the Creative Commons Attribution 4.0 License.
the Creative Commons Attribution 4.0 License.
 | 19 Jun 2025
Indicators of Global Climate Change 2024: annual update of key indicators of the state of the climate system and human influence
Chris Smith
Tristram Walsh
William F. Lamb
Robin Lamboll
Christophe Cassou
Mathias Hauser
Zeke Hausfather
June-Yi Lee
Matthew D. Palmer
Karina von Schuckmann
Aimée B. A. Slangen
Sophie Szopa
Blair Trewin
Jeongeun Yun
Nathan P. Gillett
Stuart Jenkins
H. Damon Matthews
Krishnan Raghavan
Aurélien Ribes
Joeri Rogelj
Debbie Rosen
Xuebin Zhang
Myles Allen
Lara Aleluia Reis
Robbie M. Andrew
Richard A. Betts
Alex Borger
Jiddu A. Broersma
Samantha N. Burgess
Lijing Cheng
Pierre Friedlingstein
Catia M. Domingues
Marco Gambarini
Thomas Gasser
Johannes Gütschow
Masayoshi Ishii
Christopher Kadow
John Kennedy
Rachel E. Killick
Paul B. Krummel
Aurélien Liné
Didier P. Monselesan
Colin Morice
Jens Mühle
Vaishali Naik
Glen P. Peters
Anna Pirani
Julia Pongratz
Jan C. Minx
Matthew Rigby
Robert Rohde
Abhishek Savita
Sonia I. Seneviratne
Peter Thorne
Christopher Wells
Luke M. Western
Guido R. van der Werf
Susan E. Wijffels
Valérie Masson-Delmotte
Panmao Zhai
In a rapidly changing climate, evidence-based decision-making benefits from up-to-date and timely information. Here we compile monitoring datasets (published at https://doi.org/10.5281/zenodo.15639576; Smith et al., 2025a) to produce updated estimates for key indicators of the state of the climate system: net emissions of greenhouse gases and short-lived climate forcers, greenhouse gas concentrations, radiative forcing, the Earth's energy imbalance, surface temperature changes, warming attributed to human activities, the remaining carbon budget, and estimates of global temperature extremes. This year, we additionally include indicators for sea-level rise and land precipitation change. We follow methods as closely as possible to those used in the IPCC Sixth Assessment Report (AR6) Working Group One report.
The indicators show that human activities are increasing the Earth's energy imbalance and driving faster sea-level rise compared to the AR6 assessment. For the 2015–2024 decade average, observed warming relative to 1850–1900 was 1.24 [1.11 to 1.35] °C, of which 1.22 [1.0 to 1.5] °C was human-induced. The 2024-observed best estimate of global surface temperature (1.52 °C) is well above the best estimate of human-caused warming (1.36 °C). However, the 2024 observed warming can still be regarded as a typical year, considering the human-induced warming level and the state of internal variability associated with the phase of El Niño and Atlantic variability. Human-induced warming has been increasing at a rate that is unprecedented in the instrumental record, reaching 0.27 [0.2–0.4] °C per decade over 2015–2024. This high rate of warming is caused by a combination of greenhouse gas emissions being at an all-time high of 53.6±5.2 Gt CO2e yr−1 over the last decade (2014–2023), as well as reductions in the strength of aerosol cooling. Despite this, there is evidence that the rate of increase in CO2 emissions over the last decade has slowed compared to the 2000s, and depending on societal choices, a continued series of these annual updates over the critical 2020s decade could track decreases or increases in the rate of the climatic changes presented here.
Please read the corrigendum first before continuing.
-
Notice on corrigendum
The requested paper has a corresponding corrigendum published. Please read the corrigendum first before downloading the article.
-
Article
(7612 KB)
-
The requested paper has a corresponding corrigendum published. Please read the corrigendum first before downloading the article.
- Article
(7612 KB) - Full-text XML
- Corrigendum
- Version 2022
- Version 2023
- Version 2025
-
Supplement
(3529 KB) - BibTeX
- EndNote


IPCC AR6 provided an assessment of human influence on key indicators of the state of the climate grounded in available data at the time of publication. The preparation for the next IPCC report, the Seventh Assessment Report (AR7), has started, and the assessment is due in around 5 years. Given the speed of recent change, and the need for updated climate knowledge to inform evidence-based decision-making, the Indicators of Global Climate Change (IGCC) was initiated to provide policymakers with annual updates of the latest scientific understanding on the state of selected critical indicators of the climate system and where possible of the quantified human influence upon these.
IGCC complements other annual updates, most notably the BAMS State of the Climate Report (Dunn et al., 2024) and the WMO State of the Global Climate (WMO, 2025). The main difference is that this work goes beyond the observations to make process-level estimates of effective radiative forcing and attributed human-induced response using methods rigorously assessed in AR6.
This third annual update follows broadly the format of last year (Forster et al., 2024), which extended indicators through 2023. The work focuses on indicators related to heating of the climate system, building from greenhouse gas emissions towards estimates of human-induced warming and the remaining carbon budget for 1.5 °C and other policy-relevant temperature thresholds. Figure 1 presents an overview of the aspects assessed and their interlinkages from cause (emissions) through effect (changes in physical indicators) to climatic impact drivers. It also provides a visual roadmap as to the structure of remaining sections in this paper to guide the reader.
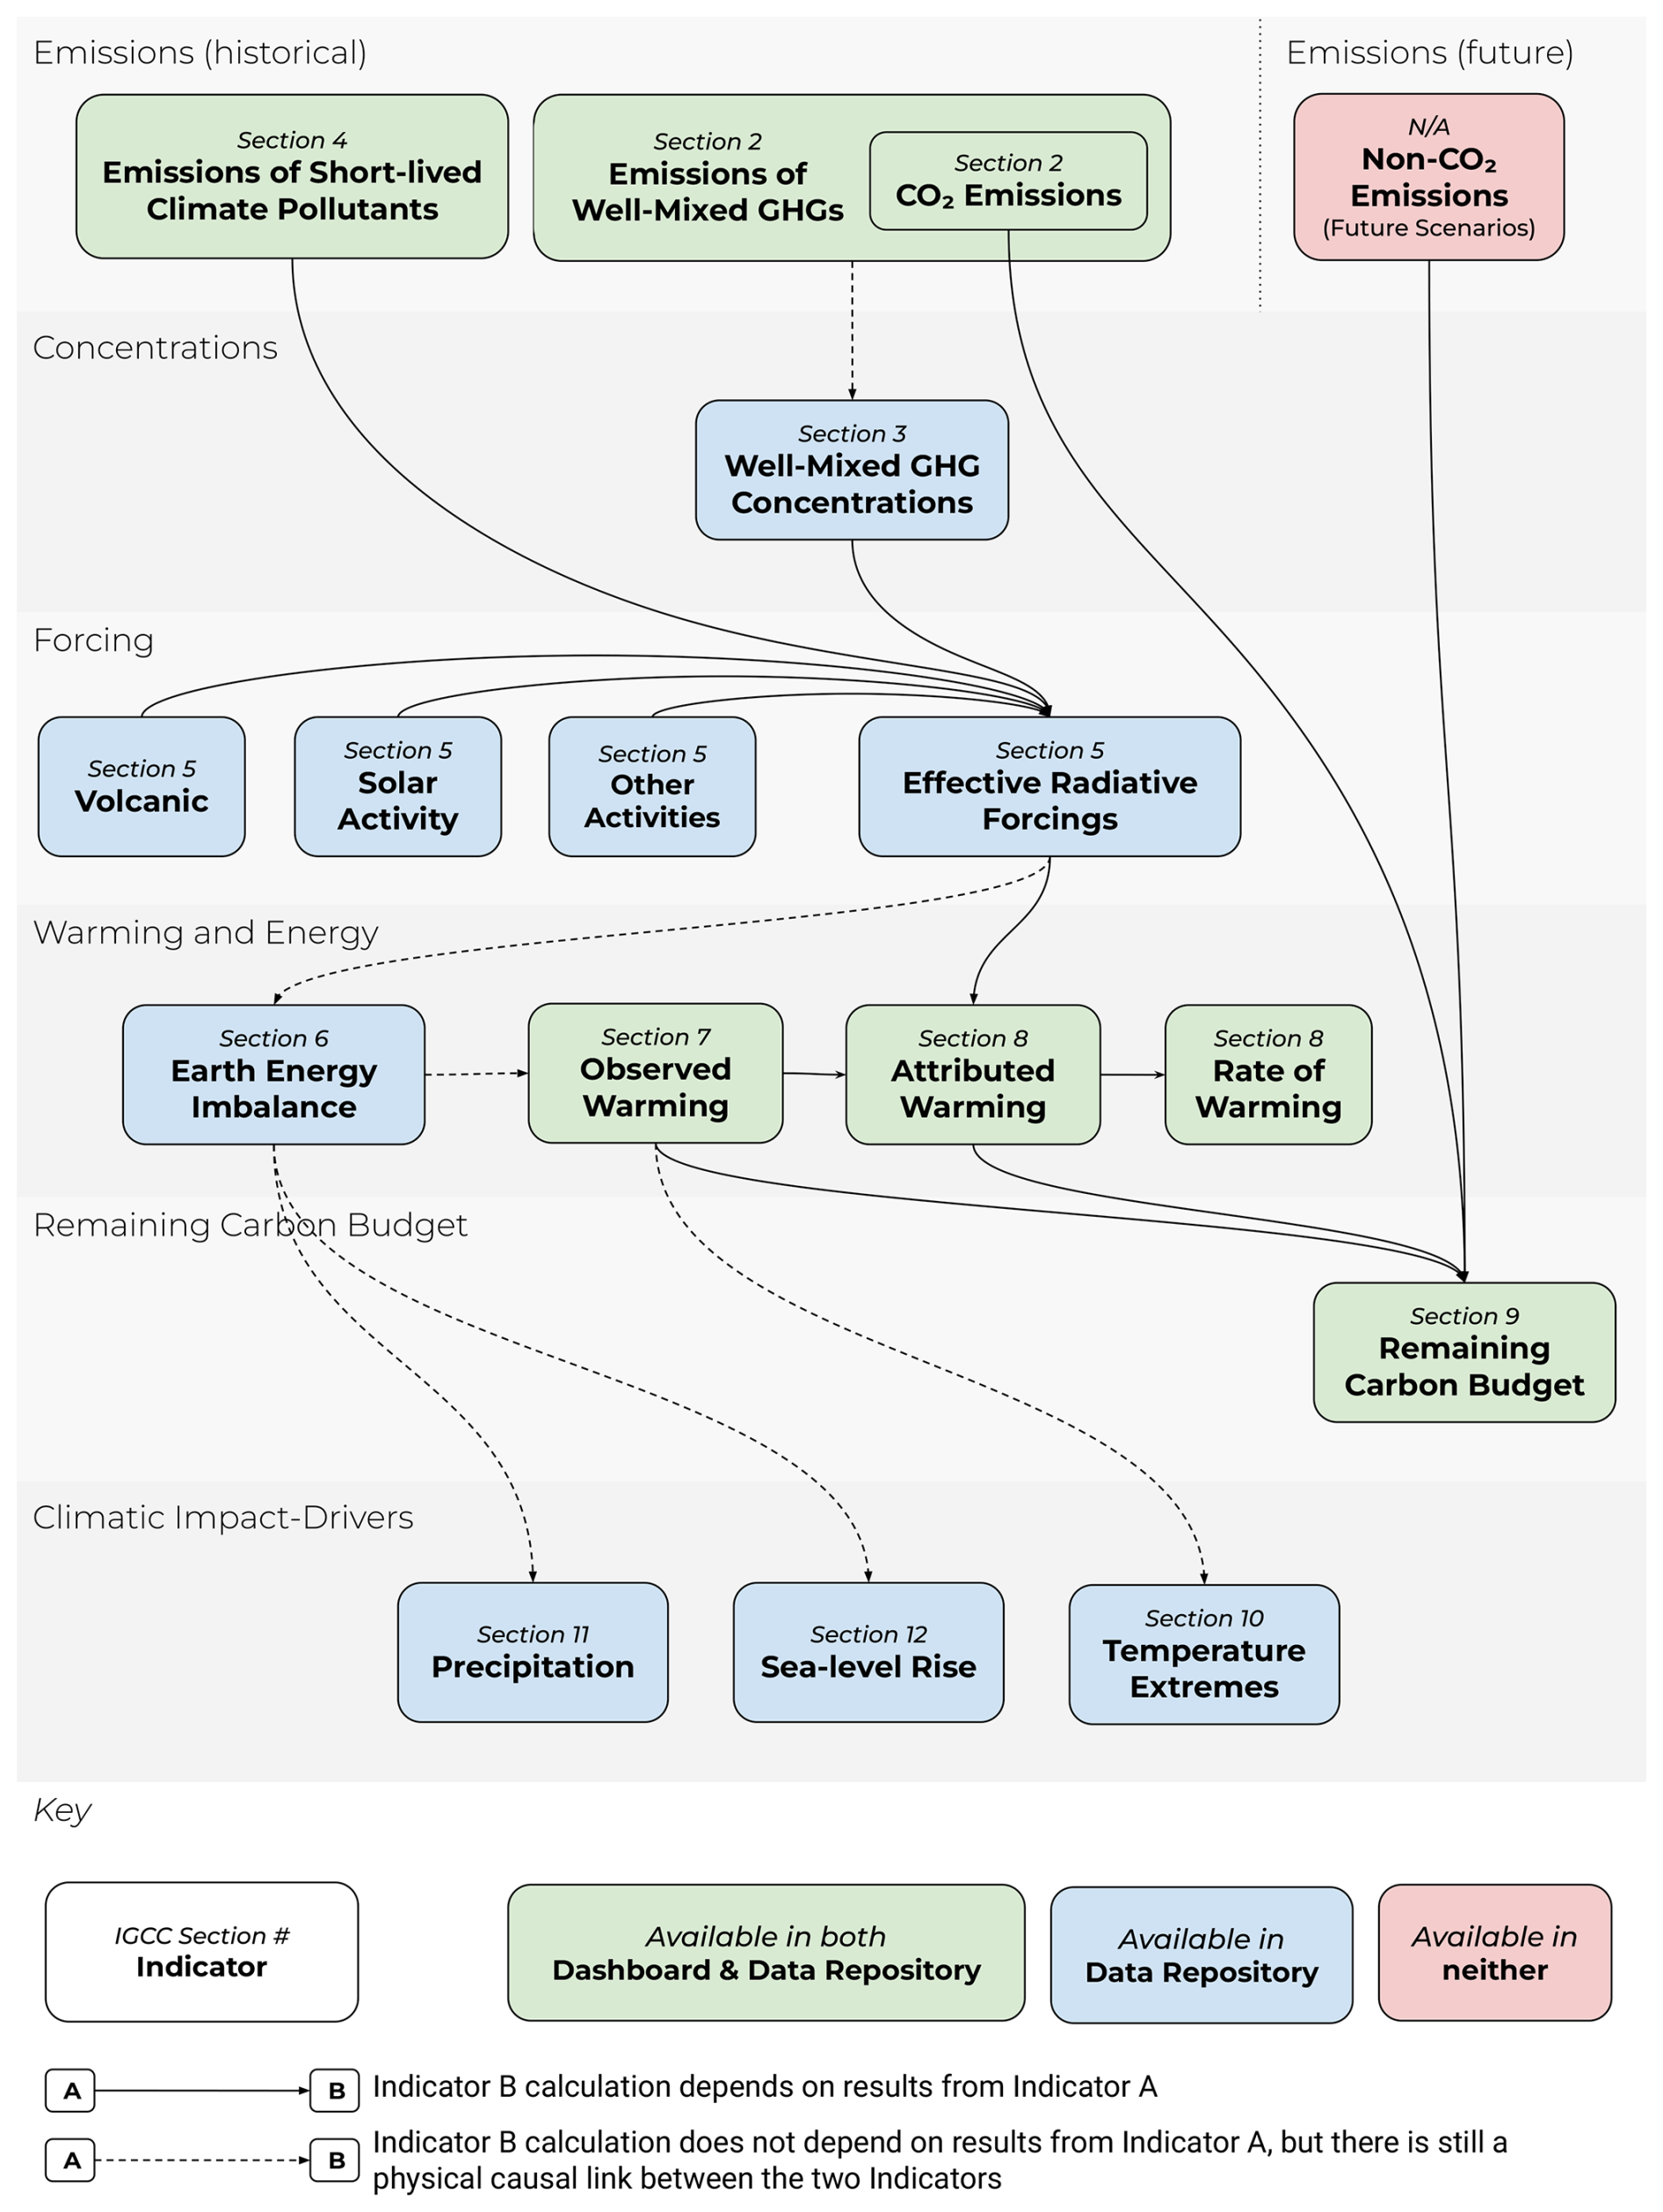
Figure 1The flow chart of data production from emissions to human-induced warming, the remaining carbon budget and changes to climatic impact drivers, illustrating both the rationale and workflow within the paper production.
The update is based on methodologies assessed by the IPCC Sixth Assessment Report (AR6) of the physical science basis of climate change (Working Group One (WGI) report; IPCC, 2021a) as well as Chap. 2 of the WGIII report (Dhakal et al., 2022) and is aligned with the efforts initiated in AR6 to implement FAIR (Findable, Accessible, Interoperable, Reusable) principles for reproducibility and reusability (Pirani et al., 2022; Iturbide et al., 2022). IPCC reports make a much wider assessment of the science and methodologies – we do not attempt to reproduce the comprehensive nature of these IPCC assessments here. We also do not consider adopting fundamentally different approaches to AR6. Rather, our aim is to rigorously track both climate system change and evolving methodological improvements between IPCC report cycles, thereby increasing transparency and consistency in between successive reports.
This annual update is organised as follows: greenhouse gas (GHG) emissions (Sect. 2), greenhouse gas concentrations (Sect. 3) and emissions of short-lived climate forcers (SLCFs) (Sect. 4) are used to develop updated estimates of effective radiative forcing (Sect. 5). The Earth energy imbalance (Sect. 6) and observations of global surface temperature change (Sect. 7) are key global indicators of a warming world. The contributions to global surface temperature change from human and natural influences are formally attributed in Sect. 8, which tracks the level and rate of human-induced warming. Section 9 updates the remaining carbon budget for policy-relevant temperature thresholds. Section 10 gives an example of global-scale indicators associated with climate extremes of maximum land surface temperatures, and Sect. 11 shows land surface precipitation trends traceable to AR6, a new addition to this year's update. Section 12 presents updated estimates of global mean sea-level rise, also a new addition. Code and data availability is given in Sect. 13, and conclusions are presented in Sect. 14. Data are available at https://doi.org/10.5281/zenodo.15639576 (Smith et al., 2025a).
Historic GHG emissions from human activity were assessed in both AR6 WGI and WGIII. Chapter 5 of WGI assessed CO2 and CH4 emissions in the context of the carbon cycle (Canadell et al., 2021). Chapter 2 of WGIII, published 1 year later (Dhakal et al., 2022), assessed the sectoral sources of emissions and gave the most up-to-date understanding of the current level of emissions. This section bases its methods and data on those employed in this WGIII chapter.
2.1 Methods of estimating greenhouse gas emissions changes
Like in AR6 WGIII, net GHG emissions in this paper refer to releases of GHGs from anthropogenic sources minus removals by anthropogenic sinks, for the set of GHGs outlined in the United Nations Framework Convention on Climate Change (UNFCCC). These include CO2 emissions from fossil fuels and industry (CO2-FFI); net CO2 emissions from land use, land-use change and forestry (CO2-LULUCF); CH4 emissions; N2O emissions; and fluorinated gas (F-gas) emissions comprising hydrofluorocarbons (HFCs), perfluorocarbons (PFCs), sulfur hexafluoride (SF6) and nitrogen trifluoride (NF3) – hereafter the “UNFCCC F-gases”.
Despite extensive literature on GHG emissions, there remains important differences in reporting conventions and system boundaries between assessments. These differences relate to three underlying issues: (1) emissions datasets vary in their coverage of sources and sectors; (2) there are different approaches to determining the “anthropogenic” component of LULUCF emissions and removals; and (3) the Paris Agreement does not cover all relevant sources of emissions (Lamb et al., 2025).
Concerning the first issue, there are several possible emissions datasets to draw from, each with varying coverage and update schedules. Emissions data are gathered by countries and submitted to the UNFCCC in the form of national inventory reports and common reporting tables. However, these “national inventories” are generally incomplete and are not kept up to date for all countries. Emissions reporting therefore often relies on “third-party” datasets compiled by research organisations, including the Global Carbon Budget (GCB; Friedlingstein et al., 2025), the Emissions Database for Global Atmospheric Research (EDGAR; Crippa et al., 2023), the Potsdam Real-time Integrated Model for probabilistic Assessment of emissions Paths (PRIMAP-hist; Gütschow et al., 2016, 2025)1, the Community Emissions Data System (CEDS; Hoesly et al., 2018; Hoesly and Smith, 2024) and the Global Fire Emissions Database (GFED; van der Werf et al., 2017). As detailed below, for various reasons not all these datasets were employed in this update.
Concerning the second issue, there are varying conventions used to quantify CO2-LULUCF fluxes. These include the use of bookkeeping models and aggregated national inventory reporting (Pongratz et al., 2021), which differ in terms of their applied system boundaries and definitions and in particular how they treat “indirect anthropogenic effects” such as the influence of increased atmospheric CO2 on vegetation growth. As such, the CO2-LULUCF emissions estimates generated using bookkeeping models versus national inventories are not directly comparable and differ by about 7.5 Gt CO2 yr−1 (2013–2022 average), but there are now methods to “translate” between these two approaches (Friedlingstein et al., 2022; Grassi et al., 2023; Schwingshackl et al., 2022). Assessments also differ with respect to biomass fire emissions and to what extent components of these are treated as anthropogenic (Lamb et al., 2025).
Finally, two categories of emissions are not directly covered by the Paris Agreement but might be considered depending on the objectives of an assessment. These include the ozone-depleting substances (hereafter the “ODS F-gases”) comprising halons, chlorofluorocarbons (CFCs) and hydrochlorofluorocarbons (HCFCs). The ODS F-gases were initially controlled under the Montreal Protocol, and its amendments and are therefore not included in national inventories submitted to the UNFCCC, nor in many third-party emissions datasets – in contrast to the UNFCCC F-gases. Another important omission is the cement carbonation sink. To date this has also been excluded from national reporting under the UNFCCC, but plans for a new chapter covering these removals in the IPCC Task Force on National Greenhouse Gas Inventory Guidelines indicate a pathway for its eventual inclusion (IPCC, 2025).
The IPCC AR6 WGIII addressed these issues as follows. Total net GHG emissions were calculated as the sum of CO2-FFI, CH4, N2O and UNFCCC F-gases from EDGAR (version 6, with a fast-track methodology applied for the final year of data – 2019) and net CO2-LULUCF emissions from the GCB (the 2020 version; Friedlingstein et al., 2020). Net CO2-LULUCF emissions followed the GCB convention and were derived from the average of three bookkeeping models (Hansis et al., 2015; Houghton and Nassikas, 2017; Gasser et al., 2020). “Indirect anthropogenic effects” on the terrestrial carbon fluxes were therefore excluded from totals (i.e. they were treated as part of the natural land sink). Further, the GCB methodology (and thus reporting in IPCC AR6 WGIII) includes CO2 emissions from deforestation and forest degradation fires but excludes those from wildfires, which are classified as natural even if climate change affects their intensity and frequency. Similarly, the EDGAR dataset used in AR6 includes some non-CO2 biomass fire emissions in the agricultural sector but otherwise excludes those from wildfires. Sources not covered by inventories or the Paris Agreement (ODS F-gases and cement carbonation) were also excluded. Together these choices ensured consistency with the Integrated Assessment Model (IAM) benchmarks reported in WGIII and were closely focused on direct anthropogenic emissions under the UNFCCC, reflecting the importance of human-driven technology and policy options in shaping the future climate response.
The analysis presented here continues to provide an “WGIII update” estimate that tracks the same system boundary and compilation of GHGs as in AR6 WGIII, albeit with some differences in the selected data sources. As in previous years, we use GCB data for CO2-FFI. We also continue to use GCB for CO2-LULUCF, which has now been updated to use the average of four (rather than three) bookkeeping models (BLUE by Hansis et al., 2015; H&C by Houghton and Castanho, 2023; OSCAR by Gasser et al., 2020; LUCE by Qin et al., 2024). We use PRIMAP Hist-TP data for CH4 and N2O and inversions of atmospheric concentrations tracked by NOAA and AGAGE with best-estimate lifetimes for UNFCCC F-gas emissions based on analysis in the subsequent section (Sect. 3) (Lan et al., 2025; Dutton et al., 2024; Prinn et al., 2018). We follow the same approach for estimating uncertainties and CO2-equivalent (CO2-e) emissions as in AR6, as described in the Supplement.
In addition to the WGIII update, we provide two further estimates that provide clarity and comparison to other assessment approaches. This reflects the fact that other decision criteria for tracking emissions are possible. First, in cases where assessments prioritise calculating the best estimate of fluxes to the atmosphere, it would be important to include ODS F-gases, cement carbonation and all non-CO2 biomass fire emissions, including those from wildfires. Indeed, these are included in this article in subsequent assessments of concentration change (including compounds formed in the atmosphere as ozone), effective radiative forcing, human-induced warming, carbon budgets and climate impacts, in line with the WGI assessment. We therefore provide an “IPCC update + additional sources and sinks” estimate that shows the change implied by including these three components in the global total. Second, the IPCC AR7 report outline foresees the tracking of “inventory-aligned” emissions that are consistent with national reporting. Full alignment between emissions inventories and WGIII emissions consistent with IAM benchmarks is essential for an accurate assessment and stocktake of the nationally determined contributions (NDCs) and pathways to net-zero emissions (Grassi et al., 2021; Gidden et al., 2023; Allen et al., 2025). We therefore provide an inventory-aligned estimate that follows the inventory approach to accounting for LULUCF emissions, while also integrating the latest national inventory data from the Common Reporting Tables. The data sources associated with these additional estimates are detailed in Table S1 in the Supplement.
We expect to see differences between the three estimates, most notably between the WGIII update and inventory-aligned estimates. As discussed above, these differ conceptually in their treatment of the LULUCF sector. However, national inventory reporting can also differ from third-party datasets in terms of underlying methods: in some countries, investments into statistical infrastructures have enabled the use of more precise emissions factors in inventories to estimate fluxes according to local or national conditions, while in others this may not be the case. In contrast, third-party datasets often use globally consistent emissions factors. Notably, the PRIMAP Hist-CR dataset, which is used here to represent national inventories, has significantly lower total CH4 emissions relative to other datasets reported here, as well as the global atmospheric inversion estimates evaluated in this paper. A substantive body of literature has found that, on average, national inventories tend to underestimate CH4 compared to inversions (Deng et al., 2022; Tibrewal et al., 2024; Janardanan et al., 2024; Scarpelli et al., 2022).
2.2 Updated greenhouse gas emissions
Updated GHG emission estimates following the WGIII assessment are presented in Fig. 2 and Table 1. Total global GHG emissions were 55.4±5.1 Gt CO2e in 2023. Of this total, CO2-FFI contributed 37.8±3.0 Gt CO2, CO2-LULUCF contributed 3.6±2.5 Gt CO2, CH4 contributed 9.2±2.7 Gt CO2e, N2O contributed 2.9±1.7 Gt CO2e and F-gas emissions contributed 1.9±0.6 Gt CO2e.
Note the recent history of emissions in these datasets is continually revised, so there are small differences between each annual update in emission estimates over the recent past. Initial projections for 2024 indicate that CO2 emissions from fossil fuels and industry increased to 38.2±3.0, and CO2 emissions from land-use change increased to 4.2±2.8 Gt CO2 (Friedlingstein et al., 2025; Deng et al., 2025). The significant increase in land-use change emissions is connected to high emissions from tropical deforestation and degradation fires in the aftermath of the El Niño with droughts in South America continuing since 2023. Synchronous large fires occurred in North America, where the record-breaking Canadian fires of 2023 were followed by another year that was well above average in 2024 but are attributable to climate variability and climate change and not anthropogenic land-use change (Friedlingstein et al., 2025).
Average annual GHG emissions for the decade 2014–2023 were 53.6±5.2 Gt CO2e. Average decadal GHG emissions have increased steadily since the 1970s across all major groups of GHGs, driven primarily by increasing CO2 emissions from fossil fuel and industry but also rising emissions of CH4 and N2O. Emissions of UNFCCC F-gases have grown more rapidly than other GHG but from low levels. Both the magnitude and trend of CO2 emissions from land-use change remain highly uncertain, with the latest data indicating an average net flux between 4–5 Gt CO2 yr−1 for the past few decades.
The fossil fuel share of global GHG emissions was approximately 70 % in 2023 (GWP100 weighted), based on the EDGAR v9 dataset (Crippa et al., 2023) and net land-use CO2 emissions from the Global Carbon Budget (Friedlingstein et al., 2025). The remaining share of non-fossil fuel emissions is mostly from land-use change, agriculture, cement production, waste and F-gas emissions.
Different emissions assessment approaches are shown in Fig. 3. Increasing the scope of the WGIII update to include ODS F-gases, cement carbonation, and CH4 and N2O from biomass burning results in emissions of 56.9±5.2 Gt CO2e yr−1 in 2023 or a total change of +1.6 Gt CO2e yr−1. ODS F-gas emissions have declined substantially since the 1990s under the Montreal Protocol and its amendments, reaching 1.3 Gt CO2e yr−1 in 2023, with a stalling rate of reduction in the past decade. The cement carbonation sink has steadily increased alongside cement production to reach −0.8 Gt CO2e yr−1 in 2023. Biomass fire emissions have a more variable trend, and 2023 was a relatively extreme year at 1 Gt CO2e yr−1, compared to an average of 0.7 Gt CO2e yr−1 in the preceding decade.
Emissions according to national inventories were 47.1±4.7 Gt CO2e yr−1 in 2023 or 8.3 Gt CO2e yr−1 lower than the WGIII update (Fig. 3). The main reason is diverging estimates of net LULUCF emissions, which according to inventory accounts were on average 7.5 Gt CO2 lower over the past decade (2014–2023). Additional differences result from a lower estimate of energy, industrial process, agriculture and waste emissions in inventories (−1.8 Gt CO2e yr−1), particularly for CH4 (−0.7 Gt CO2e yr−1).
Emerging literature, published after AR6, suggests that increases in atmospheric CH4 concentrations may also be driven by methane emissions from wetland changes resulting from climate change and variability (e.g. Basu et al., 2022; Hardy et al., 2023; Peng et al., 2022; Nisbet et al., 2023; Zhang et al., 2023). There is also a possible effect from CO2 fertilisation (Feron et al., 2024; Hu et al., 2023). The latest global methane budget estimates indirect anthropogenic CH4 fluxes from wetlands and freshwater bodies of approximately 2.4 Gt CO2e yr−1 (Saunois et al., 2025). Such emissions are not captured in the WGIII estimate here as they are not a direct emission from human activity but rather a feedback induced by a changing climate, yet they will contribute to GHG concentration rise, forcing and energy budget changes discussed in the next sections. They will become more important to properly account for in future years. Note that these indirect CH4 emissions are not used to determine the effective radiative forcing in Sect. 5.
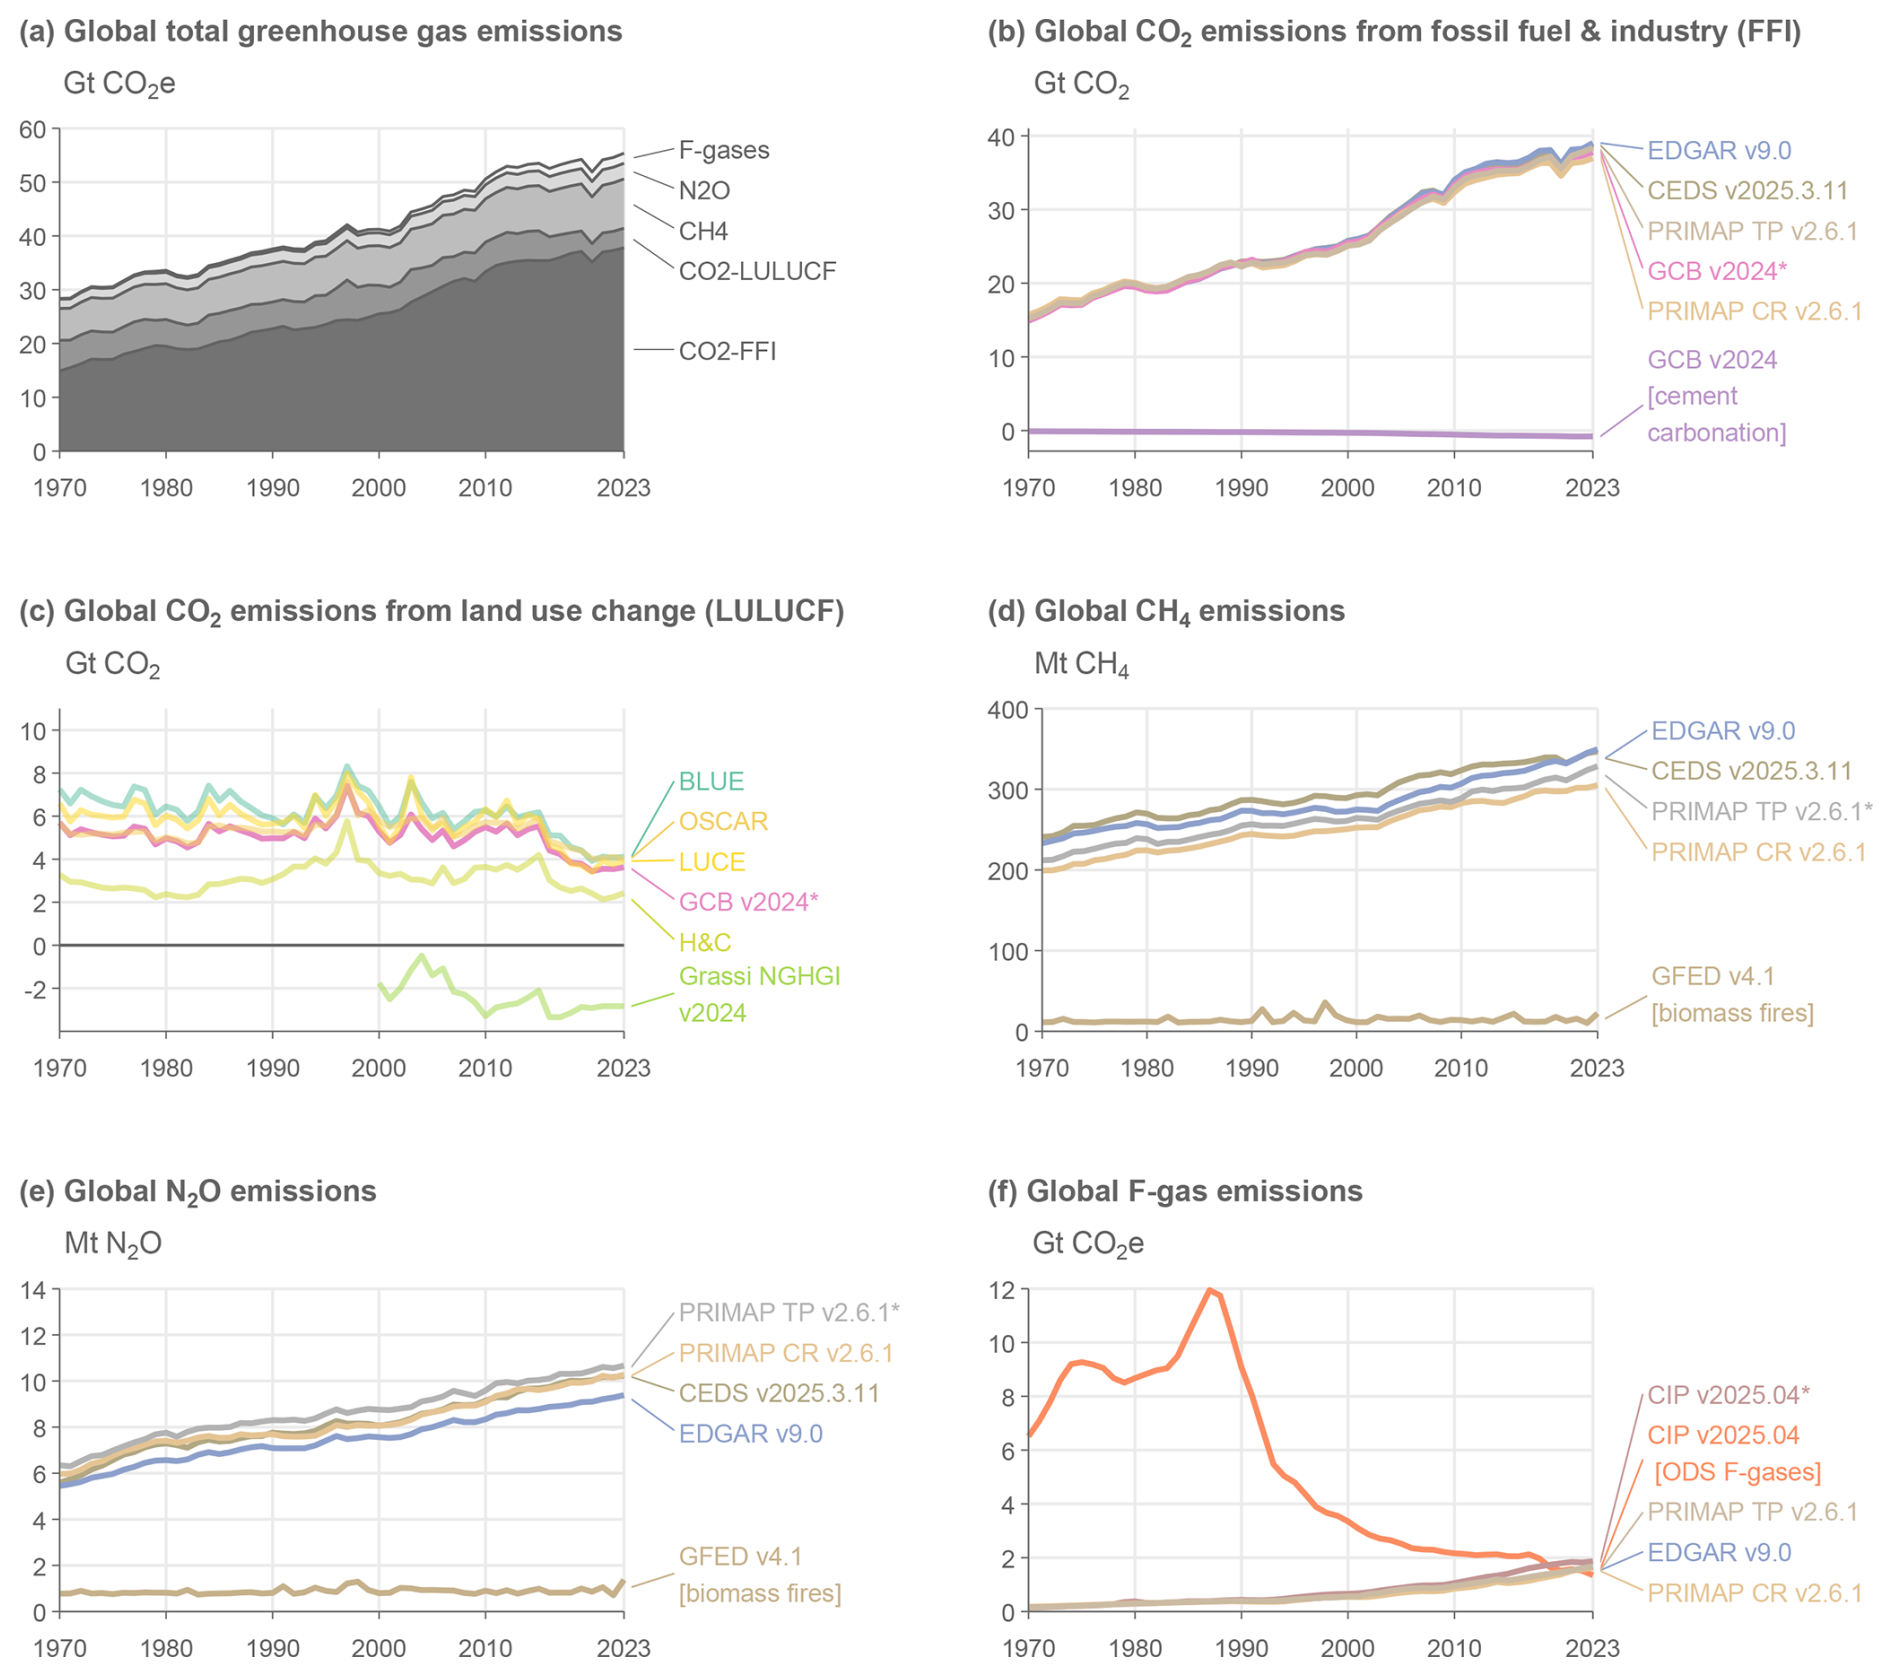
Figure 2Annual global anthropogenic GHG emissions by source, 1970–2023. Refer to Sect. 2.1 and Table S1 for a list of datasets. Datasets with an asterisk (*) indicate the sources used to compile global total greenhouse gas emissions following the WGIII assessment in (a). CO2-equivalent emissions in (a) and (f) are calculated using GWP100 from the AR6 WGI Chap. 7 (Forster et al., 2021). F-gas emissions in (a) comprise only UNFCCC F-gas emissions (see Sect. 2.1 for a list of species). F-gas emissions in (f) refer to UNFCCC F-gases, except for “CIP v2024.04 [ODS F-gases]”. Some of the major depicted differences between datasets (e.g. between GCB v2024 and Grassi NGHGI v2024 in panel c) are due to varying system boundaries, rather than underlying uncertainties in activity levels or emissions factors.
Table 1Global anthropogenic greenhouse gas emissions by source and decade following the WGIII assessment. All numbers refer to decadal averages, except for annual estimates in 2023 and 2024. CO2-equivalent emissions are calculated using GWP100 from AR6 WGI Chap. 7 (Forster et al., 2021). Projections of non-CO2 GHG emissions in 2024 remain unavailable at the time of publication. Uncertainties are ±8 % for CO2-FFI, ±70 % for CO2-LULUCF, ±30 % for CH4 and F-gases, and ±60 % for N2O, corresponding to a 90 % confidence interval. “GHG” in row one is the sum of the other rows.
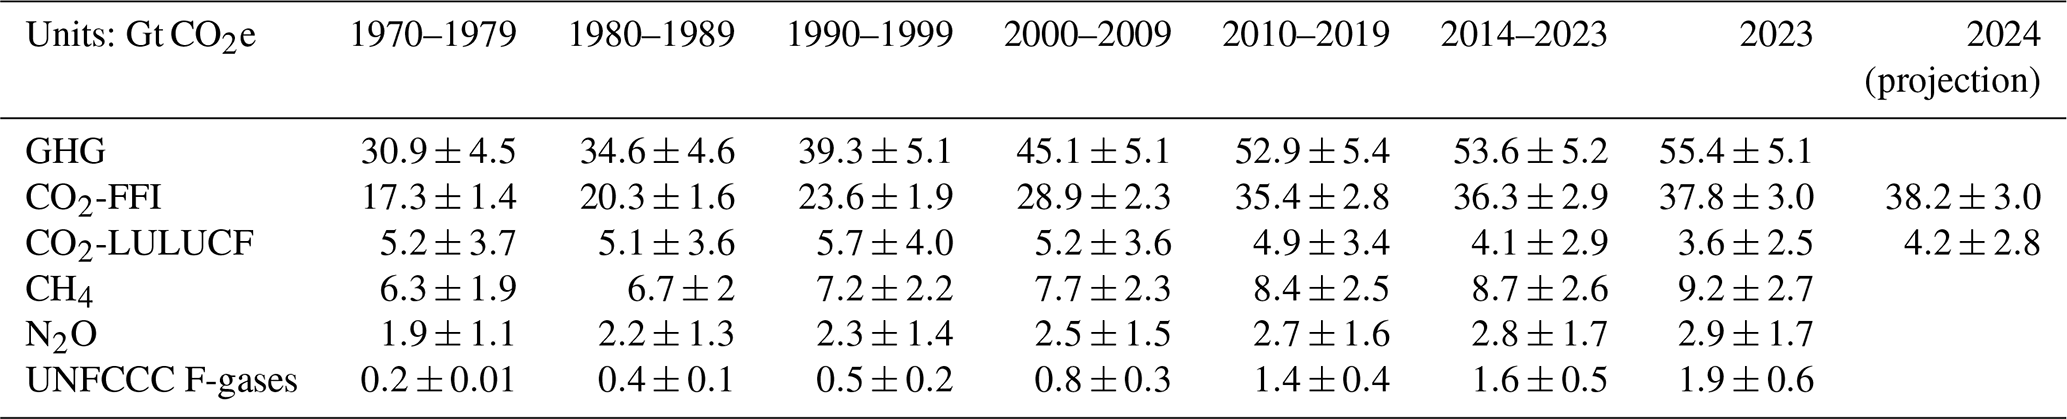
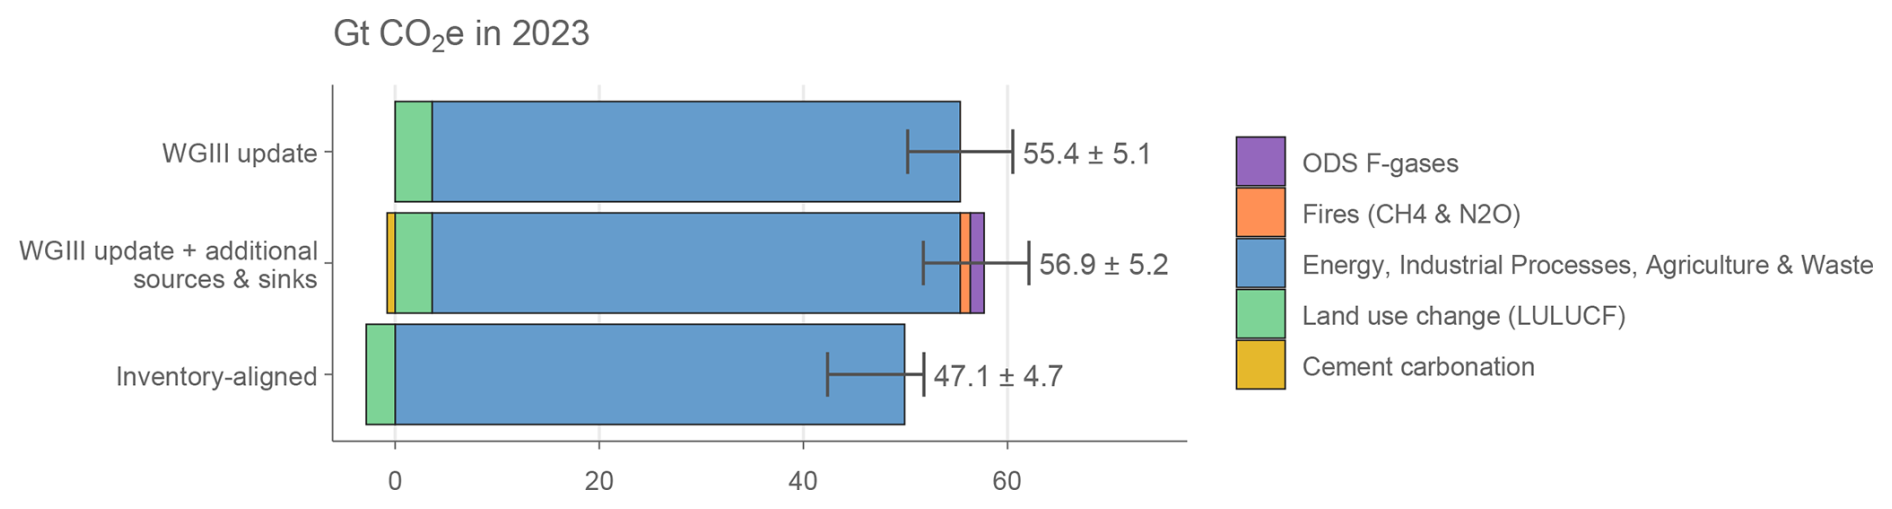
Figure 3Annual global anthropogenic greenhouse gas emissions by assessment convention in 2023. Refer to Table 1 for a list of underlying datasets. Differences between conventions are primarily due to differences in system boundaries (Lamb et al., 2025). Uncertainties are ±8 % for CO2-FFI, ±70 % for CO2-LULUCF, ±30 % for CH4 and F-gases, and ±60 % for N2O, corresponding to a 90 % confidence interval.
As in Forster et al. (2024), we report best-estimate global mean concentrations for 52 well-mixed GHGs. These concentrations are updated to 2024. CO2 mixing ratios were taken from the NOAA Global Monitoring Laboratory (GML) and are updated here through 2024 (Lan et al., 2025). As in Forster et al. (2023, 2024), CO2 is reported on the WMO-CO2-X2019 scale, which differs from the WMO-CO2-X2007 scale used in AR6, with WMO-CO2-X2019 being around 0.18 ppm higher than WMO-CO2-X2007 in recent years. For consistency with WMO-CO2-X2019, the AR6 CO2 concentrations that make up the 1750 to 1978 period in the IGCC dataset (before recent NOAA updates) have been converted to the WMO-CO2-X2019 scale. Other GHG records were compiled from NOAA and AGAGE global networks or extrapolated from the literature. Average NOAA and AGAGE data, updated through 2024, were used for N2O, CH4, CFC-11, CFC-12, CCl4, HCFC-22, HFC-134a and HFC-125 (Lan et al., 2025; Dutton et al., 2024; Prinn et al., 2018), which, along with CO2, account for over 97 % of the effective radiative forcing (ERF) from well-mixed GHGs. Several other species also use means from the NOAA and AGAGE networks, where the NOAA data are updated to 2024 from the values given in the BAMS State of the Climate Report (Dunn et al., 2024), and AGAGE data up until 2022 are available; for 2023 and 2024, an offset to the NOAA data was applied, which was equal to the mean difference between the NOAA and AGAGE datasets over the recent past. In cases where no updated information is available, global estimates were extrapolated from Vimont et al. (2022), Western et al. (2023, 2024), or other literature and scaled to be consistent with those reported in AR6. Some extrapolations are based on data from the mid-2010s (Droste et al., 2020; Laube et al., 2014; Simmonds et al., 2017; Vollmer et al., 2018) but have an imperceptible effect on the total ERF assessed in Sect. 5 and are included to maintain consistency with AR6. Mixing ratio uncertainties for 2024 are assumed to be like 2019, and we adopt the same uncertainties as assessed in AR6 WGI.
Figure 4 shows recent GHG concentrations and their changes. Table S2 in the Supplement shows specific updated concentrations for all the GHGs considered. The global surface mean concentrations of CO2, CH4 and N2O in 2024 were 422.8 [±0.4] ppm (parts per million), 1929.7 [±3.3] ppb (parts per billion) and 337.9 [±0.4] ppb, respectively. Concentrations of all three major GHGs have increased since 2019, with CO2 increasing by 12.7 ppm, CH4 by 63.3 ppb and N2O by 5.8 ppb. Increases since 2019 are consistent with those from the CSIRO network (Francey et al., 1999), which are 13.0 ppm, 61.9 ppb and 6.0 ppb for CO2, CH4 and N2O, respectively. With few exceptions, concentrations of ozone-depleting substances, such as CFC-11 and CFC-12, continue to decline, while those of replacement compounds (HFCs) have increased. HFC-134a, for example, has increased 25 % since 2019 from 107.6 to 134.7 ppt (parts per trillion). Aggregated across all gases, PFCs increased from 109.7 to an estimated 117.4 ppt CF4-e from 2019 to 2024 and HFCs from 237 to 3212 ppt HFC-134a-e, while ozone-depleting gases declined from 1032 to 995 ppt CFC-12-e. Mixing ratio equivalents are determined by the radiative efficiencies of each GHG from Hodnebrog et al. (2020).
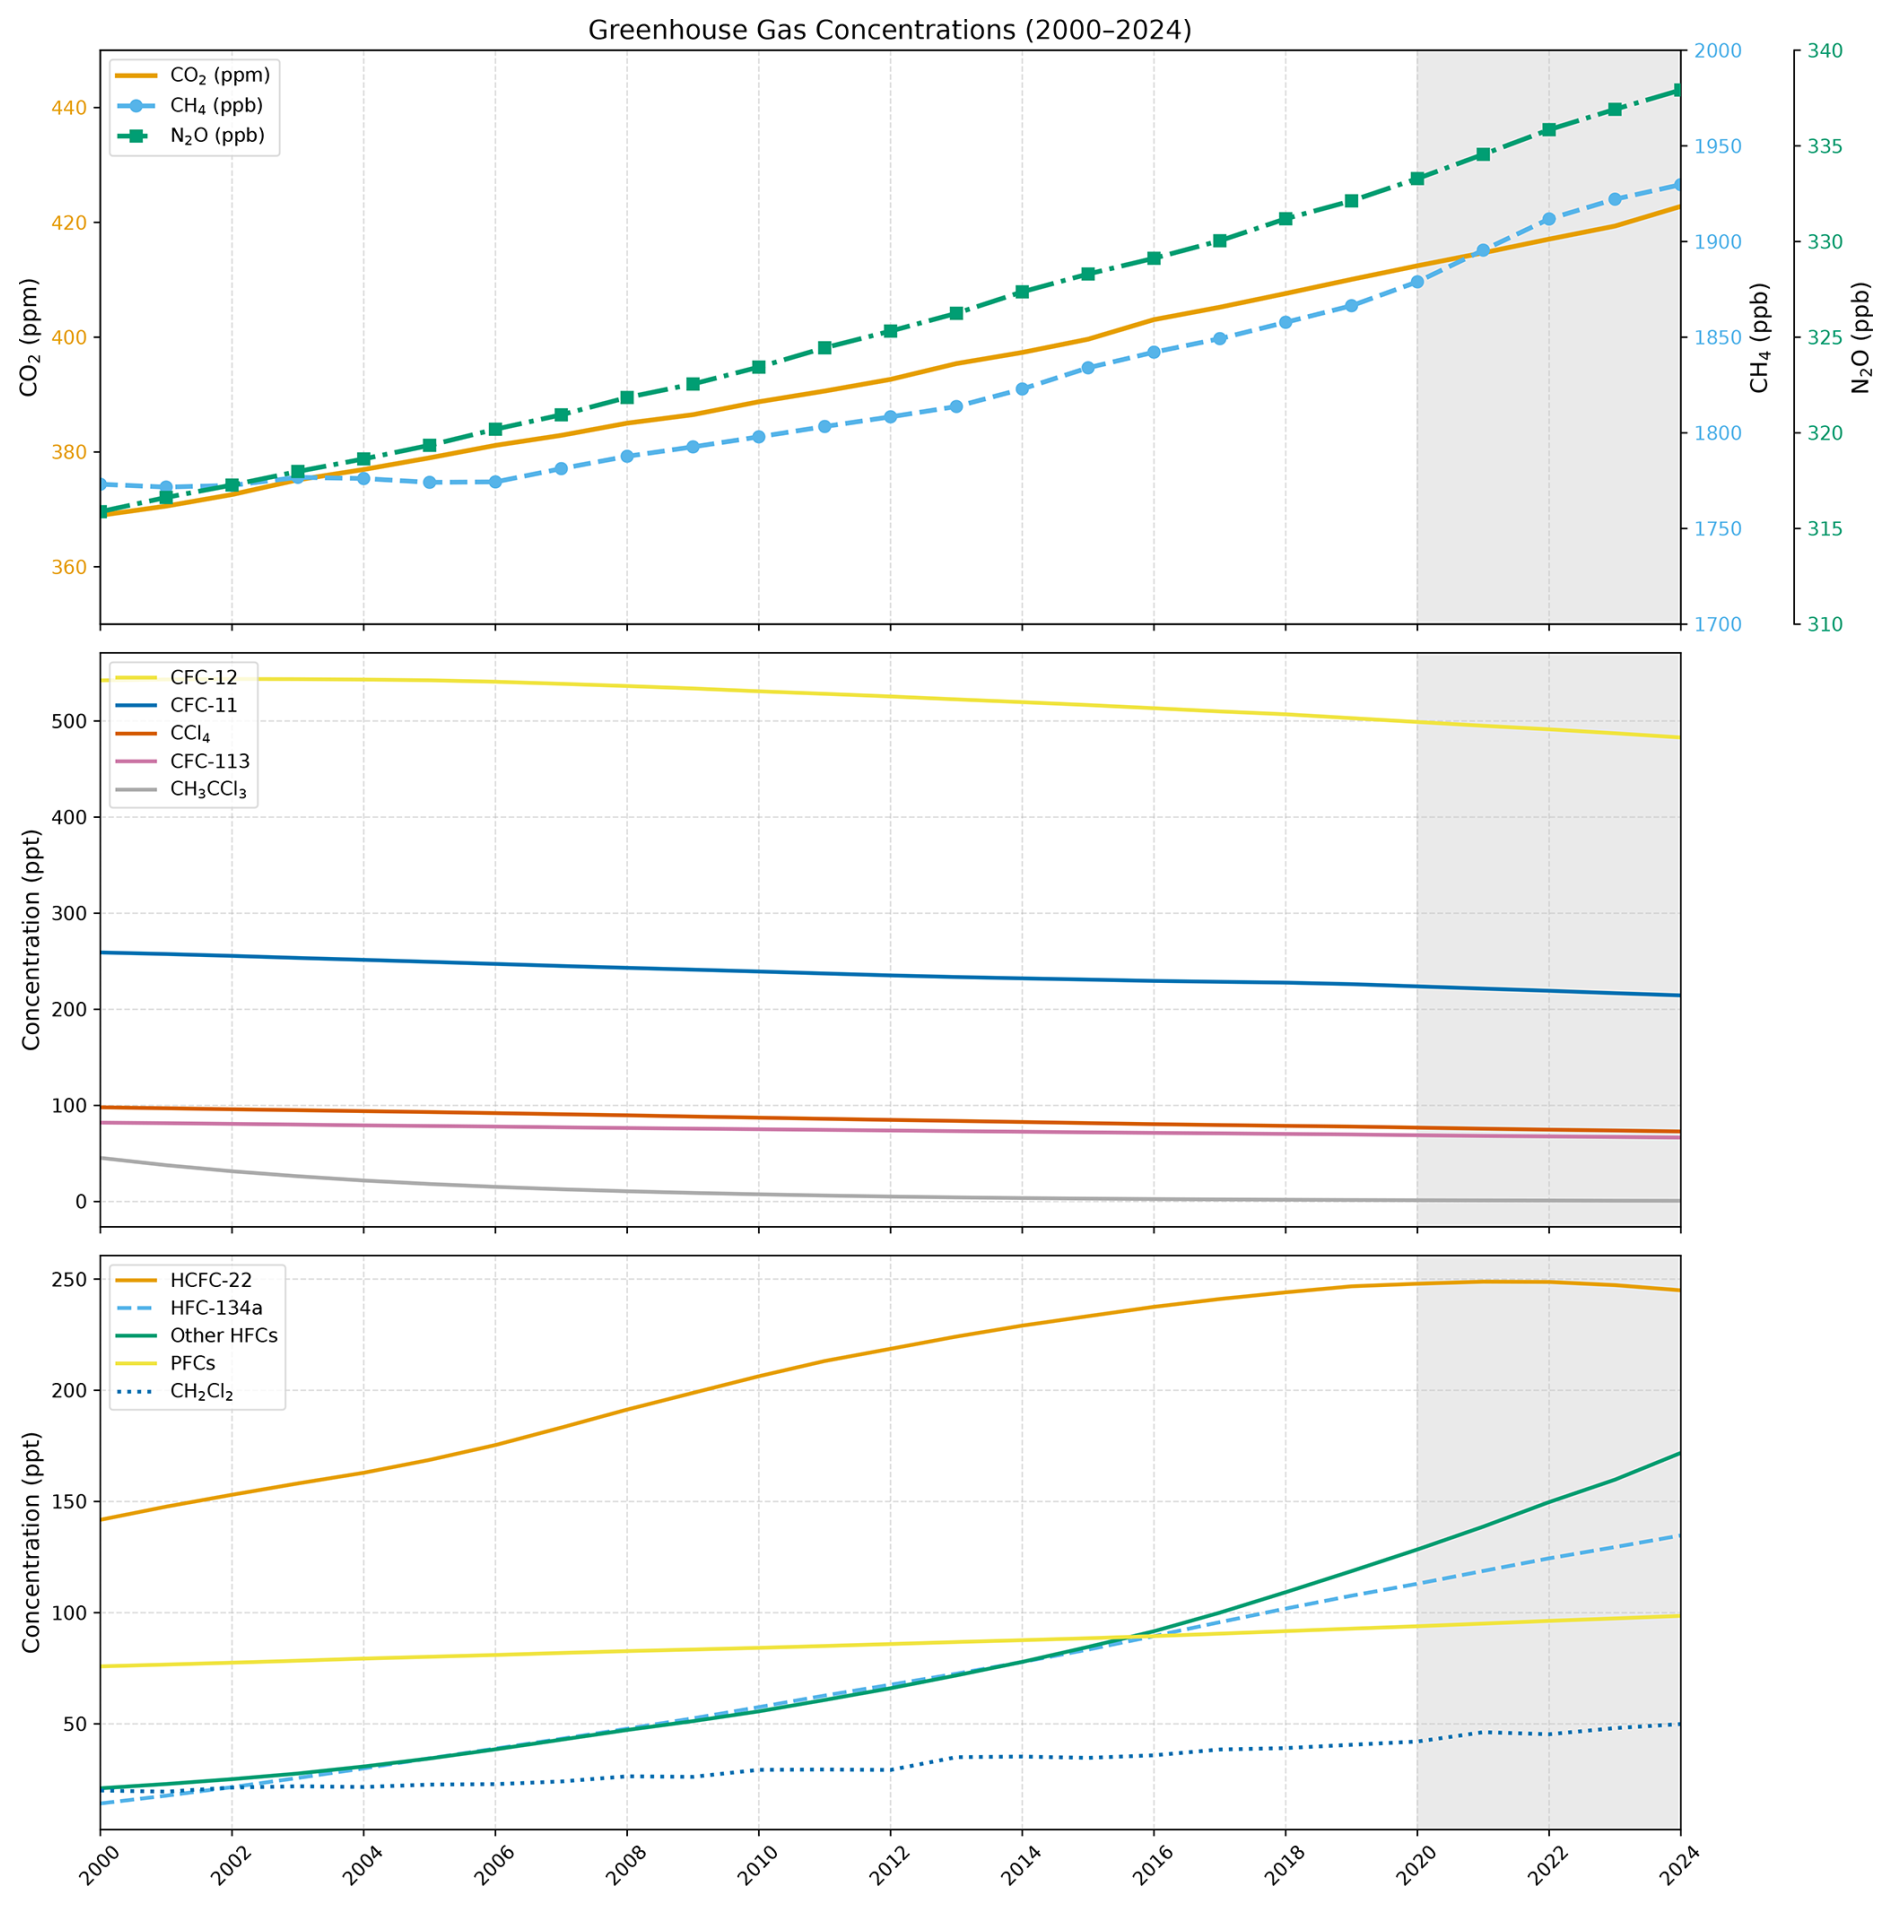
Figure 4Atmospheric concentrations of a set of well-mixed greenhouse gases over 2000–2024. The grey shaded region represents continuing changes since AR6. Note the different vertical scales.
Ozone and other non-methane SLCFs are not well mixed in the atmosphere and are thus discussed separately (in Sect. 4). For this reason, the warming impact of ozone, the third-most-important GHG (in terms of current contribution to warming), is not included in the contribution of well-mixed GHGs to observed warming, consistently with AR6. Note that change in methane concentration affects ozone, but this indirect effect is not accounted for in the estimate of the warming due to the evolution of well-mixed GHG concentrations.
Chapter 6 of WGI assessed emissions in the context of understanding the climate and air quality impacts of SLCFs (Szopa et al., 2021). Methane is a SLCF but also a well-mixed GHG and is discussed in Sects. 2 and 3. Trends in SLCFs emissions are spatially heterogeneous (Szopa et al., 2021), with strong shifts in the locations of reductions and increases over the decade 2010–2019 (Hodnebrog et al., 2024). Concentrations of non-methane SLCFs are heterogeneously distributed in the atmosphere, and the observation networks are too sparse to report globally averaged concentrations. Typically, a combination of satellite data, where available, and global models and reanalysis is relied upon for producing global-scale distributions. In the case of models, production of near-real-time information relies upon the availability of near-real-time updates to SLCF emissions which are still challenging. Little information, whether from observations from local monitoring networks, from satellite data or from global model reanalysis, is released in near-real time.
In addition to GHG emissions, we provide an update of anthropogenic emissions of non-methane SLCFs (SO2, black carbon (BC), organic carbon (OC), NOx, volatile organic compounds (VOCs), CO and NH3). Data are presented in Table 2, and the evolution of SLCF emission estimates from the AR6 to this study is presented in Sect. S4 of the Supplement. Consistency between emission trends and concentrations is considered whenever feasible. HFCs, whatever their lifetimes, were considered in Sect. 2.2.
Sectoral emissions of SLCFs are derived from two sources: CEDS, which was used in the AR6 and in CMIP6 to assess historical evolution of atmospheric composition and that has been updated since then, and the Copernicus Atmosphere Monitoring Service (CAMS). The most recent release of the CEDS anthropogenic emissions dataset (Hoesly et al., 2025) covers the 1750–2023 period (Hoesly et al., 2018; Hoesly and Smith, 2024). Since 2023, CAMS has released regular updates of their global emission dataset (Soulie et al., 2024). For the year 2024, we apply, for each compound, the trend in emission from the CAMS dataset to the 2023 CEDS emission. The CAMS dataset is essentially based on the EDGARv6/v7 emissions as well as on CEDS, so CEDS and CAMS are not entirely independent. The temporal extension is based on evolution of drivers of emissions (energy consumption, production rates) and trends in technologies that affect the emissions factors (e.g. fleet renewal and abatement systems) (Denier van der Gon et al., 2023).
The CAMS v6.2 emission dataset (ECCAD, 2025) indicates a decrease in global anthropogenic emissions of the primary SLCFs (NOx, CO, non-methane VOCs (NMVOCs), SO2, BC and OC) since the COVID hiatus in emissions, except for NH3, whose emissions are steadily increasing. SLCF emissions from biomass burning are taken from GFED (van der Werf et al., 2017) with small fires (GFED4.1s) updated to 2024 (following AR6 WGIII; Dhakal et al., 2022). Estimates from GFED for 2017 to 2024 are provisional and will be updated with GFED5 in future datasets, which will provide substantially higher emissions for most species. The estimate of global carbon emissions due to wildfires in 2024 is slightly lower than in 2023 (both were higher than average fire years). These lower overall carbon emissions in 2024 hide an increase in CO2 emissions (accompanied by an increase in NOx emissions) but a decrease in CH4 and CO emissions accompanied by a decrease in carbonaceous aerosols and NMVOC emissions.
The decrease in global NOx emissions, despite very heterogeneous regional trends (Szopa et al., 2021), is confirmed by global NO2 satellite observations from OMI (tropospheric NO2 column from OMI visualised through the Giovanni system, Acker and Leptoukh, 2007). The trends in global CO concentration are less clear. Surface data from MOPITT and AIRS show a slight increase over the last 3 years. CO does not result solely from CO emissions but also from VOCs including methane oxidation, which can explain differences in trends between emissions and concentrations.
Overall, the trends in emissions were similar (see Supplement Sect. S4) over the 2020–2023 period in the most recent CEDS dataset to our previous estimate (Forster et al., 2024) but with a lower post COVID rebound for NOx and SO2. Regarding SO2, the CEDS datasets (v2024_04_01 used in Forster et al., 2024 and v2025_03_18 used here) account for the introduction of strict fuel sulfur controls brought in by the International Maritime Organization in January 2020. Total SO2 emissions in 2019 were 80.9 Tg SO2 (Table 2). The SO2 emissions from international shipping declined by 8.4 Tg SO2 from 10.4 Tg SO2 in 2019 to 2.0 Tg SO2 in 2020, which is close to the expected 8.5 Tg SO2 reduction estimated by the International Maritime Organization. This decrease was estimated at 7.4 Tg SO2 in the previous CEDS version used in Forster et al. (2024). More generally, the reduction pace of the global SO2 emission over the last 10 years corresponds to that of the first 10 years of the SSP scenarios assuming strong air pollution control (SSP1 and SSP5).
Using our combined estimate of GFED and CEDS (with a 2024 extrapolation based on CAMS), emissions of all SLCFs were reduced in 2022 relative to 2019 but rebounded in 2023 and then slightly decreased in 2024 (relative to 2023) for all compounds except NOx, whose increase is partly driven by increased emissions from biomass burning (Table 2 and Sect. S4). 2023 was a record year for emissions of organic carbon (driven again by a very active biomass burning season) and ammonia (driven by a steady background increase in agricultural sources and a contribution from biomass burning). Fires can be worsened by climate change because of increased fire-prone weather conditions (Burton et al., 2024). Strictly speaking, such fires could sometimes be considered feedbacks and not be included in anthropogenic forcings. However, we choose to include fires in our tracking, as historical biomass burning emissions inventories have previously been consistently treated as an anthropogenic forcing (for example in CMIP6), though this assumption may need to be revisited in the future (see also discussion in Sect. 5). This differs from the treatment of accounting for CO2 and CH4 emissions at present (Sect. 2.2), where we do not include natural emissions in the inventories. As described in Sect. 5, this treatment of all biomass burning emissions as a forcing has implications for several categories of anthropogenic radiative forcing.
Table 2Emissions of the major SLCFs in 1750, 2019 and 2024 from a combination of CEDS and GFED. Emissions of SO2+ SO4 use SO2 molecular weights. Emissions of NOx use NO2 molecular weights. VOCs are for the total mass. Note that estimates for previous years have been revised and updated. WGI 2019 estimates from Smith et al. (2021a).
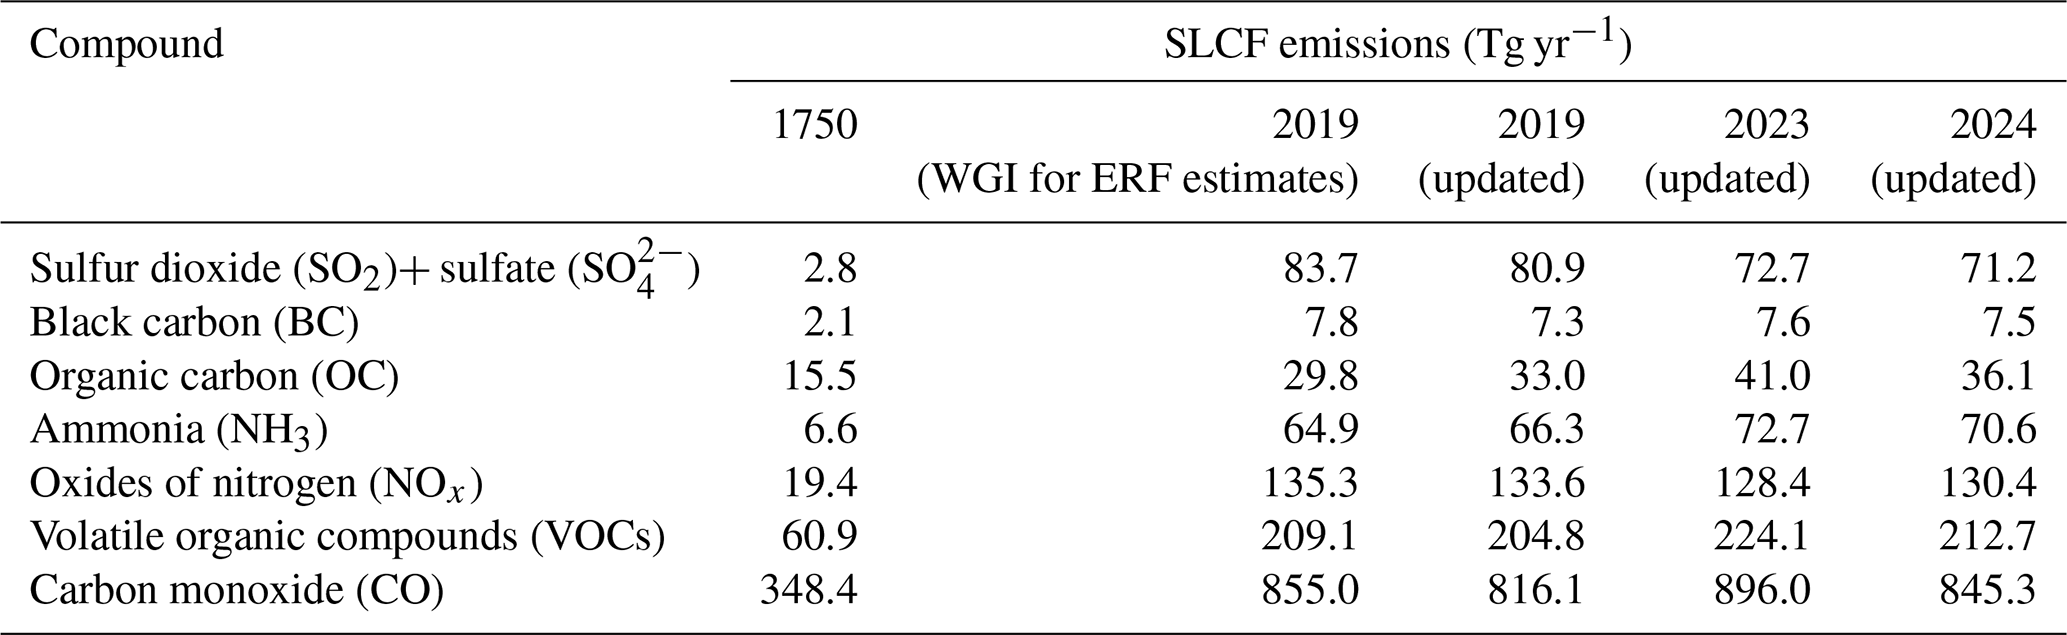
Uncertainties associated with these emission estimates are difficult to quantify. From the non-biomass-burning sectors they are estimated to be smallest for SO2 (±14 %), largest for black carbon (BC) (a factor of 2) and intermediate for other species (Smith et al., 2011; Bond et al., 2013; Hoesly et al., 2018). Relative uncertainties are also likely to increase both backwards in time (Hoesly et al., 2018) and again in the most recent years. Future updates of CEDS are expected to include uncertainties (Hoesly et al., 2018).
ERFs were principally assessed in Chap. 7 of AR6 WGI (Forster et al., 2021), which focussed on assessing ERF from changes in atmospheric concentrations; it also supported estimates of ERF in Chap. 6 that attributed forcing to specific precursor emissions (Szopa et al., 2021) and generated the time history of ERF shown in AR6 WGI Fig. 2.10 and discussed in Chap. 2 (Gulev et al., 2021).
The ERF calculation follows the methodology used in AR6 WGI (Smith et al., 2021b) as updated by Forster et al. (2024) and described in Sect. S5). One methodological update is incorporated into IGCC 2024 for the ERF from land-use surface reflection and irrigation (Sect. S5.4). For each category of forcing, a 100 000-member probabilistic Monte Carlo ensemble is sampled to span the assessed uncertainty range in each forcing. Uncertainties account for systematic, structured random and random components. All uncertainties are reported as 5 %–95 % ranges and provided in square brackets. The methods are all detailed in Sect. S5.
The summary results for the anthropogenic constituents of ERF and solar irradiance in 2024 relative to 1750 are shown in Fig. 5a. In Table 3 these are summarised alongside the equivalent ERFs from AR6 (1750–2019) and last year's Climate Indicators update (1750–2023). Figure 5b shows the time evolution of ERF from 1750 to 2024.
Table 3Contributions to anthropogenic effective radiative forcing (ERF) for 1750–2024 assessed in this section. Data are for single-year estimates unless specified. All values are in watts per square metre (W m−2), and 5 %–95 % ranges are in square brackets. As a comparison, the equivalent assessments from AR6 (1750–2019) and last year's climate indicators (1750–2023) are shown. Solar ERF is included and unchanged from AR6, based on the most recent solar cycle (2009–2019), thus differing from the single-year estimate in Fig. 5a. Volcanic ERF is excluded due to the sporadic nature of eruptions.
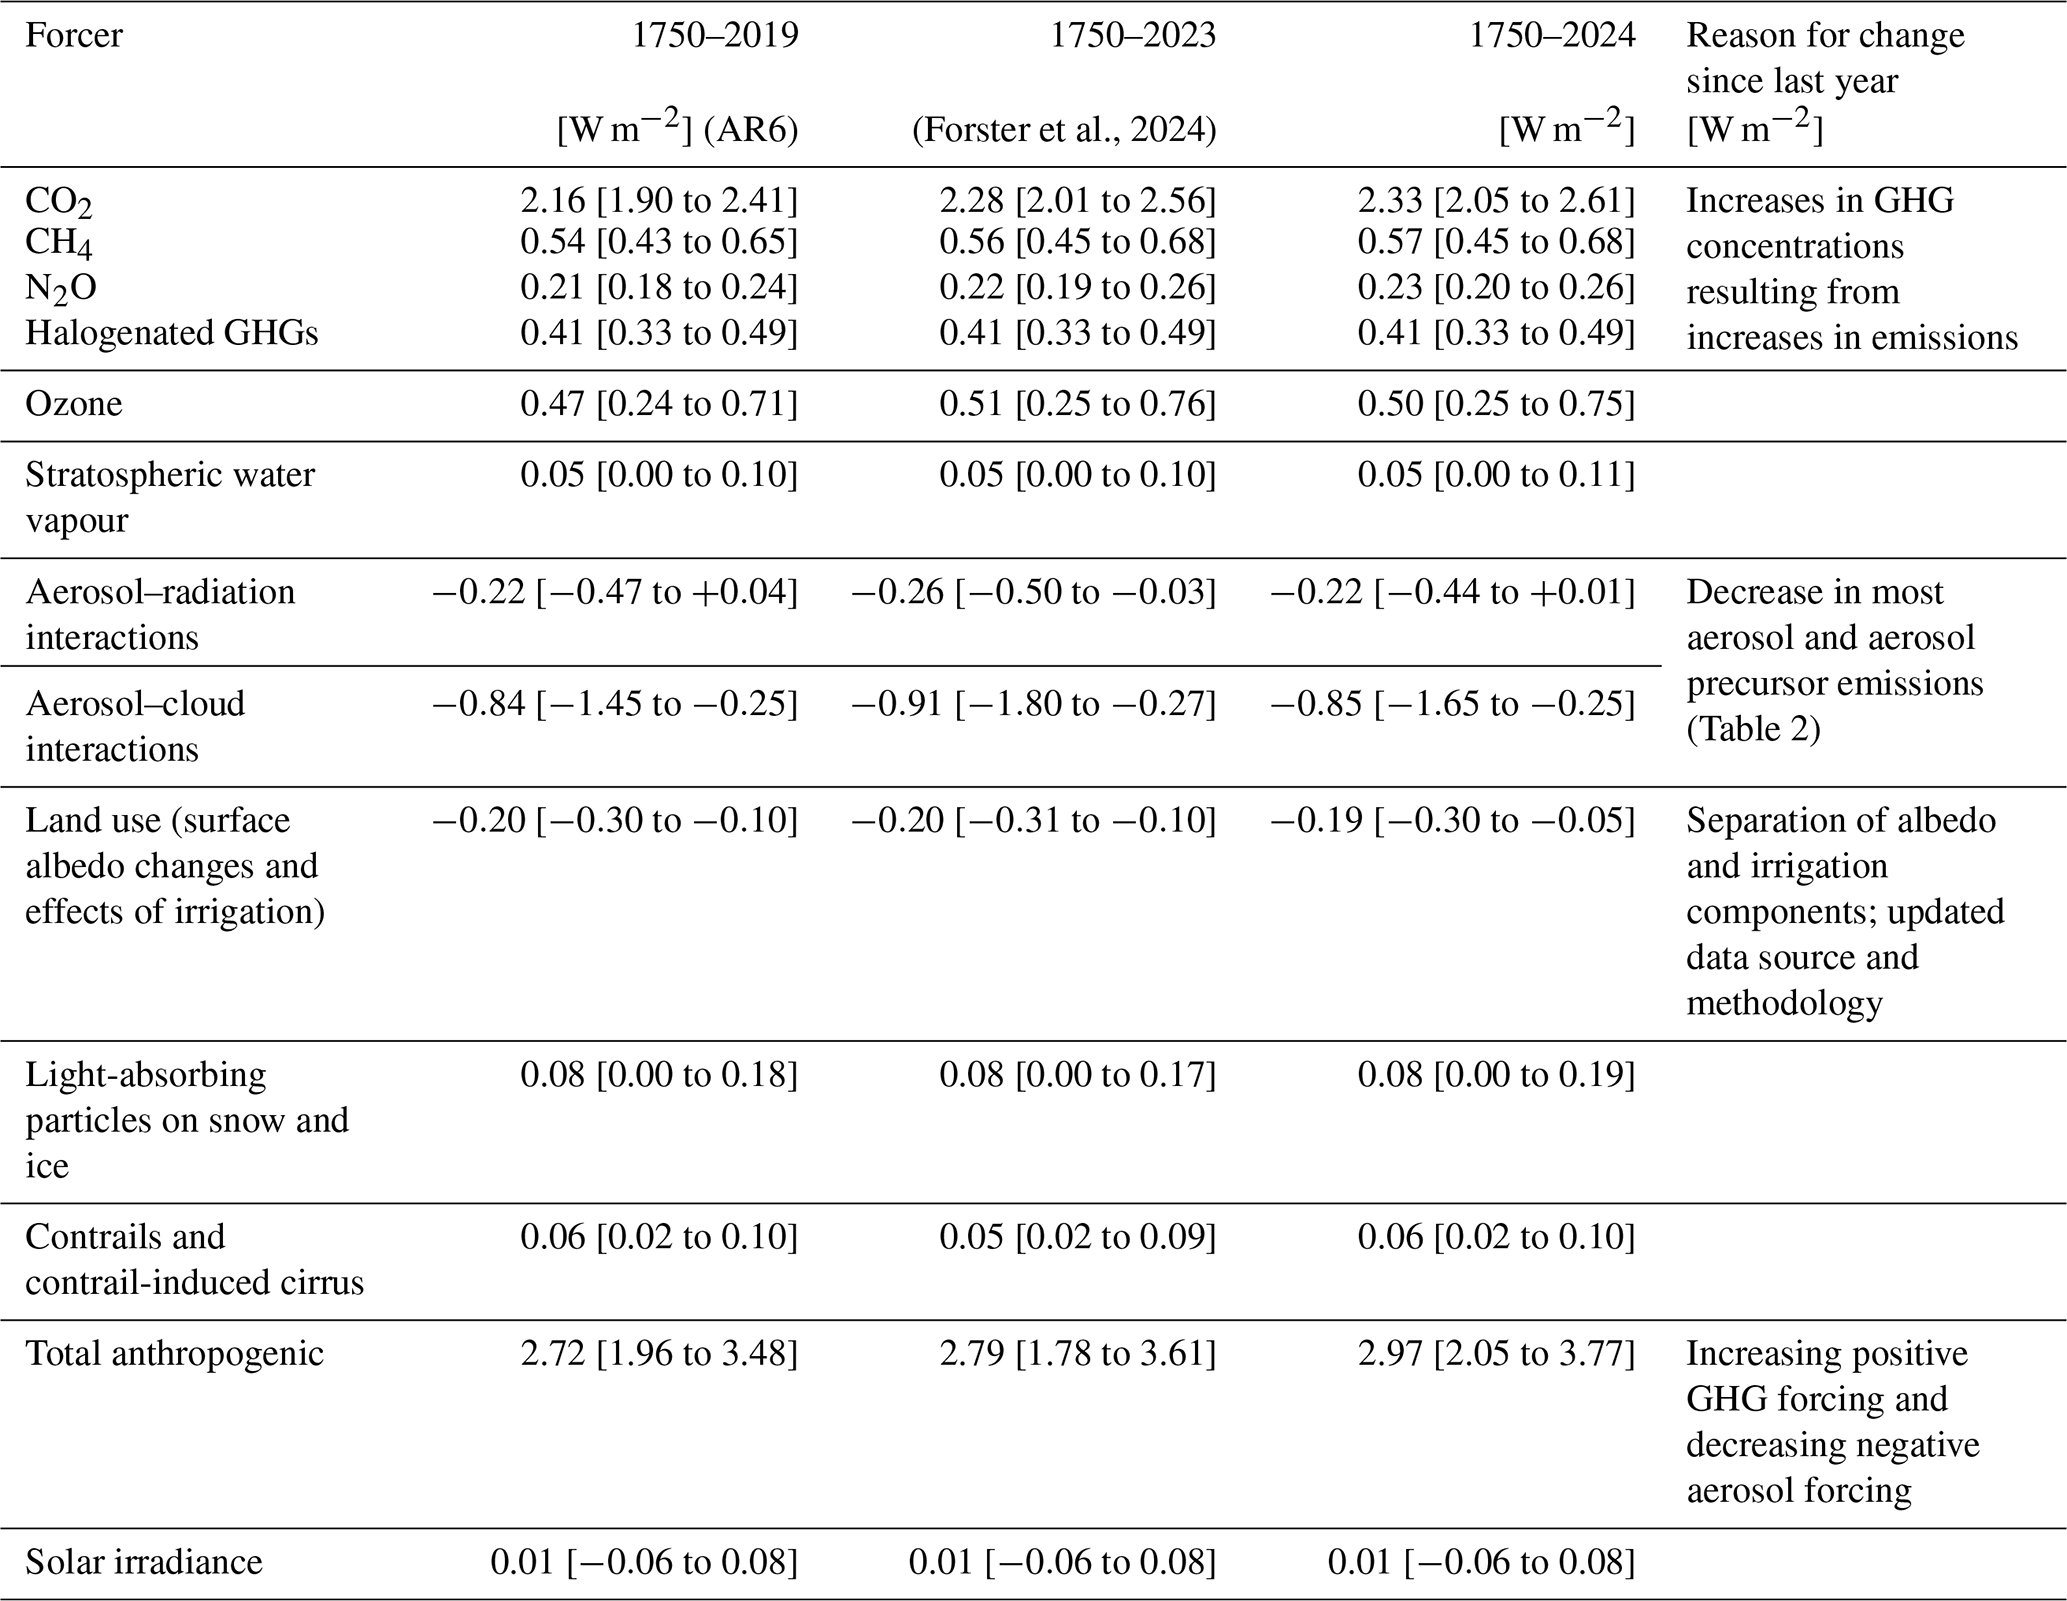
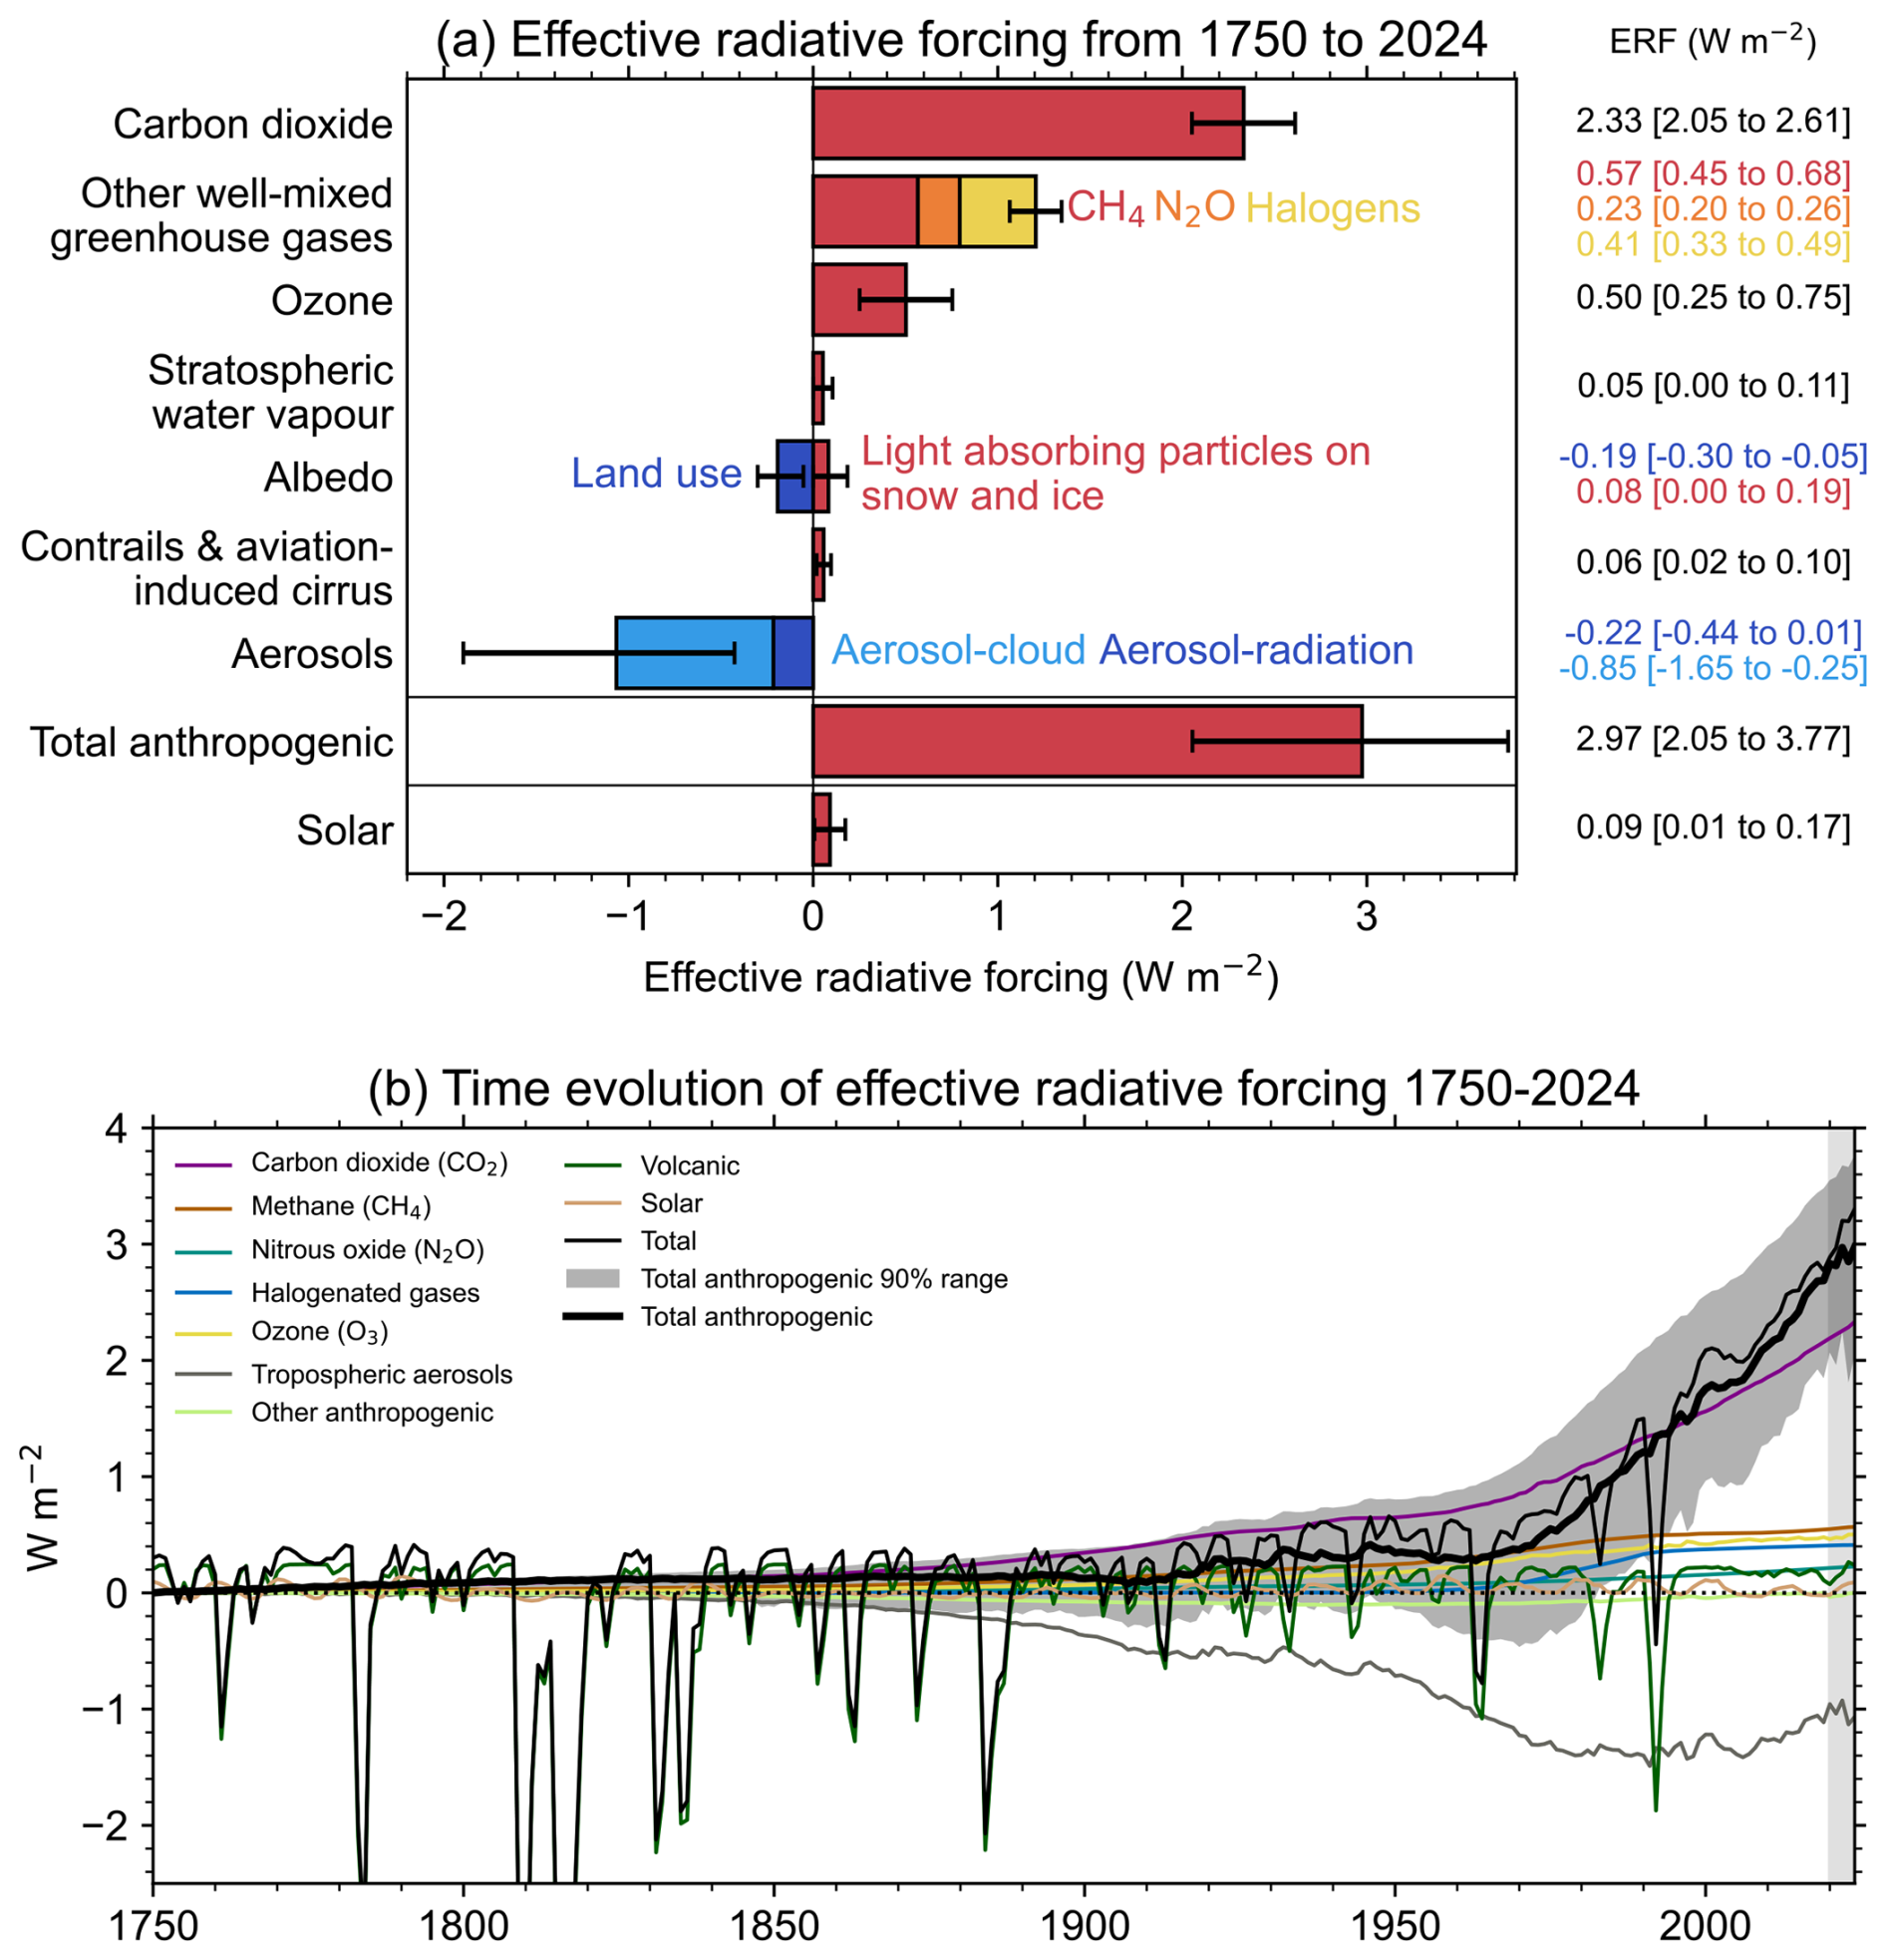
Figure 5Effective radiative forcing (ERF) from 1750–2024. (a) 1750–2024 change in ERF, showing best estimates (bars) and 5 %–95 % uncertainty ranges (lines) from major anthropogenic components to ERF, total anthropogenic ERF and solar forcing. Note that solar forcing in 2024 is a single-year estimate and hence differs from Table 3. (b) Time evolution of ERF from 1750 to 2024. Best estimates from major anthropogenic categories are shown along with solar and volcanic forcing (thin coloured lines), total (thin black line), and anthropogenic total (thick black line). The 5 %–95 % uncertainty in the anthropogenic forcing is shown by grey shading.
Total anthropogenic ERF has increased to 2.97 [2.05 to 3.77] W m−2 in 2024 relative to 1750, compared to 2.72 [1.96 to 3.48] W m−2 for 2019 relative to 1750 in AR6. The ERF has increased considerably from the 2023 estimate of 2.79 [1.79 to 3.61] W m−2. 2023 was a year associated with high biomass burning aerosol, which resulted in a stronger negative aerosol forcing than recent trends. Biomass burning was also high in 2024 but lower than 2023 levels. Sulfur emissions from shipping have declined since 2020, weakening the aerosol ERF and adding around +0.1 W m−2 over 2020 to 2024 (see Sects. 7.2, S5 and S7). The approach of including all biomass burning aerosols is consistent with reporting ERF based on concentration increase in GHGs independent of whether CO2 and CH4 are caused by anthropogenic emissions or a smaller part is caused by any feedbacks such as from biomass burning fires or wetlands. Changes in mineral dust and sea salt are not easily relatable to human activity and are not included in the ERF of aerosols.
The ERF from well-mixed GHGs is 3.54 [3.22 to 3.85] W m−2 for 1750–2024, of which 2.33 W m−2 is from CO2, 0.57 W m−2 from CH4, 0.23 W m−2 from N2O and 0.41 W m−2 from halogenated gases. This is an increase of around 7 % from 3.32 [3.03 to 3.61] W m−2 for 1750–2019 in AR6. ERFs from CO2, CH4 and N2O have all increased since the AR6 WG1 assessment for 1750–2019, owing to increases in atmospheric concentrations.
The total aerosol ERF (sum of the ERF from aerosol–radiation interactions (ERFari's) and aerosol–cloud interactions (ERFaci's)) for 1750–2024 is −1.07 [−1.90 to −0.43] W m−2 compared to −1.18 [−2.10 to −0.49] W m−2 for 1750–2023 (Forster et al., 2024) and −1.06 [−1.71 to −0.41] W m−2 assessed for 1750–2019 in AR6 WGI. Attributing year-to-year trends to aerosol forcing is problematic due to the variability in biomass burning emissions. Increasing biomass burning emissions since AR6 have been mostly offset by a decrease in emissions from energy and industrial sectors, leading to best estimates of ERFari and ERFaci that are virtually unchanged from the 1750–2019 AR6 assessment to the 1750–2024 determination here (Table 3).
Ozone ERF is determined to be 0.50 [0.25 to 0.75] W m−2 for 1750–2024, slightly higher than the AR6 assessment of 0.47 [0.24 to 0.71] W m−2 for 1750–2019. This is due to the increase in emissions of some of its precursors (CO, VOCs, CH4), but this result is highly uncertain since consolidated ozone trends are not yet released. Stratospheric water vapour from methane oxidation has not changed (to two decimal places) since AR6. ERF from light-absorbing particles on snow and ice is 0.08 [0.00 to 0.19] W m−2 for 1750–2024, like AR6. We determine from provisional data that aviation activity in 2024 returned to pre-COVID levels (IATA, 2024). Therefore, ERF from contrails and contrail-induced cirrus is the same as in AR6, at 0.06 [0.02 to 0.10] W m−2 in 2024. The methodology to determine land-use ERF has been updated (Sect. S5.4), but this forcing has a similar best estimate to 2023 and AR6, with a wider uncertainty range that accounts for the separate assessment of irrigation forcing.
The headline assessment of solar ERF has not been re-assessed, at 0.01 [−0.06 to +0.08] W m−2 from pre-industrial times to the 2009–2019 solar cycle mean (Table 3). Separate to the assessment of solar forcing over complete solar cycles, we provide a single-year solar ERF for 2024 of +0.09 [+0.01 to +0.17] W m−2 (Fig. 5a). This is higher than the single-year estimate of solar ERF for 2019 (a solar minimum) of −0.02 [−0.08 to 0.06] W m−2.
Volcanic ERF is included in the overall time series (Fig. 5b), but following IPCC convention we do not provide a single-year estimate for 2024 given the sporadic nature of volcanoes. Alongside the time series of stratospheric aerosol optical depth derived from proxies and satellite products, for 2022–2024 we include the stratospheric water vapour contribution from the Hunga Tonga–Hunga Ha'apai (HTHH) eruption derived from Microwave Limb Sounder (MLS) data. We estimate a net positive (positive forcing from stratospheric water vapour more than outweighing negative forcing from stratospheric aerosols) forcing from HTHH through 2024 (Sect. S5), though note that other studies find the net HTHH forcing to be negative (Gupta et al., 2025) or close to zero (Schoeberl et al., 2024).
EEI, assessed in Chap. 7 of AR6 WGI (Forster et al., 2021), provides a measure of accumulated surplus energy (heating) in the climate system and is hence an essential indicator to monitor the current and future status of global warming. It represents the difference between the radiative forcing acting to warm the climate, and Earth's radiative response, which acts to oppose this warming. Under stable climate conditions, i.e. in the absence of anthropogenic climate forcing, this difference would be balanced over interdecadal timescales. Since at least 1970 there has been a persistent imbalance in the energy flows that has led to excess energy being absorbed by the climate system (Forster et al., 2021). On annual and longer timescales, the global Earth heat inventory changes associated with EEI are dominated by the changes in global ocean heat content (OHC), which has accounted for about 90 % of global heating since the 1970s (Forster et al., 2021). This planetary heating results in changes in all components of the Earth system such as sea-level rise, ocean warming, ice loss, rises in temperature and water vapour in the atmosphere, changes in ocean and atmospheric circulation, continental warming and permafrost thawing (e.g. Cheng et al., 2022; von Schuckmann et al., 2023), with adverse impacts for ecosystems and human systems (Douville et al., 2021; IPCC, 2022).
On decadal timescales, changes in global surface temperatures (Sect. 5) can become decoupled from EEI by ocean heat rearrangement processes (e.g. Palmer and McNeall, 2014; Allison et al., 2020). Therefore, the increase in the Earth heat inventory arguably provides a more robust indicator of the rate of global change on interannual-to-decadal timescales (Cheng et al., 2019; Forster et al., 2021; von Schuckmann et al., 2023). AR6 WGI found increased confidence in the assessment of change in the Earth heat inventory compared to previous IPCC reports due to observational advances and joint closure of the energy and global sea-level budgets (Forster et al., 2021; Fox-Kemper et al., 2021).
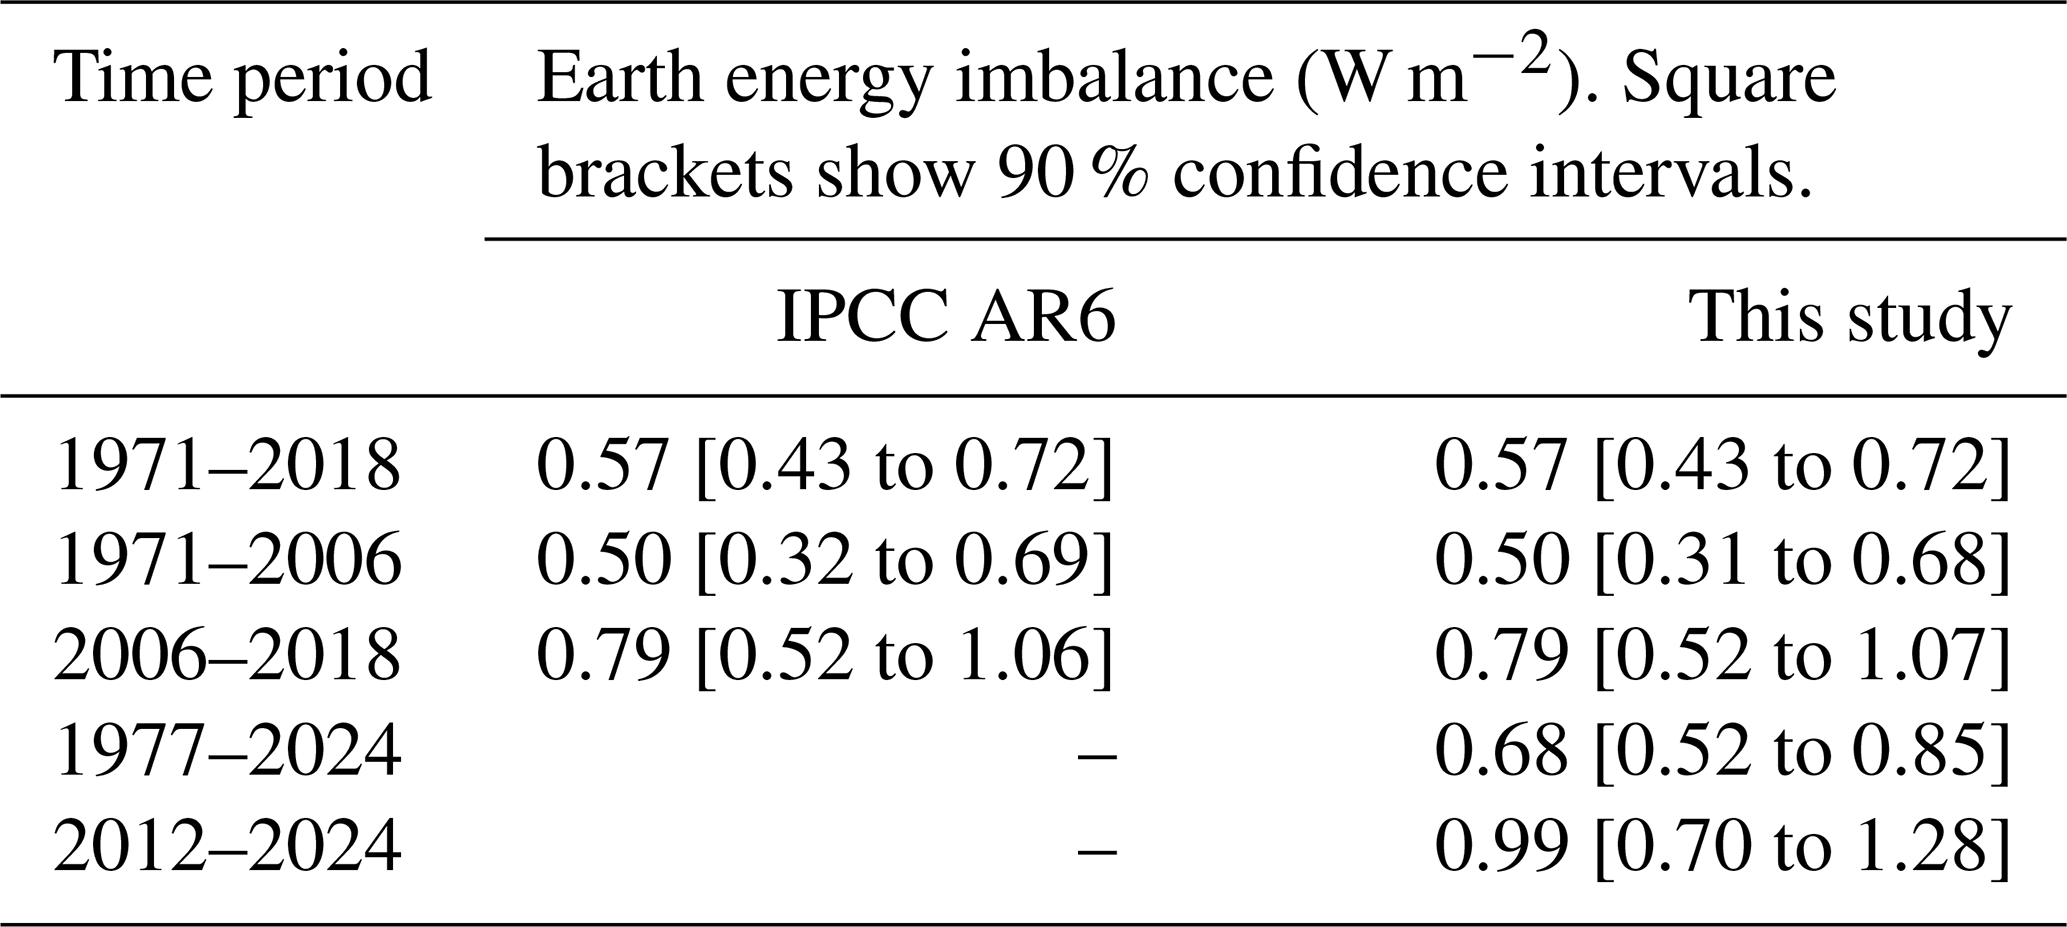
AR6 estimated that EEI increased from 0.50 [0.32–0.69] W m−2 during the period 1971–2006 to 0.79 [0.52–1.06] W m−2 during the period 2006–2018 (Forster et al., 2021). The contributions to increases in the Earth heat inventory throughout 1971–2018 remained stable: 91 % for the full-depth ocean, 5 % for the land, 3 % for the cryosphere and about 1 % for the atmosphere (Forster et al., 2021). Two recent studies demonstrated independently and consistently that since 1960, the rate of warming of the world ocean has been increasing at a relatively consistent pace of 0.15±0.05 W m−2 per decade (Minière et al., 2023; Storto and Yang, 2024; Merchant et al., 2025), while the rate of warming for the land, cryosphere and atmosphere has been increasing at rate of 0.013±0.003 W m−2 per decade (Minière et al., 2023). The increase in EEI over the last several decades (Fig. 6) has also been reported by Cheng et al. (2019), von Schuckmann et al. (2020, 2023), Loeb et al. (2021), Hakuba et al. (2021), Kramer et al. (2021), Raghuraman et al. (2021) and Minère et al. (2023). The observed increase in EEI over the most recent period (i.e. past 2 decades) is helping to drive exceptionally warm conditions (Sect. 7; Minobe et al., 2025). The increase in EEI has been linked to rising concentrations of well-mixed GHGs and recent reductions in aerosol emissions (Sect. 5; Raghuraman et al., 2021; Kramer et al., 2021; Hansen et al., 2023) and to an increase in absorbed solar radiation associated with decreased reflection by clouds and sea ice and a decrease in outgoing longwave radiation (OLR) due to increases in trace gases and water vapour (Loeb et al., 2021; Goessling et al., 2025; Allan and Merchant, 2025).
We carry out an update to the AR6 estimate of changes in the Earth heat inventory based on updated observational time series for the period 1971–2020 (Table 4 and Fig. 6). Time series of heating associated with loss of ice and warming of the atmosphere and continental land surface are obtained from the recent Global Climate Observing System (GCOS) initiative (von Schuckmann et al., 2023; Cuesta-Valero et al., 2023; Vanderkelen and Thiery, 2022; Nitzbon et al., 2022; Kirchengast et al., 2022). We use the original AR6 time series ensemble OHC time series for the period 1971–2018 and then an updated five-member ensemble for the period 2019–2024. We “splice” the two sets of time series by adding an offset as needed to ensure that the 2018 values are identical. The AR6 heating rates and uncertainties for the ocean below 2000 m are assumed to be constant throughout the period. The time evolution of the Earth heat inventory is determined as a simple summation of time series of atmospheric heating; continental land heating; heating of the cryosphere; and heating of the ocean over three depth layers – 0–700, 700–2000 and greater than 2000 m (Fig. 6a). While von Schuckmann et al. (2023) have also quantified heating of permafrost and inland lakes and reservoirs, these additional terms are small and not included here for consistency with AR6 (Forster et al., 2021).
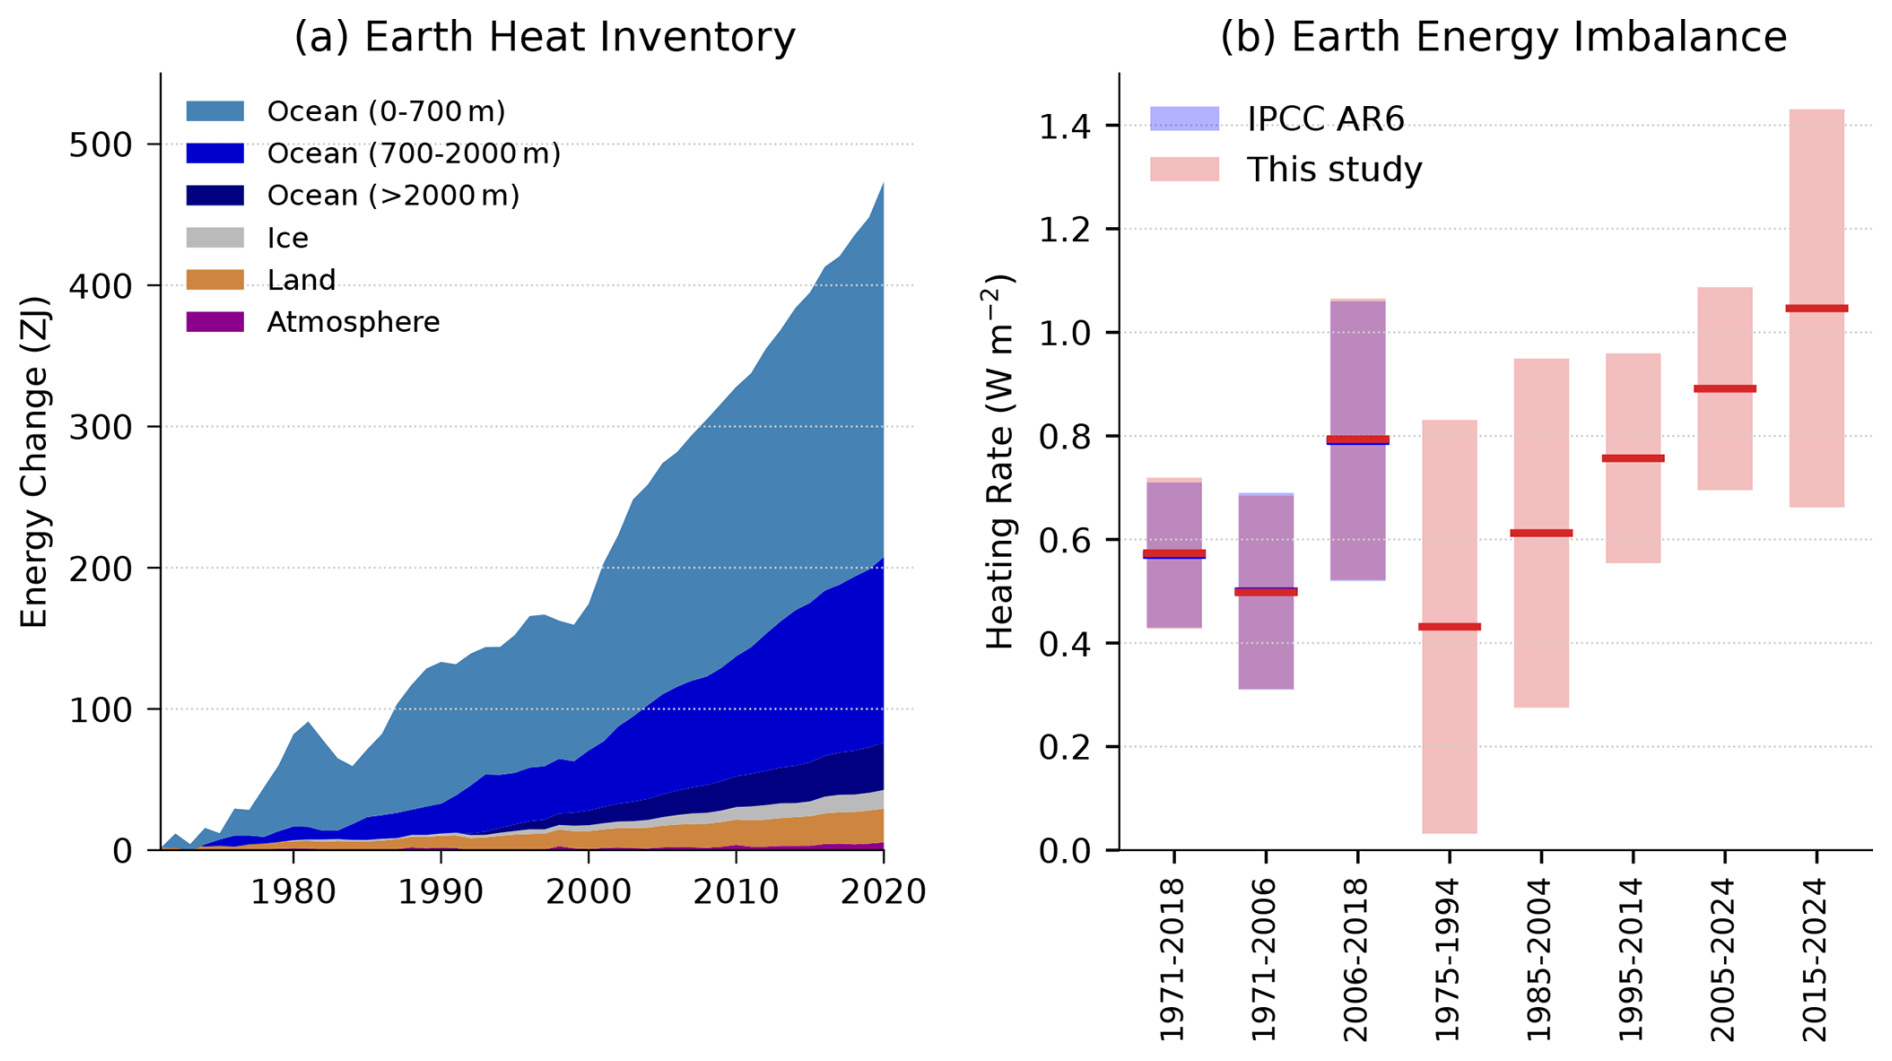
Figure 6(a) Observed changes in the Earth heat inventory for the period 1971–2020, with component contributions as indicated in the figure legend. (b) Estimates of the Earth energy imbalance for the IPCC AR6 assessment periods, for consecutive 20-year periods and the most recent decade. Shaded regions indicate the very likely range (90 % to 100 % probability). Data use and approach are based on the AR6 methods and further described in Sect. S6. For the IPCC AR6 periods our assessment closely matches that in AR6. Note the periods in our assessment overlap with different IPCC AR6 periods.
In our updated analysis, we find successive increases in EEI for each 20-year period since 1975, with an estimated value of 0.43 [0.03 to 0.83] W m−2 during 1975–1994 that more than doubled to 0.89 [0.7 to 1.09] W m−2 during 2005–2024 (Fig. 6b). In addition, there is some evidence that the warming signal is propagating into the deeper ocean over time, as seen by a robust increase in ocean warming in the 700–2000 m depth layer since the 1990s (von Schuckmann et al., 2020, 2023; Cheng et al., 2019, 2022). The model simulations qualitatively agree with the observational evidence (e.g. Gleckler et al., 2016; Cheng et al., 2019), further suggesting that more than half of the OHC increase since the late 1800s occurs after the 1990s.
The update of the AR6 assessment periods to end in 2024 results in systematic increases of EEI: 0.68 W m−2 during 1977–2024 compared to 0.57 W m−2 during 1971–2018 and 0.99 W m−2 during 2012–2024 compared to 0.79 W m−2 2006–2018 (Table 4). The trend and interannual variability of EEI can largely be explained by a combination of surface temperature changes and radiative forcing (Hodnebrog et al., 2024). However, there was a jump in 2023 and 2024, which is still being investigated (see Sect. 7.2) but which is also discussed in the light of recent exceptional extreme climate conditions (Minobe et al., 2025).
Table 4Estimates of the Earth energy imbalance (EEI) for AR6 and the present study.
7.1 Change since 1850–1900
AR6 WGI Chap. 2 assessed the 2001–2020 globally averaged surface temperature change above an 1850–1900 baseline to be 0.99 [0.84 to 1.10] °C and 1.09 [0.95 to 1.20] °C for 2011–2020 (Gulev et al., 2021). Updated estimates to 2013–2022 of 1.15 [1.00–1.25] °C were given in AR6 SYR (IPCC, 2023c), matching the estimate in Forster et al. (2023).
There are choices around the methods used to aggregate surface temperatures into a global average, how to correct for systematic errors in measurements, methods of infilling missing data, and whether surface measurements or atmospheric temperatures just above the surface are used. These choices, and others, affect temperature change estimates and contribute to their uncertainty (AR6 WGI Chap. 2, Cross Chap. Box 2.3, Gulev et al., 2021). The methods chosen here closely follow AR6 WGI and are presented in the Supplement, Sect. S7. Confidence intervals are taken from AR6 as only one of the employed datasets regularly updates ensembles (see Supplement, Sect. S7).
Based on the updates available as of March 2025, the change in global surface temperature from 1850–1900 to 2015–2024 is presented in Fig. 7. These data, using the same underlying datasets (with some version changes: see Sect. S7) and methodology as AR6, estimate 1.24 [1.11–1.35] °C of warming, an increase of 0.15 °C within 4 years from the 2011–2020 value reported in AR6 WGI (Table 5) or 0.14 °C from the 2011–2020 value in the most recent dataset version. The decade 2015–2024 was 0.31 °C warmer than the previous decade (2005–2014). These changes, although amplified somewhat by the exceptionally warm years in 2023 and 2024, are broadly consistent with typical warming rates over the last few decades, which were assessed in AR6 as 0.76 °C over the 1980–2020 period (using ordinary-least-square linear trends) or 0.019 °C per year (Gulev et al., 2021). They are also broadly consistent with projected warming rates from 2001–2020 to 2021–2040 reported in AR6, which have a very likely range between 0.016 °C per year and 0.036 °C per year under SSP2-4.5 (Lee et al., 2021, their Table 4.5), and with human-induced warming rates discussed in Sect. 8.4.
Land temperatures increased by 1.79 [1.56–2.03] °C from 1850–1900 to 2015–2024 and ocean temperatures by 1.02 [0.81–1.13] °C over the same period, implying that most land areas have already experienced more than 1.5 °C of warming from the 1850–1900 period. As was the case for the periods reported in AR6, the ratio of observed land to ocean warming is in the vicinity of 1.75, somewhat higher than the ratio of 1.5 [1.4–1.7] projected by the end of the century in CMIP6 models (AR6, their Table 4.2 and Sect. 4.5.1.1.1). The additional observed warming since 2020 in the most recent dataset versions (0.21 °C for land, 0.13 °C for ocean) has a ratio within the CMIP6 projection range.
Table 5Estimates of global surface temperature change from 1850–1900 [very likely (90 %–100 % probability) ranges] for IPCC AR6 and the present study.
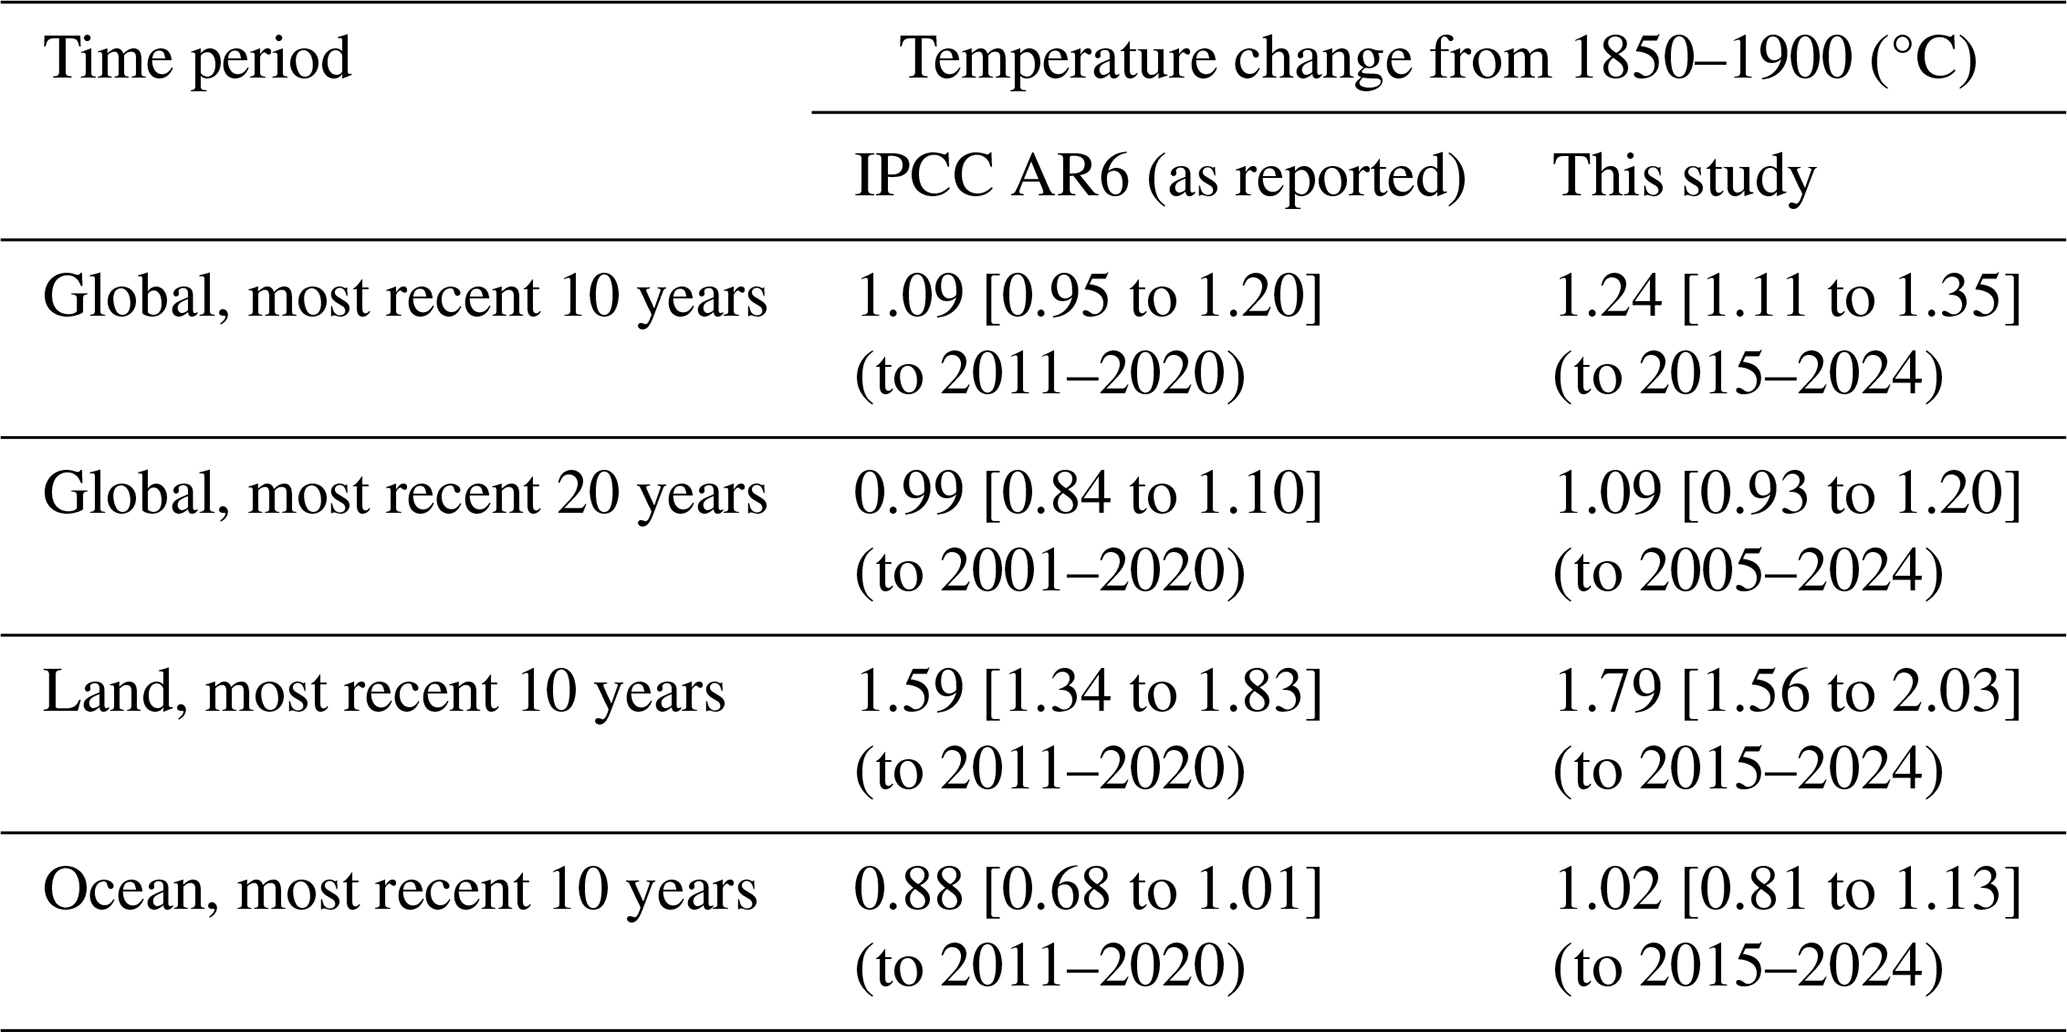
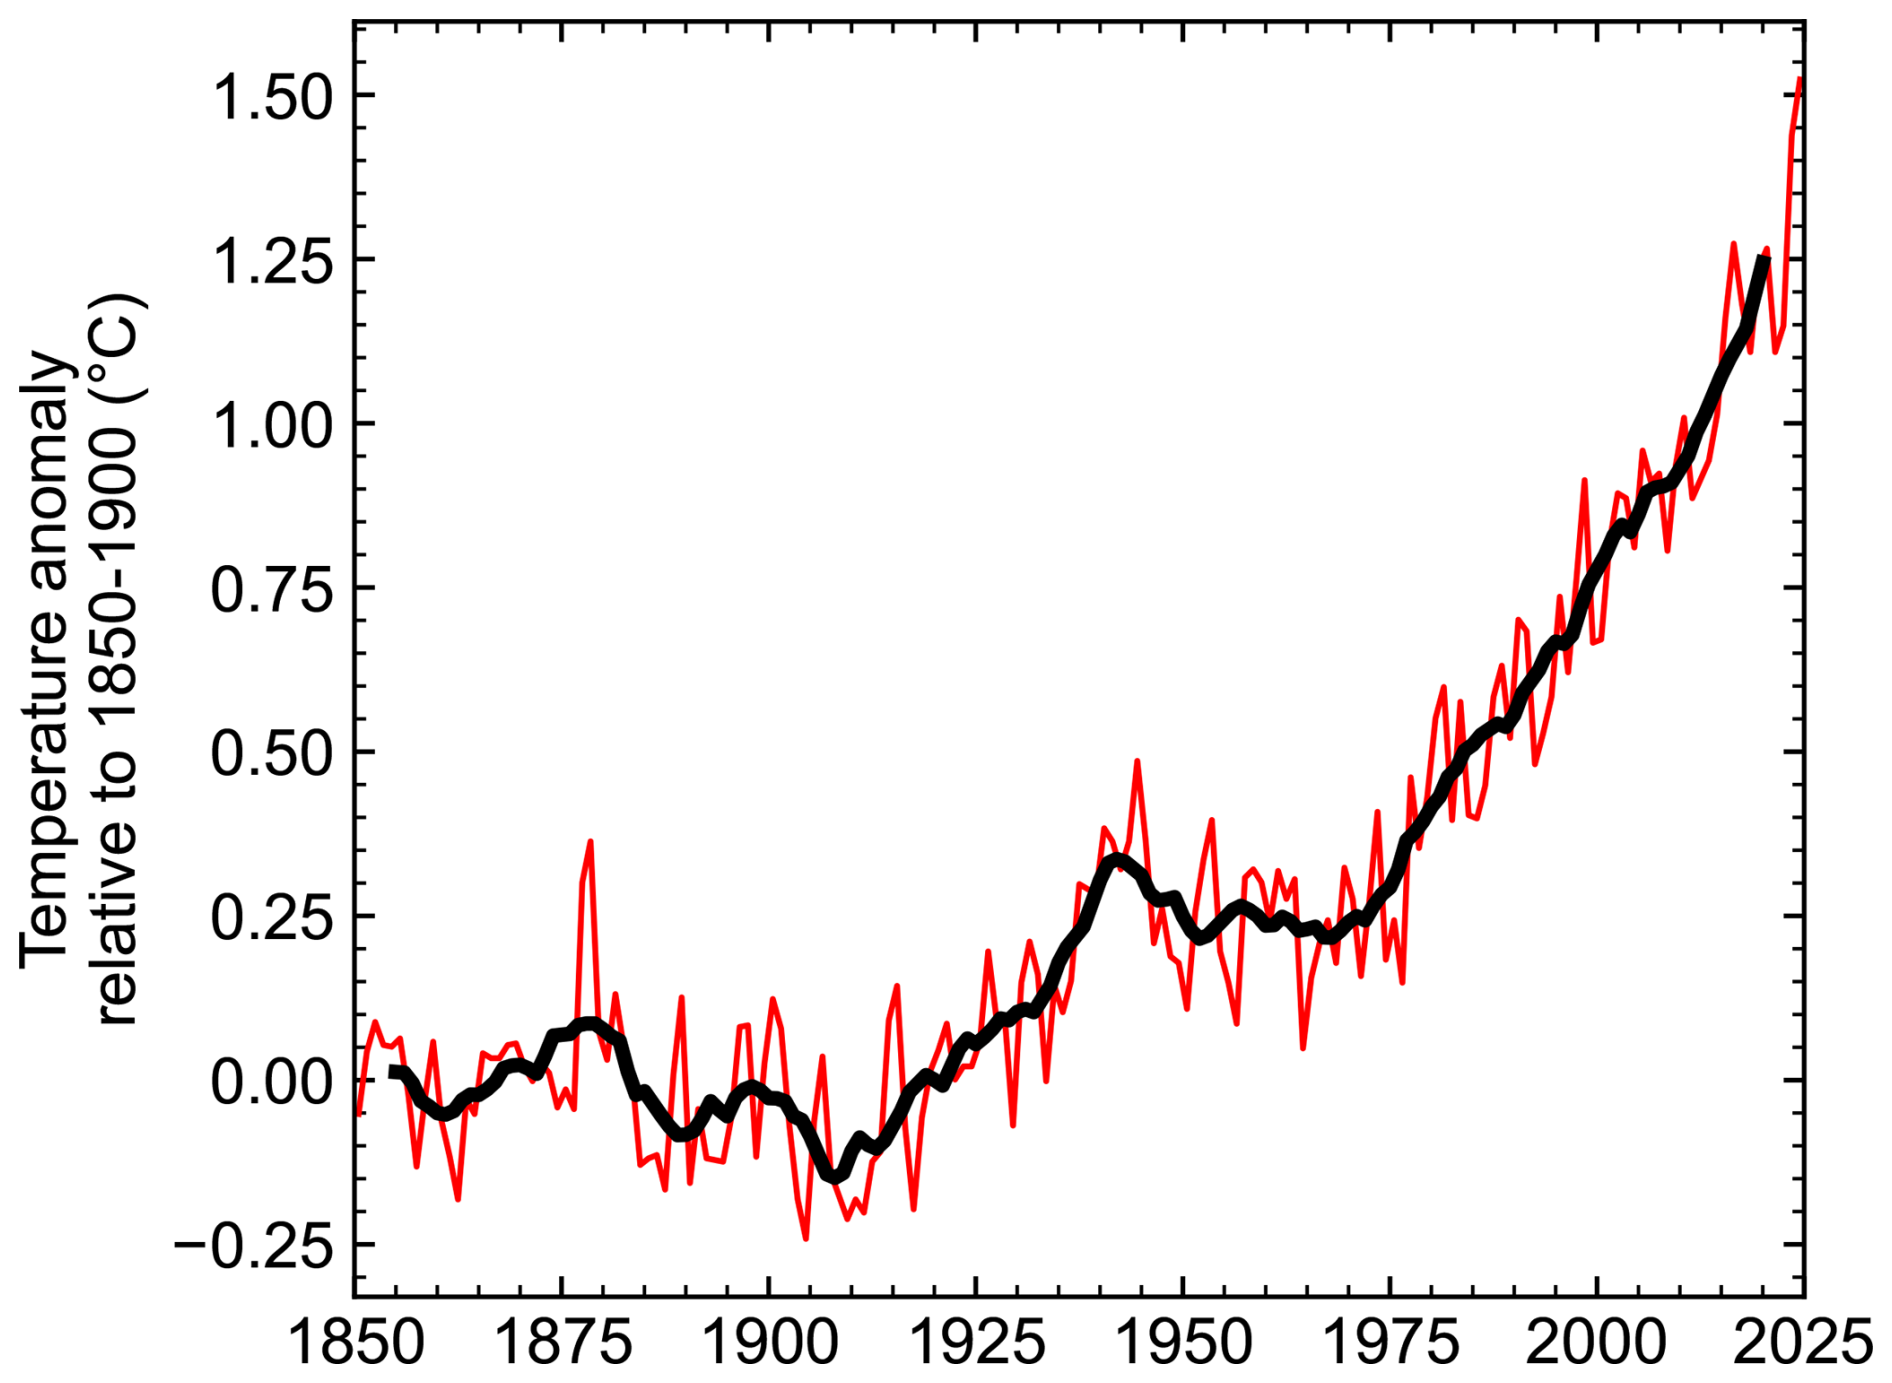
Figure 7Annual (thin line) and decadal (thick line) means of global surface temperature (expressed as a change from the 1850–1900 reference period). Temperatures are based on an average of four datasets following AR6; see Sect. S7 for details.
7.2 2023–2024 global mean temperature anomalies
At the time, 2023 set a new global annual-mean surface temperature change record, with a best estimate of 1.44 °C, beating 2016 by 0.16 °C. 2024 surpassed this, reaching 1.52±0.13 °C, becoming the first calendar year since pre-industrial times more likely than not exceeding 1.5 °C (Fig. 7). The assessed uncertainty range is based on that in AR6 WGI (Gulev et al., 2021). All four individual datasets are well inside the range (ranging from 1.46 to 1.56 °C). Natural drivers and internal variability are expected to modulate human-caused warming at interannual-to-decadal timescales. 2024 is assessed to be 0.16 °C warmer than the updated human-induced value (Table 6), while 2022 was 0.06 °C colder. These values are not inconsistent with AR6, which estimated the effect of internal variability in any single year to be ±0.25 °C based on CMIP6 models, nor with the lower estimated ranges (±0.17 °C) when calculated from observational products (Trewin, 2022).
The probability of seeing an observed temperature of 1.52 °C in 2024 considering a human-induced warming equal to 1.36 °C is about one chance out of six (Fig. 8a). The methodology to calculate this probability consists in comparing the global surface air temperature (GSAT)-observed anomaly to the anomalies expected from CMIP6 models following the framework adopted in AR6 in Chap. 3 (Eyring et al., 2021) for decadal trends and adapted here for interannual timescale issues. The same probability but conditional to the fact that 2024 followed an El Niño year and that the Atlantic multidecadal variability (AMV) was in a positive phase (Sect. S7), rises to one chance out of two. 2024 can therefore be treated as a “normal” year, i.e. very much expected at the actual human-caused global warming level when the internal modes of variability are taken into account and when assessed from a very large number of simulations from large ensembles. Based on the same calculation, we estimate that a year as warm as 2023 would occur once in 4 years at human-induced warming equal to 1.31 °C (Fig. 8b). It drops to a 1-in-14 [10–20, CI 5 %–95 %]-year event, i.e. a rare-to-exceptional event, when considering that 2023 followed a La Niña year and despite persistent positive AMV. Note that the probability of the large jump in global temperatures was increased by the fact that the El Niño followed an extended La Niña over 2020–2022 (Raghuraman et al., 2024). Within such a framework, 2022, which was colder than human-induced warming, could be interpreted as a normal/expected year considering that 2021 was a La Niña year and AMV positive (Fig. 8c). These results show that human-induced warming combined with particular modes of natural variability shifts the odds of global surface temperatures passing 1.5 °C, making it more likely. Section 8 has a fuller discussion of human-induced warming.
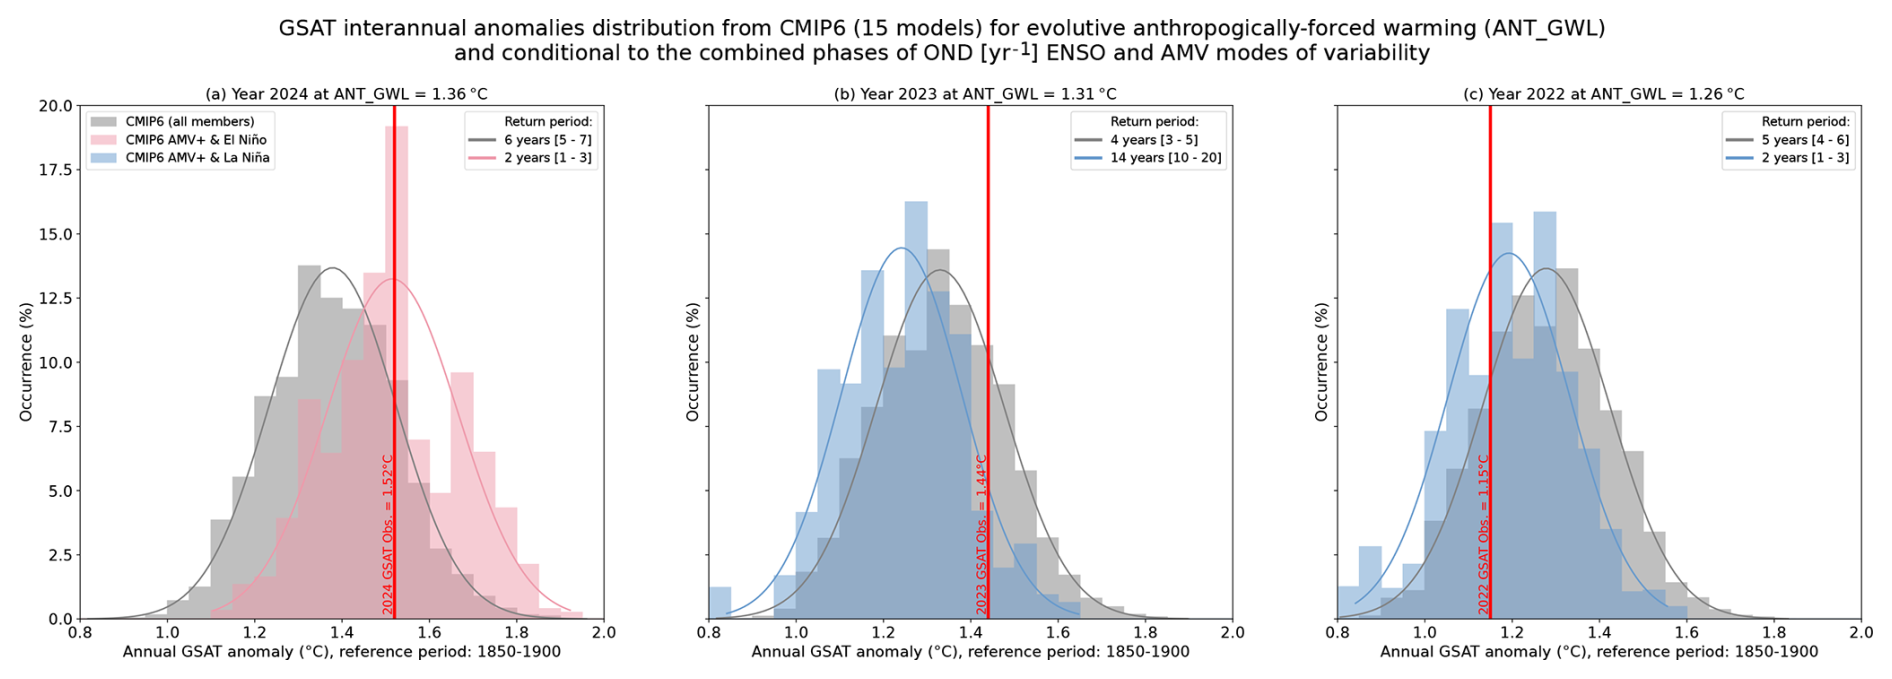
Figure 8(a) Grey histograms of global surface air temperature (GSAT) interannual anomalies estimated from 15 CMIP6 models extracted from all available SSP scenarios (∼700 members) at anthropogenic global warming levels (ANT_GWL) corresponding to (a) 2024, (b) 2023 and (c) 2022. The red vertical bar stands for the observational consolidated GSAT annual anomalies (Sect. 7.1). The return period of the observed annual GSAT event estimated from the CMIP6 distribution is provided (upper corner). Associated [5 %–95 %] likely range is assessed through bootstrapping. Interannual anomalies are obtained following the Trewin (2022) method over 10-year sliding windows. Only models providing large ensembles (n members >5) and having at least one member whose interannual variance of GSAT is compatible with observational estimates are selected. Coloured histograms stand for the same distribution but conditional to the combined phase of El Niño–Southern Oscillation (ENSO) and Atlantic Multidecadal Variability (AMV). Sea surface temperature (SST) anomalies for the modes of variability are calculated from the residual of SST obtained after removing the modelled forced response estimated as model ensemble mean. A year is considered an El Niño/La Niña year if the (October–December) Oceanic Niño Index (ONI) index of the previous year is greater/lower than 1 standard deviation. A year is considered an AMV+ year if the annual North Atlantic average SST is greater than 1 standard deviation. Light pink represents years when ONI and AMV are concomitantly positive and light blue when ONI is negative.
The increase in global temperature between 2022 and 2023 and in particular in global sea surface temperature is exceptional based on model estimates accounting for projected known human and natural forcings and internal variability (Rantanen and Laaksonen, 2024; Terhaar et al., 2025, Cattiaux et al., 2024). The La Niña-to-El Niño sequence is of key importance and has been likely reinforced by enhanced energy uptake due to multi-year persistence in the preceding La Niña. The temporal synchronicity between the modes of variability in all basins is hypothesised to have played a role in the jump (Minobe et al., 2025), with the North Atlantic being at a record warm (Guinaldo et al., 2025) and the austral sea ice extent being at a record low (Purich and Doddridge, 2023).
Possible specific causes beyond internal variability, many of which are already accounted for in the estimated human-induced warming level, have been postulated, e.g. International Maritime Organization rules on shipping fuel sulfur content that came into force in January 2021, the eruption of Hunga Tonga–Hunga Ha'apai in January 2022 and other subsequent smaller volcanic activity, and a faster-than-expected onset of solar cycle 25 (see Sect. S7 for details and references). A key diagnostic of these changes including both external forcing and internal variability was the exceptional magnitude of the net energy increase into the Earth system from mid-2022 to mid-2023, driven in large part by the reduced reflectance and greater absorption of solar radiation (Hodnebrog et al., 2024; Goessling et al., 2025; Minobe et al., 2025; Allan and Merchant, 2025), which may be influenced by cloud feedbacks (Tselioudis et al., 2024) as well as surface reflectance and atmospheric composition change (see also Sect. 6).
Our analysis, detailed in the Supplement, Sect. S7, makes use of estimates of variability and radiative forcing contributions and their uncertainty based on Sect. 5 and the published literature. It shows that the increase in 2023 and 2024 compared to previous years could be explained by a combination of factors. In summary, our analyses show that, although the relative weight between the physical processes in explaining the high surface temperatures remain to be better quantified, the 2023 and 2024 observed temperatures are not inconsistent with the level of human-induced warming assessed next, in Sect. 8.
Human-induced warming, also known as anthropogenic warming, refers to the component of observed global surface temperature increase attributable to both the direct and indirect effects of human activities, which are typically grouped as follows: well-mixed GHGs (consisting of CO2, CH4, N2O and F-gases) and other human forcings (consisting of aerosol–radiation interaction, aerosol–cloud interaction, black carbon on snow, contrails, ozone, stratospheric H2O and land use) (Eyring et al., 2021). The remaining contributors to total warming are natural: consisting of both natural forcings (such as solar and volcanic activity) and internal variability of the climate system (such as variability related to El Niño/La Niña events).
An assessment of human-induced warming was provided in two reports within the IPCC's sixth assessment cycle: first in SR1.5 in 2018 (Chap. 1 Sect. 1.2.1.3 and Fig. 1.2; Allen et al., 2018, summarised in the Summary for Policymakers (SPM) Sect. A.1 and Fig. SPM.1; IPCC, 2018) and second in AR6 in 2021 (WGI Chap. 3 Sect. 3.3.1.1.2 and Fig. 3.8; Eyring et al., 2021), summarised in the WGI Summary for Policymakers (SPM) Sect. A.1.3 and Fig. SPM.2; IPCC, 2021b) and quoted again without any updates in SYR (Sect. 2.1.1 and Fig. 2.1; IPCC, 2023a, and SYR Summary for Policymakers (SPM) Sect. A.1.2.; IPCC, 2023b).
8.1 Warming period definitions in the IPCC sixth assessment cycle
Temperature increases are defined relative to a baseline; IPCC assessments typically use the 1850–1900 average temperature as a proxy for the climate in pre-industrial times, referred to as the period before 1750, even though a small amount of warming likely occurred over 1750–1850 (see AR6 WGI Cross Chapter Box 1.2). Temperatures in the IPCC were reported as either global mean surface temperature (GMST) or GSAT; see Sect. S8.1 for details.
Tracking progress towards the long-term global goal to limit warming, in line with the Paris Agreement, requires the assessment of both what the current level of global surface temperatures is and whether a level of global warming, such as 1.5 °C, is being reached. Definitions for these were not specified in the Paris Agreement, and several ways of tracking levels of global warming are in use; here we focus on those adopted within AR6. When determining whether warming thresholds have been passed, both AR6 and SR1.5 adopted definitions that depend on future warming; in practice, levels of current warming were therefore reported in AR6 and SR1.5 using additional definitions that circumvented the need to wait for observations of the future climate, as described next. AR6 defined crossing time for a level of global warming as the midpoint of the first 20-year period during which the average observed warming for that period exceeds that level of warming (see AR6 WGI Chap. 2 Box 2.3) (the level of warming for a given year defined in this way is therefore not known until 10 years after that year). AR6 therefore reported current levels of both observed and human-induced warming as their averages over just the most recent 10 years (which gives warming that lags by only 5 years instead of 10 years) (see AR6 WGI Chap. 3 their Sect. 3.3.1.1.2); we refer to this definition as the “AR6 decade-average” warming. SR1.5 defined the level of warming in a given year as the average human-induced warming, in GMST, of a 30-year period centred on that year; when the given year is the current year, SR1.5 specified that the future 15 years (required for the mean) is revealed by extrapolating the multidecadal trend (see SR1.5 Chap. 1, their Sect. 1.2.1); we refer to this definition as the “SR1.5 trend-based” warming. If the multidecadal trend is interpreted as being linear (which it has been very close to over recent decades), this definition of current warming is equivalent to the end-point of the trend line through the most recent 15 years of human-induced warming and therefore provides a definition of warming for the current year that depends only on historical warming. This interpretation produces results that in recent years have been identical (or extremely close) to the current annual-mean value of human-induced warming (see results in Sect. 8.2, and Sect. S8.3), so in practice the attribution assessment in SR1.5 was based not on the trend-based definition but on the simple annual-year attributed warming; we refer to this definition as the “SR1.5 annual-mean” warming. A diagram of these three definitions is given in Fig. S11.
8.2 Updated assessment approach of human-induced warming to date
This paper provides an update of the AR6 WGI and SR1.5 human-induced warming assessments including, for completeness, all three definitions (AR6 decade-average, SR1.5 trend-based single year, and SR1.5 annual-mean single year). The 2024 updates in this paper follow the same methods and process as the 2022 and 2023 updates provided in Forster et al. (2023, 2024). Global mean surface temperature (GMST) is adopted as the definition of global surface temperature (see Sect. S8.1). The three attribution methods used in AR6 are retained: the Global Warming Index (GWI) (building on Haustein et al., 2017), regularised optimal fingerprinting (ROF) (as in Gillett et al., 2021) and kriging for climate change (KCC) (Ribes et al., 2021). Details of each method, their different uses in SR1.5 and AR6, and any methodological changes, are provided in Sect. S8.2; method-specific results are also provided in Sect. S8.3. The overall estimate of attributed global warming for each definition (decade-average, trend-based and annual mean) is based on a multi-method assessment of the three attribution methods (GWI, KCC, ROF); the best estimate is given as the 0.01 °C-precision mean of the 50th percentiles from each method, and the likely range is given as the smallest 0.1 °C precision range that envelops the 5th to 95th percentile ranges of each method. This assessment approach is identical to last year's update (Forster et al., 2024); it is directly traceable to and fully consistent with the assessment approach in AR6, though it has been lightly extended in ways that are explained in Sect. S8.4.
Results are summarised in Table 6 and Fig. 9. Method-specific contributions to the assessment results, along with time series, are given in Sect. S8.3. Where results reported in GSAT differ from those reported in GMST (see Sect. S8.1), the additional GSAT results are given in Sect. S8.3.
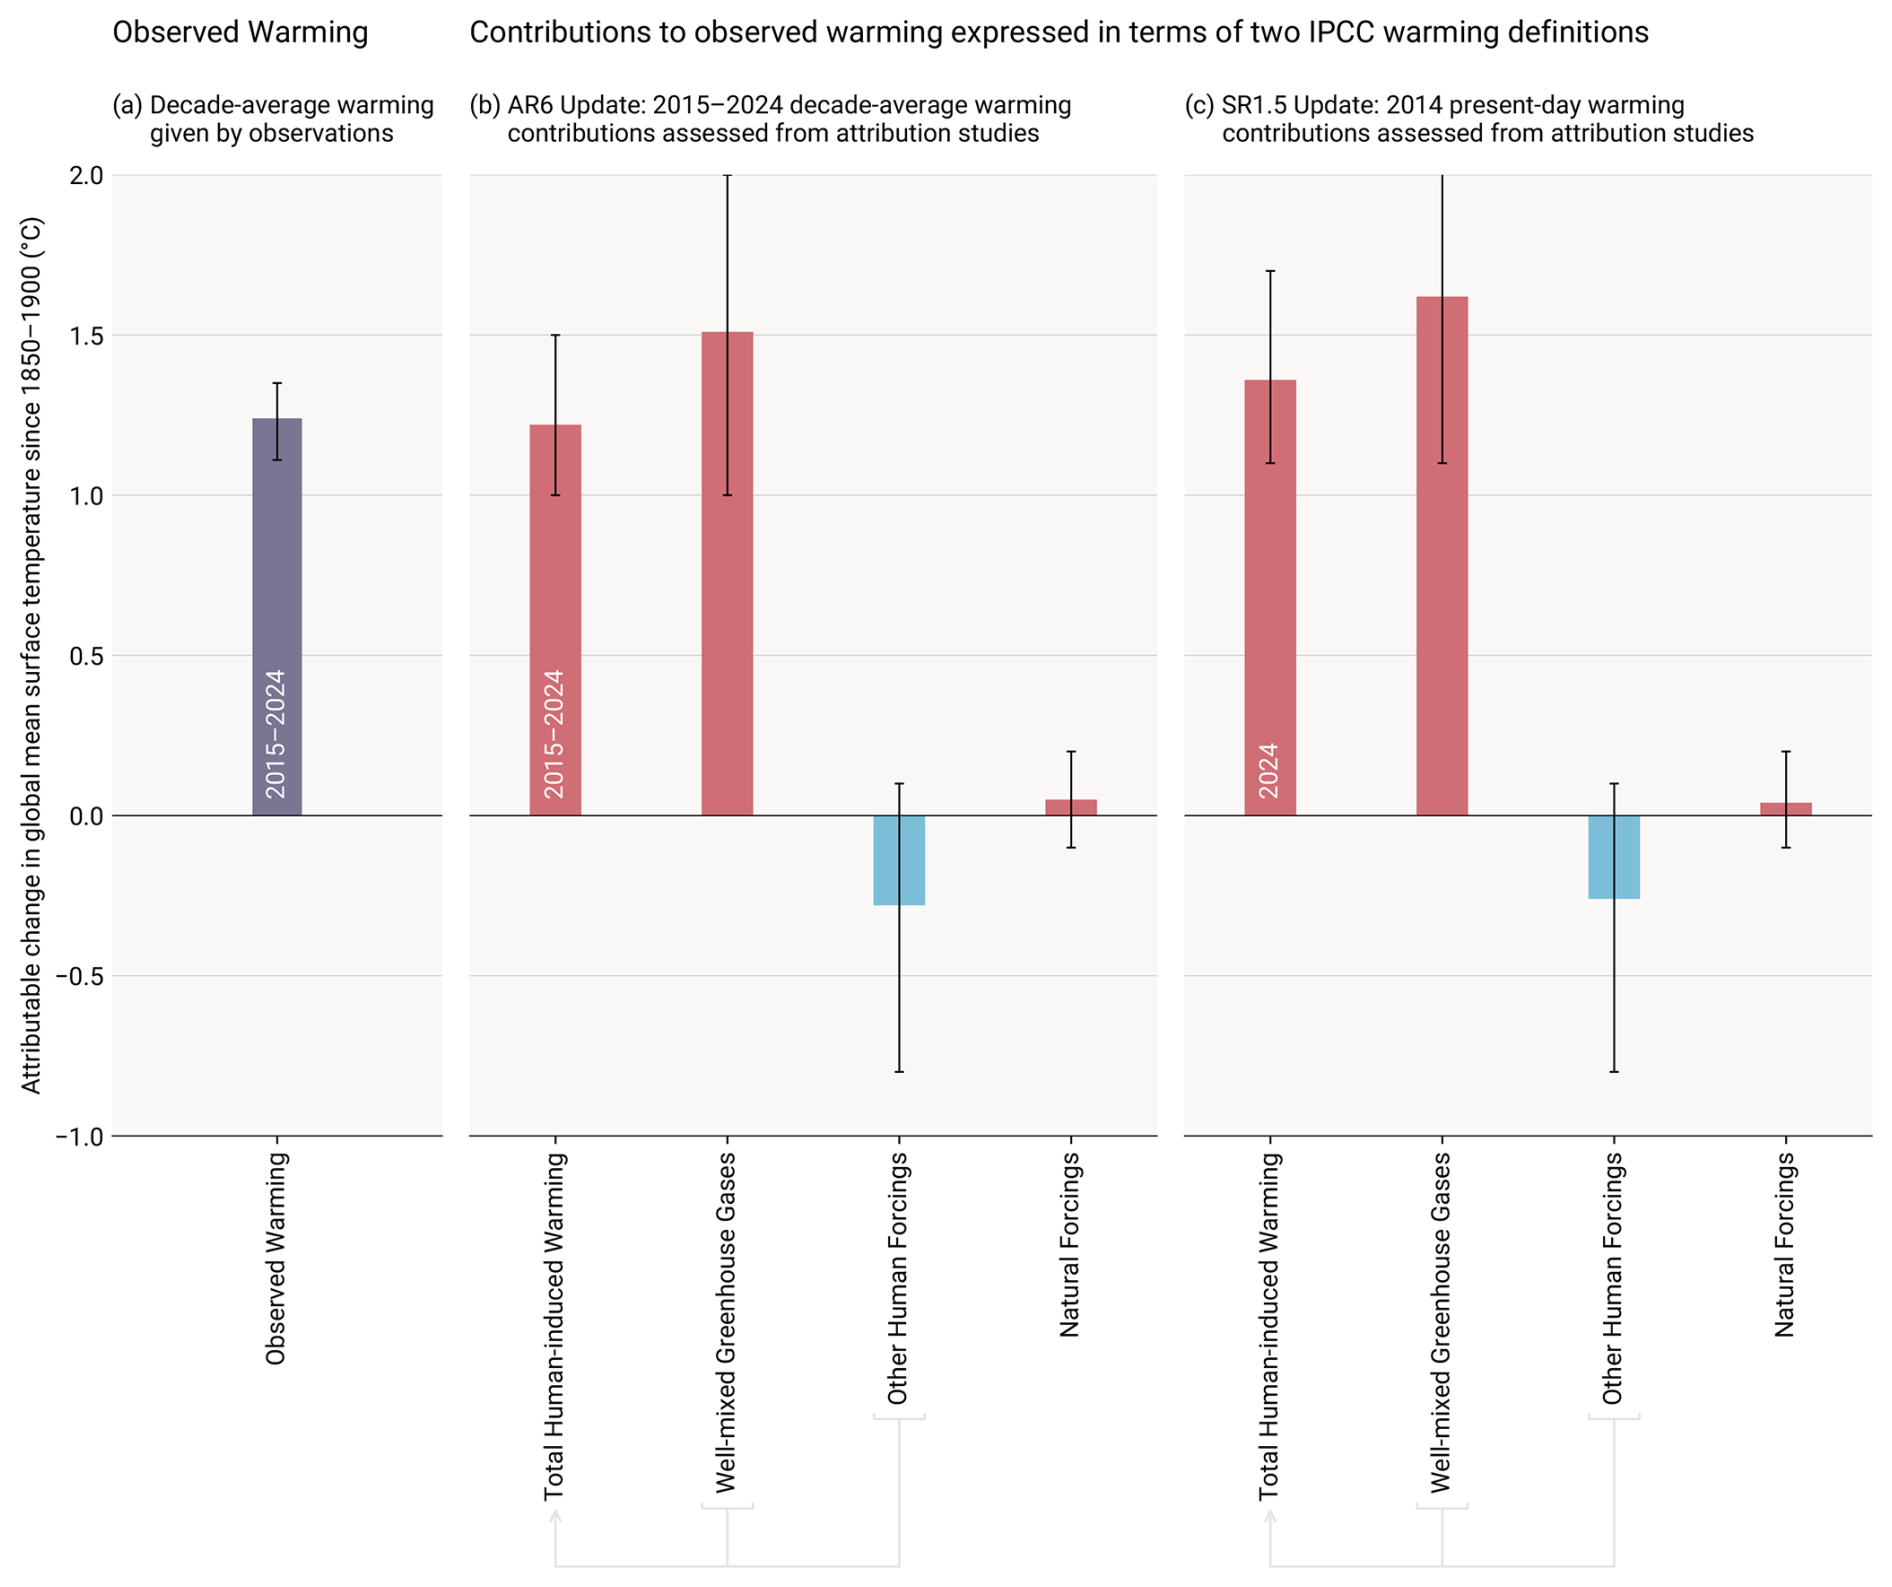
Figure 9Updated assessed contributions to observed warming relative to 1850–1900; see AR6 WGI SPM.2. Results for all time periods in this figure are calculated using updated datasets and methods. The 2015–2024 average and 2024 results are this year's updated assessments for AR6 and SR1.5, respectively. Panel (a) shows updated observed global warming from Sect. 7, expressed as total global mean surface temperature (GMST), due to both anthropogenic and natural influences. Whiskers give the “very likely” range. Panels (b) and (c) show updated assessed contributions to warming, expressed as global mean surface temperature (GMST), from natural forcings and total human-induced forcings, which in turn consist of contributions from well-mixed GHGs and other human forcings. Whiskers give the “likely” range. Changes to warming levels since the IPCC sixth assessment cycle are depicted in Fig. S10.
Table 6Updates to assessments in the IPCC sixth assessment cycle of warming attributable to multiple influences. Estimates of warming attributable to multiple influences (in °C) relative to the 1850–1900 baseline period. Results are given as best estimates, with the likely range in brackets, and reported as global mean surface temperature (GMST). Results from the IPCC sixth assessment cycle, for both AR6 and SR1.5, are quoted in columns labelled (i) and are compared with repeat calculations in columns labelled (ii) for the same period using the updated methods and datasets to see how methodological and dataset updates alone would change previous assessments. Assessments for the updated periods are reported in columns labelled (iii).
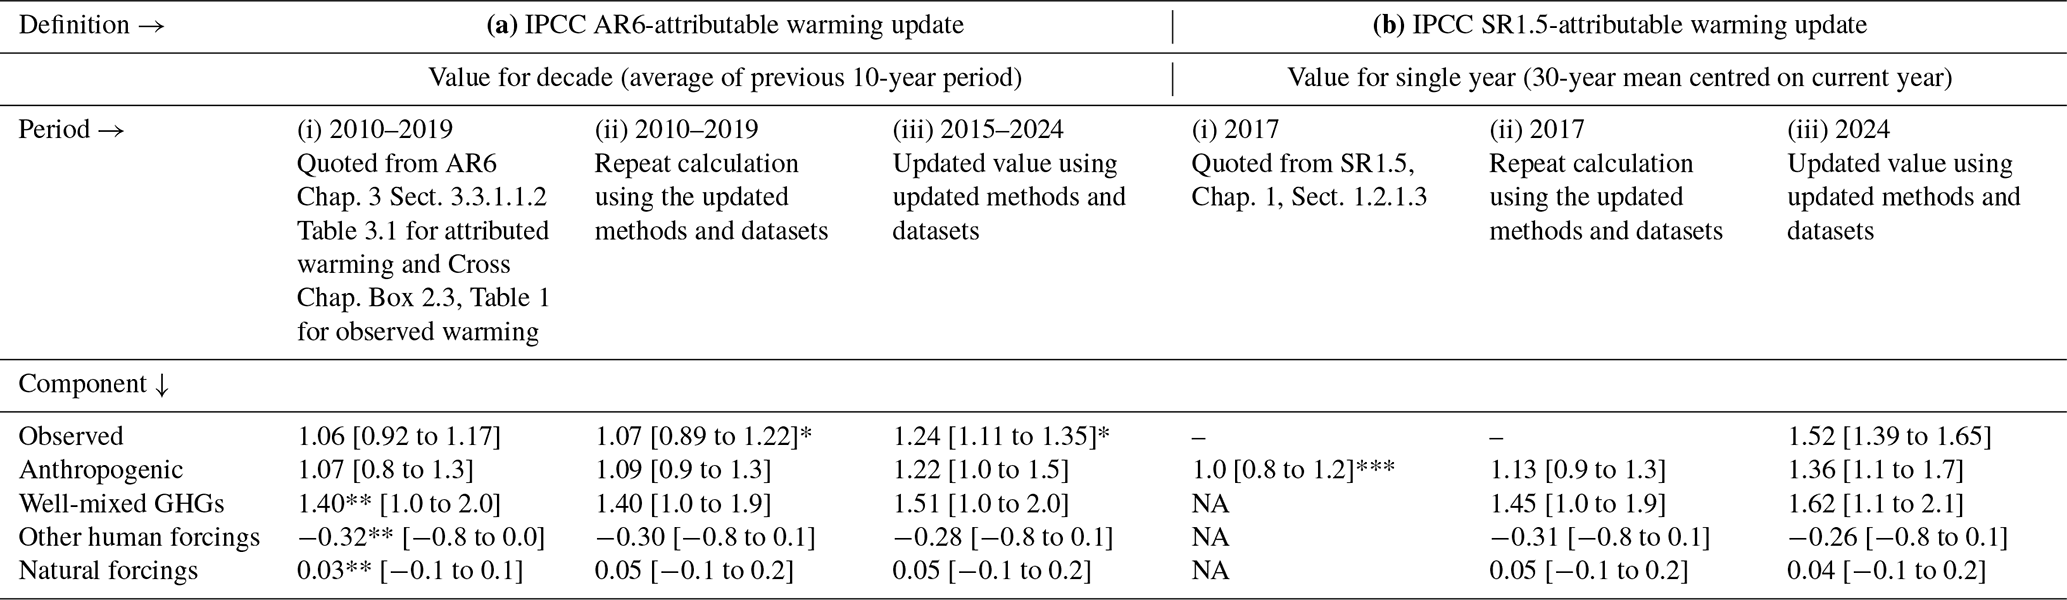
* Updated GMST observations, quoted from Sect. 7 of this update, are marked with an asterisk, with “very likely” ranges given in brackets. In AR6 WGI, best-estimate values were not provided for warming attributable to well-mixed GHGs, other human forcings and natural forcings (though they did receive a “likely” range); for comparison, best estimates (marked with two asterisks) have been retrospectively calculated in an identical way to the best estimate that AR6 provided for anthropogenic warming (see discussion in Supplement Sect. S8.4.1). The SR1.5 assessment drew only on GWI rounded to 0.1 °C precision, whereas the repeat and updated calculations use the updated multi-method assessment approach. NA: not available.
The repeat calculations for attributable warming in 2010–2019 exhibit good correspondence with the results in AR6 WGI for the same period (see also Supplement, Sect. S8). The repeat calculation for the level of attributable anthropogenic warming in 2017 is about 0.1 °C larger than the estimate provided in SR1.5 for the same period, resulting from changes in methods and observational data (see AR6 WGI Chap. 2 Box 2.3). The updated results for warming contributions in 2024 are higher than in 2017, due also to 7 additional years of increasing anthropogenic forcing. Note also that the SR1.5 assessment only used the GWI method, whereas these annual updates apply the full AR6 multi-method assessment (see Sect. S8.4 for details and rationale).
In this 2025 update, we assess the 2015–2024 decade-average human-induced warming at 1.22 [1.0 to 1.5] °C, which is 0.15 °C above the AR6 assessment for 2010–2019. The single-year average human-induced warming is assessed to be 1.36 [1.1 to 1.7] °C in 2024 relative to 1850–1900. In general, these forced warming levels have evolved steadily and predictably in line with the current warming rate within uncertainty. The uncertainty range for the single-year level of anthropogenic warming already included 1.5 °C in previous years' assessments and for the first time this year also lies at the edge of the uncertainty range for the (lagged) decade mean definition. The single-year anthropogenic warming best estimate is well below the observed best estimate for 2024 (1.52 °C; see Sect. 7), but note that the best estimate and lower uncertainty for observed warming lie within the uncertainty for single-year anthropogenic warming from each of the three attribution methods (see Table S5), whereas the upper uncertainty range of observed warming lies above the range for anthropogenic warming for the two attribution methods that fully exclude internal variability.
The best estimates for decade-average and single-year human-induced warming are 0.04 and 0.05 °C respectively above the value estimated in the previous update for the year 2023 (Forster et al., 2024) but should not be interpreted as a substantive increase in the rate of forced anthropogenic warming, as the rate increase is well within uncertainty ranges (Sect. 8.3).
AR6 found that, averaged for the 2010–2019 period, essentially all observed global surface temperature change was human-induced, with solar and volcanic drivers and internal climate variability making a negligible contribution. This conclusion remains the same for the 2015–2024 period. Generally, whatever methodology is used, on a global scale, the best estimate of the current level of human-induced warming is (within uncertainty) similar to the observed global surface temperature change (Table 6).
8.3 Rate of human-induced global warming
Estimates of the human-induced warming rate follow the same methodology as in the previous year's update (a rolling 10-year linear trend in attributed anthropogenic warming). A full description of the approach can be found in Sect. S8.5. The rate of increase in attributed anthropogenic warming over time is distinct from the rate of increase in the observed global surface temperature, which is also affected by internal variability such as El Niño and natural forcings such as volcanic activity (see discussions in Sect. 7.2). The rate of anthropogenic warming we estimate here is driven by the rate of change of anthropogenic ERF (Sect. 5), with variations in the climate forcing trend over time correlating with variations in the rate of attributed warming (Fig. 10).
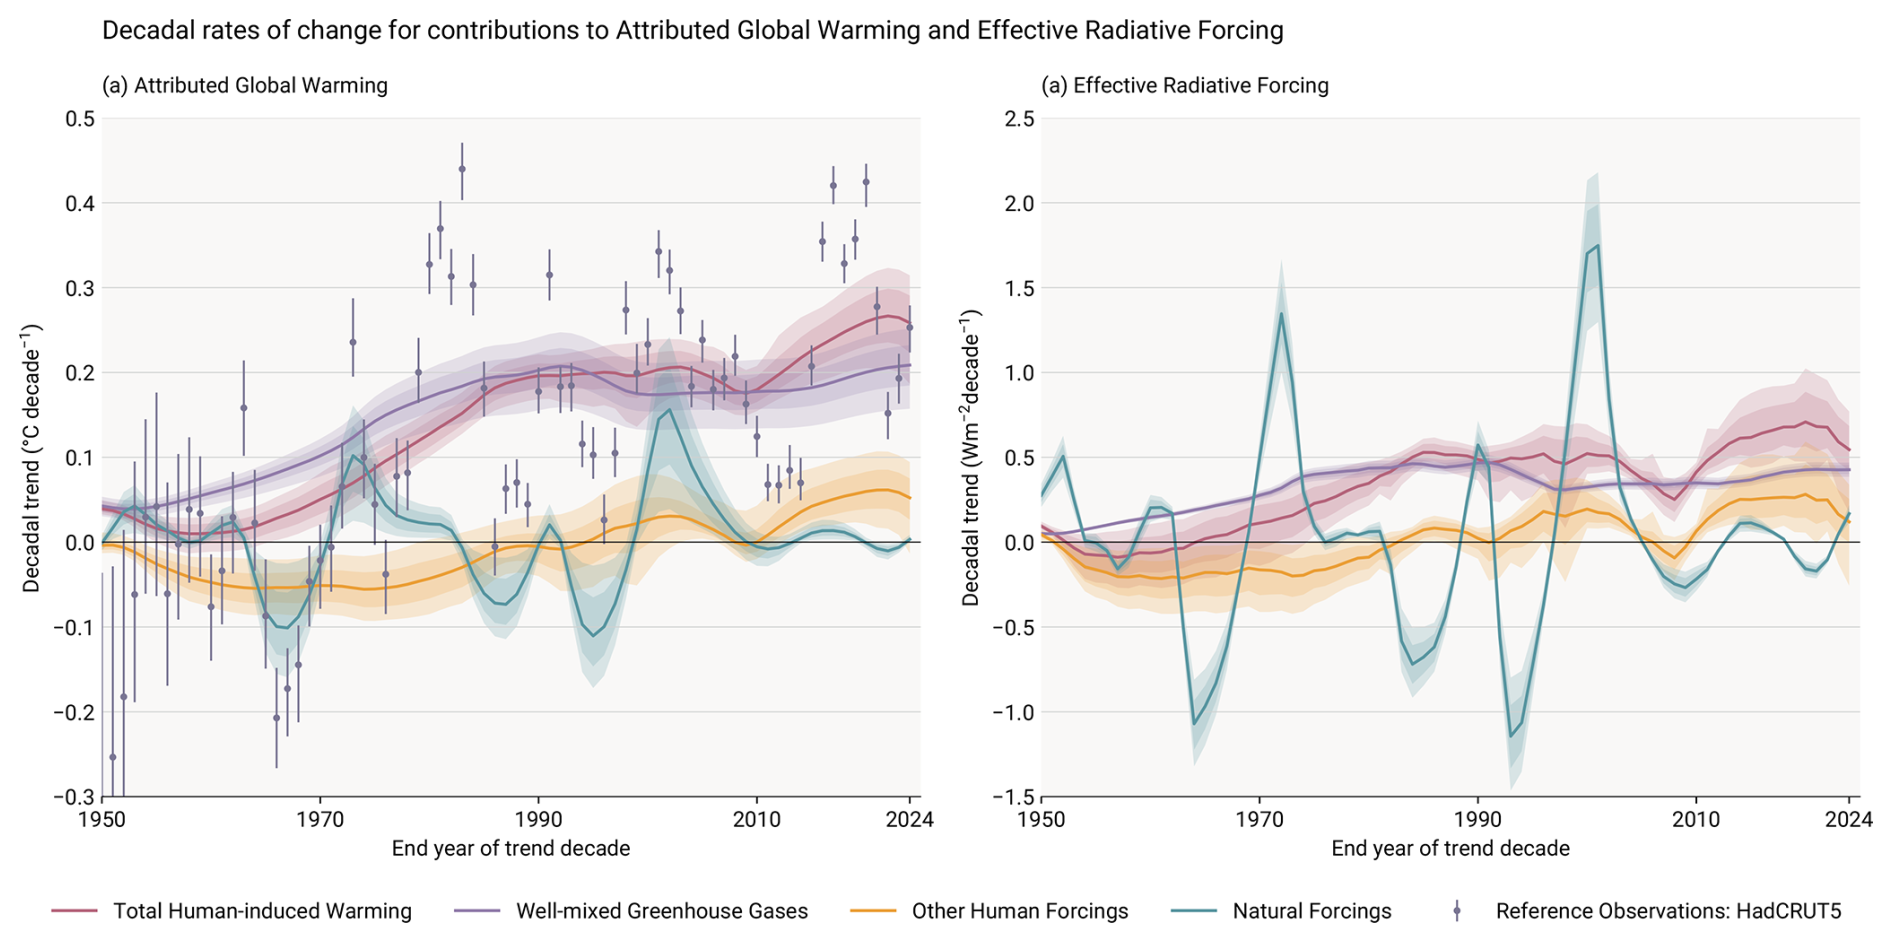
Figure 10Rates of (a) attributable warming (global mean surface temperature (GMST)) and (b) effective radiative forcing. The attributable warming rate time series are calculated using the Global Warming Index method with full ensemble uncertainty. The observed GMST rates included for reference are also calculated with uncertainty from the HadCRUT5 ensemble and, for consistency with the attributed warming rates, do not include standard regression error, which, for observed warming, would increase the size of the error bars. The effective radiative forcing rates are calculated using a representative 1000-member ensemble of the forcings provided in Sect. 5 of this paper. The depicted rates are the decadal rates, with the end year of the decade in question being the value given on the time axis.
Estimates for the trend derived from the three warming attribution methodologies are presented in Table 7, with results for individual attribution methods detailed in Table S6. The GWI (based on observed warming and forcing) and KCC (based on CMIP simulations) methodologies report results that are in close agreement, while estimates derived with the ROF method (also based on CMIP simulations) are more strongly influenced by residual internal variability that remains in the anthropogenic warming signal due to the limitations in size of the available CMIP ensemble. The median result is presented at a precision of 0.01 °C per decade for the overall multi-method rate of warming assessment.
An overall best estimate attributed rate of human-induced warming of 0.27 °C per decade is found for the decade 2015–2024. This increased rate relative to the AR6 assessment of 0.2 °C per decade is broken down in the following way: (i) 0.03 °C per decade from changing the rounding precision (updating the AR6 2010–2019 warming rate assessment from 0.2 to 0.23 °C per decade); (ii) 0.03 °C per decade from methodological and dataset updates (updating the 2010–2019 warming rate from 0.23 °C per decade to 0.26 °C per decade, including the effect of adding 5 additional observed years to the attribution over the entire historical period); and (iii) 0.01 °C per decade due to a real increase in rate for the 2015–2024 period since the 2010–2019 period (updating 0.26 °C per decade for 2010–2019 to 0.27 °C per decade for 2015–2024), consistent with increased GHG emissions over the last decade. The spread of rates across the three attribution methods remains similar to their spread in AR6, and previous updates of this work, and hence does not support a decrease in the headline uncertainty range. However, as previous assessments suggested, we update the uncertainty range for the rate of human-induced warming from [0.1–0.3] °C per decade in AR6 to [0.2–0.4] °C per decade to better reflect the closer agreement of the 5 % floors and the larger spread in the 95 % ceilings of the three methods and higher rate from the ROF method. The rate of human-induced warming for the 2015–2024 decade is concluded to be 0.27 °C per decade with a range of [0.2–0.4] °C per decade). This agrees with the decadal trend in observed warming of 0.26 °C per decade (also calculated as a linear trend through 10-year periods – see Sect. 7.1). It is important to note, however, that internal variability leads to the decadal rates of observed warming being far less stable than for anthropogenic warming, and the very close correspondence between the two this year is somewhat incidental (see Fig. 10).
Table 7Updates to the IPCC AR6 rate of human-induced warming. Results for each method are given in the Table S6; assessment results are given as a best estimate with likely range in brackets. Results from AR6 WGI (Chap. 3 Sect. 3.3.1.1.2 Table 3.1) are quoted in column (i) and compared with a repeat calculation using the updated methods and datasets in column (ii) and finally updated for the 2015–2024 period in column (iii). The AR6 assessment result was identical to the SR1.5 assessment result, though the latter was based on a different set of studies and time frames.
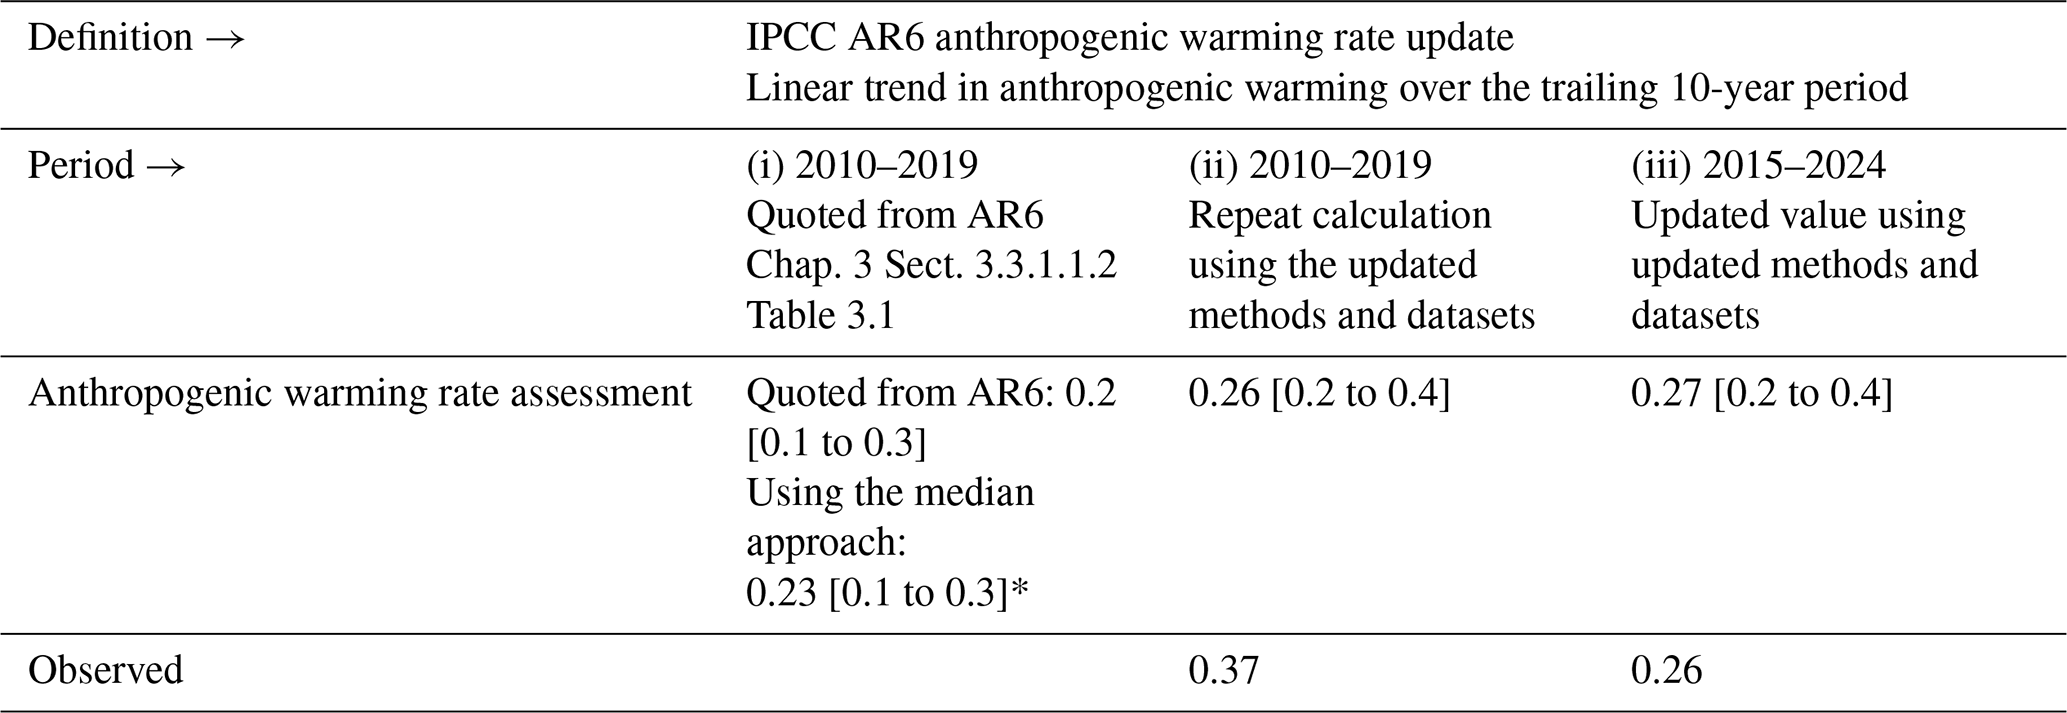
* Note that for clarity and ease of comparison with this year's updated assessment, the assessed rate in column (i) both quotes the assessment from AR6 and retrospectively applies the median approach adopted in this paper. The observed rates are calculated using the multi-dataset observed temperature dataset from Sect. 7; no ensemble is available for this, hence the absence of an uncertainty range.
AR5 (IPCC, 2013) assessed that long-term global surface temperature increase caused by CO2 emissions is close to linearly proportional to the total amount of cumulative CO2 emissions (Collins et al., 2013). The most recent AR6 report reaffirmed this assessment and highlights that this near-linear relationship also holds between cumulative CO2 emissions and maximum global surface temperature increase caused by CO2 (Canadell et al., 2021). This near-linear relationship implies that for keeping global warming below a specified temperature level, one can estimate the total amount of CO2 that can ever be emitted. When expressed relative to a recent reference period, this is referred to as the remaining carbon budget (Rogelj et al., 2018).
AR6 assessed the remaining carbon budget (RCB) in Chap. 5 of its WGI report (Canadell et al., 2021) for warming limits ranging from 1.3 to 2.4 °C relative to the 1850–1900 period (see Table 5.8 in Canadell et al., 2021). A selection of these (1.5, 1.7 and 2 °C) were also reported in its Summary for Policymakers (Table SPM.2, IPCC, 2021b). These RCB values are updated in this section using the same method as last year (Forster et al., 2024). Data for four warming limits (1.5, 1.6, 1.7 and 2 °C) are included in Table 8, while figures for more values are included in Sect. S9.
The RCB is estimated by application of the WGI AR6 method described in Rogelj et al. (2019), which involves the combination of the assessment of five factors: (i) the amount of human-induced warming for the most recent decade (given in Sect. 8); (ii) the transient climate response to cumulative emissions of CO2 (TCRE), which quantifies the linear proportionality between cumulative CO2 emissions and CO2-induced warming; (iii) the zero emissions commitment (ZEC), representing the expected amount of additional (at present unrealised) warming caused by past CO2 emissions; (iv) the temperature contribution of future non-CO2 emissions; and (v) an adjustment term for Earth system feedbacks that are otherwise not captured through the other factors. AR6 WGI reassessed all five terms (Canadell et al., 2021). Lamboll et al. (2023) further considered the temperature contribution of non-CO2 emissions and integrated different uncertainties, while Rogelj and Lamboll (2024) clarified the reductions in non-CO2 emissions that are assumed in the RCB estimation.
The RCB for 1.5, 1.6, 1.7 and 2 °C warming levels is re-assessed based on the most recent available data. Estimated RCBs are reported in Table 8. They are expressed relative to the start of 2025 for estimates based on the 2015–2024 human-induced warming update (Sect. 8). Based on the variation in non-CO2 emissions across the scenarios in AR6 WGIII scenario database, the estimated RCB values can be higher or lower by around 200 Gt CO2 depending on how successful non-CO2 emissions reductions are (Lamboll et al., 2023; Rogelj and Lamboll, 2024). Notably, RCB estimates consider the subset of non-CO2 emission scenarios in the AR6 WGIII database that are aligned with a global transition to net zero CO2 emissions (Lamboll et al., 2023; Rogelj and Lamboll, 2024). These estimates assume median reductions in non-CO2 emissions between 2020–2050 of CH4 (about 50 %), N2O (about 20 %) and SO2 (about 80 %) (see Supplement, Sect. S9 and Table S7, and Rogelj and Lamboll, 2024). If these non-CO2 GHG emission reductions are not achieved, the RCB for all temperature targets would be smaller than the values reported here in Table 8 (see Lamboll et al., 2023; Rogelj and Lamboll, 2024).
Compared to RCB values reported in AR6, our estimates here are smaller, owing to several factors. First, AR6 budgets were expressed from 2020 onwards, and approximately 200 Gt CO2 was emitted between 2020 and 2024. Second, we use updated physical models of non-CO2 forcing, which leads to an increased estimate of the importance of aerosols that are expected to decline with time in low emissions pathways (Rogelj et al., 2014; Rogelj and Lamboll, 2024). This decreased negative forcing from aerosols is expected to cause additional net non-CO2 warming because more non-CO2 GHG warming is being unmasked, and this decreases the RCB (Lamboll et al., 2023) by slightly over 100 Gt CO2. There was also a small reduction in the budget (about 10 Gt CO2) from using the newer AR6 scenario set. Finally, the updated warming estimate reported in Sect. 8 is slightly increased due to the high observed temperatures in the last few years, which resulted in a further reduction of the budget by around 40 Gt CO2, relative to values reported in last year's assessment (Forster et al., 2024). This gives a total reduction in RCB values estimated from the beginning of 2025 of ∼370 Gt CO2 compared to the values from 2020 reported in AR6.
Table 8Updated estimates of the remaining carbon budget for 1.5, 1.6, 1.7 and 2.0 °C, for five levels of likelihood, considering only uncertainty in TCRE. Estimates are expressed relative to the start of 2024. The probability includes only the uncertainty in how the Earth immediately responds to CO2 emissions (TCRE), not long-term committed warming or uncertainty in the climate response to other non-CO2 emissions. All values are rounded to the nearest 10 Gt CO2. Additional values can be found in Tables S7 and S8.
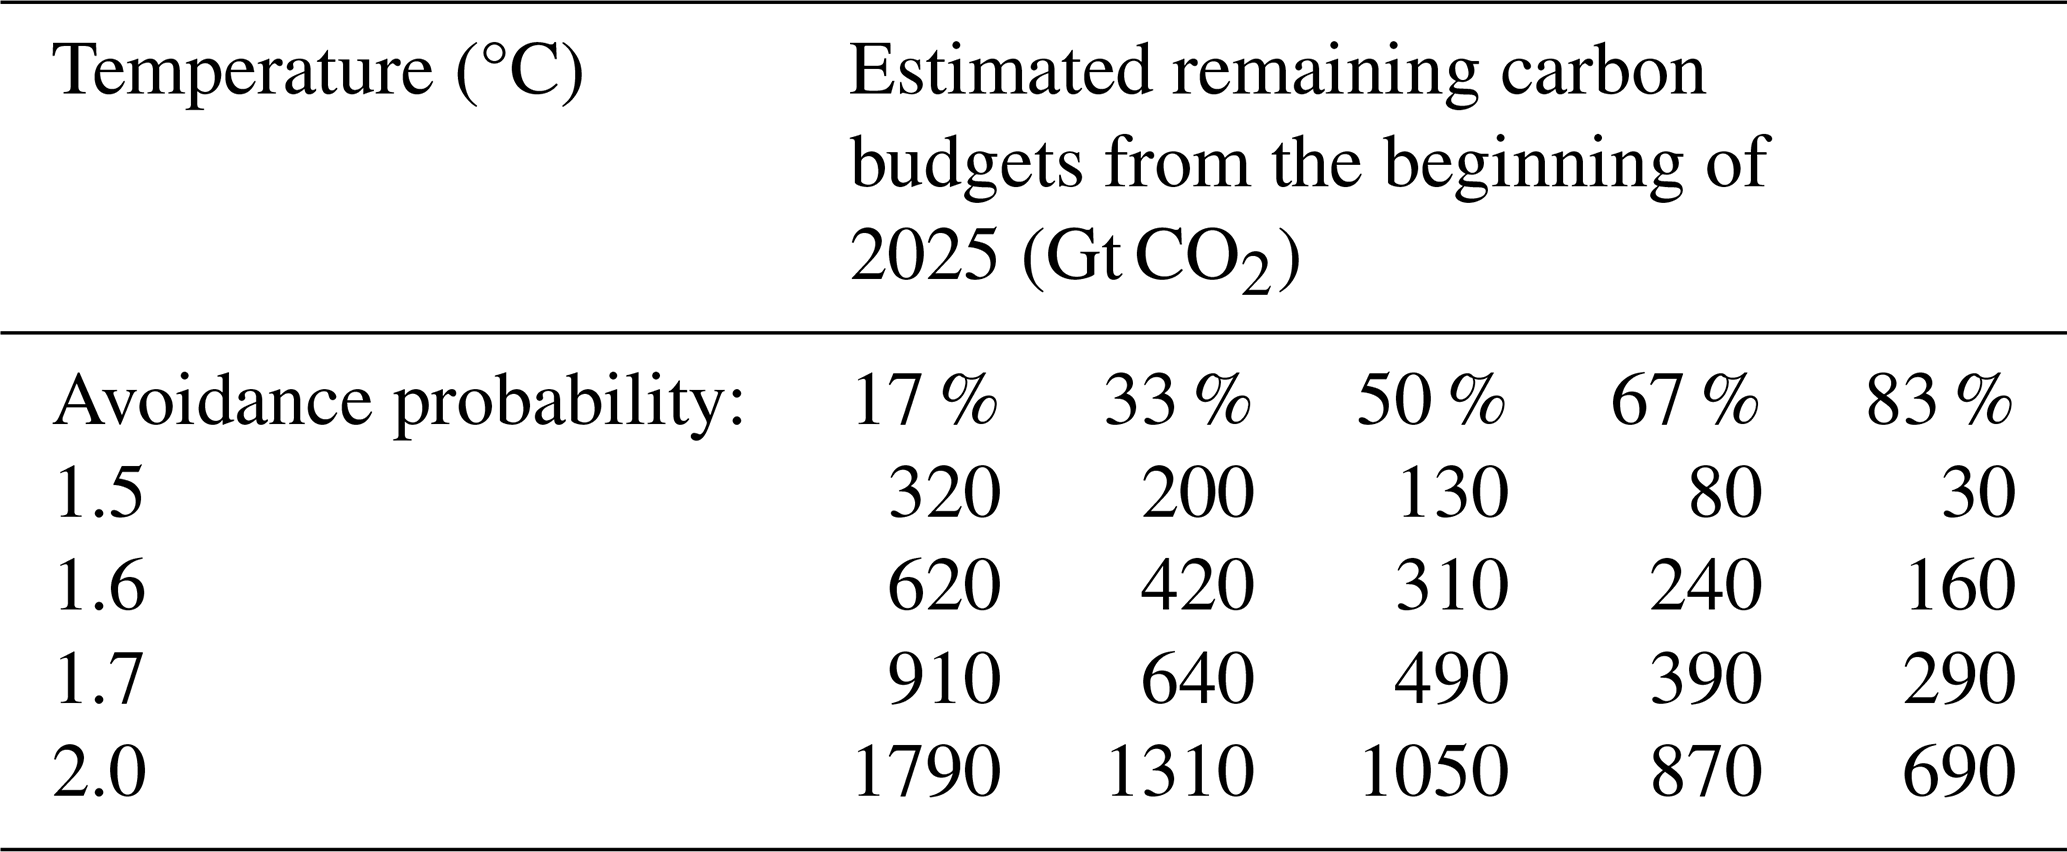
This year's update of the 1.5 °C budget uses the historical warming level for the 2015–2024 period of 1.24 °C, with 0.11 °C future contribution of non-CO2 warming. Assuming a median TCRE estimate of 0.45 °C per 1000 Gt CO2, this gives around 340 Gt CO2 from the midpoint of the period, from which we subtract around 210 Gt CO2 (204 Gt CO2 that was already emitted from the middle until the end of the 2015–2024 period and 7 Gt CO2 that represents the median estimate of the impact of Earth system feedbacks such as permafrost feedback that would otherwise not be covered). The same method is used to calculate budgets for the other warming levels.
The values in Table 8 are all greater than zero, implying that we have not yet emitted the amount of CO2 that would commit us to these levels of warming. However, including the uncertainty in ZEC (as in Table S8), non-CO2 emission and forcing uncertainty, and underrepresented Earth system feedbacks results in negative RCB estimates for limiting warming to low temperature limits with high likelihood. A negative RCB for a specific temperature limit would mean that the world is already committed to this amount of warming and that net negative emissions would therefore be required to return to the temperature limit after a period of overshoot. The assumption behind such a calculation is that we can treat the warming impact of positive and negative net emissions as approximately symmetric. While the claim of symmetry is likely valid for small emissions values, some model studies have shown that it holds less well for reversal of larger emissions (Canadell et al., 2021; Zickfeld et al., 2021; Vakilifard et al., 2022; Pelz et al., 2025). As such, larger exceedances of the RCB for a particular temperature target would decrease the likelihood that the temperature target could still be achieved by an equivalent amount of net negative emissions.
Note that the 50 % RCB estimate of 130 Gt CO2 would be exhausted in a little more than 3 years if global CO2 emissions remain at 2024 levels (42 Gt CO2 yr−1; see Table 1). This is not expected to correspond exactly to the time that 1.5 °C global warming level is reached due to uncertainty associated with committed warming from past CO2 emissions (the ZEC) as well as ongoing warming and cooling contributions from non-CO2 emissions. For comparison, our estimate of 2024 anthropogenic warming (1.36 °C) and the recent rate of increase (0.27 °C per decade) would suggest that continued emissions at current levels would cause human-induced global warming to reach 1.5 °C in approximately 5 years.
Changes in climate and weather extremes are among the most visible effects of human-induced climate change. Within AR6 WGI, a full chapter was dedicated to the assessment of past and projected changes in extremes on continents (Seneviratne et al., 2021), and the chapter on ocean, cryosphere and sea-level changes also provided assessments on changes in marine heatwaves (Fox-Kemper et al., 2021). Global indicators related to climate extremes include averaged changes in climate extremes, for example, the mean increase in annual minimum and maximum temperatures on land (AR6 WGI Chap. 11, Fig. 11.2, Seneviratne et al., 2021) or the area affected by certain types of extremes (AR6 WGI Chap. 11, Box 11.1, Fig. 1, Seneviratne et al., 2021; Sippel et al., 2015).
The presented climate indicator for changes in temperature extremes consists of land average maximum temperatures for any single day in a year (TXx) (excluding Antarctica). Figure 11 updates the land mean TXx shown in Forster et al. (2023, 2024), originally based on Fig. 11.2 from Seneviratne et al. (2021). Three datasets are analysed: HadEX3 (Dunn et al., 2020), Berkeley Earth Surface Temperature (building off Rohde et al., 2013), and the fifth-generation ECMWF atmospheric reanalysis of the global climate (ERA5; Hersbach et al., 2020). HadEX3 is static and has not received any updates. Berkeley Earth has been extended and updated compared to Forster et al. (2024), resulting in TXx differences for most years (less than 0.1 °C), and now includes data for 2023. Of the three datasets, only ERA5 covers the whole of 2024 at the present time. TXx is calculated by averaging the annual maximum temperature over all available land grid points (excluding Antarctica) and then converting this into anomalies with respect to a base period of 1961–1990. To express the TXx as anomalies with respect to 1850–1900, we add an offset of 0.51 °C to all three datasets. See Sect. S10 for details on the data selection, averaging and offset computation.
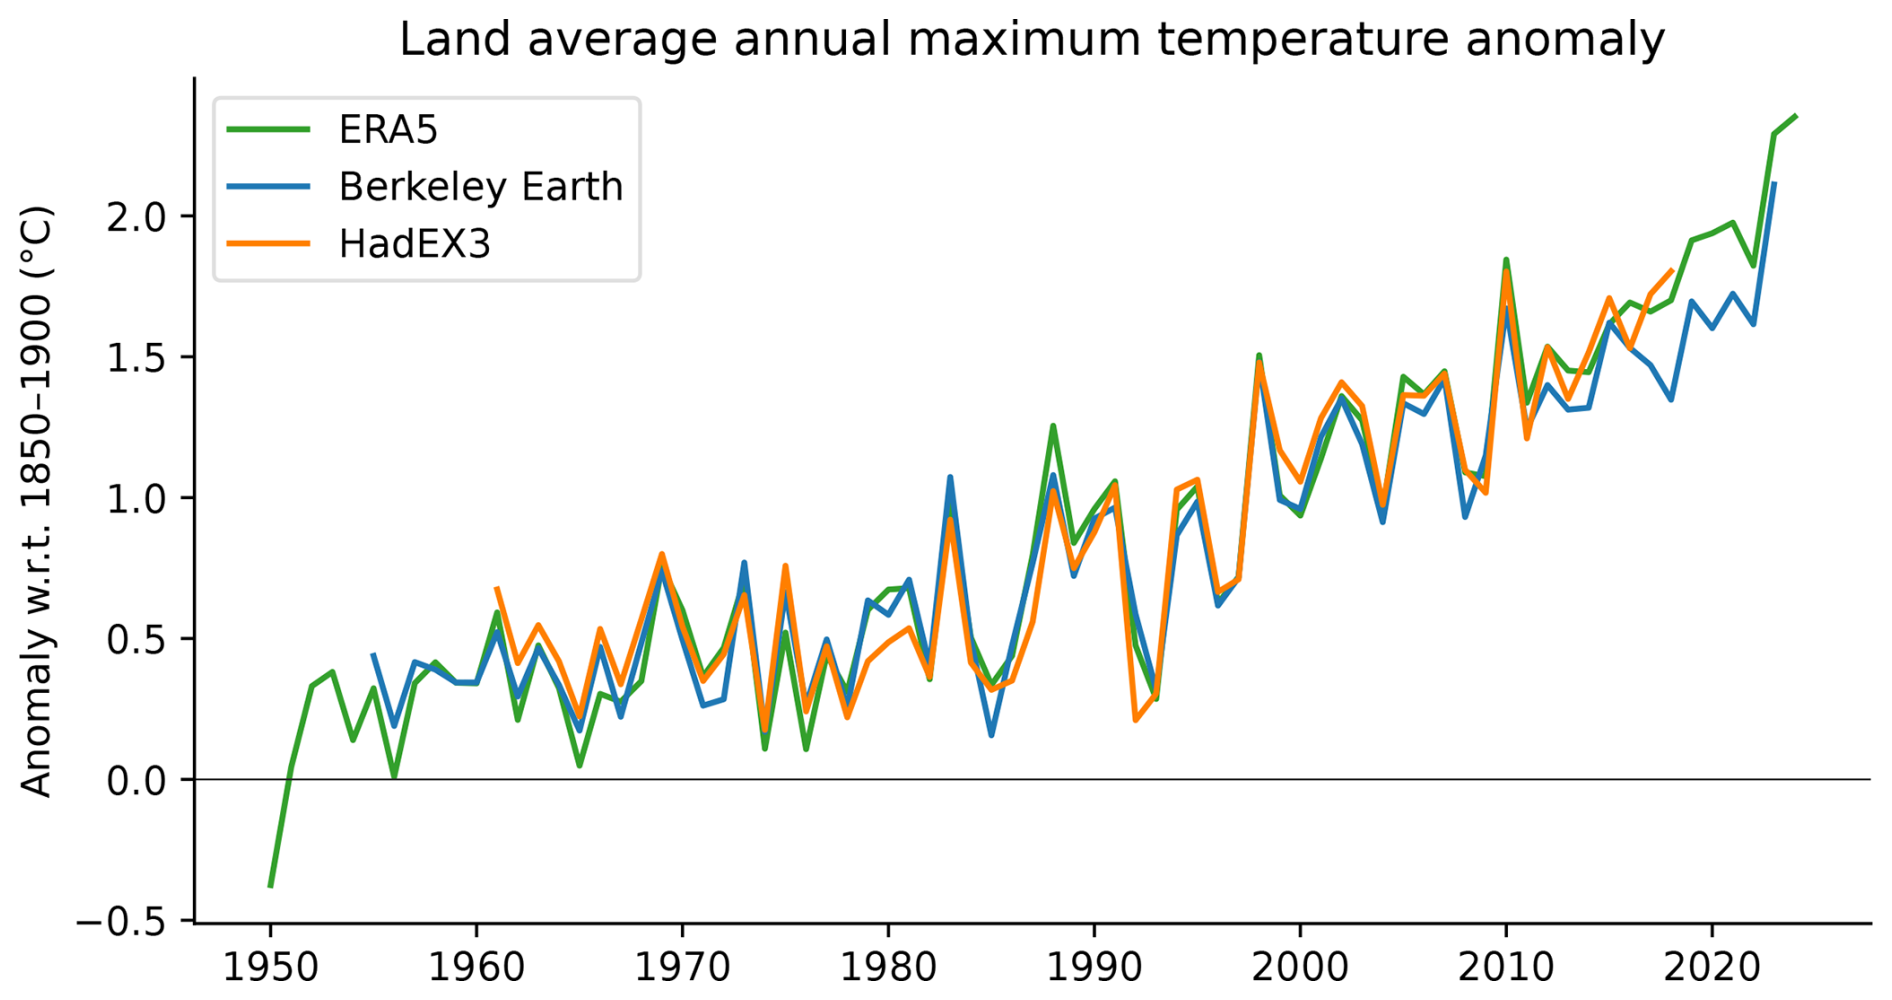
Figure 11Time series of observed temperature anomalies for land average annual maximum temperature (TXx) for ERA5 (1950–2024), Berkeley Earth (1955–2023) and HadEX3 (1961–2018), with respect to 1850–1900. The datasets have different spatial coverage and are not coverage-matched. All anomalies are calculated relative to 1961–1990, and an offset of 0.51 °C is added to obtain TXx values relative to 1850–1900. Note that while the HadEX3 numbers are the same as shown in Seneviratne et al. (2021) Fig. 11.2, these numbers were not specifically assessed.
Our climate has warmed rapidly in the last few decades (Sect. 7), which also manifests in changes in the occurrence and intensity of climate and weather extremes. From about 1980 onwards, all datasets point to a strong TXx increase, which coincides with the transition from global dimming, associated with aerosol increases, to brightening, associated with aerosol decreases (Wild et al., 2005, Sect. 4). The ERA5-based TXx warming estimate with respect to 1850–1900 for 2024 is at 2.35 °C, an increase of 0.05 °C compared to 2023 and thus even warmer than the previous record in 2023. On longer timescales, land average TXx has warmed 0.49 °C in the past 10 years (comparing the decades 2015–2024 to 2005–2014) and 1.90 °C with respect to pre-industrial conditions (Table 9). Since the offset relative to our pre-industrial baseline period is calculated over 1961–1990, temperature anomalies align by construction over this period but can diverge afterwards.
Table 9Anomalies of land average annual maximum temperature (TXx) for recent decades based on HadEX3, Berkeley Earth and ERA5, with respect to 1850–1900. All anomalies are calculated relative to 1961–1990, and an offset of 0.51 °C is added to obtain TXx values relative to 1850–1900.
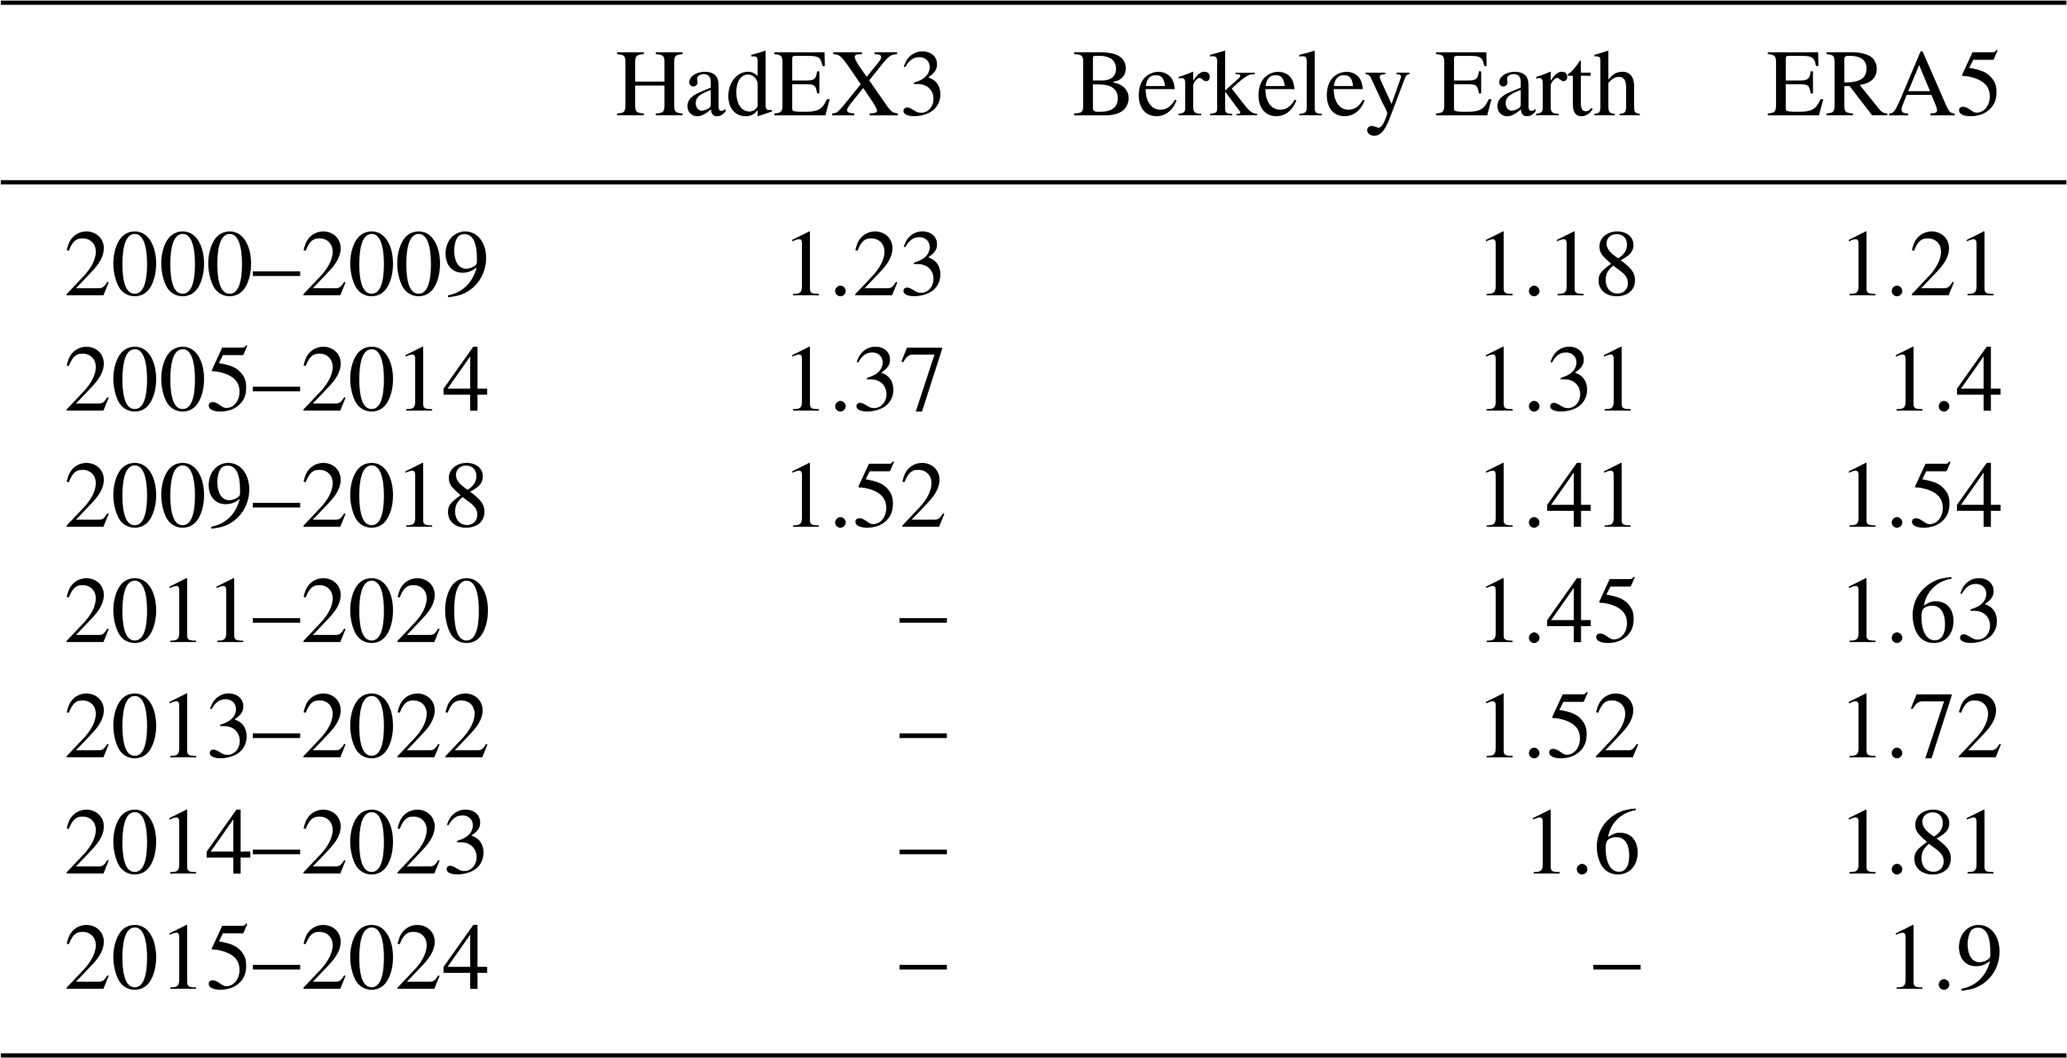
Anthropogenic radiative forcings modify the Earth's energy budget and subsequently drive substantial and widespread changes in the global water cycle including precipitation, evaporation, atmospheric moisture and runoff (Forster et al., 2021, Douville et al., 2021; Gulev et al. 2021). AR6 Chap. 8 assessed that human-caused climate change has driven detectable changes in the global water cycle since the mid-20th century with high confidence, including an overall increase in atmospheric moisture (7 % per 1 °C of warming), precipitation intensity (1 %–3 % per 1 °C of warming) and increased terrestrial evapotranspiration (Douville et al., 2021).
In AR6, global land precipitation was highlighted as one of the large-scale indicators of climate change rather than global precipitation since land precipitation has greater societal relevance, and in situ precipitation records over land extend back to the early to mid-20th century quasi-globally except Antarctica and parts of Africa and South America (Gulev et al., 2021; Lee et al., 2021; Douville et al., 2021). AR6 assessed that global land precipitation has likely increased since the middle of the 20th century with a faster increase since the 1980s with large interannual variability and regional heterogeneity. The observed northern hemispheric land summer monsoon precipitation experienced a significant decline during 1901–2014, which has been attributed to the dominant influence of anthropogenic aerosols (Cao et al., 2022). Here, we include an update of global land precipitation change since AR6 (i.e. from 2020 to 2024).
Figure 12 shows the annual global land precipitation anomaly relative to 1991–2020, following the current WMO climatology reference, obtained from GPCC V2020 (Schamm et al., 2014), CRU TS 4.08 (Harris et al., 2020), GPCP V.2.3 (Adler et al., 2018) and GHCN V4 (Menne et al., 2018) observed datasets. The change of reference period to 1991–2020 affects the perceived evolution compared to Fig. 2.15c in AR6 WGI, which had a 1981–2010 reference period. There is little consistency among datasets due to differences in input data, completeness of records, period of covered and the gridding procedures applied (Sun et al., 2018; Nogueira, 2020). While the globally averaged land surface specific humidity has continuously increased (Dunn et al., 2024), global land precipitation has exhibited considerable interannual to interdecadal variability (Fig. 12). There was a positive anomaly in global land precipitation in 2024 but a negative anomaly in 2023. The former was contributed to by above-normal precipitation over the Asian and Australian monsoon region, likely associated with La Niña conditions, but was offset by dry conditions over South America and the southern part of Africa. The latter was driven by below-normal precipitation over South Asia, the Maritime Continent, the southern part of North America and the northern part of South America, due to El Niño conditions, with a corresponding increase in precipitation over the ocean (Adler and Gu, 2024).
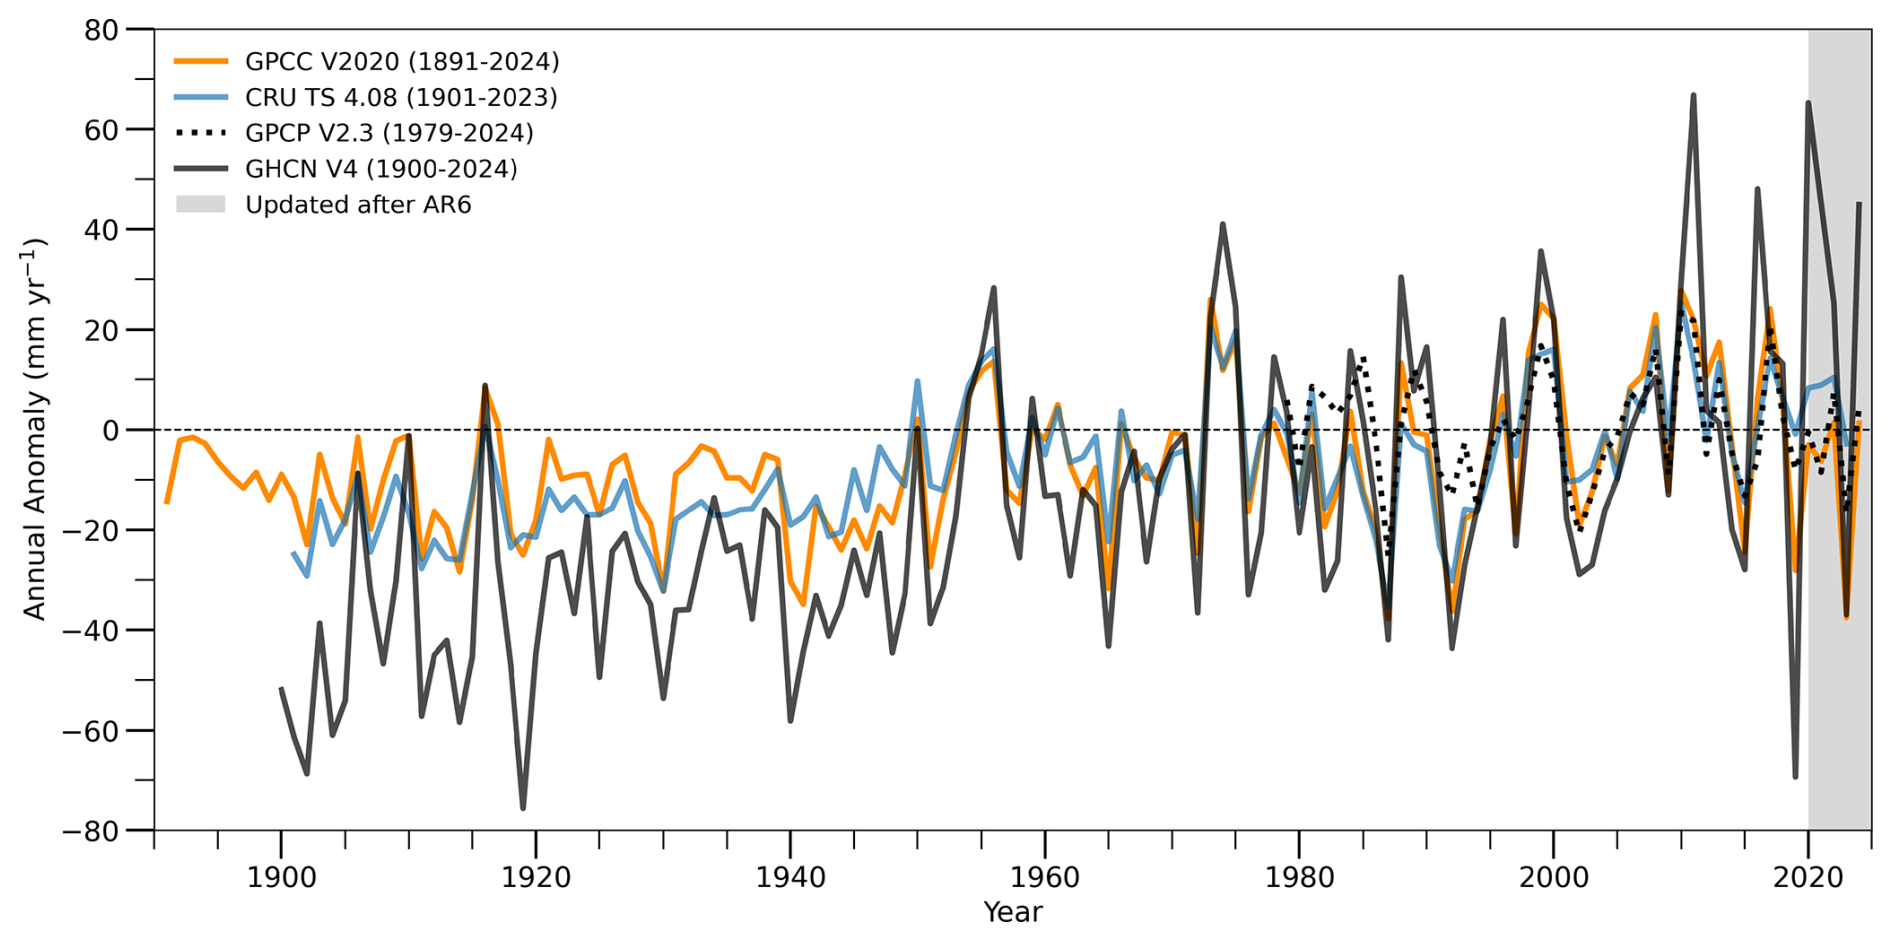
Figure 12Time series of annual global land precipitation (mm yr−1) from 1891 to date relative to a 1991–2020 climatology obtained from GPCP V2020, CRU TS 4.08, GPCP V2.3 and GHCN V4 (note that different products commence at distinct times). Annual global land precipitation for each observed data is estimated following the AR6 method except the period of climatology and updated from 2020 to 2024. In AR6, the reference period of the climatology was from 1981 to 2010.
Global mean sea-level rise (GMSLR) is included in this annual update of AR6 for the first time. GMSLR is primarily driven by (i) thermal expansion as the ocean warms and (ii) increases in ocean mass associated with the addition of water or ice from land-based reservoirs, including glaciers and ice sheets (Fox-Kemper et al., 2021). Most of these processes are directly linked to changes in the global Earth energy inventory (Sect. 6). Sea-level rise can have large consequences for coastal ecosystems, safety and management, as it increases the baseline for sea-level extremes arising from short-term phenomena such as storm surges, waves and tides.
Observed GMSLR was assessed in IPCC AR6 WG1, in Chap. 2 (their Sect. 2.3.3.3, Gulev et al., 2021) and Chap. 9 (their Sect. 9.6.1 and Cross-Chapter Box 9.1, Fox-Kemper et al., 2021), on the basis of tide gauge reconstructions (up to 1993) and satellite altimeter observations (1993–2018). The assessment of GMSLR from tide gauge reconstructions used the ensemble approach presented by Palmer et al. (2021), which quantifies an ensemble and its uncertainties by combining an estimate of the structural uncertainty (informed by the ensemble spread) with an estimate of the internal uncertainty across the ensemble (i.e. the parametric uncertainty of each of the members in the ensemble). The members included in the tide gauge ensemble, which informed the total sea-level change estimate for the period 1901–1992, were reconstructions from Church et al. (2011), Dangendorf et al. (2019), Frederikse et al. (2020), and Hay et al. (2015). For the satellite period, from 1993 to 2018, AR6 used the estimate of the WCRP Global Sea Level Budget Group (2018), which was constructed from satellite-based GMSLR time series from six groups (AVISO/CNES, CSIRO, NASA/GSFC, NOAA, SL_cci/ESA and University of Colorado). Based on this information, AR6 concluded that GMSLR increased by 0.20 [0.15 to 0.25] m over the period 1901 to 2018, with a rate of 1.73 [1.28 to 2.17] mm yr−1 (high confidence). Periods closer to the present showed an accelerating GMSLR, with a rate of 2.3 [1.6 to 3.1] mm yr−1 over the period 1971–2018 increasing to 3.7 [3.2 to 4.2] mm yr−1 over the period 2006–2018 (high confidence).
Here, we extend the AR6 GMSLR time series, which ended in 2018, closer to the present day. We use the same tide-gauge-based ensemble estimate as in AR6 for the period up to 1993. We do note that two new reconstructions have been published recently, both providing rates in line with the AR6 assessment rates given above. The new GMSLR reconstruction by Dangendorf et al. (2024) uses a Kalman smoother and adjusted estimates of the contributions of glacial isostatic adjustment and barystatic and sterodynamic changes to sea-level change and finds a trend of 1.50±0.20 mm yr−1 for the period 1900–2021. The new reconstruction by Wang et al. (2024) uses an updated vertical land motion correction and considers barystatic fingerprints and sterodynamic patterns from CMIP6 models and finds a trend of 1.6±0.2 mm yr−1 over 1900–2019.
The satellite record now provides observations up to the end of 2024, for three out of the six satellite data products used for the WCRP estimate used in AR6. The three records available to the end of 2024 are from NASA (2025), NOAA (2025) and AVISO (2025). All data were downloaded on 19 February 2025. We use the global mean time series based on the reference missions, with seasonal signals removed and corrected for glacial isostatic adjustment. We first compute annual averages and then an ensemble average time series, which is spliced to the AR6 GMSLR record ending in 2018. For consistency, we retain the uncertainties from the six-member WCRP ensemble and propagate them over the period 2019–2024. We note that reprocessing of the altimetry record is periodically required to account for new insights on instrument drift, retracking and geophysical corrections to the altimetry missions. This reprocessing may lead to small differences in the satellite altimeter record and the associated assessment of GMSLR in future iterations of IGCC.
Over the period 2019 to 2024, global mean sea level has increased by 26.1 [19.8 to 32.4] mm. When combining the AR6 estimate up to 2018 with the satellite time series for 2019–2024, we find a total GMSLR of 228.0 [176.4 to 279.6] mm for the period 1901–2024, which translates to an average rate of 1.85 [1.43 to 2.27] mm yr−1 (Table 10, Fig. 13). The rate increase associated with extending the time series by just 6 years, as well as the increasing rates over consecutive 20-year periods (Fig. 13b), indicates a continuing acceleration of GMSLR. This is in line with the assessments of AR6 (Fox-Kemper et al., 2021), SROCC (Oppenheimer et al., 2019) and AR5 (Church et al., 2013) that sea-level change has been accelerating over the course of the 20th and early 21st centuries and consistent with the observed acceleration in some components of the Earth heat inventory (see Sect. 6).
Table 10Observed global mean sea-level rise (GMSLR) as presented in IPCC AR6, Table 9.5 (Fox-Kemper et al., 2021), compared with the extended time series in this study. Values are expressed as the total change (Δ) in the annual mean over each period (mm), along with the equivalent rate calculated as the total change divided by the number of years (mm yr−1). Uncertainties represent the very likely range.
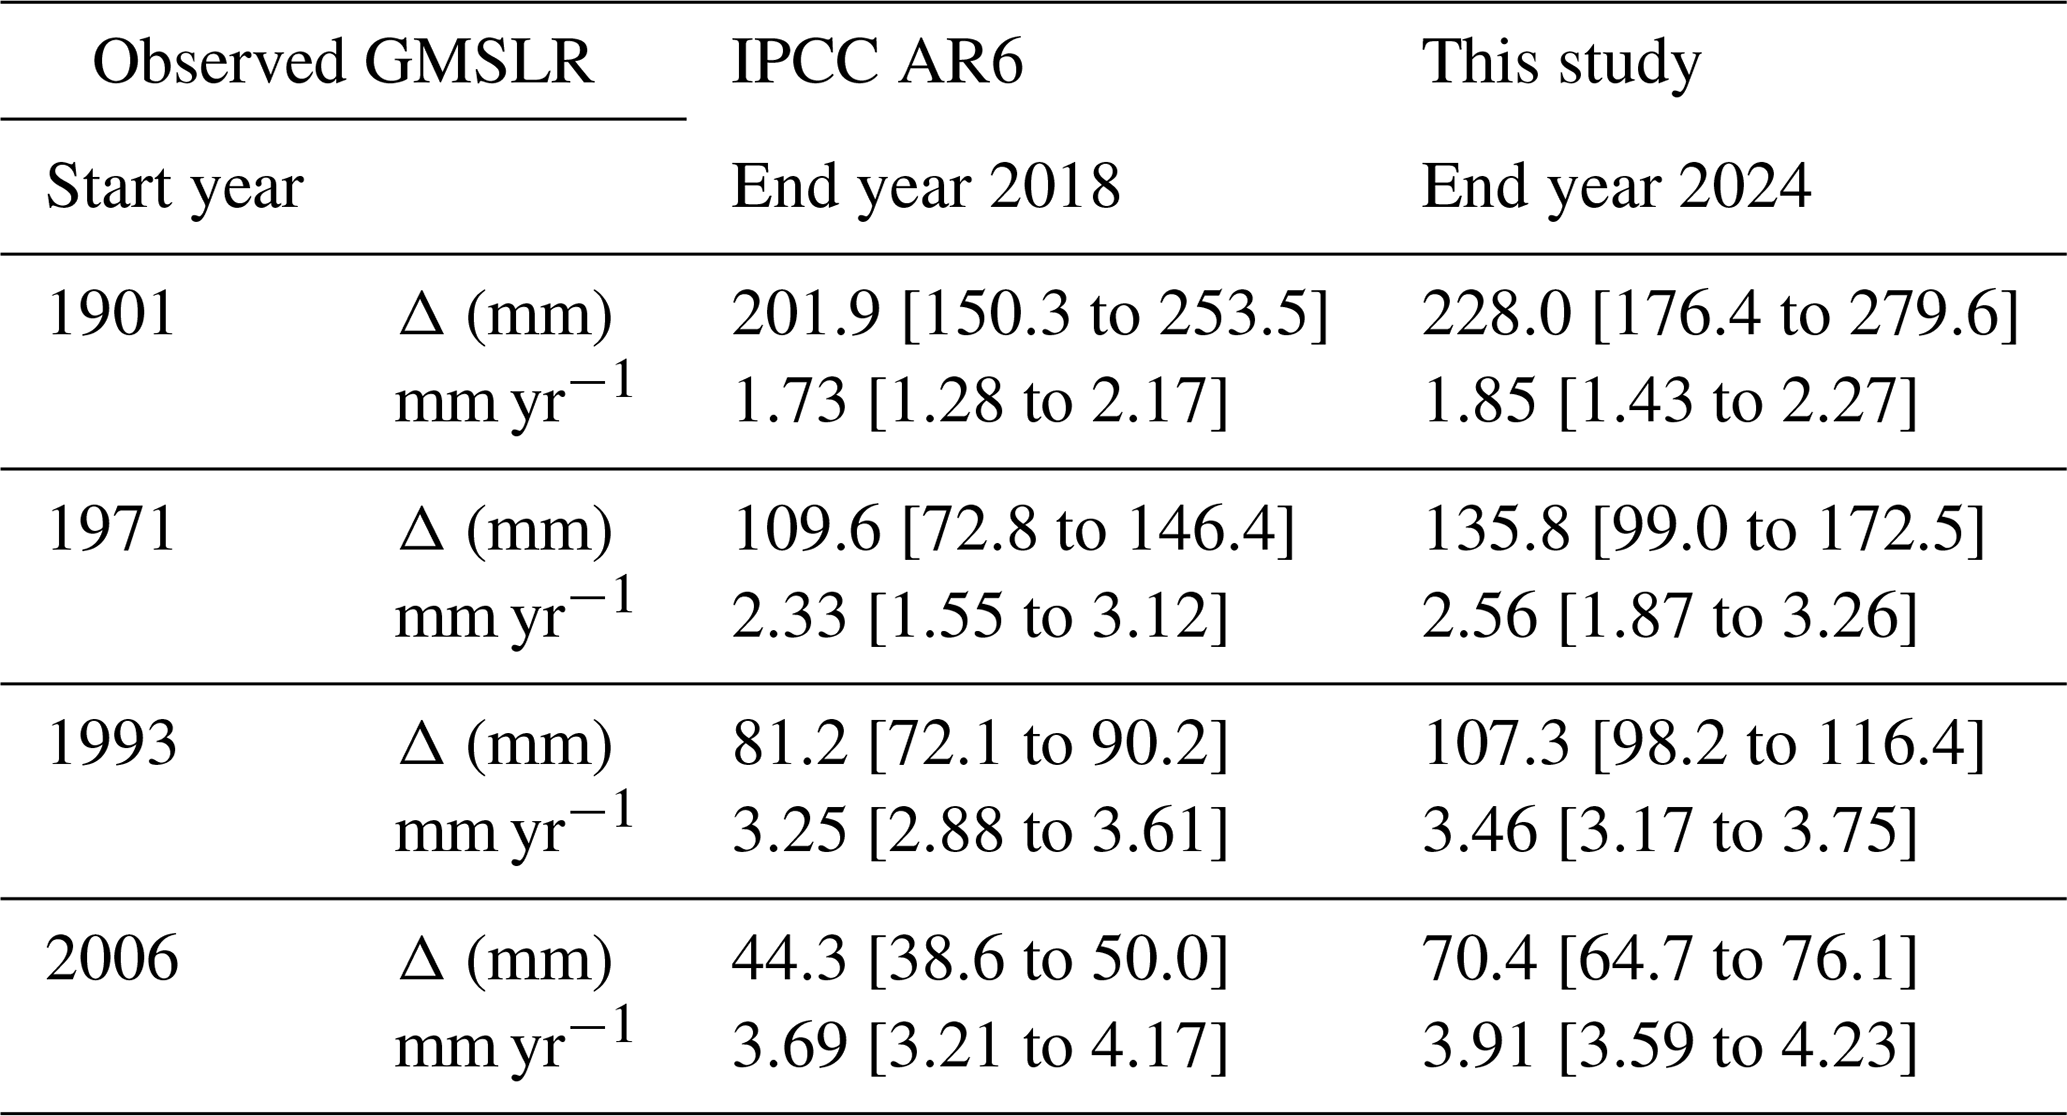
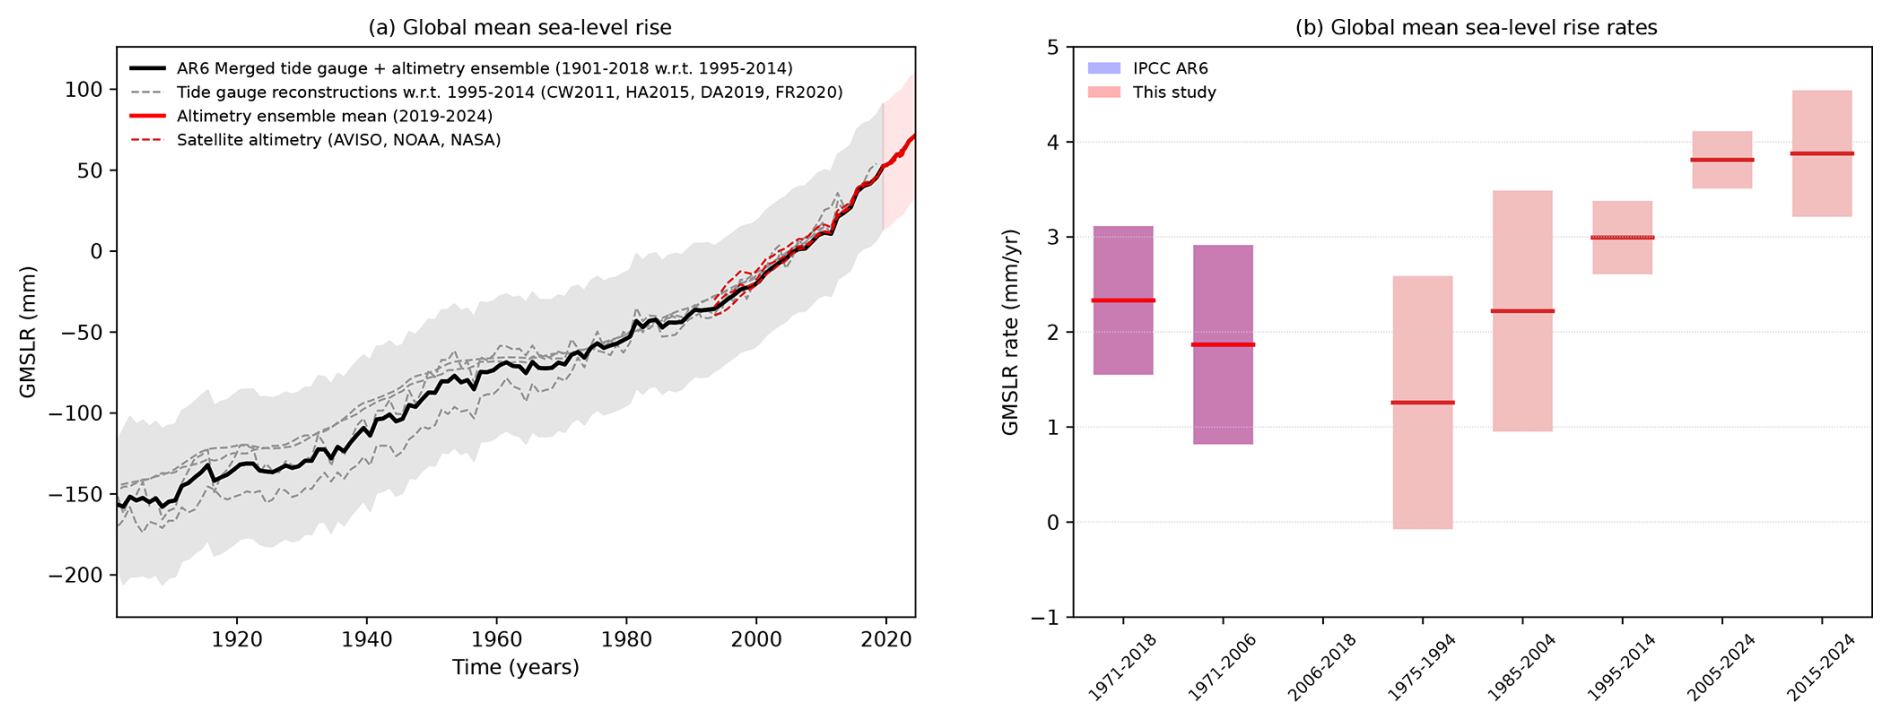
Figure 13(a) Global mean sea-level rise time series 1901–2024 (mm). The GMSLR ensemble from AR6 is in black, with respect to the period 1995–2014, and the updated satellite altimetry ensemble is in red, with respect to the AR6 ensemble in 2018. Individual time series are shown by dashed lines. (b) GMSLR rates (mm yr−1) for different periods. Uncertainties in (a) show the likely range and in (b) the very likely range, computed relative to 1901, including estimates of both structural uncertainty and parametric uncertainty (Palmer et al., 2021).
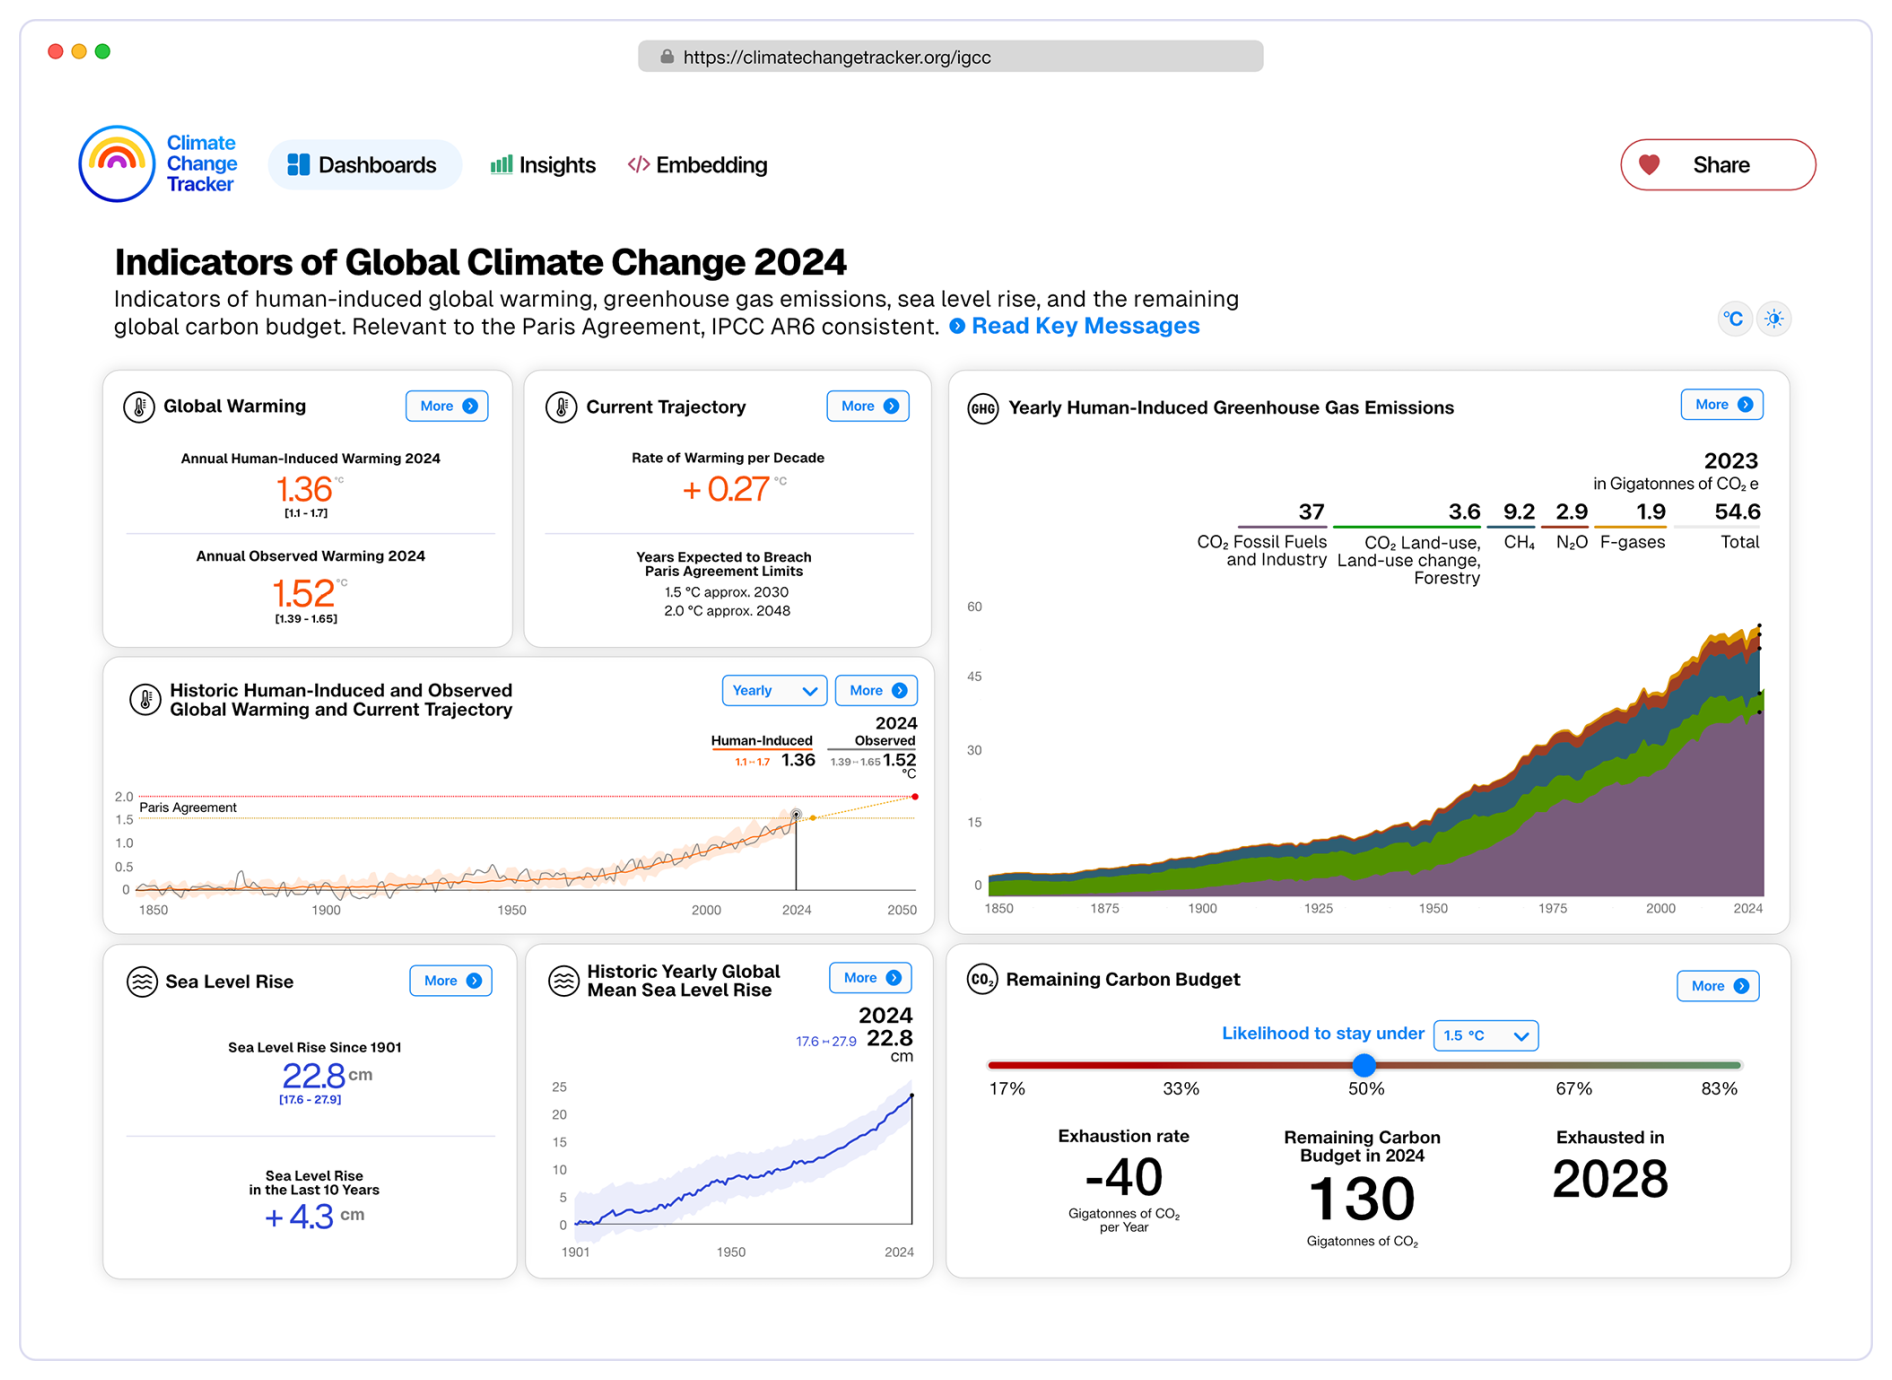
Figure 14Screenshot of the IGCC dashboard (https://climatechangetracker.org/, last access: 13 June 2025, Climate Change Tracker, 2025).
We have published a set of selected key indicators of global climate change via Climate Change Tracker (https://climatechangetracker.org/, Climate Change Tracker, 2025), a platform which aims to provide reliable, user-friendly, high-quality interactive dashboards, visualisations, data, and easily accessible insights of this paper.
With Climate Change Tracker we aim to reach a wider public audience, including policymakers involved in UNFCCC negotiations and decision-makers working in climate change mitigation and adaptation. Climate Change Tracker plans to update significant indicators multiple times throughout the year, providing an up-to-date picture of the indicators of climate change. Within the dashboards, all data are traceable to the underlying sources. Figure 14 presents a screenshot of the IGCC dashboard.
The carbon budget calculation is available from https://github.com/Rlamboll/AR6CarbonBudgetCalc/tree/v1.0.3 (Lamboll and Rogelj, 2025). The code and data used to produce other indicators are available in repositories under https://github.com/ClimateIndicator/data/tree/v2025.06.11 (Smith et al., 2025b). All data are available from https://doi.org/10.5281/zenodo.15639576 (Smith et al., 2025a). Data are provided under the CC-BY 4.0 License.
HadEX3 [3.0.4] data were obtained from https://catalogue.ceda.ac.uk/uuid/115d5e4ebf7148ec941423ec86fa9f26 (Dunn et al., 2023) on 5 April 2023 and are © British Crown Copyright, Met Office 2022, provided under an Open Government Licence; http://www.nationalarchives.gov.uk/doc/open-government-licence/version/2/ (last access: 2 June 2023).
Table 11Summary of headline results and methodological updates from the Indicators of Global Climate Change (IGCC) initiative.
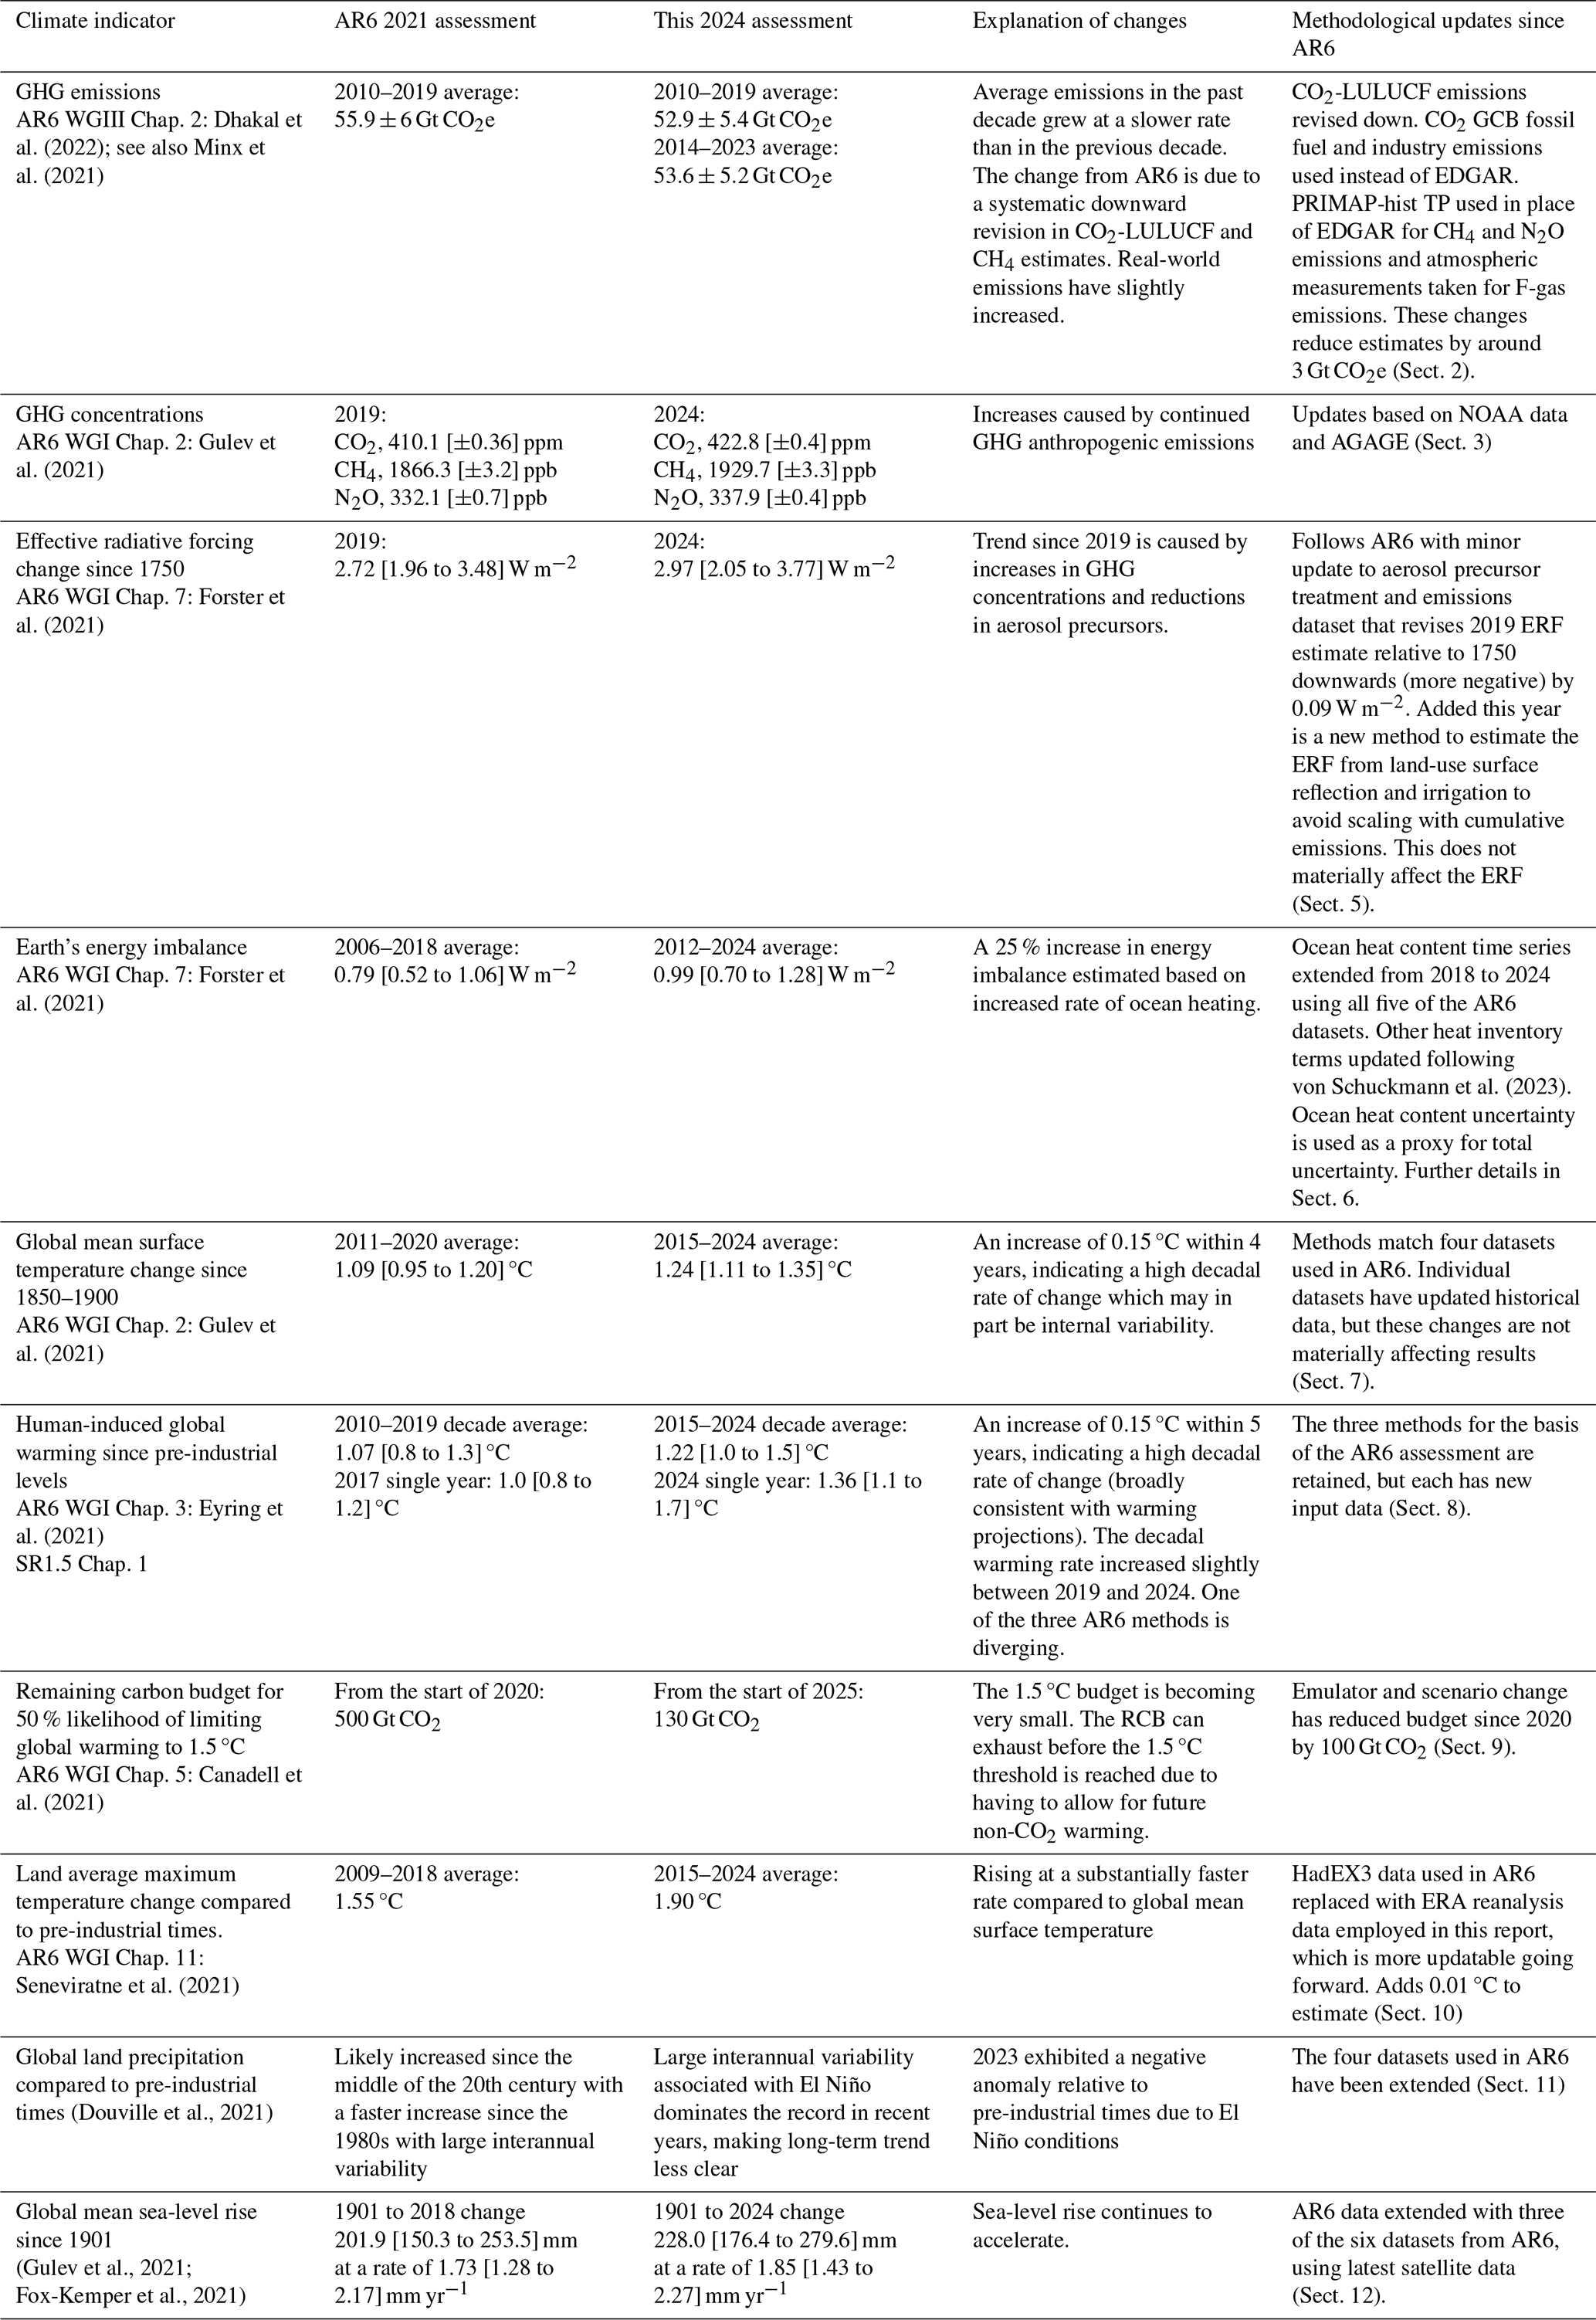
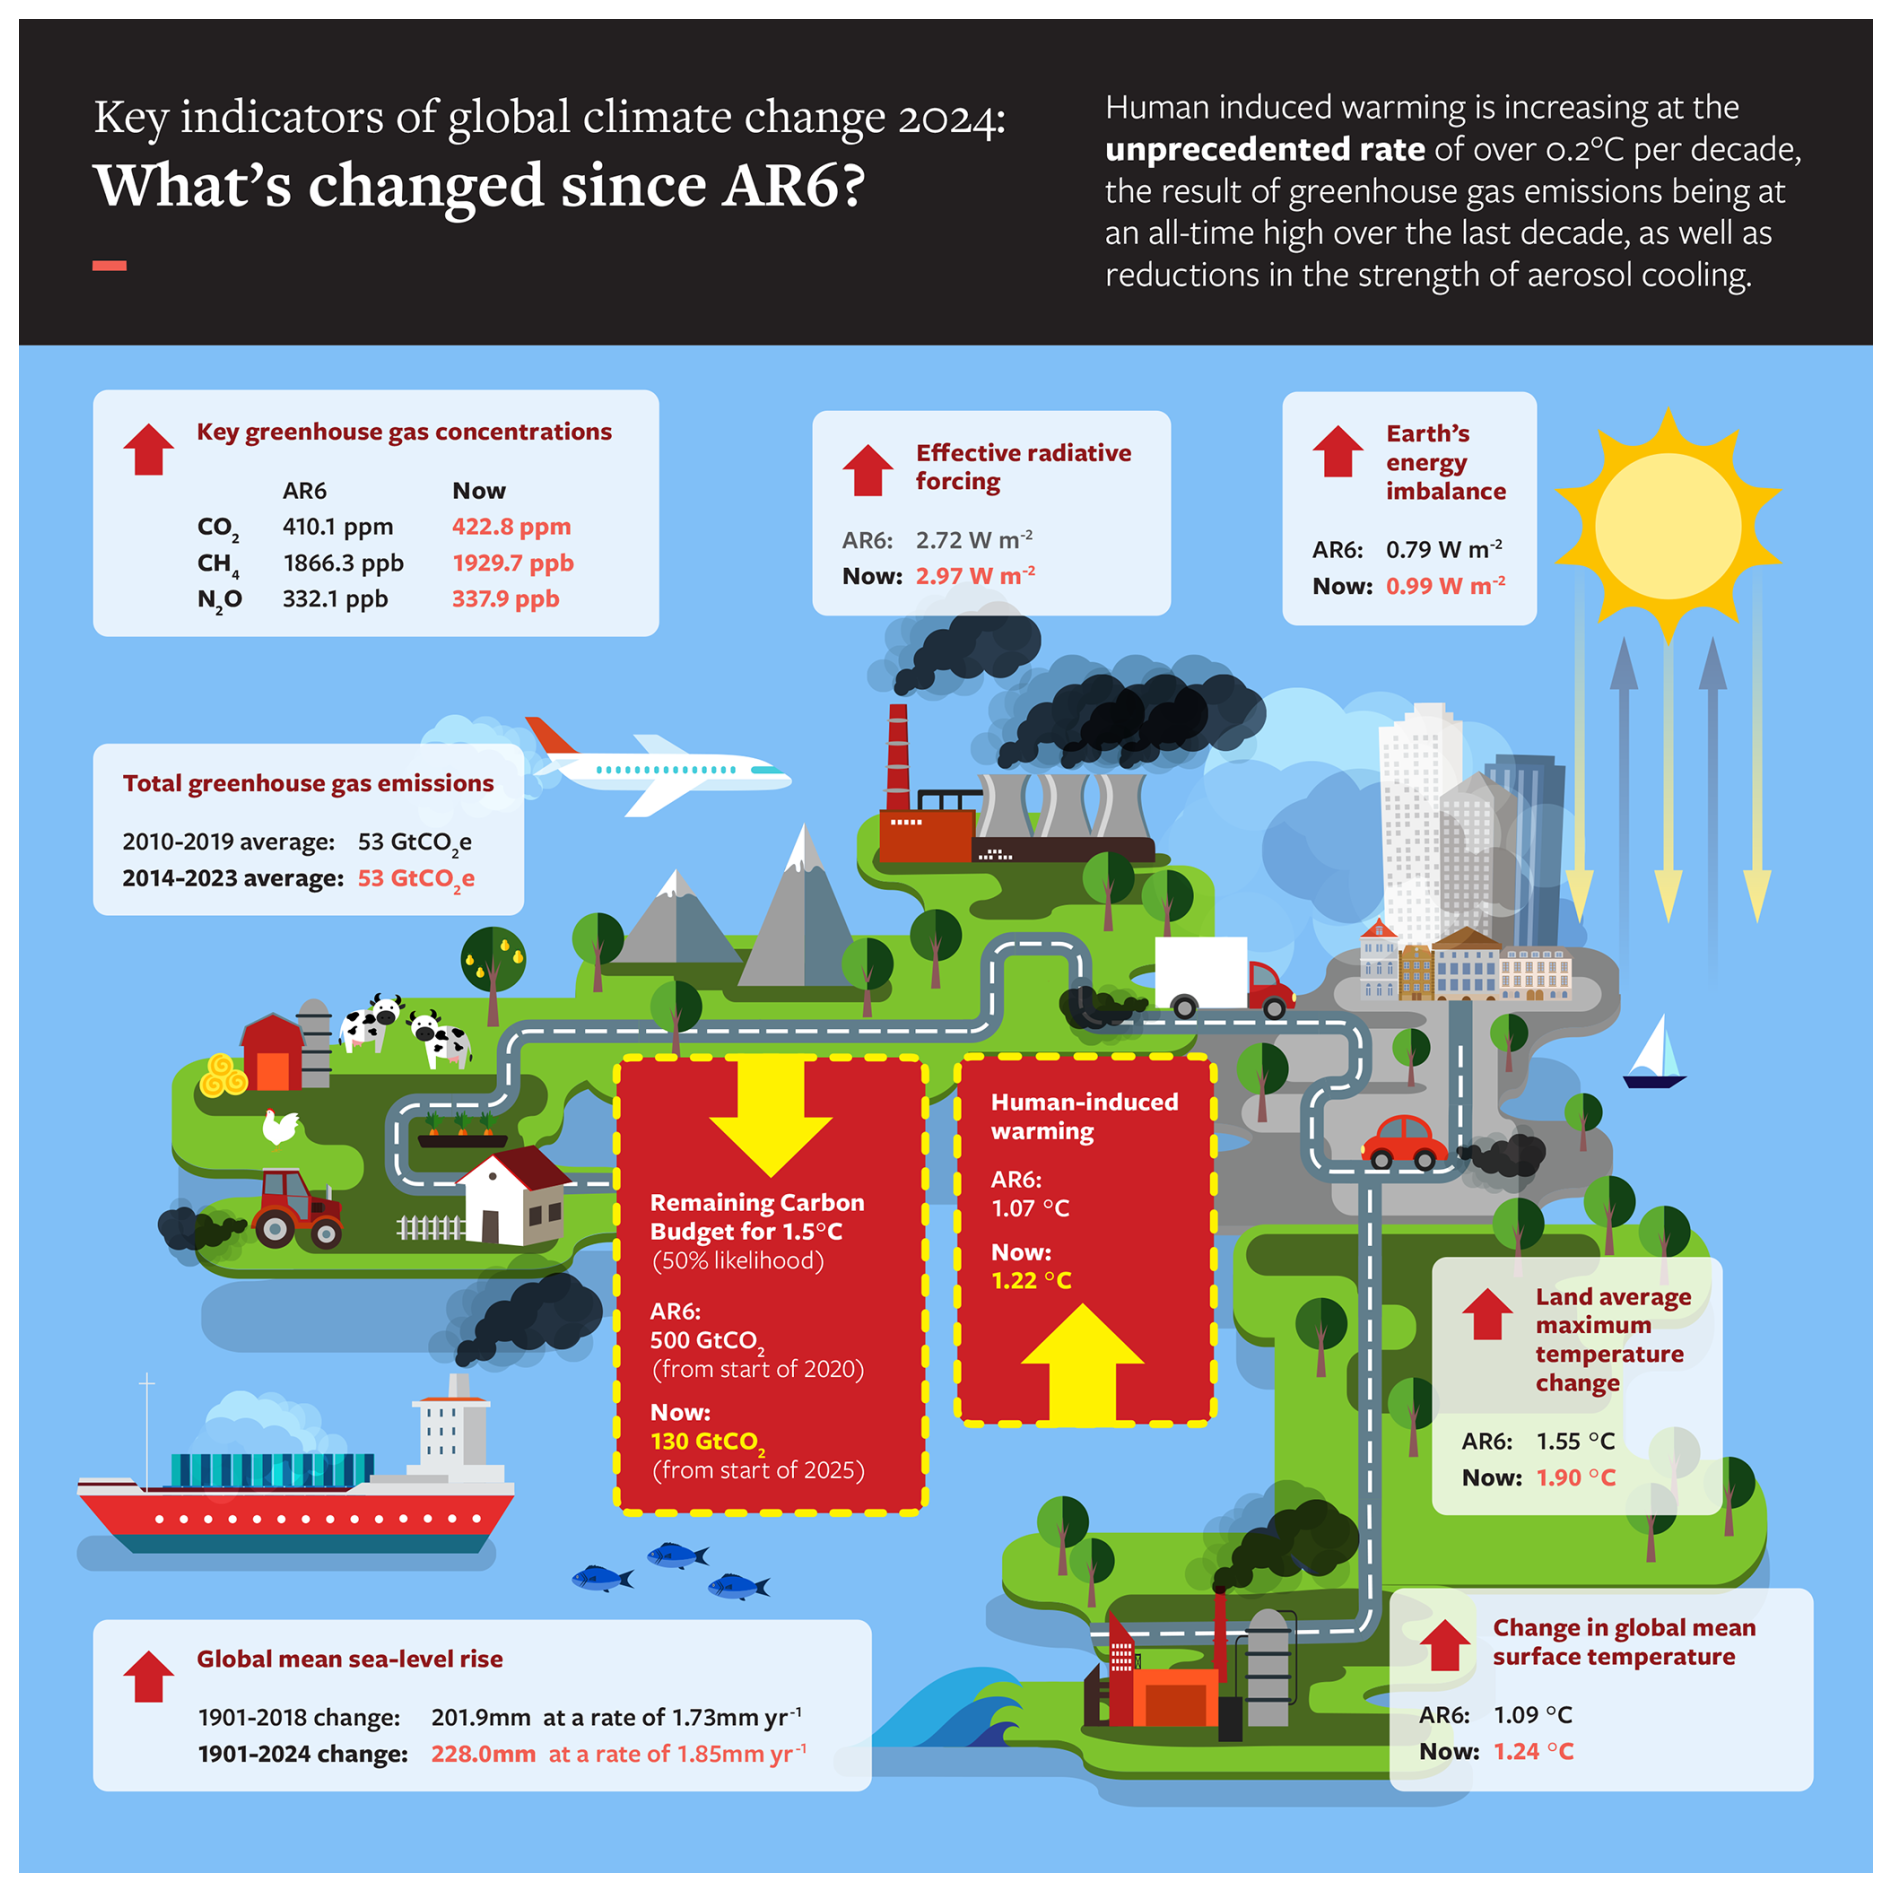
The third year of the Indicators of Global Climate Change (IGCC) initiative has built on previous years' efforts to provide a comprehensive update of the climate change indicators required to estimate the human-induced warming and the remaining carbon budget. Table 11 and Fig. 15 present a summary of the headline indicators from each section compared to those given in the AR6 assessment. Table 11 also summarises methodological updates.
Last year (2024) witnessed global surface temperatures more likely than not exceeding 1.5 °C above pre-industrial levels which has widely been reported in the press. Sections 7 and 8 show that such high levels of global temperature anomalies are typical of what we expect from current best estimates of human-induced warming, modulated by internal climate variability.
The overview of key indicators of the state of global climate indeed highlights the multiple fingerprints of the 2023–2024 El Niño event regarding peak global surface temperature (Sect. 7.2), regional dry anomalies in land precipitation (Sect. 11), and their implications for reduced land carbon sinks and the record growth rate of atmospheric CO2 concentrations in 2024 (Sect. 3).
The overall increase in land maximum temperatures (Sect. 10), closely related to global warming levels, drives increasing trends in potential evapotranspiration, decreasing trends in soil moisture (Seo et al., 2025), contributing to the increased rate of global mean sea-level rise (Sect. 12).
Methane and biomass emissions had a strong component of change related to climate feedbacks (Sects. 2 and 3). Such changes will become increasingly important over this century, even if the direct human influence declines. This year, we explored different inventory choices in Sect. 2. In future years a more consistent approach to attribution of atmospheric emissions, concentration change and radiative forcing should be developed, so it can be assessed in AR7.
It is hoped that this update can support the science community in its collection and provision of reliable and timely global climate data. In future years we are particularly interested in improving SLCF updating methods to get a more accurate estimate of short-term ERF changes. The work also highlights the importance of high-quality metadata to document changes in methodological approaches over time. This year we have extended the datasets with land precipitation and global mean sea-level rise. In future years we hope to improve the robustness of the indicators presented here and could update other AR6 assessments. Parallel efforts could explore how we might update indicators of regional climate extremes and their attribution, which are particularly relevant for supporting actions on adaptation and loss and damage.
Generally, scientists and scientific organisations have an important role as “watchdogs” to critically inform evidence-based decision-making. This annual update traced to IPCC methods can provide a reliable, timely source of trustworthy information; IGCC and the complementary updates of the State of the Climate (BAMS) and State of the Global Climate (WMO) reports very much rely on the continued support of high-quality global monitoring networks of atmospheric and climate data and also on open data sources that are regularly updated and easily accessed.
This is a critical decade: human-induced global warming rates are at their highest historical level, and 1.5 °C global warming might be expected to be reached or exceeded in around 5 years in the absence of cooling from major volcanic eruptions (Sects. 8 and 9). Yet this is also the decade when global GHG emissions could be expected to peak and begin to substantially decline. The indicators of global climate change presented here show that the Earth's energy imbalance has increased to around 1.0 W m−2, averaged over the last 12 years (Sect. 5), which represents a 25 % increase on the value assessed for 2006–2018 by AR6. This also has implications for the committed response of slow components in the climate system (glaciers, deep ocean, ice sheets) and committed long-term sea-level rise (through ocean thermal expansion and land-based ice melt/loss), to be addressed further in future updates. However, rapid and stringent GHG emission decreases such as those committed to at COP28 could halve warming rates over the next 20 years (McKenna et al., 2021). Table 1 shows that global GHG emissions are at a long-term high, yet there are signs that their rate of increase has slowed. Depending on the societal choices made in this critical decade, a continued series of these annual updates could track an improving trend for some of the indicators herein discussed.
The supplement related to this article is available online at https://doi.org/10.5194/essd-17-2641-2025-supplement.
PMF, CS, MA, PF, JR and AP developed the concept of an annual update in discussions with the wider IPCC community over many years. CS led the work of the data repositories. VMD, PZ, SS, CS, SIS, VN, AP, NPG, GPP, BT, MDP, KvS, JR, PF, MA, JCM, XZ, RAB, CB, CC, SB and PT provided important IPCC and UNFCCC framing. PMF coordinated the production of the manuscript with support from DR. WFL led Sect. 2 with contributions from PF, GPP, JG, JP, JCM and RA. CS led Sect. 3 with inputs from JM, PK, LW, PMF and MR. SS led Sect. 4 with inputs from VK, CS, GvdW, LAR and MG. CS led Sect. 5 with contributions from CW, TG, SS, VN and GvdW. KvS and MDP led Sect. 6 with contributions from LC, MI, JR, REK, AS, CMD, DPM and SEW. BT, CC and ZH led Sect. 7 with contributions from PT, CM, CK, JK, RR, RV, AL and LC. TW led Sect. 8 with contributions and calculations from AR, NPG, SJ, CS and MA. RL led Sect. 9 with contributions from JR and HDM. Section 10 was led by MH, with contributions from SIS and XZ. JYL, JEY and RK led Sect. 11 with contributions from VMD, PT and KvS. AS led Sect. 12 with contributions from MDP. All authors either edited or commented on the manuscript. DR, AB and JAB coordinated the data visualisation effort.
The contact author has declared that none of the authors has any competing interests.
Publisher's note: Copernicus Publications remains neutral with regard to jurisdictional claims made in the text, published maps, institutional affiliations, or any other geographical representation in this paper. While Copernicus Publications makes every effort to include appropriate place names, the final responsibility lies with the authors.
Analyses and visualisations for concentrations of short-lived climate forcers used in this paper were produced with the Giovanni online data system, developed and maintained by the NASA GES DISC (as available in February 2025). We thank Xin Lan for assistance with compiling the GHG concentration data.
This research has been supported by the Natural Environment Research Council (grant no. NE/X00452X/1); the Engineering and Physical Sciences Research Council (grant no. EP/V000772/1); the HORIZON EUROPE Framework Programme, HORIZON EUROPE Excellent Science (grant nos. 820829, 101081395, 101081661 and 821003); the EU H2020 European Research Council (grant nos. 951542 and 101137656 – EXPECT (Towards an Integrated Capability to Explain and Predict Regional Climate Changes)); the Department for Enterprise, Trade and Investment, UK Government (grant no. Met Office); the National Research Foundation of Korea (grant no. RS-2024-00416848); and the Nederlandse Organisatie voor Wetenschappelijk Onderzoek (DARSea, project no. VI.Vidi.2023.058). Peter Thorne was supported by Co-Centre award number 22/CC/11103. The Co-Centre award is managed by Research Ireland Northern Ireland's Department of Agriculture, Environment and Rural Affairs (DAERA) and UK Research and Innovation (UKRI) and supported via the UK's International Science Partnerships Fund (ISPF) and the Irish Government's Shared Island initiative. June-Yi Lee and Jung-Eun Yun were supported by the National Research Foundation of Korea (NRF) grant, funded by the Korea government (MSIT) (grant no. RS-2024-00416848).
This paper was edited by Martina Stockhause and reviewed by John Dunne and one anonymous referee.
Acker, J. G. and Leptoukh, G.: Online analysis enhances use of NASA Earth science data, EoS Transactions, 88, 14–17, https://doi.org/10.1029/2007EO020003, 2007.
Adler, R. F. and Gu, G.: Global precipitation for the year 2023 and how it relates to longer term variations and trends, Atmosphere, 15, 535, https://doi.org/10.3390/atmos15050535, 2024.
Adler, R. F., Sapiano, M. R. P., Huffman, J., Wang, J.-J., Gu G., Bolvin, D., Chiu, L., Schneider, U., Becker, A., Nelkin, E., Xie, P., Ferrarok R., and Shin, D.-B.: The global precipitation climatology project (GPCP) monthly analysis (new version 2.3) and a review of 2017 global precipitation, Atmosphere, 9, 138, https://doi.org/10.3390/atmos9040138, 2018.
Allan, R. P. and Merchant, C. J.: Reconciling Earth's growing energy imbalance with ocean warming, Environ. Res. Lett., 20, 04402, https://doi.org/10.1088/1748-9326/adb448, 2025.
Allen, M. R., Dube, O. P., Solecki, W., Aragón-Durand, F., Cramer, W., Humphreys, S., Kainuma, M., Kala, J., Mahowald, N., Mulugetta, Y., Perez, R., Wairiu, M., and Zickfeld, K.: Framing and Context, in: Global Warming of 1.5 °C. An IPCC Special Report on the impacts of global warming of 1.5 °C above pre-industrial levels and related global greenhouse gas emission pathways, in the context of strengthening the global response to the threat of climate change, sustainable development, and efforts to eradicate poverty, edited by: Masson-Delmotte, V., Zhai, P., Pörtner, H.-O., Roberts, D., Skea, J., Shukla, P. R., Pirani, A., Moufouma-Okia, W., Péan, C., Pidcock, R., Connors, S., Matthews, J. B. R., Chen, Y., Zhou, X., Gomis, M. I., Lonnoy, E., Maycock, T., Tignor, M., and Waterfield, T., Cambridge University Press, Cambridge, UK and New York, NY, USA, 49–92, https://doi.org/10.1017/9781009157940.003, 2018.
Allen, M. R., Frame, D. J., Friedlingstein, P., Gillett, N. P., Grassi, G., Gregory, J. M., Hare, W., House, J., Huntingford, C., Jenkins, S., Jones, C. D., Knutti, R., Lowe, J. A., Matthews, H. D., Meinshausen, M., Meinshausen, N., Peters, G. P., Plattner, G.-K., Raper, S., Rogelj, J., Stott, P. A., Solomon, S., Stocker, T. F., Weaver, A. J., and Zickfeld, K.: Geological Net Zero and the need for disaggregated accounting for carbon sinks, Nature, 638, 343–350, https://doi.org/10.1038/s41586-024-08326-8, 2025.
Allison, L. C., Palmer, M. D., Allan, R. P., Hermanson, L., Liu, C., and Smith, D. M.: Observations of planetary heating since the 1980s from multiple independent datasets, Environ. Res. Commun., 2, 101001, https://doi.org/10.1088/2515-7620/abbb39, 2020.
AVISO: Mean sea-level product, AVISO+ [data set], https://www.aviso.altimetry.fr/en/data/products/ocean-indicators-products/mean-sea-level/data-acces.html (last access: 19 February 2025), 2025.
Basu, S., Lan, X., Dlugokencky, E., Michel, S., Schwietzke, S., Miller, J. B., Bruhwiler, L., Oh, Y., Tans, P. P., Apadula, F., Gatti, L. V., Jordan, A., Necki, J., Sasakawa, M., Morimoto, S., Di Iorio, T., Lee, H., Arduini, J., and Manca, G.: Estimating emissions of methane consistent with atmospheric measurements of methane and δ13C of methane, Atmos. Chem. Phys., 22, 15351–15377, https://doi.org/10.5194/acp-22-15351-2022, 2022.
Bond, T. C., Doherty, S. J., Fahey, D. W., Forster, P. M., Berntsen, T., DeAngelo, B. J., Flanner, M. G., Ghan, S., Kärcher, B., Koch, D., Kinne, S., Kondo, Y., Quinn, P. K., Sarofim, M. C., Schultz, M. G., Schulz, M., Venkataraman, C., Zhang, H., Zhang, S., Bellouin, N., Guttikunda, S. K., Hopke, P. K., Jacobson, M. Z., Kaiser, J. W., Klimont, Z., Lohmann, U., Schwarz, J. P., Shindell, D., Storelvmo, T., Warren, S. G., and Zender, C. S.: Bounding the role of black carbon in the climate system: A scientific assessment, J. Geophys. Res.-Atmos., 118, 5380–5552, https://doi.org/10.1002/jgrd.50171, 2013.
Burton, C., Lampe, S., Kelley, D. I., Thiery, W., Hantson, S., Christidis, N., Gudmundsson, L., Forrest, M., Burke, E., Chang, J., Huang, H., Ito, A., Kou-Giesbrecht, S., Lasslop, G., Li, W., Nieradzik, L., Li, F., Chen, Y., Randerson, J., Reyer, C. P. O., and Mengel, M.: Global burned area increasingly explained by climate change, Nat. Clim. Chang., 14, 1186–1192, https://doi.org/10.1038/s41558-024-02140-w, 2024.
Canadell, J. G., Monteiro, P. M. S., Costa, M. H., Cotrim da Cunha, L., Cox, P. M., Eliseev, A. V., Henson, S., Ishii, M., Jaccard, S., Koven, C., Lohila, A., Patra, P. K., Piao, S., Rogelj, J., Syampungani, S., Zaehle, S., and Zickfeld, K.: Global Carbon and other Biogeochemical Cycles and Feedbacks. In Climate Change 2021: The Physical Science Basis. Contribution of Working Group I to the Sixth Assessment Report of the Intergovernmental Panel on Climate Change, edited by: Masson-Delmotte, V., Zhai, P., Pirani, A., Connors, S. L., Péan, C., Berger, S., Caud, N., Chen, Y., Goldfarb, L., Gomis, M. I., Huang, M., Leitzell, K., Lonnoy, E., Matthews, J. B. R., Maycock, T. K., Waterfield, T., Yelekçi, O., Yu, R., and Zhou, B., Cambridge University Press, Cambridge, United Kingdom and New York, NY, USA, 673–816, https://doi.org/10.1017/9781009157896.007, 2021.
Cao, J., Wang, H., Wang, B., Zhao, H., Wang, C., and Zhu, X.: Higher sensitivity of Northern Hemisphere monsoon to anthropogenic aerosol than greenhouse gases, Geophys Res. Lett., 49, e2022GL100270, https://doi.org/10.1029/2022GL100270, 2022.
Cattiaux, J., Ribes, A., and Cariou, E.: How Extreme Were Daily Global Temperatures in 2023 and Early 2024?, Geophys. Res. Lett., 51, e2024GL110531, https://doi.org/10.1029/2024GL110531, 2024.
Cheng, L., Abraham, J., Hausfather, Z., and Trenberth, K. E.: How fast are the oceans warming?, Science, 363, 128–129, https://doi.org/10.1126/science.aav7619, 2019.
Cheng, L., von Schuckmann, K., Abraham, J. P., Trenberth, K. E., Mann, M. E., Zanna, L., England, M. H., Zika, J. D., Fasullo, J. T., Yu, Y., Pan, Y., Zhu, J., Newsom, E. R., Bronselaer, B., and Lin, X.: Past and future ocean warming, Nat. Rev. Earth. Environ., 3, 776–794, https://doi.org/10.1038/s43017-022-00345-1, 2022.
Church, J. A., White, N. J., Konikow, L. F., Domingues, C. M., Cogley, J. G., Rignot, E., Gregory, J. M., Van Den Broeke, M. R., Monaghan, A. J., and Velicogna, I.: Revisiting the Earth's sea-level and energy budgets from 1961 to 2008: SEA-LEVEL AND ENERGY BUDGETS, Geophys. Res. Lett., 38, L18601, https://doi.org/10.1029/2011GL048794, 2011.
Church, J. A., Clark, P. U., Cazenave, A., Gregory, J. M., Jevrejeva, S., Levermann, A., Merrifield, M. A., Milne, G. A., Nerem, R. S., Nunn, P. D., Payne, A. J., Pfeffer, W. T., Stammer, D., and Unnikrishnan, A. S.: Sea Level Change, in: Climate Change 2013: The Physical Science Basis. Contribution of Working Group I to the Fifth Assessment Report of the Intergovernmental Panel on Climate Change, edited by: Stocker, T. F., Qin, D., Plattner, G.-K., Tignor, M., Allen, S. K., Boschung, J., Nauels, A., Xia, Y., Bex, V., and P. Midgley, M., Cambridge University Press, Cambridge, United Kingdom and New York, NY, USA, 2013.
Climate Change Tracker: Indicators of Global Climate Change 2023, Climate Change Tracker [data set], https://climatechangetracker.org/igcc (last access: 20 May 2025), 2025.
Collins, M., Knutti, R., Arblaster, J., Dufresne, J.-L., Fichefet, T., Friedlingstein, P., Gao, X., Gutowski, W. J., Johns, T., Krinner, G., Shongwe, M., Tebaldi, C., Weaver, A. J., and Wehner, M.: Long-term Climate Change: Projections, Commitments and Irreversibility, in: Stocker, V. B. T. F., Qin, D., Plattner, G. K., Tignor, M., Allen, S. K., Boschung, J., Nauels, A., Xia, Y., and Midgley, P. M., Climate Change 2013: The Physical Science Basis. Contribution of Working Group I to the Fifth Assessment Report of the Intergovernmental Panel on Climate Change, Cambridge, United Kingdom and New York, NY, USA, Cambridge University Press, 1029–1136, 2013.
Crippa, M., Guizzardi, D., Schaaf, E., Monforti-Ferrario, F., Quadrelli, R., Risquez Martin, A., Rossi, S., Vignati, E., Muntean, M., Brandao De Melo, J., Oom, D., Pagani, F., Banja, M., Taghavi-Moharamli, P., Köykkä, J., Grassi, G., Branco, A., and San-Miguel, J.: GHG emissions of all world countries – 2023, Publications Office of the European Union, https://doi.org/10.2760/953322, 2023.
Cuesta-Valero, F. J., Beltrami, H., García-García, A., Krinner, G., Langer, M., MacDougall, A., Nitzbon, J., Peng, J., von Schuckmann, K., Seneviratne, S., Thiery, W., Vanderkelen, I., and Wu, T.: GCOS EHI 1960–2020 Continental Heat Content (Version 2), World Data Center for Climate (WDCC) at DKRZ, https://doi.org/10.26050/WDCC/GCOS_EHI_1960-2020_CoHC_v2, 2023.
Dangendorf, S., Hay, C., Calafat, F. M., Marcos, M., Piecuch, C. G., Berk, K., and Jensen, J.: Persistent acceleration in global sea-level rise since the 1960s, Nat. Clim. Chang., 9, 705–710, https://doi.org/10.1038/s41558-019-0531-8, 2019.
Dangendorf, S., Sun, Q., Wahl, T., Thompson, P., Mitrovica, J. X., and Hamlington, B.: Probabilistic reconstruction of sea-level changes and their causes since 1900, Earth Syst. Sci. Data, 16, 3471–3494, https://doi.org/10.5194/essd-16-3471-2024, 2024.
Deng, Z., Ciais, P., Tzompa-Sosa, Z. A., Saunois, M., Qiu, C., Tan, C., Sun, T., Ke, P., Cui, Y., Tanaka, K., Lin, X., Thompson, R. L., Tian, H., Yao, Y., Huang, Y., Lauerwald, R., Jain, A. K., Xu, X., Bastos, A., Sitch, S., Palmer, P. I., Lauvaux, T., d'Aspremont, A., Giron, C., Benoit, A., Poulter, B., Chang, J., Petrescu, A. M. R., Davis, S. J., Liu, Z., Grassi, G., Albergel, C., Tubiello, F. N., Perugini, L., Peters, W., and Chevallier, F.: Comparing national greenhouse gas budgets reported in UNFCCC inventories against atmospheric inversions, Earth Syst. Sci. Data, 14, 1639–1675, https://doi.org/10.5194/essd-14-1639-2022, 2022.
Deng, Z., Zhu, B., Davis, S. J., Ciais, P., Guan, D., Gong, P., and Liu, Z.: Global carbon emissions and decarbonization in 2024, Nat. Rev. Earth Environ., 6, 231–233, https://doi.org/10.1038/s43017-025-00658-x, 2025.
Denier van der Gon, H., Gauss, M., Granier, C., Arellano, S., Benedictow, A., Darras, S., Dellaert, S., Guevara, M., Jalkanen, J.-P., Krueger, K., Kuenen, J., Liaskoni, M., Liousse, C., Markova, J., Prieto Perez, A., Quack, B., Simpson, D., Sindelarova, K., and Soulie, A.: Documentation of CAMS emission inventory products, Copernicus Atmosphere Monitoring Service [data set], https://doi.org/10.24380/Q2SI-TI6I, 2023.
Dhakal, S., Minx, J. C., Toth, F. L., Abdel-Aziz, A., Figueroa Meza, M. J., Hubacek, K., Jonckheere, I. G. C., Kim, Y.-G., Nemet, G. F., Pachauri, S., Tan, X. C., and Wiedmann, T.: Emissions Trends and Drivers, in IPCC, 2022: Climate Change 2022: Mitigation of Climate Change. Contribution of Working Group III to the Sixth Assessment Report of the Intergovernmental Panel on Climate Change, edited by: Shukla, P. R., Skea, J., Slade, R., Al Khourdajie, A., van Diemen, R., McCollum, D., Pathak, M., Some, S., Vyas, P., Fradera, R., Belkacemi, M., Hasija, A., Lisboa, G., Luz, S., and Malley, J., Cambridge University Press, Cambridge, UK and New York, NY, USA, https://doi.org/10.1017/9781009157926.004, 2022.
Douville, H., Raghavan, K., Renwick, J., Allan, R. P., Arias, P. A., Barlow, M., Cerezo-Mota, R., Cherchi, A., Gan, T. Y., Gergis, J., Jiang, D., Khan, A., Pokam Mba, W., Rosenfeld, D., Tierney, J., and Zolina, O.: Water Cycle Changes, in: Climate Change 2021: The Physical Science Basis. Contribution of Working Group I to the Sixth Assessment Report of the Intergovernmental Panel on Climate Change, edited by: Masson-Delmotte, V., Zhai, P., Pirani, A., Connors, S. L., Péan, C., Berger, S., Caud, N., Chen, Y., Goldfarb, L., Gomis, M. I., Huang, M., Leitzell, K., Lonnoy, E., Matthews, J. B. R., Maycock, T. K., Waterfield, T., Yelekçi, O., Yu, R., and Zhou, B., Cambridge University Press, Cambridge, United Kingdom and New York, NY, USA, 1055–1210, https://doi.org/10.1017/9781009157896.010, 2021.
Droste, E. S., Adcock, K. E., Ashfold, M. J., Chou, C., Fleming, Z., Fraser, P. J., Gooch, L. J., Hind, A. J., Langenfelds, R. L., Leedham Elvidge, E. C., Mohd Hanif, N., O'Doherty, S., Oram, D. E., Ou-Yang, C.-F., Panagi, M., Reeves, C. E., Sturges, W. T., and Laube, J. C.: Trends and emissions of six perfluorocarbons in the Northern Hemisphere and Southern Hemisphere, Atmos. Chem. Phys., 20, 4787–4807, https://doi.org/10.5194/acp-20-4787-2020, 2020.
Dunn, R. J. H., Alexander, L. V., Donat, M. G., Zhang, X., Bador, M., Herold, N., Lippmann, T., Allan, R., Aguilar, E., Barry, A. A., Brunet, M., Caesar, J., Chagnaud, G., Cheng, V., Cinco, T., Durre, I., Guzman, R., Htay, T. M., Wan Ibadullah, W. M., Bin Ibrahim, M. K. I., Khoshkam, M., Kruger, A., Kubota, H., Leng, T. W., Lim, G., Li-Sha, L., Marengo, J., Mbatha, S., McGree, S., Menne, M., Milagros Skansi, M., Ngwenya, S., Nkrumah, F., Oonariya, C., Pabon-Caicedo, J. D., Panthou, G., Pham, C., Rahimzadeh, F., Ramos, A., Salgado, E., Salinger, J., Sané, Y., Sopaheluwakan, A., Srivastava, A., Sun, Y., Timbal, B., Trachow, N., Trewin, B., Schrier, G., Vazquez-Aguirre, J., Vasquez, R., Villarroel, C., Vincent, L., Vischel, T., Vose, R., and Bin Hj Yussof, M. N.: Development of an updated global land in situ-based data set of temperature and precipitation extremes: HadEX3, J. Geophys. Res.-Atmos., 125, e2019JD032263, https://doi.org/10.1029/2019JD032263, 2020.
Dunn, R. J. H., Alexander, L., Donat, M., Zhang, X., Bador, M., Herold, N., Lippmann, T., Allan, R. J., Aguilar, E., Aziz, A., Brunet, M., Caesar, J., Chagnaud, G., Cheng, V., Cinco, T., Durre, I., de Guzman, R., Htay, T. M., Wan Ibadullah, W. M., Bin Ibrahim, M. K. I., Khoshkam, M., Kruge, A., Kubota, H., Leng, T. W., Lim, G., Li-Sha, L., Marengo, J., Mbatha, S., McGree, S., Menne, M., de los Milagros Skansi, M., Ngwenya, S., Nkrumah, F., Oonariya, C., Pabon-Caicedo, J. D., Panthou, G., Pham, C., Rahimzadeh, F., Ramos, A., Salgado, E., Salinger, J., Sane, Y., Sopaheluwakan, A., Srivastava, A., Sun, Y., Trimbal, B., Trachow, N., Trewin, B., van der Schrier, G., Vazquez-Aguirre, J., Vasquez, R., Villarroel, C., Vincent, L., Vischel, T., Vose, R., and Bin Hj Yussof, M. N. A.: HadEX3: Global land-surface climate extremes indices v3.0.4 (1901–2018), NERC EDS Centre for Environmental Data Analysis [data set], https://doi.org/10.5285/115d5e4ebf7148ec941423ec86fa9f26, 2023.
Dunn, R. J. H., Blannin, J., Gobron, N., Miller, J. B. and Willett, K. M. (Eds.): Global climate, in: State of the Climate in 2023, B. Am. Meteorol. Soc., 105, S12–S155, https://doi.org/10.1175/BAMS-D-24-0116.1, 2024.
Dutton, G. S., Hall, B. D., Montzka, S. A., Nance, J. D., Clingan, S. D., and Petersen, K. M.: Combined Atmospheric Chloroflurocarbon-12 Dry Air Mole Fractions from the NOAA GML Halocarbons Sampling Network, 1977–2024, Version: 2024-03-07, Global Monitoring Laboratory [data set], https://doi.org/10.15138/PJ63-H440, 2024.
ECCAD: CAMS database version 6.2 (v6.2), ECCAD [data set], https://permalink.aeris-data.fr/CAMS-GLOB-ANT (last access: 20 April 2025), 2025.
Eyring, V., Gillett, N. P., Achuta Rao, K. M., Barimalala, R., Barreiro Parrillo, M., Bellouin, N., Cassou, C., Durack, P. J., Kosaka, Y., McGregor, S., Min, S., Morgenstern, O., and Sun, Y.: Human Influence on the Climate System, in: Climate Change 2021: The Physical Science Basis. Contribution of Working Group I to the Sixth Assessment Report of the Intergovernmental Panel on Climate Change, edited by: Masson-Delmotte, V., Zhai, P., Pirani, A., Connors, S. L., Péan, C., Berger, S., Caud, N., Chen, Y., Goldfarb, L., Gomis, M. I., Huang, M., Leitzell, K., Lonnoy, E., Matthews, J. B. R., Maycock, T. K., Waterfield, T., Yelekçi, O., Yu, R., and Zhou, B., Cambridge University Press, Cambridge, United Kingdom and New York, NY, USA, 423–552, https://doi.org/10.1017/9781009157896.005, 2021.
Feron, S., Malhotra, A., Bansal, S., Fluet-Chouinard, E., McNicol, G., Knox, S. H., Delwiche, K. B., Cordero, R. R., Ouyang, Z., Zhang, Z., Poulter, B., and Jackson, R. B.: Recent increases in annual, seasonal, and extreme methane fluxes driven by changes in climate and vegetation in boreal and temperate wetland ecosystems, Global Change Biol., 30, e17131, https://doi.org/10.1111/gcb.17131, 2024.
Forster, P., Storelvmo, T., Armour, K., Collins, W., Dufresne, J.-L., Frame, D., Lunt, D. J., Mauritsen, T., Palmer, M. D., Watanabe, M., Wild, M., and Zhang, H.: The Earth's Energy Budget, Climate Feedbacks, and Climate Sensitivity, in: Climate Change 2021: The Physical Science Basis. Contribution of Working Group I to the Sixth Assessment Report of the Intergovernmental Panel on Climate Change, edited by: Masson-Delmotte, V., Zhai, P., Pirani, A., Connors, S. L., Péan, C., Berger, S., Caud, N., Chen, Y., Goldfarb, L., Gomis, M. I., Huang, M., Leitzell, K., Lonnoy, E., Matthews, J. B. R., Maycock, T. K., Waterfield, T., Yelekçi, O., Yu, R., and Zhou, B., Cambridge University Press, Cambridge, United Kingdom and New York, NY, USA, 923–1054, https://doi.org/10.1017/9781009157896.009, 2021.
Forster, P. M., Smith, C. J., Walsh, T., Lamb, W. F., Lamboll, R., Hauser, M., Ribes, A., Rosen, D., Gillett, N., Palmer, M. D., Rogelj, J., von Schuckmann, K., Seneviratne, S. I., Trewin, B., Zhang, X., Allen, M., Andrew, R., Birt, A., Borger, A., Boyer, T., Broersma, J. A., Cheng, L., Dentener, F., Friedlingstein, P., Gutiérrez, J. M., Gütschow, J., Hall, B., Ishii, M., Jenkins, S., Lan, X., Lee, J.-Y., Morice, C., Kadow, C., Kennedy, J., Killick, R., Minx, J. C., Naik, V., Peters, G. P., Pirani, A., Pongratz, J., Schleussner, C.-F., Szopa, S., Thorne, P., Rohde, R., Rojas Corradi, M., Schumacher, D., Vose, R., Zickfeld, K., Masson-Delmotte, V., and Zhai, P.: Indicators of Global Climate Change 2022: annual update of large-scale indicators of the state of the climate system and human influence, Earth Syst. Sci. Data, 15, 2295–2327, https://doi.org/10.5194/essd-15-2295-2023, 2023.
Forster, P. M., Smith, C., Walsh, T., Lamb, W. F., Lamboll, R., Hall, B., Hauser, M., Ribes, A., Rosen, D., Gillett, N. P., Palmer, M. D., Rogelj, J., von Schuckmann, K., Trewin, B., Allen, M., Andrew, R., Betts, R. A., Borger, A., Boyer, T., Broersma, J. A., Buontempo, C., Burgess, S., Cagnazzo, C., Cheng, L., Friedlingstein, P., Gettelman, A., Gütschow, J., Ishii, M., Jenkins, S., Lan, X., Morice, C., Mühle, J., Kadow, C., Kennedy, J., Killick, R. E., Krummel, P. B., Minx, J. C., Myhre, G., Naik, V., Peters, G. P., Pirani, A., Pongratz, J., Schleussner, C.-F., Seneviratne, S. I., Szopa, S., Thorne, P., Kovilakam, M. V. M., Majamäki, E., Jalkanen, J.-P., van Marle, M., Hoesly, R. M., Rohde, R., Schumacher, D., van der Werf, G., Vose, R., Zickfeld, K., Zhang, X., Masson-Delmotte, V., and Zhai, P.: Indicators of Global Climate Change 2023: annual update of key indicators of the state of the climate system and human influence, Earth Syst. Sci. Data, 16, 2625–2658, https://doi.org/10.5194/essd-16-2625-2024, 2024.
Fox-Kemper, B., Fox-Kemper, B., Hewitt, H. T., Xiao, C., Aðalgeirsdóttir, G., Drijfhout, S. S., Edwards, T. L., Golledge, N. R., Hemer, M., Kopp, R. E., Krinner, G., Mix, A., Notz, D., Nowicki, S., Nurhati, I. S., Ruiz, L., Sallée, J.-B., Slangen, A. B. A., and Yu, Y.: Ocean, Cryosphere and Sea Level Change, in: Climate Change 2021: The Physical Science Basis. Contribution of Working Group I to the Sixth Assessment Report of the Intergovernmental Panel on Climate Change, edited by: Masson-Delmotte, V., Zhai, P., Pirani, A., Connors, S. L., Péan, C., Berger, S., Caud, N., Chen, Y., Goldfarb, L., Gomis, M. I., Huang, M., Leitzell, K., Lonnoy, E., Matthews, J. B. R., Maycock, T. K., Waterfield, T., Yelekçi, O., Yu, R., and Zhou, B., Cambridge University Press, Cambridge, United Kingdom and New York, NY, USA, 1211–1362, https://doi.org/10.1017/9781009157896.011, 2021.
Francey, R. J., Steele, L. P., Langenfelds, R. L., and Pak, B. C.: High precision long-term monitoring of radiatively-active trace gases at surface sites and from ships and aircraft in the Southern Hemisphere atmosphere, J. Atmos. Science, 56, 279–285 https://doi.org/10.1175/1520-0469(1999)056<0279:HPLTMO>2.0.CO;2, 1999.
Frederikse, T., Landerer, F., Caron, L., Adhikari, S., Parkes, D., Humphrey, V. W., Dangendorf, S., Hogarth, P., Zanna, L., Cheng, L., and Wu, Y.-H.: The causes of sea-level rise since 1900, Nature, 584, 393–397, https://doi.org/10.1038/s41586-020-2591-3, 2020.
Friedlingstein, P., O'Sullivan, M., Jones, M. W., Andrew, R. M., Hauck, J., Olsen, A., Peters, G. P., Peters, W., Pongratz, J., Sitch, S., Le Quéré, C., Canadell, J. G., Ciais, P., Jackson, R. B., Alin, S., Aragão, L. E. O. C., Arneth, A., Arora, V., Bates, N. R., Becker, M., Benoit-Cattin, A., Bittig, H. C., Bopp, L., Bultan, S., Chandra, N., Chevallier, F., Chini, L. P., Evans, W., Florentie, L., Forster, P. M., Gasser, T., Gehlen, M., Gilfillan, D., Gkritzalis, T., Gregor, L., Gruber, N., Harris, I., Hartung, K., Haverd, V., Houghton, R. A., Ilyina, T., Jain, A. K., Joetzjer, E., Kadono, K., Kato, E., Kitidis, V., Korsbakken, J. I., Landschützer, P., Lefèvre, N., Lenton, A., Lienert, S., Liu, Z., Lombardozzi, D., Marland, G., Metzl, N., Munro, D. R., Nabel, J. E. M. S., Nakaoka, S.-I., Niwa, Y., O'Brien, K., Ono, T., Palmer, P. I., Pierrot, D., Poulter, B., Resplandy, L., Robertson, E., Rödenbeck, C., Schwinger, J., Séférian, R., Skjelvan, I., Smith, A. J. P., Sutton, A. J., Tanhua, T., Tans, P. P., Tian, H., Tilbrook, B., van der Werf, G., Vuichard, N., Walker, A. P., Wanninkhof, R., Watson, A. J., Willis, D., Wiltshire, A. J., Yuan, W., Yue, X., and Zaehle, S.: Global Carbon Budget 2020, Earth Syst. Sci. Data, 12, 3269–3340, https://doi.org/10.5194/essd-12-3269-2020, 2020.
Friedlingstein, P., O'Sullivan, M., Jones, M. W., Andrew, R. M., Gregor, L., Hauck, J., Le Quéré, C., Luijkx, I. T., Olsen, A., Peters, G. P., Peters, W., Pongratz, J., Schwingshackl, C., Sitch, S., Canadell, J. G., Ciais, P., Jackson, R. B., Alin, S. R., Alkama, R., Arneth, A., Arora, V. K., Bates, N. R., Becker, M., Bellouin, N., Bittig, H. C., Bopp, L., Chevallier, F., Chini, L. P., Cronin, M., Evans, W., Falk, S., Feely, R. A., Gasser, T., Gehlen, M., Gkritzalis, T., Gloege, L., Grassi, G., Gruber, N., Gürses, Ö., Harris, I., Hefner, M., Houghton, R. A., Hurtt, G. C., Iida, Y., Ilyina, T., Jain, A. K., Jersild, A., Kadono, K., Kato, E., Kennedy, D., Klein Goldewijk, K., Knauer, J., Korsbakken, J. I., Landschützer, P., Lefèvre, N., Lindsay, K., Liu, J., Liu, Z., Marland, G., Mayot, N., McGrath, M. J., Metzl, N., Monacci, N. M., Munro, D. R., Nakaoka, S.-I., Niwa, Y., O'Brien, K., Ono, T., Palmer, P. I., Pan, N., Pierrot, D., Pocock, K., Poulter, B., Resplandy, L., Robertson, E., Rödenbeck, C., Rodriguez, C., Rosan, T. M., Schwinger, J., Séférian, R., Shutler, J. D., Skjelvan, I., Steinhoff, T., Sun, Q., Sutton, A. J., Sweeney, C., Takao, S., Tanhua, T., Tans, P. P., Tian, X., Tian, H., Tilbrook, B., Tsujino, H., Tubiello, F., van der Werf, G. R., Walker, A. P., Wanninkhof, R., Whitehead, C., Willstrand Wranne, A., Wright, R., Yuan, W., Yue, C., Yue, X., Zaehle, S., Zeng, J., and Zheng, B.: Global Carbon Budget 2022, Earth Syst. Sci. Data, 14, 4811–4900, https://doi.org/10.5194/essd-14-4811-2022, 2022.
Friedlingstein, P., O'Sullivan, M., Jones, M. W., Andrew, R. M., Hauck, J., Landschützer, P., Le Quéré, C., Li, H., Luijkx, I. T., Olsen, A., Peters, G. P., Peters, W., Pongratz, J., Schwingshackl, C., Sitch, S., Canadell, J. G., Ciais, P., Jackson, R. B., Alin, S. R., Arneth, A., Arora, V., Bates, N. R., Becker, M., Bellouin, N., Berghoff, C. F., Bittig, H. C., Bopp, L., Cadule, P., Campbell, K., Chamberlain, M. A., Chandra, N., Chevallier, F., Chini, L. P., Colligan, T., Decayeux, J., Djeutchouang, L. M., Dou, X., Duran Rojas, C., Enyo, K., Evans, W., Fay, A. R., Feely, R. A., Ford, D. J., Foster, A., Gasser, T., Gehlen, M., Gkritzalis, T., Grassi, G., Gregor, L., Gruber, N., Gürses, Ö., Harris, I., Hefner, M., Heinke, J., Hurtt, G. C., Iida, Y., Ilyina, T., Jacobson, A. R., Jain, A. K., Jarníková, T., Jersild, A., Jiang, F., Jin, Z., Kato, E., Keeling, R. F., Klein Goldewijk, K., Knauer, J., Korsbakken, J. I., Lan, X., Lauvset, S. K., Lefèvre, N., Liu, Z., Liu, J., Ma, L., Maksyutov, S., Marland, G., Mayot, N., McGuire, P. C., Metzl, N., Monacci, N. M., Morgan, E. J., Nakaoka, S.-I., Neill, C., Niwa, Y., Nützel, T., Olivier, L., Ono, T., Palmer, P. I., Pierrot, D., Qin, Z., Resplandy, L., Roobaert, A., Rosan, T. M., Rödenbeck, C., Schwinger, J., Smallman, T. L., Smith, S. M., Sospedra-Alfonso, R., Steinhoff, T., Sun, Q., Sutton, A. J., Séférian, R., Takao, S., Tatebe, H., Tian, H., Tilbrook, B., Torres, O., Tourigny, E., Tsujino, H., Tubiello, F., van der Werf, G., Wanninkhof, R., Wang, X., Yang, D., Yang, X., Yu, Z., Yuan, W., Yue, X., Zaehle, S., Zeng, N., and Zeng, J.: Global Carbon Budget 2024, Earth Syst. Sci. Data, 17, 965–1039, https://doi.org/10.5194/essd-17-965-2025, 2025.
Gasser, T., Crepin, L., Quilcaille, Y., Houghton, R. A., Ciais, P., and Obersteiner, M.: Historical CO2 emissions from land use and land cover change and their uncertainty, Biogeosciences, 17, 4075–4101, https://doi.org/10.5194/bg-17-4075-2020, 2020.
Gidden, M. J., Gasser, T., Grassi, G., Forsell, N., Janssens, I., Lamb, W. F., Minx, J., Nicholls, Z., Steinhauser, J., and Riahi, K.: Aligning climate scenarios to emissions inventories shifts global benchmarks, Nature, 624, 102–108, https://doi.org/10.1038/s41586-023-06724-y, 2023.
Gillett, N. P., Kirchmeier-Young, M., Ribes, A., Shiogama, H., Hegerl, G. C., Knutti, R., Gastineau, G., John, J. G., Li, L., Nazarenko, L., Rosenbloom, N., Seland, Ø., Wu, T., Yukimoto, S., and Ziehn, T.: Constraining human contributions to observed warming since the pre-industrial period, Nat. Clim. Chang., 11, 207–212, https://doi.org/10.1038/s41558-020-00965-9, 2021.
Gleckler, P. J., Durack, P. J., Stouffer, R. J., Johnson, G. C., and Forest, C. E.: Industrial-era global ocean heat uptake doubles in recent decades, Nat. Clim. Chang., 6, 394–398, https://doi.org/10.1038/nclimate2915, 2016.
Goessling, H. F., Rackow, T., and Jung, T.: Recent global temperature surge intensified by record-low planetary albedo, Science, 387, 68–73, https://doi.org/10.1126/science.adq7280, 2025.
Grassi, G., Stehfest, E., Rogelj, J., Van Vuuren, D., Cescatti, A., House, J., Nabuurs, G.-J., Rossi, S., Alkama, R., Viñas, R. A., Calvin, K., Ceccherini, G., Federici, S., Fujimori, S., Gusti, M., Hasegawa, T., Havlik, P., Humpenöder, F., Korosuo, A., Perugini, L., Tubiello, F. N., and Popp, A.: Critical adjustment of land mitigation pathways for assessing countries' climate progress, Nat. Clim. Chang., 11, 425–434, https://doi.org/10.1038/s41558-021-01033-6, 2021.
Grassi, G., Schwingshackl, C., Gasser, T., Houghton, R. A., Sitch, S., Canadell, J. G., Cescatti, A., Ciais, P., Federici, S., Friedlingstein, P., Kurz, W. A., Sanz Sanchez, M. J., Abad Viñas, R., Alkama, R., Bultan, S., Ceccherini, G., Falk, S., Kato, E., Kennedy, D., Knauer, J., Korosuo, A., Melo, J., McGrath, M. J., Nabel, J. E. M. S., Poulter, B., Romanovskaya, A. A., Rossi, S., Tian, H., Walker, A. P., Yuan, W., Yue, X., and Pongratz, J.: Harmonising the land-use flux estimates of global models and national inventories for 2000–2020, Earth Syst. Sci. Data, 15, 1093–1114, https://doi.org/10.5194/essd-15-1093-2023, 2023.
Guinaldo, T., Cassou, C., Sallée, J.-B., and Liné, A.: Internal variability effect doped by climate change drove the 2023 marine heat extreme in the North Atlantic, Commun. Earth Environ., 6, 291, https://doi.org/10.1038/s43247-025-02197-1, 2025.
Gulev, S. K., Thorne, P. W., Ahn, J., Dentener, F. J., Domingues, C. M., Gerland, S., Gong, D., Kaufman, D. S., Nnamchi, H. C., Quaas, J., Rivera, J. A., Sathyendranath, S., Smith, S. L., Trewin, B., von Schuckmann, K., and Vose, R. S.: Changing State of the Climate System, in: Climate Change 2021: The Physical Science Basis. Contribution of Working Group I to the Sixth Assessment Report of the Intergovernmental Panel on Climate Change, edited by: Masson-Delmotte, V., Zhai, P., Pirani, A., Connors, S. L., Péan, C., Berger, S., Caud, N., Chen, Y., Goldfarb, L., Gomis, M. I., Huang, M., Leitzell, K., Lonnoy, E., Matthews, J. B. R., Maycock, T. K., Waterfield, T., Yelekçi, O., Yu, R., and Zhou, B., Cambridge University Press, Cambridge, United Kingdom and New York, NY, USA, 287–422, https://doi.org/10.1017/9781009157896.004, 2021.
Gupta, A. K., Mittal, T., Fauria, K. E., Bennartz, R., and Kok, J. F.: The January 2022 Hunga eruption cooled the southern hemisphere in 2022 and 2023, Commun. Earth Environ., 6, 240, https://doi.org/10.1038/s43247-025-02181-9, 2025.
Gütschow, J., Jeffery, M. L., Gieseke, R., Gebel, R., Stevens, D., Krapp, M., and Rocha, M.: The PRIMAP-hist national historical emissions time series, Earth Syst. Sci. Data, 8, 571–603, https://doi.org/10.5194/essd-8-571-2016, 2016.
Gütschow, J. and Busch, D., and Pflüger, M.: The PRIMAP-hist national historical emissions time series v2.6.1 (1750–2023) (2.6.1), Zenodo [data set], https://doi.org/10.5281/zenodo.15016289, 2025.
Hakuba, M. Z., Frederikse, T., and Landerer, F. W.: Earth's energy imbalance from the ocean perspective (2005–2019), Geophys. Res. Lett., 48, e2021GL093624, https://doi.org/10.1029/2021GL093624, 2021.
Hansen, J. E., Sato, M., Simons, L., Nazarenko, L. S., Sangha, I., Kharecha, P., Zachos, J. C., von Schuckmann, K., Loeb, N. G., Osman, M. B., Jin, Q., Tselioudis, G., Jeong, E., Lacis, A., Ruedy, R., Russell, G., Cao, J., and Li, J.: Global warming in the pipeline, Oxford Open Climate Change, 3, kgad008, https://doi.org/10.1093/oxfclm/kgad008, 2023.
Hansis, E., Davis, S. J., and Pongratz, J.: Relevance of methodological choices for accounting of land use change carbon fluxes, Global Biogeochem. Cy., 29, 1230–1246, https://doi.org/10.1002/2014GB004997, 2015.
Hardy, A., Palmer, P. I., and Oakes, G.: Satellite data reveal how Sudd wetland dynamics are linked with globally-significant methane emissions, Environ. Res. Lett., 18, 074044, https://doi.org/10.1088/1748-9326/ace272, 2023.
Harris, I., Osborn, T. J., Jones, P., and Lister, D.: Version 4 of the CRU TS monthly high-resolution gridded multivariate climate dataset, Sci. Data, 7, 109, https://doi.org/10.1038/s41597-020-0453-3, 2020.
Haustein, K., Allen, M. R., Forster, P. M., Otto, F. E. L., Mitchell, D. M., Matthews, H. D., and Frame, D. J.: A real-time Global Warming Index, Sci. Rep., 7, 15417, https://doi.org/10.1038/s41598-017-14828-5, 2017.
Hay, C. C., Morrow, E., Kopp, R. E., and Mitrovica, J. X.: Probabilistic reanalysis of twentieth-century sea-level rise, Nature, 517, 481–484, https://doi.org/10.1038/nature14093, 2015.
Hersbach, H., Bell, B., Berrisford, P., Hirahara, S., Horányi, A., Muñoz-Sabater, J., Nicolas, J., Peubey, C., Radu, R., Schepers, D., Simmons, A., Soci, C., Abdalla, S., Abellan, X., Balsamo, G., Bechtold, P., Biavati, G., Bidlot, J., Bonavita, M., De Chiara, G., Dahlgren, P., Dee, D., Diamantakis, M., Dragani, R., Flemming, J., Forbes, R., Fuentes, M., Geer, A., Haimberger, L., Healy, S., Hogan, R. J., Hólm, E., Janisková, M., Keeley, S., Laloyaux, P., Lopez, P., Lupu, C., Radnoti, G., de Rosnay, P., Rozum, I., Vamborg, F., Villaume, S., and Thépaut, J.-N.: The ERA5 global reanalysis, Q. J. Roy. Meteor. Soc., 146, 1999–2049, https://doi.org/10.1002/qj.3803, 2020.
Hodnebrog, Ø., Aamaas, B., Fuglestvedt, J. S., Marston, G., Myhre, G., Nielsen, C. J., Sandstad, M., Shine, K. P., and Wallington, T. J.: Updated Global Warming Potentials and Radiative Efficiencies of Halocarbons and Other Weak Atmospheric Absorbers, Rev. Geophys., 58, e2019RG000691, https://doi.org/10.1029/2019RG000691, 2020.
Hodnebrog, Ø., Myhre, G., Jouan, C., Andrews, T., Forster, P. M., Jia, H., Loeb, N. G., Olivié, D. J. L., Paynter, D., Quaas, J., Raghuraman, S. P., and Schulz, M.: Recent reductions in aerosol emissions have increased Earth's energy imbalance, Commun. Earth Environ., 5, 166, https://doi.org/10.1038/s43247-024-01324-8, 2024.
Hoesly, R. and Smith, S.: CEDS v_2024_04_01 Release Emission Data (v_2024_04_01), Zenodo [data set], https://doi.org/10.5281/zenodo.10904361, 2024.
Hoesly, R., Smith, S. J., Ahsan, H., Prime, N., O'Rourke, P., Crippa, M., Klimont, Z., Guizzardi, D., Feng, L., Harkins, C., MCDONALD, B., and Wang, S.: CEDS v_2025_03_18 Aggregate Data (v_2025_03_18), Zenodo [data set], https://doi.org/10.5281/ZENODO.15059443, 2025.
Hoesly, R. M., Smith, S. J., Feng, L., Klimont, Z., Janssens-Maenhout, G., Pitkanen, T., Seibert, J. J., Vu, L., Andres, R. J., Bolt, R. M., Bond, T. C., Dawidowski, L., Kholod, N., Kurokawa, J.-I., Li, M., Liu, L., Lu, Z., Moura, M. C. P., O'Rourke, P. R., and Zhang, Q.: Historical (1750–2014) anthropogenic emissions of reactive gases and aerosols from the Community Emissions Data System (CEDS), Geosci. Model Dev., 11, 369–408, https://doi.org/10.5194/gmd-11-369-2018, 2018.
Houghton, R. A. and Castanho, A.: Annual emissions of carbon from land use, land-use change, and forestry from 1850 to 2020, Earth Syst. Sci. Data, 15, 2025–2054, https://doi.org/10.5194/essd-15-2025-2023, 2023.
Houghton, R. A. and Nassikas, A. A.: Global and regional fluxes of carbon from land use and land cover change 1850–2015, Global Biogeochem. Cy., 31, 456–472, https://doi.org/10.1002/2016GB005546, 2017.
Hu, Y., Yue, X., Tian, C., Zhou, H., Fu, W., Zhao, X., Zhao, Y., and Chen, Y.: Identifying the main drivers of the spatiotemporal variations in wetland methane emissions during 2001–2020, Front. Environ. Sci., 11, 1275742., https://doi.org/10.3389/fenvs.2023.1275742, 2023.
IATA: Air Passenger Monthly Analysis March 2024, https://www.iata.org/en/iata-repository/publications/economic-reports/air-passenger-market-analysis-march-2024/ (last access: 20 May 2024), 2024.
IPCC: Climate Change 2013: The Physical Science Basis. Contribution of Working Group I to the Fifth Assessment Report of the Intergovernmental Panel on Climate Change, edited by: Stocker, T. F., Qin, D., Plattner, G.-K., Tignor, M., Allen, S. K., Boschung, J., Nauels, A., Xia, Y., Bex, V., and Midgley, P. M., Cambridge University Press, Cambridge, United Kingdom and New York, NY, USA, 1535 pp., https://doi.org/10.1017/CBO9781107415324, 2013.
IPCC: Summary for Policymakers, in: Global Warming of 1.5 °C. An IPCC Special Report on the impacts of global warming of 1.5 °C above pre-industrial levels and related global greenhouse gas emission pathways, in the context of strengthening the global response to the threat of climate change, sustainable development, and efforts to eradicate poverty, edited by: Masson-Delmotte, V., Zhai, P., Pörtner, H.-O., Roberts, D., Skea, J., Shukla, P. R., Pirani, A., Moufouma-Okia, W., Péan, C., Pidcock, R., Connors, S., Matthews, J. B. R., Chen, Y., Zhou, X., Gomis, M. I., Lonnoy, E., Maycock, T., Tignor, M., and Waterfield, T., Cambridge University Press, Cambridge, UK and New York, NY, USA, 3–24, https://doi.org/10.1017/9781009157940.001, 2018.
IPCC: Climate Change 2021: The Physical Science Basis. Contribution of Working Group I to the Sixth Assessment Report of the Intergovernmental Panel on Climate Change, Cambridge University Press, Cambridge, United Kingdom and New York, NY, USA, https://doi.org/10.1017/9781009157896, 2021a.
IPCC: Summary for Policymakers, in: Climate Change 2021: The Physical Science Basis. Contribution of Working Group I to the Sixth Assessment Report of the Intergovernmental Panel on Climate Change, edited by: Masson-Delmotte, V., Zhai, P., Pirani, A., Connors, S. L., Péan, C., Berger, S., Caud, N., Chen, Y., Goldfarb, L., Gomis, M. I., Huang, M., Leitzell, K., Lonnoy, E., Matthews, J. B. R., Maycock, T. K., Waterfield, T., Yelekçi, O., Yu, R., and Zhou, B., Cambridge University Press, Cambridge, United Kingdom and New York, NY, USA, 3–32, https://doi.org/10.1017/9781009157896.001, 2021b.
IPCC: Climate Change 2022: Impacts, Adaptation, and Vulnerability. Contribution of Working Group II to the Sixth Assessment Report of the Intergovernmental Panel on Climate Change, edited by: Pörtner, H.-O., Roberts, D. C., Tignor, M., Poloczanska, E. S., Mintenbeck, K., Alegría, A., Craig, M., Langsdorf, S., Löschke, S., Möller, V., Okem, A., and Rama, B., Cambridge University Press, Cambridge University Press, Cambridge, UK and New York, NY, USA, 3056 pp., https://doi.org/10.1017/9781009325844, 2022.
IPCC: Climate Change 2023: Synthesis Report. Contribution of Working Groups I, II and III to the Sixth Assessment Report of the Intergovernmental Panel on Climate Change, edited by: Core Writing Team, Lee, H., and Romero, J., IPCC, Geneva, Switzerland., Intergovernmental Panel on Climate Change (IPCC), https://doi.org/10.59327/IPCC/AR6-9789291691647, 2023a.
IPCC: Climate Change 2023: Summary for Policy Makers. Contribution of Working Groups I, II and III to the Sixth Assessment Report of the Intergovernmental Panel on Climate Change, edited by: Core Writing Team, Lee, H., and Romero, J., IPCC, Geneva, Switzerland., Intergovernmental Panel on Climate Change (IPCC), https://doi.org/10.59327/IPCC/AR6-9789291691647, 2023b.
IPCC: Summary for Policymakers, in: Climate Change 2023: Synthesis Report, Contribution of Working Groups I, II and III to the Sixth Assessment Report of the Intergovernmental Panel on Climate Change, edited by: Core Writing Team, Lee, H., and Romero, J., IPCC, Geneva, Switzerland, 1–34, https://doi.org/10.59327/IPCC/AR6-9789291691647.001, 2023c.
IPCC: Sixty-second Session of the IPCC (IPCC-62), Fifteenth Session of the IPCC Working Group I (WGI-15), Thirteenth Session of the IPCC Working Group II (WGII-13), and Fifteenth Session of the IPCC Working Group III (WGIII-15), https://www.ipcc.ch/meeting-doc/ipcc-62/ (last access: 20 April 2025), 2025.
Iturbide, M., Fernández, J., Gutiérrez, J. M., Pirani, A., Huard, D., Al Khourdajie, A., Baño-Medina, J., Bedia, J., Casanueva, A., Cimadevilla, E., Cofiño, A. S., De Felice, M., Diez-Sierra, J., García-Díez, M., Goldie, J., Herrera, D. A., Herrera, S., Manzanas, R., Milovac, J., Radhakrishnan, A., San-Martín, D., Spinuso, A., Thyng, K. M., Trenham, C., and Yelekçi, Ö.: Implementation of FAIR principles in the IPCC: the WGI AR6 Atlas repository, Sci. Data, 9, 629, https://doi.org/10.1038/s41597-022-01739-y, 2022.
Janardanan, R., Maksyutov, S., Wang, F., Nayagam, L., Sahu, S. K., Mangaraj, P., Saunois, M., Lan, X., and Matsunaga, T.: Country-level methane emissions and their sectoral trends during 2009–2020 estimated by high-resolution inversion of GOSAT and surface observations, Environ. Res. Lett., 19, 034007, https://doi.org/10.1088/1748-9326/ad2436, 2024.
Kirchengast, G., Gorfer, M., Mayer, M., Steiner, A. K., and Haimberger, L.: GCOS EHI 1960–2020 Atmospheric Heat Content, https://doi.org/10.26050/WDCC/GCOS_EHI_1960-2020_AHC, 2022.
Kramer, R. J., He, H., Soden, B. J., Oreopoulos, L., Myhre, G., Forster, P. M., and Smith, C. J., Observational evidence of increasing global radiative forcing, Geophys. Res. Lett., 48, e2020GL091585, https://doi.org/10.1029/2020GL091585, 2021.
Lamb, W., Andrew, R., Jones, M., Nicholls, Z., Peters, G., Smith, C., Saunois, M., Grassi, G., Pongratz, J., Smith, S., Tubiello, F., Crippa, M., Gidden, M., Friedlingstein, P., Minx, J., and Forster, P.: Differences in anthropogenic greenhouse gas emissions estimates explained, Earth Syst. Sci. Data Discuss. [preprint], https://doi.org/10.5194/essd-2025-188, in review, 2025.
Lamboll, R. and Rogelj, J.: Carbon Budget Calculator, 2025, Github [code], https://github.com/Rlamboll/AR6CarbonBudgetCalc/tree/v1.0.1 (last access: 25 April 2025), 2025.
Lamboll, R. D., Nicholls, Z. R. J., Smith, C. J., Kikstra, J. S., Byers, E., and Rogelj, J.: Assessing the size and uncertainty of remaining carbon budgets, Nat. Clim. Change, 13, 1360–1367, https://doi.org/10.1038/s41558-023-01848-5, 2023.
Lan, X., Tans, P., and Thoning, K. W.: Trends in globally-averaged CO2 determined from NOAA Global Monitoring Laboratory measurements, Version Monday, 14-Apr-2025 09:08:57 MDT, Global Monitoring Laboratory [data set], https://doi.org/10.15138/9N0H-ZH07, 2025.
Laube, J., Newland, M., Hogan, C., Brenninkmeijer, A. M., Fraser, P. J., Martinerie, P., Oram, D. E., Reeves, C. E., Röckmann, T., Schwander, J., Witrant, E., and Sturges, W. T.: Newly detected ozone-depleting substances in the atmosphere, Nat. Geosci., 7, 266–269, https://doi.org/10.1038/ngeo2109, 2014.
Lee, J.-Y., Marotzke, J., Bala, G., Cao, L., Corti, S., Dunne, J. P., Engelbrecht, F., Fischer, E., Fyfe, J. C., Jones, C., Maycock, A., Mutemi, J., Ndiaye, O., Panickal, S., and Zhou, T.: Future Global Climate: Scenario-Based Projections and Near-Term Information. In Climate Change 2021: The Physical Science Basis. Contribution of Working Group I to the Sixth Assessment Report of the Intergovernmental Panel on Climate Change, edited by: Masson-Delmotte, V., Zhai, P., Pirani, A., Connors, S. L., Péan, C., Berger, S., Caud, N., Chen, Y., Goldfarb, L., Gomis, M. I., Huang, M., Leitzell, K., Lonnoy, E., Matthews, J. B. R., Maycock, T. K., Waterfield, T., Yelekçi, O., Yu, R., and Zhou, B., Cambridge University Press, Cambridge, United Kingdom and New York, NY, USA, 553–672,https://doi.org/10.1017/9781009157896.006, 2021.
Loeb, N. G., Johnson, G. C., Thorsen, T. J., Lyman, J. M., Rose, F. G., and Kato, S.: Satellite and ocean data reveal marked increase in Earth's heating rate. Geophys. Res. Lett., 48, e2021GL093047, https://doi.org/10.1029/2021GL093047, 2021.
McKenna, C. M., Maycock, A. C., Forster, P. M., Smith, C. J., and Tokarska, K. B.: Stringent mitigation substantially reduces risk of unprecedented near-term warming rates, Nat. Clim. Change, 11, 126–131, https://doi.org/10.1038/s41558-020-00957-9, 2021.
Menne, M. J., Williams, C. N., Gleason, B. E., Rennie, J. J., and Lawrimore, J. H.: The global historical climatology network monthly temperature dataset, version 4, J. Climate, 31, 9835–9854, https://doi.org/10.1175/JCLI-D-18-0094.1, 2018.
Merchant, C. J., Allan, R. P., and Embury, O.: Quantifying the acceleration of multidecadal global sea surface warming driven by Earth's energy imbalance, Environ. Res. Lett., 20, 024037, https://doi.org/10.1088/1748-9326/adaa8a, 2025.
Minière, A., von Schuckmann, K., Sallée, J.-B., and Vogt, L.: Robust acceleration of Earth system heating observed over the past six decades, Sci. Rep., 13, 22975, https://doi.org/10.1038/s41598-023-49353-1, 2023.
Minobe, S., Behrens, E., Findell, K. L., Loeb, N. G., Meyssignac, B., and Sutton, R.: Global and regional drivers for exceptional climate extremes in 2023-2024: beyond the new normal, npj Clim. Atmos. Sci., 8, 138, https://doi.org/10.1038/s41612-025-00996-z, 2025.
Minx, J. C., Lamb, W. F., Andrew, R. M., Canadell, J. G., Crippa, M., Döbbeling, N., Forster, P. M., Guizzardi, D., Olivier, J., Peters, G. P., Pongratz, J., Reisinger, A., Rigby, M., Saunois, M., Smith, S. J., Solazzo, E., and Tian, H.: A comprehensive and synthetic dataset for global, regional, and national greenhouse gas emissions by sector 1970–2018 with an extension to 2019, Earth Syst. Sci. Data, 13, 5213–5252, https://doi.org/10.5194/essd-13-5213-2021, 2021.
NASA: Satellite sea level observations, NASA Earth Data [data set], https://sealevel.nasa.gov/understanding-sea-level/key-indicators/global-mean-sea-level/ (last access: 19 February 2025), 2025.
Nisbet, E. G., Manning, M. R., Dlugokencky, E. J., Michel, S. E., Lan, X., Röckmann, T., Denier van der Gon, H. A. C., Schmitt, J., Palmer, P. I., Dyonisius, M. N., Oh, Y., Fisher, R. E., Lowry, D., France, J. L., White, J. W. C., Brailsford, G., and Bromley, T.: Atmospheric methane: Comparison between methane's record in 2006–2022 and during glacial terminations, Global Biogeochem. Cycles, 37, e2023GB007875, https://doi.org/10.1029/2023GB007875, 2023.
Nitzbon, J., Krinner, G., and Langer, M.: GCOS EHI 1960–2020 Permafrost Heat Content, World Data Center for Climate (WDCC) at DKRZ [data set], https://doi.org/10.26050/WDCC/GCOS_EHI_1960-2020_PHC, 2022.
NOAA: Global sea level timeseries, NOAA[data set], https://www.star.nesdis.noaa.gov/socd/lsa/SeaLevelRise/LSA_SLR_timeseries.php (last access: 19 February 2025), 2025.
Nogueira, M.: Inter-comparison of ERA-5, ERA-interim and GPCP rainfall over the last 40 years: Process-based analysis of systematic and random differences, J. Hydrol., 583, 124632, https://doi.org/10.1016/j.jhydrol.2020.124632, 2020.
Oppenheimer, M., Glavovic, B. C., Hinkel, J., van de Wal, R., Magnan, A. K., Abd-Elgawad, A., Cai, R., Cifuentes-Jara, M., DeConto, R. M., Ghosh, T., Hay, J., Isla, F., Marzeion, B., Meyssignac, B., and Sebesvari, Z.: Sea Level Rise and Implications for Low-Lying Islands, Coasts and Communities, in: IPCC Special Report on the Ocean and Cryosphere in a Changing Climate, edited by: Pörtner, H.-O., Roberts, D. C., Masson-Delmotte, V., Zhai, P., Tignor, M., Poloczanska, E., Mintenbeck, K., Alegría, A., Nicolai, M., Okem, A., Petzold, J., Rama, B., and Weyer, N. M., Cambridge University Press, Cambridge, UK and New York, NY, USA, 321–445, https://doi.org/10.1017/9781009157964.006, 2019.
Palmer, M. D. and McNeall, D. J.: Internal variability of Earth's energy budget simulated by CMIP5 climate models, Environ. Res. Lett., 9, 034016, https://doi.org/10.1088/1748-9326/9/3/034016, 2014.
Palmer, M. D., Domingues, C. M., Slangen, A. B. A., and Boeira Dias, F.: An ensemble approach to quantify global mean sea-level rise over the 20th century from tide gauge reconstructions, Environ. Res. Lett., 16, 044043, https://doi.org/10.1088/1748-9326/abdaec, 2021.
Pelz, S., Ganti, G., Lamboll, R., Grant, L., Smith, C., Pachauri, S., Rogelj, J., Riahi, K., Thiery, W., and Gidden, M. J.: Using net-zero carbon debt to track climate overshoot responsibility, P. Natl. Acad. Sci. USA, 122, e2409316122, https://doi.org/10.1073/pnas.2409316122, 2025.
Peng, S., Lin, X., Thompson, R. L., Xi, Y., Liu, G., Hauglustaine, D., Lan, X., Poulter, B., Ramonet, M., Saunois, M., Yin, Y., Zhang, Z., Zheng, B., and Ciais, P.: Wetland emission and atmospheric sink changes explain methane growth in 2020, Nature, 612, 477–482, https://doi.org/10.1038/s41586-022-05447-w, 2022.
Pirani, A., Alegria, A., Khourdajie, A. A., Gunawan, W., Gutiérrez, J. M., Holsman, K., Huard, D., Juckes, M., Kawamiya, M., Klutse, N., Krey, V., Matthews, R., Milward, A., Pascoe, C., Van Der Shrier, G., Spinuso, A., Stockhause, M., and Xiaoshi Xing: The implementation of FAIR data principles in the IPCC AR6 assessment process, Zenodo [data set], https://doi.org/10.5281/ZENODO.6504469, 2022.
Pongratz, J., Schwingshackl, C., Bultan, S., Obermeier, W., Havermann, F., and Guo, S.: Land Use Effects on Climate: Current State, Recent Progress, and Emerging Topics, Curr. Clim. Change Rep., 7, 99–120, https://doi.org/10.1007/s40641-021-00178-y, 2021.
Prinn, R. G., Weiss, R. F., Arduini, J., Arnold, T., DeWitt, H. L., Fraser, P. J., Ganesan, A. L., Gasore, J., Harth, C. M., Hermansen, O., Kim, J., Krummel, P. B., Li, S., Loh, Z. M., Lunder, C. R., Maione, M., Manning, A. J., Miller, B. R., Mitrevski, B., Mühle, J., O'Doherty, S., Park, S., Reimann, S., Rigby, M., Saito, T., Salameh, P. K., Schmidt, R., Simmonds, P. G., Steele, L. P., Vollmer, M. K., Wang, R. H., Yao, B., Yokouchi, Y., Young, D., and Zhou, L.: History of chemically and radiatively important atmospheric gases from the Advanced Global Atmospheric Gases Experiment (AGAGE), Earth Syst. Sci. Data, 10, 985–1018, https://doi.org/10.5194/essd-10-985-2018, 2018.
Purich, A. and Doddridge, E. W.: Record low Antarctic sea ice coverage indicates a new sea ice state, Commun. Earth Environ., 4, 314, https://doi.org/10.1038/s43247-023-00961-9, 2023.
Qin, Z., Zhu, Y., Canadell, J. G., Chen, M., Li, T., Mishra, U., and Yuan, W.: Global spatially explicit carbon emissions from land-use change over the past six decades (1961–2020), One Earth, 7, 835–847, https://doi.org/10.1016/j.oneear.2024.04.002, 2024.
Raghuraman, S. P., Paynter, D., and Ramaswamy, V.: Anthropogenic forcing and response yield observed positive trend in Earth's energy imbalance, Nat. Commun. 12, 4577, https://doi.org/10.1038/s41467-021-24544-4, 2021.
Raghuraman, S. P., Soden, B., Clement, A., Vecchi, G., Menemenlis, S., and Yang, W.: The 2023 global warming spike was driven by the El Niño–Southern Oscillation, Atmos. Chem. Phys., 24, 11275–11283, https://doi.org/10.5194/acp-24-11275-2024, 2024.
Rantanen, M. and Laaksonen, A.: The jump in global temperatures in September 2023 is extremely unlikely due to internal climate variability alone, npj Clim. Atmos. Sci., 7, 34, https://doi.org/10.1038/s41612-024-00582-9, 2024.
Ribes, A., Qasmi, S., and Gillett, N. P.: Making climate projections conditional on historical observations, Sci. Adv., 7, eabc0671, https://doi.org/10.1126/sciadv.abc0671, 2021.
Rogelj, J. and Lamboll, R. D.: Substantial reductions in non-CO2 greenhouse gas emissions reductions implied by IPCC estimates of the remaining carbon budget, Commun. Earth Environ., 5, 35, https://doi.org/10.1038/s43247-023-01168-8, 2024.
Rogelj, J., Rao, S., McCollum, D. L., Pachauri, S., Klimont, Z., Krey, V., and Riahi, K: Air-pollution emission ranges consistent with the representative concentration pathways, Nat. Clim. Chang., 4, 446–450, https://doi.org/10.1038/nclimate2178, 2014.
Rogelj, J., Shindell, D., Jiang, K., Fifita, S., Forster, P., Ginzburg, V., Handa, C., Kheshgi, H., Kobayashi, S., Kriegler, E., Mundaca, L., Séférian, R., and Vilariño, M. V.: Mitigation Pathways Compatible with 1.5 °C in the Context of Sustainable Development. In: Global Warming of 1.5 °C. An IPCC Special Report on the impacts of global warming of 1.5 °C above pre-industrial levels and related global greenhouse gas emission pathways, in the context of strengthening the global response to the threat of climate change, sustainable development, and efforts to eradicate poverty, edited by: Masson-Delmotte, V., Zhai, P., Pörtner, H.-O., Roberts, D., Skea, J., Shukla, P. R., Pirani, A., Moufouma-Okia, W., Péan, C., Pidcock, R., Connors, S., Matthews, J. B. R., Chen, Y., Zhou, X., Gomis, M. I., Lonnoy, E., Maycock, T., Tignor, M., and Waterfield, T., Cambridge University Press, Cambridge, UK and New York, NY, USA, 93–174, https://doi.org/10.1017/9781009157940.004, 2018.
Rogelj, J., Forster, P. M., Kriegler, E., Smith, C. J., and Séférian, R.: Estimating and tracking the remaining carbon budget for stringent climate targets, Nature, 571, 335–342, https://doi.org/10.1038/s41586-019-1368-z, 2019.
Rohde R., Muller R., Jacobsen R., Perlmutter S., Rosenfeld A., Wurtele, J., Curry, J., Wickham, C., and Mosher, S.: Berkeley Earth Temperature Averaging Process. Geoinfor Geostat: An Overview, 1, 2, https://doi.org/10.4172/2327-4581.1000103, 2013.
Saunois, M., Martinez, A., Poulter, B., Zhang, Z., Raymond, P. A., Regnier, P., Canadell, J. G., Jackson, R. B., Patra, P. K., Bousquet, P., Ciais, P., Dlugokencky, E. J., Lan, X., Allen, G. H., Bastviken, D., Beerling, D. J., Belikov, D. A., Blake, D. R., Castaldi, S., Crippa, M., Deemer, B. R., Dennison, F., Etiope, G., Gedney, N., Höglund-Isaksson, L., Holgerson, M. A., Hopcroft, P. O., Hugelius, G., Ito, A., Jain, A. K., Janardanan, R., Johnson, M. S., Kleinen, T., Krummel, P. B., Lauerwald, R., Li, T., Liu, X., McDonald, K. C., Melton, J. R., Mühle, J., Müller, J., Murguia-Flores, F., Niwa, Y., Noce, S., Pan, S., Parker, R. J., Peng, C., Ramonet, M., Riley, W. J., Rocher-Ros, G., Rosentreter, J. A., Sasakawa, M., Segers, A., Smith, S. J., Stanley, E. H., Thanwerdas, J., Tian, H., Tsuruta, A., Tubiello, F. N., Weber, T. S., van der Werf, G. R., Worthy, D. E. J., Xi, Y., Yoshida, Y., Zhang, W., Zheng, B., Zhu, Q., Zhu, Q., and Zhuang, Q.: Global Methane Budget 2000–2020, Earth Syst. Sci. Data, 17, 1873–1958, https://doi.org/10.5194/essd-17-1873-2025, 2025.
Scarpelli, T. R., Jacob, D. J., Grossman, S., Lu, X., Qu, Z., Sulprizio, M. P., Zhang, Y., Reuland, F., Gordon, D., and Worden, J. R.: Updated Global Fuel Exploitation Inventory (GFEI) for methane emissions from the oil, gas, and coal sectors: evaluation with inversions of atmospheric methane observations, Atmos. Chem. Phys., 22, 3235–3249, https://doi.org/10.5194/acp-22-3235-2022, 2022.
Schamm, K., Ziese, M., Becker, A., Finger, P., Meyer-Christoffer, A., Schneider, U., Schröder, M., and Stender, P.: Global gridded precipitation over land: a description of the new GPCC First Guess Daily product, Earth Syst. Sci. Data, 6, 49–60, https://doi.org/10.5194/essd-6-49-2014, 2014.
Schoeberl, M. R., Wang, Y., Taha, G., Zawada, D. J., Ueyama, R., and Dessler, A.: Evolution of the Climate Forcing During the Two Years After the Hunga Tonga-Hunga Ha'apai Eruption, J. Geophys. Res.-Atmos, 129, e2024JD041296, https://doi.org/10.1029/2024JD041296, 2024.
Schwingshackl, C., Obermeier, W. A., Bultan, S., Grassi, G., Canadell, J. G., Friedlingstein, P., Gasser, T., Houghton, R. A., Kurz, W. A., Sitch, S., and Pongratz, J.: Differences in land-based mitigation estimates reconciled by separating natural and land-use CO2 fluxes at the country level, One Earth, 5, 1367–1376, https://doi.org/10.1016/j.oneear.2022.11.009, 2022.
Seneviratne, S. I., Zhang, X., Adnan, M., Badi, W., Dereczynski, C., Di Luca, A., Ghosh, S., Iskandar, I., Kossin, J., Lewis, S., Otto, F., Pinto, I., Satoh, M., Vicente-Serrano, S. M., Wehner, M., and Zhou, B.: Weather and Climate Extreme Events in a Changing Climate, in: Climate Change 2021: The Physical Science Basis. Contribution of Working Group I to the Sixth Assessment Report of the Intergovernmental Panel on Climate Change, edited by: Masson-Delmotte, V., Zhai, P., Pirani, A., Connors, S. L., Péan, C., Berger, S., Caud, N., Chen, Y., Goldfarb, L., Gomis, M. I., Huang, M., Leitzell, K., Lonnoy, E., Matthews, J. B. R., Maycock, T. K., Waterfield, T., Yelekçi, O., Yu, R., and Zhou, B., Cambridge University Press, Cambridge, United Kingdom and New York, NY, USA, 1513–1766, https://doi.org/10.1017/9781009157896.013, 2021.
Seo, K.-W., Ryu, D., Jeon, T., Youm, K., Kim, J.-S., Oh, E. H., Chen, J., Famiglietti, J. S., and Wilson, C. R.: Abrupt sea level rise and Earth's gradual pole shift reveal permanent hydrological regime changes in the 21st century, Science, 387, 1408–1413, https://doi.org/10.1126/science.adq6529, 2025.
Simmonds, P. G., Rigby, M., McCulloch, A., O'Doherty, S., Young, D., Mühle, J., Krummel, P. B., Steele, P., Fraser, P. J., Manning, A. J., Weiss, R. F., Salameh, P. K., Harth, C. M., Wang, R. H. J., and Prinn, R. G.: Changing trends and emissions of hydrochlorofluorocarbons (HCFCs) and their hydrofluorocarbon (HFCs) replacements, Atmos. Chem. Phys., 17, 4641–4655, https://doi.org/10.5194/acp-17-4641-2017, 2017.
Sippel, S., Zscheischler, J., Heimann, M., Otto, F. E. L., Peters, J., and Mahecha, M. D.: Quantifying changes in climate variability and extremes: Pitfalls and their overcoming, Geophys. Res. Lett., 42, 9990–9998, https://doi.org/10.1002/2015GL066307, 2015.
Smith, C., Forster, P., Palmer, M., Collins, B., Leach, N., Watanabe, M., Berger, S., Hall, B., Zelinka, M., Lunt, D., Cain, M., Harris, G., and Ringer, M.: IPCC WGI AR6 Chapter 7 (v.1.0), Zenodo [code], https://doi.org/10.5281/zenodo.5211358, 2021a.
Smith, C., Nicholls, Z. R. J., Armour, K., Collins, W., Forster, P., Meinshausen, M., Palmer, M. D., and Watanabe, M.: The Earth's Energy Budget, Climate Feedbacks, and Climate Sensitivity Supplementary Material, in: Climate Change 2021: The Physical Science Basis. Contribution of Working Group I to the Sixth Assessment Report of the Intergovernmental Panel on Climate Change, edited by: Masson-Delmotte, V., Zhai, P., Pirani, A., Connors, S. L., Péan, C., Berger, S., Caud, N., Chen, Y., Goldfarb, L., Gomis, M. I., Huang, M., Leitzell, K., Lonnoy, E., Matthews, J. B. R., Maycock, T. K., Waterfield, T., Yelekçi, O., Yu, R., and Zhou, B., https://www.ipcc.ch/report/ar6/wg1/downloads/report/IPCC_AR6_WGI_Chapter07_SM.pdf (last access: 16 June 2025), 2021b.
Smith, C., Walsh, T., Gillett, N., Hall, B., Hauser, M., Krummel, P., Lamb, W., Lamboll, R., Muhle, J., Palmer, M., Ribes, A., Seneviratne, S., Trewin, B., von Schuckmann, K., and Forster, P.: ClimateIndicator/data: Indicators of Global Climate Change 2024 submission (v2025.06.11), Zenodo [data set], https://doi.org/10.5281/zenodo.15639576, 2025a.
Smith, C., Walsh, T., Gillett, N., Hall, B., Hauser, M., Krummel, P., Lamb, W., Lamboll, R., X., Muhle, J., Palmer, M., Ribes, A., Seneviratne, S., Trewin, B., von Schuckmann, K., and Forster, P.: Data repository for Indicators of Global Climate Change, Github [code], https://github.com/ClimateIndicator/data/tree/v2025.06.11 (last access: 11 June 2025), 2025b.
Smith, S. J., van Aardenne, J., Klimont, Z., Andres, R. J., Volke, A., and Delgado Arias, S.: Anthropogenic sulfur dioxide emissions: 1850–2005, Atmos. Chem. Phys., 11, 1101–1116, https://doi.org/10.5194/acp-11-1101-2011, 2011.
Soulie, A., Granier, C., Darras, S., Zilbermann, N., Doumbia, T., Guevara, M., Jalkanen, J.-P., Keita, S., Liousse, C., Crippa, M., Guizzardi, D., Hoesly, R., and Smith, S. J.: Global anthropogenic emissions (CAMS-GLOB-ANT) for the Copernicus Atmosphere Monitoring Service simulations of air quality forecasts and reanalyses, Earth Syst. Sci. Data, 16, 2261–2279, https://doi.org/10.5194/essd-16-2261-2024, 2024.
Storto, A. and Yang, C.: Acceleration of the ocean warming from 1961 to 2022 unveiled by large-ensemble reanalyses, Nat. Commun., 15, 545, https://doi.org/10.1038/s41467-024-44749-7, 2024.
Sun, Q., Miao, C., Duan, Q., Ashouri, H., Sorooshian, S., and Hsu, K.-L.: A review of global precipitation data sets: Data sources, estimation, and intercomparisons, Rev. Geophys., 56, 79–107, https://doi.org/10.1002/2017RG000574, 2018.
Szopa, S., Naik, V., Adhikary, B., Artaxo, P., Berntsen, T., Collins, W. D., Fuzzi, S., Gallardo, L., Kiendler-Scharr, A., Klimont, Z., Liao, H., Unger, N., and Zanis, P.: Short-Lived Climate Forcers. In Climate Change 2021: The Physical Science Basis. Contribution of Working Group I to the Sixth Assessment Report of the Intergovernmental Panel on Climate Change, edited by: Masson-Delmotte, V., Zhai, P., Pirani, A., Connors, S. L., Péan, C., Berger, S., Caud, N., Chen, Y., Goldfarb, L., Gomis, M. I., Huang, M., Leitzell, K., Lonnoy, E., Matthews, J. B. R., Maycock, T. K., Waterfield, T., Yelekçi, O., Yu, R., and Zhou, B., Cambridge University Press, Cambridge, United Kingdom and New York, NY, USA, 817–922, https://doi.org/10.1017/9781009157896.008, 2021.
Terhaar, J., Burger, F. A., Vogt, L., Frölicher, T. L., and Stocker, T. F.: Record sea surface temperature jump in 2023–2024 unlikely but not unexpected, Nature, 639, 942–946, https://doi.org/10.1038/s41586-025-08674-z, 2025.
Tibrewal, K., Ciais, P., Saunois, M., Martinez, A., Lin, X., Thanwerdas, J., Deng, Z., Chevallier, F., Giron, C., Albergel, C., Tanaka, K., Patra, P., Tsuruta, A., Zheng, B., Belikov, D., Niwa, Y., Janardanan, R., Maksyutov, S., Segers, A., Tzompa-Sosa, Z. A., Bousquet, P., and Sciare, J.: Assessment of methane emissions from oil, gas and coal sectors across inventories and atmospheric inversions, Commun. Earth Environ., 5, 26, https://doi.org/10.1038/s43247-023-01190-w, 2024.
Trewin, B.: Assessing Internal Variability of Global Mean Surface Temperature From Observational Data and Implications for Reaching Key Thresholds, J. Geophys. Res.-Atmos, 127, e2022JD036747, https://doi.org/10.1029/2022JD036747, 2022.
Tselioudis, G., Rossow, W. B., Bender, F., Oreopoulos, L., and Remillard, J.: Oceanic cloud trends during the satellite era and their radiative signatures, Clim. Dynam., 62, 9319–9332, https://doi.org/10.1007/s00382-024-07396-8, 2024.
Vakilifard, N., Williams, R. G., Holden, P. B., Turner, K., Edwards, N. R., and Beerling, D. J.: Impact of negative and positive CO2 emissions on global warming metrics using an ensemble of Earth system model simulations, Biogeosciences, 19, 4249–4265, https://doi.org/10.5194/bg-19-4249-2022, 2022.
Vanderkelen, I. and Thiery, W.: GCOS EHI 1960–2020 Inland Water Heat Content, WDC Climate, https://doi.org/10.26050/WDCC/GCOS_EHI_1960-2020_IWHC, 2022.
van der Werf, G. R., Randerson, J. T., Giglio, L., van Leeuwen, T. T., Chen, Y., Rogers, B. M., Mu, M., van Marle, M. J. E., Morton, D. C., Collatz, G. J., Yokelson, R. J., and Kasibhatla, P. S.: Global fire emissions estimates during 1997–2016, Earth Syst. Sci. Data, 9, 697–720, https://doi.org/10.5194/essd-9-697-2017, 2017.
Vimont, I. J., Hall, B. D., Dutton, G., Montzka, S. A., Mühle, J., Crotwell, M., Petersen, K., Clingan, S., and Nance, D.: in “State of the Climate in 2022”, B. Am. Meteorol. Soc., 104, S76–S78, https://doi.org/10.1175/BAMS-D-23-0090.1., 2022.
Vollmer, M. K., Young, D., Trudinger, C. M., Mühle, J., Henne, S., Rigby, M., Park, S., Li, S., Guillevic, M., Mitrevski, B., Harth, C. M., Miller, B. R., Reimann, S., Yao, B., Steele, L. P., Wyss, S. A., Lunder, C. R., Arduini, J., McCulloch, A., Wu, S., Rhee, T. S., Wang, R. H. J., Salameh, P. K., Hermansen, O., Hill, M., Langenfelds, R. L., Ivy, D., O'Doherty, S., Krummel, P. B., Maione, M., Etheridge, D. M., Zhou, L., Fraser, P. J., Prinn, R. G., Weiss, R. F., and Simmonds, P. G.: Atmospheric histories and emissions of chlorofluorocarbons CFC-13 (CClF3), ΣCFC-114 (C2Cl2F4), and CFC-115 (C2ClF5), Atmos. Chem. Phys., 18, 979–1002, https://doi.org/10.5194/acp-18-979-2018, 2018.
von Schuckmann, K., Cheng, L., Palmer, M. D., Hansen, J., Tassone, C., Aich, V., Adusumilli, S., Beltrami, H., Boyer, T., Cuesta-Valero, F. J., Desbruyères, D., Domingues, C., García-García, A., Gentine, P., Gilson, J., Gorfer, M., Haimberger, L., Ishii, M., Johnson, G. C., Killick, R., King, B. A., Kirchengast, G., Kolodziejczyk, N., Lyman, J., Marzeion, B., Mayer, M., Monier, M., Monselesan, D. P., Purkey, S., Roemmich, D., Schweiger, A., Seneviratne, S. I., Shepherd, A., Slater, D. A., Steiner, A. K., Straneo, F., Timmermans, M.-L., and Wijffels, S. E.: Heat stored in the Earth system: where does the energy go?, Earth Syst. Sci. Data, 12, 2013–2041, https://doi.org/10.5194/essd-12-2013-2020, 2020.
von Schuckmann, K., Minière, A., Gues, F., Cuesta-Valero, F. J., Kirchengast, G., Adusumilli, S., Straneo, F., Ablain, M., Allan, R. P., Barker, P. M., Beltrami, H., Blazquez, A., Boyer, T., Cheng, L., Church, J., Desbruyeres, D., Dolman, H., Domingues, C. M., García-García, A., Giglio, D., Gilson, J. E., Gorfer, M., Haimberger, L., Hakuba, M. Z., Hendricks, S., Hosoda, S., Johnson, G. C., Killick, R., King, B., Kolodziejczyk, N., Korosov, A., Krinner, G., Kuusela, M., Landerer, F. W., Langer, M., Lavergne, T., Lawrence, I., Li, Y., Lyman, J., Marti, F., Marzeion, B., Mayer, M., MacDougall, A. H., McDougall, T., Monselesan, D. P., Nitzbon, J., Otosaka, I., Peng, J., Purkey, S., Roemmich, D., Sato, K., Sato, K., Savita, A., Schweiger, A., Shepherd, A., Seneviratne, S. I., Simons, L., Slater, D. A., Slater, T., Steiner, A. K., Suga, T., Szekely, T., Thiery, W., Timmermans, M.-L., Vanderkelen, I., Wjiffels, S. E., Wu, T., and Zemp, M.: Heat stored in the Earth system 1960–2020: where does the energy go?, Earth Syst. Sci. Data, 15, 1675–1709, https://doi.org/10.5194/essd-15-1675-2023, 2023.
Wang, J., Church, J. A., Zhang, X., and Chen, X.: Improved Sea Level Reconstruction from 1900 to 2019, J. Climate, 37, 6453–6474, https://doi.org/10.1175/JCLI-D-23-0410.1, 2024.
WCRP Global Sea Level Budget Group: Global sea-level budget 1993–present, Earth Syst. Sci. Data, 10, 1551–1590, https://doi.org/10.5194/essd-10-1551-2018, 2018.
Western, L. M., Vollmer, M. K., Krummel, P. B., Adcock, K. E., Fraser, P. J., Harth, C. M., Langenfelds, R. L., Montzka, S. A., Mühle, J., O'Doherty, S., Oram, D. E., Reimann, S., Rigby, M., Vimont, I., Weiss, R. F., Young, D., and Laube, J. C.: Global increase of ozone-depleting chlorofluorocarbons from 2010 to 2020, Nat. Geosci., 16, 309–313, https://doi.org/10.1038/s41561-023-01147-w, 2023.
Western, L. M., Daniel, J. S., Vollmer, M. K., Clingan, S., Crotwell, M., Fraser, P. J., Ganesan, A. L., Hall, B., Harth, C. M., Krummel, P. B., Mühle, J., O'Doherty, S., Salameh, P. K., Stanley, K. M., Reimann, S., Vimont, I., Young, D., Rigby, M., Weiss, R. F., Prinn, R. G., and Montzka, S. A.: A decrease in radiative forcing and equivalent effective chlorine from hydrochlorofluorocarbons, Nat. Clim. Chang., 14, 805–807, https://doi.org/10.1038/s41558-024-02038-7, 2024.
Wild, M., Gilgen, H., Roesch, A., Ohmura, A., Long, C. N., Dutton, E. G., Forgan, B., Kallis, A., Russak, V., and Tsvetkov, A.: From Dimming to Brightening: Decadal Changes in Solar Radiation at Earth's Surface, Science, 308, 847–850, https://doi.org/10.1126/science.1103215, 2005.
World Meteorological Organization (WMO): State of the Global Climate 2024, WMO-No. 1368, ISBN 978-92-63-11368-5, 2025.
Zhang, Z., Poulter, B., Feldman, A.F., Ying, Q., Ciais, P., Peng, S., and Xin, L.: Recent intensification of wetland methane feedback, Nat. Clim. Chang., 13, 430–433, https://doi.org/10.1038/s41558-023-01629-0, 2023.
Zickfeld, K., Azevedo, D., Mathesius, S., and Matthews, H. D.: Asymmetry in the climate–carbon cycle response to positive and negative CO2 emissions, Nat. Clim. Chang., 11, 613–617, https://doi.org/10.1038/s41558-021-01061-2, 2021.
PRIMAP is a synthetic dataset that includes two time series: PRIMAP Hist-TP, which is compiled from other underlying products such as EDGAR, and PRIMAP Hist-CR, which prioritises data from national inventories but gap-fills these where necessary.
- Abstract
- Introduction
- Greenhouse gas emissions
- Well-mixed greenhouse gas concentrations
- Non-methane short-lived climate forcers
- Effective radiative forcing (ERF)
- Earth energy imbalance (EEI)
- Observed surface temperature change
- Human contribution to surface temperature change
- Remaining carbon budget
- Indicator of climate and weather extremes: land average maximum temperatures
- Global land precipitation
- Global mean sea-level rise
- Code and data availability
- Discussion and conclusions
- Author contributions
- Competing interests
- Disclaimer
- Acknowledgements
- Financial support
- Review statement
- References
- Supplement
The requested paper has a corresponding corrigendum published. Please read the corrigendum first before downloading the article.
- Article
(7612 KB) - Full-text XML
- Abstract
- Introduction
- Greenhouse gas emissions
- Well-mixed greenhouse gas concentrations
- Non-methane short-lived climate forcers
- Effective radiative forcing (ERF)
- Earth energy imbalance (EEI)
- Observed surface temperature change
- Human contribution to surface temperature change
- Remaining carbon budget
- Indicator of climate and weather extremes: land average maximum temperatures
- Global land precipitation
- Global mean sea-level rise
- Code and data availability
- Discussion and conclusions
- Author contributions
- Competing interests
- Disclaimer
- Acknowledgements
- Financial support
- Review statement
- References
- Supplement