the Creative Commons Attribution 4.0 License.
the Creative Commons Attribution 4.0 License.
 | 08 Jun 2023
Indicators of Global Climate Change 2022: annual update of large-scale indicators of the state of the climate system and human influence
Christopher J. Smith
Tristram Walsh
William F. Lamb
Robin Lamboll
Mathias Hauser
Aurélien Ribes
Debbie Rosen
Nathan Gillett
Matthew D. Palmer
Joeri Rogelj
Karina von Schuckmann
Sonia I. Seneviratne
Blair Trewin
Xuebin Zhang
Myles Allen
Robbie Andrew
Arlene Birt
Alex Borger
Tim Boyer
Jiddu A. Broersma
Lijing Cheng
Frank Dentener
Pierre Friedlingstein
José M. Gutiérrez
Johannes Gütschow
Bradley Hall
Masayoshi Ishii
Stuart Jenkins
June-Yi Lee
Colin Morice
Christopher Kadow
John Kennedy
Rachel Killick
Jan C. Minx
Vaishali Naik
Glen P. Peters
Anna Pirani
Julia Pongratz
Carl-Friedrich Schleussner
Sophie Szopa
Peter Thorne
Robert Rohde
Maisa Rojas Corradi
Dominik Schumacher
Russell Vose
Kirsten Zickfeld
Valérie Masson-Delmotte
Panmao Zhai
Intergovernmental Panel on Climate Change (IPCC) assessments are the trusted source of scientific evidence for climate negotiations taking place under the United Nations Framework Convention on Climate Change (UNFCCC), including the first global stocktake under the Paris Agreement that will conclude at COP28 in December 2023. Evidence-based decision-making needs to be informed by up-to-date and timely information on key indicators of the state of the climate system and of the human influence on the global climate system. However, successive IPCC reports are published at intervals of 5–10 years, creating potential for an information gap between report cycles.
We follow methods as close as possible to those used in the IPCC Sixth Assessment Report (AR6) Working Group One (WGI) report. We compile monitoring datasets to produce estimates for key climate indicators related to forcing of the climate system: emissions of greenhouse gases and short-lived climate forcers, greenhouse gas concentrations, radiative forcing, surface temperature changes, the Earth's energy imbalance, warming attributed to human activities, the remaining carbon budget, and estimates of global temperature extremes. The purpose of this effort, grounded in an open data, open science approach, is to make annually updated reliable global climate indicators available in the public domain (https://doi.org/10.5281/zenodo.8000192, Smith et al., 2023a). As they are traceable to IPCC report methods, they can be trusted by all parties involved in UNFCCC negotiations and help convey wider understanding of the latest knowledge of the climate system and its direction of travel.
The indicators show that human-induced warming reached 1.14 [0.9 to 1.4] ∘C averaged over the 2013–2022 decade and 1.26 [1.0 to 1.6] ∘C in 2022. Over the 2013–2022 period, human-induced warming has been increasing at an unprecedented rate of over 0.2 ∘C per decade. This high rate of warming is caused by a combination of greenhouse gas emissions being at an all-time high of 54 ± 5.3 GtCO2e over the last decade, as well as reductions in the strength of aerosol cooling. Despite this, there is evidence that increases in greenhouse gas emissions have slowed, and depending on societal choices, a continued series of these annual updates over the critical 2020s decade could track a change of direction for human influence on climate.
- Article
(5176 KB) - Full-text XML
- Version 2023
- Version 2024
- Version 2025
-
Supplement
(1171 KB) - BibTeX
- EndNote


Increased greenhouse gas concentrations combined with reductions in aerosol pollution have led to rapid increases in human-induced effective radiative forcing, which has in turn led to atmosphere, land, cryosphere and ocean warming (Gulev et al., 2021). This in turn has led to an intensification of many weather and climate extremes, particularly more frequent and more intense hot extremes, and heavy precipitation across most regions of the world (Seneviratne et al., 2021). Given the speed of recent change, and the need for evidence-based decision-making, this Indicators of Global Climate Change (IGCC) update assembles the latest scientific understanding on the current state and evolution of the climate system and of human influence to support policymakers whilst the next Intergovernmental Panel on Climate Change (IPCC) assessment is under preparation. This first annual update is focused on indicators related to heating of the climate system, building from greenhouse gas emissions towards estimates of human-induced warming and the remaining carbon budget. In future years, this effort could be expanded to encompass other indicators, including global precipitation changes and related extremes.
We adopt the Global Carbon Budget ethos of a community-wide inclusive effort that synthesises work from across a large and diverse global scientific community in a timely fashion (Friedlingstein et al., 2022a). Like the Global Carbon Budget, this initiative arises from the international science community to establish a knowledge base to support policy debate and action to meet the Paris Agreement temperature goal.
This update complements other international efforts under the auspices of the Global Climate Observing System (GCOS) and the World Meteorological Organization (WMO). Annual state-of-the-climate reports are released by the WMO which use much of the same data analysed here for surface temperature and energy budget trends. The Bulletin of American Meteorological Society (BAMS) releases annual state-of-the-climate reports covering many essential variables including temperature and greenhouse gas concentrations. However, these reports focus on statistics from the previous year and make slightly different choices over datasets and analysis compared to the IPCC (see Sect. 5). The Global Carbon Project publishes updated carbon dioxide datasets which are used directly in this report. There is no similarly structured activity that provides all the necessary datasets to update the assessment of human influence on global surface temperature annually.
The update is based on methodologies for key climate indicators assessed by the IPCC Sixth Assessment Report (AR6) of the physical science basis of climate change (Working Group One (WGI) report; IPCC, 2021a) as well as Chap. 2 of the WGIII report (Dhakal et al., 2022) and is aligned with the efforts initiated in AR6 to implement FAIR (Findable, Accessible, Interoperable, Reusable) principles for reproducibility and reusability (Pirani et al., 2022; Iturbide et al., 2022). IPCC reports make a much wider assessment of the science and methodologies – we do not attempt to reproduce the comprehensive nature of these IPCC assessments here.
The IPCC Special Report on Global Warming of 1.5 ∘C (SR1.5), published in 2018, provided an assessment of the level of human-induced warming and cumulative emissions to date (Allen et al., 2018) and the remaining carbon budget (Rogelj et al., 2018) to support the evidence base on how the world is progressing in terms of meeting aspects of the Paris Agreement. The AR6 WGI Report, published in 2021, assessed past, current and future changes of these and other key global climate indicators, as well as undertaking an assessment of the Earth's energy budget. It also updated its approach for estimating human-induced warming and global warming level. In AR6 WGI and here, reaching a level of global warming is defined as the global surface temperature change, averaged over a 20-year period, exceeding a particular level of global warming, for example, 1.5 ∘C global warming. Given the current rates of change and the likelihood of reaching 1.5 ∘C of global warming in the first half of the 2030s (Lee et al., 2021, 2023; Riahi et al., 2022), it is important to have robust, trusted and also timely climate indicators in the public domain to form an evidence base for effective science-based decision-making.
When making their assessments, authors of IPCC reports assess published literature but also apply established published analysis methods to assessed datasets, such as the dataset produced by the latest climate model intercomparison projects (Lee et al., 2021). The authors combine and analyse both model and observational data as part of their expert assessment, making assessments of the trustworthiness and error characteristics of different datasets. It is this synthetic analysis by IPCC authors that derives the estimates of key climate indicators. Wherever possible, these same assessed methodological approaches are implemented here to provide the updates with variations clearly flagged and documented. The same approach, using the same datasets (updated by 2 years) and methods as employed in WGI, was used in the AR6 Synthesis Report (2023) (AR6 SYR; Lee et al., 2023) to provide an updated assessment of the latest atmospheric well-mixed greenhouse gas concentrations (up to 2021) and decadal average change in global surface temperature (+1.15 ∘C [1.00–1.25 ∘C] in 2013–2022 for global surface temperature). However, the assessment of human-induced warming was not updated (and therefore only covers warming up to the decade 2010–2019), nor was the remaining carbon budget updated, so the related information in the AR6 SYR report remained based on data up to the end of 2019.
The indicators in this first annual update give important insights into the magnitude and the pace of global warming. This paper provides the basis for a dashboard of climate indicators grounded in IPCC methodologies and directly traceable to reports published as part of the AR6 cycle. We employ datasets that can be updated on a regular basis between the publication of IPCC reports. Note that there are other similar initiatives underway to update other AR6 cycle products; for example, the evolution of the WGI Interactive Atlas (Gutiérrez et al., 2021) is being developed under the Copernicus Climate Change Service (C3S) and has potential connections and synergies with this initiative that will be explored in the future.
Our longer-term ambition is to rigorously track both climate system change and methodological improvements between IPCC report cycles, thereby building consistency and awareness. An example of why tracking methodological change is important was the updated estimate for historic warming (the increase in global surface temperature from 1850–1900 to 1986–2005). This was 0.08 [−0.01 to 0.12] ∘C higher in the AR6 than in the fifth assessment report (AR5) and SR1.5. Datasets and methods of evaluating global temperature changes altered between the AR5 and AR6, leading to a small shift in the historical temperature. This was reflected in changes between AR5 and AR6, whereas SR1.5 mostly relied on methodologies from AR5 (see AR6 WGI Cross Chap. Box 2.3, Gulev et al., 2021). Annual updates provide indications of possible future methodological shifts that subsequent IPCC reports may make as science advances and can detail their impact on perceived trends.
The update is organised as follows: emissions (Sect. 2) and greenhouse gas (GHG) concentrations (Sect. 3) are used to develop updated estimates of effective radiative forcing (Sect. 4). Observations of global surface temperature change (Sect. 5) and Earth's energy imbalance (Sect. 6) are key global indicators of a warming world. The global surface temperature change is formally attributed to human activity in Sect. 7, which tracks human-induced warming. Section 8 updates the remaining carbon budget to policy-relevant temperature thresholds. Section 9 gives an example of global-scale indicators associated with climate extremes of maximum land surface temperatures.
An important purpose of the exercise is to make these indicators widely available and understood. Plans for a web dashboard are discussed in Sect. 10 and code and data availability in Sect. 11, and conclusions are presented in Sect. 12. Data are available at https://doi.org/10.5281/zenodo.8000192 (Smith et al., 2023a).
Historic emissions from human activity were assessed in both AR6 WGI and WGIII. Chapter 5 of WGI assessed CO2 and CH4 emissions in the context of the carbon cycle (Canadell et al., 2021). Chapter 6 of WGI assessed emissions in the context of understanding the climate and air quality impacts of short-lived climate forcers (Szopa et al., 2021). Chapter 2 of WGIII, published 1 year later (Dhakal et al., 2022), looked at the sectoral sources of emissions and gave the most up-to-date understanding of the current level of emissions. This section bases its methods and data on those employed in this WGIII chapter.
2.1 Methods of estimating greenhouse gas emissions changes
Like in AR6 WGIII, net GHG emissions in this paper refer to releases of GHGs from anthropogenic sources minus removals by anthropogenic sinks, for those species of gases that are reported under the common reporting format of the UNFCCC. This includes CO2 emissions from fossil fuels and industry (CO2-FFI); net CO2 emissions from land use, land-use change and forestry (CO2-LULUCF); CH4; N2O; and fluorinated gas (F-gas) emissions. CO2-FFI mainly comprises fossil-fuel combustion emissions, as well as emissions from industrial processes such as cement production. This excludes biomass and biofuel use by industry. CO2-LULUCF is mainly driven by deforestation but also includes anthropogenic removals on land from afforestation and reforestation, emissions from logging and forest degradation, and emissions and removals in shifting cultivation cycles, as well as emissions and removals from other land-use change and land management activities, including peat burning and drainage. The non-CO2 GHGs – CH4, N2O and F-gas emissions – are linked to the fossil-fuel extraction, agriculture, industry and waste sectors.
Global regulatory conventions have led to a twofold categorisation of F-gas emissions (also known as halogenated gases). Under UNFCCC accounting, countries record emissions of hydrofluorocarbons (HFCs), perfluorocarbons (PFCs), sulfur hexafluoride (SF6) and nitrogen trifluoride (NF3) – hereinafter “UNFCCC F-gases”. However, national inventories tend to exclude halons, chlorofluorocarbons (CFCs) and hydrochlorofluorocarbons (HCFCs) – hereinafter “ODS (ozone-depleting substance) F-gases” – as they have been initially regulated under the Montreal Protocol and its amendments. In line with the WGIII assessment, ODS F-gases and other substances, including ozone and aerosols, are not included in our GHG emissions reporting but are included in subsequent assessments of concentrations, effective radiative forcing, human-induced warming, carbon budgets and climate impacts in line with the WGI assessment.
There are also varying conventions used to quantify CO2-LULUCF fluxes. These include the use of bookkeeping models, dynamic global vegetation models (DGVMs) and the national inventory approach (Pongratz et al., 2021). Each differs in terms of their applied system boundaries and definitions and is not directly comparable. However, efforts to “translate” between bookkeeping estimates and national inventories using DGVMs have demonstrated a degree of consistency between the varying approaches (Friedlingstein et al., 2022a; Grassi et al., 2023).
Each category of GHG emissions included here is covered by varying primary sources and datasets. Although many datasets cover individual categories, few extend across multiple categories, and only a minority have frequent and timely update schedules. Notable datasets include the Global Carbon Budget (GCB; Friedlingstein et al., 2022b), which covers CO2-FFI and CO2-LULUCF; the Emissions Database for Global Atmospheric Research (EDGAR; Crippa et al., 2022) and the Potsdam Real-time Integrated Model for probabilistic Assessment of emissions Paths (PRIMAP-hist; Gütschow et al., 2016; Gütschow and Pflüger 2023), which cover CO2-FFI, CH4, N2O and UNFCCC F-gases; and the Community Emissions Data System (CEDS; O'Rourke et al., 2021), which covers CO2-FFI, CH4, and N2O. As detailed below, not all these datasets were employed in this update.
In AR6 WGIII, total net GHG emissions were calculated as the sum of CO2-FFI, CH4, N2O and UNFCCC F-gases from EDGAR and net CO2-LULUCF emissions from the GCB. Net CO2-LULUCF emissions followed the GCB convention and were derived from the average of three bookkeeping models (Hansis et al., 2015; Houghton and Nassikas, 2017; Gasser et al., 2020). Version 6 of EDGAR was used (with a fast-track methodology applied for the final year of data – 2019), alongside the 2020 version of the GCB (Friedlingstein et al., 2020). CO2-equivalent emissions were calculated using global warming potentials with a 100-year time horizon from AR6 WGI Chap. 7 (Forster et al., 2021). Uncertainty ranges were based on a comparative assessment of available data and expert judgement, corresponding to a 90 % confidence interval (Minx et al., 2021): ±8 % for CO2-FFI, ±70 % for CO2-LULUCF, ±30 % for CH4 and F-gases, and ±60 % for N2O (note that the GCB assesses 1 standard deviation uncertainty for CO2-FFI as ±5 % and for CO2-LULUCF as ±2.6 GtCO2; Friedlingstein et al., 2022a). The total uncertainty was summed in quadrature, assuming independence of estimates per species/source. Reflecting these uncertainties, AR6 WGIII reported emissions to two significant figures only. Uncertainties in GWP100 metrics were not applied (Minx et al., 2021).
This analysis tracks the same compilation of GHGs as in AR6 WGIII. We follow the same approach for estimating uncertainties and CO2-equivalent emissions. We also use the same type of data sources but make important changes to the specific selection of data sources to further improve the quality of the data, as suggested in the knowledge gap discussion of the WGIII report (Dhakal et al., 2022). Instead of using EDGAR data (which are now available as version 7), we use GCB data for CO2-FFI, PRIMAP-hist data for CH4 and N2O, and atmospheric concentrations with best-estimate lifetimes for UNFCCC F-gas emissions (Hodnebrog et al., 2020). As in AR6 WGIII we use GCB for net CO2-LULUCF emissions, taking the average of three bookkeeping models.
There are three reasons for these specific data choices. First, national greenhouse gas emissions inventories tend to use improved, higher-tier methods for estimating emissions fluxes than global inventories such as EDGAR or CEDS (Dhakal et al., 2022; Minx et al., 2021). As GCB and PRIMAP-hist integrate the most recent national inventory submissions to the UNFCCC, selecting these databases makes best use of country-level improvements in data-gathering infrastructures. Second, comprehensive reporting of F-gas emissions has remained challenging in national inventories and may exclude some military applications (see Minx et al., 2021; Dhakal et al., 2022). However, F-gases are entirely anthropogenic substances, and their concentrations can be measured effectively and reliably in the atmosphere. We therefore follow the AR6 WGI approach in making use of direct atmospheric observations. Third, the choice of GCB data for CO2-FFI means we can integrate its projection of that year's CO2 emissions at the time of publication (i.e. for 2022). No other dataset except GCB provides projections of CO2 emissions on this time frame. At this point in the publication cycle (mid-year), the other chosen sources provide data points with a 2-year time lag (i.e. for 2021). While these data choices inform our overall assessment of GHG emissions, we provide a comparison across datasets for each emissions category, as well as between our estimates and an estimate derived from AR6 WGIII-like databases (i.e. EDGAR for CO2-FFI and non-CO2 GHG emissions, GCB for CO2-LULUCF).
2.2 Updated global greenhouse gas emissions
Total global GHG emissions reached 55 ± 5.2 GtCO2e in 2021. The main contributing sources were CO2-FFI (37 ± 3 GtCO2), CO2-LULUCF (3.9 ± 2.8 GtCO2), CH4 (8.9 ± 2.7 GtCO2e), N2O (2.9 ± 1.8 GtCO2e) and F-gas emissions (2 ± 0.59 GtCO2e). GHG emissions rebounded in 2021, following a single-year decline during the COVID-19-induced lockdowns of 2020. Prior to this event in 2019, emissions were 55 ± 5.4 GtCO2e – i.e. almost the same level as in 2021. Initial projections indicate that CO2 emissions from fossil fuel and industry and land-use change remained similar in 2022, at 37 ± 3 and 3.9 ± 2.8 GtCO2, respectively (Friedlingstein et al., 2022a). Note that ODS F-gases such as chlorofluorocarbons and hydrochlorofluorocarbons are excluded from national GHG emissions inventories. For consistency with AR6, they are also excluded here. Including them here would increase total global GHG emissions by 1.6 GtCO2e in 2021.
Average GHG emissions for the decade 2012–2021 were 54 ± 5.3 GtCO2e. Average decadal GHG emissions have increased steadily since the 1970s across all major groups of GHGs, driven primarily by increasing CO2 emissions from fossil fuel and industry but also rising emissions of CH4 and N2O. UNFCCC F-gas emissions have grown more rapidly than other greenhouse gases reported under the UNFCCC but from low levels. By contrast, ODS F-gas emissions have declined substantially since the 1990s. Both the magnitude and trend of CO2 emissions from land-use change remain highly uncertain, with the latest data indicating an average net flux between 4–5 GtCO2 yr−1 for the past few decades.
AR6 WGIII reported total net anthropogenic emissions of 59 ± 6.6 GtCO2e in 2019 and decadal average emissions of 56 ± 6.0 GtCO2e from 2010–2019. By comparison, our estimates here for the AR6 period sum to 55 ± 5.4 GtCO2e in 2019 and 53 ± 5.3 GtCO2e for the same decade (2010–2019). The difference between these figures, including the reduced relative uncertainty range, is partly driven by the substantial revision in GCB CO2-LULUCF estimates between the 2020 version (used in AR6 WGIII) of 6.6 GtCO2 and the 2022 version (used here) of 4.6 GtCO2. The main reason for this downward revision comes from updated estimates of agricultural areas by the FAO and uses multi-annual land-cover maps from satellite remote sensing, leading to lower emissions from cropland expansion, particularly in the tropical regions. It is important to note that this change is not a reflection of changed and improved methodology per se but an update of the resulting estimation due to updates in the available input data. Second, there are relatively small changes resulting from improvements in datasets since AR6, with the direction of changes depending on the considered gases. CH4 accounts for the largest of these at −1.8 GtCO2e in 2019, which is related to the switch from EDGAR in AR6 to PRIMAP-hist in this study. EDGAR estimates considerably higher CH4 emissions – from fugitive fossil sources, as well as the livestock, rice cultivation and waste sectors – compared to country-reported data using higher tier methods, as compiled in PRIMAP-hist. Generally, uncertainty in these sectors is relatively high as calculations are based on activity data and assumed emissions factors which are hard to determine and vary greatly over countries. Differences in the remaining gases for 2019 are relatively small in magnitude (increases in N2O (+0.18 GtCO2e) and UNFCCC-F-gases (+0.48 GtCO2e) and decreases in CO2-FFI (−0.8 GtCO2e)). Overall, excluding the change due to CO2-LULUCF and CH4, they impact the total GHG emissions estimate by −0.14 GtCO2e.
New literature not available at the time of the AR6 suggests that increases in atmospheric methane concentrations are also driven by methane emissions from wetland changes resulting from climate change (e.g. Basu et al., 2022; Peng et al., 2022; Nisbet et al., 2023; Zhang et al., 2023). Such carbon cycle feedbacks are not considered here, as we focus on estimates of emissions resulting directly from human activities.
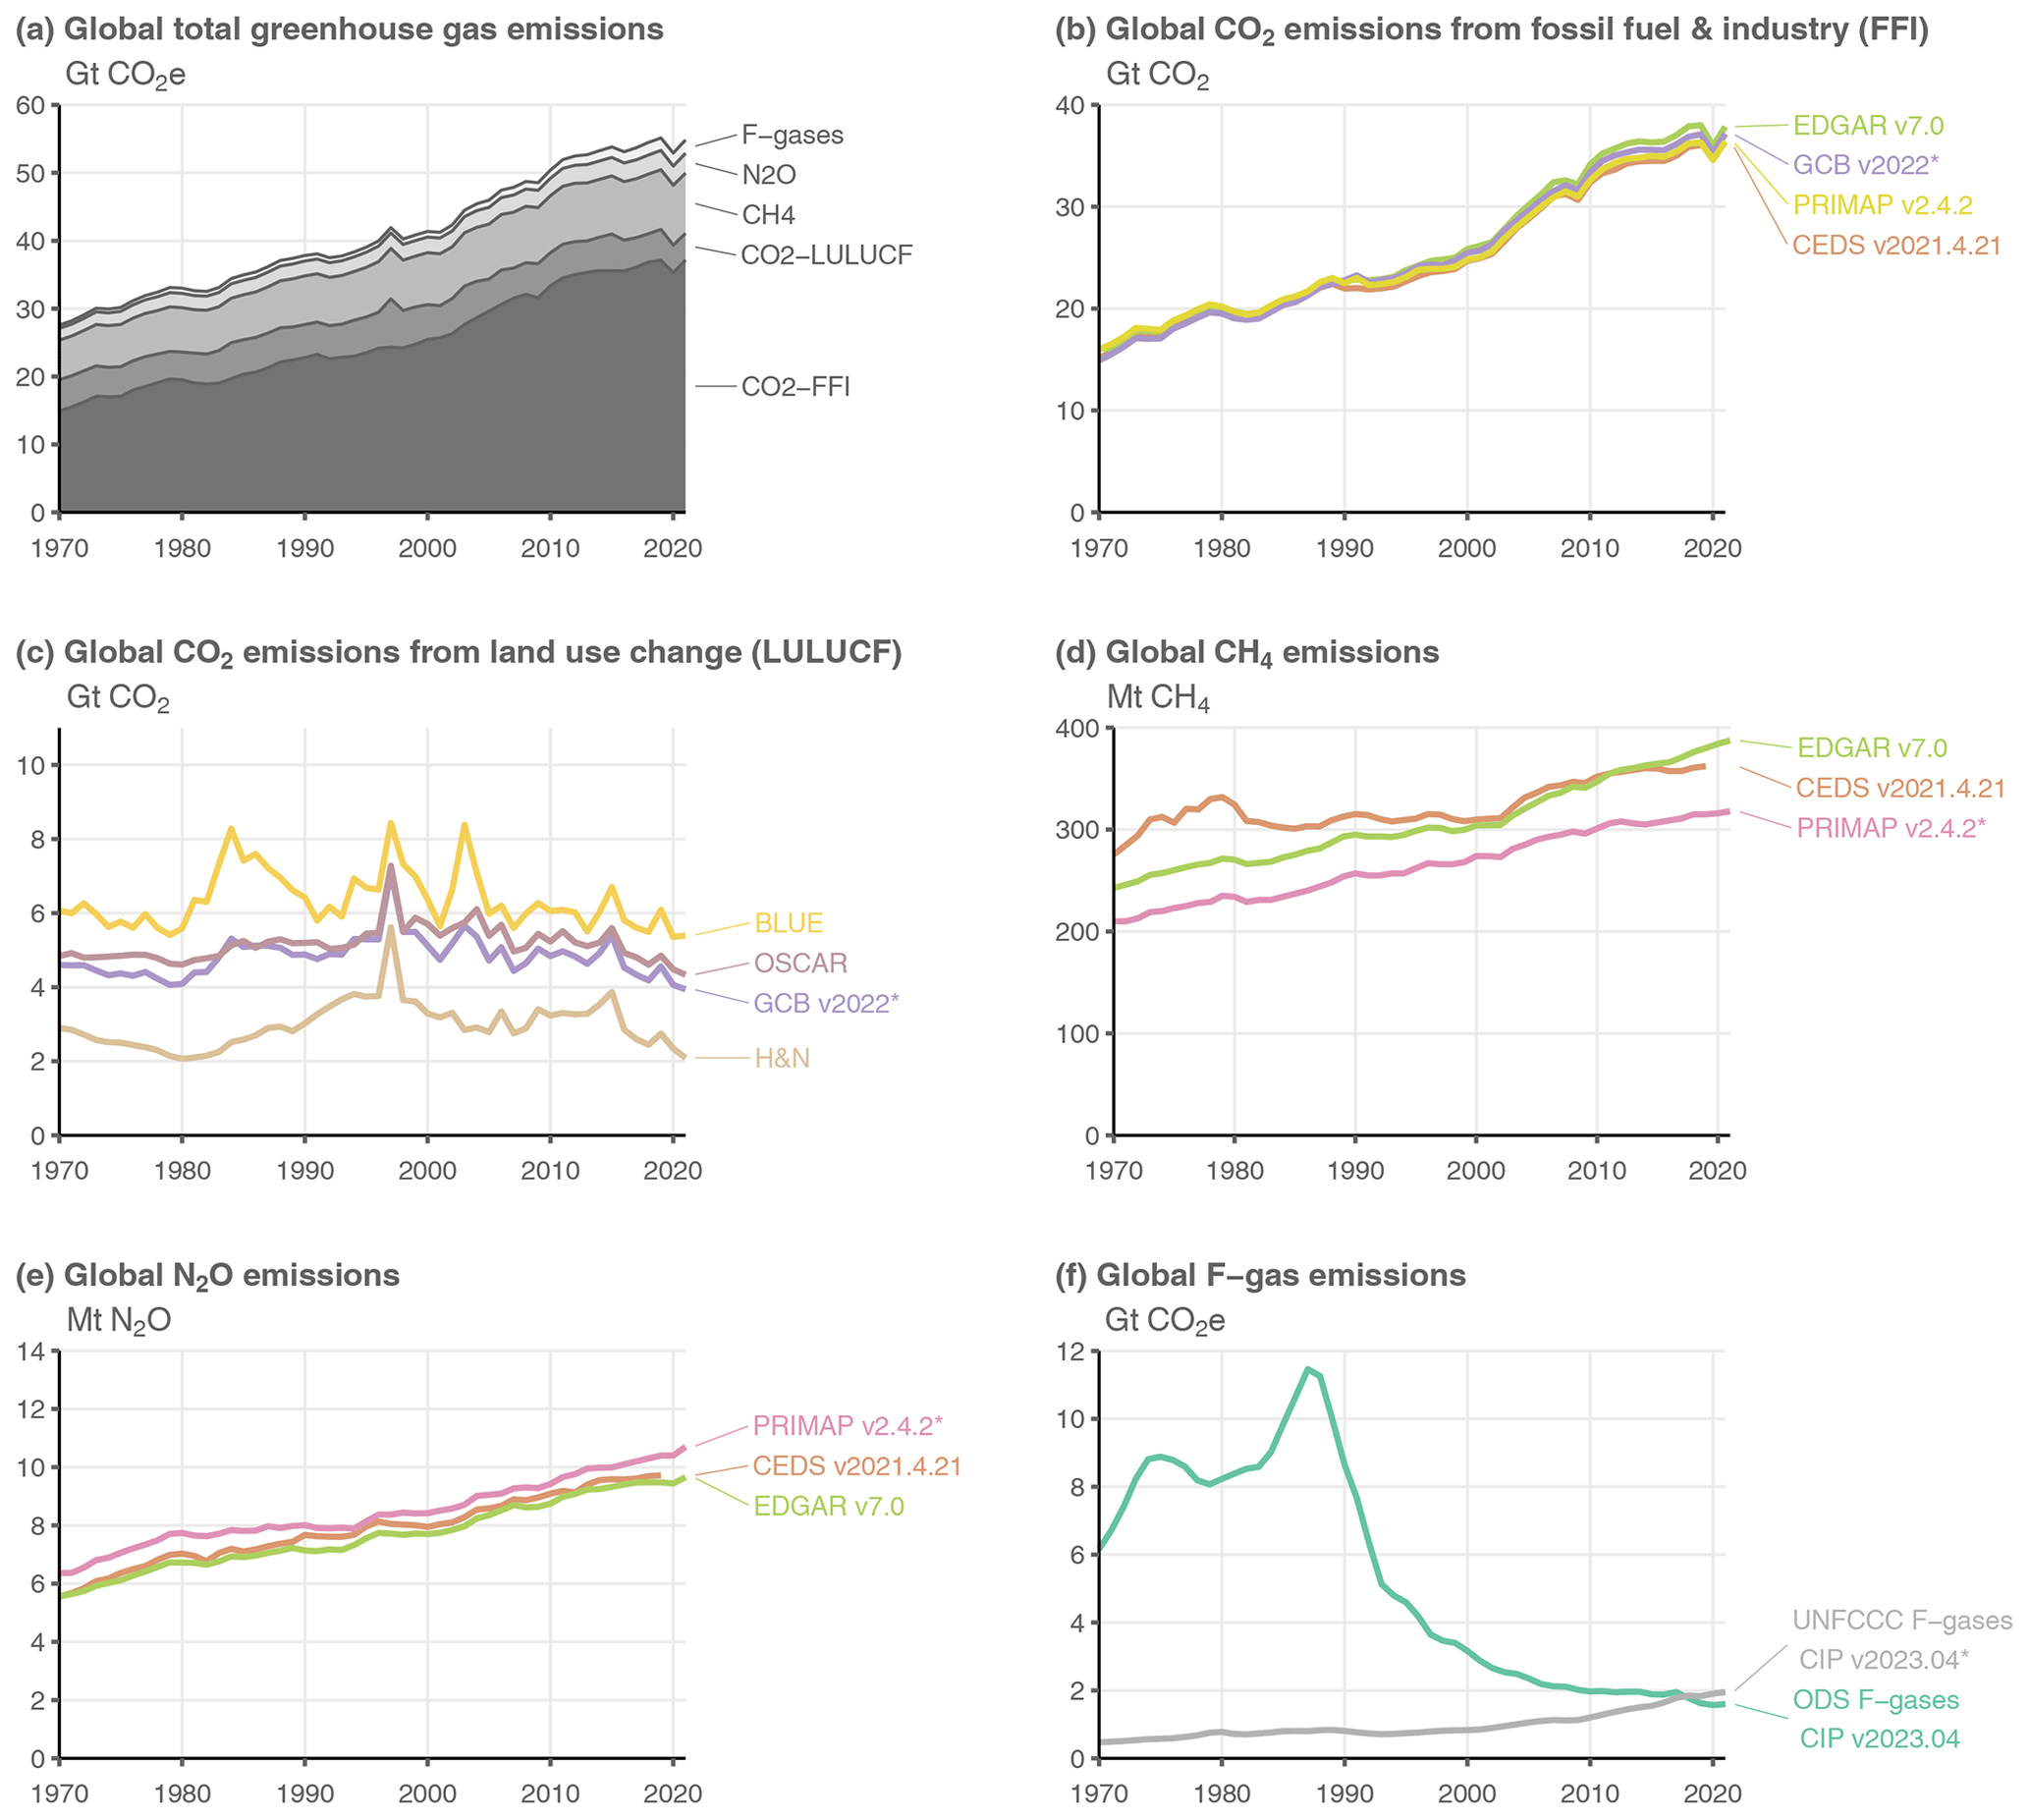
Figure 1Annual global anthropogenic greenhouse gas emissions by source, 1970–2021. Refer to Sect. 2.1 for a list of datasets. Datasets with an asterisk (*) indicate the sources used to compile global total greenhouse gas emissions in (a). CO2-equivalent emissions in (a) and (f) are calculated using global warming potentials (GWPs) with a 100-year time horizon from the AR6 WGI Chap. 7 (Forster et al., 2021). F-gas emissions in (a) comprise only UNFCCC F-gas emissions (see Sect. 2.1 for a list of species).
Table 1Global anthropogenic greenhouse gas emissions by source and decade.
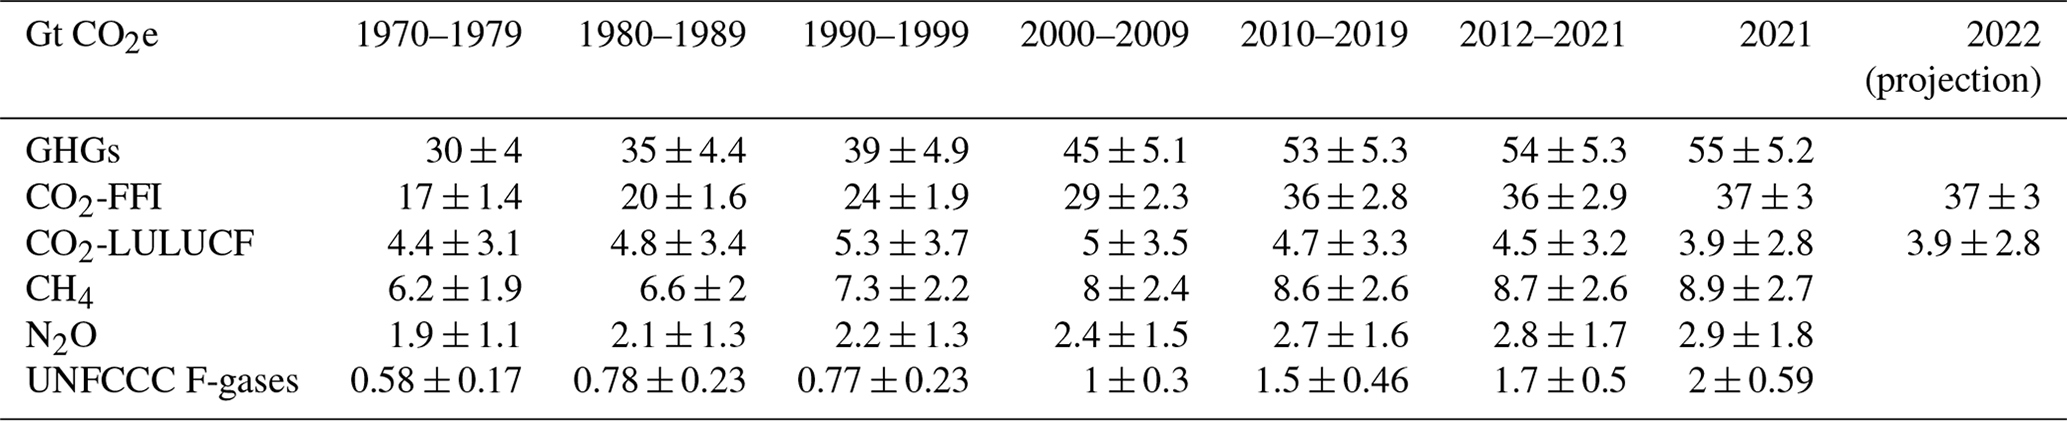
All numbers refer to decadal averages, except for annual estimates in 2021 and 2022. CO2-equivalent emissions are calculated using GWP with a 100-year time horizon from AR6 WGI Chap. 7 (Forster et al., 2021). Projections of non-CO2 GHG emissions in 2022 remain unavailable at the time of publication. Uncertainties are ±8 % for CO2-FFI, ±70 % for CO2-LULUCF, ±30 % for CH4 and F-gases, and ±60 % for N2O, corresponding to a 90 % confidence interval. ODS F-gases are excluded, as noted in Sect. 2.1.
2.3 Non-methane short-lived climate forcers
In addition to GHG emissions, we provide an update of anthropogenic emissions of non-methane short-lived climate forcers (SLCFs) (SO2, black carbon (BC), organic carbon (OC), NOx, volatile organic compounds (VOCs), CO and NH3). HFCs are considered in Sect. 2.2. Updating emissions of many short-lived climate forcing agents to 2022 based on established datasets is not possible as compiling global data can take several years. Yet, as SLCF emissions are needed in this paper to update effective radiative forcing (ERF) estimates through 2022, updated emission datasets, where they are available, are combined with projected data to make SLCF emission time series complete.
As in Dhakal et al. (2022), sectoral emissions of SLCFs are derived from two sources. For fossil fuel, industrial, waste and agricultural sectors, we use the CEDS dataset that provided SLCF emissions for the Coupled Model Intercomparison Project Phase 6 (CMIP6) (Hoesly et al., 2018). CEDS provides global emissions totals from 1750 to 2019 in its most recent version (O'Rourke et al., 2021). No CEDS emissions data are available yet beyond 2019. As a first estimate, the SLCF emissions time series are extrapolated to 2022 using the “two-year blip” scenario (Forster et al., 2020) of global emissions suppressed by the economic slowdown due to COVID-19. These projections are proxy estimates from Google and Apple mobility data over 2020 and assume a slow return to pre-pandemic emissions activity levels by 2022. Other near-real-time emissions estimates covering the COVID-19 pandemic era tend to show less of an emissions reduction than the two-year blip scenario (Guevara et al., 2023). It should be stressed that accurate quantification of SLCF emissions during this period is not possible.
We do not explicitly account for the introduction of strict fuel sulfur controls brought in by the International Maritime Organization on 1 January 2020, which was expected to reduce SO2 emissions from the global shipping sector by 8.5 Tg against a pre-COVID baseline (around 10 % of 2019 total SO2 emissions). SO2 reductions from shipping are partly accounted for in the proxy activity dataset, and including a specific shipping adjustment may double-count emissions reductions.
For biomass-burning SLCF emissions, we follow AR6 WGIII (Dhakal et al., 2022) and use the Global Fire Emissions Dataset (GFED; Randerson et al., 2017) for 1997 to 2022, with the dataset extended back to 1750 for CMIP6 (van Marle et al., 2017). Estimates from 2017 to 2022 are provisional. The potential for both sources of emissions data to be updated in future versions exists, particularly in light of a forthcoming update to CEDS and quantification of shipping sector SO2 reductions. Other natural emissions, which are important for gauging some SLCF concentrations, are considered as constant in the context of calculating concentrations and ERF.
Estimated emissions used here are based on a combination of GFED emissions for biomass-burning emissions and CEDS up until 2019 extended with the two-year blip scenario for fossil, agricultural, industrial and waste sectors. Under this scenario, emissions of all SLCFs are reduced in 2022 relative to 2019 (Table 2). As described in Sect. 4, this has implications for several categories of anthropogenic radiative forcing. Trends in SLCFs emissions are spatially heterogeneous (Szopa et al., 2021), with strong shifts in the geographical distribution of emissions over the 2010–2019 decade. Very different lockdown measures have been applied for COVID around the world, resulting in various lengths and intensities of activity reductions and effects on air pollutant emissions (Sokhi et al., 2021). SLCF emissions have been seen to return to their pre-COVID levels by 2022 in some regions, sometimes with a rebound effect, but not in all (Putaud et al., 2023; Lonsdale and Sun, 2023), but quantification at the global scale is not yet available.
Table 2Emissions of the major SLCFs in 1750, 2019 and 2022.
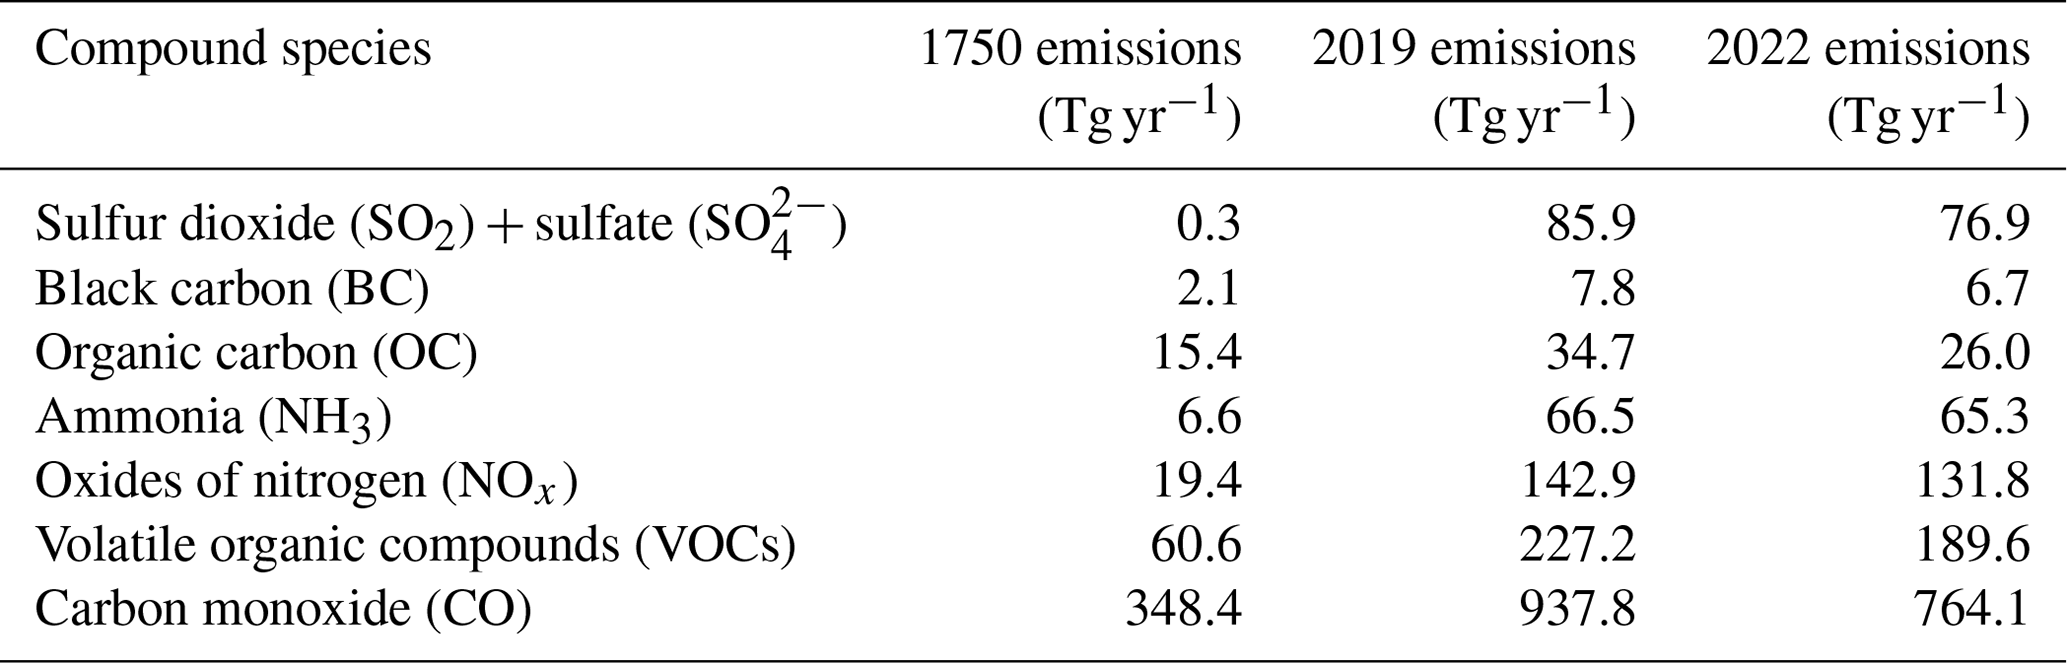
Emissions of SO2+SO use SO2 molecular weights. Emissions of NOx use NO2 molecular weights. VOCs are for the total mass.
Uncertainties associated with these emission estimates are difficult to quantify. From the non-biomass-burning sectors they are estimated to be smallest for SO2 (±14 %), largest for black carbon (BC) (a factor of 2) and intermediate for other species (Smith et al., 2011; Bond et al., 2013; Hoesly et al., 2018). Uncertainties are also likely to increase both backwards in time (Hoesly et al., 2018) and again in the most recent years. The estimates of non-biomass-burning emissions for 2020, 2021 and 2022 are highly uncertain, owing to the use of proxy activity data, scenario extension and the impact of sulfur controls in the shipping sector. Future updates of CEDS are expected to include uncertainties (Hoesly et al., 2018). Even though trends over recent years are uncertain, the general decline in some SLCF emissions derived is supported by aerosol optical depth measurements (e.g. Quaas et al., 2022).
AR6 WGI assessed well-mixed GHG concentrations in Chap. 2 (Gulev et al., 2021) and additionally provided a dataset of concentrations of 52 well-mixed GHGs from 1750 to 2019 in its Annex III (IPCC, 2021c). Footnotes in AR6 SYR updated CO2, CH4 and N2O concentrations to 2021 (Lee et al., 2023). In this update, we extended the record to 2022 for all 52 gases.
Ozone is an important greenhouse gas with strong regional variation both in the stratosphere and troposphere (Szopa et al., 2021). Its ERF arising from its regional distribution is assessed in Sect. 4 but following AR6 convention is not included with the GHGs discussed here. Other non-methane SLCFs are heterogeneously distributed in the atmosphere and are also not typically reported in terms of a globally averaged concentration. Globally averaged concentrations for these are normally model-derived, supplemented by local monitoring networks and satellite data (Szopa et al., 2021).
As in AR6, CO2 concentrations are taken from the NOAA Global Monitoring Laboratory (GML) and updated through 2022 (Lan et al., 2023a). Here, CO2 is reported on the updated WMO-CO2-X2019 scale, whereas in AR6, values were reported on the WMO-CO2-X2007 scale. This improved calibration increases CO2 concentrations by around 0.2 ppm (Hall et al., 2021). In AR6, CH4 and N2O were reported as the average from NOAA and the Advanced Global Atmospheric Gases Experiment (AGAGE) global networks. For 2022, as updated AGAGE data are not currently available, we used only NOAA data (Lan et al., 2023b) and multiplied N2O by 1.0007 to be consistent with a NOAA–AGAGE average. NOAA CH4 in 2022 was used without adjustment since the NOAA and AGAGE global CH4 means are consistent within 2 ppb. Mixing ratio uncertainties for 2022 are assumed to be similar to 2019, and we adopt the same uncertainties as assessed in AR6 WGI.
Many halogenated greenhouse gases are reported on a global mean basis from NOAA and/or AGAGE until 2020 or 2021 (SF6 is available in the NOAA dataset up to 2022). Where both NOAA and AGAGE data are used for the same gas, we take a mean of the two datasets. Where both networks are used and the last full year of data availability is different, the difference between the dataset mean and the dataset with the longer time series in this last year is used as an additive offset to the dataset with the longer time series. Some obvious inconsistencies are removed such as sudden changes in concentrations when missing data are reported as zero.
Some of the more minor halogenated gases are not part of the NOAA or AGAGE operational network and are currently only reported in literature sources until 2019 or possibly 2015 (Droste et al., 2020; Laube et al., 2014; Schoenenberger et al., 2015; Simmonds et al., 2017; Vollmer et al., 2018). Concentrations of gases where 2022 data are not yet available are extrapolated forwards to 2022 using the average growth rate over the last 5 years of available data. These assumptions have an imperceptible effect on the total ERF assessed in Sect. 4, whereas excluding these gases would have an impact.
The global surface mean mixing ratios of CO2, CH4 and N2O in 2022 were 417.1 [±0.4] ppm, 1911.9 [±3.3] ppb and 335.9 [±0.4] ppb. Concentrations of all three major GHGs have increased from 2019 values reported in AR6 WGI, which were 410.1 [±0.36] ppm for CO2, 1866.3 [±3.2] ppb for CH4 and 332.1 [±0.7] ppb for N2O. CO2 concentrations in 2019 are updated to 410.3 ppm using the new WMO-CO2-X2019 scale adopted here. Concentrations of most categories of halogenated GHGs have increased from 2019 to 2022: from 109.4 to 114.2 ppt on a CF4-equivalent scale for PFCs, 237.1 to 287.2 ppt on an HFC-134a-equivalent scale for HFCs, 9.9 to 11.0 ppt for SF6 and 2.1 to 2.8 ppt for NF3. Only Montreal Protocol halogenated GHGs have decreased in concentration, from 1031.9 ppt in 2019 to 1016.6 ppt in 2022 on a CFC-12-equivalent scale, demonstrating the continued success of the Montreal Protocol. Although even here, concentrations of some minor CFCs are rising (see also Western et al., 2023). In this update we employ AR6-derived uncertainty estimates and do not perform a new assessment. Table S1 in Sect. S3 of the Supplement shows specific updated concentrations for all the GHGs considered.
ERFs were principally assessed in Chap. 7 of AR6 WGI (Forster et al., 2021). Chapter 7 focussed on assessing ERF from changes in atmospheric concentrations; it also supported estimates of ERF in Chap. 6 that attributed forcing to specific precursor emissions (Szopa et al., 2021) and also generated the time history of ERF shown in AR6 WGI Fig. 2.10 and discussed in Chap. 2 (Gulev et al., 2021). Only the concentration-based estimates are updated this year. The emission-based estimates relied on specific chemistry climate model integrations, and a consistent method of applying updates to these would need to be developed in the future.
Each IPCC report has successively updated both the method of calculation and the time history of different warming and cooling contributions, measured as ERFs. Both types of updates have contributed to a significantly changed forcing estimate between successive reports. For example, Forster et al. (2021) updated the methodology to exclude adjustments related to land surface temperature from the forcing calculation, which generally increased estimates. At the same time GHG levels increased, and the time history of aerosol forcing was revised, overall leading to a higher total ERF estimate in AR6 compared to AR5. These IPCC updates flow from an assessment of varied literature and also rely on updates to concentrations and/or emissions.
There is no published regularly updated total ERF indicator outside of the IPCC process, although the European Copernicus programme has trialled such a product (Bellouin et al., 2020). For radiative forcing, NOAA annually updates estimates for the main GHGs, calculating radiative forcing (RF) using the set of formulas to estimate RFs from concentrations (Montzka, 2022). Updated RF formulas were employed in AR6 (Forster et al., 2021), and these updated expressions are also employed here in the Supplement, Sect. S4.
The ERF calculation follows the methodology used in AR6 WGI (Smith et al., 2021). For each category of forcing, a 100 000-member probabilistic Monte Carlo ensemble is sampled to span the assessed uncertainty range in each forcing. All uncertainties are reported as 5 %–95 % ranges and provided in square brackets. The only significant methodological change compared to AR6 is for the volcanic ERF estimate. Firstly, the pre-industrial baseline data have been improved by switching to a new longer record of stratospheric aerosol optical depth before 1750 (Sigl et al., 2022). Secondly, choices have also been made to include the January 2022 eruption of Hunga Tonga–Hunga Ha'apai as an exceptional positive ERF perturbation from the increase in stratospheric water vapour (Millán et al., 2022; Sellito et al., 2022; Jenkins et al., 2023). The methods are all detailed in the Supplement, Sect. S4.
The summary results for the anthropogenic constituents of ERF and solar irradiance in 2022 relative to 1750 are shown in Fig. 2a. In Table 3 these are summarised alongside the equivalent ERFs from AR6 (1750–2019) and AR5 (1750–2011). Figure 2b shows the time evolution of ERF from 1750 to 2022.
Table 3Contributions to anthropogenic effective radiative forcing (ERF) for 1750–2022 assessed in this section.
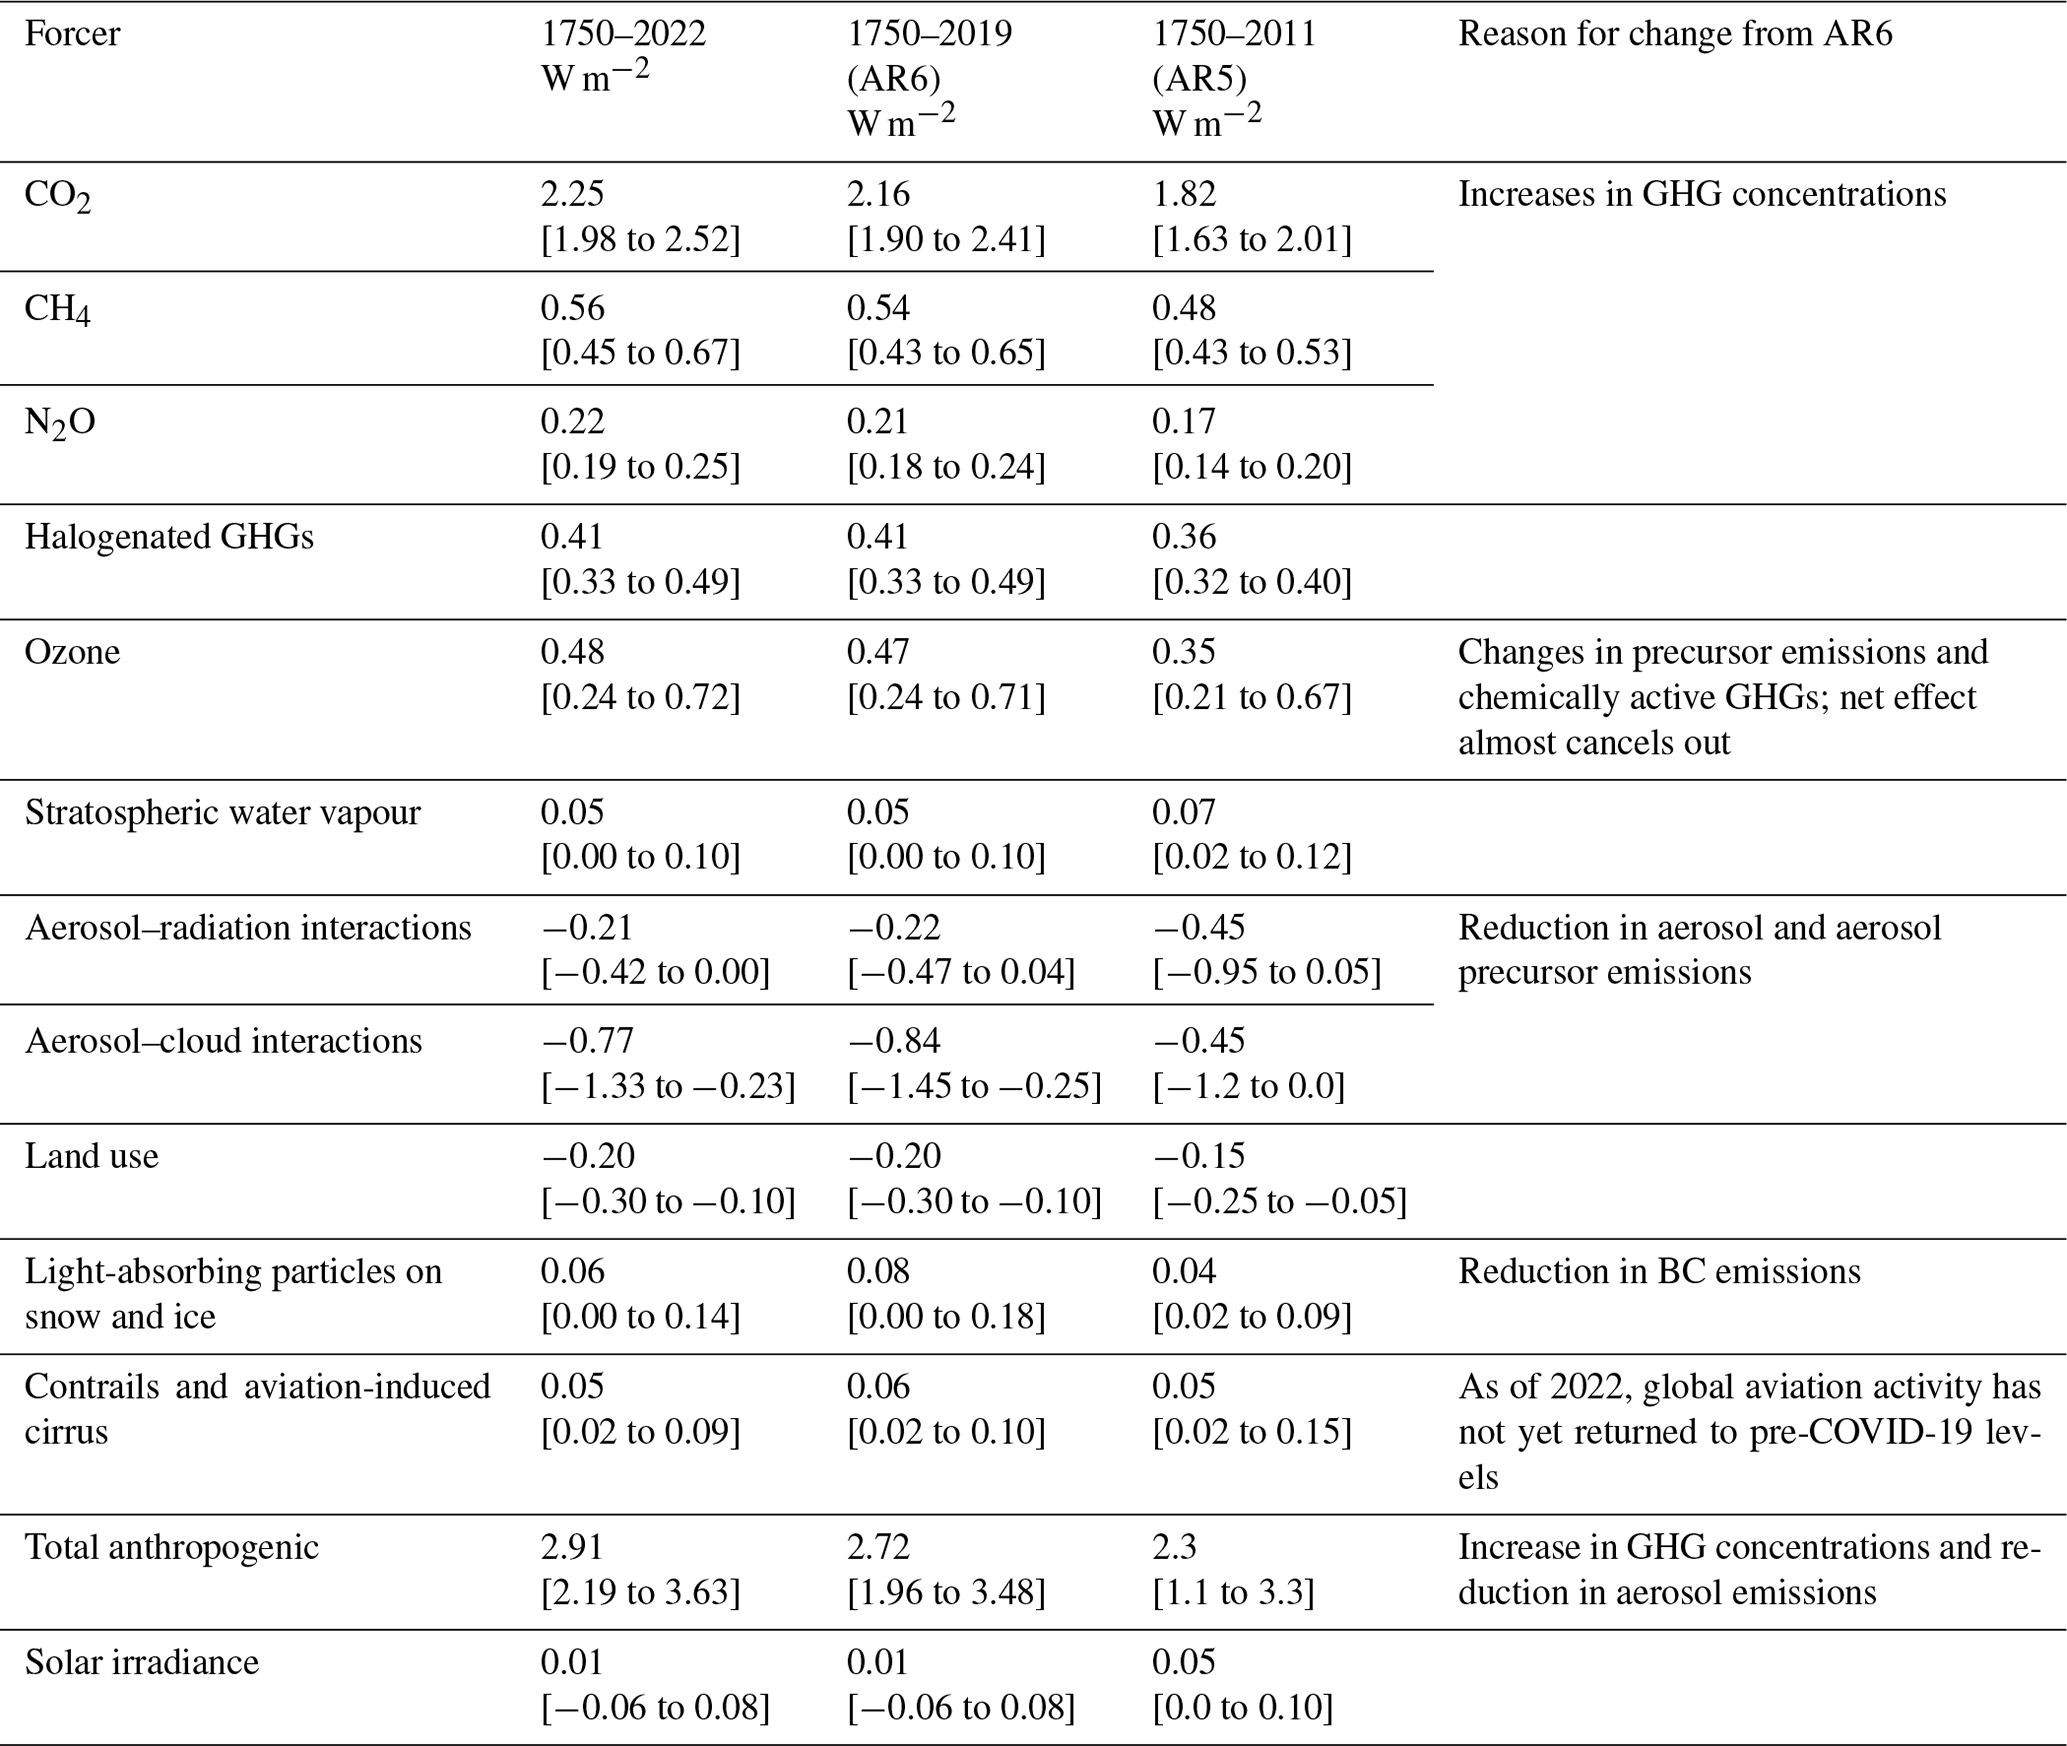
All values are in watts per square metre (W m−2), and 5 %–95 % ranges are in square brackets. As a comparison, the equivalent assessments from AR6 (1750–2019) and AR5 (1750–2011; Myhre et al., 2013) are shown. Solar ERF is included and unchanged from AR6, based on the most recent solar cycle (2009–2019), thus differing from the single-year estimate in Fig. 2a. Volcanic ERF is excluded due to the sporadic nature of eruptions.
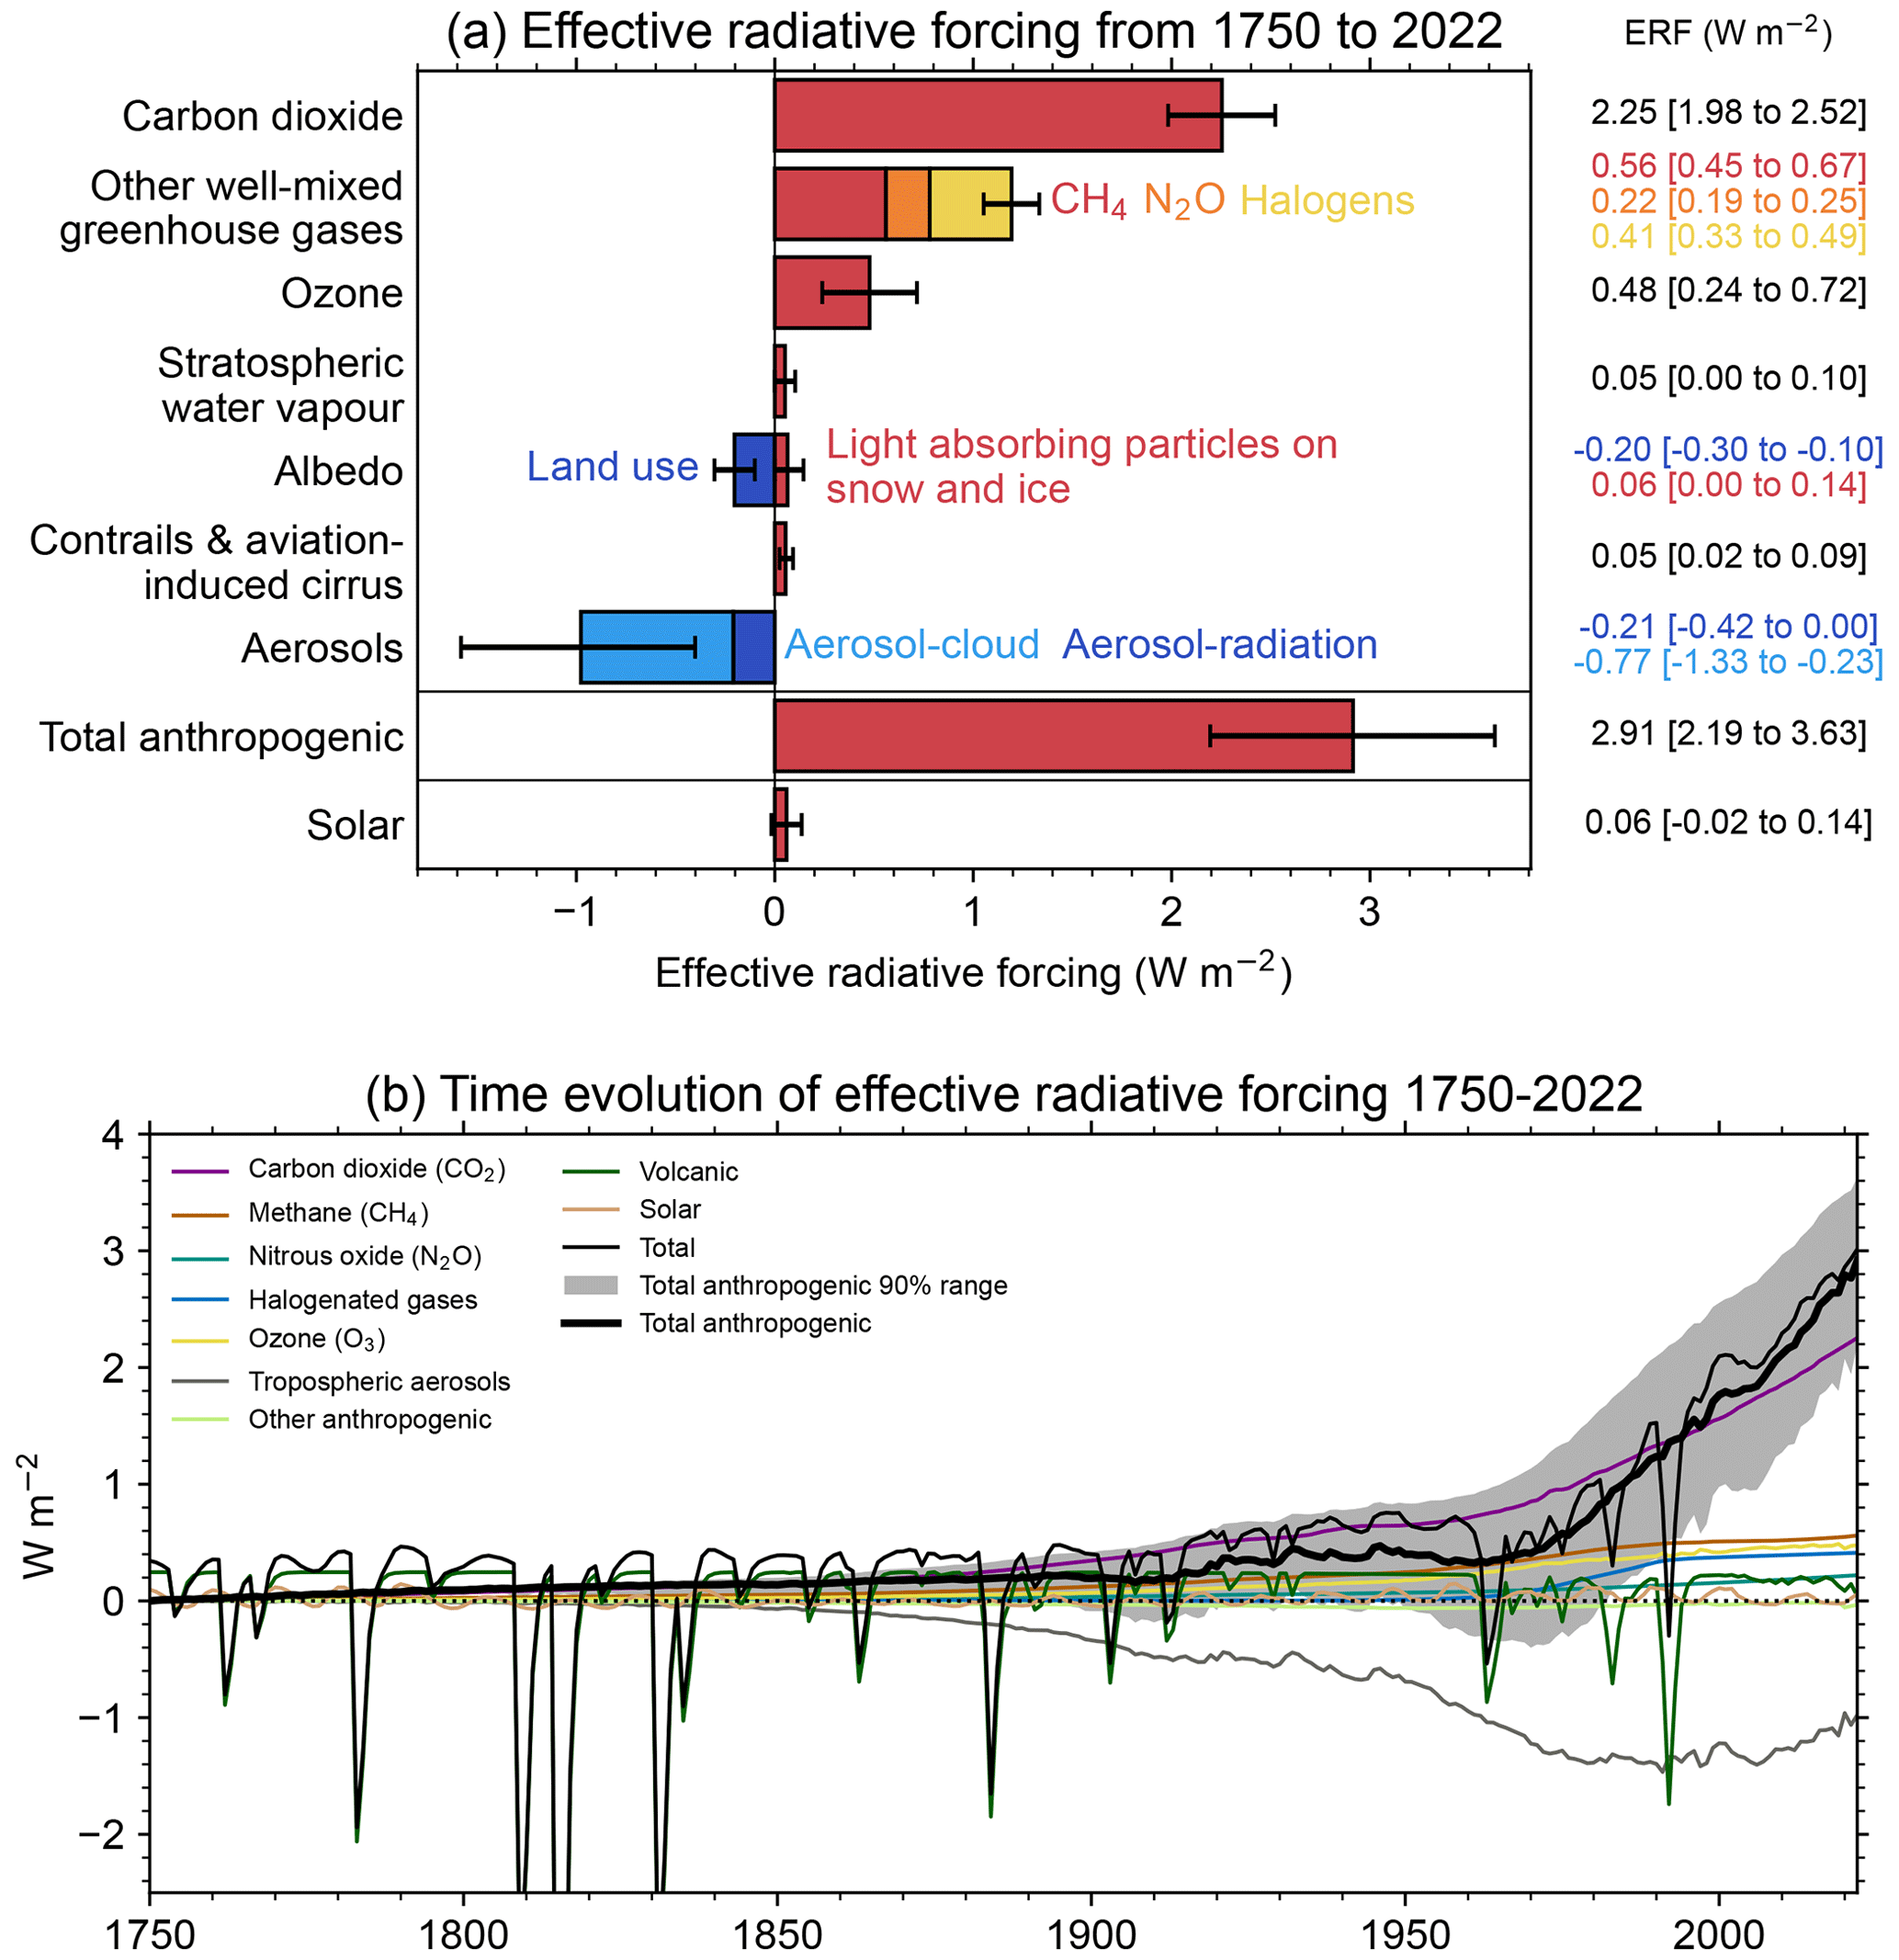
Figure 2Effective radiative forcing from 1750–2022. (a) 1750–2022 change in ERF, showing best estimates (bars) and 5 %–95 % uncertainty ranges (lines) from major anthropogenic components to ERF, total anthropogenic ERF and solar forcing. (b) Time evolution of ERF from 1750 to 2022. Best estimates from major anthropogenic categories are shown along with solar and volcanic forcing (thin coloured lines), total (thin black line), and anthropogenic total (thick black line). The 5 %–95 % uncertainty in the anthropogenic forcing is shown by grey shading. Note that solar forcing in 2022 is a single-year estimate.
Total anthropogenic ERF has increased to 2.91 [2.19 to 3.63] W m−2 in 2022 relative to 1750, compared to 2.72 [1.96 to 3.48] W m−2 for 2019 relative to 1750 in AR6. The main contributions to this increase are from increases in greenhouse gas concentrations and a reduction in the magnitude of aerosol forcing. Decadal trends in ERF have increased markedly and are now over 0.6 W m−2 per decade. These are discussed further in the discussion and conclusions (Sect. 12).
The ERF from well-mixed GHGs is 3.45 [3.14 to 3.75] W m−2 for 1750–2022, of which 2.25 W m−2 is from CO2, 0.56 W m−2 from CH4, 0.22 W m−2 from N2O and 0.41 W m−2 from halogenated gases. This is an increase from 3.32 [3.03 to 3.61] W m−2 for 1750–2019 in AR6. ERFs from CO2, CH4 and N2O have all increased since the AR6 WG1 assessment for 1750–2019, owing to increases in atmospheric concentrations.
The total aerosol ERF (sum of the ERF from aerosol–radiation interactions (ERFari) and aerosol–cloud interactions (ERFaci)) for 1750–2022 is −0.98 [−1.58 to −0.40] W m−2 compared to −1.06 [−1.71 to −0.41] W m−2 assessed for 1750–2019 in AR6 WG1. This continues a trend of weakening aerosol forcing due to reductions in precursor emissions. Most of this reduction is from ERFaci, which is determined to be −0.77 [−1.33 to −0.23] W m−2 compared to −0.84 [−1.45 to −0.25] W m−2 in AR6 for 1750–2019. ERFari for 1750–2022 is −0.21 [−0.42 to 0.00] W m−2, marginally weaker than the −0.22 [−0.47 to 0.04] W m−2 assessed for 1750–2019 in AR6 WG1 (Forster et al., 2021). The largest contributions to ERFari are from SO2 (primary source of sulfate aerosol; −0.21 W m−2), BC (+0.12 W m−2), OC (−0.04 W m−2) and NH3 (primary source of nitrate aerosol; −0.03 W m−2). ERFari is not weakening as fast as ERFaci due to reductions in the warming influence of BC cancelling out some of the reduced sulfate cooling. ERFari also includes terms from CH4, N2O and NH3 which are small but have all increased.
Ozone ERF is determined to be 0.48 [0.24 to 0.72] W m−2 for 1750–2022, similar to the AR6 assessment of 0.47 [0.24 to 0.71] W m−2 for 1750–2019. Land-use forcing and stratospheric water vapour from methane oxidation are unchanged (to two decimal places) since AR6. The decline in BC emissions from 2019 to 2022 has reduced ERF from light-absorbing particles on snow and ice from 0.08 [0.00 to 0.18] W m−2 for 1750–2019 to 0.06 [0.00 to 0.14] W m−2 for 1750–2022. We determine from provisional data that aviation activity in 2022 had not yet returned to pre-COVID levels. Therefore, ERF from contrails and contrail-induced cirrus is lower than AR6, at 0.05 [0.02 to 0.09] W m−2 in 2022 compared to 0.06 [0.02 to 0.10] W m−2 in 2019.
The headline assessment of solar ERF is unchanged, at 0.01 [−0.06 to +0.08] W m−2 from pre-industrial to the 2009–2019 solar cycle mean. Separate to the assessment of solar forcing over complete solar cycles, we provide a single-year solar ERF for 2022 of 0.06 [−0.02 to +0.14] W m−2. This is higher than the single-year estimate of solar ERF for 2019 (a solar minimum) of −0.02 [−0.08 to 0.06] W m−2.
For volcanic ERF, updating of the pre-industrial dataset for stratospheric aerosol optical depth (sAOD) increased the sAOD over 500 BCE to 1749 CE, resulting in a larger difference to post-1750 sAOD and resulting in a volcanic ERF difference of +0.015 W m−2 compared to AR6 (see Sect. S4 in the Supplement). In addition, the earlier Holocene was more volcanically active than the period after 500 BCE, further increasing the mean sAOD baseline. Taking the longer baseline period into account in the new pre-industrial dataset, post-1750 ERF is further increased by 0.031 W m−2. The net effect is that volcanic forcing after 1750 has increased by +0.046 W m−2 compared to AR6 due to dataset updates and by account of the fact that the post-1750 period was less volcanically active on average than the Early Holocene, which is now used in the ERF calculation.
AR6 WGI Chap. 2 assessed the 2001–2020 globally averaged surface temperature change above an 1850–1900 baseline to be 0.99 [0.84 to 1.10] ∘C and 1.09 [0.95 to 1.20] ∘C for 2011–2020 (Gulev et al., 2021). Updated estimates to 2022 were also given in AR6 SYR (Lee et al., 2023). The AR6 SYR estimates match those given here. We describe the update in detail and provide further quantification and comparisons.
There are choices around the methods used to aggregate surface temperatures into a global average, how to correct for systematic errors in measurements, methods of infilling missing data, and whether surface measurements or atmospheric temperatures just above the surface are used. These choices, and others, affect temperature change estimates and contribute to uncertainty (IPCC AR6 WGI Chap. 2, Cross Chap. Box 2.3, Gulev et al., 2021). The methods chosen here closely follow AR6 WGI and are presented in the Supplement, Sect. S5. Confidence intervals are taken from AR6 as only one of the employed datasets regularly updates ensembles (see Supplement, Sect. S5).
Based on the updates available as of February 2023 (which were reported in the AR6 SYR), the change in global surface temperature from 1850–1900 to 2013–2022, using the same underlying datasets and methodology as AR6, is 1.15 [1.00–1.25] ∘C, an increase of 0.06 ∘C within 2 years from the 2011–2020 value reported in AR6 WGI (Table 4). The change from 1850–1900 to 2003–2022 was 1.03 [0.87–1.13] ∘C, 0.04 ∘C higher than the earlier value reported in AR6 WGI. These changes are broadly consistent with typical warming rates over the last few decades, which were assessed in AR6 as 0.76 ∘C over the 1980–2020 period (using ordinary-least-square linear trends) or 0.019 ∘C per year (Gulev et al., 2021). They are also broadly consistent with projected warming rates from 2001–2020 to 2021–2040 reported in AR6, which are in the order of 0.025 ∘C per year under most scenarios (Lee et al., 2021).
Table 4Estimates of global surface temperature change from 1850–1900 [very likely (90 %–100 % probability) ranges] for IPCC AR6 and the present study.
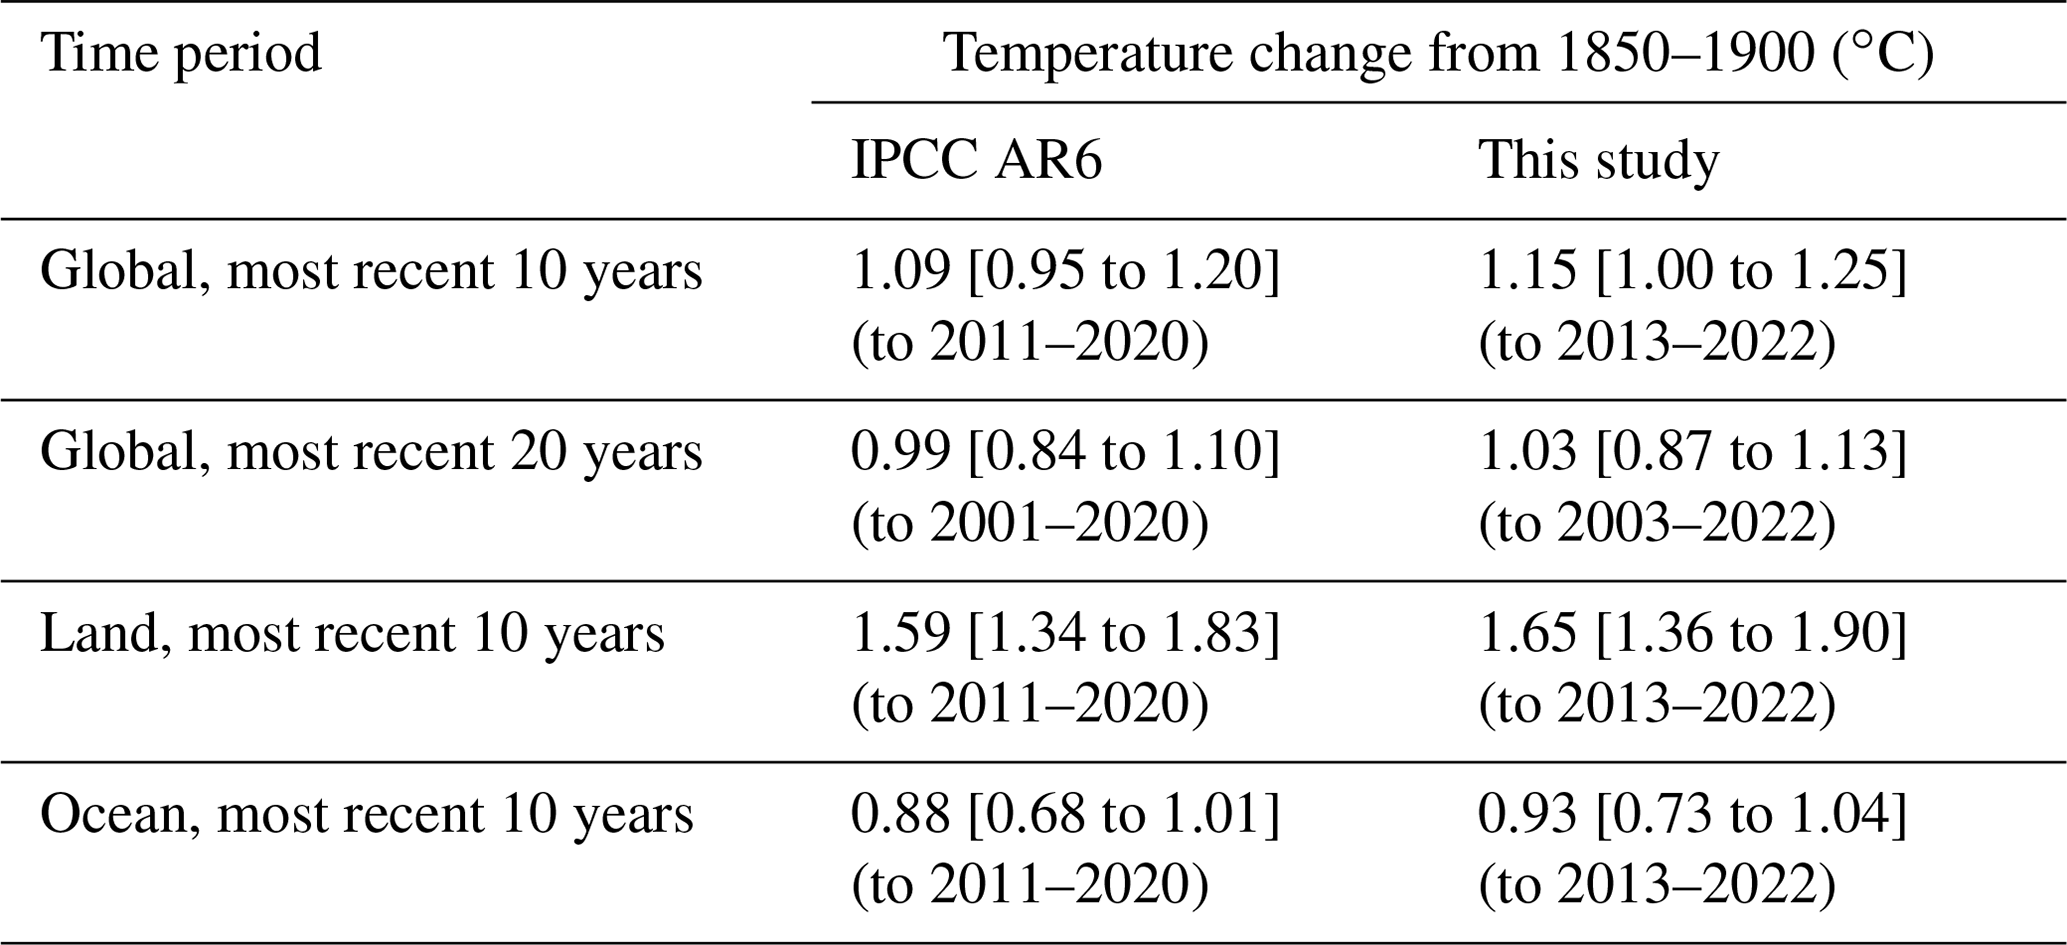
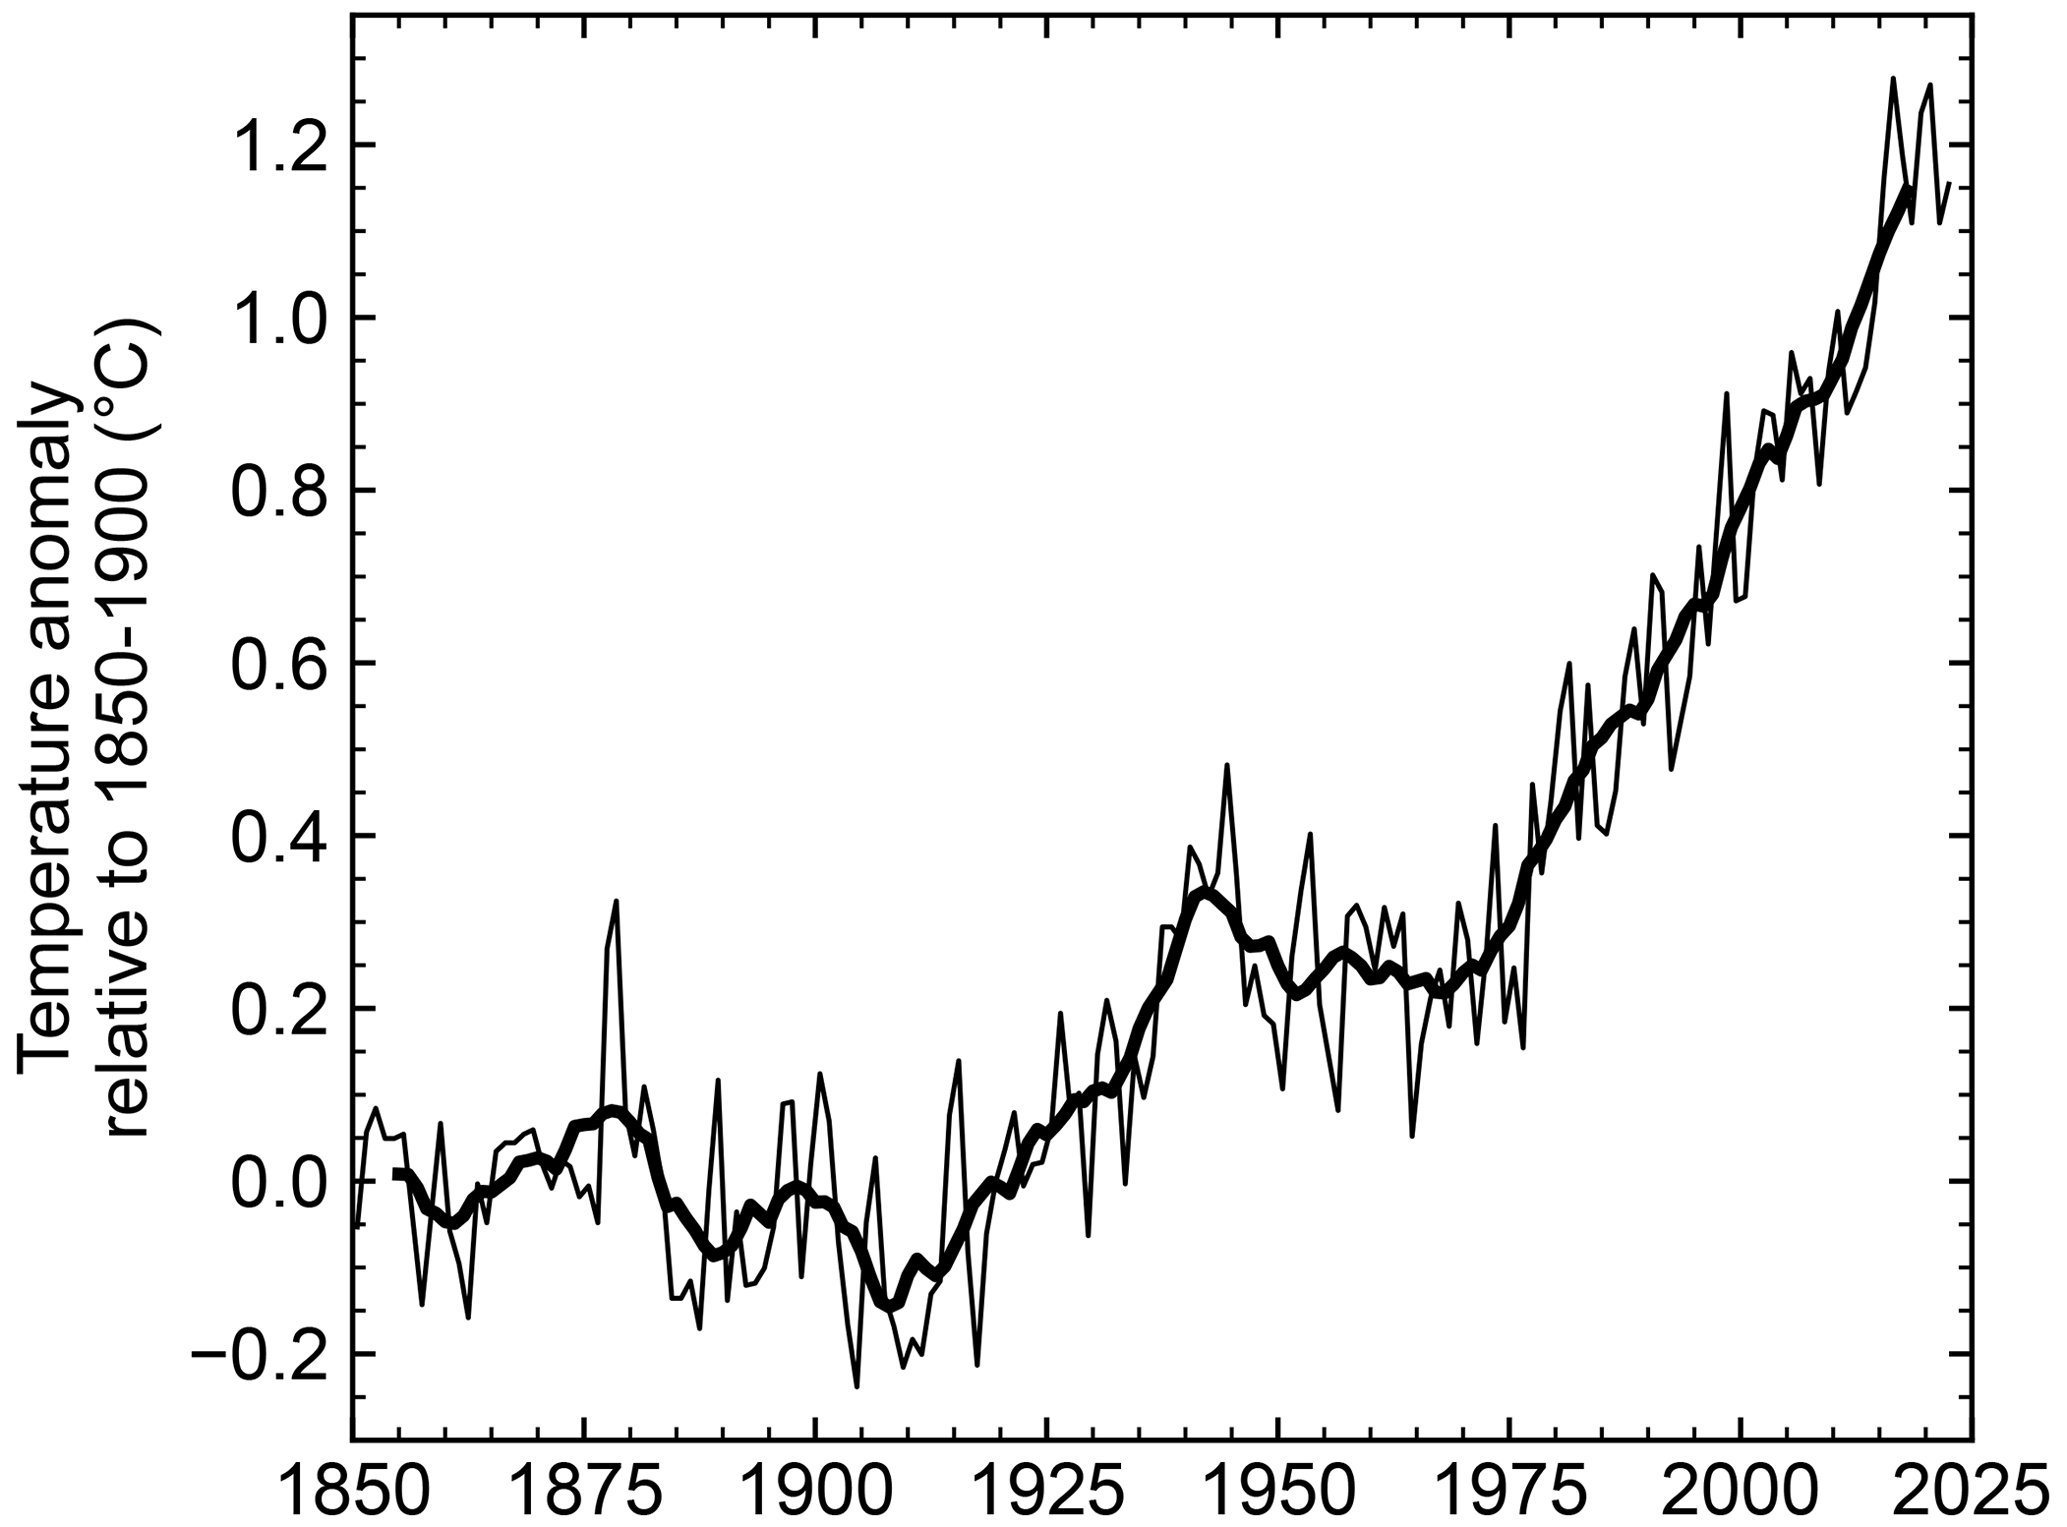
Figure 3Annual (thin line) and decadal (thick line) means of global surface temperature (expressed as a change from the 1850–1900 reference period).
Note that the temperatures for single years include considerable variability and are influenced by natural forcings such as the El Niño–Southern Oscillation and sporadic volcanic eruptions that might either cool or warm the climate for short periods (Jenkins et al., 2023). At current warming rates, individual years may exceed warming of 1.5 ∘C several years before a long-term mean exceeds this level (Trewin, 2022).
The Earth energy imbalance (EEI), assessed in Chap. 7 of AR6 WGI (Forster et al., 2021), provides a measure of accumulated additional energy (heating) in the climate system and hence plays a critical role in our understanding of climate change. It represents the difference between the radiative forcing acting to warm the climate and Earth's radiative response, which acts to oppose this warming. On annual and longer timescales, the Earth heat inventory changes associated with EEI are dominated by the changes in global ocean heat content (OHC), which accounts for about 90 % of global heating since the 1970s (Forster et al., 2021). This planetary heating results in changes to the Earth system such as sea level rise, ocean warming, ice loss, rise in temperature and water vapour in the atmosphere, and permafrost thawing (e.g. Cheng et al., 2022; von Schuckmann et al., 2023a), with adverse impacts for ecosystems and human systems (Douville et al., 2021; IPCC, 2022).
On decadal timescales, changes in global surface temperatures (Sect. 5) can become decoupled from EEI by ocean heat rearrangement processes (e.g. Palmer and McNeall, 2014; Allison et al., 2020). Therefore, the increase in the Earth heat inventory provides a more robust indicator of the rate of global change on interannual-to-decadal timescales (Cheng et al., 2019; Forster et al., 2021; von Schuckmann et al., 2023a). AR6 WGI found increased confidence in the assessment of changes in the Earth heat inventory compared to previous IPCC reports due to observational advances and closure of the energy and global sea level budgets (Forster et al., 2021; Fox-Kemper et al., 2021).
AR6 estimated with that EEI increased from 0.50 [0.32–0.69] W m−2 during the period 1971–2006 to 0.79 [0.52–1.06] W m−2 during the period 2006–2018 (Forster et al., 2021). The contributions to increases in the Earth heat inventory throughout 1971–2018 remained stable: 91 % for the full-depth ocean, 5 % for the land, 3 % for the cryosphere and about 1 % for the atmosphere (Forster et al., 2021). The increase in EEI (Fig. 4) has also been reported by Cheng et al. (2019), von Schuckmann et al. (2020, 2023a), Loeb et al. (2021), Hakuba et al. (2021), Kramer et al. (2021) and Raghuraman et al. (2021). Drivers for the most recent period (i.e. past 2 decades) are both the increases in effective radiative forcing (Sect. 4) and climate feedbacks, such as cloud and sea ice changes. The degree of contribution from the different drivers is uncertain and still under active investigation.
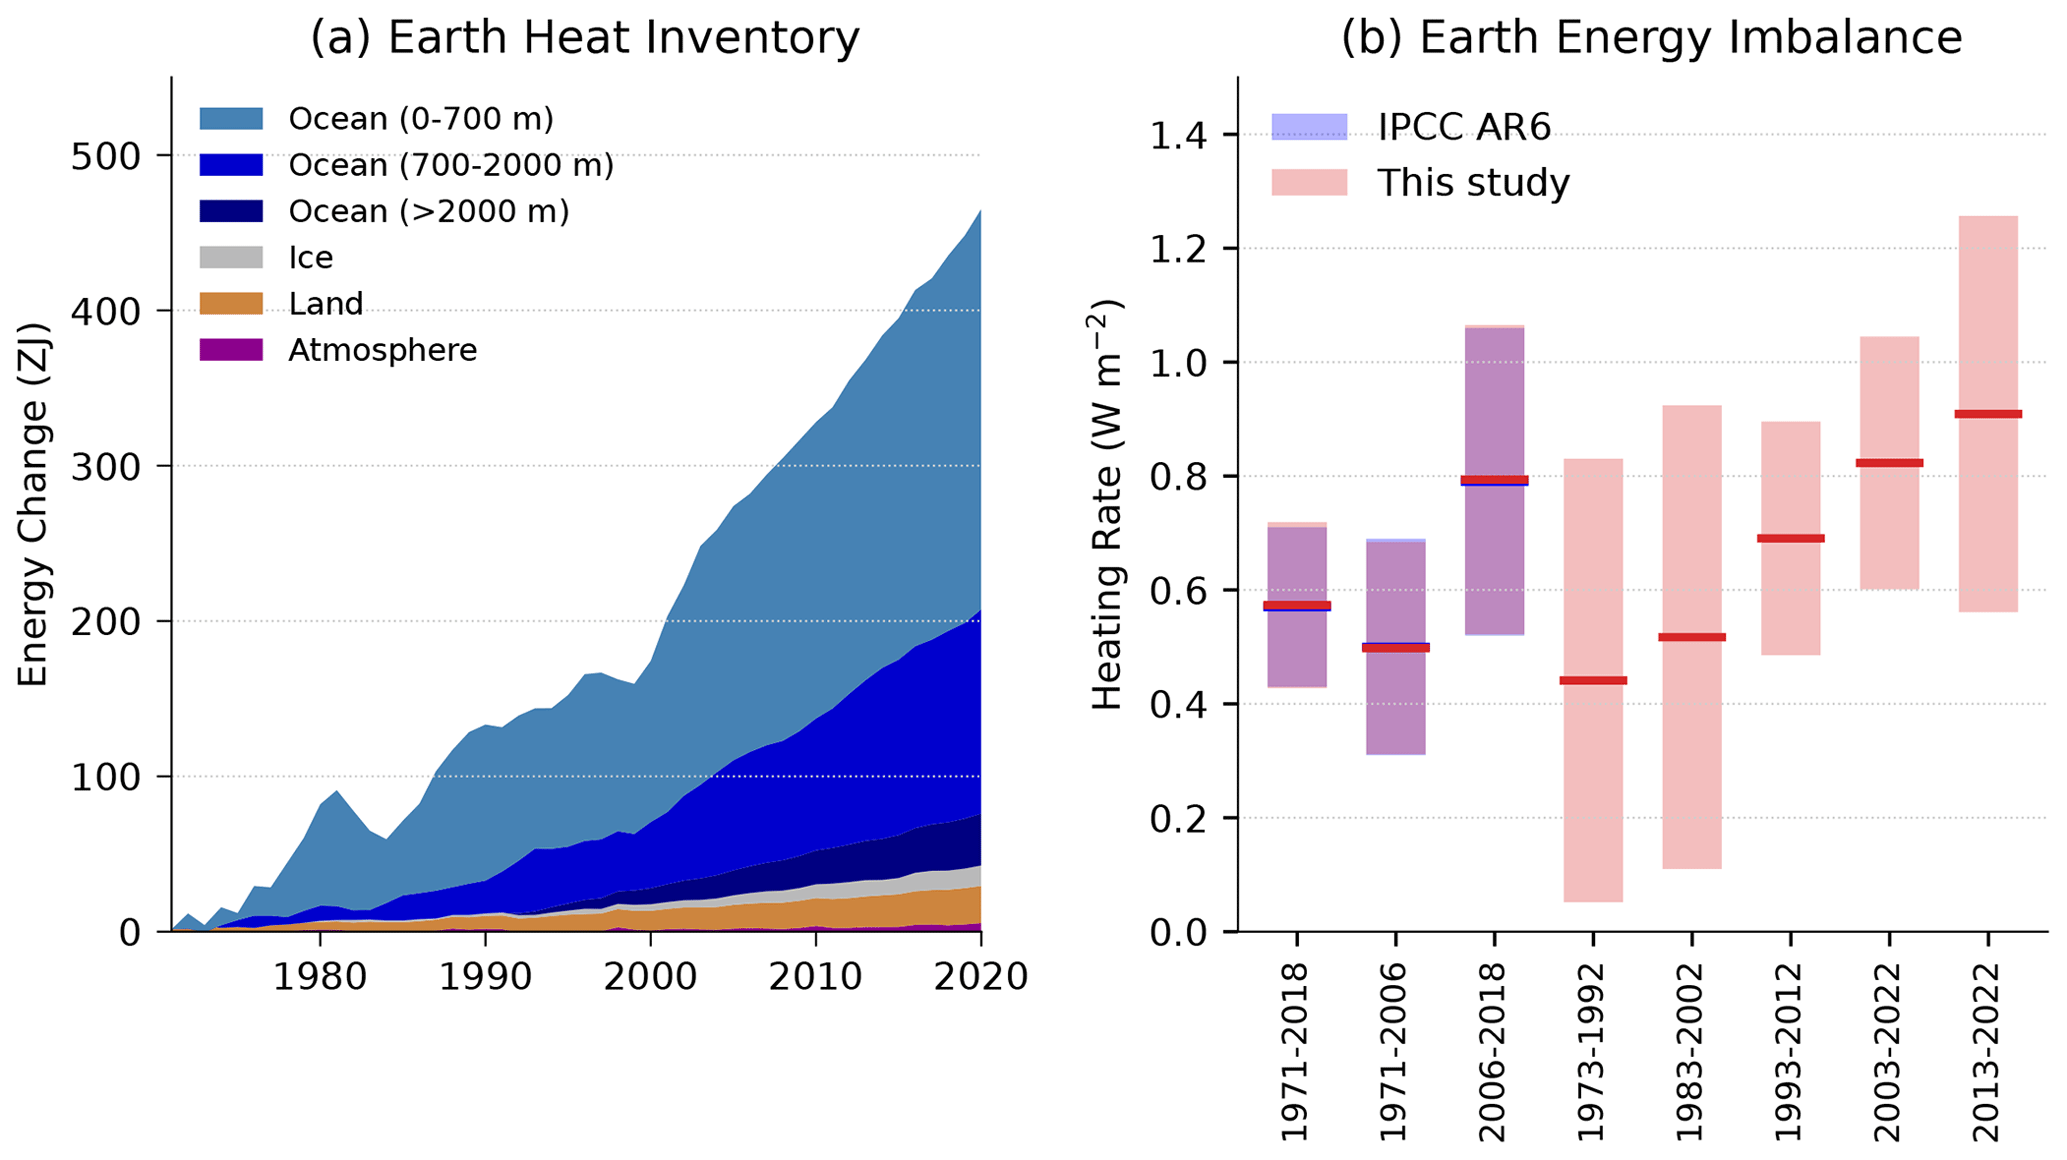
Figure 4(a) Observed changes in the Earth heat inventory for the period 1971–2020, with component contributions as indicated in the figure legend. (b) Estimates of the Earth energy imbalance for IPCC AR6 assessment periods, for consecutive 20-year periods and the most recent decade. Shaded regions indicate the very likely range (90 % to 100 % probability). Data use and approach are based on the AR6 methods and further described in Sect. 6.
While changes in EEI have been effectively monitored at the top of the atmosphere by satellites since the mid-2000s, we rely on estimates of OHC change to determine the absolute magnitude of EEI and its evolution on inter-annual to multi-decadal time series. The AR6 assessment of ocean heat content change for the 0–2000 m layer was based on global annual mean time series from five ocean heat content datasets: IAP (Cheng et al., 2017), Domingues et al. (2008), EN4 (Good et al., 2013), Ishii et al. (2017) and NCEI (Levitus et al., 2012). Four of these datasets routinely provide updated OHC time series for the BAMS State of the Climate report, and all are used for the GCOS Earth heat inventory (von Schuckmann et al., 2020, 2023a) and the annual WMO global state of the climate. The uncertainty assessment for the 0–2000 m layer used the ensemble method described by Palmer et al. (2021) that separately accounts for parametric and structural uncertainty. The OHC change >2000 m and associated uncertainty were assessed based on trend analysis of the available hydrographic data following Purkey and Johnson (2010). All five of the datasets used for the 0–2000 m OHC assessment are now updated at least annually and should in principle support an AR6 assessment time series update within the first few months of each year. There is potential to increase the observational ensemble used in the assessment by supplementing this set with additional data products that are also available annually for future updates. There is also a potential to update the uncertainty estimate after a more comprehensive understanding of the error sources.
Estimates of EEI should also account for the other elements of the Earth heat inventory, i.e. the atmospheric warming, the latent heat of global ice loss and heating of the continental land surface (Forster et al., 2021; Cuesta-Valero et al., 2021, 2023a; Steiner et al., 2020; Nitzbon et al., 2022a; Vanderkelen et al., 2020; Adusumilli et al., 2022). Some of these components of the Earth heat inventory are routinely updated by a community-based initiative reported in von Schuckmann et al. (2020, 2023a). However, in the absence of annual updates to all heat inventory components, a pragmatic approach is to use recent OHC change as a proxy for EEI, scaling the value up as required based on historical partitioning between Earth system components.
We carry out an update to the AR6 estimate of changes in the Earth heat inventory based on updated observational time series for the period 1971–2020 (Table 5 and Fig. 4). Time series of heating associated with loss of ice and warming of the atmosphere and continental land surface are obtained from the recent Global Climate Observing System (GCOS) initiative (von Schuckmann et al., 2023b; Adusumilli et al., 2022; Cuesta-Valero et al., 2023b; Vanderkelen and Thiery, 2022; Nitzbon et al., 2022b; Kirchengast et al., 2022). We use the original AR6 time series ensemble OHC time series for the period 1971–2018 and then switch to a smaller four-member ensemble for the period 2019–2022. We “splice” the two sets of time series by adding an offset as needed to ensure that the 2018 values are identical. The AR6 heating rates and uncertainties for the ocean below 2000 m are assumed to be constant through the period. The time evolution of the Earth heat inventory is determined as a simple summation of time series of atmospheric heating; continental land heating; heating of the cryosphere; and heating of the ocean over three depth layers, 0–700, 700–2000 and below 2000 m (Fig. 4a). While von Schuckmann et al. (2023a) have also quantified heating of permafrost and inland lakes and reservoirs, these additional terms are very small and are omitted here for consistency with AR6 (Forster et al., 2021).
Table 5Estimates of the Earth energy imbalance (EEI) for AR6 and the present study.
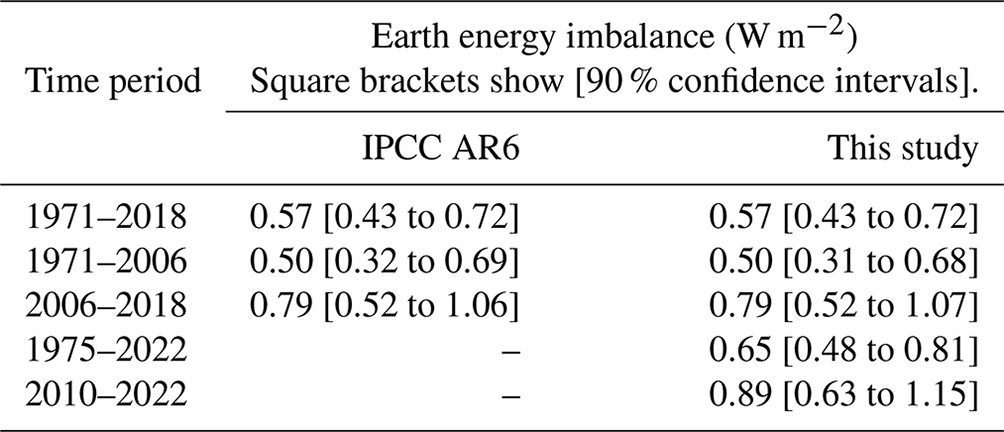
A full propagation of uncertainties across all heat inventory components depends on the specific choice of time period, and different estimates are not directly comparable. Therefore, we take a simple pragmatic approach, using the total ocean heat content uncertainty as a proxy for the total uncertainty, since this term is 2 orders of magnitude larger than the other terms (Forster et al., 2021). To provide estimates of the EEI up to the year 2022, we scale up the values of OHC change in 2021 and 2022 to reflect the about 90 % contribution of the ocean to changes in the Earth heat inventory. The EEI is then simply computed as the difference in global energy inventory over each period, converted to units of watts per square metre (W m−2) using the surface area of the Earth and the elapsed time. The uncertainties in the global energy inventory for the end-point years are assumed to be independent and added in quadrature, following the approach used in AR6 (Forster et al., 2021).
In our updated analysis, we find successive increases in EEI for each 20-year period since 1973, with an estimated value of 0.44 [0.05 to 0.83] W m−2 during 1973–1992 that almost doubled to 0.82 [0.60 to 1.04] W m−2 during 2003–2022 (Fig. 4b). In addition, there is some evidence that the warming signal is propagating into the deeper ocean over time, as seen by a robust increase of deep (700–2000 m) ocean warming since the 1990s (Cheng et al., 2019, 2022). The model simulations qualitatively agree with the observational evidence (e.g. Gleckler et al., 2016; Cheng et al., 2019), further suggesting that more than half of the OHC increase since the late 1800s occurs after the 1990s. For 1973–1992, the contribution by ocean vertical layer was 66 %, 28 % and 1 % for 0–700, 700–2000 and >2000 m, respectively. During 2013–2022, the corresponding layer contributions were 50 %, 33 % and 8 %.
The update of the AR6 assessment periods to end in 2022 results in systematic increases of EEI of 0.08 W m−2 for 1975–2022 relative to 1971–2018 and 0.10 W m−2 for 2010–2022 relative to 2006–2018 (Table 5).
Human-induced warming, also known as anthropogenic warming, refers to the component of observed global surface temperature increase over a specific period (for instance, from 1850–1900 as a proxy for pre-industrial climate to the last decade) attributable to both the direct and indirect effects of human activities, which are typically grouped as follows: well-mixed greenhouse gases (consisting of CO2, CH4, N2O and F-gases) and other human forcings (consisting of aerosol–radiation interaction, aerosol–cloud interaction, black carbon on snow, contrails, ozone, stratospheric H2O and land use) (Eyring et al., 2021). While total warming, the actual observed temperature change potentially resulting from both natural climate variability (internal variability of the climate system and the climate response to natural forcing) and human influences, is the quantity directly related to climate impacts and therefore relevant for adaptation, mitigation efforts focus on human-induced warming as the more relevant indicator for tracking progress against climate stabilisation targets. Further, as the attribution analysis allows human-induced warming to be disentangled from possible contributions from solar and volcanic forcing and internal variability (e.g. related to El Niño/La Nina events), it avoids misperception about short-term fluctuations in temperature. An assessment of human-induced warming was therefore provided in two reports within the IPCC's 6th assessment cycle: first in SR1.5 in 2018 (Chap. 1 Sect. 1.2.1.3 and Fig. 1.2 (Allen et al., 2018), summarised in the Summary for Policymakers (SPM) Sect. A.1 and Fig. SPM.1 (IPCC, 2018)) and second in AR6 in 2021 (WGI Chap. 3 Sect. 3.3.1.1.2 and Fig. 3.8 (Eyring et al., 2021), summarised in WGI SPM A.1.3 and Fig. SPM.2 (IPCC, 2021b)).
7.1 Definitions
7.1.1 Warming period definitions in the IPCC Sixth Assessment cycle
AR6 defined the current human-induced warming relative to the 1850–1900 baseline as the decade average of the previous 10-year period (see AR6 WGI Chap. 3). This paper provides an update of the 2010–2019 period used in the AR6 to the 2013–2022 decade. SR1.5 defined current human-induced warming as the average of a 30-year period centred on the current year, assuming the recent rate of warming continues (see SR1.5 Chap. 1). This definition is currently almost identical to the present-day single-year value of human-induced warming, differing by about 0.01 ∘C (see results in Sect. 7.4); the attribution assessment in SR1.5 was therefore provided as a single-year warming. This section also updates the SR1.5 single-year approach by providing a year 2022 value.
7.1.2 Estimates of global surface temperature: GMST and GSAT
AR6 WGI (Chap. 2 Cross-Chap. Box 2.3, Gulev et al., 2021) described how global mean surface air temperature (GSAT), as is typically diagnosed from climate models, is physically distinct from the global mean surface temperature (GMST) estimated from observations, which generally combine measurements of near-surface temperature over land and in some cases over ice, with measurements of sea surface temperature over the ocean. Based on conflicting lines of evidence from climate models, which show stronger warming of GSAT compared to GMST, and observations, which tend to show the opposite, Gulev et al. (2021) assessed with high confidence that long-term trends in the two indicators differ by less than 10 % but that there is low confidence in the sign of the difference in trends. Therefore, with medium confidence, in AR6 WGI Chap. 3 (Eyring et al., 2021), the best estimates and likely ranges for attributable warming expressed in terms of GMST were assessed to be equal to those for GSAT, with the consequence that the AR6 warming attribution results can be interpreted as both GMST and GSAT. While, based on the WGI Chap. 2 (Gulev et al., 2021) assessment, WGI Chap. 3 (Eyring et al., 2021) treated estimates of attributable warming in GSAT and GMST from the literature together, without any rescaling, we note that climate-model-based estimates of attributable warming in GSAT are expected to be systematically higher than corresponding estimates of attributable warming in GMST (see e.g. Cowtan et al., 2015; Richardson et al., 2018; Beusch et al., 2020; Gillett et al., 2021). Therefore, given an opportunity to update these analyses from AR6, it is more consistent and more comparable with observations of GMST to report attributable changes in GMST using all three methods (described in Sect. 7.2). The SR1.5 assessment of attributable warming was given in terms of GMST, which is continued here. In line with Sect. 2 and AR6 WGI, we adopt GMST as the estimate of global surface temperature.
7.2 Methods
Both SR1.5 and AR6 drew on evidence from a range of literature for their assessments of human-induced warming, before selecting results from a smaller subset to produce a quantified estimate. While both the SR1.5 and AR6 assessments used the latest Global Warming Index (GWI) results (Haustein et al., 2017), AR6 also incorporated results from two other methods, regularised optimal fingerprinting (ROF) (as in Gillett et al., 2021) and kriging for climate change (KCC) (as in Ribes et al., 2021). In AR6, all three methods gave results consistent not only with each other but also results from AR6 WGI Chap. 7 (see WGI Chap. 7 Supplementary Material (Smith et al., 2021) and Fig. 3.8 of AR6 WGI Chap. 3 (Eyring et al., 2021) and Supplement, Sect. S7 and Fig. S2), though the results from Chap. 7 were not included in the AR6 WGI final calculation because they were not statistically independent. Of the methods used, two (Gillett et al., 2021; Ribes et al., 2021) relied on CMIP6 DAMIP (Gillett et al., 2016) simulations which ended in 2020 and hence require modifications to update to the most recent years. The other two methods (Haustein et al., 2017; Smith et al., 2021) are updatable and can also be made consistent with other aspects of the AR6 assessment and methods. The three methods used in the final assessment of contributions to warming in AR6 are used again with revisions for this annual update and are presented in the Supplement, Sect. S7, with any updates to their approaches described in Sect. 7.2.
Table 6Updates to assessments in the IPCC 6th assessment cycle of warming attributable to multiple influences. Estimates of warming attributable to multiple influences, in ∘C, relative to the 1850–1900 baseline period. Results are given as best estimates, with the likely range in brackets, and reported as global mean surface temperature.
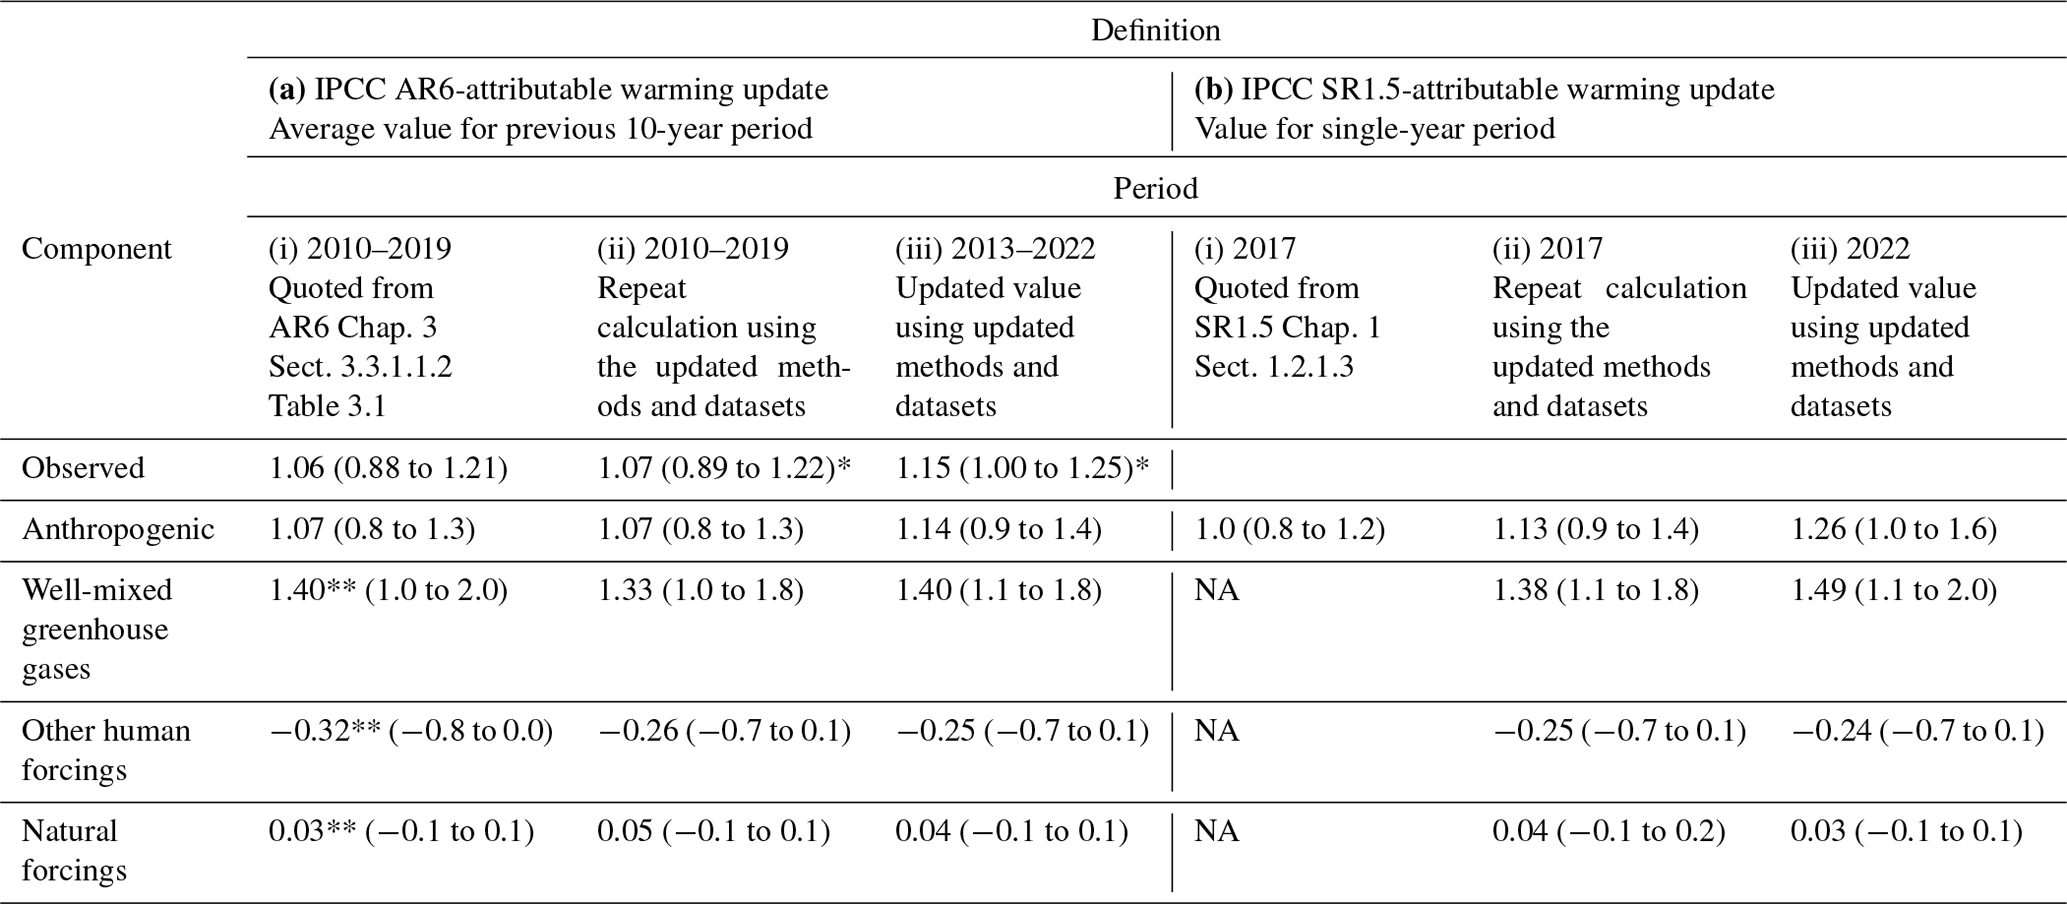
Results from the IPCC 6th assessment cycle, for both AR6 and SR1.5, are
quoted in columns labelled (i) and are compared with repeat calculations in
columns labelled (ii) for the same period using the updated methods and
datasets to see how methodological and dataset updates alone would change
previous assessments. Assessments for the updated periods are reported in
columns labelled (iii). * Updated GMST observations, quoted
from Sect. 5 of this update, are marked with an asterisk, with “very likely”
ranges given in brackets. ** In AR6 WGI, best-estimate values were not
provided for warming attributable to well-mixed greenhouse gases, other
human forcings and natural forcings (though they did receive a “likely”
range, as discussed in Sect. 7.3.1); for comparison, best estimates (marked
with two asterisks) have been retrospectively calculated in an identical way
to the best estimate that AR6 provided for anthropogenic warming.
NA: not available.
7.3 Updated estimates of human-induced warming to date
7.3.1 Updated estimate using the AR6 WGI methodology
Factoring in results from all three methods, AR6 WGI Chap. 3 (Erying et al., 2021) defined the likely (66 %–100 % probability interval) range for each warming component as the smallest 0.1 ∘C precision range that enveloped the 5th to 95th percentile ranges of each method. In addition, a best estimate was provided for the human-induced (Ant) warming component, calculated as the mean of the 50th percentile values for each method. Best estimates were not provided in AR6 for the other components (well-mixed greenhouse gases (GHGs), other human forcings (OHFs) and natural forcings (Nat)), with their values in AR6 WGI Fig. SPM.2(b) simply being given as the midpoint between the lower and upper bound of the likely range and therefore not directly comparable with the central values given for human-induced and observed warming. In order to make a meaningful and consistent comparison, and provide meaningful insight into interannual changes, an improvement is made in this update: the multi-method-mean best-estimate approach is extended for all warming components.
7.3.2 Updated estimate using the SR1.5 methodology applied to the AR6 WGI datasets
While a variety of literature was drawn upon for the assessment of human-induced warming in SR1.5 Chap. 1 (Allen et al., 2018), only one method, the Global Warming Index (GWI), was used to provide a quantitative assessment of the 2017, “present-day”, level of human-induced warming. The latest results for this method were provided by Haustein et al. (2017), who gave a central estimate for human-induced warming in 2017 of 1.01 ∘C with a 5 %–95 % range of (0.87 to 1.22 ∘C). SR1.5 then accounted for methodological uncertainty by rounding this value to 0.1 ∘C precision for its final assessment of 1.0 ∘C and assessing the 0.8 to 1.2 ∘C range as a likely range. No assessment of the contributions from other components was provided due to limitations in the GWI approach at the time.
While it is possible to continue the SR1.5 assessment approach of using a single method (GWI) rounded to 0.1 ∘C precision, for the purpose of providing annual updates this is insufficient; (i) 0.1 ∘C precision is too coarse to capture meaningful inter-annual changes to the level of present-day warming, (ii) using different selections of methods prevents meaningful comparison between the results for decadal mean and present-day warming calculations, and (iii) using the mean of multiple methods increases the robustness of the results. These points are simultaneously addressed in this update by adopting the latest multi-method assessment approach, as established in WGI AR6, for both the AR6 decadal mean warming update and the SR1.5 present-day single-year warming update. Further, where SR1.5 only provided an assessment for human-induced warming, updates in available attribution methods since SR1.5 mean that it is now also possible to provide a fully consistent assessment for all warming components. As with the attribution assessment in SR1.5, this update reports values in Table 6b for single-year present-day attributable warming (as discussed in Sect. 7.1.1), with a comparison to results calculated using the SR1.5 trend-based definition also provided below in Sect. 7.4.
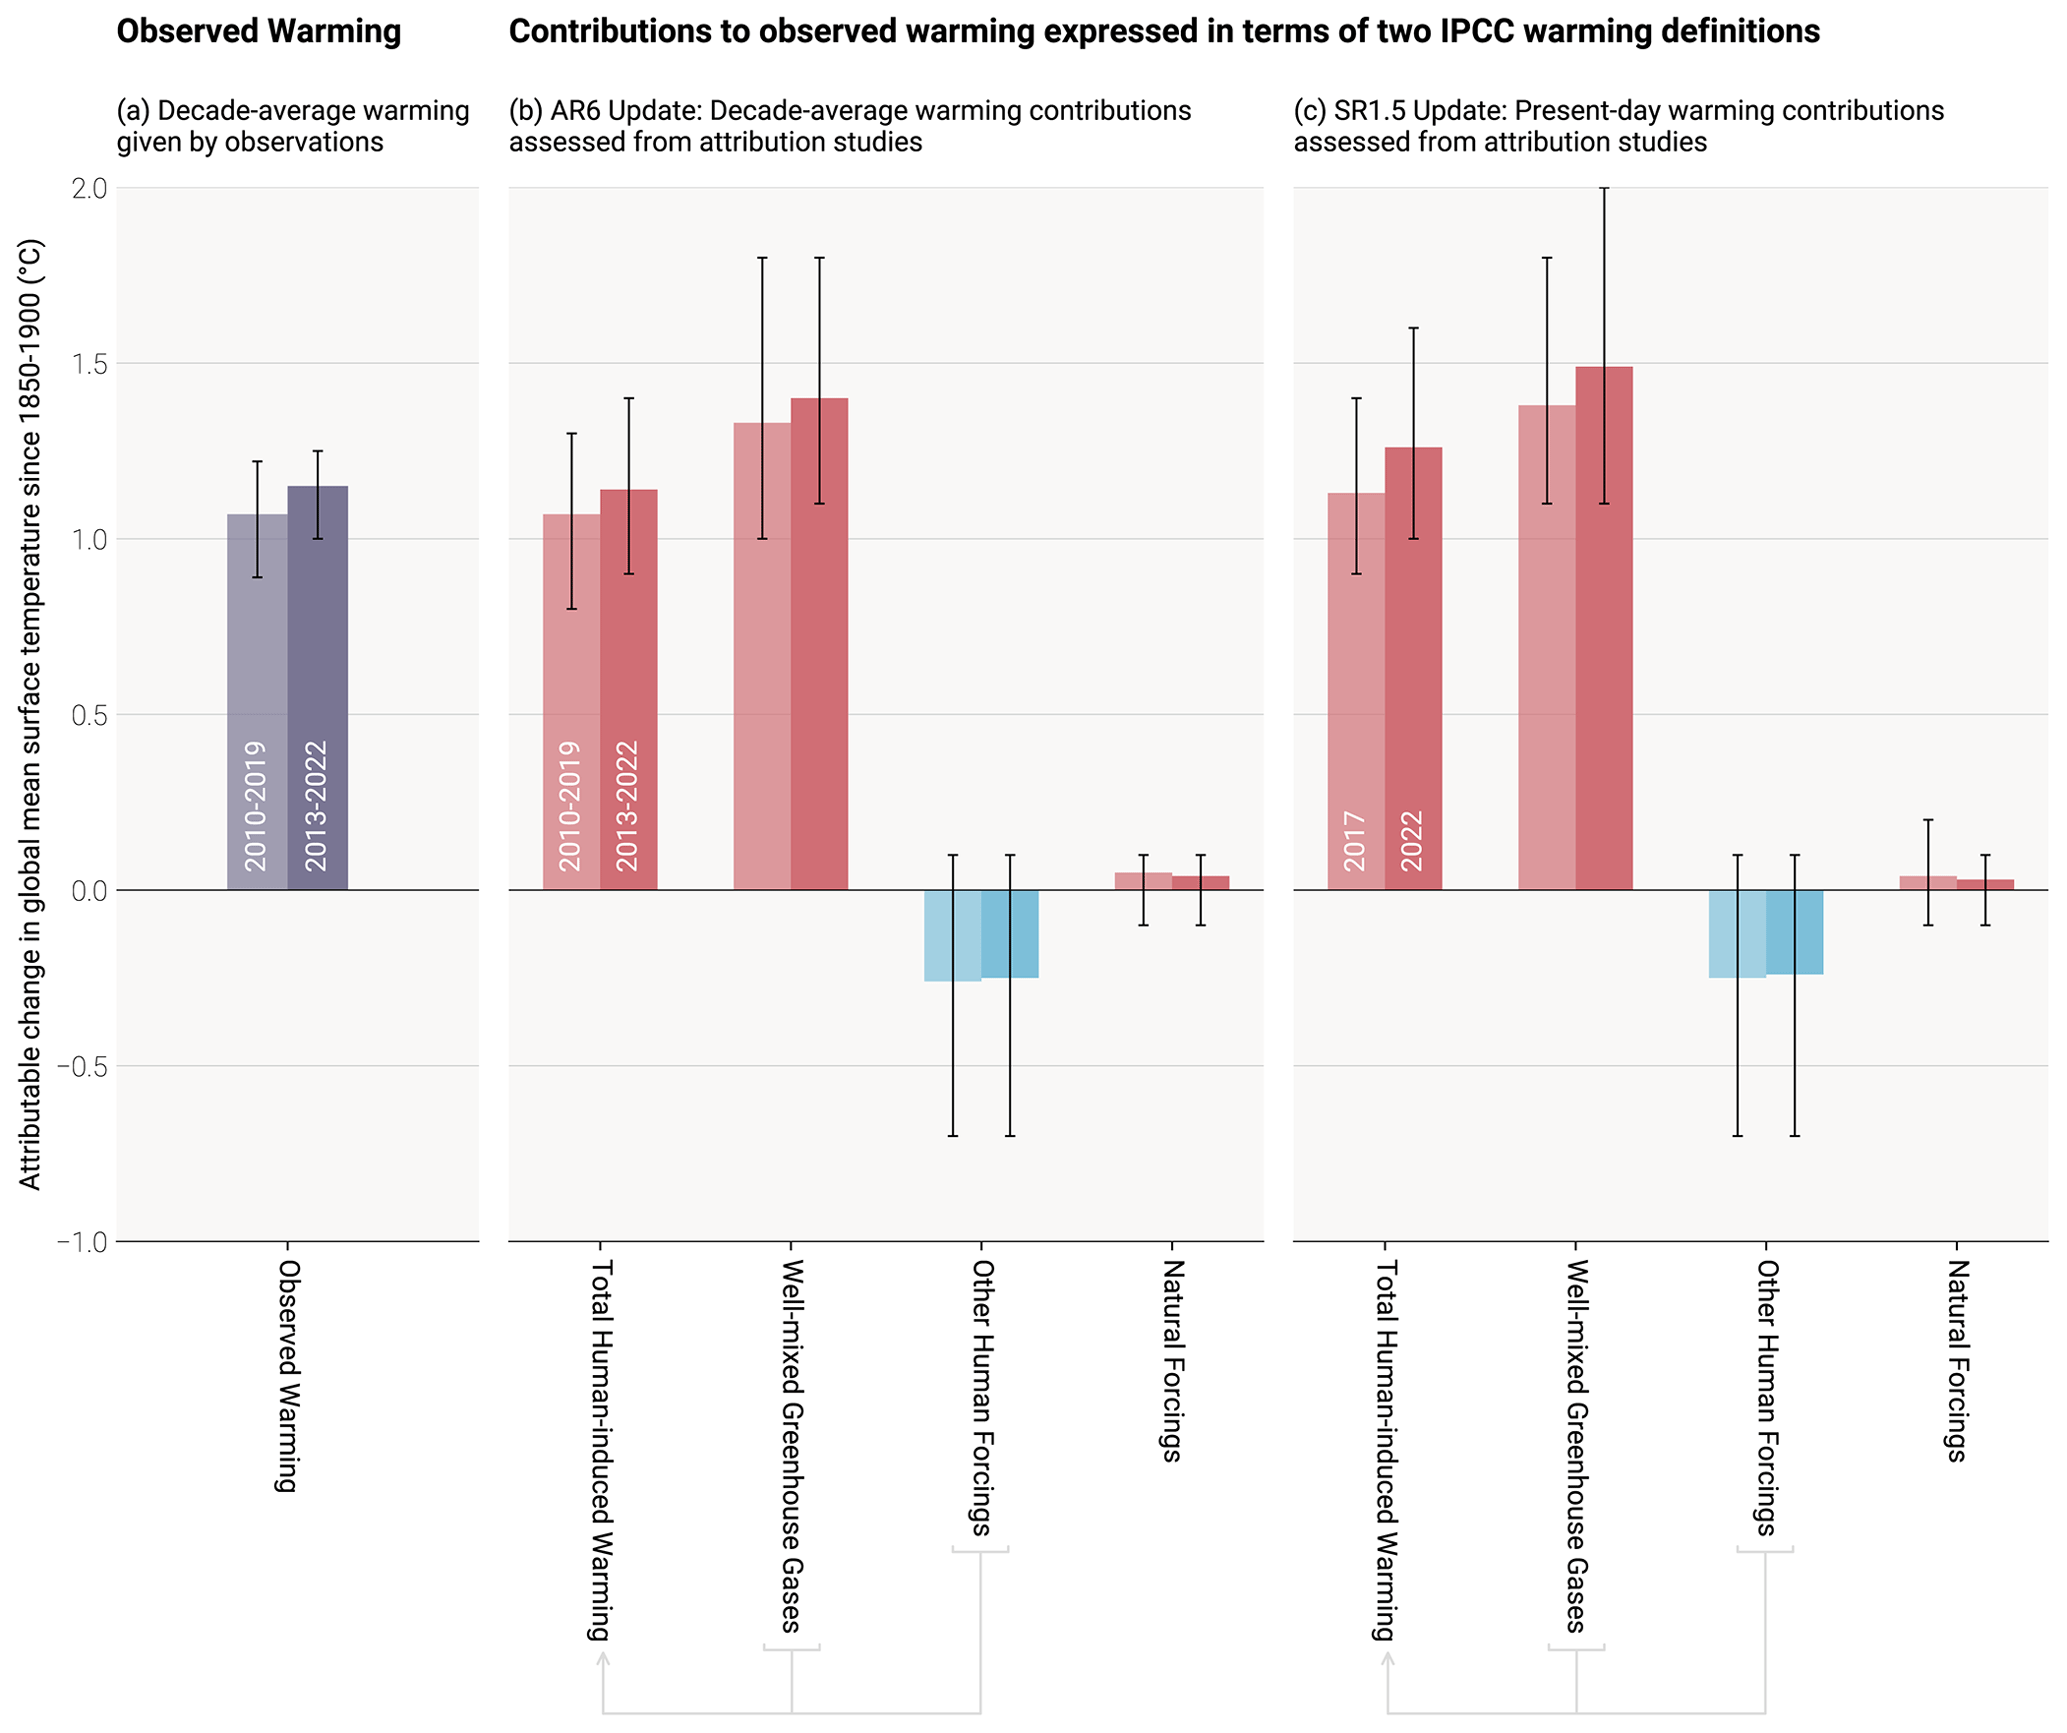
Figure 5Updated assessed contributions to observed warming relative to 1850–1900; see AR6 WGI SPM.2. Results for all time periods in this figure are calculated using updated datasets and methods. The 2010–2019 decade-average-assessed results repeat the AR6 2010–2019 assessment, and the 2017 single-year-assessed results repeat the SR1.5 2017 assessment. For each double bar, the lighter and darker shading refers to the earlier and later period, respectively. The 2013–2022 decade-average and 2022 single-year results are the updated assessments for AR6 and SR1.5, respectively. Panel (a) shows updated observed global warming from Sect. 5, expressed as total GMST, due to both anthropogenic and natural influences. Whiskers give the very likely range. Panels (b) and (c) show updated assessed contributions to warming, expressed as global mean surface temperature, from natural forcings and total human-induced forcings, which in turn consist of contributions from well-mixed greenhouse gases and other human forcings. Whiskers give the likely range.
7.4 Results
Results are summarised in Table 6 and Fig. 5. WGI AR6 results for 2010–2019 are quoted in Table 6a, compared with a repeat calculation using updated methods and datasets, and finally updated for the 2013–2022 period. Results from SR1.5 are quoted in Table 6b for the 2017 level of human-induced warming, compared with a repeat calculation using the updated selection of methods and datasets (see Sect. 7.2) and the WGI AR6 multi-method assessment approach (see Sect. 7.3.2), and finally updated for 2022. Method-specific contributions to the assessment results, along with time series, are given in the Supplement, Sect. S7.
The repeat calculations for attributable warming in 2010–2019 exhibit good correspondence with the results in WGI AR6 for the same period (see also Supplement, Sect. S7), with an exact correspondence in the best estimate and likely (66 % to 100 % probability) range of human-induced warming (Ant).
The repeat calculation for the level of attributable anthropogenic warming in 2017 is about 0.1 ∘C larger than the estimate provided in SR1.5 for the same period, resulting from changes in methods and observational data (see above). The updated results for warming contributions in 2022 are also higher than in 2017 due to 5 additional years of anthropogenic forcing. A repeat assessment using the SR1.5 trend-based definition (see Sect. 7.1.1) leads to results that are very similar to the single-year results reported in Table 6b, with 0.02 ∘C differences at most (Supplement, Sect. S7).
The attribution assessment in WGI AR6 concluded that, averaged for the 2010–2019 period, all observed warming was human-induced, with solar and volcanic drivers and internal climate variability estimated not to make a contribution. This conclusion remains the same for the 2013–2022 period. Generally, whatever methodology is used, the best estimate of the human-induced warming to date is (within small uncertainties) equal to the observed warming to date.
AR6 assessed the remaining carbon budget (RCB) in Chap. 5 of its WGI report (Canadell et al., 2021) for 1.5, 1.7 and 2 ∘C thresholds (see Table 7). They were also reported in its Summary for Policymakers (Table SPM.2, IPCC, 2021b). These are updated in this section using the same method with transparently described updates.
Table 7Updated estimates of the remaining carbon budget for 1.5, 1.7 and 2.0 ∘C, for five levels of likelihood, considering only uncertainty in TCRE.
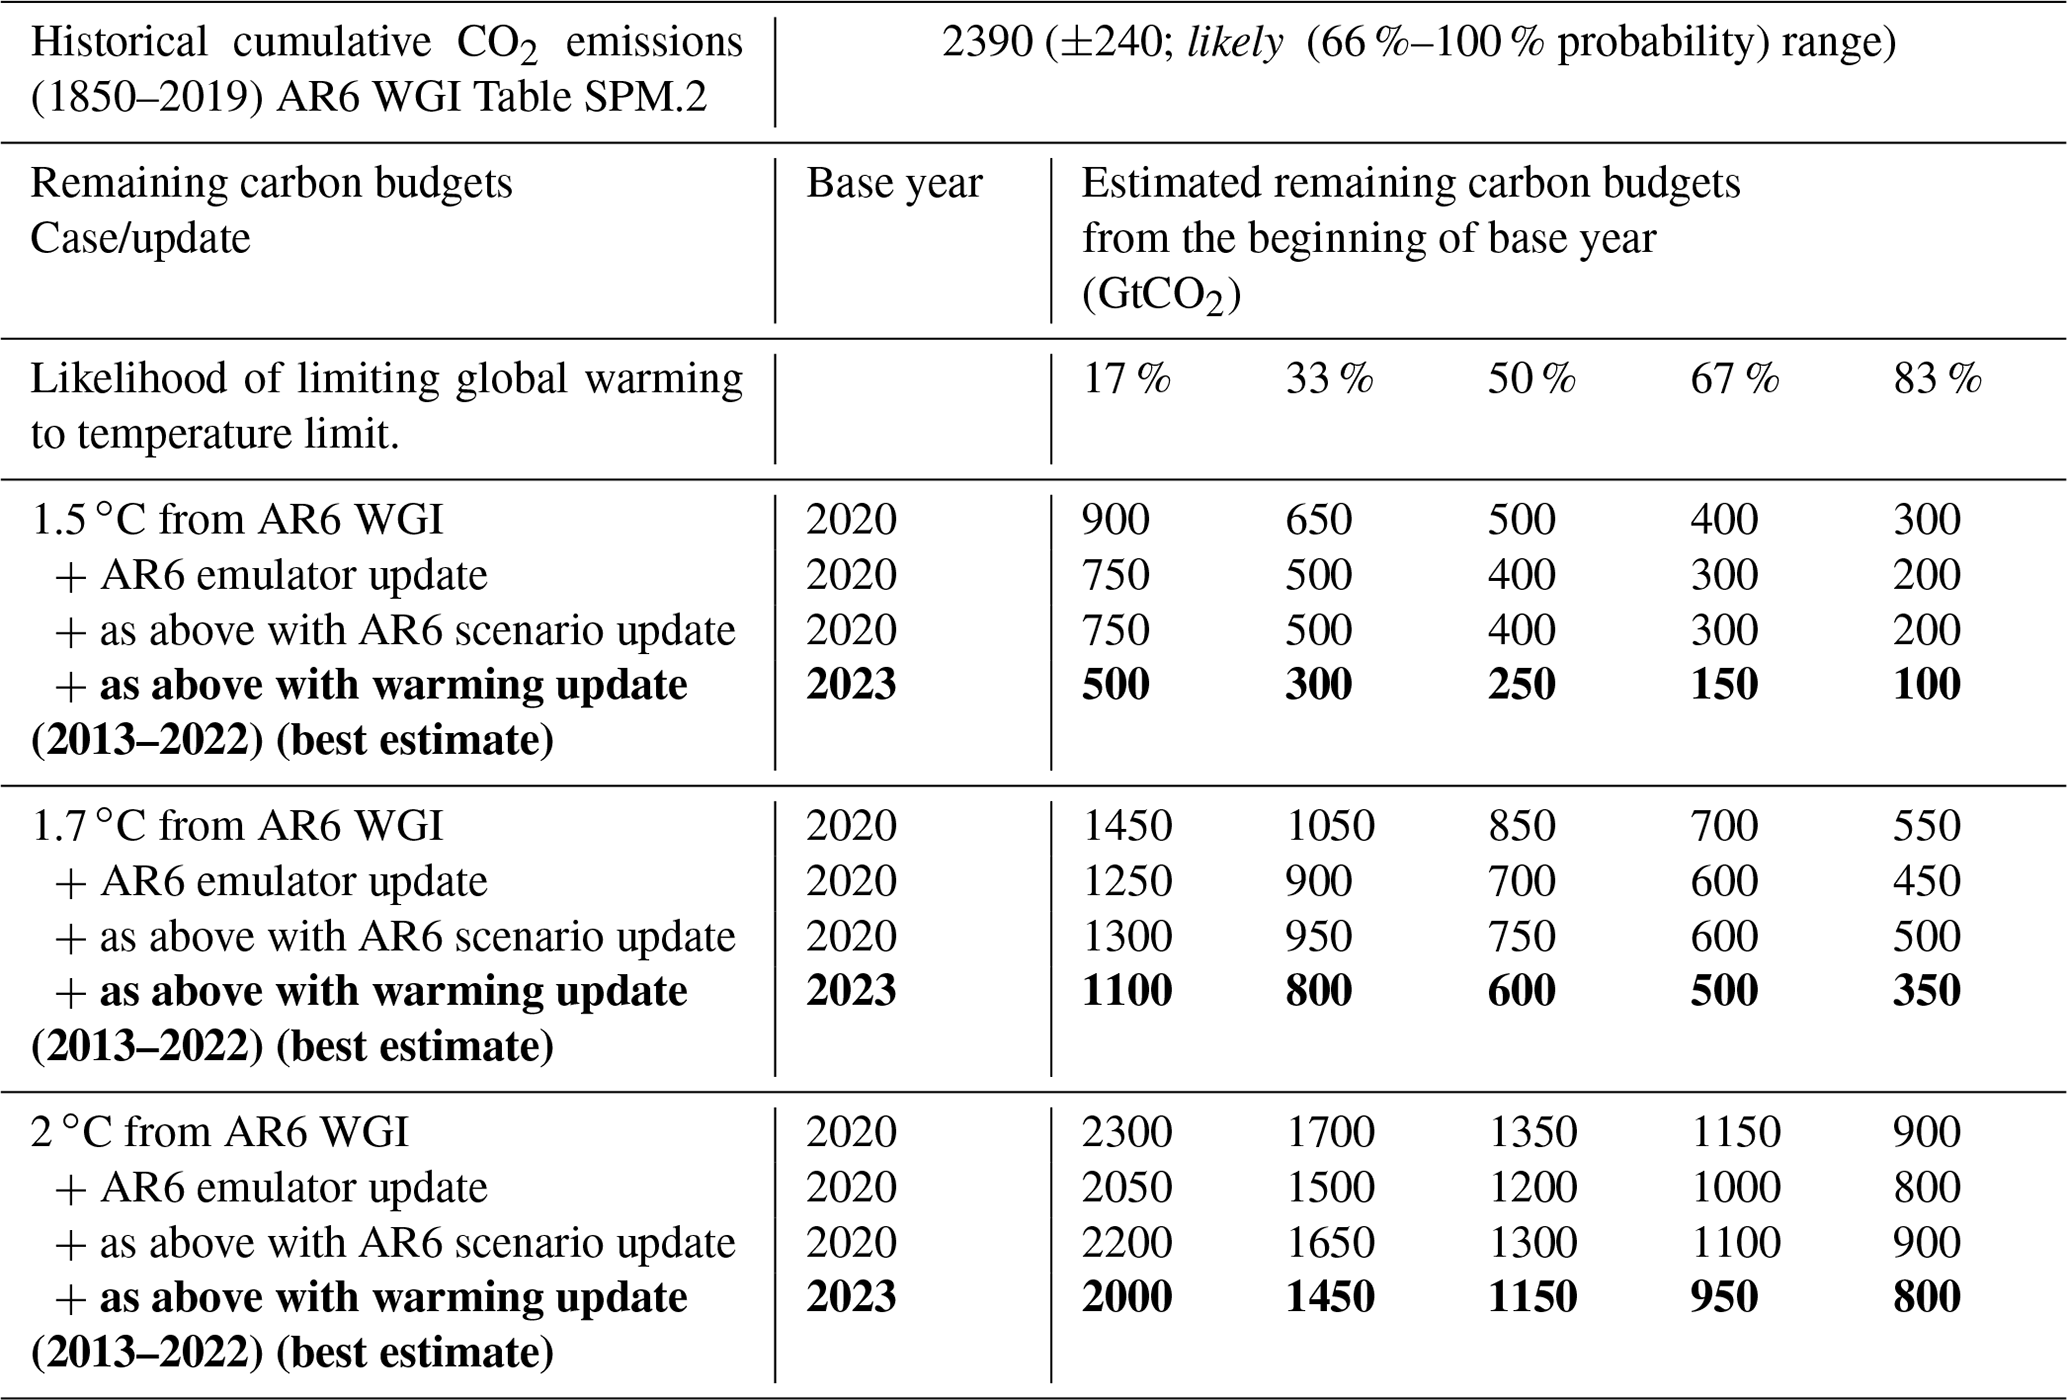
Estimates start from AR6 WGI estimates (first row for each warming level), updated with the latest scenario information from AR6 WGIII (from second row for each warming level), and an update of the anthropogenic historical warming, which is estimated for the 2013–2022 period (third row for each warming level). Estimates are expressed relative to either the start of the year 2020 or 2023. The probability includes only the uncertainty in how the Earth immediately responds to carbon, not long-term committed warming or uncertainty in other emissions. All values are rounded to the nearest 50 GtCO2.
AR5 (IPCC, 2013) assessed that global surface temperature increase is close to linearly proportional to the total amount of cumulative CO2 emissions (Collins et al., 2013). The most recent AR6 report reaffirmed this assessment (Canadell et al., 2021). This near-linear relationship implies that for keeping global warming below a specified temperature level, one can estimate the total amount of CO2 that can ever be emitted. When expressed relative to a recent reference period, this is referred to as the remaining carbon budget (Rogelj et al., 2018).
The RCB is estimated by application of the WGI AR6 method described in Rogelj et al. (2019), which involves the combination of the assessment of five factors: (i) the most recent decade of human-induced warming, (ii) the transient climate response to cumulative emissions of CO2 (TCRE), (iii) the zero emissions commitment (ZEC), (iv) the temperature contribution of non-CO2 emissions and (v) an adjustment term for Earth system feedbacks that are otherwise not captured through the other factors. AR6 WGI reassessed all five terms (Canadell et al., 2021). The incorporation of factor (v) was further considered by Lamboll and Rogelj (2022).
Of these factors, only factor (i) (human-induced warming), where AR6 WGI used the decade-long period, 2010–2019, lends itself to a regular and systematic annual update. Historical CO2 emissions from the middle of this period until the start of the RCB are required to have an as up-to-date RCB estimate as possible.
Other factors can be updated but depend on new evidence and insights being published rather than an additional year of observational data becoming available. Factor (iv) (temperature contribution of non-CO2 emissions) depends both on the available mitigation scenario evidence and the assessment of non-CO2 warming. Additional scenario evidence has become available through the publication of the scenario database supporting the AR6 WGIII report (Byers et al., 2022), which is taken into account in this update.
The RCB for 1.5, 1.7 and 2 ∘C warming levels is re-assessed based on the most recent available data. Estimated RCBs are reported below. They are expressed both relative to 2020 to compare to AR6 and relative to the start of 2023 for estimates based on the 2013–2022 human-induced warming update. Note that between the start of 2020 and the end of 2022, about 122 GtCO2 has been emitted (Sect. 2). Based on the variation in non-CO2 emissions across the scenarios in AR6 WGIII scenario database, the estimated RCB values can be higher or lower by around 200 GtCO2 depending on how deeply non-CO2 emissions are reduced. The impact of non-CO2 emissions on warming includes both the warming effects of other greenhouse gases such as methane and the cooling effects of aerosols such as sulfates. The impacts of these are assessed using a climate emulator (MAGICC; Meinshausen et al., 2011), which was updated to capture recent updates more accurately from the AR6 WGIII report but whose results were not captured in the AR6 WGI carbon budget estimates. This emulator update increased the estimate of the importance of aerosols, which are expected to decline with time in low emissions pathways (Rogelj et al., 2014), causing a net warming and decreasing the remaining carbon budget. The AR6 WGIII version of MAGICC is used here. If instead, the FaIR emulator were used, this would give reduced non-CO2 warming and a larger carbon budget (Lamboll and Rogelj, 2022). For example, using non-CO2 warming from the FaIR emulator to estimate the 1.5 ∘C remaining carbon budget results in 350 GtCO2 for a 50 % likelihood with a 17 %–83 % range of 200–700 GtCO2. The variation between the different estimates reflects the structural uncertainty in estimating future non-CO2 warming contributions and highlights inherent limits to the precision with which remaining carbon budgets can be quantified. Such variation in remaining carbon budget estimates illustrates that most of the total carbon budget for limiting warming to 1.5 ∘C has already been emitted and emphasises the robust insight that the 1.5 ∘C compatible budget is very small in light of continuing high global CO2 emissions.
Updated RCB estimates presented in Table 7 for 1.5, 1.7 and 2.0 ∘C of global warming are smaller than AR6, and geophysical and other uncertainties therefore have become larger in relative terms. This is a feature that will have to be kept in mind when communicating budgets. The estimates presented here differ from those presented in the annual Global Carbon Budget (GCB) publications (Friedlingstein et al., 2022a). The GCB updates have previously started from the AR6 WGI estimate and subtracted the latest estimates of historical CO2 emissions. The RCB estimates presented here consider the same updates in historical CO2 emissions from the GCB as well as the latest available quantification of human-induced warming to date and a reassessment of non-CO2 warming contributions.
If the single-year human-induced warming until 2022 (Sect. 7) were used directly in the RCB calculation, this would lead to similar remaining carbon budgets estimates to those from the decadal average approach used here; the 50 % likelihood estimates would be unchanged although other likelihoods alter somewhat because the spread due to TCRE uncertainty starts 5 years later. However, we choose to only show the decadal calculation as this was assessed to be the best estimate for human-induced warming and the method adopted in AR6 WGI.
The RCB for limiting warming to 1.5 ∘C is becoming very small. It is important, however, to correctly interpret this information. RCB estimates consider projected reductions in non-CO2 emissions that are aligned with a global transition to net zero CO2 emissions. These estimates assume median reductions in non-CO2 emissions between 2020–2050 of CH4 (50 %), N2O (25 %) and SO2 (77 %). If these non-CO2 greenhouse gas emission reductions are not achieved, the RCB will be smaller (see Supplement, Sect. S8). Note that the 50 % RCB is expected to be exhausted a few years before the 1.5 ∘C global warming level is reached due to the way it factors future warming from non-CO2 emissions into its estimate.
Climate and weather extremes are among the most visible human-induced climate changes. Within AR6 WGI, a full chapter was dedicated to the assessment of past and projected changes in extremes on continents (Seneviratne et al., 2021), and the chapter on ocean, cryosphere and sea level changes also provided assessments on changes in marine heatwaves (Fox-Kemper et al., 2021). Global indicators related to climate extremes include averaged changes in climate extremes, for example, the mean increase of annual minimum and maximum temperatures on land (AR6 WGI Chap. 11, Fig. 11.2, Seneviratne et al., 2021) or the area affected by certain types of extremes (AR6 WGI Chap. 11, Box 11.1, Fig. 1, Seneviratne et al., 2021; Sippel et al., 2015). In contrast to global surface temperature, extreme indicators are less established. They are therefore expected to be subject to improvements, reflecting advances in understanding and better data collection. Indeed, such efforts are planned within the World Climate Research Programme (WCRP) Grand Challenge on Weather and Climate Extremes, which will likely inform the next iteration of this study.
As part of this first update, we provide an upgraded version of the analysis in Fig. 11.2 from Seneviratne et al. (2021) (Fig. 6). Like the analysis of global mean temperature, the choice of datasets is based on a compromise on the length of the data record, the data availability, near-real-time updates and long-term support. As the indicator (in its current form) averages over all available land grid points, the spatial coverage should be high to obtain a meaningful average, which further limits the choice of datasets. The HadEX3 dataset (Dunn et al., 2020), which is used for Fig. 11.2 in Seneviratne et al. (2021), is static and does not cover years after 2018. We therefore additionally include the Berkeley Earth Surface Temperature dataset (building off Rohde et al., 2013) and the fifth-generation ECMWF atmospheric reanalysis of the global climate (ERA5; Hersbach et al., 2020). Berkeley Earth data currently enable an analysis of annual indices up to 2021, while ERA5 is updated daily with a latency of about 5 d (and the final release occurs after 2–3 months).
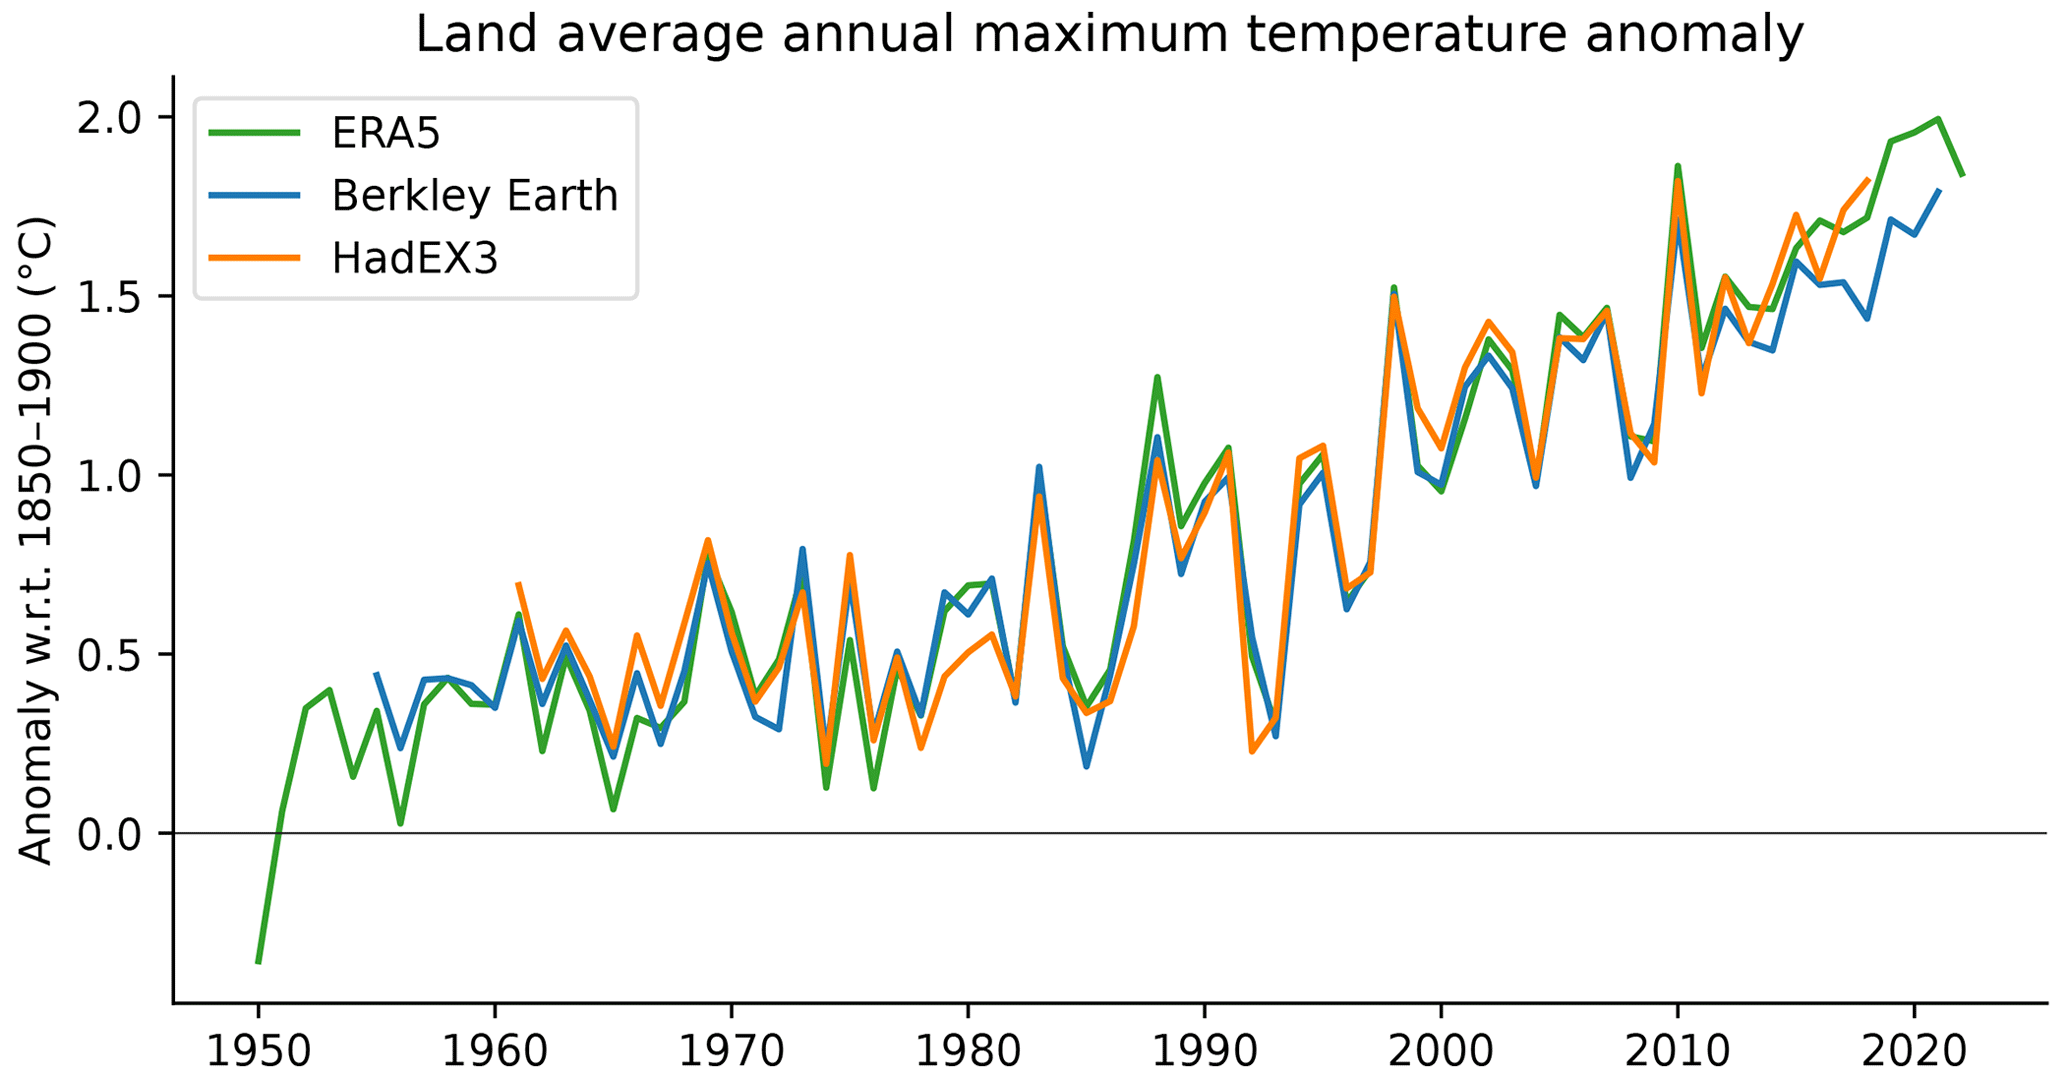
Figure 6Time series of observed temperature anomalies for land average annual maximum temperature (TXx) for ERA5 (1950–2022), Berkeley Earth (1955–2021) and HadEX3 (1961–2018), with respect to 1850–1900. Note that the datasets have different spatial coverage and are not coverage-matched. All anomalies are calculated relative to 1961–1990, and an offset of 0.53 ∘C is added to obtain TXx values relative to 1850–1900. Note that while the HadEX3 numbers are the same as shown in Seneviratne et al. (2021) Fig. 11.2, these numbers were not specifically assessed.
Our proposed climate indicator of changes in temperature extremes consists of land average annual maximum temperatures (TXx) (excluding Antarctica). For HadEX3, we select the years 1961–2018, to exclude years with insufficient data coverage, and require at least 90 % temporal completeness, thus applying the same criteria as for Fig. 11.2 (Seneviratne et al., 2021). Berkeley Earth provides daily maximum temperatures, and we require more than 99 % data availability for each individual year and grid, such that years with more than 4 missing days are removed. Based on this criterion, Berkeley Earth covers at least 95 % of the global land area from 1955 onwards. ERA5, on the other hand, has full spatio-temporal coverage by design, and hence the entire currently available period of 1950 to 2022 is used. The annual maximum temperature is then computed for each grid cell, and a global area-weighted average is calculated for all grid cells with at least 90 % temporal completeness in the respective available period (1955–2021 and 1961–2018 for Berkeley Earth and HadEX3, while ERA5 is again not affected by this criterion). We thus enforce high data availability to adequately calculate global land averaged TXx across all three datasets, but their coverage is not identical, which introduces minor deviations in the estimated global land averages. The resulting TXx time series are then computed as anomalies with respect to a baseline period of 1961–1990.
To express the TXx as anomalies with respect to 1850–1900, we add an offset to all three datasets. The offset is based on the Berkeley Earth data and is derived from the linear regression of land mean TXx to the annual mean global mean air temperature over the period 1955 to 2020. The offset is then calculated as the slope of the linear regression times the global mean temperature difference between the reference periods 1850–1900 and 1961–1990 (see Supplement, Fig. S4).
Our climate has warmed rapidly in the last few decades, which also manifests in changes in the occurrence and intensity of climate and weather extremes. We visualise this with land average annual maximum temperatures (TXx) from three different datasets (ERA5, Berkeley Earth and HadEX3), expressed as anomalies with respect to the pre-industrial baseline period of 1850–1900 (Fig. 6). From about 1980 onwards, all employed datasets point to a strong TXx increase, which coincides with the transition from global dimming, associated with aerosol increases, to brightening, associated with decreases (Wild et al., 2005). Together with strongly increasing greenhouse gas emissions (Sect. 2), this explains why human-induced climate change has emerged at an even greater pace in the last 4 decades than previously. For example, land average annual maximum temperatures have warmed by more than 0.5 ∘C in the past 10 years (1.72 ∘C with respect to pre-industrial conditions) compared to the first decade of the millennium (1.22 ∘C; Table 8). Since the offset relative to our pre-industrial baseline period is calculated relative to 1961–1990, within the latter period, temperature anomalies align by construction but can diverge afterwards. In an extensive comparison of climate extreme indices across several reanalyses and observational products, Dunn et al. (2022) point to an overall strong correspondence between temperature extreme indices across reanalysis and observational products, with ERA5 exhibiting especially high correlations to HadEX3 among all regularly updated datasets. This suggests that both our choice of datasets and approach to calculate anomalies does not affect our conclusion – the intensity of heatwaves across all land areas has unequivocally increased since pre-industrial times.
Table 8Anomalies of land average annual maximum temperature (TXx) for recent decades based on HadEX3 and ERA5.
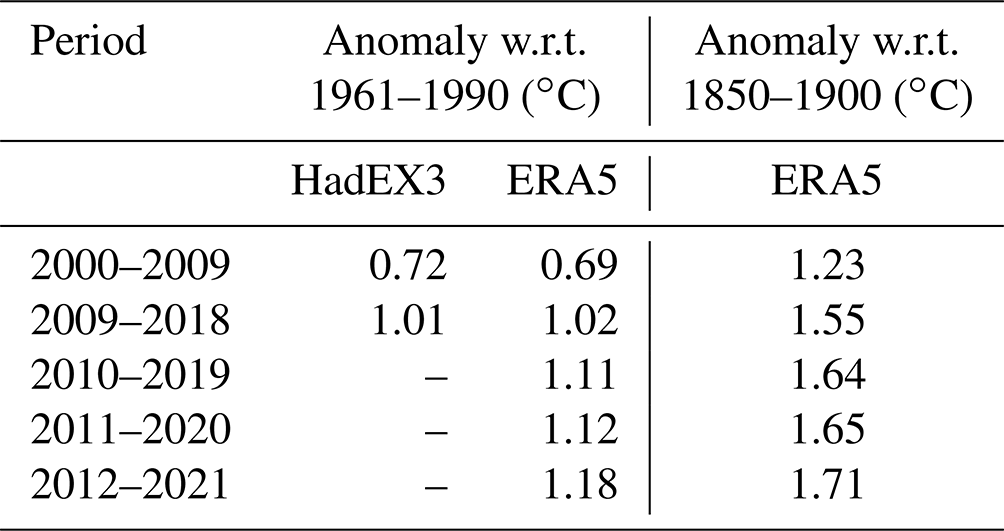
Table 9Summary of headline results and methodological updates from the Indicators of Global Climate Change (IGCC) initiative.
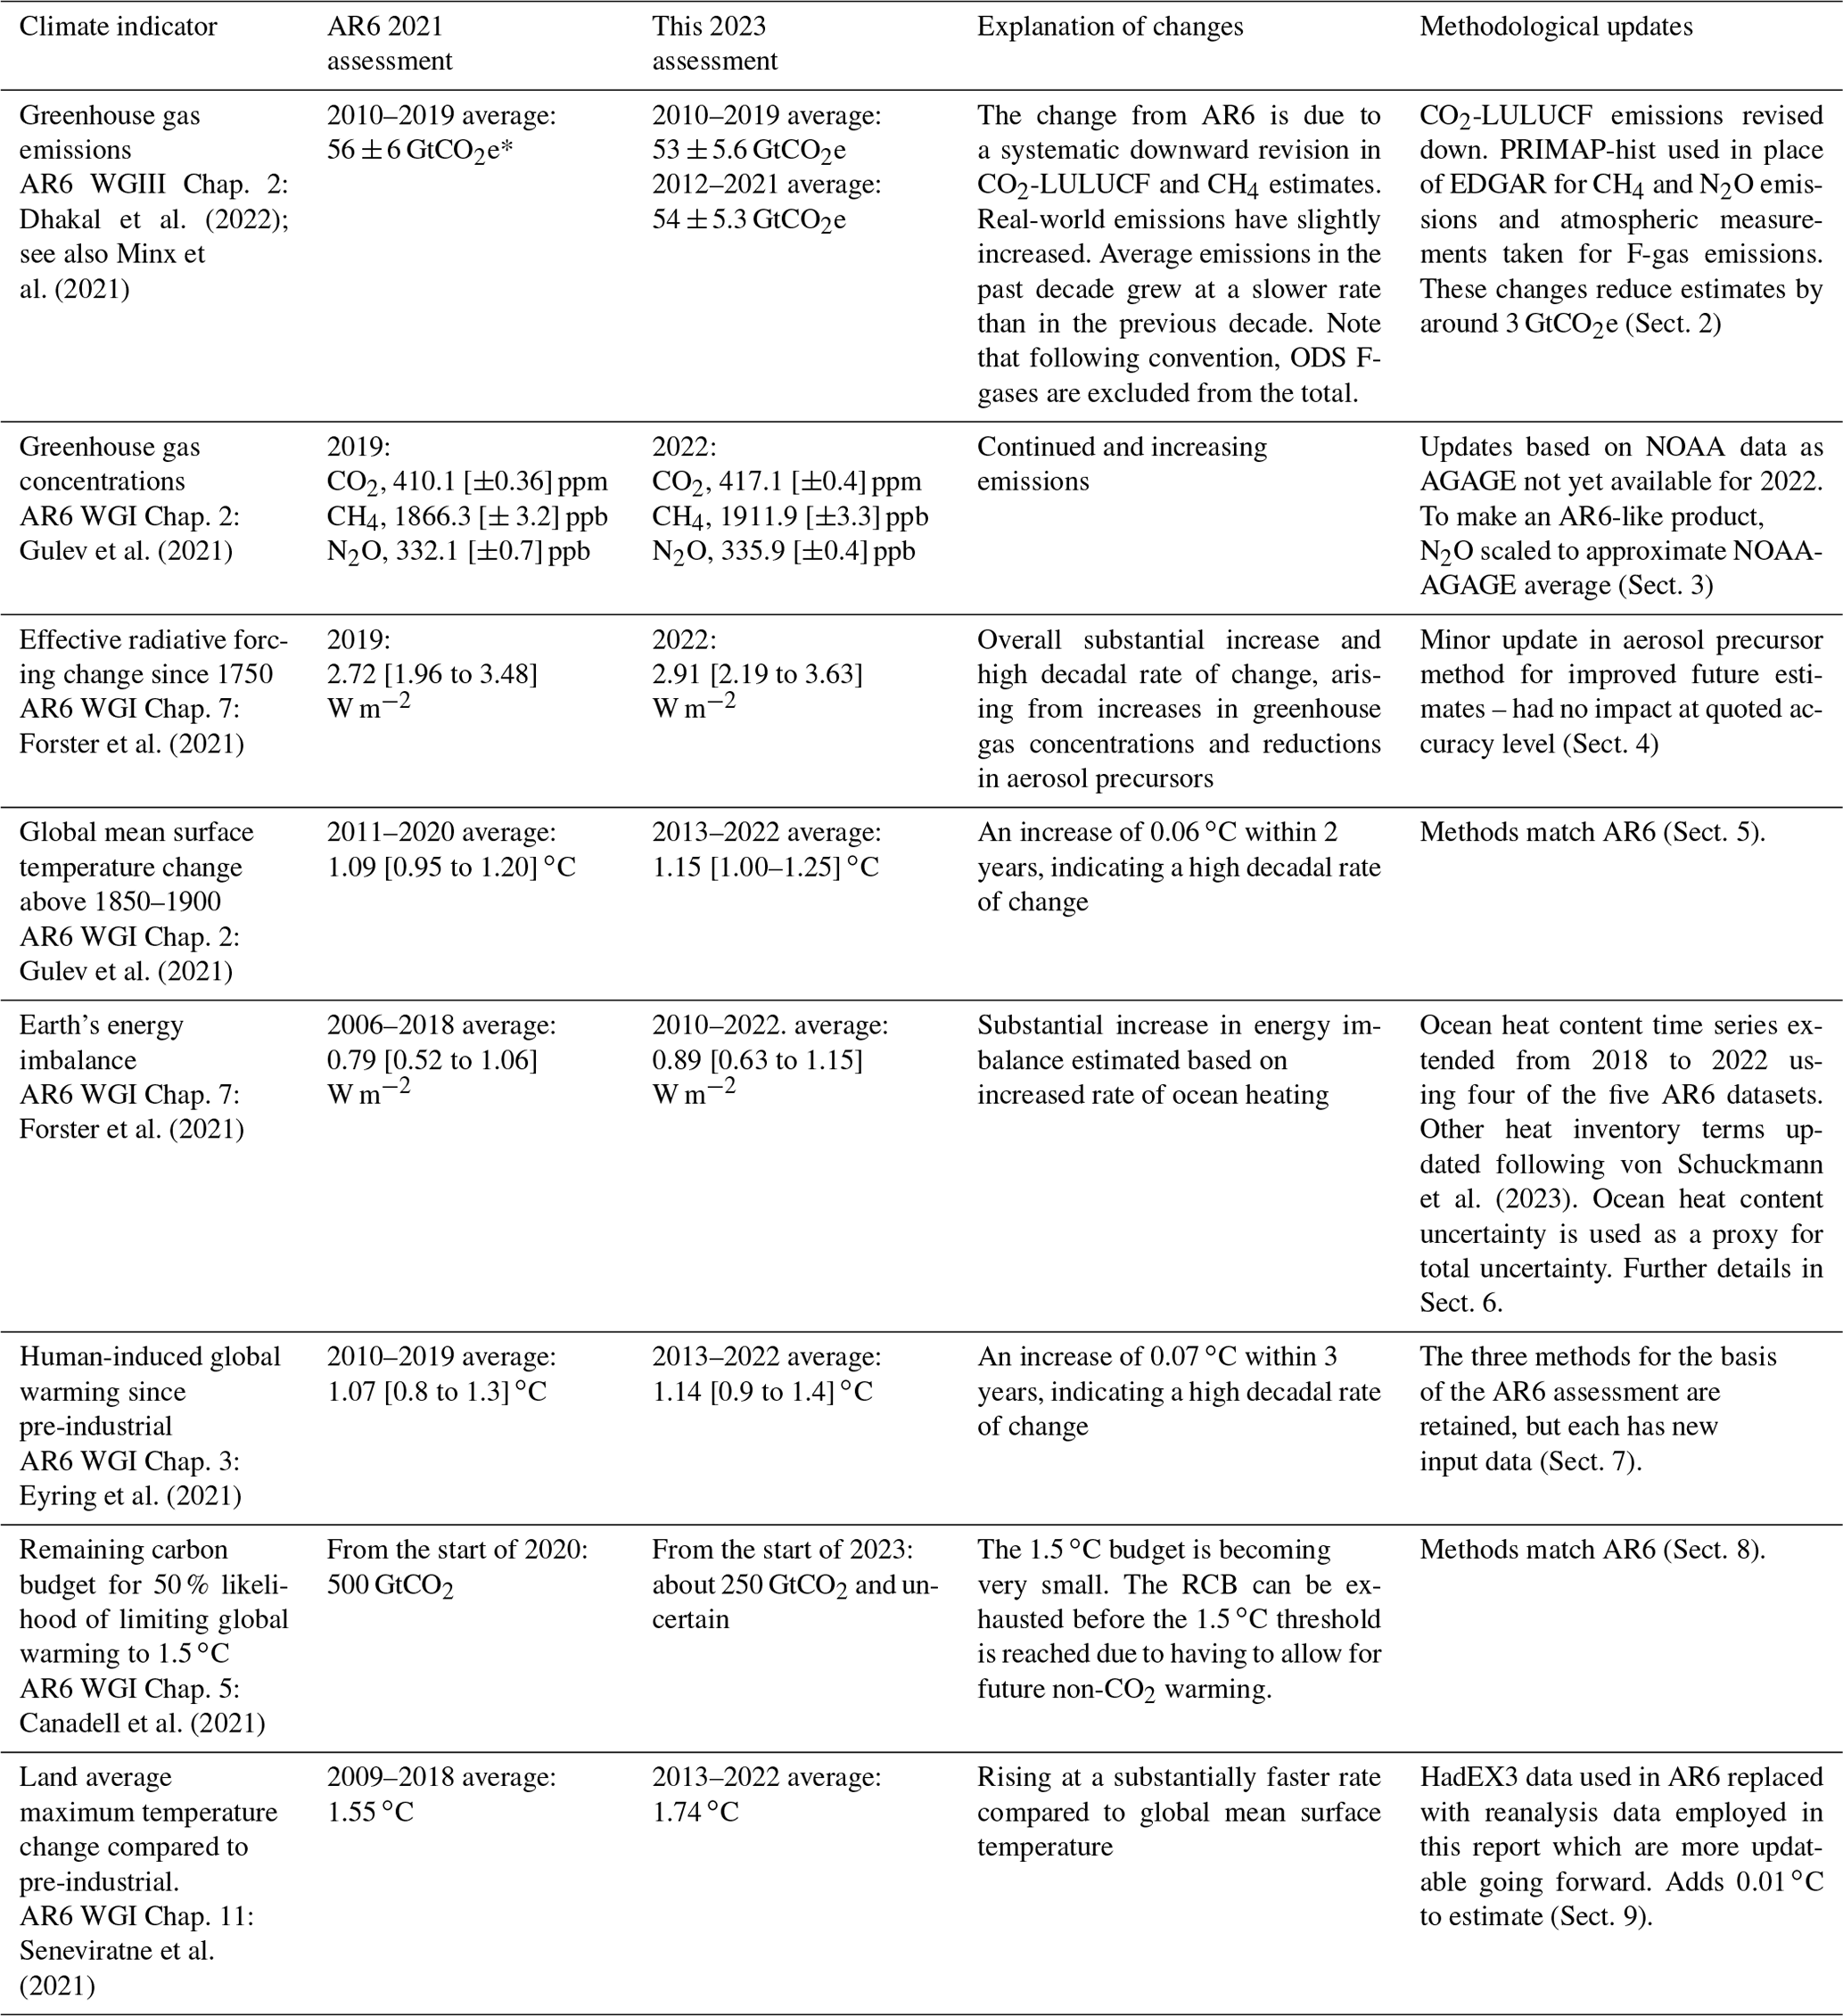
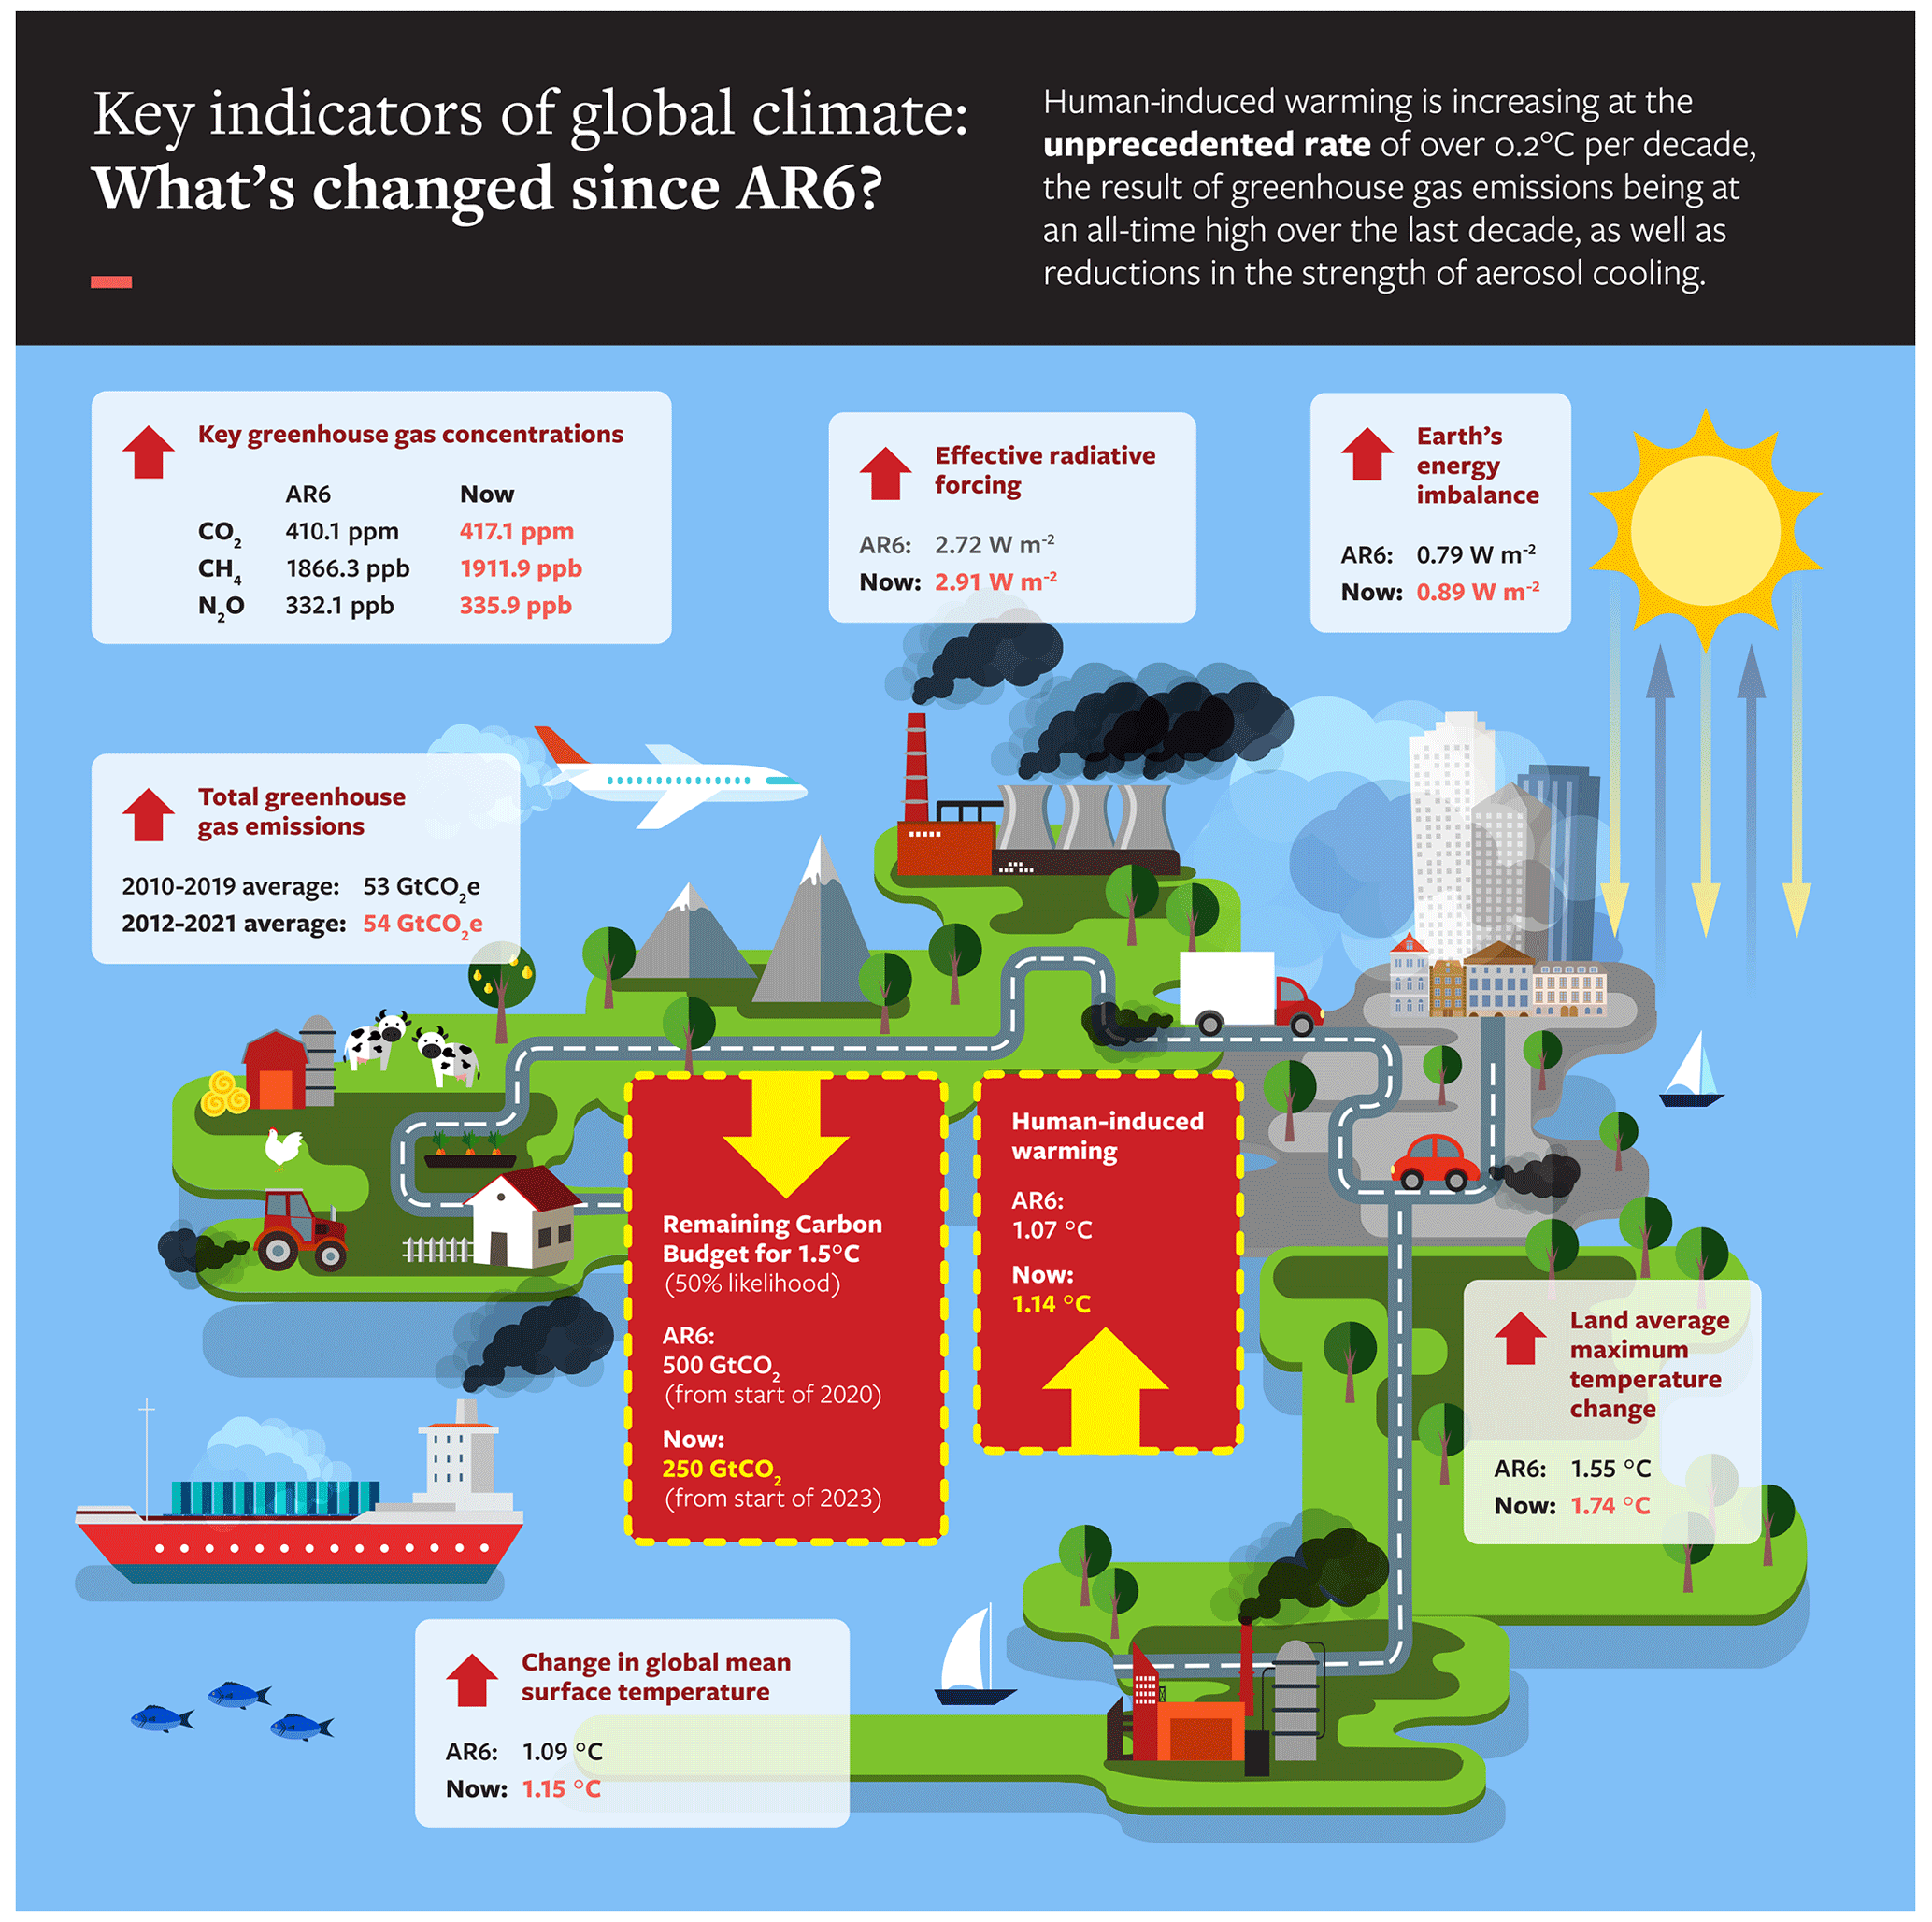
Figure 7Infographic associated with headline results in Table 9. “AR6” refers to approximately 2019, and “Now” refers to 2022. The AR6 period total emissions are our re-evaluated assessment for 2010–2019. For details and uncertainties, see Table 9.
The anomalies with respect to 1850–1900 are derived by adding an offset of 0.53 ∘C. Note that while the HadEX3 numbers are the same as shown in Seneviratne et al. (2021) Fig. 11.2, these numbers were not specifically assessed.
The Climate Change Tracker (https://climatechangetracker.org/, last access: 2 June 2023), a platform hosting a range of publicly available climate data, aims to provide a range of audiences with a reliable, user-friendly means of tracking and understanding climate change and its progression.
Building on the existing platform, a bespoke “dashboard” places several of the updated IPCC-consistent indicators of climate change set out above in the public domain. This bespoke dashboard is primarily aimed at policymakers involved in UNFCCC negotiations, but the ultimate intention is to reach and inform a much wider audience.
The dashboard initially focuses on three key indicator sets: greenhouse gas emissions (Sect. 2), human-induced global warming (Sect. 7) and the remaining global carbon budget (Sect. 8), bringing together and presenting up-to-date information crucial to effective climate decision-making in a findable, accessible, traceable and reproducible way. In addition, the Climate Change Tracker provides standardised application programming interfaces (APIs), dashboards and charts to embed in third-party apps and websites. All data are traceable to the GitHub repository employed for this paper (Sect. 11).
In time, and with feedback from the user community, the initial set of indicators displayed by the dashboard may be expanded to include others alongside their rates of change.
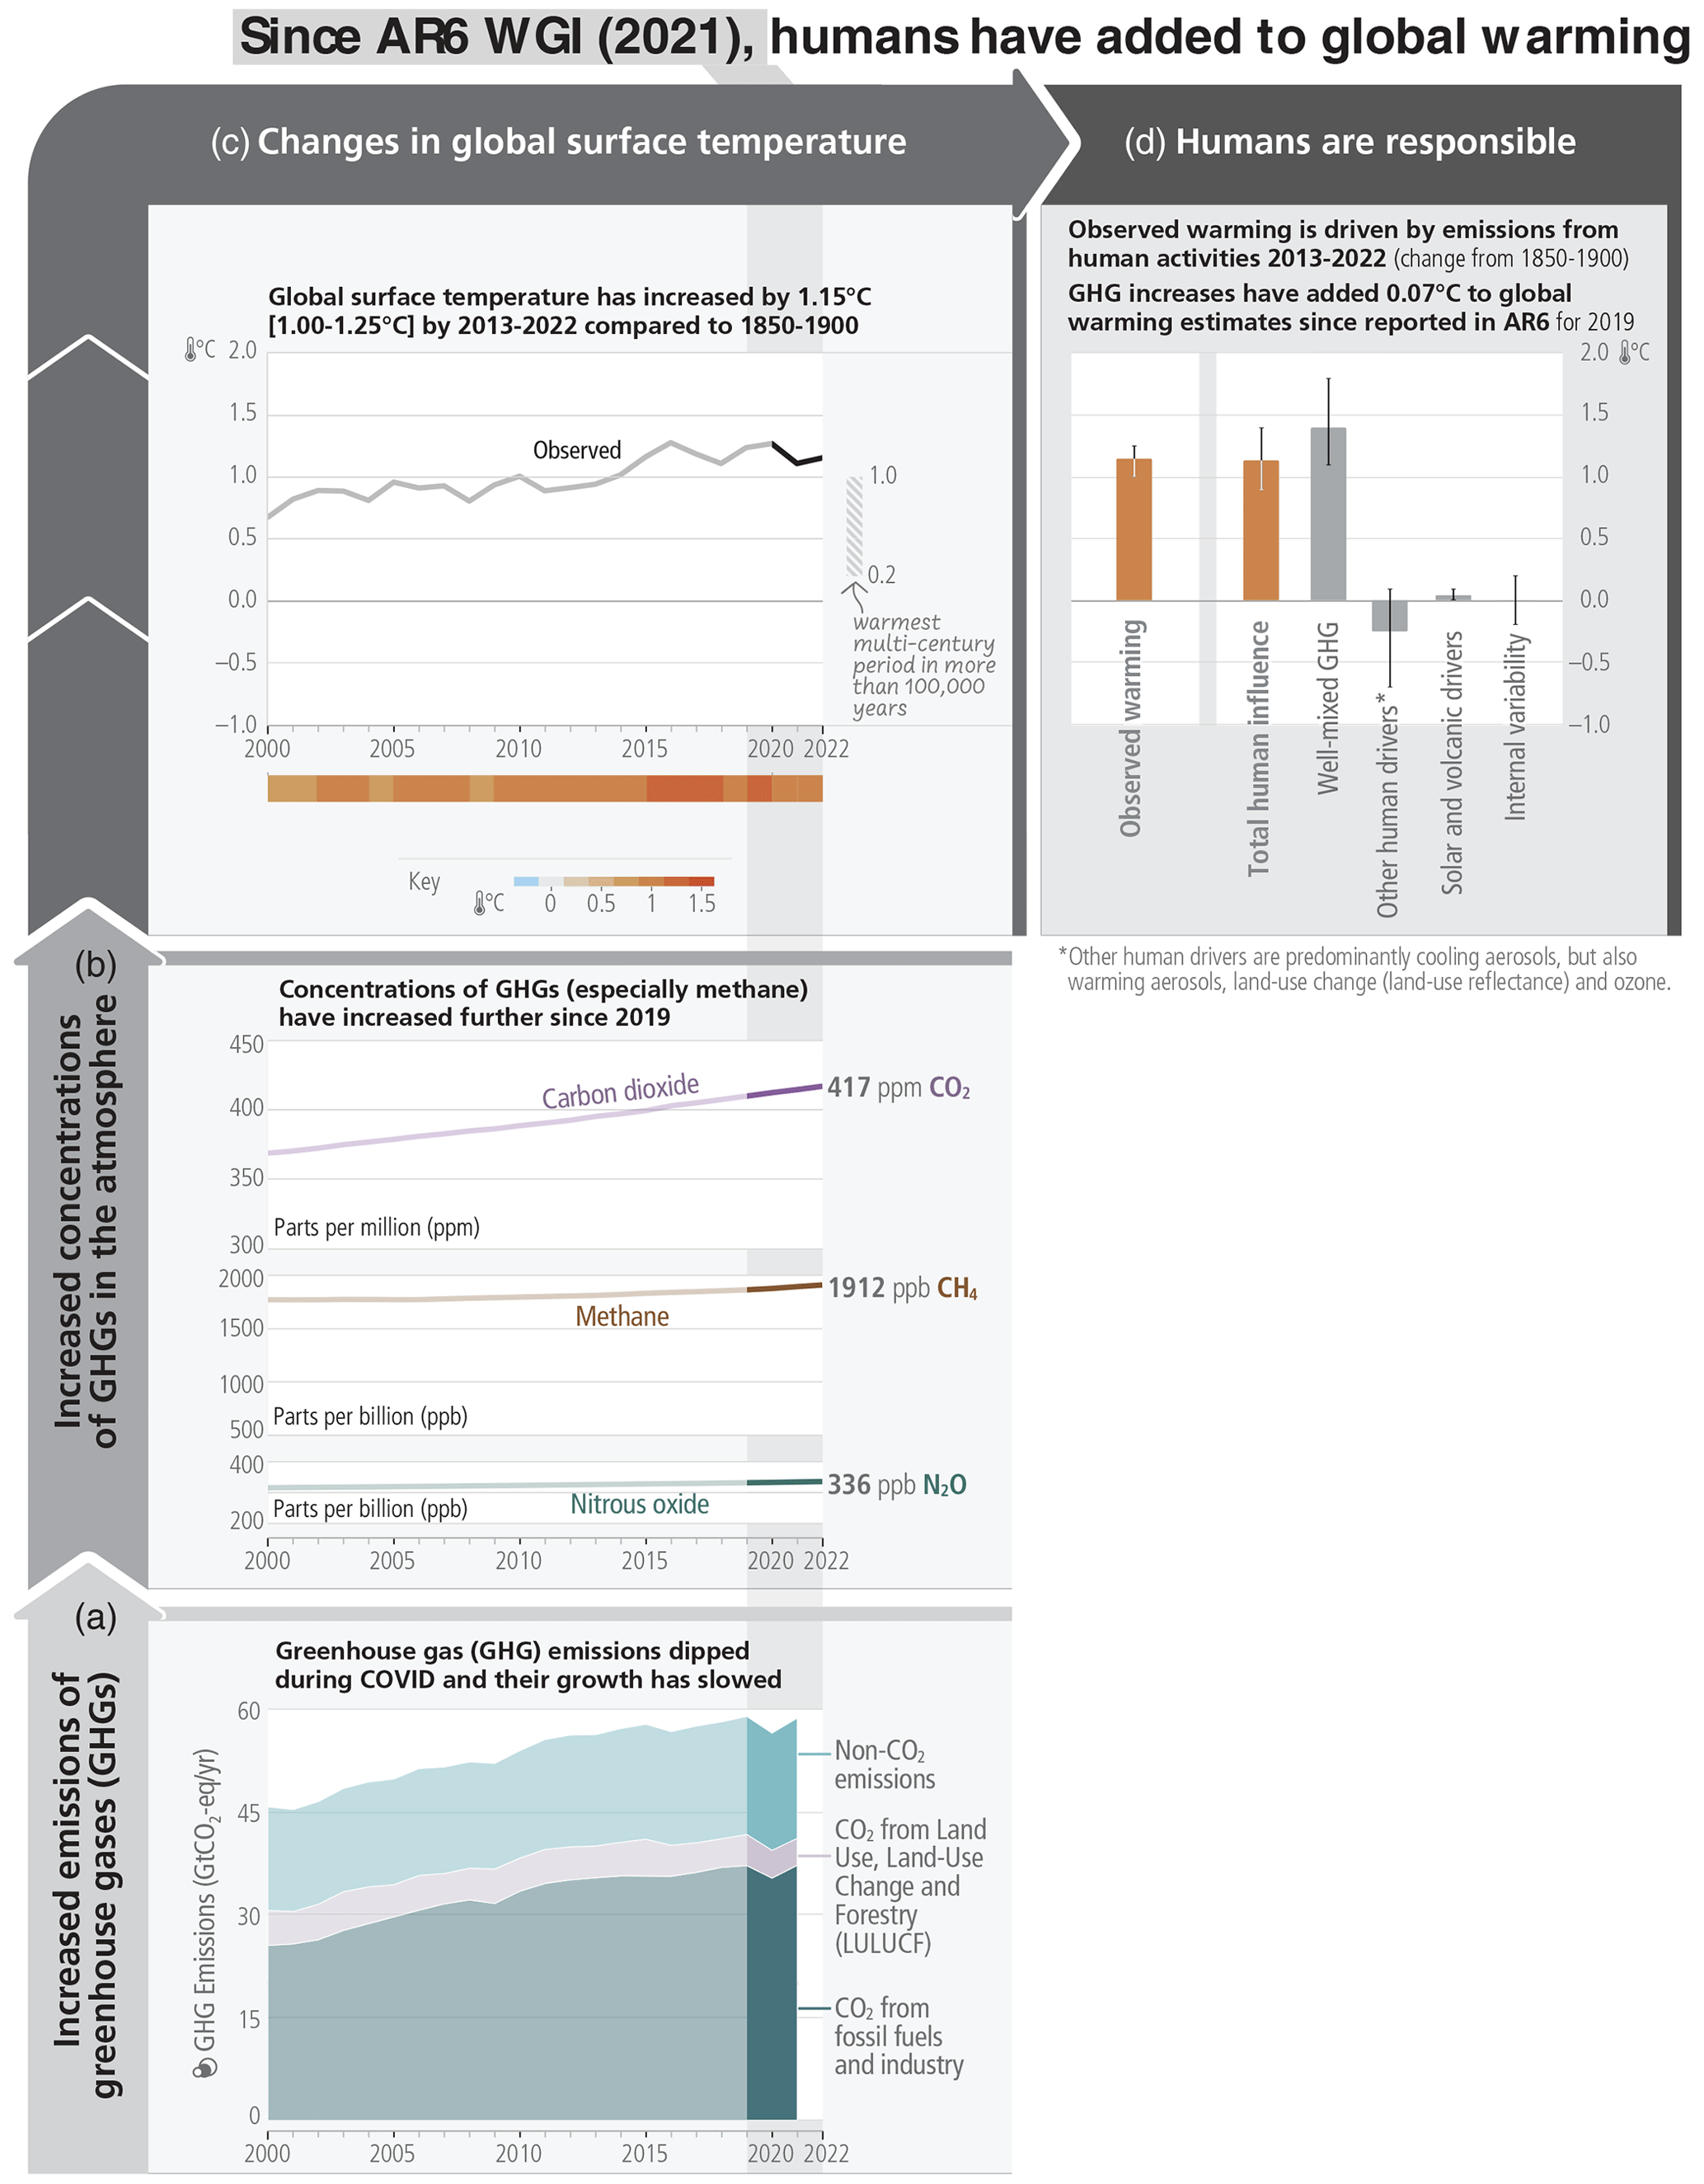
Figure 8The causal chain from emissions to resulting warming of the climate system. Emissions of GHGs have increased rapidly over recent decades (a). These emissions have led to increases in the atmospheric concentrations of several GHGs including the three major well-mixed GHGs (b). The global surface temperature (shown as annual anomalies from an 1850–1900 baseline) has increased by around 1.15 ∘C since 1850–1900 (c). The human-induced warming estimate over the last decade is a close match to the observed warming (d). Whiskers show 5 % to 95 % ranges. Figure is modified from AR6 SYR with a zoomed-in view of the period 2000 to 2022 for the upper two panels (Fig. 2.1, Lee et al., 2023).
The carbon budget calculation is available from https://github.com/Rlamboll/AR6CarbonBudgetCalc (Lamboll and Rogelj, 2023). The code and data used to produce other indicators are available in repositories under https://github.com/ClimateIndicator (Smith et al., 2023b). All data are available from https://doi.org/10.5281/zenodo.8000192 (Smith et al., 2023a). Data are provided under the CC-BY 4.0 Licence.
HadEX3 [3.0.4] data were obtained from https://catalogue.ceda.ac.uk/uuid/115d5e4ebf7148ec941423ec86fa9f26 (Dunn et al., 2023) on 5 April 2023 and are © British Crown Copyright, Met Office, 2022, provided under an Open Government Licence; http://www.nationalarchives.gov.uk/doc/open-government-licence/version/2/ (last access: 2 June 2023).
The first year of the Global Climate Change (IGCC) initiative has built on the AR6 report cycle to provide a comprehensive update of the climate change indicators required to estimate the human-induced warming and the remaining carbon budget. Table 9 and Fig. 7 present a summary of the headline figures from each section compared to those given in the AR6 assessment. The main substantive dataset change since AR6 is that land-use CO2 emissions have been revised down by around 2 GtCO2 (Table 9). However, as CO2 ERF and human-induced warming estimates depend on concentrations, not emissions, this does not affect most of the other findings. Note it does slightly increase the remaining carbon budget, but this is only by 5 GtCO2, less than the 50 GtCO2 rounding precision.
Figure 8 summarises contributions to warming, repeating Fig. 2.1 of the AR6 Synthesis Report (Lee et al., 2023). It highlights changes since the assessment period in AR6 WGI. Table 9 also summarises methodological updates.
It is hoped that this update can support the science community in its collection and provision of reliable and timely global climate data. In future years we are particularly interested in improving SLCF updating methods to get a more accurate estimate of short-term ERF changes. The work also highlights the importance of high-quality metadata to document changes in methodological approaches over time. In future years we hope to improve the robustness of the indicators presented here but also extend the breadth of indicators reported through coordinated research activities. For example, we could begin to make use of new satellite data inversion techniques to infer recent emissions. We are particularly interested in exploring how we might update indicators of regional climate extremes and their attribution, which are particularly relevant for supporting actions on adaptation and loss and damage.
Generally, scientists and scientific organisations such as the WMO and IPCC have an important role as “watchdogs” to critically inform evidence-based decision-making. This annual update traced to IPCC methods can provide a reliable, timely source of trustworthy information. As well as helping inform decisions, we can use the update to track changes in dataset homogeneity between their use in one IPCC report and the next. We can also provide information and testing to motivate updates in methods that future IPCC reports might choose to employ.
Figure 9 shows decadal trends for the attributed warming and ERF. The most recent trends were unprecedented at the time of AR6 and have increased further since then (red markers), showing that human activities are consistently causing global warming recently of more than 0.2 ∘C per decade. As nations and businesses forge climate policies and take meaningful action, the latest available evidence shows that global actions are not yet at the scale to manifest a substantive shift in the direction of global human influence on the Earth's energy imbalance and the resulting global warming. Indeed, our results point to the opposite: the evidence shows continued increase in cumulative CO2 emissions, increased emissions of other GHGs and gains in air quality at the expense of the loss of the cooling effect from aerosols. Both AR6 WGI and WGIII reports highlighted the benefits of short-term reductions in methane emissions to counter the loss of aerosol cooling and further improve air quality – however, at the global scale, methane emissions are at their highest level and rising (see Table 1). Policymakers, civil society and the scientific community require monitoring data and analyses from rigorous, robust assessments available on a regular basis. These results illustrate how assessments such as ours provide a strong “reality check” based on science and real-world data.
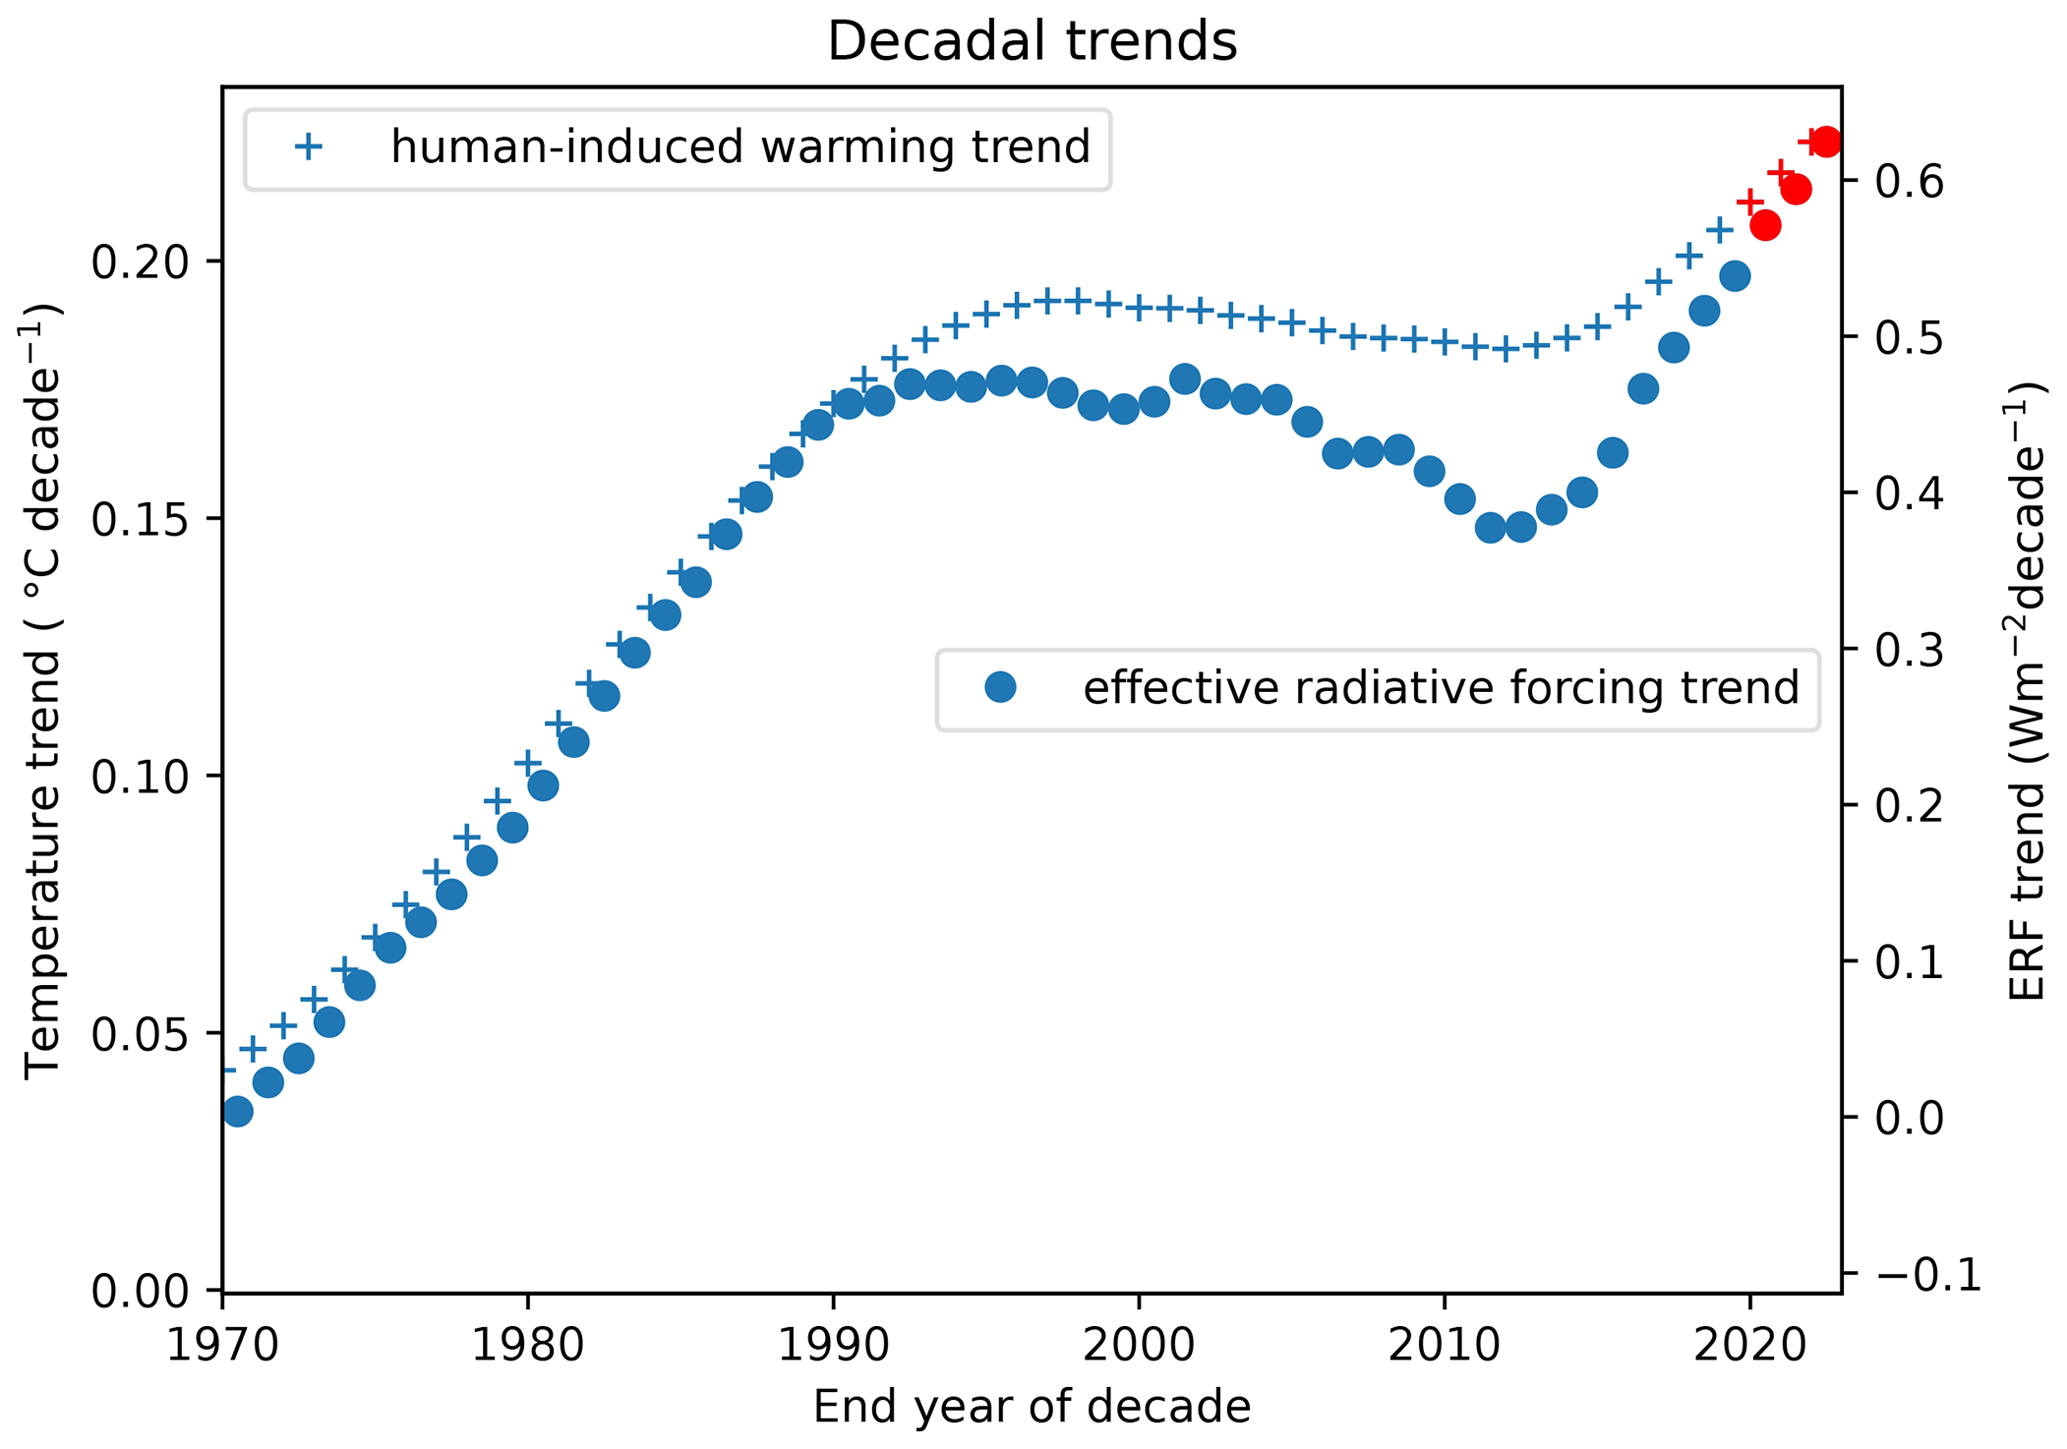
Figure 9Decadal trends in human-induced warming on the left axis and anthropogenic effective radiative forcing (ERF) on the right axis. These are computed from the Global Warming Index human-induced warming estimate shown in the Supplement, Sect. S7 and Fig. 2b, respectively. The red points mark 3 additional years since the AR6 time series for these indicators ended in 2019.
This is a critical decade: human-induced global warming rates are at their highest historical level, and 1.5 ∘C global warming might be expected to be reached or exceeded within the next 10 years in the absence of cooling from major volcanic eruptions (Lee et al., 2021). Yet this is also the decade that global greenhouse gas emissions could be expected to peak and begin to substantially decline. The indicators of global climate change presented here show that the Earth's energy imbalance has increased to around 0.9 W m−2, averaged over the last 12 years. This also has implications for the committed response of slow components in the climate system (glaciers, deep ocean, ice sheets) and committed long-term sea level rise, but this is not part of the update here. However, rapid and stringent GHG emission decreases could halve warming rates over the next 20 years (McKenna et al., 2021). Table 1 shows that global GHG emissions are at a long-term high, yet there are signs that their rate of increase has slowed. Depending on the societal choices made in this critical decade, a continued series of these annual updates could track a change in direction for the human influence on climate.
The supplement related to this article is available online at: https://doi.org/10.5194/essd-15-2295-2023-supplement.
PMF, CJS, MA, PF, JR, MRC and AP developed the concept of an annual update in discussions with the wider IPCC community over many years. CJS led the work of the data repositories. ABo and JAB led the website development with visualisation support from DR, JMG and ABi. VMD, PZ, SS, JM, CFS, SIS, VN, AP, JYL, NG, FD, GP, BT, MSP, MRC, JR, PF, MA and PT provided important IPCC and UNFCCC framing. PMF coordinated the production of the manuscript with support from DR. WFL led Sect. 2 with contributions from CJS, JM, PF, GP, JG, JP and RA. CJS led Sects. 3 and 4 with contributions from BH, FD, SS, VN and XL. BT led Sect. 5 with contributions from PT, CM, CK, JK, RR, RV and LC. KvS and MDP led Sect. 6 with contributions from LC, MI, TB and RK. TW led Sect. 7 with contributions and calculations from AR, NG and MR. JR led Sect. 8 with contributions from RL and KZ. Section 9 was led by SIS and XC with calculations by MH and DS. All authors either edited or commented on the manuscript.
The contact author has declared that none of the authors has any competing interests.
Publisher’s note: Copernicus Publications remains neutral with regard to jurisdictional claims in published maps and institutional affiliations.
This research has been supported by the Horizon 2020 Framework Programme, H2020 Excellent Science (grant nos. 820829 and 821003), the H2020 European Research Council (grant no. 951542) and the Natural Environment Research Council (grant no. NE/T009381/1). Matthew D. Palmer, Colin Morice and Rachel Killick were supported by the Met Office Hadley Centre Climate Programme funded by BEIS.
This paper was edited by David Carlson and reviewed by Albertus J. (Han) Dolman, Martin Heimann, Matthew Jones, Greet Janssens-Maenhout, and one anonymous referee.
Adusumilli, S., Straneo, F., Hendricks, S., Korosov, A., Lavergne, T., Lawrence, I., Marzeion, B., Otosaka, I., Schweiger, A., Shepherd, A., Slater, D., Slater, T., Timmermanns, M.-L., and Zemp, M.: GCOS EHI 1960–2020 Cryosphere Heat Content, World Data Center for Climate (WDCC) at DKRZ [data set], https://doi.org/10.26050/WDCC/GCOS_EHI_1960-2020_CRHC, 2022.
Allen, M. R., Dube, O. P., Solecki, W., Aragón-Durand, F., Cramer, W., Humphreys, S., Kainuma, M., Kala, J., Mahowald, N., Mulugetta, Y., Perez, R., Wairiu, M., and Zickfeld, K.: Framing and Context, in: Global Warming of 1.5 ∘C. An IPCC Special Report on the impacts of global warming of 1.5 ∘C above pre-industrial levels and related global greenhouse gas emission pathways, in the context of strengthening the global response to the threat of climate change, sustainable development, and efforts to eradicate poverty, edited by: Masson-Delmotte, V., Zhai, P., Pörtner, H.-O., Roberts, D., Skea, J., Shukla, P. R., Pirani, A., Moufouma-Okia, W., Péan, C., Pidcock, R., Connors, S., Matthews, J. B. R., Chen, Y., Zhou, X., Gomis, M. I., Lonnoy, E., Maycock, T., Tignor, M., and Waterfield, T., Cambridge University Press, Cambridge, UK and New York, NY, USA, 49–92, https://doi.org/10.1017/9781009157940.003, 2018.
Allison, L. C., Palmer, M. D., Allan, R. P., Hermanson, L., Liu, C., and Smith, D. M.: Observations of planetary heating since the 1980s from multiple independent datasets, Environ. Res. Commun., 2, 101001, https://doi.org/10.1088/2515-7620/abbb39, 2020.
Basu, S., Lan, X., Dlugokencky, E., Michel, S., Schwietzke, S., Miller, J. B., Bruhwiler, L., Oh, Y., Tans, P. P., Apadula, F., Gatti, L. V., Jordan, A., Necki, J., Sasakawa, M., Morimoto, S., Di Iorio, T., Lee, H., Arduini, J., and Manca, G.: Estimating emissions of methane consistent with atmospheric measurements of methane and δ13C of methane, Atmos. Chem. Phys., 22, 15351–15377, https://doi.org/10.5194/acp-22-15351-2022, 2022.
Bellouin, N., Davies, W., Shine, K. P., Quaas, J., Mülmenstädt, J., Forster, P. M., Smith, C., Lee, L., Regayre, L., Brasseur, G., Sudarchikova, N., Bouarar, I., Boucher, O., and Myhre, G.: Radiative forcing of climate change from the Copernicus reanalysis of atmospheric composition, Earth Syst. Sci. Data, 12, 1649–1677, https://doi.org/10.5194/essd-12-1649-2020, 2020.
Beusch, L., Gudmundsson, L., and Seneviratne, S. I.: Crossbreeding CMIP6 Earth System Models With an Emulator for Regionally Optimized Land Temperature Projections, Geophys. Res. Lett., 47, e2019GL086812, https://doi.org/10.1029/2019GL086812, 2020.
Bond, T. C., Doherty, S. J., Fahey, D. W., Forster, P. M., Berntsen, T., DeAngelo, B. J., Flanner, M. G., Ghan, S., Kärcher, B., Koch, D., Kinne, S., Kondo, Y., Quinn, P. K., Sarofim, M. C., Schultz, M. G., Schulz, M., Venkataraman, C., Zhang, H., Zhang, S., Bellouin, N., Guttikunda, S. K., Hopke, P. K., Jacobson, M. Z., Kaiser, J. W., Klimont, Z., Lohmann, U., Schwarz, J. P., Shindell, D., Storelvmo, T., Warren, S. G., and Zender, C. S.: Bounding the role of black carbon in the climate system: A scientific assessment, J. Geophys. Res.-Atmos., 118, 5380–5552, https://doi.org/10.1002/jgrd.50171, 2013.
Byers, E., Krey, V., Kriegler, E., Riahi, K., Schaeffer, R., Kikstra, J., Lamboll, R., Nicholls, Z., Sandstad, M., Smith, C., van der Wijst, K., Lecocq, F., Portugal-Pereira, J., Saheb, Y., Stromann, A., Winkler, H., Auer, C., Brutschin, E., Lepault, C., Müller-Casseres, E., Gidden, M., Huppmann, D., Kolp, P., Marangoni, G., Werning, M., Calvin, K., Guivarch, C., Hasegawa, T., Peters, G., Steinberger, J., Tavoni, M., van Vuuren, D., Al -Khourdajie, A., Forster, P., Lewis, J., Meinshausen, M., Rogelj, J., Samset, B., and Skeie, R.: AR6 Scenarios Database, Zenodo [data set], https://doi.org/10.5281/ZENODO.5886912, 2022.
Canadell, J. G., Monteiro, P. M. S., Costa, M. H., Cotrim da Cunha, L., Cox, P. M., Eliseev, A. V., Henson, S., Ishii, M., Jaccard, S., Koven, C., Lohila, A., Patra, P. K., Piao, S., Rogelj, J., Syampungani, S., Zaehle, S., and Zickfeld, K.: Global Carbon and other Biogeochemical Cycles and Feedbacks, in: Climate Change 2021: The Physical Science Basis, Contribution of Working Group I to the Sixth Assessment Report of the Intergovernmental Panel on Climate Change, edited by: Masson-Delmotte, V., Zhai, P., Pirani, A., Connors, S. L., Péan, C., Berger, S., Caud, N., Chen, Y., Goldfarb, L., Gomis, M. I., Huang, M., Leitzell, K., Lonnoy, E., Matthews, J. B. R., Maycock, T. K., Waterfield, T., Yelekçi, O., Yu, R., and Zhou, B., Cambridge University Press, Cambridge, United Kingdom and New York, NY, USA, pp. 673–816, https://doi.org/10.1017/9781009157896.007, 2021.
Cheng, L., Trenberth, K. E., Fasullo, J., Boyer, T., Abraham, J., and Zhu, J.: Improved estimates of ocean heat content from 1960 to 2015, Sci. Adv., 3, e1601545, https://doi.org/10.1126/sciadv.1601545, 2017.
Cheng, L., Abraham, J., Hausfather, Z., and Trenberth, K. E.: How fast are the oceans warming?, Science, 363, 128–129, https://doi.org/10.1126/science.aav7619, 2019.
Cheng, L., Von Schuckmann, K., Abraham, J. P., Trenberth, K. E., Mann, M. E., Zanna, L., England, M. H., Zika, J. D., Fasullo, J. T., Yu, Y., Pan, Y., Zhu, J., Newsom, E. R., Bronselaer, B., and Lin, X.: Past and future ocean warming, Nat. Rev. Earth. Environ., 3, 776–794, https://doi.org/10.1038/s43017-022-00345-1, 2022.
Collins, M., Knutti, R., Arblaster, J., Dufresne, J.-L., Fichefet, T., Friedlingstein, P., Gao, X., Gutowski, W. J., Johns, T., Krinner, G., Shongwe, M., Tebaldi, C., Weaver, A. J., and Wehner, M.: Long-term Climate Change: Projections, Commitments and Irreversibility, in: Climate Change 2013: The Physical Science Basis, Contribution of Working Group I to the Fifth Assessment Report of the Intergovernmental Panel on Climate Change, edited by: Stocker, T. F., Qin, D., Plattner, G. K., Tignor, M., Allen, S. K., Boschung, J., Nauels, A., Xia, Y., and Midgley, P. M., Cambridge, United Kingdom and New York, NY, USA, Cambridge University Press, 1029–1136, 2013.
Cowtan, K., Hausfather, Z., Hawkins, E., Jacobs, P., Mann, M. E., Miller, S. K., Steinman, B. A., Stolpe, M. B., and Way, R. G.: Robust comparison of climate models with observations using blended land air and ocean sea surface temperatures, Geophys. Res. Lett., 42, 6526–6534, https://doi.org/10.1002/2015GL064888, 2015.
Crippa, M., Guizzardi, D., Banja, M., Solazzo, E., Muntean, M., Schaaf, E., Pagani, F., Monforti-Ferrario, F., Olivier, J. G. J., Quadrelli, R., Risquez Martin, A., Taghavi-Moharamli, P., Grassi, G., Rossi, S., Oom, D., Branco, A., San-Miguel, J., and Vignati, E.: CO2 emissions of all world countries: JRC/IEA/PBL 2022 report, Publications Office, LU, https://doi.org/10.2760/07904, 2022.
Cuesta-Valero, F. J., García-García, A., Beltrami, H., González-Rouco, J. F., and García-Bustamante, E.: Long-term global ground heat flux and continental heat storage from geothermal data, Clim. Past, 17, 451–468, https://doi.org/10.5194/cp-17-451-2021, 2021.
Cuesta-Valero, F. J., Beltrami, H., García-García, A., Krinner, G., Langer, M., MacDougall, A. H., Nitzbon, J., Peng, J., von Schuckmann, K., Seneviratne, S. I., Thiery, W., Vanderkelen, I., and Wu, T.: Continental heat storage: contributions from the ground, inland waters, and permafrost thawing, Earth Syst. Dynam., 14, 609–627, https://doi.org/10.5194/esd-14-609-2023, 2023a.
Cuesta-Valero, F. J., Beltrami, H., García-García, A., Krinner, G., Langer, M., MacDougall, A., Nitzbon, J., Peng, J., von Schuckmann, K., Seneviratne, S., Thiery, W., Vanderkelen, I., and Wu, T.: GCOS EHI 1960–2020 Continental Heat Content (Version 2), World Data Center for Climate (WDCC) at DKRZ, https://doi.org/10.26050/WDCC/GCOS_EHI_1960-2020_CoHC_v2, 2023b.
Dhakal, S., Minx, J. C., Toth, F. L., Abdel-Aziz, A., Figueroa Meza, M. J., Hubacek, K., Jonckheere, I. G. C., Kim, Y.-G., Nemet, G. F., Pachauri, S., Tan, X. C., and Wiedmann, T.: Emissions Trends and Drivers, in: IPCC, 2022: Climate Change 2022: Mitigation of Climate Change, Contribution of Working Group III to the Sixth Assessment Report of the Intergovernmental Panel on Climate Change, edited by: Shukla, P. R., Skea, J., Slade, R., Al Khourdajie, A., van Diemen, R., McCollum, D., Pathak, M., Some, S., Vyas, P., Fradera, R., Belkacemi, M., Hasija, A., Lisboa, G., Luz, S., and Malley, J., Cambridge University Press, Cambridge, UK and New York, NY, USA, https://doi.org/10.1017/9781009157926.004, 2022.
Domingues, C. M., Church, J. A., White, N. J., Gleckler, P. J., Wijffels, S. E., Barker, P. M., and Dunn, J. R.: Improved estimates of upper-ocean warming and multi-decadal sea-level rise, Nature, 453, 1090–1093, https://doi.org/10.1038/nature07080, 2008.
Douville, H., Raghavan, K., Renwick, J., Allan, R. P., Arias, P. A., Barlow, M., Cerezo-Mota, R., Cherchi, A., Gan, T. Y., Gergis, J., Jiang, D., Khan, A., Pokam, Mba, W. P., Rosenfeld, D., Tierney, J., and Zolina, O.: Water Cycle Changes, in: Climate Change 2021: The Physical Science Basis, Contribution of Working Group I to the Sixth Assessment Report of the Intergovernmental Panel on Climate Change, edited by: Masson-Delmotte, V., Zhai, P., Pirani, A., Connors, S. L., Péan, C., Berger, S., Caud, N., Chen, Y., Goldfarb, L., Gomis, M. I., Huang, M., Leitzell, K., Lonnoy, E., Matthews, J. B. R., Maycock, T. K., Waterfield, T., Yelekçi, O., Yu, R., and Zhou, B., Cambridge University Press, Cambridge, United Kingdom and New York, NY, USA, pp. 1055–1210, https://doi.org/10.1017/9781009157896.010, 2021.
Droste, E. S., Adcock, K. E., Ashfold, M. J., Chou, C., Fleming, Z., Fraser, P. J., Gooch, L. J., Hind, A. J., Langenfelds, R. L., Leedham Elvidge, E. C., Mohd Hanif, N., O'Doherty, S., Oram, D. E., Ou-Yang, C.-F., Panagi, M., Reeves, C. E., Sturges, W. T., and Laube, J. C.: Trends and emissions of six perfluorocarbons in the Northern Hemisphere and Southern Hemisphere, Atmos. Chem. Phys., 20, 4787–4807, https://doi.org/10.5194/acp-20-4787-2020, 2020.
Dunn, R. J. H., Alexander, L. V., Donat, M. G., Zhang, X., Bador, M., Herold, N., Lippmann, T., Allan, R., Aguilar, E., Barry, A. A., Brunet, M., Caesar, J., Chagnaud, G., Cheng, V., Cinco, T., Durre, I., Guzman, R., Htay, T. M., Wan Ibadullah, W. M., Bin Ibrahim, M. K. I., Khoshkam, M., Kruger, A., Kubota, H., Leng, T. W., Lim, G., Li-Sha, L., Marengo, J., Mbatha, S., McGree, S., Menne, M., Milagros Skansi, M., Ngwenya, S., Nkrumah, F., Oonariya, C., Pabon-Caicedo, J. D., Panthou, G., Pham, C., Rahimzadeh, F., Ramos, A., Salgado, E., Salinger, J., Sané, Y., Sopaheluwakan, A., Srivastava, A., Sun, Y., Timbal, B., Trachow, N., Trewin, B., Schrier, G., Vazquez-Aguirre, J., Vasquez, R., Villarroel, C., Vincent, L., Vischel, T., Vose, R., and Bin Hj Yussof, M. N.: Development of an updated global land in situ-based data set of temperature and precipitation extremes: HadEX3, J. Geophys. Res.-Atmos., 125, e2019JD032263, https://doi.org/10.1029/2019JD032263, 2020.
Dunn, R. J. H., Donat, M. G., and Alexander, L. V.: Comparing extremes indices in recent observational and reanalysis products, Front. Clim., 4, 98905, https://doi.org/10.3389/fclim.2022.989505, 2022.
Dunn, R. J. H., Alexander, L., Donat, M., Zhang, X., Bador, M., Herold, N., Lippmann, T., Allan, R. J., Aguilar, E., Aziz, A., Brunet, M., Caesar, J., Chagnaud, G., Cheng, V., Cinco, T., Durre, I., de Guzman, R., Htay, T. M., Wan Ibadullah, W. M., Bin Ibrahim, M. K. I., Khoshkam, M., Kruge, A., Kubota, H., Leng, T. W., Lim, G., Li-Sha, L., Marengo, J., Mbatha, S., McGree, S., Menne, M., de los Milagros Skansi, M., Ngwenya, S., Nkrumah, F., Oonariya, C., Pabon-Caicedo, J. D., Panthou, G., Pham, C., Rahimzadeh, F., Ramos, A., Salgado, E., Salinger, J., Sane, Y., Sopaheluwakan, A., Srivastava, A., Sun, Y., Trimbal, B., Trachow, N., Trewin, B., van der Schrier, G., Vazquez-Aguirre, J., Vasquez, R., Villarroel, C., Vincent, L., Vischel, T., Vose, R., and Bin Hj Yussof, M. N. A.: HadEX3: Global land-surface climate extremes indices v3.0.4 (1901–2018), NERC EDS Centre for Environmental Data Analysis [data set], https://catalogue.ceda.ac.uk/uuid/115d5e4ebf7148ec941423ec86fa9f26 (last access: 5 June 2023), 2023.
Eyring, V., Gillett, N. P., Achuta Rao, K. M., Barimalala, R., Barreiro Parrillo, M., Bellouin, N., Cassou, C., Durack, P. J., Kosaka, Y., McGregor, S., Min, S., Morgenstern, O., and Sun, Y.: Human Influence on the Climate System, in: Climate Change 2021: The Physical Science Basis, Contribution of Working Group I to the Sixth Assessment Report of the Intergovernmental Panel on Climate Change, edited by: Masson-Delmotte, V., Zhai, P., Pirani, A., Connors, S. L., Péan, C., Berger, S., Caud, N., Chen, Y., Goldfarb, L., Gomis, M. I., Huang, M., Leitzell, K., Lonnoy, E., Matthews, J. B. R., Maycock, T. K., Waterfield, T., Yelekçi, O., Yu, R., and Zhou, B., Cambridge University Press, Cambridge, United Kingdom and New York, NY, USA, pp. 423–552, https://doi.org/10.1017/9781009157896.005, 2021.
Forster, P. M., Forster, H. I., Evans, M. J., Gidden, M. J., Jones, C. D., Keller, C. A., Lamboll, R. D., Le Quéré, C., Rogelj, J., Rosen, D., Schleussner, C. F., Richardson, T. B., Smith, C. J., and Turnock, S. T.: Current and future global climate impacts resulting from COVID-19, Nature Clim. Chang, 10, 913–919, https://doi.org/10.1038/s41558-020-0883-0, 2020.
Forster, P., Storelvmo, T., Armour, K., Collins, W., Dufresne, J.-L., Frame, D., Lunt, D. J., Mauritsen, T., Palmer, M. D., Watanabe, M., Wild, M., and Zhang, H.: The Earth's Energy Budget, Climate Feedbacks, and Climate Sensitivity, in: Climate Change 2021: The Physical Science Basis, Contribution of Working Group I to the Sixth Assessment Report of the Intergovernmental Panel on Climate Change, edited by: Masson-Delmotte, V., Zhai, P., Pirani, A., Connors, S. L., Péan, C., Berger, S., Caud, N., Chen, Y., Goldfarb, L., Gomis, M. I., Huang, M., Leitzell, K., Lonnoy, E., Matthews, J. B. R., Maycock, T. K., Waterfield, T., Yelekçi, O., Yu, R., and Zhou, B., Cambridge University Press, Cambridge, United Kingdom and New York, NY, USA, pp. 923–1054, https://doi.org/10.1017/9781009157896.009, 2021.
Fox-Kemper, B., Fox-Kemper, B., Hewitt, H. T., Xiao, C., Aðalgeirsdóttir, G., Drijfhout, S. S., Edwards, T. L., Golledge, N. R., Hemer, M., Kopp, R. E., Krinner, G., Mix, A., Notz, D., Nowicki, S., Nurhati, I. S., Ruiz, L., Sallée, J.-B., Slangen, A. B. A., and Yu, Y.: Ocean, Cryosphere and Sea Level Change, in: Climate Change 2021: The Physical Science Basis, Contribution of Working Group I to the Sixth Assessment Report of the Intergovernmental Panel on Climate Change, edited by: Masson-Delmotte, V., Zhai, P., Pirani, A., Connors, S. L., Péan, C., Berger, S., Caud, N., Chen, Y., Goldfarb, L. , Gomis, M. I., Huang, M., Leitzell, K., Lonnoy, E., Matthews, J. B. R., Maycock, T. K., Waterfield, T., Yelekçi, O., Yu, R., and Zhou B., Cambridge University Press, Cambridge, United Kingdom and New York, NY, USA, pp. 1211–1362, https://doi.org/10.1017/9781009157896.011, 2021.
Friedlingstein, P., O'Sullivan, M., Jones, M. W., Andrew, R. M., Hauck, J., Olsen, A., Peters, G. P., Peters, W., Pongratz, J., Sitch, S., Le Quéré, C., Canadell, J. G., Ciais, P., Jackson, R. B., Alin, S., Aragão, L. E. O. C., Arneth, A., Arora, V., Bates, N. R., Becker, M., Benoit-Cattin, A., Bittig, H. C., Bopp, L., Bultan, S., Chandra, N., Chevallier, F., Chini, L. P., Evans, W., Florentie, L., Forster, P. M., Gasser, T., Gehlen, M., Gilfillan, D., Gkritzalis, T., Gregor, L., Gruber, N., Harris, I., Hartung, K., Haverd, V., Houghton, R. A., Ilyina, T., Jain, A. K., Joetzjer, E., Kadono, K., Kato, E., Kitidis, V., Korsbakken, J. I., Landschützer, P., Lefèvre, N., Lenton, A., Lienert, S., Liu, Z., Lombardozzi, D., Marland, G., Metzl, N., Munro, D. R., Nabel, J. E. M. S., Nakaoka, S.-I., Niwa, Y., O'Brien, K., Ono, T., Palmer, P. I., Pierrot, D., Poulter, B., Resplandy, L., Robertson, E., Rödenbeck, C., Schwinger, J., Séférian, R., Skjelvan, I., Smith, A. J. P., Sutton, A. J., Tanhua, T., Tans, P. P., Tian, H., Tilbrook, B., van der Werf, G., Vuichard, N., Walker, A. P., Wanninkhof, R., Watson, A. J., Willis, D., Wiltshire, A. J., Yuan, W., Yue, X., and Zaehle, S.: Global Carbon Budget 2020, Earth Syst. Sci. Data, 12, 3269–3340, https://doi.org/10.5194/essd-12-3269-2020, 2020.
Friedlingstein, P., O'Sullivan, M., Jones, M. W., Andrew, R. M., Gregor, L., Hauck, J., Le Quéré, C., Luijkx, I. T., Olsen, A., Peters, G. P., Peters, W., Pongratz, J., Schwingshackl, C., Sitch, S., Canadell, J. G., Ciais, P., Jackson, R. B., Alin, S. R., Alkama, R., Arneth, A., Arora, V. K., Bates, N. R., Becker, M., Bellouin, N., Bittig, H. C., Bopp, L., Chevallier, F., Chini, L. P., Cronin, M., Evans, W., Falk, S., Feely, R. A., Gasser, T., Gehlen, M., Gkritzalis, T., Gloege, L., Grassi, G., Gruber, N., Gürses, Ö., Harris, I., Hefner, M., Houghton, R. A., Hurtt, G. C., Iida, Y., Ilyina, T., Jain, A. K., Jersild, A., Kadono, K., Kato, E., Kennedy, D., Klein Goldewijk, K., Knauer, J., Korsbakken, J. I., Landschützer, P., Lefèvre, N., Lindsay, K., Liu, J., Liu, Z., Marland, G., Mayot, N., McGrath, M. J., Metzl, N., Monacci, N. M., Munro, D. R., Nakaoka, S.-I., Niwa, Y., O'Brien, K., Ono, T., Palmer, P. I., Pan, N., Pierrot, D., Pocock, K., Poulter, B., Resplandy, L., Robertson, E., Rödenbeck, C., Rodriguez, C., Rosan, T. M., Schwinger, J., Séférian, R., Shutler, J. D., Skjelvan, I., Steinhoff, T., Sun, Q., Sutton, A. J., Sweeney, C., Takao, S., Tanhua, T., Tans, P. P., Tian, X., Tian, H., Tilbrook, B., Tsujino, H., Tubiello, F., van der Werf, G. R., Walker, A. P., Wanninkhof, R., Whitehead, C., Willstrand Wranne, A., Wright, R., Yuan, W., Yue, C., Yue, X., Zaehle, S., Zeng, J., and Zheng, B.: Global Carbon Budget 2022, Earth Syst. Sci. Data, 14, 4811–4900, https://doi.org/10.5194/essd-14-4811-2022, 2022a.
Friedlingstein, P., O'Sullivan, M., Jones, M. W., Andrew, R. M., Gregor, L., Hauck, L., Le Quéré, C., Luijkx, I. T., Olsen, A., Peters, G. P., Peters, W., Pongratz, J., Schwingshackl, C., Sitch, S., Canadell, J. G., Ciais, P., Jackson, R. B., Alin, S., Alkama, R., Arneth, A., Arora, V. K., Bates, N. R., Becker, M., Bellouin, N., Bittig, H. C., Bopp, L., Chevallier, F., Chini, L. P., Cronin, M., Evans, W., Falk, S., Feely, R. A., Gasser, T., Gehlen, M., Gkritzalis, T., Gloege, L., Grassi, G, Gruber, N., Gürses, Ö, Harris, I., Hefner, M., Houghton, R. A., Hurtt, G. C., Iida, Y., Ilyina, T., Jain, A. T., Jersild, A., Kadono, K., Kato, E., Kennedy, D., Klein Goldewijk, K., Knauer, J., Korsbakken, J. I., Landschützer, P., Lefèvre, N., Lindsay, Keith., Liu, J., Marland, G., Mayot, N., McGrath, M. J., Metzl, N., Monacci, N. M., Munro, D. R., Nakaoka, S.-I., Niwa, Y., O'Brien, K., Ono, T., Palmer, P. I., Pan, N., Pierrot, D., Pocock, K., Poulter, B., Resplandy, L., Robertson, E., Rödenbeck, C., Rodriguez, C., Rosan, T. M., Schwinger, J., Séférian, R., Shutler, J. D., Skjelvan, I., Steinhoff, T., Sun, Q., Sutton, A. J., Sweeney, C., Takao, S., Tanhua, T., Tans, P. P., Tian, X., Tian, H., Tilbrook, B., Tsujino, H., Tubiello, F., van der Werf, G. R., Walker, A. P., Wanninkhof, R., Whitehead, C., Wranne, A., Wright, R. M., Yuan, W., Yue, C., Yue, X., Zaehle, S., Zeng, J., Zheng, B., and Zhu, L.: Supplemental data of the Global Carbon Budget 2022, ICOS-ERIC Carbon Portal [data set], https://doi.org/10.18160/GCP-2022, 2022b.
Gasser, T., Crepin, L., Quilcaille, Y., Houghton, R. A., Ciais, P., and Obersteiner, M.: Historical CO2 emissions from land use and land cover change and their uncertainty, Biogeosciences, 17, 4075–4101, https://doi.org/10.5194/bg-17-4075-2020, 2020.
Gillett, N. P., Shiogama, H., Funke, B., Hegerl, G., Knutti, R., Matthes, K., Santer, B. D., Stone, D., and Tebaldi, C.: The Detection and Attribution Model Intercomparison Project (DAMIP v1.0) contribution to CMIP6, Geosci. Model Dev., 9, 3685–3697, https://doi.org/10.5194/gmd-9-3685-2016, 2016.
Gillett, N. P., Kirchmeier-Young, M., Ribes, A., Shiogama, H., Hegerl, G. C., Knutti, R., Gastineau, G., John, J. G., Li, L., Nazarenko, L., Rosenbloom, N., Seland, Ø., Wu, T., Yukimoto, S., and Ziehn, T.: Constraining human contributions to observed warming since the pre-industrial period, Nat. Clim. Chang., 11, 207–212, https://doi.org/10.1038/s41558-020-00965-9, 2021.
Gleckler, P. J., Durack, P. J., Stouffer, R. J., Johnson, G. C., and Forest, C. E.: Industrial-era global ocean heat uptake doubles in recent decades, Nat. Clim. Chang., 6, 394–398, https://doi.org/10.1038/nclimate2915, 2016.
Good, S. A., Martin, M. J., and Rayner, N. A.: EN4: Quality controlled ocean temperature and salinity profiles and monthly objective analyses with uncertainty estimates, THE EN4 DATA SET, J. Geophys. Res.-Oceans, 118, 6704–6716, https://doi.org/10.1002/2013JC009067, 2013.
Grassi, G., Schwingshackl, C., Gasser, T., Houghton, R. A., Sitch, S., Canadell, J. G., Cescatti, A., Ciais, P., Federici, S., Friedlingstein, P., Kurz, W. A., Sanz Sanchez, M. J., Abad Viñas, R., Alkama, R., Bultan, S., Ceccherini, G., Falk, S., Kato, E., Kennedy, D., Knauer, J., Korosuo, A., Melo, J., McGrath, M. J., Nabel, J. E. M. S., Poulter, B., Romanovskaya, A. A., Rossi, S., Tian, H., Walker, A. P., Yuan, W., Yue, X., and Pongratz, J.: Harmonising the land-use flux estimates of global models and national inventories for 2000–2020, Earth Syst. Sci. Data, 15, 1093–1114, https://doi.org/10.5194/essd-15-1093-2023, 2023.
Guevara, M., Petetin, H., Jorba, O., Denier van der Gon, H., Kuenen, J., Super, I., Granier, C., Doumbia, T., Ciais, P., Liu, Z., Lamboll, R. D., Schindlbacher, S., Matthews, B., and Pérez García-Pando, C.: Towards near-real time air pollutant and greenhouse gas emissions: lessons learned from multiple estimates during the COVID-19 Pandemic, EGUsphere [preprint], https://doi.org/10.5194/egusphere-2023-186, 2023.
Gulev, S. K., Thorne, P. W., Ahn, J., Dentener, F. J., Domingues, C. M., Gerland, S., Gong, D., Kaufman, D. S., Nnamchi, H. C., Quaas, J., Rivera, J. A., Sathyendranath, S., Smith, S. L., Trewin, B., von Schuckmann, K., and Vose, R. S.: Changing State of the Climate System, in: Climate Change 2021: The Physical Science Basis, Contribution of Working Group I to the Sixth Assessment Report of the Intergovernmental Panel on Climate Change, edited by: Masson-Delmotte, V., Zhai, P., Pirani, A., Connors, S. L., Péan, C., Berger, S., Caud, N., Chen, Y., Goldfarb, L., Gomis, M. I., Huang, M., Leitzell, K., Lonnoy, E., Matthews, J. B. R., Maycock, T. K., Waterfield, T., Yelekçi, O., Yu, R., and Zhou, B., Cambridge University Press, Cambridge, United Kingdom and New York, NY, USA, pp. 287–422, https://doi.org/10.1017/9781009157896.004, 2021.
Gutiérrez, J. M., Jones, R. G., Narisma, G. T., Alves, L. M., Amjad, M., Gorodetskaya, I. V., Grose, M., Klutse, N. A. B., Krakovska, S., Li, J., Martínez-Castro, D., Mearns, L. O., Mernild, S. H., Ngo-Duc, T., van den Hurk, B., and Yoon, J.-H.: Atlas, in: Climate Change 2021: The Physical Science Basis, Contribution of Working Group I to the Sixth Assessment Report of the Intergovernmental Panel on Climate Change, edited by: Masson-Delmotte, V., Zhai, P., Pirani, A., Connors, S. L., Péan, C., Berger, S., Caud, N., Chen, Y., Goldfarb, L., Gomis, M. I., Huang, M., Leitzell, K., Lonnoy, E., Matthews, J. B. R., Maycock, T. K., Waterfield, T., Yelekçi, O., Yu, R., and Zhou, B., Cambridge University Press, Cambridge, United Kingdom and New York, NY, USA, pp. 1927–2058, https://doi.org/10.1017/9781009157896.021, 2021 (Note: The companion Interactive Atlas is available at http://interactive-atlas.ipcc.ch, last access: 2 June 2023).
Gütschow, J. and Pflüger, M.: The PRIMAP-hist national historical emissions time series (1750–2021) v2.4.1 (2.4.1), Zenodo [data set], https://doi.org/10.5281/zenodo.7585420, 2023.
Gütschow, J., Jeffery, M. L., Gieseke, R., Gebel, R., Stevens, D., Krapp, M., and Rocha, M.: The PRIMAP-hist national historical emissions time series, Earth Syst. Sci. Data, 8, 571–603, https://doi.org/10.5194/essd-8-571-2016, 2016.
Hakuba, M. Z., Frederikse, T., and Landerer, F. W.: Earth's energy imbalance from the ocean perspective (2005–2019), Geophys. Res. Lett., 48, e2021GL093624, https://doi.org/10.1029/2021GL093624, 2021.
Hall, B. D., Crotwell, A. M., Kitzis, D. R., Mefford, T., Miller, B. R., Schibig, M. F., and Tans, P. P.: Revision of the World Meteorological Organization Global Atmosphere Watch (WMO/GAW) CO2 calibration scale, Atmos. Meas. Tech., 14, 3015–3032, https://doi.org/10.5194/amt-14-3015-2021, 2021.
Hansis, E., Davis, S. J., and Pongratz, J.: Relevance of methodological choices for accounting of land use change carbon fluxes, Global Biogeochem. Cy., 29, 1230–1246, https://doi.org/10.1002/2014GB004997, 2015.
Haustein, K., Allen, M. R., Forster, P. M., Otto, F. E. L., Mitchell, D. M., Matthews, H. D., and Frame, D. J.: A real-time Global Warming Index, Sci. Rep., 7, 15417, https://doi.org/10.1038/s41598-017-14828-5, 2017.
Hersbach, H., Bell, B., Berrisford, P., Hirahara, S., Horányi, A., Muñoz-Sabater, J., Nicolas, J., Peubey, C., Radu, R., Schepers, D., Simmons, A., Soci, C., Abdalla, S., Abellan, X., Balsamo, G., Bechtold, P., Biavati, G., Bidlot, J., Bonavita, M., De Chiara, G., Dahlgren, P., Dee, D., Diamantakis, M., Dragani, R., Flemming, J., Forbes, R., Fuentes, M., Geer, A., Haimberger, L., Healy, S., Hogan, R. J., Hólm, E., Janisková, M., Keeley, S., Laloyaux, P., Lopez, P., Lupu, C., Radnoti, G., de Rosnay, P., Rozum, I., Vamborg, F., Villaume, S., and Thépaut, J.-N.: The ERA5 global reanalysis, Q. J. R. Meteorol. Soc., 146, 1999–2049, https://doi.org/10.1002/qj.3803, 2020.
Hodnebrog, Ø., Aamaas, B., Fuglestvedt, J. S., Marston, G., Myhre, G., Nielsen, C. J., Sandstad, M., Shine, K. P., and Wallington, T. J.: Updated Global Warming Potentials and Radiative Efficiencies of Halocarbons and Other Weak Atmospheric Absorbers, Rev. Geophys., 58, e2019RG000691, https://doi.org/10.1029/2019RG000691, 2020.
Hoesly, R. M., Smith, S. J., Feng, L., Klimont, Z., Janssens-Maenhout, G., Pitkanen, T., Seibert, J. J., Vu, L., Andres, R. J., Bolt, R. M., Bond, T. C., Dawidowski, L., Kholod, N., Kurokawa, J.-I., Li, M., Liu, L., Lu, Z., Moura, M. C. P., O'Rourke, P. R., and Zhang, Q.: Historical (1750–2014) anthropogenic emissions of reactive gases and aerosols from the Community Emissions Data System (CEDS), Geosci. Model Dev., 11, 369–408, https://doi.org/10.5194/gmd-11-369-2018, 2018.
Houghton, R. A. and Nassikas, A. A.: Global and regional fluxes of carbon from land use and land cover change 1850–2015, Global Biogeochem. Cy., 31, 456–472, https://doi.org/10.1002/2016GB005546, 2017.
IPCC: Climate Change 2013: The Physical Science Basis, Contribution of Working Group I to the Fifth Assessment Report of the Intergovernmental Panel on Climate Change, edited by: Stocker, T. F., Qin, D., Plattner, G.-K., Tignor, M., Allen, S. K., Boschung, J., Nauels, A., Xia, Y., Bex, V., and Midgley P. M., Cambridge University Press, Cambridge, United Kingdom and New York, NY, USA, 1535 pp., https://https://doi.org/10.1017/CBO9781107415324, 2013.
IPCC: Summary for Policymakers, in: Global Warming of 1.5 ∘C. An IPCC Special Report on the impacts of global warming of 1.5 ∘C above pre-industrial levels and related global greenhouse gas emission pathways, in the context of strengthening the global response to the threat of climate change, sustainable development, and efforts to eradicate poverty, edited by: Masson-Delmotte, V., Zhai, P., Pörtner, H.-O., Roberts, D., Skea, J., Shukla, P. R., Pirani, A., Moufouma-Okia, W., Péan, C., Pidcock, R., Connors, S., Matthews, J. B. R., Chen, Y., Zhou, X., Gomis, M. I., Lonnoy, E., Maycock, T., Tignor, M., and Waterfield, T., Cambridge University Press, Cambridge, UK and New York, NY, USA, pp. 3–24, https://doi.org/10.1017/9781009157940.001, 2018.
IPCC: Climate Change 2021: The Physical Science Basis, Contribution of Working Group I to the Sixth Assessment Report of the Intergovernmental Panel on Climate Change, Cambridge University Press, Cambridge, United Kingdom and New York, NY, USA, https://doi.org/10.1017/9781009157896, 2021a.
IPCC: Summary for Policymakers, in: Climate Change 2021: The Physical Science Basis, Contribution of Working Group I to the Sixth Assessment Report of the Intergovernmental Panel on Climate Change, edited by: Masson-Delmotte, V., Zhai, P., Pirani, A., Connors, S. L., Péan, C., Berger, S., Caud, N., Chen, Y., Goldfarb, L., Gomis, M. I., Huang, M., Leitzell, K., Lonnoy, E., Matthews, J. B. R., Maycock, T. K., Waterfield, T., Yelekçi, O., Yu, R., and Zhou, B., Cambridge University Press, Cambridge, United Kingdom and New York, NY, USA, pp. 3–32, https://doi.org/10.1017/9781009157896.001, 2021b.
IPCC: Annex III: Tables of historical and projected well-mixed greenhouse gas mixing ratios and effective radiative forcing of all climate forcers, edited by: Dentener, F. J., Hall, B., and Smith, C., in: Climate Change 2021: The Physical Science Basis, Contribution of Working Group I to the Sixth Assessment Report of the Intergovernmental Panel on Climate Change, edited by: Masson-Delmotte, V., Zhai, P., Pirani, A., Connors, S. L., Péan, C., Berger, S., Caud, N., Chen, Y., Goldfarb, L., Gomis, M. I., Huang, M., Leitzell, K., Lonnoy, E., Matthews, J. B. R., Maycock, T. K., Waterfield, T., Yelekçi, O., Yu, R., and Zhou, B., Cambridge University Press, Cambridge, United Kingdom and New York, NY, USA, pp. 2139–2152, https://doi.org/10.1017/9781009157896.017, 2021c.
IPCC: Climate Change 2022: Impacts, Adaptation, and Vulnerability, Contribution of Working Group II to the Sixth Assessment Report of the Intergovernmental Panel on Climate Change, edited by: Pörtner, H.-O., Roberts, D. C., Tignor, M., Poloczanska, E. S., Mintenbeck, K., Alegría, A., Craig, M., Langsdorf, S., Löschke, S., Möller, V., Okem, A., and Rama, B., Cambridge University Press, Cambridge University Press, Cambridge, UK and New York, NY, USA, 3056 pp., https://doi.org/10.1017/9781009325844, 2022.
Ishii, M., Fukuda, Y., Hirahara, S., Yasui, S., Suzuki, T., and Sato, K.: Accuracy of Global Upper Ocean Heat Content Estimation Expected from Present Observational Data Sets, SOLA, 13, 163–167, https://doi.org/10.2151/sola.2017-030, 2017.
Iturbide, M., Fernández, J., Gutiérrez, J. M., Pirani, A., Huard, D., Al Khourdajie, A., Baño-Medina, J., Bedia, J., Casanueva, A., Cimadevilla, E., Cofiño, A. S., De Felice, M., Diez-Sierra, J., García-Díez, M., Goldie, J., Herrera, D. A., Herrera, S., Manzanas, R., Milovac, J., Radhakrishnan, A., San-Martín, D., Spinuso, A., Thyng, K. M., Trenham, C., and Yelekçi, Ö.: Implementation of FAIR principles in the IPCC: the WGI AR6 Atlas repository, Sci. Data, 9, 629, https://doi.org/10.1038/s41597-022-01739-y, 2022.
Jenkins, S., Smith, C., Allen, M., and Grainger, R.: Tonga eruption increases chance of temporary surface temperature anomaly above 1.5 ∘C, Nature Clim. Chang., 13, 127–129, https://doi.org/10.1038/s41558-022-01568-2, 2023.
Kirchengast, G., Gorfer, M., Mayer, M., Steiner, A. K., and Haimberger, L.: GCOS EHI 1960–2020 Atmospheric Heat Content, World Data Center for Climate (WDCC) at DKRZ [data set], https://doi.org/10.26050/WDCC/GCOS_EHI_1960-2020_AHC, 2022.
Kramer, R. J., He, H., Soden, B. J., Oreopoulos, L., Myhre, G., Forster, P. M., and Smith, C. J., Observational evidence of increasing global radiative forcing, Geophys. Res. Lett., 48, e2020GL091585, https://doi.org/10.1029/2020GL091585, 2021.
Lamboll, R. D. and Rogelj, J.: Code for estimation of remaining carbon budget in IPCC AR6 WGI, Zenodo [code], https://doi.org/10.5281/zenodo.6373365, 2022.
Lamboll, R. and Rogelj, J.: Carbon Budget Calculator, 2023, Github [code], https://github.com/Rlamboll/AR6CarbonBudgetCalc, last access: 2 June 2023.
Lan, X., Tans, P., and Thoning, K. W.: Trends in globally-averaged CO2 determined from NOAA Global Monitoring Laboratory measurements, Version 2023-04, https://doi.org/10.15138/9N0H-ZH07, 2023a.
Lan, X., Thoning, K. W., and Dlugokencky, E. J.: Trends in globally-averaged CH4 N2O, and SF6 determined from NOAA Global Monitoring Laboratory measurements, Version 2023-04, NOAA Earth System Research Laboratories Global Monitoring Laboratory, https://doi.org/10.15138/P8XG-AA10, 2023b.
Laube, J., Newland, M., Hogan, C., Brenninkmeijer, A. M., Fraser, P. J., Martinerie, P., Oram, D. E., Reeves, C. E., Röckmann, T., Schwander, J., Witrant, E., and Sturges, W. T.: Newly detected ozone-depleting substances in the atmosphere, Nat. Geosci., 7, 266–269, https://doi.org/10.1038/ngeo2109, 2014.
Lee, H., Calvin, K., Dasgupta, D., Krinner, G., Mukherji, A., Thorne, P., Trisos, C., Romero, J., Aldunce, P., Barrett, K., Blanco, G., Cheung, W. W. L., Connors, S. L., Denton, F., Diongue-Niang, A., Dodman, D., Garschagen, M., Geden, O., Hayward, B., Jones, C., Jotzo, F., Krug, T., Lasco, R., Lee, J.-Y., Masson-Delmotte, V., Meinshausen, M., Mintenbeck, K., Mokssit, A., Otto, F. E. L., Pathak, M., Pirani, A., Poloczanska, E., Pörtner, H.-O., Revi, A., Roberts, D. C., Roy, J., Ruane, A. C., Skea, J., Shukla, P. R., Slade, R., Slangen, A., Sokona, Y., Sörensson, A. A., Tignor, M., van Vuuren, D., Wei, Y.-M., Winkler, H., Zhai, P., and Zommers, Z.: Synthesis Report of the IPCC Sixth Assessment Report (AR6): Summary for Policymakers, Intergovernmental Panel on Climate Change [accepted], available at https://www.ipcc.ch/report/ar6/syr/ (last access: 2 June 2023), 2023.
Lee, J.-Y., Marotzke, J., Bala, G., Cao, L., Corti, S., Dunne, J. P., Engelbrecht, F., Fischer, E., Fyfe, J. C., Jones, C., Maycock, A., Mutemi, J., Ndiaye, O., Panickal, S., and Zhou, T.: Future Global Climate: Scenario-Based Projections and Near-Term Information, in: Climate Change 2021: The Physical Science Basis, Contribution of Working Group I to the Sixth Assessment Report of the Intergovernmental Panel on Climate Change, edited by: Masson-Delmotte, V., Zhai, P., Pirani, A., Connors, S. L., Péan, C., Berger, S., Caud, N., Chen, Y., Goldfarb, L., Gomis, M. I., Huang, M., Leitzell, K., Lonnoy, E., Matthews, J. B. R., Maycock, T. K., Waterfield, T., Yelekçi, O., Yu, R., and Zhou, B., Cambridge University Press, Cambridge, United Kingdom and New York, NY, USA, pp. 553–672, https://doi.org/10.1017/9781009157896.006, 2021.
Levitus, S., Antonov, J. I., Boyer, T. P., Baranova, O. K., Garcia, H. E., Locarnini, R. A., Mishonov, A. V., Reagan, J. R., Seidov, D., Yarosh, E. S., and Zweng, M. M.: World ocean heat content and thermosteric sea level change (0–2000 m), 1955–2010, Geophys. Res. Lett., 39, L10603, https://doi.org/10.1029/2012GL051106, 2012.
Loeb, N. G., Johnson, G. C., Thorsen, T. J., Lyman, J. M., Rose, F. G., and Kato, S.: Satellite and ocean data reveal marked increase in Earth's heating rate, Geophys. Res. Lett., 48, e2021GL093047, https://doi.org/10.1029/2021GL093047, 2021.
Lonsdale, C. R. and Sun, K.: Nitrogen oxides emissions from selected cities in North America, Europe, and East Asia observed by TROPOMI before and after the COVID-19 pandemic, EGUsphere [preprint], https://doi.org/10.5194/egusphere-2023-346, 2023.
McKenna, C. M., Maycock, A. C., Forster, P. M., Smith, C. J., and Tokarska, K. B.: Stringent mitigation substantially reduces risk of unprecedented near-term warming rates, Nature Climate Change, 11, 126–131, https://doi.org/10.1038/s41558-020-00957-9, 2021.
Meinshausen, M., Raper, S. C. B., and Wigley, T. M. L.: Emulating coupled atmosphere-ocean and carbon cycle models with a simpler model, MAGICC6 – Part 1: Model description and calibration, Atmos. Chem. Phys., 11, 1417–1456, https://doi.org/10.5194/acp-11-1417-2011, 2011.
Millán, L., Santee, M. L., Lambert, A., Livesey, N. J., Werner, F., Schwartz, M. J., Pumphrey, H. C., Manney, G. L., Wang, Y., Su, H., Wu, L., Read, W. G., and Froidevaux, L.: The Hunga Tonga-Hunga Ha'apai Hydration of the Stratosphere, Geophys. Res. Lett., 49, e2022GL099381, https://doi.org/10.1029/2022GL099381, 2022.
Minx, J. C., Lamb, W. F., Andrew, R. M., Canadell, J. G., Crippa, M., Döbbeling, N., Forster, P. M., Guizzardi, D., Olivier, J., Peters, G. P., Pongratz, J., Reisinger, A., Rigby, M., Saunois, M., Smith, S. J., Solazzo, E., and Tian, H.: A comprehensive and synthetic dataset for global, regional, and national greenhouse gas emissions by sector 1970–2018 with an extension to 2019, Earth Syst. Sci. Data, 13, 5213–5252, https://doi.org/10.5194/essd-13-5213-2021, 2021.
Montzka, S: The NOAA Annual Greenhouse Gas Index (AGGI), NOAA Global Monitoring Laboratory, Boulder Colorado, USA, https://gml.noaa.gov/aggi/aggi.html (last access: 2 June 2023), 2022.
Myhre, G., Shindell, D., Bréon, F.-M., Collins, W., Fuglestvedt, J., Huang, J., Koch, D., Lamarque, J.-F., Lee, D., Mendoza, B., Nakajima, T., Robock, A., Stephens, G., Takemura, T., and Zhang, H.: Anthropogenic and Natural Radiative Forcing, in: Climate Change 2013: The Physical Science Basis, Contribution of Working Group I to the Fifth Assessment Report of the Intergovernmental Panel on Climate Change, edited by: Stocker, T. F., Qin, D., Plattner, G.-K., Tignor, M., Allen, S. K., Boschung, J., Nauels, A., Xia, Y., Bex, V., and Midgley, P. M., Cambridge University Press, Cambridge, United Kingdom and New York, NY, USA, https://doi.org/10.1017/CBO9781107415324.018, 2013.
Nisbet, E. G., Manning, M. R., Dlugokencky, E. J., Michel, S. E., Lan, X., Roeckmann, T., Gon, H. A. D. V. D., Palmer, P., Oh, Y., Fisher, R., Lowry, D., France, J. L., and White, J. W. C.: Atmospheric methane: Comparison between methane's record in 2006–2022 and during glacial terminations, ESS Open Archive [preprint], https://doi.org/10.22541/essoar.167689502.25042797/v1, 2023.
Nitzbon, J., Krinner, G., von Deimling, T. S., Werner, M., and Langer, M.: Quantifying the Permafrost Heat Sink in Earth's Climate System, ESS Open Archive [preprint], https://doi.org/10.1002/essoar.10511600.1, 2022a.
Nitzbon, J., Krinner, G., and Langer, M.: GCOS EHI 1960–2020 Permafrost Heat Content, World Data Center for Climate (WDCC) at DKRZ, https://doi.org/10.26050/WDCC/GCOS_EHI_1960-2020_PHC, 2022b.
O'Rourke, P. R., Smith, S. J., Mott, A., Ahsan, H., McDuffie, E. E., Crippa, M., Klimont, Z., McDonald, B., Wang, S., Nicholson, M. B., Feng, L., and Hoesly, R. M.: CEDS v_2021_04_21 Release Emission Data (v_2021_02_05), Zenodo [data set], https://doi.org/10.5281/zenodo.4741285, 2021.
Palmer, M. D. and McNeall, D. J.: Internal variability of Earth's energy budget simulated by CMIP5 climate models, Environ. Res. Lett., 9, 034016, https://doi.org/10.1088/1748-9326/9/3/034016, 2014.
Palmer, M. D., Domingues, C. M., Slangen, A. B. A., and Dias, F. B.: An ensemble approach to quantify global mean sea-level rise over the 20th century from tide gauge reconstructions, Environ. Res. Lett., 16, 044043, https://doi.org/10.1088/1748-9326/abdaec, 2021.
Peng, S., Lin, X., Thompson, R. L., Xi, Y., Liu, G., Hauglustaine, D., Lan, X., Poulter, B., Ramonet, M., Saunois, M., Yin, Y., Zhang, Z., Zheng, B., and Ciais, P.: Wetland emission and atmospheric sink changes explain methane growth in 2020, Nature, 612, 477–482, https://doi.org/10.1038/s41586-022-05447-w, 2022.
Pirani, A., Alegria, A., Khourdajie, A. A., Gunawan, W., Gutiérrez, J. M., Holsman, K., Huard, D., Juckes, M., Kawamiya, M., Klutse, N., Krey, V., Matthews, R., Milward, A., Pascoe, C., Van Der Shrier, G., Spinuso, A., Stockhause, M., and Xing, X.: The implementation of FAIR data principles in the IPCC AR6 assessment process, Zenodo, https://doi.org/10.5281/ZENODO.6504469, 2022.
Pongratz, J., Schwingshackl, C., Bultan, S., Obermeier, W., Havermann, F., and Guo, S.: Land Use Effects on Climate: Current State, Recent Progress, and Emerging Topics, Curr. Clim. Change Rep., 7, 99–120, https://doi.org/10.1007/s40641-021-00178-y, 2021.
Purkey, S. G. and Johnson, G. C.: Warming of Global Abyssal and Deep Southern Ocean Waters between the 1990s and 2000s: Contributions to Global Heat and Sea Level Rise Budgets, J. Climate, 23, 6336–6351, https://doi.org/10.1175/2010JCLI3682.1, 2010.
Putaud, J.-P., Pisoni, E., Mangold, A., Hueglin, C., Sciare, J., Pikridas, M., Savvides, C., Ondracek, J., Mbengue, S., Wiedensohler, A., Weinhold, K., Merkel, M., Poulain, L., van Pinxteren, D., Herrmann, H., Massling, A., Nordstroem, C., Alastuey, A., Reche, C., Pérez, N., Castillo, S., Sorribas, M., Adame, J. A., Petaja, T., Lehtipalo, K., Niemi, J., Riffault, V., de Brito, J. F., Colette, A., Favez, O., Petit, J.-E., Gros, V., Gini, M. I., Vratolis, S., Eleftheriadis, K., Diapouli, E., Denier van der Gon, H., Yttri, K. E., and Aas, W.: Impact of 2020 COVID-19 lockdowns on particulate air pollution across Europe, EGUsphere [preprint], https://doi.org/10.5194/egusphere-2023-434, 2023.
Quaas, J., Jia, H., Smith, C., Albright, A. L., Aas, W., Bellouin, N., Boucher, O., Doutriaux-Boucher, M., Forster, P. M., Grosvenor, D., Jenkins, S., Klimont, Z., Loeb, N. G., Ma, X., Naik, V., Paulot, F., Stier, P., Wild, M., Myhre, G., and Schulz, M.: Robust evidence for reversal of the trend in aerosol effective climate forcing, Atmos. Chem. Phys., 22, 12221–12239, https://doi.org/10.5194/acp-22-12221-2022, 2022.
Raghuraman, S. P., Paynter, D., and Ramaswamy, V.: Anthropogenic forcing and response yield observed positive trend in Earth's energy imbalance, Nat. Commun., 12, 4577, https://doi.org/10.1038/s41467-021-24544-4, 2021.
Randerson, J. T., van der Werf, G. R., Giglio, L., Collatz, G. J., and Kasibhatla, P. S.: Global Fire Emissions Database, Version 4.1 (GFEDv4), ORNL Distributed Active Archive Center [data set], https://doi.org/10.3334/ORNLDAAC/1293, 2017.
Riahi, K., Schaeffer, R., Arango, J., Calvin, K., Guivarch, C., Hasegawa, T., Jiang, K., Kriegler, E., Matthews, R., Peters, G. P., Rao, A., Robertson, S., Sebbit, A. M., Steinberger, J., Tavoni, M., van Vuuren, D. P.: Mitigation pathways compatible with long-term goals, in: IPCC, 2022: Climate Change 2022: Mitigation of Climate Change, Contribution of Working Group III to the Sixth Assessment Report of the Intergovernmental Panel on Climate Change, edited by: Shukla, P. R., Skea, J., Slade, R., Al Khourdajie, A., van Diemen, R., McCollum, D., Pathak, M., Some, S., Vyas, P., Fradera, R., Belkacemi, M., Hasija, A., Lisboa, G., Luz, S., and Malley, J., Cambridge University Press, Cambridge, UK and New York, NY, USA, https://doi.org/10.1017/9781009157926.005, 2022.
Ribes, A., Qasmi, S., and Gillett, N. P.: Making climate projections conditional on historical observations, Sci. Adv., 7, eabc0671, https://doi.org/10.1126/sciadv.abc0671, 2021.
Richardson, M., Cowtan, K., and Millar, R. J.: Global temperature definition affects achievement of long-term climate goals, Environ. Res. Lett., 13, 054004, https://doi.org/10.1088/1748-9326/aab305, 2018.
Rogelj, J., Rao, S., McCollum, D. L., Pachauri, S., Klimont, Z., Krey, V., and Riahi, K.: Air-pollution emission ranges consistent with the representative concentration pathways, Nature Clim. Chang., 4, 446–450, https://doi.org/10.1038/nclimate2178, 2014.
Rogelj, J., Shindell, D., Jiang, K., Fifita, S., Forster, P., Ginzburg, V., Handa, C., Kheshgi, H., Kobayashi, S., Kriegler, E., Mundaca, L., Séférian, R., and Vilariño, M. V.: Mitigation Pathways Compatible with 1.5 ∘C in the Context of Sustainable Development, in: Global Warming of 1.5 ∘C, An IPCC Special Report on the impacts of global warming of 1.5 ∘C above pre-industrial levels and related global greenhouse gas emission pathways, in the context of strengthening the global response to the threat of climate change, sustainable development, and efforts to eradicate poverty, edited by: Masson-Delmotte, V., Zhai, P., Pörtner, H.-O., Roberts, D., Skea, J., Shukla, P. R., Pirani, A., Moufouma-Okia, W., Péan, C., Pidcock, R., Connors, S., Matthews, J. B. R., Chen, Y., Zhou, X., Gomis, M. I., Lonnoy, E., Maycock, T., Tignor, M., and Waterfield, T., Cambridge University Press, Cambridge, UK and New York, NY, USA, pp. 93–174, https://doi.org/10.1017/9781009157940.004, 2018.
Rogelj, J., Forster, P. M., Kriegler, E., Smith, C. J., and Séférian, R.: Estimating and tracking the remaining carbon budget for stringent climate targets, Nature, 571, 335–342, https://doi.org/10.1038/s41586-019-1368-z, 2019.
Rohde, R., Muller, R., Jacobsen, R., Perlmutter, S., Rosenfeld, A., Wurtele, J., Curry, J., Wickham, C., and Mosher, S.: Berkeley Earth Temperature Averaging Process, Geoinfor. Geostat.: An Overview, 1, https://doi.org/10.4172/2327-4581.1000103, 2013.
Schoenenberger, F., Vollmer, M. K., Rigby, M., Hill, M., Fraser, P. J., Krummel, P. B., Langenfelds, R. L., Rhee, T. S., Peter, T., and Reimann, S.: First observations,trends, and emissions of HCFC-31 (CH2ClF) in the global atmosphere, Geophys. Res. Lett., 42, 7817–7824, https://doi.org/10.1002/2015GL064709, 2015.
Sellitto, P., Podglajen, A., Belhadji, R., Boichu, M., Carboni, E., Cuesta, J., Duchamp, C., Kloss, C., Siddans, R., Bègue, N., Blarel, L., Jegou, F., Khaykin, S., Renard, J.-B., and Legras, B.: The unexpected radiative impact of the Hunga Tonga eruption of 15th January 2022, Commun. Earth Environ., 3, 288, https://doi.org/10.1038/s43247-022-00618-z, 2022.
Seneviratne, S. I., Zhang, X., Adnan, M., Badi, W., Dereczynski, C., Di Luca, A., Ghosh, S., Iskandar, I., Kossin, J., Lewis, S., Otto, F., Pinto, I., Satoh, M., Vicente-Serrano, S. M., Wehner, M., and Zhou, B.: Weather and Climate Extreme Events in a Changing Climate, in: Climate Change 2021: The Physical Science Basis, Contribution of Working Group I to the Sixth Assessment Report of the Intergovernmental Panel on Climate Change, edited by: Masson-Delmotte, V., Zhai, P., Pirani, A., Connors, S. L., Péan, C., Berger, S., Caud, N., Chen, Y., Goldfarb, L., Gomis, M. I., Huang, M., Leitzell, K., Lonnoy, E., Matthews, J. B. R., Maycock, T. K., Waterfield, T., Yelekçi, O., Yu, R., and Zhou, B., Cambridge University Press, Cambridge, United Kingdom and New York, NY, USA, pp. 1513–1766, https://doi.org/10.1017/9781009157896.013, 2021.
Sigl, M., Toohey, M., McConnell, J. R., Cole-Dai, J., and Severi, M.: Volcanic stratospheric sulfur injections and aerosol optical depth during the Holocene (past 11 500 years) from a bipolar ice-core array, Earth Syst. Sci. Data, 14, 3167–3196, https://doi.org/10.5194/essd-14-3167-2022, 2022.
Simmonds, P. G., Rigby, M., McCulloch, A., O'Doherty, S., Young, D., Mühle, J., Krummel, P. B., Steele, P., Fraser, P. J., Manning, A. J., Weiss, R. F., Salameh, P. K., Harth, C. M., Wang, R. H. J., and Prinn, R. G.: Changing trends and emissions of hydrochlorofluorocarbons (HCFCs) and their hydrofluorocarbon (HFCs) replacements, Atmos. Chem. Phys., 17, 4641–4655, https://doi.org/10.5194/acp-17-4641-2017, 2017.
Sippel, S., Zscheischler, J., Heimann, M., Otto, F. E. L., Peters, J., and Mahecha, M. D.: Quantifying changes in climate variability and extremes: Pitfalls and their overcoming, Geophys. Res. Lett., 42, 9990–9998, https://doi.org/10.1002/2015GL066307, 2015.
Smith, C., Nicholls, Z. R. J., Armour, K., Collins, W., Forster, P., Meinshausen, M., Palmer, M. D., and Watanabe, M.: The Earth's Energy Budget, Climate Feedbacks, and Climate Sensitivity Supplementary Material, in: Climate Change 2021: The Physical Science Basis, Contribution of Working Group I to the Sixth Assessment Report of the Intergovernmental Panel on Climate Change, edited by: Masson-Delmotte, V., Zhai, P., Pirani, A., Connors, S. L., Péan, C., Berger, S., Caud, N., Chen, Y., Goldfarb, L., Gomis, M. I., Huang, M., Leitzell, K., Lonnoy, E., Matthews, J. B. R., Maycock, T. K., Waterfield, T., Yelekçi, O., Yu, R., and Zhou, B., IPCC, https://www.ipcc.ch/report/ar6/wg1/downloads/report/IPCC_AR6_WGI_Chapter07_SM.pdf (last access: 2 June 2023), 2021.
Smith, C., Walsh, T., Forster, P. M., Gillett, N., Hauser, M., Lamb, W., Lamboll, R., Palmer, M., Ribes, A., Schumacher, D., Seneviratne, S., Trewin, B., and von Schuckmann, K.: Indicators of Global Climate Change 2022 (v2023.06.02), Zenodo [data set], https://doi.org/10.5281/zenodo.8000192, 2023a.
Smith, C., Walsh, T., Forster, P. M., Gillett, N., Hauser, M., Lamb, W., Lamboll, R., Palmer, M., Ribes, A., Schumacher, D., Seneviratne, S., Trewin, B., and von Schuckmann, K.: Github Climate Indicator Repository, Github [code], https://github.com/ClimateIndicator, last access: 2 June 2023b.
Smith, S. J., van Aardenne, J., Klimont, Z., Andres, R. J., Volke, A., and Delgado Arias, S.: Anthropogenic sulfur dioxide emissions: 1850–2005, Atmos. Chem. Phys., 11, 1101–1116, https://doi.org/10.5194/acp-11-1101-2011, 2011.
Sokhi, R. S., Singh, V., Querol, X., Finardi, S., Targino, A. C., Andrade, M. de F., Pavlovic, R., Garland, R. M., Massagué, J., Kong, S., Baklanov, A., Ren, L., Tarasova, O., Carmichael, G., Peuch, V.-H., Anand, V., Arbilla, G., Badali, K., Beig, G., Belalcazar, L. C., Bolignano, A., Brimblecombe, P., Camacho, P., Casallas, A., Charland, J.-P., Choi, J., Chourdakis, E., Coll, I., Collins, M., Cyrys, J., Silva, C. M. da, Giosa, A. D. D., Leo, A. D., Ferro, C., Gavidia-Calderon, M., Gayen, A., Ginzburg, A., Godefroy, F., Gonzalez, Y. A., Guevara-Luna, M., Haque, S. M., Havenga, H., Herod, D., Hõrrak, U., Hussein, T., Ibarra, S., Jaimes, M., Kaasik, M., Khaiwal, R., Kim, J., Kousa, A., Kukkonen, J., Kulmala, M., Kuula, J., Violette, N. L., Lanzani, G., Liu, X., MacDougall, S., Manseau, P. M., Marchegiani, G., McDonald, B., Mishra, S. V., Molina, L. T., Mooibroek, D., Mor, S., Moussiopoulos, N., Murena, F., Niemi, J. V., Noe, S., Nogueira, T., Norman, M., Pérez-Camaño, J. L., Petäjä, T., Piketh, S., Rathod, A., Reid, K., Retama, A., Rivera, O., Rojas, N. Y., Rojas-Quincho, J. P., José, R. S., Sánchez, O., Seguel, R. J., Sillanpää, S., Su, Y., Tapper, N., Terrazas, A., Timonen, H., Toscano, D., Tsegas, G., Velders, G. J. M., Vlachokostas, C., Schneidemesser, E. von, VPM, R., Yadav, R., Zalakeviciute, R., and Zavala, M.: A global observational analysis to understand changes in air quality during exceptionally low anthropogenic emission conditions, Environ. Int., 157, 106818, https://doi.org/10.1016/j.envint.2021.106818, 2021.
Steiner, A. K., Ladstädter, F., Randel, W. J., Maycock, A. C., Fu, Q., Claud, C., Gleisner, H., Haimberger, L., Ho, S.-P., Keckhut, P., Leblanc, T., Mears, C., Polvani, L. M., Santer, B. D., Schmidt, T., Sofieva, V., Wing, R., and Zou, C.-Z.: Observed Temperature Changes in the Troposphere and Stratosphere from 1979 to 2018, J. Climate, 33, 8165–8194, https://doi.org/10.1175/JCLI-D-19-0998.1, 2020.
Szopa, S., Naik, V., Adhikary, B., Artaxo, P., Berntsen, T., Collins, W. D., Fuzzi, S., Gallardo, L., Kiendler-Scharr, A., Klimont, Z., Liao, H., Unger, N., and Zanis, P.: Short-Lived Climate Forcers, in: Climate Change 2021: The Physical Science Basis, Contribution of Working Group I to the Sixth Assessment Report of the Intergovernmental Panel on Climate Change, edited by: Masson-Delmotte, V., Zhai, P., Pirani, A., Connors, S. L., Péan, C., Berger, S., Caud, N., Chen, Y., Goldfarb, L., Gomis, M. I., Huang, M., Leitzell, K., Lonnoy, E., Matthews, J. B. R., Maycock, T. K., Waterfield, T., Yelekçi, O., Yu, R., and Zhou, B., Cambridge University Press, Cambridge, United Kingdom and New York, NY, USA, pp. 817–922, https://doi.org/10.1017/9781009157896.008, 2021.
Trewin, B.: Assessing Internal Variability of Global Mean Surface Temperature From Observational Data and Implications for Reaching Key Thresholds, J. Geophys. Res.-Atmos., 127, e2022JD036747, https://doi.org/10.1029/2022JD036747, 2022.
Vanderkelen, I. and Thiery, W.: GCOS EHI 1960–2020 Inland Water Heat Content, World Data Center for Climate (WDCC) at DKRZ [data set], https://doi.org/10.26050/WDCC/GCOS_EHI_1960-2020_IWHC, 2022.
Vanderkelen, I., van Lipzig, N. P. M., Lawrence, D. M., Droppers, B., Golub, M., Gosling, S. N., Janssen, A. B. G., Marcé, R., Schmied, H. M., Perroud, M., Pierson, D., Pokhrel, Y., Satoh, Y., Schewe, J., Seneviratne, S. I., Stepanenko, V. M., Tan, Z., Woolway, R. I., and Thiery, W.: Global Heat Uptake by Inland Waters, Geophys. Res. Lett., 47, e2020GL087867, https://doi.org/10.1029/2020GL087867, 2020.
van Marle, M. J. E., Kloster, S., Magi, B. I., Marlon, J. R., Daniau, A.-L., Field, R. D., Arneth, A., Forrest, M., Hantson, S., Kehrwald, N. M., Knorr, W., Lasslop, G., Li, F., Mangeon, S., Yue, C., Kaiser, J. W., and van der Werf, G. R.: Historic global biomass burning emissions for CMIP6 (BB4CMIP) based on merging satellite observations with proxies and fire models (1750–2015), Geosci. Model Dev., 10, 3329–3357, https://doi.org/10.5194/gmd-10-3329-2017, 2017.
Vollmer, M. K., Young, D., Trudinger, C. M., Mühle, J., Henne, S., Rigby, M., Park, S., Li, S., Guillevic, M., Mitrevski, B., Harth, C. M., Miller, B. R., Reimann, S., Yao, B., Steele, L. P., Wyss, S. A., Lunder, C. R., Arduini, J., McCulloch, A., Wu, S., Rhee, T. S., Wang, R. H. J., Salameh, P. K., Hermansen, O., Hill, M., Langenfelds, R. L., Ivy, D., O'Doherty, S., Krummel, P. B., Maione, M., Etheridge, D. M., Zhou, L., Fraser, P. J., Prinn, R. G., Weiss, R. F., and Simmonds, P. G.: Atmospheric histories and emissions of chlorofluorocarbons CFC-13 (CClF3), ΣCFC-114 (C2Cl2F4), and CFC-115 (C2ClF5), Atmos. Chem. Phys., 18, 979–1002, https://doi.org/10.5194/acp-18-979-2018, 2018.
von Schuckmann, K., Cheng, L., Palmer, M. D., Hansen, J., Tassone, C., Aich, V., Adusumilli, S., Beltrami, H., Boyer, T., Cuesta-Valero, F. J., Desbruyères, D., Domingues, C., García-García, A., Gentine, P., Gilson, J., Gorfer, M., Haimberger, L., Ishii, M., Johnson, G. C., Killick, R., King, B. A., Kirchengast, G., Kolodziejczyk, N., Lyman, J., Marzeion, B., Mayer, M., Monier, M., Monselesan, D. P., Purkey, S., Roemmich, D., Schweiger, A., Seneviratne, S. I., Shepherd, A., Slater, D. A., Steiner, A. K., Straneo, F., Timmermans, M.-L., and Wijffels, S. E.: Heat stored in the Earth system: where does the energy go?, Earth Syst. Sci. Data, 12, 2013–2041, https://doi.org/10.5194/essd-12-2013-2020, 2020.
von Schuckmann, K., Minière, A., Gues, F., Cuesta-Valero, F. J., Kirchengast, G., Adusumilli, S., Straneo, F., Ablain, M., Allan, R. P., Barker, P. M., Beltrami, H., Blazquez, A., Boyer, T., Cheng, L., Church, J., Desbruyeres, D., Dolman, H., Domingues, C. M., García-García, A., Giglio, D., Gilson, J. E., Gorfer, M., Haimberger, L., Hakuba, M. Z., Hendricks, S., Hosoda, S., Johnson, G. C., Killick, R., King, B., Kolodziejczyk, N., Korosov, A., Krinner, G., Kuusela, M., Landerer, F. W., Langer, M., Lavergne, T., Lawrence, I., Li, Y., Lyman, J., Marti, F., Marzeion, B., Mayer, M., MacDougall, A. H., McDougall, T., Monselesan, D. P., Nitzbon, J., Otosaka, I., Peng, J., Purkey, S., Roemmich, D., Sato, K., Sato, K., Savita, A., Schweiger, A., Shepherd, A., Seneviratne, S. I., Simons, L., Slater, D. A., Slater, T., Steiner, A. K., Suga, T., Szekely, T., Thiery, W., Timmermans, M.-L., Vanderkelen, I., Wjiffels, S. E., Wu, T., and Zemp, M.: Heat stored in the Earth system 1960–2020: where does the energy go?, Earth Syst. Sci. Data, 15, 1675–1709, https://doi.org/10.5194/essd-15-1675-2023, 2023a.
von Schuckmann, K., Minière, A., Gues, F., Cuesta-Valero, F. J., Kirchengast, G., Adusumilli, S., Straneo, F., Ablain, M., Allan, R. P., Barker, P. M., Beltrami, H., Blazquez, A., Boyer, T., Cheng, L., Church, J., Desbruyeres, D., Dolman, H., Domingues, C. M., García-García, A., Giglio, D., Gilson, J. E., Gorfer, M., Haimberger, L., Hakuba, M. Z., Hendricks, S., Hosoda, S., Johnson, G. C., Killick, R., King, B., Kolodziejczyk, N., Korosov, A., Krinner, G., Kuusela, M., Landerer, F. W., Langer, M., Lavergne, T., Lawrence, I., Li, Y., Lyman, J., Marti, F., Marzeion, B., Mayer, M., MacDougall, A. H., McDougall, T., Monselesan, D. P., Nitzbon, J., Otosaka, I., Peng, J., Purkey, S., Roemmich, D., Sato, K., Sato, K., Savita, A., Schweiger, A., Shepherd, A., Seneviratne, S. I., Simons, L., Slater, D. A., Slater, T., Steiner, A. K., Suga, T., Szekely, T., Thiery, W., Timmermans, M.-L., Vanderkelen, I., Wjiffels, S. E., Wu, T., and Zemp, M.: GCOS EHI 1960–2020 Earth Heat Inventory Ocean Heat Content (Version 2), World Data Center for Climate (WDCC) at DKRZ [data set], https://doi.org/10.26050/WDCC/GCOS_EHI_1960-2020_OHC_v2, 2023b.
Western, L. M., Vollmer, M. K., Krummel, P. B., Adcock, K. E., Fraser, P. J., Harth, C. M., Langenfelds, R. L., Montzka, S. A., Mühle, J., O'Doherty, S., Oram, D. E., Reimann, S., Rigby, M., Vimont, I., Weiss, R. F., Young, D., and Laube, J. C.: Global increase of ozone-depleting chlorofluorocarbons from 2010 to 2020, Nat. Geosci., 16, 309–313, https://doi.org/10.1038/s41561-023-01147-w, 2023.
Wild, M., Gilgen, H., Roesch, A., Ohmura, A., Long, C. N., Dutton, E. G., Forgan, B., Kallis, A., Russak, V., and Tsvetkov, A.: From Dimming to Brightening: Decadal Changes in Solar Radiation at Earth's Surface, Science, 308, 847–850, https://doi.org/10.1126/science.1103215, 2005.
Zhang, Z., Poulter, B., Feldman, A. F., Ying, Q., Ciais, P., Peng, S., and Xin, L.: Recent intensification of wetland methane feedback, Nat. Clim. Chang., 13, 430–433, https://doi.org/10.1038/s41558-023-01629-0, 2023.
- Abstract
- Introduction
- Emissions
- Well-mixed greenhouse gas concentrations
- Effective radiative forcing (ERF)
- Global surface temperature
- Earth energy imbalance
- Human-induced global warming
- Remaining carbon budget
- Examples of climate and weather extremes: maximum temperature over land
- Dashboard data visualisations
- Code and data availability
- Discussion and conclusions
- Author contributions
- Competing interests
- Disclaimer
- Financial support
- Review statement
- References
- Supplement
- Article
(5176 KB) - Full-text XML
- Version 2023
- Version 2024
- Version 2025
-
Supplement
(1171 KB) - BibTeX
- EndNote
- Abstract
- Introduction
- Emissions
- Well-mixed greenhouse gas concentrations
- Effective radiative forcing (ERF)
- Global surface temperature
- Earth energy imbalance
- Human-induced global warming
- Remaining carbon budget
- Examples of climate and weather extremes: maximum temperature over land
- Dashboard data visualisations
- Code and data availability
- Discussion and conclusions
- Author contributions
- Competing interests
- Disclaimer
- Financial support
- Review statement
- References
- Supplement