the Creative Commons Attribution 4.0 License.
the Creative Commons Attribution 4.0 License.
 | 11 Jun 2026
Indicators of Global Climate Change 2025: annual update of key indicators of the state of the climate system and human influence
Tristram Walsh
Chris Smith
William F. Lamb
Robin Lamboll
Christophe Cassou
Mathias Hauser
Zeke Hausfather
June-Yi Lee
Matthew D. Palmer
Karina von Schuckmann
Aimée B. A. Slangen
Sophie Szopa
Blair Trewin
Jeongeun Yun
Nathan P. Gillett
Stuart Jenkins
H. Damon Matthews
Krishnan Raghavan
Aurélien Ribes
Joeri Rogelj
Debbie Rosen
Xuebin Zhang
Myles Allen
Robbie M. Andrew
Chris Atkinson
Richard A. Betts
Antonio Bombelli
Samantha N. Burgess
Lijing Cheng
Helen E. Claxton
Pierre Friedlingstein
Thomas L. Frölicher
Catia M. Domingues
Thomas Gasser
Catherine H. Gregory
Rachel M. Hoesly
Daniel Huppmann
Masayoshi Ishii
Christopher Kadow
Alexia Karwat
John Kennedy
Rachel E. Killick
Mahesh V. M. Kovilakam
Paul B. Krummel
Xin Lan
Jean-François Lamarque
Aurélien Liné
Belén Martín-Míguez
Didier P. Monselesan
Colin Morice
Jens Mühle
Pino Mussak
Glen P. Peters
Anna Pirani
Julia Pongratz
Matthew Rigby
Robert Rohde
Abhishek Savita
Sonia I. Seneviratne
Steven J. Smith
Ghassan Taha
Caterina Tassone
Peter Thorne
Christopher Wells
Luke M. Western
Guido R. van der Werf
Susan E. Wijffels
Marco Zecchetto
Junting Zhong
Xiao-Ye Zhang
Valérie Masson-Delmotte
Panmao Zhai
In a rapidly changing climate, evidence-based decision-making benefits from up-to-date and timely information. We track twelve key sets of indicators of the state of the climate system, closely following Intergovernmental Panel on Climate Change (IPCC) Sixth Assessment report (AR6) methods, to produce our fourth annual publication. One of the indicators, the Earth's energy imbalance (EEI) provides a crucial integrative measure of the overall heating of the planet and the pace of climate change – this has more than doubled since the 1976–1995 period. A newly added indicator of temperature extremes, the number of days experiencing marine heatwaves, has more than tripled between 1991 and 2025.
For the 2016–2025 decade average, observed warming relative to 1850–1900 was 1.26 [1.13 to 1.36] °C, of which 1.24 [1.0 to 1.5] °C was human-induced. Human-induced warming reached 1.37 °C relative to 1850–1900 in the year 2025, increasing at a rate of 0.27 [0.2–0.4] °C per decade over 2016–2025. This high rate of warming, which matches the all-time high seen last year in the instrumental record, was caused by a combination of greenhouse gas emissions being at an all-time high of 54.6 ± 5.5 GtCO2e yr−1 over the last decade (2015–2024), as well as reductions in the strength of aerosol cooling. Despite this, there is evidence that CO2 emission growth is slowing. The continuation of these annual updates could track decreases or increases in the rate of human influence and climatic changes presented here, reflecting the outcomes of societal choices during the critical 2020s decade.
The data presented herein can provide a useful reference point for the drafting of the IPCC seventh assessment report. In total, we employ analysis from over 40 global datasets (https://doi.org/10.5281/zenodo.20499280, Smith et al., 2026a). Future monitoring of these indicators, such as ocean and satellite measurements of the Earth's energy imbalance, are threatened by geopolitical and public funding decisions. Our ability to consistently track many of the indicators requires the continuity of observation programs and coordination mechanisms, including the Global Climate Observing System (GCOS) program, that enable their effective integration and use.
- Version 2022
- Version 2023
- Version 2024
-
Supplement
(10624 KB)
- Article
(9508 KB) - Full-text XML
- Version 2022
- Version 2023
- Version 2024
-
Supplement
(10624 KB) - BibTeX
- EndNote


IPCC AR6 provided an assessment of human influence on key indicators of the state of the climate grounded in available data at the time of publication. The preparation for the next IPCC report, the Seventh Assessment Report (AR7), has started, and the assessment is due in around two years. Given the speed of recent change and the need for updated climate knowledge to inform evidence-based decision-making, the Indicators of Global Climate Change (IGCC) was initiated in 2023 to provide policymakers with annual updates of the latest scientific understanding on the state of selected critical indicators of the climate system and, where possible, of the quantified human influence upon these.
IGCC complements other annual physical climate updates, most notably, the BAMS State of the Climate Report (Blunden and Reagan, 2025) and the WMO State of the Global Climate (WMO, 2026). The main difference is that this work goes beyond the observations to make process level estimates of effective radiative forcing and attributed human-induced response, including the remaining carbon budget, using methods rigorously assessed in AR6, modified where necessary to account for new or revised datasets and other key innovations. By attributing temperature changes it also supports annual updates of climate impacts, especially health-related impacts compiled by the Lancet Countdown reports on health and climate change (Romanello et al., 2025).
This fourth annual update follows broadly the format of last year (Forster et al., 2025) and extends the indicators through 2025. The work focuses on indicators related to heating of the climate system, building from greenhouse gas emissions towards estimates of human-induced warming and the remaining carbon budget for 1.5 °C and other policy-relevant temperature thresholds. New in this year's update are the inclusion of a marine heatwave indicator. Figure 1 presents an overview of the aspects assessed and their interlinkages from cause (emissions) through effect (changes in physical indicators) to climatic impact drivers. It also provides a visual roadmap as to the structure of remaining sections in this paper to guide the reader.
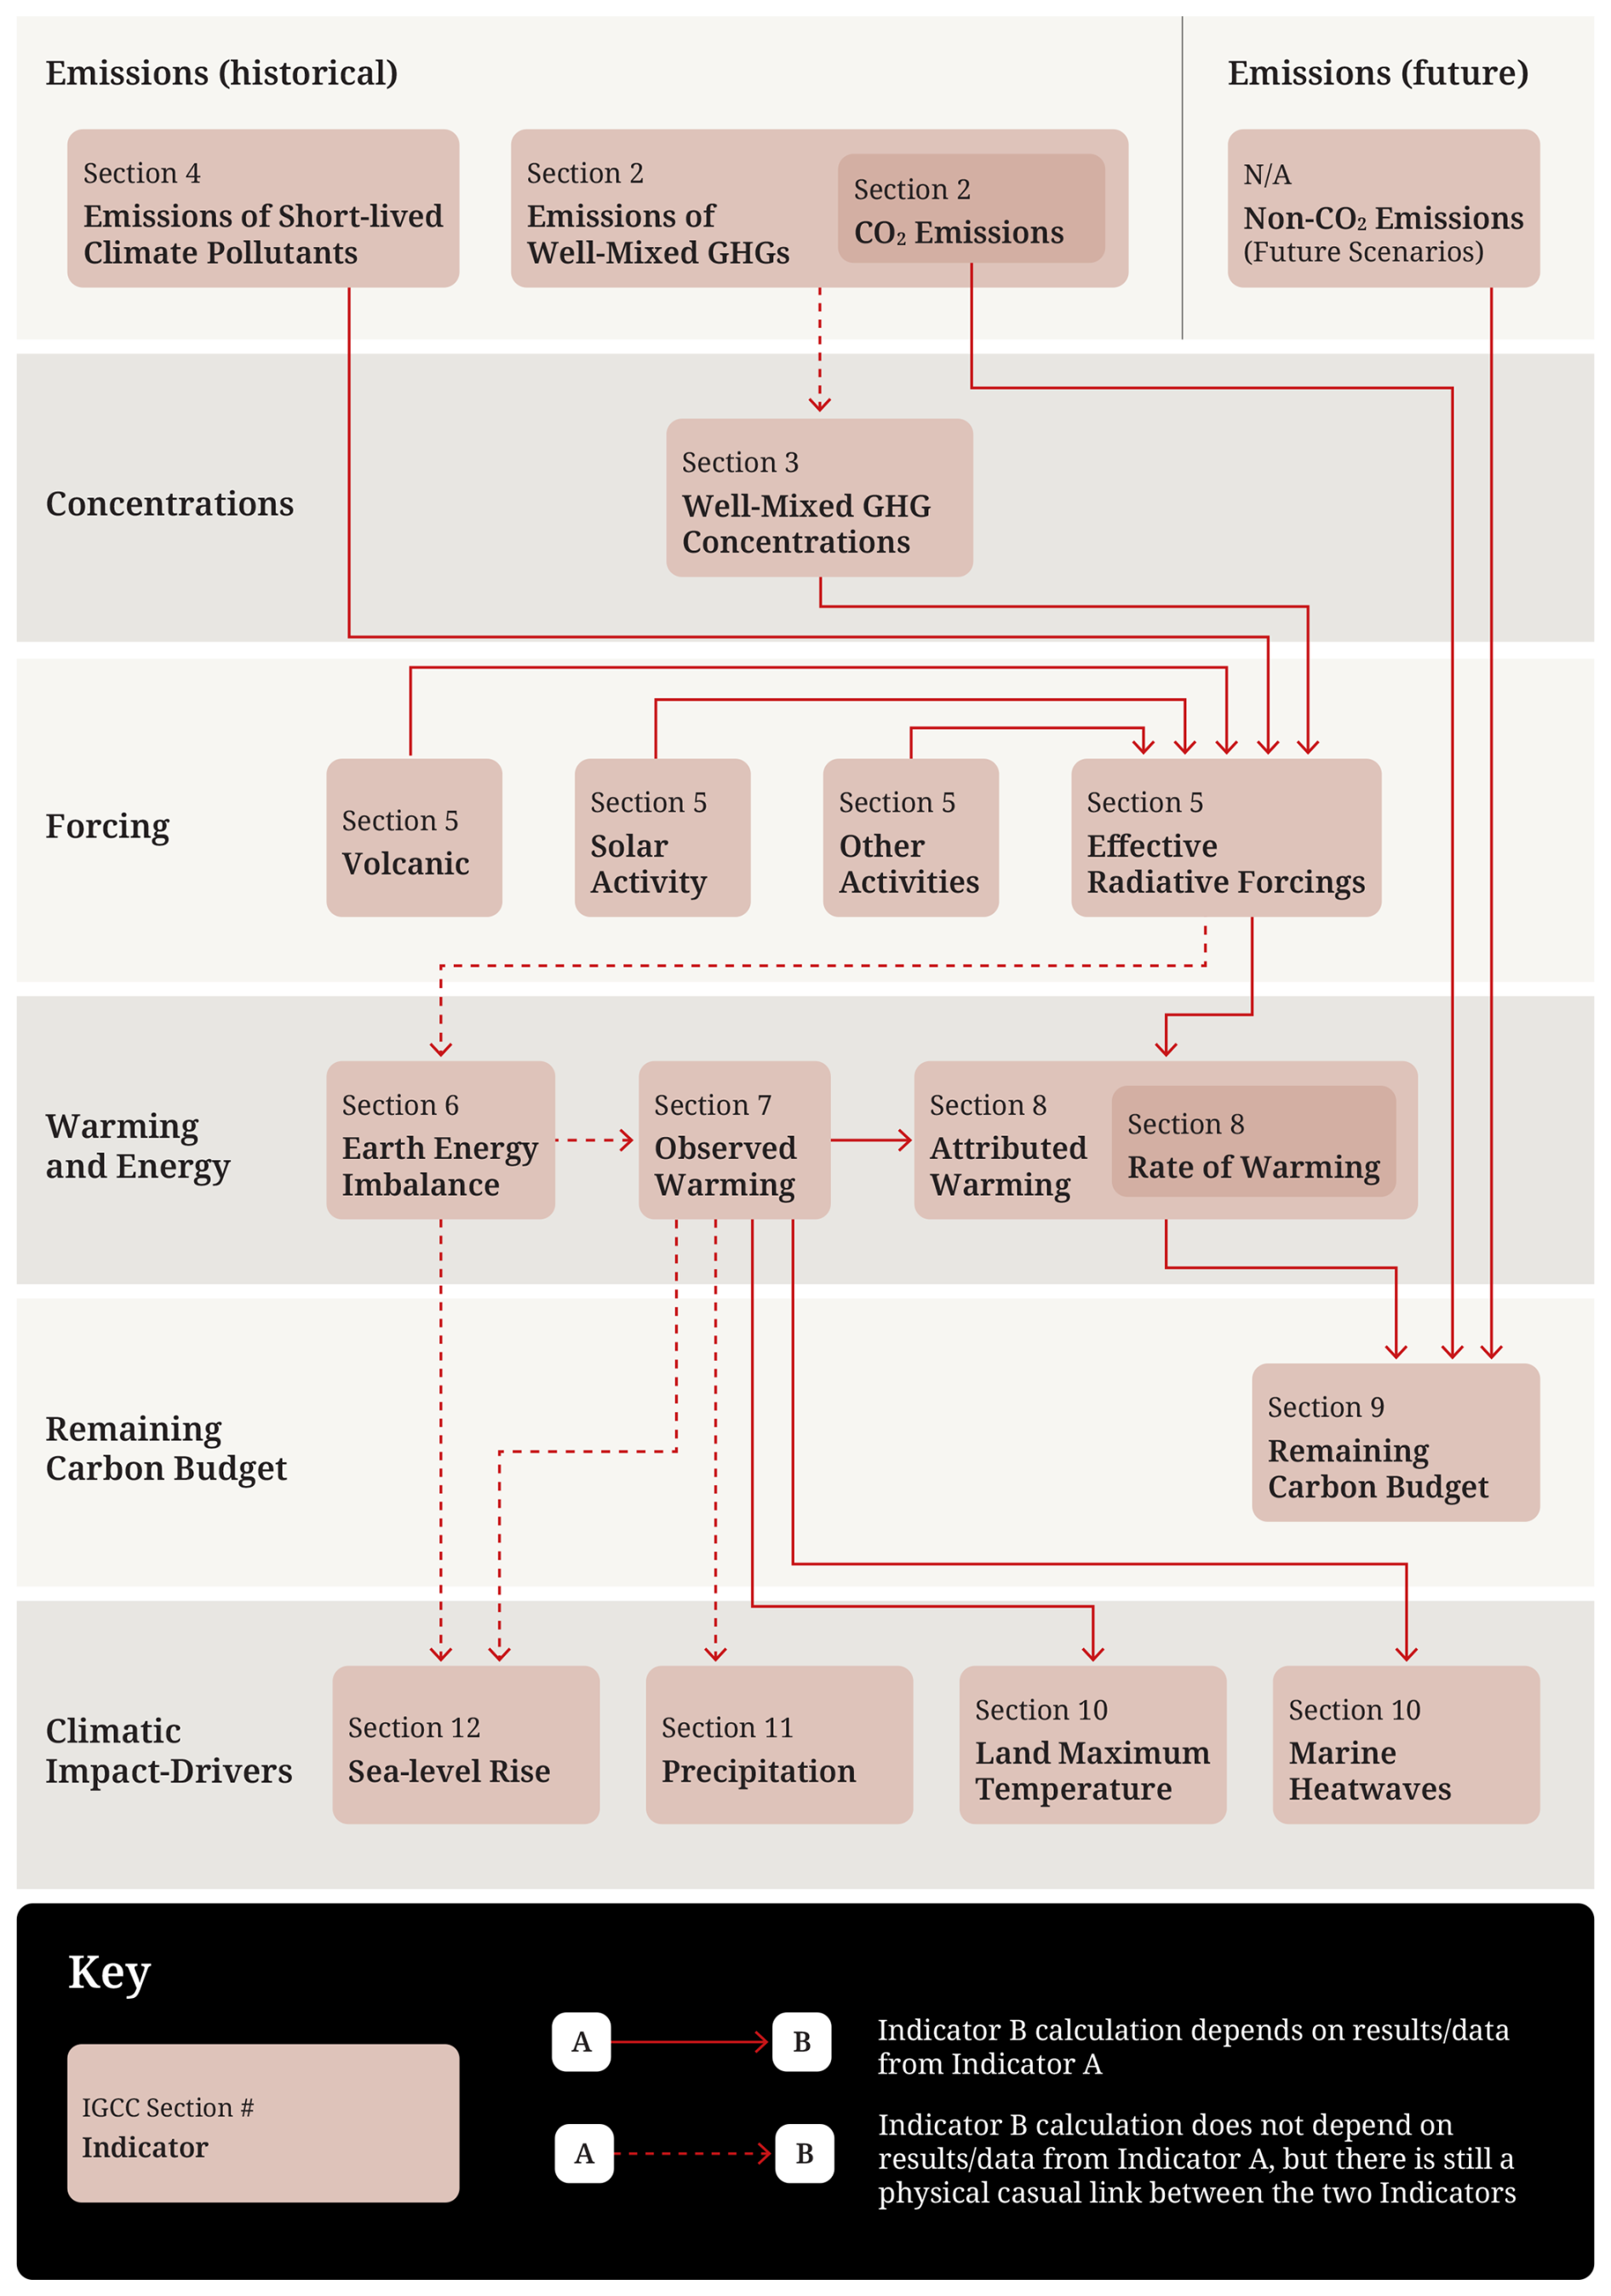
Figure 1The flow chart of data production from emissions to human induced warming, the remaining carbon budget, and changes to Climatic Impact-Drivers, illustrating both the rationale and workflow within this manuscript. Note that, where indicator boxes are nested inside each other, this indicates that the inner indicator is a subset of the outer indicator's dataset or analysis process, not separate.
The update is based on methodologies assessed by the IPCC Sixth Assessment Report (AR6) of the physical science basis of climate change (Working Group One (WGI) report; IPCC, 2021a) as well as Chap. 2 of the WGIII report (Dhakal et al., 2022) and is aligned with the efforts initiated in AR6 to implement FAIR (Findable, Accessible, Interoperable, Reusable) principles for reproducibility and reusability (Pirani et al., 2022; Iturbide et al., 2022). IPCC reports make a much wider assessment of the science and methodologies – we do not attempt to reproduce the comprehensive nature of these IPCC assessments here. We also do not consider adopting fundamentally different approaches to AR6. Rather, our aim is to rigorously track both climate system change and evolving methodological improvements between IPCC report cycles, thereby increasing transparency and consistency in between successive reports.
This annual update is organised as follows: greenhouse gas (GHG) emissions (Sect. 2), greenhouse gas concentrations (Sect. 3) and emissions of short-lived climate forcers (Sect. 4) are used to develop updated estimates of effective radiative forcing (Sect. 5). The Earth energy imbalance (Sect. 6) and observations of global surface temperature change (Sect. 7) are key global indicators of a warming world. The contributions to global surface temperature change from human and natural influences are formally attributed in Sect. 8, which tracks the level and rate of human-induced warming. Section 9 updates the remaining carbon budget for policy-relevant temperature thresholds. Section 10 gives an example of global-scale indicators associated with climate extremes of maximum land surface temperatures and, a new addition to this year's update, the number of marine heatwave days. Section 11 shows land-surface precipitation trends and Sect. 12 presents updated estimates of global mean sea-level rise. Code and data availability are described in Sect. 13, and conclusions are presented in Sect. 14. Data are available at https://doi.org/10.5281/zenodo.7883757 (Smith et al., 2026a).
Historic GHG emissions from human activity were assessed in both AR6 WGI and WGIII. Chapter 5 of WGI assessed CO2 and CH4 emissions in the context of the carbon cycle (Canadell et al., 2021). Chapter 2 of WGIII, published one year later (Dhakal et al., 2022), assessed the sectoral sources of emissions and gave the most up-to-date understanding of the current level of emissions. This section bases its methods and data on those employed in the WGIII chapter.
2.1 Methods of estimating greenhouse gas emissions changes
Like in AR6 WGIII, net GHG emissions in this paper refer to releases of GHGs from anthropogenic sources minus removals by anthropogenic sinks, for the set of GHGs outlined in the United Nations Framework Convention on Climate Change (UNFCCC). These include: CO2 emissions from fossil fuels and industry (CO2-FFI); net CO2 emissions from land use, land-use change and forestry (CO2-LULUCF); CH4 emissions; N2O emissions; and fluorinated gas (F-gas) emissions comprising hydrofluorocarbons (HFCs), perfluorocarbons (PFCs), sulphur hexafluoride (SF6) and nitrogen trifluoride (NF3) – hereafter the “UNFCCC F-gases”.
The IPCC AR6 WGIII calculated total net GHG emissions as the sum of CO2-FFI, CH4, N2O and UNFCCC F-gases from the Emissions Database for Global Atmospheric Research (“EDGAR” version 6, with a fast-track methodology applied for the final year of data – 2019), and net CO2-LULUCF emissions from the Global Carbon Budget (“GCB”; the 2020 version; Friedlingstein et al., 2020). Net CO2-LULUCF emissions followed the GCB convention and were derived from the average of three bookkeeping models (Hansis et al., 2015; Houghton and Nassikas, 2017; Gasser et al., 2020).
The analysis presented here continues to provide an “WGIII update” estimate that tracks the same system boundary and compilation of GHGs as in AR6 WGIII, albeit with one difference in the selected data sources: for CO2-FFI we use GCB (Friedlingstein et al., 2026) instead of EDGAR, in order to report the year-1 projection which is only available for GCB at this point in the reporting cycle. Otherwise, we continue to use EDGAR (Crippa et al., 2025) for non-CO2 emissions (N2O, CH4 and F-gases), and GCB for CO2-LULUCF. The latter has now been updated to account for historical changes in biomass and soil carbon densities (primarily due to CO2 fertilisation) based on the average of three bookkeeping models that can represent time-varying carbon densities (the BLUE model by Hansis et al., 2015; the OSCAR model by Gasser et al., 2020; the LUCE model by Qin et al., 2024, see Friedlingstein et al., 2026 and Supplement). We follow the same approach for estimating uncertainties and CO2-equivalent emissions as in AR6, as described in the Supplement. We contextualise the selected data sources by reporting emissions at the level of gases (e.g. CO2-FFI, CO2-LULUCF, CH4, N2O and F-gases) from other major databases, including the PRIMAP-hist database (Gütschow et al., 2025)1; the Community Emissions Data System (CEDS; Hoesly et al., 2025); the LULUCF Data Hub (Melo et al., 2025); the Food and Agriculture Organisation of the UN (FAOSTAT) Greenhouse Gas Emissions dataset (FAO, 2025); and the Global Fire Emissions Database (GFED; van der Werf et al., 2025).
In addition to the WGIII update, we provide two further estimates of total GHG emissions that provide clarity and comparison to other existing assessment approaches. This reflects the fact that other decision criteria for tracking emissions are possible (for further detail, see Supplement and Lamb et al., 2026). First, in cases where assessments prioritise calculating the best estimate of fluxes to the atmosphere, it would be important to include Ozone Depleting Substances (ODS F-gases – which include CFCs, HCFCs, Halons and other non-“UNFCCC” species), the cement carbonation sink and all non-CO2 biomass fire emissions, including those from wildfires. Indeed, these are included in this article in subsequent assessments of concentration change (including compounds formed in the atmosphere as ozone), effective radiative forcing, human-induced warming, carbon budgets and climate impacts, in line with the WGI assessment. We therefore provide an “IPCC update + additional sources and sinks” estimate that shows the change implied by including these three components in the global total. Second, we provide an “inventory-aligned” estimate that is consistent with national reporting and assessments of the Nationally Determined Contributions (NDCs). This explicitly follows the inventory approach to accounting for LULUCF emissions (based on the processed inventory data from the LULUCF Data Hub), while also integrating the latest national inventory data from the Common Reporting Tables (based on PRIMAP Hist-CR). The data sources associated with these additional estimates are detailed in Table S1 in the Supplement.
We expect to see differences between the three estimates, most notably between the “WGIII update” and “inventory-aligned” estimates, primarily because they differ conceptually in their treatment of the LULUCF sector. Whereas the WGIII update excludes “indirect anthropogenic effects” on terrestrial carbon fluxes when they do not coincide with land-use changes (i.e., in the GCB fluxes such as enhanced forest growth in response to increased atmospheric CO2 levels are treated as part of the natural land sink), these fluxes are included in inventory-aligned estimates where they occur on managed land, effectively summing to a significant sink. Further, national inventory reporting can also differ from third-party datasets in terms of underlying methods: in some countries, investments into statistical infrastructures have enabled the use of more precise emissions factors in inventories to estimate fluxes according to local or national conditions, while in others this may not be the case. In contrast, third-party datasets often use globally consistent emissions factors. Notably, the PRIMAP Hist-CR dataset, which is here used to represent national inventories, has significantly lower total CH4 emissions relative to other datasets reported herein, as well as the global atmospheric inversion estimates evaluated in this paper. A substantive body of recent literature has consistently found that, on average, national inventories tend to underestimate emissions compared to inversions (Deng et al., 2022; Tibrewal et al., 2024; Janardanan et al., 2024; Scarpelli et al., 2022; Song et al., 2026).
2.2 Updated greenhouse gas emissions
Updated GHG emission estimates following the WGIII assessment are presented in Fig. 2 and Table 1. Total global GHG emissions were 56.8 ± 5.5 GtCO2e in 2024. Of this total, CO2-FFI contributed 38.6 ± 3.1 GtCO2, CO2-LULUCF contributed 4.6 ± 3.2 GtCO2, CH4 contributed 9.3 ± 2.8 GtCO2e, N2O contributed 2.6 ± 1.6 GtCO2e and F-gas emissions contributed 1.7 ± 0.5 GtCO2e.
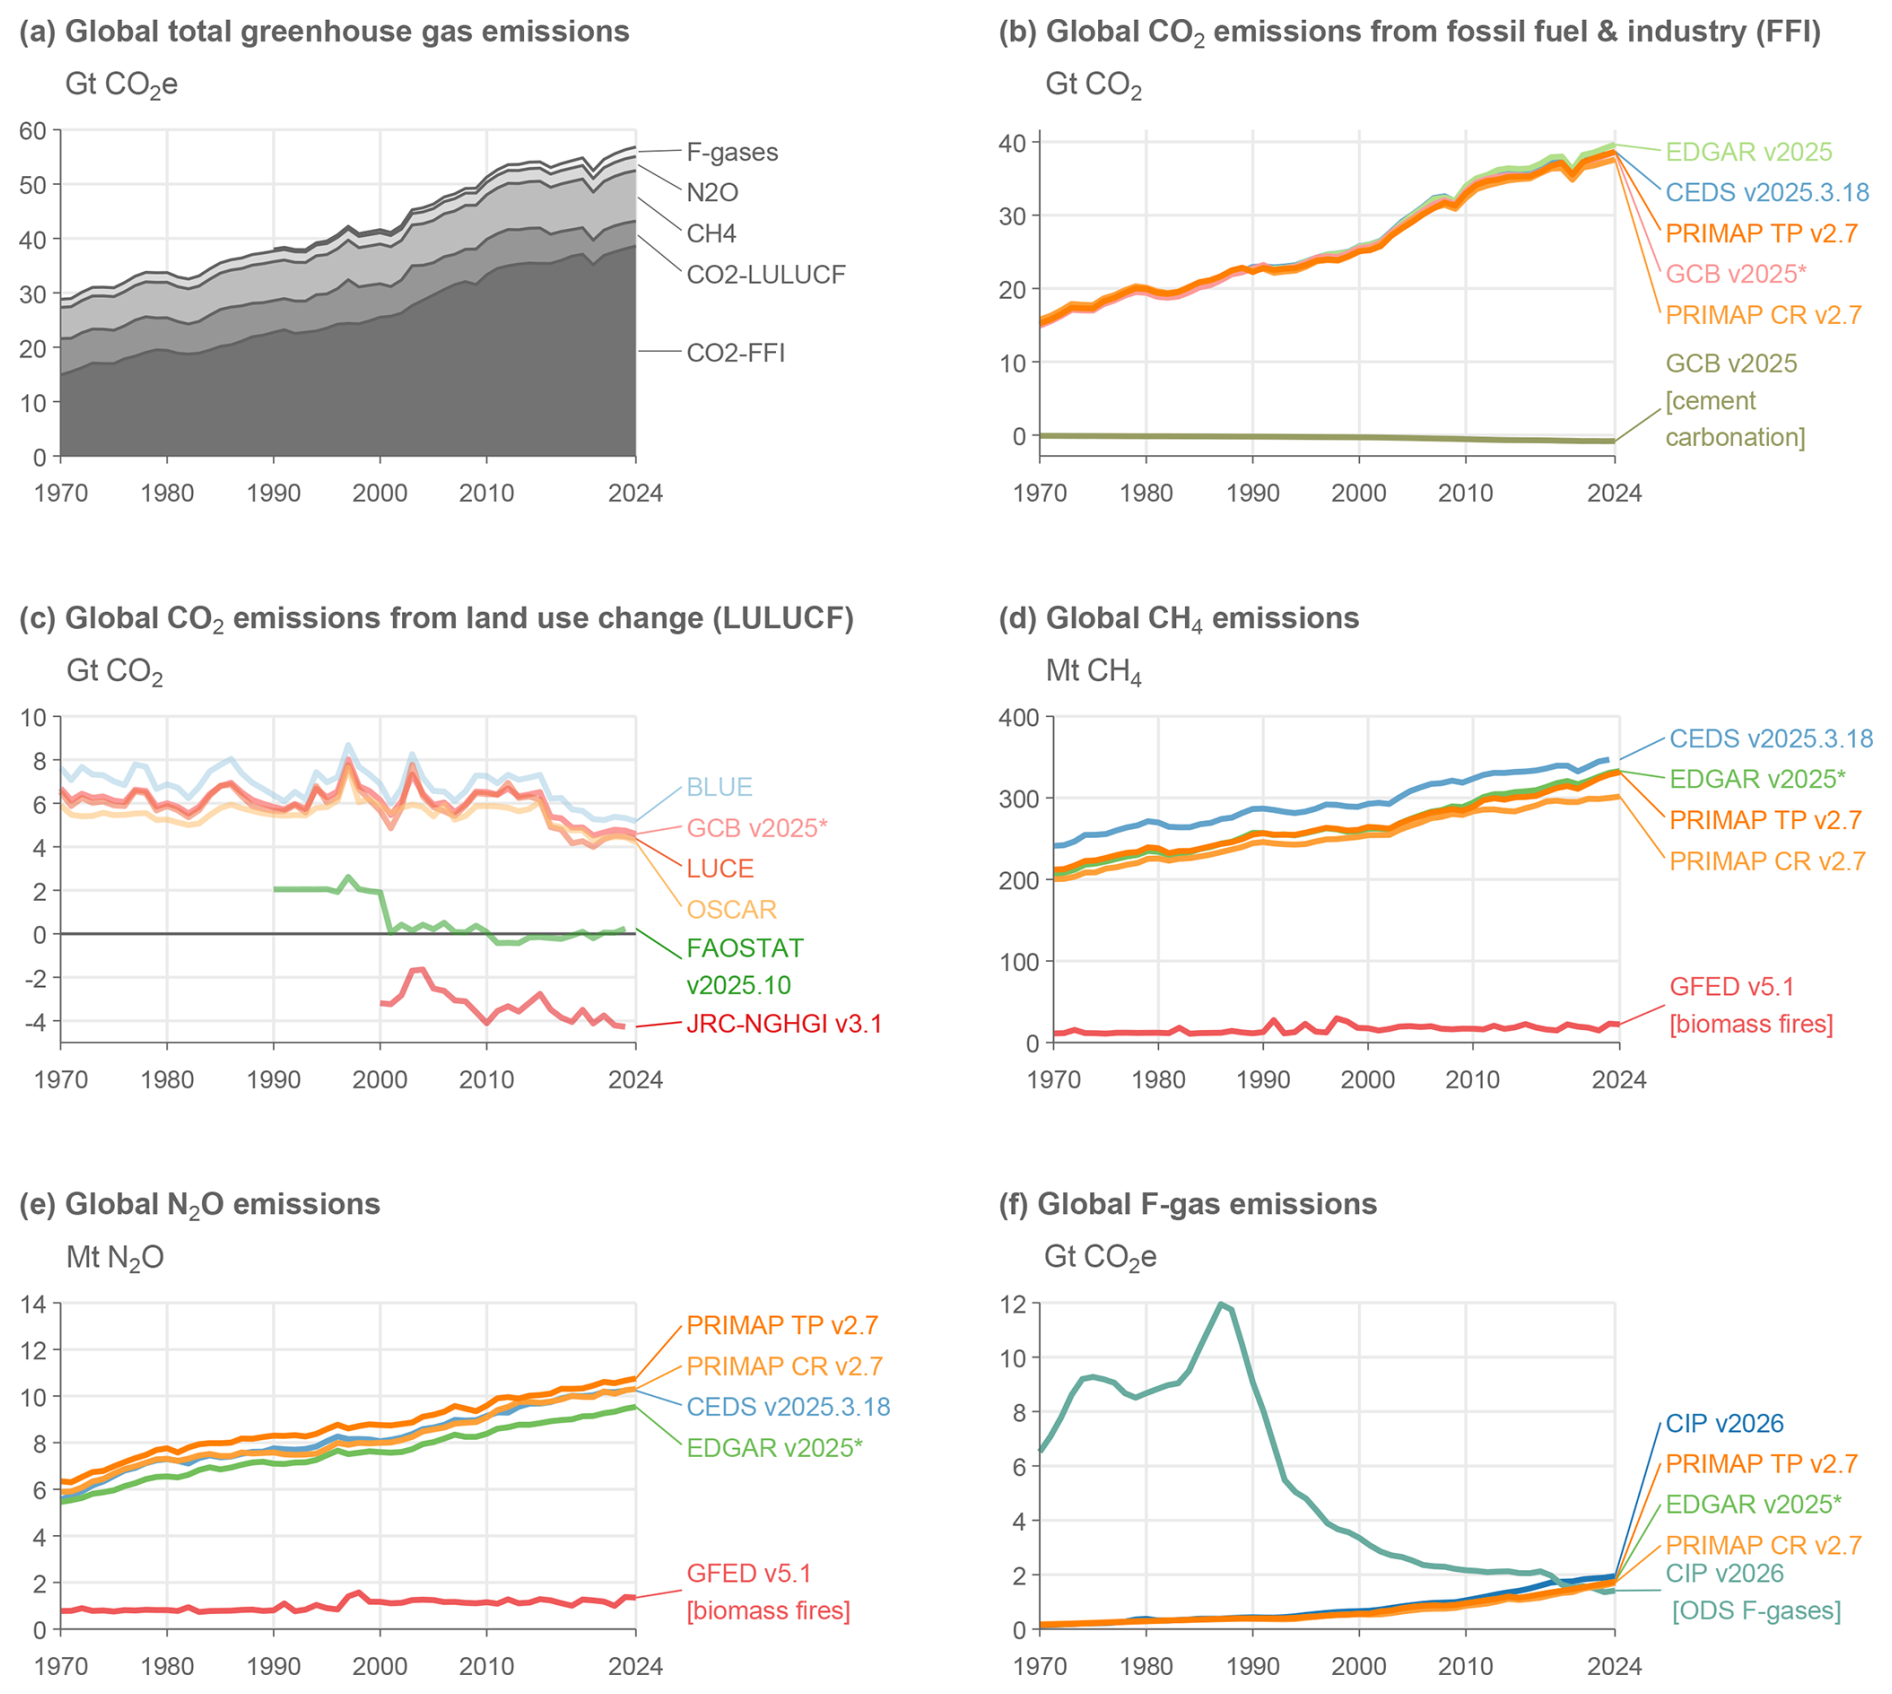
Figure 2Annual global anthropogenic GHG emissions by source, 1970–2024. Refer to Sect. 2.1 and Table S1 for a list of datasets. Datasets with an asterisk (∗) indicate the sources used to compile global total greenhouse gas emissions following the WGIII assessment in (a). CO2-equivalent emissions in (a) and (f) are calculated using GWP100 from the AR6 WGI Chap. 7 (Forster et al., 2021). F-gas emissions in (a) comprise only UNFCCC F-gas emissions (see Sect. 2.1 for a list of species). F-gas emissions in (f) refer to UNFCCC F-gases, except for “CIP v2026 [ODS F-gases]”. Some of the major depicted differences between datasets (e.g. between GCB v2025 and JRC-NGHGI v3.1 in panel c) are due to varying system boundaries, rather than underlying uncertainties in activity levels or emissions factors.
Table 1Global anthropogenic greenhouse gas emissions by source and decade following the WGIII assessment. All numbers refer to decadal averages, except for annual estimates in 2023 and 2024. CO2-equivalent emissions are calculated using GWP100 from AR6 WGI Chap. 7 (Forster et al., 2021). Projections for CO2 emissions in 2025 are from the Global Carbon Project. Projections of non-CO2 GHG emissions in 2025 remain unavailable at the time of publication. Uncertainties are ± 8 % for CO2-FFI, ± 70 % for CO2-LULUCF, ± 30 % for CH4 and F-gases, and ± 60 % for N2O, corresponding to a 90 % confidence interval. “GHG” in row one is the sum of the other rows.
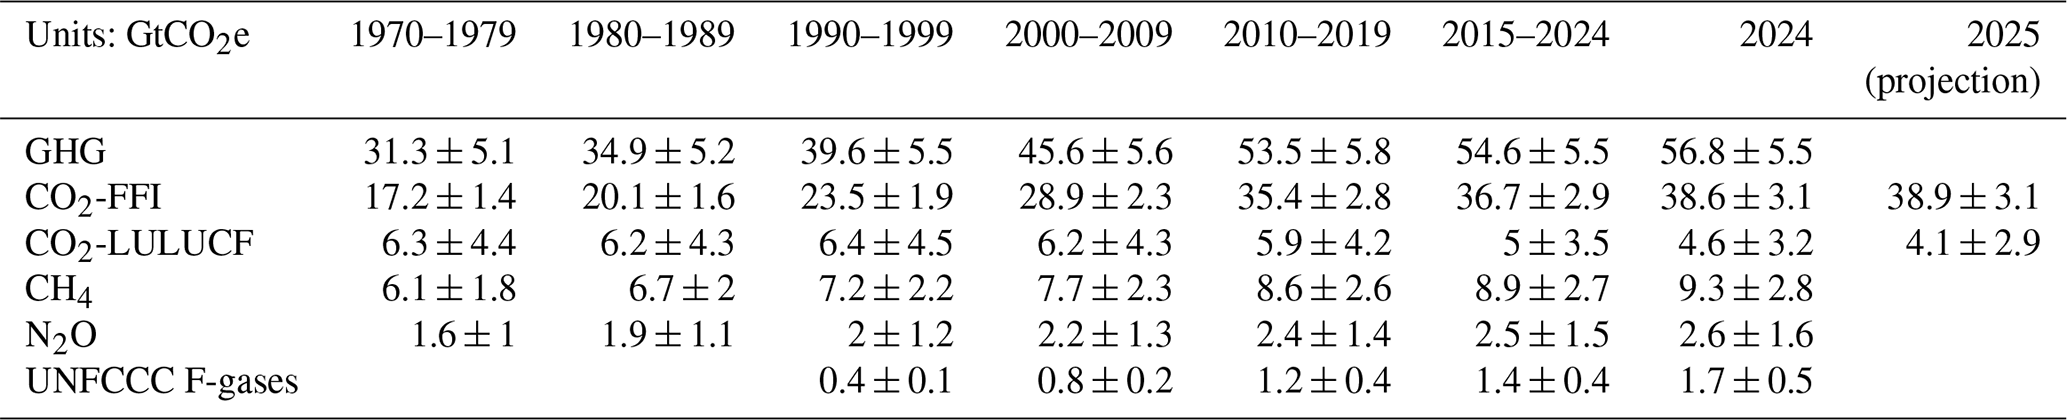
Note the recent history of emissions in these datasets are continually revised, so there are small differences between each annual update in emission estimates over the recent past. Initial projections for 2025 indicate that CO2 emissions from fossil fuels and industry increased to 38.9 ± 3.1, and CO2 emissions from land-use change decreased to 4.1 ± 2.9 GtCO2 (Friedlingstein et al., 2026).
Average annual GHG emissions for the decade 2015–2024 were 54.6 ± 5.5 GtCO2e. Average decadal GHG emissions have increased steadily since the 1970s across all major groups of GHGs, driven primarily by increasing CO2 emissions from fossil fuel and industry but also rising emissions of CH4 and N2O. Emissions of UNFCCC F-gases have grown more rapidly than other GHG, but from low levels that remain only 2.6 % of the current decadal GHG contribution even after these increases. Both the magnitude and trend of CO2 emissions from land-use change remain highly uncertain, with the latest data indicating an average net flux between 4–6 GtCO2 yr−1 for the past few decades.
The fossil fuel share of global GHG emissions was approximately 73 % in 2024 (GWP100 weighted) (UNEP, 2025a), based on the EDGAR v2025 dataset (Crippa et al., 2025) and net land-use CO2 emissions from the Global Carbon Budget (Friedlingstein et al., 2026). The remaining share of non-fossil fuel emissions are mostly from land-use change, agriculture, cement production, waste and F-gas emissions.
Different emissions assessment approaches are shown in Fig. 3. Compared to the WGIII update estimate in 2023 (56.3 ± 5.5 GtCO2e yr−1), including ODS F-gases, cement carbonation, and CH4 and N2O from biomass burning increases emissions to 57.9 ± 5.6 GtCO2e yr−1, or a total change of +1.5 GtCO2e yr−1. ODS F-gas emissions have declined substantially since the 1990s under the Montreal Protocol and its amendments, reaching 1.4 GtCO2e yr−1 in 2024, with a stalling rate of reduction in the past decade. The cement carbonation sink has steadily increased alongside cement production to reach −0.8 GtCO2e yr−1 in 2024. Biomass fire emissions have a more variable trend and 2024 was a relatively extreme year at 1 GtCO2e yr−1, compared to an average of 0.8 GtCO2e yr−1 in the preceding decade.
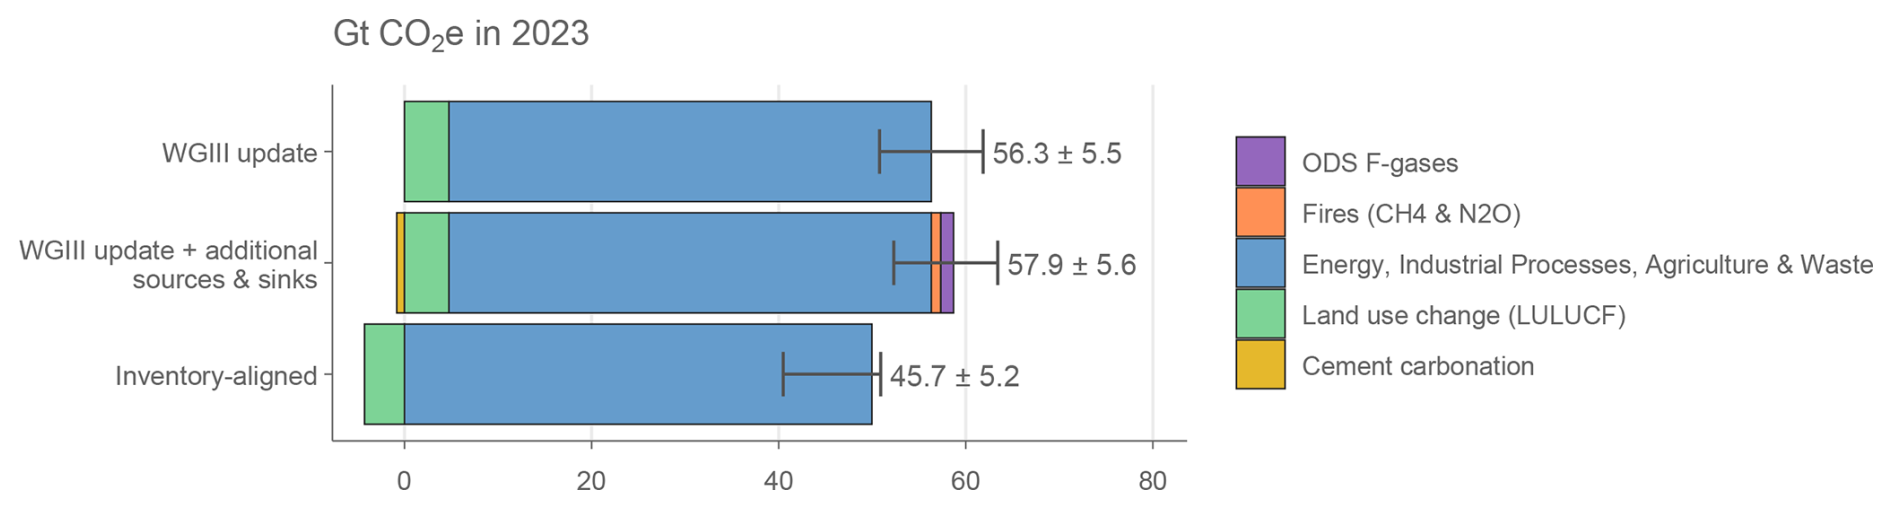
Figure 3Annual global anthropogenic greenhouse gas emissions by assessment convention in 2023. Refer to Table 1 for a list of underlying datasets. Differences between conventions are primarily due to differences in system boundaries (Lamb et al., 2026). Uncertainties are ± 8 % for CO2-FFI, ± 70 % for CO2-LULUCF, ± 30 % for CH4 and F-gases, and ± 60 % for N2O, corresponding to a 90 % confidence interval.
Emissions according to national inventories were 45.7 ± 5.2 GtCO2e yr−1 in 2023, or 10.6 GtCO2e yr−1 lower than the WGIII update (Fig. 3). The main reason is due to diverging estimates of net LULUCF emissions, which according to inventory accounts was a 3.8 GtCO2 sink over the past decade, while it is a 5 GtCO2 source in the WGIII update. This 8.9 GtCO2 difference is primarily due to the inclusion of indirect anthropogenic effects such as CO2 fertilisation on vegetation growth on “managed land” in the inventory estimate. Additional differences result from a lower estimate of Energy, Industrial Process, Agriculture and Waste emissions in inventories (−1.6 GtCO2e yr−1).
Literature published after AR6 shows that increases in atmospheric CH4 concentrations are also being driven by methane emissions from wetland changes resulting from climate change and variability. For example, Zhang et al. (2025) found an average increase of 6–7 Tg CH4 yr−1 (0.16–0.20 GtCO2e yr−1) in wetland emissions in 2010–2019 compared to the average for 2000–2009, attributable mostly to temperature-driven climate change. Changes to these wetland emissions are not captured in the WGIII estimate of anthropogenic emissions as they are not a direct emission from human activity, but rather a feedback induced by a changing climate, yet they will contribute to GHG concentration rise, forcing and energy budget changes discussed in the next sections.
As in Forster et al. (2025), we report best-estimate global mean concentrations for 52 well-mixed GHGs. These concentrations are updated to 2025. CO2 mixing ratios were taken from the NOAA Global Monitoring Laboratory (GML) and are updated here through 2024 (Lan et al., 2025). As in past IGCC publications, CO2 is reported on the WMO-CO2-X2019 scale, which differs from the WMO-CO2-X2007 scale used in AR6 with WMO-CO2-X2019 being around 0.18 ppm higher than WMO-CO2-X2007 in recent years. For consistency with WMO-CO2-X2019, the AR6 CO2 concentrations that make up the 1750 to 1978 period in the IGCC dataset (before recent NOAA updates) have been converted to the WMO-CO2-X2019 scale. Other GHG records were compiled from NOAA and AGAGE global networks or extrapolated from literature. An average of NOAA and AGAGE data, updated through 2025, were used for N2O, CH4, CFC-11, CFC-12, CCl4, HCFC-22, HFC-134a, and HFC-125 (Lan et al., 2026; Dutton et al., 2024; Prinn et al., 2018), which, along with CO2, account for over 97 % of the ERF from well-mixed GHGs. Several other species also use means from the NOAA and AGAGE networks, where the NOAA data is updated to 2025 and AGAGE data is also updated until 2025 for CH4 and 2024 for most other gases (Western et al., 2025, 2026; Prinn et al., 2025). In cases where no updated information is available, global estimates were extrapolated from Vimont et al. (2022), Western et al. (2023, 2024, 2025, 2026), or other literature and scaled to be consistent with those reported in AR6. Some extrapolations of minor GHG concentrations are based on data from the mid-2010s (Droste et al., 2020; Laube et al., 2014; Simmonds et al., 2017; Vollmer et al., 2018), but have an imperceptible effect on the total ERF assessed in Sect. 5, and are included to maintain consistency with AR6. Mixing ratio uncertainties for 2025 are assumed to be like 2019, and we adopt the same uncertainties as assessed in AR6 WGI.
Figure 4 shows recent GHG concentrations and their changes. Table S2 in the Supplement shows specific updated concentrations for all the GHGs considered. The global surface mean concentrations of CO2, CH4 and N2O in 2025 were 425.6 [± 0.4] parts per million (ppm), 1936.3 [± 3.3] parts per billion (ppb) and 339.4 [± 0.4] ppb, respectively. Concentrations of all three major GHGs have increased since 2019, with CO2 increasing by 15.6 ppm, CH4 by 70.2 ppb, and N2O by 7.2 ppb. Increases since 2019 are consistent with those from the CSIRO network (Francey et al., 1999). With few exceptions, concentrations of ozone-depleting substances, such as CFC-11 and CFC-12, continue to decline, while those of replacement compounds (HFCs) have increased. HFC-134a, for example, has increased 30 % since 2019 from 107.6 to 140.3 parts per trillion (ppt). Aggregated across all gases, PFCs have increased from 109.7 to an estimated 118.9 ppt CF4-eq from 2019 to 2025, HFCs from 237 to 338 ppt HFC-134a-eq, while ozone depleting substances controlled under the Montreal Protocol have declined from 1032 to 989 ppt CFC-12-eq. Mixing ratio equivalents are determined by the radiative efficiencies of each GHG from Hodnebrog et al. (2020), and the equivalent “-eq” concentrations are presented in terms of the most abundant species in the HFC, PFC and CFC categorizations.
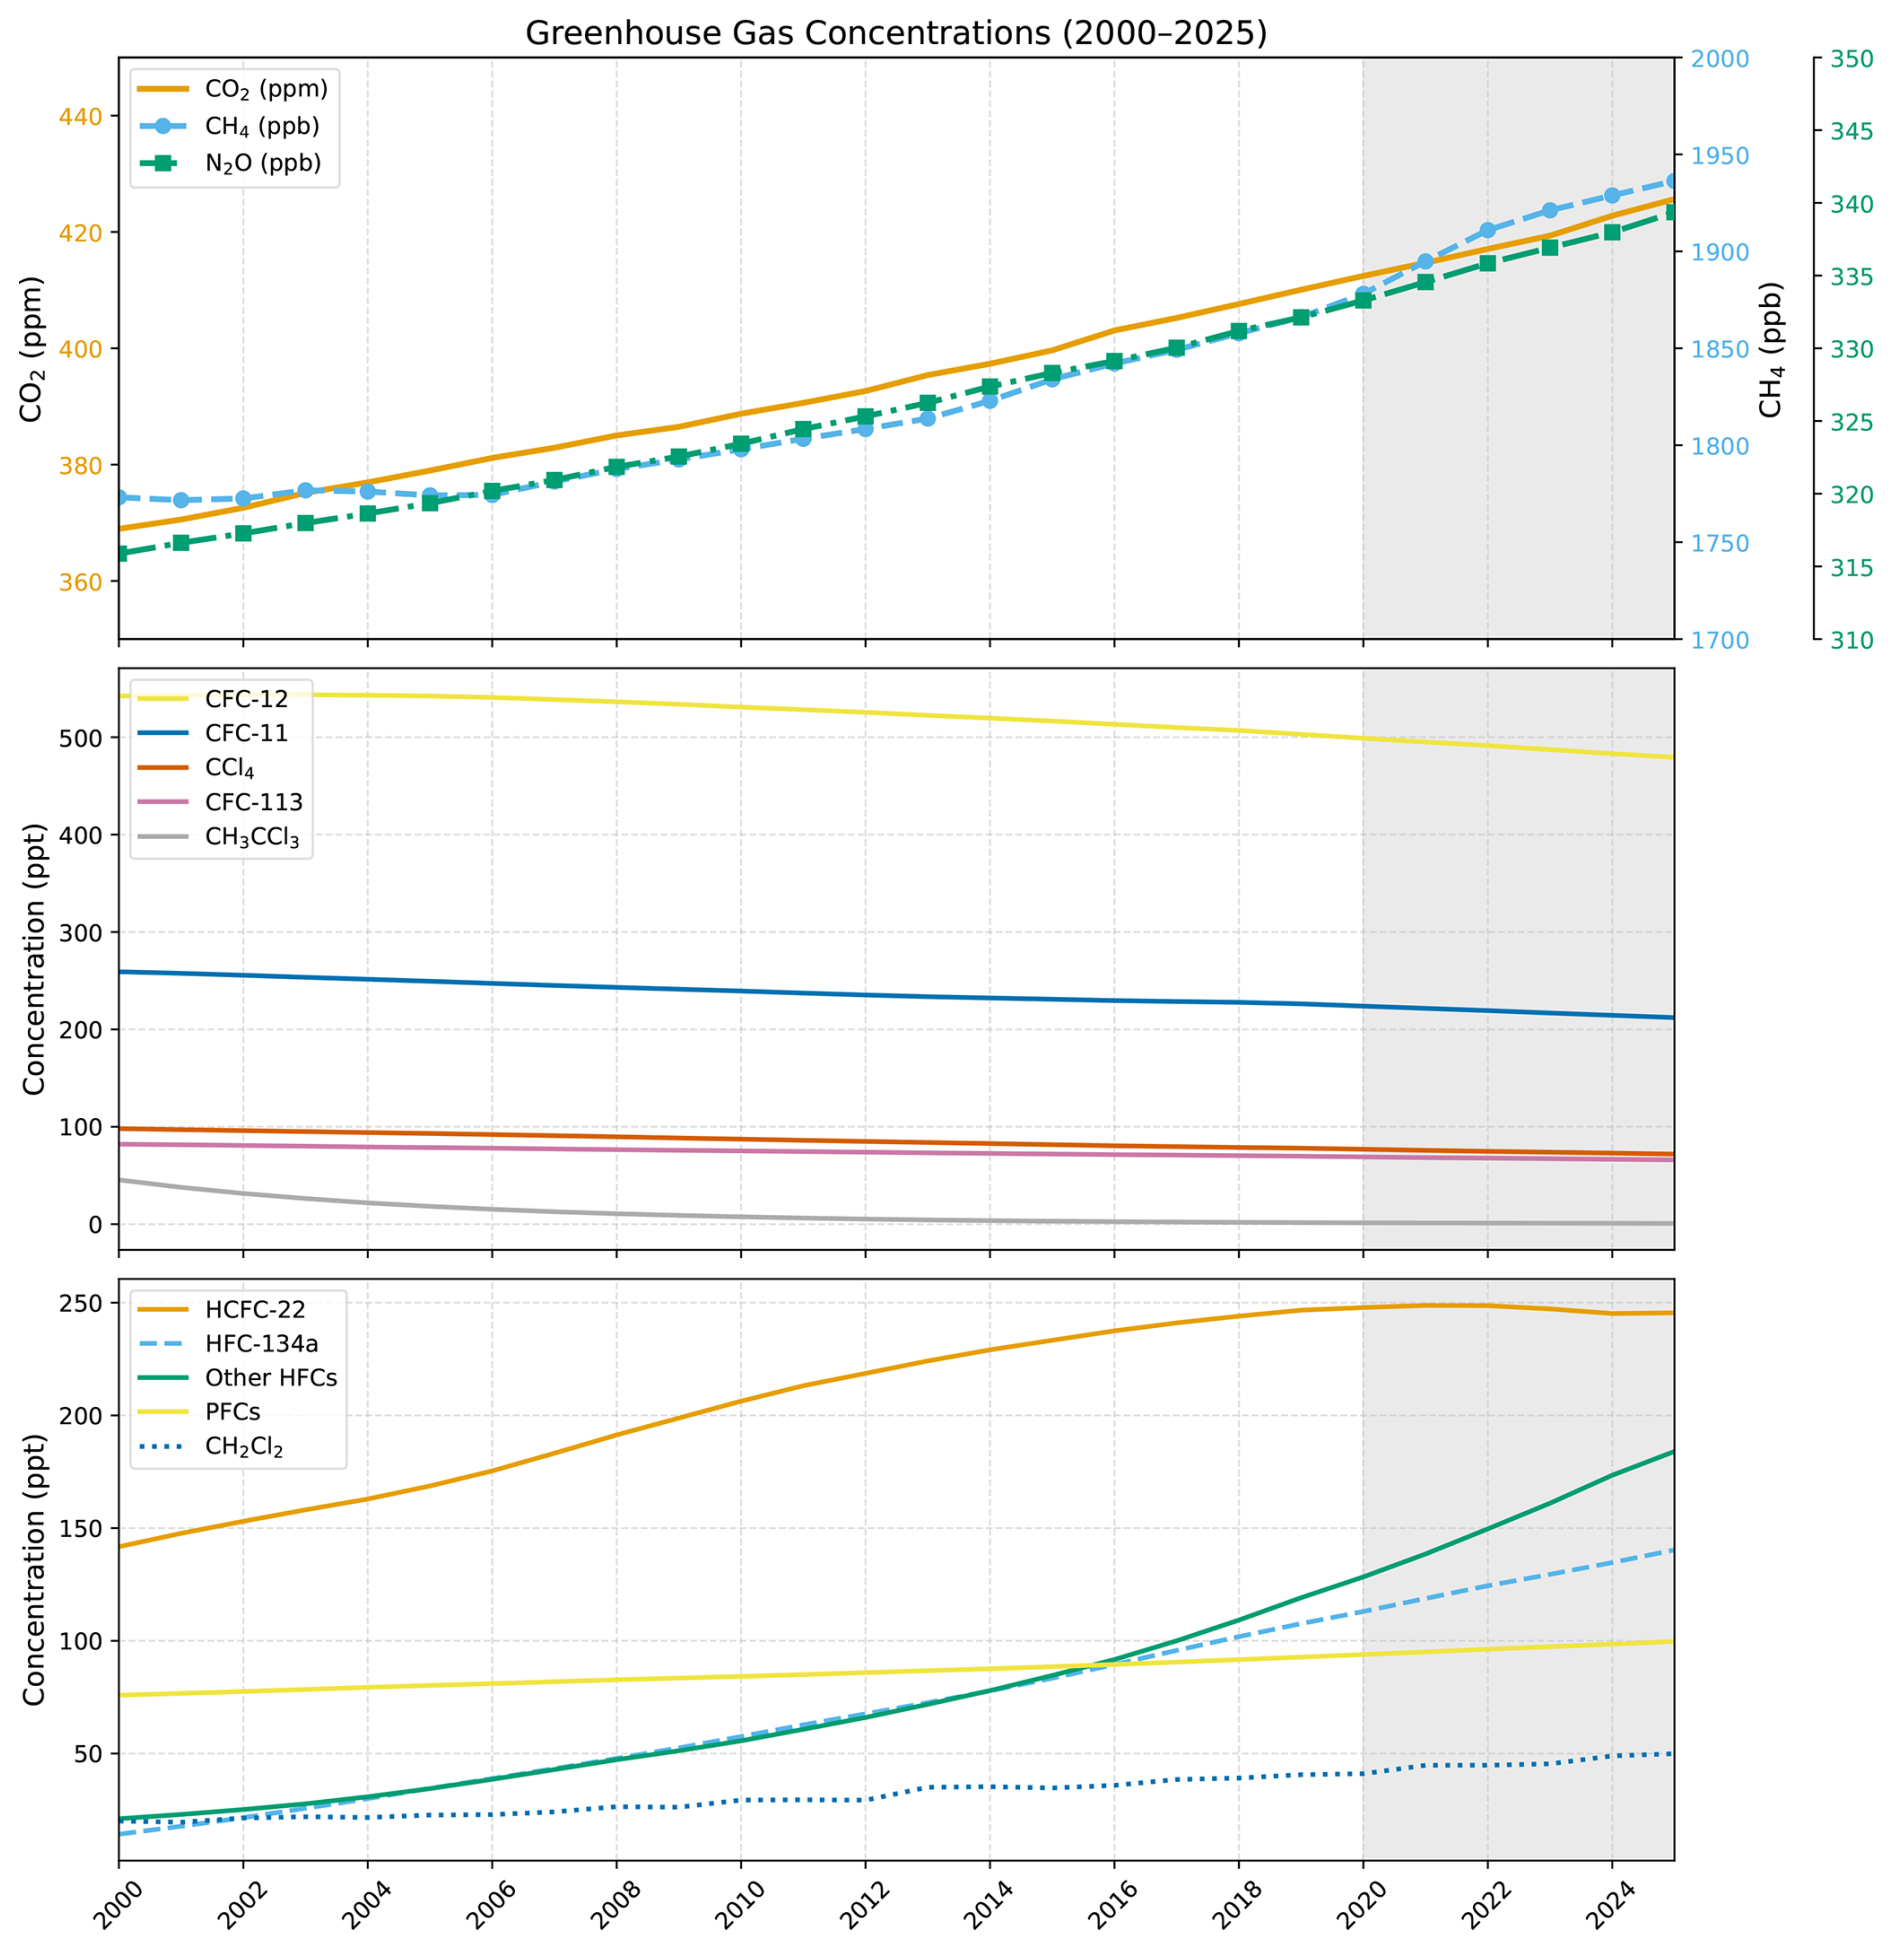
Figure 4Atmospheric concentrations of a set of well mixed greenhouse gases over 2000–2025. The grey shaded region represents continuing changes since AR6. Note the different vertical scales.
Ozone and other non-methane SLCFs are not well-mixed in the atmosphere and are thus discussed separately (in Sect. 4). For this reason, the warming impact of ozone, the third most important GHG (in terms of current contribution to warming) is not included in the contribution of well-mixed GHGs to observed warming, consistently with AR6.
In addition to GHG emissions, we provide an update of anthropogenic emissions of non-methane SLCFs (SO2, black carbon (BC), organic carbon (OC), NOx, volatile organic compounds (VOCs), CO and NH3). Chapter 6 of WGI assessed emissions in the context of understanding the climate and air quality impacts of SLCFs (Szopa et al., 2021). Methane is a SLCF but also a well mixed GHG and is discussed in Sects. 2 and 3. Trends in SLCF emissions are spatially heterogeneous (Szopa et al., 2021), with strong shifts in the locations of reductions and increases over the decade 2010–2019 (Hodnebrog et al., 2024). Concentrations of non-methane SLCFs are heterogeneously distributed in the atmosphere and the observation networks are too sparse to report globally averaged concentrations. Typically, a combination of satellite data, where available, and global models and reanalyses are relied upon for estimating global-scale distributions. Production of near-real time information in the model-based estimates relies upon the availability of near-real time updates to SLCF emissions which are still challenging. Little information, whether from observations from local monitoring networks, satellite data or from global model reanalysis, is released in near-real time.
Data are presented in Table 2 and the evolution of SLCF emission estimates from the AR6 to this study is presented in Sect. S4 of the Supplement. Consistency between emission trends and concentrations is considered whenever feasible. HFCs, whatever their lifetimes, were considered in Sect. 2.2.
Table 2Emissions of the major SLCFs in 1750, 2019, 2023, 2024 and 2025 from a combination of CEDS and GFED (trends in anthropogenic emissions for 2024 and 2025 from CAMS). Emissions of SO2 + SO4 use SO2 molecular weights. Emissions of NOx use NO2 molecular weights. VOCs are for the total mass. Note that estimates for 2019 to 2024 were updated in Forster et al. (2025). WGI 2019 estimates from Smith et al. (2021a).
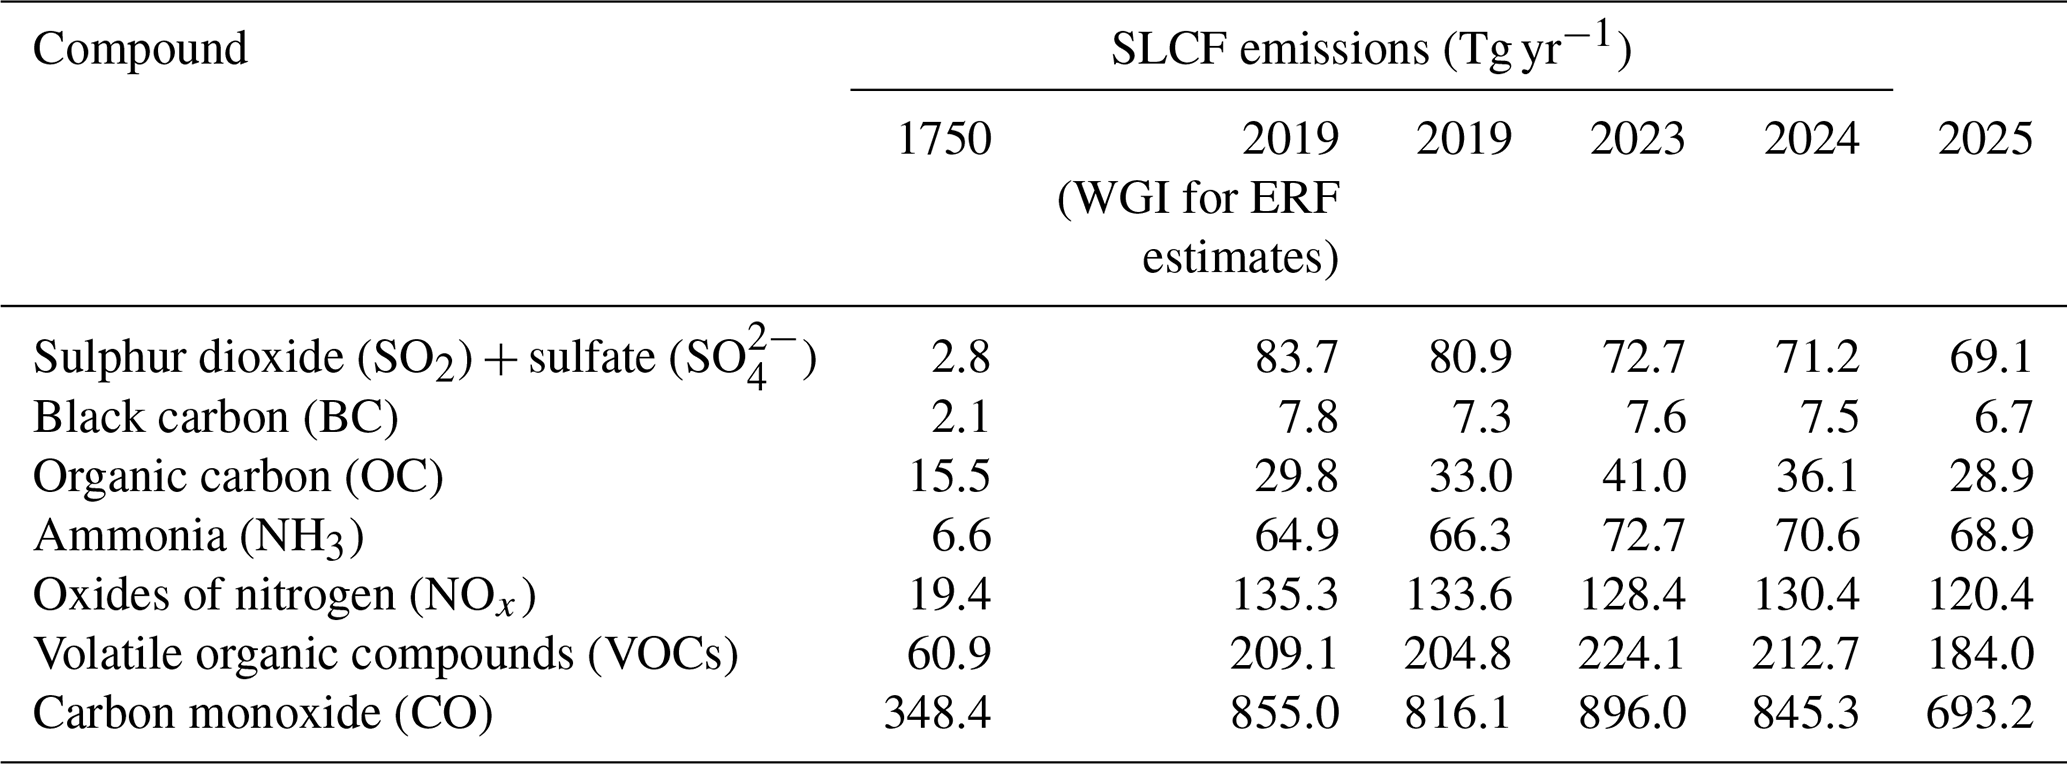
Sectoral emissions of SLCFs are derived from two sources: CEDS, which was used in the AR6 and in CMIP6 to assess historical evolution of atmospheric composition and that has been updated since then, and the Copernicus Atmosphere Monitoring Service (CAMS). The most recent release of the CEDS anthropogenic emissions dataset (Hoesly et al., 2025) covers the 1750–2023 period (Hoesly et al., 2018, 2024). Since 2023, CAMS has released regular updates of their global emission dataset (Soulie et al., 2024). For the years 2024 and 2025, we apply, for each compound, the trend in emission from the CAMS dataset to the 2023 CEDS emission. The CAMS dataset is essentially based on the EDGARv6/v7 emissions as well as on CEDS, so CEDS and CAMS are not entirely independent. The temporal extension is based on evolution of drivers of emissions (energy consumption, production rates) and trends in technologies that affect the emissions factors (e.g. fleet renewal and abatement systems) (Denier van der Gon et al., 2023).
The CAMS v6.2 emission dataset (ECCAD, 2026) indicates a decrease in global anthropogenic emissions of the primary SLCFs (NOx, CO, NMVOCs, SO2, BC and OC), since the COVID hiatus in emissions, except for NH3, whose emissions are steadily increasing. Note that the trend in emissions for NMVOCs and OC is very weak. SLCF emissions from biomass burning are taken from GFED (van der Werf et al., 2017) with small fires (GFED4.1s) updated to 2025 (following AR6 WGIII; Dhakal et al., 2022). Estimates from GFED for 2017 to 2025 are provisional. GFED5 re-evaluations will lead to systematically higher emissions estimates for most species (van der Werf et al., 2025), of the order of a factor of two for some species, and will affect the ratio of non-biomass and biomass-burning aerosol for those species significantly affected, potentially impacting ERF estimates. The estimate of global carbon emissions due to wildfires in 2025 is significantly lower than in 2023 and 2024 which were both higher than the average over the last ten years.
The decrease of global NOx emissions, despite very heterogeneous regional trends (Szopa et al., 2021), is confirmed by global NO2 satellite observations from OMI (tropospheric NO2 column from OMI visualised through the Giovanni system, Acker and Leptoukh, 2007). The trends in global CO concentration are less clear due to significant interannual variability. Surface data from MOPITT and AIRS, via the Giovanni system, show a slight increase over the 2022–2024 period followed by a slight decrease in 2025 (according to AIRS since MOPITT stopped mid-2025). Increases in CO concentration results from CO anthropogenic emissions as well as variable biomass burning emissions. CO is also influenced by NMVOC emissions, including methane oxidation, which can help explain differences in trends between emissions and concentrations. Multi-instrumental analysis of satellite observations do not reveal clear trends in aerosol optical depth at the global scale between 2002 and 2024, despite large positive trends over India and negative trends over Europe, Eastern China, Eastern US consistent among the datasets for the 2012–2024 period (Sawyer et al., 2025). Fire related peaks in AOD are observed more frequently in some regions like Brazil or Western Canada but the record is not long enough to conclude to a positive trend (Sawyer et al., 2025). Study of ozone trends requires multi-instruments datasets which are not yet available after 2022 (Szopa et al., 2026). Analysis of multi-instrument satellite data over the 2005–2022 period indicates no trend for the tropospheric column (Hubert et al., 2026; Szopa et al., 2026).
Overall, the trends in SLCF emissions were similar (see Supplement, Sect. S4) over the 2020–2023 period in the most recent CEDS dataset to our previous estimate (Forster et al., 2024) but with a lower post COVID rebound for NOx and SO2. Regarding SO2, the CEDS datasets (v2024_04_01 used in Forster et al., 2024 and v2025_03_18 since Forster et al., 2025) account for the introduction of strict fuel sulphur controls brought in by the International Maritime Organization in January 2020. Total SO2 emissions in 2019 were 80.9 TgSO2 (Table 2). The SO2 emissions from international shipping declined by 8.4 TgSO2 from 10.4 TgSO2 in 2019 to 2.0 TgSO2 in 2020, which is close to the expected 8.5 TgSO2 reduction estimated by the International Maritime Organization. This decrease was estimated at 7.4 TgSO2 in the previous CEDS version used in Forster et al. (2024). More generally, the reduction pace of the global SO2 emission over the last ten years corresponds to that of the first ten years of the SSP scenarios assuming strong air pollution control (SSP1 and SSP5).
In the combined estimate of GFED and CEDS (with a 2024–2025 extrapolation based on CAMS), emissions of all SLCFs were reduced in 2022 relative to 2019, but rebounded in 2023 and then slightly decreased in 2024 and 2025 (relative to 2023) for all compounds except NOx which increased in 2024 partly due to biomass burning emissions (Table 2 and Supplement, Sect. S4). 2023 was a record year for emissions of organic carbon (driven again by a very active biomass burning season) and ammonia (driven by a steady background increase in agricultural sources, plus a contribution from biomass burning). OC emissions from biomass burning remained high in 2024 before reverting back to recent trends in 2025. Fires can be worsened by climate change, because of increased fire prone weather conditions (Burton et al., 2024; Oliveira and Gil Martins, 2026). Strictly speaking, such fires could be considered as climate feedbacks and not be included in anthropogenic forcings, though cleanly separating forced and climate driven components could prove difficult. However, we choose to include fires in our tracking, as historical biomass burning emissions inventories have previously been consistently treated as an anthropogenic forcing (for example in the CMIP6 and CMIP7 emissions datasets used to run Earth System Models). This differs from the treatment of CO2 and CH4 emissions at present (Sect. 2), where we do not include natural emissions in the inventories. As described in Sect. 5, this treatment of all biomass burning emissions as a forcing has implications for several categories of anthropogenic radiative forcing.
Uncertainties associated with these emission estimates are difficult to quantify. From the non-biomass-burning sectors they are estimated to be smallest for SO2 (± 14 %), largest for black carbon (BC) (a factor of 2) and intermediate for other species (Smith et al., 2011; Bond et al., 2013; Hoesly et al., 2018). Relative uncertainties are also likely to increase both backwards in time (Hoesly et al., 2018) and again in the most recent years because of the difficulty to capture in near real time the regional emission dynamics due in particular to the rapidly evolving local air pollution policies (Szopa et al., 2021).
ERFs were principally assessed in Chap. 7 of AR6 WGI (Forster et al., 2021), which focussed on assessing ERF from changes in atmospheric concentrations; it also supported estimates of ERF in Chap. 6 that attributed forcing to specific precursor emissions (Szopa et al., 2021) and generated the time history of ERF shown in AR6 WGI Fig. 2.10 and discussed in Chap. 2 (Gulev et al., 2021).
The ERF calculation follows the methodology used in Forster et al. (2025) which was based on AR6 WGI methods (Smith et al., 2021a). Compared to AR6, there as some minor methodological changes as detailed in Forster et al. (2025) and described in the Supplement, Sect. S5.
The summary results for the anthropogenic constituents of ERF and solar irradiance in 2025 relative to 1750 are shown in Fig. 5a. In Table 3 these are summarised alongside the equivalent ERFs from AR6 (1750–2019) and last year's Climate Indicators update (1750–2024). Figure 5b shows the time evolution of ERF from 1750 to 2025.
Table 3Contributions to anthropogenic effective radiative forcing (ERF) for 1750–2025 assessed in this section. Data is for single year estimates unless specified. All values are in watts per square metre (W m−2), and 5 %–95 % ranges are in square brackets. As a comparison, the equivalent assessments from AR6 (1750–2019) and last year's Climate Indicators (1750–2024) are shown. Solar ERF is included and unchanged from AR6, based on the most recent solar cycle (2009–2019), thus differing from the single-year estimate in Fig. 5a. Volcanic ERF is excluded due to the sporadic nature of eruptions.
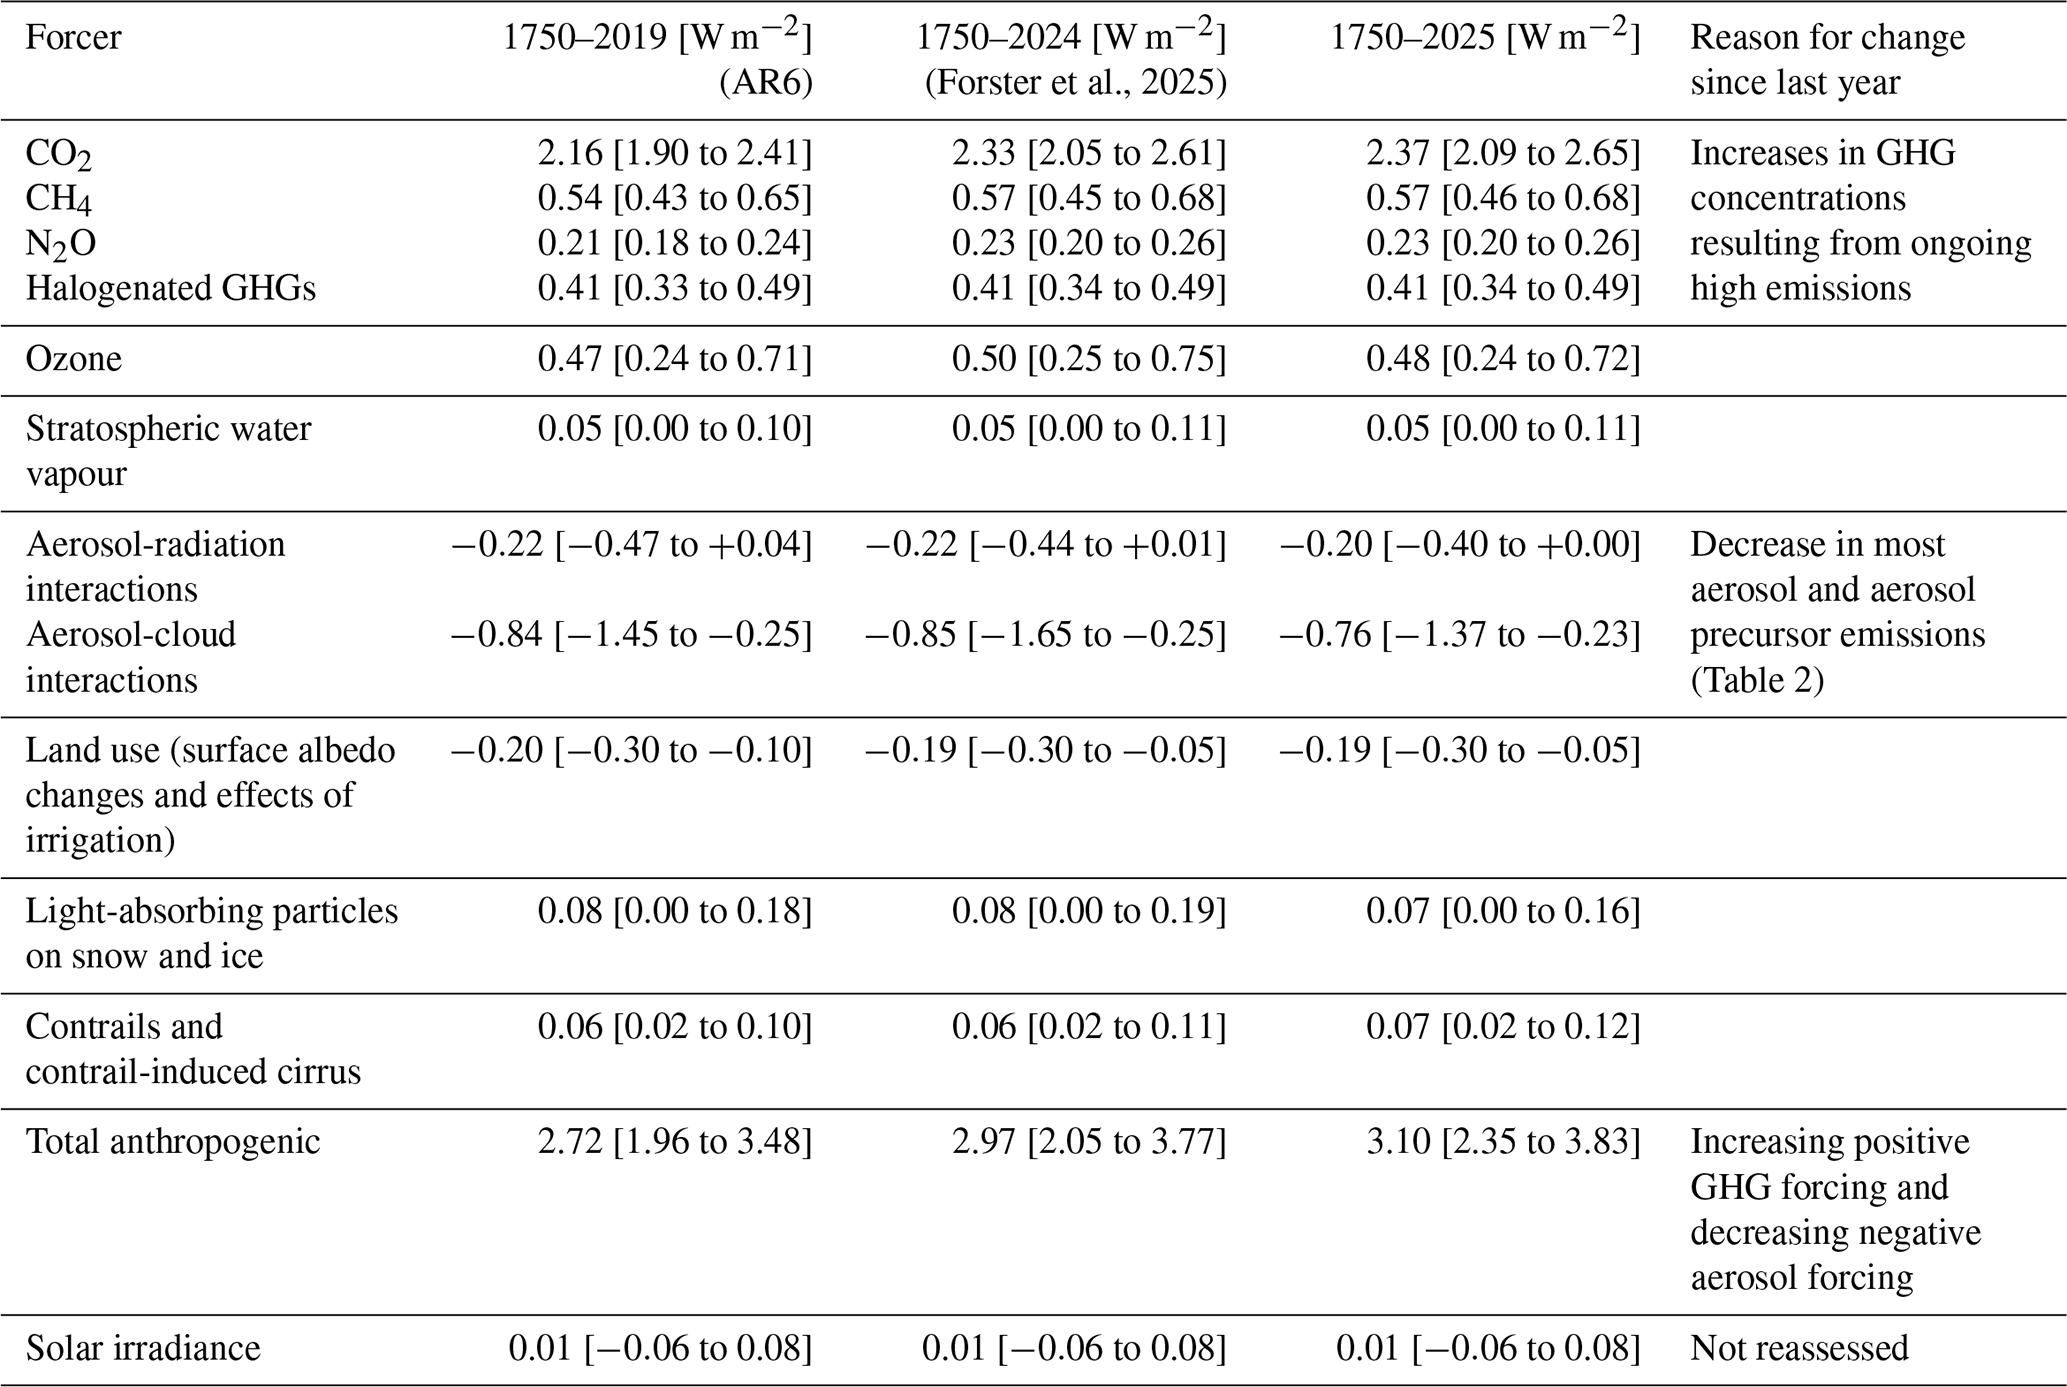
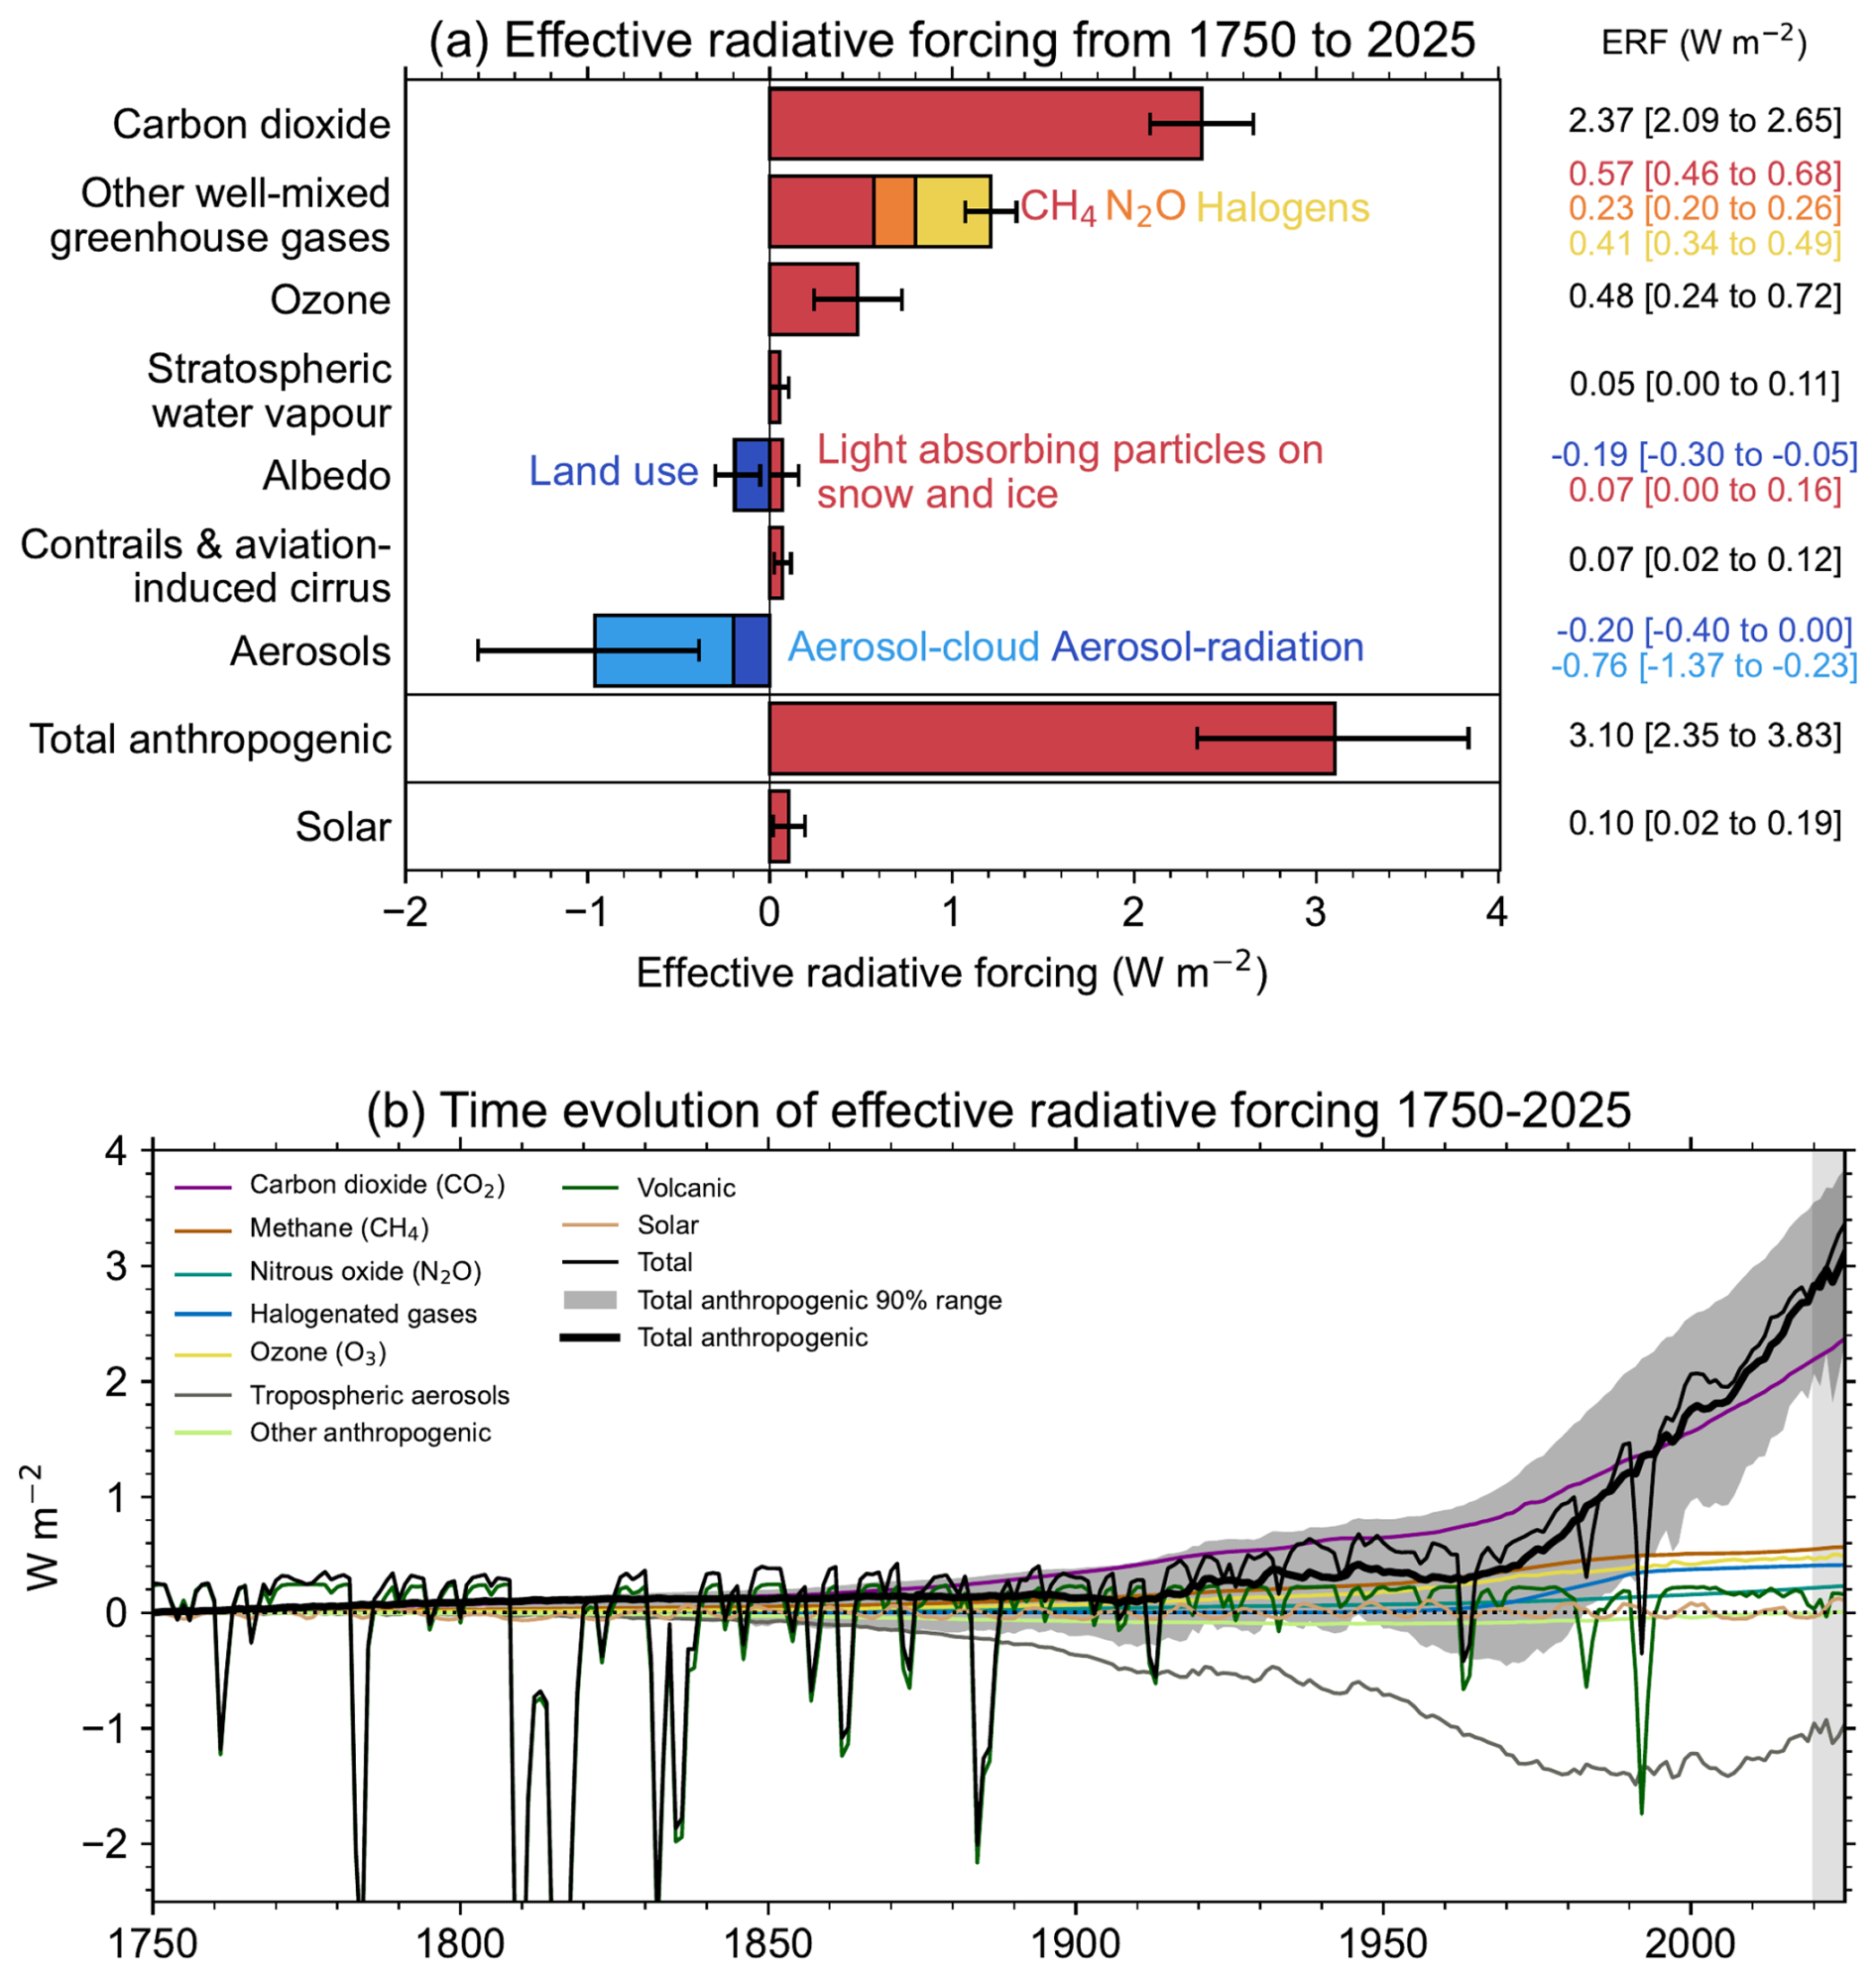
Figure 5Effective radiative forcing (ERF) from 1750–2025. (a) 1750–2025 change in ERF, showing best estimates (bars) and 5 %–95 % uncertainty ranges (lines) from major anthropogenic components to ERF, total anthropogenic ERF and solar forcing. Note that solar forcing in 2025 is a single-year estimate and hence differs from Table 3. (b) Time evolution of ERF from 1750 to 2025. Best estimates from major anthropogenic categories are shown along with solar and volcanic forcing (thin coloured lines),total (thin black line), and anthropogenic total (thick black line). The 5 %–95 % uncertainty in the anthropogenic forcing is shown by grey shading.
Total anthropogenic ERF has increased to 3.10 [2.35 to 3.83] W m−2 in 2025 relative to 1750, compared to 2.72 [1.96 to 3.48] W m−2 for 2019 relative to 1750 in AR6. The ERF has increased considerably from the 2024 estimate of 2.97 [2.35 to 3.83] W m−2, however, it should be noted that the large reduction in biomass burning aerosol from 2024 to 2025 is the primary driver of this single year increase, contributing +0.11 W m−2 of the total +0.13 m−2 change from 2024 to 2025 For non-biomass burning trends which are less variable, sulphur emissions have declined since 2019, weakening the aerosol ERF and adding around +0.1 W m−2 over 2020 to 2025 (see Supplement, Sects. S5 and S7). The approach of including all biomass burning aerosols, while potentially aliasing some of a climate feedback into the forcing, is consistent with reporting ERF based on concentration increase of GHGs independent of whether CO2 and CH4 are caused by anthropogenic emissions or a smaller part is caused by any feedbacks such as from biomass burning fires or wetlands. Changes in mineral dust and sea salt are not easily relatable to human activity and are not included in the ERF of aerosols.
The ERF from well-mixed GHGs is 3.58 [3.27 to 3.91] W m−2 for 1750–2025, of which 2.37 W m−2 is from CO2, 0.57 W m−2 from CH4, 0.23 W m−2 from N2O and 0.41 W m−2 from halogenated gases. This is an increase of around 7 % from 3.32 [3.03 to 3.61] W m−2 for 1750–2019 in AR6. ERFs from CO2, CH4 and N2O have all increased since the AR6 WG1 assessment for 1750–2019, owing to increases in atmospheric concentrations.
The total aerosol ERF (sum of the ERF from aerosol–radiation interactions (ERFari) and aerosol–cloud interactions (ERFaci)) for 1750–2025 is −0.96 [−1.58 to −0.40] W m−2 for 1750–2025 compared to −1.07 [−1.90 to −0.43] W m−2 for 1750–2024 (Forster et al., 2024) and −1.06 [−1.71 to −0.41] W m−2 assessed for 1750–2019 in AR6 WGI. Attributing year-to-year trends to aerosol forcing is problematic due to the variability in biomass burning emissions, and can result in relatively large single-year increases in net anthropogenic ERF (as in 2024 to 2025), or even single-year decreases (such as 2022 to 2023; Forster et al., 2024).
Ozone ERF is determined to be 0.48 [0.24 to 0.72] W m−2 for 1750–2025, about the same as the AR6 assessment of 0.47 [0.24 to 0.71] W m−2 for 1750–2019. Stratospheric water vapour from methane oxidation is unchanged (to two decimal places) since AR6. ERF from light-absorbing particles on snow and ice is 0.08 [0.00 to 0.19] W m−2 for 1750–2024, unchanged from AR6. For the first time since 2019, we determine from provisional data that aviation activity exceeded pre-COVID levels in 2025 (IATA, 2025), which is used as one indicator of ERF from contrails and contrail-induced cirrus (Supplement, Sect. S5.5). We estimate ERF from contrails and contrail-induced cirrus to be 0.07 [0.02 to 0.12] W m−2 in 2025. The methodology to determine land-use ERF has been updated (Sect. S5.4) but this forcing has a similar best estimate to 2023 and AR6, with a wider uncertainty range that accounts for the separate assessment of irrigation forcing.
The headline assessment of solar ERF has not been re-assessed, at 0.01 [−0.06 to +0.08] W m−2 from pre-industrial to the 2009–2019 solar cycle mean (Table 3). Separate to the assessment of solar forcing over complete solar cycles, we provide a single-year solar ERF for 2025 of +0.10 [+0.02 to +0.19] W m−2 (Fig. 5a). This is higher than the single-year estimate of solar ERF for 2019 (a solar minimum) of −0.02 [−0.08 to 0.06] W m−2.
Volcanic ERF is included in the overall time series (Fig. 5b), but following IPCC convention, we do not provide a single-year estimate for 2025 given the sporadic nature of volcanoes. Alongside the time series of stratospheric aerosol optical depth derived from proxies and satellite products, for 2022–2025 we include the stratospheric water vapour contribution from the Hunga Tonga-Hunga Ha'apai (HTHH) eruption derived from Microwave Limb Sounder (MLS) data. We note that the elevated stratospheric water vapour from HTHH persists into 2025. We estimate a net positive (positive forcing from stratospheric water vapour more than outweighing negative forcing from stratospheric aerosols) forcing from HTHH through 2025 (Supplement, Sect. S5), though note that other studies find the net HTHH forcing to be negative (Gupta et al., 2025) or close to zero (Schoeberl et al., 2024). The stratospheric aerosol input from HTHH has, by 2025, virtually decayed away, leaving the water vapour contribution (Zhu et al., 2025). We do not separately account for indirect effects, such as stratospheric ozone depletion or other chemical or dynamical adjustments that could affect the net ERF from HTHH (Zhang et al., 2024a).
In addition to the concentration-based ERF estimates in Table 3 and Fig. 5, we present an updated analog of AR6 WG1 Fig. 6.12 (Szopa et al., 2021) that decomposes ERF and global surface air temperature (GSAT) change by emitted compound, including secondary effects on other forcing agents (Fig. 6). While the original AR6 figure attributed assessed ERF to emitted compounds using radiative efficiencies and passed the resulting time series through an impulse-response function, here we adopt an emissions-driven counterfactual approach using FaIR v2.2 (Leach et al., 2021) with the v1.4.5 calibrated constrained parameterization (Smith et al., 2024). For each emitted compound, a counterfactual scenario is run with that compound's emissions set to zero from 1750 to 2025 while all other emissions remain at historical levels. The difference in forcing and temperature between the baseline and counterfactual simulations gives the contribution of each compound, decomposed across forcing agents (e.g. greenhouse gas forcing, ozone, aerosol-radiation and aerosol-cloud interactions). Methodological differences between this and the original AR6 figure are discussed in more depth in the Supplement, Sect. S5.
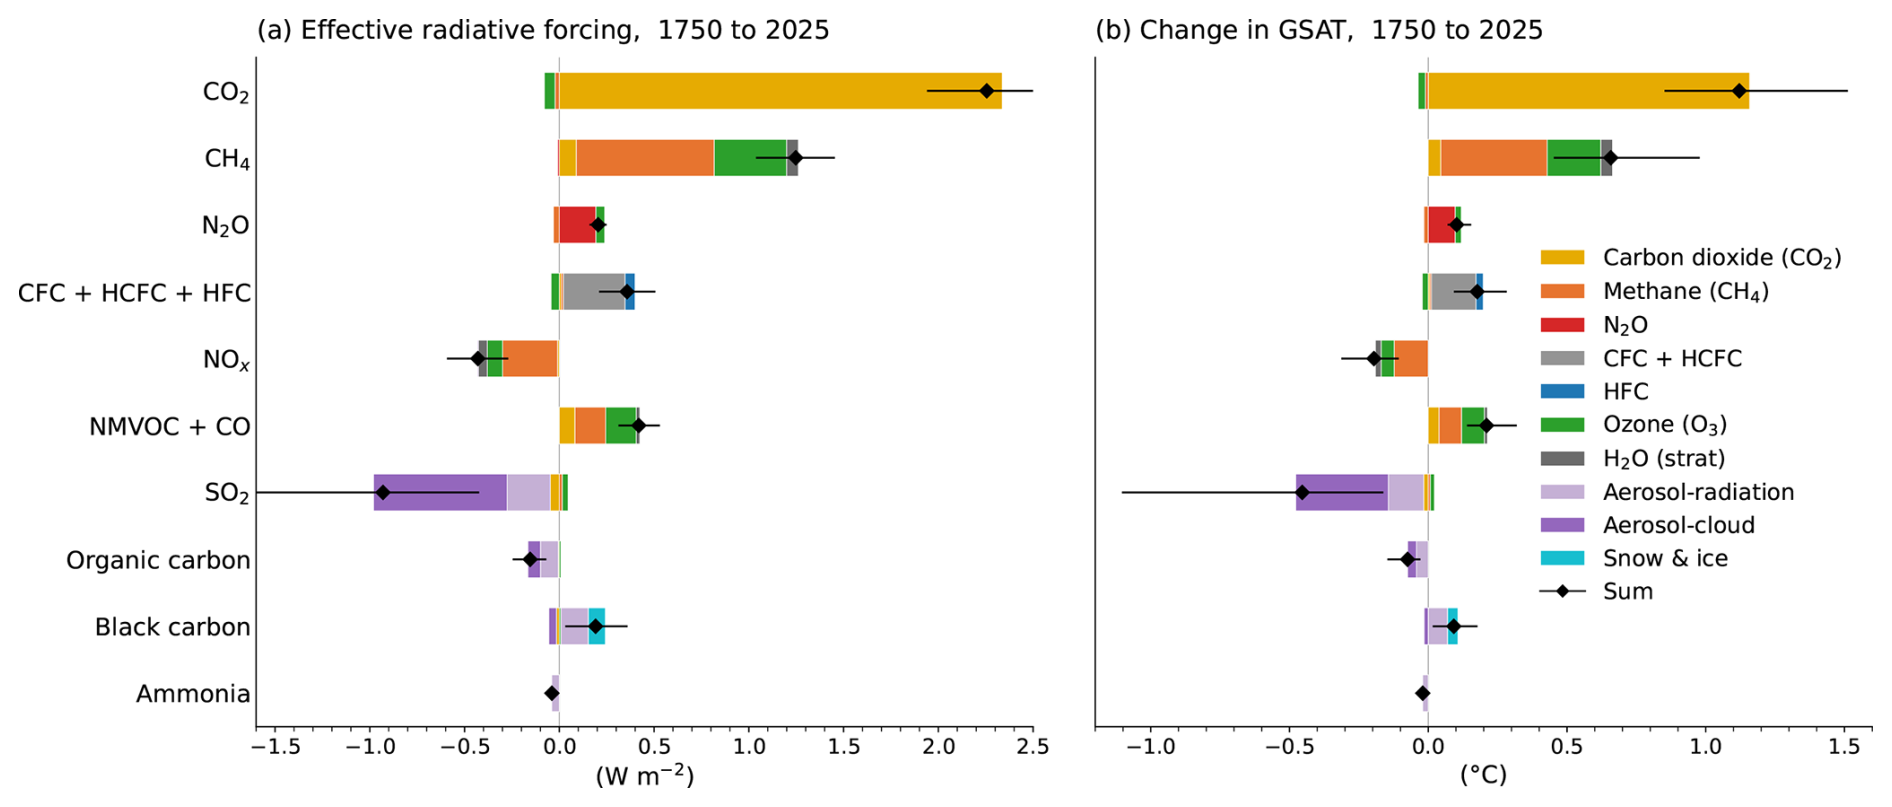
Figure 6Effective radiative forcing (ERF) and global surface air temperature (GSAT) response between 1750 and 2025 by individual emitted species, including secondary effects. Update to the IPCC AR6 WG1 Fig. 6.12 using FaIR emissions-driven runs with each species individually excluded. Uncertainty ranges (5 %–95 %) are shown as whiskers on the total (diamond) markers and are derived from the constrained ensemble, with sub-bar segments determined by averaging per-agent ERF values across ensemble members falling within a narrow band around the target percentile to ensure exact additivity. Note that the resulting species-specific ERF and GSAT responses are not fully independent and cannot be directly summed.
EEI, assessed in Chap. 7 of AR6 WGI (Forster et al., 2021), measures the surplus energy accumulating in the climate system and is hence an essential global climate indicator for monitoring the current and future state of global warming, the expected rate of warming and the perturbation to the planet caused by human activity. It is an integrative measure and represents the difference between the radiative forcing acting to warm the climate and Earth's radiative response, which acts to oppose that warming. Under stable climate conditions, for example, in the absence of anthropogenic climate forcing, this imbalance would average close to zero over interdecadal time scales (Forster et al., 2021). Since at least 1970, however, a persistent positive imbalance in the Earth's energy flows has led to continued heat uptake by the climate system (Church et al., 2011, 2013; Rhein et al., 2013; von Schuckmann et al., 2020; Forster et al., 2021).
On annual and longer timescales, changes in Earth heat inventory associated with the positive EEI are dominated by the changes in global ocean heat content (OHC), which has accounted for about 90 % of excess heat uptake since the 1970s (Rhein et al., 2013; von Schuckmann et al., 2020; Forster et al., 2021). The remainder is partitioned among land warming, atmospheric warming, and cryospheric melt (Rhein et al., 2013; von Schuckmann et al., 2023a). This planetary heat accumulation drives widespread changes across the Earth system, including sea-level rise, ocean warming, ice loss, warming and moistening of the atmosphere, changes in ocean and atmospheric circulation, continental warming and permafrost thaw (e.g. Cheng et al., 2022; Cuesta-Valero et al., 2023; von Schuckmann et al., 2023a), with adverse impacts on ecosystems and human systems (Douville et al., 2021; IPCC, 2022; UNEP, 2025b).
On decadal timescales, changes in global surface temperatures (Sect. 7) can become decoupled from EEI by ocean heat redistribution processes (e.g. Palmer and McNeall, 2014; Allison et al., 2020). The increase in the Earth heat inventory therefore provides a more robust indicator of the rate of global change on interannual-to-decadal timescales (Cheng et al., 2019; Forster et al., 2021; von Schuckmann et al., 2023a). Since AR5 WGI, confidence in the assessment of changes in the Earth heat inventory has increased, owing to observational advances and improved closure of both the Earth's energy and global mean sea level budgets (Church et al., 2013; Rhein et al., 2013; Forster et al., 2021; Fox-Kemper et al., 2021).
AR6 estimated that EEI increased from 0.50 [0.32–0.69] W m−2 over 1971–2006 to 0.79 [0.52–1.06] W m−2 over 2006–2018 (Forster et al., 2021). Over 1971–2018, about 91 % of excess heat uptake was stored in the full-depth ocean, 5 % in land, 3 % the cryosphere and 1 % in the atmosphere (Forster et al., 2021). Since AR6, the annual IGCC updates have extended this assessment using the same underlying Earth heat inventory framework while progressively incorporating updated observations (Forster et al., 2023, 2024, 2025). Recent studies have shown that since 1960, the rate of warming of the world ocean is accelerating at a relatively consistent pace of 0.15 ± 0.05 W m−2 per decade (Minière et al., 2023; Storto and Yang, 2024; Merchant et al., 2025), consistent with the update of 0.13 ± 0.03 W m−2 for the period 1960–2025 (WMO, 2026), while the combined rate of warming for the land, cryosphere, and atmosphere has been accelerating at a rate of 0.013 ± 0.003 W m−2 per decade (Minière et al., 2023; Cuesta-Valero et al., 2025). An increase in EEI over recent decades (Fig. 7) has also been reported by Cheng et al. (2019), von Schuckmann et al. (2020, 2023a), Loeb et al. (2021), Hakuba et al. (2021), Kramer et al. (2021), Raghuraman et al. (2021) and Minière et al. (2023), with studies further strengthening confidence in both its magnitude and acceleration. Over the most recent period 2001 to 2025, the trend in EEI as derived from ocean warming has increased to 0.30 ± 0.1 W m−2 per decade, and 0.44 ± 0.13 W m−2 per decade as observed from satellite data (WMO, 2026).
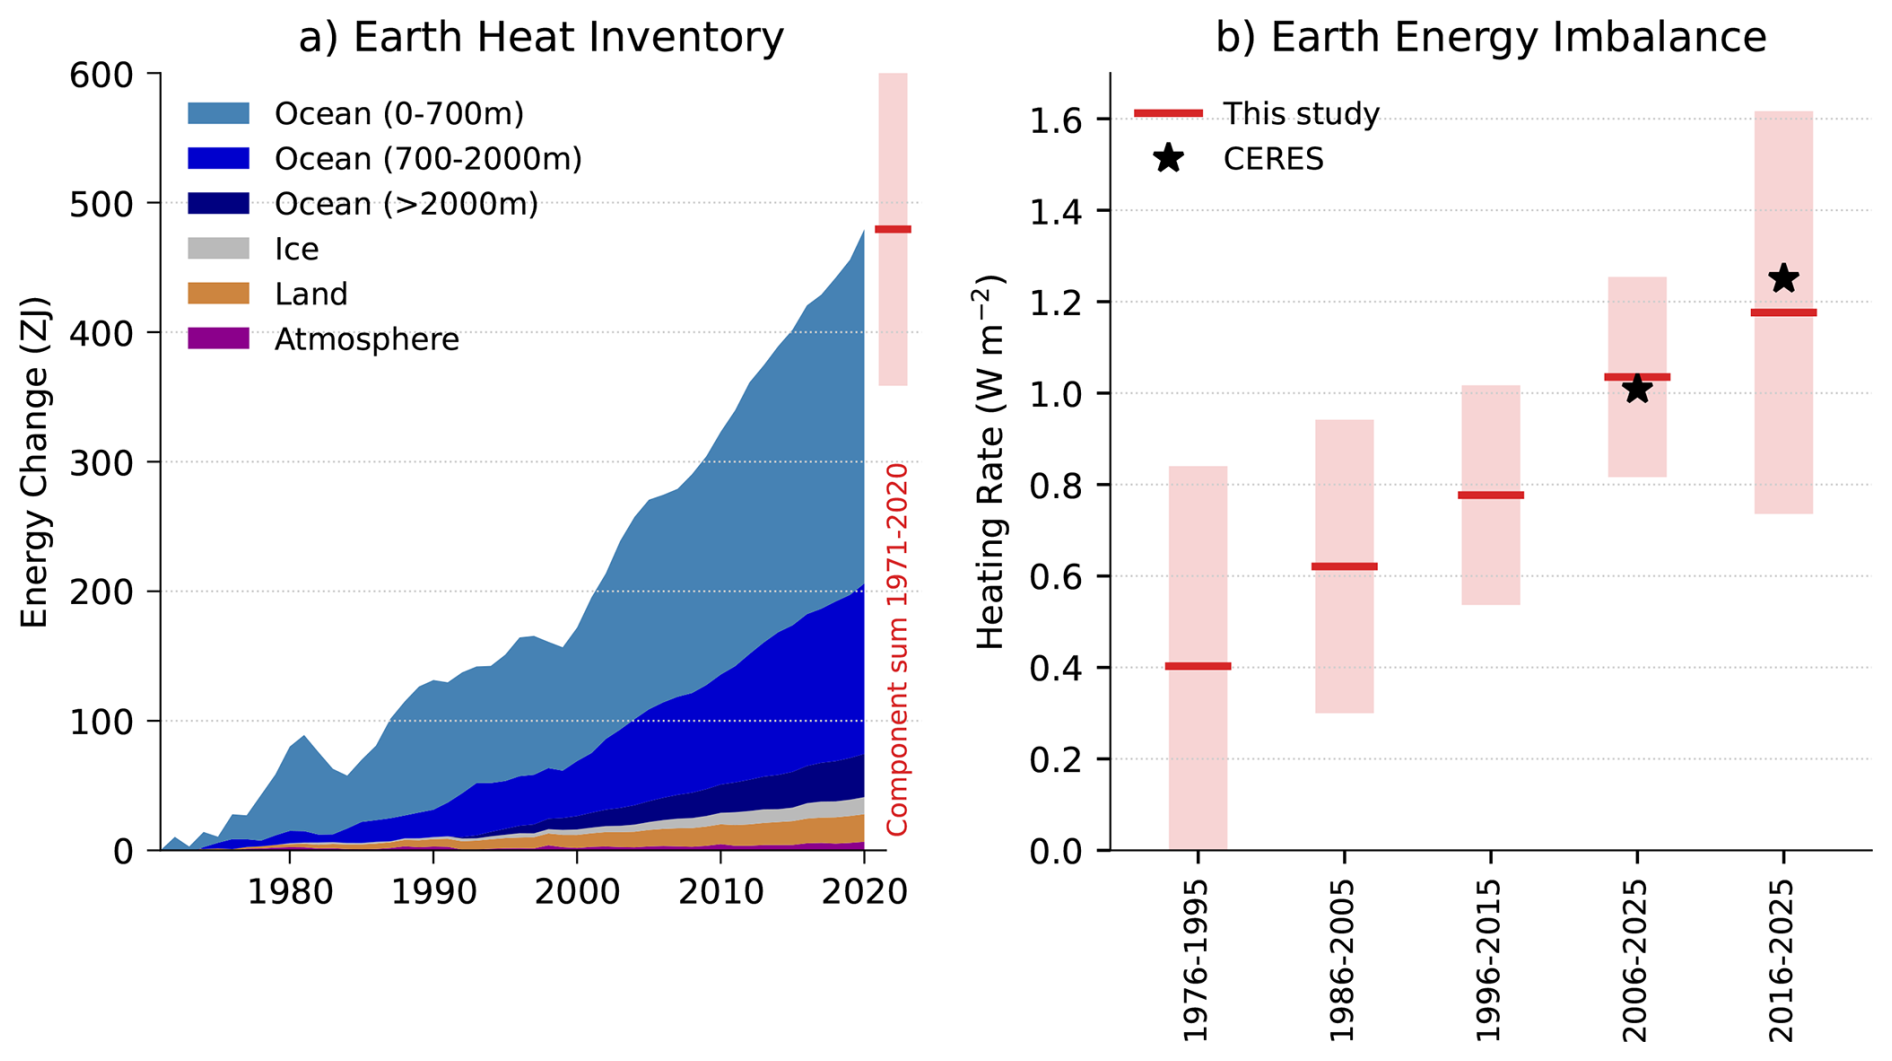
Figure 7(a) Observed changes in the Earth heat inventory for the period 1971–2020, with component contributions as indicated in the figure legend. (b) Estimates of the Earth energy imbalance for successive overlapping 20-year periods and the most recent decade. Shaded regions indicate the very likely range (90 % to 100 % probability). The CERES EBAF-TOA Ed4.2.1 estimates for the two most recent periods are shown for comparison (Loeb et al., 2024). Data use and approach are based on the AR6 methods and further described in the Supplement, Sect. S6.
In particular, recent studies indicate that Earth's energy imbalance has more than doubled in recent decades, highlighting a faster-than-expected increase and reinforcing its central role as an integrative metric of ongoing climate change (Loeb et al., 2024; Mauritsen et al., 2025). The observed increase in EEI over the most recent period (i.e., past 2 decades) is contributing to exceptionally warm conditions (Sect. 7; Minobe et al., 2025), with short-term variability – such as the recent transition from La Niña to El Niño – superimposed on the long-term forced trend (Tsuchida et al., 2026). The recent increase in EEI has been interpreted in several ways in the literature. It has been linked to rising concentrations of well-mixed GHGs and recent reductions in aerosol emissions (Sect. 5; Raghuraman et al., 2021; Kramer et al., 2021; Hansen et al., 2023; Myhre et al., 2025). It can be also be viewed in terms of increased absorbed solar radiation associated with decreased reflection by clouds and sea-ice and a decrease in outgoing longwave radiation (OLR) arising from increases in greenhouse gases and atmospheric water vapor (Loeb et al., 2021; Goessling et al., 2025; Allan and Merchant, 2025). A recent study further identified a decline in low-cloud cover as an important contributor to increased solar absorption and the recent increase in EEI (Ceppi et al., 2026). Consistent with these radiative changes, continued and accelerating ocean heat uptake together with increasing penetration of warming into the deep ocean, provides an integrative constraint on EEI trends (Pan et al., 2026; Cazenave et al., 2026). At the same time, there is growing concern regarding the continuity of the observing system underpinning EEI estimates, as the ability to directly monitor the top-of-atmosphere radiation budget is threatened by the progressive decommissioning of satellite missions while in situ monitoring faces pressures from observing gaps, reduced support and maintenance, despite the fundamental importance of these observations for tracking climate change (von Schuckmann et al., 2023a; Mauritsen et al., 2025).
Here we update the AR6 estimate of changes in the Earth heat inventory for 1971–2020 based on updated observational time series (Table 4 and Fig. 7). Time series of heating associated with loss of ice, and warming of the atmosphere and continental land surface are obtained from the recent Global Climate Observing System (GCOS) initiative (von Schuckmann et al., 2023b; Adusumilli et al., 2022; Cuesta-Valero et al., 2023; Vanderkelen and Thiery, 2022; Nitzbon et al., 2022; Kirchengast et al., 2022). We update the AR6 ensemble OHC time series for the period 1971–2025 based on the most recent versions of the underlying datasets (see Supplement, Sect. S6 for further details). The AR6 heating rates and uncertainties for the ocean below 2000 m are assumed to be constant throughout the period. The time evolution of the Earth heat inventory is determined as a simple summation of time series of atmospheric heating; continental land heating; heating of the cryosphere; and heating of the ocean over three depth layers: 0–700, 700–2000 and below 2000 m (Fig. 7a). Although von Schuckmann et al. (2023a) also quantified heat taken up by permafrost and inland lakes and reservoirs, these terms are small and excluded here for consistency with AR6 (Forster et al., 2021). Because the GCOS estimates of heat uptake by the atmosphere, cryosphere and land are currently only available up to 2020, we use total OHC change as a proxy for Earth system heat uptake for 2021–2025, scaling values upward on the basis that the ocean accounts for 91 % of the total (Forster et al., 2021). Updated GCOS estimates following the approach of von Schuckmann et al. (2023a) are currently in preparation and are expected to become available in the near future.
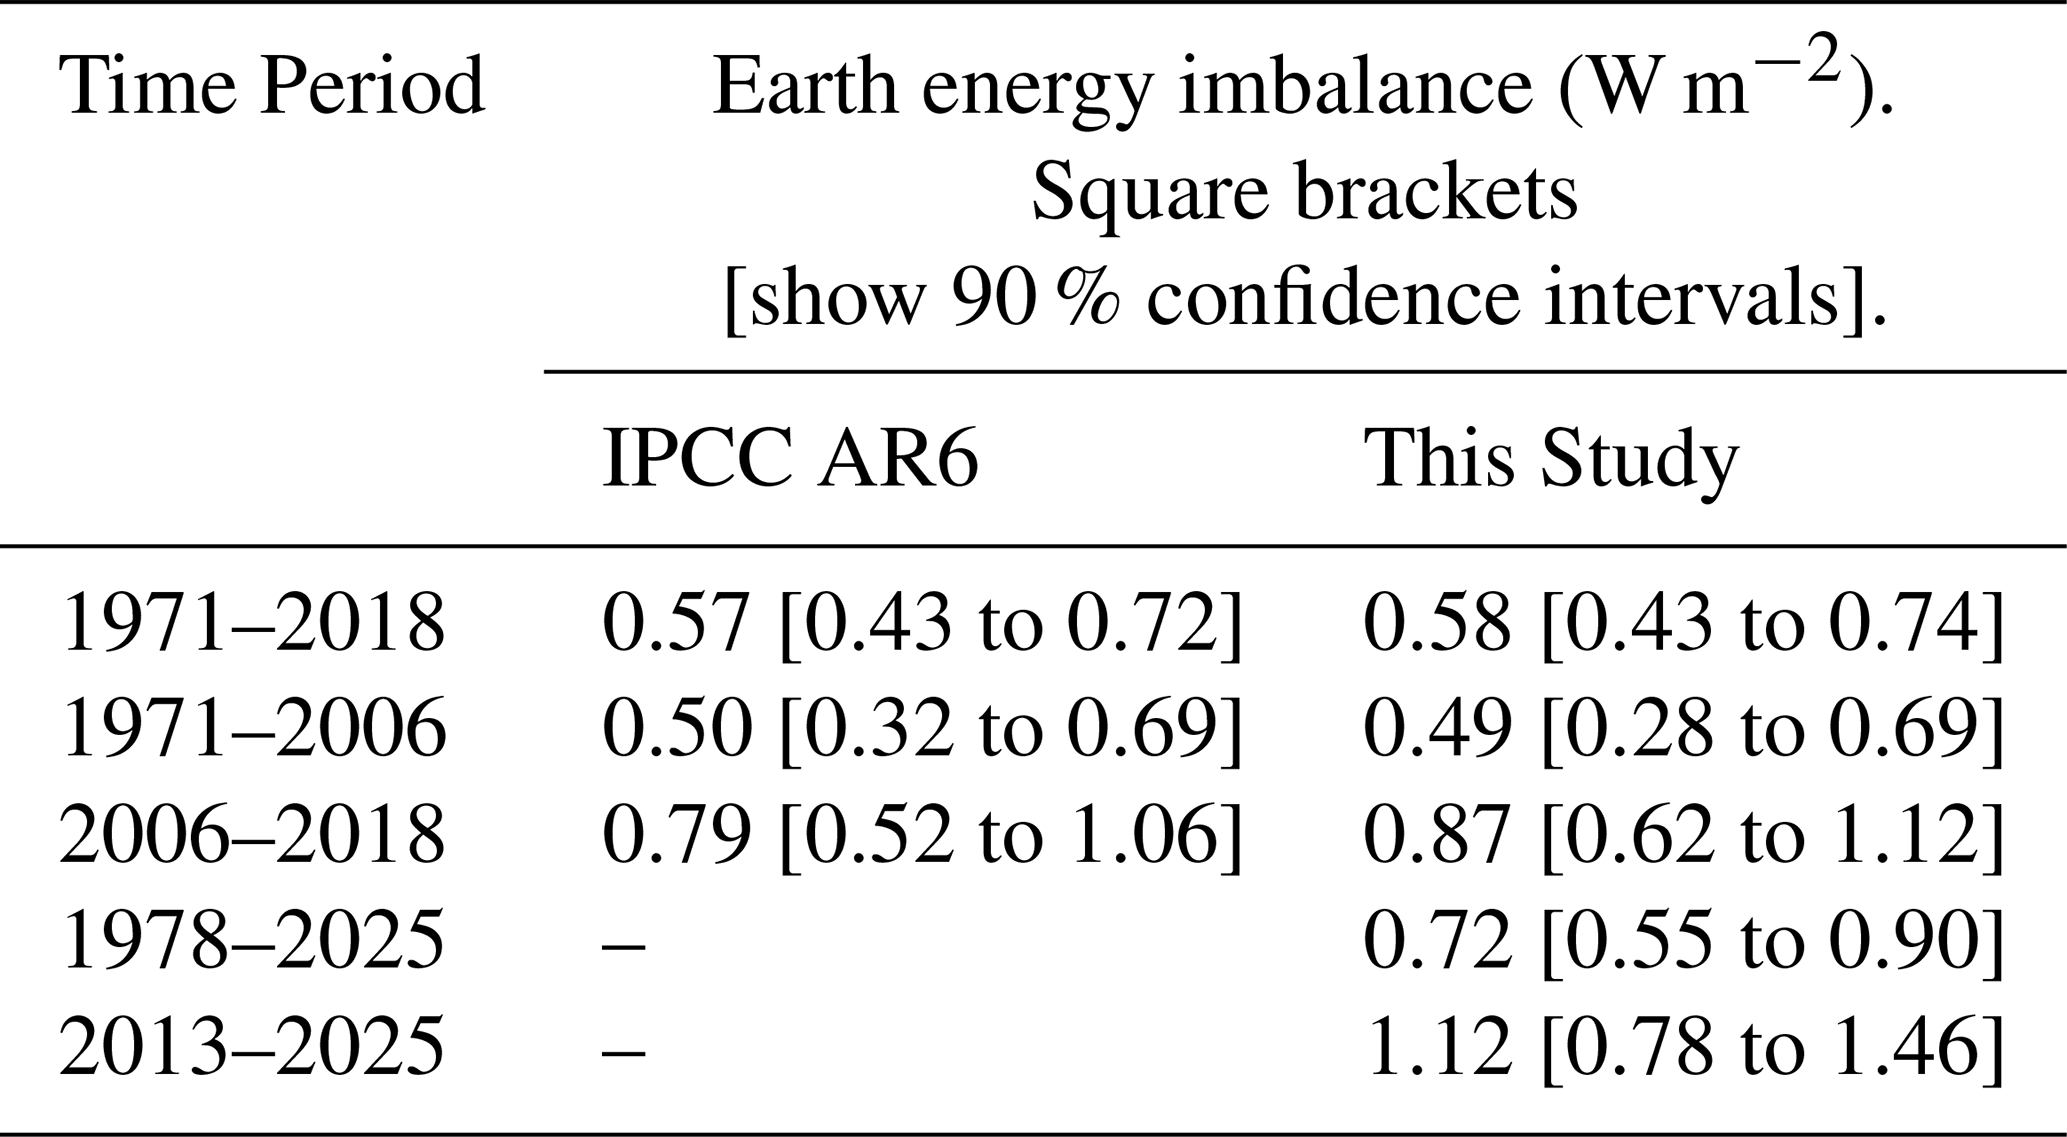
Table 4Estimates of the Earth energy imbalance (EEI) for AR6 and the present study.
Our updated analysis shows successive increases in EEI for each 20-year period since 1976, from 0.40 [−0.03 to 0.84] W m−2 during 1976–1995 to 1.04 [0.82 to 1.25] W m−2 during 2006–2025 (Fig. 7b). There is also evidence that the warming signal is propagating into the deeper ocean over time, as indicated by a robust increase in warming within the 700–2000 m depth layer since the 1990s (von Schuckmann et al., 2020, 2023a; Cheng et al., 2019, 2022). Model simulations qualitatively agree with this observational evidence (e.g. Gleckler et al., 2016; Cheng et al., 2019), further suggesting that more than half of the OHC increase since the late 1800s occurred after the 1990s. Our EEI estimates also agree with the NASA Clouds and the Earth's Radiant Energy System (CERES) observations, which use a different estimate of ocean heat uptake to “anchor” their timeseries of net top-of-atmosphere radiative fluxes (Loeb et al., 2024). However, the CERES-based estimates indicate a larger increase in EEI between 2006–2025 and 2016–2025 of about 0.25 W m−2 compared with about 0.15 W m−2 in our estimate, although both are within the bounds of observational uncertainty (Fig. 7b).
Updating the AR6 assessment periods to end in 2025 results in systematic larger EEI values: 0.72 W m−2 during 1978–2025 compared with 0.58 W m−2 during 1971–2018, and 1.12 W m−2 during 2013–2025 compared with 0.87 W m−2 during 2006–2018 (Table 4). The trend and interannual variability of EEI can largely be explained by a combination of radiative forcing and surface temperature change (Hodnebrog et al., 2024). However, there was a rapid increase in 2023 and 2024 which is still being investigated (see Sect. S7.2), and is also discussed in the context of recent exceptional climate extremes (Minobe et al., 2025).
Change since 1850–1900
AR6 WGI Chap. 2 assessed the 2011–2020 globally averaged surface temperature change above an 1850–1900 baseline to be 1.09 [0.95 to 1.20] °C (Gulev et al., 2021). Updated estimates to 2013–2022 of 1.15 [1.00–1.25] °C were given in AR6 SYR (IPCC, 2023b), matching the estimate in Forster et al. (2023). These estimates are updated within this section.
The methods chosen here closely follow AR6 WGI and are presented in the Supplement, Sect. S7. Confidence intervals are taken from AR6 as only one of the employed datasets regularly updates ensembles (see Supplement, Sect. S7).
Global mean surface temperature (GMST) in 2025 was 1.39 ± 0.13 °C warmer than the 1850–1900 baseline, which is cooler than 2024 (1.51 ± 0.13 °C) but warmer than any year prior to 2023. Based on the updates available as of March 2026, the change in global surface temperature from 1850–1900 to 2016–2025 is presented in Fig. 8. These data, using the same underlying datasets (with some version changes: see Supplement, Sect. S7) and methodology as AR6, estimate 1.26 [1.13–1.36] °C of warming, an increase of 0.17 °C within five years from the 2011–2020 value reported in AR6 WGI (Table 5), or 0.18 °C from the 2011–2020 value in the most recent dataset version. The decade 2016–2025 was 0.32 °C warmer than the previous decade (2006–2015). These changes, although amplified somewhat by the exceptionally warm years in 2023 and 2024, are larger than typical warming rates over the last few decades, which were assessed in AR6 as 0.19 °C per decade over the 1980–2020 period (Gulev et al., 2021). The rate falls within the upper end of projected warming rates from 2001–2020 to 2021–2040 reported in AR6, which had a very likely range between 0.016 and 0.036 °C per year under SSP2-4.5 (Lee et al., 2021, their Table 4.5), and with human-induced warming rates discussed in Sect. 8.2.
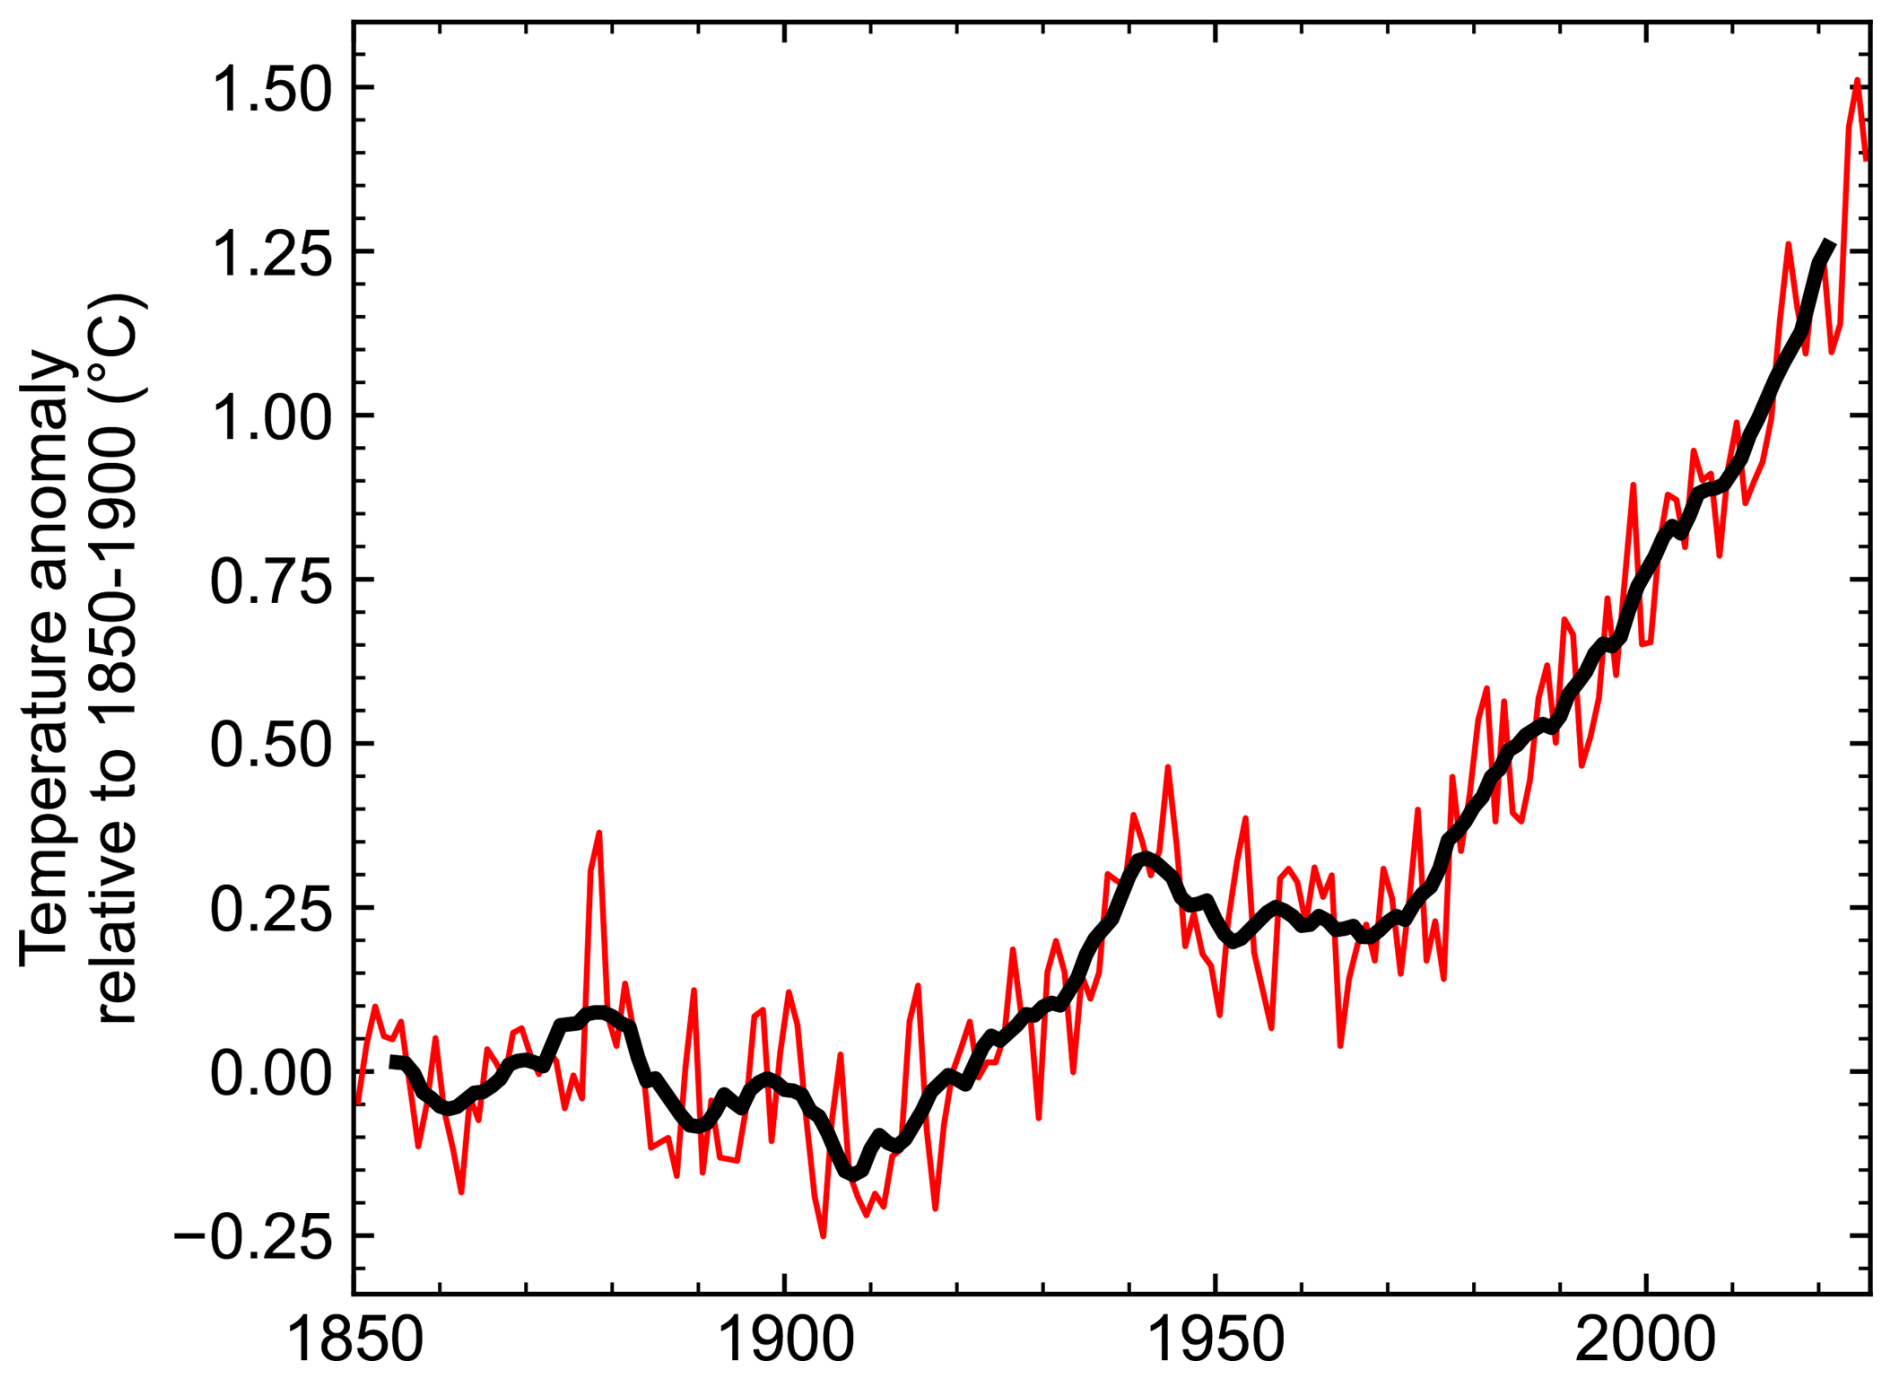
Figure 8Annual (thin line) and decadal (thick line) means of global surface temperature (expressed as a change from the 1850–1900 reference period). Temperatures are based on an average of four datasets following AR6, see Supplement, Sect. S7 for details.
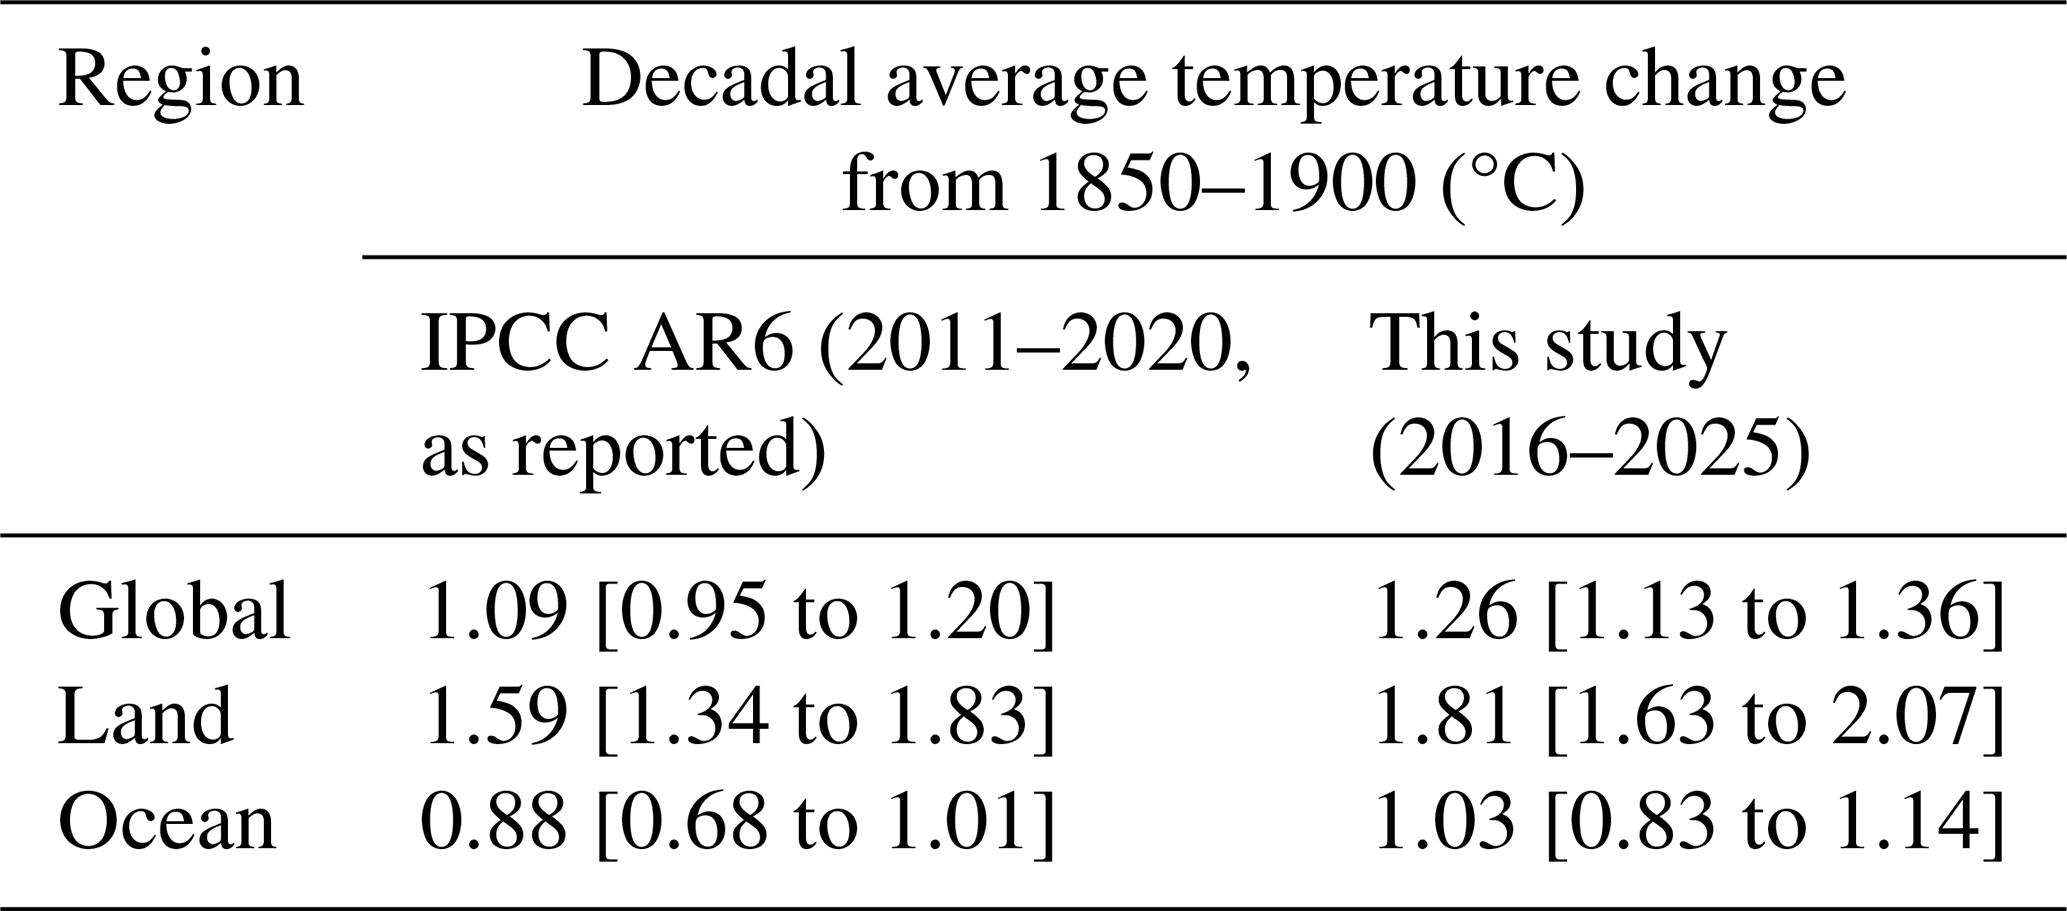
Table 5Estimates of global surface temperature change from 1850–1900 [very likely (90 %–100 % probability) ranges] for IPCC AR6 and the present study.
Natural drivers and internal variability modify the human-caused warming at interannual-to-decadal timescales. Observed global surface temperature in 2024 is assessed to be 0.15 °C higher than the updated human-induced value while 2022 was 0.06 °C lower. The 2025 observed value of surface temperature is close to the 2025 estimate of human induced warming (see Supplement, Sect. S7).
The probability to get such an observed value at current human-induced warming levels, conditional to the fact that 2025 was in a weak La Niña state in the Pacific and that the Atlantic Multidecadal Variability (AMV) was in a positive phase, is equal to around 1 chance out of 4 (p=0.26 [0.22–0.30]) (see Supplement, Sect. S7). 2025 can therefore be treated as a “normal” year, i.e. very much expected at the actual human-caused global warming level when the internal modes of variability are taken into account and when assessed from a very large number of simulations from large ensembles. Forster et al. (2025) and Supplement, Sect. S7 has further discussion of the very high global surface temperature observed in 2023 and 2024 and probabilities of outcomes for annual global surface temperature resulting from the modulation of global warming trends by internal variability..
Land temperatures have increased by 1.81 [1.63–2.07] °C from 1850–1900 to 2016–2025, and ocean temperatures by 1.03 [0.83–1.14] °C over the same period. As was the case for the periods reported in AR6, the ratio of observed land to ocean warming is in the vicinity of 1.75, somewhat higher than the ratio of 1.5 [1.4–1.7] projected by the end of the century in CMIP6 models (AR6, their Table 4.2 and Sect. 4.5.1.1.1). The additional observed warming since 2020 in the most recent dataset versions (0.24 °C for land, 0.15 °C for ocean) has a ratio within the CMIP6 projections range.
Human-induced warming, also known as anthropogenic warming, refers to the component of observed global surface temperature increase attributable to both the direct and indirect effects of human activities, which are typically grouped as follows: well-mixed GHGs (consisting of CO2, CH4, N2O and F-gases) and other human forcings (consisting of aerosol–radiation interaction, aerosol–cloud interaction, black carbon on snow, contrails, ozone, stratospheric H2O and land use) (Eyring et al., 2021). The remaining contributors to total warming are natural, consisting of both natural forcings (such as solar and volcanic activity) and internal variability of the climate system (such as variability related to El Niño/La Niña events).
An assessment of human-induced warming was provided in two reports within the IPCC's Sixth Assessment cycle: first in SR1.5 in 2018 (Chap. 1 Sect. 1.2.1.3 and Fig. 1.2 (Allen et al., 2018), summarised in the Summary for Policymakers (SPM) Sect. A.1 and Fig. SPM.1 (IPCC, 2018)) and second in AR6 in 2021 (WGI Chap. 3 Sect. 3.3.1.1.2 and Fig. 3.8 (Eyring et al., 2021), summarised in the WGI Summary for Policymakers (SPM) Sect. A.1.3 and Fig. SPM.2 (IPCC, 2021b)), and quoted again without any updates in SYR (Sect. 2.1.1 and Fig. 2.1 (IPCC, 2023a) and SYR Summary for Policymakers (SPM) Sect. A.1.2. (IPCC, 2023b)).
Temperature increases are defined relative to a baseline; IPCC assessments typically use the 1850–1900 average temperature as a proxy for the climate in pre-industrial times, even though a small amount of warming likely occurred over 1750–1850 (see AR6 WGI Cross Chapter Box 1.2). Temperatures in the IPCC were reported as either GMST or GSAT, see Supplement, Sect. S8.1 for details. Tracking progress towards the long-term global goal to limit warming, in line with the Paris Agreement, requires the assessment of both what the current level of global surface temperatures are and whether a level of global warming, such as 1.5 °C, is being reached (Betts et al., 2023; Thorne et al., 2026). Definitions for these were not specified in the Paris Agreement, and several ways of tracking levels of global warming are in use. When determining whether warming thresholds have been passed, both AR6 and SR1.5 adopted definitions that depend on future warming; in practice, levels of current warming were therefore reported in AR6 and SR1.5 using additional definitions that circumvented the need to wait for observations of the future climate, as described in the Supplement, Sect. S8.1.1 and Fig. S12.
8.1 Updated assessment approach of human-induced warming to date
This paper provides an update of the AR6 and SR1.5 human-induced warming assessments, including, for completeness, all the three definitions: (i) the lagged decade mean value as used in AR6, (ii) the trend based value for a single-year as used in SR1.5, and (iii) the annual mean value for a single year as also used in SR1.5 (see Supplement, Sect. S8.1.1). The two latter definitions have produced identical or almost identical results in recent years, hence they are sometimes used interchangeably; where they differ we prioritise the SR1.5 trend-based definition which reduces the effects of any internal variability in the annual mean estimates, while acknowledging that there is increasing confidence in the robustness of the simpler annual mean (Ribes et al., 2025). The 2025 updates in this paper follow the same methods and process as Forster et al. (2023, 2024, 2025). Global mean surface temperature (GMST) is adopted as the definition of global surface temperature (see Supplement, Sect. S8.1.2). The three attribution methods used in AR6 are retained: the Global Warming Index (GWI) (building on Haustein et al., 2017), regularised optimal fingerprinting (ROF) (as in Gillett et al., 2021) and kriging for climate change (KCC) (Ribes et al., 2021). Details of each method, their different uses in SR1.5 and AR6, and any methodological changes, are provided in the Supplement, Sect. S8.2; method-specific results are also provided in the Supplement, Sect. S8.3. The overall estimate of attributed global warming for each definition (decade-average, trend-based, and annual-mean), is based on a multi-method assessment of the three attribution methods (GWI, KCC, ROF); the best estimate is given as the 0.01 °C-precision mean of the 50th percentiles from each method, and the likely range is given as the smallest 0.1 °C-precision range that envelops the 5th to 95th percentile ranges of each method. This assessment approach is directly traceable to and fully consistent with the assessment approach in AR6, though it has been lightly extended for these annual updates in ways that are explained in the Supplement, Sect. S8.4.
Results are summarised in Table 6 and Fig. 9. Method-specific contributions to the assessment results, along with time series, are given in the Supplement, Sect. S8.3. Where results reported in GSAT differ from those reported in GMST (see Supplement, Sect. S8.1), the additional GSAT results are given in the Supplement, Sect. S8.3.
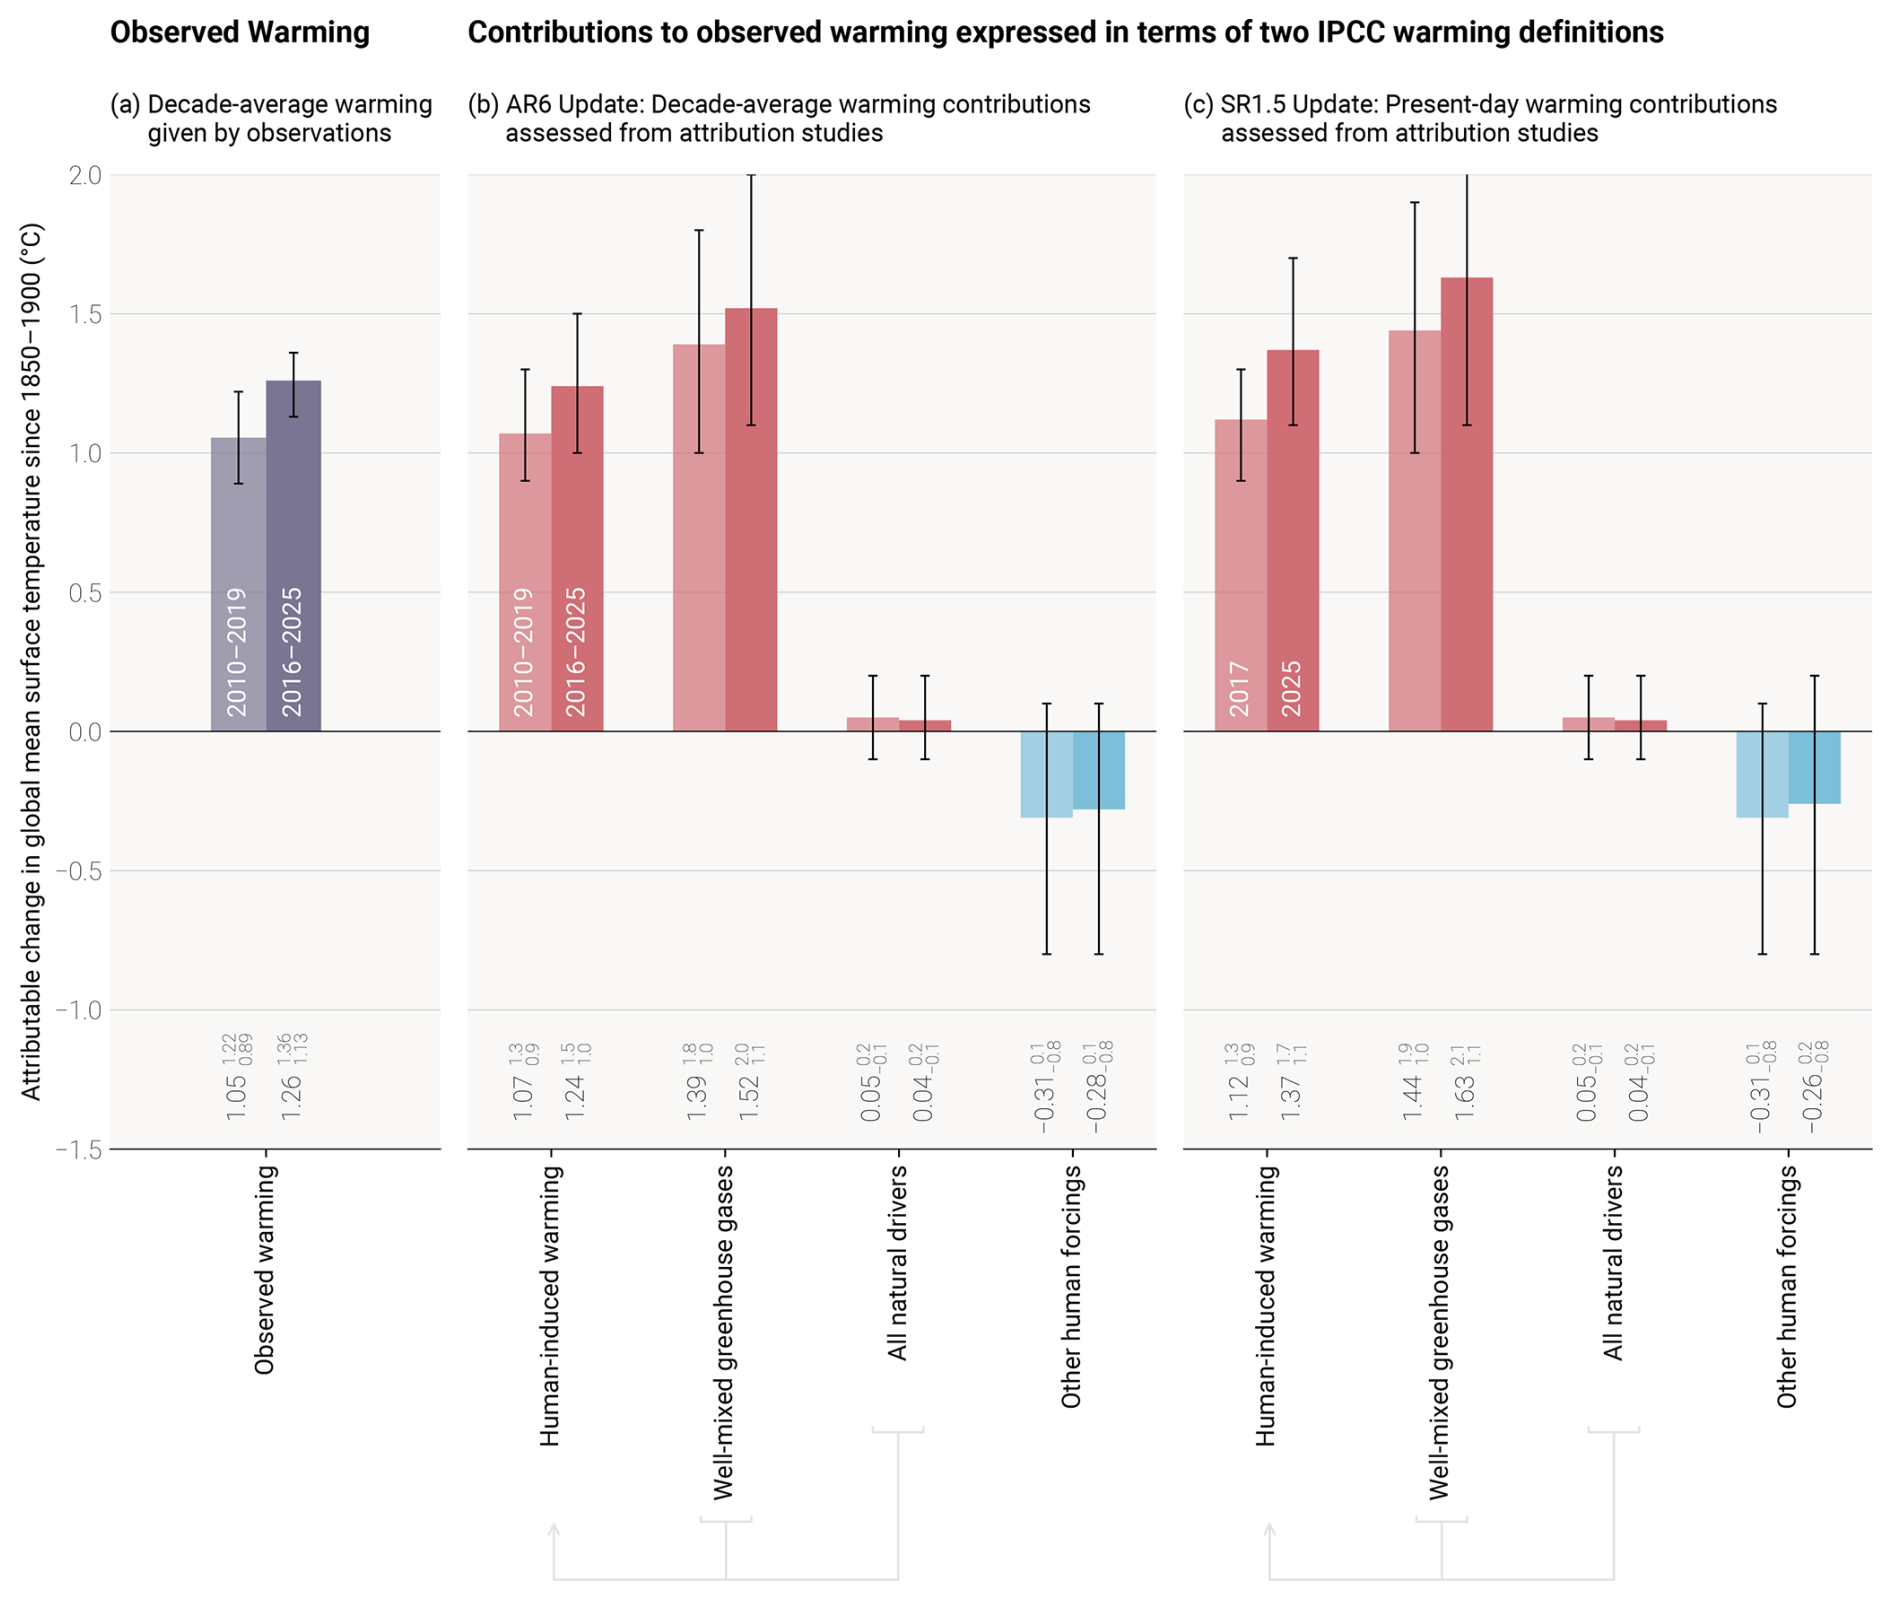
Figure 9Updated assessed contributions to observed warming relative to 1850–1900; see AR6 WGI SPM.2. Results for all time periods in this figure are calculated using updated datasets and methods. The 2016–2025 average and 2025 results are this year's updated assessments of the attributable warming reported in AR6 and SR1.5, respectively. Panel (a) shows updated observed global warming from Sect. 7, expressed as total global mean surface temperature (GMST), due to both anthropogenic and natural influences. Whiskers give the “very likely” range. Panels (b) and (c) show updated assessed contributions to warming, expressed as global mean surface temperature (GMST), from natural forcings and total human-induced forcings, which in turn consist of contributions from well-mixed GHGs and other human forcings. Whiskers give the “likely” range. Changes to warming levels since the IPCC sixth assessment cycle are depicted in the Supplement, Fig. S11.
Table 6Updates to assessments in the IPCC 6th assessment cycle of warming attributable to multiple influences. Estimates of warming attributable to multiple influences, in °C, relative to the 1850–1900 baseline period. Results are given as best estimates, with the likely range in brackets, and reported as global mean surface temperature (GMST). Results from the IPCC 6th assessment cycle, for both AR6 and SR1.5, are quoted in columns labelled (i) and are compared with repeat calculations in columns labelled (ii) for the same period using the updated methods and datasets, including new observations up to 2025, to see how methodological and dataset updates alone would change previous assessments. Assessments for the updated periods are reported in columns labelled (iii).
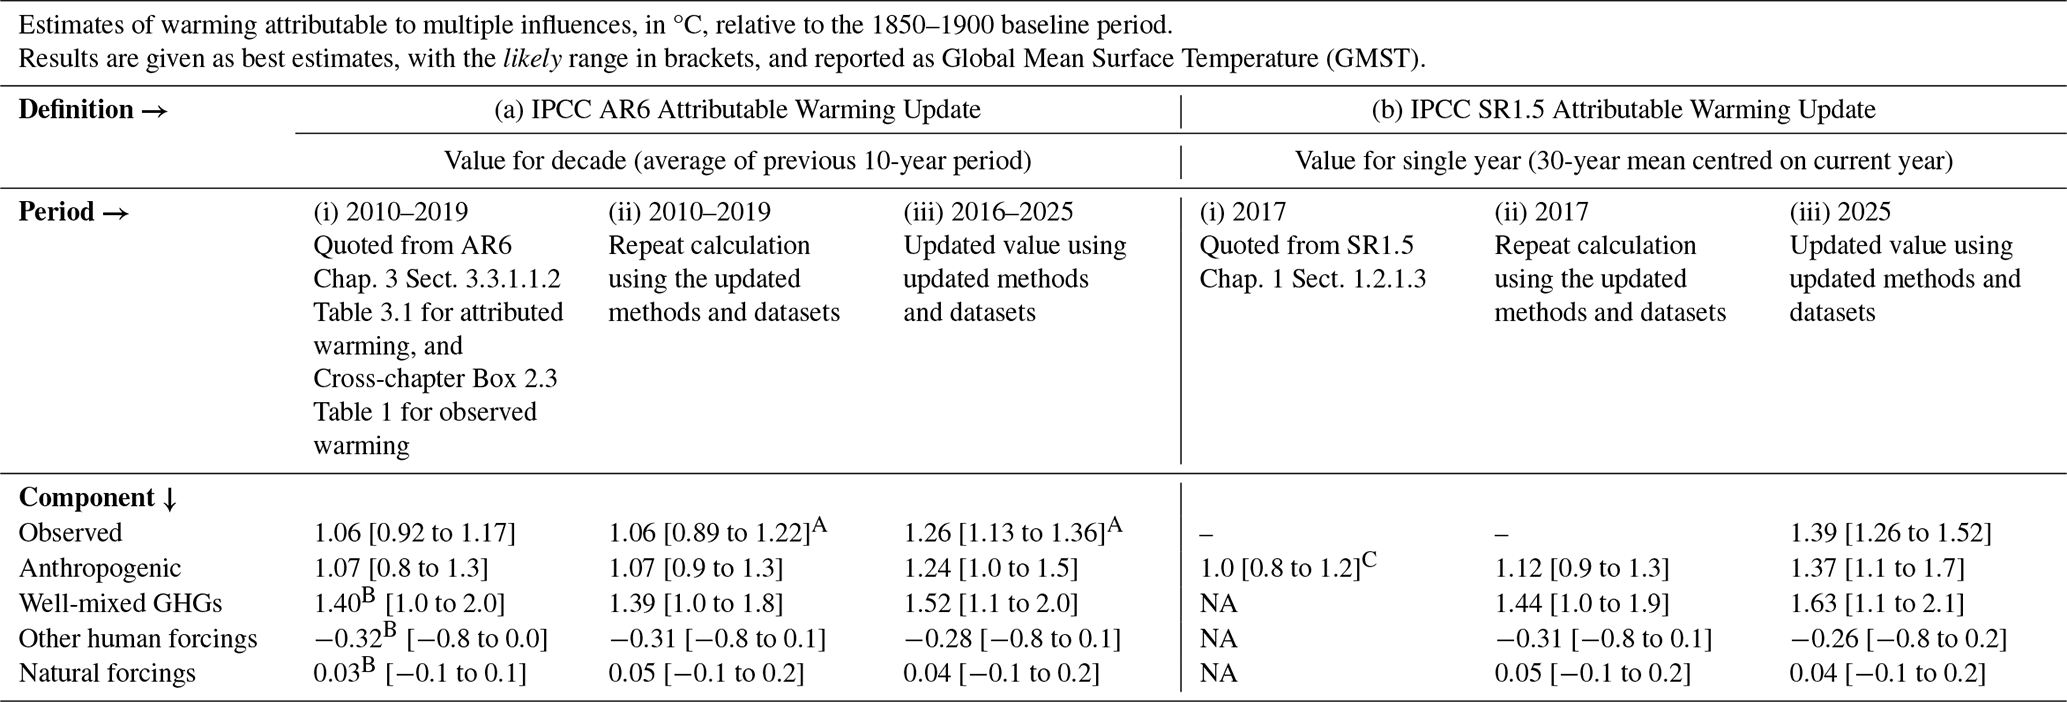
A Updated GMST observations, quoted from Sect. 7 of this update, are marked with an asterisk, with “very likely” ranges given in brackets. B In AR6 WGI, best-estimate values were not provided for warming attributable to well-mixed GHGs, other human forcings and natural forcings (though a “likely” range was assessed); for comparison, best estimates (marked with two asterisks) have been retrospectively calculated in an identical way to the best estimate that AR6 provided for anthropogenic warming (see discussion in the Supplement, Sect. S8.4.1). C The SR1.5 assessment drew only on GWI rounded to 0.1 °C precision, whereas the repeat and updated calculations use the updated multi-method assessment approach. NA: not available.
The repeat calculations for attributable warming in 2010–2019 exhibit good correspondence with the results in AR6 WGI for the same period (see also Supplement, Sect. S8). The repeat calculation for the level of attributable anthropogenic warming in 2017 is about 0.1 °C larger than the estimate provided in SR1.5 for the same period, resulting from changes in methods and observational data (see AR6 WGI Chap. 2 Box 2.3). The updated results for warming contributions in 2025 are higher than in 2017 due also to 8 additional years of increasing anthropogenic forcing. Note also that the SR1.5 assessment only used the GWI method, whereas these annual updates apply the full AR6 multi-method assessment (see Supplement, Sect. S8.4 for details and rationale).
In this 2026 update, we assess the 2016–2025 decade average human-induced warming at 1.24 [1.0 to 1.5] °C, which is 0.17 °C above the AR6 assessment for 2010–2019. The single year average human-induced warming is assessed to be 1.37 [1.1 to 1.7] °C in 2025 relative to 1850–1900. In general, these forced warming levels have evolved steadily and predictably in line with the current warming rate within uncertainty. Note that the interannual increase in assessed human-induced warming since last year's assessment is smaller than the assessed rate of human-induced warming, due in part to the change from HadCRUT 5.0.2 to 5.1.0, which contributed to a small downward revision of historical warming compared to Forster et al. (2025). Even with the slight downward historical revision, the central estimate for well-mixed greenhouse gases lies above 1.5 °C for the 2016–2025 average and above 1.6 °C by 2025, which is masked by the net cooling contribution from all other human forcings.
AR6 assessed that, averaged for the 2010–2019 period, essentially all observed global surface temperature change was human-induced, with solar and volcanic drivers and internal climate variability making a negligible contribution. For both 2016–2025 and 2025 the observed warming again is only 0.02 °C different than the assessed level of human-induced warming; indeed for all three attribution methods, observed warming in 2025 was extremely close to the total forced warming, indicating that 2025 was a typical year for the current level of forced warming, with only a minimal contribution from internal variability (see Sect. 7). This conclusion remains the same for the 2016–2025 period. Generally, whatever methodology is used, on a global scale, the best estimate of the current level of human-induced warming is (within uncertainty) similar to the observed global surface temperature change (Table 6).
8.2 Rate of human-induced global warming
Estimates of the human-induced warming rate follow the same methodology as in previous years (a rolling 10-year linear trend in attributed anthropogenic warming). A description of the approach can be found in the Supplement (Sect. S8.5). Our assessed rate of attributed anthropogenic warming over time is distinct from the rate of increase in the observed global surface temperature, discussed in Sect. 7, which is also affected by internal variability (see Sect. S7.2). In this section we isolate the rate of anthropogenic warming driven by the rate of change of anthropogenic ERF (Sect. 5), with variations in the climate forcing trend over time correlating with variations in the rate of attributed warming (Fig. 10).
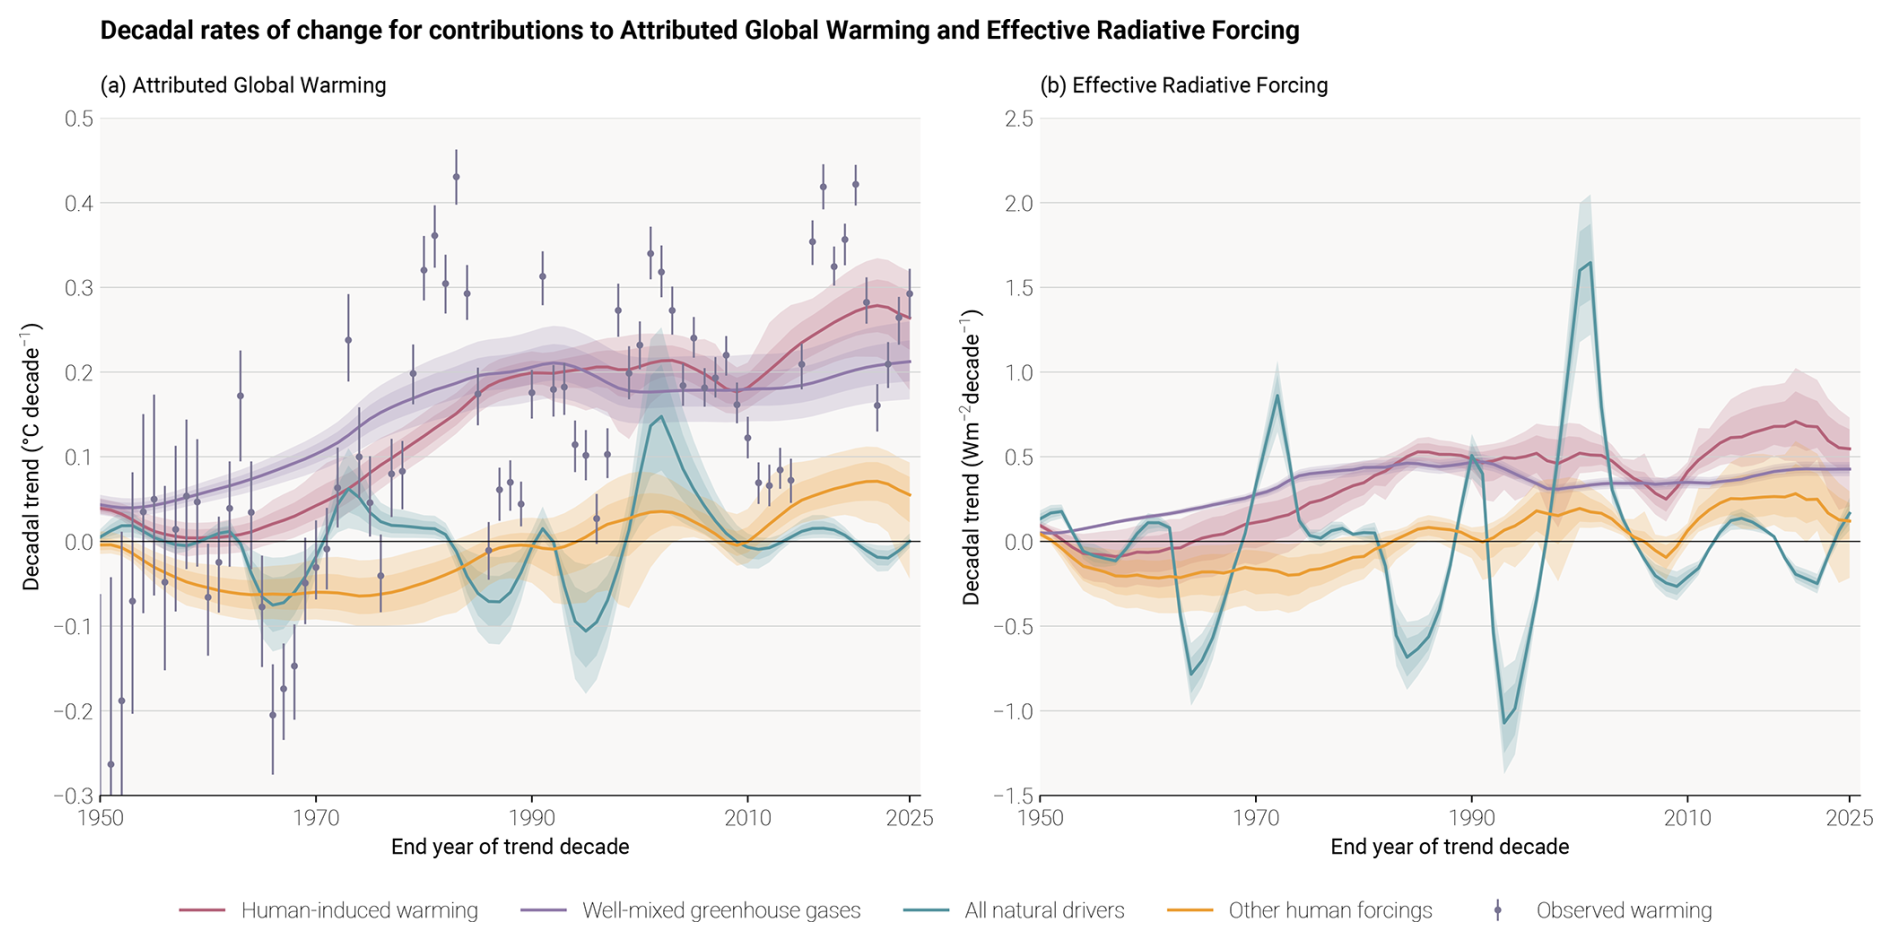
Figure 10Rates of (a) attributable warming (global mean surface temperature (GMST)) and (b) effective radiative forcing. The attributable warming rate time-series are calculated using the Global Warming Index method with full ensemble uncertainty. The observed GMST rates included for reference are also calculated with uncertainty from the HadCRUT5 ensemble, and, for consistency with the attributed warming rates, do not include standard regression error, which, for observed warming, would increase the size of the error bars. The effective radiative forcing rates are calculated using a representative 1000-member ensemble of the forcings provided in Sect. 5 of this paper. The depicted rates are the decadal rates, with the end year of the decade in question being the value given on the time axis. See Fig. S14 in the Supplement for a breakdown of these aggregate rates into their components.
A combined estimate for the trend derived using the three warming attribution methodologies is presented in Table 7, with results for individual methods shown in the Supplement, Table S7. As in previous assessments, the GWI (based on observed warming and forcing) and KCC (based on observed warming and CMIP simulations) methodologies are in close agreement, while estimates derived with the ROF method (also based on observed warming and CMIP simulations) imply higher warming rates. The ROF results are more strongly influenced by residual internal variability that remains in the anthropogenic warming signal due to the limitations in size of the available CMIP ensemble.
Table 7Updates to the IPCC AR6 rate of human-induced warming. Results for each method are given in the Supplement, Table S6; assessment results are given as a best estimate with likely range in brackets. Results from AR6 WGI (Chap. 3 Sect. 3.3.1.1.2 Table 3.1) are quoted in column (i), and compared with a repeat calculation using the updated methods and datasets in column (ii), and finally updated for the 2016–2025 period in column (iii). The AR6 assessment result was identical to the SR1.5 assessment result, though the latter was based on a different set of studies and timeframes.
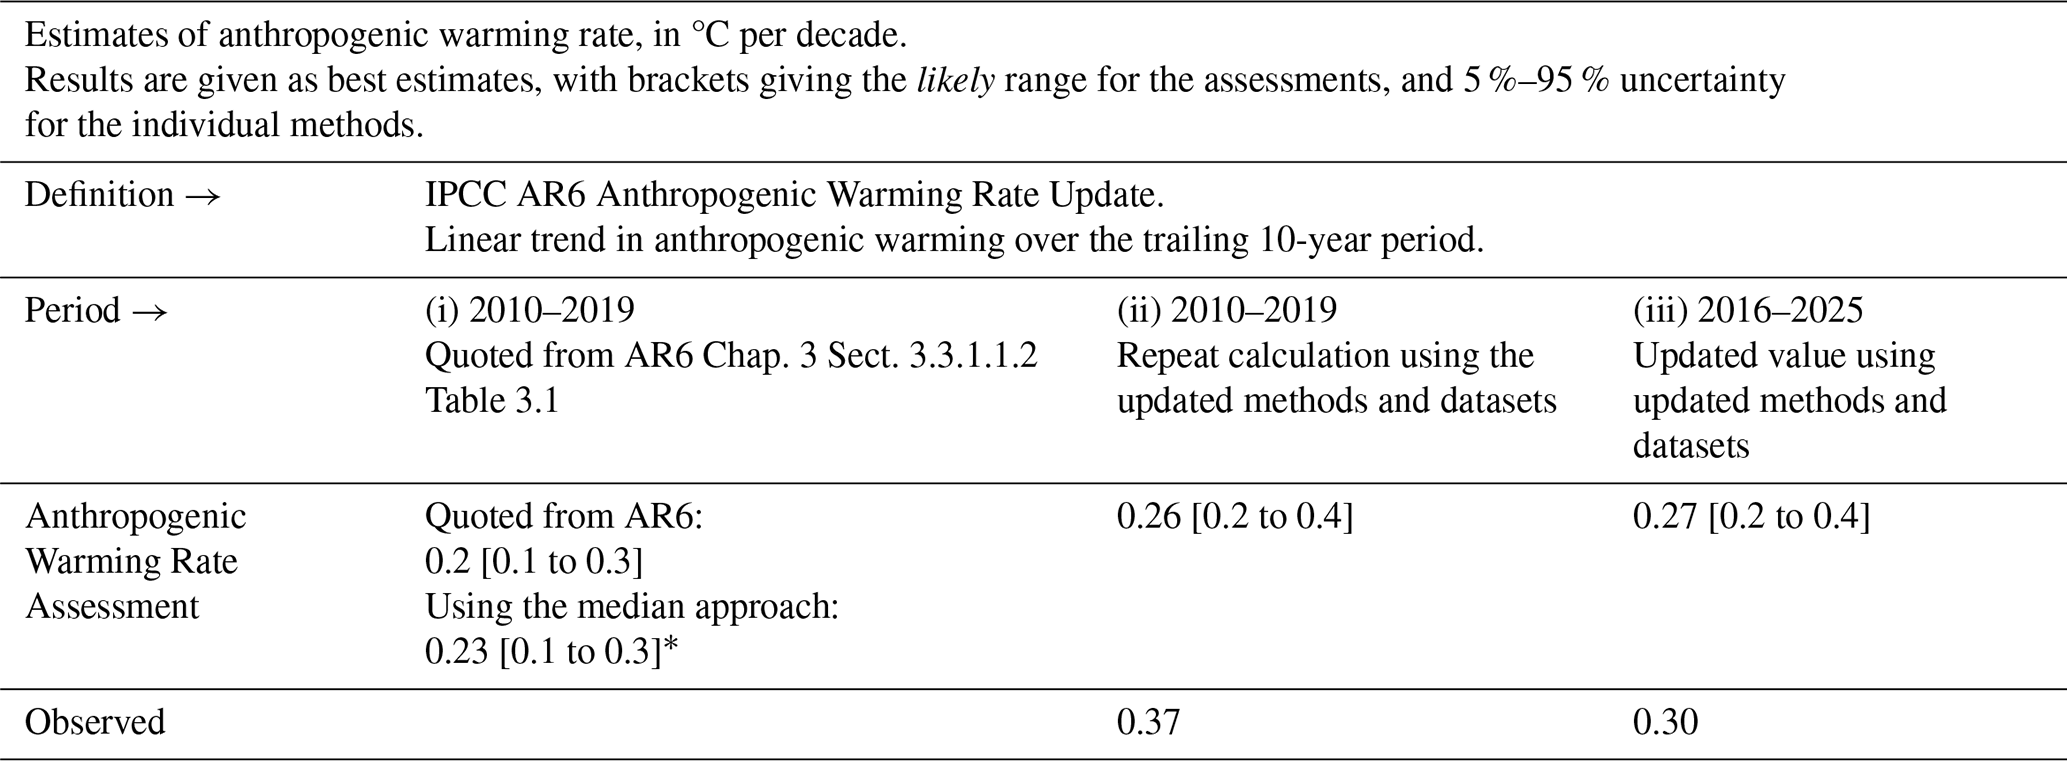
* Note that for clarity and ease of comparison with this year's updated assessment, the assessed rate in column (i) both quotes the assessment from AR6 and retrospectively applies the median approach adopted in this paper. The observed rates are calculated using the multi-dataset observed temperature dataset from Sect. 7; no ensemble is available for this, hence the absence of an uncertainty range.
The assessed attributed rate of human-induced warming is unchanged on the previous year's assessment (0.27 °C per decade for the decade 2016–2025). The spread of rates across the three attribution methods remains similar to their spread in AR6, and previous updates of this work, and hence does not support a decrease in the headline uncertainty range overall, which we maintain at 0.2–0.4 °C per decade overall (see discussion in the Supplement; reflecting the agreement of the 5 % floors and the larger spread in the 95 % ceilings of the three methods, and higher rate from the ROF method).
The overall assessed rate of human-induced warming (0.27 (0.2–0.4) °C per decade agrees with the decadal trend in observed warming of 0.30 °C per decade (also calculated as a linear trend through 10-year periods – see Table 7). Last year we noted that internal variability leads to the decadal rates of observed warming being far less stable than for anthropogenic warming, and the continued close correspondence between the two this year is, again, somewhat coincidental (see Fig. 10). This year we diagnose a slightly lower decadal human-induced warming rate compared to the last couple of years. This slight revision is due to a decrease in the attributed warming rate from aerosol emissions (with aerosol forcing trends peaking and declining in recent years, see Fig. S13). Aerosols have been the predominant driver of the acceleration in anthropogenic warming since the decade 2000–2009 due to their emission rate falling. A slowing in the rate at which aerosol emissions are falling (i.e. a deceleration) are contributing a slight reduction in anthropogenic warming rates (i.e. a net deceleration) over the last three years, though we note that wildfire emissions, which were particularly high in 2023 and 2024, are included in the aerosol emissions underlying this calculation (Sect. 4). Carbon-dioxide-induced warming remains the dominant contribution to the anthropogenic warming rate, and, having consistently increased over the assessed historical period, reached a new historical high over the decade 2016–2025 (individually-attributed warming rates using the GWI methodology are shown in the Supplement, Fig. S13). The contributions from internal variability were small for the 2016–2025 period, though the decadal rate from internal variability fluctuates strongly year-on-year (see Fig. S13). Finally, we note that, based on the current assessed level and rate of warming, human-induced warming will reach 1.5 °C around the year 2030.
Long-term global surface temperature increase caused by CO2 emissions is close to linearly proportional to the total amount of cumulative CO2 emissions (IPCC, 2013; Collins et al., 2013), an assessment reaffirmed by AR6 (Canadell et al., 2021). This near-linear relationship implies that for keeping global warming below a specified temperature level, one can estimate the total amount of CO2 that can ever be emitted. When expressed relative to a recent reference period, this is referred to as the remaining carbon budget (Rogelj et al., 2018).
AR6 WGI assessed the remaining carbon budget (RCB) for warming levels ranging from 1.3 to 2.4 °C relative to the 1850–1900 period (see Table 5.8 in Canadell et al., 2021). A selection of these (1.5, 1.7, and 2 °C) were also reported in its Summary for Policymakers (Table SPM.2, IPCC, 2021b). These RCB values are updated in this section using the same method as previously (Forster et al., 2024, 2025).
The RCB is estimated by application of the WGI AR6 method described in Rogelj et al. (2019), which involves the combination of the assessment of five factors: (i) the amount of human-induced warming for the most recent decade (given in Sect. 8), (ii) the transient climate response to cumulative emissions of CO2 (TCRE), which quantifies the linear proportionality between cumulative CO2 emissions and CO2-induced warming (iii) the zero emissions commitment (ZEC), representing the expected amount of additional (at present unrealized) warming caused by past CO2 emissions (iv) the temperature contribution of future non-CO2 emissions and (v) an adjustment term for Earth system feedbacks that are otherwise not captured through the other factors. AR6 WGI reassessed all five terms (Canadell et al., 2021). Lamboll et al. (2023) further considered the temperature contribution of non-CO2 emissions and integrated different uncertainties, while Rogelj and Lamboll (2024) clarified the reductions in non-CO2 emissions that are assumed in the RCB estimation.
The RCB is re-assessed based on the most recent available data. Estimated RCBs for 0.1 °C increments in global warming between 1.5 and 2 °C are reported in Table 8. They start from 2026 and are based on the 2016–2025 human-induced warming update (Sect. 8). Several robustness cases are included in the Supplement, Sect. S9 – values for the calculation using observed rather than anthropogenic warming, as well as versions using both MAGICC and FaIR results for the emulators and including ZEC uncertainty in the distribution. Based on the variation in non-CO2 emissions across the scenarios in AR6 WGIII scenario database, the estimated RCB values can be higher or lower by around 200 GtCO2 depending on how successful non-CO2 emissions reductions are (Lamboll et al., 2023; Rogelj and Lamboll, 2024). Notably, RCB estimates consider the subset of non-CO2 emission scenarios in the AR6 WGIII database that are aligned with a global transition to net zero CO2 emissions (Lamboll et al., 2023; Rogelj and Lamboll, 2024). These estimates assume median reductions in non-CO2 emissions between 2020–2050 of CH4 (about 50 %), N2O (about 20 %) and SO2 (about 80 %) (see Supplement, Sect. S9 and Table S11 and Rogelj and Lamboll, 2024). If these non-CO2 GHG emission reductions are not achieved, the RCB for all temperature targets would be smaller than the values reported here in Table 8 (see Lamboll et al., 2023; Rogelj and Lamboll, 2024).
Table 8Estimates of the remaining carbon budget for 1.5–2.0 °C temperature increase, for five levels of likelihood, considering only uncertainty in TCRE. Estimates are expressed relative to the start of 2026. The probability includes only the uncertainty in how the Earth immediately responds to CO2 emissions (TCRE), not long-term committed warming or uncertainty in the climate response to other non-CO2 emissions. All values are rounded to the nearest 10 GtCO2. Additional values can be found in the Supplement, Tables S8 and S9, and the corresponding time to net zero based on a linear pathway are presented in the Supplement, Table S10.
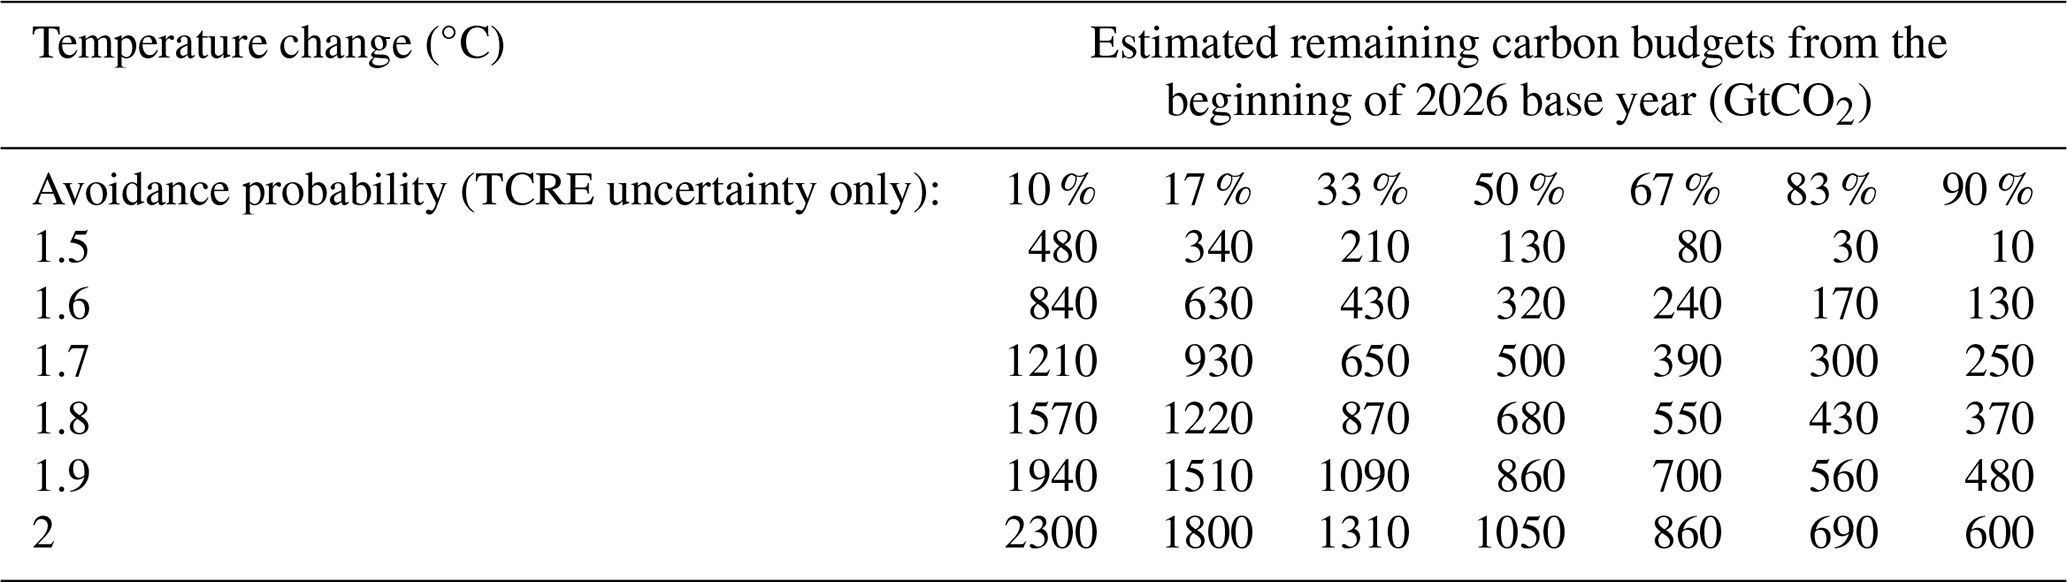
Compared to RCB values reported in AR6, our estimates here are smaller owing to several factors. First, AR6 budgets were expressed from 2020 onwards, and approximately 250 GtCO2 have been emitted between 2020 and 2025 (Friedlingstein et al., 2026), so the expected budget is smaller. Second, we use updated physical models of non-CO2 forcing which lead to an increased estimate of the importance of aerosols that are expected to decline with time in low emissions pathways (Rogelj et al., 2014; Rogelj and Lamboll, 2024). This decreased negative forcing from aerosols is expected to cause additional net non-CO2 warming because more non-CO2 GHG warming is being unmasked and this decreases the RCB (Lamboll et al., 2023) by around100 GtCO2. There was also a small reduction in the budget (about 10 GtCO2) from using the newer AR6 scenario set compared to the SR1.5 scenario set on which AR6 WGI still had to rely. Finally, the updated warming estimate reported in Sect. 8 is slightly increased compared to central estimates at the time of AR6 due to the higher than expected recent warming in the last few years, which resulted in a further reduction of the budget by a few tens of GtCO2. This gives a total reduction in RCB values estimated from the beginning of 2026 of ∼ 370 GtCO2 compared to the values from 2020 reported in AR6.
This year's update of the 1.5 °C budget uses the historical warming level for the 2016–2025 period of 1.24 °C, with a 0.10 °C future contribution of non-CO2 warming. Assuming a median TCRE estimate of 0.45 °C per 1000 GtCO2 this gives around 360 GtCO2 from the midpoint of the period, from which we subtract around 220 GtCO2 (consisting of 213 GtCO2 that were already emitted from the middle until the end of the 2016–2025 period, and 7 GtCO2 that represents the median estimate of the impact of Earth systems feedbacks such as permafrost feedback that would otherwise not be covered). The same method is used to calculate budgets for the other warming levels.
The values in Table 8 are all greater than zero, implying that we have not yet emitted the amount of CO2 that would commit us to these levels of warming for these ranges of probability. However, including the uncertainty in ZEC (as in the Supplement, Table S9), non-CO2 emission and forcing uncertainty, and underrepresented Earth-system feedbacks results in negative RCB estimates for limiting warming to low temperature limits with high likelihood. A negative RCB for a specific temperature limit would mean that the world is already committed to this amount of warming, even if CO2 emissions ceased now, and that net negative CO2 emissions would be required to return to the temperature limit after a period of overshoot. The assumption behind such a calculation is that we can treat the warming impact of positive and negative net emissions as approximately symmetric. While the claim of symmetry is likely valid for small levels of carbon budget overconsumption, some model studies have shown that it holds less well for reversal of larger emissions (Canadell et al., 2021; Zickfeld et al., 2021; Vakilifard et al., 2022) As such, larger exceedances of the RCB for a particular temperature target would decrease the likelihood that the temperature target could still be achieved by an equivalent amount of net negative emissions.
Note that the RCB estimate of 130 GtCO2 (50 % likelihood) would be exhausted in a little more than 3 years if global CO2 emissions remain at 2025 levels (42 GtCO2 yr−1, from Table 1 with additional accounting for cement carbonation sink). This is not expected to correspond exactly to the time that 1.5 °C of global warming is reached due to uncertainty associated with committed warming from past CO2 emissions (the ZEC) as well as ongoing warming and cooling contributions from non-CO2 emissions. For comparison, our estimate of 2025 anthropogenic warming (1.37 °C) and the recent rate of increase (0.27 °C per decade) would suggest that continued emissions at current levels would cause human-induced global warming to reach 1.5 °C around the year 2030.
Changes in climate and weather extremes are among the most visible effects of human-induced climate change. Within AR6 WGI, a full chapter was dedicated to the assessment of past and projected changes in extremes on continents (Seneviratne et al., 2021). The AR6 WGI chapter on ocean, cryosphere and sea level changes (Fox-Kemper et al., 2021) also provided assessments on changes in marine heatwaves.
10.1 Land average maximum temperature
The presented climate indicator for changes in temperature extremes consists of land average maximum temperatures for any single day in a year (TXx) (excluding Antarctica). Figure 11 updates the land mean TXx shown in Forster et al. (2023, 2024, 2025), originally based on Fig. 11.2 from Seneviratne et al. (2021). Three datasets are analyzed: HadEX3 (Dunn et al., 2020), Berkeley Earth Surface Temperature (building off Rohde et al., 2013), and the fifth-generation ECMWF atmospheric reanalysis of the global climate (ERA5; Hersbach et al., 2020). HadEX3 is static and has not received any updates. Berkeley Earth intends to release an extended and updated dataset in May 2026, which we plan to include in the revision of this paper. Currently, Berkeley Earth only extends to 2023 and is the same as in Forster et al. (2025). Of the three datasets, only ERA5 covers the whole of 2025 at the present time. TXx is calculated by averaging the annual maximum temperature over all available land grid points (excluding Antarctica) and then converted to anomalies with respect to a base period of 1961–1990. To express the TXx as anomalies with respect to 1850–1900, we add an offset of 0.51 °C to all three datasets. See Supplement, Sect. S10 for details on the data selection, averaging and offset computation. Note that the updated Berkeley Earth dataset will likely lead to changed TXx and offset estimates.
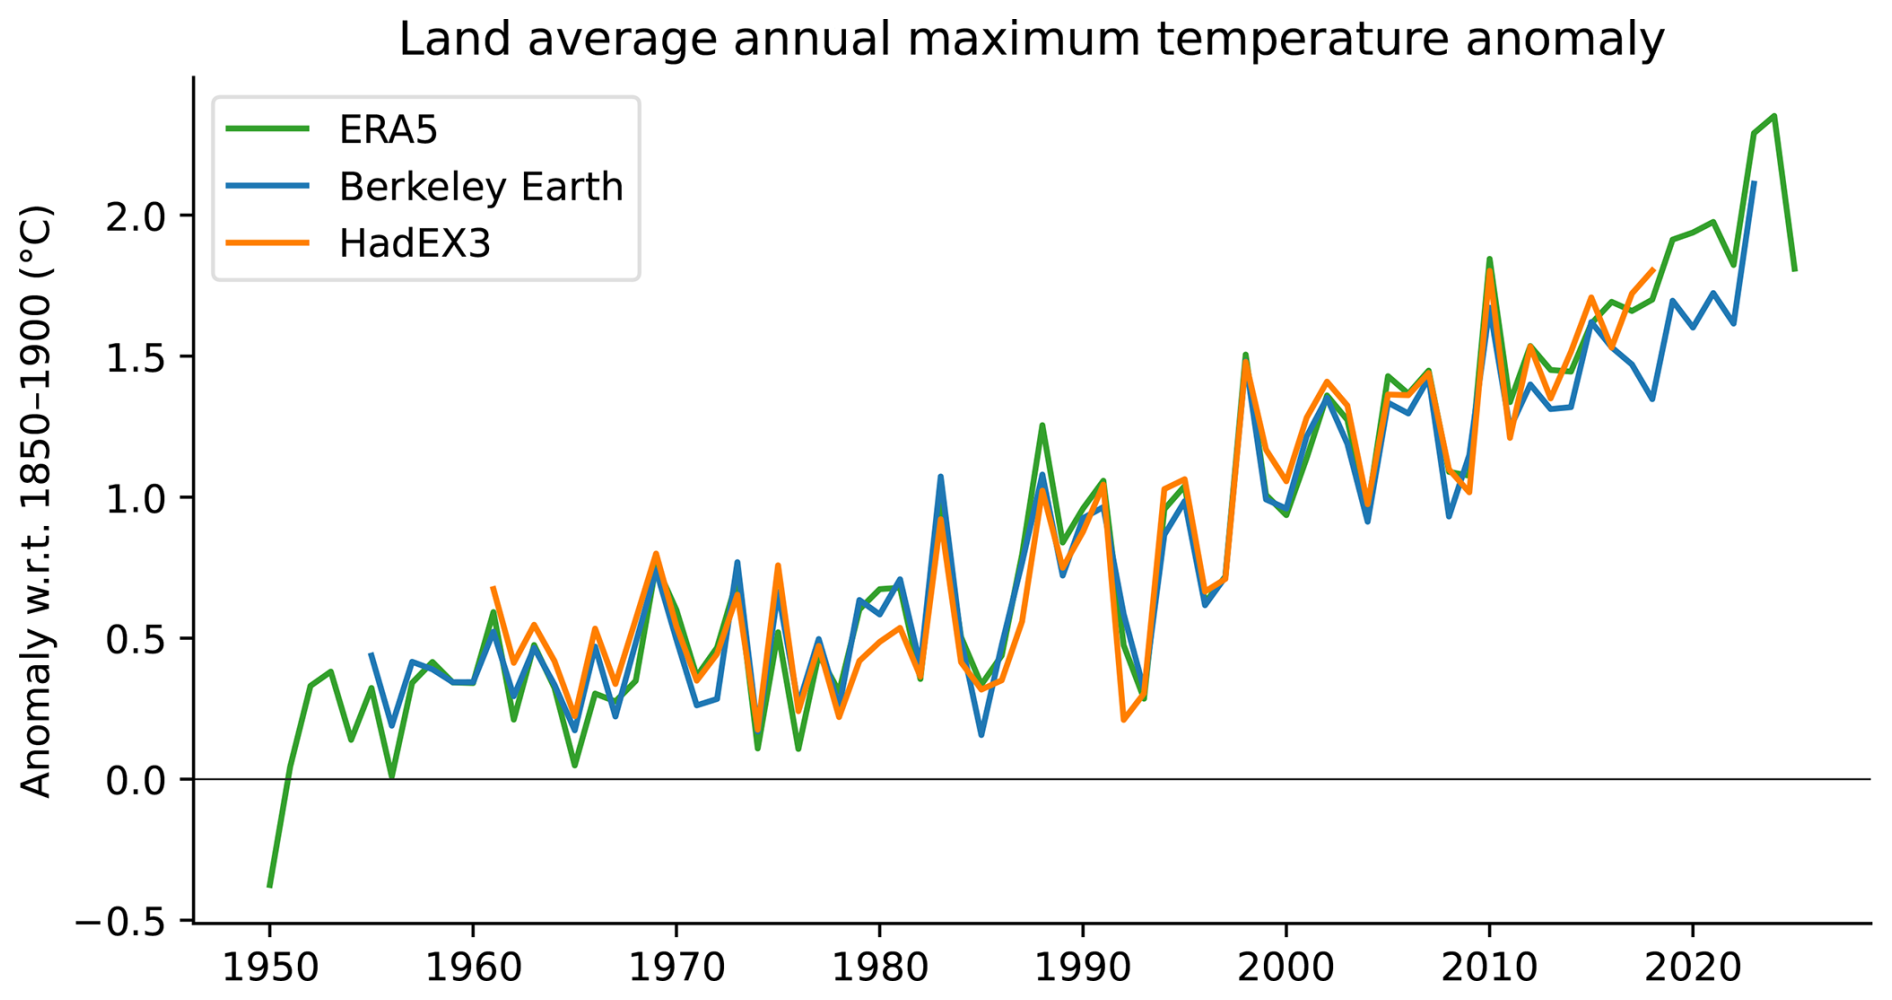
Figure 11Time series of observed temperature anomalies for land average annual maximum temperature (TXx) for ERA5 (1950–2025), Berkeley Earth (1955–2023) and HadEX3 (1961–2018), with respect to 1850–1900. The datasets have different spatial coverage and are not coverage-matched. All anomalies are calculated relative to 1961–1990, and an offset of 0.51 °C is added to obtain TXx values relative to 1850–1900. Note that while the HadEX3 numbers are the same as shown in Seneviratne et al. (2021) Fig. 11.2, these numbers were not specifically assessed.
Our climate has warmed rapidly in the last few decades (Sect. 7), which also manifests in changes in the occurrence and intensity of climate and weather extremes. From about 1980 onwards, all datasets point to a strong TXx increase, which coincides with the transition from global dimming, associated with aerosol increases, to brightening, associated with aerosol decreases (Wild et al., 2005, Sect. 4). The ERA5 based TXx warming estimate w.r.t. 1850–1900 for 2025 is at 1.81 °C; a decrease of 0.54 °C compared to 2024, on par with the anomaly in 2022. On longer time scales, land average TXx has warmed 0.49 °C in the past 10 years (comparing the decades 2016–2025 to 2006–2015) and 1.92 °C with respect to pre-industrial conditions (Table 9). Since the offset relative to our pre-industrial baseline period is calculated over 1961–1990, temperature anomalies align by construction over this period but can diverge afterwards.
Table 9Anomalies of land average annual maximum temperature (TXx) for recent decades based on HadEX3, Berkeley Earth, and ERA5, with respect to 1850–1900. All anomalies are calculated relative to 1961–1990, and an offset of 0.51 °C is added to obtain TXx values relative to 1850–1900.
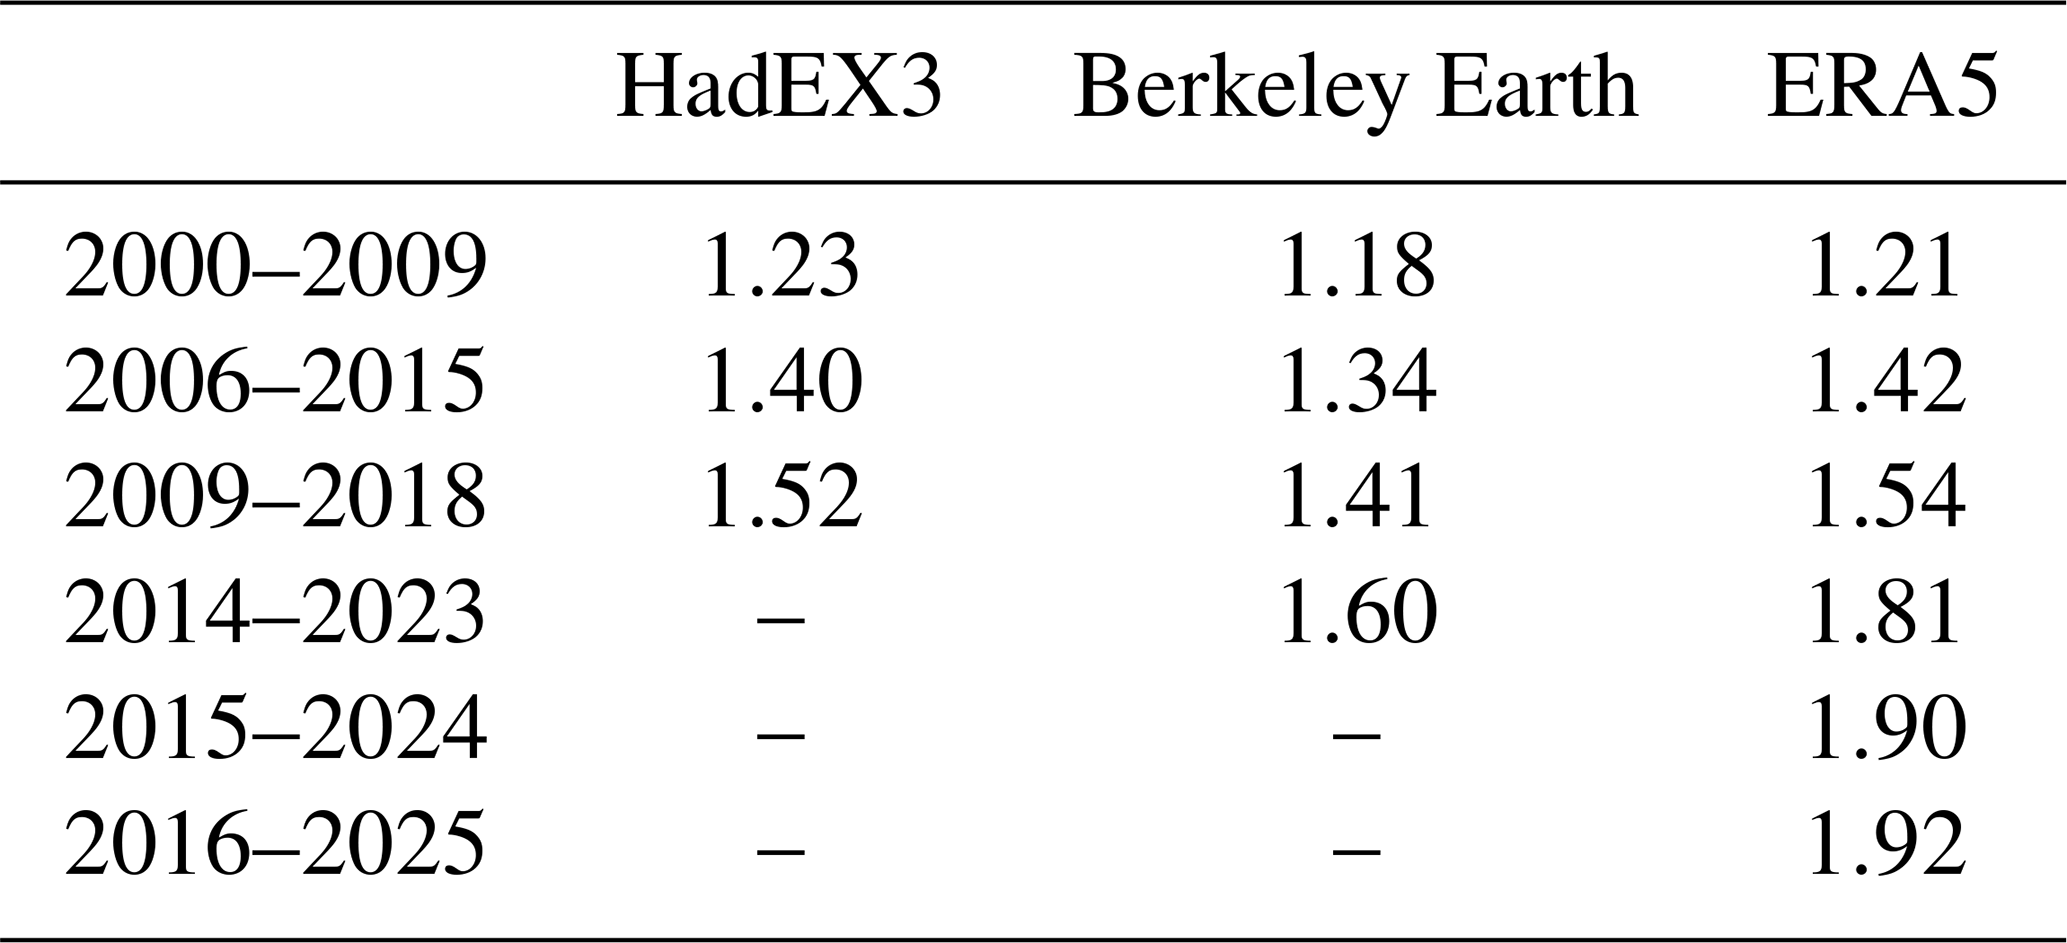
10.2 Marine heatwave days
We include, for the first time, an updated assessment of global marine heatwaves (MHWs) since AR6. MHWs can have detrimental impacts on marine ecosystems and socio-economic systems (Hughes et al., 2017; Frölicher and Laufkötter, 2018; Smale et al., 2019; Smith et al., 2021b; Cheung et al., 2021; Smith et al., 2023; Wernberg et al., 2025), influence air-sea carbon exchange (Li et al., 2024; Müller et al., 2025), impact marine biological productivity, acidity and oxygen levels (Le Grix et al., 2021; Burger et al., 2022; Gruber et al., 2021), and influence extreme weather over land (Hu, 2021; Berthou et al., 2024).
The SROCC reported with high confidence that MHW days approximately doubled between 1982 and 2016 (Collins et al., 2019; Frölicher et al., 2018). Over the same period, MHW intensity increased by about 0.04 °C per decade and the spatial extent of MHW conditions increased by about 19 % per decade (Frölicher et al., 2018). The number of annual MHW days also increased by 54 % during 1987–2016 relative to 1925–1954 (Oliver et al., 2018). With further evidence, the AR6 assessed with high confidence that MHWs have increased in frequency over the 20th century, with an approximate doubling from 1982 to 2016, and medium confidence that they have become more intense and longer since the 1980s (Fox-Kemper et al., 2021).
Based on the AR6 and SROCC approach, MHWs here are defined at each ocean grid cell as days when the deseasonalized SST exceeds the local daily 99th percentile within an 11 d moving window relative to a climatological baseline (i.e., 1985–2014) (Fox-Kemper et al., 2021; Collins et al., 2019). Annual MHW days are then calculated at each grid cell and spatially averaged to produce a global mean annual MHW day metric. We consider MHWs only between 60° S and 60° N, as their identification in polar regions is more challenging than at lower latitudes due to seasonal-to-interannual variability in sea-ice cover, which hampers the calculation of consistent climatologies and percentile-based thresholds. Four datasets spanning up to 2025 were analysed: NOAA's Optimum Interpolation SST (OISST; Huang et al., 2021), the Operational SST and Sea Ice Analysis (OSTIA; Donlon et al., 2012), the fifth-generation ECMWF atmospheric reanalysis (ERA5; Hersbach et al., 2020), and NOAA's Coral Reef Watch daily 5 km SST product (CRW; Liu et al., 2014). Spatial maps of the number of MHW days from each of these datasets are included in the Supplement, Fig. S16.
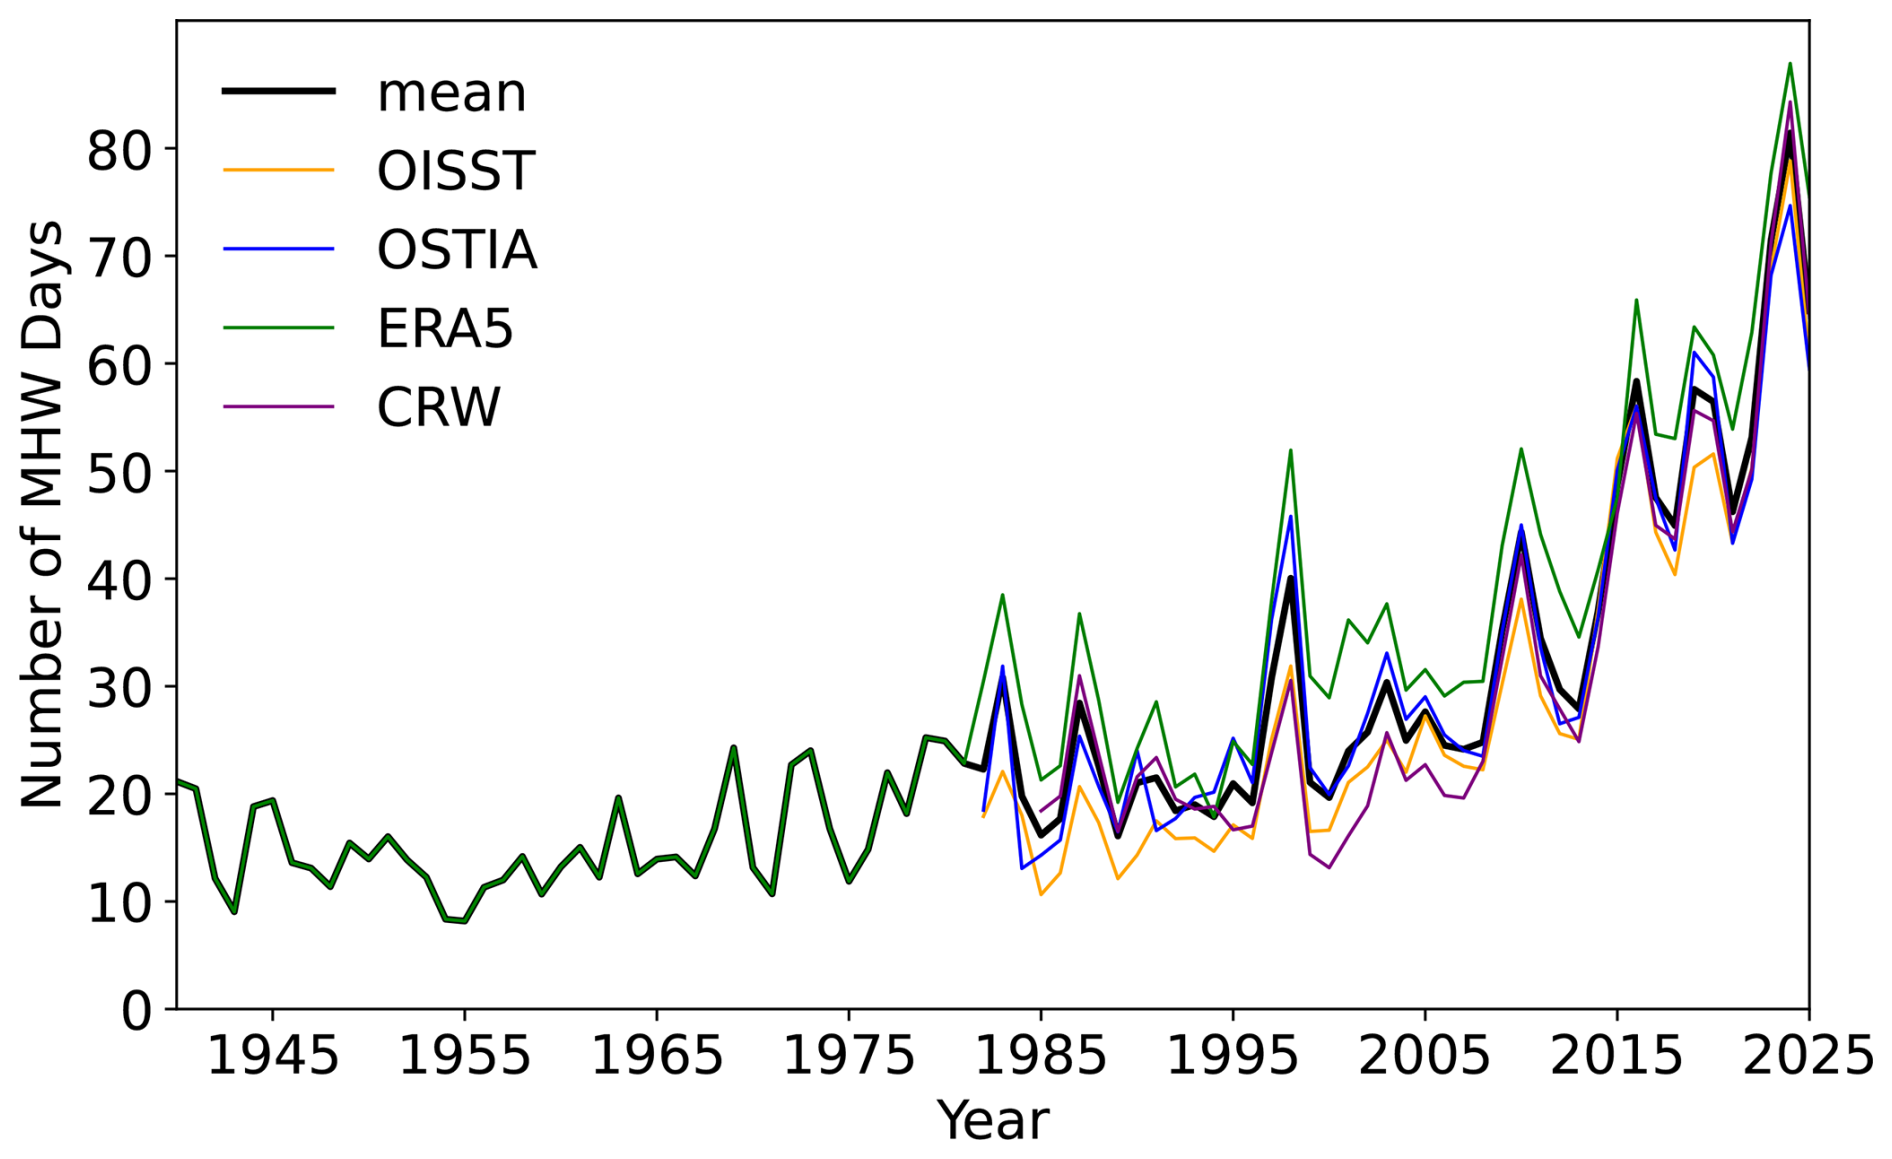
Figure 12Global mean annual number of marine heatwave (MHW) days from ERA5 (1940–2025), OISST (1982–2025), OSTIA (1982–2025), and CRW (1985–2025), and the mean of these shown in black. MHWs are identified at each grid cell as days exceeding the 99th percentile of deseasonalized SST anomalies, calculated using an 11 d moving window and a 1985–2014 climatology. An offset relative to the 1850–1900 baseline (using ERSST v6; Huang et al., 2025) was added to data to scale the results to the preindustrial level (see Supplement, Fig. S15). Annual MHW day counts are then calculated at each grid cell and spatially averaged to produce the global mean.
All four datasets show a consistent and pronounced increase in the number of MHW days beginning in the early 1980s, coincident with strong ocean warming (Fig. 12). The satellite-based products (OISST, OSTIA, and CRW) start in the early 1980s, while the reanalysis product ERA5 extends the record back to the 1940s and exhibits similar variability during the pre-satellite era, when the warming trend was smaller. Interannual peaks are evident throughout the record, with several prominent maxima aligning with strong El Niño events (e.g., 1982–1983, 1987–1988, 1997–1998, 2015–2016, and 2023–2024), which are known to enhance the occurrence of MHWs (Gregory et al., 2024; Holbrook et al., 2020). The upward trend intensifies in the most recent decade, culminating in a maximum mean of 82 MHW days in 2024. The global mean annual numbers of MHWs increased by approximately 60 % during the latest decade 2016–2025 (58 d) compared with the previous decade 2007–2016 (36 d) (Table 10). The global mean annual numbers of MHWs averaged over all four products were 70, 82, and 65 d in 2023, 2024, and 2025, respectively (Supplement, Fig. S15).
In summary, evidence accumulated since the AR6 assessment further indicates that MHWs are becoming more frequent, consistent with the ongoing warming of the ocean surface. Compared to the doubling between 1982 and 2016, MHW days more than tripled between 1991 and 2025 (Supplement, Table S12).
Table 10Global mean annual number of MHW days from OISST, OSTIA, ERA5, CRW, and their mean.
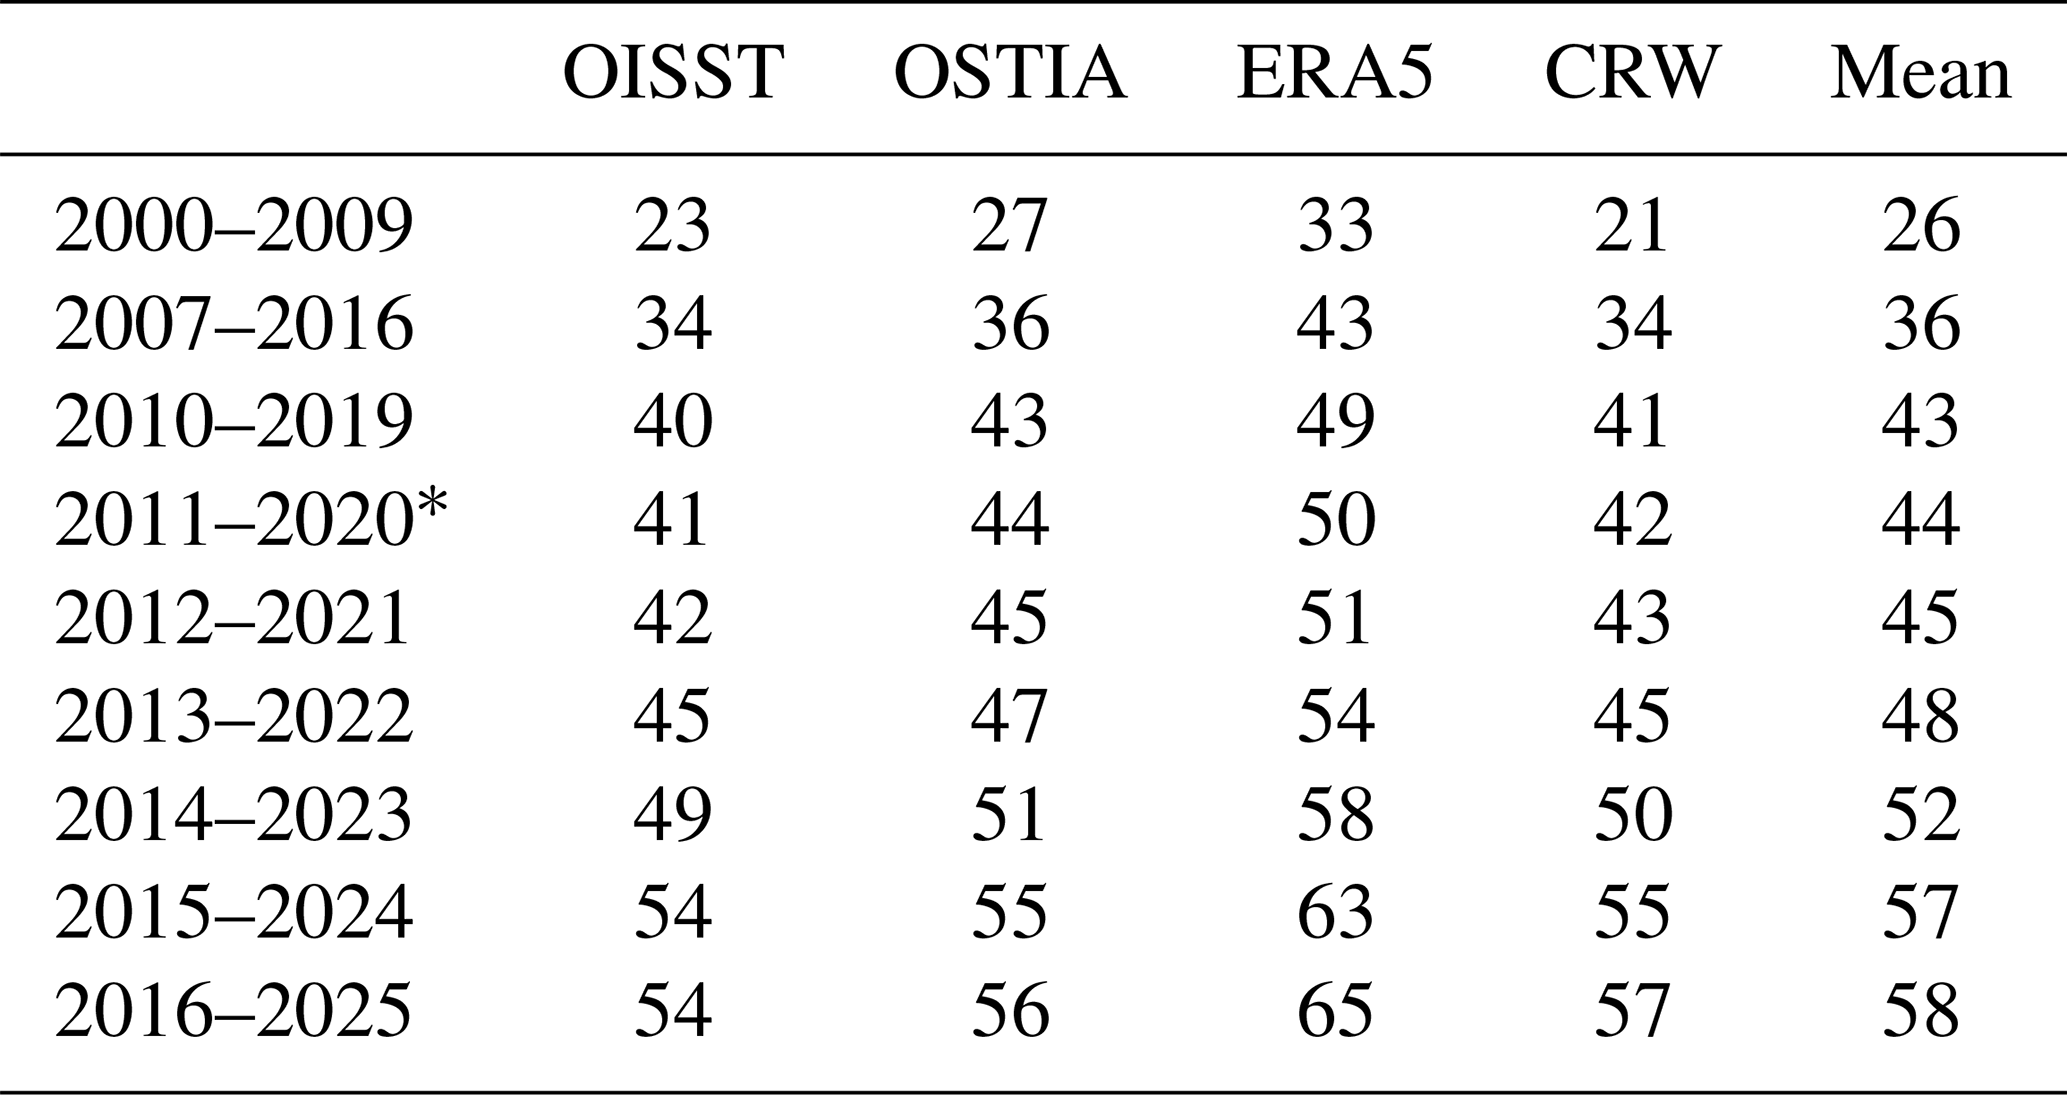
* Latest decade for some indicators in AR6.
As one of the large-scale indicators of climate change with great societal relevance, AR6 assessed that global land precipitation has likely increased since the middle of the 20th century with a faster increase since the 1980s with large interannual variability and regional heterogeneity (Gulev et al., 2021; Douville et al., 2021). The observed Northern Hemispheric land summer monsoon precipitation experienced a significant decline during 1901–2014, which has been attributed to the dominant influence of anthropogenic aerosols (Cao et al., 2022).
Figure 13 updates annual global land precipitation anomaly relative to 1991–2020 shown in Forster et al. (2025), originally based on Fig. 2.15c in AR6 WGI (Gulev et al., 2021). The datasets used are from GPCC V2020 (Schamm et al., 2014), CRU TS 4.09 (Harris et al., 2020), GPCP V.2.3 (Adler et al., 2018), and GHCN V4 (Menne et al., 2018) observed datasets. There is little consistency among datasets due to differences in input data, completeness of records, periods covered, and the gridding procedures applied (Sun et al., 2018; Nogueira, 2020; Yate and Ren, 2025). Su et al. (2026) highlighted important gaps in global precipitation monitoring, indicating that only 13.4 % of the global land surface meets the World Meteorological Organization requirements for annual precipitation monitoring at present.
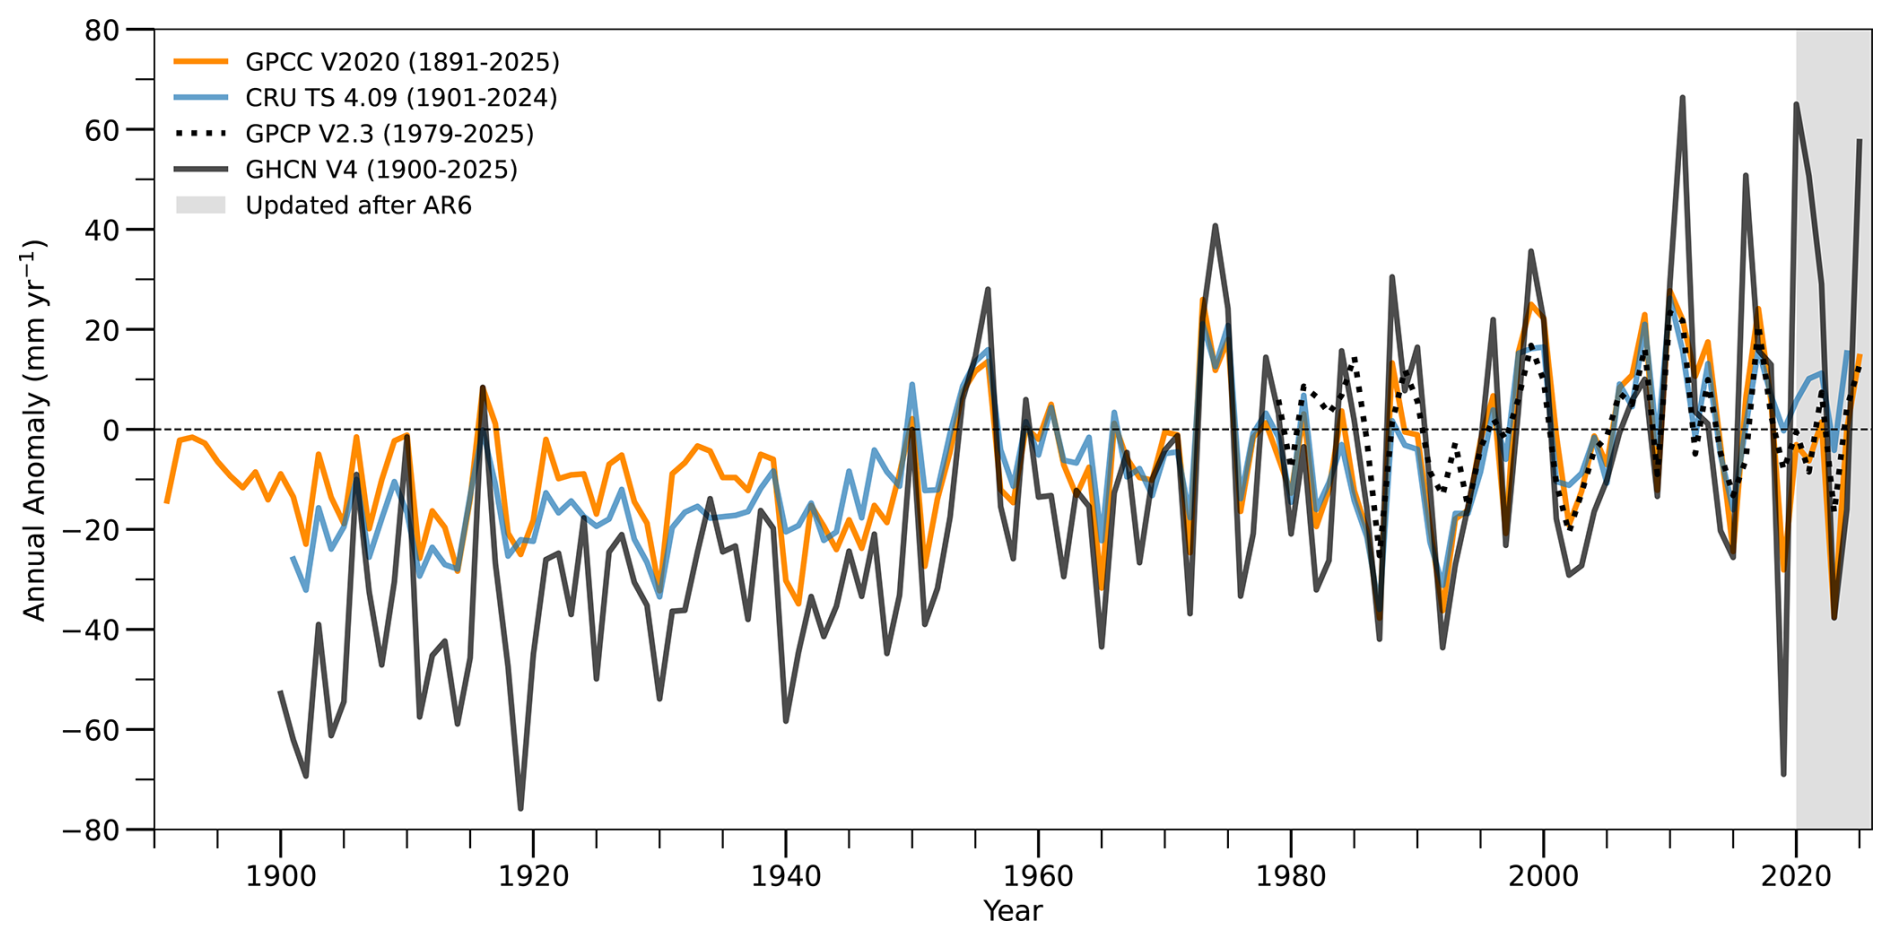
Figure 13Time series of annual global land precipitation (mm yr−1) from 1891 to date relative to a 1991–2020 climatology obtained from GPCP V2020, CRU TS 4.09, GPCP V2.3, and GHCN V4 (note that different products commence at distinct times). Annual global land precipitation for each observed data is estimated following the AR6 method except the period of climatology and updated from 2020 to 2025. In AR6, the reference period of the climatology was from 1981 to 2010.
While the globally averaged land surface specific humidity has continuously increased (Dunn et al., 2024), global land precipitation has exhibited considerable interannual to interdecadal variability (Fig. 13). Zhang et al. (2024b) suggested that precipitation variability over 75 % of land area has already increased over the past century, driven mainly by anthropogenic warming-induced atmospheric moistening. In 2025, all datasets show a larger positive anomaly in global land precipitation than in 2024. Enhanced rainfall is observed over Asia and the Maritime Continent, likely linked to La Niña conditions, as well as over Siberia and southern Africa. The pronounced rainfall deficit over central South America during 2023–2024 was markedly reduced in 2025. In contrast, wet conditions have persisted over the Arctic and much of the Siberian region from 2023 to 2025 (Supplement, Fig. S17).
Global mean sea-level (GMSL) rise is primarily driven by: (i) thermal expansion as the ocean warms; and (ii) increases in ocean mass associated with the addition of water or ice from land-based reservoirs, including glaciers and ice sheets (Fox-Kemper et al., 2021). Most of these processes are directly linked to changes in the global Earth energy inventory (Sect. 6). Sea-level rise can have large consequences for coastal ecosystems, safety and management, as it increases the baseline for sea-level extremes arising from short-term phenomena such as storm surges, waves and tides.
The observed total GMSL change was assessed in AR6 WG1, in Chap. 2 (their Sect. 2.3.3.3, Gulev et al., 2021) and Chap. 9 (their Sect. 9.6.1 and Cross-Chapter Box 9.1, Fox-Kemper et al., 2021) on the basis of tide gauge reconstructions (up to 1993) and satellite altimeter observations (1993–2018). AR6 concluded that GMSL increased by 0.20 [0.15 to 0.25] m over the period 1901 to 2018, with a rate of 1.73 [1.28 to 2.17] mm yr−1 (high confidence). Periods closer to the present showed an accelerating GMSL, with a rate of 2.3 [1.6 to 3.1] mm yr−1 over the period 1971–2018 increasing to 3.7 [3.2 to 4.2] mm yr−1 over the period 2006–2018 (high confidence).
Forster et al. (2025) included an extension of the AR6 GMSL time series from 2019 up to the end of 2024 using three out of the six satellite data products from the WCRP estimate used in AR6: NASA (NASA, 2025), NOAA (NOAA, 2025) and AVISO (AVISO, 2025). This year, we update the GMSL time series to the end of 2025, and replace the entire satellite part of the GMSL time series (from 1993 onwards) using three satellite products that have been updated at the time of writing: AVISO (downloaded 11 February 2026), NASA (downloaded 11 March 2026) and the University of Colorado (downloaded 13 February 2026). By updating the entire satellite altimetry period there is consistency across the altimetry record for the type of corrections that are performed, and this approach ensures that the satellite record represents the state-of-the-art. We use the global mean time series based on the reference missions, with seasonal signals removed and corrected for glacial isostatic adjustment. We first compute annual averages and then an ensemble average time series, which is spliced to the AR6 GMSL TG record ending in 1993. For comparison to the AR6 tide gauge ensemble, we show three new tide gauge reconstructions over the 20th century in Fig. 14: Dangendorf et al. (2024), Wang et al. (2024) and Mu et al. (2025).
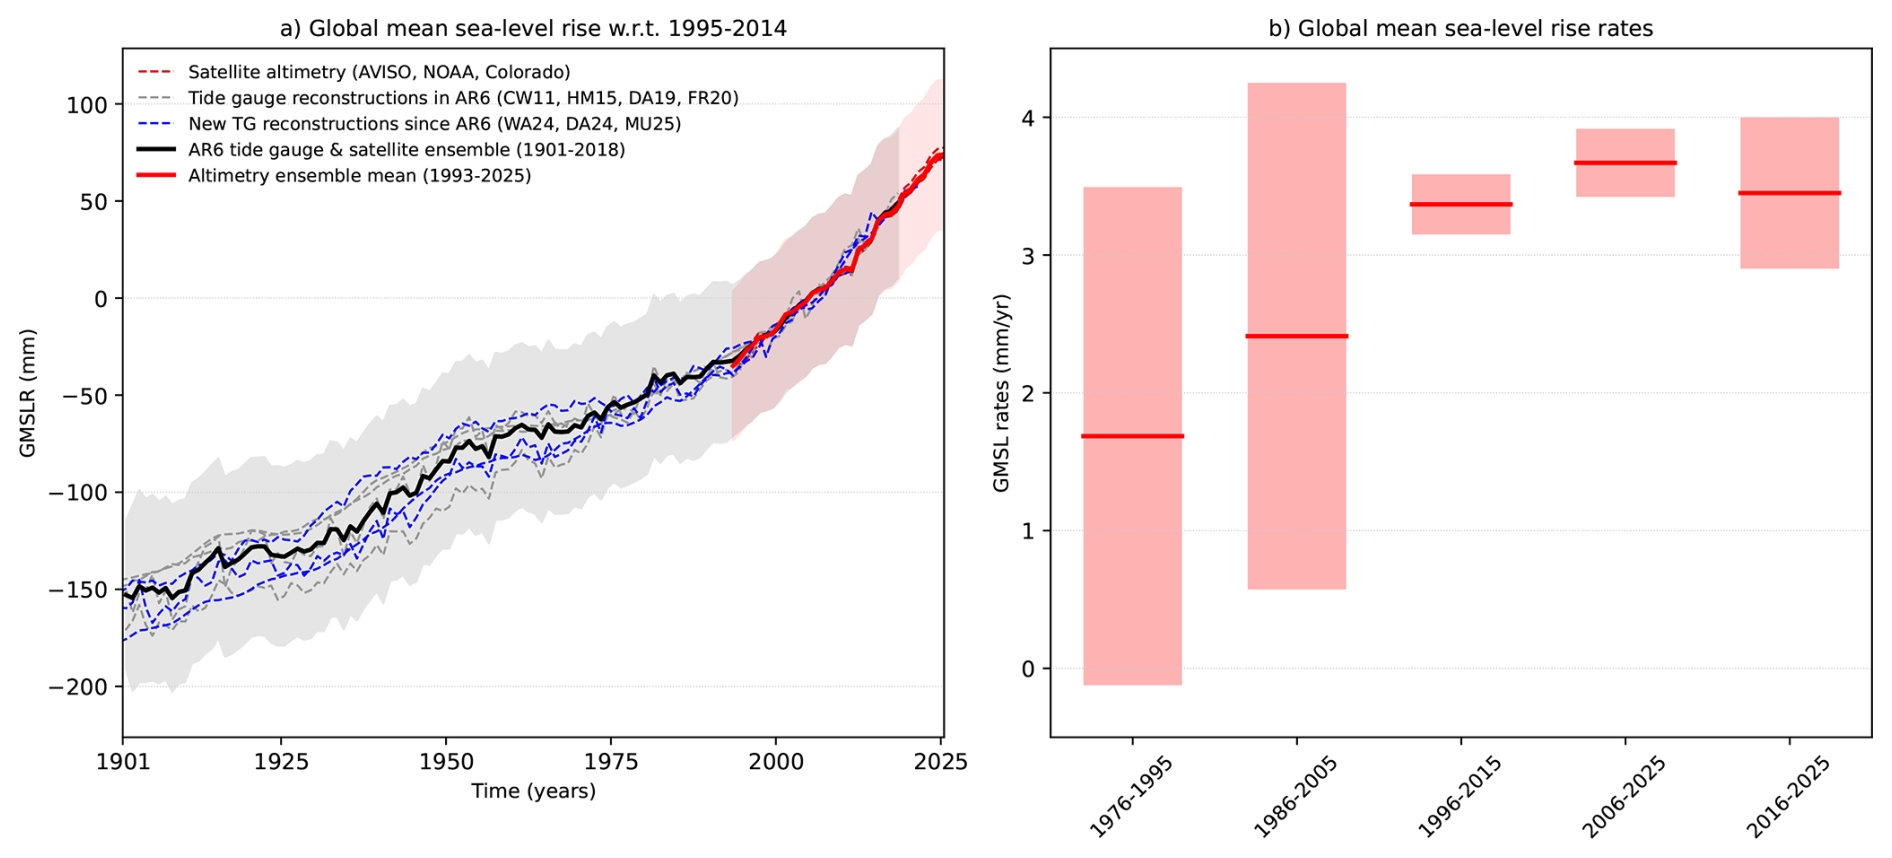
Figure 14(a) Global mean sea-level rise time series 1901–2025 (mm) w.r.t. 1995–2014. The GMSLR ensemble from AR6 in black; the updated satellite altimetry ensemble in red. Uncertainties represent the 1σ range, computed relative to 1901, including estimates of both structural uncertainty and parametric uncertainty (Palmer et al., 2021). Individual time series shown with dashed lines, with reconstructions available for AR6 in grey (Church and White, 2011; Hay et al., 2015; Dangendorf et al., 2019; Frederikse et al., 2020) and new reconstructions in blue (Dangendorf et al., 2024; Wang et al., 2024; Mu et al., 2025). (b) Global mean sea-level rates (mm yr−1) for four successive overlapping 20-year periods and the most recent decade, uncertainties indicating the very likely range.
Over the period 1901 to 2025, we find that GMSL has increased by 229.6 [178.6 to 280.6] mm, with an average rate of 1.85 [1.44 to 2.26] mm yr−1 (Table 11, Fig. 14). For the post-AR6 period (2018–2025), the observed rise is 26.9 [21.1 to 32.7] mm with an average rate of 3.84 [3.01 to 4.67] mm yr−1. Compared to Forster et al. (2025), the different satellite ensemble (replacing NOAA by University of Colorado) results in an addition of 0.3 mm to the estimates over 2018–2024. Variations in the year-to-year changes occur throughout the GMSL time series as a result of internal climate variability (Fig. 13a). In this case, the small GMSL change of 0.4 mm from 2024 to 2025 has been attributed to last years' transition from El Niño to weak La Niña conditions which affected precipitation patterns (WMO, 2026). To reduce the impact of year-to-year variations on the climatic signal, sea-level trends are typically computed over longer (at least decadal) periods (Fig. 14b, Table 11). When comparing 20-year averaged rates, GMSL has accelerated from 1.69 ± 1.81 mm yr−1 in 1976–1995 to 3.37 ± 2.19 mm yr−1 in 1996–2015 and to 3.67 ± 2.47 mm yr−1 in 2006–2025 (Fig. 14b). This finding is in line with the assessments of AR6 (Fox-Kemper et al., 2021), SROCC (Oppenheimer et al., 2019) and AR5 (Church et al., 2013) that sea-level change has been accelerating over the course of the 20th and early 21st centuries, and consistent with the observed acceleration in some components of the Earth heat inventory (see Sect. 6).
Table 11Observed global mean sea-level rise (GMSLR), comparing the extended time series in this study to IPCC AR6 (Table 9.5, Fox-Kemper et al., 2021) and to Forster et al. (2025). Values are expressed as the total change (Δ) in the annual mean over each period (mm) along with the equivalent rate calculated as the total change divided by the number of years (mm yr−1). Uncertainties represent the very likely range.
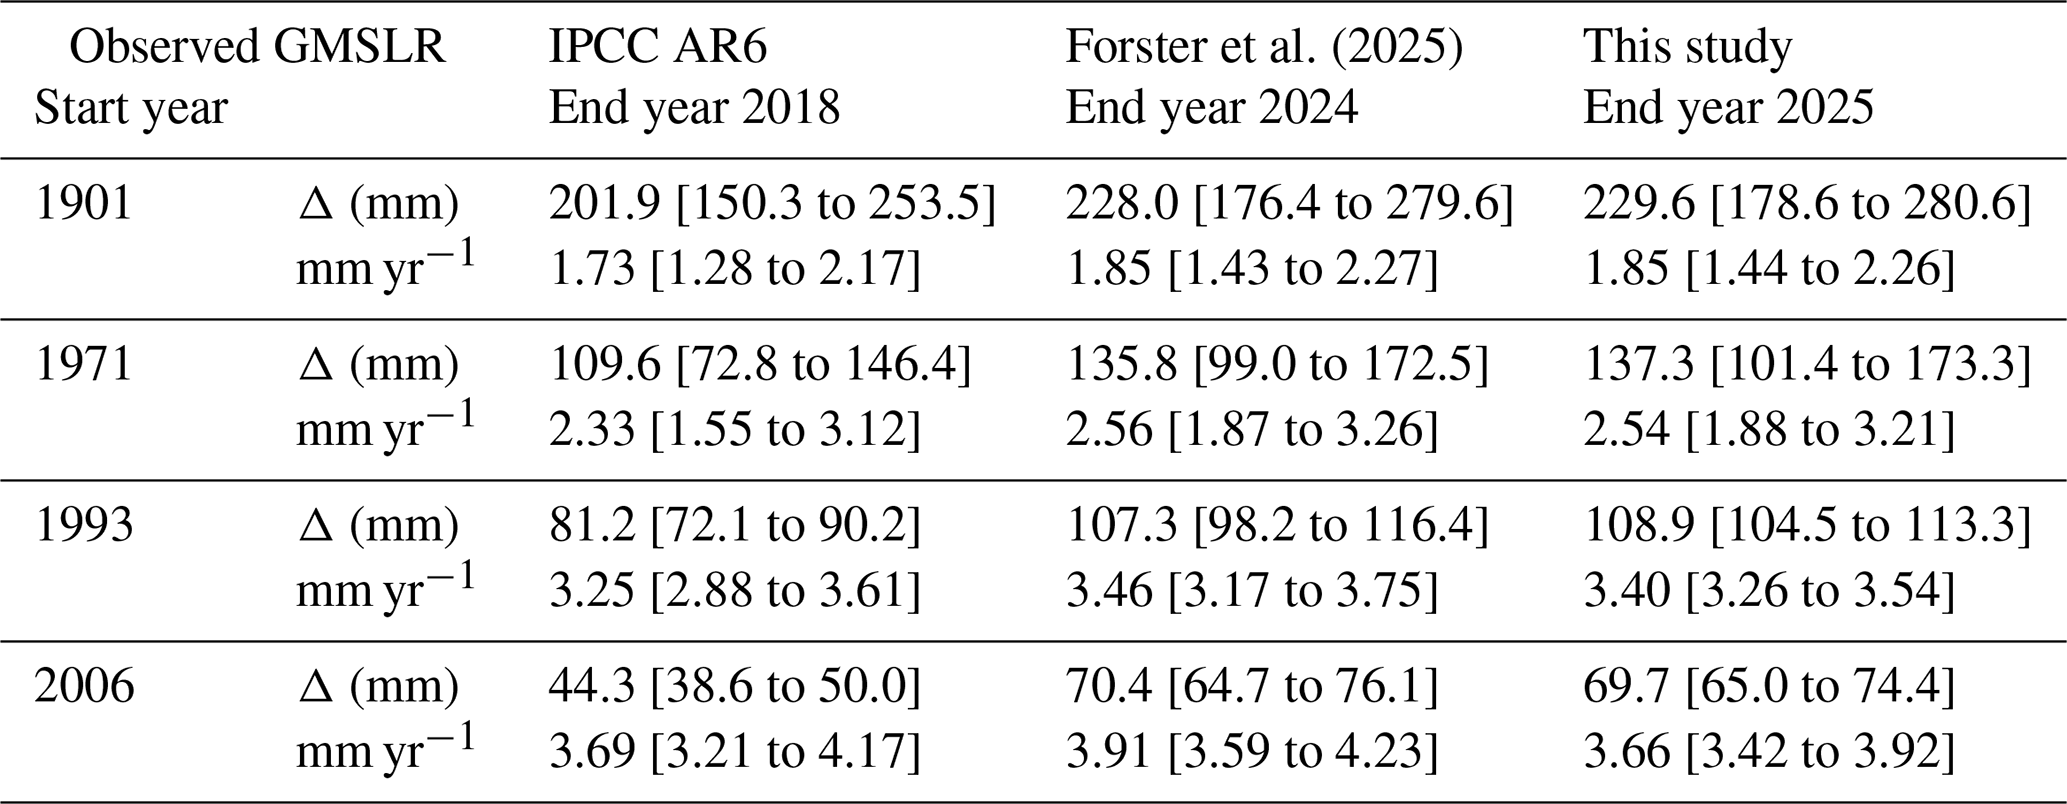
IGCC will deliver an operational, annually updated suite of Indicators of Global Climate Change available through the Copernicus Climate Data Store (CDS), accompanied by communication and outreach platforms that provide timely, trusted and readily accessible evidence for consumers of climate data.
A main feature will be a new data dashboard, currently in development, designed for broad accessibility, and leveraging the software tools and infrastructure of the CDS to facilitate access to the indicators by a less technical audience. This will ensure that IGCC, and the scientific evidence that it provides, is associated with an established and robust service that can reach a wider range of users with free, open-access climate data and tools.
Working within the Copernicus Climate Change Service (C3S) ecosystem, including via the CDS, we aim to consolidate the position of IGCC as a trusted source of authoritative climate information, strengthen its contribution to international policy and assessment processes, and facilitate ways to reach a far wider audience than IGCC can achieve working alone. This includes but is not limited to policymakers involved in UNFCCC negotiations, and decision makers working in climate change mitigation and adaptation.
The carbon budget calculation is available from https://github.com/Rlamboll/AR6CarbonBudgetCalc/releases/tag/RCB2025-v1 (Lamboll and Rogelj, 2026). The code and data used to produce other indicators are available in repositories under https://github.com/ClimateIndicator/data/tree/v2026.06.02 (Smith et al., 2026b). All data are available from https://doi.org/10.5281/zenodo.20499280 (Smith et al., 2026a). Data are provided under the CC-BY 4.0 License.
HadEX3 [3.0.4] data were obtained from https://doi.org/10.5285/115d5e4ebf7148ec941423ec86fa9f26 (Dunn et al., 2023) on 5 May 2024 and are © British Crown Copyright, Met Office, 2022, provided under an Open Government Licence; http://www.nationalarchives.gov.uk/doc/open-government-licence/version/2/ (last access: 2 June 2026).
Table 12 lists the main global observational and inventory datasets used to produce the indicators.
Table 12Observations and datasets utilised in producing this year's key indicators of global climate change.
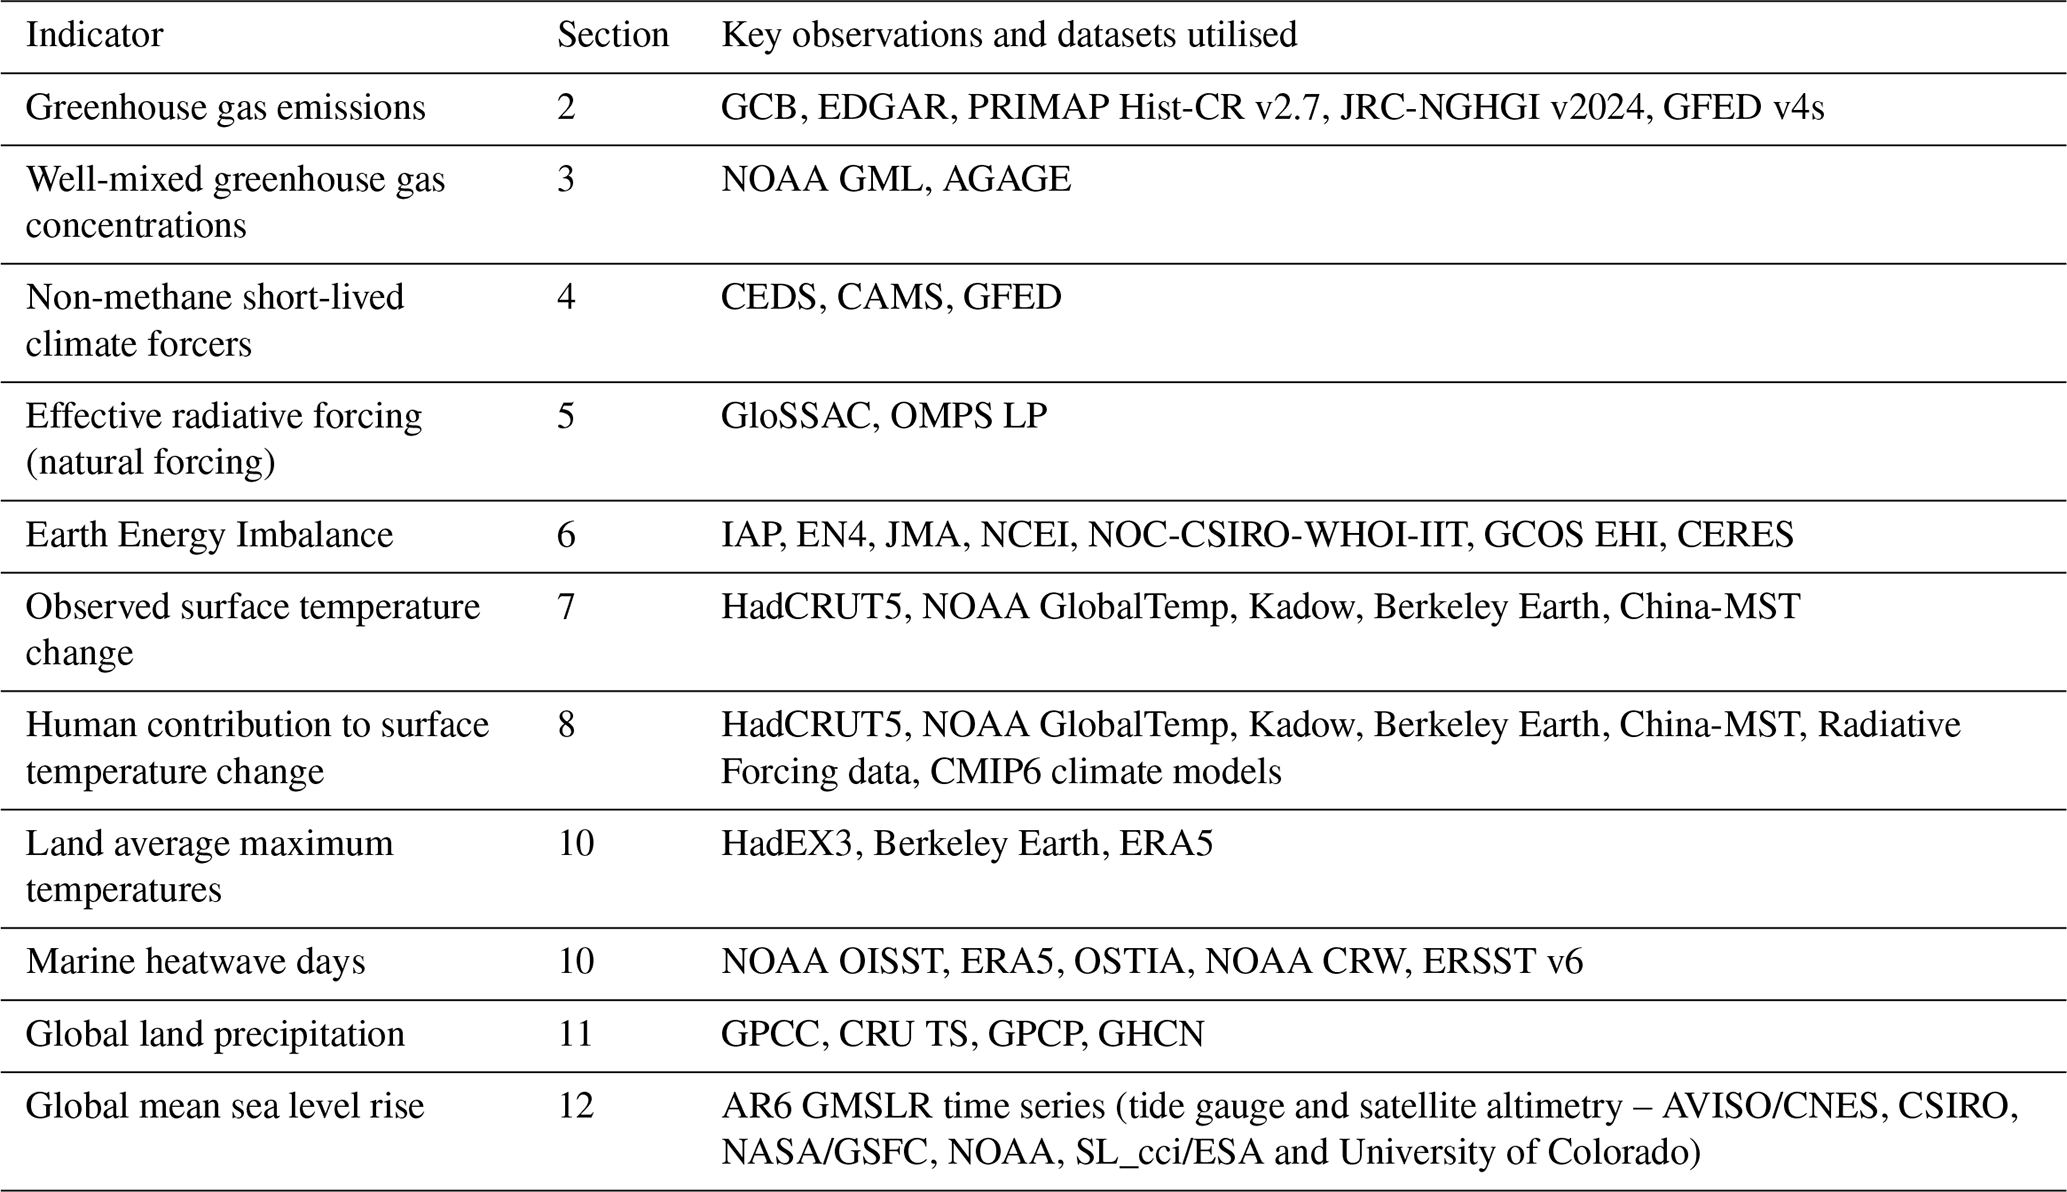
The fourth year of the Indicators of Global Climate Change (IGCC) initiative has built on previous years' efforts to provide a comprehensive update of the climate change indicators required to estimate the human-induced warming and the remaining carbon budget. Table 13 and Fig. 15 present a summary of the headline indicators from each section compared to those given in the AR6 assessment. Table 13 also summarises methodological updates.
Table 13Summary of headline results and methodological updates from the Indicators of Global Climate Change (IGCC) initiative.
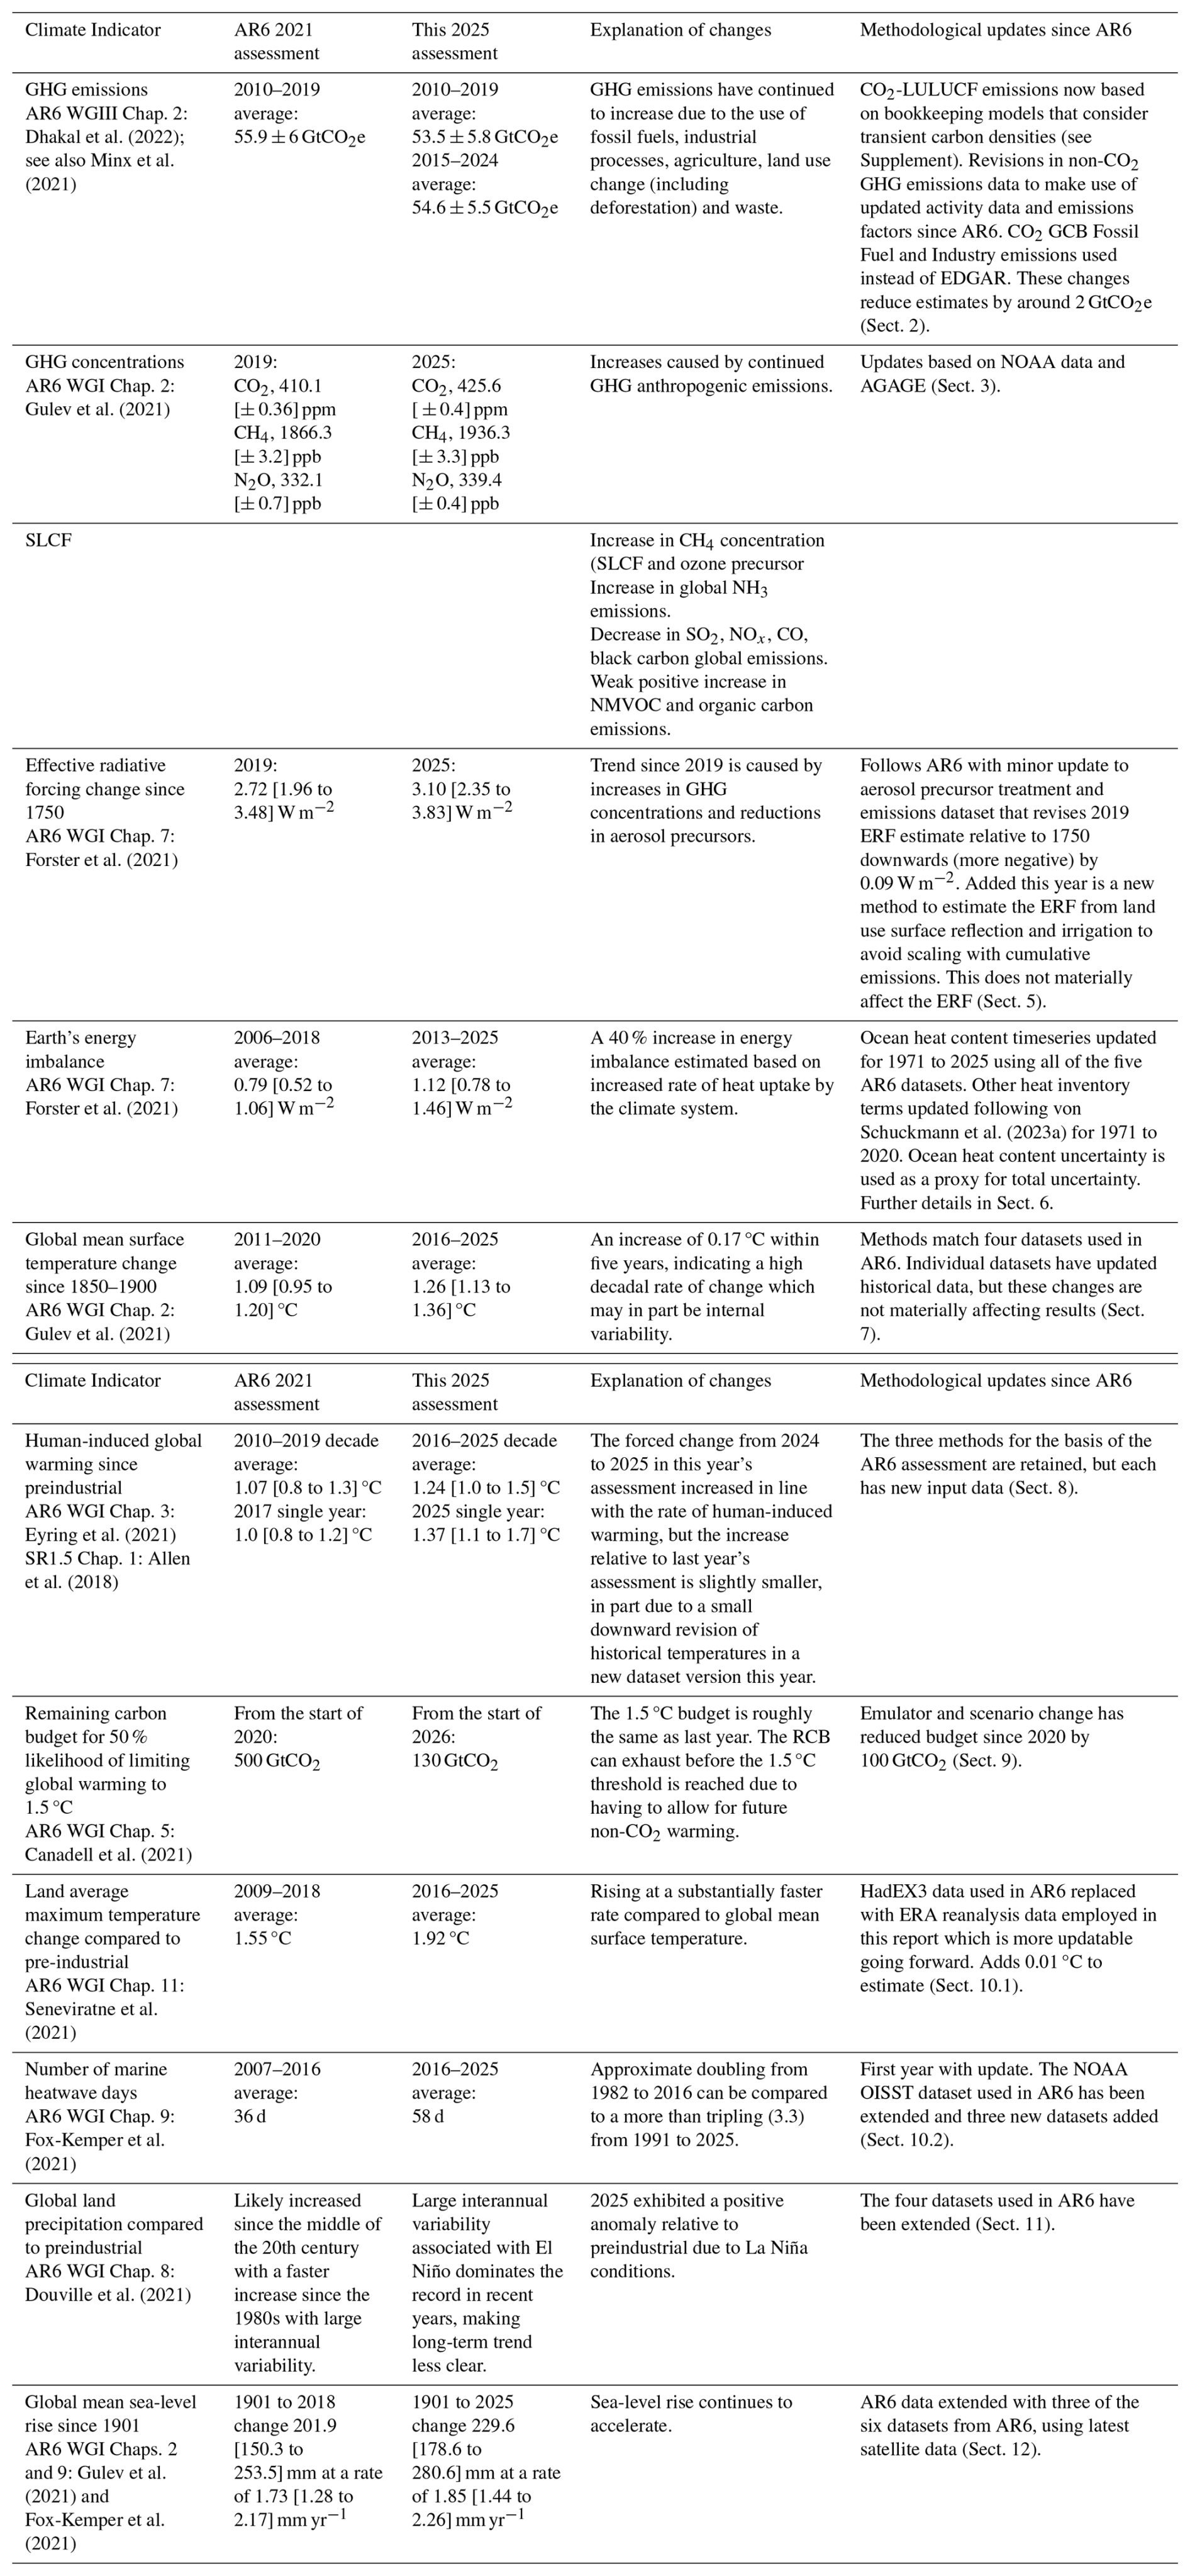
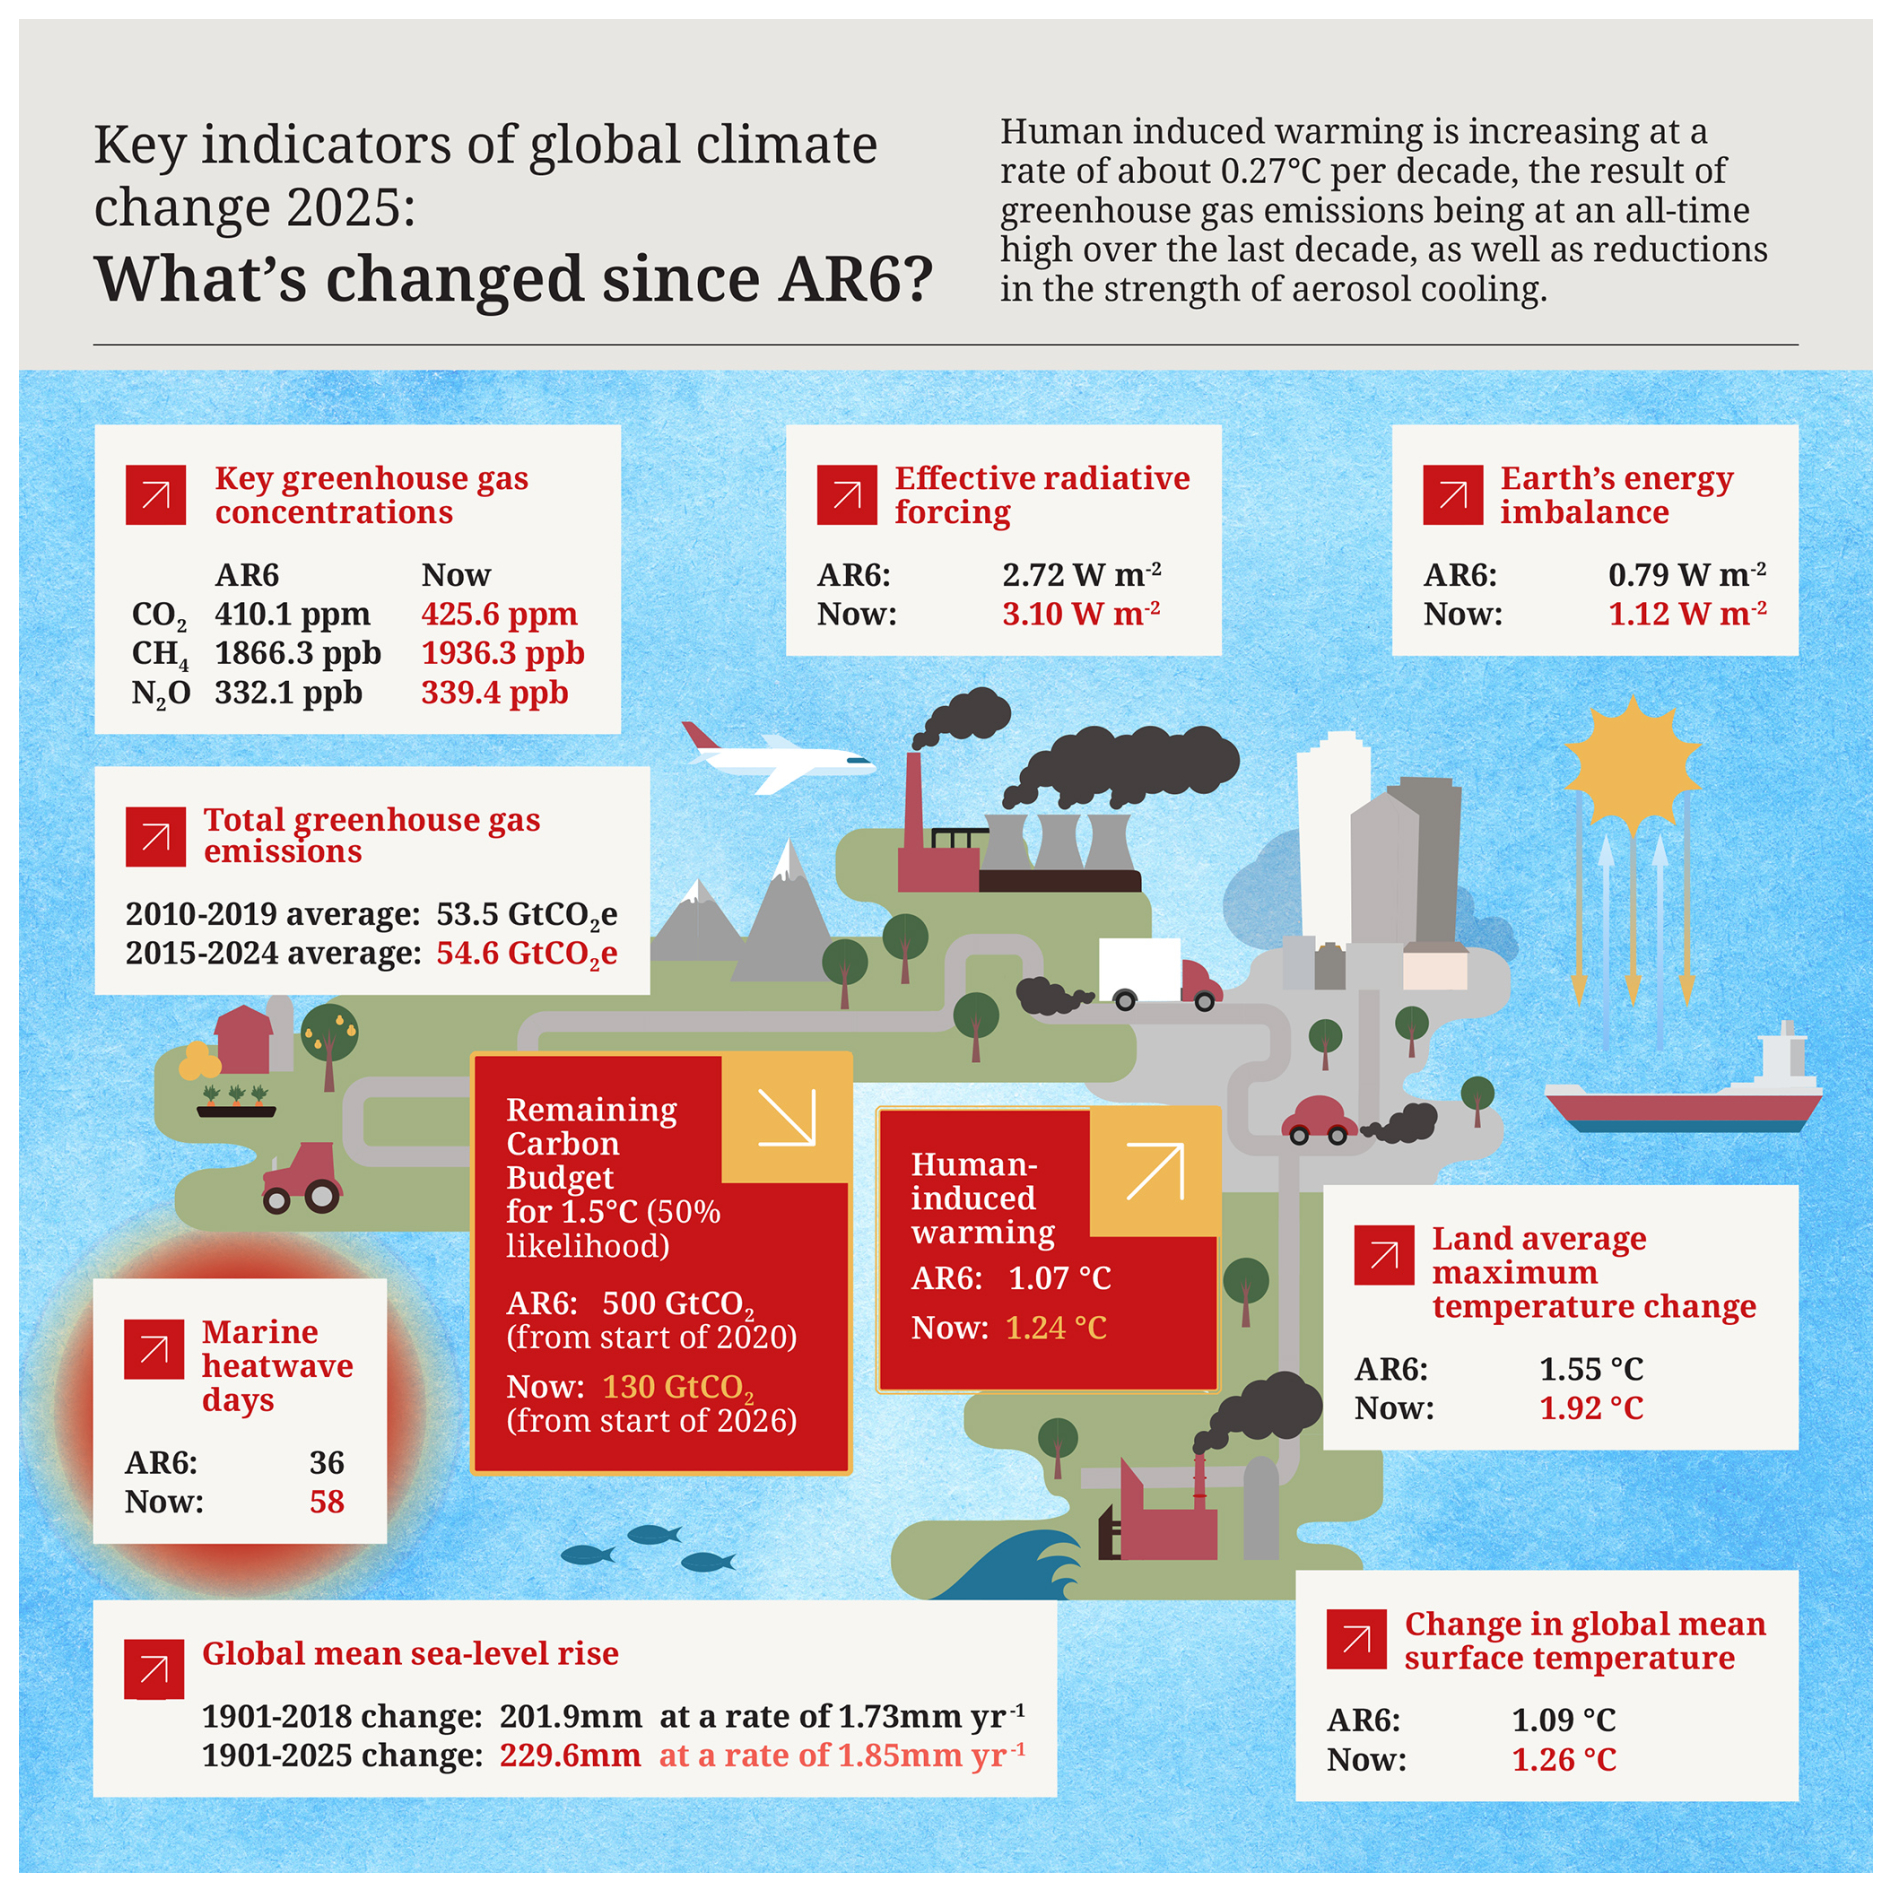
In spite of the increasing deployment of renewable energy, GHG emissions are at an all-time high, reaching 56.8 ± 5.5 GtCO2e in 2024 (Sect. 2). However, these emissions are no longer rapidly increasing, leading to a steady rise in the atmospheric concentrations of the major greenhouse gases (Sect. 3). This, combined with a reduction in aerosol cooling (Sect. 4), has caused a 0.38 W m−2 (14 %) increase in the level of radiative forcing in the six year period since AR6 (Sect. 5, Table 13, Fig. 15). This increase in forcing would be expected to increase the Earth's Energy Imbalance (EEI) (Sect. 6). Theory and physical laws would suggest that as the Earth's temperature has warmed in response to the forcing, the increase in EEI should be less than the increase in radiative forcing, which fits with the best estimate of EEI change: 0.33 [0.0 to 0.65] W m−2, although the time periods do not exactly match. Nevertheless, the EEI trend is higher than expected (a 40 % increase in EEI since AR6). This is an area of very active research and observational errors, an underestimate of the positive aerosol forcing trend, a higher than expected climate sensitivity or cloud regime changes are all under investigation (Sect. 6).
Although reasons for the magnitude of EEI trend are under investigation a positive trend is expected and clear signs of accelerated planetary warming, comparing the previous decades with earlier decades. Trends in other indicators from sea-level (Sect. 12) rise and temperature extremes (Sect. 10) support evidence of this acceleration. Marine heatwave days, a new indicator for this update, has tripled since 1991 (Sect. 10.2, Table 10). The pace of human-induced warming remains at its all-time high in the instrumental record (Sect. 8).
Generally, scientists and scientific organisations have an important role as “watchdogs” to critically inform evidence-based decision-making. This annual update and the complementary updates of the State of the Climate (BAMS) and State of Global Climate (WMO) report critically depend on continued support for high quality global monitoring networks of climate data, and also on open globally aggregated data sources that are regularly updated and easily accessed. In total, we employ analysis from over 40 global datasets (Table 12). The data and coordination activities underpinning these are increasingly threatened by funding choices and geopolitical decisions (Karl et al., 2026).
Several envisaged satellite programs are threatened including key U.S. missions. In-situ programs in many countries have diminished, particularly weather balloon data, with potential real-world consequences for lives and livelihoods (Freedman, 2025). Much of the ocean observing system relies upon project funding which is highly insecure, imperilling our ability to monitor and understand key diagnostics including EEI as recently investigated and quantified by Zhu et al. (2026).
The preservation of historical holdings is also under threat with many data centres being cut either partially or fully. Yet these historical data are a common good – the cornerstone not just of today's science to advance understanding and inform society but the science that will be undertaken by future generations who need access to the original observational records. In the same way that today's scientists rightly view the state of the art datasets of the early 1990s as dated, scientists in 2060 will not be using current datasets. However, without assuring continued access to the original holdings those scientists will be unable to revisit decisions made today. The original raw records truly are forever.
The Global Climate Observing System (GCOS) program which directly supports much of our international capability is also under threat. The World Meteorological Organization which performs a vital function of coordination to enable not just climate monitoring but global weather forecasting capabilities has seen funding diminished. The World Climate Research Programme (WCRP) has also seen its funding approximately halved. These international organisations enable coordination, ensure the sharing of key data and the comparability of measurement systems. It is vital that they be protected and their missions continue.
To illustrate the precarity of the moment, the GCOS program is in the process of preparing a report assessing the adequacy of the observing system for climate – this will be delivered to UNFCCC in early 2027 alongside a high priority action plan to directly inform the next global stocktake. As a first step an assessment was undertaken by the GCOS panels and invited experts at a joint panel meeting in Harwell, UK in February 2026 (see Supplement, Table S13) using a structured expert elicitation process (Table 14). This has served to highlight that many components of the observing system are under considerable threat, including key aspects such as measurements of the top-of-atmosphere radiation budget and ocean heat content that are critical to continued monitoring of the indicators presented herein.
Table 14Initial expert assessment of the stability of Essential Climate Variables (ECVs) undertaken by the GCOS panels and invited experts. The first column denotes the subset of the 55 ECVs of direct relevance to the indicators used herein. The second column considers whether the ECV as a whole is prone to a single point of failure (green = no; yellow = significant component; red = entire ECV). The third column denotes funding levels compared to 2022 (white = no change; green = better; yellow = slightly degraded; red = worse). The fourth column denotes funding stability foreseen over the next 5 years (green = stable; yellow = concern; red = not secured). The fourth column denotes funding stability compared to 2022 (white = no change; green = better; yellow = slightly degraded; red = worse). The final column considers specific components of the observing system under threat (green = none identified; yellow = important component under threat; red = critical components under threat which will substantively harm our ability to monitor the ECV globally). Explanations are generally given in brief in cells marked in yellow and red where helpful to aid understanding. The forthcoming GCOS Status Report will include an analysis for the full 55 ECVs.
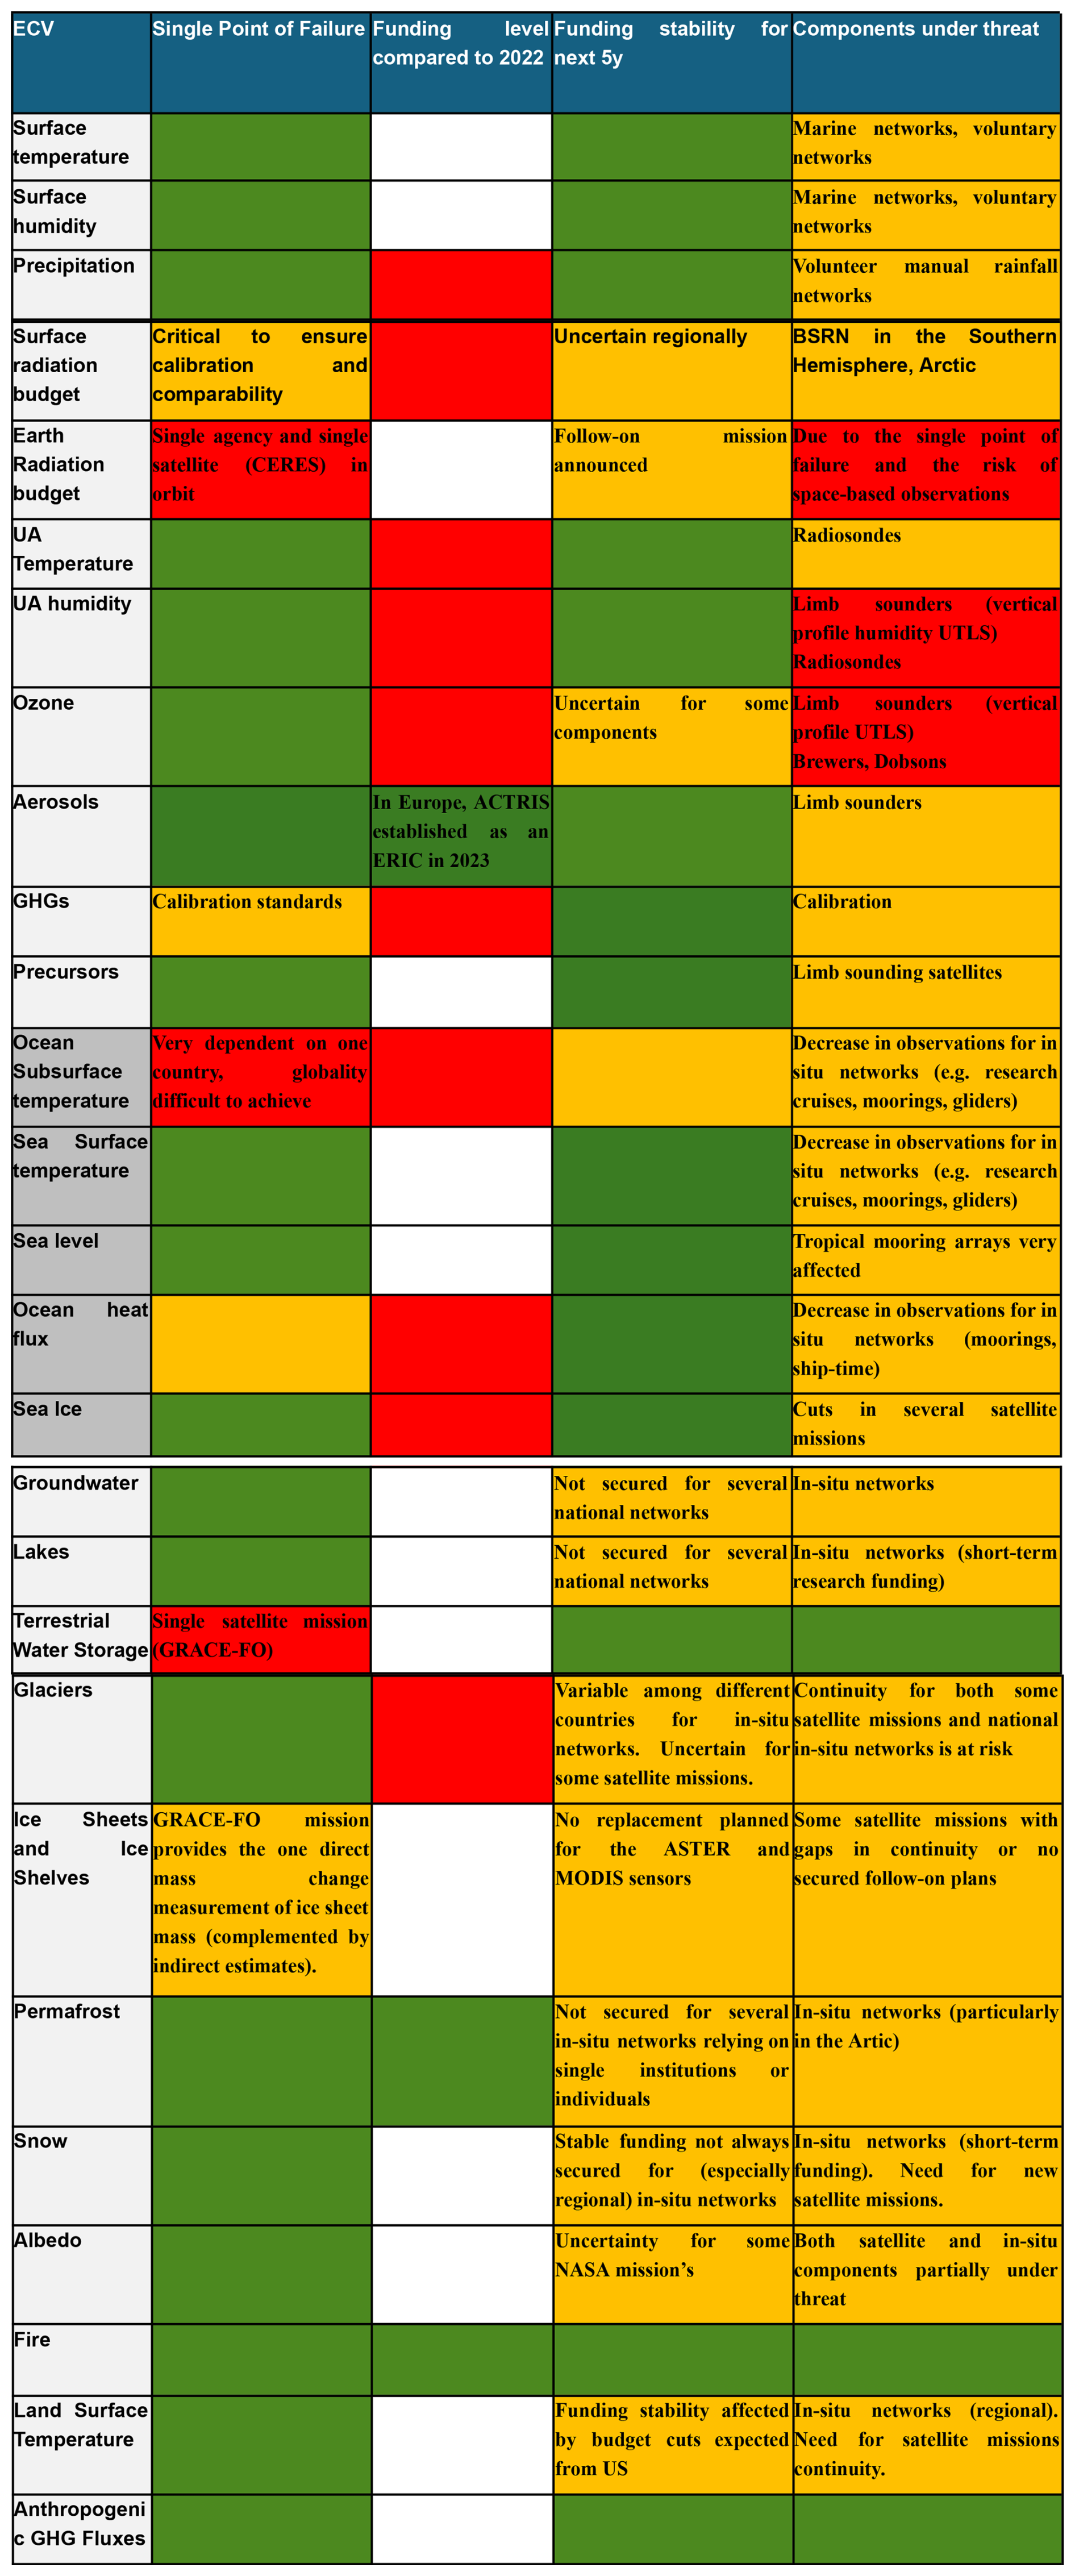
The supplement related to this article is available online at https://doi.org/10.5194/essd-18-3889-2026-supplement.
PMF, CS, MA, PF, JR and AP developed the concept of an annual update in discussions with the wider IPCC community over many years. CS led the work of the data repositories with contributions from PM, DH and MZ. VMD, PZ, SS, CS, SIS, AP, NPG, GPP, BT, MDP, KvS, JR, PF, MA,, XZ, RB, CC, SB and PT provided important IPCC and UNFCCC framing. PMF, CS and TW coordinated the production of the manuscript with support from DR and HC. WFL led Sect. 2 with contributions from PF, GPP, JP and RA. CS led Sect. 3 with inputs from JM, PK, LW, PMF, MK, XL and MR. SS led Sect. 4 with inputs from CS, SJS, GT, JZ, XYZ and GvdW. CS led Sect. 5 with contributions from CW, TG, SS, JFL, RMH, SJS, GT, JZ, XYZ, and GvdW. KvS and MDP led Sect. 6 with contributions from CA, LC, MI,, REK, ABS, CMD, DPM, AL and SEW. BT, CC and ZH led Sect. 7 with contributions from PT, CM, CK, JK, RB, RR, AL and LC. TW led Sect. 8 with contributions and calculations from AR, CK, NPG, RB, SJ, CS and MA. RL led Sect. 9 with contributions from JR, PF and HDM. Section 10 was led by MH, with contributions from SIS, XZ, CHG, TLF, JYL, AK, and VMD. JYL and JEY led Sect. 11 with contributions from KR, VMD, PT, and KvS. AS led Sect. 12 with contributions from MDP, AL, CA, ABS, SEW and CMD. PMF led Sect. 13 with contributions from DR. PMF led Sect. 14 with contributions from AB, CT and BMM. All authors either edited or commented on the manuscript. DR and TW coordinated the data visualisation effort.
The contact author has declared that none of the authors has any competing interests.
Publisher's note: Copernicus Publications remains neutral with regard to jurisdictional claims made in the text, published maps, institutional affiliations, or any other geographical representation in this paper. The authors bear the ultimate responsibility for providing appropriate place names. Views expressed in the text are those of the authors and do not necessarily reflect the views of the publisher.
The University of Leeds has been contracted by ECMWF to coordinate the production of these indicators and provide them to Copernicus. Copernicus is the Earth observation component of the European Union's space programme. The European Centre for Medium-Range Weather Forecasts (ECMWF) has been appointed by the European Commission with funding from the EU to operate the Copernicus Atmosphere Monitoring Service and the Copernicus Climate Change Service on its behalf. Analyses and visualizations for concentrations of short-lived climate forcers used in this paper were produced with the Giovanni online data system, developed and maintained by the NASA GES DISC (as available in March 2026). We thank Xin Lan for assistance with compiling the GHG concentration data.
This research has been supported by the European Union's Horizon Europe research and innovation programme under Grant Agreement Nos. 820829, 101081395, 101081661, 101137656 and 821003, the H2020 European Research Council (grant no. 951542), the Natural Environment Research Council (NE/X00452X/1) and the Engineering and Physical Research Council (EP/V000772/1). Matthew Palmer, Colin Morice, Rachel Killick and Richard Betts were supported by the Met Office Hadley Centre Climate Programme funded by DSIT. Peter Thorne was supported by Co-Centre award number 22/CC/11103. The Co-Centre award is managed by Research Ireland Northern Ireland's Department of Agriculture, Environment and Rural Affairs (DAERA) and UK Research and Innovation (UKRI), and supported via UK's International Science Partnerships Fund (ISPF), and the Irish Government's Shared Island initiative. June-Yi Lee, Jeongeun Yun, and Alexia Karwat were supported by the National Research Foundation of Korea (NRF) grant funded by the Korea government (MSIT) (No. RS-2024-00416848). Aimée Slangen was supported by the research programme ENW-Vidi (DARSea, project number VI.Vidi.2023.058) funded by the Dutch Research Council (NWO).
This paper was edited by Martina Stockhause and reviewed by John Dunne, Matthew Jones, and Chris Jones.
Acker, J. G. and Leptoukh, G.: Online analysis enhances use of NASA Earth science data, EoS Transactions, 88, 14–17, https://doi.org/10.1029/2007EO020003, 2007.
Adler, R. F., Sapiano, M. R. P., Huffman, J., Wang, J.-J., Gu G., Bolvin, D., Chiu, L., Schneider, U., Becker, A., Nelkin, E., Xie, P., Ferrarok, R., and Shin, D.-B.: The global precipitation climatology project (GPCP) monthly analysis (new version 2.3) and a review of 2017 global precipitation, Atmosphere, 9, 138, https://doi.org/10.3390/atmos9040138, 2018.
Adusumilli, S., Straneo, F., Hendricks, S., Korosov, A., Lavergne, T., Lawrence, I., Marzeion, B., Otosaka, I., Schweiger, A., Shepherd, A., Slater, D., Slater, T., Timmermanns, M.-L., and Zemp, M.: GCOS EHI 1960–2020 Cryosphere Heat Content, World Data Center for Climate (WDCC) at DKRZ, https://doi.org/10.26050/WDCC/GCOS_EHI_1960-2020_CRHC, 2022.
Allan, R. P. and Merchant, C. J.: Reconciling Earth's growing energy imbalance with ocean warming, Environ. Res. Lett., 20, 04402, https://doi.org/10.1088/1748-9326/adb448, 2025.
Allen, M. R., Dube, O. P., Solecki, W., Aragón-Durand, F., Cramer, W., Humphreys, S., Kainuma, M., Kala, J., Mahowald, N., Mulugetta, Y., Perez, R., Wairiu, M., and Zickfeld, K.: Framing and Context, in: Global Warming of 1.5 °C. An IPCC Special Report on the impacts of global warming of 1.5 °C above pre-industrial levels and related global greenhouse gas emission pathways, in the context of strengthening the global response to the threat of climate change, sustainable development, and efforts to eradicate poverty, edited by: Masson-Delmotte, V., Zhai, P., Pörtner, H.-O., Roberts, D., Skea, J., Shukla, P. R., Pirani, A., Moufouma-Okia, W., Péan, C., Pidcock, R., Connors, S., Matthews, J. B. R., Chen, Y., Zhou, X., Gomis, M. I., Lonnoy, E., Maycock, T., Tignor, M., and Waterfield, T., Cambridge University Press, Cambridge, UK and New York, NY, USA, 49–92, https://doi.org/10.1017/9781009157940.003, 2018.
Allison, L. C., Palmer, M. D., Allan, R. P., Hermanson, L., Liu, C., and Smith, D. M.: Observations of planetary heating since the 1980s from multiple independent datasets, Environ. Res. Commun., 2, 101001, https://doi.org/10.1088/2515-7620/abbb39, 2020.
AVISO: Mean sea-level product, AVISO [data set], https://www.aviso.altimetry.fr/en/data/products/ocean-indicators-products/mean-sea-level/data-acces.html (last access: 19 February 2025), 2025.
Berthou, S., Renshaw, R., Smyth, T., Tinker, J., Grist, J. P., Wihsgott, J. U., Jones, S., Inall, M., Nolan, G., Berx, B., Arnold, A., Blunn, L. P., Castillo, J. M., Cotterill, D., Daly, E., Dow, G., Gomez, B., Fraser-Leonhardt, V., Hirschi, J. J.-M., Lewis, H. W., Mahmood, S., and Worsfold, M.: Exceptional atmospheric conditions in June 2023 generated a northwest European marine heatwave which contributed to breaking land temperature records, Commun. Earth & Environ., 5, 287, https://doi.org/10.1038/s43247-024-01413-8, 2024.
Betts, R. A., Belcher, S. E., Hermanson, L., Klein Tank, A., Lowe, J. A., Jones, C. D., Morice, C. P., Rayner, N. A., Scaife, A. A., and Stott, P. A.: Approaching 1.5 °C: how will we know we've reached this crucial warming mark?, Nature, 624, 33–35, https://doi.org/10.1038/d41586-023-03775-z, 2023.
Blunden, J. and Reagan, J. (Eds.): State of the Climate in 2024, B. Am. Meteorol. Soc., 106, S1–S513, https://doi.org/10.1175/2025BAMSStateoftheClimate.1, 2025.
Bond, T. C., Doherty, S. J., Fahey, D. W., Forster, P. M., Berntsen, T., DeAngelo, B. J., Flanner, M. G., Ghan, S., Kärcher, B., Koch, D., Kinne, S., Kondo, Y., Quinn, P. K., Sarofim, M. C., Schultz, M. G., Schulz, M., Venkataraman, C., Zhang, H., Zhang, S., Bellouin, N., Guttikunda, S. K., Hopke, P. K., Jacobson, M. Z., Kaiser, J. W., Klimont, Z., Lohmann, U., Schwarz, J. P., Shindell, D., Storelvmo, T., Warren, S. G., and Zender, C. S.: Bounding the role of black carbon in the climate system: A scientific assessment, J. Geophys. Res.-Atmos., 118, 5380–5552, https://doi.org/10.1002/jgrd.50171, 2013.
Burger, F. A., Terhaar, J., and Frolicher, T. L.: Compound marine heatwaves and ocean acidity extremes, Nat. Commun., 13, 4722, https://doi.org/10.1038/s41467-022-32120-7, 2022.
Burton, C., Lampe, S., Kelley, D. I., Thiery, W., Hantson, S., Christidis, N., Gudmundsson, L., Forrest, M., Burke, E., Chang, J., Huang, H., Ito, A., Kou-Giesbrecht, S., Lasslop, G., Li, W., Nieradzik, L., Li, F., Chen, Y., Randerson, J., Reyer, C. P. O., and Mengel, M.: Global burned area increasingly explained by climate change, Nat. Clim. Change, 14, 1186–1192, https://doi.org/10.1038/s41558-024-02140-w, 2024.
Canadell, J. G., Monteiro, P. M. S., Costa, M. H., Cotrim da Cunha, L., Cox, P. M., Eliseev, A. V., Henson, S., Ishii, M., Jaccard, S., Koven, C., Lohila, A., Patra, P. K., Piao, S., Rogelj, J., Syampungani, S., Zaehle, S., and Zickfeld, K.: Global Carbon and other Biogeochemical Cycles and Feedbacks, in: Climate Change 2021: The Physical Science Basis. Contribution of Working Group I to the Sixth Assessment Report of the Intergovernmental Panel on Climate Change, edited by: Masson-Delmotte, V., Zhai, P., Pirani, A., Connors, S. L., Péan, C., Berger, S., Caud, N., Chen, Y., Goldfarb, L., Gomis, M. I., Huang, M., Leitzell, K., Lonnoy, E., Matthews, J. B. R., Maycock, T. K., Waterfield, T., Yelekçi, O., Yu, R., and Zhou, B., Cambridge University Press, Cambridge, United Kingdom and New York, NY, USA, 673–816, https://doi.org/10.1017/9781009157896.007, 2021.
Cao, J., Wang, H., Wang, B., Zhao, H., Wang, C., and Zhu, X.: Higher sensitivity of Northern Hemisphere monsoon to anthropogenic aerosol than greenhouse gases, Geophys Res. Lett., 49, e2022GL100270, https://doi.org/10.1029/2022GL100270, 2022.
Cazenave, A., Yang, C., Bouih, M., Storto, A., Chen, J., Llovel, W., Von Schuckmann, K., and Leclercq, L.: Evidence of Increased Deep Ocean Warming From a Sea Level Budget Approach, Earth's Future, 14, e2025EF007403, https://doi.org/10.1029/2025EF007403, 2026.
Ceppi, P., Wilson Kemsley, S., Andersen, H., Andrews, T., Kramer, R. J., Nowack, P., Wall, C. J., and Zelinka, M. D.: Emerging low-cloud feedback and adjustment in global satellite observations, Atmos. Chem. Phys., 26, 4153–4171, https://doi.org/10.5194/acp-26-4153-2026, 2026.
Cheng, L., Abraham, J., Hausfather, Z., and Trenberth, K. E.: How fast are the oceans warming?, Science, 363, 128–129, https://doi.org/10.1126/science.aav7619, 2019.
Cheng, L., Von Schuckmann, K., Abraham, J. P., Trenberth, K. E., Mann, M. E., Zanna, L., England, M. H., Zika, J. D., Fasullo, J. T., Yu, Y., Pan, Y., Zhu, J., Newsom, E. R., Bronselaer, B., and Lin, X.: Past and future ocean warming, Nat. Rev. Earth. Environ., 3, 776–794, https://doi.org/10.1038/s43017-022-00345-1, 2022.
Cheung, W. W. L., Frölicher, T. L., Lam, V. W., Oyinlola, M. A., Reygondeau, G., Sumaila, U. R., Tai, T. C., Teh, L. C. L., and Wabnitz, C. C. C.: Marine high temperature extremes amplify the impacts of climate change on fish and fisheries, Sci. Adv., 7, 40, https://doi.org/10.1126/sciadv.abh0895, 2021.
Church, J. A. and White, N. J.: Sea-Level Rise from the Late 19th to the Early 21st Century, Surv. Geophys., 32, 585–602, https://doi.org/10.1007/s10712-011-9119-1, 2011.
Church, J. A., White, N. J., Konikow, L. F., Domingues, C. M., Cogley, J. G., Rignot, E., Gregory, J. M., Van Den Broeke, M. R., Monaghan, A. J., and Velicogna, I.: Revisiting the Earth's sea-level and energy budgets from 1961 to 2008: SEA-LEVEL AND ENERGY BUDGETS, Geophys. Res. Lett., 38, https://doi.org/10.1029/2011GL048794, 2011.
Church, J. A., Clark, P. U., Cazenave, A., Gregory, J. M., Jevrejeva, S., Levermann, A., Merrifield, M. A., Milne, G. A., Nerem, R. S., Nunn, P. D., Payne, A. J., Pfeffer, W. T., Stammer, D., and Unnikrishnan, A. S.: Sea Level Change, in: Climate Change 2013: The Physical Science Basis. Contribution of Working Group I to the Fifth Assessment Report of the Intergovernmental Panel on Climate Change, edited by: Stocker, T. F., Qin, D., Plattner, G.-K., Tignor, M., Allen, S. K., Boschung, J., Nauels, A., Xia, Y., Bex, V., and Midgley, P. M., Cambridge University Press, Cambridge, United Kingdom and New York, NY, USA, https://doi.org/10.1017/CBO9781107415324.026, 2013.
Collins, M., Knutti, R., Arblaster, J., Dufresne, J.-L., Fichefet, T., Friedlingstein, P., Gao, X., Gutowski, W. J., Johns, T., Krinner, G., Shongwe, M., Tebaldi, C., Weaver, A. J., and Wehner, M.: Long-term Climate Change: Projections, Commitments and Irreversibility, in: Climate Change 2013: The Physical Science Basis. Contribution of Working Group I to the Fifth Assessment Report of the Intergovernmental Panel on Climate Change, edited by: Stocker, T. F., Qin, D., Plattner, G. K., Tignor, M., Allen, S. K., Boschung, J., Nauels, A., Xia, Y., and Midgley, P. M., Cambridge, United Kingdom and New York, NY, USA, Cambridge University Press, 1029–1136, https://doi.org/10.1017/CBO9781107415324.024, 2013.
Collins, M., Sutherland, M., Bouwer, L., Cheong, S.-M., Frölicher, T., Jacot Des Combes, H., Koll Roxy, M., Losada, I., McInnes, K., Ratter, B., Rivera-Arriaga, E., Susanto, R. D., Swingedouw, D., and Tibig, L.: Extremes, Abrupt Changes and Managing Risk, in: IPCC Special Report on the Ocean and Cryosphere in a Changing Climate, edited by: Pörtner, H.-O., Roberts, D. C., Masson-Delmotte, V., Zhai, P., Tignor, M., Poloczanska, E., Mintenbeck, K., Alegría, A., Nicolai, M., Okem, A., Petzold, J., Rama, B., and Weyer, N. M., Cambridge University Press, Cambridge, UK and New York, NY, USA, 589–655, https://doi.org/10.1017/9781009157964.008, 2019.
Crippa, M., Guizzardi, D., Pagani, F., Banja, M., Muntean, M., Schaaf, E., Becker, W., Monforti-Ferrario, F., Quadrelli, R., Risquez Martin, A., Taghavi-Moharamli, P., Grassi, G., Rossi, S., Brandao De Melo, J., Oom, D., Branco, A., San-Miguel, J., and Vignati, E.: GHG emissions of all world countries, Publications Office of the European Union [data set], https://doi.org/10.2760/9816914, 2025.
Cuesta-Valero, F. J., Beltrami, H., García-García, A., Krinner, G., Langer, M., MacDougall, A., Nitzbon, J., Peng, J., von Schuckmann, K., Seneviratne, S., Thiery, W., Vanderkelen, I., and Wu, T.: GCOS EHI 1960–2020 Continental Heat Content (Version 2), World Data Center for Climate (WDCC) at DKRZ, https://doi.org/10.26050/WDCC/GCOS_EHI_1960-2020_CoHC_v2, 2023.
Cuesta-Valero, F. J., García-García, A., Beltrami, H., García-Pereira, F., González-Rouco, J. F., and Peng, J.: Robust increase in observed heat storage by the global subsurface, Sci. Adv., 11, eadw9958, https://doi.org/10.1126/sciadv.adw9958, 2025.
Dangendorf, S., Hay, C., Calafat, F. M., Marcos, M., Piecuch, C. G., Berk, K., and Jensen, J.: Persistent acceleration in global sea-level rise since the 1960s, Nat. Clim. Change, 9, 705–710, https://doi.org/10.1038/s41558-019-0531-8, 2019.
Dangendorf, S., Sun, Q., Wahl, T., Thompson, P., Mitrovica, J. X., and Hamlington, B.: Probabilistic reconstruction of sea-level changes and their causes since 1900, Earth Syst. Sci. Data, 16, 3471–3494, https://doi.org/10.5194/essd-16-3471-2024, 2024.
Deng, Z., Ciais, P., Tzompa-Sosa, Z. A., Saunois, M., Qiu, C., Tan, C., Sun, T., Ke, P., Cui, Y., Tanaka, K., Lin, X., Thompson, R. L., Tian, H., Yao, Y., Huang, Y., Lauerwald, R., Jain, A. K., Xu, X., Bastos, A., Sitch, S., Palmer, P. I., Lauvaux, T., d'Aspremont, A., Giron, C., Benoit, A., Poulter, B., Chang, J., Petrescu, A. M. R., Davis, S. J., Liu, Z., Grassi, G., Albergel, C., Tubiello, F. N., Perugini, L., Peters, W., and Chevallier, F.: Comparing national greenhouse gas budgets reported in UNFCCC inventories against atmospheric inversions, Earth Syst. Sci. Data, 14, 1639–1675, https://doi.org/10.5194/essd-14-1639-2022, 2022.
Denier van der Gon, H., Gauss, M., Granier, C., Arellano, S., Benedictow, A., Darras, S., Dellaert, S., Guevara, M., Jalkanen, J.-P., Krueger, K., Kuenen, J., Liaskoni, M., Liousse, C., Markova, J., Prieto Perez, A., Quack, B., Simpson, D., Sindelarova, K., and Soulie, A.: Documentation of CAMS emission inventory products, Copernicus Atmosphere Monitoring Service, https://doi.org/10.24380/Q2SI-TI6I, 2023.
Dhakal, S., Minx, J. C., Toth, F. L., Abdel-Aziz, A., Figueroa Meza, M. J., Hubacek, K., Jonckheere, I. G. C., Kim, Y.-G., Nemet, G. F., Pachauri, S., Tan, X. C., and Wiedmann, T.: Emissions Trends and Drivers, in: IPCC, 2022: Climate Change 2022: Mitigation of Climate Change. Contribution of Working Group III to the Sixth Assessment Report of the Intergovernmental Panel on Climate Change, edited by: Shukla, P. R., Skea, J., Slade, R., Al Khourdajie, A., van Diemen, R., McCollum, D., Pathak, M., Some, S., Vyas, P., Fradera, R., Belkacemi, M., Hasija, A., Lisboa, G., Luz, S., and Malley, J., Cambridge University Press, Cambridge, UK and New York, NY, USA, https://doi.org/10.1017/9781009157926.004, 2022.
Donlon, C. J., Martin, M., Stark, J., Roberts-Jones, J., Fiedler, E., and Wimmer, W.: The Operational Sea Surface Temperature and Sea Ice Analysis (OSTIA) system, Remote Sens. Environ., 116, 140–158, https://doi.org/10.1016/j.rse.2010.10.017, 2012.
Douville, H., Raghavan, K., Renwick, J., Allan, R. P., Arias, P. A., Barlow, M., Cerezo-Mota, R., Cherchi, A., Gan, T. Y., Gergis, J., Jiang, D., Khan, A., Pokam Mba, W., Rosenfeld, D., Tierney, J., and Zolina, O.: Water Cycle Changes, in: Climate Change 2021: The Physical Science Basis. Contribution of Working Group I to the Sixth Assessment Report of the Intergovernmental Panel on Climate Change, edited by: Masson-Delmotte, V., Zhai, P., Pirani, A., Connors, S. L., Péan, C., Berger, S., Caud, N., Chen, Y., Goldfarb, L., Gomis, M. I., Huang, M., Leitzell, K., Lonnoy, E., Matthews, J. B. R., Maycock, T. K., Waterfield, T., Yelekçi, O., Yu, R., and Zhou, B., Cambridge University Press, Cambridge, United Kingdom and New York, NY, USA, 1055–1210, https://doi.org/10.1017/9781009157896.010, 2021.
Droste, E. S., Adcock, K. E., Ashfold, M. J., Chou, C., Fleming, Z., Fraser, P. J., Gooch, L. J., Hind, A. J., Langenfelds, R. L., Leedham Elvidge, E. C., Mohd Hanif, N., O'Doherty, S., Oram, D. E., Ou-Yang, C.-F., Panagi, M., Reeves, C. E., Sturges, W. T., and Laube, J. C.: Trends and emissions of six perfluorocarbons in the Northern Hemisphere and Southern Hemisphere, Atmos. Chem. Phys., 20, 4787–4807, https://doi.org/10.5194/acp-20-4787-2020, 2020.
Dunn, R. J. H., Alexander, L. V., Donat, M. G., Zhang, X., Bador, M., Herold, N., Lippmann, T., Allan, R., Aguilar, E., Barry, A. A., Brunet, M., Caesar, J., Chagnaud, G., Cheng, V., Cinco, T., Durre, I., Guzman, R., Htay, T. M., Wan Ibadullah, W. M., Bin Ibrahim, M. K. I., Khoshkam, M., Kruger, A., Kubota, H., Leng, T. W., Lim, G., Li-Sha, L., Marengo, J., Mbatha, S., McGree, S., Menne, M., Milagros Skansi, M., Ngwenya, S., Nkrumah, F., Oonariya, C., Pabon-Caicedo, J. D., Panthou, G., Pham, C., Rahimzadeh, F., Ramos, A., Salgado, E., Salinger, J., Sané, Y., Sopaheluwakan, A., Srivastava, A., Sun, Y., Timbal, B., Trachow, N., Trewin, B., Schrier, G., Vazquez-Aguirre, J., Vasquez, R., Villarroel, C., Vincent, L., Vischel, T., Vose, R., and Bin Hj Yussof, M. N.: Development of an updated global land in situ-based data set of temperature and precipitation extremes: HadEX3, J. Geophys. Res.-Atmos., 125, e2019JD032263, https://doi.org/10.1029/2019JD032263, 2020.
Dunn, R. J. H., Alexander, L., Donat, M., Zhang, X., Bador, M., Herold, N., Lippmann, T., Allan, R. J., Aguilar, E., Aziz, A., Brunet, M., Caesar, J., Chagnaud, G., Cheng, V., Cinco, T., Durre, I., de Guzman, R., Htay, T. M., Wan Ibadullah, W. M., Bin Ibrahim, M. K. I., Khoshkam, M., Kruge, A., Kubota, H., Leng, T. W., Lim, G., Li-Sha, L., Marengo, J., Mbatha, S., McGree, S., Menne, M., de los Milagros Skansi, M., Ngwenya, S., Nkrumah, F., Oonariya, C., Pabon-Caicedo, J. D., Panthou, G., Pham, C., Rahimzadeh, F., Ramos, A., Salgado, E., Salinger, J., Sane, Y., Sopaheluwakan, A., Srivastava, A., Sun, Y., Trimbal, B., Trachow, N., Trewin, B., van der Schrier, G., Vazquez-Aguirre, J., Vasquez, R., Villarroel, C., Vincent, L., Vischel, T., Vose, R., and Bin Hj Yussof, M. N. A.: HadEX3: Global land-surface climate extremes indices v3.0.4 (1901–2018), NERC EDS Centre for Environmental Data Analysis [data set], https://doi.org/10.5285/115d5e4ebf7148ec941423ec86fa9f26, 2023.
Dunn, R. J. H., Blannin, J., Gobron, N., Miller, J. B., and Willett, K. M. (Eds.): Global climate [in “State of the Climate in 2023”], B. Am. Meteorol. Soc., 105, S12–S155, https://doi.org/10.1175/BAMS-D-24-0116.1, 2024.
Dutton, G. S., Hall, B. D., Montzka, S. A., Nance, J. D., Clingan, S. D., and Petersen, K. M.: Combined Atmospheric Chloroflurocarbon-12 Dry Air Mole Fractions from the NOAA GML Halocarbons Sampling Network, 1977–2024, Version: 2024-03-07, National Oceanic & Atmospheric Administration (NOAA), https://doi.org/10.15138/PJ63-H440, 2024.
ECCAD: CAMS database version 6.2 (v6.2), ECCAD [data set], https://permalink.aeris-data.fr/CAMS-GLOB-ANT (last access: 17 March 2026), 2026.
Eyring, V., Gillett, N. P., Achuta Rao, K. M., Barimalala, R., Barreiro Parrillo, M., Bellouin, N., Cassou, C., Durack, P. J., Kosaka, Y., McGregor, S., Min, S., Morgenstern, O., and Sun, Y.: Human Influence on the Climate System, in: Climate Change 2021: The Physical Science Basis. Contribution of Working Group I to the Sixth Assessment Report of the Intergovernmental Panel on Climate Change, edited by: Masson-Delmotte, V., Zhai, P., Pirani, A., Connors, S. L., Péan, C., Berger, S., Caud, N., Chen, Y., Goldfarb, L., Gomis, M. I., Huang, M., Leitzell, K., Lonnoy, E., Matthews, J. B. R., Maycock, T. K., Waterfield, T., Yelekçi, O., Yu, R., and Zhou, B., Cambridge University Press, Cambridge, United Kingdom and New York, NY, USA, 423–552, https://doi.org/10.1017/9781009157896.005, 2021.
FAO: Greenhouse gas emissions from agrifood systems – Global, regional and country trends, Food and Agriculture Organization of the United Nations, Rome, https://doi.org/10.4060/cd7300en, 2025.
Forster, P., Storelvmo, T., Armour, K., Collins, W., Dufresne, J.-L., Frame, D., Lunt, D. J., Mauritsen, T., Palmer, M. D., Watanabe, M., Wild, M., and Zhang, H.: The Earth's Energy Budget, Climate Feedbacks, and Climate Sensitivity. In Climate Change 2021: The Physical Science Basis. Contribution of Working Group I to the Sixth Assessment Report of the Intergovernmental Panel on Climate Change, edited by: Masson-Delmotte, V., Zhai, P., Pirani, A., Connors, S. L., Péan, C., Berger, S., Caud, N., Chen, Y., Goldfarb, L., Gomis, M. I., Huang, M., Leitzell, K., Lonnoy, E., Matthews, J. B. R., Maycock, T. K., Waterfield, T., Yelekçi, O., Yu, R., and Zhou, B., Cambridge University Press, Cambridge, United Kingdom and New York, NY, USA, 923–1054, https://doi.org/10.1017/9781009157896.009, 2021.
Forster, P. M., Smith, C. J., Walsh, T., Lamb, W. F., Lamboll, R., Hauser, M., Ribes, A., Rosen, D., Gillett, N., Palmer, M. D., Rogelj, J., von Schuckmann, K., Seneviratne, S. I., Trewin, B., Zhang, X., Allen, M., Andrew, R., Birt, A., Borger, A., Boyer, T., Broersma, J. A., Cheng, L., Dentener, F., Friedlingstein, P., Gutiérrez, J. M., Gütschow, J., Hall, B., Ishii, M., Jenkins, S., Lan, X., Lee, J.-Y., Morice, C., Kadow, C., Kennedy, J., Killick, R., Minx, J. C., Naik, V., Peters, G. P., Pirani, A., Pongratz, J., Schleussner, C.-F., Szopa, S., Thorne, P., Rohde, R., Rojas Corradi, M., Schumacher, D., Vose, R., Zickfeld, K., Masson-Delmotte, V., and Zhai, P.: Indicators of Global Climate Change 2022: annual update of large-scale indicators of the state of the climate system and human influence, Earth Syst. Sci. Data, 15, 2295–2327, https://doi.org/10.5194/essd-15-2295-2023, 2023.
Forster, P. M., Smith, C., Walsh, T., Lamb, W. F., Lamboll, R., Hall, B., Hauser, M., Ribes, A., Rosen, D., Gillett, N. P., Palmer, M. D., Rogelj, J., von Schuckmann, K., Trewin, B., Allen, M., Andrew, R., Betts, R. A., Borger, A., Boyer, T., Broersma, J. A., Buontempo, C., Burgess, S., Cagnazzo, C., Cheng, L., Friedlingstein, P., Gettelman, A., Gütschow, J., Ishii, M., Jenkins, S., Lan, X., Morice, C., Mühle, J., Kadow, C., Kennedy, J., Killick, R. E., Krummel, P. B., Minx, J. C., Myhre, G., Naik, V., Peters, G. P., Pirani, A., Pongratz, J., Schleussner, C.-F., Seneviratne, S. I., Szopa, S., Thorne, P., Kovilakam, M. V. M., Majamäki, E., Jalkanen, J.-P., van Marle, M., Hoesly, R. M., Rohde, R., Schumacher, D., van der Werf, G., Vose, R., Zickfeld, K., Zhang, X., Masson-Delmotte, V., and Zhai, P.: Indicators of Global Climate Change 2023: annual update of key indicators of the state of the climate system and human influence, Earth Syst. Sci. Data, 16, 2625–2658, https://doi.org/10.5194/essd-16-2625-2024, 2024.
Forster, P. M., Smith, C., Walsh, T., Lamb, W. F., Lamboll, R., Cassou, C., Hauser, M., Hausfather, Z., Lee, J.-Y., Palmer, M. D., von Schuckmann, K., Slangen, A. B. A., Szopa, S., Trewin, B., Yun, J., Gillett, N. P., Jenkins, S., Matthews, H. D., Raghavan, K., Ribes, A., Rogelj, J., Rosen, D., Zhang, X., Allen, M., Aleluia Reis, L., Andrew, R. M., Betts, R. A., Borger, A., Broersma, J. A., Burgess, S. N., Cheng, L., Friedlingstein, P., Domingues, C. M., Gambarini, M., Gasser, T., Gütschow, J., Ishii, M., Kadow, C., Kennedy, J., Killick, R. E., Krummel, P. B., Liné, A., Monselesan, D. P., Morice, C., Mühle, J., Naik, V., Peters, G. P., Pirani, A., Pongratz, J., Minx, J. C., Rigby, M., Rohde, R., Savita, A., Seneviratne, S. I., Thorne, P., Wells, C., Western, L. M., van der Werf, G. R., Wijffels, S. E., Masson-Delmotte, V., and Zhai, P.: Indicators of Global Climate Change 2024: annual update of key indicators of the state of the climate system and human influence, Earth Syst. Sci. Data, 17, 2641–2680, https://doi.org/10.5194/essd-17-2641-2025, 2025.
Fox-Kemper, B., Hewitt, H. T., Xiao, C., Aðalgeirsdóttir, G., Drijfhout, S. S., Edwards, T. L., Golledge, N. R., Hemer, M., Kopp, R. E., Krinner, G., Mix, A., Notz, D., Nowicki, S., Nurhati, I. S., Ruiz, L., Sallée, J.-B., Slangen, A. B. A., and Yu, Y.: Ocean, Cryosphere and Sea Level Change, in: Climate Change 2021: The Physical Science Basis. Contribution of Working Group I to the Sixth Assessment Report of the Intergovernmental Panel on Climate Change, edited by: Masson-Delmotte, V., Zhai, P., Pirani, A., Connors, S. L., Péan, C., Berger, S., Caud, N., Chen, Y., Goldfarb, L., Gomis, M. I., Huang, M., Leitzell, K., Lonnoy, E., Matthews, J. B. R., Maycock, T. K., Waterfield, T., Yelekçi, O., Yu, R., and Zhou, B., Cambridge University Press, Cambridge, United Kingdom and New York, NY, USA, 1211–1362, https://doi.org/10.1017/9781009157896.011, 2021.
Francey, R. J., Steele, L. P., Langenfelds, R. L., and Pak, B. C.: High precision long-term monitoring of radiatively-active trace gases at surface sites and from ships and aircraft in the Southern Hemisphere atmosphere, J. Atmos. Sci., 56, 279–285, https://doi.org/10.1175/1520-0469(1999)056<0279:HPLTMO>2.0.CO;2, 1999.
Frederikse, T., Landerer, F., Caron, L., Adhikari, S., Parkes, D., Humphrey, V. W., Dangendorf, S., Hogarth, P., Zanna, L., Cheng, L., and Wu, Y.-H.: The causes of sea-level rise since 1900, Nature, 584, 393–397, https://doi.org/10.1038/s41586-020-2591-3, 2020.
Freedman, A.: Lack of weather data due to Trump's budget cuts impacted forecast for deadly Alaska storm, CNN, https://edition.cnn.com/2025/10/14/weather/alaska-storm-weather-balloons-trump-cuts-nws-climate (last access: 28 May 2026), 2026.
Friedlingstein, P., O'Sullivan, M., Jones, M. W., Andrew, R. M., Hauck, J., Olsen, A., Peters, G. P., Peters, W., Pongratz, J., Sitch, S., Le Quéré, C., Canadell, J. G., Ciais, P., Jackson, R. B., Alin, S., Aragão, L. E. O. C., Arneth, A., Arora, V., Bates, N. R., Becker, M., Benoit-Cattin, A., Bittig, H. C., Bopp, L., Bultan, S., Chandra, N., Chevallier, F., Chini, L. P., Evans, W., Florentie, L., Forster, P. M., Gasser, T., Gehlen, M., Gilfillan, D., Gkritzalis, T., Gregor, L., Gruber, N., Harris, I., Hartung, K., Haverd, V., Houghton, R. A., Ilyina, T., Jain, A. K., Joetzjer, E., Kadono, K., Kato, E., Kitidis, V., Korsbakken, J. I., Landschützer, P., Lefèvre, N., Lenton, A., Lienert, S., Liu, Z., Lombardozzi, D., Marland, G., Metzl, N., Munro, D. R., Nabel, J. E. M. S., Nakaoka, S.-I., Niwa, Y., O'Brien, K., Ono, T., Palmer, P. I., Pierrot, D., Poulter, B., Resplandy, L., Robertson, E., Rödenbeck, C., Schwinger, J., Séférian, R., Skjelvan, I., Smith, A. J. P., Sutton, A. J., Tanhua, T., Tans, P. P., Tian, H., Tilbrook, B., van der Werf, G., Vuichard, N., Walker, A. P., Wanninkhof, R., Watson, A. J., Willis, D., Wiltshire, A. J., Yuan, W., Yue, X., and Zaehle, S.: Global Carbon Budget 2020, Earth Syst. Sci. Data, 12, 3269–3340, https://doi.org/10.5194/essd-12-3269-2020, 2020.
Friedlingstein, P., O'Sullivan, M., Jones, M. W., Andrew, R. M., Bakker, D. C. E., Hauck, J., Landschützer, P., Le Quéré, C., Li, H., Luijkx, I. T., Peters, G. P., Peters, W., Pongratz, J., Schwingshackl, C., Sitch, S., Canadell, J. G., Ciais, P., Aas, K., Alin, S. R., Anthoni, P., Barbero, L., Bates, N. R., Bellouin, N., Benoit-Cattin, A., Berghoff, C. F., Bernardello, R., Bopp, L., Brasika, I. B. M., Chamberlain, M. A., Chandra, N., Chevallier, F., Chini, L. P., Collier, N. O., Colligan, T. H., Cronin, M., Djeutchouang, L. M., Dou, X., Enright, M. P., Enyo, K., Erb, M., Evans, W., Feely, R. A., Feng, L., Ford, D. J., Foster, A., Fransner, F., Gasser, T., Gehlen, M., Gkritzalis, T., Goncalves De Souza, J., Grassi, G., Gregor, L., Gruber, N., Guenet, B., Gürses, Ö., Harrington, K., Harris, I., Heinke, J., Hurtt, G. C., Iida, Y., Ilyina, T., Ito, A., Jacobson, A. R., Jain, A. K., Jarníková, T., Jersild, A., Jiang, F., Jones, S. D., Kato, E., Keeling, R. F., Klein Goldewijk, K., Knauer, J., Kong, Y., Korsbakken, J. I., Koven, C., Kunimitsu, T., Lan, X., Liu, J., Liu, Z., Liu, Z., Lo Monaco, C., Ma, L., Marland, G., McGuire, P. C., McKinley, G. A., Melton, J. R., Monacci, N., Monier, E., Morgan, E. J., Munro, D. R., Müller, J. D., Nakaoka, S.-I., Nayagam, L. R., Niwa, Y., Nutzel, T., Olsen, A., Omar, A. M., Pan, N., Pandey, S., Pierrot, D., Qin, Z., Regnier, P., Rehder, G., Resplandy, L., Roobaert, A., Rosan, T. M., Rödenbeck, C., Schwinger, J., Skjelvan, I., Smallman, T. L., Spada, V., Sreeush, M. G., Sun, Q., Sutton, A. J., Sweeney, C., Swingedouw, D., Séférian, R., Takao, S., Tatebe, H., Tian, H., Tian, X., Tilbrook, B., Tsujino, H., Tubiello, F., van Ooijen, E., van der Werf, G. R., van de Velde, S. J., Walker, A. P., Wanninkhof, R., Yang, X., Yuan, W., Yue, X., and Zeng, J.: Global Carbon Budget 2025, Earth Syst. Sci. Data, 18, 3211–3288, https://doi.org/10.5194/essd-18-3211-2026, 2026.
Frölicher, T. L. and Laufkötter, C.: Emerging risks from marine heatwaves, Nat. Commun., 9, 650, https://doi.org/10.1038/s41467-018-03163-6, 2018.
Frölicher, T. L., Fischer, E. M., and Gruber, N.: Marine heatwaves under global warming, Nature, 560, 360–364, https://doi.org/10.1038/s41586-018-0383-9, 2018.
Gasser, T., Crepin, L., Quilcaille, Y., Houghton, R. A., Ciais, P., and Obersteiner, M.: Historical CO2 emissions from land use and land cover change and their uncertainty, Biogeosciences, 17, 4075–4101, https://doi.org/10.5194/bg-17-4075-2020, 2020.
Gillett, N. P., Kirchmeier-Young, M., Ribes, A., Shiogama, H., Hegerl, G. C., Knutti, R., Gastineau, G., John, J. G., Li, L., Nazarenko, L., Rosenbloom, N., Seland, Ø., Wu, T., Yukimoto, S., and Ziehn, T.: Constraining human contributions to observed warming since the pre-industrial period, Nat. Clim. Change, 11, 207–212, https://doi.org/10.1038/s41558-020-00965-9, 2021.
Gleckler, P. J., Durack, P. J., Stouffer, R. J., Johnson, G. C., and Forest, C. E.: Industrial-era global ocean heat uptake doubles in recent decades, Nat. Clim. Change, 6, 394–398, https://doi.org/10.1038/nclimate2915, 2016.
Goessling, H. F., Rackow, T., and Jung, T.: Recent global temperature surge intensified by record-low planetary albedo, Science, 387, 68–73, https://doi.org/10.1126/science.adq7280, 2025.
Gregory, C. H., Artana, C., Lama, S., Leon-FonFay, D., Sala, J., Xiao, F., Xu, T., Capotondi, A., Martinez-Villalobos, C., and Holbrook, N. J.: Global Marine Heatwaves Under Different Flavors of ENSO, Geophys. Res. Lett., 51, 20, e2024GL110399, https://doi.org/10.1029/2024GL110399, 2024.
Gruber, N., Boyd, P. W., Frolicher, T. L., and Vogt, M.: Biogeochemical extremes and compound events in the ocean, Nature, 600, 395–407, https://doi.org/10.1038/s41586-021-03981-7, 2021.
Gulev, S. K., Thorne, P. W., Ahn, J., Dentener, F. J., Domingues, C. M., Gerland, S., Gong, D., Kaufman, D. S., Nnamchi, H. C., Quaas, J., Rivera, J. A., Sathyendranath, S., Smith, S. L., Trewin, B., von Schuckmann, K., and Vose, R. S.: Changing State of the Climate System, in: Climate Change 2021: The Physical Science Basis. Contribution of Working Group I to the Sixth Assessment Report of the Intergovernmental Panel on Climate Change, edited by: Masson-Delmotte, V., Zhai, P., Pirani, A., Connors, S. L., Péan, C., Berger, S., Caud, N., Chen, Y., Goldfarb, L., Gomis, M. I., Huang, M., Leitzell, K., Lonnoy, E., Matthews, J. B. R., Maycock, T. K., Waterfield, T., Yelekçi, O., Yu, R., and Zhou, B., Cambridge University Press, Cambridge, United Kingdom and New York, NY, USA, 287–422, https://doi.org/10.1017/9781009157896.004, 2021.
Gupta, A. K., Mittal, T., Fauria, K. E., Bennartz, R., and Kok, J. F.: The January 2022 Hunga eruption cooled the southern hemisphere in 2022 and 2023, Commun. Earth Environ., 6, 240, https://doi.org/10.1038/s43247-025-02181-9, 2025.
Gütschow, J., Busch, D., and Pflüger, M.: The PRIMAP-hist national historical emissions time series (1750-2024) v2.7, Zenodo [data set], https://doi.org/10.5281/zenodo.17090760, 2025.
Hakuba, M. Z., Frederikse, T., and Landerer, F. W.: Earth's energy imbalance from the ocean perspective (2005–2019), Geophys. Res. Lett., 48, e2021GL093624, https://doi.org/10.1029/2021GL093624, 2021.
Hansen, J. E., Sato, M., Simons, L., Nazarenko, L. S., Sangha, I., Kharecha, P., Zachos, J. C., von Schuckmann, K., Loeb, N. G., Osman, M. B., Jin, Q., Tselioudis, G., Jeong, E., Lacis, A., Ruedy, R., Russell, G., Cao, J., and Li, J.: Global warming in the pipeline, Oxford Open Climate Change, 3, kgad008, https://doi.org/10.1093/oxfclm/kgad008, 2023.
Hansis, E., Davis, S. J., and Pongratz, J.: Relevance of methodological choices for accounting of land use change carbon fluxes, Global Biogeochem. Cy., 29, 1230–1246, https://doi.org/10.1002/2014GB004997, 2015.
Harris, I., Osborn, T. J., Jones, P., and Lister, D.: Version 4 of the CRU TS monthly high-resolution gridded multivariate climate dataset, Scientific Data, 7, 109, https://doi.org/10.1038/s41597-020-0453-3, 2020.
Haustein, K., Allen, M. R., Forster, P. M., Otto, F. E. L., Mitchell, D. M., Matthews, H. D., and Frame, D. J.: A real-time Global Warming Index, Sci. Rep., 7, 15417, https://doi.org/10.1038/s41598-017-14828-5, 2017.
Hay, C. C., Morrow, E., Kopp, R. E., and Mitrovica, J. X.: Probabilistic reanalysis of twentieth-century sea-level rise, Nature, 517, 481–484, https://doi.org/10.1038/nature14093, 2015.
Hersbach, H., Bell, B., Berrisford, P., Hirahara, S., Horányi, A., Muñoz-Sabater, J., Nicolas, J., Peubey, C., Radu, R., Schepers, D., Simmons, A., Soci, C., Abdalla, S., Abellan, X., Balsamo, G., Bechtold, P., Biavati, G., Bidlot, J., Bonavita, M., De Chiara, G., Dahlgren, P., Dee, D., Diamantakis, M., Dragani, R., Flemming, J., Forbes, R., Fuentes, M., Geer, A., Haimberger, L., Healy, S., Hogan, R. J., Hólm, E., Janisková, M., Keeley, S., Laloyaux, P., Lopez, P., Lupu, C., Radnoti, G., de Rosnay, P., Rozum, I., Vamborg, F., Villaume, S., and Thépaut, J.-N.: The ERA5 global reanalysis, Q. J. Roy. Meteor. Soc., 146, 1999–2049, https://doi.org/10.1002/qj.3803, 2020.
Hodnebrog, Ø., Aamaas, B., Fuglestvedt, J. S., Marston, G., Myhre, G., Nielsen, C. J., Sandstad, M., Shine, K. P., and Wallington, T. J.: Updated Global Warming Potentials and Radiative Efficiencies of Halocarbons and Other Weak Atmospheric Absorbers, Rev. Geophys., 58, e2019RG000691, https://doi.org/10.1029/2019RG000691, 2020.
Hodnebrog, Ø., Myhre, G., Jouan, C., Andrews, T., Forster, P. M., Jia, H., Loeb, N. G., Olivié, D. J. L., Paynter, D., Quaas, J., Raghuraman, S. P., and Schulz, M.: Recent reductions in aerosol emissions have increased Earth's energy imbalance, Commun. Earth Environ., 5, 166, https://doi.org/10.1038/s43247-024-01324-8, 2024.
Hoesly, R. M., Smith, S. J., Feng, L., Klimont, Z., Janssens-Maenhout, G., Pitkanen, T., Seibert, J. J., Vu, L., Andres, R. J., Bolt, R. M., Bond, T. C., Dawidowski, L., Kholod, N., Kurokawa, J.-I., Li, M., Liu, L., Lu, Z., Moura, M. C. P., O'Rourke, P. R., and Zhang, Q.: Historical (1750–2014) anthropogenic emissions of reactive gases and aerosols from the Community Emissions Data System (CEDS), Geosci. Model Dev., 11, 369–408, https://doi.org/10.5194/gmd-11-369-2018, 2018.
Hoesly, R., Smith, S. J., Prime, N., Ahsan, H., Suchyta, H., O'Rourke, P., Crippa, M., Klimont, Z., Guizzardi, D., Behrendt, J., Feng, L., Harkins, C., McDonald, B. C., Mott, A., McDuffie, E. E., Nicholson, M. B., and Wang, S.: CEDS v_2024_11_25 Gridded Emissions Data 0.5 degree (v_2024_11_25), Zenodo [data set], https://doi.org/10.5281/zenodo.14145000, 2024.
Hoesly, R., Smith, S. J., Ahsan, H., Prime, N., O'Rourke, P., Crippa, M., Klimont, Z., Guizzardi, D., Feng, L., Harkins, C., McDonald, B., and Wang, S.: CEDS v_2025_03_18 Aggregate Data, Zenodo [data set], https://doi.org/10.5281/zenodo.15059443, 2025.
Holbrook, N. J., Sen Gupta, A., Oliver, E. C. J., Hobday, A. J., Benthuysen, J. A., Scannell, H. A., Smale, D. A., and Wernberg, T.: Keeping pace with marine heatwaves, Nat. Rev. Earth Environ., 1, 482–493, https://doi.org/10.1038/s43017-020-0068-4, 2020.
Houghton, R. A. and Nassikas, A. A.: Global and regional fluxes of carbon from land use and land cover change 1850–2015, Global Biogeochem. Cy., 31, 456–472, https://doi.org/10.1002/2016GB005546, 2017.
Hu, L.: A Global Assessment of Coastal Marine Heatwaves and Their Relation With Coastal Urban Thermal Changes, Geophys. Res. Lett., 48, 9, https://doi.org/10.1029/2021GL093260, 2021.
Huang, B., Liu, C., Banzon, V., Freeman, E., Graham, G., Hankins, B., Smith, T., and Zhang, H.-M.: Daily Optimum Interpolation Sea Surface Temperature (DOISST) Version 2.1, J. Climate, 34, 8, https://doi.org/10.1175/JCLI-D-21-0001.1, 2021.
Huang, B., Yin, X., Boyer, T., Liu, C., Menne, M., Rao, Y. D., Smith, T., Vose, R., and Zhang, H.-M.: Extended Reconstructed Sea Surface Temperature, Version 6 (ERSSTv6). Part I: An Artificial Neural Network Approach, J. Climate, 38, 1105–1121, https://doi.org/10.1175/JCLI-D-23-0707.1, 2025.
Hubert, D., Miyazaki, K., Dufour, G., Pennington, E. A., Sofieva, V., Arosio, C., Barret, B., Boynard, A., Coldewey-Egbers, M., Cuesta, J., Heue, K.-P., Keppens, A., Kramarova, N. A., Lambert, J.-C., Loyola, D., Orfanoz-Cheuquelaf, A. P., Siddans, R., Van Malderen, R., Veefkind, P., Wespes, C., and Ziemke, J. R.: Tropospheric Ozone Assessment Report II: Past and present tropospheric ozone using satellite observations, Philos. T. Roy. Soc. A, accepted, 2026.
Hughes, T. P., Barnes, M. L., Bellwood, D. R., Cinner, J. E., Cumming, G. S., Jackson, J. B. C., Kleypas, J., van de Leemput, I. A., Lough, J. M., Morrison, T. H., Palumbi, S. R., van Nes, E. H., and Scheffer, M.: Coral reefs in the Anthropocene, Nature, 546, 82–90, https://doi.org/10.1038/nature22901, 2017.
IATA: Global Outlook for Air Transport, https://www.iata.org/en/iata-repository/publications/economic-reports/global-outlook-for-air-transport-december-2025/ (last access: 14 April 2026), 2025.
IPCC: Climate Change 2013: The Physical Science Basis. Contribution of Working Group I to the Fifth Assessment Report of the Intergovernmental Panel on Climate Change, edited by: Stocker, T. F., Qin, D., Plattner, G.-K., Tignor, M., Allen, S. K., Boschung, J., Nauels, A., Xia, Y., Bex, V., and Midgley, P. M., Cambridge University Press, Cambridge, United Kingdom and New York, NY, USA, 1535 pp., https://doi.org/10.1017/CBO9781107415324, 2013.
IPCC: Summary for Policymakers, in: Global Warming of 1.5 °C. An IPCC Special Report on the impacts of global warming of 1.5 °C above pre-industrial levels and related global greenhouse gas emission pathways, in the context of strengthening the global response to the threat of climate change, sustainable development, and efforts to eradicate poverty, edited by: Masson-Delmotte, V., Zhai, P., Pörtner, H.-O., Roberts, D., Skea, J., Shukla, P. R., Pirani, A., Moufouma-Okia, W., Péan, C., Pidcock, R., Connors, S., Matthews, J. B. R., Chen, Y., Zhou, X., Gomis, M. I., Lonnoy, E., Maycock, T., Tignor, M., and Waterfield, T., Cambridge University Press, Cambridge, UK and New York, NY, USA, 3–24, https://doi.org/10.1017/9781009157940.001, 2018.
IPCC: Climate Change 2021: The Physical Science Basis. Contribution of Working Group I to the Sixth Assessment Report of the Intergovernmental Panel on Climate Change, Cambridge University Press, Cambridge, United Kingdom and New York, NY, USA, https://doi.org/10.1017/9781009157896, 2021a.
IPCC: Summary for Policymakers, in: Climate Change 2021: The Physical Science Basis. Contribution of Working Group I to the Sixth Assessment Report of the Intergovernmental Panel on Climate Change, edited by: Masson-Delmotte, V., Zhai, P., Pirani, A., Connors, S. L., Péan, C., Berger, S., Caud, N., Chen, Y., Goldfarb, L., Gomis, M. I., Huang, M., Leitzell, K., Lonnoy, E., Matthews, J. B. R., Maycock, T. K., Waterfield, T., Yelekçi, O., Yu, R., and Zhou, B., Cambridge University Press, Cambridge, United Kingdom and New York, NY, USA, 3–32, https://doi.org/10.1017/9781009157896.001, 2021b.
IPCC: Climate Change 2022: Impacts, Adaptation, and Vulnerability. Contribution of Working Group II to the Sixth Assessment Report of the Intergovernmental Panel on Climate Change, edited by: Pörtner, H.-O., Roberts, D. C., Tignor, M., Poloczanska, E. S., Mintenbeck, K., Alegría, A., Craig, M., Langsdorf, S., Löschke, S., Möller, V., Okem, A., and Rama, B., Cambridge University Press, Cambridge University Press, Cambridge, UK and New York, NY, USA, 3056 pp., https://doi.org/10.1017/9781009325844, 2022.
IPCC: Climate Change 2023: Synthesis Report. Contribution of Working Groups I, II and III to the Sixth Assessment Report of the Intergovernmental Panel on Climate Change, edited by: Core Writing Team, Lee, H., and Romero, J., IPCC, Geneva, Switzerland, Intergovernmental Panel on Climate Change (IPCC), https://doi.org/10.59327/IPCC/AR6-9789291691647, 2023a.
IPCC: Climate Change 2023: Summary for Policy Makers. Contribution of Working Groups I, II and III to the Sixth Assessment Report of the Intergovernmental Panel on Climate Change, edited by: Core Writing Team, Lee, H., and Romero, J., IPCC, Geneva, Switzerland, Intergovernmental Panel on Climate Change (IPCC), https://doi.org/10.59327/IPCC/AR6-9789291691647, 2023b.
Iturbide, M., Fernández, J., Gutiérrez, J. M., Pirani, A., Huard, D., Al Khourdajie, A., Baño-Medina, J., Bedia, J., Casanueva, A., Cimadevilla, E., Cofiño, A. S., De Felice, M., Diez-Sierra, J., García-Díez, M., Goldie, J., Herrera, D. A., Herrera, S., Manzanas, R., Milovac, J., Radhakrishnan, A., San-Martín, D., Spinuso, A., Thyng, K. M., Trenham, C., and Yelekçi, Ö.: Implementation of FAIR principles in the IPCC: the WGI AR6 Atlas repository, Sci. Data, 9, 629, https://doi.org/10.1038/s41597-022-01739-y, 2022.
Janardanan, R., Maksyutov, S., Wang, F., Nayagam, L., Sahu, S. K., Mangaraj, P., Saunois, M., Lan, X., and Matsunaga, T.: Country-level methane emissions and their sectoral trends during 2009–2020 estimated by high-resolution inversion of GOSAT and surface observations, Environ. Res. Lett., 19, 034007, https://doi.org/10.1088/1748-9326/ad2436, 2024.
Karl, T. R., Diggs, S. C., Nutter, F., Reed, K., and Thompson, T.: The looming data loss that threatens public safety and prosperity, Eos, 107, https://doi.org/10.1029/2026EO260021, 2026.
Kirchengast, G., Gorfer, M., Mayer, M., Steiner, A. K., and Haimberger, L.: GCOS EHI 1960–2020 Atmospheric Heat Content, World Data Center for Climate (WDCC), https://doi.org/10.26050/WDCC/GCOS_EHI_1960-2020_AHC, 2022.
Kramer, R. J., He, H., Soden, B. J., Oreopoulos, L., Myhre, G., Forster, P. M., and Smith, C. J.: Observational evidence of increasing global radiative forcing, Geophys. Res. Lett., 48, e2020GL091585, https://doi.org/10.1029/2020GL091585, 2021.
Lamb, W. F., Andrew, R. M., Jones, M., Nicholls, Z., Peters, G. P., Smith, C., Saunois, M., Grassi, G., Pongratz, J., Smith, S. J., Tubiello, F. N., Crippa, M., Gidden, M., Friedlingstein, P., Minx, J., and Forster, P. M.: Differences in anthropogenic greenhouse gas emissions estimates explained, Earth Syst. Sci. Data, 18, 2549–2572, https://doi.org/10.5194/essd-18-2549-2026, 2026.
Lamboll, R. and Rogelj, J.: Carbon Budget Calculator, 2025, GitHub [code], https://github.com/Rlamboll/AR6CarbonBudgetCalc/releases/tag/RCB2025-v1 (last access: 28 May 2026), 2026.
Lamboll, R. D., Nicholls, Z. R. J., Smith, C. J., Kikstra, J. S., Byers, E., and Rogelj, J.: Assessing the size and uncertainty of remaining carbon budgets, Nat. Clim. Change, 13, 1360–1367, https://doi.org/10.1038/s41558-023-01848-5, 2023.
Lan, X., Tans, P., and Thoning, K. W.: Trends in globally-averaged CO2 determined from NOAA Global Monitoring Laboratory measurements, Version Monday, 14-Apr-2025 09:08:57 MDT, National Oceanic & Atmospheric Administration (NOAA), https://doi.org/10.15138/9N0H-ZH07, 2025.
Lan, X., Tans, P., and Thoning, K. W.: Trends in globally-averaged CO2 determined from NOAA Global Monitoring Laboratory measurements, Version Tuesday, 05-May-2026 05:42:49 MDT, National Oceanic & Atmospheric Administration (NOAA), https://doi.org/10.15138/9N0H-ZH07, 2026.
Laube, J., Newland, M., Hogan, C., Brenninkmeijer, A. M., Fraser, P.J., Martinerie, P., Oram, D. E., Reeves, C.E., Röckmann, T., Schwander, J., Witrant, E., and Sturges, W. T.: Newly detected ozone-depleting substances in the atmosphere, Nat. Geosci., 7, 266–269, https://doi.org/10.1038/ngeo2109, 2014.
Leach, N. J., Jenkins, S., Nicholls, Z., Smith, C. J., Lynch, J., Cain, M., Walsh, T., Wu, B., Tsutsui, J., and Allen, M. R.: FaIRv2.0.0: a generalized impulse response model for climate uncertainty and future scenario exploration, Geosci. Model Dev., 14, 3007–3036, https://doi.org/10.5194/gmd-14-3007-2021, 2021.
Lee, J.-Y., Marotzke, J., Bala, G., Cao, L., Corti, S., Dunne, J. P., Engelbrecht, F., Fischer, E., Fyfe, J. C., Jones, C., Maycock, A., Mutemi, J., Ndiaye, O., Panickal, S., and Zhou, T.: Future Global Climate: Scenario-Based Projections and Near-Term Information, in: Climate Change 2021: The Physical Science Basis. Contribution of Working Group I to the Sixth Assessment Report of the Intergovernmental Panel on Climate Change, edited by: Masson-Delmotte, V., Zhai, P., Pirani, A., Connors, S. L., Péan, C., Berger, S., Caud, N., Chen, Y., Goldfarb, L., Gomis, M. I., Huang, M., Leitzell, K., Lonnoy, E., Matthews, J. B. R., Maycock, T. K., Waterfield, T., Yelekçi, O., Yu, R., and Zhou, B., Cambridge University Press, Cambridge, United Kingdom and New York, NY, USA, 553–672, https://doi.org/10.1017/9781009157896.006, 2021.
Le Grix, N., Zscheischler, J., Laufkötter, C., Rousseaux, C. S., and Frölicher, T. L.: Compound high-temperature and low-chlorophyll extremes in the ocean over the satellite period, Biogeosciences, 18, 2119–2137, https://doi.org/10.5194/bg-18-2119-2021, 2021.
Li, C., Burger, F. A., Raible, C. C., and Frölicher, T. L.: Observed Regional Impacts of Marine Heatwaves on Sea-Air CO2 Exchange, Geophys. Res. Lett., 51, 24, https://doi.org/10.1029/2024GL110379, 2024.
Liu, G., Heron, S. F., Eakin, C. M., Muller-Karger, F. E., Vega-Rodriguez, M., Guild, L. S., De La Cour, J. L., Geiger, E. F., Skirving, W. J., Burgess, T. F. R., Strong, A. E., Harris, A., Maturi, E., Ignatov, A., Sapper, J., Li, J., and Lynds, S.: Reef-Scale Thermal Stress Monitoring of Coral Ecosystems: New 5-km Global Products, from NOAA Coral Reef Watch, Remote Sens., 6, https://doi.org/10.3390/rs61111579, 2014.
Loeb, N. G., Johnson, G. C., Thorsen, T. J., Lyman, J. M., Rose, F. G., and Kato, S.: Satellite and ocean data reveal marked increase in Earth's heating rate, Geophys. Res. Lett., 48, e2021GL093047, https://doi.org/10.1029/2021GL093047, 2021.
Loeb, N. G., Ham, S.-H., Allan, R. P., Thorsen, T. J., Meyssignac, B., Kato, S., Johnson, G. C., and Lyman, J. M.: Observational Assessment of Changes in Earth's Energy Imbalance Since 2000, Surv. Geophys., 45, 1757–1783, https://doi.org/10.1007/s10712-024-09838-8, 2024.
Mauritsen, T., Tsushima, Y., Meyssignac, B., Loeb, N. G., Hakuba, M., Pilewskie, P., Cole, J., Suzuki, K., Ackerman, T. P., Allan, R. P., Andrews, T., Bender, F. A.-M., Bloch-Johnson, J., Bodas-Salcedo, A., Brookshaw, A., Ceppi, P., Clerbaux, N., Dessler, A. E., Donohoe, A., Dufresne, J., Eyring, V., Findell, K. L., Gettelman, A., Gristey, J. J., Hawkins, E., Heimbach, P., Hewitt, H. T., Jeevanjee, N., Jones, C., Kang, S. M., Kato, S., Kay, J. E., Klein, S. A., Knutti, R., Kramer, R., Lee, J., McCoy, D. T., Medeiros, B., Megner, L., Modak, A., Ogura, T., Palmer, M. D., Paynter, D., Quaas, J., Ramanathan, V., Ringer, M., Von Schuckmann, K., Sherwood, S., Stevens, B., Tan, I., Tselioudis, G., Sutton, R., Voigt, A., Watanabe, M., Webb, M. J., Wild, M., and Zelinka, M. D.: Earth's Energy Imbalance More Than Doubled in Recent Decades, AGU Advances, 6, e2024AV001636, https://doi.org/10.1029/2024AV001636, 2025.
Melo, J., Rossi, S., Achard, F., Alkama, R., Canadell, J. G., Friedlingstein, P., Gibbs, D., Harris, N., Heinrich, V., O'Sullivan, M., Peters, G., Pongratz, J., Rose, M., Roman-Cuesta, R., Sanz Sanchez, M. J., Schwingshackl, C., Sitch, S., and Grassi, G.: The LULUCF data hub: translating global land use emissions estimates into the national GHG inventory framework (Version 3.0, 2025 NGHGI release) (3.0), Zenodo [data set], https://doi.org/10.5281/zenodo.17153438, 2025.
Menne, M. J., Williams, C. N., Gleason, B. E., Rennie, J. J., and Lawrimore, J. H.: The global historical climatology network monthly temperature dataset, version 4, J. Climate, 31, 9835–9854, https://doi.org/10.1175/JCLI-D-18-0094.1, 2018.
Merchant, C. J., Allan, R. P., and Embury, O.: Quantifying the acceleration of multidecadal global sea surface warming driven by Earth's energy imbalance, Environ. Res. Lett., 20, 024037, https://doi.org/10.1088/1748-9326/adaa8a, 2025.
Minière, A., von Schuckmann, K., Sallée, J.-B., and Vogt, L.: Robust acceleration of Earth system heating observed over the past six decades, Sci. Rep., 13, 22975, https://doi.org/10.1038/s41598-023-49353-1, 2023.
Minobe, S., Behrens, E., Findell, K. L., Loeb, N. G., Meyssignac, B., and Sutton, R.: Global and regional drivers for exceptional climate extremes in 2023–2024: beyond the new normal, npj Clim. Atmos. Sci., 8, 138, https://doi.org/10.1038/s41612-025-00996-z, 2025.
Minx, J. C., Lamb, W. F., Andrew, R. M., Canadell, J. G., Crippa, M., Döbbeling, N., Forster, P. M., Guizzardi, D., Olivier, J., Peters, G. P., Pongratz, J., Reisinger, A., Rigby, M., Saunois, M., Smith, S. J., Solazzo, E., and Tian, H.: A comprehensive and synthetic dataset for global, regional, and national greenhouse gas emissions by sector 1970–2018 with an extension to 2019, Earth Syst. Sci. Data, 13, 5213–5252, https://doi.org/10.5194/essd-13-5213-2021, 2021.
Mu, D., Huang, R., Yin, P., Yan, H., and Xu, T.: Reconstructing sea level rise from global 945 tide gauges since 1900, Earth Syst. Sci. Data, 17, 5507–5528, https://doi.org/10.5194/essd-17-5507-2025, 2025.
Müller, J. D., Gruber, N., Schneuwly, A., Bakker, D. C. E., Gehlen, M., Gregor, L., Hauck, J., Landschuetzer, P., and McKinley G. A.: Unexpected decline in the ocean carbon sink under record-high sea surface temperatures in 2023, Nat. Clim. Change, 15, 978–985, https://doi.org/10.1038/s41558-025-02380-4, 2025.
Myhre, G., Hodnebrog, Ø., Loeb, N., and Forster, P. M.: Observed trend in Earth energy imbalance may provide a constraint for low climate sensitivity models, Science, 388, 1210–1213, https://doi.org/10.1126/science.adt0647, 2025.
NASA: Satellite sea level observations, NASA [data set], https://sealevel.nasa.gov/understanding-sea-level/key-indicators/global-mean-sea-level/ (last access: 19 February 2025), 2025.
Nitzbon, J., Krinner, G., and Langer, M.: GCOS EHI 1960–2020 Permafrost Heat Content, World Data Center for Climate (WDCC) at DKRZ, https://doi.org/10.26050/WDCC/GCOS_EHI_1960-2020_PHC, 2022.
NOAA: Global sea level timeseries, NOAA [data set], https://www.star.nesdis.noaa.gov/socd/lsa/SeaLevelRise/LSA_SLR_timeseries.php (last access: 19 February 2025), 2025.
Nogueira, M.: Inter-comparison of ERA-5, ERA-interim and GPCP rainfall over the last 40 years: Process-based analysis of systematic and random differences, J. Hydrol., 583, 124632, https://doi.org/10.1016/j.jhydrol.2020.124632, 2020.
Oliveira, A. P. and Gil Martins, P.: Global Shifts in Fire Regimes Under Climate Change: Patterns, Drivers, and Ecological Implications Across Biomes, Forests, 17, 104, https://doi.org/10.3390/f17010104, 2026.
Oliver, E. C. J., Donat, M. G., Burrows, M. T., Moore, P. J., Smale, D. A., Alexander, L. V., Benthuysen, J. A., Feng, M., Sen Gupta, A., Hobday, A. J., Holbrook, N. J., Perkins-Kirkpatrick, S. E., Scannell, H. A., Straub, S. C., and Wernberg, T.: Longer and more frequent marine heatwaves over the past century, Nat. Commun., 9, 1324, https://doi.org/10.1038/s41467-018-03732-9, 2018.
Oppenheimer, M., Glavovic, B. C., Hinkel, J., van de Wal, R., Magnan, A. K., Abd-Elgawad, A., Cai, R., CifuentesJara, M., DeConto, R. M., Ghosh, T., Hay, J., Isla, F., Marzeion, B., Meyssignac, B., and Sebesvari, Z.: Sea Level Rise and Implications for Low-Lying Islands, Coasts and Communities, in: IPCC Special Report on the Ocean and Cryosphere in a Changing Climate, edited by: Pörtner, H.-O., Roberts, D. C., Masson-Delmotte, V., Zhai, P., Tignor, M., Poloczanska, E., Mintenbeck, K., Alegría, A., Nicolai, M., Okem, A., Petzold, J., Rama, B., and Weyer, N. M., Cambridge University Press, Cambridge, UK and New York, NY, USA, 321–445, https://doi.org/10.1017/9781009157964.006, 2019.
Palmer, M. D. and McNeall, D. J.: Internal variability of Earth's energy budget simulated by CMIP5 climate models, Environ. Res. Lett., 9, 034016, https://doi.org/10.1088/1748-9326/9/3/034016, 2014.
Palmer, M. D., Domingues, C. M., Slangen, A. B. A., and Boeira Dias, F.: An ensemble approach to quantify global mean sea-level rise over the 20th century from tide gauge reconstructions, Environ. Res. Lett., 16, 044043, https://doi.org/10.1088/1748-9326/abdaec, 2021.
Pan, Y., Cheng, L., Abraham, J., Trenberth, K. E., Reagan, J., Du, J., Wang, Z., Storto, A., Von Schuckmann, K., Zhu, Y., Mann, M. E., Zhu, J., Wang, F., Yu, F., Locarnini, R., Fasullo, J., Huang, B., Graham, G., Yin, X., Gouretski, V., Zheng, F., Li, Y., Zhang, B., Wan, L., Chen, X., Wang, D., Feng, L., Song, X., Liu, Y., Reseghetti, F., Simoncelli, S., Chen, G., Zhang, R., Mishonov, A., Wei, W., Tan, Z., Li, G., Cao, L., Chen, L., Yuan, H., Lyu, K., Sulaiman, A., Mayer, M., Wang, H., Ma, Z., Bao, S., Yan, H., Liu, Z., Yang, C., Liu, X., Hausfather, Z., Gues, F., Song, X., Zhang, M., and Chen, L.: Ocean Heat Content Sets Another Record in 2025, Adv. Atmos. Sci., https://doi.org/10.1007/s00376-026-5876-0, 2026.
Pirani, A., Alegria, A., Khourdajie, A. A., Gunawan, W., Gutiérrez, J. M., Holsman, K., Huard, D., Juckes, M., Kawamiya, M., Klutse, N., Krey, V., Matthews, R., Milward, A., Pascoe, C., Van Der Shrier, G., Spinuso, A., Stockhause, M., and Xing, X.: The implementation of FAIR data principles in the IPCC AR6 assessment process, Zenodo, https://doi.org/10.5281/zenodo.6504469, 2022.
Prinn, R. G., Weiss, R. F., Arduini, J., Arnold, T., DeWitt, H. L., Fraser, P. J., Ganesan, A. L., Gasore, J., Harth, C. M., Hermansen, O., Kim, J., Krummel, P. B., Li, S., Loh, Z. M., Lunder, C. R., Maione, M., Manning, A. J., Miller, B. R., Mitrevski, B., Mühle, J., O'Doherty, S., Park, S., Reimann, S., Rigby, M., Saito, T., Salameh, P. K., Schmidt, R., Simmonds, P. G., Steele, L. P., Vollmer, M. K., Wang, R. H., Yao, B., Yokouchi, Y., Young, D., and Zhou, L.: History of chemically and radiatively important atmospheric gases from the Advanced Global Atmospheric Gases Experiment (AGAGE), Earth Syst. Sci. Data, 10, 985–1018, https://doi.org/10.5194/essd-10-985-2018, 2018.
Prinn, R., Weiss, R., Arduini, J., Choi, H., Engel, A., Fraser, P., Ganesan, A., Harth, C., Hermansen, O., Kim, J., Krummel, P., Loh, Z., Lunder, C., Maione, M., Manning, A., Mitrevski, B., Mühle, J., O'Doherty, S., Park, S., Pitt, J., Reimann, S., Rigby, M., Saito, T., Salameh, P., Schmidt, R., Simmonds, P., Stanley, K., Stavert, A., Steele, P., Vollmer, M., Wagenhäuser, T., Wang, H., Wenger, A., Western, L., Yao, B., Young, D., Zhou, L., and Zhu, L.: The dataset of in-situ measurements of chemically and radiatively important atmospheric gases from the Advanced Global Atmospheric Gas Experiment (AGAGE) and affiliated stations (20251230), NASA Langley Research Center (LaRC) Data Host Facility (DHF), https://doi.org/10.60718/2ZET-CN22, 2025.
Qin, Z., Zhu, Y., Canadell, J. G., Chen, M., Li, T., Mishra, U., and Yuan, W.: Global spatially explicit carbon emissions from land-use change over the past six decades (1961–2020), One Earth, 7, 835–847, https://doi.org/10.1016/j.oneear.2024.04.002, 2024.
Raghuraman, S. P., Paynter, D., and Ramaswamy, V.: Anthropogenic forcing and response yield observed positive trend in Earth's energy imbalance, Nat. Commun., 12, 4577, https://doi.org/10.1038/s41467-021-24544-4, 2021.
Rhein, M., Rintoul, S. R., Aoki, S., Campos, E., Chambers, D., Feely, R. A., Gulev, S., Johnson, G. C., Josey, S. A., Kostianoy, A., Mauritzen, C., Roemmich, D., Talley, L. D., and Wang, F.: Observations: Ocean, in: Climate Change 2013: The Physical Science Basis. Contribution of Working Group I to the Fifth Assessment Report of the Intergovernmental Panel on Climate Change, edited by: Stocker, T. F., Qin, D., Plattner, G.-K., Tignor, M., Allen, S. K., Boschung, J., Nauels, A., Xia, Y., Bex, V., and Midgley, P. M., Cambridge University Press, Cambridge, United Kingdom and New York, NY, USA, https://doi.org/10.1017/CBO9781107415324.010, 2013.
Ribes, A., Qasmi, S., and Gillett, N. P.: Making climate projections conditional on historical observations, Sci. Adv., 7, eabc0671, https://doi.org/10.1126/sciadv.abc0671, 2021.
Ribes, A., Tessiot, O., Forster, P. M., Gillett, N. P., Masson-Delmotte, V., Rogelj, J., Vautard, R., and Walsh, T.: Towards annual updating of forced warming to date and constrained climate projections, Nat. Commun., 16, 9214, https://doi.org/10.1038/s41467-025-63026-9, 2025.
Rogelj, J. and Lamboll, R. D.: Substantial reductions in non-CO2 greenhouse gas emissions reductions implied by IPCC estimates of the remaining carbon budget, Commun. Earth Environ., 5, 35, https://doi.org/10.1038/s43247-023-01168-8, 2024.
Rogelj, J., Shindell, D., Jiang, K., Fifita, S., Forster, P., Ginzburg, V., Handa, C., Kheshgi, H., Kobayashi, S., Kriegler, E., Mundaca, L., Séférian, R., and Vilariño, M. V.: Mitigation Pathways Compatible with 1.5 °C in the Context of Sustainable Development, in: Global Warming of 1.5 °C. An IPCC Special Report on the impacts of global warming of 1.5 °C above pre-industrial levels and related global greenhouse gas emission pathways, in the context of strengthening the global response to the threat of climate change, sustainable development, and efforts to eradicate poverty, edited by: Masson-Delmotte, V., Zhai, P., Pörtner, H.-O., Roberts, D., Skea, J., Shukla, P. R., Pirani, A., Moufouma-Okia, W., Péan, C., Pidcock, R., Connors, S., Matthews, J. B. R., Chen, Y., Zhou, X., Gomis, M. I., Lonnoy, E., Maycock, T., Tignor, M., and Waterfield, T., Cambridge University Press, Cambridge, UK and New York, NY, USA, 93–174, https://doi.org/10.1017/9781009157940.004, 2018.
Rogelj, J., Forster, P. M., Kriegler, E., Smith, C. J., and Séférian, R.: Estimating and tracking the remaining carbon budget for stringent climate targets, Nature, 571, 335–342, https://doi.org/10.1038/s41586-019-1368-z, 2019.
Rogelj, J., Rao, S., McCollum, D. L., Pachauri, S., Klimont, Z., Krey, V., and Riahi, K: Air-pollution emission ranges consistent with the representative concentration pathways, Nat. Clim. Change, 4, 446–450, https://doi.org/10.1038/nclimate2178, 2014.
Rohde, R., Muller, R., Jacobsen, R., Perlmutter, S., Rosenfeld, A., Wurtele, J., Curry, J., Wickham, C., and Mosher, S.: Berkeley Earth Temperature Averaging Process, Geoinformatics & Geostatistics: An Overview, 1, 13, https://doi.org/10.4172/2327-4581.1000103, 2013.
Romanello, M., Walawender, M., Hsu, S.-C., et al.: The 2025 report of the Lancet Countdown on health and climate change: climate change action offers a lifeline, Lancet, 406, 2804–2857, https://doi.org/10.1016/S0140-6736(25)01919-1, 2025.
Sawyer, V., Levy, R. C., Mattoo, S., Shi, Y. R., Kim, M., Remer, L. A., and Cureton G.: An updated VIIRS dark target aerosol product for continuity with MODIS: assessing regional aerosol trends, Front. Environ. Sci., 13, 1602145, https://doi.org/10.3389/fenvs.2025.1602145, 2025.
Scarpelli, T. R., Jacob, D. J., Grossman, S., Lu, X., Qu, Z., Sulprizio, M. P., Zhang, Y., Reuland, F., Gordon, D., and Worden, J. R.: Updated Global Fuel Exploitation Inventory (GFEI) for methane emissions from the oil, gas, and coal sectors: evaluation with inversions of atmospheric methane observations, Atmos. Chem. Phys., 22, 3235–3249, https://doi.org/10.5194/acp-22-3235-2022, 2022.
Schamm, K., Ziese, M., Becker, A., Finger, P., Meyer-Christoffer, A., Schneider, U., Schröder, M., and Stender, P.: Global gridded precipitation over land: a description of the new GPCC First Guess Daily product, Earth Syst. Sci. Data, 6, 49–60, https://doi.org/10.5194/essd-6-49-2014, 2014.
Schoeberl, M. R., Wang, Y., Taha, G., Zawada, D. J., Ueyama, R., and Dessler, A.: Evolution of the Climate Forcing During the Two Years After the Hunga Tonga-Hunga Ha'apai Eruption, J. Geophys. Res.-Atmos., 129, e2024JD041296, https://doi.org/10.1029/2024JD041296, 2024.
Seneviratne, S. I., Zhang, X., Adnan, M., Badi, W., Dereczynski, C., Di Luca, A., Ghosh, S., Iskandar, I., Kossin, J., Lewis, S., Otto, F., Pinto, I., Satoh, M., Vicente-Serrano, S. M., Wehner, M., and Zhou, B.: Weather and Climate Extreme Events in a Changing Climate, in: Climate Change 2021: The Physical Science Basis. Contribution of Working Group I to the Sixth Assessment Report of the Intergovernmental Panel on Climate Change, edited by: Masson-Delmotte, V., Zhai, P., Pirani, A., Connors, S. L., Péan, C., Berger, S., Caud, N., Chen, Y., Goldfarb, L., Gomis, M. I., Huang, M., Leitzell, K., Lonnoy, E., Matthews, J. B. R., Maycock, T. K., Waterfield, T., Yelekçi, O., Yu, R., and Zhou, B., Cambridge University Press, Cambridge, United Kingdom and New York, NY, USA, 1513–1766, https://doi.org/10.1017/9781009157896.013, 2021.
Simmonds, P. G., Rigby, M., McCulloch, A., O'Doherty, S., Young, D., Mühle, J., Krummel, P. B., Steele, P., Fraser, P. J., Manning, A. J., Weiss, R. F., Salameh, P. K., Harth, C. M., Wang, R. H. J., and Prinn, R. G.: Changing trends and emissions of hydrochlorofluorocarbons (HCFCs) and their hydrofluorocarbon (HFCs) replacements, Atmos. Chem. Phys., 17, 4641–4655, https://doi.org/10.5194/acp-17-4641-2017, 2017.
Smale, D. A., Wernberg, T., Oliver, E. C. J., Thomsen, M., Harvey, B. P., Straub, S. C., Burrows, M. T., Alexander, L. V., Benthuysen, J. A., Donat, M. G., Feng, M., Hobday, A. J., Holbrook, N. J., Perkins-Kirkpatrick, S. E., Scannell, H. A., Sen Gupta, A., Payne, B. L., and Moore, P. J.: Marine heatwaves threaten global biodiversity and the provision of ecosystem services, Nat. Clim. Change, 9, 306–312, https://doi.org/10.1038/s41558-019-0412-1, 2019.
Smith, C., Nicholls, Z. R. J., Armour, K., Collins, W., Forster, P., Meinshausen, M., Palmer, M. D., and Watanabe, M.: The Earth's Energy Budget, Climate Feedbacks, and Climate Sensitivity Supplementary Material, in: Climate Change 2021: The Physical Science Basis. Contribution of Working Group I to the Sixth Assessment Report of the Intergovernmental Panel on Climate Change, edited by: Masson-Delmotte, V., Zhai, P., Pirani, A., Connors, S. L., Péan, C., Berger, S., Caud, N., Chen, Y., Goldfarb, L., Gomis, M. I., Huang, M., Leitzell, K., Lonnoy, E., Matthews, J. B. R., Maycock, T. K., Waterfield, T., Yelekçi, O., Yu, R., and Zhou, B., https://www.ipcc.ch/ (last access: 3 June 2026), 2021a.
Smith, C., Cummins, D. P., Fredriksen, H.-B., Nicholls, Z., Meinshausen, M., Allen, M., Jenkins, S., Leach, N., Mathison, C., and Partanen, A.-I.: fair-calibrate v1.4.1: calibration, constraining, and validation of the FaIR simple climate model for reliable future climate projections, Geosci. Model Dev., 17, 8569–8592, https://doi.org/10.5194/gmd-17-8569-2024, 2024.
Smith, C., Walsh, T., Gillett, N., Hauser, M., Krummel, P., Lamb, W., Lamboll, R., Mühle, J., Palmer, M., Ribes, A., Schumacher, D., Seneviratne, S., Slangen, A., Trewin, B., von Schuckmann, K., and Forster, P.: Indicators of Global Climate Change 2025 (v2026.06.02), Zenodo [data set, software], https://doi.org/10.5281/zenodo.20499280, 2026a.
Smith, C., Walsh, T., Gillett, N., Hall, B., Hauser, M., Krummel, P., Lamb, W., Lamboll, R., X., Muhle, J., Palmer, M., Ribes, A., Seneviratne, S., Trewin, B., von Schuckmann, K., and Forster, P.: Data repository for Indicators of Global Climate Change, GitHub [code], https://github.com/ClimateIndicator/data/tree/v2026.06.02 (last access: 2 June 2026), 2026b.
Smith, K. E., Burrows, M. T., Hobday, A. J., Sen Gupta, A., Moore, P. J., Thomsen, M., Wernberg, T., and Smale, D. A.: Socioeconomic impacts of marine heatwaves: Global issues and opportunities, Science, 374, 6566, https://doi.org/10.1126/science.abj3593, 2021b.
Smith, K. E., Burrows, M. T., Hobday, A. J., King, N. G., Moore, P. J., Sen Gupta, A., Thomsen, M. S., Wernberg, T., and Smale, D. A.: Biological Impacts of Marine Heatwaves, Annu. Rev. Mar. Sci., 15, 119–145, https://doi.org/10.1146/annurev-marine-032122-121437, 2023.
Smith, S. J., van Aardenne, J., Klimont, Z., Andres, R. J., Volke, A., and Delgado Arias, S.: Anthropogenic sulfur dioxide emissions: 1850–2005, Atmos. Chem. Phys., 11, 1101–1116, https://doi.org/10.5194/acp-11-1101-2011, 2011.
Song, C., Ponder, D., Peng, W., and Ren, Z. J.: Discrepancies in national inventories reveal a large emissions gap in the wastewater sector, Nat. Clim. Change, 16, 313–321, https://doi.org/10.1038/s41558-025-02540-6, 2026.
Soulie, A., Granier, C., Darras, S., Zilbermann, N., Doumbia, T., Guevara, M., Jalkanen, J.-P., Keita, S., Liousse, C., Crippa, M., Guizzardi, D., Hoesly, R., and Smith, S. J.: Global anthropogenic emissions (CAMS-GLOB-ANT) for the Copernicus Atmosphere Monitoring Service simulations of air quality forecasts and reanalyses, Earth Syst. Sci. Data, 16, 2261–2279, https://doi.org/10.5194/essd-16-2261-2024, 2024.
Storto, A. and Yang, C.: Acceleration of the ocean warming from 1961 to 2022 unveiled by large-ensemble reanalyses, Nat. Commun., 15, 545, https://doi.org/10.1038/s41467-024-44749-7, 2024.
Su, J., Miao, C., Zwiers, F., Beck, H., Jones, P., Sun, Q., Slater, L. J., Berghuijs, W. R., Wada, Y., Rosenfeld, D., Gou, J., Wu, Y., Tarolli, P., Borrelli, P., Panagos, P., Alexander, L. V., Zhang, Q., Hu, J., Min, S.-K., Samaniego, L., Duan, Q., Destouni, G., Marengo, J. A., Modarres, R., and Sorooshian, S.: Precipitation observing network gaps limit climate change impact assessment, Nature, https://doi.org/10.1038/s41586-026-10300-5, 2026.
Sun, Q., Miao, C., Duan, Q., Ashouri, H., Sorooshian, S., and Hsu, K.-L.: A review of global precipitation data sets: Data sources, estimation, and intercomparisons, Rev. Geophys., 56, 79–107, https://doi.org/10.1002/2017RG000574, 2018.
Szopa, S., Naik, V., Adhikary, B., Artaxo, P., Berntsen, T., Collins, W. D., Fuzzi, S., Gallardo, L., Kiendler-Scharr, A., Klimont, Z., Liao, H., Unger, N., and Zanis, P.: Short-Lived Climate Forcers, in: Climate Change 2021: The Physical Science Basis. Contribution of Working Group I to the Sixth Assessment Report of the Intergovernmental Panel on Climate Change, edited by: Masson-Delmotte, V., Zhai, P., Pirani, A., Connors, S. L., Péan, C., Berger, S., Caud, N., Chen, Y., Goldfarb, L., Gomis, M. I., Huang, M., Leitzell, K., Lonnoy, E., Matthews, J. B. R., Maycock, T. K., Waterfield, T., Yelekçi, O., Yu, R., and Zhou, B., Cambridge University Press, Cambridge, United Kingdom and New York, NY, USA, 817–922, https://doi.org/10.1017/9781009157896.008, 2021.
Szopa, S., Cooper, O. R., Collins, W. J., Fiore, A. M., Lee, J., Lin, M., Naik, V., Turnock, S. T., and West, J. J.: Tropospheric Ozone Assessment Report Phase-II: Ozone interactions with climate change: drivers and long-term trends, Philos. T. Roy Soc. A, in review, 2026.
Thorne, P. W., Nicklas, J. M., Kennedy, J. J., Calvert, B., Fox-Kemper, B., Richardson, M. T., Simmons, A., Hawkins, E., Rhode, R., Cowtan, K., Abram, N. J., Andersson, A., Noone, S., Marbaix, P., Lenssen, N., Olonscheck, D., Walsh, T., Outten, S., Bethke, I., Samset, B. H., Smith, C., Pirani, A., Fuglestvedt, J., Rajamani, L., Betts, R. A., Kent, E. C., Trewin, B., Morice, C., Osborn, T., Burgess, S. N., Geden, O., Parnell, A., Forster, P. M., Hewitt, C., Hausfather, Z., Masson-Delmotte, V., Marotzke, J., Gillett, N., Seneviratne, S. I., Schmidt, G. A., Chan, D., Brönnimann, S., Reisinger, A., Menne, M., Rojas Corradi, M., Kadow, C., Huybers, P., Stephenson, D. B., Wallis, E., Rogelj, J., Schurer, A., McKinnon, K., Zhai, P., Driouech, F., Moufouma Okia, W., Vazifehkhah, S., Szopa, S., Merchant, C. J., Hirahara, S., Ishii, M., Engelbrecht, F. A., Li, Q., Lee, J.-Y., Cannon, A. J., Cassou, C., von Schuckmann, K., Delju, A. H., and Murtagh, E.: How well can we quantify when 1.5 °C of global warming has been exceeded?, Earth Syst. Sci. Data Discuss. [preprint], https://doi.org/10.5194/essd-2025-825, in review, 2026.
Tibrewal, K., Ciais, P., Saunois, M., Martinez, A., Lin, X., Thanwerdas, J., Deng, Z., Chevallier, F., Giron, C., Albergel, C., Tanaka, K., Patra, P., Tsuruta, A., Zheng, B., Belikov, D., Niwa, Y., Janardanan, R., Maksyutov, S., Segers, A., Tzompa-Sosa, Z. A., Bousquet, P., and Sciare, J.: Assessment of methane emissions from oil, gas and coal sectors across inventories and atmospheric inversions, Commun. Earth Environ., 5, 26, https://doi.org/10.1038/s43247-023-01190-w, 2024.
Tsuchida, K., Kosaka, Y., and Minobe, S.: Multi-year La Niña–El Niño transition influenced Earth's extreme energy uptake in 2022–2023, Nat. Geosci., https://doi.org/10.1038/s41561-026-01921-6, 2026.
UNEP (United Nations Environment Programme): Emissions Gap Report 2025: Off Target – Continued Collective inaction puts Global Temperature Goal at Risk, United Nations Environment Programme, https://doi.org/10.59117/20.500.11822/48854, 2025a.
UNEP (United Nations Environment Programme): Global Environment Outlook 7: A future we choose – Why investing in Earth now can lead to a trillion-dollar benefit for all, Nairobi, https://wedocs.unep.org/handle/20.500.11822/49014 (last access: 14 April 2026), 2025b.
Vakilifard, N., Williams, R. G., Holden, P. B., Turner, K., Edwards, N. R., and Beerling, D. J.: Impact of negative and positive CO2 emissions on global warming metrics using an ensemble of Earth system model simulations, Biogeosciences, 19, 4249–4265, https://doi.org/10.5194/bg-19-4249-2022, 2022.
Vanderkelen, I. and Thiery, W.: GCOS EHI 1960–2020 Inland Water Heat Content, https://doi.org/10.26050/WDCC/GCOS_EHI_1960-2020_IWHC, 2022.
van der Werf, G. R., Randerson, J. T., Giglio, L., van Leeuwen, T. T., Chen, Y., Rogers, B. M., Mu, M., van Marle, M. J. E., Morton, D. C., Collatz, G. J., Yokelson, R. J., and Kasibhatla, P. S.: Global fire emissions estimates during 1997–2016, Earth Syst. Sci. Data, 9, 697–720, https://doi.org/10.5194/essd-9-697-2017, 2017.
van der Werf, G. R., Randerson, J. T., van Wees, D., Chen, Y., Giglio, L., Hall, J., Vernooij, R., Mu, M., Shahid, S. B., Barsanti, K. C., Yokelson, R., and Morton, D. C.: Landscape fire emissions from the 5th version of the Global Fire Emissions Database (GFED5), Sci. Data, 12, 1870, https://doi.org/10.1038/s41597-025-06127-w, 2025.
Vimont, I. J., Hall, B. D., Dutton, G., Montzka, S. A., Mühle, J., Crotwell, M., Petersen, K., Clingan, S., and Nance, D.: Ozone-Depleting Substances and their Substitutes [in “State of the Climate in 2022”], B. Am. Meteorol. Soc., 104, S76–S78, https://doi.org/10.1175/BAMS-D-23-0090.1, 2022.
Vollmer, M. K., Young, D., Trudinger, C. M., Mühle, J., Henne, S., Rigby, M., Park, S., Li, S., Guillevic, M., Mitrevski, B., Harth, C. M., Miller, B. R., Reimann, S., Yao, B., Steele, L. P., Wyss, S. A., Lunder, C. R., Arduini, J., McCulloch, A., Wu, S., Rhee, T. S., Wang, R. H. J., Salameh, P. K., Hermansen, O., Hill, M., Langenfelds, R. L., Ivy, D., O'Doherty, S., Krummel, P. B., Maione, M., Etheridge, D. M., Zhou, L., Fraser, P. J., Prinn, R. G., Weiss, R. F., and Simmonds, P. G.: Atmospheric histories and emissions of chlorofluorocarbons CFC-13 (CClF3), ΣCFC-114 (C2Cl2F4), and CFC-115 (C2ClF5), Atmos. Chem. Phys., 18, 979–1002, https://doi.org/10.5194/acp-18-979-2018, 2018.
von Schuckmann, K., Cheng, L., Palmer, M. D., Hansen, J., Tassone, C., Aich, V., Adusumilli, S., Beltrami, H., Boyer, T., Cuesta-Valero, F. J., Desbruyères, D., Domingues, C., García-García, A., Gentine, P., Gilson, J., Gorfer, M., Haimberger, L., Ishii, M., Johnson, G. C., Killick, R., King, B. A., Kirchengast, G., Kolodziejczyk, N., Lyman, J., Marzeion, B., Mayer, M., Monier, M., Monselesan, D. P., Purkey, S., Roemmich, D., Schweiger, A., Seneviratne, S. I., Shepherd, A., Slater, D. A., Steiner, A. K., Straneo, F., Timmermans, M.-L., and Wijffels, S. E.: Heat stored in the Earth system: where does the energy go?, Earth Syst. Sci. Data, 12, 2013–2041, https://doi.org/10.5194/essd-12-2013-2020, 2020.
von Schuckmann, K., Minière, A., Gues, F., Cuesta-Valero, F. J., Kirchengast, G., Adusumilli, S., Straneo, F., Ablain, M., Allan, R. P., Barker, P. M., Beltrami, H., Blazquez, A., Boyer, T., Cheng, L., Church, J., Desbruyeres, D., Dolman, H., Domingues, C. M., García-García, A., Giglio, D., Gilson, J. E., Gorfer, M., Haimberger, L., Hakuba, M. Z., Hendricks, S., Hosoda, S., Johnson, G. C., Killick, R., King, B., Kolodziejczyk, N., Korosov, A., Krinner, G., Kuusela, M., Landerer, F. W., Langer, M., Lavergne, T., Lawrence, I., Li, Y., Lyman, J., Marti, F., Marzeion, B., Mayer, M., MacDougall, A. H., McDougall, T., Monselesan, D. P., Nitzbon, J., Otosaka, I., Peng, J., Purkey, S., Roemmich, D., Sato, K., Sato, K., Savita, A., Schweiger, A., Shepherd, A., Seneviratne, S. I., Simons, L., Slater, D. A., Slater, T., Steiner, A. K., Suga, T., Szekely, T., Thiery, W., Timmermans, M.-L., Vanderkelen, I., Wjiffels, S. E., Wu, T., and Zemp, M.: Heat stored in the Earth system 1960–2020: where does the energy go?, Earth Syst. Sci. Data, 15, 1675–1709, https://doi.org/10.5194/essd-15-1675-2023, 2023a.
von Schuckmann, K., Minière, A., Gues, F., Cuesta-Valero, F. J., Kirchengast, G., Adusumilli, S., Straneo, F., Allan, R., Barker, P. M., Beltrami, H., Boyer, T., Cheng, L., Church, J., Desbruyeres, D., Dolman, H., Domingues, C. M., García-García, A., Gilson, J., Gorfer, M., Haimberger, L., Hendricks, S., Hosoda, S., Johnson, G. C., Killick, R., King, B. A., Kolodziejczyk, N., Korosov, A., Krinner, G., Kuusela, M., Langer, M., Lavergne, T., Lawrence, I., Li, Y., Lyman, J., Marzeion, B., Mayer, M., MacDougall, A., McDougall, T., Monselesan, D. P., Nitzbon, J., Otosaka, I., Peng, J., Purkey, S., Roemmich, D., Sato, K., Sato, K., Savita, A., Schweiger, A., Shepherd, A., Seneviratne, S. I., Slater, D. A., Slater, T., Simons, L., Steiner, A. K., Szekely, T., Suga, T., Thiery, W., Timmermanns, M.-L., Vanderkelen, I., Wijffels, S. E., Wu, T., and Zemp, M.: GCOS EHI 1960–2020 Earth Heat Inventory Ocean Heat Content (Version 2), World Data Center for Climate (WDCC) at DKRZ, https://doi.org/10.26050/WDCC/GCOS_EHI_1960-2020_OHC_v2, 2023b.
Wang, J., Church, J. A., Zhang, X., and Chen, X.: Improved Sea Level Reconstruction from 1900 to 2019, J. Climate, 37, 6453–6474, https://doi.org/10.1175/JCLI-D-23-0410.1, 2024.
Wernberg, T., Thomsen, M. S., Burrows, M. T., Filbee-Dexter, K., Hobday, A. J., Holbrook, N. J., Montie, S., Moore, P. J., Oliver, E. C. J., Sen Gupta, A., Smale, D. A., and Smith, K.: Marine heatwaves as hot spots of climate change and impacts on biodiversity and ecosystem services, Nat. Rev. Biodivers., 1, 461–479, https://doi.org/10.1038/s44358-025-00058-5, 2025.
Western, L. M., Vollmer, M. K., Krummel, P. B., Adcock, K. E., Fraser, P. J., Harth, C. M., Langenfelds, R. L., Montzka, S. A., Mühle, J., O'Doherty, S., Oram, D. E., Reimann, S., Rigby, M., Vimont, I., Weiss, R. F., Young, D., and Laube, J. C.: Global increase of ozone-depleting chlorofluorocarbons from 2010 to 2020, Nat. Geosci., 16, 309–313, https://doi.org/10.1038/s41561-023-01147-w, 2023.
Western, L. M., Daniel, J. S., Vollmer, M. K., Clingan, S., Crotwell, M., Fraser, P. J., Ganesan, A. L., Hall, B., Harth, C. M., Krummel, P. B., Mühle, J., O'Doherty, S., Salameh, P. K., Stanley, K. M., Reimann, S., Vimont, I., Young, D., Rigby, M., Weiss, R. F., Prinn, R. G., and Montzka, S. A.: A decrease in radiative forcing and equivalent effective chlorine from hydrochlorofluorocarbons, Nat. Clim. Change, 14, 805–807, https://doi.org/10.1038/s41558-024-02038-7, 2024.
Western, L. M., Rigby, M., Mühle, J., Krummel, P. B., Lunder, C. R., O'Doherty, S., Reimann, S., Vollmer, M. K., Young, D., Adam, B., Fraser, P. J., Ganesan, A. L., Harth, C. M., Hermansen, O., Kim, J., Langenfelds, R. L., Loh, Z. M., Mitrevski, B., Pitt, J. R., Salameh, P. K., Schmidt, R., Stanley, K., Stavert, A. R., Wang, H.-J., Weiss, R. F., and Prinn, R. G.: Global emissions and abundances of chemically and radiatively important trace gases from the AGAGE network, Earth Syst. Sci. Data, 17, 6557–6582, https://doi.org/10.5194/essd-17-6557-2025, 2025.
Western, L. M., Rigby, M., Mühle, J., Krummel, P. B., Lunder, C. R., O'Doherty, S., Reimann, S., Vollmer, M. K., Adam, B., Fraser, P. J., Ganesan, A. L., Harth, C. M., Hermansen, O., Kim, J., Langenfelds, R. L., Loh, Z. M., Mitrevski, B., Pitt, J. R., Salameh, P. K., Schmidt, R., Stanley, K., Stavert, A. R., Wang, H.-J. (Ray), Young, D., Weiss, R. F., and Prinn, R. G.: Global Emissions and Abundances of Chemically and Radiatively Important Trace Gases from the AGAGE Network (20260305), Zenodo, https://doi.org/10.5281/zenodo.18878005, 2026.
Wild, M., Gilgen, H., Roesch, A., Ohmura, A., Long, C. N., Dutton, E. G., Forgan, B., Kallis, A., Russak, V., and Tsvetkov, A.: From Dimming to Brightening: Decadal Changes in Solar Radiation at Earth's Surface, Science, 308, 847–850, https://doi.org/10.1126/science.1103215, 2005.
WMO (World Meteorological Organization): State of the Global Climate 2025, WMO-No. 1342, Geneva, https://doi.org/10.59327/WMO/S/CRI/SOC/1, 2026.
Yate, T. A. and Ren, G.: An overview of observed changes in precipitation totals and extremes over global land, with a focus on Africa, Earth-Sci. Rev., 262, 105063, https://doi.org/10.1016/j.earscirev.2025.105063, 2025.
Zhang, J., Kinnison, D., Zhu, Y., Wang, X., Tilmes, S., Dube, K., and Randel, W.: Chemistry Contribution to Stratospheric Ozone Depletion After the Unprecedented Water-Rich Hunga Tonga Eruption, Geophys. Res. Lett., 51, e2023GL105762, https://doi.org/10.1029/2023GL105762, 2024a.
Zhang, W., Zhou, T., and Wu, P.: Anthropogenic amplification of precipitation variability over the past century, Science, 385, 427–432, https://doi.org/10.1126/science.adp0212, 2024b.
Zhang, Z., Poulter, B., Melton, J. R., Riley, W. J., Allen, G. H., Beerling, D. J., Bousquet, P., Canadell, J. G., Fluet-Chouinard, E., Ciais, P., Gedney, N., Hopcroft, P. O., Ito, A., Jackson, R. B., Jain, A. K., Jensen, K., Joos, F., Kleinen, T., Knox, S. H., Li, T., Li, X., Liu, X., McDonald, K., McNicol, G., Miller, P. A., Müller, J., Patra, P. K., Peng, C., Peng, S., Qin, Z., Riggs, R. M., Saunois, M., Sun, Q., Tian, H., Xu, X., Yao, Y., Xi, Y., Zhang, W., Zhu, Q., Zhu, Q., and Zhuang, Q.: Ensemble estimates of global wetland methane emissions over 2000–2020, Biogeosciences, 22, 305–321, https://doi.org/10.5194/bg-22-305-2025, 2025.
Zhu, Y., Mann, G., Newman, P. A., and Randel, W.: The Hunga Volcanic Eruption Atmospheric Impacts Report, edited by: Zhu, Y., Mann, G., Newman, P. A., and Randel, W., Forschungzentrum Jülich, https://doi.org/10.34734/FZJ-2025-05237, 2025.
Zhu, Y., Cheng, L., Trenberth, K. E., Abraham, J. P., Speich, S., and Zhu, J.: Critical dependence of global ocean heat monitoring on the ocean observing system, Nat. Clim. Change, https://doi.org/10.1038/s41558-026-02661-6, 2026.
Zickfeld, K., Azevedo, D., Mathesius, S., and Matthews, H. D.: Asymmetry in the climate–carbon cycle response to positive and negative CO2 emissions, Nat. Clim. Change, 11, 613–617, https://doi.org/10.1038/s41558-021-01061-2, 2021.
PRIMAP is a synthetic dataset that includes two time-series: PRIMAP Hist-TP, which is compiled from other underlying products such as EDGAR; and PRIMAP Hist-CR, which prioritises data from national inventories but gap-fills these where necessary.
- Abstract
- Introduction
- Greenhouse gas emissions
- Well-mixed greenhouse gas concentrations
- Non-methane short-lived climate forcers
- Effective radiative forcing (ERF)
- Earth energy imbalance (EEI)
- Observed surface temperature change
- Human contribution to surface temperature change
- Remaining Carbon Budget
- Indicators of climate and weather extremes: land average maximum temperatures and number of marine heat waves days
- Global land precipitation
- Global mean sea-level rise
- Code and data availability
- Discussion and conclusions
- Author contributions
- Competing interests
- Disclaimer
- Acknowledgements
- Financial support
- Review statement
- References
- Supplement
- Article
(9508 KB) - Full-text XML
- Version 2022
- Version 2023
- Version 2024
-
Supplement
(10624 KB) - BibTeX
- EndNote
- Abstract
- Introduction
- Greenhouse gas emissions
- Well-mixed greenhouse gas concentrations
- Non-methane short-lived climate forcers
- Effective radiative forcing (ERF)
- Earth energy imbalance (EEI)
- Observed surface temperature change
- Human contribution to surface temperature change
- Remaining Carbon Budget
- Indicators of climate and weather extremes: land average maximum temperatures and number of marine heat waves days
- Global land precipitation
- Global mean sea-level rise
- Code and data availability
- Discussion and conclusions
- Author contributions
- Competing interests
- Disclaimer
- Acknowledgements
- Financial support
- Review statement
- References
- Supplement