Articles | Volume 18, issue 8
https://doi.org/10.5194/essd-18-5739-2026
© Author(s) 2026. This work is distributed under
the Creative Commons Attribution 4.0 License.
https://doi.org/10.5194/essd-18-5739-2026
© Author(s) 2026. This work is distributed under
the Creative Commons Attribution 4.0 License.
GLBD-FED: a global first-hand in-situ daily temperature dataset preferentially with a 00:00–24:00 UTC 24 h window (1981–2024)

National Meteorological Information Centre, Beijing, China
Panmao Zhai
State Key Laboratory of Severe Weather, Chinese Academy of Meteorological Sciences, Beijing, China
Xuebin Zhang
Pacific Climate Impacts Consortium, University of Victoria, Victoria BC, Canada
Hui Jiang
National Meteorological Information Centre, Beijing, China
Fang Yuan
National Meteorological Information Centre, Beijing, China
Zijiang Zhou
CORRESPONDING AUTHOR
National Meteorological Information Centre, Beijing, China
Related authors
No articles found.
Zuo Wen, Baiquan Zhou, and Panmao Zhai
Earth Syst. Sci. Data Discuss., https://doi.org/10.5194/essd-2026-278, https://doi.org/10.5194/essd-2026-278, 2026
Preprint under review for ESSD
Short summary
Short summary
The weather stations in Tibetan Plateau are sparse, especially in the west. We combined 12 precipitation datasets using machine learning to create a rainfall record for 1961-2021 rainy seasons. It reduces errors by 30-40% versus satellite data and works well in the poorly observed west. It overestimates light rain and underestimates heavy downpours, but reliably captures long-term trends. This work provides a new reference for studying precipitation changes on the Tibetan Plateau.
Piers M. Forster, Tristram Walsh, Chris Smith, William F. Lamb, Robin Lamboll, Christophe Cassou, Mathias Hauser, Zeke Hausfather, June-Yi Lee, Matthew D. Palmer, Karina von Schuckmann, Aimée B. A. Slangen, Sophie Szopa, Blair Trewin, Jeongeun Yun, Nathan P. Gillett, Stuart Jenkins, H. Damon Matthews, Krishnan Raghavan, Aurélien Ribes, Joeri Rogelj, Debbie Rosen, Xuebin Zhang, Myles Allen, Robbie M. Andrew, Chris Atkinson, Richard A. Betts, Antonio Bombelli, Samantha N. Burgess, Lijing Cheng, Helen E. Claxton, Pierre Friedlingstein, Thomas L. Frölicher, Catia M. Domingues, Thomas Gasser, Catherine H. Gregory, Rachel M. Hoesly, Daniel Huppmann, Masayoshi Ishii, Christopher Kadow, Alexia Karwat, John Kennedy, Rachel E. Killick, Mahesh V. M. Kovilakam, Paul B. Krummel, Xin Lan, Jean-François Lamarque, Aurélien Liné, Belén Martín-Míguez, Didier P. Monselesan, Colin Morice, Jens Mühle, Pino Mussak, Glen P. Peters, Anna Pirani, Julia Pongratz, Matthew Rigby, Robert Rohde, Abhishek Savita, Sonia I. Seneviratne, Steven J. Smith, Ghassan Taha, Caterina Tassone, Peter Thorne, Christopher Wells, Luke M. Western, Guido R. van der Werf, Susan E. Wijffels, Marco Zecchetto, Junting Zhong, Xiao-Ye Zhang, Valérie Masson-Delmotte, and Panmao Zhai
Earth Syst. Sci. Data, 18, 3889–3933, https://doi.org/10.5194/essd-18-3889-2026, https://doi.org/10.5194/essd-18-3889-2026, 2026
Short summary
Short summary
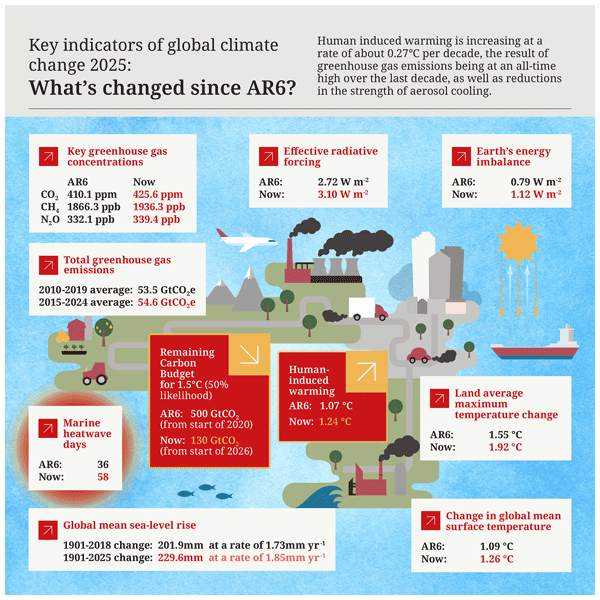
We give our annual update of key climate indicators. Our work quantifies the human contribution to global warming and the pace of climate change. This represents a large effort by the international community akin to an Intergovernmental Panel on Climate Change (IPCC) report.
Peter W. Thorne, John M. Nicklas, John J. Kennedy, Bruce Calvert, Baylor Fox-Kemper, Mark T. Richardson, Adrian Simmons, Ed Hawkins, Robert Rhode, Kathryn Cowtan, Nerilie J. Abram, Axel Andersson, Simon Noone, Phillipe Marbaix, Nathan Lenssen, Dirk Olonscheck, Tristram Walsh, Stephen Outten, Ingo Bethke, Bjorn H. Samset, Chris Smith, Anna Pirani, Jan Fuglestvedt, Lavanya Rajamani, Richard A. Betts, Elizabeth C. Kent, Blair Trewin, Colin Morice, Tim Osborn, Samantha N. Burgess, Oliver Geden, Andrew Parnell, Piers M. Forster, Chris Hewitt, Zeke Hausfather, Valerie Masson-Delmotte, Jochem Marotzke, Nathan Gillett, Sonia I. Seneviratne, Gavin A. Schmidt, Duo Chan, Stefan Brönnimann, Andy Reisinger, Matthew Menne, Maisa Rojas Corradi, Christopher Kadow, Peter Huybers, David B. Stephenson, Emily Wallis, Joeri Rogelj, Andrew Schurer, Karen McKinnon, Panmao Zhai, Fatima Driouech, Wilfran Moufouma Okia, Saeed Vazifehkhah, Sophie Szopa, Christopher J. Merchant, Shoji Hirahara, Masayoshi Ishii, Francois A. Engelbrecht, Qingxiang Li, June-Yi Lee, Alex J. Cannon, Christophe Cassou, Karina von Schuckmann, Amir H. Delju, and Ellie Murtagh
Earth Syst. Sci. Data Discuss., https://doi.org/10.5194/essd-2025-825, https://doi.org/10.5194/essd-2025-825, 2026
Preprint under review for ESSD
Short summary
Short summary
We reassess the basis for determining the present level of long-term global warming. Unbiased estimates of both realised warming and anthropogenic warming are possible that approximate a 20-year retrospective mean. Our resulting estimates of 1.40 [1.23–1.58] °C (realised) and 1.34 [1.18–1.50] °C (anthropogenic) as at end of 2024 highlight the urgency of immediate, far-reaching and sustained climate mitigation actions if we are to meet the long term temperature goal of the Paris Agreement.
Piers M. Forster, Chris Smith, Tristram Walsh, William F. Lamb, Robin Lamboll, Christophe Cassou, Mathias Hauser, Zeke Hausfather, June-Yi Lee, Matthew D. Palmer, Karina von Schuckmann, Aimée B. A. Slangen, Sophie Szopa, Blair Trewin, Jeongeun Yun, Nathan P. Gillett, Stuart Jenkins, H. Damon Matthews, Krishnan Raghavan, Aurélien Ribes, Joeri Rogelj, Debbie Rosen, Xuebin Zhang, Myles Allen, Lara Aleluia Reis, Robbie M. Andrew, Richard A. Betts, Alex Borger, Jiddu A. Broersma, Samantha N. Burgess, Lijing Cheng, Pierre Friedlingstein, Catia M. Domingues, Marco Gambarini, Thomas Gasser, Johannes Gütschow, Masayoshi Ishii, Christopher Kadow, John Kennedy, Rachel E. Killick, Paul B. Krummel, Aurélien Liné, Didier P. Monselesan, Colin Morice, Jens Mühle, Vaishali Naik, Glen P. Peters, Anna Pirani, Julia Pongratz, Jan C. Minx, Matthew Rigby, Robert Rohde, Abhishek Savita, Sonia I. Seneviratne, Peter Thorne, Christopher Wells, Luke M. Western, Guido R. van der Werf, Susan E. Wijffels, Valérie Masson-Delmotte, and Panmao Zhai
Earth Syst. Sci. Data, 17, 2641–2680, https://doi.org/10.5194/essd-17-2641-2025, https://doi.org/10.5194/essd-17-2641-2025, 2025
Short summary
Short summary
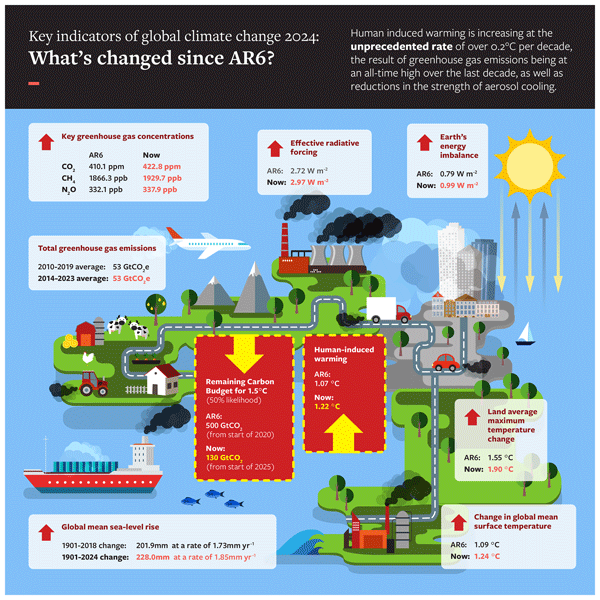
In a rapidly changing climate, evidence-based decision-making benefits from up-to-date and timely information. Here we compile monitoring datasets to track real-world changes over time. To make our work relevant to policymakers, we follow methods from the Intergovernmental Panel on Climate Change (IPCC). Human activities are increasing the Earth's energy imbalance and driving faster sea-level rise compared to the IPCC assessment.
Piers M. Forster, Chris Smith, Tristram Walsh, William F. Lamb, Robin Lamboll, Bradley Hall, Mathias Hauser, Aurélien Ribes, Debbie Rosen, Nathan P. Gillett, Matthew D. Palmer, Joeri Rogelj, Karina von Schuckmann, Blair Trewin, Myles Allen, Robbie Andrew, Richard A. Betts, Alex Borger, Tim Boyer, Jiddu A. Broersma, Carlo Buontempo, Samantha Burgess, Chiara Cagnazzo, Lijing Cheng, Pierre Friedlingstein, Andrew Gettelman, Johannes Gütschow, Masayoshi Ishii, Stuart Jenkins, Xin Lan, Colin Morice, Jens Mühle, Christopher Kadow, John Kennedy, Rachel E. Killick, Paul B. Krummel, Jan C. Minx, Gunnar Myhre, Vaishali Naik, Glen P. Peters, Anna Pirani, Julia Pongratz, Carl-Friedrich Schleussner, Sonia I. Seneviratne, Sophie Szopa, Peter Thorne, Mahesh V. M. Kovilakam, Elisa Majamäki, Jukka-Pekka Jalkanen, Margreet van Marle, Rachel M. Hoesly, Robert Rohde, Dominik Schumacher, Guido van der Werf, Russell Vose, Kirsten Zickfeld, Xuebin Zhang, Valérie Masson-Delmotte, and Panmao Zhai
Earth Syst. Sci. Data, 16, 2625–2658, https://doi.org/10.5194/essd-16-2625-2024, https://doi.org/10.5194/essd-16-2625-2024, 2024
Short summary
Short summary
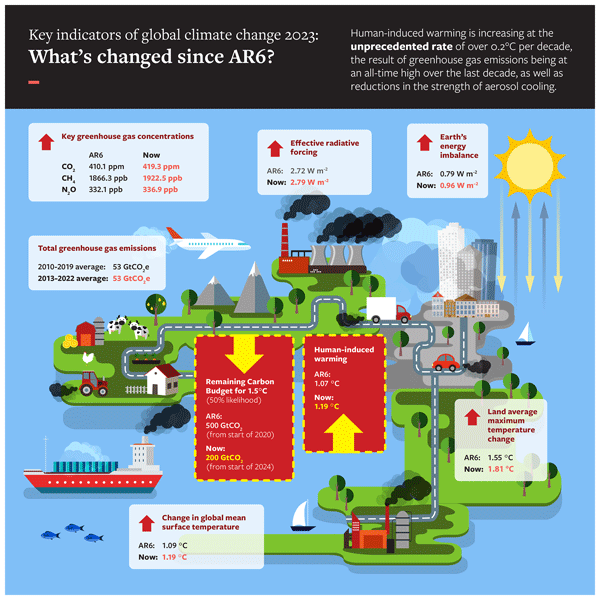
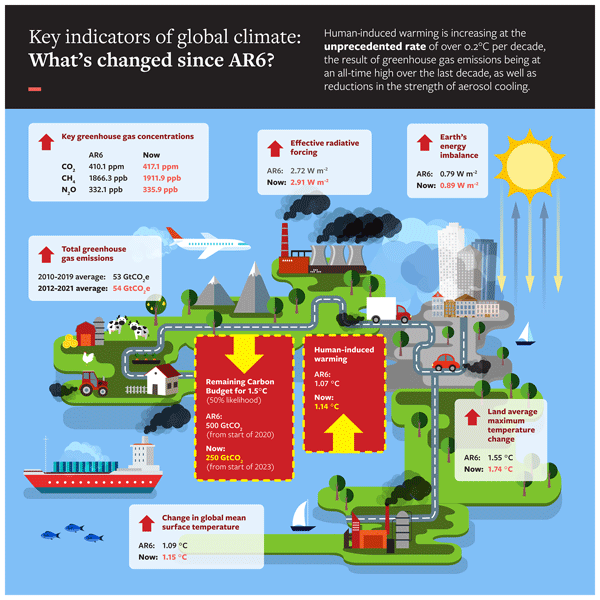
This paper tracks some key indicators of global warming through time, from 1850 through to the end of 2023. It is designed to give an authoritative estimate of global warming to date and its causes. We find that in 2023, global warming reached 1.3 °C and is increasing at over 0.2 °C per decade. This is caused by all-time-high greenhouse gas emissions.
Jianping Guo, Jian Zhang, Jia Shao, Tianmeng Chen, Kaixu Bai, Yuping Sun, Ning Li, Jingyan Wu, Rui Li, Jian Li, Qiyun Guo, Jason B. Cohen, Panmao Zhai, Xiaofeng Xu, and Fei Hu
Earth Syst. Sci. Data, 16, 1–14, https://doi.org/10.5194/essd-16-1-2024, https://doi.org/10.5194/essd-16-1-2024, 2024
Short summary
Short summary
A global continental merged high-resolution (PBLH) dataset with good accuracy compared to radiosonde is generated via machine learning algorithms, covering the period from 2011 to 2021 with 3-hour and 0.25º resolution in space and time. The machine learning model takes parameters derived from the ERA5 reanalysis and GLDAS product as input, with PBLH biases between radiosonde and ERA5 as the learning targets. The merged PBLH is the sum of the predicted PBLH bias and the PBLH from ERA5.
Piers M. Forster, Christopher J. Smith, Tristram Walsh, William F. Lamb, Robin Lamboll, Mathias Hauser, Aurélien Ribes, Debbie Rosen, Nathan Gillett, Matthew D. Palmer, Joeri Rogelj, Karina von Schuckmann, Sonia I. Seneviratne, Blair Trewin, Xuebin Zhang, Myles Allen, Robbie Andrew, Arlene Birt, Alex Borger, Tim Boyer, Jiddu A. Broersma, Lijing Cheng, Frank Dentener, Pierre Friedlingstein, José M. Gutiérrez, Johannes Gütschow, Bradley Hall, Masayoshi Ishii, Stuart Jenkins, Xin Lan, June-Yi Lee, Colin Morice, Christopher Kadow, John Kennedy, Rachel Killick, Jan C. Minx, Vaishali Naik, Glen P. Peters, Anna Pirani, Julia Pongratz, Carl-Friedrich Schleussner, Sophie Szopa, Peter Thorne, Robert Rohde, Maisa Rojas Corradi, Dominik Schumacher, Russell Vose, Kirsten Zickfeld, Valérie Masson-Delmotte, and Panmao Zhai
Earth Syst. Sci. Data, 15, 2295–2327, https://doi.org/10.5194/essd-15-2295-2023, https://doi.org/10.5194/essd-15-2295-2023, 2023
Short summary
Short summary
This is a critical decade for climate action, but there is no annual tracking of the level of human-induced warming. We build on the Intergovernmental Panel on Climate Change assessment reports that are authoritative but published infrequently to create a set of key global climate indicators that can be tracked through time. Our hope is that this becomes an important annual publication that policymakers, media, scientists and the public can refer to.
Junting Zhong, Xiaoye Zhang, Ke Gui, Jie Liao, Ye Fei, Lipeng Jiang, Lifeng Guo, Liangke Liu, Huizheng Che, Yaqiang Wang, Deying Wang, and Zijiang Zhou
Earth Syst. Sci. Data, 14, 3197–3211, https://doi.org/10.5194/essd-14-3197-2022, https://doi.org/10.5194/essd-14-3197-2022, 2022
Short summary
Short summary
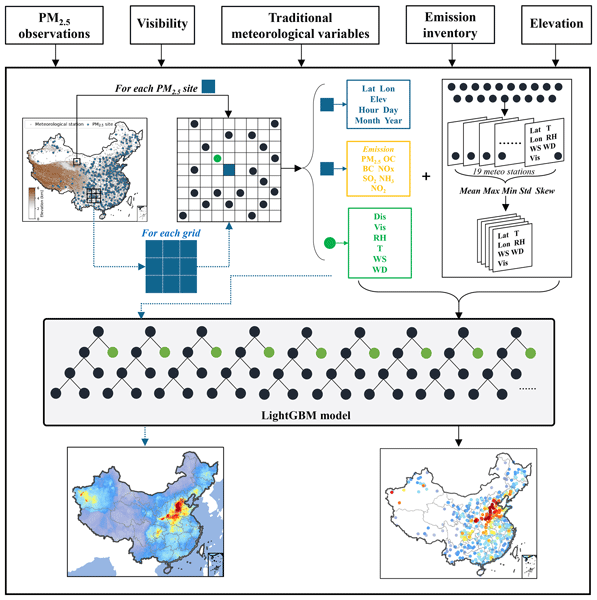
Historical long-term PM2.5 records with high temporal resolution are essential but lacking for research and environmental management. Here, we reconstruct site-based and gridded PM2.5 datasets at 6-hour intervals from 1960 to 2020 that combine visibility, meteorological data, and emissions based on a machine learning model with extracted spatial features. These two PM2.5 datasets will lay the foundation of research studies associated with air pollution, climate change, and aerosol reanalysis.
Jianping Guo, Jian Zhang, Kun Yang, Hong Liao, Shaodong Zhang, Kaiming Huang, Yanmin Lv, Jia Shao, Tao Yu, Bing Tong, Jian Li, Tianning Su, Steve H. L. Yim, Ad Stoffelen, Panmao Zhai, and Xiaofeng Xu
Atmos. Chem. Phys., 21, 17079–17097, https://doi.org/10.5194/acp-21-17079-2021, https://doi.org/10.5194/acp-21-17079-2021, 2021
Short summary
Short summary
The planetary boundary layer (PBL) is the lowest part of the troposphere, and boundary layer height (BLH) is the depth of the PBL and is of critical importance to the dispersion of air pollution. The study presents the first near-global BLH climatology by using high-resolution (5-10 m) radiosonde measurements. The variations in BLH exhibit large spatial and temporal dependence, with a peak at 17:00 local solar time. The most promising reanalysis product is ERA-5 in terms of modeling BLH.
Cited articles
Alexander, L. V., Zhang, X., Peterson, T. C., Caesar, J., Gleason, B., Klein Tank, A. M. G., Haylock, M., Collins, D., Trewin, B., Rahimzadeh, F., Tagipour, A., Rupa Kumar, K., Revadekar, J., Griffiths, G., Vincent, L., Stephenson, D. B., Burn, J., Aguilar, E., Brunet, M., Taylor, M., New, M., Zhai, P., Rusticucci, M., and Vazquez-Aguirre, J. L.: Global observed changes in daily climate extremes of temperature and precipitation, J. Geophys. Res.-Atmos., 111, D05109, https://doi.org/10.1029/2005JD006290, 2006.
Beck, H. E., Wood, E. F., Pan, M., Fisher, C. K., Miralles, D. G., van Dijk, A. I. J. M., McVicar, T. R., and Adler, R. F.: MSWEP V2 global 3-hourly 0.1° precipitation: Methodology and quantitative assessment, Bull. Am. Meteorol. Soc., 100, 473–500, https://doi.org/10.1175/BAMS-D-17-0138.1, 2019.
Becker, A., Finger, P., Meyer-Christoffer, A., Rudolf, B., Schamm, K., Schneider, U., and Ziese, M.: A description of the global land-surface precipitation data products of the Global Precipitation Climatology Centre with sample applications including centennial (trend) analysis from 1901–present, Earth Syst. Sci. Data, 5, 71–99, https://doi.org/10.5194/essd-5-71-2013, 2013.
Caesar, J., Alexander, L., and Vose, R.: Large-scale changes in observed daily maximum and minimum temperatures: Creation and analysis of a new gridded data set, J. Geophys. Res.-Atmos., 111, D05101, https://doi.org/10.1029/2005JD006280, 2006.
Donat, M. G., Alexander, L. V., Yang, H., Durre, I., Vose, R. S., Dunn, R. J. H., Willett, K. M., Aguilar, E., Brunet, M., Caesar, J., Hewitt, B., Klein Tank, A. M. G., Kruger, A. C., Marengo, J., Peterson, T. C., Renom, M., Oria Rojas, C., Rusticucci, M., Salinger, J., Elrayah, A. S., Sekele, S. S., Srivastava, A. K., Trewin, B., Villarroel, C., Vincent, L. A., Zhai, P., Zhang, X., and Kitching, S.: Updated analyses of temperature and precipitation extreme indices since the beginning of the twentieth century: The HadEX2 dataset, J. Geophys. Res.-Atmos., 118, 2098–2118, https://doi.org/10.1002/jgrd.50150, 2013.
Dunn, R. J. H., Alexander, L. V., Donat, M. G., Zhang, X., Bador, M., Herold, N., Lippmann, T., Allan, R., Aguilar, E., Barry, A. A., Brunet, M., Caesar, J., Chagnaud, G., Cheng, V., Cui, G., Enola, A. K., Gerst, B., Hasan, J., Huai, T., Ibadullah, V. R., Iqbal, W., Jones, P. D., Karlsson, E., Kitching, S., Kruger, A. C., Lester, E., Mhando, L. Z., McGree, S., Morice, C. P., Nying'uro, P. A., Oria Rojas, C., Rennie, J., Rusticucci, M., Salinger, J., Sanley, L., Silva, A., Srivastava, A. K., Trewin, B., Viale, M., Villarroel, C., Vincent, L. A., Wei, L., and Yin, H.: Development of an updated global land in situ-based data set of temperature and precipitation extremes: HadEX3, J. Geophys. Res.-Atmos., 125, e2019JD032263, https://doi.org/10.1029/2019JD032263, 2020.
Durre, I., Menne, M. J., Gleason, C. E., Houston, T. G., and Vose, R. S.: Comprehensive automated quality assurance of daily surface observations, J. Appl. Meteorol. Climatol., 49, 1615–1633, https://doi.org/10.1175/2010JAMC2375.1, 2010.
Haiden, T., Janousek, M., Bidlot, J., Buizza, R., Ferranti, L., Prates, F., and Vitart, F.: Evaluation of ECMWF forecasts, including the 2018 upgrade, ECMWF Technical Memorandum No. 831, ECMWF, Reading, UK, https://doi.org/10.21957/b8g71b69, 2018.
IPCC: Climate Change 2021: The Physical Science Basis. Contribution of Working Group I to the Sixth Assessment Report of the Intergovernmental Panel on Climate Change, edited by: Masson-Delmotte, V., Zhai, P., Pirani, A., Connors, S. L., Péan, C., Berger, S., Caud, N., Chen, Y., Goldfarb, L., Gomis, M. I., Huang, M., Leitzell, K., Lonnoy, E., Matthews, J. B. R., Maycock, T. K., Waterfield, T., Yelekçi, O., Yu, R., and Zhou, B., Cambridge University Press, Cambridge, United Kingdom and New York, NY, USA, 2391 pp., https://doi.org/10.1017/9781009157896, 2021.
Karl, T. R., Williams Jr, C. N., Young, P. J., and Wendland, W. M.: A model to estimate the time of observation bias associated with monthly mean maximum, minimum and mean temperatures for the United States, J. Clim. Appl. Meteorol., 25, 145–160, https://doi.org/10.1175/1520-0450(1986)025<0145:AMTETT>2.0.CO;2, 1986.
Lott, N.: The quality control of the Integrated Surface Database (ISD), in: Preprints, 84th AMS Annual Meeting, American Meteorological Society, Seattle, WA, USA, 1–7, https://ams.confex.com/ams/84Annual/webprogram/Paper71929.html (last access: 30 July 2026), 2004.
Menne, M. J., Durre, I., Vose, R. S., Gleason, B. E., and Houston, T. G.: An overview of the Global Historical Climatology Network-Daily Database, J. Atmos. Ocean. Technol., 29, 897–910, https://doi.org/10.1175/JTECH-D-11-00103.1, 2012.
NOAA NCEI: Global Surface Summary of the Day – GSOD, Version 1.0, NOAA National Centers for Environmental Information [data set], https://www.ncei.noaa.gov/access/metadata/landing-page/bin/iso?id=gov.noaa.ncdc:C00516 (last access: 30 July 2026), 1999.
Rohde, R., Muller, R. A., Jacobsen, R., Muller, E., Perlmutter, S., Rosenfeld, A., Wurtele, J., Groom, D., and Wickham, C.: A new estimate of the average Earth surface land temperature spanning 1753 to 2011, Geoinfor. Geostat. An Overview, 1, 1000101, https://doi.org/10.4172/2327-4581.1000101, 2013.
Smith, A., Lott, N., and Vose, R.: The Integrated Surface Database: Recent developments and partnerships, Bull. Am. Meteorol. Soc., 92, 704–708, https://doi.org/10.1175/2011BAMS3015.1, 2011.
Trewin, B.: Exposure, instrumentation, and observing practice effects on land temperature measurements, Wiley Interdiscip. Rev.: Clim. Change, 1, 490–506, https://doi.org/10.1002/wcc.46, 2010.
World Meteorological Organization (WMO): Guide to Climatological Practices, WMO-No. 100, World Meteorological Organization, Geneva, Switzerland, https://library.wmo.int/idurl/4/60113 (last access: 30 July 2026), 2011.
World Meteorological Organization (WMO): Manual on Codes – International Codes, Volume I.1, Part A – Alphanumeric Codes, WMO-No. 306, World Meteorological Organization, Geneva, Switzerland, https://library.wmo.int/idurl/4/35713 (last access: 30 July 2026), 2015.
World Meteorological Organization (WMO): Manual on the Global Observing System, WMO-No. 544, World Meteorological Organization, Geneva, Switzerland, https://library.wmo.int/idurl/4/58672 (last access: 30 July 2026), 2017.
World Meteorological Organization (WMO): Guide to Instruments and Methods of Observation, WMO-No. 8, World Meteorological Organization, Geneva, Switzerland, https://library.wmo.int/idurl/4/68695 (last access: 30 July 2026), 2018.
Yang, S., Jones, P. D., Jiang, H., and Zhou, Z.: Development of a near-real-time global in situ daily precipitation dataset for 0000–0000 UTC, Int. J. Climatol., 40, 2795–2810, https://doi.org/10.1002/joc.6367, 2020.
Yang, S., Zhai, P., Zhang, X., and Zhou, Z.: Development of a global in-situ daily temperature dataset preferentially for 0000–2400 UTC from 1981–2024, Zenodo [data set], https://doi.org/10.5281/zenodo.17895292, 2025.
Zhang, X., Alexander, L., Hegerl, G. C., Jones, P., Klein Tank, A. M. G., Peterson, T. C., Trewin, B., and Zwiers, F. W.: Indices for monitoring changes in extremes based on daily temperature and precipitation data, Wiley Interdiscip. Rev.: Clim. Change, 2, 851–870, https://doi.org/10.1002/wcc.147, 2011.
Short summary
We introduce GLBD-FED (1981–2024), a global daily temperature dataset spanning ~17 000 stations. To harmonize varying national reporting times, we reconstruct sub-daily observations into consistent 24 h physical windows, preferentially aligned to 00:00–24:00 UTC. This effectively corrects Time of Observation Biases. GLBD-FED provides a globally uniform, first-hand observational baseline highly valuable for synoptic weather evaluation and validating numerical weather prediction models.
We introduce GLBD-FED (1981–2024), a global daily temperature dataset spanning ~17 000 stations....
Altmetrics
Final-revised paper
Preprint