the Creative Commons Attribution 4.0 License.
the Creative Commons Attribution 4.0 License.
 | 04 Jan 2024
A merged continental planetary boundary layer height dataset based on high-resolution radiosonde measurements, ERA5 reanalysis, and GLDAS
Jianping Guo
Jian Zhang
Jia Shao
Tianmeng Chen
Kaixu Bai
Yuping Sun
Ning Li
Jingyan Wu
Rui Li
Jian Li
Qiyun Guo
Jason B. Cohen
Panmao Zhai
Xiaofeng Xu
Fei Hu
The planetary boundary layer (PBL) is the lowermost part of the troposphere that governs the exchange of momentum, mass and heat between surface and atmosphere. To date, the radiosonde measurements have been extensively used to estimate PBL height (PBLH); suffering from low spatial coverage and temporal resolution, the radiosonde data are incapable of providing a diurnal description of PBLH across the globe. To fill this data gap, this paper aims to produce a temporally continuous PBLH dataset during the course of a day over the global land by applying machine learning algorithms to integrate high-resolution radiosonde measurements, ERA5 reanalysis, and the Global Land Data Assimilation System (GLDAS) product. This dataset covers the period from 2011 to 2021 with a temporal resolution of 3 h and a horizontal resolution of . The radiosonde dataset contains around 180 million profiles over 370 stations across the globe. The machine learning model was established by taking 18 parameters derived from ERA5 reanalysis and GLDAS as input variables, while the PBLH biases between radiosonde observations and ERA5 reanalysis were used as the learning targets. The input variables were presumably representative regarding the land properties, near-surface meteorological conditions, terrain elevations, lower tropospheric stabilities, and solar cycles. Once a state-of-the-art model had been trained, the model was then used to predict the PBLH bias at other grids across the globe with parameters acquired or derived from ERA5 and GLDAS. Eventually, the merged PBLH can be taken as the sum of the predicted PBLH bias and the PBLH retrieved from ERA5 reanalysis. Overall, this merged high-resolution PBLH dataset was globally consistent with the PBLH retrieved from radiosonde observations in terms of both magnitude and spatiotemporal variation, with a mean bias of as low as −0.9 m. The dataset and related codes are publicly available at https://doi.org/10.5281/zenodo.6498004 (Guo et al., 2022), and are of significance for a multitude of scientific research endeavors and applications, including air quality, convection initiation, climate, and climate change, to name but a few.
- Article
(7359 KB) - Full-text XML
- BibTeX
- EndNote


The planetary boundary layer (PBL), the lowermost part of the troposphere where turbulence and convection mainly occur, is of significance in modulating the exchange of momentum, heat, moisture, and mass between the surface and the free atmosphere over a range of scales (Stull, 1988; Cooper and Eichinger, 1994; Edson et al., 2013). Turbulence in the PBL is largely generated mechanically owing to both wind shear and friction, whereas convectively, it is generated by buoyancy and surface heating (Degrazia et al., 2020). Within the PBL, vertical turbulent mixing of air masses is rapid and constant, in the order of 30 min or less (Wallace and Hobbs, 2006). Therefore, reliable parameterization of the PBL is crucial for accurate representations of vertical diffusion, cloud formation and development, and pollutant deposition in numerical weather prediction (NWP), climate, air quality, and coupled atmosphere–hydrosphere–biosphere models (Seibert et al., 2000; Hu et al., 2010; Baklanov et al., 2011). It is well recognized that the variation of PBL height (PBLH) significantly impacts the near-surface air quality (Petäjä et al., 2016; Wang and Wang, 2016; Lou et al., 2019; Li et al., 2021) and climate system as well (Esau and Zilitinkevich, 2010; Davy and Esau, 2016).
Development of the PBL is subject to changes in the energy balance near the ground surface, largely through the linkages between soil moisture and sensible heat flux, latent heat flux, and net radiation (Dirmeyer et al., 2014; Xu et al., 2021). In particular, the sensible heat flux is closely associated with the variation in evapotranspiration, land type, and cloud cover. Also, the daytime convective PBL is modulated by cloud radiative effects, particularly in the early afternoon (Guo et al., 2016; Zhang et al., 2018; Davis et al., 2020). Furthermore, the aerosol radiative effect (due to both aerosol scattering and absorption) indirectly affects evolution of the PBL by changing the atmospheric heating rate and the solar radiation reaching the surface (Wang et al., 2013; Li et al., 2017; Yang et al., 2016). Besides, the entrainment of air from above the PBL can also significantly drive evolution of the PBL (Hu et al., 2010).
To date, a variety of methods have been applied to vertical profiles of aerosol properties, water vapor, temperature, refractivity, and wind to estimate PBLH (e.g., Holzworth, 1964; Seibert et al., 2000; Lammert and Bösenberg, 2006; McGrath-Spangler and Denning, 2012; Chan and Wood, 2013; Su et al., 2018; Liu et al., 2019; Ding et al., 2021). The estimates vary considerably with data sources, algorithms, and vertical data resolution (Seibert et al., 2000; Seidel et al., 2010). For instance, PBLH determined by the minimum vertical gradient relative humidity is about 1 km larger than that from the parcel method, even though the latter algorithm is generally thought to be one of the most reliable methods for estimation of convective boundary layer (CBL) height (Hennemuth and Lammert, 2006; Seidel et al., 2010). In addition, different data sources, such as ceilometer lidar, COSMIC GPS RO satellite, radiosonde, and the fifth-generation ECMWF (European Centre for Medium-Range Weather Forecasts) atmospheric reanalysis (ERA5) dataset can reach quite different estimates of PBLH (Saha et al., 2022). Recently, as suggested by Teixeira et al. (2022), the PBLH should ideally be estimated using direct observations of vertical profiles of turbulent quantities, which is due in a large part to the turbulent nature of the PBL. However, only a few places have such observations. A wide range of complex physical and chemical processes involved in the PBL contribute to make PBLH estimates quite elusive and tricky (Seidel et al., 2010; Teixeira et al., 2022).
Table 1Basic information on the data used in the present study, including data source, number of stations, vertical resolution, and the years with data curation.
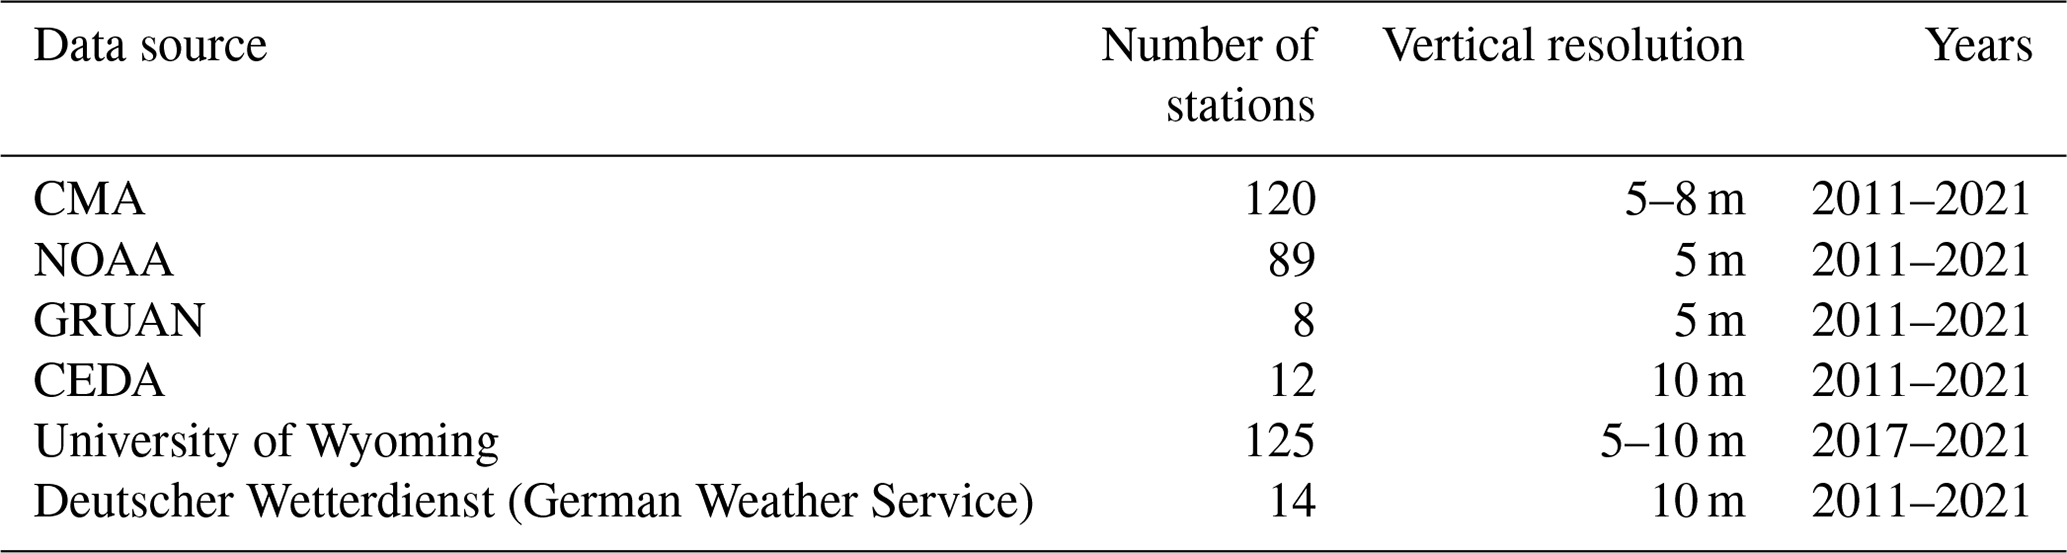
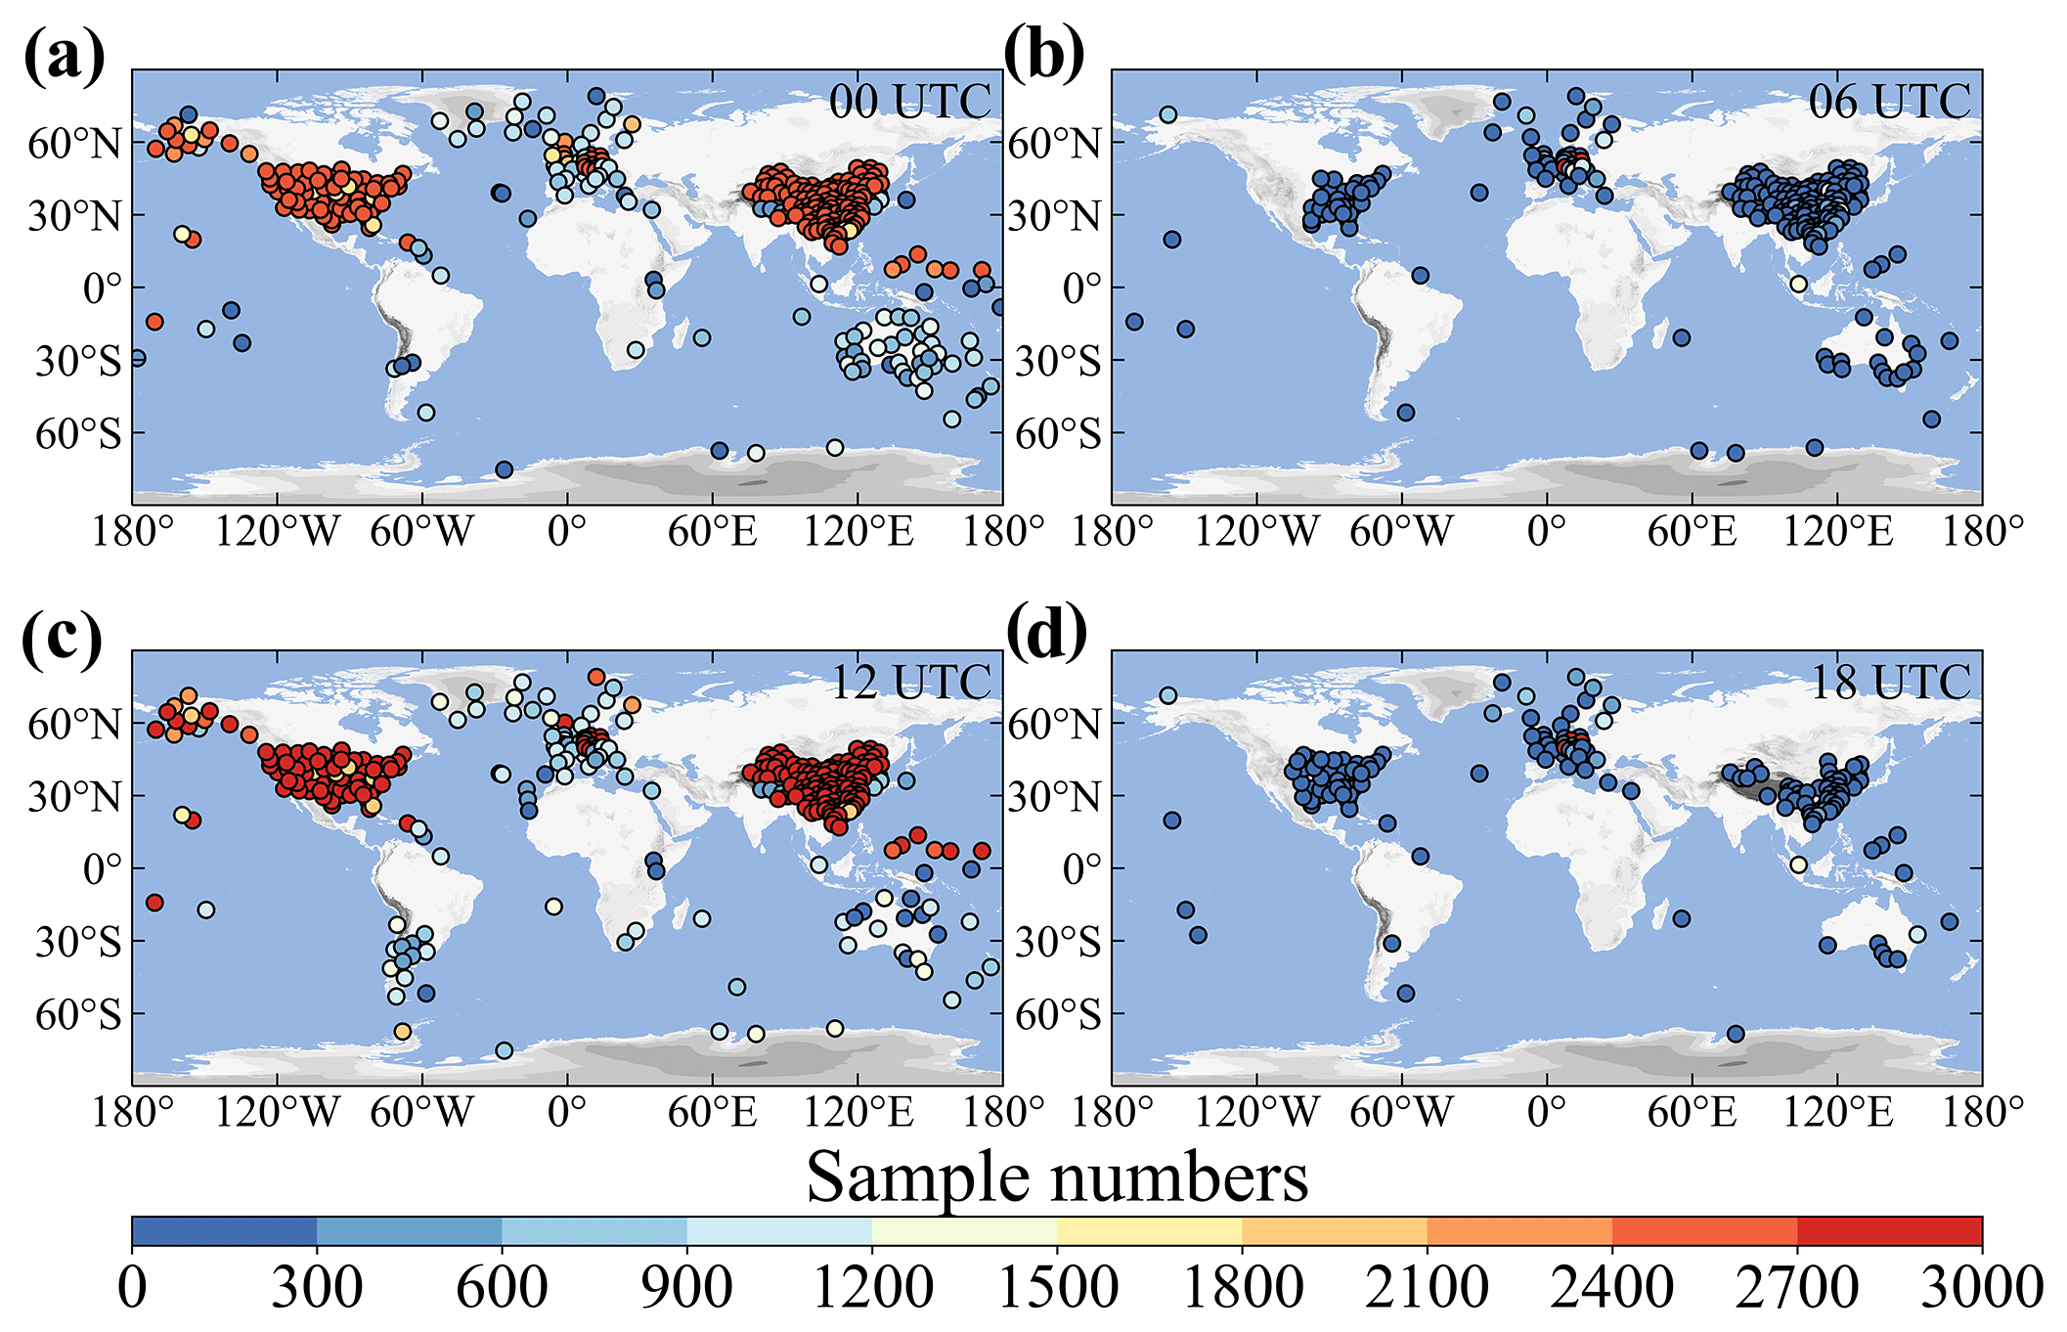
Figure 1Spatial distribution of sample number (color circles) for each radiosonde station at 00:00 (a), 06:00 (b), 12:00 (c), and 18:00 UTC from the years 2011 to 2021. Stations with less than 10 samples are not indicated.
Among the instruments, radiosonde is the most accepted instrument for deriving PBLH for both CBL and the stable boundary layer (SBL), due to its unprecedented capability to provide in situ observations of the thermodynamic and dynamic states of the PBL (Seidel et al., 2010; de Arruda Moreira et al., 2018, Guo et al., 2019). In addition, the bulk Richardson number method has been proven to be the most suitable PBLH algorithm for application to a large radiosonde dataset (Seidel et al., 2012). The dataset with full vertical resolution (5–8 m) has previously been used to study PBLHs over China and the near globe (Guo et al., 2016, 2021). The limitation of this dataset is its poor coverage over the ocean and some continental areas without high-resolution radiosonde observations.
By contrast, reanalysis datasets, such as the ERA5 reanalysis and the Modern-Era Retrospective Analysis for Research and Applications version 2 product (MERRA-2), have a unique advantage in terms of spatiotemporal coverage. Our recent study (Guo et al., 2021) suggests that ERA5 is the most promising reanalysis data source in terms of characterizing the evolution of PBLH, with an underestimation of daytime PBLH of around 130 m when compared to high-resolution radiosonde. Nevertheless, the underestimation of PBLH in the ERA5 reanalysis can be as high as 500 m in the afternoon, when the PBL is fully developed. This underestimation could be attributed to, but not limited to, the gradient of terrain elevation and the lower tropospheric stability. Particularly a higher terrain gradient or a more unstable troposphere generally lead to a lower PBLH in ERA5 reanalysis.
By exploiting both the advantages of in situ atmospheric measurements from radiosonde and the high-resolution model products from ERA5 reanalysis, it is desirable to generate a new PBLH dataset by seamlessly blending these versatile products. The biases between PBLHs retrieved from the ERA5 and radiosonde could be represented by the land properties and near-surface meteorological conditions, among other things, and be minimized or optimized via a machine learning model. The Global Land Data Assimilation System (GLDAS) incorporates satellite- and ground-based observations and produces a global, high-resolution product regarding land states and fluxes (Rodell et al., 2004). To this end, the present analyses used the radiosonde dataset that contains around 180 million profiles over 370 stations across the world in combination with the ERA5 reanalysis and GLDAS data. A long-term merged PBLH dataset covering the period 2011 to 2021 was generated, which could have crucial implications for the development and evaluation of weather and climate, environmental meteorology, and boundary layer parameterization. The rest of the paper is organized as follows: Sect. 2 describes the fundamental datasets and the PBLH methodology we used in this study, Sects. 3 and 4 report on the machine learning algorithm used to generate the merged PBLH dataset and also reveal the data quality, Sect. 5 represents the climatological merged continental PBLH, and Sect. 6 ends with a brief summary and conclusion.
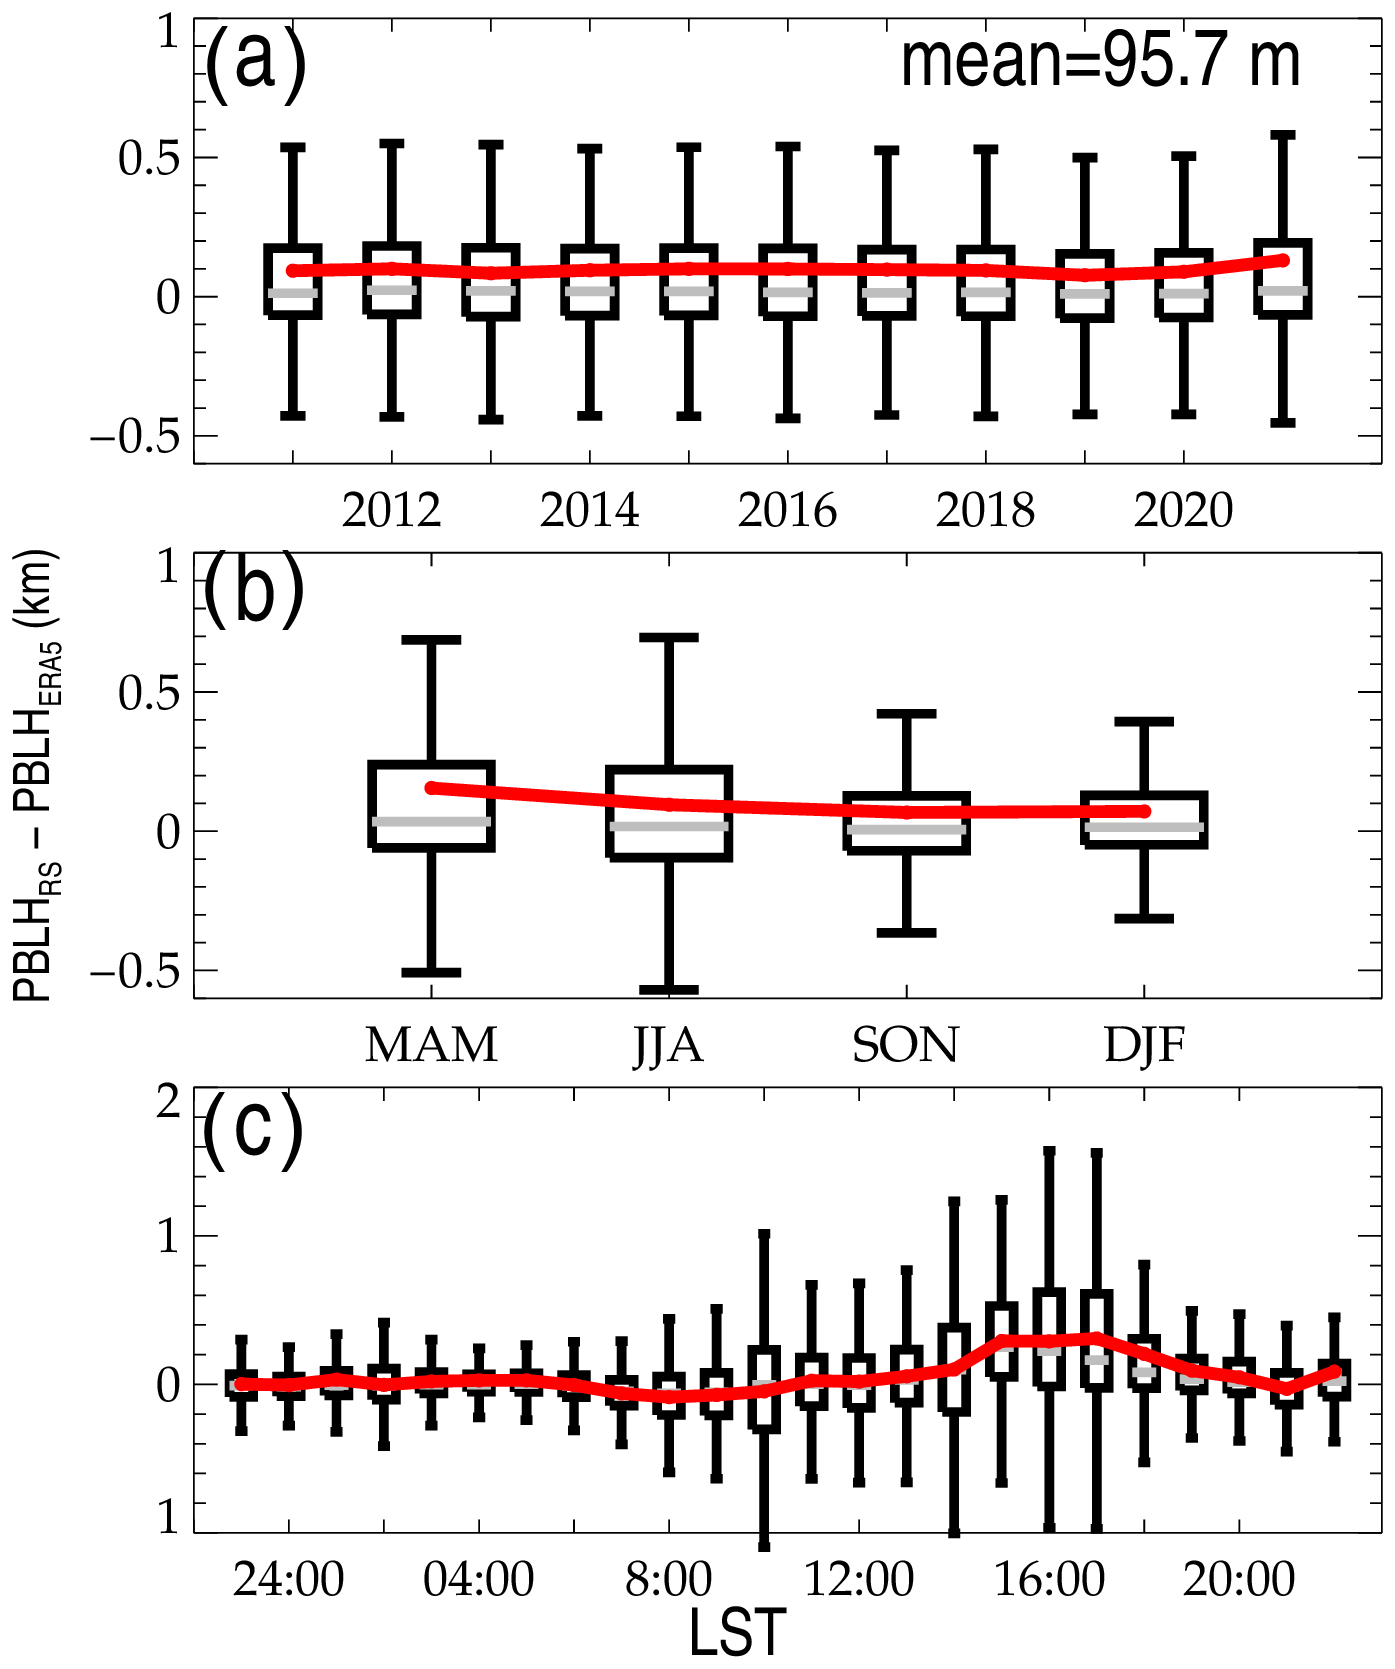
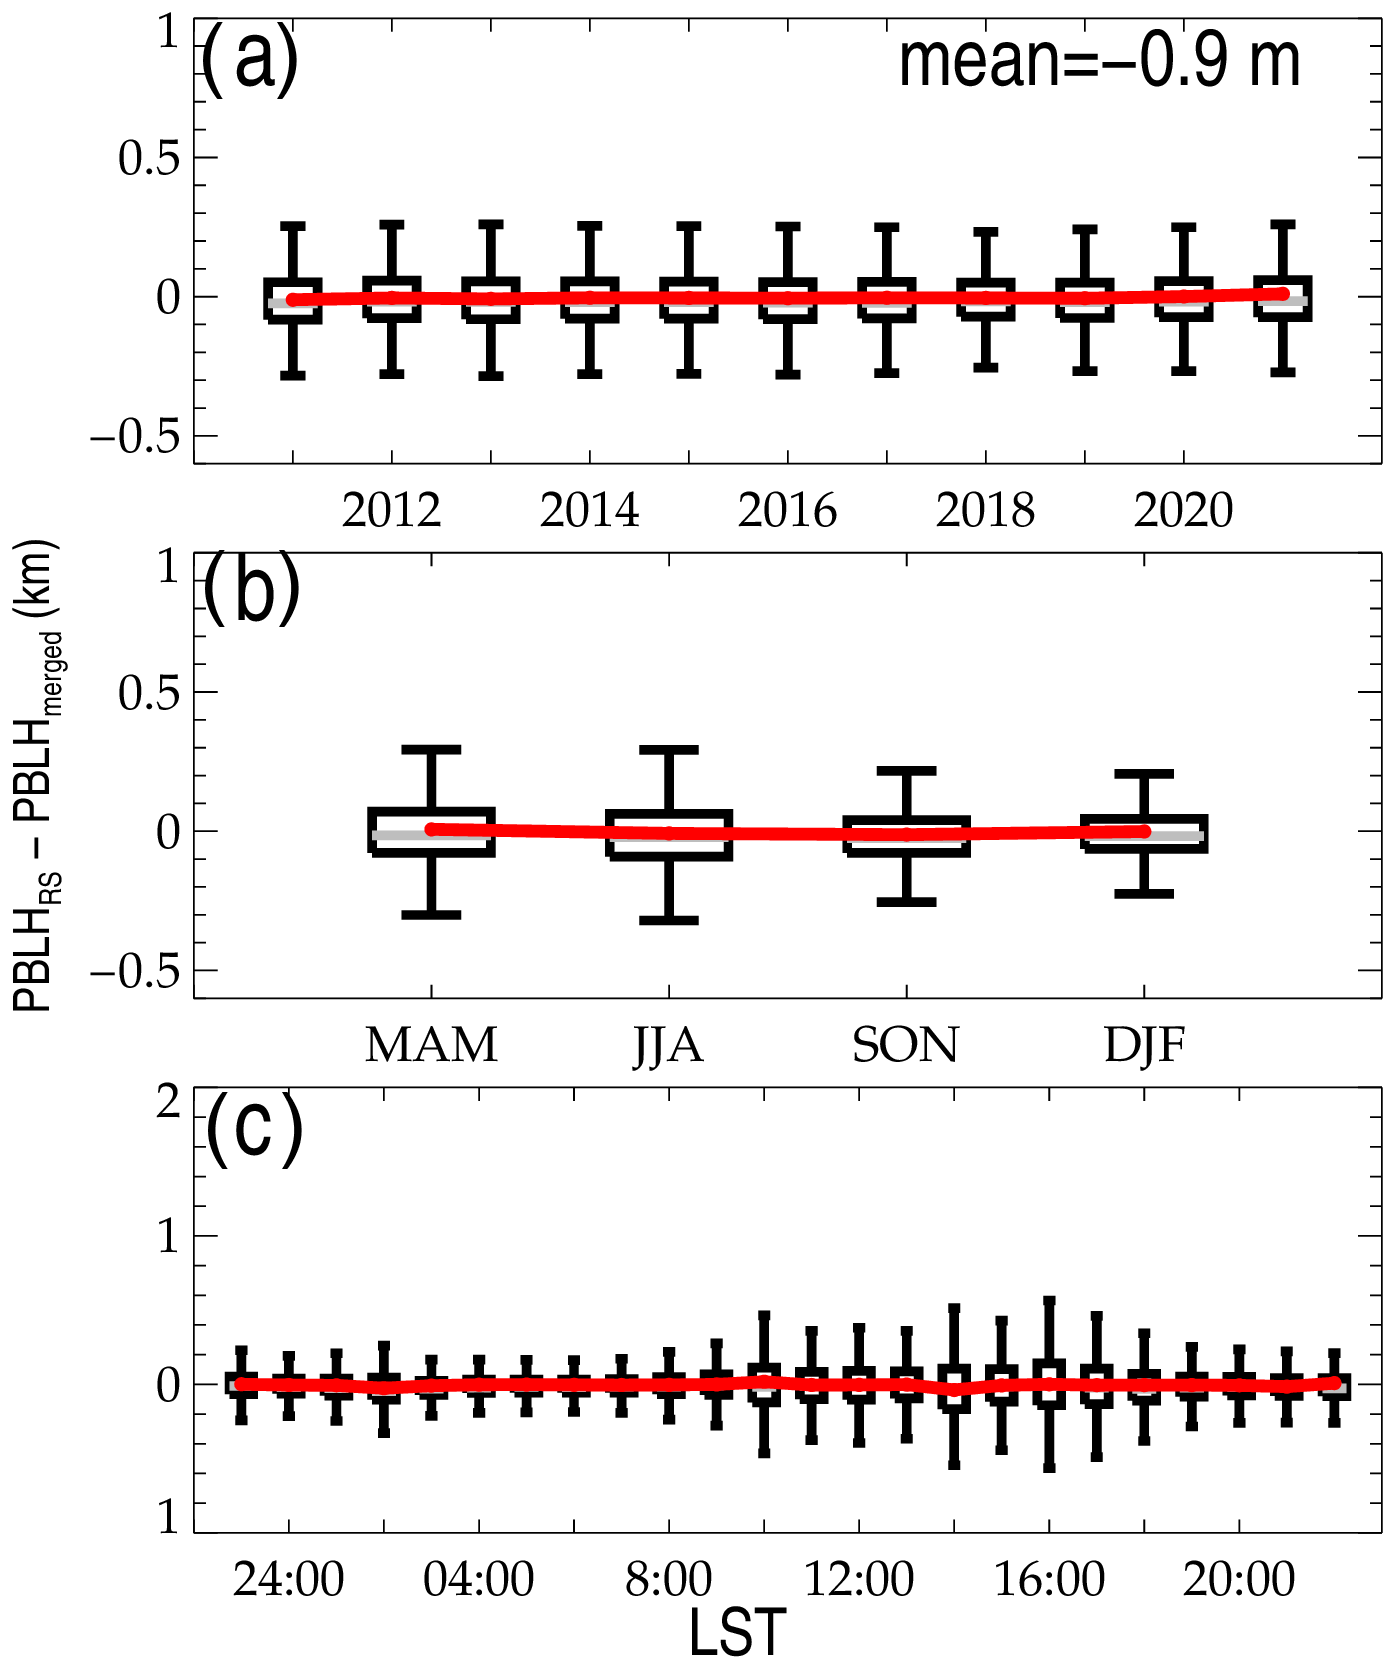
Figure 2Evolution of the difference between PBLHERA5 and PBLHRS at various time scales: different years (a), different seasons (b), and at different local times (c). MAM, March–April–May; JJA, June–July–August; SON, September–October–November; DJF, December–January–February. The mean bias is labeled in the upper right corner of panel (a). Note that the Southern Hemisphere DJF (JJA) is combined with Northern Hemisphere JJA (DJF).
2.1 High-resolution radiosonde measurements
As described in Guo et al. (2021) and Zhang et al. (2022), a high-resolution radiosonde dataset gained from several organizations was adopted, spanning the years from 2011 to 2021. The organizations include the China Meteorological Administration (CMA), the National Oceanic and Atmospheric Administration (NOAA), the Global Climate Observing System (GCOS) Reference Upper-Air Network (GRUAN), the Centre for Environmental Data Analysis of the United Kingdom (CEDA), the University of Wyoming, and the Deutscher Wetterdienst (German Weather Service). Detailed information on the provided data is listed in Table 1. In total, over 185 million radiosonde profiles were collected to determine PBLH, 95 % of which were released at regular synoptic times of 00:00 and 12:00 UTC, and the rest of which were irregularly launched at other times during the intensive observational periods. Note that those soundings with the lowest burst height, lower than 10 km above ground level (a.g.l.), were eliminated. In addition, all the original soundings were evenly interpolated into the profiles with a vertical resolution of 10 m by cubic spline interpolation.
Table 2Summary of input parameters of machine learning algorithms and the corresponding statistical metrics for their correlation analyses with PBLH bias between radiosonde and ERA5 reanalysis, including correlation coefficient and confidence level.
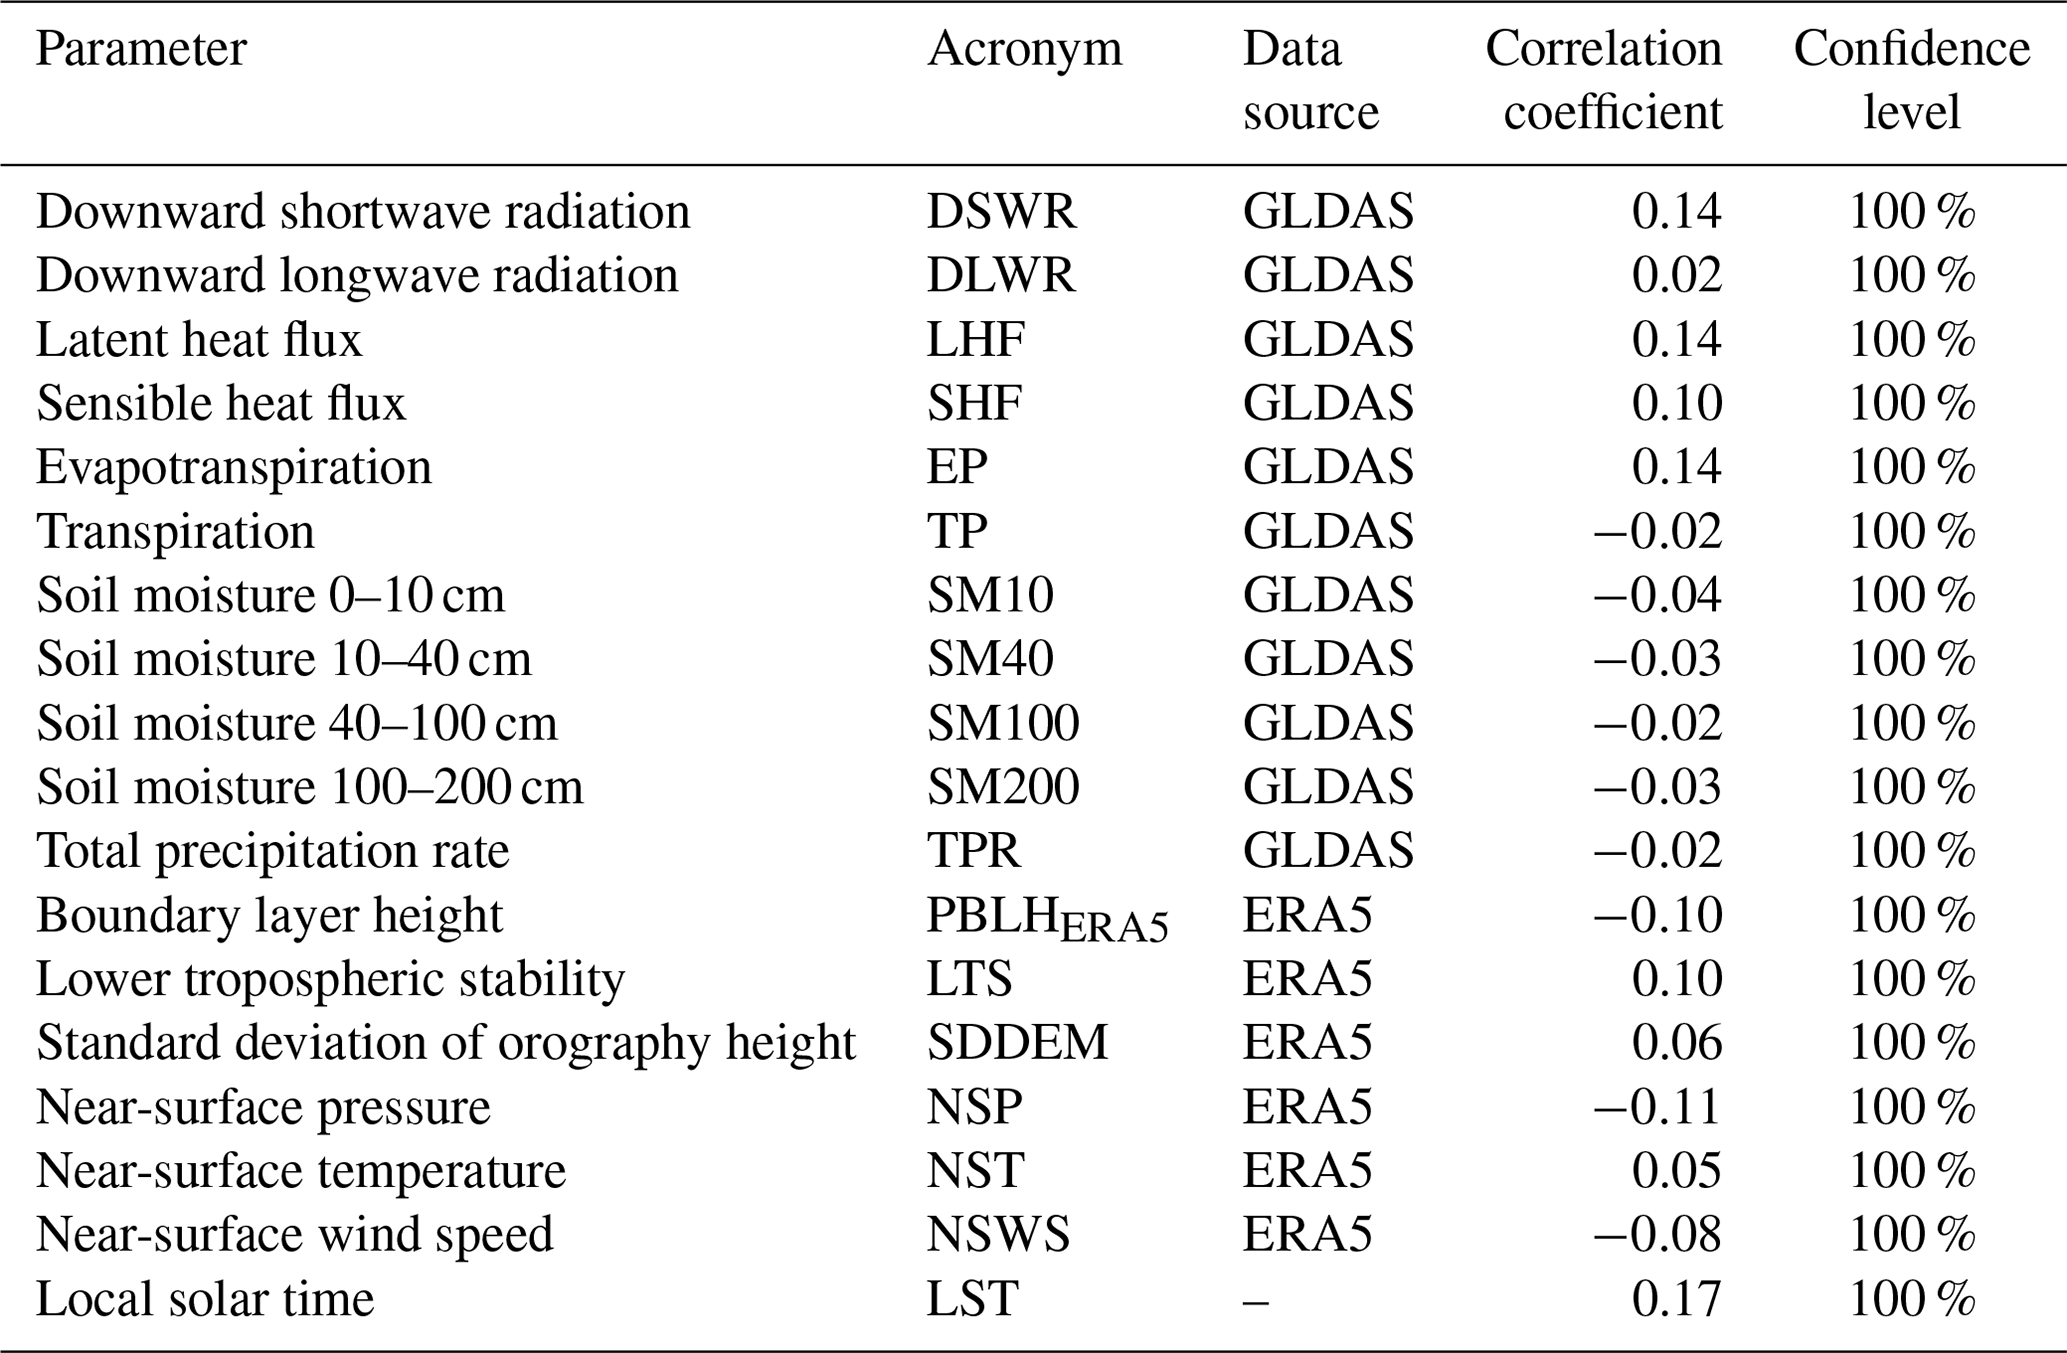
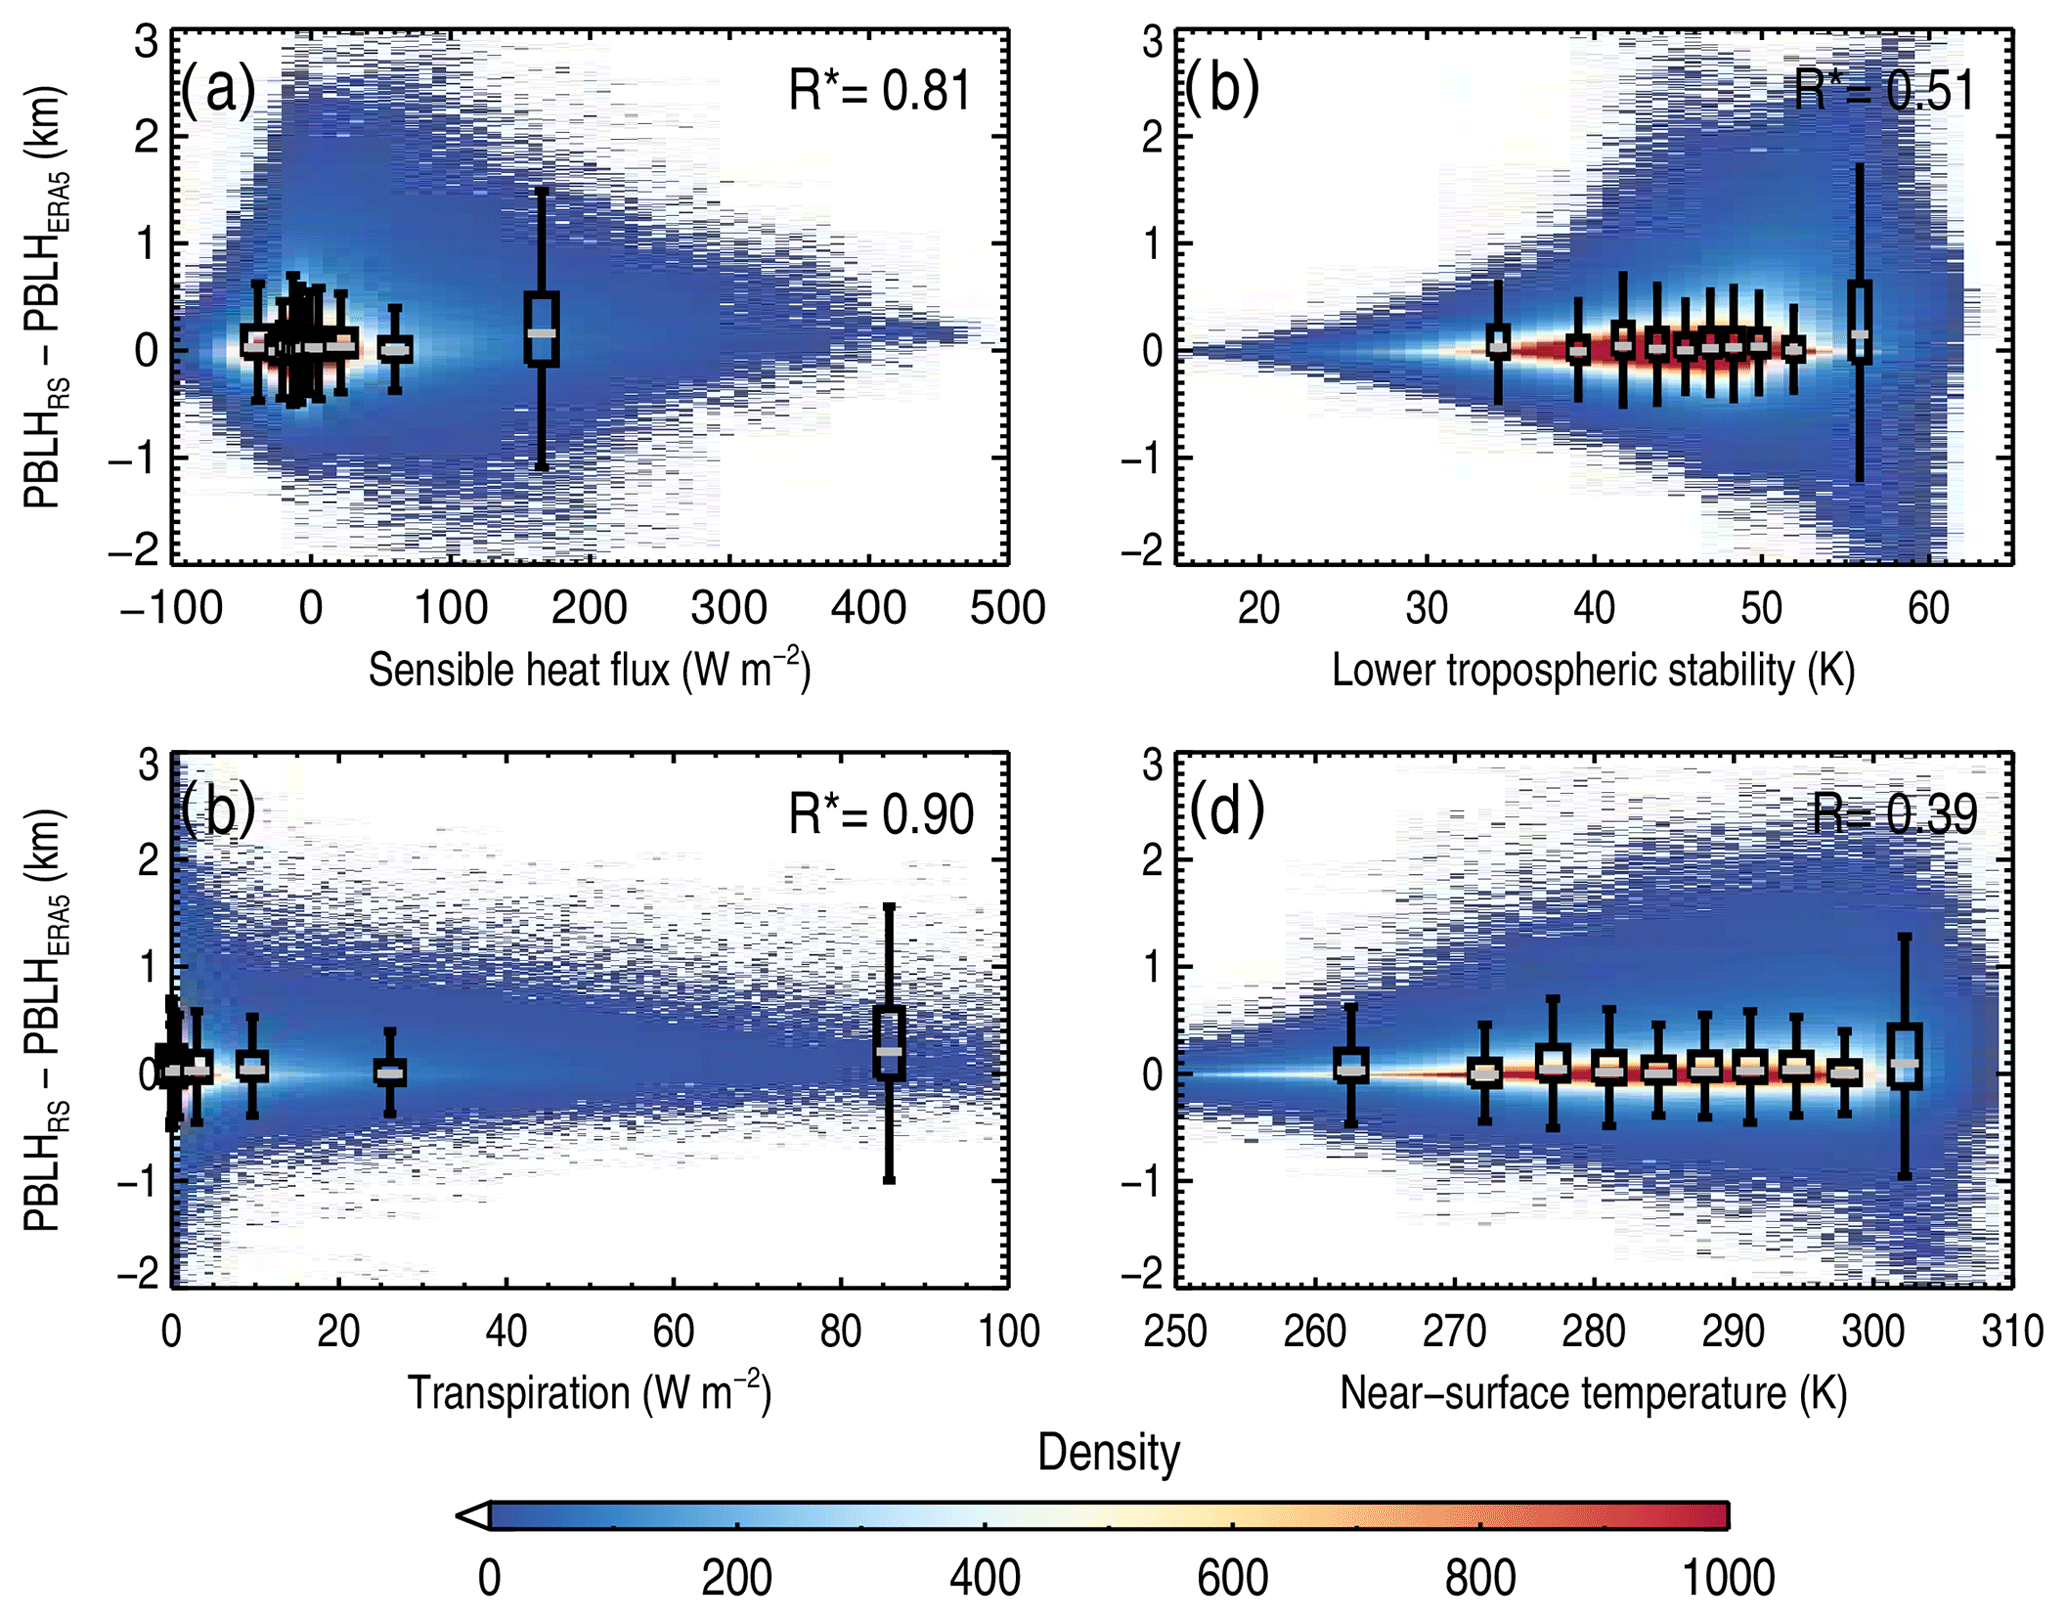
Figure 3Joint distribution of the difference in PBLHRS and PBLHERA5 and the surface sensible heat flux (a), the lower tropospheric stability (b), transpiration (c), and the near-surface temperature (d). The box-and-whisker plots in 10 even intervals are overlaid in each panel, and the correlation coefficients are marked in the upper right corner of each panel, wherein the asterisks indicate that the values are statistically significant (p<0.05).
The spatial distribution of sample numbers over each radiosonde station at four different synoptic times (00:00, 06:00, 12:00, 18:00 UTC) is presented in Fig. 1. It is noticeable that the radiosonde stations over Europe, the US, China, and Australia have an unprecedented, rich geographic coverage. Furthermore, the radiosonde measurements over China and the US have a fair temporal continuity at 00:00 and 12:00 UTC, with a total sample size reaching up to 3000 for each station. In comparison, the stations are poorly distributed over regions or countries such as South America, the Pacific islands, Russia, the Middle East, India, and Africa.
2.2 ERA5 and GLDAS
ERA5 is the latest version of the ECMWF reanalysis, benefiting from a decade of developments in model physics, core dynamics, and data assimilation (Hersbach et al., 2020). The PBLH product is resolved by the ERA5 reanalysis on a 1440×721 longitude and latitude grid, with a spatial resolution of and a temporal resolution of 1 h, which is realistically simulated by the bulk Richardson number method. In addition, the parameters, such as the lower tropospheric stability (LTS), the standard deviation of digital elevation model (SDDEM), 10 m surface wind speed, 2 m air temperature, and 2 m pressure, are either computed or directly extracted from the ERA5 reanalysis. LTS is defined as the difference in potential temperature between 700 and 1000 hPa (Guo et al., 2016). As a result, a total of six parameters were obtained from the ERA5 reanalysis.
The land property parameters were taken from GLDAS, which include downward shortwave radiation (DSWR), downward longwave radiation (DLWR), surface heat net flux (SHF), surface latent heat net flux (LHF), evapotranspiration, transpiration, soil moisture in 0–10, 10–40, 40–100, and 100–200 cm, and total precipitation. In total, 11 parameters were extracted from the GLDAS product. GLDAS has a temporal resolution of 3 h and the same spatial resolution as the ERA5 reanalysis. However, GLDAS has no data over Antarctica. It should be noted that there exists a 0.125∘ lag between the start latitude and longitude of GLDAS and those of ERA5 and, therefore, the latitude and longitude of GLDAS minus 0.125∘ have to be used to match with ERA5 reanalysis.
According to the methods proposed by Guo et al. (2021), the collocation procedures between the grid products from ERA5 and GLDAS and station-based radiosonde observations were mainly implemented as follows: (1) the grid should contain the radiosonde station and (2) the UTC time (hour) of the grid product and radiosonde stay the same.
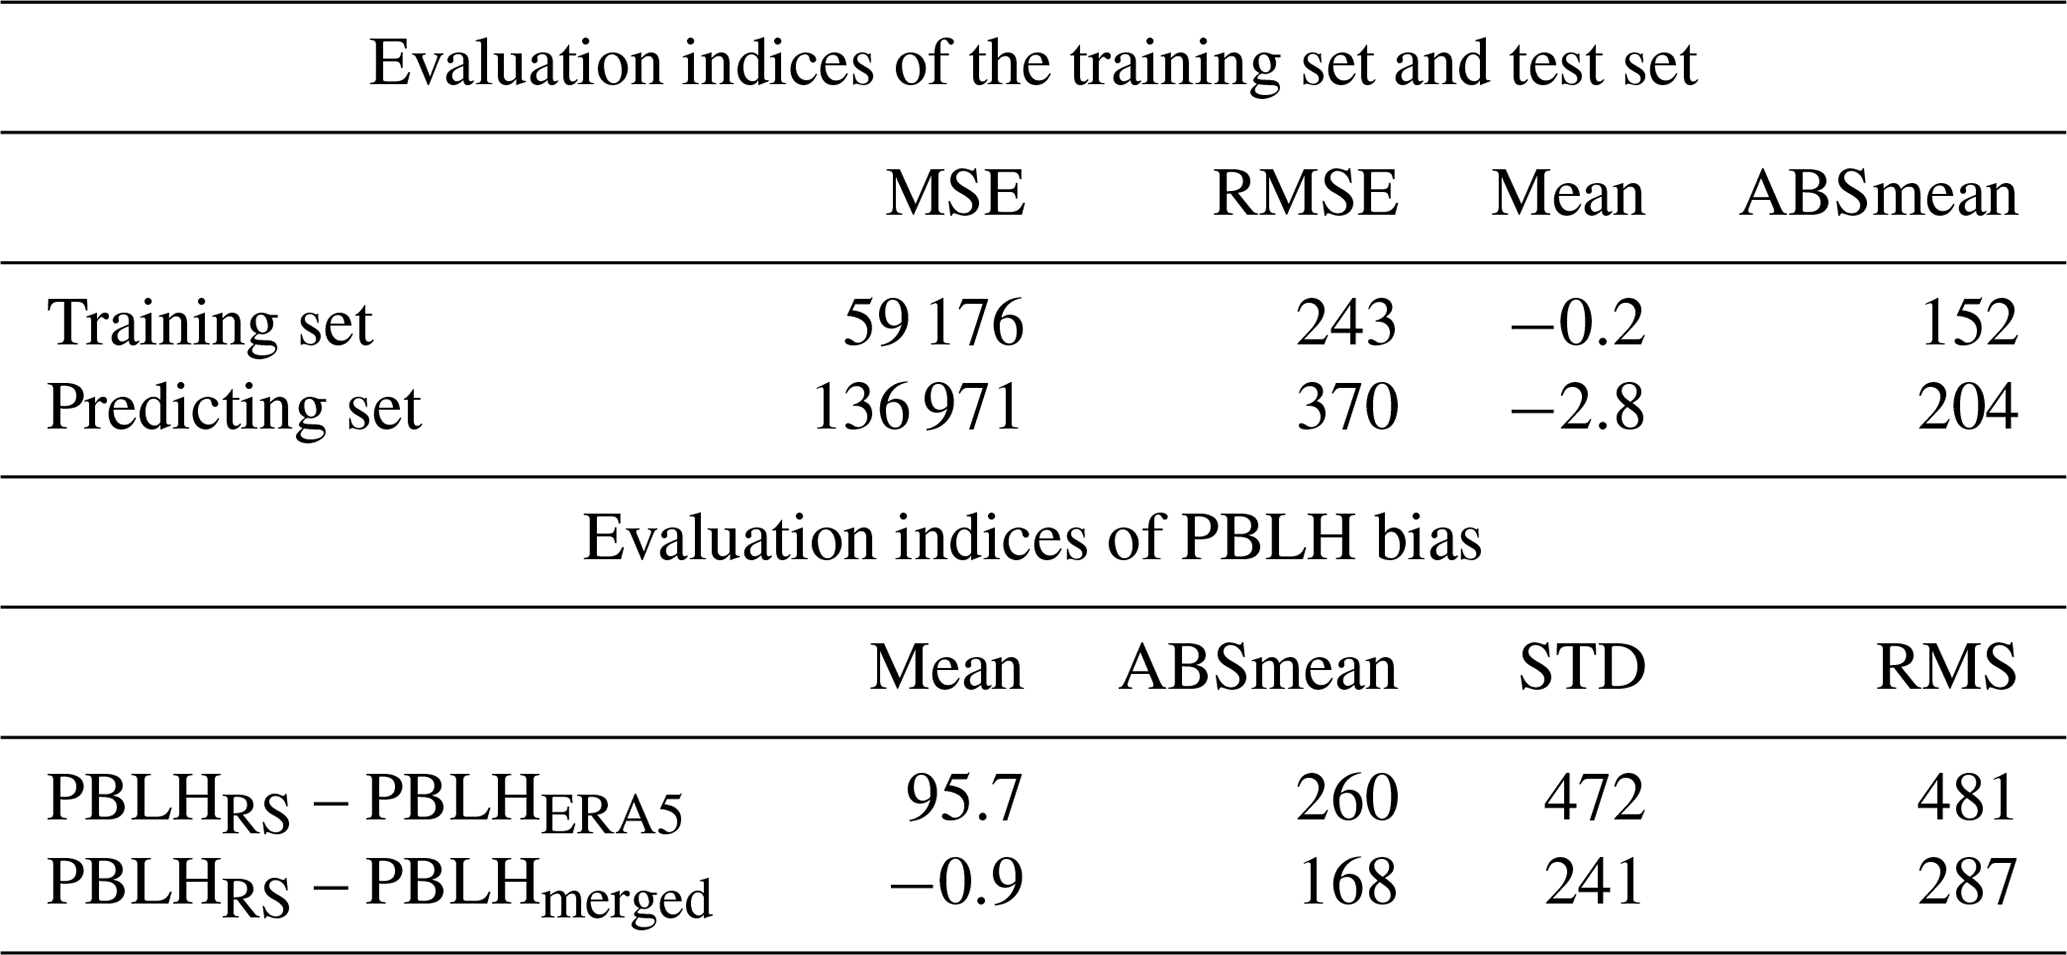
Table 3Basic information on evaluation indices. MSE, mean squared error; RMSE, root mean square error; ABSmean, mean of the absolute bias; STD, standard derivation; RMS, root mean square.
2.3 PBLH determination using the bulk Richardson number method
The bulk Richardson number (Ri) is widely used for climatological study of PBLH from radiosonde measurements thanks to its applicability and reliability for all atmospheric conditions (Anderson, 2009; Seidel et al., 2012). Ri, a good indicator of turbulence and thermodynamic stability, is calculated as the ratio of turbulence due to buoyancy to that due to mechanical shear, which is formulated as
where g is the gravitational acceleration, zAG the AGL, θv the virtual potential temperature, u∗ the surface friction velocity, u and v the horizontal wind component, and b the constant which is usually set to zero since friction velocity is much weaker compared to the horizontal wind (Seidel et al., 2012). The subscripts of z and s denote the parameters at z height above ground and the ground level, respectively.
The critical value of Ri(z) can be used to identify a statically stable layer atop the PBL (Seibert et al., 2000), and it is commonly taken as 0.25. Meanwhile, PBLH estimates were found to vary little by differing the input of critical values () (Guo et al., 2016). Therefore, the PBLH here is identified as the interpolated height at which the Ri(z) profile crosses the critical value of 0.25. The determined PBLH was set invalid in the following two scenarios: (1) Ri(z) in Eq. (1) exceeds 0.25, where z is the second level of radiosonde measurement; (2) the estimated PBLH is extremely high (for instance, 10 km) and apparently overestimates the well recognized climatological averaged PBLH.
As shown in Fig. 2, there exist discernable biases between PBLH retrieved from radiosonde (hereinafter referred to as PBLHRS) and PBLH determined from ERA5 reanalysis (hereinafter referred to as PBLHERA5). The match procedures between PBLHRS and PBLHERA5 follow Guo et al. (2021). Noticeably, the PBLH bias (PBLHRS minus PBLHERA5) is less dependent on years, with a mean bias of 95.7 m, indicative of a possible systematic PBLH underestimation by the ERA5 reanalysis. By contrast, the underestimation is around 137 m during the daytime (Guo et al., 2021), which is systematically larger than that during all days obtained in the present study. However, the bias is found to vary with season and local solar time (LST). More precisely, the mean bias varies from 150 m in March–April–May (MAM) to 64 m in September–October–November (SON), and from 309 m at 17:00 LST to 1.8 m at 00:00 LST. Moreover, the standard deviation of bias greatly changes from 64 m at 01:00 LST to 807 m at 17:00 LST. The large uncertainty raised by PBLHERA5 during the daytime motivated this study to establish a new PBLH dataset that would be more consistent with observations.
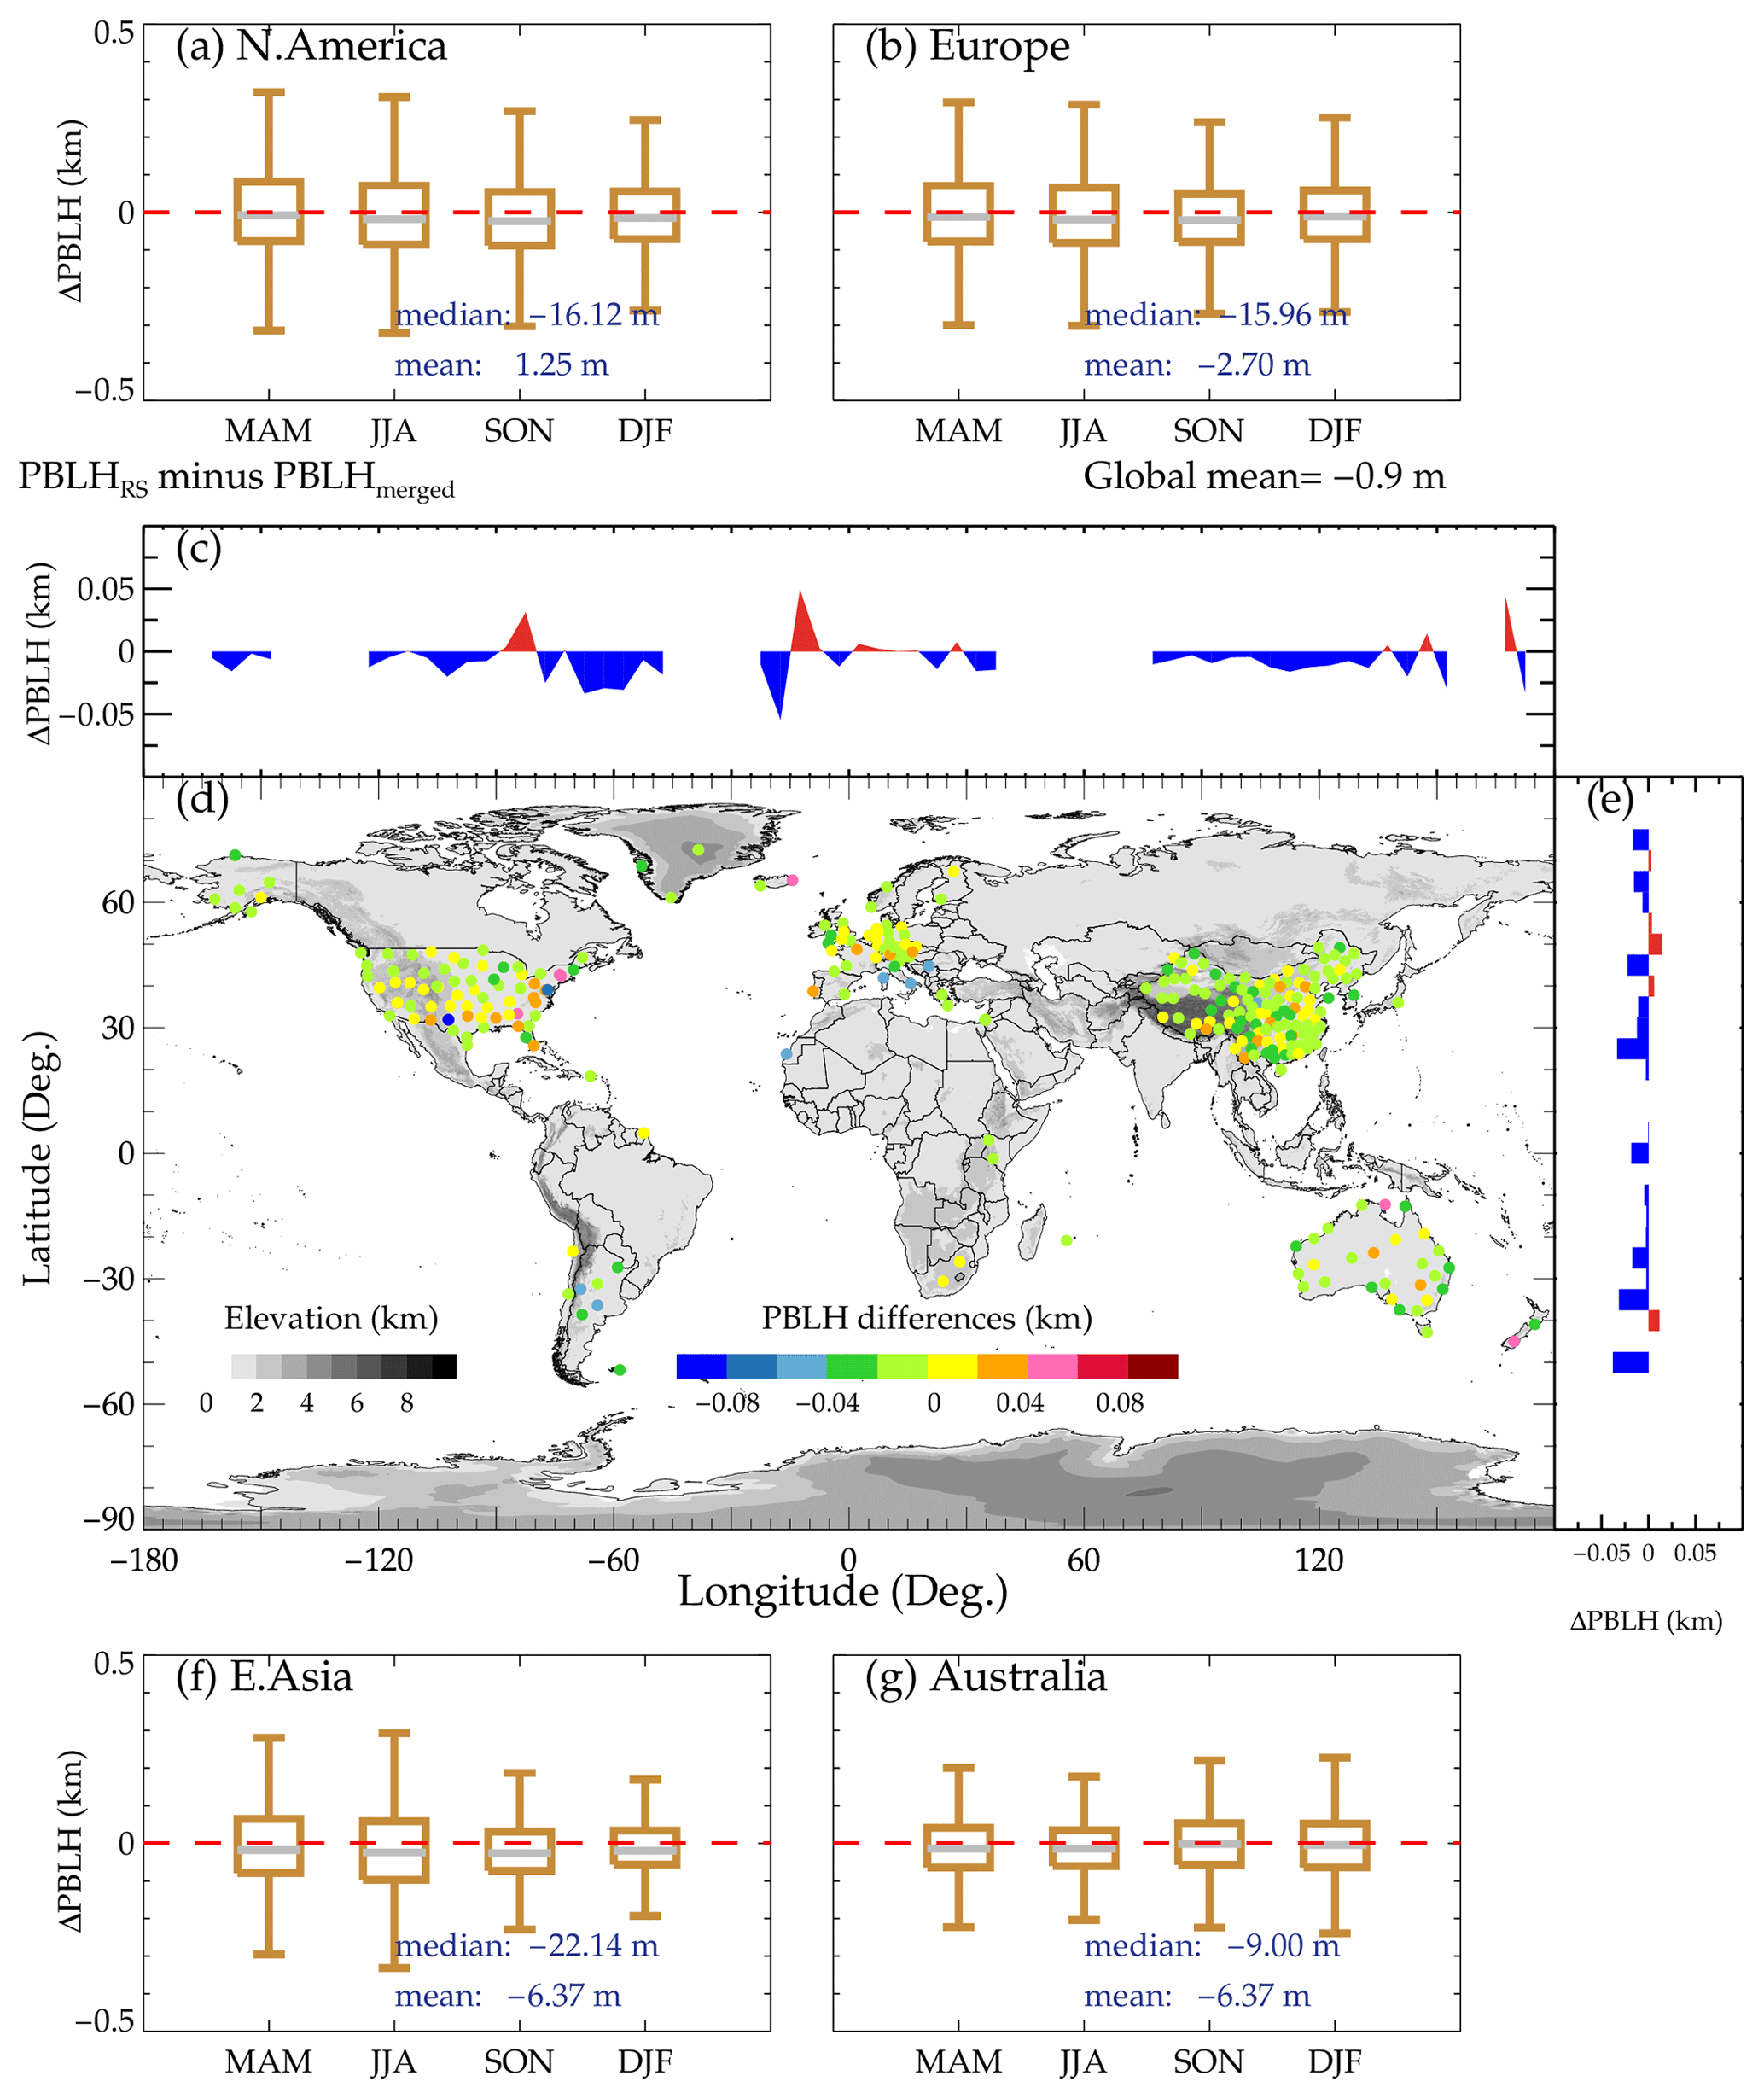
Figure 5Spatial variations of PBLH differences between PBLHRS and PBLHmerged. Panel (d) indicates the overall spatial distribution, and panels (c) and (e) illustrate its longitudinal and latitudinal variations, respectively. Panels (a), (b), (f), and (g) represent the seasonal variations over the four regions of interest, including North America, Europe, East Asia, and Australia, respectively. MAM, March–April–May; JJA, June–July–August; SON, September–October–November; DJF, December–January–February.
Previous studies have indicated that the bias could be physically attributed to variables such as SDDEM and LTS (Guo et al., 2021). However, the potential correlations with other variables, including DLWR, DSWR, SHF, LHF, evapotranspiration, transpiration, total precipitation rate (TPR), and soil moisture (SM), as well as wind speed, pressure, and air temperature at the near surface, have yet to be systematically investigated. Figure 3 shows that the bias is positively correlated with SHF, transpiration, LTS, and 2 m near-surface temperature, with a correlation coefficient ranging from 0.39 to 0.9 based on 10 evenly split bins. However, these parameters could be independent. For instance, evapotranspiration is determined by surface features which include plant physiology, land cover, and soil moisture, and it is the most important non-radiative process transmitting latent heat from the surface to the atmosphere (Cuxart and Boone, 2020). In addition, soil moisture probably contributes to decreases in the surface sensible flux locally (Basha and Ratnam, 2009). We further performed correlation analyses between the aforementioned variables and PBLH biases between radiosonde and ERA5 reanalysis, and the statistical results are shown in Table 2.
It was found that the PBLH bias is highly associated with variations in land properties, near-surface meteorological conditions, terrain elevations, LTS, and solar cycles. Consequently, it is possible to predict the PBLH bias based on these potential influential variables. Once the spatially resolved bias is available, a bias-corrected PBLH dataset, namely a merged PBLH product (denoted as PBLHmerged hereafter), can be acquired by perturbating PBLHERA5 with the addition of predicted bias. This process can be formulated as
where PBLHbias denotes the PBLH bias to be predicted. Under this philosophy, we here established a data-driven PBLHbias prediction model with the abovementioned factors used as the potential input variables, while the PBLH bias over radiosonde sites was the learning target. Considering the possible dependence on the magnitude of PBLHERA5 and its corresponding LST, these two factors were also used as covariates in predicting PBLH bias.
After testing with several machine learning models, such as the ridge regression, the decision tree regressor, the support vector regressor, the multilayer perceptron regression, and random forest (RF), we found the latter method to give the most proper and robust prediction. Therefore, an RF regressor was established to give a prediction of PBLHbias, and can be described as
where the abbreviation RF represents the random forest regressor, and the other acronyms and abbreviations are listed in Table 2. In the RF model, the hyper-parameters of the maximum depth of the tree and the random state of the bootstrapping of the samples are compiled to 20 and 5 in this analysis, respectively. The dataset that contains the input array and the learning target is randomly divided into two parts, with 70 % for training and 30 % for validation. All the data from 2011–2021 were included in the model training stage. Statistical metrics, including the mean squared error (MSE), root mean square error (RMSE), arithmetic mean, and arithmetic mean of the absolute difference, were applied to evaluate the performance of the prediction model.
Table 3a presents the prediction accuracy on the training and testing sets. Overall, the RMSE and arithmetic mean on the training subset are 243 and −0.2, respectively. In comparison, these two metrics are 370 and −2.8 on the testing subset, implying the presence of slight overfitting. To demonstrate the merit of PBLHmerged, we further compared the PBLH bias before and after merging. As illustrated in Fig. 4a, the mean bias between PBLHRS and PBLHmerged is −0.9 m, which is smaller than the bias between PBLHRS and PBLHERA5. In addition, the mean of absolute bias decreases from 260 m (PBLHRS minus PBLHERA5) to 168 m (PBLHRS minus PBLHmerged), and the standard derivation declines from 472 to 241 m, as listed in Table 3b. Moreover, the correlation coefficient between PBLHRS and PBLHERA5 is 0.59, and it increases to 0.92 between PBLHRS and PBLHmerged. More importantly, the bias between PBLHRS and PBLHmerged during the daytime is dramatically decreased, to 20 m, compared to the bias between PBLHRS and PBLHERA5 (300 m). These metrics clearly demonstrate a better accuracy of PBLHmerged than PBLHERA5, indicative of the merit of correcting modeling biases in PBLHERA5.
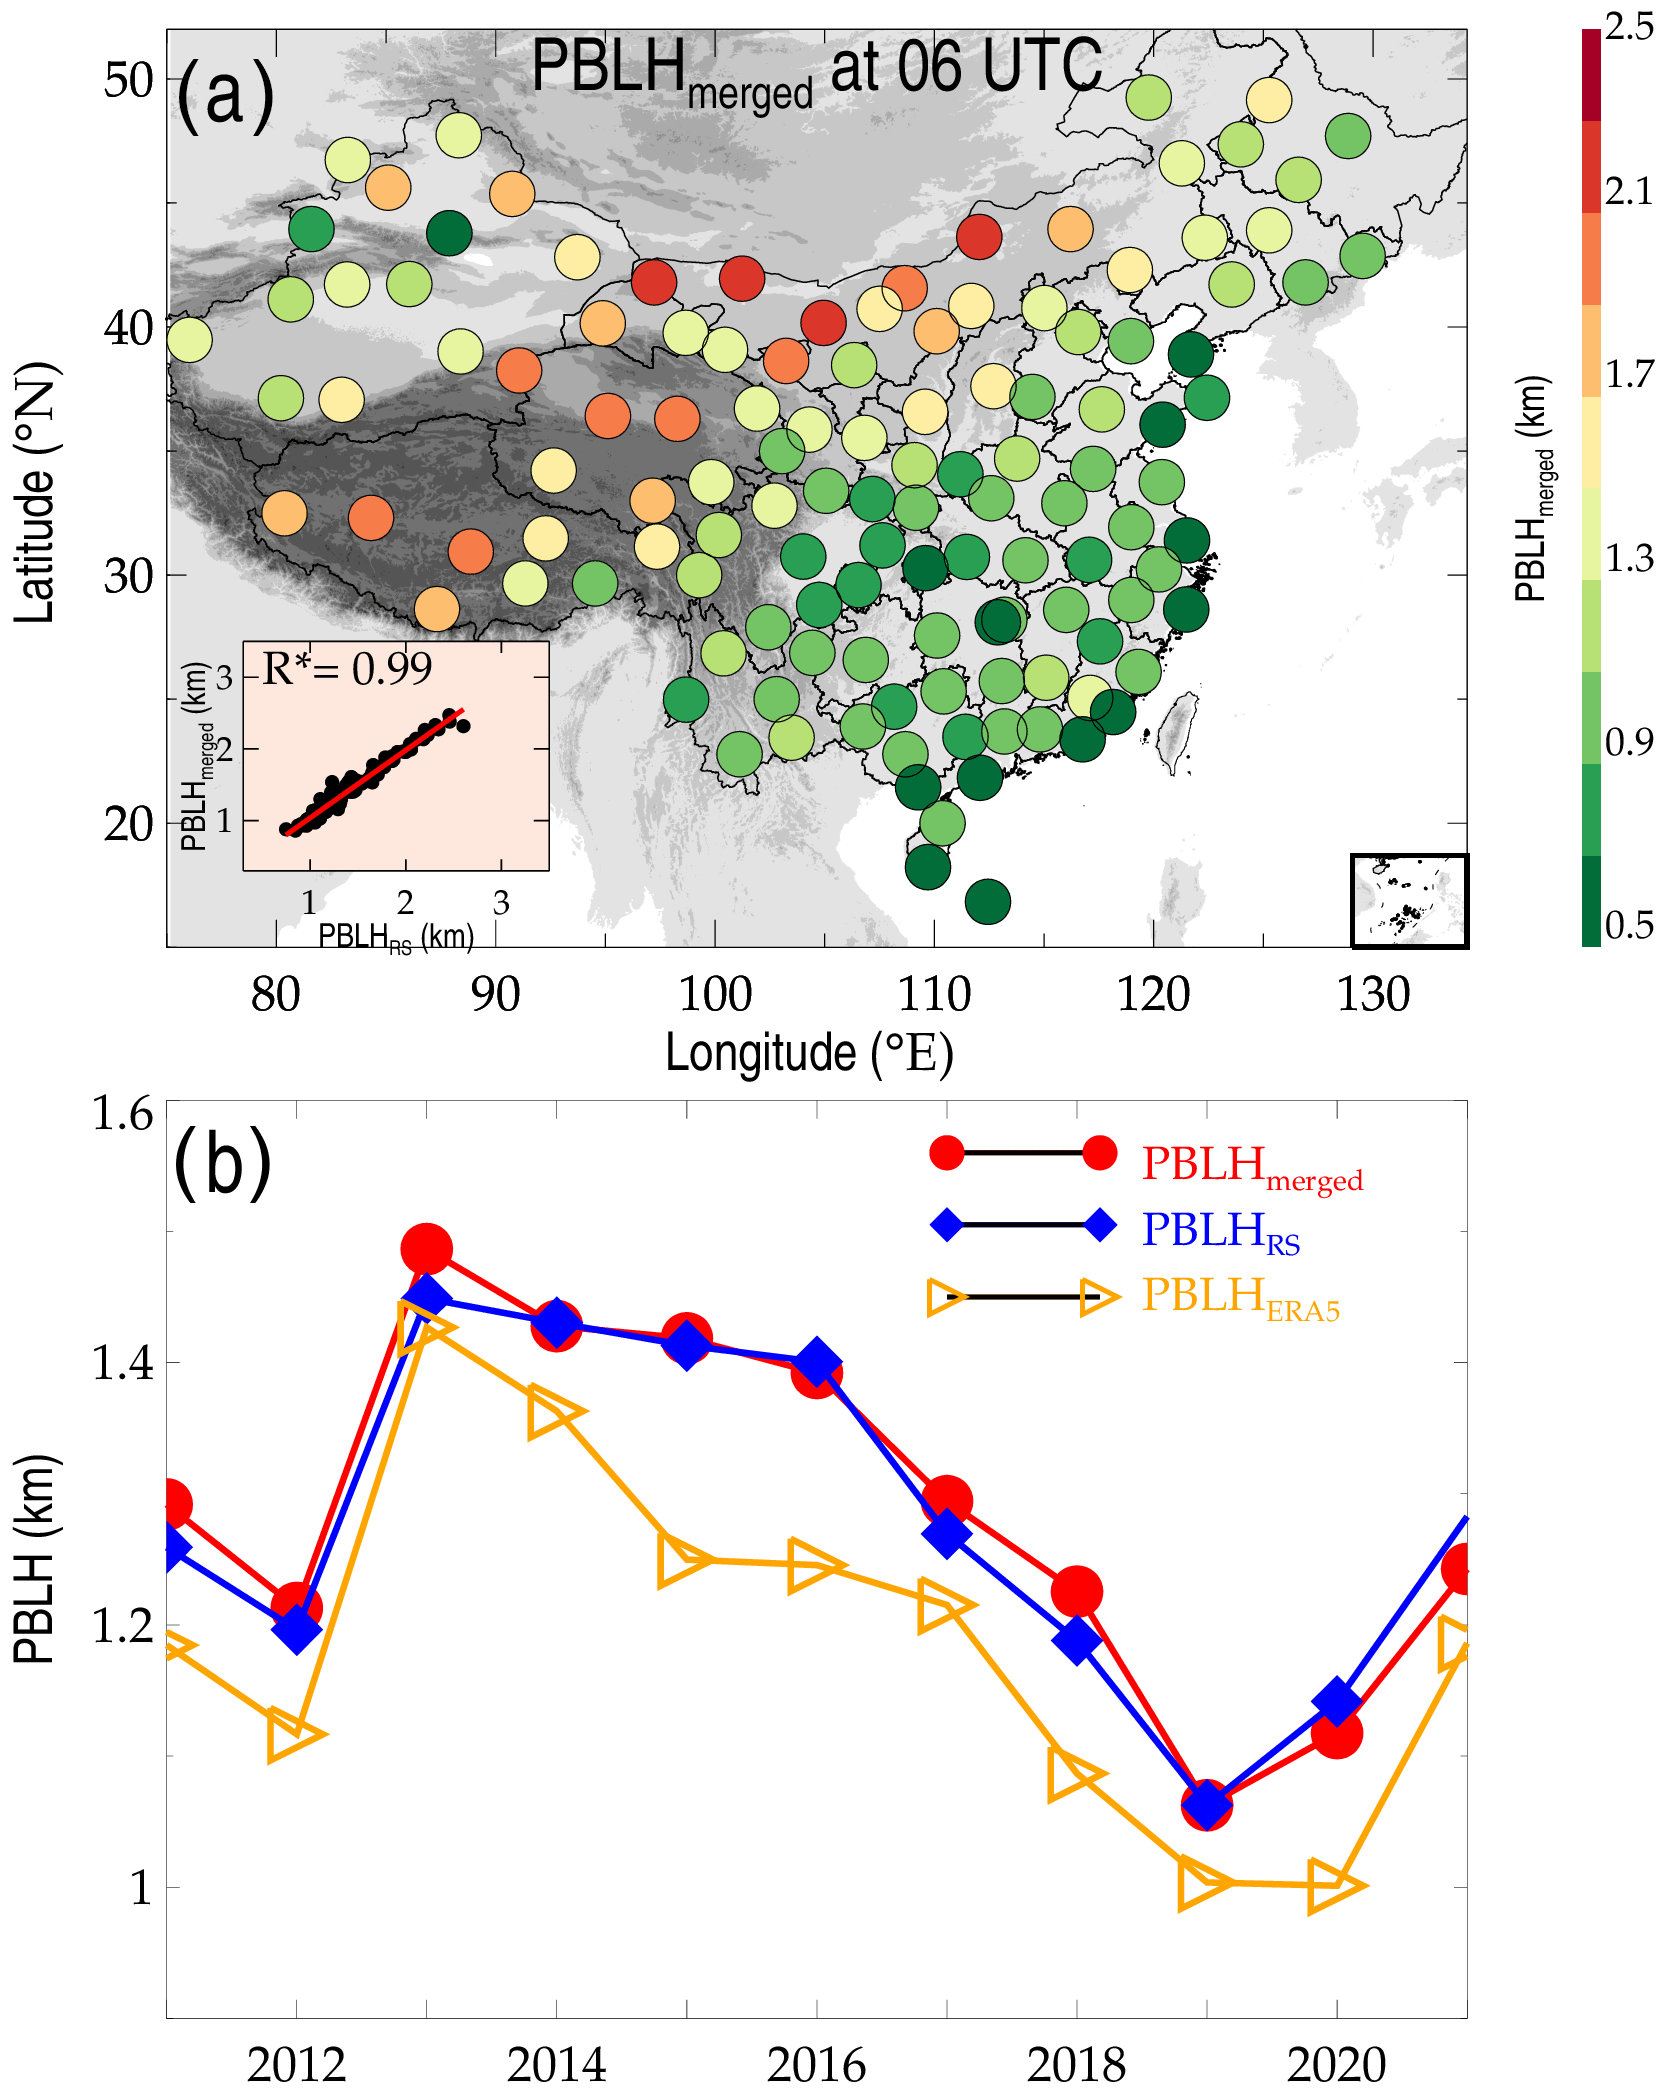
Figure 6(a) Spatial distributions of PBLHmerged at 06:00 UTC across China for the years 2011 to 2021. The scatter plot in the left bottom of the panel illustrates the statistical correlation between PBLHmerged and PBLHRS, where the asterisks indicate that the values are statistically significant (p<0.05). Also shown is the temporal evolution of annual average PBLHmerged, PBLHRS, and PBLHERA5 during the period 2011 to 2021 (b).
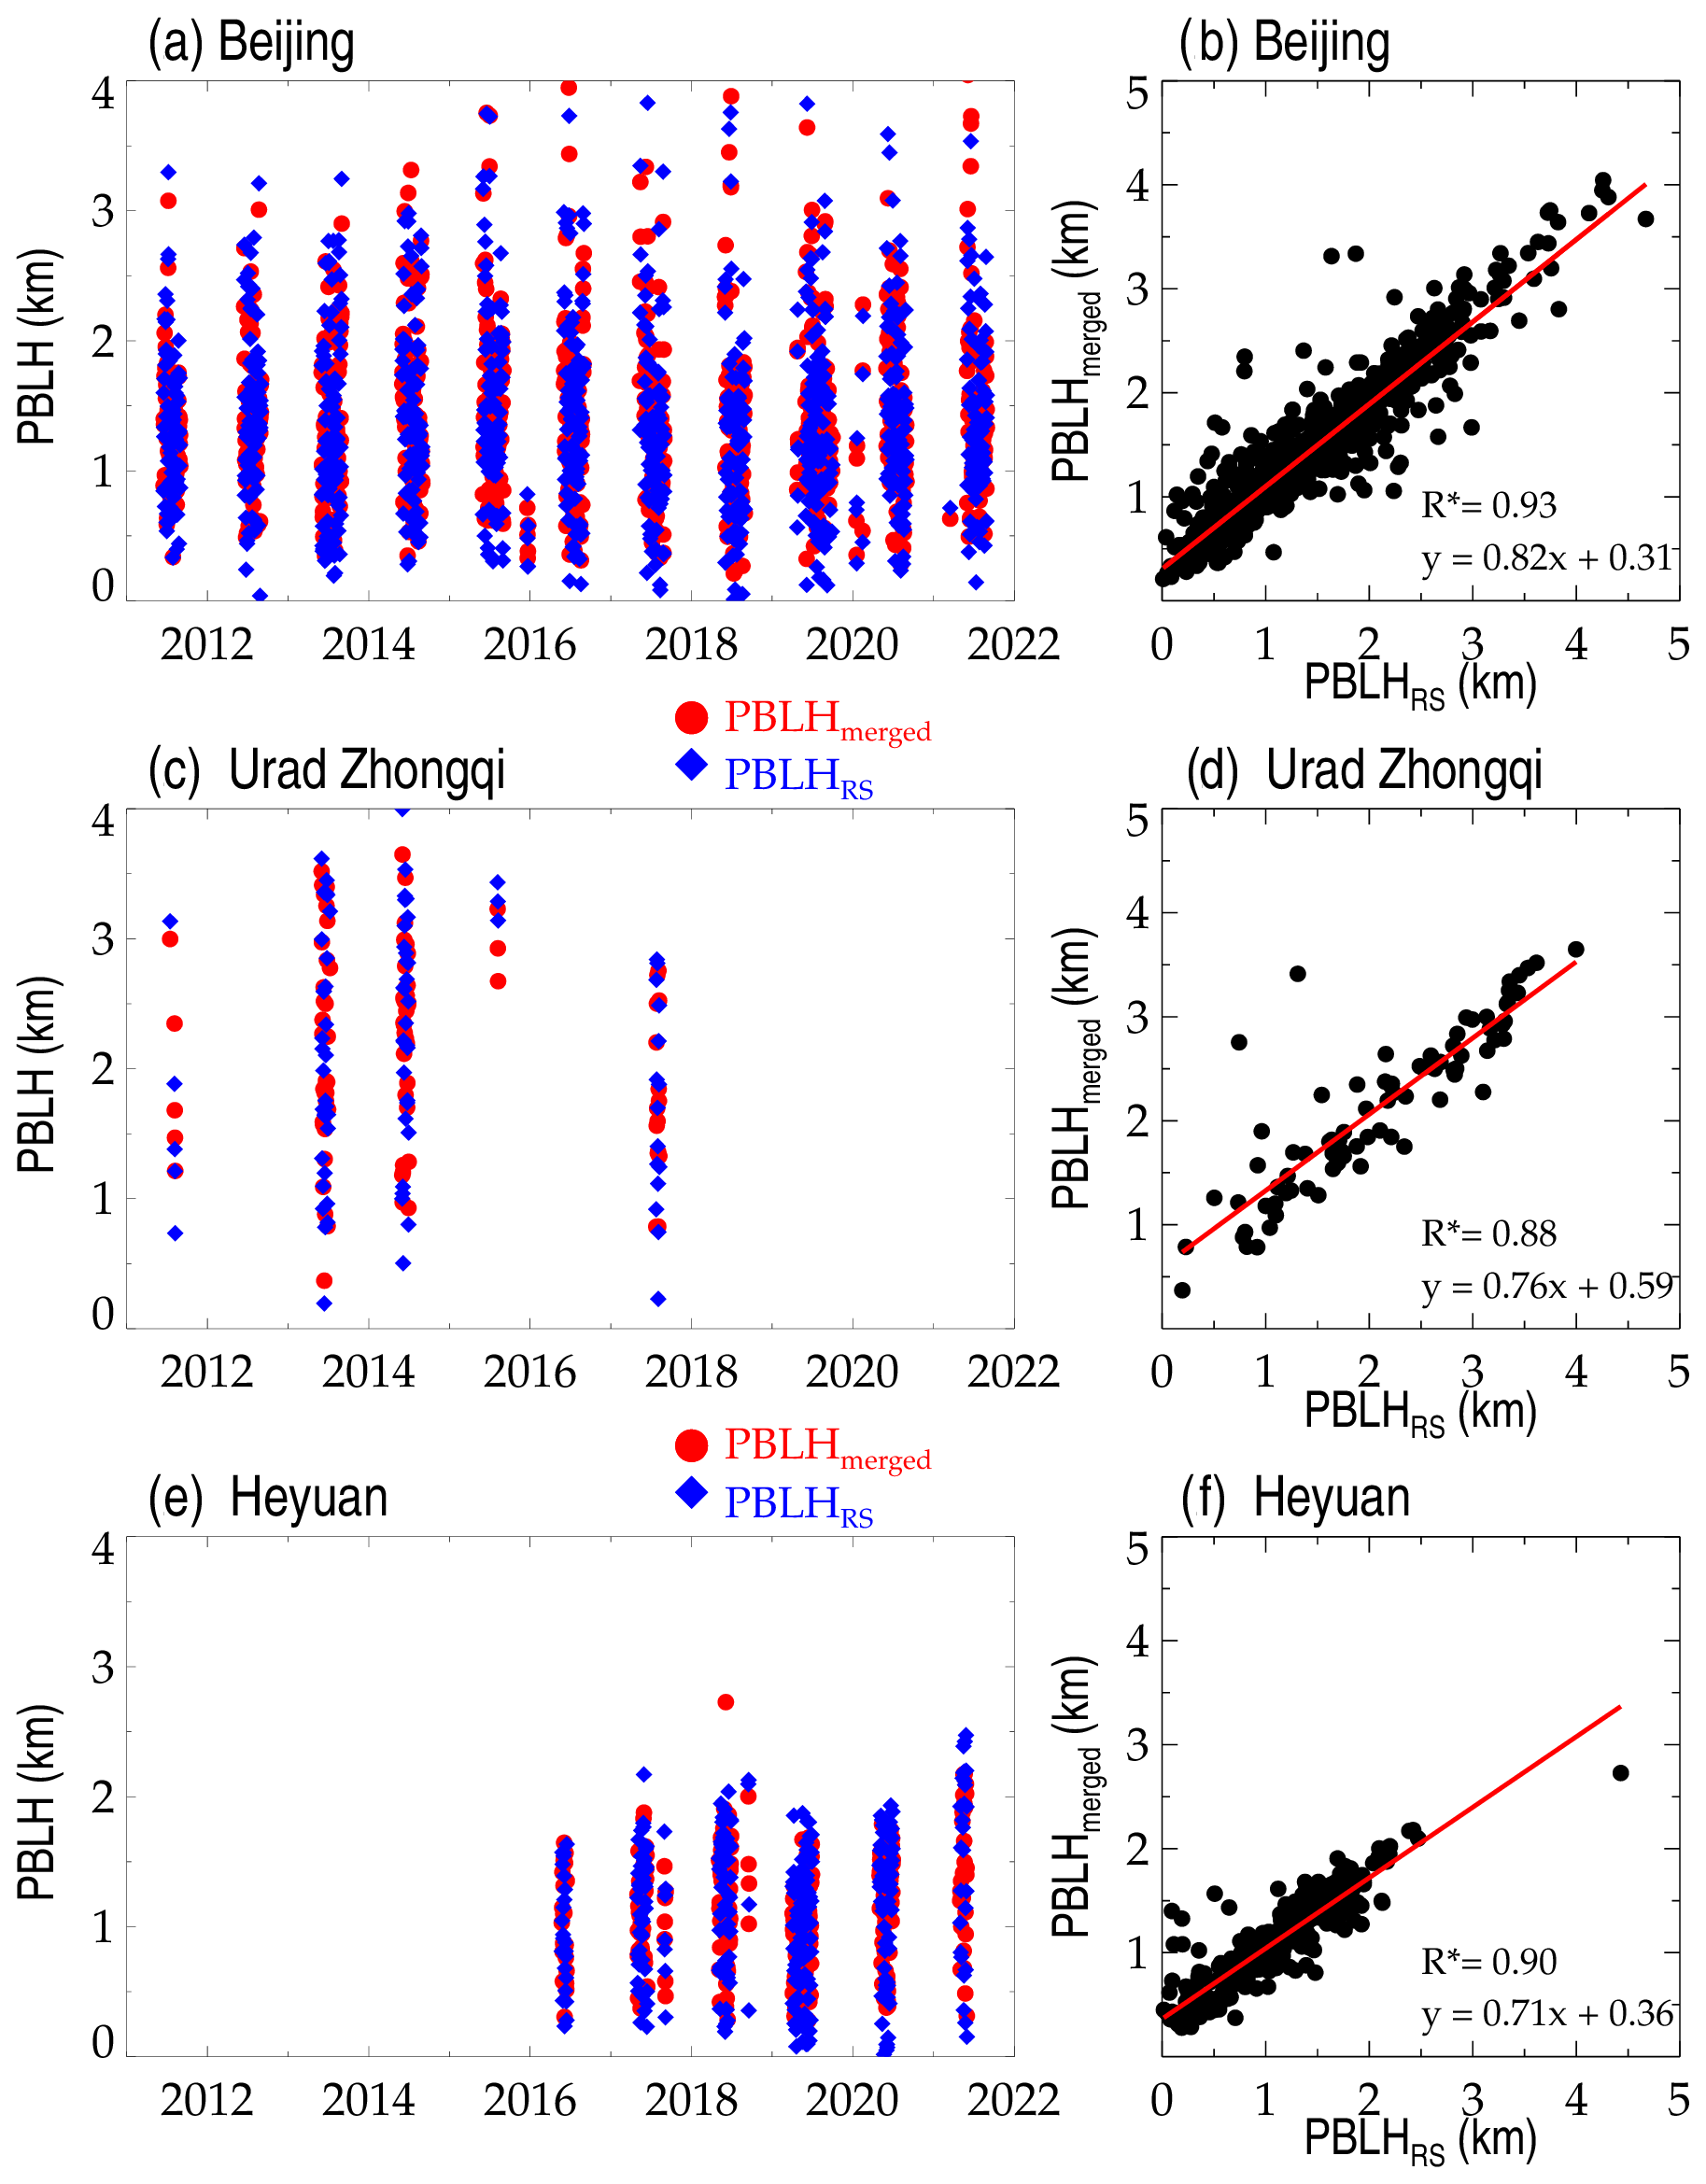
Figure 7Temporal variations of PBLHmerged (red) and PBLHRS (blue) at Beijing (39.8∘ N, 116.47∘ E) (a), the Urad Zhongqi station (41.3∘ N, 108.3∘ E) (b) in the Nei Monggol Autonomous Region, and (c) the Heyuan station (23.7∘ N, 114.7∘ E) in the Guangdong province. Panels (b), (d), and (f) demonstrate the joint distributions of PBLHRS and PBLHmerged, and correlation coefficients (R) and the fitted linear functions are given in the bottom right corner, where the asterisks indicate that the values are statistically significant (p<0.05).
Furthermore, the overview of PBLH bias (PBLHRS minus PBLHmerged) in terms of spatial variation, and the seasonal variations over the four regions of interest are presented in Fig. 5. As compared to the finding in Guo et al. (2021), the bias dramatically decreases to dozens of meters for all stations (Fig. 5d), many of which slightly overestimate PBLH. More specifically, the PBLH over East Asia is overestimated by around 6 m (Fig. 5f), whereas it is underestimated by around 1 m over North America (Fig. 5a). Based on the bias with near-global coverage, we could infer that the merged model gives a more realistic PBLH estimate.
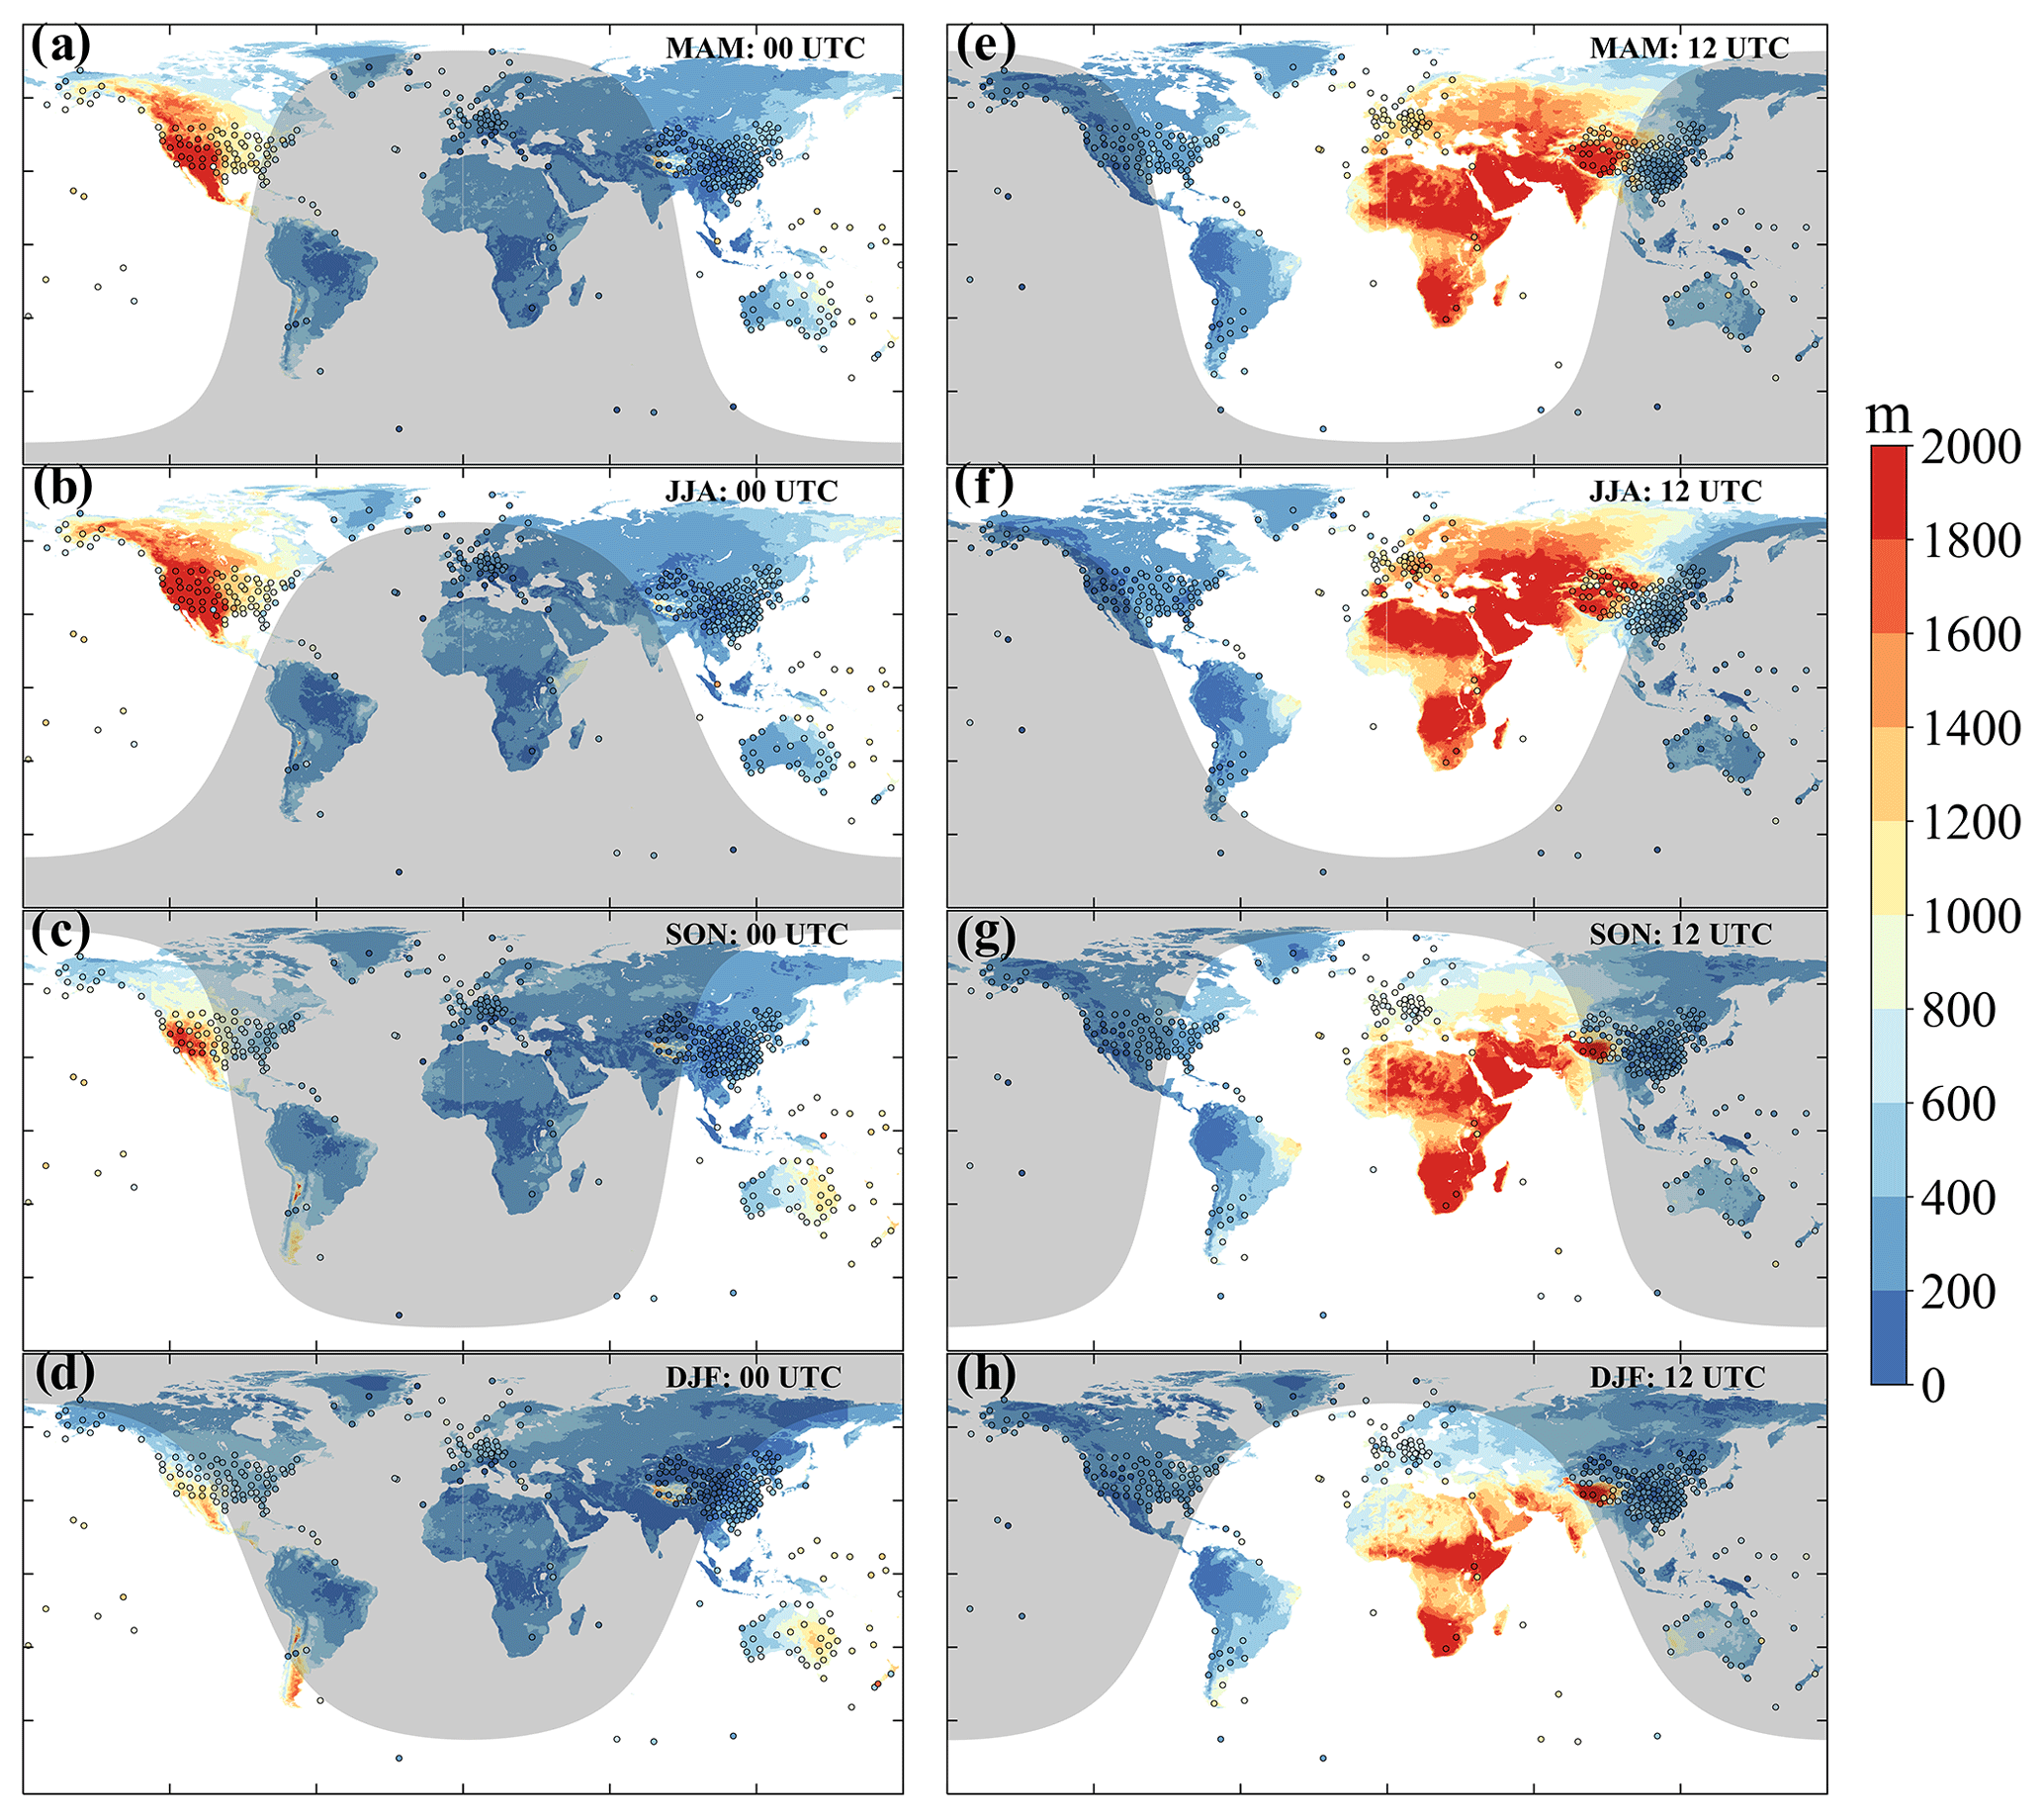
Figure 8Spatial distribution of PBLH at 00:00 (a–d) and 12:00 UTC (e–h) in four seasons over land produced by the merged algorithms proposed here (i–l). The solid colored circles indicate the PBLH retrieved from high-resolution radiosondes. The shadow zones show nighttime regions, depending on the solar zenith angle on 15 April 2019 (MAM), 15 July 2019 (JJA), 15 October 2019 (SON), and 15 January 2019 (DJF). MAM, March–April–May; JJA, June–July–August; SON, September–October–November; DJF, December–January–February.
Intensive radiosonde observation is conducted across China in the boreal summer season at 06:00 UTC (14:00 Beijing Time), when the PBL is fully developed (Zhang et al., 2018). In addition to the overall near-global spatial distribution, a deeper investigation of PBLHmerged across China at 06:00 UTC is presented in Fig. 6. The spatial distribution of PBLHmerged exhibits a pronounced “northwest high southeast low” spatial pattern (Fig. 6a), which generally agrees with Zhang et al. (2018). The correlation coefficient between PBLHmerged and PBLHRS is as high as 0.99, indicating their extreme consistencies in terms of spatial variations. The annual variations in PBLHmerged, PBLHRS, and PBLHERA5 followed a similar trend, achieving a maximum in 2013 and a minimum in 2019 (Fig. 6b). The variations in PBLHmerged and PBLHRS are rather close to each other. However, PBLHERA5 creates a different temporal variation, and it is systematically underestimated compared to PBLHRS.
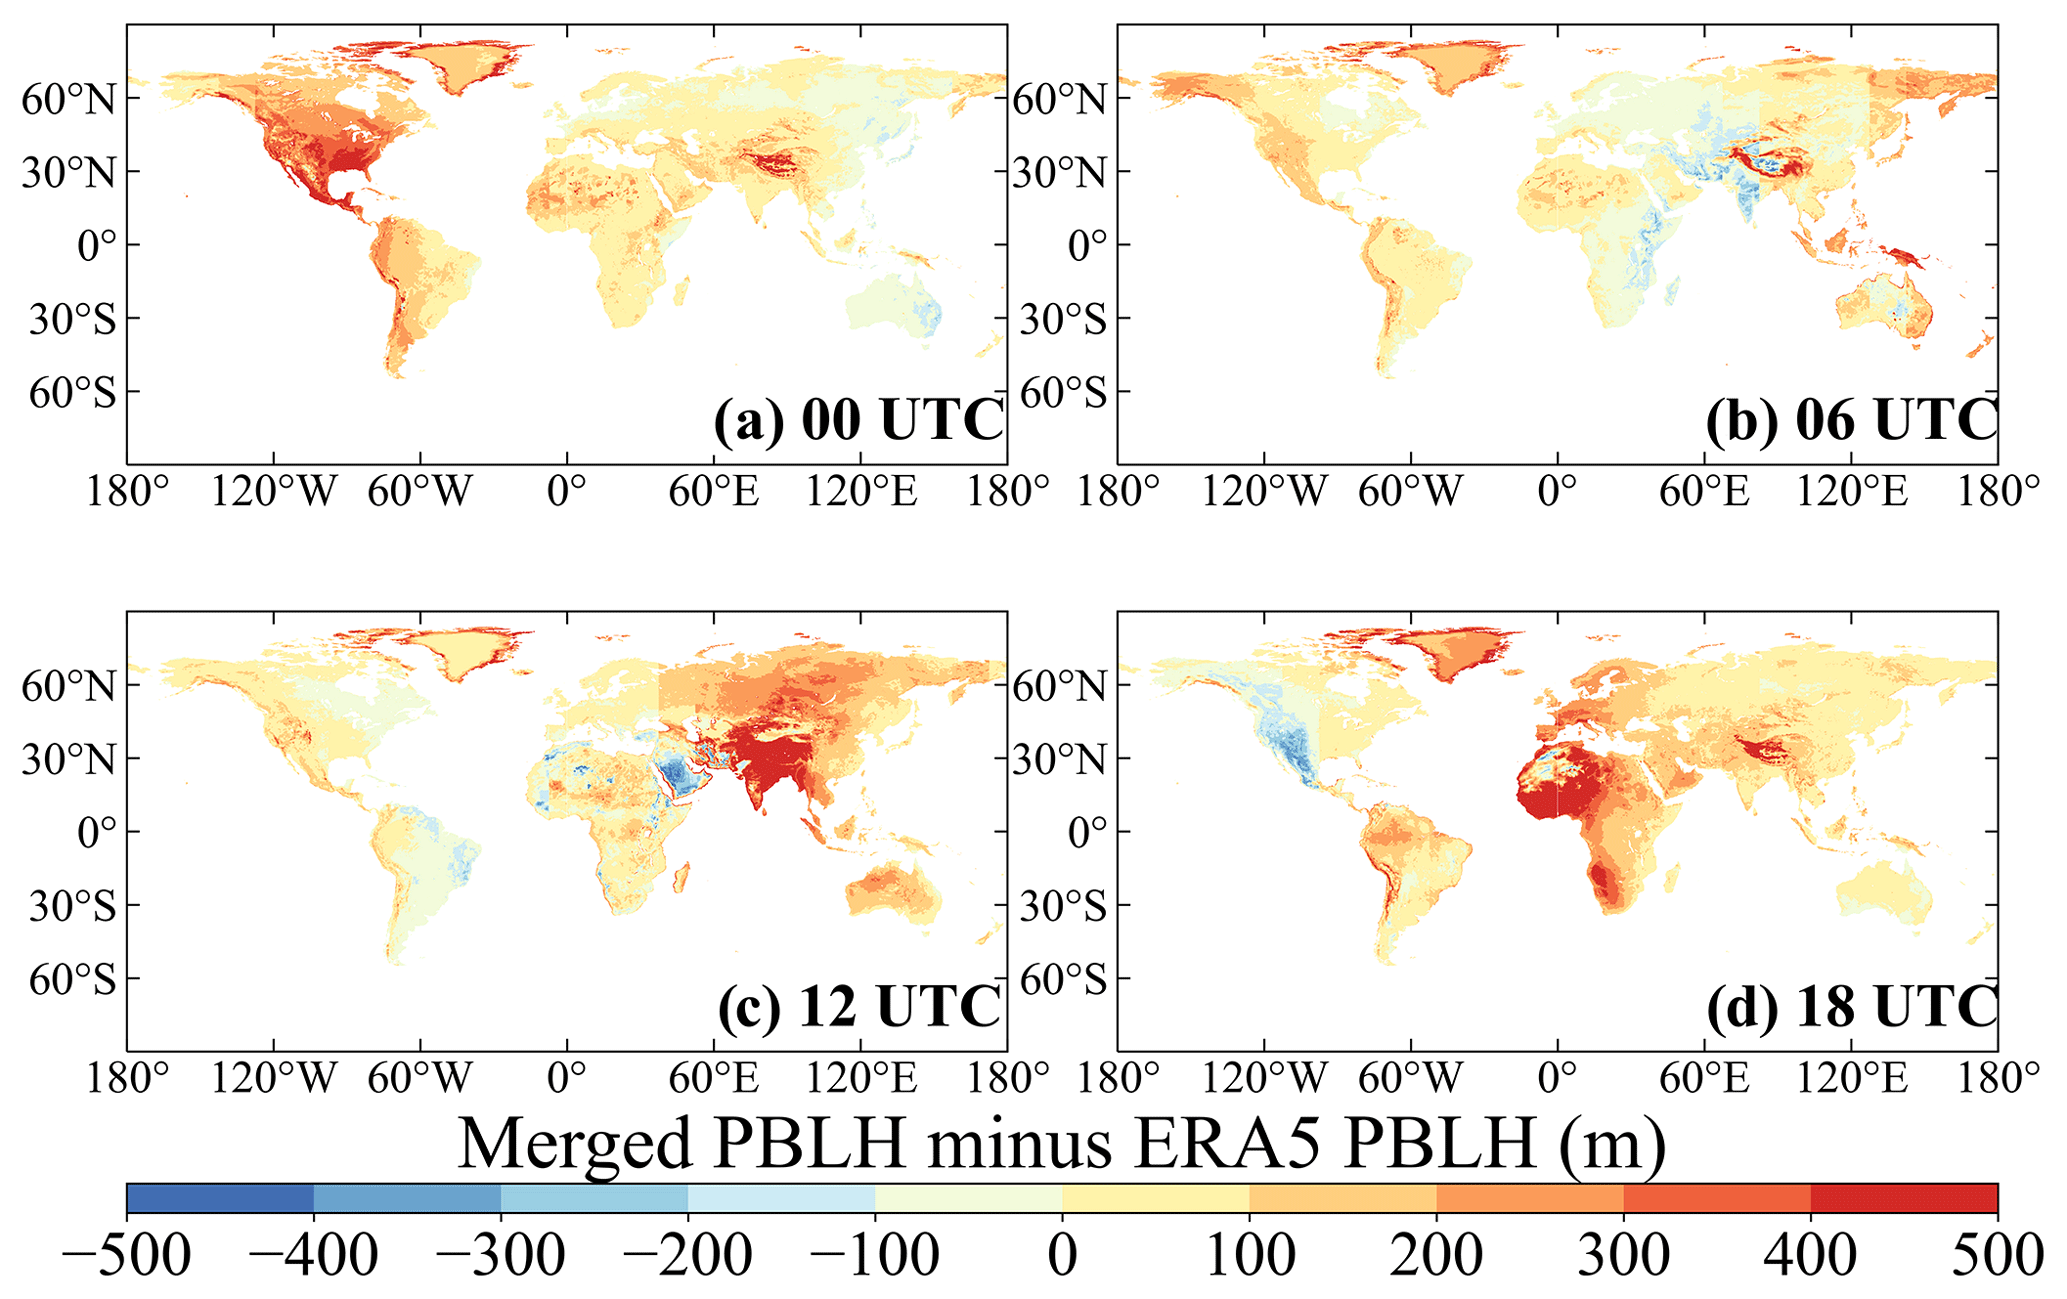
Figure 9Spatial distributions of PBLH differences between the merged dataset and the ERA5 reanalysis from the years 2011 to 2021 at 00:00 (a), 06:00 (b), 12:00 (c), and 18:00 UTC (d).
As a good case in point for the comparison of fine structures, we show the diurnal variation of PBLHmerged and PBLHRS at 06:00 UTC over three stations in Fig. 7. Three sites, including one in northwestern China where the highest PBLH is usually obtained, one in northern China where the most intensive observations can be found, and one in southern China where the lowest PBLH can be detected. The diurnal variations of PBLHmerged and PBLHRS are strongly correlated with the lowest correlation of 0.88 (Fig. 7d). From Figs. 5–7, we can observe that the spatiotemporal variations of PBLHmerged and PBLHRS are in good agreement.
The climatological mean of PBLHmerged in four seasons at 00:00 and 12:00 UTC during the years 2011 to 2021 is illustrated in Fig. 8, and PBLHRS at the same UTC and in the same season is overlaid as filled circles. At all UTCs and in all seasons, the PBLHmerged is high during the daytime as compared to the nighttime, and reaches a maximum of around 2 km, especially in the afternoon. In addition, PBLHmerged experiences noticeable seasonal variation. For instance, over Australia, the PBLHERA5 in SON and December–January–February (DJF) seasons is about 400 m larger than in the other two seasons (Fig. 8a–d), and vice versa in the Northern Hemisphere. Moreover, we observe that PBLHmerged has a clear latitude and elevation dependence: it decreases from approximately 2 km at low and middle latitudes to around 0.8 km at high latitudes during the daytime. At similar latitudes, PBLHmerged over terrain with a high elevation could be substantially larger than for that with a low elevation. For example, in the DJF season and at 00:00 UTC, the PBLHERA5 over the Andes Mountain is about 0.4 km higher than that over the surrounding flat region (Fig. 8d). In a short conclusion, the spatiotemporal variability of the PBLHmerged is inevitably associated with local times, seasons, latitudes, terrain elevations, and hemispheres.
In general, PBLHmerged is remarkably consistent with PBLHRS in terms of seasonal variation and diurnal cycle, especially at 00:00 and 12:00 UTC, when the radiosonde measurement is comparatively sufficient. These findings suggest that PBLHmerged could adequately resolve the climatological variation in PBLH.
The difference in PBLHmerged and PBLHERA5 during the years 2011–2021 at four typical times is further illustrated in Fig. 9. Compared to PBLHERA5, PBLHmerged is overestimated overall, with a mean overestimation of approximately 90 m. The overestimation appears very close to the difference in PBLHRS and PBLHERA5. The overestimation over North America at 00:00 UTC, over East Asia and South Asia at 12:00 UTC, and over Africa at 18:00 UTC can be as high as 500 m. However, PBLH over some areas, such as the Middle East at 06:00 UTC and the Western United States at 18:00 UTC, is slightly underestimated by around 200 m.
The merged PBLH dataset and the related codes can be accessed at https://doi.org/10.5281/zenodo.6498004 (Guo et al., 2022). ERA5 data is publicly accessible at https://cds.climate.copernicus.eu/#/search?text=ERA5&type=dataset (ECMWF, 2019). NASA GLDAS can be accessed at: https://disc.gsfc.nasa.gov/datasets/GLDAS_NOAH025_3H_2.1/summary?keywords=GLDAS (NASA, 2021).
The general underestimation of PBLH by the reanalysis dataset, especially during the daytime, motivated the present analysis to generate a merged long-term high-resolution seamless continental PBLH dataset, i.e., PBLHmerged, by integrating multi-modal data products including 185 million high-resolution radiosondes from the years 2011 to 2021, ERA5 reanalysis, and the GLDAS product. The PBLHmerged dataset generated in this study has a horizontal resolution of and a temporal resolution of 3 h, identical to PBLHERA5 but with much higher data accuracy.
Compared to PBLHRS, PBLHmerged is overestimated by around −0.9 m, which is considerably smaller than the bias between PBLHRS and PBLHERA5 (95.7 m). During the daytime, the mean and the standard derivation of bias are remarkably decreased from 300 and 600 m (PBLHRS minus PBLHERA5) to 20 and 300 m (PBLHRS minus PBLHmerged), respectively. In addition, the climatological variation of the merged PBLH dataset is highly correlated with PBLHRS, both in terms of magnitude and in terms of spatiotemporal variation. Moreover, the climatological mean of continental PBLHmerged is around 90 m higher than that of PBLHERA5, which is quantitatively consistent with the comparison result of PBLHRS and PBLHERA5. Overall, the merged dataset closely agrees with the radiosonde-derived PBLH in terms of magnitude and spatiotemporal variation.
In conclusion, the PBLHmerged dataset is outstanding in terms of both spatiotemporal coverage and good accuracy. This dataset could be of importance for advancing our understanding of the PBL processes involved in air quality prediction, weather forecasting, and climate projection under global warming. In the future, with more data available over the ocean, a global seamless PBLH dataset is warranted, and this needs more field campaigns to be deployed over the open ocean or islands in the ocean in which more intensive radiosonde balloons are launched. Besides, it is imperative to improve the observational capability of satellite-based instruments in characterizing the temperature and humidity profiles in the PBL, which will no doubt help to fill the gaps in atmospheric sounding over the ocean.
JG and FH conceptualized this study. JG and JZ carried out the dataset production with comments from other co-authors. JG, JZ, and JS drafted the first manuscript, and JS, KB, and RL further revised it. JS established the model and its optimization. All authors contributed to the discussion of results interpretation and helped finalize the submission.
The contact author has declared that none of the authors has any competing interests.
Publisher's note: Copernicus Publications remains neutral with regard to jurisdictional claims in published maps and institutional affiliations.
The authors would like to acknowledge the National Meteorological Information Centre (NMIC) of CMA, NOAA, Deutscher Wetterdienst (German Weather Service), U.K Centre for Environmental Data Analysis (CEDA), GRUAN, and the University of Wyoming (http://data.cma.cn/en, ftp://ftp.ncdc.noaa.gov/pub/data/ua/data/1-sec/, https://cdc.dwd.de/portal/, https://catalogue.ceda.ac.uk/, ftp://ftp.ncdc.noaa.gov/pub/data/gruan/processing/level2/RS92-GDP/version-002/, http://weather.uwyo.edu, last access: 4 December 2023) for providing the high-resolution radiosonde dataset.
This study is jointly supported by the Natural Science Foundation of China under grants 42325501, U2142209 and 62101203, the Hubei Provincial Natural Science Foundation of China under grant KZ22Z3021, the Fundamental Research Funds for the Central Universities, China University of Geosciences (Wuhan) under grant 162301192698, the Fundamental Research Funds for the Central Universities, Huazhong Agricultural University under grant 2662021XXQD002, and the Chinese Academy of Meteorological Sciences under grant 2021KJ029.
This paper was edited by Qingxiang Li and reviewed by two anonymous referees.
Anderson, P. S: Measurement of Prandtl number as a function of Richardson number avoiding self-correlation, Bound.-Lay. Meteorol., 131, 345–362, https://doi.org/10.1007/s10546-009-9376-4, 2009.
Baklanov, A. A., Grisogono, B., Bornstein, R., Mahrt, L., Zilitinkevich, S. S., Taylor, P., Larsen, S. E., Rotach, M. W., and Fernando, H. J. S.: The nature, theory, and modeling of atmospheric planetary boundary layers, B. Am. Meteorol. Soc., 92, 123–128, https://doi.org/10.1175/2010BAMS2797.1, 2011.
Basha, G. and Ratnam, M. V.: Identification of atmospheric boundary layer height over a tropical station using high-resolution radiosonde refractivity profiles: Comparison with GPS radio occultation measurements, J. Geophys. Res.-Atmos., 114, D16101, https://doi.org/10.1029/2008JD011692, 2009.
Chan, K. M. and Wood, R.: The seasonal cycle of planetary boundary layer depth determined using COSMIC radio occultation data, J. Geophys. Res.-Atmos., 118, 12422–12434, https://doi.org/10.1002/2013JD020147, 2013.
Cooper, D. I. and Eichinger, W. E.: Structure of the atmosphere in an urban planetary boundary layer from lidar and radiosonde observations, J. Geophys. Res.-Atmos., 99, 22937–22948, https://doi.org/10.1029/94JD01944, 1994.
Cuxart, J. and Boone A. A.: Evapotranspiration over Land from a Boundary-Layer Meteorology Perspective, Bound.-Lay. Meteorol., 177, 427–459, https://doi.org/10.1007/s10546-020-00550-9, 2020.
Davis, E. V., Rajeev, K., and Mishra, M. K.: Effect of clouds on the diurnal evolution of the atmospheric boundary-layer height over a tropical coastal station, Bound.-Lay. Meteorol., 175, 135–152, https://doi.org/10.1007/s10546-019-00497-6, 2020.
Davy, R. and Esau, I.: Differences in the efficacy of climate forcings explained by variations in atmospheric boundary layer depth, Nat. Commun., 7, 11690, https://doi.org/10.1038/ncomms11690, 2016.
de Arruda Moreira, G., Guerrero-Rascado, J. L., Bravo-Aranda, J. A., Benavent-Oltra, J. A., Ortiz-Amezcua, P., Róman, R., Bedoya-Velásquez, A. E., Landulfo, E., and Alados-Arboledas, L.: Study of the planetary boundary layer by microwave radiometer, elastic lidar and Doppler lidar estimations in Southern Iberian Peninsula, Atmos Res., 213, 185–195, https://doi.org/10.1016/j.atmosres.2018.06.007, 2018.
Degrazia, G. A., Anfossi, D., Carvalho, J. C., Mangia, C., Tirabassi, T., and Campos Velho, H. F.: Turbulence parameterisation for PBL dispersion models in all stability conditions, Atmos. Environ., 34, 3575–3583, https://doi.org/10.1016/S1352-2310(00)00116-3, 2000.
Ding, F., Iredell, L., Theobald, M., Wei, J., and Meyer, D.: PBL height from AIRS, GPS RO, and MERRA-2 products in NASA GES DISC and their 10-year seasonal mean intercomparison, Earth Space Sci., 8, e2021EA001859, https://doi.org/10.1029/2021EA001859, 2021.
Dirmeyer, P. A., Wang, Z., Mbuh, M. J., and Norton, H. E.: Intensified land surface control on boundary layer growth in a changing climate, Geophys. Res. Lett., 41, 1290–1294, https://doi.org/10.1002/2013GL058826, 2014.
ECMWF: ERA5 reanalysis, ECMWF [data set], https://cds.climate.copernicus.eu/#!/search?text=ERA5&type=dataset, 2019.
Edson, J. B., Jampana, V., Weller, R. A., Bigorre, S. P., Plueddemann, A. J., Fairall, C. W., Miller, S. D., Mahrt, L., Vickers, D., and Hersbach, H.: On the Exchange of Momentum over the Open Ocean, J. Phys. Oceanogr., 43, 1589–1610, https://doi.org/10.1175/JPO-D-12-0173.1, 2013.
Esau, I. and Zilitinkevich, S.: On the role of the planetary boundary layer depth in the climate system, Adv. Sci. Res., 4, 63–69, https://doi.org/10.5194/asr-4-63-2010, 2010.
Guo, J., Miao, Y., Zhang, Y., Liu, H., Li, Z., Zhang, W., He, J., Lou, M., Yan, Y., Bian, L., and Zhai, P.: The climatology of planetary boundary layer height in China derived from radiosonde and reanalysis data, Atmos. Chem. Phys., 16, 13309–13319, https://doi.org/10.5194/acp-16-13309-2016, 2016.
Guo, J., Li, Y., Cohen, J. B., Li, J., Chen, D., Xu, H., Liu, L., Yin, J., Hu, K., and Zhai, P.: Shift in the temporal trend of boundary layer height in China using long-term (1979–2016) radiosonde data, Geophys. Res. Lett., 46, 6080–6089, https://doi.org/10.1029/2019GL082666, 2019.
Guo, J., Zhang, J., Yang, K., Liao, H., Zhang, S., Huang, K., Lv, Y., Shao, J., Yu, T., Tong, B., Li, J., Su, T., Yim, S. H. L., Stoffelen, A., Zhai, P., and Xu, X.: Investigation of near-global daytime boundary layer height using high-resolution radiosondes: first results and comparison with ERA5, MERRA-2, JRA-55, and NCEP-2 reanalyses, Atmos. Chem. Phys., 21, 17079–17097, https://doi.org/10.5194/acp-21-17079-2021, 2021.
Guo, J., Zhang, J., and Shao., J.: A Harmonized Global Continental High-resolution Planetary Boundary Layer Height Dataset Covering 2017–2021, Zenodo [data set], https://zenodo.org/record/6498004, 2022.
Hennemuth, B. and Lammert, A.: Determination of the atmospheric boundary layer height from radiosonde and lidar backscatter, Bound.-Lay. Meteorol., 120, 181–200, https://doi.org/10.1007/s10546-005-9035-3, 2006.
Hersbach, H., Bell, B., Berrisford, P., Hirahara, S., Horányi, A., Muñoz-Sabater, J., Nicolas, J., Peubey, C., Radu, R., Schepers, D., and Simmons, A.: The ERA5 global reanalysis, Q. J. Roy. Meteor. Soc., 146, 1999–2049, https://doi.org/10.1002/qj.3803, 2020.
Holzworth, G. C.: Estimates of mean maximum mixing depths in the contiguous United States, Mon. Weather Rev., 92, 235–242, https://doi.org/10.1175/1520-0493(1964)092<0235:EOMMMD>2.3.CO;2, 1964.
Hu, X. M., Nielsen-Gammon, J. W., and Zhang, F.: Evaluation of three planetary boundary layer schemes in the WRF model, J. Appl. Meteorol. Clim., 49, 1831–1844, https://doi.org/10.1175/2010JAMC2432.1, 2010.
Lammert, A. and Bösenberg, J.: Determination of the con- vective boundary-layer height with laser remote sensing, Bound.-Lay. Meteor., 119, 159–170, https://doi.org/10.1007/ s10546-005-9020-x, 2006.
Li, Q., Zhang, H., Cai, X., Song, Y., and Zhu, T.: The impacts of the atmospheric boundary layer on regional haze in North China, npj Clim. Atmos. Sci., 4, 1–10, https://doi.org/10.1038/s41612-021-00165-y, 2021.
Li, Z., Guo, J., Ding, A., Liao, H., Liu, J., Sun, Y., Wang, T., Xue, H., Zhang, H. and Zhu, B.: Aerosol and boundary-layer interactions and impact on air quality, Natl. Sci. Rev., 4, 810–833, https://doi.org/10.1093/nsr/nwx117, 2017.
Liu, B., Y. Ma, J. Guo, W. Gong, Y. Zhang, F. Mao, J. Li, X. Guo, and Shi, Y.: Boundary layer heights as derived from ground-based radar wind profiler in Beijing, IEEE T. Geosci. Remote, 57, 8095–8104, https://doi.org/10.1109/TGRS.2019.2918301, 2019.
Lou, M., J. Guo, L. Wang, H. Xu, D. Chen, Y. Miao, Y. Lv, Y. Li, X. Guo, S. Ma, and Li, J.: On the relationship between aerosol and boundary layer height in summer in China under different thermodynamic conditions, Earth Space Sci., 6, 887–901, https://doi.org/10.1029/2019EA000620, 2019.
McGrath-Spangler, E. L. and Denning, A. S.: Estimates of North American summertime planetary boundary layer depths derived from space-borne lidar, J. Geophys. Res., 117, D15101, https://doi.org/10.1029/2012JD017615, 2012.
NASA: Global Land Data Assimilation System, NASA [data set], https://disc.gsfc.nasa.gov/datasets/GLDAS_CLSM025_DA1_D_2.2/summary?keywords=GLDAS, last access: 10 May 2021.
Petäjä, T., Järvi, L., Kerminen, V. M., Ding, A.J., Sun, J.N., Nie, W., Kujansuu, J., Virkkula, A., Yang, X., Fu, C.B., Zilitinkevich, S., and Kulmala, M.: Enhanced air pollution via aerosol-boundary layer feedback in China, Sci. Rep.-UK, 6, 18998, https://doi.org/10.1038/srep18998, 2016.
Rodell, M., Houser, P. R., Jambor, U., Gottschalck, J., Mitchell, K., Meng, C.-J., Arsenault, K., Cosgrove, B., Radakovich, J., Bosilovich, M., Entin, J. K., Walker, J. P., Lohmann, D., and Toll, D.: The global land data assimilation system, B. Am. Meteorol. Soc., 85, 381–394, https://doi.org/10.1175/BAMS-85-3-381, 2004.
Saha, S., Sharma, S., Kumar, K. N., Kumar, P., Lal, S., and Kamat, D.: Investigation of atmospheric boundary layer characteristics using ceilometer lidar, COSMIC GPS RO satellite, radiosonde and ERA-5 reanalysis dataset over Western Indian region, Atmos. Res., 268, 105999, https://doi.org/10.1016/j.atmosres.2021.105999, 2022.
Seibert, P., Beyrich, F., Gryning, S.-E., Joffre, S., Rasmussen, A., and Tercier, P.: Review and intercomparison of operational methods for the determination of the mixing height, Atmos. Environ., 34, 1001–1027, https://doi.org/10.1016/S1352-2310(99)00349-0, 2000.
Seidel, D. J., Ao, C. O., and Li, K.: Estimating climatological planetary boundary layer heights from radiosonde observations: Comparison of methods and uncertainty analysis, J. Geophys. Res.-Atmos., 115, D16113, https://doi.org/10.1029/2009JD013680, 2010.
Seidel, D. J., Zhang, Y., Beljaars, A., Golaz, J. C., Jacobson, A. R., and Medeiros, B.: Climatology of the planetary boundary layer over the continental United States and Europe, J. Geophys. Res.-Atmos., 117, D17106, https://doi.org/10.1029/2012JD018143, 2012.
Stull, R. B.: An Introduction to Boundary Layer Meteorology, Kluwer Academic, 666 pp., https://doi.org/10.1007/978-94-009-3027-8, 1988.
Su, T., Li, Z., and Kahn, R.: Relationships between the planetary boundary layer height and surface pollutants derived from lidar observations over China: regional pattern and influencing factors, Atmos. Chem. Phys., 18, 15921–15935, https://doi.org/10.5194/acp-18-15921-2018, 2018.
Teixeira, J., Piepmeier, J. R., Nehrir, A. R., Ao, C. O., Chen, S. S., Clayson, C. A., Fridlind, A. M., Lebsock, M., Mc-Carty, W., Salmun, H., Santanello, J. A., Turner, D. D., Wang, Z., and Zeng, X.: Toward a global planetary boundary layer observing system: the NASA PBL incubation study team report, NASA PBL Incubation Study Team, 134 pp., https://science.nasa.gov/science-red/s3fs-public/atoms/files/NASAPBLIncubationFinalReport.pdf, last access: 28 April 2022.
Wallace, J. M. and Hobbs, P. V: Atmospheric Science: An Introductory Survery, Academic Press, Burlington, MA, ISBN 9780127329512, 2006.
Wang, X. and Wang, K.: Homogenized variability of radiosonde-derived atmospheric boundary layer height over the global land surface from 1973 to 2014, J. Climate, 29, 6893–6908, https://doi.org/10.1175/JCLI-D-15-0766.1, 2016.
Wang, Y., Khalizov, A., Levy, M., and Zhang, R.: New Directions: Light Absorbing Aerosols and Their Atmospheric Impacts, Atmos. Environ., 81, 713–715, https://doi.org/10.1016/j.atmosenv.2013.09.034, 2013.
Xu, Z., Chen, H., Guo, J., and Zhang, W.: Contrasting effect of soil moisture on the daytime boundary layer under different thermodynamic conditions in summer over China, Geophys Res. Lett., 48, e2020GL090989, https://doi. org/10.1029/2020GL090989, 2021.
Yang, X., Zhao, C., Guo, J., and Wang, Y.: Intensification of aerosol pollution associated with its feedback with surface solar radiation and winds in Beijing, J. Geophys. Res.-Atmos., 121, 4093–4099, https://doi.org/10.1002/2015JD024645, 2016.
Zhang, J., Guo, J. P., Zhang, S. D., and Shao, J.: Inertia-gravity wave energy and instability drive turbulence: evidence from a near-global high-resolution radiosonde dataset, Clim. Dynam., 58, 2927–2939, https://doi.org/10.1007/s00382-021-06075-2, 2022.
Zhang, W., Guo, J., Miao, Y., Liu, H., Song, Y., Fang, Z., He, J., Lou, M., Yan, Y., Li, Y., and Zhai, P.: On the summertime planetary boundary layer with different thermodynamic stability in China: A radiosonde perspective, J. Climate, 31, 1451–1465, https://doi.org/10.1175/JCLI-D-17-0231.1, 2018.
- Abstract
- Introduction
- Data sources and conventional PBLH determination method
- Methodology
- Validation
- Merged continental planetary boundary layer height
- Data availability
- Conclusions and summary
- Author contributions
- Competing interests
- Disclaimer
- Acknowledgements
- Financial support
- Review statement
- References