the Creative Commons Attribution 4.0 License.
the Creative Commons Attribution 4.0 License.
 | 12 Jul 2022
Reconstructing 6-hourly PM2.5 datasets from 1960 to 2020 in China
Junting Zhong
Xiaoye Zhang
Ke Gui
Jie Liao
Ye Fei
Lipeng Jiang
Lifeng Guo
Liangke Liu
Huizheng Che
Yaqiang Wang
Deying Wang
Zijiang Zhou
Fine particulate matter (PM2.5) has altered the radiation balance on Earth and raised environmental and health risks for decades but has only been monitored widely since 2013 in China. Historical long-term PM2.5 records with high temporal resolution are essential but lacking for both research and environmental management. Here, we reconstruct a site-based PM2.5 dataset at 6 h intervals from 1960 to 2020 that combines long-term visibility, conventional meteorological observations, emissions, and elevation. The PM2.5 concentration at each site is estimated based on an advanced machine learning model, LightGBM, that takes advantage of spatial features from 20 surrounding meteorological stations. Our model's performance is comparable to or even better than those of previous studies in by-year cross validation (CV) (R2=0.7) and spatial CV (R2=0.76) and is more advantageous in long-term records and high temporal resolution. This model also reconstructs a 0.25∘ × 0.25∘, 6-hourly, gridded PM2.5 dataset by incorporating spatial features. The results show PM2.5 pollution worsens gradually or maintains before 2010 from an interdecadal scale but mitigates in the following decade. Although the turning points vary in different regions, PM2.5 mass concentrations in key regions decreased significantly after 2013 due to clean air actions. In particular, the annual average value of PM2.5 in 2020 is nearly the lowest since 1960. These two PM2.5 datasets (publicly available at https://doi.org/10.5281/zenodo.6372847, Zhong et al., 2022) provide spatiotemporal variations at high resolution, which lay the foundation for research studies associated with air pollution, climate change, and atmospheric chemical reanalysis.
- Article
(15864 KB) - Full-text XML
-
Supplement
(642 KB) - BibTeX
- EndNote


In the past decades, anthropogenic emissions of reactive gases and aerosols have been emitted increasingly in the atmosphere and, thus, have led to a substantial increase in fine particulate matter (PM2.5). Increased PM2.5 has strongly interacted with solar radiation through absorption and scattering, thereby reducing visibility and influencing the Earth's radiance balance. Inhalable PM2.5 has increased human morbidity and mortality by penetrating the respiratory system (Pope et al., 2002; Beelen et al., 2007; X. Chen et al., 2016). To evaluate the impacts of PM2.5 pollution on the environment, climate, and health, the primary concern is to understand the spatiotemporal variations of PM2.5 concentrations. Namely, extended PM2.5 records with high temporal resolution lay the foundation for research studies associated with air pollution, climate change, and environmental health. Nevertheless, it was not until 2013 that the Ministry of Ecology and Environment (MEE) established a nationwide PM2.5 monitoring network. Long-term and accurate historical PM2.5 datasets are lacking for both research and environmental management.
Chemical transport models (CTMs) are expected to simulate the spatial and temporal variations of PM2.5 with reasonable emission inventories inputted. However, significant uncertainties still exist in historical emission inventories and physicochemical mechanisms, which resulted in inevitable biases in the simulated absolute values of PM2.5. Satellite-based aerosol optical depth (AOD), which measures the aerosol extinction of the solar beam, is an indicator of ground-level aerosols. AOD data products from Moderate Resolution Imaging Spectroradiometer (MODIS) have broad spatial coverage and relatively long observation periods (∼20 years). Therefore, assimilating satellite-retrieved AOD to construct atmospheric chemical reanalysis is a practical approach to reducing PM2.5 biases. In recent years, several international aerosol reanalysis datasets have been developed preliminarily, including the reanalysis data produced by the Copernicus Atmosphere Monitoring Service (CAMS) from the European Centre for Medium-Range Weather Forecasts (ECMWF) (Inness et al., 2019), the Modern-Era Retrospective analysis for Research and Applications, Version 2 (MERRA-2) from the National Aeronautics and Space Administration (NASA) (Gelaro et al., 2017; Randles et al., 2017), aerosol reanalysis from the Navy Aerosol Analysis and Prediction System (NAAPS) (Lynch et al., 2016), and the Japanese Reanalysis for Aerosol (JRAero) from the Japanese Meteorological Agency (Yumimoto et al., 2017). In particular, CAMS produced gridded PM1, PM2.5, and PM10 data at 80 km resolution since 2003 by assimilating satellite retrievals of total AOD, total tropospheric NO2 column, total O3 column, CO column, and vertical profiles (Inness et al., 2019). MERRA-2 reanalysis includes PM2.5 and PM10 at 50 km resolution since 1980 by assimilating ground-based and satellite-retrieval (Gelaro et al., 2017; Randles et al., 2017). NAAPS generates gridded AOD data at ∼100 km resolution from 2003 to 2013 by assimilating satellite-based AOD products (Lynch et al., 2016). JRAero provides PM2.5 and PM10 at ∼100 km resolution from 2011 to 2015 by assimilating satellite AOD data (Yumimoto et al., 2017). These reanalysis data have contributed significantly to research in aerosol-related fields. However, there are still some weaknesses in accuracy, spatial resolution, time span, and types of assimilated data. In China, the highest horizontal resolution of the four reanalysis is only 50 km, and this coarse grid setting may not be sufficient to capture the spatial differences in atmospheric pollutants at regional scales. In terms of the type of aerosol data assimilation, these reanalysis data mainly assimilate satellite-based and ground-based AOD and do not take into account ground PM2.5 observations.
To overcome the reanalysis' weaknesses in low spatial resolution and high biases, numerical researchers focus on constructing relatively long-term PM2.5 datasets based on machine learning techniques that fuse multisource data, including satellite-retrieved AOD, CTM simulations, and even atmospheric chemical reanalysis. For example, Ma et al. (2016) estimated daily PM2.5 records at 0.1∘ resolution between 2004–2013 with MODIS AOD. Liang et al. (2020) rebuilt monthly PM2.5 concentrations at 1 km resolution during 2000–2016 based on the multiangle implementation of atmospheric correction (MAIAC) from MODIS and reanalysis AOD and PM2.5 data from MERRA-2. Geng et al. (2021) reconstructed daily 10 km PM2.5 data between 2000–2020 with MODIS AOD and CTM simulations. Wei et al. (2021a) regenerated monthly 1 km PM2.5 records between 2000–2018 based on MAIAC AOD. Huang et al. (2021) estimated 1 km × 1 km PM2.5 concentrations daily between 2013–2019 based on MAIAC AOD and CTM outputs. However, some inherent limitations in satellite-based AOD are challenging to overcome. Due to the low sampling frequency of satellite-retrieved AOD, AOD-based PM2.5 datasets are limited to a maximum temporal resolution of 1 d. With AOD over land unavailable before 2000, these PM2.5 datasets can only be back-calculated to 2000 at the earliest. Although recent studies focus on estimating hourly PM2.5 during the daytime based on AOD from geostationary satellites like Himawari 8 (Chen et al., 2019; Yan et al., 2020; Wang et al., 2021; Wei et al., 2021b), obtained PM2.5 datasets can only extend for several years and the data are missing at night or with cloud cover.
Compared to satellite data, ground-based meteorological observations have the advantages of long sequence time, high temporal resolution, and good data integrity. In China, the national meteorological observation network of the China Meteorological Administration (CMA) was established in the 1950s and is capable of continuously observing 6-hourly meteorological data on visibility and conventional meteorological variables, including temperature, pressure, wind, and relative humidity (RH). The number of national stations exceeded 2000 in 1960 and stabilized at around 2450 afterward. Studies have shown that visibility and conventional meteorological variables are closely related to PM2.5 (R. Zhang et al., 2013; X. Zhang et al., 2013; H. L. Zhang et al., 2015; Wang et al., 2018; Zhu et al., 2018; Zhong et al., 2018). For example, low wind speed is highly unfavorable to the horizontal diffusion of pollutants (X. Zhang et al., 2013). The increase in RH favors the hygroscopic growth of PM2.5 and also promotes the accelerated conversion of gaseous precursors to particulate matter, leading to a rapid increase in PM2.5 concentrations (Pilinis et al., 1989; Ervens et al., 2011; Kuang et al., 2016). Atmospheric visibility is directly related to PM2.5 mass concentrations under dry conditions and non-linearly related to PM2.5 and RH under humid conditions (Wang et al., 2019). Therefore, better results may be achieved if these ground-based meteorological data can be used to estimate historical PM2.5 data in China. Liu et al. (2017) first estimated monthly visibility-based PM2.5 concentrations between 1957–1964 and 1973–2014 based on 674 publicly available meteorological stations. Gui et al. (2020) constructed a virtual daily PM2.5 network at 1180 meteorological sites between 2017–2018. Our previous research also shows that the visibility-based machine learning model that takes advantage of spatial features has great potential in reconstructing historical PM2.5 datasets with long-term records and high temporal resolution (Zhong et al., 2021). In this study, we reconstruct a site-based PM2.5 dataset at 6 h intervals from 1960 to 2020 based on long-term visibility and conventional meteorological observations from ∼2450 national stations, together with emissions and elevation. The PM2.5 concentration at each site is estimated based on a Light Gradient Boosting Machine (LightGBM) model that takes advantage of spatial features from 20 surrounding meteorological stations. By incorporating spatial features, this model also reconstructs a 0.25∘ × 0.25∘, 6-hourly, gridded PM2.5 dataset. These two PM2.5 datasets provide spatiotemporal variations at a high resolution, which constitutes the basis for research studies associated with air pollution, climate change, and atmospheric chemical reanalysis.
2.1 Multisource input data
Observational PM2.5 data. The MEE began laying out a PM2.5 monitoring network in January 2013, expanding the scope from key regions, including the North China Plain (NCP), the Yangtze River Delta (YRD), the Pearl River Delta (PRD), the Sichuan Basin (SB), municipalities directly under the Central Government and provincial capitals to 113 key and model cities for environmental protection and, eventually, to all cities above prefecture level. This expanded the number of observation sites from the initial 520 to over 1600. Since then, PM2.5 mass concentrations have been recorded continuously using the β-absorption methods or a micro-oscillating balance following a standard protocol (Huang et al., 2021). Hourly PM2.5 data of all sites between 2013–2020 are collected from the China National Environmental Monitoring Center (CNEMC, http://www.cnemc.cn, last access: 10 July 2022). To produce high-quality PM2.5 data, a series of quality controls were conducted, including integrity checking, duplicate rejection, and outlier handling. All sites with a proportion of valid PM2.5 records exceeding 60 % were considered. For each site, identical data for three consecutive hours were excluded first, and PM2.5 values over three standard deviations from 24 h and 3 d moving average were regarded as outliers and discarded then. Eventually, PM2.5 data from 1485 sites remained for model development and application. In addition, pre-2013 PM2.5 measurements in US embassies in Beijing and Shanghai are used for independent validation evaluations (http://www.stateair.net/web/historical, last access: 10 July 2022).
Visibility and conventional meteorological data. The CMA established a national meteorological observation network in the 1950s with the station numbers exceeding 2000 at the beginning and stabilizing at ∼2450 afterward. The observation network can continuously record meteorological data on visibility and conventional meteorological variables, including temperature, pressure, wind, and RH. In recent years, meteorological observations, including 6-hourly records between 1960–2020 and gradually increasing hourly records after 2013, have been collected from the National Meteorological Information Center (NMIC). Due to the inconsistency of visibility data in terms of observation methods, we conducted a series of data conversions to ensure continuous and consistent data. Visibility data recorded on a scale ranging from 0 to 9 between 1960–1979 were converted to numerical data based on probability density distributions. Specifically, the probability density distribution of the visibility for each of the 10 years before and after 1980 was calculated at first. The numerical visibility from 1980 to 1989 was graded into classes, with the median value of each class being the corresponding value for each station, and finally, the class observations were converted into numerical observations. From September 2013 to 2016, visibility measurements gradually shifted from 6-hourly manual observations to 1-hourly automatic observations site-by-site. In keeping with manual measurements, the automatic records, which are slighter lower than manual measurements, were calibrated by dividing 0.75 following the guideline from the CMA (CMA, 2014).
Emission inventories and elevation. Historical anthropogenic emissions from 1960–2012 are taken from Peking global emission inventories, developed using a bottom-up approach with spatial resolution at 0.1∘ × 0.1∘ and temporal resolution at 1-month intervals (http://inventory.pku.edu.cn, last access: 10 July 2022) (H. Chen et al., 2016; Huang et al., 2014, 2015; Wang et al., 2014). Current anthropogenic emissions during 2013–2020 are from the Multi-resolution Emission Inventory in China (MEIC, http://meicmodel.org, last access: 10 July 2022) (Zhang et al., 2009; Zheng et al., 2018, 2021). Six emission variables from these two inventories are used as inputs for model development, including PM2.5, NOx, SO2, NH3, BC, OC, and CO. Thirty meter elevation data are collected from the global digital elevation model (GDEM) version 2 (https://earthexplorer.usgs.gov, last access: 10 July 2022). Both emission and elevation data are interpolated from grids to sites to match existing PM2.5 sites.
Auxiliary data. Monthly normalized difference vegetation index (NDVI) products are downloaded from the Level-1 and Atmosphere Archive & Distribution System Distributed Active Archive Center (LADDS DAAC, https://ladsweb.modaps.eosdis.nasa.gov, last access: 10 July 2022). Land cover classification data are taken from the National Geographic Information Resources Catalogue Service System (https://www.webmap.cn/mapDataAction.do?method=globalLandCover, last access: 10 July 2022). Population data are taken from the Gridded Population of the World version 4 (GPWv4, https://sedac.ciesin.columbia.edu/data/collection/gpw-v4, last access: 10 July 2022) and are calibrated based on the total population in China City Yearbooks. NDVI, land cover, and population data are also interpolated according to PM2.5 sites and trained as inputs for model development. However, during the model training process, we found that these data had little or no improvement in the hindcast capability of the model, and the time span of these data is insufficient for long-term historical retrieval. Hence, these auxiliary data are not used in model building.
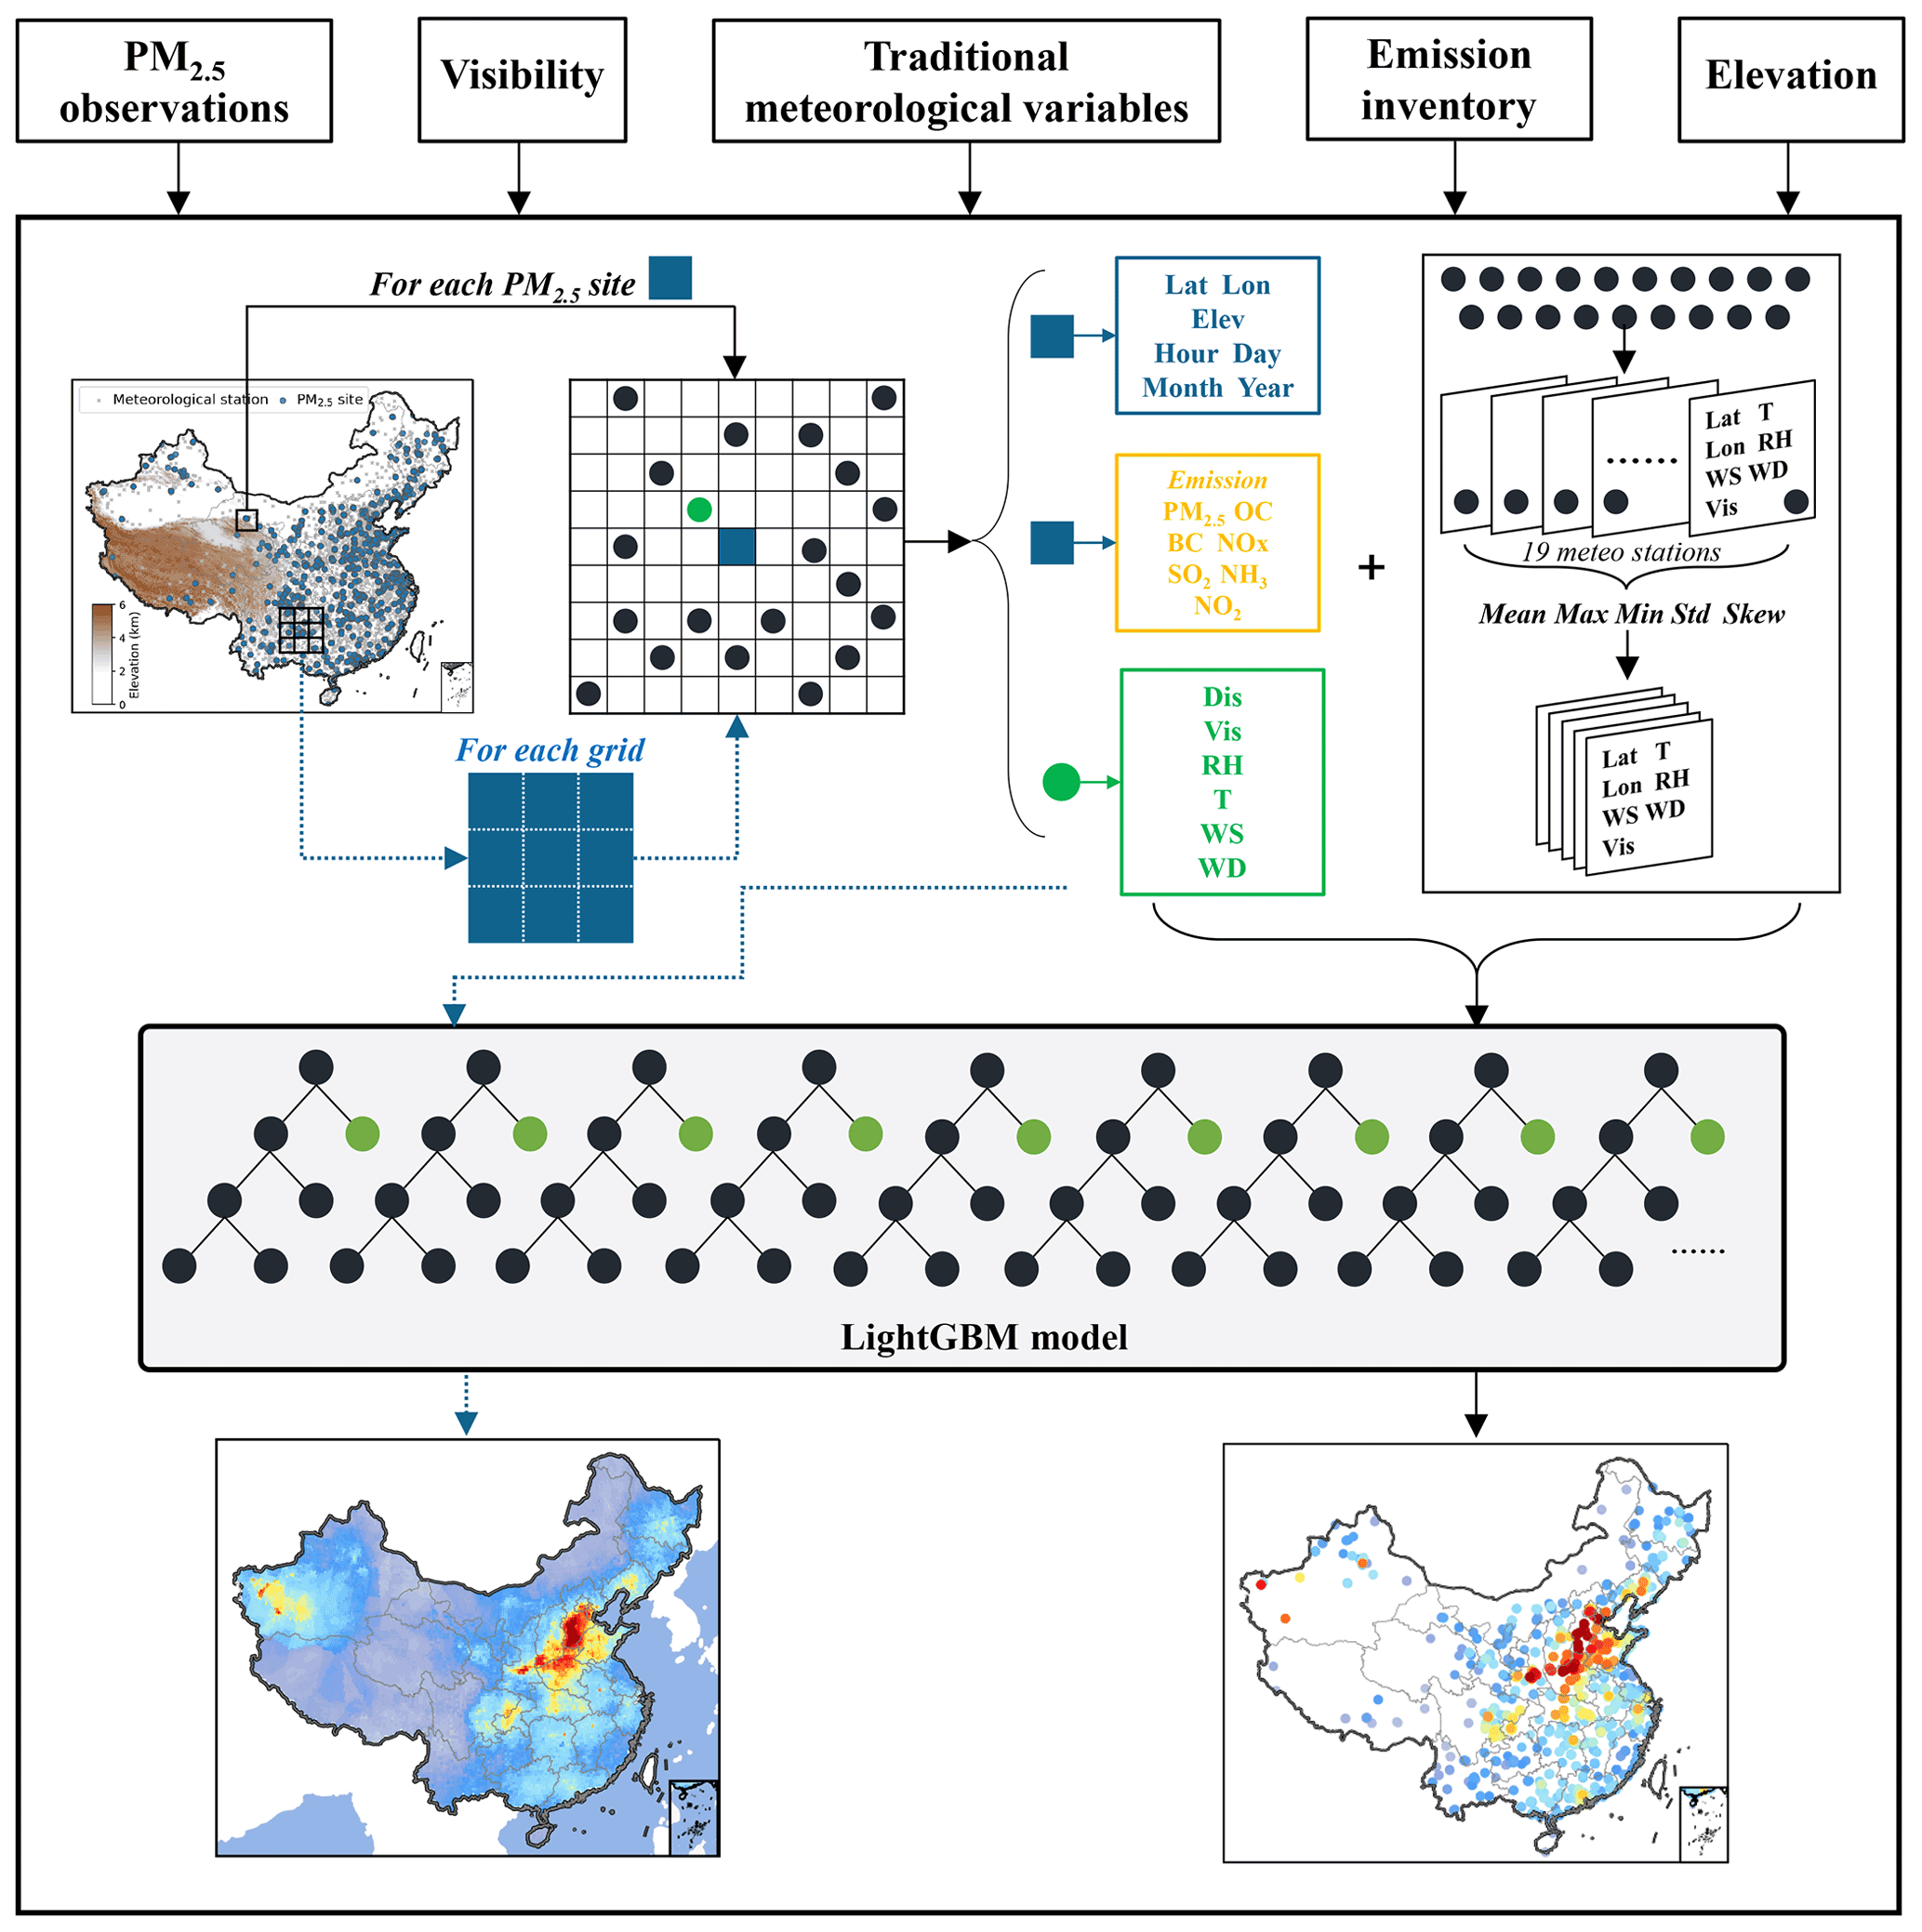
Figure 1A conceptual scheme for constructing long-term historical site-based and gridded PM2.5 records based on long-term visibility, conventional meteorological observations, emissions, and elevation.
2.2 Spatiotemporal feature extraction
For each PM2.5 site, we extract five variables as temporal inputs, including the year, month, day, hour, and day of year. The longitude and latitude variables are taken out as location inputs (Fig. 1b). Visibility, RH, and temperature from the nearest meteorological station of each PM2.5 are used as basic meteorological inputs. The distance between these two sites was also added as a feature. In addition to the influence of the nearest meteorological station, PM2.5 concentrations at a site are also affected by surrounding conditions. For example, transport of pollution due to air movement is the main cause of heavy pollution episodes in the early stage (Zhong et al., 2017, 2018). Hence, we need to consider spatial effects from surrounding meteorological stations. Our previous study developed a novel feature engineering approach, which incorporated surrounding impacts by extracting spatial features (Zhong et al., 2021). Specifically, the remaining 19 nearest stations were matched for each PM2.5 site, except the nearest meteorological station. Five variables, including longitude, latitude, temperature, visibility, and RH, were selected from the 19 stations. Then, we calculated the maximum, the minimum, the average value, the skewness value, and the standard deviation for each of the five variables. These produced features, which take advantage of surrounding conditions, are also considered as inputs. After spatiotemporal feature extraction, a total of 71 features were used as inputs for model training. To reduce computation and training time with guaranteed accuracy, the top 40 features in order of importance during small-sample testing processes are used for the following model training and hindcasting. These features included visibility, temporal features, spatial features, emission features, and elevation.
2.3 Gridded input construction
In the previous construction of input features for PM2.5 sites, we used location information, time information, meteorological information from 20 surrounding meteorological stations, emission information, and elevation. If we assume that each cell in the grid cells is a virtual PM2.5 site, then it is possible to generate input features for each grid point. After the model is trained based on input features and PM2.5 concentrations at real PM2.5 sites, we can feed the gridded input data into the model in turn and, consequently, construct a gridded PM2.5 network. Therefore, we define a grid area at 0.25 ∘ × 0.25∘ with longitude from 70 to 150∘ E and latitude from 10 to 60∘ N and select the grid points covering mainland China. For each grid point, we performed spatiotemporal feature extraction and generated the same 71 input features as those of real PM2.5 sites.
2.4 Model description
LightGBM is one of the state-of-the-art gradient boosting frameworks with better accuracy, lower memory usage, faster training speed, and the capability of handling large-scale data (Ke et al., 2017). Our previous research used this machine learning model to predict PM2.5 mass concentrations, which shows an unprecedented predictive capacity on hourly, daily, monthly, and annual timescales (Zhong et al., 2021). This study will continue to use this algorithm and previously tuned hyperparameters for model development (Zhong et al., 2021). For hindcasting historical PM2.5 datasets prior to 2013, a LightGBM model is trained and validated based on PM2.5 observations and feature inputs from 2013 to 2020. The hindcast capability is validated using cross-validation methods, which are standard methods for parameter tuning and model validation in machine learning. The training dataset is divided into several parts, one of them is used as test data and the remaining parts are used as training data in turn. Each result yields a corresponding evaluation value, which is then averaged to provide an estimate of the model's accuracy. This estimation is quantified by two metrics: the coefficient of determination (R2) and root mean square error (RMSE). The hindcast capability is also validated using PM2.5 observations from the US embassies in Beijing and Shanghai, which have been observing PM2.5 data since as early as 2008. After model training and validation, historical 6-hourly input data are inputted into this model to reconstruct a site-based PM2.5 dataset at 6 h intervals from 1960 to 2020, and gridded input data are inputted into the model to reconstruct a 0.25∘ × 0.25∘, 6-hourly, gridded PM2.5 dataset. The daily, monthly, yearly, and decadal average PM2.5 concentrations for each site and each grid are also calculated based on the two datasets. Monthly average values were obtained with daily values no less than 20 d; otherwise, they will be missing. Year-average values were calculated with 12 valid month values and decadal-average values were calculated with 10 valid year-average values. The flowchart for reconstructing PM2.5 datasets is shown in Fig. 1.
3.1 Evaluation of model hindcast performance
The hindcast performance of our model is evaluated using two CV methods, including 10-fold CV and by-year CV. The 10-fold CV partitions the original training datasets into 10 subsamples, one of which is retained as the validation data in turn for testing the model and the remaining 9 subsamples are used as training data. This method is the most common CV that can be compared with results in other studies. However, 10-fold CV often overestimates the model's ability to hindcast continuous historical data. Therefore, we also use by-year CV, during which one year of data is selected sequentially for testing and the remaining data are used for model training. This method is specifically designed to evaluate the hindcast capability of the model.
Table 1Model performance in primary predictors, temporal resolution, and hindcast capability compared with other national PM2.5 datasets in China.
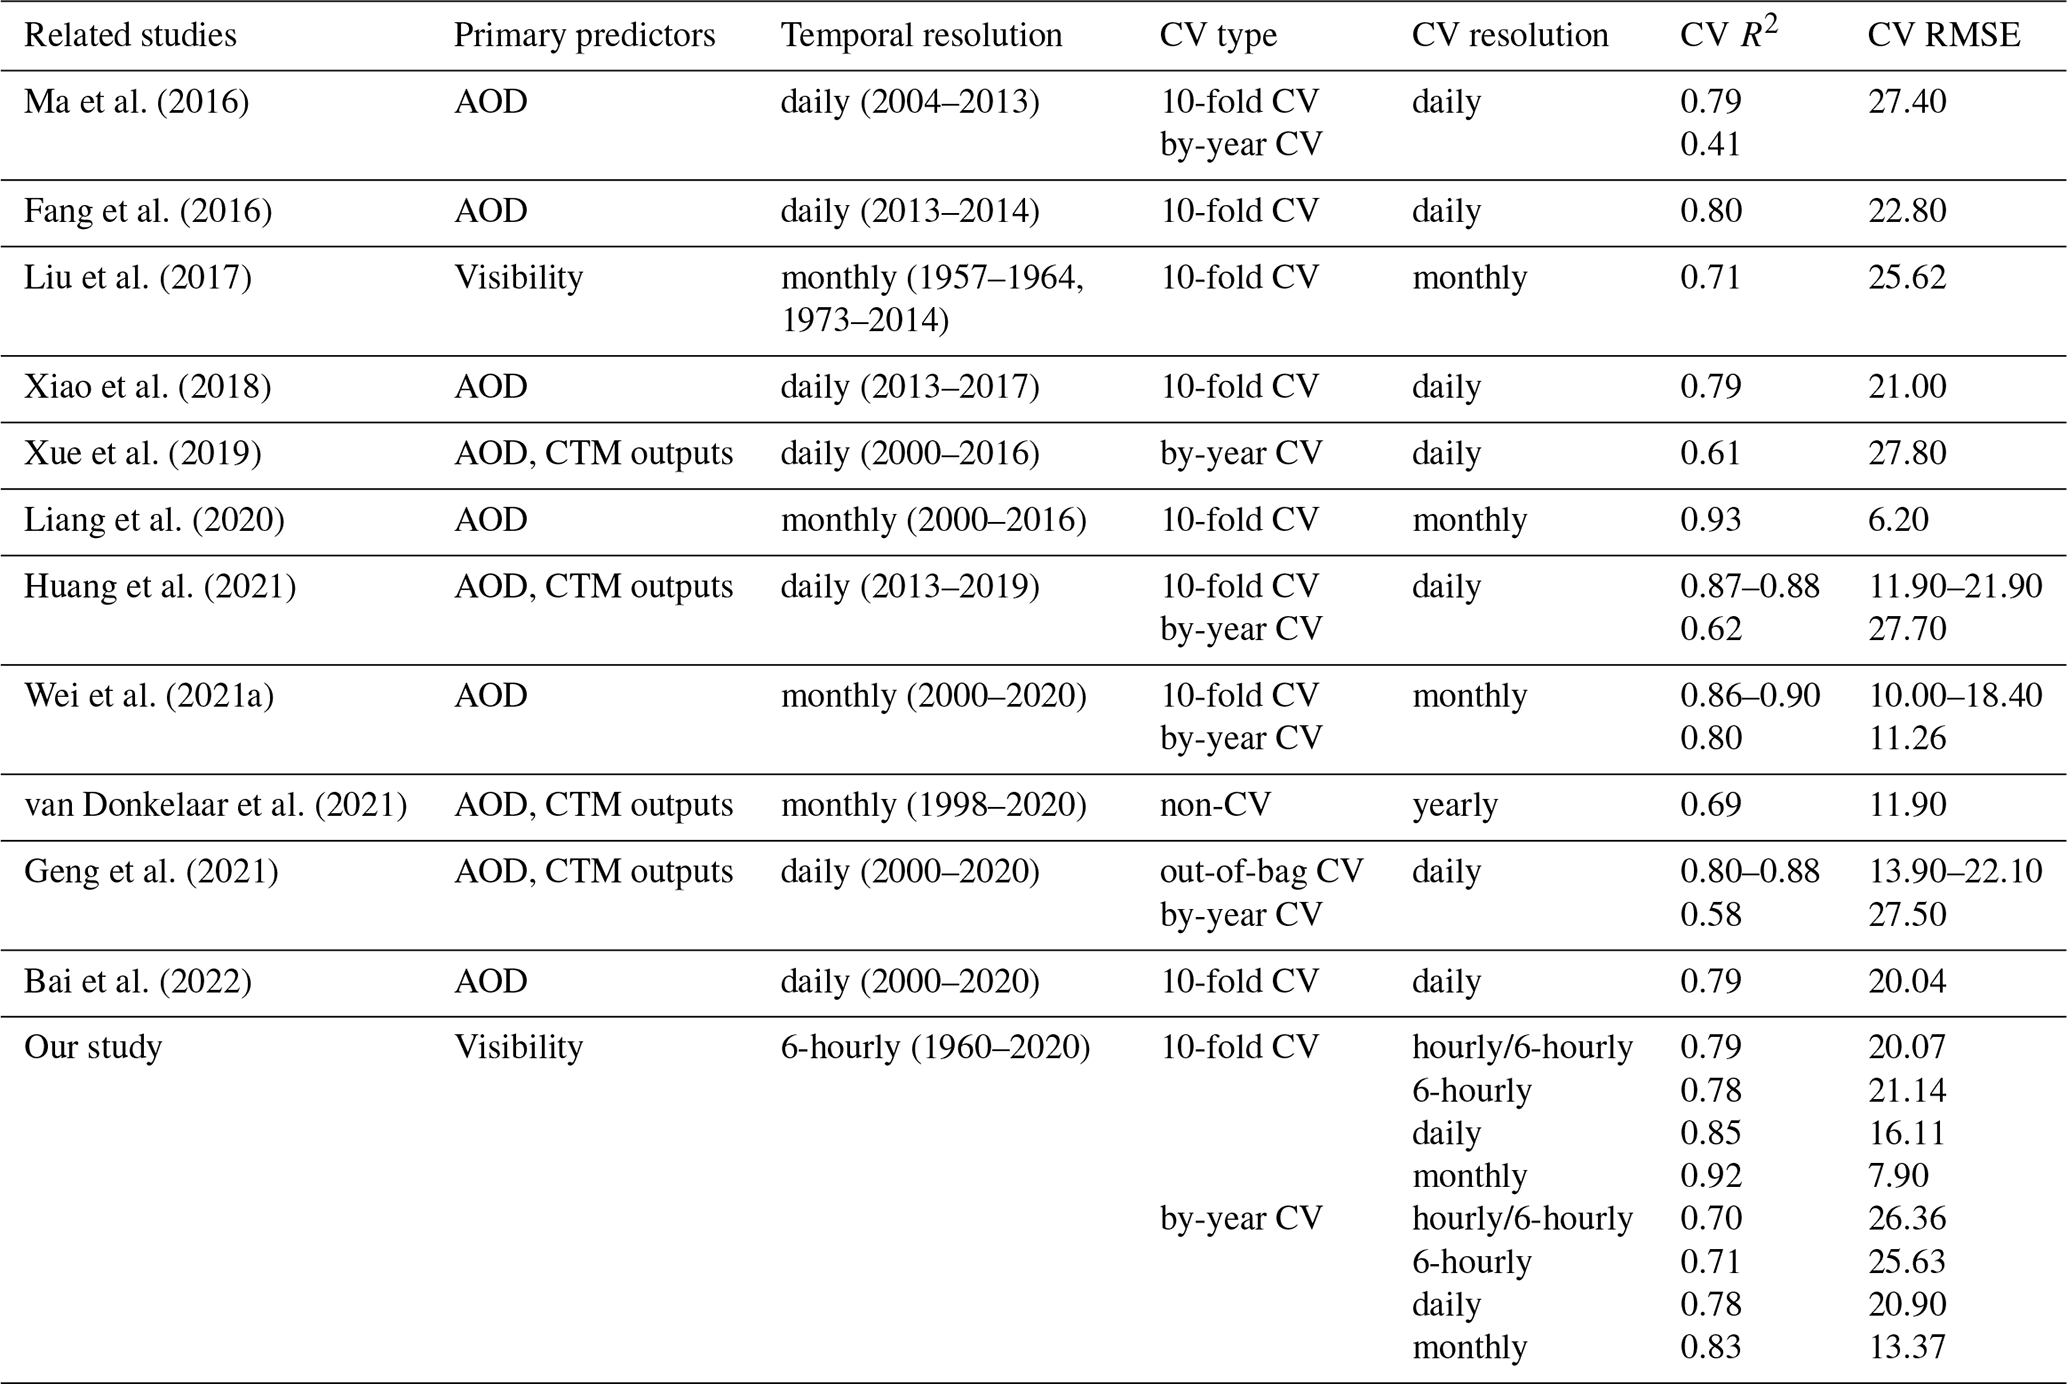
Table 1 compares our dataset and the available datasets in primary predictors, temporal resolution, and CV results (Ma et al., 2016; Fang et al., 2016; Liu et al., 2017; Xiao et al., 2018; Xue et al., 2019; Liang et al., 2020; Huang et al., 2021; Wei et al., 2021a; Van Donkelaar et al., 2021; Geng et al., 2021; Bai et al., 2022). AOD-based datasets are only available from around 2000 at the earliest, with temporal resolutions ranging from daily scale to monthly scale. In contrast, our visibility-based dataset spans 61 years from 1960 to 2020 at 6-hourly intervals, showing a clear advantage in terms of time span and resolution. The R2 and RMSE values of our 10-fold CV results are 0.78 and 21.14 µg m−3 for 6-hourly estimations, respectively, which indicates our model is quite robust in estimating PM2.5. Due to a reduction in data amount, the R2 and RMSE values further improved to 0.85 and 16.11 µg m−3 for daily estimations and 0.92 and 7.90 µg m−3 for monthly estimations. This result is comparable to or even better than those of other available datasets whose 10-fold CV R2 ranges from 0.61 to 0.80 on a daily scale and from 0.71 to 0.93 on a monthly scale. Our by-year CVs R2 and RMSE values are 0.71 and 25.63 µg m−3 for 6-hourly estimations, which indicates our model is still robust in hindcast performance. The by-year CV R2 values for daily and monthly estimations (0.78 and 0.83) are higher than those in other available datasets (0.41–0.62 and 0.80), which might be partly attributed to spatial feature extraction and the large volume of our training dataset. Zhong et al. (2021) has shown that extracting spatial features can result in a better hindcast performance by fully representing dimensional heterogeneity. Compared to hundreds of thousands to millions of training samples in AOD-based models, the training samples for the visibility-based model are over 100 million. An increase in the order of magnitude for training datasets will yield better results in machine learning.
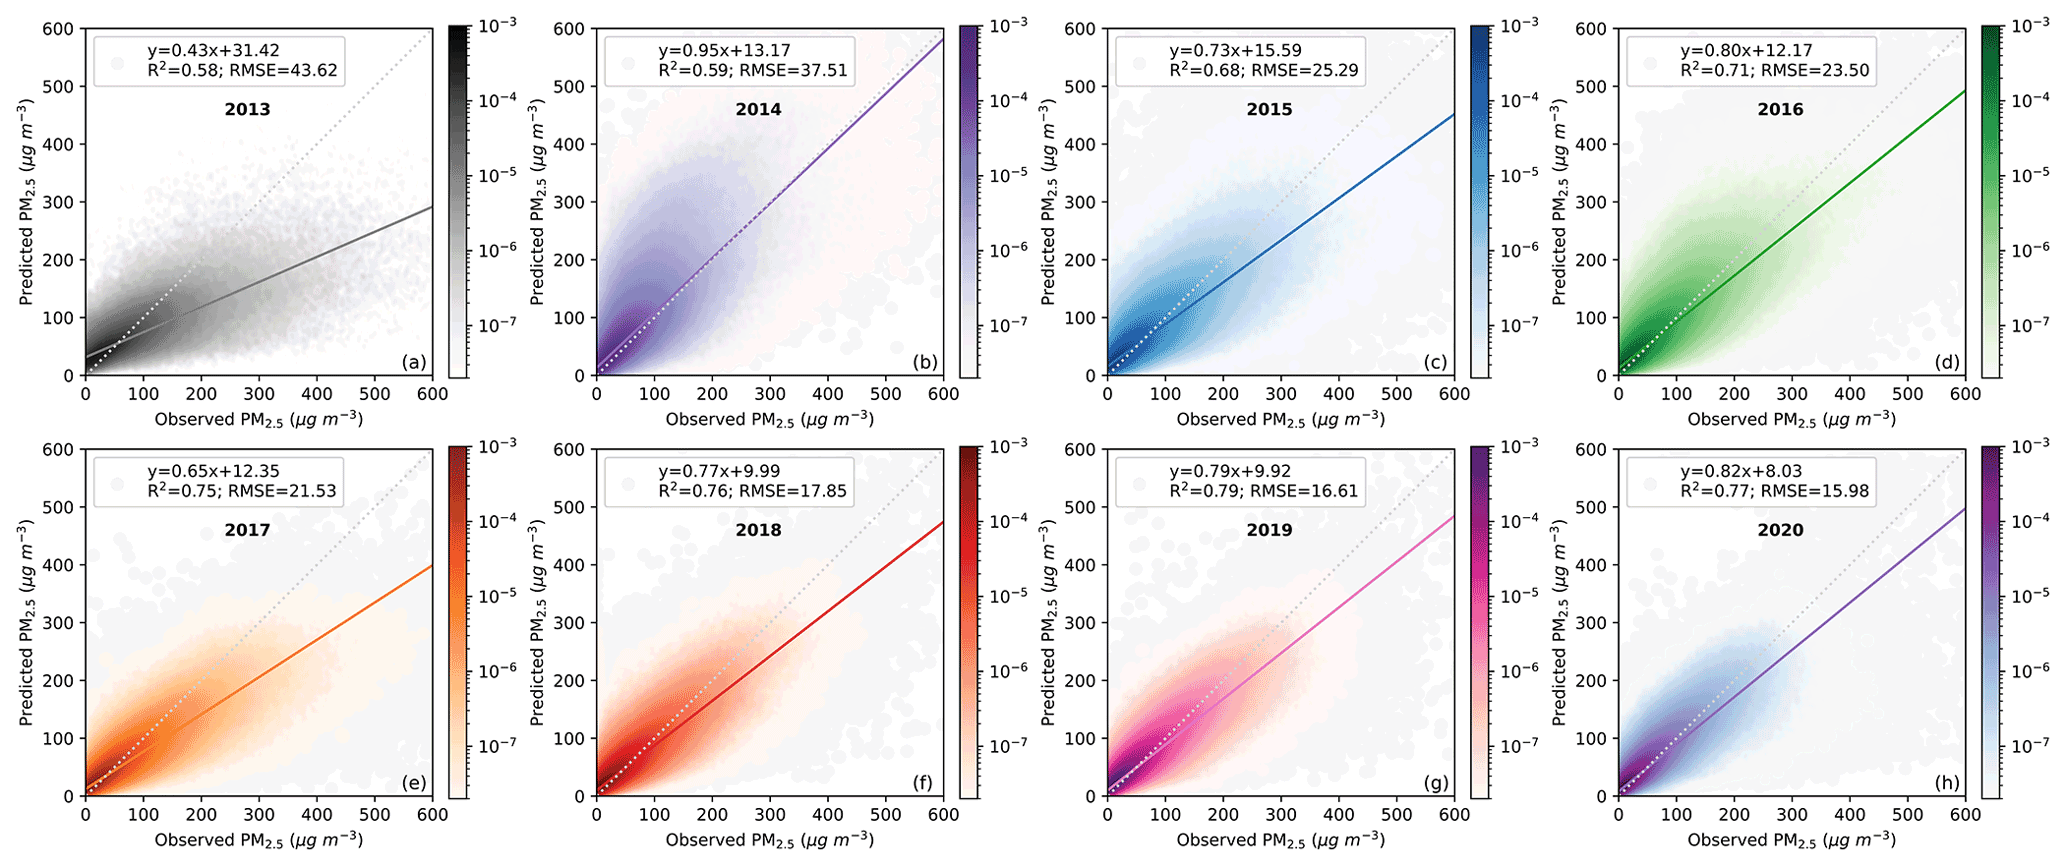
Figure 2Density scatterplots of observed PM2.5 and estimated PM2.5 across China for by-year CV from 2013 to 2020. The time resolution for CV results is hourly and 6-hourly between 2013-2017 and hourly between 2017–2020. Colors are probability distribution densities.
The refined by-year CV results for each year between 2013–2020 are shown in Fig. 2. The by-year CV R2 lies between 0.58 and 0.79 with better hindcast performance after 2014. The potential reasons why the R2 value in 2013 is slightly lower than those in other years are as follows. First, the PM2.5 observation network was just established in 2013, during which dehumidification systems, processing procedures, and data quality control methods were incomplete and, therefore, the overall data quality cannot be guaranteed. With the improvement of the observation network after 2014, both the quality and quantity of observations increase significantly. This situation where data quality is relatively low initially but increases over time is also found in O3 observations. Second, the CMA began to convert some of the manual visibility observations to automatic observations in 2013, during which there were also some irregular procedures in instrument equipment, observation steps, and data quality control. Lastly, although we have corrected the biases between manual and automated observations, some biases may still exist. However, the biases are further reduced as we integrate all manual visibility observations in 2013 into our training dataset.
The model's hindcast capability is further evaluated independently using pre-2013 PM2.5 observations. For the PM2.5 data currently available, only the US embassies in Beijing and Shanghai have at least one year's PM2.5 observations. Therefore, PM2.5 data from these two sites are applied as an independent evaluation dataset. Figure 3 shows our estimated PM2.5 are in close agreement with in situ measurements in Beijing and Shanghai, where the overall R2 between observations and estimations is 0.74 and 0.79, respectively. For each year between 2008–2012 in Beijing, the R2 values fluctuated between 0.70 and 0.81, reflecting a stable and accurate by-year hindcast capability. As shown in Fig. 3c–h, the low values, high values, and temporal variations in PM2.5 measurements are all well estimated. In particular, PM2.5 measurements are lacking at the US Embassy in Beijing in early 2008 and around 2009, but our model can provide reasonable and continuous estimations to fill in the gaps. This ability can also be used to fill in missing PM2.5 observations of MEE from 2013 onwards, building a complete PM2.5 dataset. Overall, the independent validation results show that historical PM2.5 data can be well reconstructed by our model.
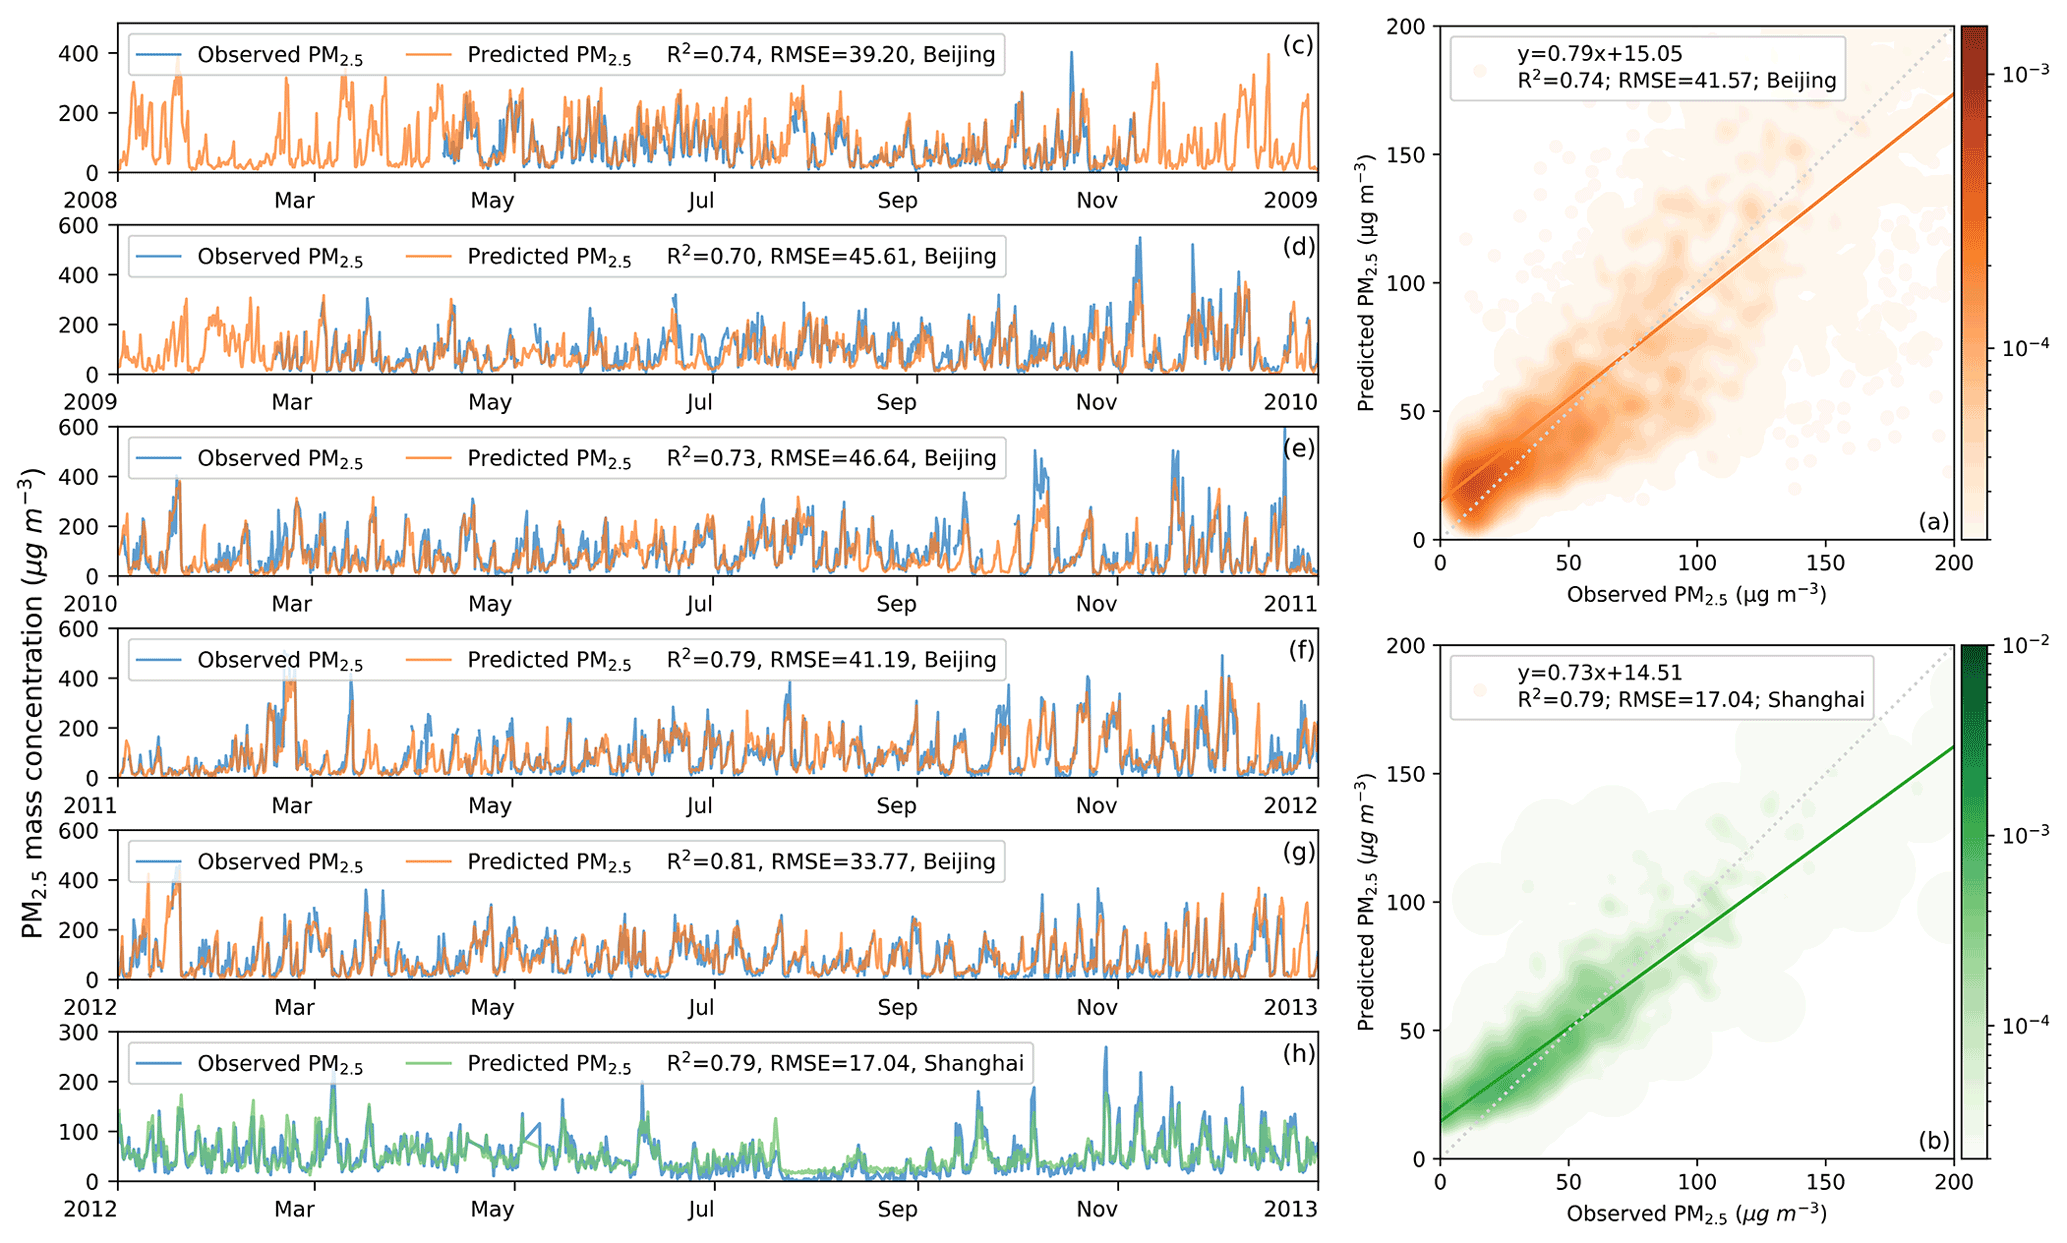
Figure 3(a) Density scatterplots of observed PM2.5 and estimated PM2.5 between 2008–2012 at the US Embassy in Beijing; (b) density scatterplots of observed PM2.5 and estimated PM2.5 in 2012 at the US Embassy in Shanghai; (c–g) time series of observed PM2.5 and estimated PM2.5 for each year between 2008–2012 at the US Embassy in Beijing; and (h) time series of observed PM2.5 and estimated PM2.5 for each year in 2012 at the US Embassy in Shanghai.
The model's ability to make PM2.5 predictions at locations outside the scope of the training stations is evaluated by spatial CV. For spatial CV, all the monitoring stations are randomly divided into five subsets, and the model is trained using data from four subsets and tested on the data from the remaining subset each time. As shown in Fig. 4, the R2 for spatial cross-validation in different groups is between 0.75 and 0.79, reflecting robust predictive power for PM2.5 concentrations at sites outside the training sites. Our previous study also examined this predictive ability using PM2.5 data from 23 untouched regional PM2.5 stations (Zhong et al., 2021).
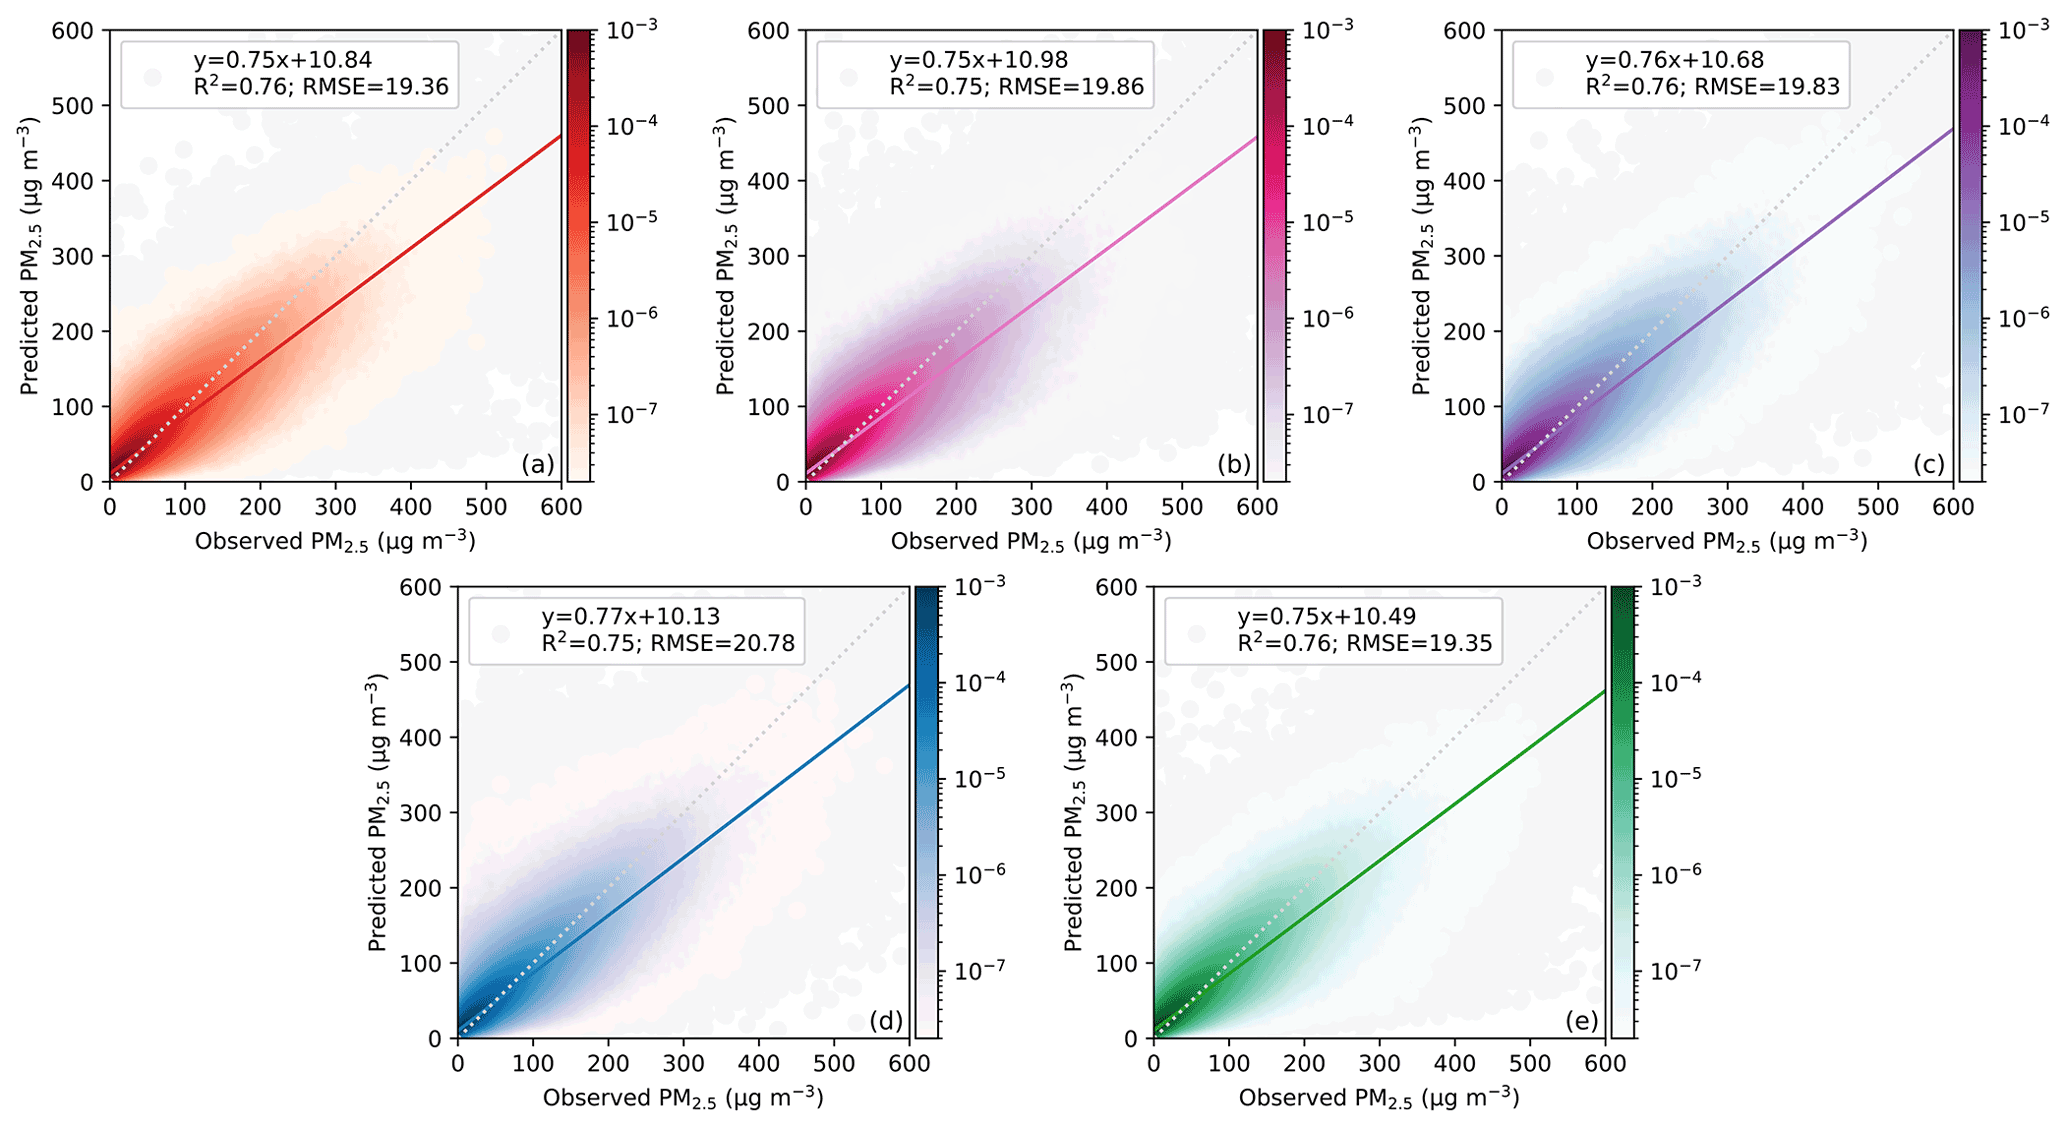
Figure 4Density scatterplots of observed PM2.5 and estimated PM2.5 for each group of spatial CV results.
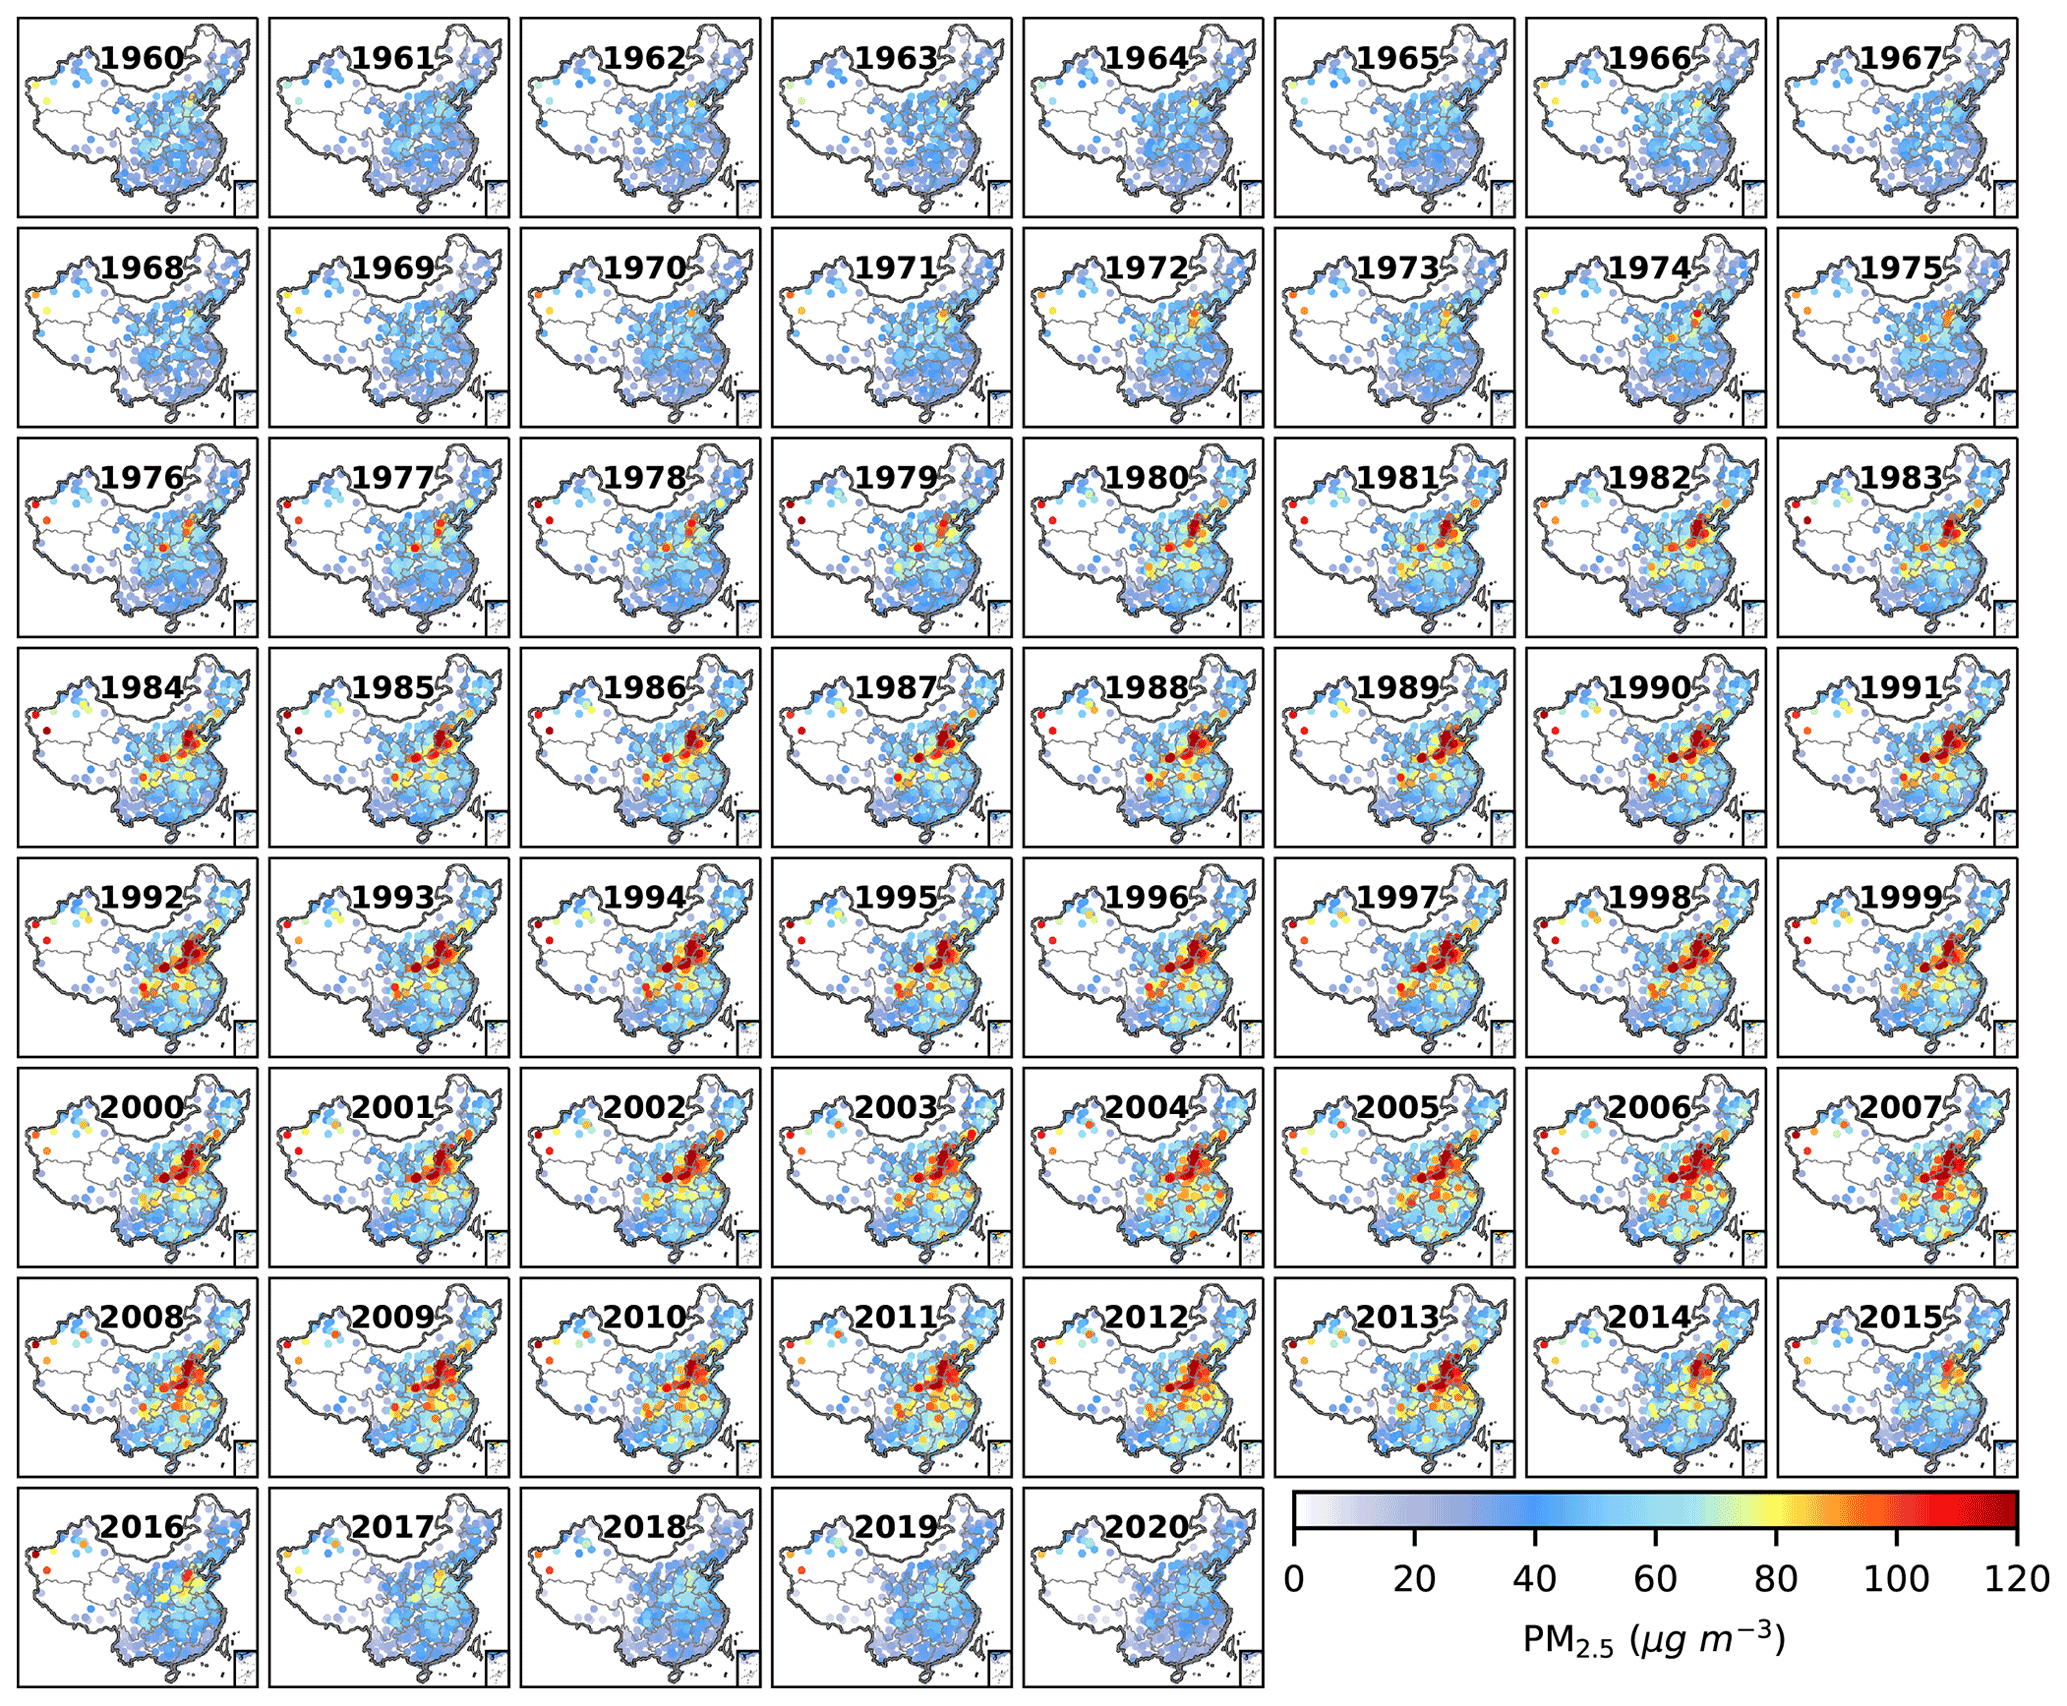
Figure 5Spatial distribution of annual average PM2.5 mass concentration at 1485 stations from 1960 to 2020.
3.2 Spatiotemporal variations in the site-based PM2.5 dataset during 1960–2020
Figure 5 shows the spatiotemporal variations in annual average site-based PM2.5 between 1960–2020. The trend of PM2.5 in China experiences three major stages, corresponding to a slow increase under low concentrations between 1960–1978, a continuous accumulation with high concentrations reached between 1979–2013, and a rapid decrease between 2014–2020. During the first stage, though PM2.5 pollution occurred in parts of the NCP and the Guanzhong Plain (GZP), PM2.5 concentrations remain low in the vast majority of areas. This is mainly because anthropogenic emissions of PM2.5 precursors and primary PM2.5 grow slowly at a low base, resulting in relatively low total emissions in different regions. However, PM2.5 pollution still occurring in the NCP and GZP, even with relatively low emissions, indicates the low environmental capacity of these two regions. During the second stage, PM2.5 reached an unprecedentedly high concentration after a continuous increase in nearly all regions in China. The heaviest PM2.5 pollution occurred in the NCP and the GZP. The SB and the Northeast China Plain (NeCP) are the polluted regions with the next highest PM2.5 pollution. Even the YRD and the PRD also experienced PM2.5 pollution during this stage. This worsening of PM2.5 pollution is closely associated with massive anthropogenic emissions from rapidly increasing living and industrial activities after reform and opening-up policies. From 1979 to 2013, primary PM2.5, NOx, SO2, NH3, BC, OC, and CO from the Peking emission inventory increased by 98 %, 457 %, 159 %, 117 %, 45 %, −22 %, and 243 %, respectively. Despite a slow reduction in SO2 after 2006, the total anthropogenic emissions each year still increased and thereby caused high-level PM2.5 pollution after 2006. The results indicate that air pollutants cannot be emitted without restraint even in regions with high atmospheric capacity. Otherwise, PM2.5 pollution will inevitably occur. In addition to anthropogenic emissions, sand and dust storms, resulting in high PM2.5 concentrations in western Xinjiang, worsened PM2.5 pollution by trans-regional transport from the desert regions. During the last stage, PM2.5 decreased nationwide with the mass concentrations in nearly all stations approximately or below 35 µg m−3 in 2020, even in the NCP and the GZP with limited environmental capacity. The substantial declines in PM2.5 illustrate the effectiveness of implementing the toughest ever clean air policy in China. The spatiotemporal variations of PM2.5 between 1960–2020 clearly show the long-term impact of economic development and energy consumption on our air quality and the effectiveness of recent years' unprecedented emission control policies.
The specific turning points in annual PM2.5 concentrations for different regions were investigated additionally. Figure 6 shows the temporal variations in national average monthly and yearly PM2.5 mass concentrations and regional average 6-hourly, monthly, and yearly PM2.5 mass concentrations in “2+26” cities of the NCP, the YRD, the PRD, and the SB. The national average yearly PM2.5 reached a peak of 67 µg m−3 in 2007, declined in 2008, and then remained steady until 2013. A sharp fall followed after 2014, with PM2.5 concentrations decreasing from 63 µg m−3 in 2013 to 34 µg m−3 in 2020. The annual PM2.5 concentrations in the “2+26” cities also experienced similar changes with a peak in 2007 and a reduction in 2008, which might be related to emission reductions for the Beijing Olympics in 2008. For the YRD, the maximum value of PM2.5 mass concentration occurred in 2013 without a striking peak in 2007. For the PRD, the annual PM2.5 concentrations increased steadily between 1960–1978, then rose more and more steeply in the following years, with a steep increase in 2003 and 2004 and peaked in 2004. A steady decrease with slight fluctuation occurred from 2005 to 2013, and then a sharp fall followed after 2014. This trend is different from that in the “2+26” cities and the YRD. For the SB, the turning point occurred in 2013, before which the annual PM2.5 concentrations increased steadily and remained steady.

Figure 6(a) The spatial distribution of average PM2.5 mass concentrations between 1960–2020 and the (b–f) time series of average PM2.5 mass concentrations for all sites in China (b), “2+26” cities (c), Yangtze River Delta (d), Pearl River Delta (e) and Sichuan Basin (f), respectively.
3.3 Detailed spatial distributions from gridded PM2.5 datasets
Figure 7 shows the annual spatial variations in 0.25∘ × 0.25∘ gridded PM2.5 between 1960–2020. Compared to site-based distributions, gridded PM2.5 can portray the spatiotemporal variations in a clearer and more detailed way. For example, the most widespread and heaviest PM2.5 pollution in western Xinjiang occurred in 1979. This abnormal pollution corresponds to the historical construction of northern severe dust storms, which recorded the event with the largest affected areas in April 1979 (Zhou and Zhang, 2003). As exposed to nearly the most frequent air stagnation in winter due to terrain and meteorological conditions (Wang et al., 2018), the NCP is the region with PM2.5 pollution first to appear and last to disappear, except for areas affected by dust storms (Fig. 7). For year-to-year comparisons, it can be clearly seen that PM2.5 concentrations in the NCP decreased slightly from 2007 to 2008 and from 2012 to 2013, respectively, and decreased significantly in 2014 relative to 2013. The PM2.5 reduction is insignificant from 2015 to 2016, but striking from 2016 to 2017. In 2020, the nationwide PM2.5 concentrations are comparable to those in the 1960s and close to the lowest level ever recorded in almost 61 years.
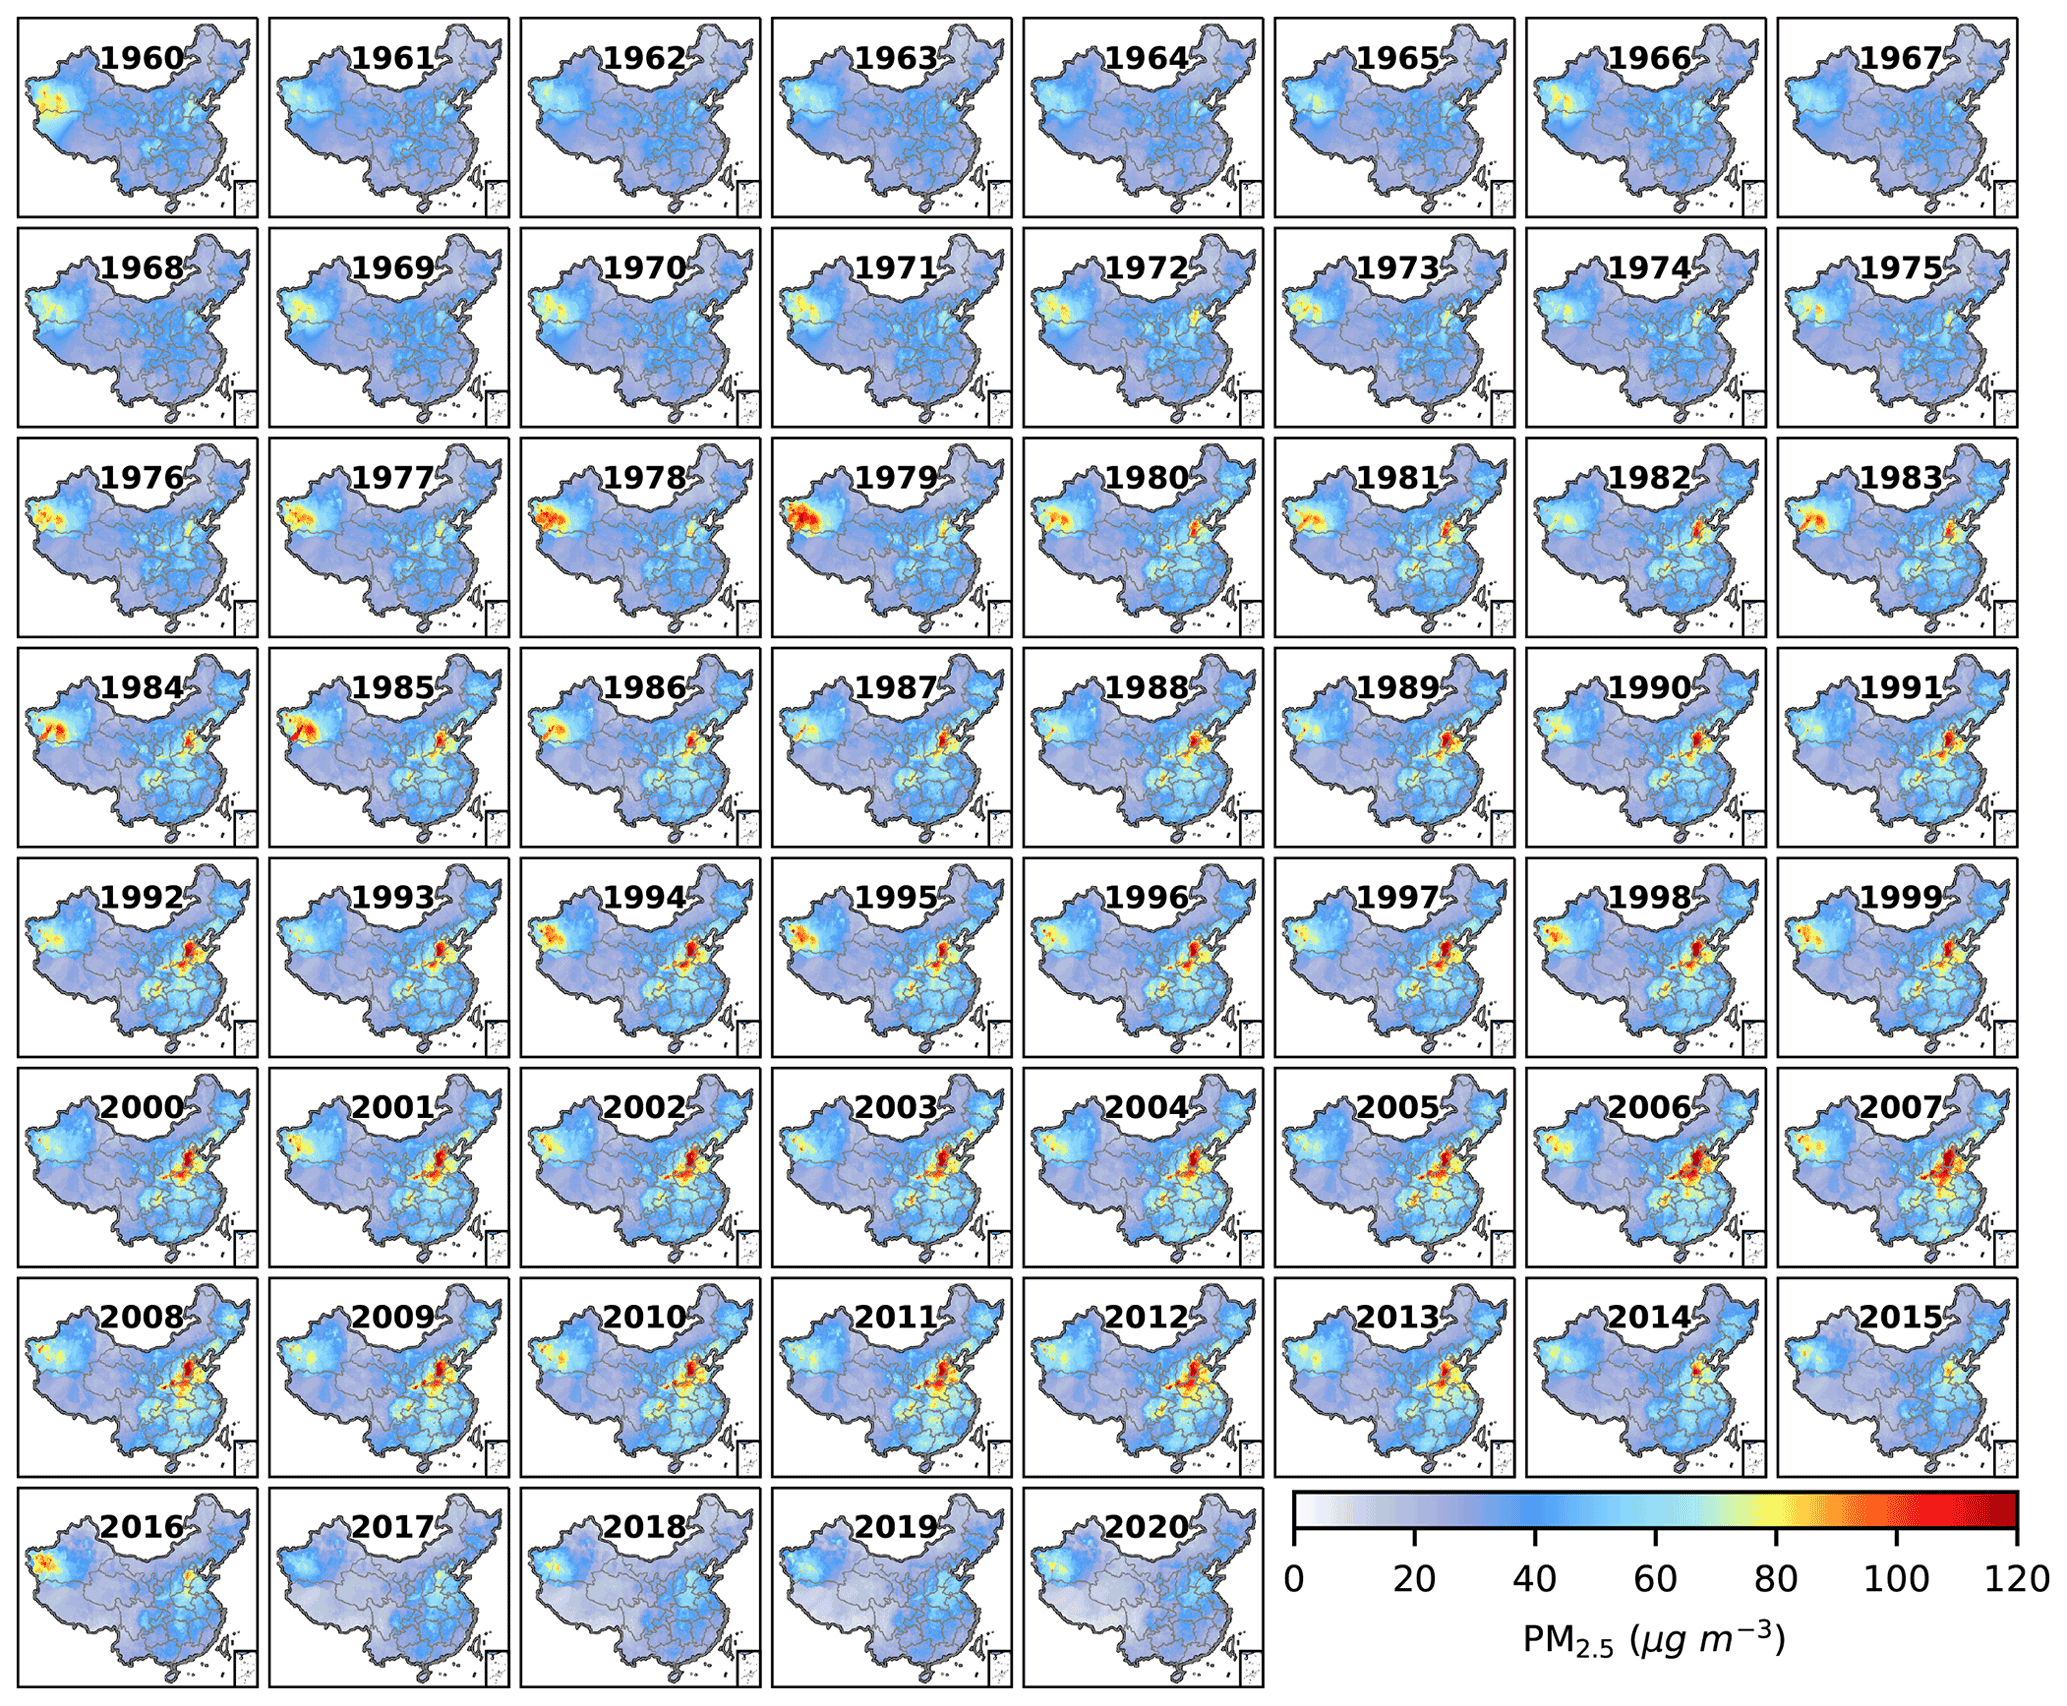
Figure 7Gridded distribution of annual average PM2.5 mass concentration from 1960 to 2020.
Figure 8 shows inter-decadal spatial variations in gridded PM2.5 between 1961–2020. PM2.5 concentrations maintained at low levels in most areas over the first decade and increased to a certain extent in the NCP and western Xinjiang over the second decade. In the following decades, PM2.5 pollution has worsened significantly in several key regions, including the NCP, the GZP, and the SB. This worsening was maintained until the last decade, during which PM2.5 pollution mitigates significantly in nearly all populous and polluted regions in eastern China.
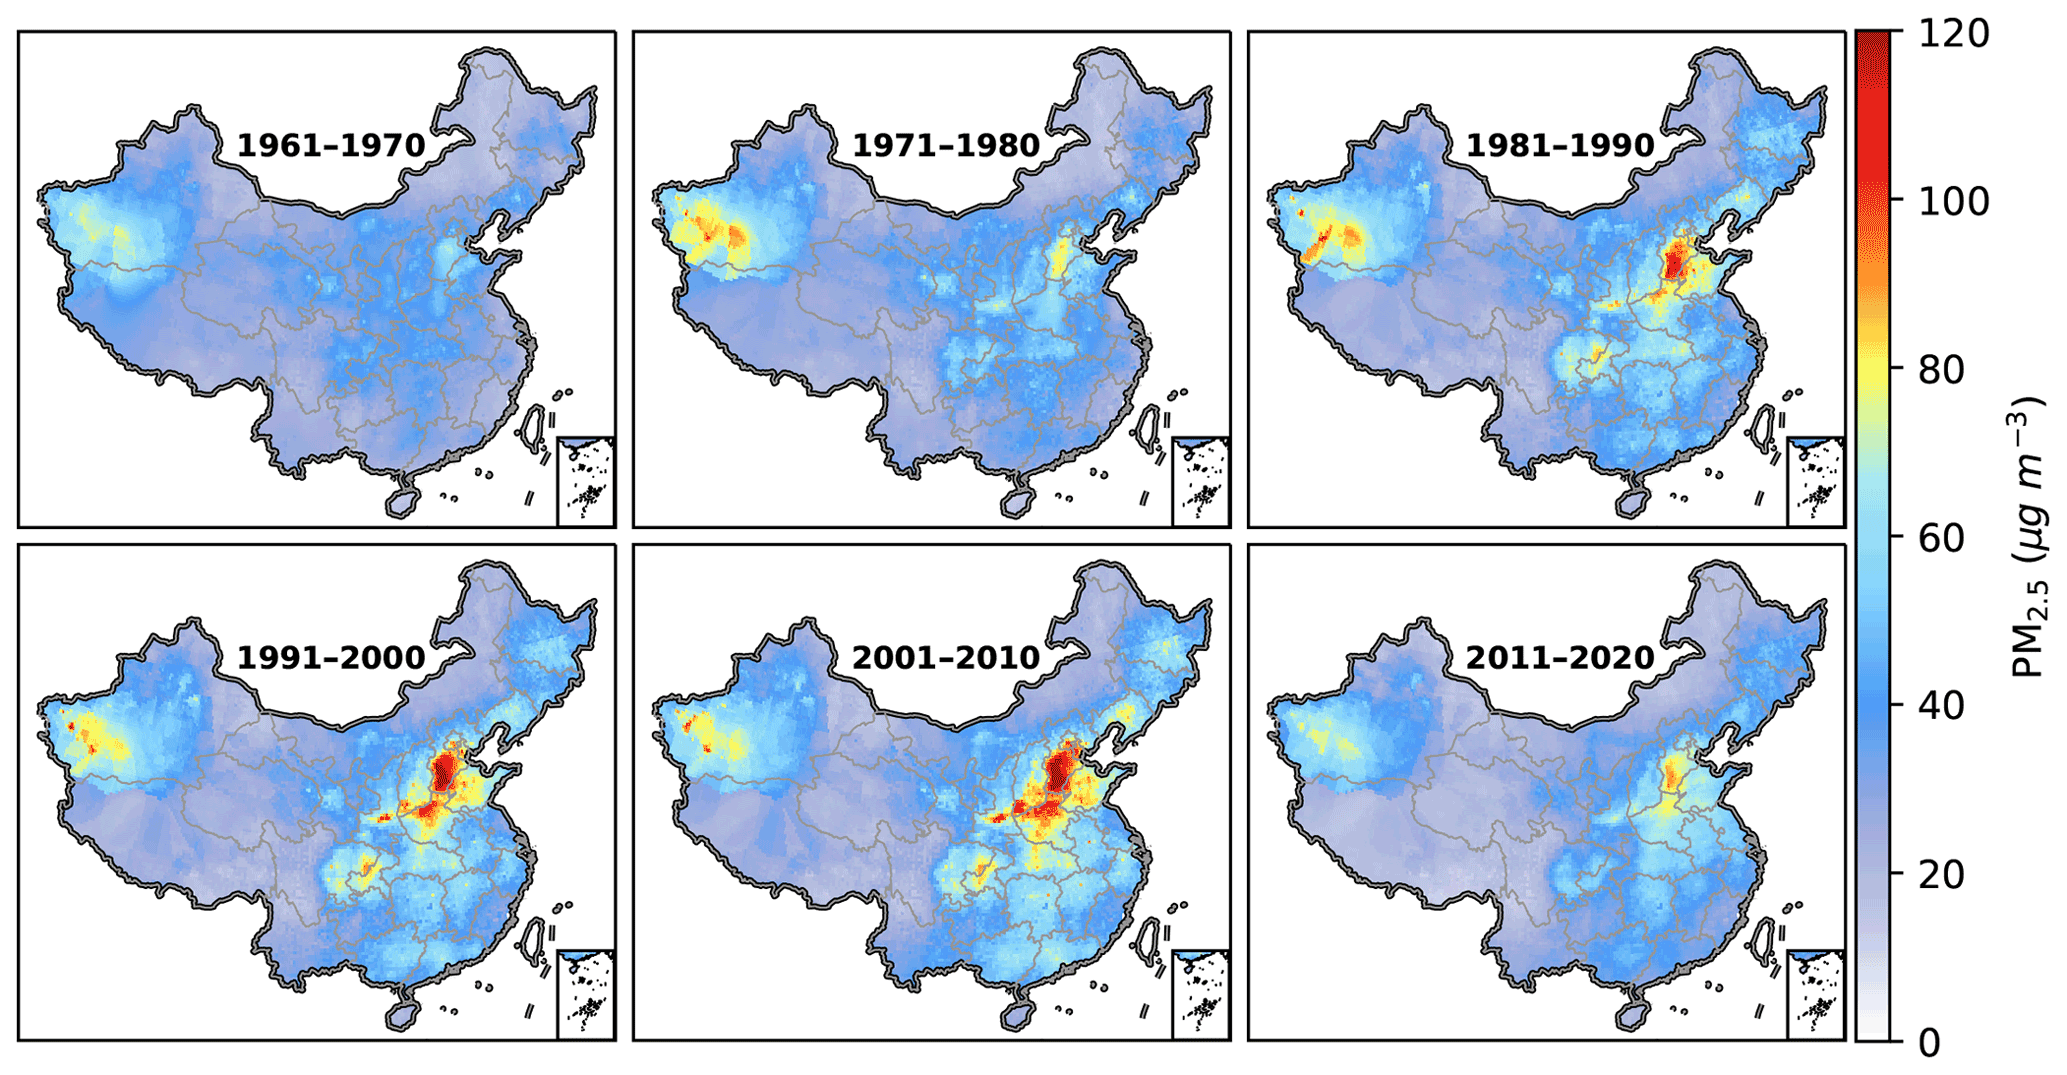
Figure 8Gridded distribution of decadal average PM2.5 mass concentration from 1960 to 2020.
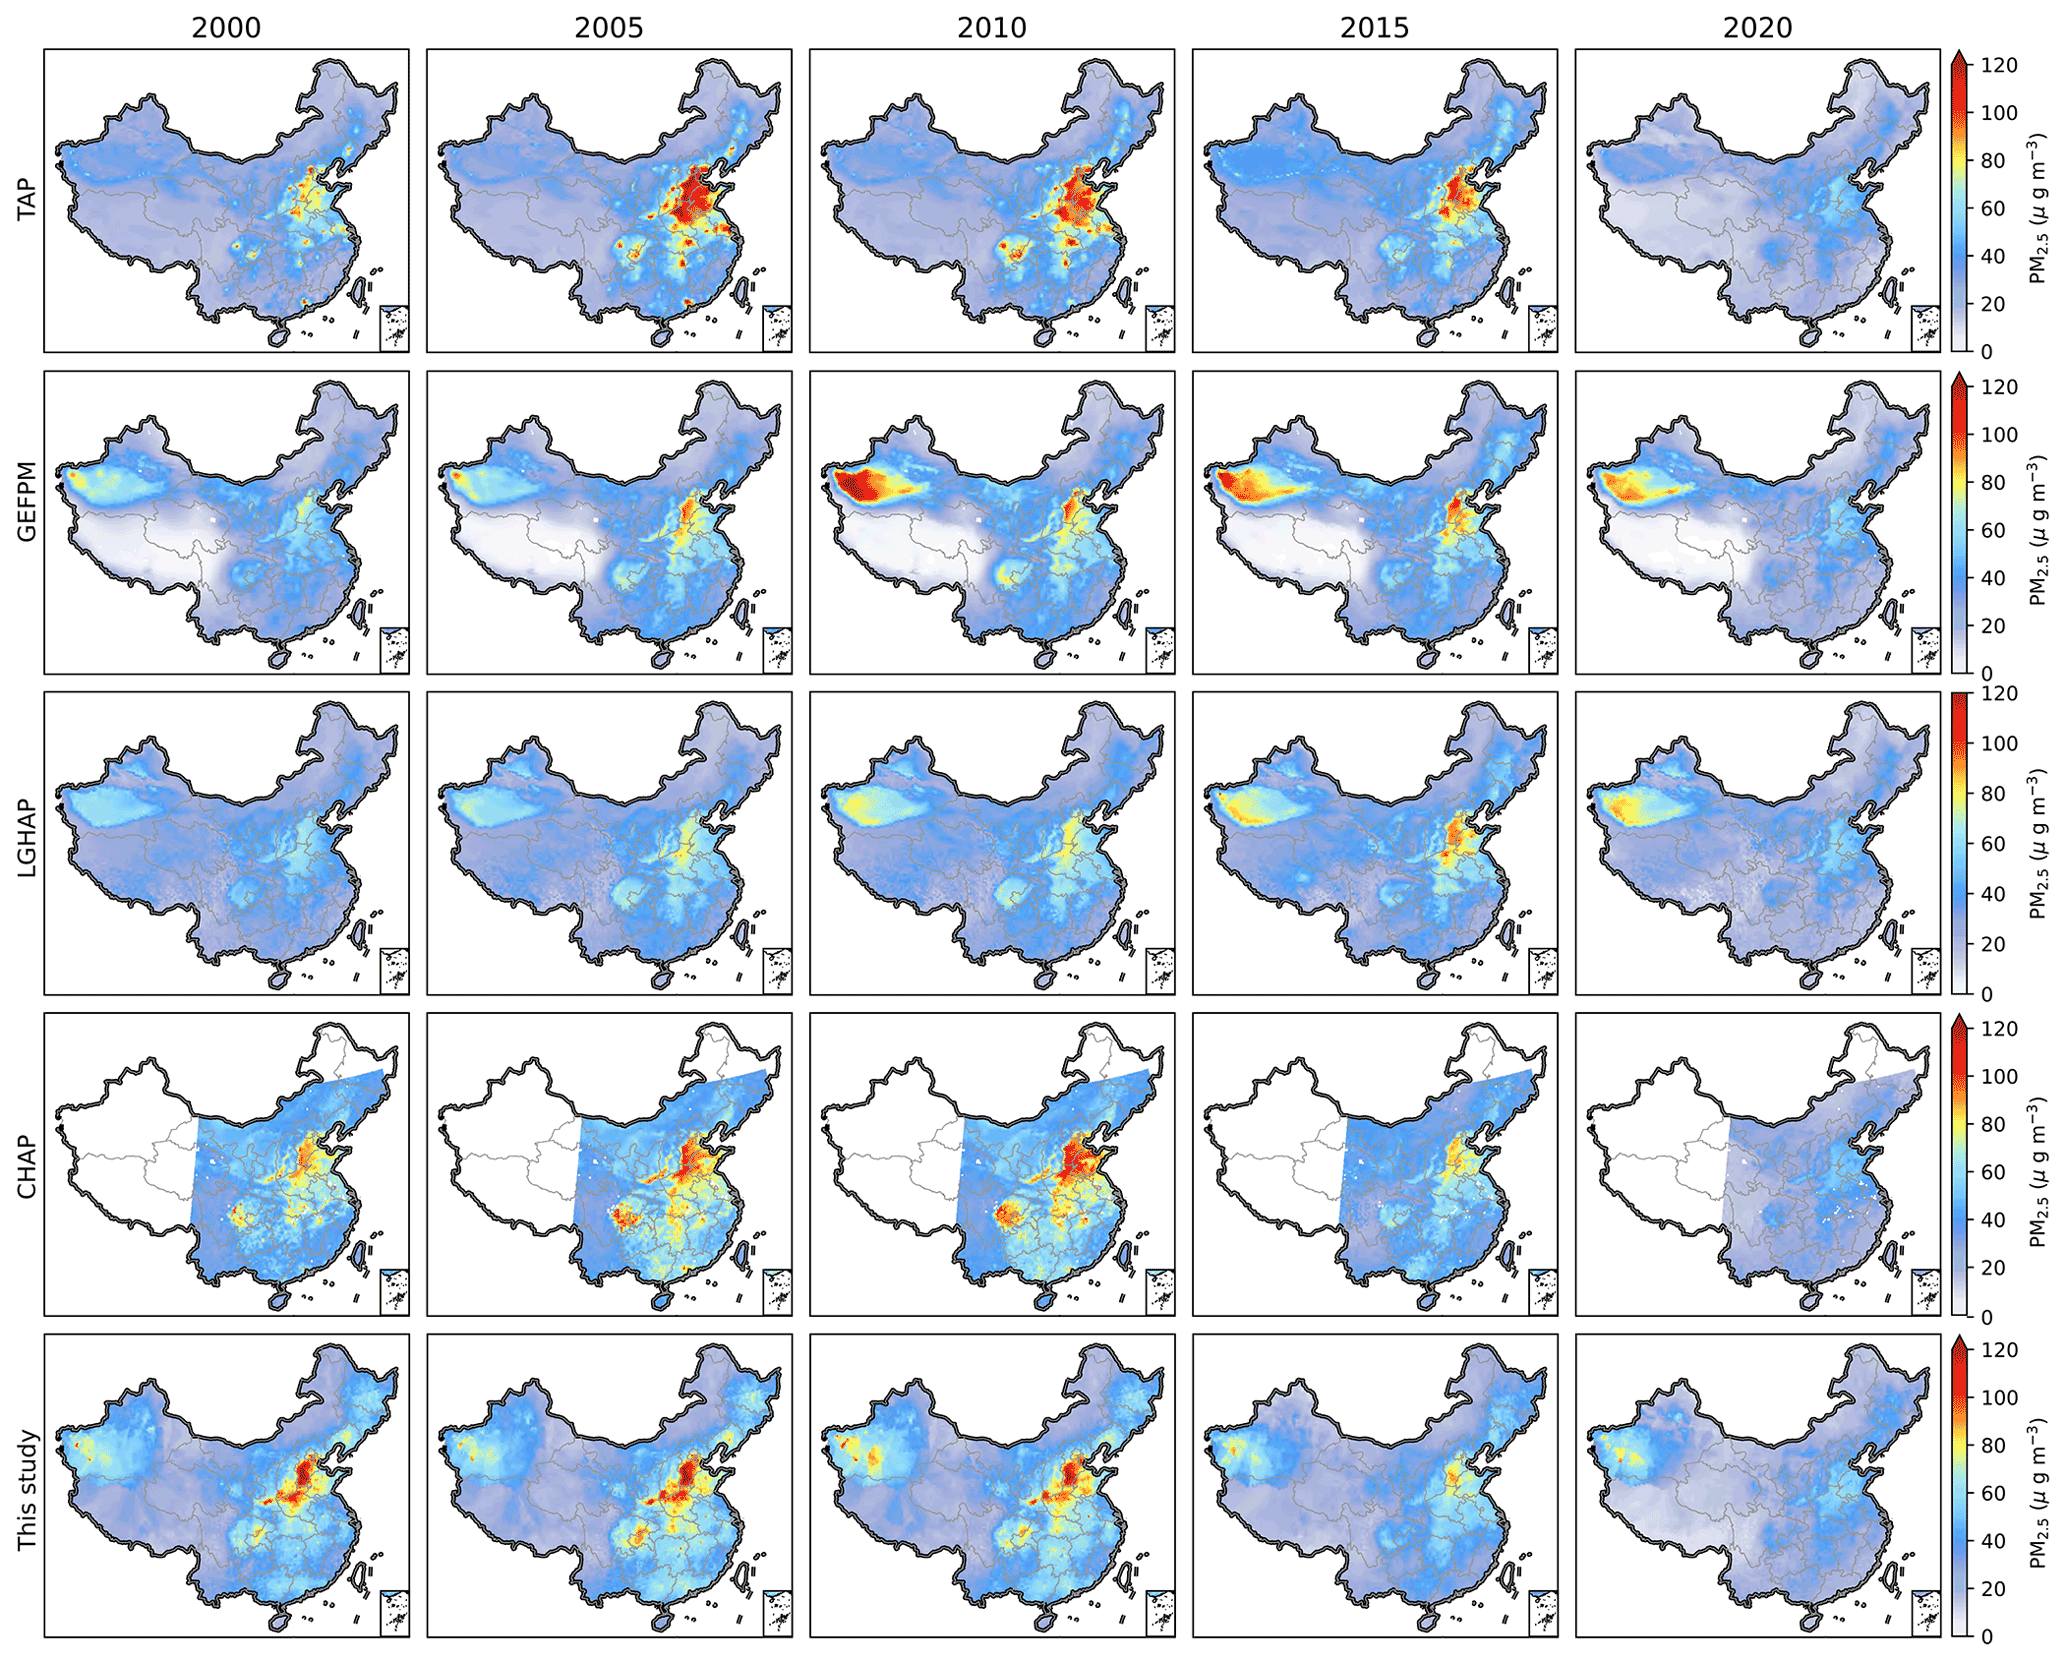
Figure 9Distribution of reconstructed PM2.5 by different PM2.5 datasets in 2000, 2005, 2010, 2015, and 2020. From top to down are TAP, GEFPM, LGHAP, CHAP, and our dataset.
The multi-year trend of our gridded PM2.5 dataset is also compared with those of publicly available datasets, including the TAP data (Geng et al., 2021), the GEFPM data (Van Donkelaar et al., 2021), the LGHAP data (Bai et al., 2022), and the CHAP data (Wei et al., 2021a), which have been interpolated to the same grid resolution. Figure 9 shows the spatial distributions of PM2.5 from those datasets at 5-year intervals between 2000–2020. One consistent trend across all datasets was that nationwide PM2.5 mass concentrations experienced an increase following a decrease from 2000 to 2020. However, the turning points are different for different datasets. From 2010 to 2015, PM2.5 pollution alleviated for TAP, CHAP, and our data, but worsened for GEFPM and LGHAP. For the time (2015 and 2020) with ground observations available, all PM2.5 data show similar spatial distributions with the most severe pollution in the NCP in 2015 and significant improvement in nationwide air pollution in 2020. For the years (2000, 2005, and 2010) when ground observations were unavailable, significant disparities in pollution levels and regional distribution emerged from different datasets. Specifically, the LGHAP data are significantly lower than other data, while the TAP data are higher than others in nearly all regions except western Xinjiang. In western Xinjiang, PM2.5 concentrations from the GEFPM data are the highest among all the datasets. Due to a lack of ground PM2.5 observations before 2000, it is challenging to determine which dataset has the least bias and more reasonable distributions. In the future, applying an ensemble average to multi-datasets might be an effective way to eliminate systematic bias.
The 6-hourly PM2.5 datasets from 1960 to 2020, including site-based and gridded data, are publicly accessible. Daily, monthly, and yearly sited-based and gridded PM2.5 datasets are also provided. The sited-based PM2.5 dataset is in the CSV format and the gridded dataset PM2.5 is in the NETCDF format. All of them are available at https://doi.org/10.5281/zenodo.6372847 (Zhong et al., 2022).
This study is among the first to generate long-term site-based and gridded PM2.5 datasets between 1960–2020 with 6-hourly resolution, based on long-term visibility, conventional meteorological observations, emissions, and elevation. A new feature engineering method that takes advantage of spatial features from 20 surrounding meteorological stations is employed in our LightGBM model to incorporate spatial effects of meteorological conditions. For by-year CV, the R2 values of our model are 0.71, 0.78, and 0.83 for 6-hourly, daily, and monthly estimations, respectively, which are higher than those in other available datasets (0.41–0.62). This hindcast capability is further evaluated independently using pre-2013 PM2.5 data of 6 years from US embassies in Beijing and Shanghai. The low values, high values, and temporal variations in US-embassy PM2.5 measurements are all well estimated, with the overall R2 being 0.74 and 0.79 in Beijing and Shanghai, respectively. Both by-year CV and independent validation show that our model has a stable by-year hindcast capability and can reconstruct historical PM2.5 data in a relatively accurate way. Our datasets show that PM2.5 variations in China experience a slow increase under low concentrations between 1960–1978, a continuous accumulation with high concentrations reached between 1979–2013, and a rapid decrease between 2014–2020. The worsening of PM2.5 pollution is closely associated with massive anthropogenic emissions after reform and opening-up policies, while the substantial declines in PM2.5 are mainly due to the implementation of the toughest ever clean air policy in China. In 2020, the nationwide PM2.5 concentrations were close to the lowest recorded level in almost 61 years. These two reconstructed PM2.5 datasets provide spatiotemporal variations at high resolution, which lay the foundation for research studies associated with air pollution, climate change, and atmospheric chemical reanalysis. It is worth noting that our datasets still have some weaknesses, with the main weakness being a lack of detailed bias estimations for each value in our datasets due to limited historical observations. In the future, we will collect as many PM2.5 observations as possible to validate the accuracy of our datasets and provide evaluations of uncertainty for our datasets.
The supplement related to this article is available online at: https://doi.org/10.5194/essd-14-3197-2022-supplement.
XZ designed the research and led the overall scientific questions. JZ, KG, and LG carried out the data processing and analysis based on suggestions from ZZ, DW, YW, and HC. LL calibrated PM2.5 data and meteorological observations. YF performed visibility conversions from class values to numeric values before 1980. JL and LJ provided calibrated visibility from 2013 to 2016 and suggestions about the manuscript structure. JZ wrote the first draft of the manuscript and XZ revised the manuscript. All authors read and approved the final version.
The contact author has declared that none of the authors has any competing interests.
Publisher's note: Copernicus Publications remains neutral with regard to jurisdictional claims in published maps and institutional affiliations.
The authors are grateful to all the organizations and groups that provided indispensable datasets that we used in this study. We would like to acknowledge the CMA for providing the long-term visibility and MEE for the observational PM2.5 data. Also, we acknowledge the MEIC team and Peking for providing the emission inventories and the GDEM data provider.
This research was supported by the Major Project (grant no. 42090031) and the Distinguished Young Scholars Project (grant no. 41825011) from the Natural Science Foundation of China.
This paper was edited by Chunlüe Zhou and reviewed by two anonymous referees.
Bai, K., Li, K., Ma, M., Li, K., Li, Z., Guo, J., Chang, N.-B., Tan, Z., and Han, D.: LGHAP: the Long-term Gap-free High-resolution Air Pollutant concentration dataset, derived via tensor-flow-based multimodal data fusion, Earth Syst. Sci. Data, 14, 907–927, https://doi.org/10.5194/essd-14-907-2022, 2022.
Beelen, R., Hoek, G., Den Brandt, P. A. V., Goldbohm, R. A., Fischer, P., Schouten, L. J., Jerrett, M., Hughes, E., Armstrong, B., and Brunekreef, B.: Long-term effects of traffic-related air pollution on mortality in a Dutch cohort (NLCS-AIR study), Environ. Health Persp., 116, 196–202, 2007.
Chen, H., Huang, Y., Shen, H., Chen, Y., Ru, M., Chen, Y., Lin, N., Su, S., Zhuo, S., Zhong, Q., Wang, X., Liu, J., Li, B., and Tao, S.: Modeling temporal variations in global residential energy consumption and pollutant emissions, Appl. Energ., 184, 820–829, https://doi.org/10.1016/j.apenergy.2015.10.185, 2016.
Chen, J., Yin, J., Zang, L., Zhang, T., and Zhao, M.: Stacking machine learning model for estimating hourly PM2.5 in China based on Himawari 8 aerosol optical depth data, Sci. Total Environ., 697, 134021, https://doi.org/10.1016/j.scitotenv.2019.134021, 2019.
Chen, X., Zhang, L. W., Huang, J. J., Song, F. J., Zhang, L. P., Qian, Z. M., Trevathan, E., Mao, H. J., Han, B., Vaughn, M., Chen, K. X., Liu, Y. M., Chen, J., Zhao, B. X., Jiang, G. H., Gu, Q., Bai, Z. P., Dong, G. H., and Tang, N. J.: Long-term exposure to urban air pollution and lung cancer mortality: A 12-year cohort study in Northern China, Sci. Total Environ., 571, 855–861, https://doi.org/10.1016/j.scitotenv.2016.07.064, 2016.
CMA: Forecasting and Networking Department of China Meteorological Administration released letter No.4: Notice on the adjustments of the haze weather phenomenon observation and on the revision of the fog and haze observation data, China Meteorological Administration (CMA), 2014.
Ervens, B., Turpin, B. J., and Weber, R. J.: Secondary organic aerosol formation in cloud droplets and aqueous particles (aqSOA): a review of laboratory, field and model studies, Atmos. Chem. Phys., 11, 11069–11102, https://doi.org/10.5194/acp-11-11069-2011, 2011.
Fang, X., Zou, B., Liu, X., Sternberg, T., and Zhai, L.: Satellite-based ground PM2.5 estimation using timely structure adaptive modeling, Remote Sens. Environ., 186, 152-163, https://doi.org/10.1016/j.rse.2016.08.027, 2016.
Gelaro, R., McCarty, W., Suárez, M. J., Todling, R., Molod, A., Takacs, L., Randles, C. A., Darmenov, A., Bosilovich, M. G., and Reichle, R.: The modern-era retrospective analysis for research and applications, version 2 (MERRA-2), J. Climate, 30, 5419–5454, 2017.
Geng, G., Xiao, Q., Liu, S., Liu, X., Cheng, J., Zheng, Y., Xue, T., Tong, D., Zheng, B., Peng, Y., Huang, X., He, K., and Zhang, Q.: Tracking Air Pollution in China: Near Real-Time PM2.5 Retrievals from Multisource Data Fusion, Environ. Sci. Technol., 55, 12106–12115, https://doi.org/10.1021/acs.est.1c01863, 2021.
Gui, K., Che, H., Zeng, Z., Wang, Y., Zhai, S., Wang, Z., Luo, M., Zhang, L., Liao, T., Zhao, H., Li, L., Zheng, Y., and Zhang, X.: Construction of a virtual PM2.5 observation network in China based on high-density surface meteorological observations using the Extreme Gradient Boosting model, Environ. Int., 141, 105801, https://doi.org/10.1016/j.envint.2020.105801, 2020.
Huang, C., Hu, J., Xue, T., Xu, H., and Wang, M.: High-Resolution Spatiotemporal Modeling for Ambient PM2.5 Exposure Assessment in China from 2013 to 2019, Environ. Sci. Technol., 55, 2152–2162, https://doi.org/10.1021/acs.est.0c05815, 2021.
Huang, Y., Shen, H., Chen, H., Wang, R., Zhang, Y., Su, S., Chen, Y., Lin, N., Zhuo, S., Zhong, Q., Wang, X., Liu, J., Li, B., Liu, W., and Tao, S.: Quantification of Global Primary Emissions of PM2.5, PM10, and TSP from Combustion and Industrial Process Sources, Environ. Sci. Technol., 48, 13834–13843, https://doi.org/10.1021/es503696k, 2014.
Huang, Y., Shen, H., Chen, Y., Zhong, Q., Chen, H., Wang, R., Shen, G., Liu, J., Li, B., and Tao, S.: Global organic carbon emissions from primary sources from 1960 to 2009, Atmos. Environ., 122, 505–512, https://doi.org/10.1016/j.atmosenv.2015.10.017, 2015.
Inness, A., Ades, M., Agustí-Panareda, A., Barré, J., Benedictow, A., Blechschmidt, A.-M., Dominguez, J. J., Engelen, R., Eskes, H., Flemming, J., Huijnen, V., Jones, L., Kipling, Z., Massart, S., Parrington, M., Peuch, V.-H., Razinger, M., Remy, S., Schulz, M., and Suttie, M.: The CAMS reanalysis of atmospheric composition, Atmos. Chem. Phys., 19, 3515–3556, https://doi.org/10.5194/acp-19-3515-2019, 2019.
Ke, G., Meng, Q., Finley, T., Wang, T., Chen, W., Ma, W., Ye, Q., and Liu, T.-Y.: Lightgbm: A highly efficient gradient boosting decision tree, Adv. Neural In., 3146–3154, 2017.
Kuang, Y., Zhao, C., Tao, J., Bian, Y., and Ma, N. J.: Impact of aerosol hygroscopic growth on the direct aerosol radiative effect in summer on North China Plain, Atmos. Environ., 147, 224–233, https://doi.org/10.1016/j.atmosenv.2016.10.013, 2016.
Liang, F., Xiao, Q., Huang, K., Yang, X., Liu, F., Li, J., Lu, X., Liu, Y., and Gu, D.: The 17-y spatiotemporal trend of PM2.5 and its mortality burden in China, P. Natl. Acad. Sci. USA, 117, 25601–25608, https://doi.org/10.1073/pnas.1919641117, 2020.
Liu, M., Bi, J., and Ma, Z.: Visibility-Based PM2.5 Concentrations in China: 1957–1964 and 1973–2014, Environ. Sci. Technol., 51, 13161–13169, https://doi.org/10.1021/acs.est.7b03468, 2017.
Lynch, P., Reid, J. S., Westphal, D. L., Zhang, J., Hogan, T. F., Hyer, E. J., Curtis, C. A., Hegg, D. A., Shi, Y., Campbell, J. R., Rubin, J. I., Sessions, W. R., Turk, F. J., and Walker, A. L.: An 11-year global gridded aerosol optical thickness reanalysis (v1.0) for atmospheric and climate sciences, Geosci. Model Dev., 9, 1489–1522, https://doi.org/10.5194/gmd-9-1489-2016, 2016.
Ma, Z., Hu, X., Sayer, A. M., Levy, R., Zhang, Q., Xue, Y., Tong, S., Bi, J., Huang, L., and Liu, Y.: Satellite-Based Spatiotemporal Trends in PM2.5 Concentrations: China, 2004–2013, Environ. Health Persp., 124, 184–192, https://doi.org/10.1289/ehp.1409481, 2016.
Pilinis, C., Seinfeld, J. H., and Grosjean, D.: Water content of atmospheric aerosols, Atmos. Environ., 23, 1601–1606, https://doi.org/10.1016/0004-6981(89)90419-8, 1989.
Pope, C. A., Burnett, R. T., Thun, M. J., Calle, E. E., Krewski, D., Ito, K., and Thurston, G. D.: Lung cancer, cardiopulmonary mortality, and long-term exposure to fine particulate air pollution, J. Am. Medical Assoc., 287, 1132–1141, 2002.
Randles, C., Da Silva, A., Buchard, V., Colarco, P., Darmenov, A., Govindaraju, R., Smirnov, A., Holben, B., Ferrare, R., and Hair, J.: The MERRA-2 aerosol reanalysis, 1980 onward. Part I: System description and data assimilation evaluation, J. Climate, 30, 6823–6850, 2017.
van Donkelaar, A., Hammer, M. S., Bindle, L., Brauer, M., Brook, J. R., Garay, M. J., Hsu, N. C., Kalashnikova, O. V., Kahn, R. A., Lee, C., Levy, R. C., Lyapustin, A., Sayer, A. M., and Martin, R. V.: Monthly Global Estimates of Fine Particulate Matter and Their Uncertainty, Environ. Sci. Technol., 55, 15287–15300, https://doi.org/10.1021/acs.est.1c05309, 2021.
Wang, B., Yuan, Q., Yang, Q., Zhu, L., Li, T., and Zhang, L.: Estimate hourly PM2.5 concentrations from Himawari-8 TOA reflectance directly using geo-intelligent long short-term memory network, Environ. Pollut., 271, 116327, https://doi.org/10.1016/j.envpol.2020.116327, 2021.
Wang, R., Tao, S., Shen, H., Huang, Y., Chen, H., Balkanski, Y., Boucher, O., Ciais, P., Shen, G., Li, W., Zhang, Y., Chen, Y., Lin, N., Su, S., Li, B., Liu, J., and Liu, W.: Trend in Global Black Carbon Emissions from 1960 to 2007, Environ. Sci. Technol., 48, 6780–6787, https://doi.org/10.1021/es5021422, 2014.
Wang, X., Dickinson, R. E., Su, L., Zhou, C., and Wang, K.: PM2.5 Pollution in China and How It Has Been Exacerbated by Terrain and Meteorological Conditions, B. Am. Meteorol. Soc., 99, 105–119, https://doi.org/10.1175/bams-d-16-0301.1, 2018.
Wang, X., Zhang, R., and Yu, W.: The Effects of PM2.5 Concentrations and Relative Humidity on Atmospheric Visibility in Beijing, J. Geophys. Res.-Atmos., 124, 2235–2259, https://doi.org/10.1029/2018JD029269, 2019.
Wei, J., Li, Z., Lyapustin, A., Sun, L., Peng, Y., Xue, W., Su, T., and Cribb, M.: Reconstructing 1-km-resolution high-quality PM2.5 data records from 2000 to 2018 in China: spatiotemporal variations and policy implications, Remote Sens. Environ., 252, 112136, https://doi.org/10.1016/j.rse.2020.112136, 2021a.
Wei, J., Li, Z., Pinker, R. T., Wang, J., Sun, L., Xue, W., Li, R., and Cribb, M.: Himawari-8-derived diurnal variations in ground-level PM2.5 pollution across China using the fast space-time Light Gradient Boosting Machine (LightGBM), Atmos. Chem. Phys., 21, 7863–7880, https://doi.org/10.5194/acp-21-7863-2021, 2021b.
Xiao, Q., Chang, H. H., Geng, G., and Liu, Y.: An Ensemble Machine-Learning Model To Predict Historical PM2.5 Concentrations in China from Satellite Data, Environ. Sci. Technol., 52, 13260–13269, https://doi.org/10.1021/acs.est.8b02917, 2018.
Xue, T., Zheng, Y., Tong, D., Zheng, B., Li, X., Zhu, T., and Zhang, Q.: Spatiotemporal continuous estimates of PM2.5 concentrations in China, 2000–2016: A machine learning method with inputs from satellites, chemical transport model, and ground observations, Environ. Int., 123, 345–357, https://doi.org/10.1016/j.envint.2018.11.075, 2019.
Yan, X., Zang, Z., Luo, N., Jiang, Y., and Li, Z.: New interpretable deep learning model to monitor real-time PM2.5 concentrations from satellite data, Environ. Int., 144, 106060, https://doi.org/10.1016/j.envint.2020.106060, 2020.
Yumimoto, K., Tanaka, T. Y., Oshima, N., and Maki, T.: JRAero: the Japanese Reanalysis for Aerosol v1.0, Geosci. Model Dev., 10, 3225–3253, https://doi.org/10.5194/gmd-10-3225-2017, 2017.
Zhang, H. L., Wang, Y. G., Hu, J. L., Ying, Q., and Hu, X. M.: Relationships between meteorological parameters and criteria air pollutants in three megacities in China, Environ. Res., 140, 242–254, https://doi.org/10.1016/j.envres.2015.04.004, 2015.
Zhang, Q., Streets, D. G., Carmichael, G. R., He, K. B., Huo, H., Kannari, A., Klimont, Z., Park, I. S., Reddy, S., Fu, J. S., Chen, D., Duan, L., Lei, Y., Wang, L. T., and Yao, Z. L.: Asian emissions in 2006 for the NASA INTEX-B mission, Atmos. Chem. Phys., 9, 5131–5153, https://doi.org/10.5194/acp-9-5131-2009, 2009.
Zhang, R., Li, Q., and Zhang, R.: Meteorological conditions for the persistent severe fog and haze event over eastern China in January 2013, Sci. China Earth Sci., 57, 26–35, https://doi.org/10.1007/s11430-013-4774-3, 2013a.
Zhang, X., Sun, J., Wang, Y., Li, W., Zhang, Q., Wang, W., Quan, J., Cao, G., Wang, J., Yang, Y., and Zhang, Y.: Factors contributing to haze and fog in China, Chinese Sci. B., 58, 1178, https://doi.org/10.1360/972013-150, 2013b.
Zheng, B., Tong, D., Li, M., Liu, F., Hong, C., Geng, G., Li, H., Li, X., Peng, L., Qi, J., Yan, L., Zhang, Y., Zhao, H., Zheng, Y., He, K., and Zhang, Q.: Trends in China's anthropogenic emissions since 2010 as the consequence of clean air actions, Atmos. Chem. Phys., 18, 14095–14111, https://doi.org/10.5194/acp-18-14095-2018, 2018.
Zheng, B., Cheng, J., Geng, G., Wang, X., Li, M., Shi, Q., Qi, J., Lei, Y., Zhang, Q., and He, K.: Mapping anthropogenic emissions in China at 1 km spatial resolution and its application in air quality modeling, Sci. Bull., 66, 612–620, https://doi.org/10.1016/j.scib.2020.12.008, 2021.
Zhong, J., Zhang, X., Wang, Y., Sun, J., Zhang, Y., Wang, J., Tan, K., Shen, X., Che, H., and Zhang, L.: Relative contributions of boundary-layer meteorological factors to the explosive growth of PM2.5 during the red-alert heavy pollution episodes in Beijing in December 2016, J. Meteorol. Res., 31, 809–819, https://doi.org/10.1007/s13351-017-7088-0, 2017.
Zhong, J., Zhang, X., Dong, Y., Wang, Y., Liu, C., Wang, J., Zhang, Y., and Che, H.: Feedback effects of boundary-layer meteorological factors on cumulative explosive growth of PM2.5 during winter heavy pollution episodes in Beijing from 2013 to 2016, Atmos. Chem. Phys., 18, 247–258, https://doi.org/10.5194/acp-18-247-2018, 2018.
Zhong, J., Zhang, X., Gui, K., Wang, Y., Che, H., Shen, X., Zhang, L., Zhang, Y., Sun, J., and Zhang, W.: Robust prediction of hourly PM2.5 from meteorological data using LightGBM, National Sci. Rev., 8, nwaa307, https://doi.org/10.1093/nsr/nwaa307, 2021.
Zhong, J., Zhang, X., Gui, K., Liao, J., Fei, Y., Jiang, L., Guo, L., Liu, L., Che, H., Wang, Y., Wang, D., and Zhou, Z.: Reconstructing 6-hourly PM2.5 datasets from 1960 to 2020 in China, Zenodo [data set], https://doi.org/10.5281/zenodo.6372847, 2022.
Zhou, Z. and Zhang, G.: Typical severe dust storms in northern China during 1954–2002, Chinese Sci. B., 48, 2366–2370, 2003.
Zhu, W., Xu, X., Zheng, J., Yan, P., Wang, Y., and Cai, W.: The characteristics of abnormal wintertime pollution events in the Jing-Jin-Ji region and its relationships with meteorological factors, Sci. Total Environ., 626, 887–898, 2018.