the Creative Commons Attribution 4.0 License.
the Creative Commons Attribution 4.0 License.
 | 08 Jul 2026
The first decadal-scale ground-based microwave radiometer dataset in China: brightness temperature and thermodynamic profiles from Xianghe (2013–2022)
Yueyuan Gong
Wenying He
Disong Fu
Xiang'ao Xia
Hongrong Shi
Weidong Nan
Pucai Wang
Hongbin Chen
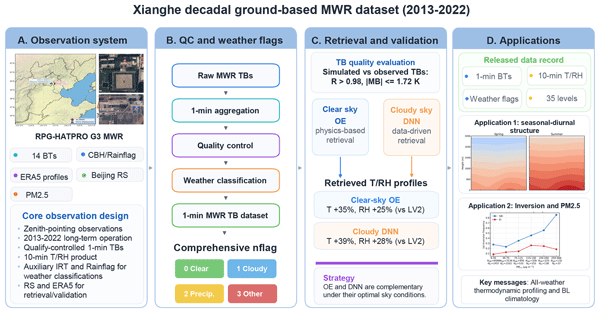
Ground-based microwave radiometers (MWRs) are indispensable instruments for the continuous observation of atmospheric temperature and humidity profiles. The reliability of brightness temperature (TB) measurements and the accuracy of retrieved atmospheric profiles are fundamental to their effective use in both research and operational applications. In this study, we present a long-term dataset of multi-channel microwave brightness temperature observations and corresponding retrieved atmospheric profiles derived from the RPG-HATPRO MWR deployed at the Xianghe Integrated Observatory (XH) in Hebei Province, China, covering the period 2013–2022. Minute-level TB observations over the 10-year period were integrated with collocated infrared cloud detection data to establish a comprehensive dataset featuring detailed weather-related information. The quality of the observed TBs was carefully evaluated using a radiative transfer model. The results demonstrate excellent agreement between simulated and observed multi-channel TBs, with correlation coefficients typically exceeding 0.96 and mean biases within 1 K, confirming the stable and reliable performance of the XH MWR throughout the entire observation period. Based on the quality-controlled TBs, two retrieval schemes for atmospheric temperature and humidity profiles were developed using collocated radiosonde observations and ERA5 reanalysis data. For clear-sky conditions, an optimal estimation (OE)-based retrieval model was employed, whereas a deep neural network (DNN)-based model was designed for cloudy-sky retrievals. Validation against radiosonde measurements shows that both retrieval schemes achieved substantially improved accuracy up to 35 % for temperature and 25 % for humidity profiles compared with the retrieval approach provided by the manufacturer. Combining the two retrieval models with the 10-year quality-controlled TB dataset, we constructed a comprehensive data record characterized by decadal-scale coverage, high temporal resolution (1–10 min), and integrated MWR observations and retrieved profiles (https://doi.org/10.5281/zenodo.20178914, Gong et al., 2025). The dataset captures changes in the frequency of surface-based inversion (SBI), from 6 % in summer to 68 % in winter. More frequent SBIs are associated with higher PM2.5 values, reaching >60 % of the most severe pollution events (>250 µg m−3). These applications demonstrate the dataset's value for boundary layer studies, climate trend analysis, and air quality forecasting.
- Article
(6664 KB) - Full-text XML
- BibTeX
- EndNote


The vertical distribution of atmospheric temperature and humidity is a key parameter for understanding the thermodynamic and dynamic processes of the atmosphere, particularly within the planetary boundary layer and the troposphere, where weather systems frequently occur and are strongly influenced by human activities. Traditionally, atmospheric temperature and humidity profiles are obtained through radiosonde measurements carried by weather balloons, which provide highly accurate and reliable data and are widely regarded as reference standards for validating other atmospheric profile products (He et al., 2019; Trent et al., 2023). However, the routine radiosonde launches, typically conducted twice daily, suffer from low temporal resolution and high operational cost, making them unsuitable for monitoring short-lived mesoscale weather systems. The ground-based microwave radiometer (MWR) is a passive remote sensing instrument that measures the atmospheric thermal emission affected by water vapor and oxygen molecules, allowing for the retrieval of temperature and humidity profiles, as well as the integrated water vapor (IWV) and liquid water path (LWP) along the line of sight (Turner et al., 2007; Xu, 2024). MWRs have become mature and robust instruments capable of unattended, all-weather operation, providing high temporal resolution (e.g., minute-level) atmospheric profiles that greatly complement radiosonde observations (Löhnert and Maier, 2012) and offer valuable input for nowcasting and numerical weather prediction systems (Rüfenacht et al., 2021; Thomas et al., 2025).
Compared with satellite-based retrievals, which are limited by surface heterogeneity and reduced sensitivity within the boundary layer, MWRs offer distinct advantages through their multi-frequency measurements and upward-looking perspective, enabling continuous and dynamic monitoring of boundary-layer meteorological variables (Cimini et al., 2020; Madhulatha et al., 2013). These observations have proven particularly useful for diagnosing the vertical structure of severe air pollution events and investigating the mechanisms of haze formation (Huang et al., 2013; Temimi et al., 2020; Zhang et al., 2024b). Moreover, MWRs are highly sensitive to variations in lower- and mid-tropospheric thermodynamic structures and are therefore widely applied in assessing atmospheric stability, cloud microphysical evolution, air pollution, and hazardous weather events (Cimini et al., 2015; Liu et al., 2025; Madhulatha et al., 2013; Zhou et al., 2024).
In general, MWR observations provide Level 1 (LV1) data, which record the measured brightness temperature (TB) representing the intensity of atmospheric microwave radiation. Based on multi-channel TB observations, various atmospheric parameters – including temperature and humidity profiles, IWV, and LWP – can be retrieved to produce Level 2 (LV2) products. The accuracy of LV2 retrievals is inherently dependent on the quality of LV1 TB measurements; therefore, a rigorous assessment of LV1 data quality is an essential prerequisite for the reliable application of MWR observations (Zou et al., 2021). The radiative transfer model (RTM), which quantitatively describes the propagation of electromagnetic radiation through the atmosphere via the radiative transfer equation, serves as a physical link between observed and simulated radiances. RTMs are widely employed for evaluating the quality of both satellite-based and ground-based radiometric observations (De Angelis et al., 2017; Hou et al., 2019). Because RTMs are independent of instrument calibration and operational conditions, the simulated TBs they generate provide an objective and physically consistent benchmark for validating MWR LV1 observations (He et al., 2021; Navas-Guzmán et al., 2016). Once the reliability of the observed TBs is established, multi-channel retrieval algorithms can be applied to derive LV2 atmospheric parameters with improved confidence.
Current MWR retrieval algorithms can generally be classified into two categories: statistical methods and physical methods. Statistical approaches, such as multivariate regression and neural network algorithms, rely on comprehensive profile datasets obtained from historical radiosondes or atmospheric models to establish empirical relationships between observed TBs and atmospheric parameters (Zhao et al., 2018; Zhu et al., 2022). These methods are computationally efficient and suitable for real-time applications but depend heavily on the completeness and representativeness of the training dataset, requiring regional adjustments for optimal performance. Physical retrieval methods, on the other hand, explicitly incorporate the radiative transfer equation and prior information of atmospheric state variables to estimate the most probable atmospheric profile using optimal estimation theory (Hewison, 2007; Maahn et al., 2020; Martinet et al., 2015). While less dependent on large training datasets, physical methods are computationally intensive, especially under cloudy or precipitating conditions, as the complex scattering effects of large hydrometeors introduce severe non-linearity and convergence difficulties in the radiative transfer modelling (Maahn et al., 2020).
With the increasing deployment of MWRs, numerous studies have focused on data quality control and retrieval algorithm development. However, most efforts have concentrated on specific events or short-term datasets, typically employing a single retrieval model for all conditions, which limits their ability to account for the radiative characteristics under diverse weather situations. To address these limitations, this study proposes a condition-dependent retrieval strategy by combining physically based and data-driven approaches. Specifically, we utilize ten years (2013–2022) of TB observations from the RPG-HATPRO MWR (Rose et al., 2005) at the Xianghe Atmospheric Observatory operated by the Institute of Atmospheric Physics, Chinese Academy of Sciences (hereafter referred to as XH). By integrating collocated infrared cloud detection data, we establish a multi-channel MWR TB dataset with a weather-related classification system. The data quality is further evaluated using an RTM combined with atmospheric temperature and humidity profiles from the ERA5 reanalysis dataset, and long-term variations in TBs under clear-sky and different cloud conditions are analyzed. Based on the quality-controlled multi-channel TBs and weather-related flags, together with radiosonde and ERA5 reanalysis profiles, two retrieval schemes are developed for different weather scenarios: an optimal estimation (OE) retrieval model for clear-sky conditions and a deep neural network (DNN) retrieval model for cloudy conditions. Both models are validated against radiosonde observations. Using these two schemes, the 10-year quality-controlled dataset is processed to generate retrieved temperature and humidity profiles, and the temporal evolution of near-surface thermodynamic structures over XH is analyzed.
The structure of this paper is as follows: Sect. 1 presents the introduction and research background; Sect. 2 describes the observational instruments and datasets; Sect. 3 details the construction of the 10-year MWR TB dataset; Sect. 4 introduces the retrieval models and their validation; and Sect. 5 summarizes the main findings.
An RPG-HATPRO (generation 3, G3) ground-based MWR is deployed at XH (39.75° N, 116.96° E, Fig. 1). The XH station is a comprehensive atmospheric observatory located in the North China Plain, situated approximately midway between the megacities of Beijing and Tianjin. The surrounding environment is predominantly characterized by a rapidly urbanizing suburban landscape.
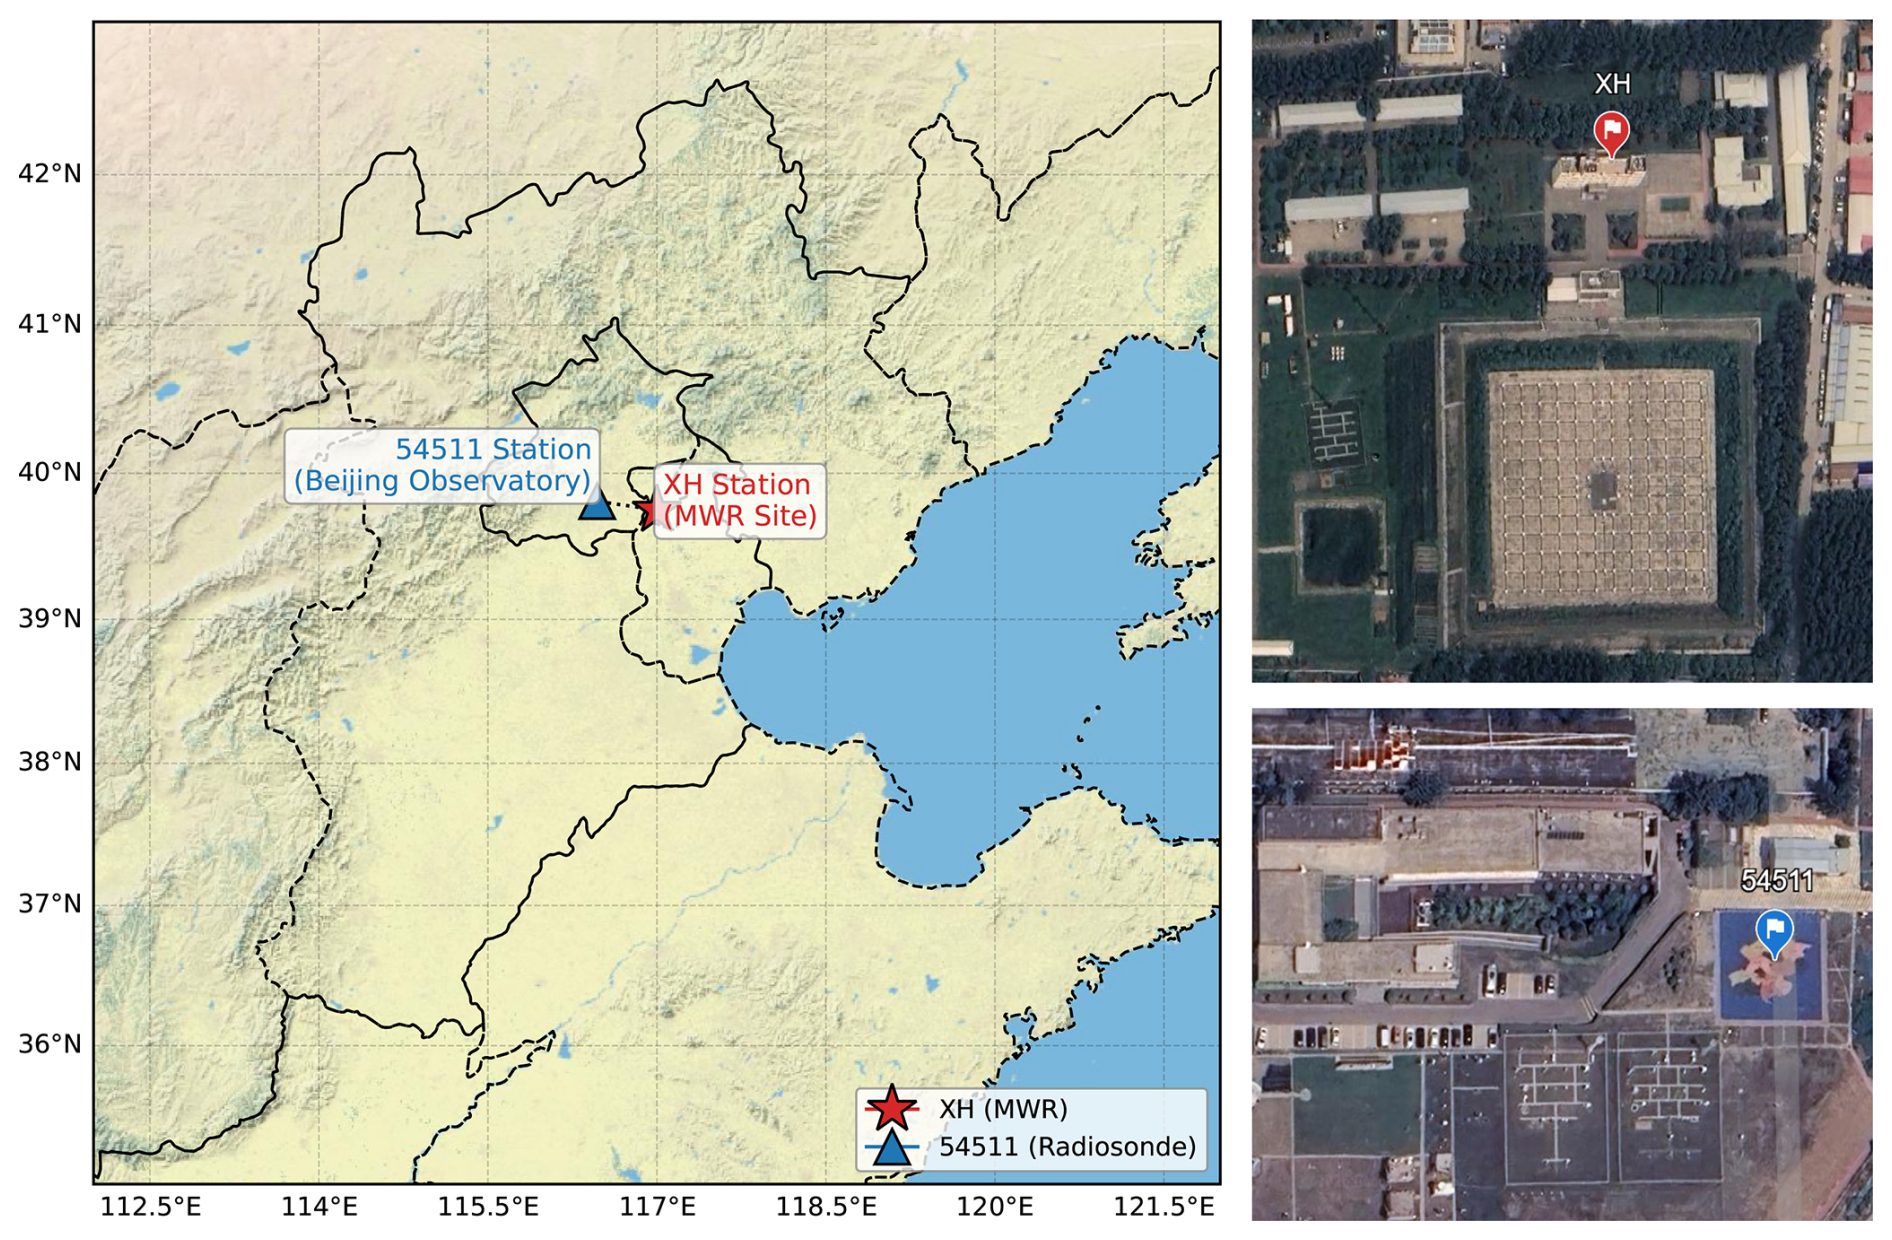
Figure 1Geographical locations of the observation sites in the Beijing-Tianjin-Hebei region. The red star indicates the deployment site of the RPG-HATPRO ground-based microwave radiometer (MWR) at XH (39.75° N, 116.96° E). The blue triangle denotes the Beijing National Basic Meteorological Station (54511; 39.81° N, 116.47° E), which provides routine radiosonde profiles for data validation. The left panel was produced by the authors using the Esri World Physical Map basemap; basemap source: Esri World Physical Map | Powered by Esri. Station markers, labels, and annotations were added by the authors. Satellite imagery in the right panels © 2026 Airbus, Map data © 2026 Google Earth.
The MWR operates across 14 frequency channels. The first seven channels (22.24–31.40 GHz) are centered on the water vapor absorption line and are used to retrieve atmospheric humidity parameters, including absolute and relative humidity, IWV, and LWP. The remaining seven channels (51.26–58.00 GHz) are located around the oxygen absorption band and provide information on atmospheric temperature profiles. It is important to clarify the observation mode: while the RPG-HATPRO is capable of boundary layer scanning, the instrument at XH was primarily configured in zenith-pointing mode (90° elevation angle) to prioritize continuous, high-temporal-resolution profiling. Additionally, several auxiliary instruments are installed on the MWR, including a rain sensor, an infrared (IR) radiometer, and an automatic weather station (AWS). The rain sensor continuously records precipitation signals (Rainflag). In this dataset, the radiometer provides two narrow-band infrared brightness temperatures (IRTs), corresponding to the 10–11 and 11–12 µm channels. These IR measurements are mainly used to support cloud detection and provide auxiliary constraints for low-cloud cloud-base-height (CBH) estimation. The AWS monitors near-surface meteorological variables such as air temperature, pressure, and humidity, providing essential background information for atmospheric observations.
The RPG system also includes a manufacturer-developed inversion module that produces standard RPG Level 2 (RPG-LV2) temperature and humidity profiles up to 10 km altitude (Bedoya-Velásquez et al., 2019). The standard RPG-LV2 product employs an irregularly spaced vertical grid consisting of 39 levels. It provides 25 dense layers below 2 km with vertical resolutions gradually increasing from 10 to 200 m, and 14 additional layers extending up to 10 km with coarser resolutions ranging from 200 to 1000 m. To ensure long-term accuracy, the instrument undergoes absolute calibration using liquid nitrogen every six months, and the radome is cleaned with purified water approximately every three months to prevent contamination.
In this study, we primarily used the multi-channel LV1 TB data recorded at second-level temporal resolution during 2013–2022. For the released long-term TB product, the original 1 s observations were aggregated onto a 1 min time grid, with each 1 min TB value calculated by averaging the quality-controlled 1 s observations within a ±5 s window around the nominal minute. Collocated CBHs and Rainflag were also used to identify cloudy and precipitating conditions. To assess the quality of these observed TBs, simulated TBs are generated via a radiative transfer model using the ERA5 reanalysis profiles as input. These hourly profiles from the European Centre for Medium-Range Weather Forecasts (ECMWF), provided at 0.25° × 0.25° spatial resolution (Hersbach et al., 2020), offer continuous atmospheric information necessary for assessing MWR performance. In contrast, atmospheric profiles from the Beijing radiosonde station (No. 54511, 39.81° N, 116.47° E) are used to construct the prior state required for the OE framework and also serve as the independent “ground truth” for validating the retrieval profiles. Located in an urban environment approximately 50 km northwest of the XH site, this station provides twice-daily balloon soundings up to ∼ 30 km (Lai et al., 2024). These high-precision soundings are essential for quantifying the biases and uncertainties of the retrieved temperature and humidity profiles.
In addition, auxiliary observational datasets, specifically, ground-based PM2.5 (particulate matter with aerodynamic diameters ≤ 2.5 µm) concentration measurements from the same XH site during 2018–2019 are incorporated to investigate the potential influence of aerosol pollution on thermodynamic profiles (Xin et al., 2015).
Ground-based MWRs retrieve atmospheric temperature and humidity profiles from multi-channel TB observations. Consequently, the accuracy of these retrieved profiles depends critically on the quality of the TB observations. When deployed outdoors for long-term monitoring, MWRs are influenced not only by varying meteorological conditions but also by occasional instrumental anomalies, such as radio-frequency interference, power instability, or communication failures (Fu and Tan, 2017; Zhu et al., 2022). Therefore, LV1 TB observations require rigorous quality control (QC) prior to their use in retrieval or analysis applications.
3.1 Quality control and classification of TB observations
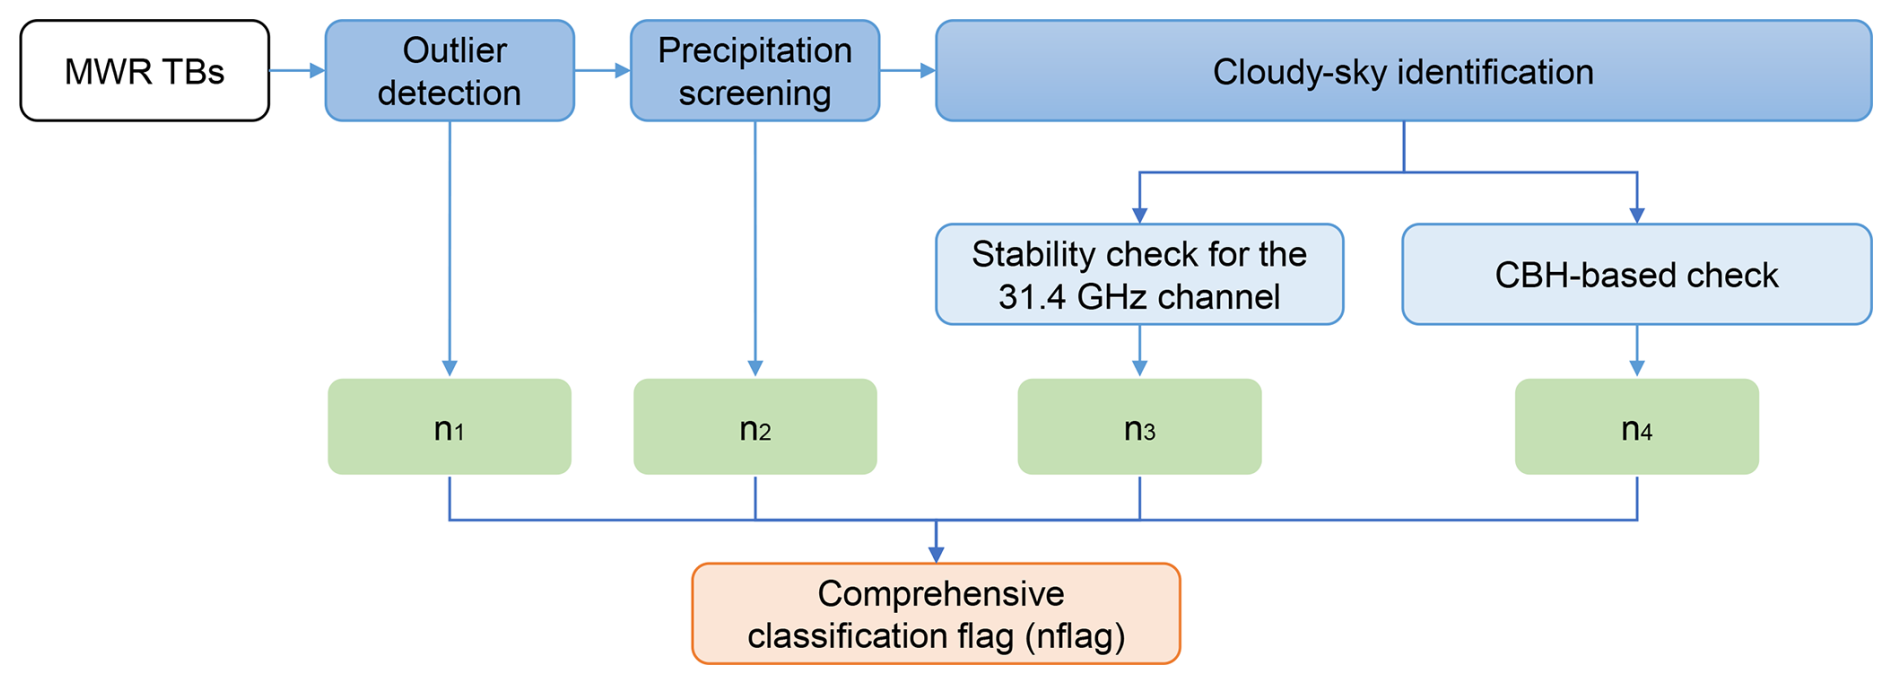
For the multi-channel TB observations collected by the XH ground-based MWR, a comprehensive TB quality control and weather classification procedure was developed. The workflow includes outlier detection, precipitation screening, and clear-sky and cloudy-sky identification, as illustrated in Fig. 2.
3.1.1 Outlier detection
Long-term TB observations are subjected to outlier detection. A quality identifier, denoted by the integer n1, is assigned to each record (see Table 1). The judgment criterion is based on the mean (μ) and standard deviation (σ) of TB within each season: if the TB at time n, denoted TB(n), satisfies , the observation is considered valid; otherwise, it is flagged as anomalous. While this statistical 3σ threshold serves as an efficient gross error check, it has inherent limitations. Genuine extreme meteorological events may be flagged as outliers; however, such events typically involve precipitation and wet-radome conditions, which inherently invalidate standard MWR profiling. Conversely, undetected minor erroneous data (e.g., small instrumental drifts) remaining within the 3σ range are systematically identified and eliminated in the subsequent consistency checks to prevent long-term biases.
Because MWRs operate continuously in outdoor environments, the radome can accumulate dust, moisture, or other contaminants, which may degrade measurement sensitivity and accuracy. Regular cleaning of the radome with purified water under clear-sky conditions is necessary, but this procedure often induces temporary abnormal increases in TB, resembling precipitation signals. Although an active blower/heater system is deployed, sub-zero winter temperatures can slow evaporation. Following cleaning, TB values generally return to normal within 1–2 h, but this process can take up to 4 h in winter. Based on maintenance logs, TB observations recorded within 4 h after radome cleaning are flagged as abnormal (n1=1 in Table 1) to conservatively ensure data purity.
Table 1Multi-Identifier for TB observations and the meanings of its values.
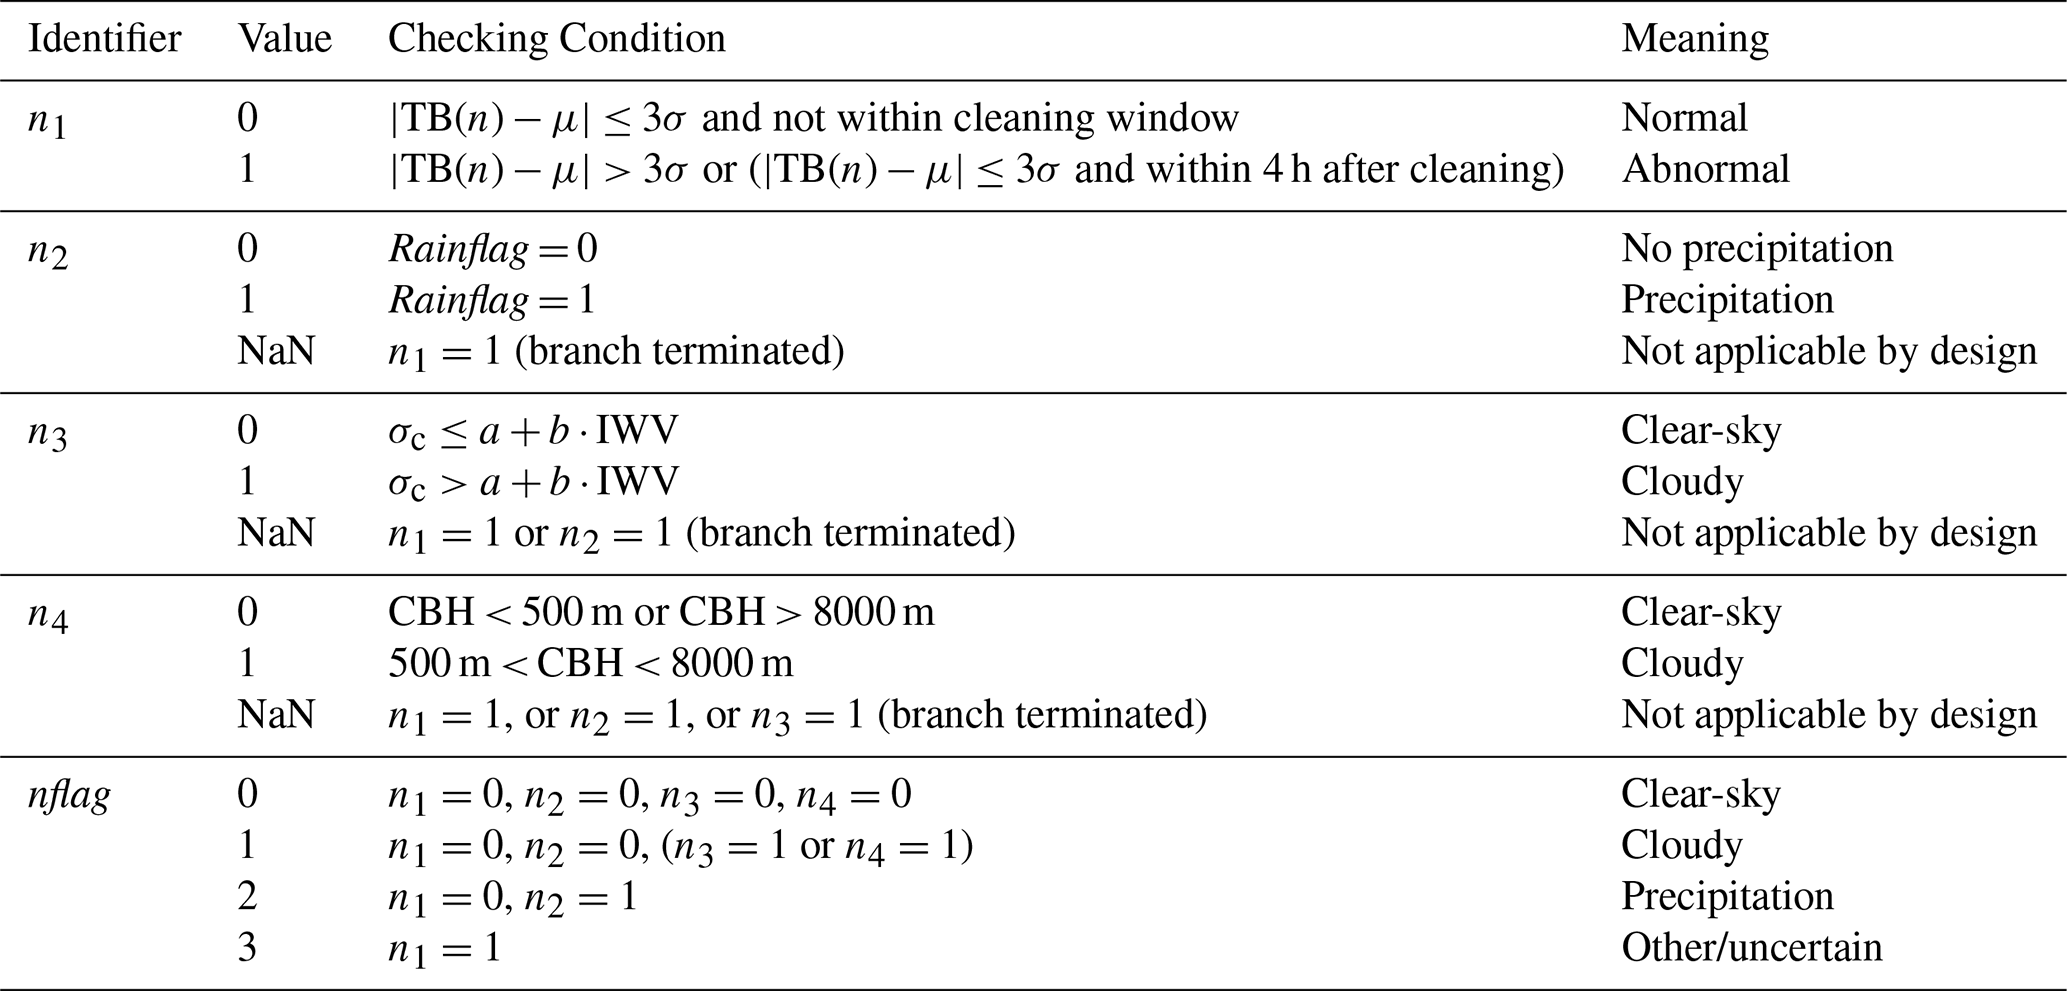
Note: NaN (Not a Number) values in n2–n4 indicate branch-terminated checks and are not random missing data, while nflag contains no NaN values.
3.1.2 Precipitation screening
During precipitation events, residual water layers on the radome may cause large uncertainties in TB observations, directly affecting retrieval accuracy (Wei et al., 2021). Therefore, after removing anomalous values via the outlier detection, precipitation-related data are further screened. The LV1 TB data from the RPG-HATPRO MWR include a Rainflag provided by a collocated precipitation sensor, indicating precipitation conditions: Rainflag = 0 denotes no precipitation, and Rainflag = 1 denotes precipitation. Accordingly, precipitation conditions are represented by identifier n2, as defined in Table 1.
3.1.3 Cloudy-sky identification
Two complementary methods were used to identify cloudy conditions. The first method exploits the high sensitivity of the 31.4 GHz water vapor channel (CH7) to liquid water in clouds, analyzing TB fluctuations to detect cloud presence. The second approach incorporates CBH information derived from co-located infrared radiometer measurements to refine the classification of cloud and clear periods.
Stability check for the 31.4 GHz channel
Given that the high-frequency water vapor channel CH7 (31.4 GHz) is sensitive to liquid water in clouds, its observed TB exhibits noticeable fluctuations when clouds are present. Therefore, the variability of CH7 observations over a specific time period – quantified by the standard deviation within a given time window – can serve as a reference indicator for the presence of clouds during that period.
Following the approach of Turner et al. (2007), this study uses a 30 min time window to calculate the standard deviation of CH7 observed TB, denoted as σc. The stability of the 31.4 GHz channel is then assessed by comparing σc against a threshold defined as , where IWV represents the total column water vapor, and the parameters are set as a=0.15 K and b=0.06 K cm−1. Based on this method for identifying cloudy conditions, the observed TB data are classified using the identifier n3: n3=0 for clear sky and n3=1 for cloudy sky.
CBH-based check
To further improve cloud detection accuracy, the CH7-based method is complemented with CBH information obtained from a zenith-view IRT. It should be noted that the CBH is directly provided as a standard product by the RPG built-in software, which estimates the cloud base by correlating the IRT-measured sky temperature with the ambient temperature profile. The CBH value itself provides a physical constraint for identifying clear-sky periods. In this study, cases with the CBH values lower than 500 m or larger than 8000 m were treated as clear-sky conditions (n4=0). Conversely, cases with CBH higher than approximately 6–8 km are typical cirrus altitudes, and 2–6 km are typical mid-level clouds, and lower than about 2 km is generally associated with low clouds, and all of them is classified as cloudy (n4=1).
3.1.4 Comprehensive classification flag
To facilitate the correct use of ground-based microwave radiometer observations, a comprehensive classification identifier, nflag, was established by integrating all the aforementioned classification flags. Its values and corresponding meanings are listed in Table 1, where “Other” indicates data with additional quality uncertainties and is not recommended for use.
Thus, based on TB observations obtained from the ground-based microwave radiometer during 2013–2022, the raw data were first subjected to an initial quality screening to remove outliers. Weather conditions – including precipitation, clear sky, and cloudy sky – were then identified and classified using multiple criteria. The final result is a nearly ten-year, high-temporal-resolution (∼ 1 min) multichannel TB long-term dataset, providing a reliable foundation for analyzing observational TB characteristics under different weather conditions, performing radiative simulations, and conducting atmospheric temperature and humidity profile retrievals.
3.2 Evaluation of observed brightness temperature quality using a radiative transfer model
Assessing the quality of MWR TBs using a radiative transfer model is a scientifically sound and efficient approach. By comparing the theoretical TB simulated from the radiative transfer model with the actual measurements, abnormal values and potential systematic biases in the observations can be effectively identified, thereby enabling a comprehensive evaluation of the observation quality and instrument performance (De Angelis et al., 2017).
Typically, only clear-sky samples are selected for such simulations, as the atmospheric state under clear-sky conditions is relatively stable and free from cloud and precipitation interference, thereby reducing model uncertainties. In this case, the radiative transfer process is primarily influenced by water vapor and oxygen absorption, resulting in the lowest simulation uncertainty. Therefore, if significant discrepancies still exist between the observed and simulated TB after removing the effects of precipitation and clouds, these differences likely indicate instrumental malfunctions, observational errors or bias from input data.
Based on the TB dataset constructed in Sect. 3.1, which includes weather classification information, clear-sky TB data were selected and evaluated using a radiative transfer model. By systematically comparing the consistency between observed and simulated TB, a precise quality assessment of the MWR observations was achieved.
3.2.1 Radiative transfer model and evaluation method
To assess the quality of observed TB data, the MWRT (Microwave Radiative Transfer) model (Liu, 1998) was employed. MWRT is based on the four-stream discrete ordinate method to solve the radiative transfer equation, achieving high computational efficiency while maintaining good accuracy. Previous studies have demonstrated that MWRT outperforms other commonly used radiative transfer models in simulating ground-based MWR observations (Zou et al., 2021).
To simulate MWR-observed TBs, MWRT requires input atmospheric profiles, including pressure, temperature, and humidity. As no local radiosonde data are available at XH and the nearest sounding station provides only two profiles per day (morning and evening), hourly ERA5 reanalysis data with a spatial resolution of 0.25° were used to provide the atmospheric state fields. The quality of MWR TB observations was then quantitatively assessed by comparing simulated and measured TBs using three statistical indicators: mean bias (MB), correlation coefficient (R), and standard deviation (SD). These metrics respectively characterize bias, correlation, and dispersion, thereby providing a comprehensive evaluation of observation accuracy and reliability.
3.2.2 Quality assessment of observed brightness temperature
Given the accuracy of radiative transfer simulations under clear-sky conditions, the TBs observed by the ground-based microwave radiometer are expected to be consistent with simulated TBs. In the comparison study, a spatiotemporal synchronization approach was applied. Specifically, to match the 1 min MWR observations with the hourly forward-modeled TBs, the single 1 min MWR measurement closest to the exact hour of the simulation was selected. Subsequently, data pairs with anomalous deviations were removed using the 3σ criterion based on the Root Mean Square Error (RMSE).
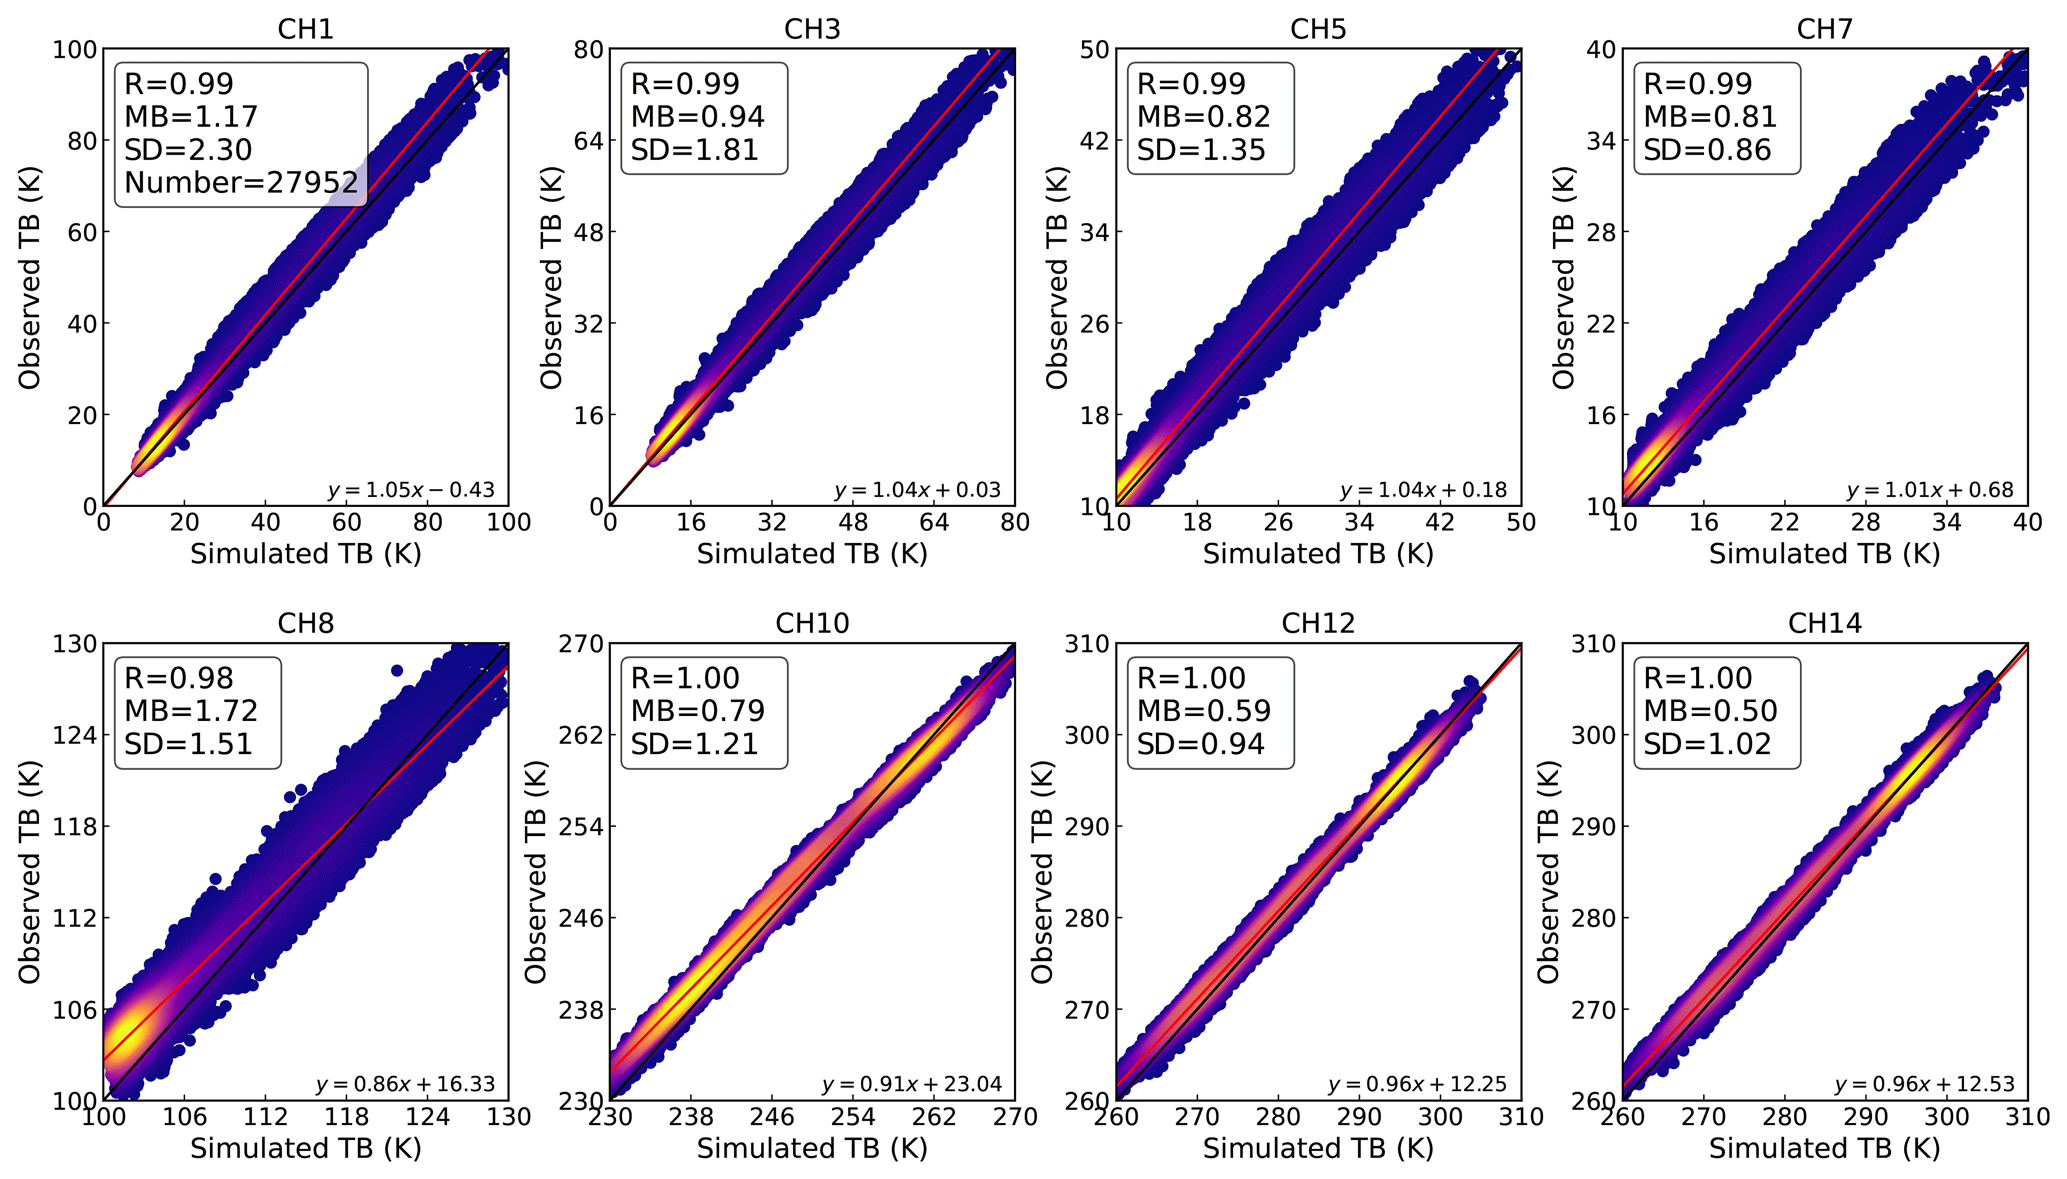
Figure 3 presents scatter plots comparing observed and simulated TBs under clear-sky conditions during 2013–2022. Statistics from ∼ 28 000 matched samples show that R values between simulated and observed TBs are close to 1.0 for most channels, with data points concentrated along the 1 : 1 line, indicating strong agreement. This result confirms both the physical reliability of the observed TBs and the long-term stability of the MWR instrument. Among the O2 channels, the low-frequency oxygen channel at 51.26 GHz (CH8) shows a slightly lower correlation (∼ 0.98) and the largest mean bias (∼ 1.51 K), which can be attributed to its sensitivity to lower- and mid-tropospheric water vapor as well as residual uncertainties in oxygen absorption parameterizations within radiative transfer models (Zou et al., 2021).
To systematically evaluate the long-term performance of the ground-based MWR, statistical analyses of R, MB, and SD were conducted for multi-channel observed and simulated TBs over the 10-year period (2013–2022). As shown in Fig. 4, except for 2013 – when limited observation samples slightly reduced correlations in the water vapor channels – the correlation coefficients for all channels remain highly consistent across the remaining years. The water vapor channels (CH1–CH7) and temperature channels (CH10–CH14) both show R>0.98, indicating excellent consistency between simulated and observed TBs. For the low-frequency oxygen channels (CH8 and CH9), correlation coefficients are slightly reduced, consistent with the results in Fig. 3, likely due to channel sensitivity to water vapor and limitations in the radiative transfer model. In terms of MB, except for 2013, the water vapor channels show a decreasing MB with increasing frequency. The largest MB is observed for CH8 (51.26 GHz), while the high-frequency oxygen channels (CH10–CH14) remain relatively stable. For SD, CH1 shows the largest values among the water vapor channels, which decrease progressively with frequency, whereas the high-frequency oxygen channels (CH10–CH14) maintain small and stable SD values.
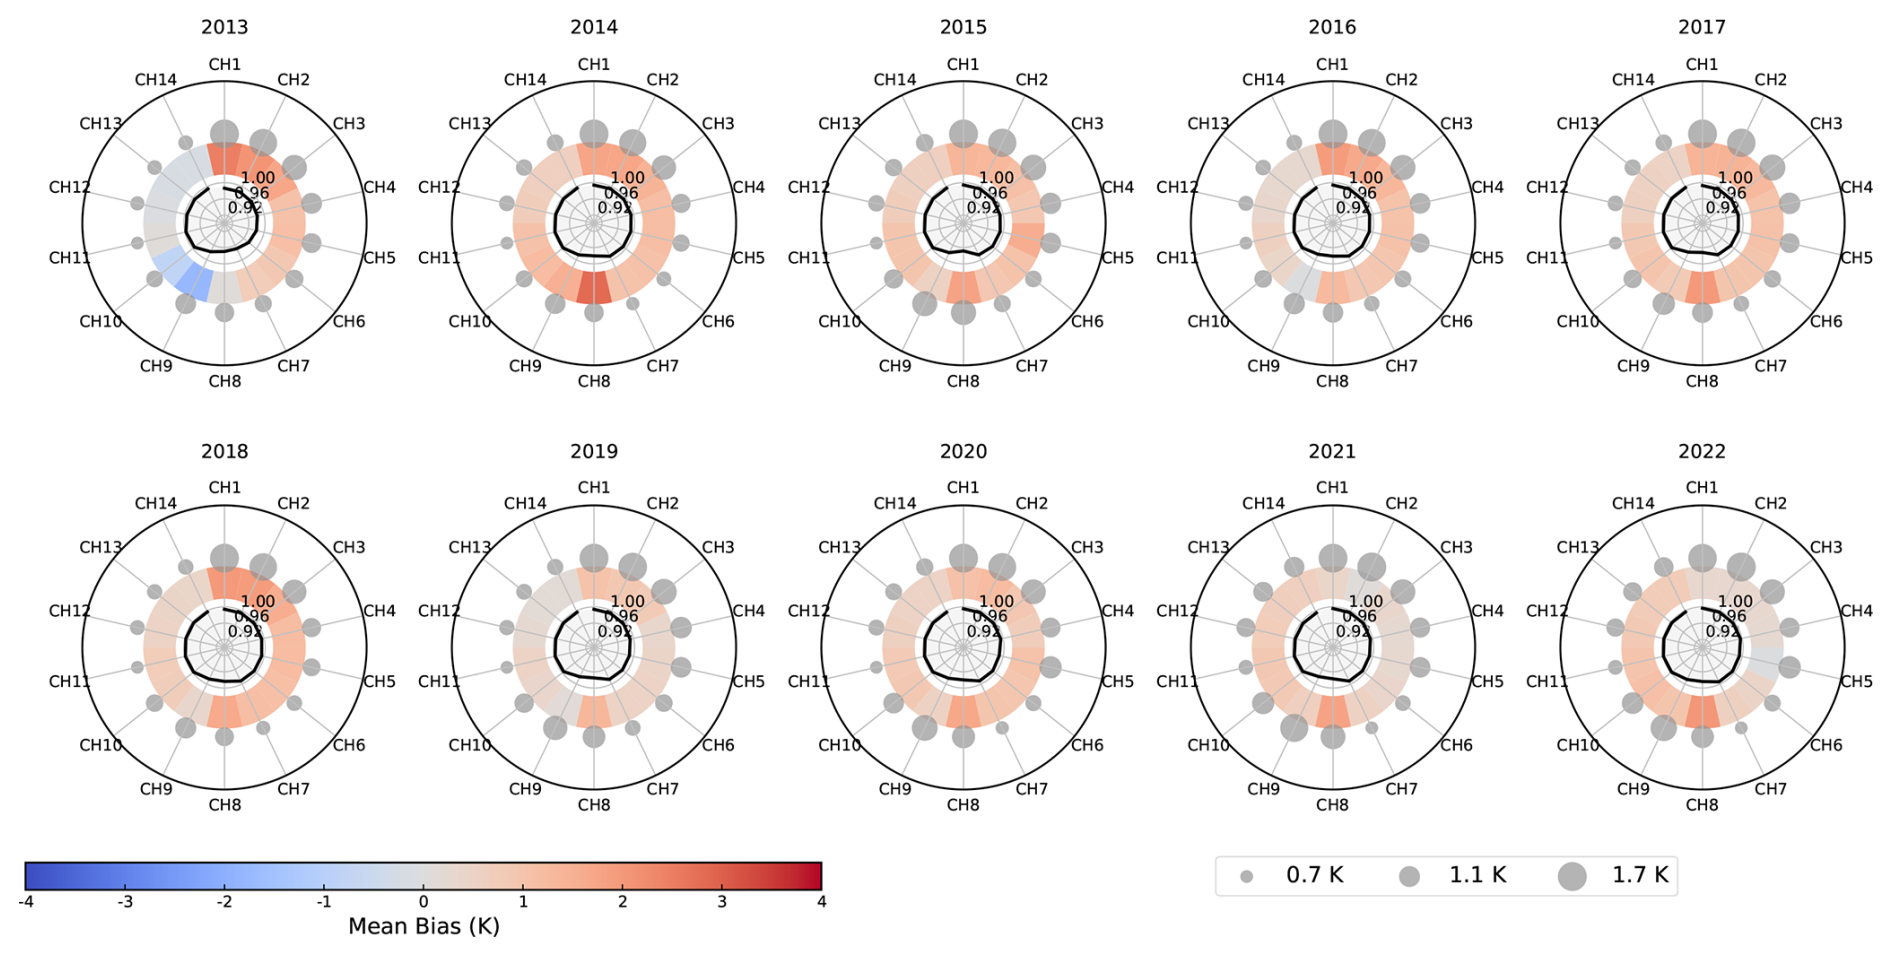
Figure 4Ten-year (2013–2022) polar summary of the agreement between observed and ERA5-simulated brightness temperatures for all 14 channels. Each subplot shows one year, with the inner black solid curve representing the R, the middle colour shaded ring indicating the mean bias, and the circle marker sizes in the outer ring representing the standard deviation of differences. The bottom horizontal colorbar denotes the bias scale, and the adjacent legend explains the marker sizes for standard deviation.
Overall, the 2013–2022 evaluation of the MWR TBs using MWRT simulations confirms the instrument's long-term stability and the reliability of its measurements. Based on this foundation, a multi-parameter dataset was constructed by integrating the quality-controlled, weather-classified, minute-resolution, multi-channel TB observations with corresponding IRTs, and manufacturer-provided CBHs, IWV and LWP. It should be noted that CBHs, IWV and LWP are standard products retrieved by the instrument's built-in software. No additional LWP offset correction was performed.
3.3 Retrieval and evaluation of atmospheric temperature and humidity profiles
Based on the dataset constructed in Sect. 3.1, together with radiosonde and ERA5 reanalysis data providing vertical atmospheric information, retrieval algorithms for atmospheric temperature and humidity profiles were developed under different weather conditions. For these retrievals, we defined a customized, irregularly spaced vertical grid of 35 layers. While this configuration generally follows the standard 39-layer design of the RPG-LV2 product, we modified the near-surface levels (below 150 m) to a uniform 50 m resolution (i.e., 0, 50, 100, and 150 m) to suit our specific retrieval design. As discussed in Sect. 1, the justification for this condition-dependent strategy is rooted in the varying physical complexities of microwave radiative transfer. Under clear-sky conditions, the physically based OE method is preferred as it ensures high thermodynamic consistency and avoids potential empirical overfitting. Conversely, for cloudy-sky conditions, a data-driven DNN is utilized to handle the complex non-linear scattering effects of clouds, which typically introduce significant uncertainties in traditional forward models.
3.3.1 Optimal Estimation (OE) method
The OE method is grounded in Bayesian theory (Rodgers, 2000), which can be expressed as:
where P(y|x) represents the likelihood function describing uncertainties in the measurement process and forward model, P(x) defines the prior probability distribution of the atmospheric state, and P(y) is a normalization factor ensuring that the posterior probability integrates to one. The posterior probability P(x|y) thus quantifies the likelihood of a given atmospheric state x given the observation y.
In this study, the prior dataset for the OE retrieval was constructed using radiosonde profiles from the Beijing station during 2016–2019. The station, located approximately 50 km from XH, provides vertical profiles of atmospheric pressure, temperature, and humidity twice daily (around 08:00 and 20:00 local time). These radiosonde observations were used to construct the prior mean state and covariance matrix required in the OE framework and also serve as an independent reference for evaluating the retrieval accuracy.
In the OE framework, a forward operator is required to simulate TBs from a given atmospheric state. For the clear-sky retrievals, we utilized the non-scattering microwave radiative transfer model (nonScatMWRadTran; Löhnert and Crewell, 2003). Gas absorption follows Rosenkranz (1998), with updates to the 22.235 GHz water vapor line width (Liljegren et al., 2005) and continuum absorption (Turner et al., 2009). Since liquid water scattering is negligible under clear-sky conditions (screened via strict LWP thresholds), this non-scattering assumption is physically appropriate.
To evaluate the applicability of nonScatMWRadTran, we benchmarked it against the MWRT model (Liu, 1998), which has been previously validated against line-by-line simulations for XH observations (Zou et al., 2021), making it a highly reliable baseline. Using 212 collocated radiosonde profiles, the two models showed excellent agreement, with RMSEs below 0.12 K (R>0.9999) for the O2 channels (51–58 GHz) and below 1.5 K (R>0.9992) for the WV channels (22–31 GHz).
Because OE retrieval requires repeated forward-model evaluations for Jacobian estimation, computational efficiency is critical for long-term processing. Given the 34-element state vector, each OE iteration requires 2N+1 forward-model evaluations. Compared with MWRT, the in-process implementation of nonScatMWRadTran substantially reduces retrieval time while maintaining comparable simulation accuracy.
To configure the OE retrieval setup, the state vector comprises atmospheric temperature and humidity profiles. To ensure structural consistency with the operational RPG-LV2 product and facilitate comparative analyses, the OE retrieval adopts the 34-layer vertical grid (up to 10 km), resulting in a 68-element state vector including temperature and log10-transformed specific humidity profiles. Additionally, the surface meteorological observations (surface temperature and humidity) are incorporated as the bottom layer, yielding a final dataset with 35 vertical levels (the surface level plus the 34 retrieval layers). It is important to note that the passive nature of ground-based microwave radiometry dictates that the vertical information content is most abundant in the lower troposphere. Consequently, the retrieval sensitivity is highest within the boundary layer (0–2 km) and decreases with altitude (Fu et al., 2026). Furthermore, the total effective observation error covariance matrix (Se) is constructed as a diagonal matrix, assuming uncorrelated observation errors among channels. In this setup, the diagonal elements represent the total effective observation variance, which comprehensively accounts for instrumental thermal noise, calibration uncertainties, and forward-model errors. Based on the clear-sky observation-minus-simulation (O-B) residual statistics and the quality assessment of TBs detailed in Sect. 3.2.2, the prescribed observation error standard deviations (the square root of the diagonal elements of Se) were specified as 2.0, 2.2, 1.8, 1.3, 1.4, 1.0, and 1.0 K for the seven K-band water vapor channels (22.24–31.40 GHz), and 1.5, 1.7, 1.2, 0.8, 1.0, 1.0, and 1.0 K for the seven V-band oxygen channels (51.26–58.00 GHz), respectively. In addition, the background error covariance matrix (Sa) was constructed separately for each season (DJF, MAM, JJA, and SON) using long-term statistics derived from collocated radiosonde observations during 2016–2019.
3.3.2 Deep Neural Network (DNN) method
DNNs have been widely applied in remote sensing retrievals. Common neural network architectures include the backpropagation (BP) network, convolutional neural network (CNN), and recurrent neural network (RNN) (Guo et al., 2021; Malmgren-Hansen et al., 2019; Zhao et al., 2018). Among these, the BP neural network is well suited for nonlinear regression problems, as it can approximate complex functions without explicitly constructing a physical forward model. While a standard BP network typically includes only a single hidden layer, a DNN extends this structure by stacking multiple hidden layers, enhancing feature extraction and nonlinear representation capabilities.
A typical DNN consists of an input layer, multiple hidden layers, and an output layer. Each neuron in the input layer represents a feature (in this case, one microwave channel), and neurons in the hidden layers apply weighted transformations followed by nonlinear activation functions. The network is trained via forward and backward propagation, and regularization techniques such as Dropout are employed to prevent overfitting.
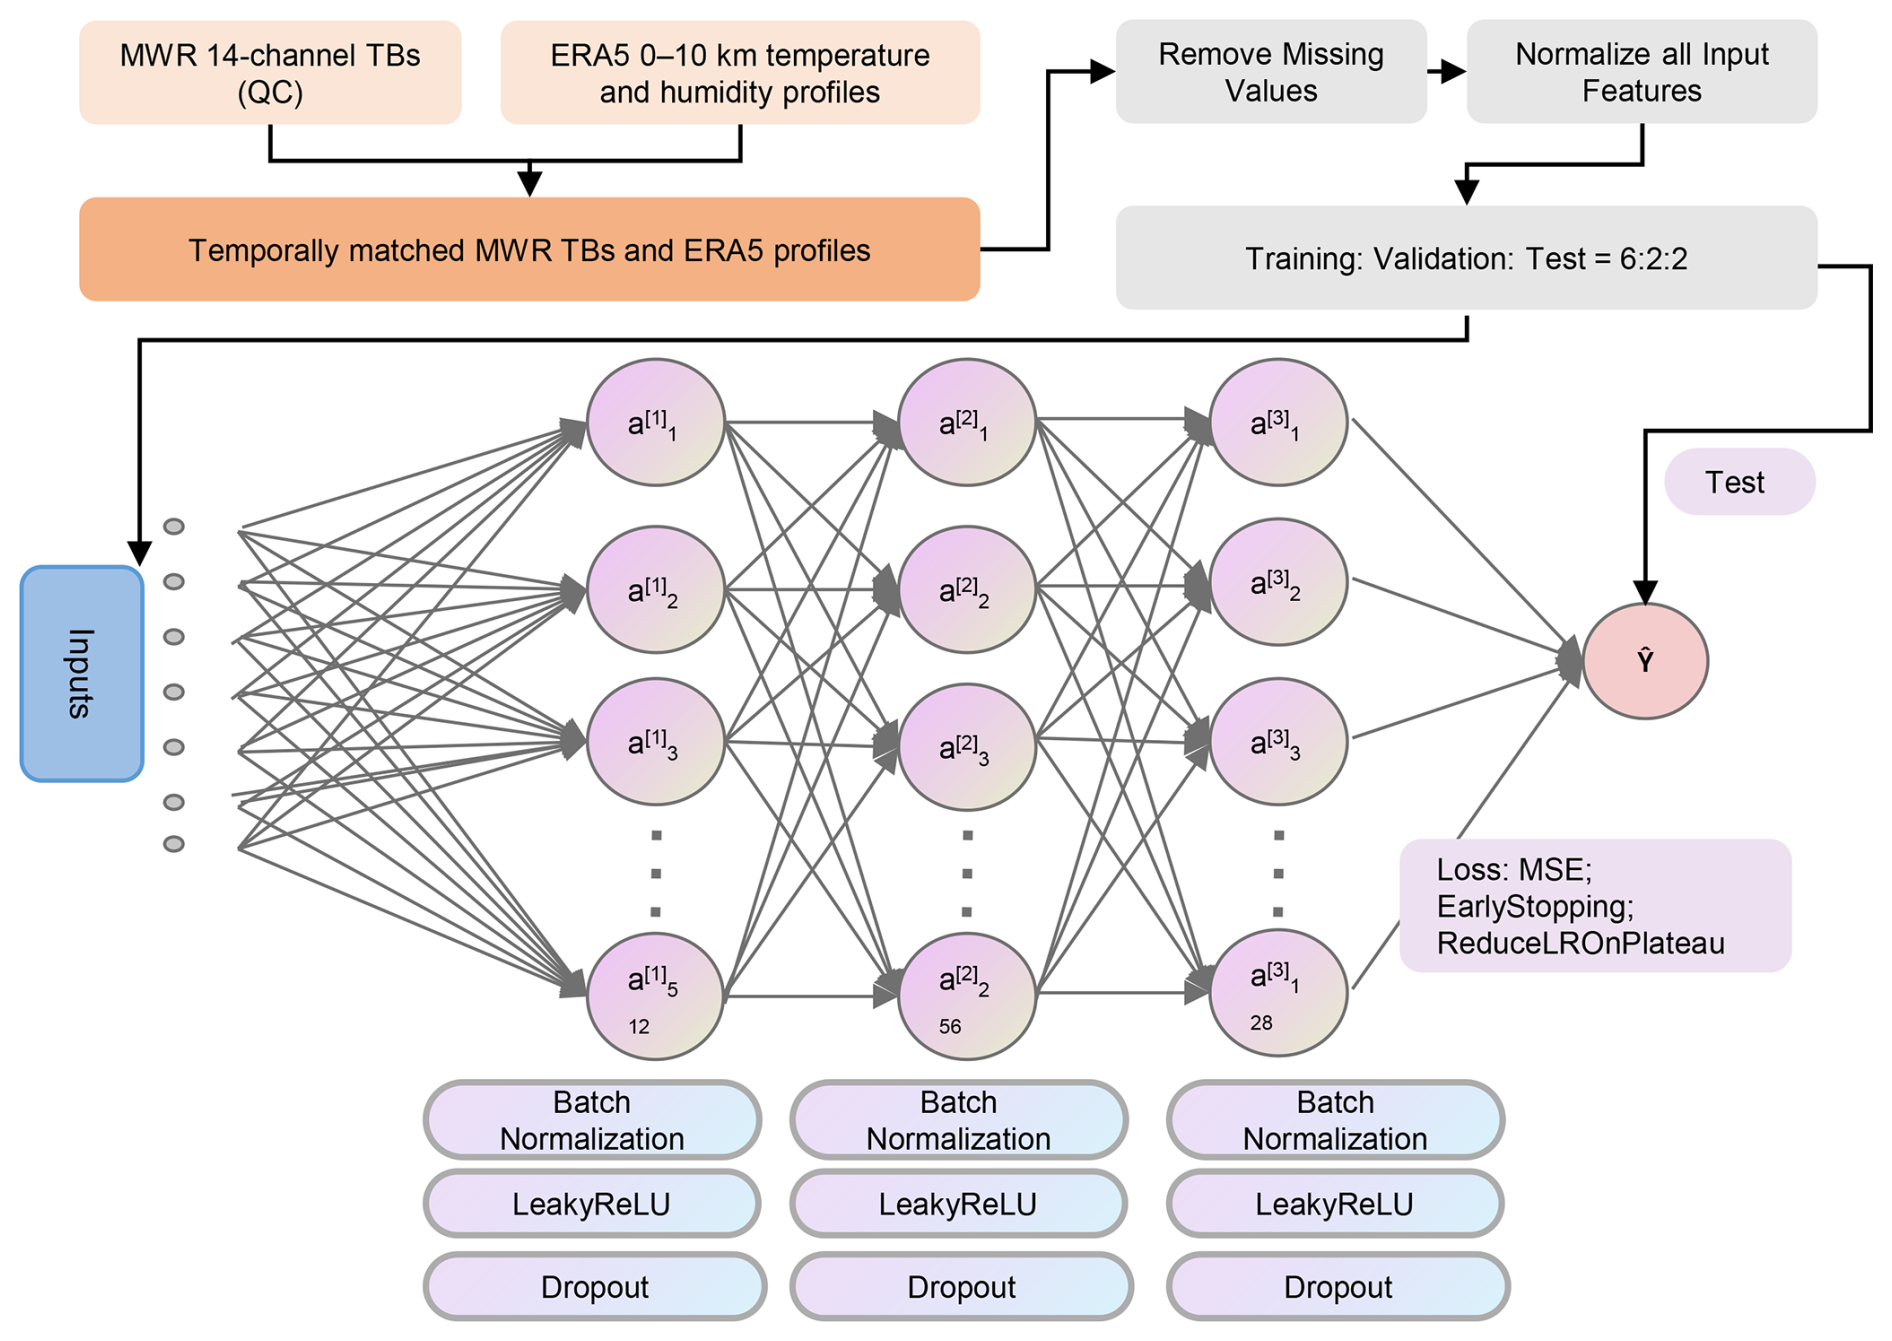
In this study, a DNN-based retrieval model was developed for MWR profile retrieval (Fig. 5). The input comprises 14-channel TBs, and the output corresponds to temperature and humidity profiles from 0–10 km. The training dataset was constructed using temporally matched actual MWR TB observations from 2019 and corresponding ERA5 temperature and humidity profiles as targets. Utilizing observed TBs rather than forward-simulated TBs allows the empirical model to inherently account for real-world instrumental noise and site-specific measurement characteristics. Furthermore, restricting the training dataset to a single representative year (capturing a full seasonal cycle) was a deliberate strategy. It ensures that the subsequent application of this model to the remaining 9 years of the decadal dataset serves as a strictly independent temporal evaluation, thereby rigorously demonstrating the model's true generalizability and the instrument's long-term stability. After removing missing values, all input features were normalized to ensure consistent data scaling. The dataset was randomly divided into training, validation, and test sets in a 6 : 2 : 2 ratio to maintain both randomness and reproducibility. The DNN architecture consists of three hidden layers, each using the LeakyReLU activation function and batch normalization to enhance nonlinearity and accelerate convergence. Dropout regularization was applied to each hidden layer to prevent overfitting, while a linear activation was used in the output layer for regression. The model was optimized using the mean squared error (MSE) loss function, with EarlyStopping and ReduceLROnPlateau strategies applied – training was terminated if no improvement was observed for 15 consecutive epochs, and the learning rate was halved if no improvement occurred for 5 epochs.
3.3.3 Quality assessment of retrievals
To quantitatively evaluate retrieval performance, radiosonde-measured temperature and humidity profiles from 2020 were used as the reference “truth”. Both the OE- and DNN-based retrievals, derived from 2020 MWR TB observations, were assessed against these independent profiles. Three statistical metrics were employed: MB, R, and SD. To further quantify improvements relative to the RPG-LV2 operational product, an accuracy improvement rate (Zhang et al., 2020) was introduced, calculated as:
where k is the accuracy improvement rate, is the mean bias of the RPG-LV2 product, calculated as , and is the mean bias of the new model retrieval, . The standard deviations are
where , ; Xmi represents the RPG-LV2 product values, Xri represents the retrieval results from the new model, and Xsi is the reference truth (radiosonde observation or ERA5 data). Here, n is the sample size, with . This evaluation framework enables a direct comparison of the two retrieval approaches (OE and DNN) against both the reference truth and the operational product, thereby quantifying the relative improvement achieved by the proposed methods.
Clear-sky retrieval results
Under clear-sky conditions, multi-channel TB observations from the MWR were used to retrieve atmospheric temperature and humidity profiles using the OE method. To directly evaluate the retrieval performance, the OE-retrieved profiles are compared against radiosonde measurements, rather than relying solely on the manufacturer-provided product. Figure 6 presents a comparison of the RPG-LV2 product and the OE-retrieved profiles against radiosonde measurements in 2020, in terms of MB and RMSE.
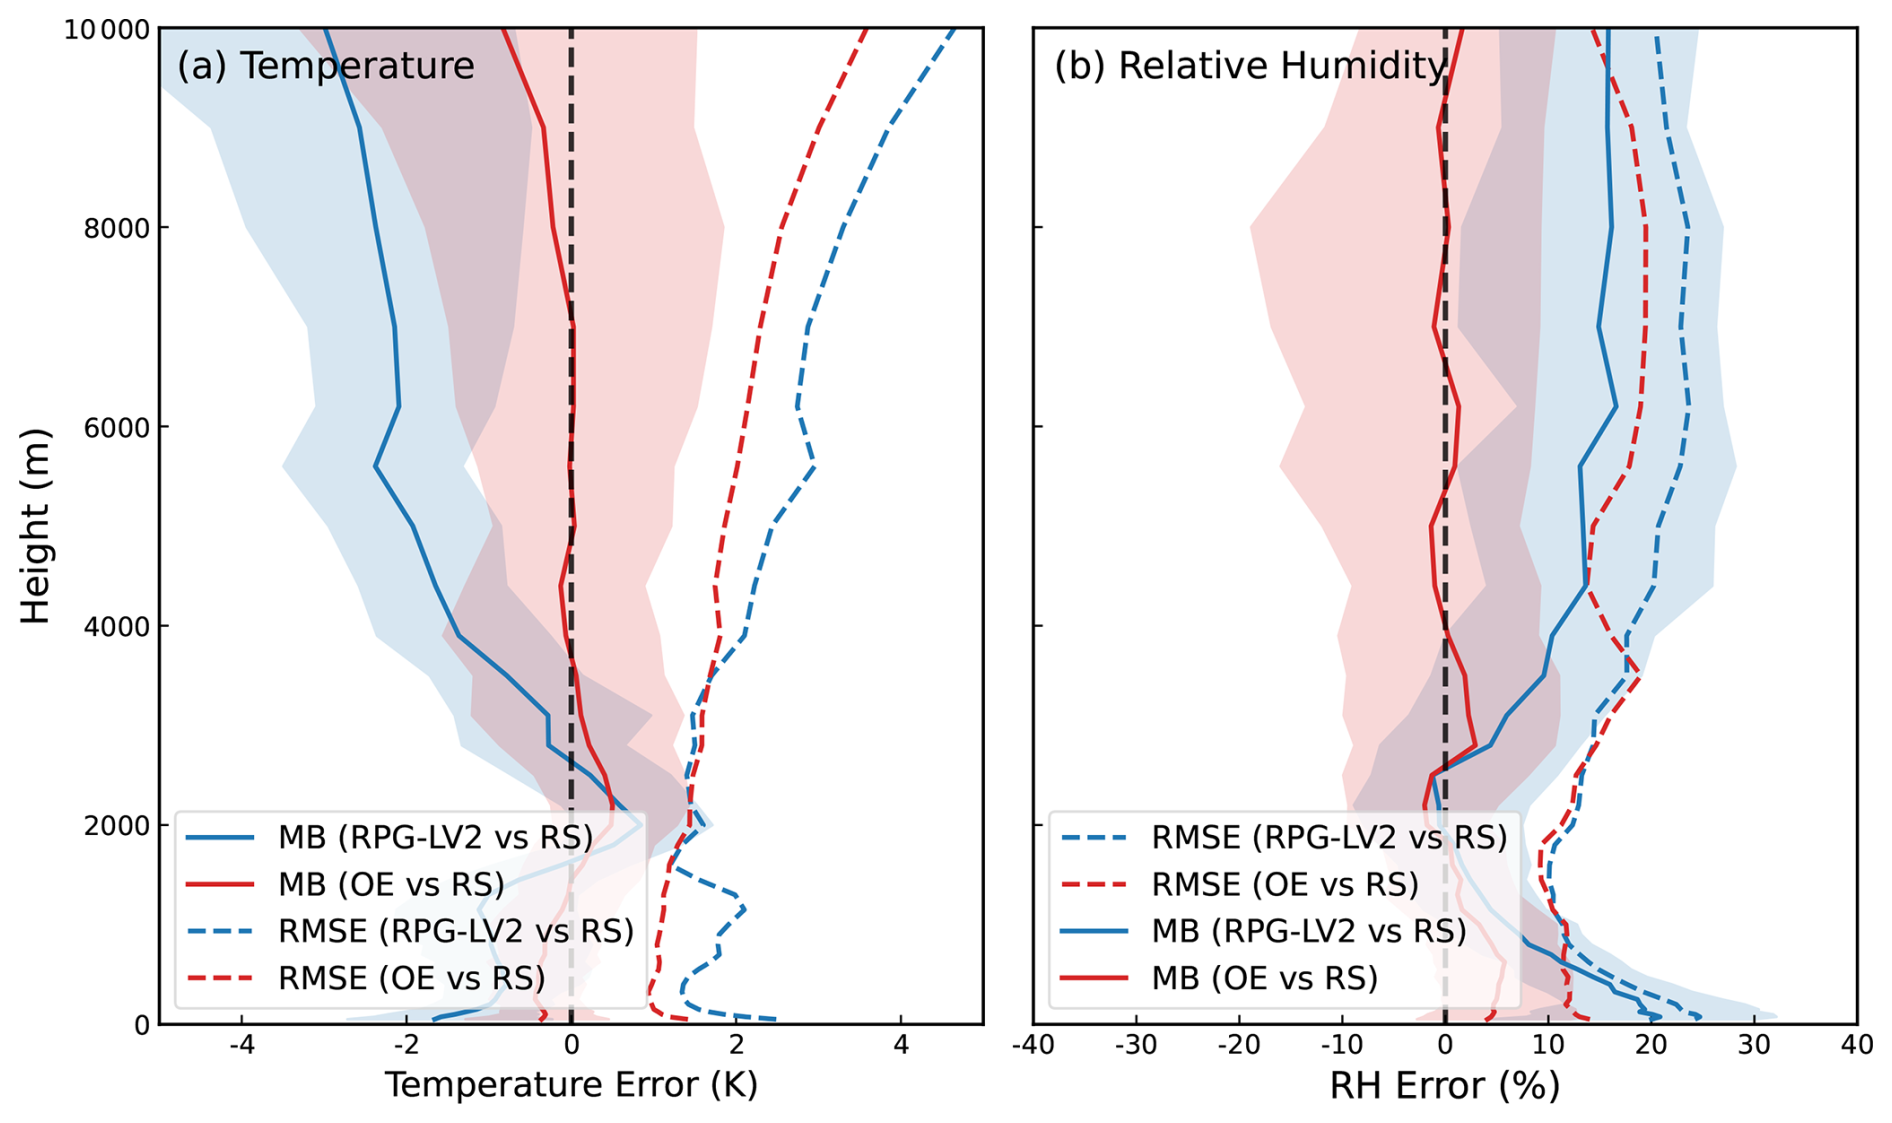
Figure 6Vertical distributions of MB and RMSE for RPG-LV2 and OE retrieved temperature (a) and relative humidity (b) profiles compared with radiosonde profiles (RS) in 2020. Solid lines denote the median MB, dashed lines indicate the mean RMSE. The shaded regions represent the interquartile range (IQR, 25 %–75 %) of difference, reflecting the estimated uncertainty at each level. A vertical dashed black line marks the zero-bias reference.
For temperature (Fig. 6a), the OE retrievals demonstrate consistently superior performance compared with the RPG-LV2 product across the full 0–10 km layer. The mean bias of OE-retrieved temperature relative to radiosonde data ranges from −0.83 to 0.50 K, while the RMSE varies from 0.96 to 3.56 K, increasing gradually with altitude and reaching its maximum at 10 km. For relative humidity (Fig. 6b), the OE retrievals also outperform the RPG-LV2 results across all altitudes, with mean biases between −6 % and 6 % and RMSE values ranging from 9 % to 20 %. These results indicate that the OE method provides physically consistent and robust retrievals under clear-sky conditions, where radiative transfer assumptions are well satisfied.
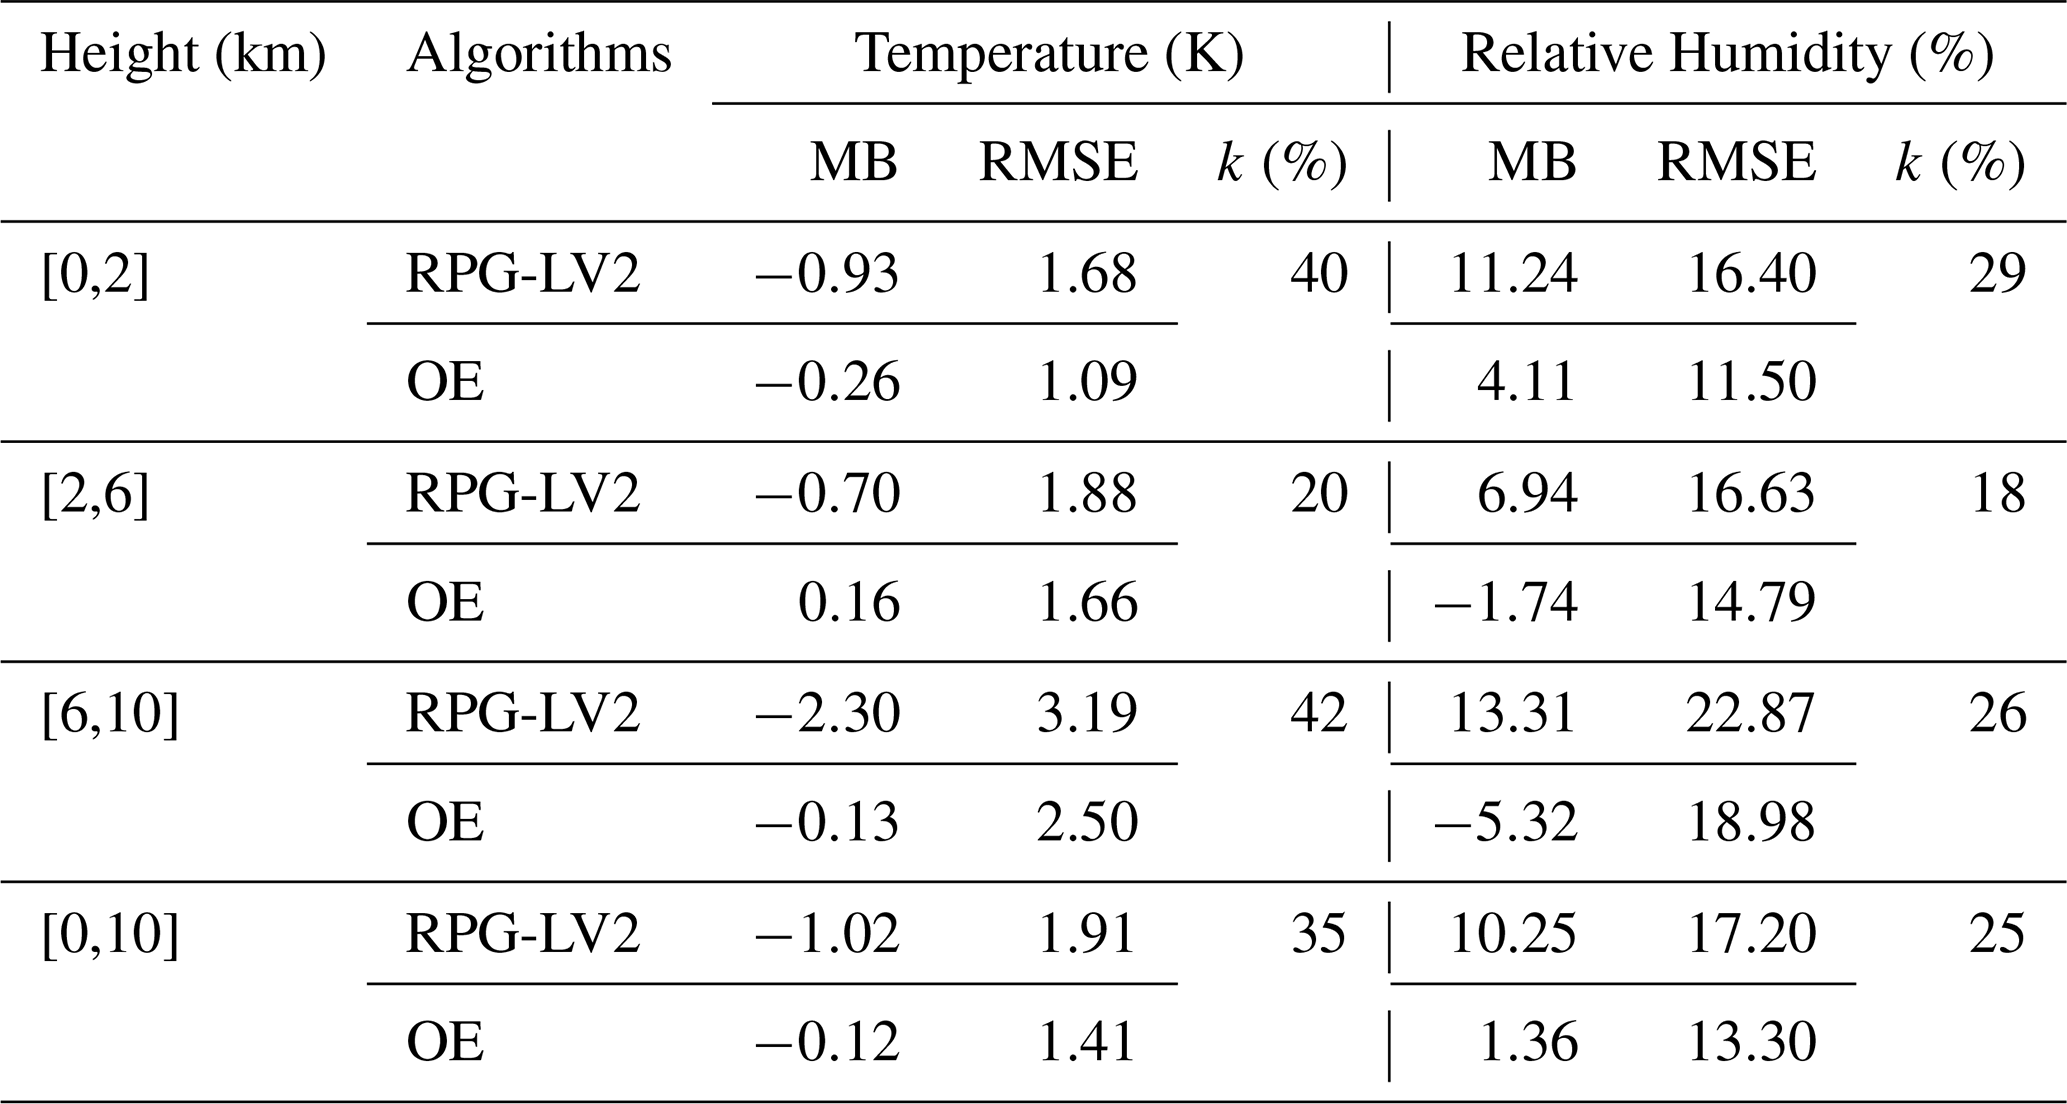
Further statistical analyses were conducted to quantify the differences between the retrieved profiles and radiosonde measurements across different altitude ranges, as well as to evaluate the accuracy improvement of the OE retrieval relative to the RPG-LV2 product (Table 2). Across all four altitude intervals ([0–2], [2–6], [6–10], and [0–10] km), the OE retrievals exhibit consistently higher accuracy. Over the full 0–10 km layer, the OE retrieval achieves a 35 % improvement in temperature accuracy relative to RPG-LV2, with particularly notable gains of up to 40 % within both the near-surface (0–2 km) and upper-tropospheric (6–10 km) layers. For relative humidity, the OE retrieval achieves a 25 % accuracy improvement over the full profile, with the highest enhancement (29 %) observed near the surface (0–2 km). These results confirm the robustness of the OE method under clear-sky conditions and highlight its capability to effectively reduce systematic biases in both temperature and humidity retrievals.
Table 2Statistics of MB, RMSE, and accuracy improvement rate k (%) of temperature and relative humidity profiles retrieved by RPG-LV2 and OE algorithms compared with radiosonde data across different altitude ranges.
Cloud-sky retrieval results
Similarly, under cloudy-sky conditions, multichannel MWR TBs at XH were used as input to the DNN-based retrieval model to obtain atmospheric temperature and humidity profiles. Given that cloud contamination violates the assumptions of traditional radiative transfer inversion, the DNN retrieval is directly evaluated against radiosonde observations to assess its capability under all-sky conditions. Figure 7 compares the DNN-retrieved profiles, RPG-LV2 product against radiosonde observations in 2020 in terms of MB and RMSE.
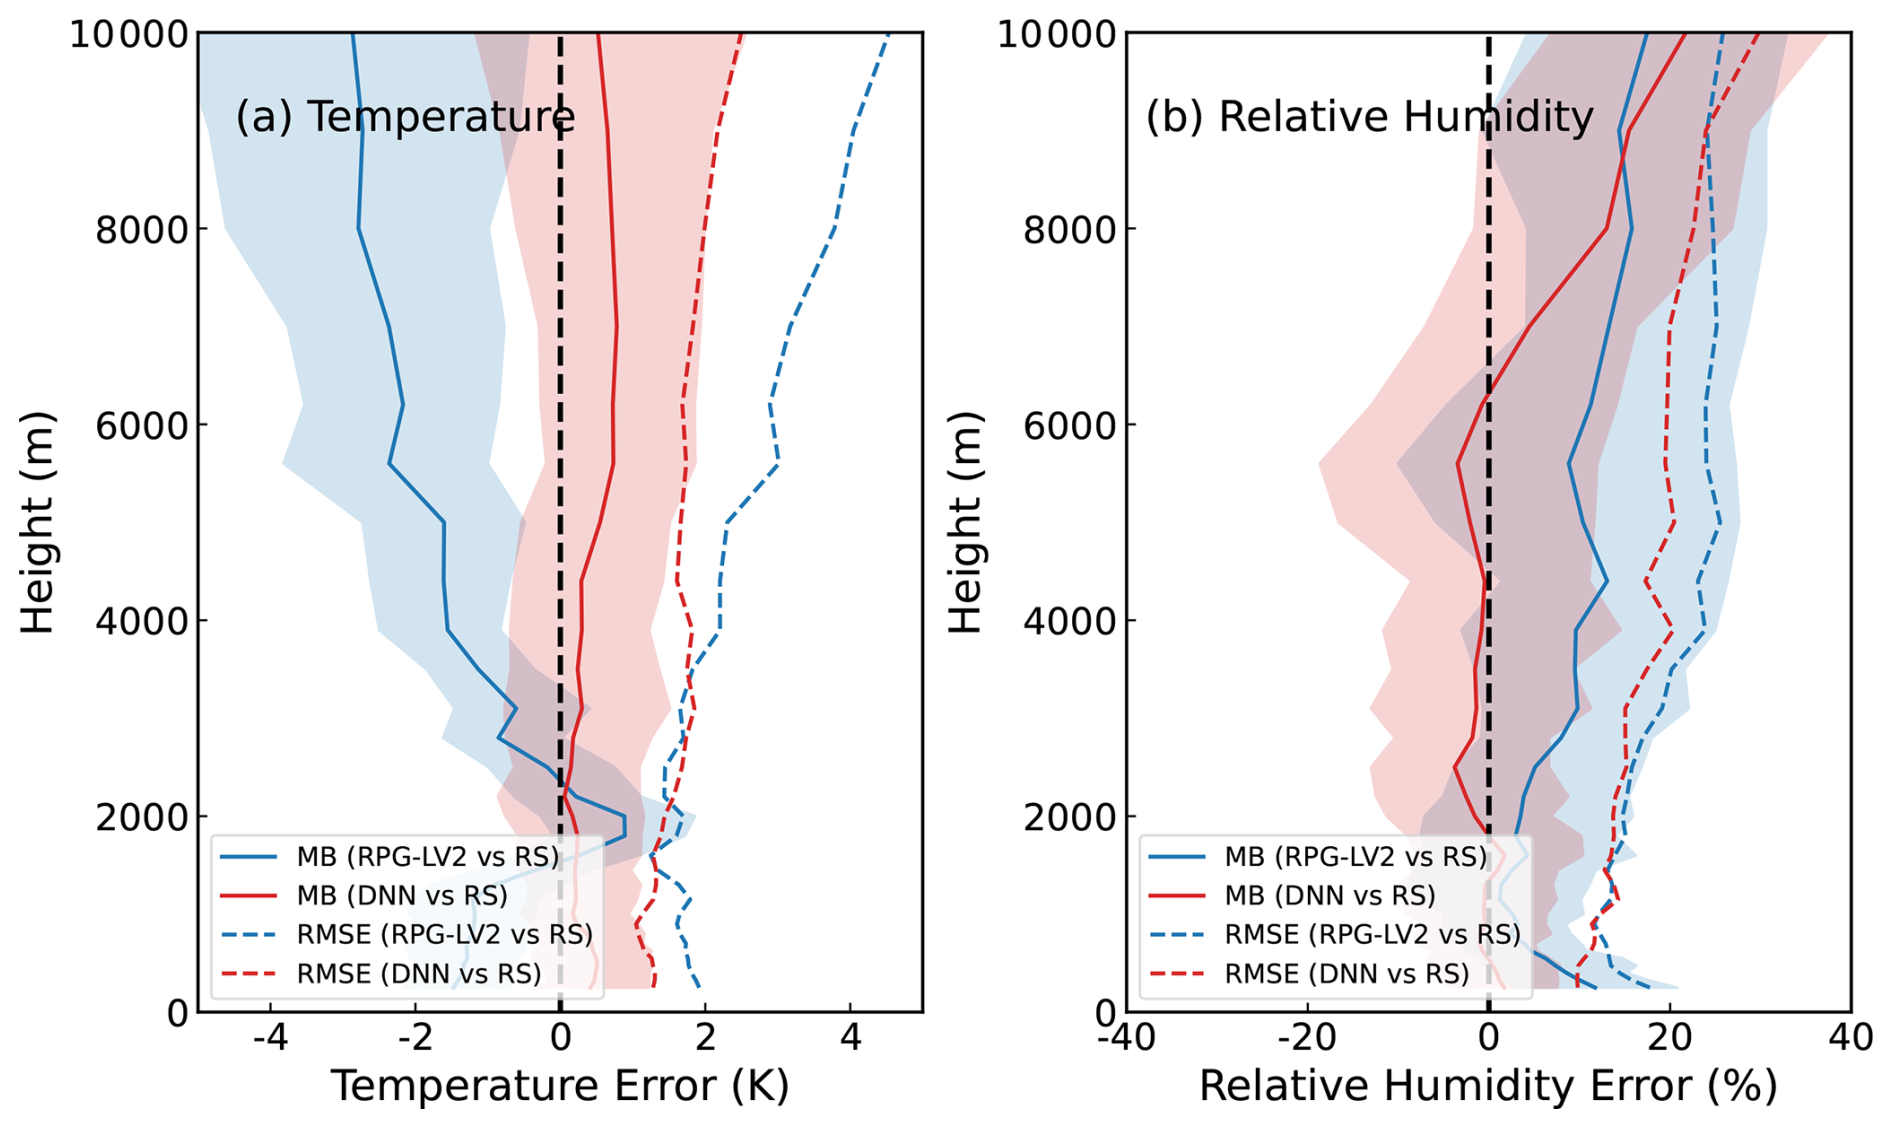
The DNN-retrieved temperature profiles exhibit markedly reduced mean biases across the entire altitude range compared to the RPG-LV2 results, with the overall mean bias of 0.38 K. The corresponding RMSE is significantly lower, particularly within the near-surface layer (below 2 km) and the mid-to-upper troposphere (above 4 km), typically ranging between 1 and 3.5 K. For relative humidity, the DNN retrievals also outperform the RPG-LV2 product throughout the entire 0–10 km range. Although both MB and RMSE increase with altitude, the mean bias remains within ±5 % below 6 km and reaches its maximum near 10 km. These results demonstrate that the DNN model effectively captures the nonlinear relationships between TB observations and atmospheric state variables.
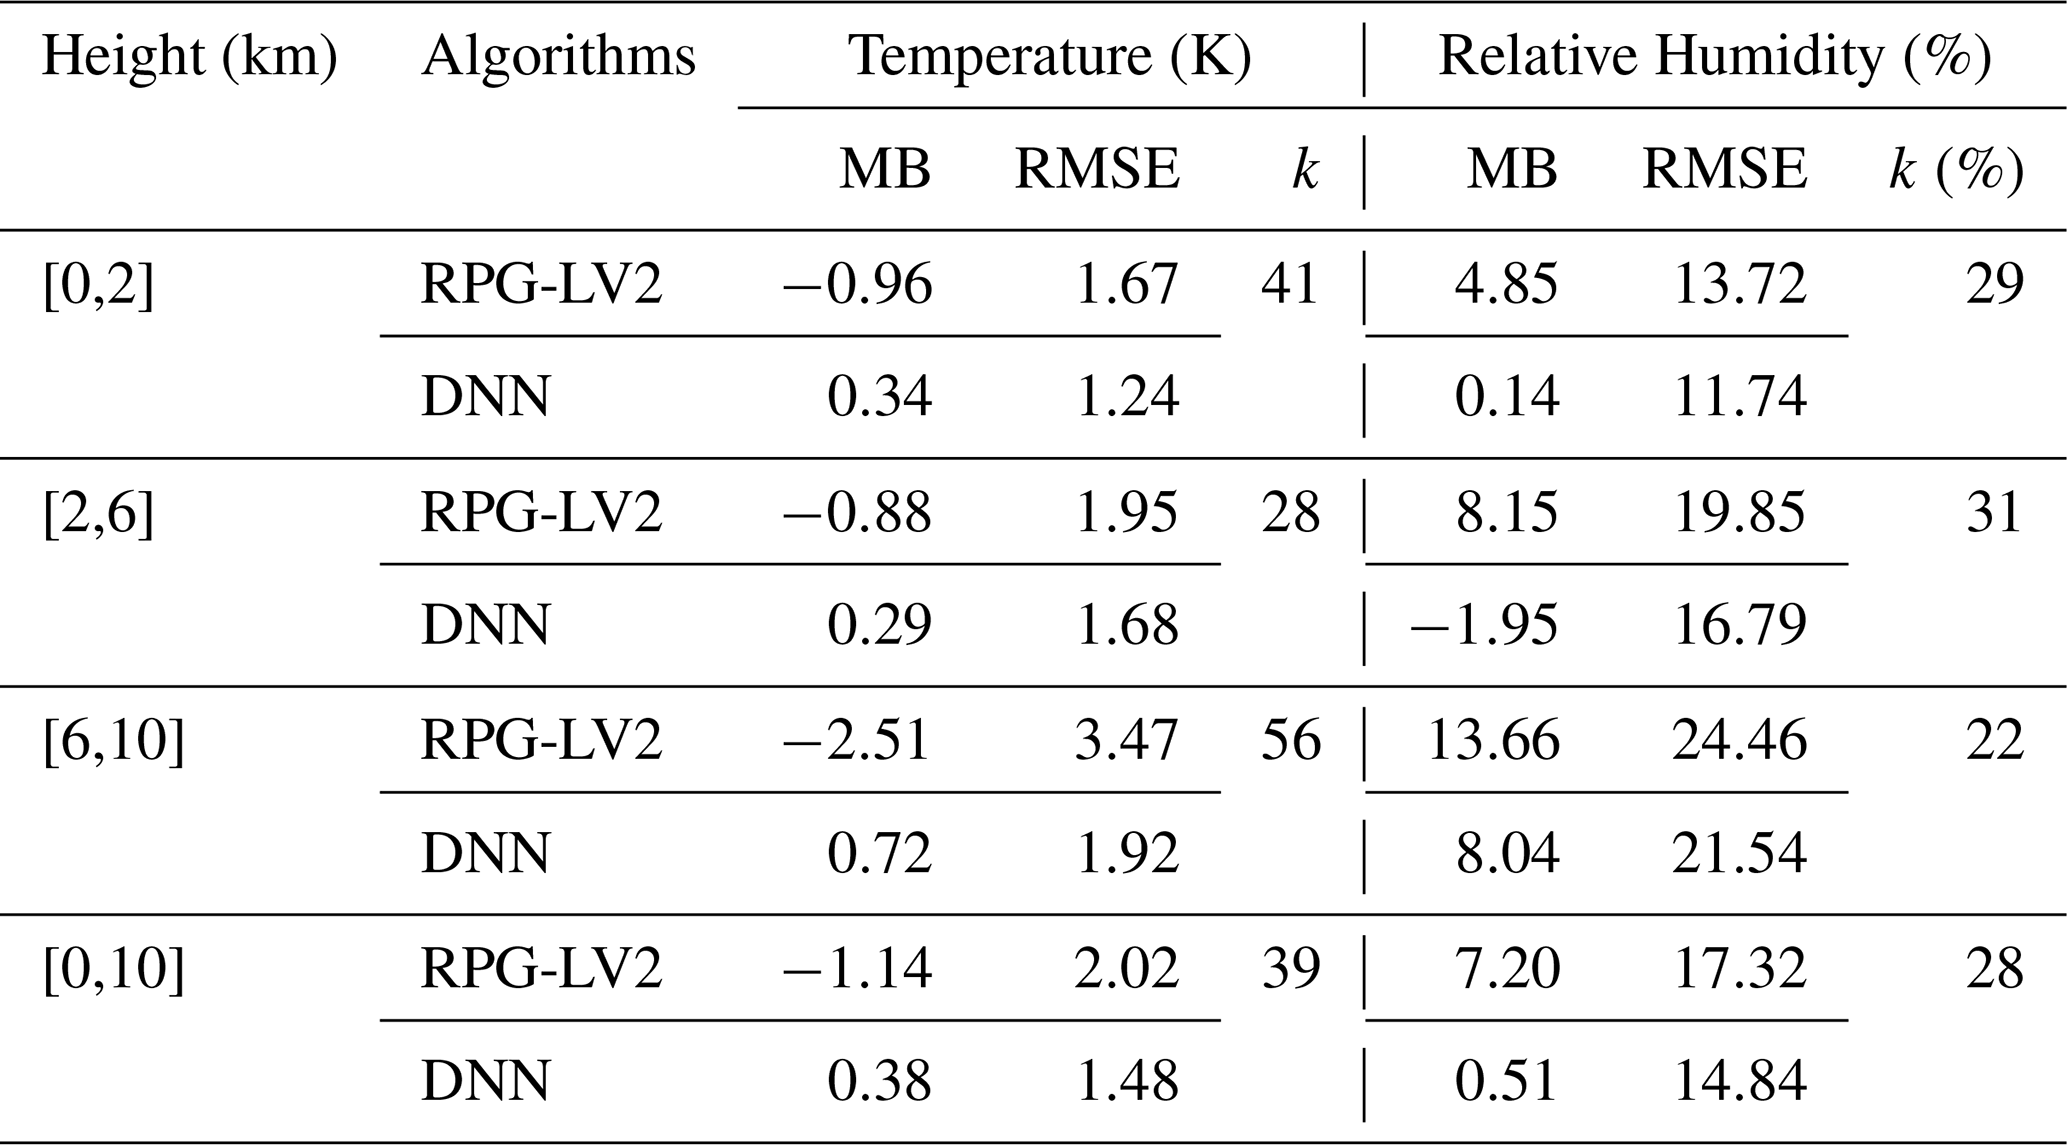
Table 3 summarizes the MB and RMSE values of the DNN and RPG-LV2 retrievals relative to radiosonde profiles across different altitude ranges, along with the accuracy improvement rates of the DNN retrievals. Overall, the DNN model yields systematically lower MB and RMSE values than the RPG-LV2 product across all layers, indicating clear and consistent improvement. For temperature profiles, the DNN retrieval achieves an overall 39 % increase in accuracy over the 0–10 km layer relative to RPG-LV2, with the most pronounced improvements of 41 % in the near-surface layer (<2 km) and 56 % in the mid-to-upper layer (6–10 km). For humidity profiles, the DNN retrieval shows a 28 % overall accuracy improvement, with the highest enhancement (30 %) observed in the 0–6 km range.
Table 3Statistics of MB, RMSE, and accuracy improvement rate k (%) of DNN and RPG-LV2 temperature and humidity profiles compared with radiosonde measurements across different altitude ranges.
From an application perspective, the OE and DNN approaches are employed as complementary rather than competing methods. The physically based OE method performs optimally under clear-sky conditions where forward radiative transfer modelling is highly reliable. Conversely, the DNN model demonstrates enhanced robustness under cloudy conditions by implicitly capturing the complex, nonlinear relationships between TBs and atmospheric states. By applying each method under its respective optimal conditions, this condition-dependent strategy yields retrieval results that are consistently closer to independent radiosonde observations than the generic operational RPG-LV2 product across all sky conditions.
The quality-controlled, minute-level multi-channel MWR TBs with weather classification flags were further matched with manufacturer's IRT, CBHs, IWV and LWP data, forming a multi-parameter dataset spanning approximately 10 years with ∼ 1 min temporal resolution (Gong et al., 2025). Based on the 10-year TB dataset and the two validated retrieval models described in Sect. 3.3, atmospheric temperature and humidity profiles were derived from the XH MWR observations. To improve computational efficiency and meet operational requirements, the 1 min TBs and corresponding retrievals were averaged to 10 min intervals. The final dataset thus provides continuous, quality-controlled MWR TBs (1 min) and derived atmospheric profiles (10 min) with enhanced retrieval accuracy, enabling systematic analyses of the temporal variability of both TBs and atmospheric profiles over the decade-long observation period. It should be noted that a post-retrieval quality check was applied to the derived profiles to ensure physical rationality, such as strictly bounding the relative humidity between 0 % and 100 %.
To ensure a meaningful interpretation of the decadal atmospheric characteristics, the statistical analyses in this section are categorized based on sky conditions and retrieval methods. Specifically, the seasonal diurnal variations and boundary layer inversion analyses (Sect. 4.2 and 4.3) utilize the merged high-resolution dataset (combining OE for clear-sky and DNN for cloudy-sky periods) to provide a continuous and comprehensive representation of the XH atmospheric state.
4.1 Availability of observed brightness temperature
To clearly reflect the availability of MWR TB samples before and after quality control, Table 4 summarizes the total number of samples from 2013–2022, as well as the number and proportion of samples remaining after QC. Specifically, the remaining “available” sample encompasses all data not flagged as instrumental errors (nflag ≠ 3). The proportion indicates the ratio of these available samples out of the total recorded observations. It can be seen that data for 2013, 2014, and 2017 were relatively incomplete, primarily due to initial unfamiliarity with the instrument and delayed maintenance. Overall, except for 2017, the usable data rate of MWR TBs over the past decade was approximately 90 %, indicating good operational stability of the instrument over long-term deployment.
Table 4Total number of observed TB samples, available samples after QC, and their proportions from 2013 to 2022 at XH.
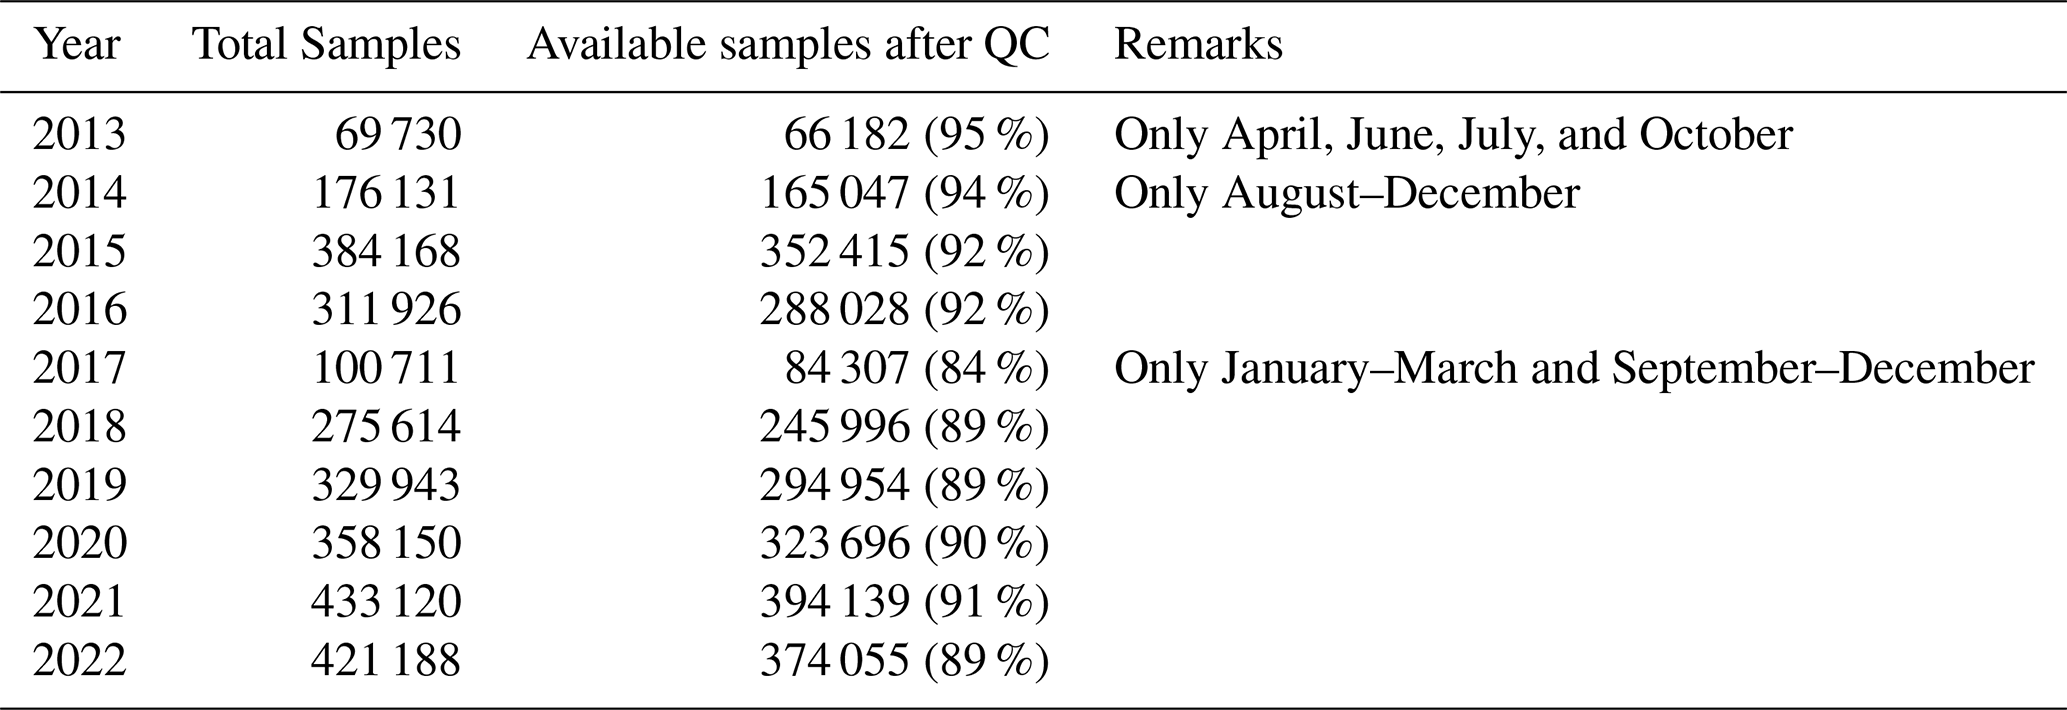
Figure 8 further illustrates the distribution of the comprehensive identifier nflag for ground-based MWR data at XH (0 = clear sky; 1 = cloudy; 2 = precipitation; 3 = uncertain samples). First, in 2013, half of the observations were concentrated in June and July, resulting in a noticeably lower frequency of clear-sky conditions compared to other years, while the proportions of cloudy and precipitation conditions were relatively higher, particularly the precipitation frequency, which was significantly above that of other years. This is primarily a sampling artifact; as noted in Table 4, the 2013 dataset was predominantly collected during June and July, which coincide with the peak of the East Asian Summer Monsoon (EASM), a period characterized by frequent convective activity and the highest rainfall of the year in North China.
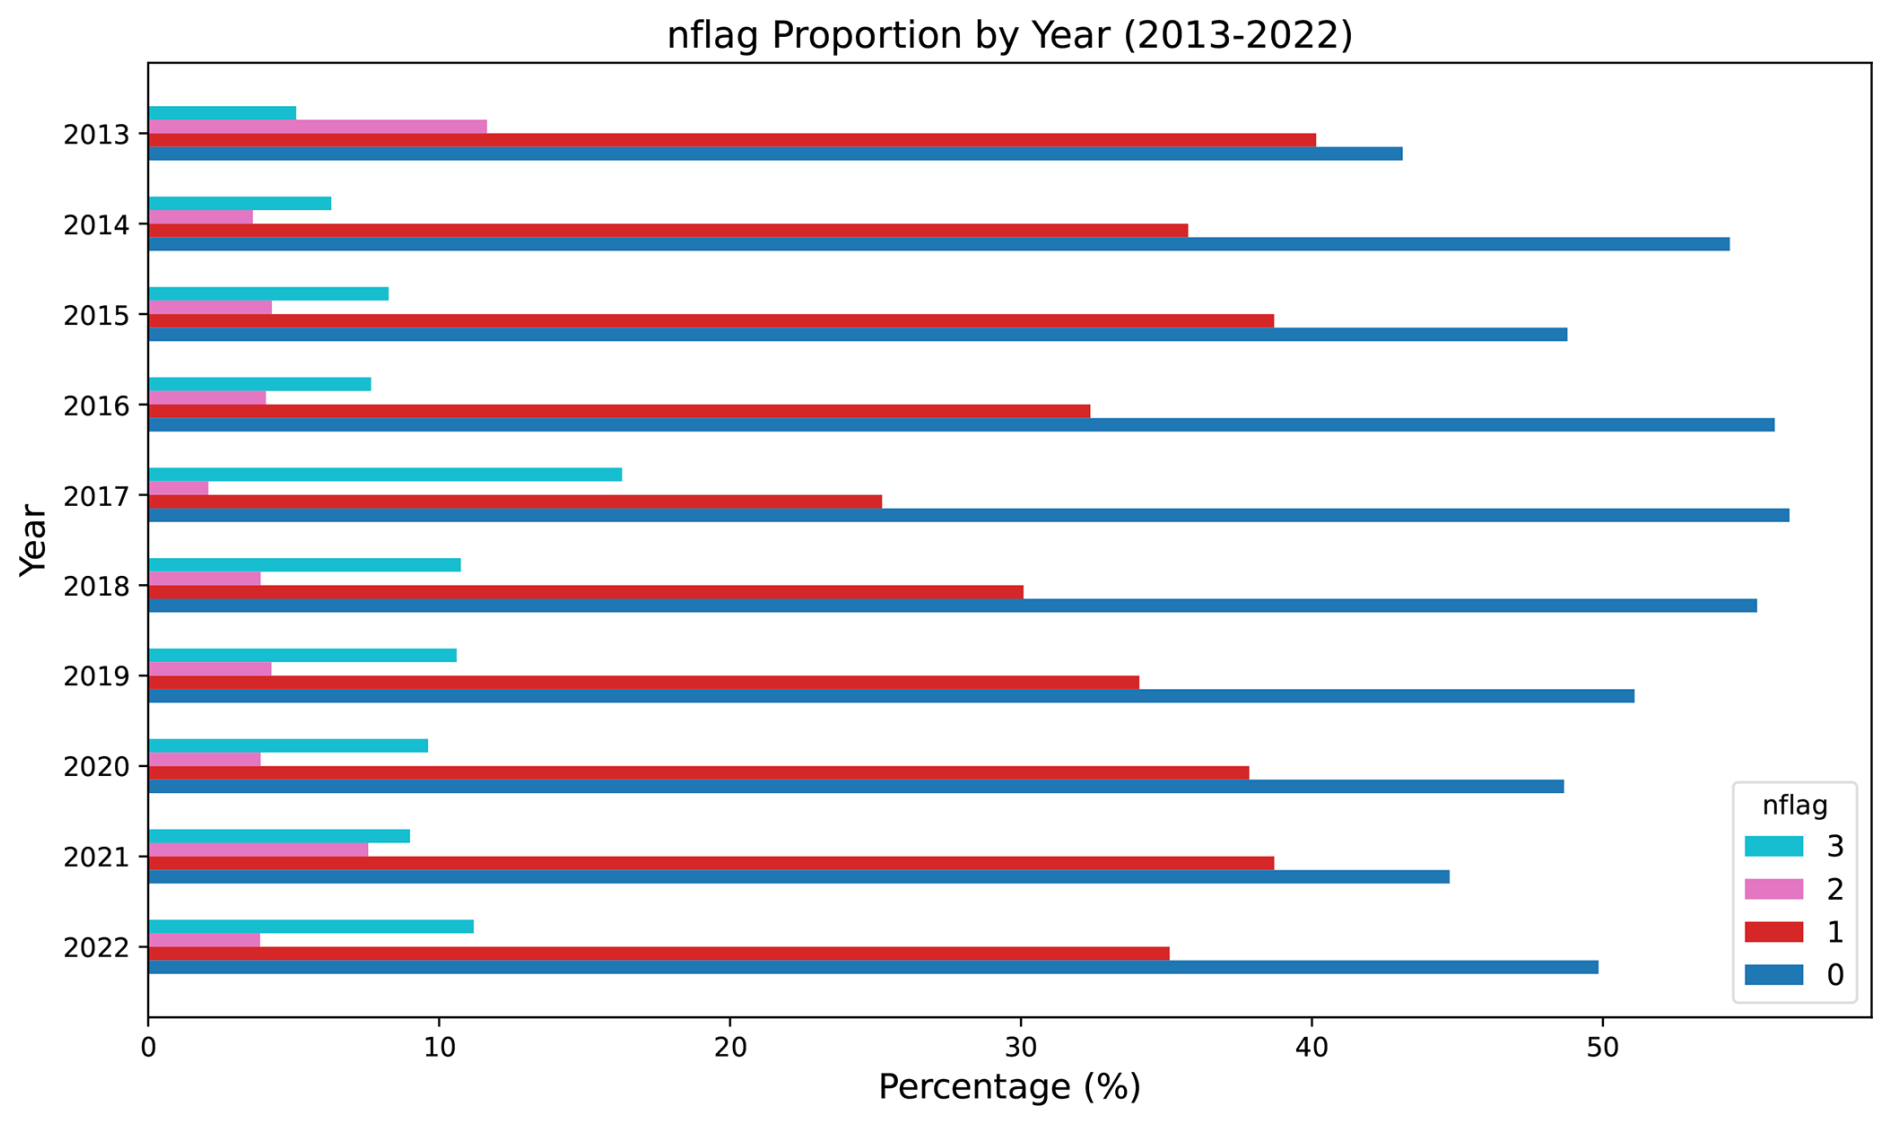
Figure 8Distribution of the comprehensive identifier nflag (0: Clear-sky; 1: Cloudy; 2: Precipitation; 3: uncertain) for ground-based MWR data at XH (2013–2022).
Second, excluding 2013, the frequency of clear-sky occurrences at XH has shown a gradual decline in recent years, especially from 2018 to 2021, when the clear-sky frequency dropped to below 50 %, with the corresponding frequency of cloudy conditions increasing to around 40 %. This trend aligns with recent findings that summertime low-level cloud cover has significantly increased across China over the past two decades. Such an increase is closely associated with regional vegetation greening, which enhances surface evapotranspiration and provides local moisture supply for cloud formation (Zhang et al., 2024a). The occurrence of precipitation, except for the anomalously high value in 2013, remained relatively stable in other years, generally around 5 %. In addition, uncertain samples have been consistently controlled at about 10 %, except in 2017, where it approached 20 %, likely due to insufficient instrument maintenance or supervision.
4.2 Seasonal and diurnal evolutions of the atmospheric profiles
The seasonal diurnal variations of temperature and relative humidity at XH during 2013–2022 reveal distinct vertical and temporal structures across the atmospheric column up to 4000 m, as illustrated in Fig. 9. The profiles used in this analysis are derived from the merged dataset, which incorporates OE retrievals for clear-sky periods and DNN retrievals for cloudy-sky periods to ensure a continuous and representative diurnal cycle. The upper panels depict temperature profiles, while the lower panels show relative humidity distributions, both averaged hourly in local standard time (LST, UTC+8). Temperature exhibits a pronounced diurnal cycle near the surface, with maximum values typically occurring in the late afternoon (around 14:00–16:00 LST) and minimum values near sunrise (approximately 06:00 LST). This pattern reflects strong solar heating during daytime and radiative cooling at night. The surface warming is most intense in summer, when temperatures exceed 20 °C, whereas winter shows significantly lower surface temperatures and a more stable thermal stratification aloft. A clear lapse rate is observed throughout the day, with the steepest near-surface gradients developing during daytime due to convective mixing and surface heat fluxes. In contrast, nighttime inversion layers form, especially during autumn and winter, indicating reduced turbulent exchange and enhanced stability.
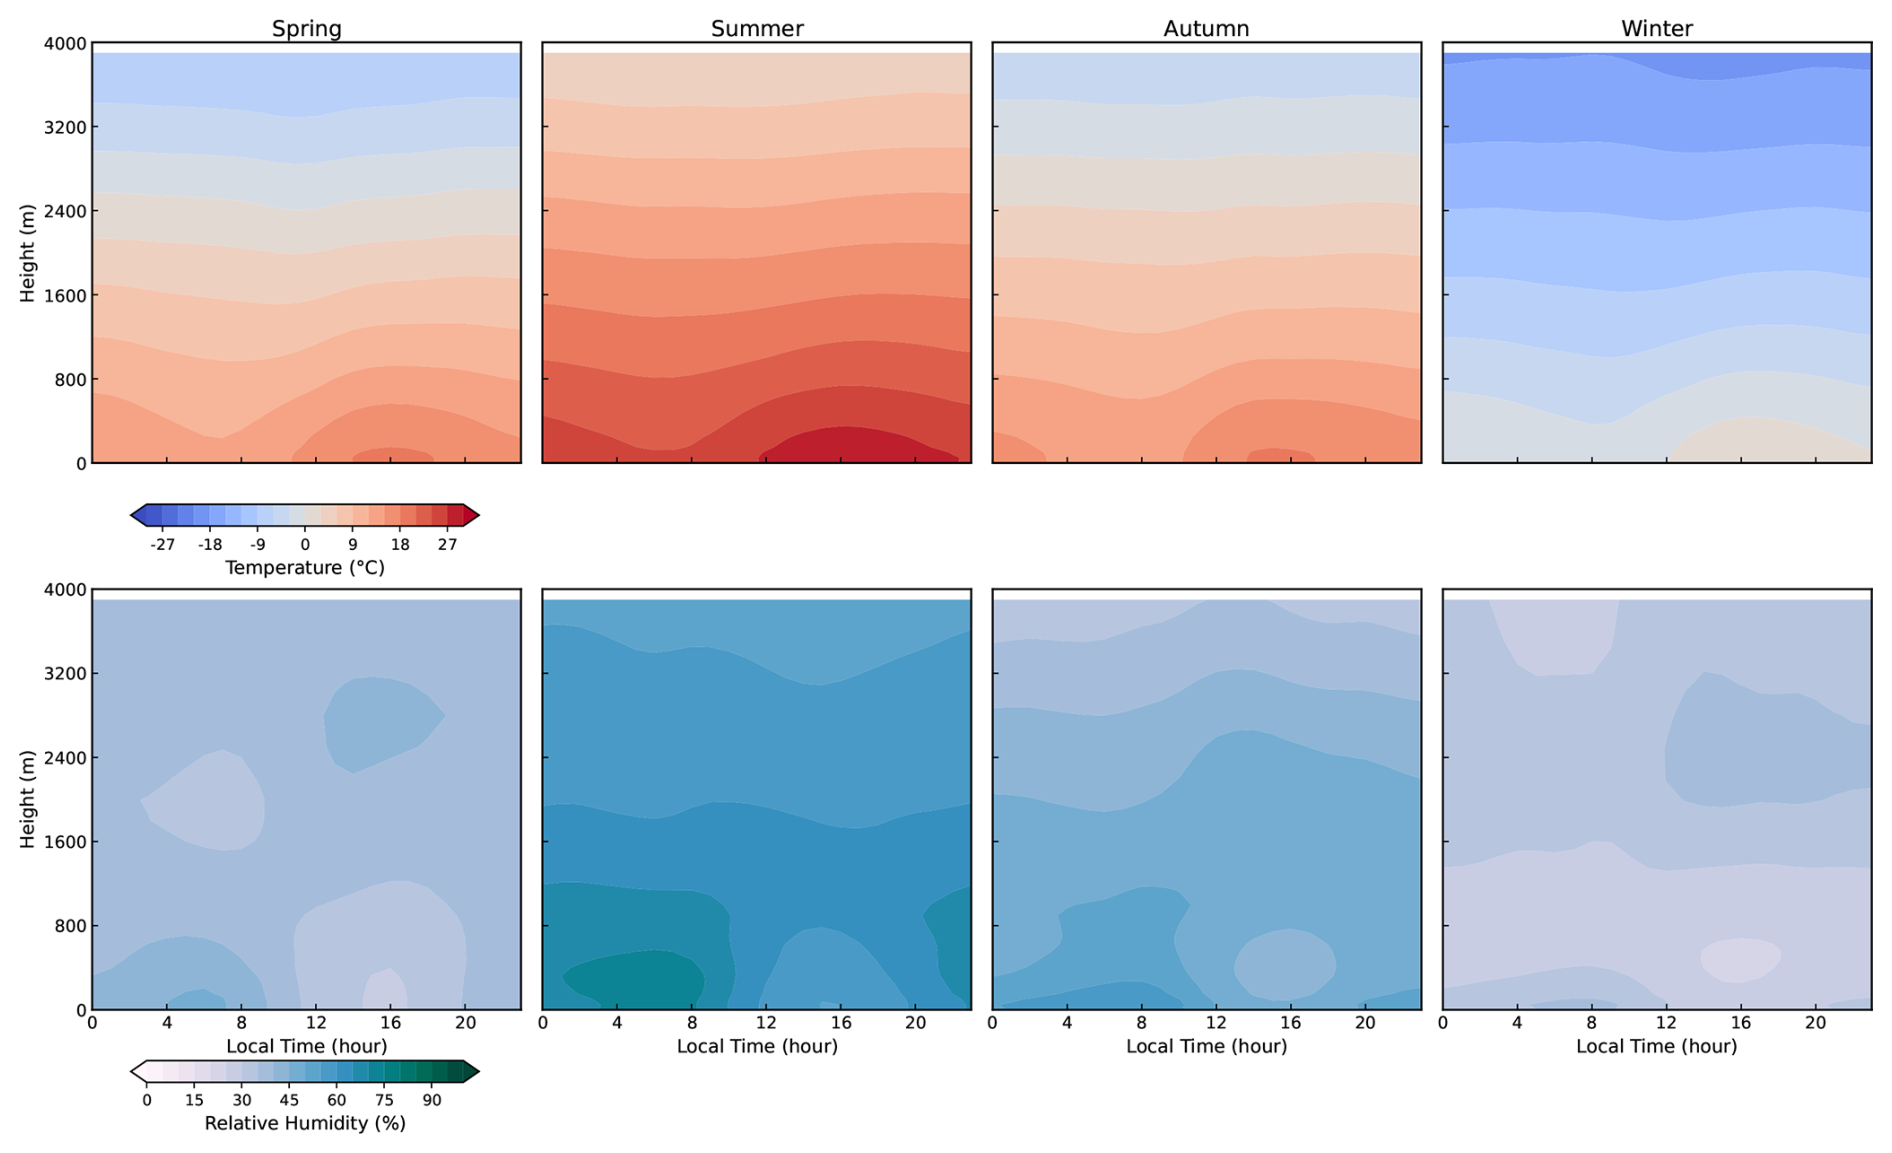
Figure 9Seasonal diurnal variations of temperature and relative humidity at XH during 2013–2022. The statistics are based on the merged retrieval dataset (OE for clear-sky and DNN for cloudy-sky conditions). Upper panels show temperature profiles (°C) and lower panels show relative humidity profiles (%). Data are averaged by hour in local standard time (LST, UTC+8). Contour shading indicates the mean diurnal evolution at each vertical level, with height restricted to 0–4000 m. Colour bars at the bottom correspond to the respective variables. Seasonal panels are arranged from spring (March–May), summer (June–August), autumn (September–November) to winter (December–February).
Relative humidity displays an inverse diurnal trend compared to temperature, peaking near sunrise and reaching its minimum in the afternoon. This behavior results from the combined effects of surface evaporation during the night and strong daytime mixing that dilutes moisture content. RH decreases rapidly with height, particularly in summer, consistent with deep convective boundary layer development and efficient vertical transport of dry air. During winter, RH profiles are more uniform vertically, with smaller gradients, reflecting weaker turbulence and limited surface moisture availability. Additionally, higher RH values persist near the surface during winter, likely due to reduced evaporation and stronger nocturnal radiation cooling.
4.3 Distribution characteristics of temperature inversions in the atmospheric boundary layer
With the availability of high-temporal-resolution (10 min) temperature and humidity profiles, various atmospheric boundary layer studies can be conducted – for instance, the identification and analysis of temperature inversions. Temperature inversions include surface-based inversions (SBI) that occur near the ground, elevated inversions (EI) that form aloft, and occasionally multiple-layer inversions (Guo et al., 2020). In this study, inversion layers were automatically identified based on the vertical temperature gradient from the merged profile dataset (combining both clear-sky and cloudy-sky conditions). However, it must be acknowledged that MWR-derived temperature profiles possess a relatively coarse vertical resolution compared to radiosonde soundings, as the vertical information content of MWR decreases with altitude. This inherent smoothing effect may limit the instrument's ability to resolve very thin or sharp inversion layers.
For each detected inversion, key characteristics such as inversion frequency, base and top height, and layer thickness were computed. For SBI, each occurrence was counted individually, whereas multiple EI layers within the same time step (Li et al., 2019) were counted only once. The temperature difference across the inversion layer represents its strength, while the inversion intensity was further derived following Zhou et al. (2024) as the ratio of temperature difference to inversion thickness (°C m−1).
Figure 10 presents the monthly variations in (panel a) inversion frequency, (panel b) inversion depth, (panel c) inversion strength (ΔT), and (panel d) inversion top height for SBI and EI from 2013 to 2022, with error bars indicating one standard deviation. Both SBI and EI show distinct seasonal characteristics, with lower frequencies in spring and summer and higher frequencies in autumn and winter. The monthly variation of SBI frequency is more pronounced, reaching up to about 0.68 during autumn–winter and dropping to around 0.06 in summer, whereas EI remains relatively stable throughout the year with frequencies generally below 0.2. The inversion depth of EI remains nearly constant at around 200 m across all months, while SBI exhibits a thicker layer in spring and summer, up to approximately 300 m, possibly due to enhanced near-surface turbulence and convective mixing under warmer conditions. Regarding inversion strength (ΔT), SBI shows the highest temperature difference in summer (up to 0.9 °C), consistent with its greater depth, while winter SBI events also exhibit large temperature gradients, likely associated with strong nocturnal radiative cooling and pollutant accumulation near the surface. In terms of inversion intensity (), SBI exhibits stronger temperature gradients in winter, with peak values around 0.006 °C m−1. The winter enhancement is likely linked to strong radiative cooling and pollutant accumulation near the surface. Notably, the standard deviation of inversion intensity also reaches its maximum during winter. This increased variability reflects the diverse meteorological conditions in North China during this season, characterized by the frequent alternation between stagnant, highly stable periods with intense nocturnal cooling and high-wind periods associated with strong cold air outbreaks that rapidly destabilize the boundary layer.
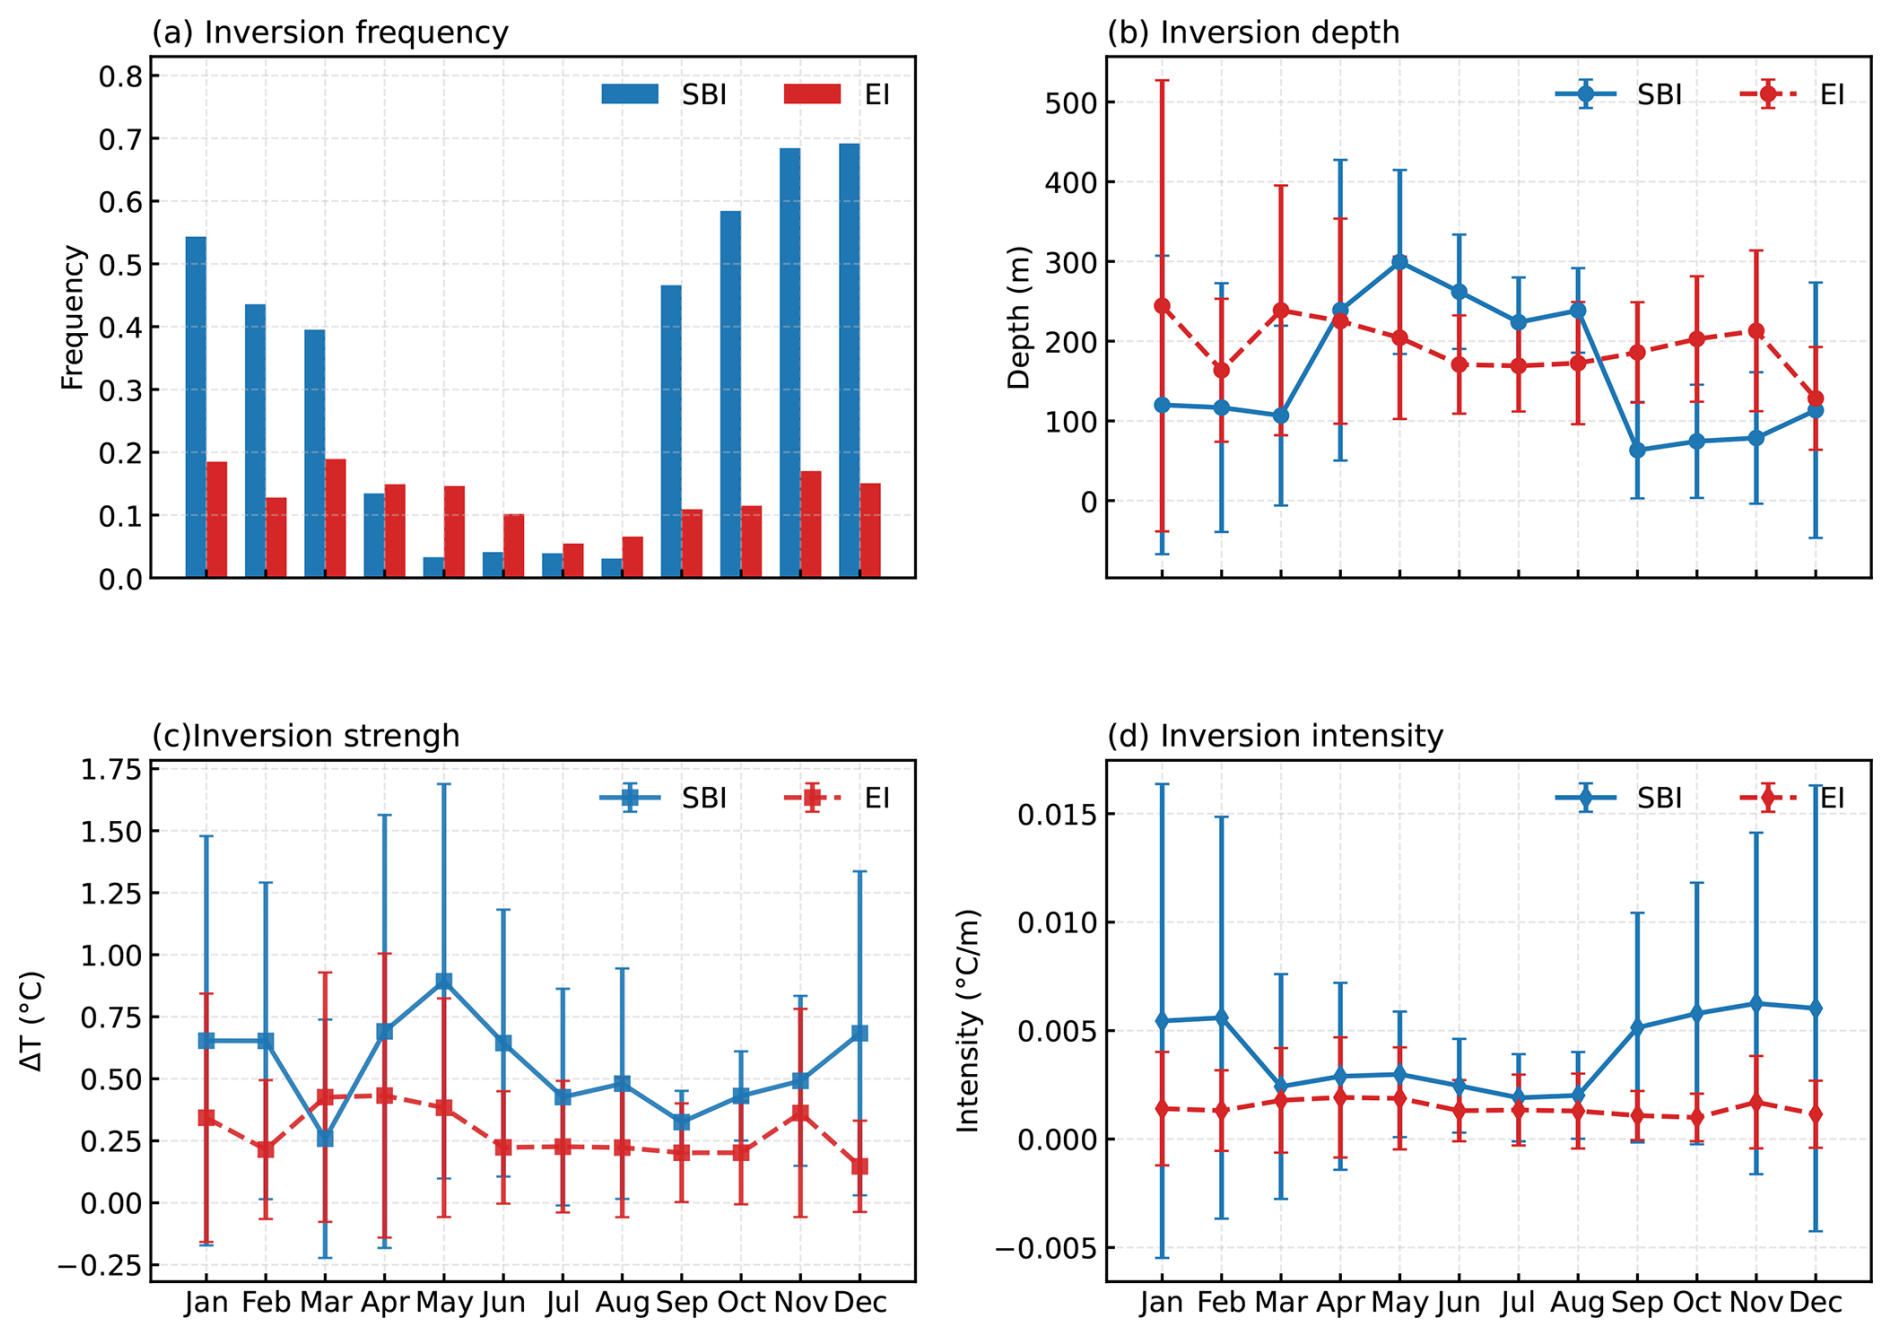
Figure 10Monthly variations in (a) inversion frequency, (b) inversion depth, (c) inversion strength (ΔT), and (d) inversion intensity () for surface-based inversions (SBI) and elevated inversions (EI) from 2013 to 2022. The error bars denote one standard deviation.
To investigate how atmospheric inversions influence air pollution, inversion characteristics were analyzed using ground-based temperature profiles at XH during 2018–2019, combined with hourly PM2.5 observations. For each inversion record, the nearest hourly PM2.5 measurement was assigned by rounding the inversion time to the closest hour. Figure 11 summarizes inversion characteristics across six PM2.5 bins (0–35, 35–75, 75–115, 115–150, 150–250, and 250–500 µg m−3).
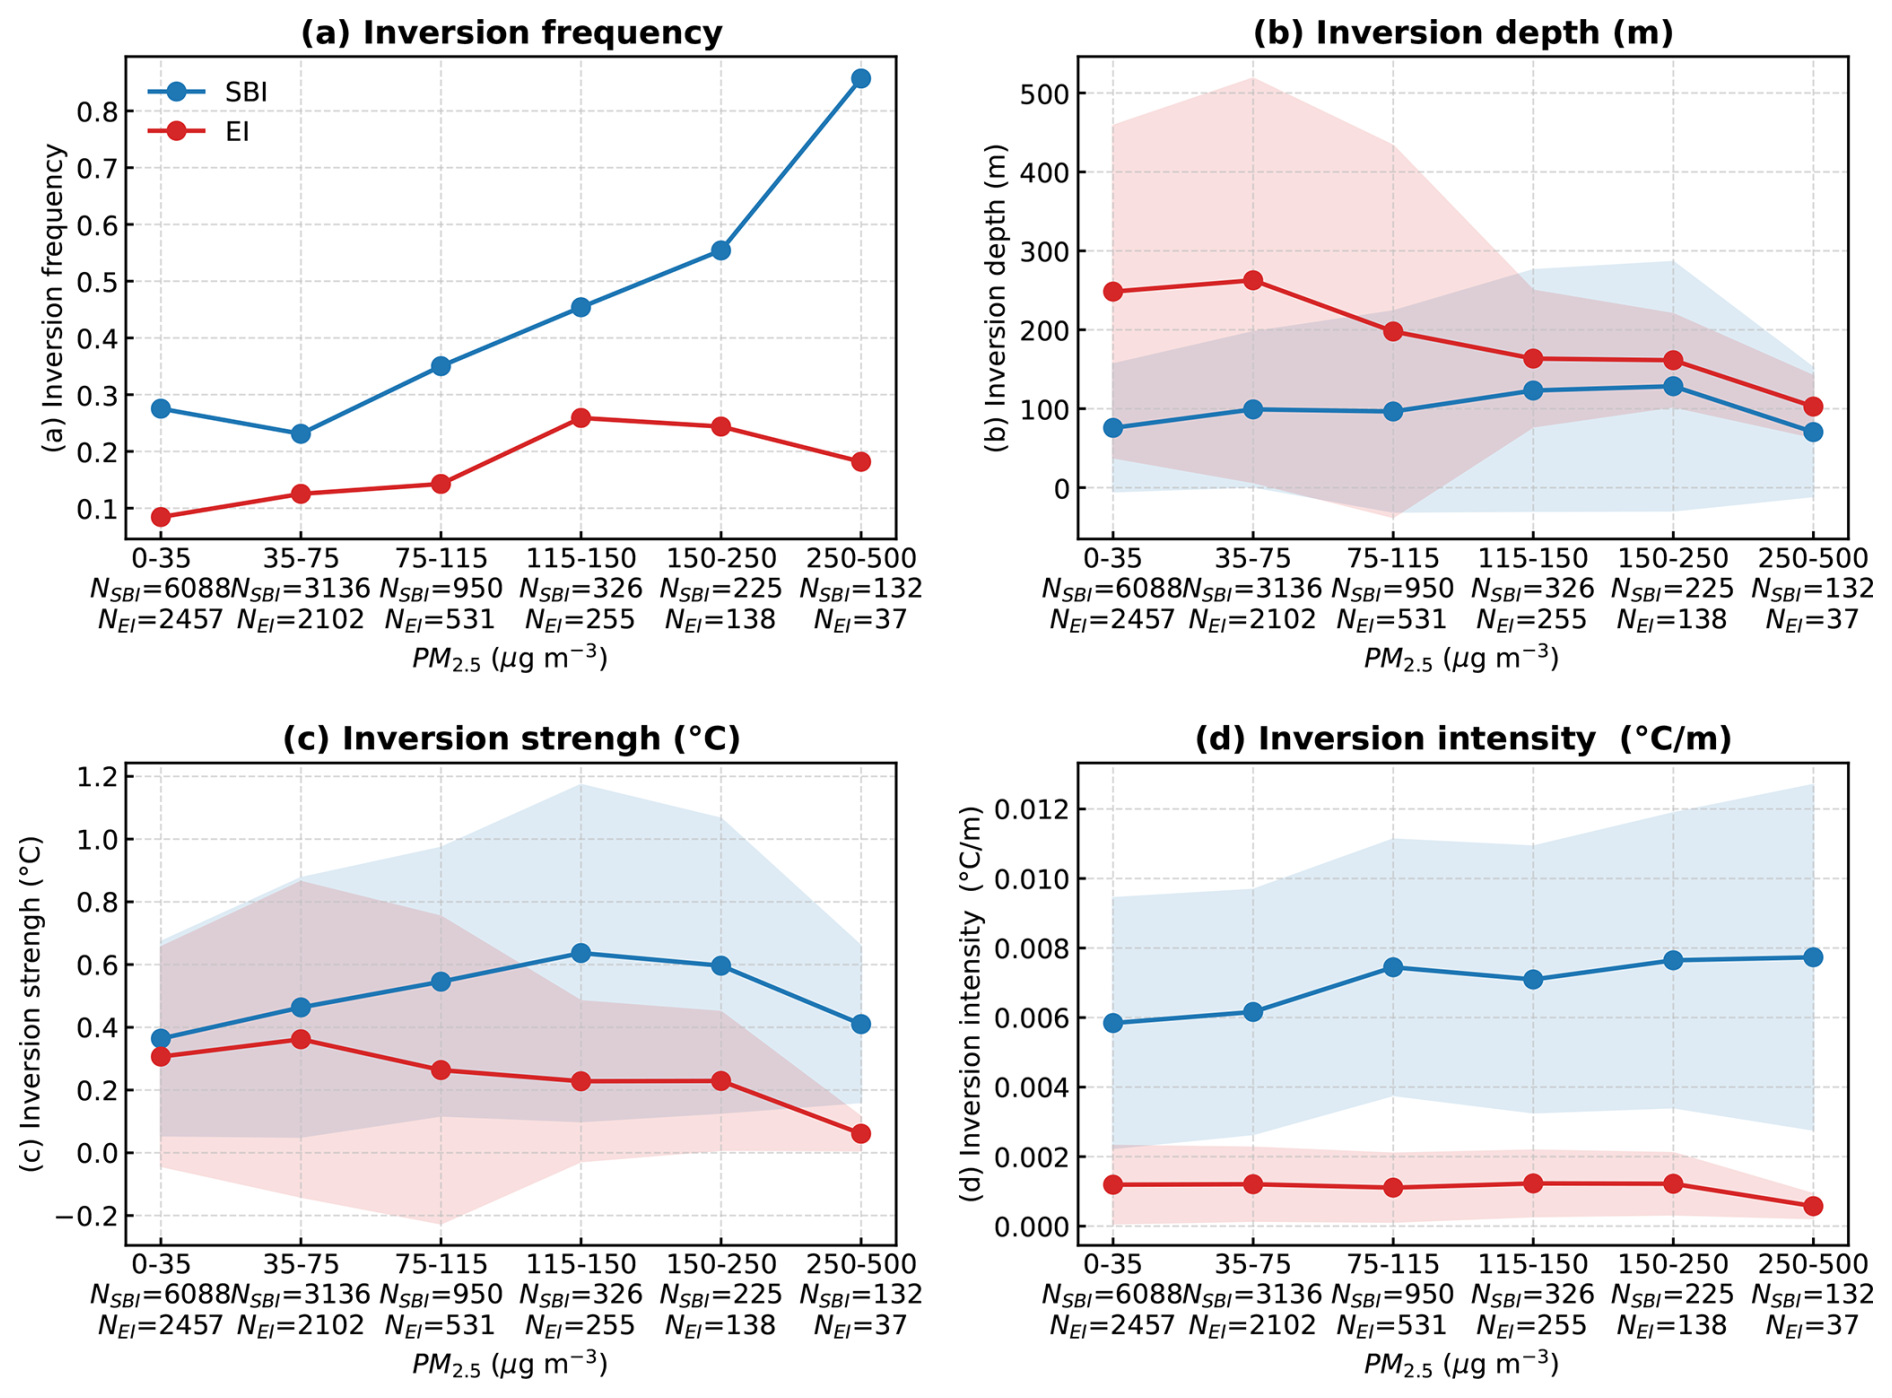
Figure 11Statistics of inversion characteristics across different PM2.5 concentration bins at XH during 2018–2019. Panels show (a) inversion frequency, (b) inversion depth, (c) inversion strength (ΔT), and (d) inversion intensity () for surface-based inversions (SBI, blue) and elevated inversion (EI, red). The specific number of inversion layers used for statistical analysis (NSBI and NEI) is indicated on the x-axis for each bin. Error bands indicate ±1 standard deviation.
As shown in Fig. 11a, the frequency of SBI increases with PM2.5, reaching a maximum under the most polluted conditions, reflecting the role of SBI in trapping pollutants near the surface. Elevated inversions (EI), in contrast, exhibit a moderate peak at intermediate PM2.5 levels (115–150 µg m−3) but decrease under the highest PM2.5 concentrations, indicating that EI contributes less to near-surface pollution accumulation during extreme pollution episodes. SBI depth gradually increases with PM2.5, whereas EI depth is generally larger but slightly decreases under severe pollution (Fig. 11b). Similarly, SBI temperature strength and inversion intensity increase with PM2.5 (Fig. 11c, d), highlighting stronger and more pronounced near-surface inversions that inhibit vertical mixing and favor pollutant accumulation. Conversely, EI exhibits relatively weaker ΔT and lower intensity, with a decline under extreme PM2.5 conditions, suggesting a limited impact on surface air quality. Overall, these results indicate that the formation and strengthening of surface-based inversions directly enhance PM2.5 accumulation near the surface, while elevated inversions are less effective in influencing surface pollution.
The data presented in this study are available here: https://doi.org/10.5281/zenodo.20178914 (Gong et al., 2025). This dataset consists of continuous ground-based MWR observations and corresponding retrieved atmospheric temperature and humidity profiles collected at the Xianghe site from 2013 to 2022. The quality-controlled and weather-classified brightness temperature dataset has a temporal resolution of 1 min, covering all 14 radiometric channels of the MWR. Each record includes quality control flags and weather classification identifiers to ensure data reliability and facilitate condition-dependent analyses. Users should note that this shared dataset contains exclusively zenith-pointing observations (90° elevation). The atmospheric profiles extend from the surface to 10 km and were derived using a merged retrieval strategy: the physical OE method was applied for clear-sky conditions, while a DNN was utilized for cloudy-sky periods to ensure temporal continuity. To meet operational requirements, these profiles are provided at a 10 min interval based on averaged TB data. The retrieved profiles extend from the surface up to 10 km, providing long-term, high-quality atmospheric structure information suitable for climatological analysis, model validation, and algorithm development.
Based on ground-based microwave radiometer (MWR) observations at XH from 2013 to 2022, a systematic study of brightness temperature (TB) quality control, classification, and evaluation was conducted, resulting in the construction of a long-term observational TB dataset. Using the observational TBs, radiosonde profiles, and ERA5 reanalysis data, two atmospheric temperature and humidity profile retrieval models were developed for clear-sky and cloudy-sky conditions: one based on the optimal estimation (OE) algorithm and the other on a deep neural network (DNN). The main conclusions are as follows:
-
Comparison between observed and simulated TBs from 2013 to 2022 shows that all channels exhibit correlation coefficients above 0.97, indicating good consistency. This demonstrates the reliability of the ten-year MWR observations and the stable performance of the instrument, providing a robust basis for constructing a long-term dataset.
-
A condition-dependent retrieval strategy is effectively implemented to optimize profile accuracy across different weather conditions. By applying the physically based OE method to clear-sky observations and the data-driven DNN model to cloudy skies, the retrieved profiles achieve substantial improvements over the generic operational LV2 product. Specifically, under clear-sky conditions, the OE method yields overall accuracy enhancements of 35 % for temperature and 25 % for relative humidity, with the most notable gains in the near-surface layer (<2 km) reaching 40 % and 29 %, respectively. Under cloudy-sky conditions, the DNN model successfully mitigates cloud-induced uncertainties, resulting in overall accuracy improvements of 39 % for temperature and 28 % for relative humidity.
-
The long-term, high-temporal-resolution (10 min) temperature and humidity profiles (2013–2022) capture pronounced diurnal cycles – surface temperatures peak at 14:00–16:00 LST (exceeding 20 °C in summer) and RH minima occur simultaneously, along with frequent surface-based inversions (SBI), whose frequency rises from ∼ 0.06 in summer to ∼ 0.68 in winter. Critically, SBI occurrence increases with PM2.5 levels, reaching >60 % under severe pollution (>250 µg m−3), demonstrating the dataset's value for boundary layer studies, climate trend analysis, and air quality forecasting.
YG and DF retrieved the temperature and humidity profiles dataset and performed numerical analyses. WH and DF designed the dataset and organized the manuscript. XX conceived the idea and WN collected the samples. YG, WH and DF prepared the figures and tables. All authors discussed the results and contributed to the final paper.
The contact author has declared that none of the authors has any competing interests.
Publisher's note: Copernicus Publications remains neutral with regard to jurisdictional claims made in the text, published maps, institutional affiliations, or any other geographical representation in this paper. The authors bear the ultimate responsibility for providing appropriate place names. Views expressed in the text are those of the authors and do not necessarily reflect the views of the publisher.
We thank the observers and technical staff, especially Qun Cheng and Qing Yao, at the Xianghe Atmospheric Observatory for their long-term microwave radiometer observations and data maintenance, and the European Centre for Medium-Range Weather Forecasts (ECMWF) for providing the ERA5 reanalysis data, and the Beijing Meteorological Observatory (station 54511) for providing the radiosonde data. Their dedicated work and data support are greatly appreciated.
This research has been supported by the National Key Research and Development Program of China (grant nos. 2022YFF0801301, 2017YFC1501700), the Innovation Foundation of CPML/CMA (grant no. 2023CPML-A01), the State Key Laboratory of Atmospheric Environment and Extreme Meteorology (grant no. 2024QN11), the Strategic Priority Research Program of the Chinese Academy of Sciences (grant no. XDB0760402), Open Funding of the Key Laboratory of Urban Meteorology, China Meteorological Administration (grant no. LUM-2024-06).
This paper was edited by Graciela Raga and reviewed by two anonymous referees.
Bedoya-Velásquez, A. E., Navas-Guzmán, F., De Arruda Moreira, G., Román, R., Cazorla, A., Ortiz-Amezcua, P., Benavent-Oltra, J. A., Alados-Arboledas, L., Olmo-Reyes, F. J., Foyo-Moreno, I., Montilla-Rosero, E., Hoyos, C. D., and Guerrero-Rascado, J. L.: Seasonal analysis of the atmosphere during five years by using microwave radiometry over a mid-latitude site, Atmos. Res., 218, 78–89, https://doi.org/10.1016/j.atmosres.2018.11.014, 2019.
Cimini, D., Nelson, M., Güldner, J., and Ware, R.: Forecast indices from a ground-based microwave radiometer for operational meteorology, Atmos. Meas. Tech., 8, 315–333, https://doi.org/10.5194/amt-8-315-2015, 2015.
Cimini, D., Haeffelin, M., Kotthaus, S., Löhnert, U., Martinet, P., O'Connor, E., Walden, C., Coen, M. C., and Preissler, J.: Towards the profiling of the atmospheric boundary layer at European scale – introducing the COST Action PROBE, Bull. Atmos. Sci. Technol., 1, 23–42, https://doi.org/10.1007/s42865-020-00003-8, 2020.
De Angelis, F., Cimini, D., Löhnert, U., Caumont, O., Haefele, A., Pospichal, B., Martinet, P., Navas-Guzmán, F., Klein-Baltink, H., Dupont, J.-C., and Hocking, J.: Long-term observations minus background monitoring of ground-based brightness temperatures from a microwave radiometer network, Atmos. Meas. Tech., 10, 3947–3961, https://doi.org/10.5194/amt-10-3947-2017, 2017.
Fu, D., Zhu, J., Xia, X., Xia, Y., Shi, H., Fan, X., Li, L., Xiao, X., and Han, X.: Enhanced boundary layer thermodynamics profiles retrieval from ground-based microwave radiometers with surface and pseudo-tower constraints, IEEE T. Geosci. Remote Sens., 64, 1–11, https://doi.org/10.1109/TGRS.2025.3647672, 2026.
Fu, X. and Tan, J.: Quality control of temperature and humidity profile retrievals from ground-based microwave radiometer, J. Appl. Meteor. Sci., 28, 209–217, https://doi.org/10.11898/1001-7313.20170208, 2017.
Gong, Y., He, W., Fu, D., Xia, X., Shi, H., Nan, W., Wang, P., and Chen, H.: The first decadal-scale ground-based microwave radiometer dataset in China: Brightness temperature and thermodynamic profiles from Xianghe (2013–2022), Zenodo [data set], https://doi.org/10.5281/zenodo.20178914, 2025.
Guo, J., Chen, X., Su, T., Liu, L., Zheng, Y., Chen, D., Li, J., Xu, H., Lv, Y., He, B., Li, Y., Hu, X.-M., Ding, A., and Zhai, P.: The climatology of lower tropospheric temperature inversions in China from radiosonde measurements: roles of black carbon, local meteorology, and large-scale subsidence, J. Climate, 33, 9327–9350, https://doi.org/10.1175/JCLI-D-19-0278.1, 2020.
Guo, Y., Du, L., and Lyu, G.: SAR target detection based on domain adaptive faster R-CNN with small training data size, Remote Sens., 13, 4202, https://doi.org/10.3390/rs13214202, 2021.
He, M., Wang, D., Ding, W., Wan, Y., Chen, Y., and Zhang, Y.: A validation of Fengyun4A temperature and humidity profile products by radiosonde observations, Remote Sens., 11, 2039, https://doi.org/10.3390/rs11172039, 2019.
He, W., Cheng, Y., Zou, R., Wang, P., Chen, H., Li, J., and Xia, X.: Radiative transfer model simulations for ground-based microwave radiometers in north China, Remote Sens., 13, 5161, https://doi.org/10.3390/rs13245161, 2021.
Hersbach, H., Bell, B., Berrisford, P., Hirahara, S., Horányi, A., Muñoz-Sabater, J., Nicolas, J., Peubey, C., Radu, R., Schepers, D., Simmons, A., Soci, C., Abdalla, S., Abellan, X., Balsamo, G., Bechtold, P., Biavati, G., Bidlot, J., Bonavita, M., De Chiara, G., Dahlgren, P., Dee, D., Diamantakis, M., Dragani, R., Flemming, J., Forbes, R., Fuentes, M., Geer, A., Haimberger, L., Healy, S., Hogan, R. J., Hólm, E., Janisková, M., Keeley, S., Laloyaux, P., Lopez, P., Lupu, C., Radnoti, G., De Rosnay, P., Rozum, I., Vamborg, F., Villaume, S., and Thépaut, J.: The ERA5 global reanalysis, Q. J. Roy. Meteor. Soc., 146, 1999–2049, https://doi.org/10.1002/qj.3803, 2020.
Hewison, T. J.: 1D-VAR retrieval of temperature and humidity profiles from a ground-based microwave radiometer, IEEE T. Geosci. Remote Sens., 45, 2163–2168, https://doi.org/10.1109/tgrs.2007.898091, 2007.
Hou, X., Han, Y., Hu, X., and Weng, F.: Verification of Fengyun-3D MWTS and MWHS Calibration Accuracy Using GPS Radio Occultation Data, J. Meteorol. Res., 33, 695–704, https://doi.org/10.1007/s13351-019-8208-9, 2019.
Huang, Z., Xu, G., Wang, X., and Tang, Y.: Applications of Ground-based Microwave Radiation Data to Short-term Rainstorm and Potential Forecast, J. Appl. Meteor. Sci., 24, 576–584, 2013.
Lai, Y., Li, L., Wang, H., Zhang, H., Xia, Y., Wei, T., and Meng, L.: Variation Characteristics and Influencing Factors of Atmospheric Convective Boundary Layer Height over Beijing Region in the Past 30 Years, Meteorological Monthly, 50, 1417–1428, https://doi.org/10.7519/j.issn.1000-0526.2024.080101, 2024.
Li, J., Chen, H., Li, Z., Wang, P., Fan, X., He, W., and Zhang, J.: Analysis of low-level temperature inversions and their effects on aerosols in the lower atmosphere, Adv. Atmos. Sci., 36, 1235–1250, https://doi.org/10.1007/s00376-019-9018-9, 2019.
Liljegren, J. C., Boukabara, S.-A., Cady-Pereira, K., and Clough, S. A.: The effect of the half-width of the 22-GHz water vapor line on retrievals of temperature and water vapor profiles with a 12-channel microwave radiometer, IEEE T. Geosci. Remote Sens., 43, 1102–1108, https://doi.org/10.1109/TGRS.2004.839593, 2005.
Liu, G.: A fast and accurate model for microwave radiance calculations, J. Meteorol. Soc. Jpn. II, 76, 335–343, https://doi.org/10.2151/jmsj1965.76.2_335, 1998.
Liu, Y., Chen, X., Ma, Y., Cao, D., Sun, F., Xu, X., and Zhang, Q.: Application of ground-based microwave radiometers to optimize the estimation method of cloud liquid water on the Tibetan Plateau, Adv. Atmos. Sci., https://doi.org/10.1007/s00376-025-4416-7, 2025.
Löhnert, U. and Crewell, S.: Accuracy of cloud liquid water path from ground-based microwave radiometry 1. Dependency on cloud model statistics, Radio Sci., 38, 2002RS002654, https://doi.org/10.1029/2002RS002654, 2003.
Löhnert, U. and Maier, O.: Operational profiling of temperature using ground-based microwave radiometry at Payerne: prospects and challenges, Atmos. Meas. Tech., 5, 1121–1134, https://doi.org/10.5194/amt-5-1121-2012, 2012.
Maahn, M., Turner, D. D., Löhnert, U., Posselt, D. J., Ebell, K., Mace, G. G., and Comstock, J. M.: Optimal estimation retrievals and their uncertainties, B. Am. Meteorol. Soc., 101, E1512–E1523, https://doi.org/10.1175/BAMS-D-19-0027.1, 2020.
Madhulatha, A., Rajeevan, M., Venkat Ratnam, M., Bhate, J., and Naidu, C. V.: Nowcasting severe convective activity over southeast India using ground-based microwave radiometer observations, J. Geophys. Res.-Atmos., 118, 1–13, https://doi.org/10.1029/2012JD018174, 2013.
Malmgren-Hansen, D., Laparra, V., Aasbjerg Nielsen, A., and Camps-Valls, G.: Statistical retrieval of atmospheric profiles with deep convolutional neural networks, ISPRS J. Photogramm. Remote Sens., 158, 231–240, https://doi.org/10.1016/j.isprsjprs.2019.10.002, 2019.
Martinet, P., Dabas, A., Donier, J.-M., Douffet, T., Garrouste, O., and Guillot, R.: 1D-Var temperature retrievals from microwave radiometer and convective scale model, Tellus A, 67, 27925, https://doi.org/10.3402/tellusa.v67.27925, 2015.
Navas-Guzmán, F., Kämpfer, N., and Haefele, A.: Validation of brightness and physical temperature from two scanning microwave radiometers in the 60 GHz O2 band using radiosonde measurements, Atmos. Meas. Tech., 9, 4587–4600, https://doi.org/10.5194/amt-9-4587-2016, 2016.
Rodgers, C. D.: Inverse methods for atmospheric sounding: theory and practice, World Scientific, Singapore, [River Edge, N.J.], 240 pp., ISBN: 978-981-02-2740-1, 2000.
Rose, T., Crewell, S., Löhnert, U., and Simmer, C.: A network suitable microwave radiometer for operational monitoring of the cloudy atmosphere, Atmos. Res., 75, 183–200, https://doi.org/10.1016/j.atmosres.2004.12.005, 2005.
Rosenkranz, P. W.: Water vapor microwave continuum absorption: a comparison of measurements and models, Radio Sci., 33, 919–928, https://doi.org/10.1029/98RS01182, 1998.
Rüfenacht, R., Haefele, A., Pospichal, B., Cimini, D., Bircher-Adrot, S., Turp, M., and Sugier, J.: EUMETNET opens to microwave radiometers for operational thermodynamical profiling in Europe, Bull. Atmos. Sci. Technol., 2, s42865-021-00033-w, https://doi.org/10.1007/s42865-021-00033-w, 2021.
Temimi, M., Fonseca, R. M., Nelli, N. R., Valappil, V. K., Weston, M. J., Thota, M. S., Wehbe, Y., and Yousef, L.: On the analysis of ground-based microwave radiometer data during fog conditions, Atmos. Res., 231, 104652, https://doi.org/10.1016/j.atmosres.2019.104652, 2020.
Thomas, G., Martinet, P., Brousseau, P., Chambon, P., Georgis, J.-F., Hervo, M., Huet, T., Löhnert, U., Orlandi, E., and Unger, V.: Assimilation of ground-based microwave radiometer temperature observations into a convective-scale NWP model for fog forecast improvement, Q. J. Roy. Meteor. Soc., 151, e4893, https://doi.org/10.1002/qj.4893, 2025.
Trent, T., Siddans, R., Kerridge, B., Schröder, M., Scott, N. A., and Remedios, J.: Evaluation of tropospheric water vapour and temperature profiles retrieved from MetOp-A by the Infrared and Microwave Sounding scheme, Atmos. Meas. Tech., 16, 1503–1526, https://doi.org/10.5194/amt-16-1503-2023, 2023.
Turner, D. D., Clough, S. A., Liljegren, J. C., Clothiaux, E. E., Cady-Pereira, K. E., and Gaustad, K. L.: Retrieving Liquid Water Path and Precipitable Water Vapor From the Atmospheric Radiation Measurement (ARM) Microwave Radiometers, IEEE T. Geosci. Remote Sens., 45, 3680–3690, https://doi.org/10.1109/TGRS.2007.903703, 2007.
Turner, D. D., Cadeddu, M. P., Lohnert, U., Crewell, S., and Vogelmann, A. M.: Modifications to the water vapor continuum in the microwave suggested by ground-based 150-GHz observations, IEEE T. Geosci. Remote Sens., 47, 3326–3337, https://doi.org/10.1109/TGRS.2009.2022262, 2009.
Wei, J., Shi, Y., Ren, Y., Li, Q., Qiao, Z., Cao, J., Ayantobo, O. O., Yin, J., and Wang, G.: Application of Ground-Based Microwave Radiometer in Retrieving Meteorological Characteristics of Tibet Plateau, Remote Sens., 13, 2527, https://doi.org/10.3390/rs13132527, 2021.
Xin, J., Wang, Y., Pan, Y., Ji, D., Liu, Z., Wen, T., Wang, Y., Li, X., Sun, Y., Sun, J., Wang, P., Wang, G., Wang, X., Cong, Z., Song, T., Hu, B., Wang, L., Tang, G., Gao, W., Guo, Y., Miao, H., Tian, S., and Wang, L.: The Campaign on Atmospheric Aerosol Research Network of China: CARE-China, B. Am. Meteorol. Soc., 96, 1137–1155, https://doi.org/10.1175/BAMS-D-14-00039.1, 2015.
Xu, G.: A Review of Remote Sensing of Atmospheric Profiles and Cloud Properties by Ground-Based Microwave Radiometers in Central China, Remote Sens., 16, 966, https://doi.org/10.3390/rs16060966, 2024.
Zhang, C., Zhao, D., Gao, Y., Song, Z., Zhao, B., and Wang, G.: Increasing summertime low-level cloud cover associated with increasing vegetation in China from 2003 to 2022, Environ. Res. Lett., 19, 124061, https://doi.org/10.1088/1748-9326/ad8cee, 2024a.
Zhang, L., Liu, M., He, W., Xia, X., Yu, H., Li, S., and Li, J.: Ground passive microwave remote sensing of atmospheric profiles using WRF simulations and machine learning techniques, J. Meteorol. Res., 38, 680–692, https://doi.org/10.1007/s13351-024-4004-2, 2024b.
Zhang, X., Wang, Z., Mao, J., Wang, Z., Zhang, D., and Tao, F.: Experiments on improving temperature and humidity profile retrieval for ground-based microwave radiometer, J. Appl. Meteor. Sci., 31, 385–396, https://doi.org/10.11898/1001-7313.20200401, 2020.
Zhao, Y., Zhou, D., and Yan, H.: An improved retrieval method of atmospheric parameter profiles based on the BP neural network, Atmos. Res., 213, 389–397, https://doi.org/10.1016/j.atmosres.2018.06.025, 2018.
Zhou, X., Zhang, C., Li, Y., Sun, J., Chen, Z., and Li, L.: Concurrence of Temperature and Humidity Inversions in Winter in Qingdao, China, Geophys. Res. Lett., 51, e2024GL108350, https://doi.org/10.1029/2024GL108350, 2024.
Zhu, L., Bao, Y., Lu, Q., Fan, S., Petropoulos, G. P., Mao, J., Li, Y., and Li, X.: A Method for Retrieving Thermodynamic Atmospheric Profiles Using Microwave Radiometers of Meteorological Observation Networks, IEEE T. Geosci. Remote Sens., 60, 1–11, https://doi.org/10.1109/TGRS.2022.3208939, 2022.
Zou, R., He, W., Wang, P., Mao, J., Chen, H., Li, J., Nan, W., and Chang, Y.: Assessment of Radiative Transfer Models Based on Observed Brightness Temperature from Ground-Based Microwave Radiometer, Chinese J. Atmos. Sci., 45, 605–616, https://doi.org/10.3878/j.issn.1006-9895.2008.20134, 2021.
- Abstract
- Introduction
- Observation instruments and data
- Construction of a 10-year ground-based MWR TB Dataset
- Characteristics of the long-term and high-resolution MWR dataset
- Data availability
- Conclusions
- Author contributions
- Competing interests
- Disclaimer
- Acknowledgements
- Financial support
- Review statement
- References
- Abstract
- Introduction
- Observation instruments and data
- Construction of a 10-year ground-based MWR TB Dataset
- Characteristics of the long-term and high-resolution MWR dataset
- Data availability
- Conclusions
- Author contributions
- Competing interests
- Disclaimer
- Acknowledgements
- Financial support
- Review statement
- References