the Creative Commons Attribution 4.0 License.
the Creative Commons Attribution 4.0 License.
 | 30 Jan 2026
SEEPS4ALL: an open dataset for the verification of daily precipitation forecasts using station climate statistics
Zied Ben-Bouallègue
Ana Prieto-Nemesio
Angela Iza Wong
Florian Pinault
Marlies van der Schee
Umberto Modigliani
Forecast verification is an essential task when developing a forecasting model. How well does a model perform? How does the forecast performance compare with previous versions or other models? Which aspects of the forecast could be improved? In weather forecasting, these questions apply in particular to precipitation, a key weather parameter with vital societal applications. Scores specifically designed to assess the performance of precipitation forecasts have been developed over the years. One example is the Stable and Equitable Error in Probability Space (SEEPS, Rodwell et al., 2010). The computation of this score is however not straightforward because it requires information about the precipitation climatology at the verification locations. More generally, climate statistics are key to assessing forecasts for extreme precipitation and high-impact events. Here, we introduce SEEPS4ALL, a set of data and tools that democratize the use of climate statistics for verification purposes. In particular, verification results for daily precipitation are showcased with both deterministic and probabilistic forecasts. The data is available through Zenodo at https://doi.org/10.5281/zenodo.18197534 (Ben Bouallègue, 2026) and the verification scripts at https://doi.org/10.5281/zenodo.18392042 (Ben Bouallegue and Prieto Nemesio, 2026).
- Article
(5583 KB) - Full-text XML
- BibTeX
- EndNote


In weather forecasting, the rise of machine learning (ML) opens new horizons where meteorological observations serve not only for training ML models but also for validating their output (Ben Bouallègue et al., 2024; McNally et al., 2024; Alexe et al., 2024). As the European Union recognizes meteorological data as high-value data, new rules facilitate their use to fuel artificial intelligence and data-driven innovation (see https://digital-strategy.ec.europa.eu/en/news/new-eu-rules-make-high-value-datasets-available-fuel-artificial-intelligence-and-data-driven, last access: 27 January 2026). Here, we introduce an open dataset based on in-situ meteorological observations for evaluating weather forecasts over Europe with a focus on precipitation. Verification of weather models requires both high-quality datasets and appropriate verification tools. Ad hoc verification methodologies have been developed over the years for assessing numerical weather predictions (NWPs), that is, computer simulations based on physical models of the earth system. Particular attention has been paid to the assessment of precipitation forecasts, precipitation being one of the most important weather variables affecting society. While dry days usually dominate the verification sample, intense precipitation events are generally deemed more important to be forecast accurately. The skewness of the precipitation distribution often results in difficult and sometimes misleading interpretations of verification results. As a workaround, innovative verification metrics use a climatology to contextualize a forecast and apply suitable penalties when the forecast is not correct (Rodwell et al., 2010). Approaches of the kind exist for both deterministic and probabilistic forecasts (Ben Bouallègue et al., 2018).
In forecast verification, climatology can be useful in various ways. For example:
-
A climatology can serve as a “reference” forecast when computing a skill score, that is, the climatology distribution is used as a simple benchmark for probabilistic forecasts (Wilks, 2006).
-
A weather event can be defined as a weather parameter exceeding a threshold, for instance, daily precipitation exceeding 10 mm per 24 h. A threshold can be expressed in absolute terms (as in this example) but also as a percentile of a climatology, for instance, the 95 % percentile. This later choice helps better identify skill in the model (Hamill and Juras, 2006).
-
The climatological frequency of events can be used to design verification metrics. An example of a score based on the climatology is the Stable and Equitable Error in Probability Space (SEEPS, Rodwell et al., 2010). In a nutshell, SEEPS is based on categorical forecasts of rain where categories are defined based on the station climatology, and penalties associated with misclassifications depend on the climatological frequency.
SEEPS is one of the supplementary headline scores of the European Center for Medium-Range Weather Forecasting (ECMWF). In this application, SEEPS helps measure the improvement in precipitation forecasting over the year for the operational NWP system. Recent studies also use SEEPS as a standard verification metric applied to precipitation forecasts as output of ML models (see for instance Rasp et al., 2024; Sha et al., 2025).
The dataset introduced here is called SEEPS4ALL, SEEPS being considered as the flagship of the scores relying on climate statistics. The aim is to provide in-situ observations together with climatological information for verification applications. The computation of SEEPS is a starting point. More scores and skill scores are easy to estimate when climate statistics are at hand.
The data source for building SEEPS4ALL is the observational station data of the European Climate Assessment & Dataset (ECA&D, Klein Tank et al., 2002). Observations cover not only recent years, which are useful for validation, but also past decades, which allows us to build a climatology. This dataset offers a unique focus on Europe.
Other datasets based on station observations of meteorological quantities and with applications in forecast verification exists. Among others, we can mention the following examples:
-
EUPPBench (Demaeyer et al., 2023). A dataset of time-aligned forecasts and observations, with the aim to facilitate and standardize post-processing method and their inter-comparison. The dataset only focuses on 2 m temperature so far, with a coverage over Western-Northern Europe.
-
Weather2K (Zhu et al., 2023). A multi-variate benchmark dataset based on ground weather stations from the China Meteorological Administration targeting near-real-time applications. Precipitation data is available with accumulation times varying from 1–24 h, but the dataset covers China only.
-
WeatherReal (Jin et al., 2024). A benchmark dataset for weather forecasting, derived from near-surface in-situ observations available globally. WeatherReal also features a publicly accessible quality control and evaluation framework. The dataset includes precipitation with different accumulation times (from 1–24 h), but no climatological information is provided.
These examples of datasets for verification illustrate a variety of scopes and spatial coverages. They also highlight the importance of benchmarking in the ML community as it is considered as a key driver of progress (Dueben et al., 2022).
The innovative contributions of the dataset presented here, compared with existing ones, are the following:
-
SEEPS4ALL is based on observations that cover mainly Europe, relying on a high-density network for some countries or regions, and in a format suitable for benchmarking;
-
SEEPS4ALL encompasses relevant climatological statistics to ease the computation of meaningful verification metrics.
We organised the manuscript as follows: Sect. 2 describes the raw data and data pre-processing, Sect. 3 discusses verification applications, and Sect. 5 concludes.
Starting from the original data in ECA&D, we derive 2 sub-datasets with climatological information targeting applications in forecast verification. One sub-dataset resembles the ingredients to compute a specific score (namely SEEPS) while the second sub-dataset provides station observations and local climate percentiles for computing threshold-based scores and skill scores. Examples of applications follow in Sect. 3.
2.1 ECA&D
The station data collated by the ECA&D initiative (Klein Tank et al., 2002) are supplied by many National Meteorological Services and other providers across Europe, the Middle East, and North Africa. Currently, ECA&D receives daily data for 13 Essential Climate Variables from 89 participants from 65 countries. It contains almost 25 000 meteorological stations and serves as the backbone for the Climate Mode of the World Meteorological Organization Region VI. Daily data is made available following FAIR principles through the ECA&D data portal at https://www.ecad.eu (last access: 27 January 2026) (when permission to do so is given by the data owner) and provided in a uniform format. ECA&D is free of charge for research and educational purposes.
Although most station series are quality controlled by the respective agencies, the series are subjected to a further quality control procedure following incorporation into ECA&D. A minimum set of metadata for each timeseries is required to judge the quality and representativeness of the observations following the attributes the WMO-TD No. 1186 (Aguilar et al., 2003). Two datasets are provided; a non-blended and a blended version in which homogeneity analyses have been performed on the latter including four homogeneity tests for each time series (Wijngaard et al., 2003). The blended dataset is used in this study and the focus is set of daily precipitation data.
Figure 1 shows the distribution of the station locations over the Northern Hemisphere (upper panel) and with a focus on the European domain (lower panel). This latter domain is used for the examples in Sect. 3. Figure 2 summarises some characteristics of this dataset. Figure 2a shows the number of stations within areas of size 1°×1°. This coarse resolution grid allows for a better visualization of the station characteristics in the form of area averages. For example, Fig. 2b shows the averaged station elevation within each pre-defined grid box.
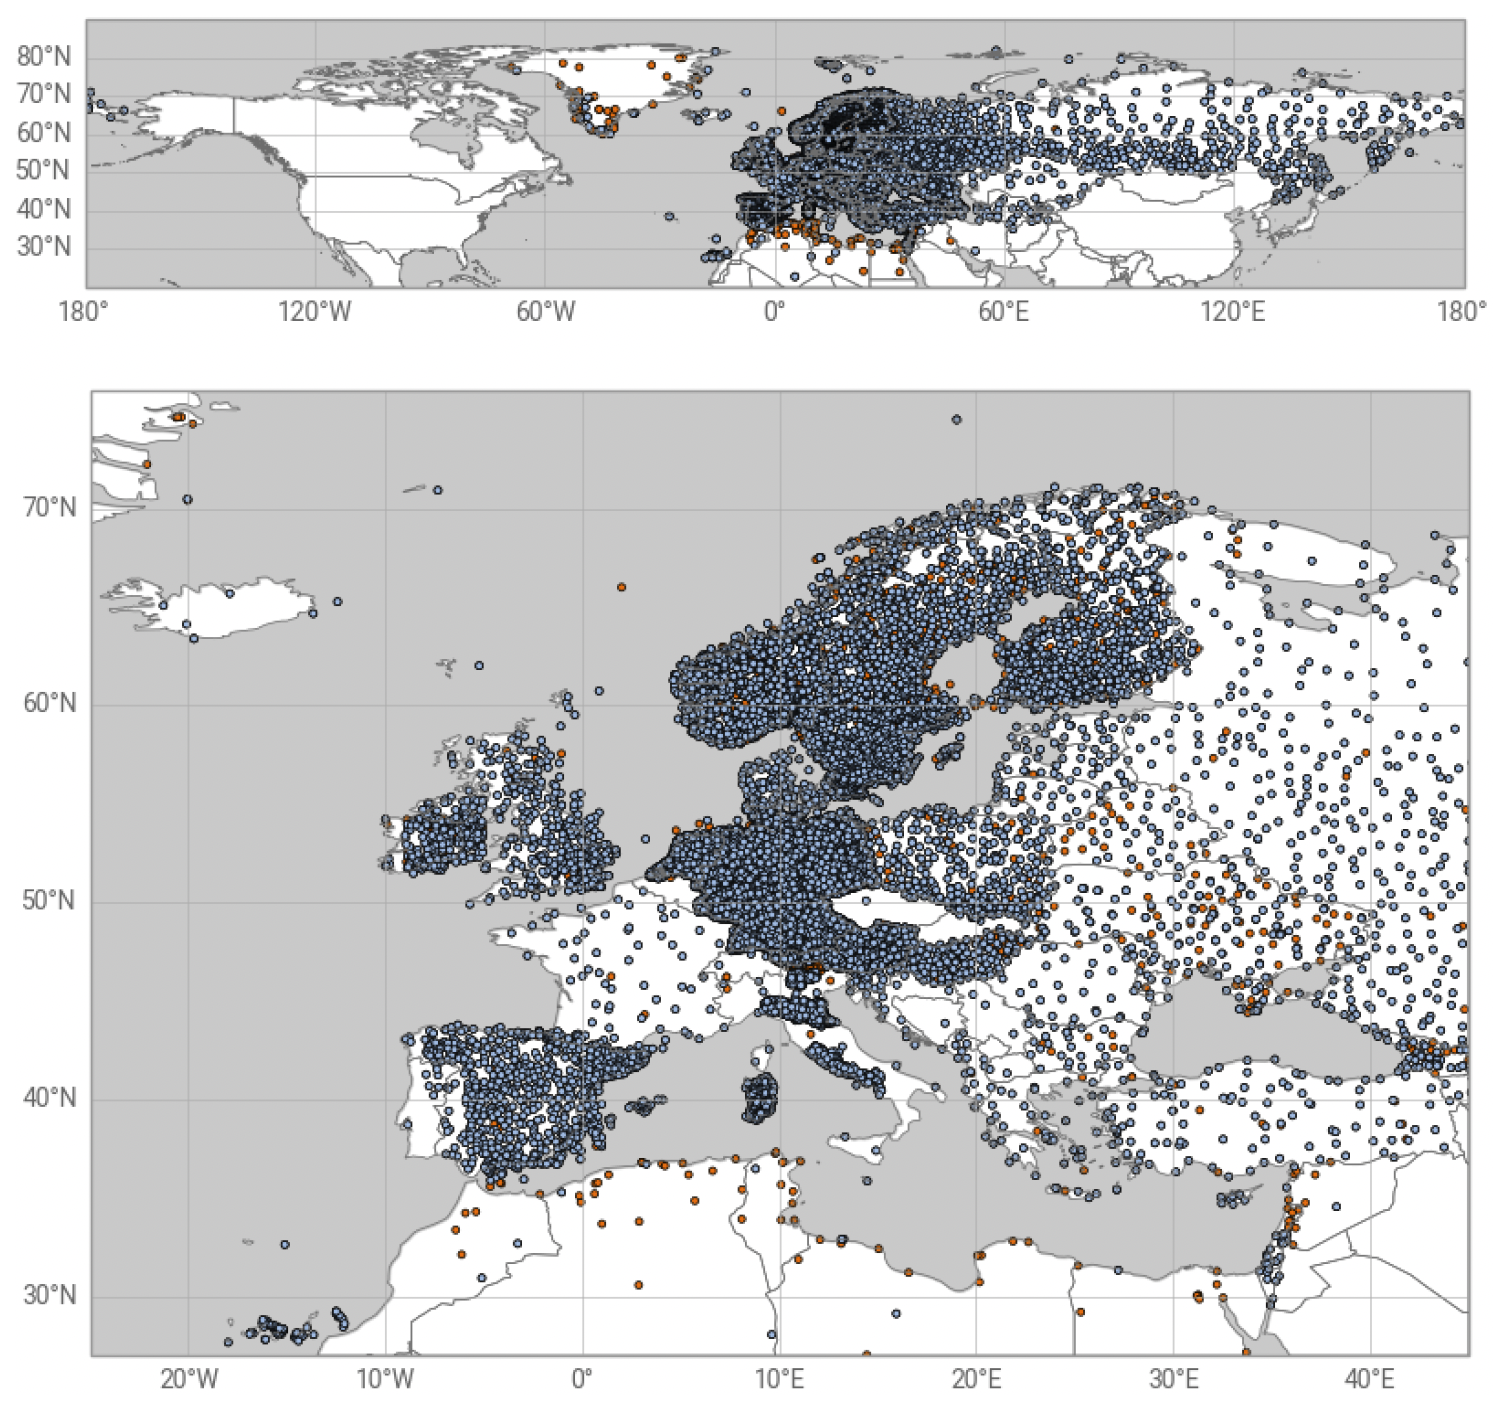
Figure 1ECA&D station distribution over the Northern Hemisphere (upper panel) and with a focus over Europe (lower panel). The stations used to build SEEPS4ALL are shown in blue while the stations disregarded because of a lack of data over the period used to compute the climate statistics (1991–2020) are indicated in orange. Overall, SEEPS4ALL comprises data from 10 705 stations from which 10 396 are located within the European domain.
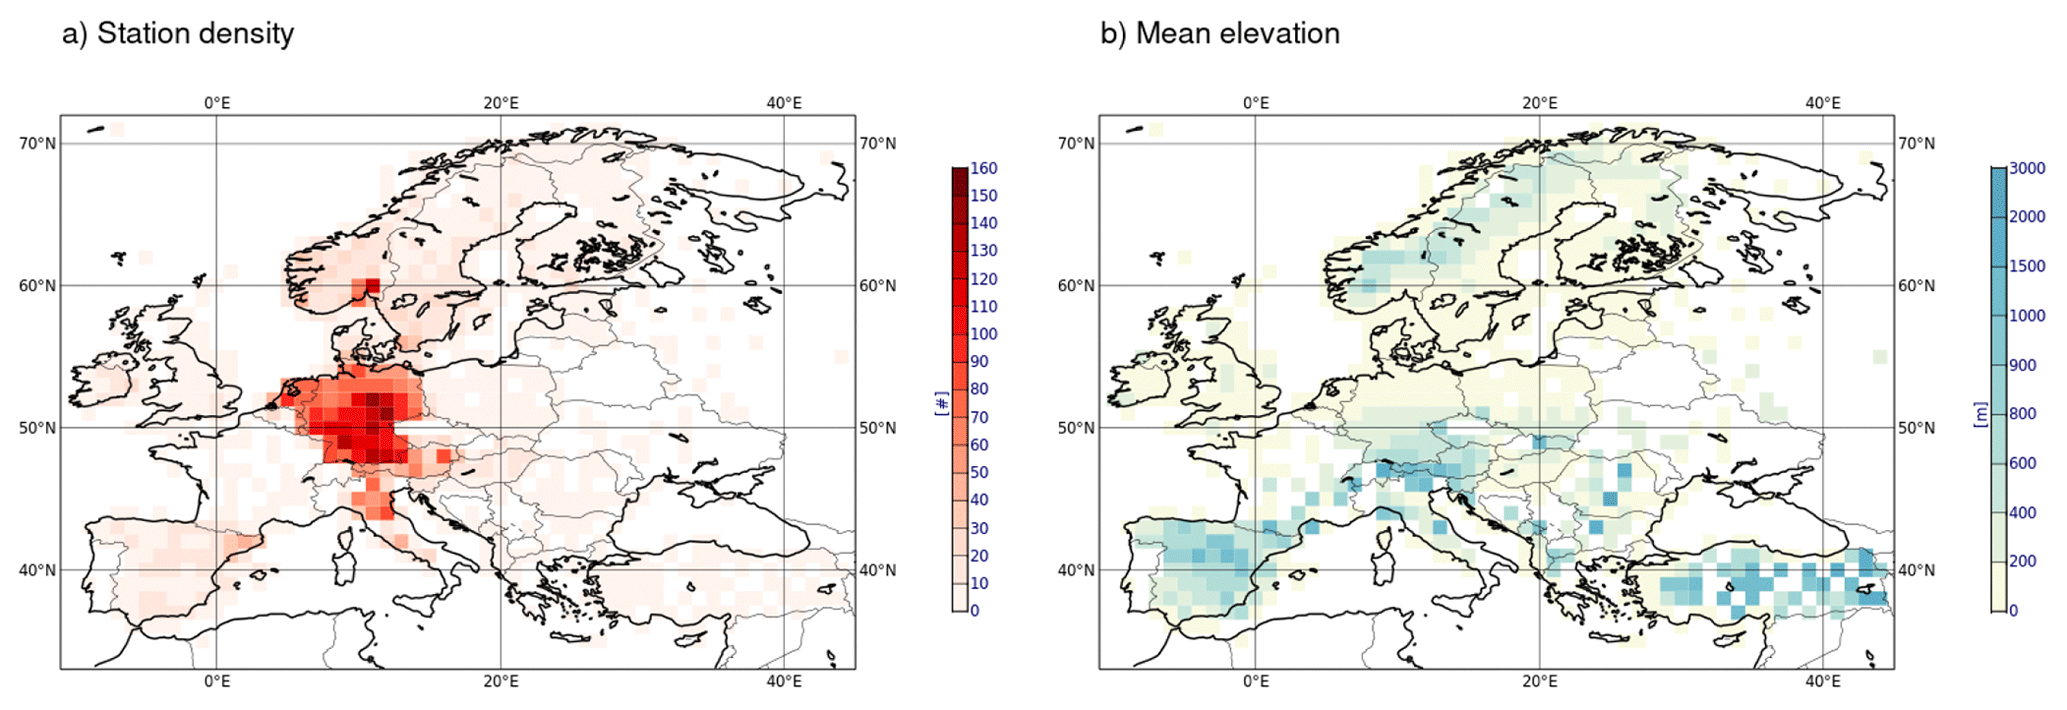
Figure 2Aggregated station statistics over a 1° grid covering the European domain: (a) number of stations per grid box and (b) mean station elevation per grid box.
2.2 SEEPS parameters
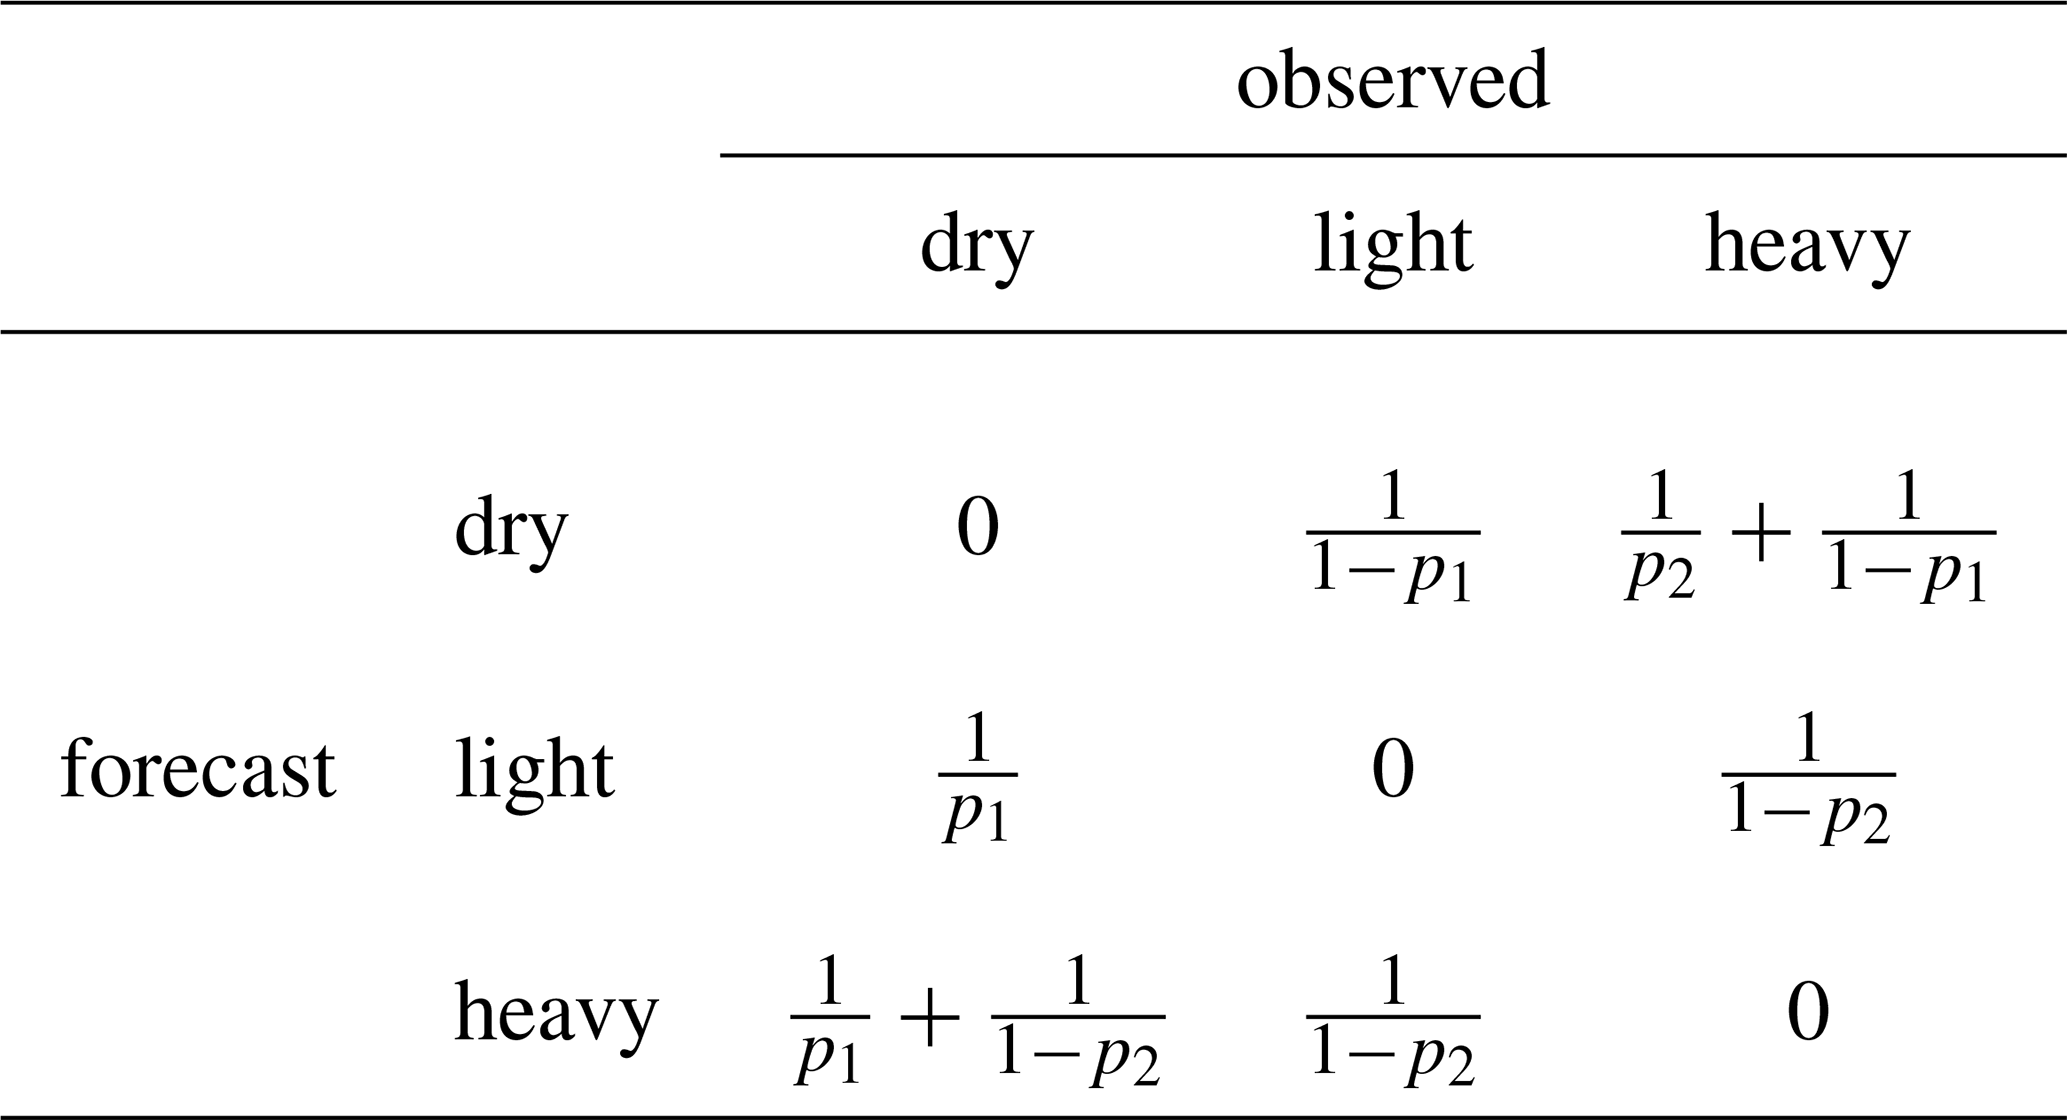
The stable and equitable error in probability space (SEEPS) is introduced and defined in Rodwell et al. (2010). Practically, to compute the score, observations and forecasts are binned into one of the 3 following precipitation categories: dry, light, and heavy. Thresholds denoted t1 and t2 are used to define the switch from dry to light, and from light to heavy, respectively. The climatological probabilities of the observation exceeding t1 and t2 are denoted p1 and p2, respectively. A penalty is applied whenever a forecast and the corresponding observation do not fall in the same category. The penalty applied is a function of the climatology as shown in Table 1.
Table 1SEEPS scoring matrix: We reproduce the SEEPS scoring matrix here, which describes the penalty applied when the observation and forecast categories do not match as in Eq. (15), Rodwell et al. (2010).
In Fig. 3, we show SEEPS parameter values after averaging over grid boxes of size 1°×1° (for visualisation purposes). Figure 3a shows the parameter p1 for August, while Fig. 3b shows the threshold t2 for February. These 2 examples illustrate the geographical variability of the SEEPS coefficients. We see the contrast between Northern and Southern Europe in terms of the probability of rain in Summer (Fig. 3a). We can also note more intense precipitation along the coastline exposed to Westerly winds in Winter (Fig. 3b).
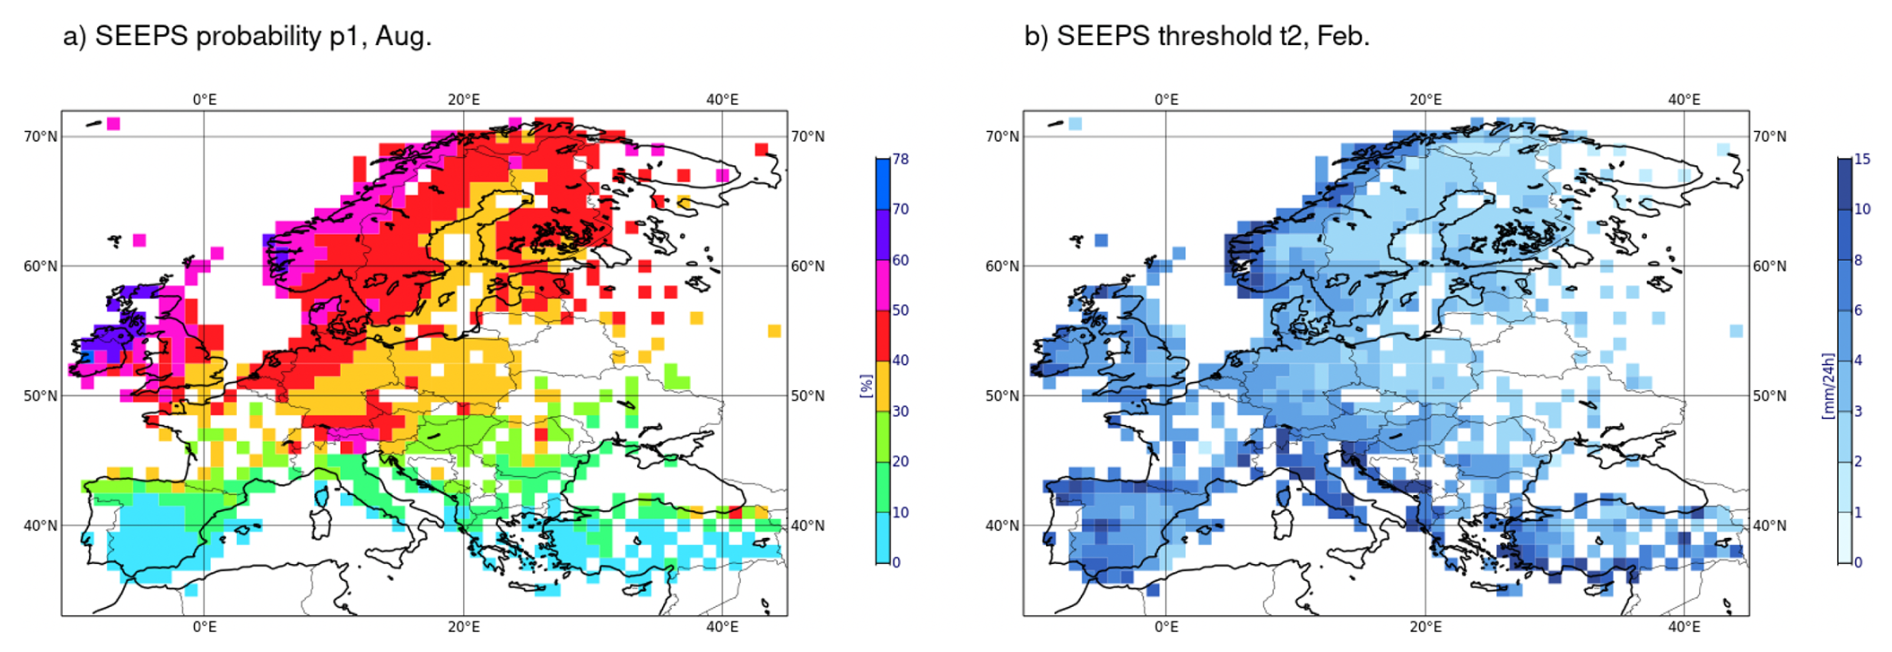
Figure 3Examples of statistics used for the computation of SEEPS: (a) probability of exceeding the first threshold t1 for the month of August and (b) threshold t2 for the month of February.
2.3 Climate percentiles
Climatological frequency can be estimated for more than the 3 categories required for the computation of SEEPS. For example, a climate distribution can be described in the form of percentiles. By definition, observations are expected to exceed the α%-percentile of the climate distribution 100−α% of the time, on average.
Figure 4 show aggregated climatological percentiles over grid boxes of size 1°×1°. Figure 4a and b shows the 95 % and 99 % percentiles of the local daily precipitation climatology, respectively. In other words, there is, on average, a 5 % and a 1 % chance to exceed the thresholds indicated in Fig. 4a and b, respectively. We see that the term “rare events” can refer to very different absolute thresholds (in mm per 24 h) wether one is focusing on the South-Western coast of Norway or on the Eastern coast of Spain.
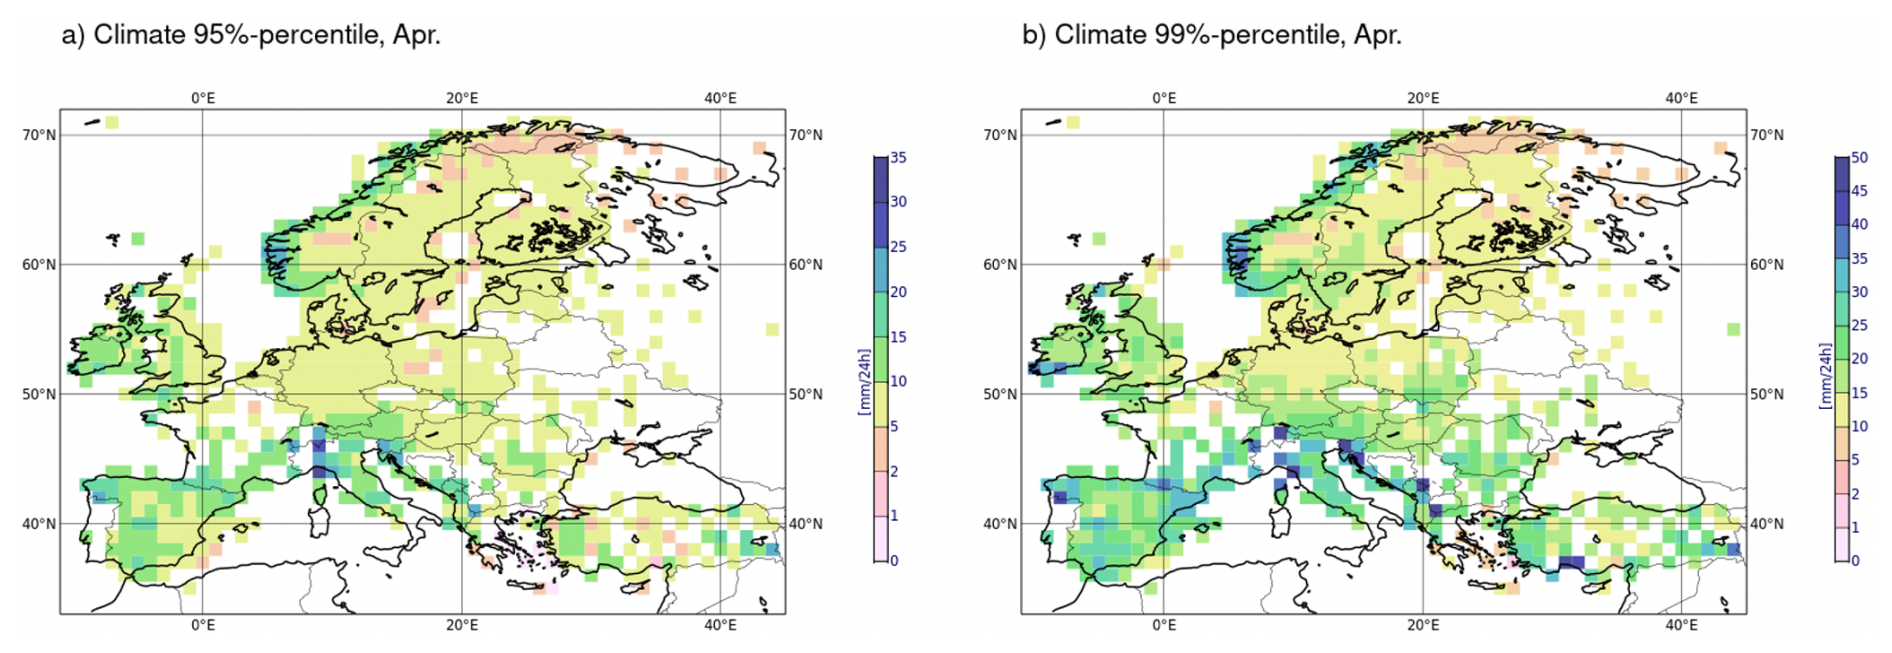
Figure 4Examples of climate statistics used for the computation of threshold-based error metrics: (a) 95 %-percentile and (b) 99 %-percentile for the month of April.
2.4 SEEPS4ALL
With this preamble in mind, we introduce here SEEPS4ALL, a dataset which consists of station measurements of daily precipitation over Europe and the corresponding climate statistics (Ben Bouallègue, 2026). We distinguish 2 sub-datasets. The first one consists of the SEEPS coefficients, that is, the 2 probabilities of exceedance p1 and p2 as well as the 2 corresponding thresholds t1 and t2. The second sub-dataset consists of estimates of local climatology distributions in the form of percentiles at levels 1 %, 2 %, …, 98 %, 99 %. Based on this later, a variety of scores and skill scores can be computed as discussed and illustrated in the next section.
Climate statistics are aligned with the observations and vary for each station and each month of the year. More specifically, SEEPS coefficients and climatological percentiles are estimated over a time window of 30 years (1 January 1991 to 31 December 2020). The maximum sample size at each station and month is 30 times the number of days in the month (so between 840 and 930). SEEPS4ALL observations used for verification cover so far the years 2022, 2023, and 2024.
Verification of daily precipitation forecasts using in-situ observations is the target application. For illustration purposes, we compare here ML-based and NWP forecasts.
ECMWF run an ML-based forecasting system operationally since February 2025. The so-called Artificial Intelligence Forecast System (AIFS, the AI models developed at ECMWF Lang et al., 2024) is complementary to the NWP system based on the Integrated Forecasting System (IFS). We showcase how SEEPS4ALL helps assessing and comparing the forecast performance of AIFS and IFS.
For each new verification exercise, a first necessary step consists in collocating forecasts and observations. We apply the nearest-neighbor approach for this purpose. This collocation step would need to be repeated each time a new forecast is ready to be verified.
For score averaging and plotting, we focus here on a single season (Summer 2024) and assess forecasts initialized at 00:00 UTC with forecast lead times up to 10 d. We distinguish 2 types of forecasts, deterministic and probabilistic ones, and show different scores accordingly. The scripts used to compute the scores and generate the plots presented below are provided along the SEEPS4ALL dataset.
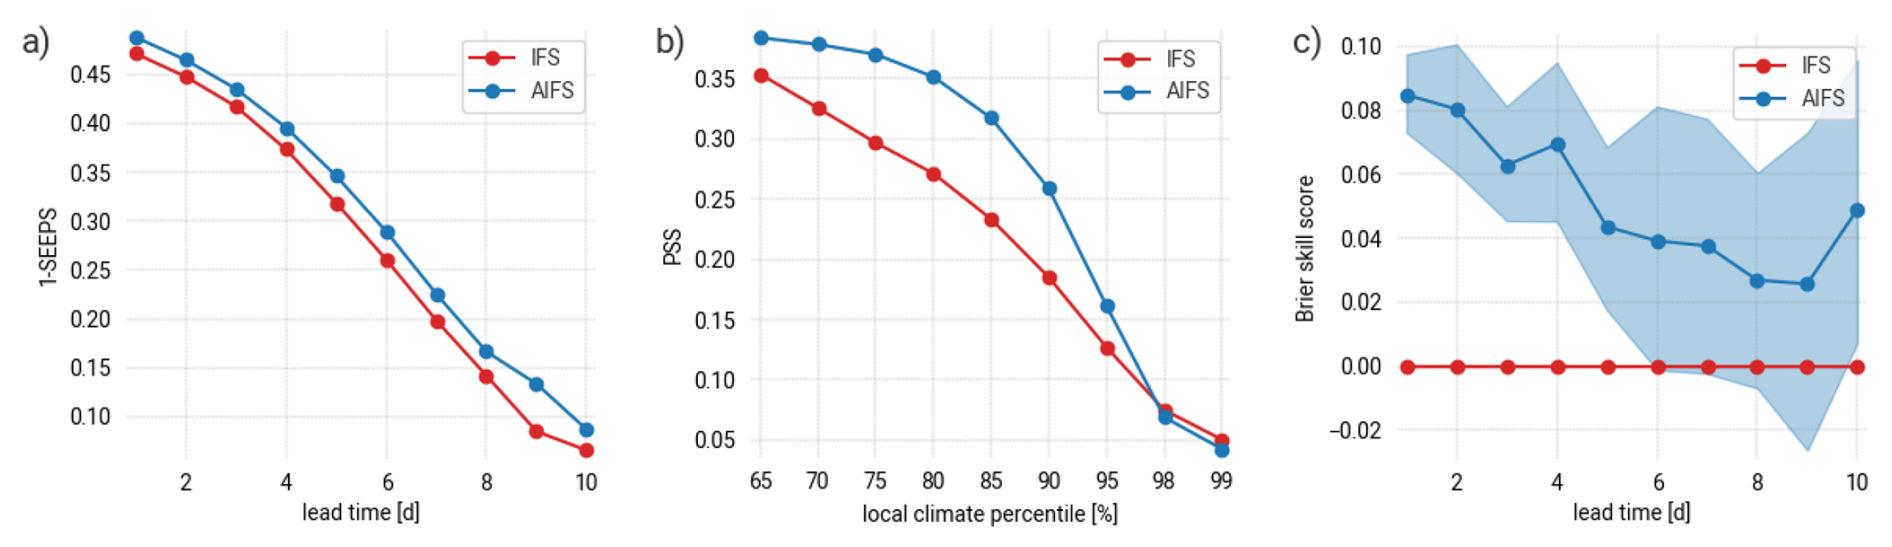
Figure 5Example of verification results for a deterministic and a probabilistic forecast: (a) SEEPS (shown as 1-SEEPS, the higher the better) as a function of the forecast lead time, (b) a contingency table based score (here PSS, the higher the better) as a function of the local climate percentile, (c) the Brier skill score as a function of the forecast lead time using IFS as reference for a rare event defined as daily precipitation exceeding the 95th percentile of the local climatology. The shading indicates the 5 %–95 % confidence interval as estimated with block-bootstrapping.
3.1 Deterministic forecasts
Figure 5a shows SEEPS as a function of the forecast lead time. In this instance, we see that AIFS is outperforming IFS for all lead times. For further investigations, a decomposition of SEEPS is possible as described in North et al. (2013) and implemented in the SEEPS4ALL verification scripts, but not shown here. Note that a station weighting algorithm (following Rodwell et al., 2010) is used to account for the heterogeneous distribution of the stations over the domain as illustrated in Fig. 1.
Another way to better understand the overall forecast performance consists in computing scores for a series of binary events with increasing intensity. For example, Fig. 5b shows the Pierce skill score (PSS Peirce, 1884) as a function of climate percentiles. For each threshold, forecasts and observations are converted into binary variables (yes or no exceeding the threshold), and a contingency table is populated. In addition to PSS, several other scores can be computed based on the 4 elements of the contingency table to assess different aspect of the forecast performance. For example, one can compute the frequency bias index (FBI) to assess the forecast bias (not shown).
3.2 Probabilistic forecasts
Probabilistic forecasts are commonly derived from ensemble forecasts. Alternatively, one can also dress a deterministic forecast: statistical dressing is a simple method to derive a probability distribution from a single-value forecast. For illustration purposes, we dress the forecast with the uncertainty that emerges from the comparison of quantities at different scales: AIFS and IFS are grid-box average forecasts (at 25 and 9 km, respectively), while in-situ observations are point measurements. Here, we use the representativeness model developed in Ben Bouallègue et al. (2020).
So, for a given event, a forecast is now expressed in the form of a probability of occurrence. For instance, one can forecast the probability of daily precipitation exceeding the 95th percentile of the climatology. The Brier score (Brier, 1950) is a standard score for assessing such a probability forecast of a binary event. Skill scores are computed to assess the improvement with respect to a reference forecast. The climatological distribution can serve as a reference. In our example, it would be a constant probability forecast of 5 %. Figure 5c shows the Brier skill score of AIFS forecast using IFS forecast as a reference for this illustration.
The integral of the Brier score over all possible thresholds (in the verification sample) corresponds to the continuous ranked probability score (CRPS), an ubiquitous score in verification exercises of probabilistic forecasts. A threshold/quantile-weighted version of the CRPS has been suggested to emphasize the importance of extreme events in verification. The so-called diagonal score is also the equivalent of SEEPS but for probabilistic forecasts. Both scores are indeed based on the same penalty matrix resulting into equitable scores (Ben Bouallègue et al., 2018).
3.3 Verification scripts
The python code for computing the scores mentioned in this section are made available together with the data. We also share the code for the other necessary (e.g. collocation) or optional (e.g. forecast statistical dressing) elements of the verification process through a GitHub repository (see Sect. 4).
The dataset SEEPS4ALL, the code to generate it, as well as the verification scripts are available through a GitHub repository (https://github.com/ecmwf/rodeo-ai-static-datasets/tree/main/seeps4all, last access: 27 January 2026) and Zenodo (https://doi.org/10.5281/zenodo.18392042, Ben Bouallegue and Prieto Nemesio, 2026). The data is also available through Zenodo with the following DOI: https://doi.org/10.5281/zenodo.18197534 (Ben Bouallègue, 2026). Note that SEEPS4ALL dataset is made available under a Creative Commons Attribution-Non-Commercial License.
SEEPS4ALL is a precipitation dataset consisting of observations at meteorological stations over 3 years (2022–2024 for now), and a set of corresponding climate statistics estimated over 30 years (1991–2020). A climatology is derived separately for each station and each month of the year. The dataset is ready to be used for the verification of daily precipitation forecasts over Europe.
Along with the dataset, SEEPS4ALL also resembles a set of verification tools aiming for:
-
transparency: the verification code is open to all;
-
reproducibility: re-computation of verification metrics is straightforward;
-
benchmarking: a fair comparison of competing forecasts is enabled.
In a nutshell, SEEPS4ALL helps promote the benchmark of daily precipitation forecasts against in-situ observations over Europe.
Beyond SEEPS, the computation of other verification metrics is encouraged. In particular, metrics based on the contingency table are supported. Contingency tables are populated using percentiles of the climatology as thresholds to define weather events. This approach relies on a clear definition of rare events at each station location, separately. Assessment of forecast performance based on cases studies could also be envisaged but not explored in this study.
While SEEPS is an error metric for deterministic forecasts, the diagonal score is the equivalent score for probabilistic forecasts. The design of SEEPS and the diagonal score relies on the same concept of equitability and therefor the same core penalty matrix. The performance of probabilistic can also be scrutinized for a range of precipitation events using, for example, the Brier score.
SEEPS4ALL can be updated with more recent dates as the data source, the ECA&D dataset, is updated regularly. In addition, with the new EU regulation on high value datasets in place, ongoing efforts at meteorological services should lead to a better coverage over Europe in a near future.
Finally, ECA&D offers access to measurements of a variety of weather variables over long periods. While the focus is on daily precipitation for SEEPS4ALL, the same effort could be pursued for the verification of other variables such as 10 m wind speed or 2 m maximum temperature. Verification practitioners would benefit from computing scores using climate statistics also for these applications.
ZBB: Conceptualization, Data curation, Software, Formal analysis, Writing (original draft preparation). APN: Data curation. AIW: Software. FP: data curation. MvdS: data curation, Writing (original draft preparation). UM: Supervision.
The contact author has declared that none of the authors has any competing interests.
Publisher's note: Copernicus Publications remains neutral with regard to jurisdictional claims made in the text, published maps, institutional affiliations, or any other geographical representation in this paper. The authors bear the ultimate responsibility for providing appropriate place names. Views expressed in the text are those of the authors and do not necessarily reflect the views of the publisher.
ZBB, APN, and FP acknowledge support from RODEO, a project co-funded by the European Union for the provision of open access to public meteorological data and development of shared federated data infrastructure for the development of information products and services (grant agreement: no. 101100651). AIW acknowledges the support of the joint fellowship scheme between the European Centre for Medium-Range Weather Forecasts (ECMWF) and the World Meteorological Organisation (WMO).
This research has been supported by the EU HORIZON EUROPE Digital, Industry and Space (grant no. 101100651).
This paper was edited by Tobias Gerken and reviewed by Jonas Bhend and one anonymous referee.
Aguilar, E., Auer, I., Brunet, M., Peterson, T., and Wieringa, J.: Guidelines on Climate Metadata and Homogenization, WMO-TD No. 1186, 2003. a
Alexe, M., Boucher, E., Lean, P., Pinnington, E., Laloyaux, P., McNally, A., Lang, S., Chantry, M., Burrows, C., Chrust, M., Pinault, F., Villeneuve, E., Bormann, N., and Healy, S.: GraphDOP: Towards skilful data-driven medium-range weather forecasts learnt and initialised directly from observations, arXiv [preprint], https://doi.org/10.48550/arXiv.2412.15687, 2024. a
Ben Bouallègue, Z.: SEEPS4ALL version 1.1, Zenodo [data set], https://doi.org/10.5281/zenodo.18197534, 2026. a, b, c
Ben Bouallegue, Z. and Prieto Nemesio, A.: ecmwf/rodeo-ai-static-datasets: v1.0.0 (v1.0.0), Zenodo [code], https://doi.org/10.5281/zenodo.18392043, 2026. a, b
Ben Bouallègue, Z., Haiden, T., and Richardson, D. S.: The diagonal score: Definition, properties, and interpretations, Quarterly Journal of the Royal Meteorological Society, 144, 1463–1473, https://doi.org/10.1002/qj.3293, 2018. a, b
Ben Bouallègue, Z., Haiden, T., Weber, N. J., Hamill, T. M., and Richardson, D. S.: Accounting for Representativeness in the Verification of Ensemble Precipitation Forecasts, Monthly Weather Review, 148, 2049–2062, https://doi.org/10.1175/MWR-D-19-0323.1, 2020. a
Ben Bouallègue, Z., Clare, M. C. A., Magnusson, L., Gascón, E., Maier-Gerber, M., Janoušek, M., Rodwell, M., Pinault, F., Dramsch, J. S., Lang, S. T. K., Raoult, B., Rabier, F., Chevallier, M., Sandu, I., Dueben, P., Chantry, M., and Pappenberger, F.: The Rise of Data-Driven Weather Forecasting: A First Statistical Assessment of Machine Learning–Based Weather Forecasts in an Operational-Like Context, Bulletin of the American Meteorological Society, 105, E864–E883, https://doi.org/10.1175/BAMS-D-23-0162.1, 2024. a
Brier, G. W.: Verification of forecasts expressed in terms of probability, Mon. Wea. Rev., 78, 1–3, https://doi.org/10.1175/1520-0493(1950)078<0001:VOFEIT>2.0.CO;2, 1950. a
Demaeyer, J., Bhend, J., Lerch, S., Primo, C., Van Schaeybroeck, B., Atencia, A., Ben Bouallègue, Z., Chen, J., Dabernig, M., Evans, G., Faganeli Pucer, J., Hooper, B., Horat, N., Jobst, D., Merše, J., Mlakar, P., Möller, A., Mestre, O., Taillardat, M., and Vannitsem, S.: The EUPPBench postprocessing benchmark dataset v1.0, Earth Syst. Sci. Data, 15, 2635–2653, https://doi.org/10.5194/essd-15-2635-2023, 2023. a
Dueben, P. D., Schultz, M. G., Chantry, M., Gagne, D. J., Hall, D. M., and McGovern, A.: Challenges and Benchmark Datasets for Machine Learning in the Atmospheric Sciences: Definition, Status, and Outlook, Artificial Intelligence for the Earth Systems, 1, e210002, https://doi.org/10.1175/AIES-D-21-0002.1, 2022. a
Hamill, T. M. and Juras, J.: Measuring forecast skill: is it real skill or is it the varying climatology?, Quarterly Journal of the Royal Meteorological Society, 132, 2905–2923, https://doi.org/10.1256/qj.06.25, 2006. a
Jin, W., Weyn, J., Zhao, P., Xiang, S., Bian, J., Fang, Z., Dong, H., Sun, H., Thambiratnam, K., and Zhang, Q.: WeatherReal: A Benchmark Based on In-Situ Observations for Evaluating Weather Models, arXiv [preprint], https://doi.org/10.48550/arXiv.2409.09371, 2024. a
Klein Tank, A. M. G., Wijngaard, J. B., Können, G. P., Böhm, R., Demarée, G., Gocheva, A., Mileta, M., Pashiardis, S., Hejkrlik, L., Kern-Hansen, C., Heino, R., Bessemoulin, P., Müller-Westermeier, G., Tzanakou, M., Szalai, S., Pálsdóttir, T., Fitzgerald, D., Rubin, S., Capaldo, M., Maugeri, M., Leitass, A., Bukantis, A., Aberfeld, R., van Engelen, A. F. V., Forland, E., Mietus, M., Coelho, F., Mares, C., Razuvaev, V., Nieplova, E., Cegnar, T., Antonio López, J., Dahlström, B., Moberg, A., Kirchhofer, W., Ceylan, A., Pachaliuk, O., Alexander, L. V., and Petrovic, P.: Daily dataset of 20th-century surface air temperature and precipitation series for the European Climate Assessment, International Journal of Climatology, 22, 1441–1453, https://doi.org/10.1002/joc.773, 2002. a, b
Lang, S., Alexe, M., Chantry, M., Dramsch, J., Pinault, F., Raoult, B., Clare, M. C. A., Lessig, C., Maier-Gerber, M., Magnusson, L., Ben Bouallègue, Z., Nemesio, A. P., Dueben, P. D., Brown, A., Pappenberger, F., and Rabier, F.: AIFS – ECMWF's data-driven forecasting system, arXiv [preprint], https://doi.org/10.48550/arxiv.2406.01465, 2024. a
McNally, A., Lessig, C., Lean, P., Boucher, E., Alexe, M., Pinnington, E., Chantry, M., Lang, S., Burrows, C., Chrust, M., Pinault, F., Villeneuve, E., Bormann, N., and Healy, S.: Data driven weather forecasts trained and initialised directly from observations, arXiv [preprint], https://doi.org/10.48550/arxiv.2407.15586, 2024. a
North, R., Trueman, M., Mittermaier, M., and Rodwell, M. J.: An assessment of the SEEPS and SEDI metrics for the verification of 6 h forecast precipitation accumulations, Meteorological Applications, 20, 164–175, https://doi.org/10.1002/met.1405, 2013. a
Peirce, C.: The numerical measure of the success of predictions, Science, 4, 453–454, 1884. a
Rasp, S., Hoyer, S., Merose, A., Langmore, I., Battaglia, P., Russell, T., Sanchez-Gonzalez, A., Yang, V., Carver, R., Agrawal, S., Chantry, M., Ben Bouallegue, Z., Dueben, P., Bromberg, C., Sisk, J., Barrington, L., Bell, A., and Sha, F.: WeatherBench 2: A Benchmark for the Next Generation of Data-Driven Global Weather Models, Journal of Advances in Modeling Earth Systems, 16, e2023MS004019, https://doi.org/10.1029/2023MS004019, 2024. a
Rodwell, M. J., Richardson, D. S., Hewson, T. D., and Haiden, T.: A new equitable score suitable for verifying precipitation in numerical weather prediction, Quarterly Journal of the Royal Meteorological Society, 136, 1344–1363, https://doi.org/10.1002/qj.656, 2010. a, b, c, d, e, f
Sha, Y., Schreck, J. S., Chapman, W., and Gagne II, D. J.: Improving AI weather prediction models using global mass and energy conservation schemes, arXiv [preprint], https://doi.org/10.48550/arxiv.2501.05648, 2025. a
Wijngaard, J. B., Tank, A. M. G. K., and Können, G. P.: Homogeneity of 20th century European daily temperature and precipitation series, Int. J. Climatol., 23, 679–692, https://doi.org/10.1002/joc.906, 2003. a
Wilks, D. S.: Statistical methods in the atmospheric sciences, 2nd Edn., Academic Press, New York, 627 pp., https://doi.org/10.1016/C2017-0-03921-6, 2006. a
Zhu, X., Xiong, Y., Wu, M., Nie, G., Zhang, B., and Yang, Z.: Weather2K: A Multivariate Spatio-Temporal Benchmark Dataset for Meteorological Forecasting Based on Real-Time Observation Data from Ground Weather Stations, arXiv [preprint], https://doi.org/10.48550/arxiv.2302.10493, 2023. a