the Creative Commons Attribution 4.0 License.
the Creative Commons Attribution 4.0 License.
 | 30 Jul 2026
Mapping complex cropping patterns in China (2018–2021) at 10 m resolution: a data-driven framework based on multi-product integration and Google satellite embedding
Mapping complex cropping patterns and temporal dynamics is of great significance for addressing the challenges faced by agricultural systems. However, in China, annual nationwide maps depicting multiple crops and rotation sequences are still lacking. In this study, we developed a data-driven crop mapping framework by integrating multiple existing crop products with the Google Satellite Embeddings derived from the AlphaEarth foundation model, and produced 10 m resolution mapping of complex cropping patterns across China from 2018 to 2021. Firstly, we integrated multiple publicly available crop mapping products within a harmonized framework that applies a unified cropland extent and cropping intensity, providing a systematic assessment of their consistency at pixel level. Consistency analysis results classify the study area into areas with consistency and areas with confusion, the latter serving as the mapping focus. Then, by combining harmonized crop data layers with random forest classifiers trained on foundation-derived embedding features, our framework effectively enhanced the spatial coherence and temporal stability, achieving an overall accuracy of 92.60 % and an F1 score of 0.7584. Compared with second-level administrative unit (ADM-2) statistics, the mapped cropping areas achieved high consistency (R2= 0.849, RMSE = 4.61 × 10⁴ ha, MAE = 2.07 × 10⁴ ha). The resulting datasets provide an integrated depiction of China's complex cropping systems, enabling consistent interannual assessments of changes in crop types, cropping sequences, and spatial patterns at 10 m resolution, thereby establishing a robust foundation for refined agricultural management and policy decisions, while supporting climate-smart and sustainable land-use planning.
- Article
(20883 KB) - Full-text XML
-
Supplement
(2026 KB) - BibTeX
- EndNote


Ensuring food security is a fundamental objective of the United Nations Sustainable Development Goals (UN, 2015). However, this objective is severely challenged by increasing food demand (Ray et al., 2022), escalating climate-change impacts (Hultgren et al., 2025; Lobell and Di Tommaso, 2025), intensifying land-use conflicts (Liu et al., 2025), and growing environmental concerns (Halpern et al., 2022; Jwaideh and Dalin, 2025). Addressing these intertwined issues requires a transition toward sustainable agricultural intensification, which aims to increase productivity while reducing environmental impacts (Foley et al., 2011; Pretty et al., 2018; Gunton et al., 2016). Cropping patterns management is one of the crucial components of sustainable intensification, referring to the spatial and temporal arrangements of crops in fields, including the selection of crop types and cropping sequences (Qiu et al., 2025b; Blickensdörfer et al., 2022; Shen et al., 2023a; Liu et al., 2022). Well-designed cropping patterns suited to local climatic and field conditions are essential for enhancing agricultural productivity, resource efficiency, and environmental sustainability (Barbieri et al., 2019; Nelson and Burchfield, 2021; Xie et al., 2023; Yang et al., 2024). Especially at the national scale, where agricultural policies are formulated and implemented, improving the understanding of cropping system dynamics is fundamental for ensuring food security and promoting sustainable land use (You and Sun, 2022).
National-scale crop mapping products have largely benefited from government-led agricultural census programs (d'Andrimont et al., 2021), which provide robust ground survey databases that serve as reliable training samples for remote sensing–based supervised classification. These datasets offer detailed and accurate information on crop types, forming the foundation for operational crop mapping systems. For example, the operational production of the U.S. Crop Data Layer (CDL) has been made possible largely through the field survey data provided by the Farm Service Agency (FSA) and the national land cover datasets supplied by the U.S. Department of Agriculture (USDA) (Boryan et al., 2011). Similar large-scale national crop mapping products include Canada's Annual Crop Inventory (ACI) (Fisette et al., 2013), the Crop Map of England (CROME) (Rural Payments Agency, 2025), France's Registre Parcellaire Graphique (RPG) (IGN, 2024), and the Netherlands' Basisregistratie Gewaspercelen (BRP) (RVO, 2026). However, for many other countries and regions, there remain no annually updated, medium- or high-resolution crop distribution datasets.
As the most populous country, China feeds nearly 20 % of the world's population with only about 7 % of global farmland (Cui and Shoemaker, 2018), relying heavily on intensive and multiple-cropping systems. Characterized by highly diverse cropping systems, highly fragmented farmland and extensive multiple cropping, traditional regional-scale mapping approaches often fail to fully capture the complexity of agricultural landscapes in China. In recent years, numerous studies have produced medium-resolution maps for major crops such as maize, rice, wheat and soybean (You et al., 2021; Peng et al., 2023; Li et al., 2023a; Pan et al., 2021; Shen et al., 2023b; Dong et al., 2020a; Liu et al., 2024b; Hu et al., 2024; Mei et al., 2024; Zhang et al., 2024). Dozens of such crop mapping products have been publicly released, with up to seven independent products available for the same crop type. However, these products were generated using different methods and reference samples, and their consistency and accuracy have not been systematically cross-validated. This challenge is further complicated by China's diverse cropping systems, which include not only single cropping per year but also extensive double cropping (Qiu et al., 2024b; Liu et al., 2020). With the increasing availability of multiple crop mapping products derived from diverse sources, recent studies have focused on integrating these datasets to generate harmonized and more reliable representations of crop distribution. For example, some studies have further integrated multi-source crop mapping datasets through scoring-based frameworks. A scoring system was developed to update crop distribution information for 66 countries based on five criteria (specificity, timeliness, spatial resolution, accuracy, and data sources) (Becker-Reshef et al., 2023). Similarly, a global crop map for 80 crop types named CROPGRIDS is produced by integrating 27 existing mapping products using a scoring-rule approach that evaluated both endogenous and exogenous data quality (Tang et al., 2024). In this context, conducting multi-product integration and consistency analysis in China is particularly necessary to build a coherent and systematic foundation for national-scale crop mapping, which is essential for supporting food security assessments and evidence-based agricultural policy-making in a highly complex and dynamic cropping system.
Seasonality is one of the key characteristics that distinguish different crop types (Zhong et al., 2019). However, how to effectively extract and select temporal features remains a central challenge in remote sensing-based crop mapping. Some studies directly use spectral bands or band-derived indices from specific periods of the growing season as the primary inputs for classification algorithms. For crops with distinct temporal signatures, this knowledge-based approach effectively captures phenological differences during key growth stages, enhancing the accuracy of crop mapping. For maize and soybean, pigment- and water-related spectral indices such as the Transformed Chlorophyll Absorption in Reflectance Index (TCARI), Anthocyanin Reflectance Index (ARI), Shortwave Infrared Water Stress Index (SIWSI), and the Greenness and Water Content Composite Index (GWCCI) have been used to characterize variations in chlorophyll concentration and canopy water status (Huang et al., 2022, 2024; Chen et al., 2023). For rice, the combination of Land Surface Water Index (LSWI) and vegetation indices can capture the optical response to surface flooding during the transplanting stage, as represented by the Flooding/Transplanting Index (FTI) (Xiao et al., 2005, 2006; Zhang et al., 2015). Meanwhile, temporal variations in SAR backscattering also enable effective identification of paddy fields (Zhan et al., 2021; Singha et al., 2019; Han et al., 2021). For winter wheat, the temporary vegetation peak before winter dormancy and rapid regreening in early spring distinguish it from other crops (Qiu et al., 2017; Dong et al., 2020b), as reflected in indices such as the Peak Before Winter Feature (PBWF) (Tao et al., 2017) and Winter Wheat Index (WWI) (Qu et al., 2021). As for rapeseed, characterized by its bright yellow canopy during the flowering stage, which produces a strong spectral signal in the visible bands (Sulik and Long, 2015; d'Andrimont et al., 2020; Danylo et al., 2021; Ashourloo et al., 2019). Indices such as the Normalized Difference Yellow Index (NDYI) (Sulik and Long, 2015) and the Winter Rapeseed Index (WRI) (Zhang et al., 2022) can be used to effectively distinguish rapeseed from other winter crops such as wheat. Collectively, these indices represent knowledge-based approaches that leverage key temporal features for crop type differentiation.
However, these methods do not fully utilize observations across the entire growing season, potentially overlooking valuable temporal information (Zhong et al., 2019). They also perform poorly when target crops exhibit complex, subtle, or poorly defined characteristics. A more common approach extracts features from time-series data by applying statistical operations such as calculating the maximum, mean, percentiles, and standard deviation, or by fitting curves to temporal profiles (Zhong et al., 2014; Wang et al., 2020). For instance, You et al. (2021) constructed a rich feature set from Sentinel-2 data, combining 10 d time-series indices, greenest/wettest seasonal composites, and harmonic metrics derived from NDVI, EVI, and LSWI, to produce 10 m resolution maps of maize, soybean, and rice in Northeast China (You et al., 2021). Even without prior knowledge of crop-specific feature differences, this approach can achieve accurate mapping by integrating a broad set of relevant variables into machine learning models trained on reference data.
Traditional crop classification studies rely on the extraction and selection of key spectral, temporal, and phenological features. However, the construction of features and determination of thresholds often depend on expert knowledge, which constrains their generalization across large spatial extents and multi-crop systems. In recent years, the emergence of foundation models has opened a new frontier in remote sensing, where large-scale pre-training on diverse, multi-source, and temporally rich Earth observation data enables the learning of universal land surface representations. Representative examples include SAM (Kirillov et al., 2023), a prompt-driven segmentation model for general image analysis; SatLas (Bastani et al., 2023), a multispectral pretraining framework; and multimodal remote sensing models such as the RingMo-Sence (Sun et al., 2022; Yao et al., 2023) and SkySense (Guo et al., 2024; Wu et al., 2025b). Collectively, these models have driven a paradigm shift from task-specific feature engineering toward general representation learning. Within this context, Google introduced AlphaEarth in 2025, further extending the capabilities of remote sensing foundation models. AlphaEarth integrates multispectral, SAR, and geospatial variables to learn pixel-level embeddings at a global scale, generating the Google Satellite Embeddings (GSE) product (Brown et al., 2025). Compared with traditional crop mapping approaches that rely on handcrafted time-series features, GSE provides annual general representations that, while not explicitly temporal, implicitly encode the seasonal dynamics of crop growth through multi-source fusion (Brown et al., 2025). Although not yet mainstream, this paradigm leverages massive and temporally comprehensive Earth observation datasets to learn transferable features for diverse geospatial applications, including large-scale and temporally consistent crop mapping. These general representations may enable more consistent and scalable characterization of complex cropping systems.
In response to the above challenges and opportunities, this study aims to develop a data-driven crop mapping framework by integrating multiple existing crop products with the Google Satellite Embeddings derived from the AlphaEarth foundation model, which enables 10 m resolution mapping of complex cropping patterns across China annually. Firstly, this study integrates multiple publicly available crop mapping products within a harmonized framework that applies a unified cropland extent and cropping intensity, providing a systematic assessment of their consistency at pixel level. Then, by combining harmonized crop data layers with machine learning models trained on foundation-derived embedding features, our framework effectively enhances the spatial coherence and temporal stability of mapping results. The resulting datasets provide an integrated depiction of China's complex cropping systems, enabling consistent interannual assessments of changes in crop types, cropping sequences, and spatial patterns at 10 m resolution, thereby establishing a robust foundation for refined agricultural management and policy decisions, while supporting climate-smart and sustainable land-use planning.
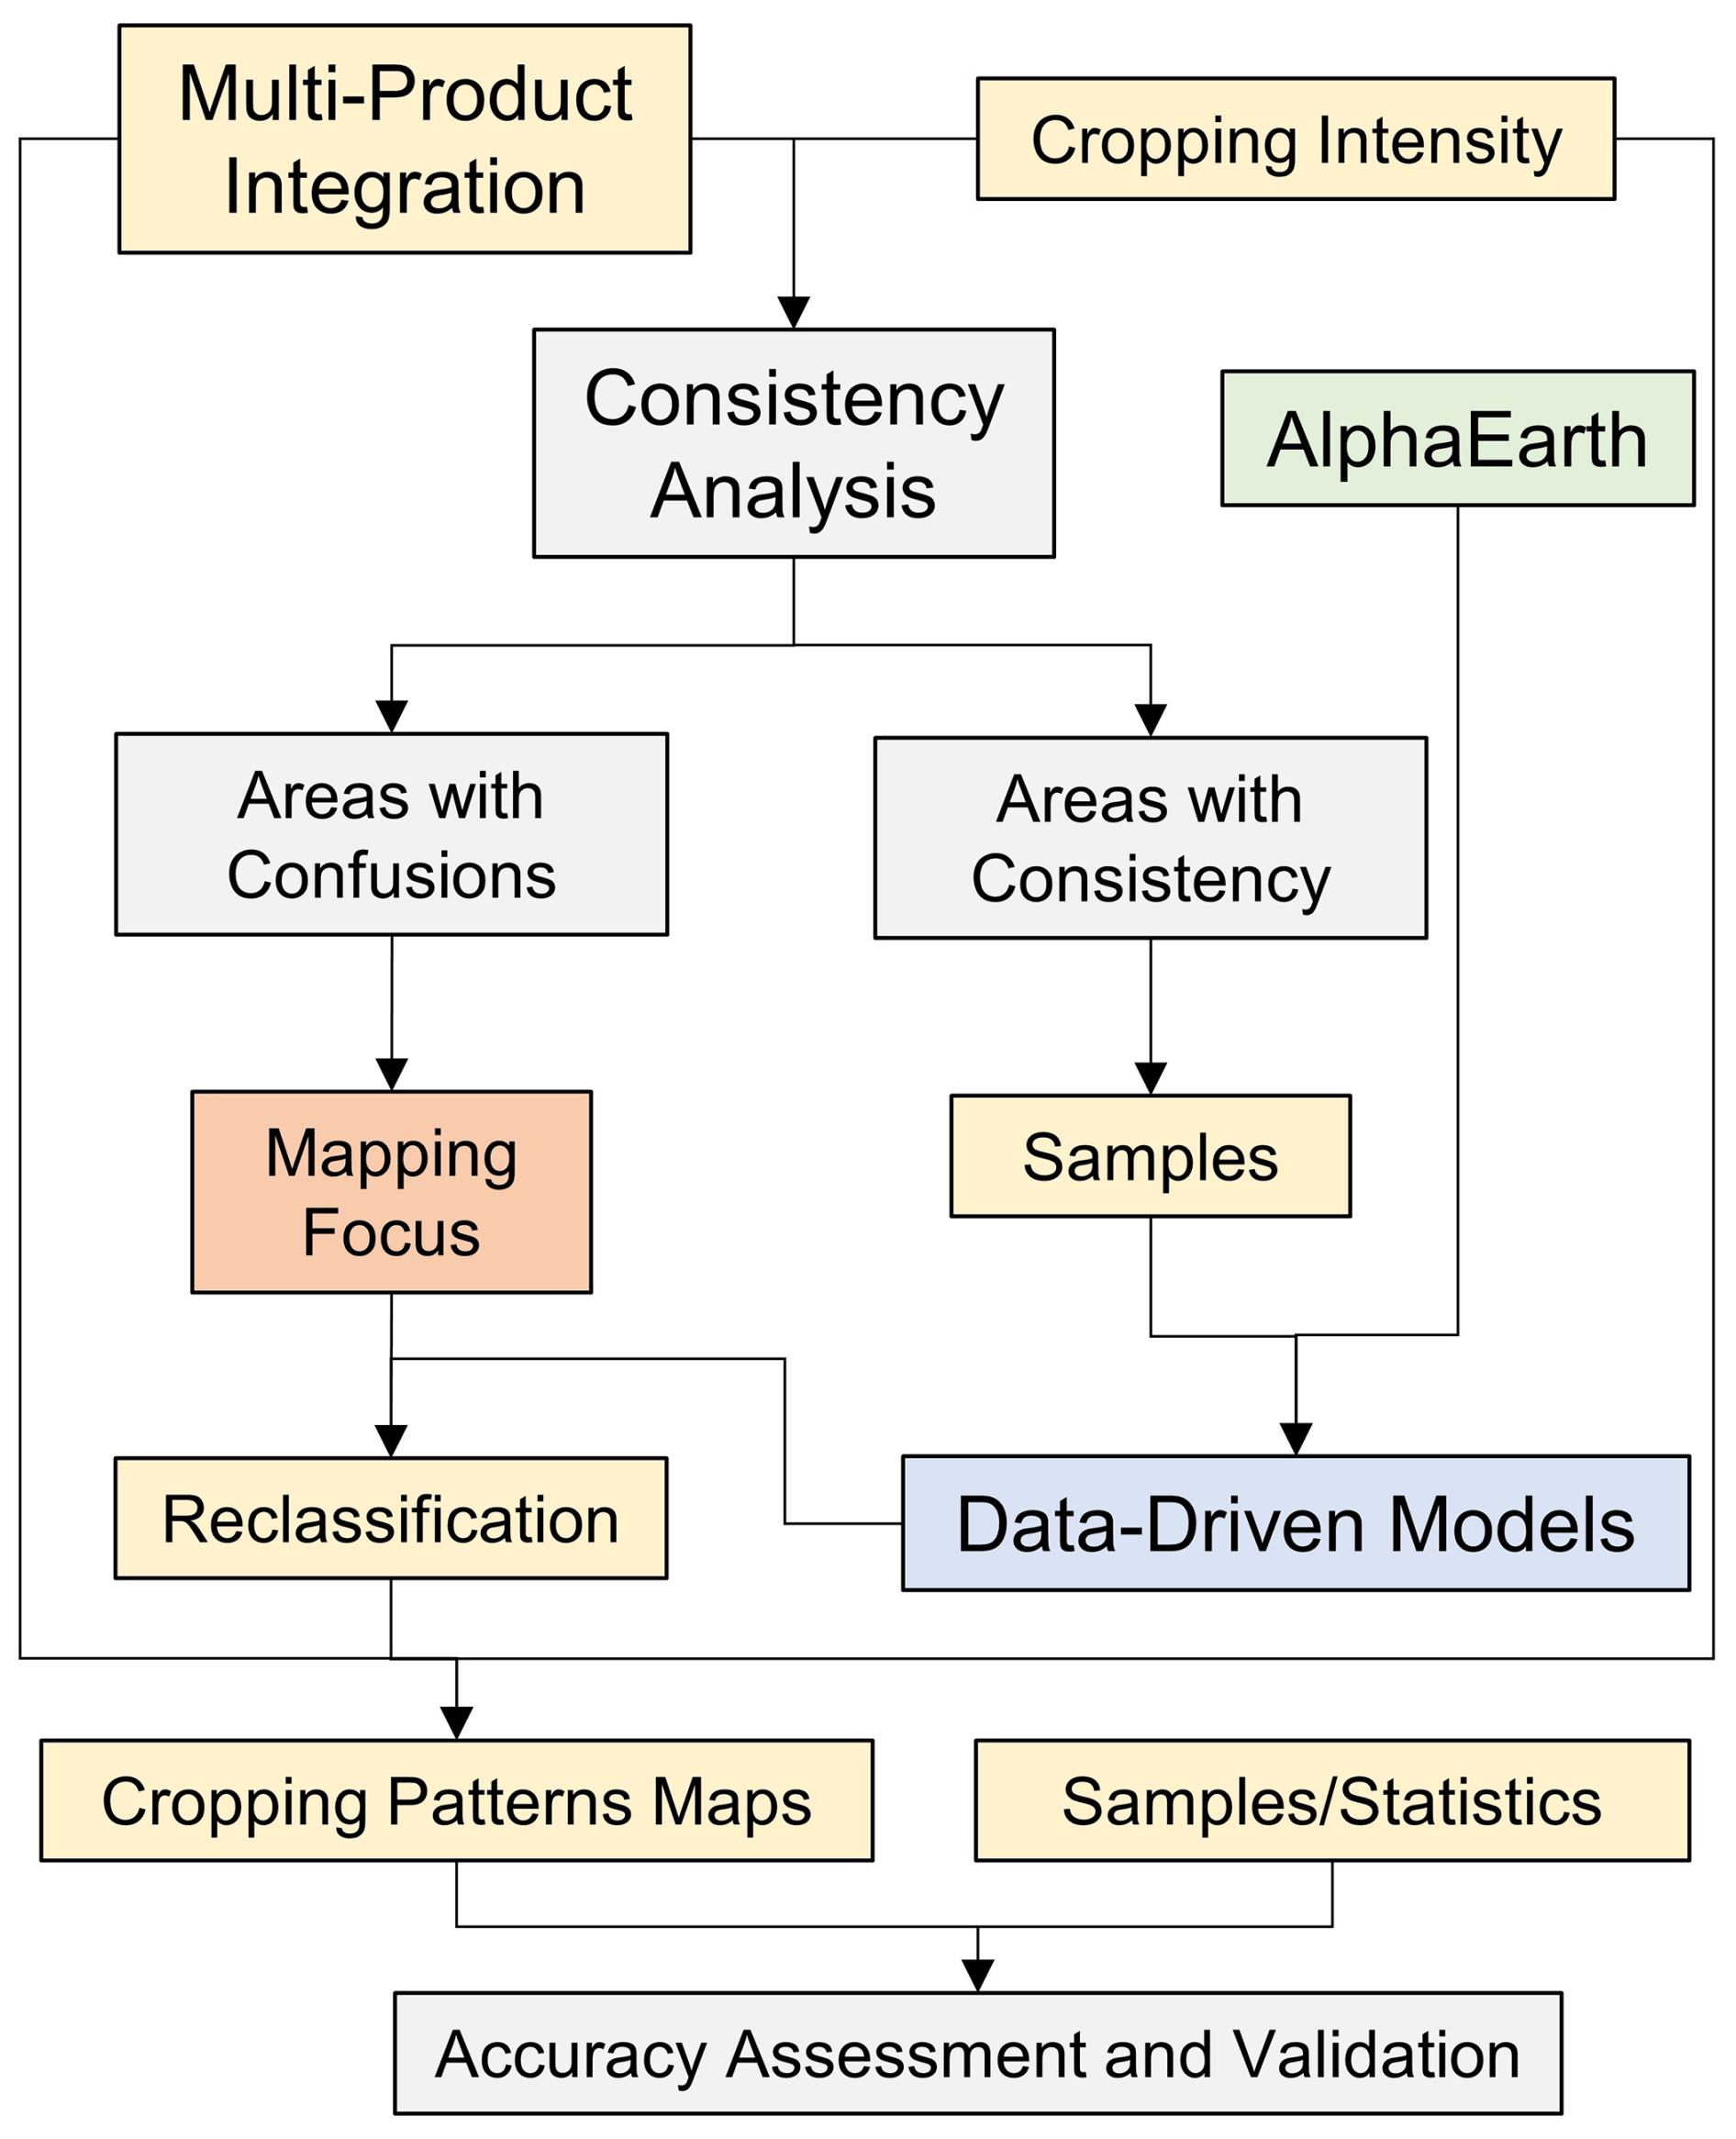
In this study, we developed a data-driven framework for crop mapping that integrates multiple existing crop mapping products with Google Satellite Embeddings derived from the AlphaEarth foundation model, allowing for 10 m-resolution mapping of complex cropping systems in China between 2018 and 2021 (Fig. 1). More specifically, this study integrates multiple publicly available crop mapping products and evaluates their consistency within a harmonized framework that applies a common cropland extent and cropping intensity. Consistency analysis results classify the study area into areas with consistency and areas with confusion, the latter serving as the mapping focus. Then, using the general features derived from Google Satellite Embeddings and samples from areas with consistency, a supervised classification model is trained and applied to the areas with confusion. Finally, the cropping pattern map is evaluated and validated based on the samples and statistical data (Fig. 1).
2.1 Integration of Existing Crop Mapping Products
We synthesize multiple publicly available crop mapping products in China (Table 1). These products include seven major crop types: maize, rice, wheat, soybean, rapeseed, sugarcane, and cotton. Their temporal coverage extends from 2000 to 2022, with more than 15 products available from 2017 to 2021. All datasets are characterized by medium spatial resolution, predominantly 10, 30, and 20 m (Table 1).
Table 1List of publicly available crop mapping products used in this study.
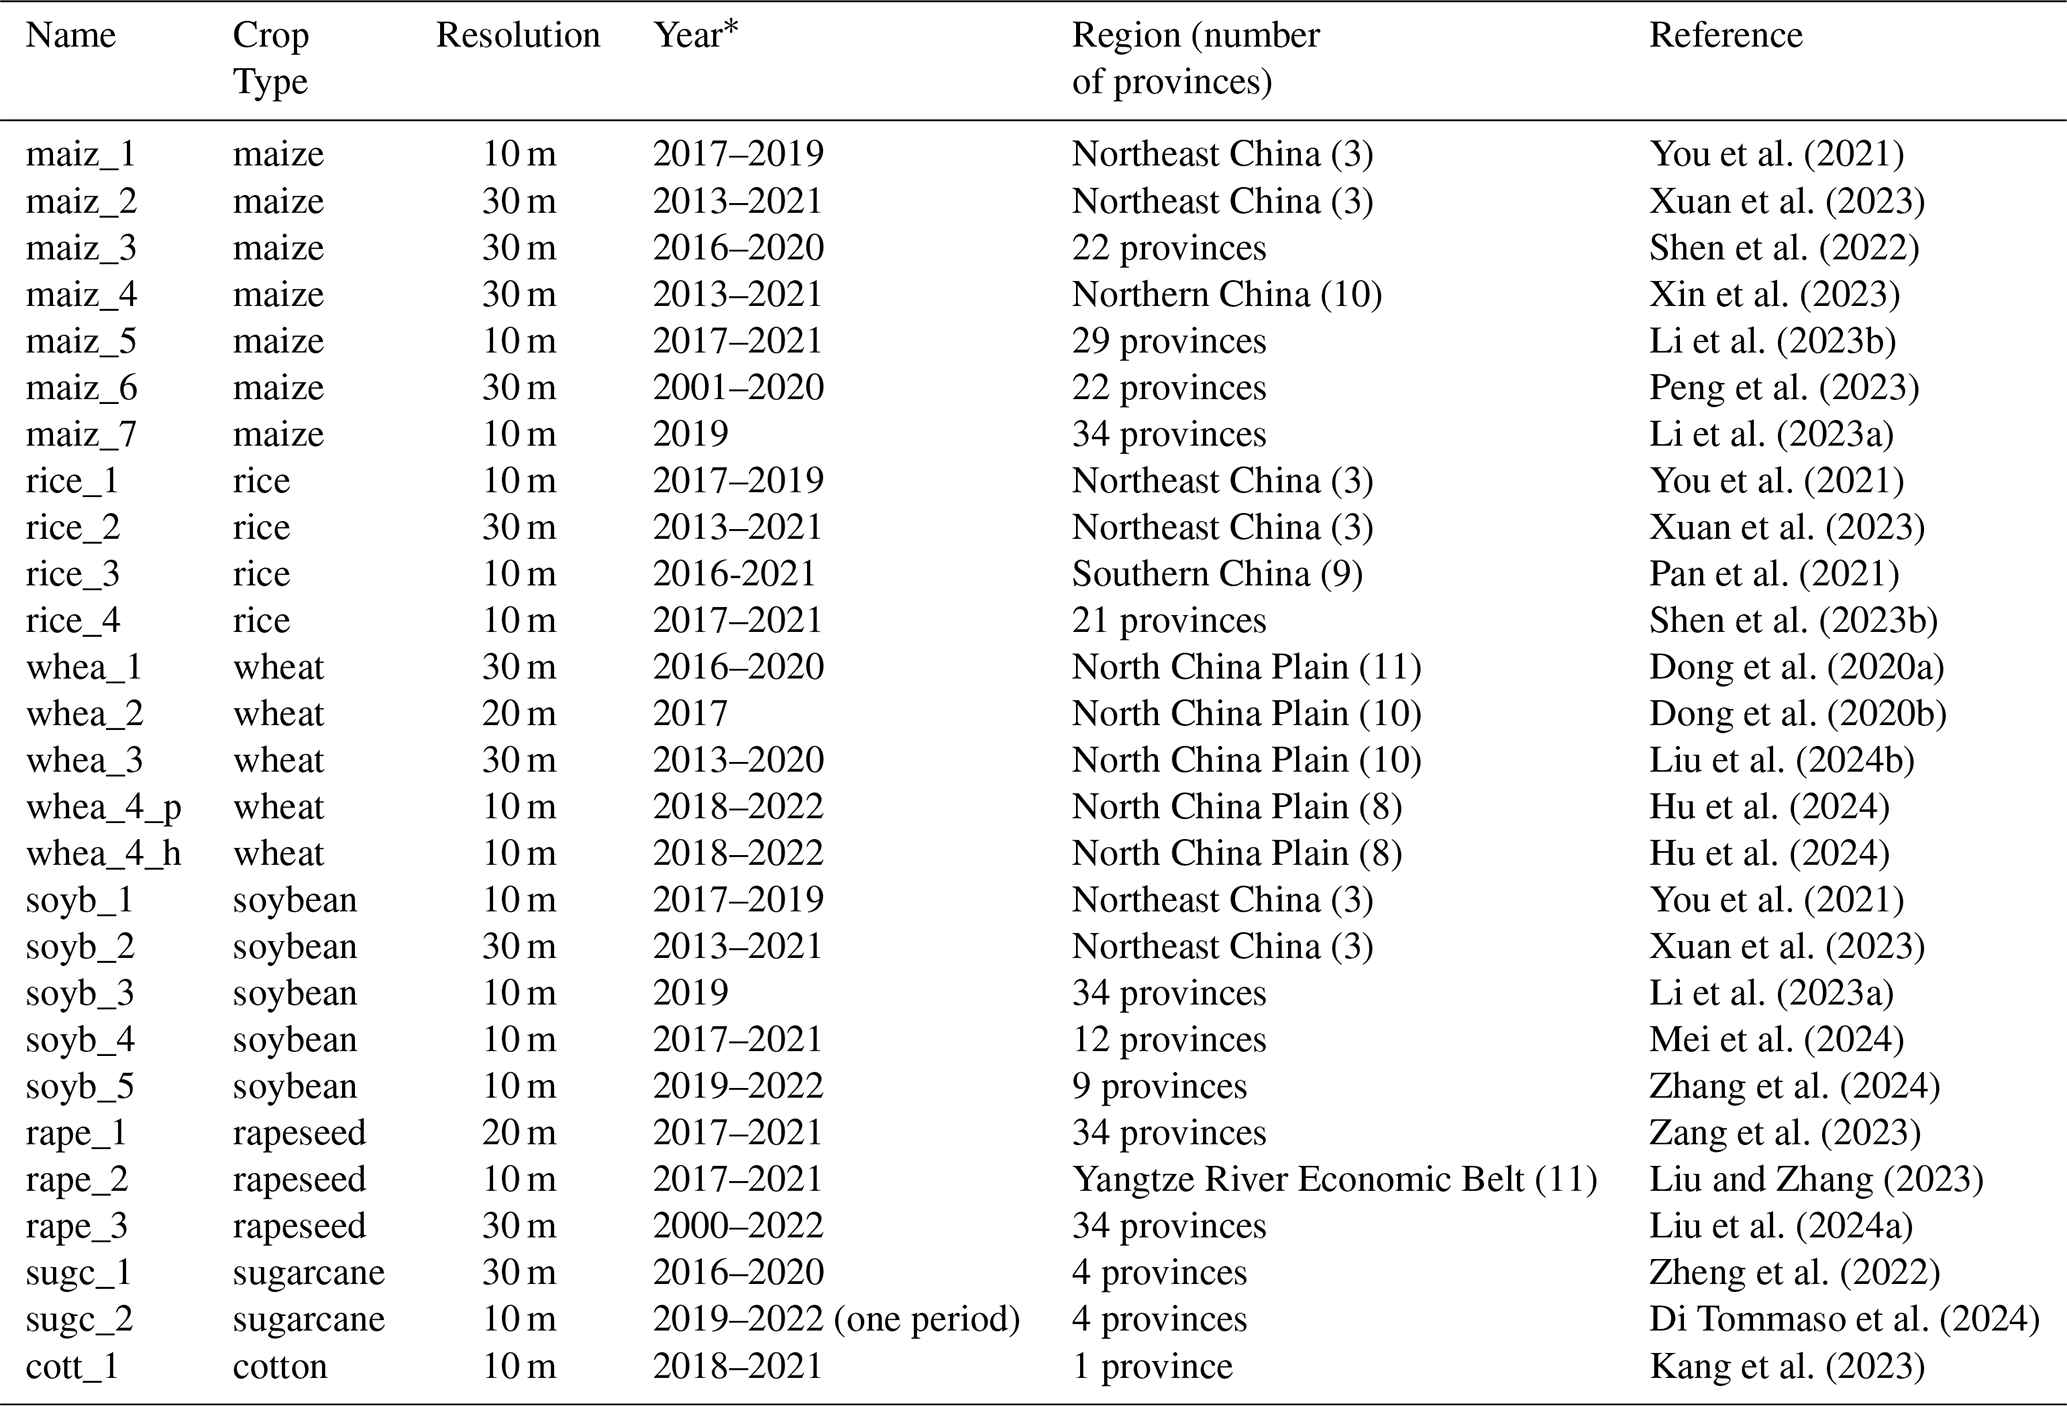
* Some products already included results for 2023 and later at the time this study began, or were released concurrently during the study period. However, these products were too few to allow a comprehensive consistency assessment, therefore, we limited our analysis to mapping products available up to 2022.
To integrate multiple crop mapping products into a single cropping system map, we adopted cropping intensity products derived from optical and SAR time series (Qiu et al., 2023, 2024b). Results were checked by an algorithm specifically designed for China to extract cropping intensity, which identifies crop growth cycles by detecting peaks and troughs in vegetation index time series and applying spectral index thresholds informed by empirical knowledge (Liu et al., 2020). The algorithm was re-implemented on the Google Earth Engine cloud platform to enable large-scale processing. To exclude non-cropland vegetation types from the cropping intensity results, we applied cropland masks derived from two 10 m land cover products. Specifically, we used ESA WorldCover (2020 and 2021) (Zanaga et al., 2021, 2022) and FROM-GLC10 (2017) (Gong et al., 2019). The union of these cropland layers was taken to generate a consistent cropland extent mask.
To begin with, we conducted a consistency assessment of products for the same crop type, focusing on within-type agreement. Specifically, we overlaid all products and calculated CMCI (Crop Map Consistency Index) at 30 m resolution for each crop type (Eq. 1). Before this, crop maps with finer spatial resolution than 30 m were resampled to 30 m and converted into fractions within a 30 m pixel, represented as floating-point values ranging from 0 to 1. Values greater than 0 were treated as 1 in the subsequent analysis.
Here, CMCI refers to Crop Map Consistency Index. CMS refers to Crop Map Sum, defined as the cumulative sum of all crop maps for a given crop type, where 1 indicates presence and 0 indicates absence. CMN denotes the Crop Map Number, which specifies the total count of crop maps available for each crop type in a given area (Province coverages of crop type maps are listed in Table S4 in the Supplement).
At this step, areas with a CMCI greater than 0.8 were classified as a certain crop type, whereas those below this threshold were considered low-consistency areas. Since CMCI was defined at 30 m resolution, only the 10 m crop type pixels (from the 10 m products) inside 30 m pixels with CMCI values greater than 0.8 were assigned to the final map. The threshold of 0.8 was chosen considering that the number of available products for each crop type was generally around five. For crop types with fewer than five products, a threshold of 0.8 corresponds to 100 % agreement. For crop types with five or more products, a threshold of 0.8 allows for one product to be inconsistent, thereby preventing a single low-quality product from disproportionately affecting the final results.
The next step was to incorporate cropping intensity to identify cropping systems and areas where confusion occurred arising from the integration across different crop types. We calculated the number of overlapping crop types (OCTC, Overlapping Crop Type Counts) in each pixel by summing across all crop-type layers (Eq. 2).
Here, OCTC refers to Overlapping Crop Type Counts. CMCIi refers to Crop Map Consistency Index of certain crop type. t denotes the predefined threshold (set to 0.8 in this study).
Pixels where the number of overlapping crop types (OCTC) was greater than the estimated cropping intensity were assigned to Confused area, while pixels with a cropping intensity value greater than 0 but no coverage from existing crop mapping products in our framework (OCTC = 0) were assigned to Unlabeled. All remaining pixels (i.e., OCTC ≤ cropping intensity and OCTC > 0) were considered Consistent. As for the classification system of Consistent areas, we defined seven single-cropping types, namely maize, rice, wheat, soybean, rapeseed, sugarcane, and cotton. In the case of multi-cropping systems, we explicitly assigned the following five main crop sequences: wheat–maize, wheat–rice, double rice, rapeseed–rice, and wheat–soybean. All other combinations in the multi-cropping systems were classified as other multi-cropping.
In summary, our framework categorizes inconsistencies arising from integrating existing crop mapping products into three classes: Confused, Low-consistency, and Unlabeled in our framework. The Confused class refers to pixels where two or more crop types exceeding the cropping intensity were assigned within the same pixel, while the Low-consistency class represents pixels that were not consistently identified as a given crop type by the majority of crop mapping products of the same category. The Unlabelled class indicates pixels that were not assigned to any crop type within the consistency assessment framework of this study.
2.2 Reclassification in Crop Type Confusion Areas
In this part, we trained classifiers to reclassify crop type confusion areas across the annual maps for the period 2018–2021. Sample points were collected based on the integrated 10 m multi-crop map, which served as a reliable source since it was derived from multiple datasets and validated through consistency analysis (Fig. 2). To ensure local spatial homogeneity, a 3 × 3 neighborhood homogeneity filter was applied. Following common practices in large-scale land cover and cropland mapping studies (Gong et al., 2013; Tu et al., 2024), nearly 1000 hexagonal grids were generated to cover the entire study area of China. Within each hexagon, stratified random sampling was conducted for the specified crop classes, with 50 samples per class collected from valid pixels (Fig. 2).
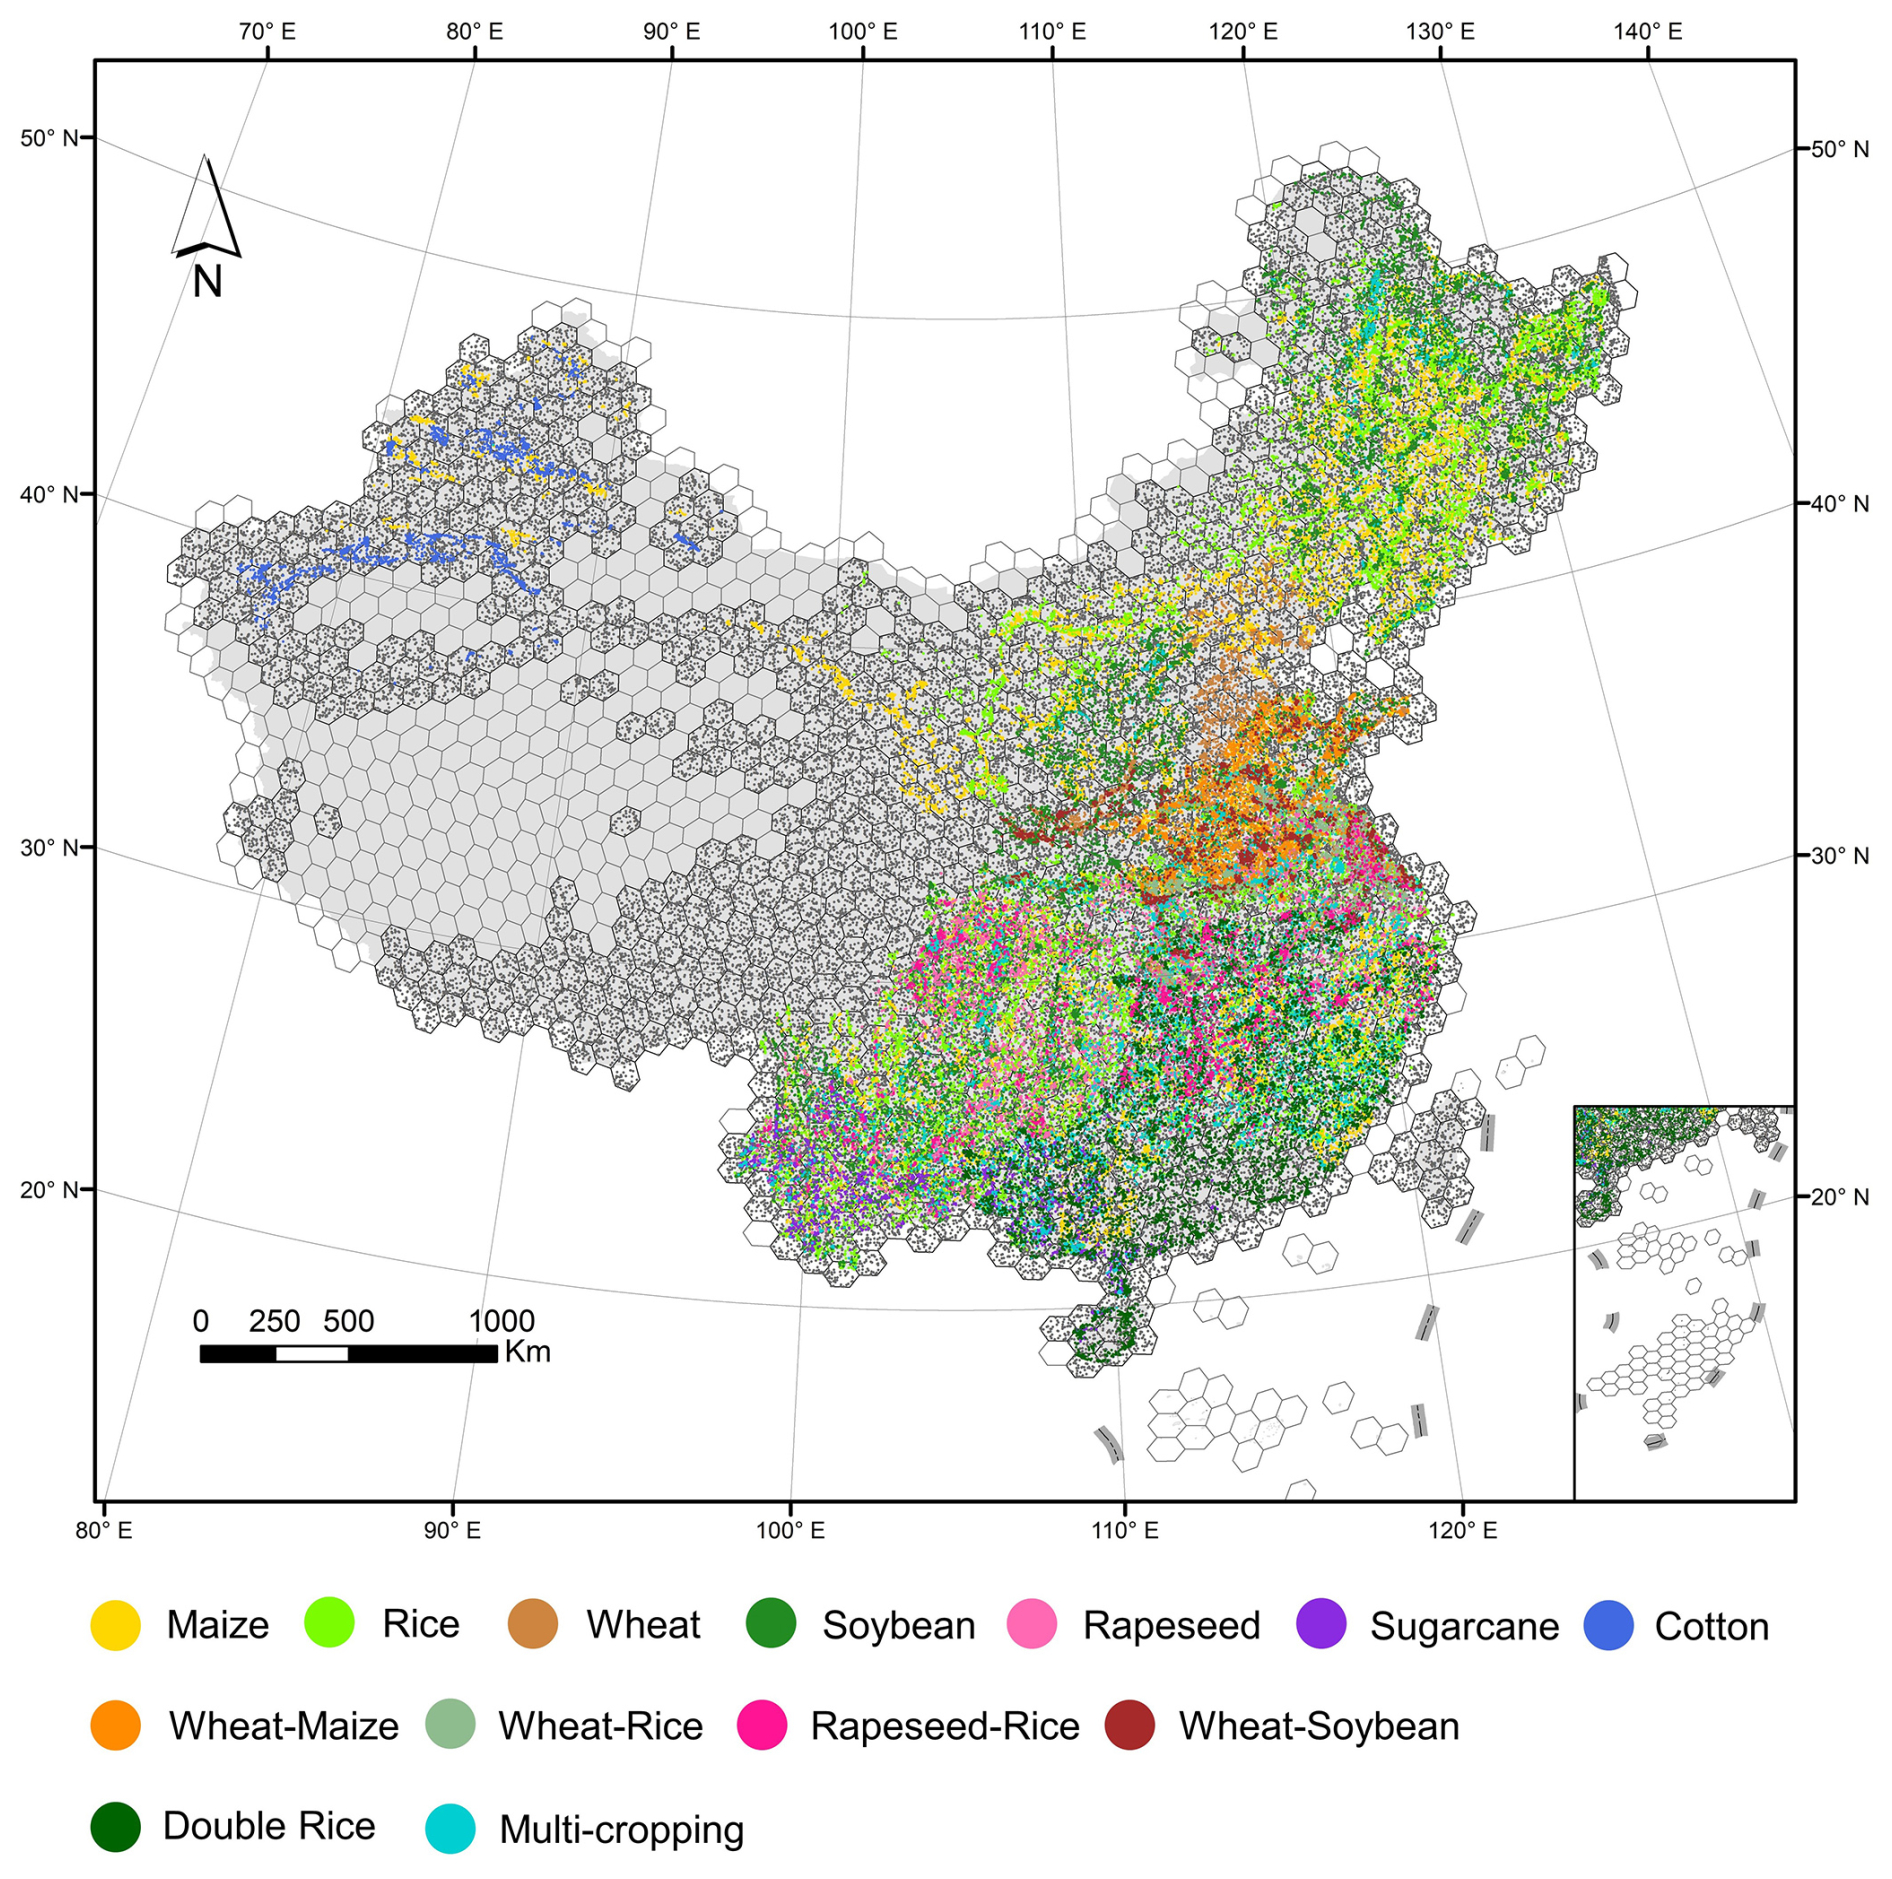
Figure 2Spatial distribution of crop type samples used in this study (taking the year 2020 as an example).
We used the Google Satellite Embedding dataset as the input to the classifier. This dataset is a global, analysis-ready collection of 10 m geospatial embeddings generated by the AlphaEarth Foundations model v2.1 (Brown et al., 2025). Each pixel is represented by a 64-dimensional embedding vector that summarizes annual temporal trajectories of surface conditions derived from multi-source Earth observation data streams, including optical, radar, LiDAR, and ancillary products. Unlike conventional spectral indices, these embeddings are unit-length feature vectors distributed across the unit sphere, making them particularly suitable for clustering, classification, and change detection tasks (Brown et al., 2025). For our analysis at this step, we employed the annual embedding products covering the period 2018–2021.
Random Forest (RF) was adopted to classify multiple crop types in this study. RF is an ensemble machine learning algorithm that constructs an ensemble of decision trees from random subsets of training data and input features (Breiman, 2001). The final prediction is obtained by majority voting across the ensemble. Due to its high accuracy, resilience to noise and overfitting, and capacity to process high-dimensional data, it has been widely used in remote sensing-based land cover and crop type mapping (Yu et al., 2025b; Qiu et al., 2025b). More specifically, we use the Random Forest algorithm implemented in the Google Earth Engine platform to build the classifier. The number of decision trees is set to 500, the number of features required for each node for splitting is set to the square root of the number of input features, and other parameters were also set to the default. To capture regional heterogeneity, the RF classification was partitioned using the Agro-Natural Regionalization of China, a climatic-geographic framework dividing the country into 38 sub-regions by temperature and precipitation (See more details in Supplement Information). Due to the complexity of multi-crop confusion, we employed a binarization strategy that decomposes the multi-class problem into a set of binary classification tasks (Galar et al., 2011; Li et al., 2023a). Specifically, we applied a one-vs-all decomposition approach (Adnan and Islam, 2015), training random forest classifiers independently for each crop type. For example, in the case of maize, the samples were separated into maize and non-maize categories, with 70 % of the samples used for training and the remaining 30 % for validation. The classifier outputs were set as binary probabilities, which were subsequently aggregated across all crop types to generate the final multi-class classification results following the rules below. As for single cropping (pixels with a cropping intensity of 1), the crop type was assigned according to the highest RF-derived probability. For multi-cropping areas (pixels with a cropping intensity greater than 1), the assignment was determined based on the RF-derived probabilities of the possible cropping sequence combinations. In the case of the unlabelled and low-consistency areas (excluding the confused class), pixel assignment was conducted only when the RF-derived probability exceeded 0.5 for single-cropping areas, or when the sum of RF-derived probabilities for two cropping types exceeded 1 in double-cropping systems. After this step, pixels that remained unassigned were further labelled according to their cropping intensity, with “Unlabelled” assigned to single-cropping areas and “Multi-cropping” assigned to areas with multiple cropping cycles.
2.3 Accuracy assessment and validation
Based on the samples from the integrated crop map, we conducted an accuracy assessment of the classifiers. More specifically, we computed a group of accuracy metrics, including F1, Omission error (1-Producer's Accuracy (PA)), and Commission error (1-User's Accuracy (UA)) based on the confusion matrix. The F1 score was adopted as the primary accuracy indicator, as it reflects the harmonic balance between user's accuracy (UA) and producer's accuracy (PA), ranging from 0 (worst) to 1 (best). To enable spatial and temporal comparisons, the accuracy metrics were summarized at multiple aggregation levels (hex grid and ADM-1 level). For each combination of region, crop type, and year, we first derived the confusion counts from all validation samples within that unit and recomputed the corresponding accuracy metrics. For broader summaries (e.g., across years, regions, or crop categories), we applied a micro-averaging approach, in which confusion counts were summed across all groups before metric computation. This sample-size–weighted approach provides a consistent and representative measure of classification performance across spatial and temporal scales.
In addition, we further validated our mapping products using official crop statistics (ADM-1 and ADM-2 levels). Firstly, crop harvest areas were aggregated by individual crop category at the ADM-1 and ADM-2 levels, where each crop in multi-cropping systems was treated as an independent crop type and counted separately, so that multiple crops coexisting within the same pixel during a year were all included in the aggregated harvested area statistics. Then, the consistency between datasets was evaluated using three indicators: the coefficient of determination (R2) for correlation strength (higher is better), the root mean square error (RMSE) for overall deviation magnitude, and the mean absolute error (MAE) for average absolute deviation (both lower are better). We further examined this through an ordinary least squares (OLS) regression analysis to quantify the linear dependence between our estimates and the reference statistics. ADM-1 level statistical data was acquired from China's economic and social big data research platform operated by China National Knowledge Infrastructure, while the ADM-2 level statistics were derived from recent crop maps of China that were spatially disaggregated based on ADM-2 level agricultural statistics (Dai et al., 2025).
3.1 Consistency Analysis Result
Consistency analysis results indicate that the various crop mapping products are not fully consistent. According to the framework established in this study, these inconsistent areas were categorized into three classes: Confused, Low-consistency, and Unlabelled. As shown in Fig. 3, Confused areas are mainly distributed in northeastern China (particularly in the northeastern part of the three northeastern provinces), the North China Plain, and Yunnan Province, predominantly located to the east of the Hu Huanyong Line, a geographic demarcation separating the densely populated eastern China from the sparsely populated western regions (Fig. 3a). Low-consistency areas are concentrated in northern croplands, including Xinjiang, Inner Mongolia, the three northeastern provinces, and Yunnan Province (Fig. 3b). Unlabelled areas are mainly distributed in western China (west of the Hu Huanyong Line), showing an opposite pattern to the Confused areas (Fig. 3c). The spatial distribution of Confused areas shows certain similarities with cropland distribution, whereas Low-consistency and Unlabelled areas are less consistent with the spatial pattern of cropland (Fig. 3d). Subsequent data-driven crop mapping frameworks will therefore focus on these three categories: Confused, Low-consistency, and Unlabelled regions.
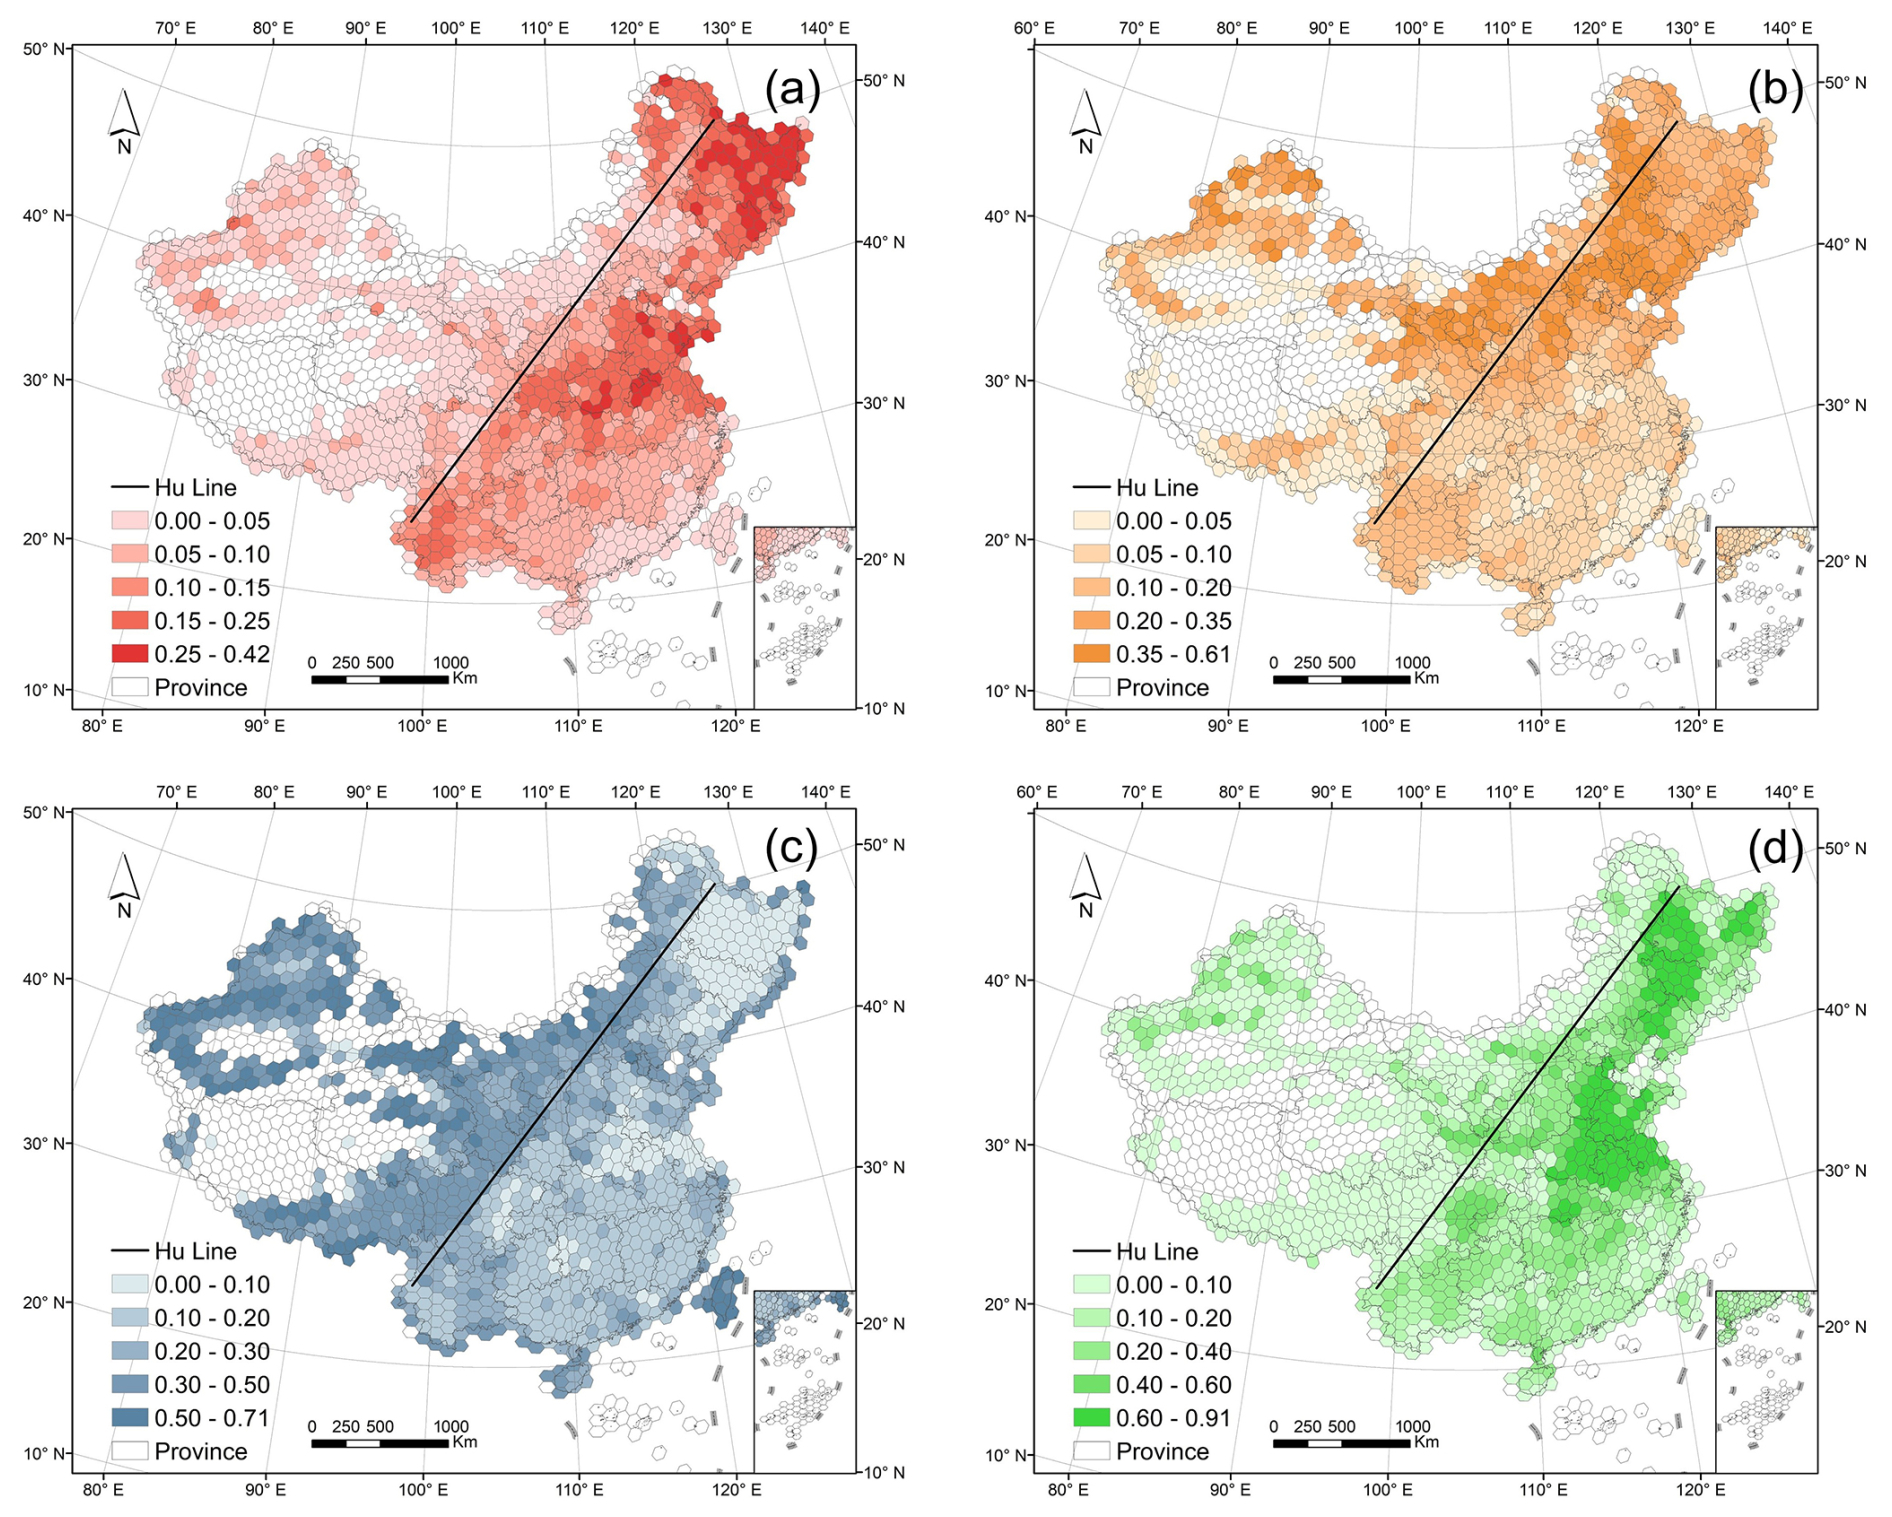
Figure 3Proportional distribution of cropland and uncertain classes (Confused, Low-consistency, Unlabelled). (a) Proportional distribution of Confused areas. (b) Proportional distribution of Low-consistency areas. (c) Proportional distribution of Unlabelled areas. (d) Proportional distribution of Cropland.
3.2 Accuracy assessment
This section provides an integrated assessment of classification performance (Fig. 4). Overall, our framework effectively enhanced the spatial coherence and temporal stability, achieving an overall accuracy of 92.60 % and an F1 score of 0.7584. As for spatial variation, the majority of regions exhibited F1 scores above 0.65, with values exceeding 0.75 in northern areas (Fig. 4a, b). Provinces with relatively low F1 scores were mainly located in southern China, including Yunnan, Guizhou, Chongqing, and Fujian. The Omission Error (OE) was generally below 0.30 across most northern regions of China, whereas predominantly higher than 0.30 in southern regions in southern regions, indicating more severe omission issues (Fig. 4c, d). The Commission Error (CE) remained below 0.20 in most parts of the country (Fig. 4e, f), although relatively higher CE values were observed in provinces such as Gansu and Anhui. Compared with the northern regions, the southern regions are characterized by more diverse crop types, extensive multiple cropping systems, and highly fragmented farmland, which collectively led to lower classification performance of the model in the south.
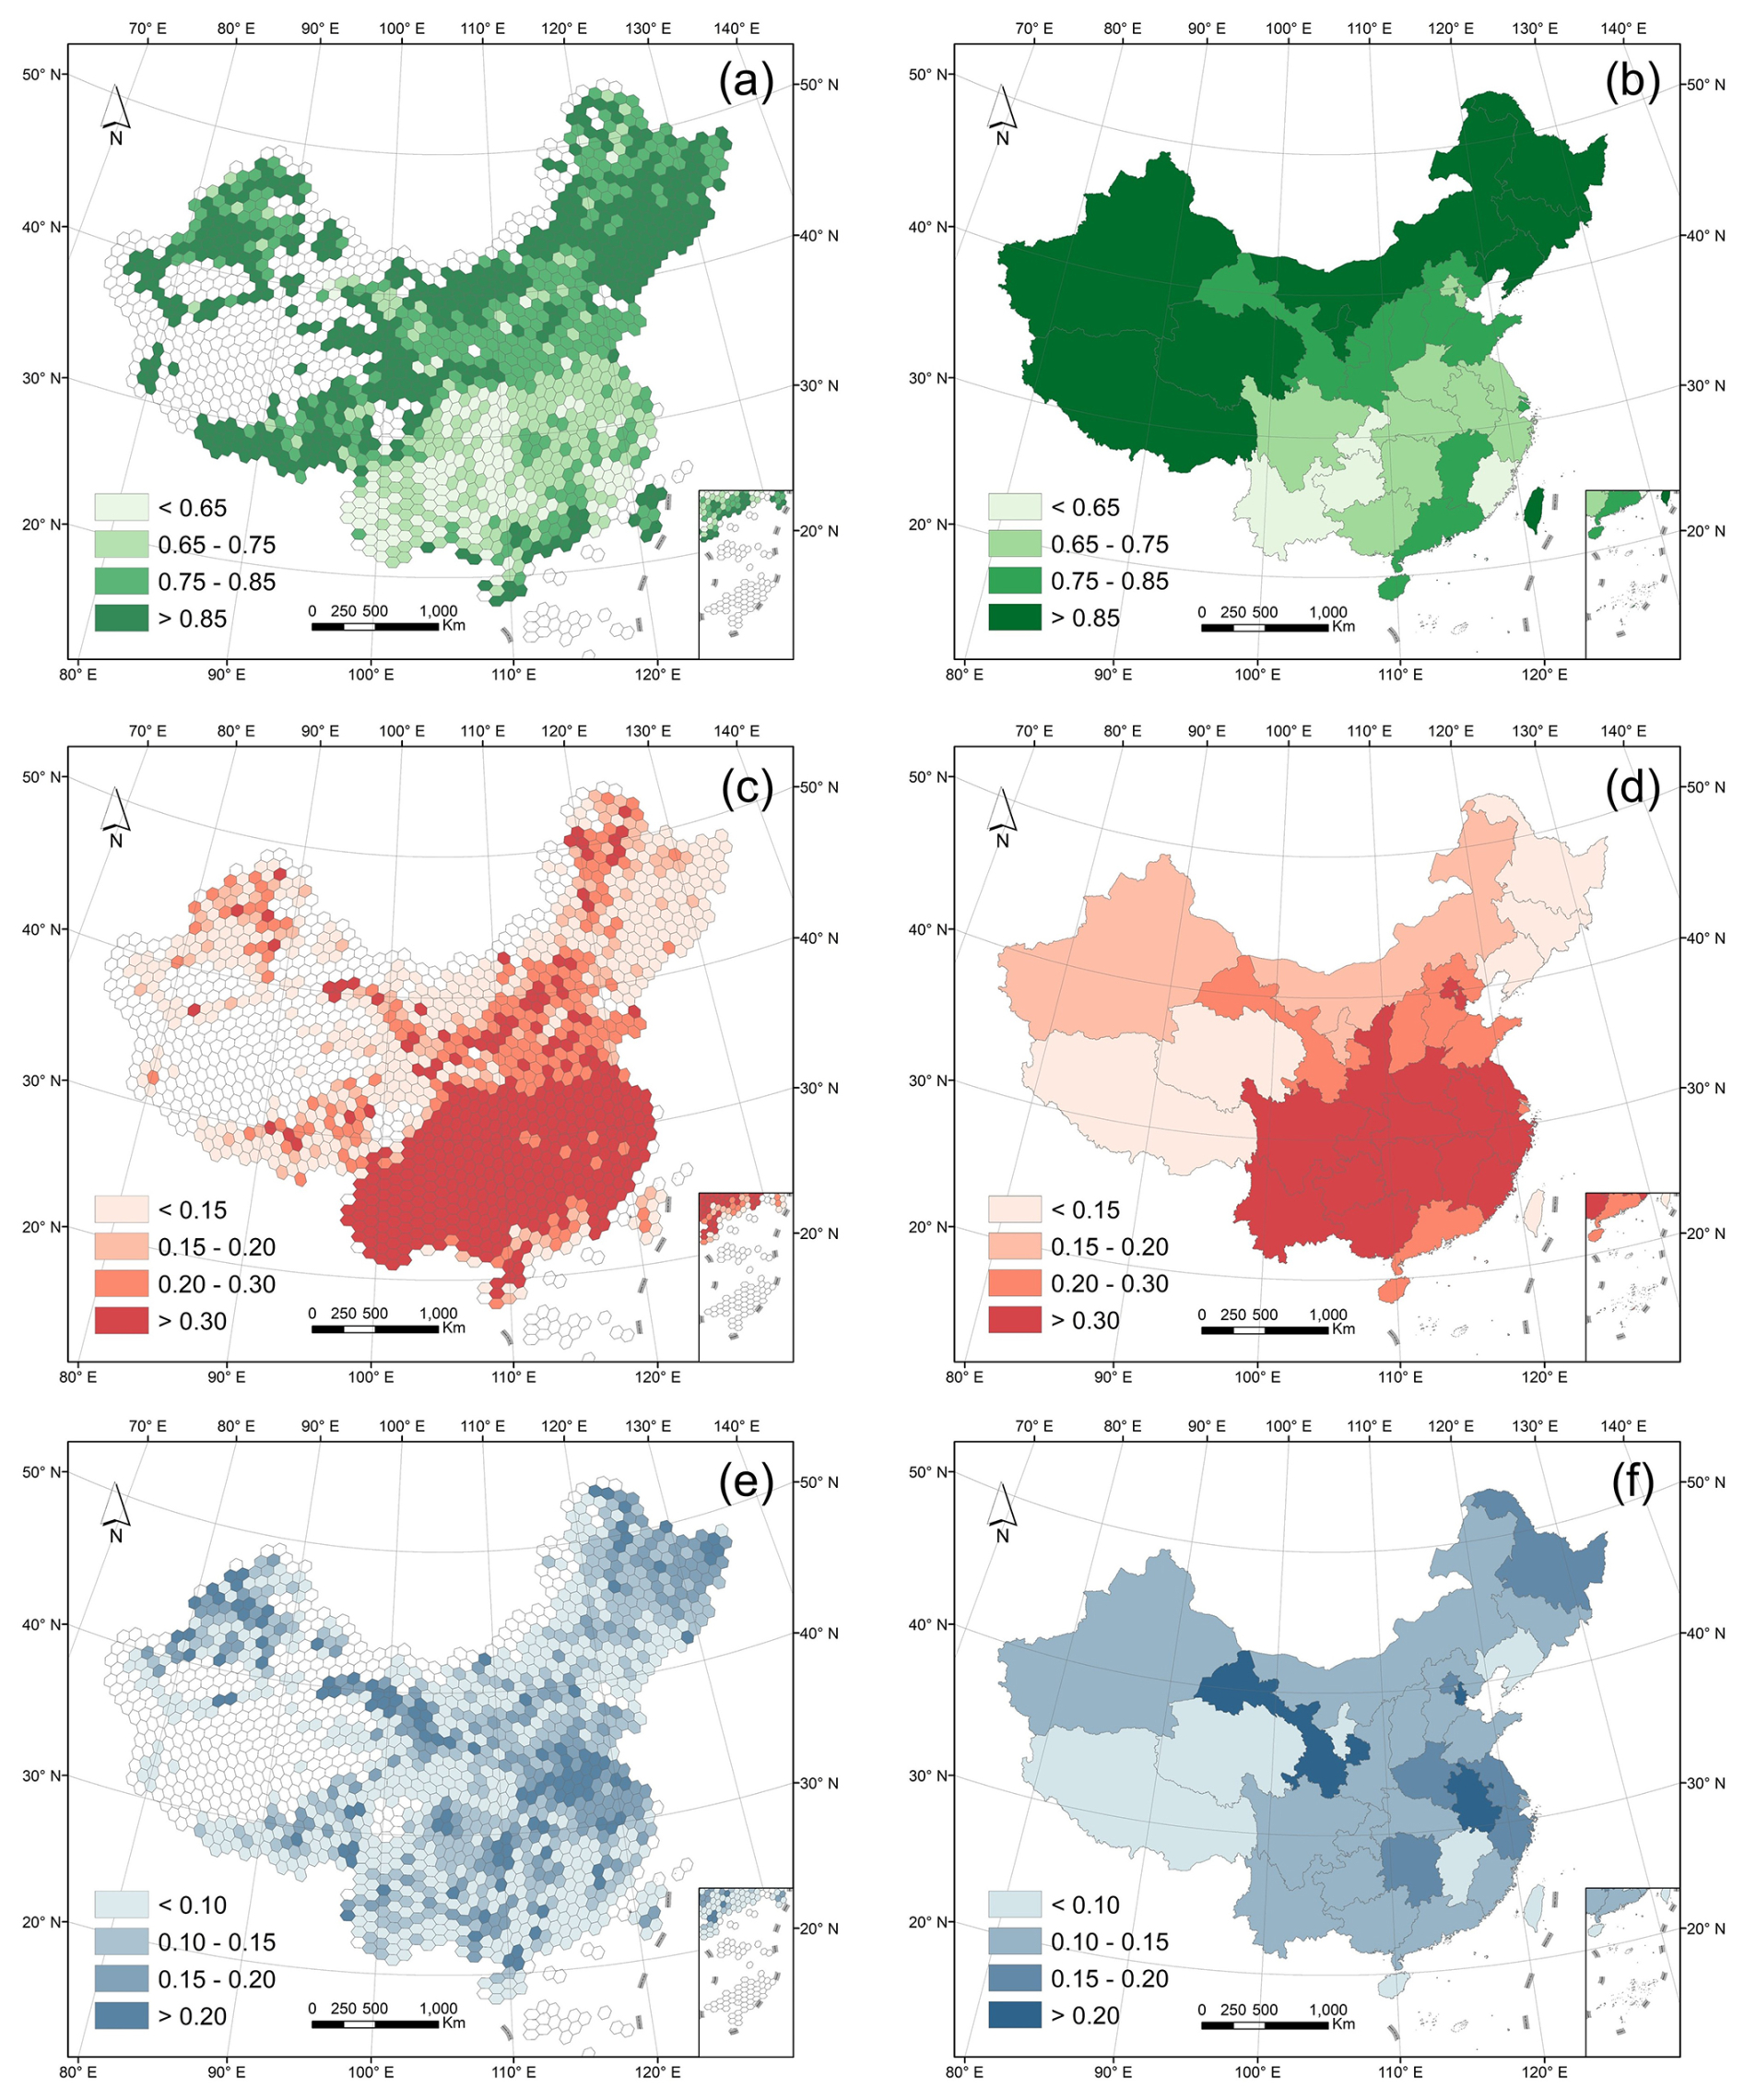
Figure 4Spatial variation of mean accuracy of classifiers for year periods from 2018 to 2021. (a) F1 score at hex grid level. (b) F1 score at ADM-1 level. (c) Omission error at hex grid level. (d) Omission error at ADM-1 level. (e) Commission error at hex grid level. (f) Commission error at ADM-1 level.
From the perspective of individual crops, high OE values for maize, rice, and soybean were mainly identified in the Sichuan Basin and the Yunnan-Guizhou Plateau. Regions with large OE values for rice also included the middle and lower reaches of the Yangtze River Plain, while high CE grids were scattered nationwide. For wheat, higher OE values occurred in the southern part of the North China Plain, and higher CE values were observed along its margins. The regions with large OE values for sugarcane were concentrated in the Yunnan–Guizhou Plateau. In contrast, rapeseed and cotton generally exhibited higher accuracy (Fig. S3).
From the perspective of individual crops, high OE values for maize were mainly concentrated in southwestern China, particularly in the Sichuan Basin and the Yunnan-Guizhou Plateau, while high CE grids were sparsely and randomly distributed without clear spatial clustering. For rice, high OE values were observed in both the Yunnan-Guizhou Plateau and the middle and lower reaches of the Yangtze River Plain, whereas CE again exhibited a scattered spatial pattern nationwide. Similarly, soybean showed concentrated high OE regions in the Sichuan Basin and Yunnan-Guizhou Plateau, with CE values lacking clear spatial aggregation. For wheat, higher OE values occurred in the southern part of the North China Plain, while higher CE values were mainly distributed along its margins. The regions with large OE values for sugarcane were concentrated in the Yunnan-Guizhou Plateau. In contrast, rapeseed and cotton generally exhibited higher accuracy, with both OE and CE remaining relatively low (Fig. S3).
3.3 Cropping Pattern and Annual Changes in China
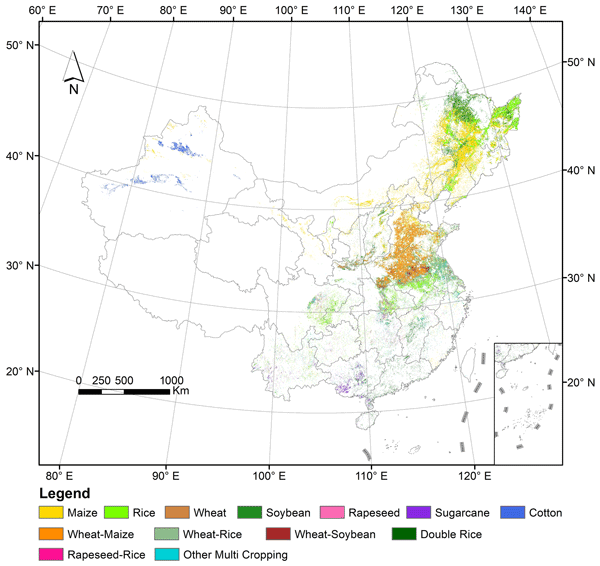
Under a unified mapping framework, we produced 10m-resolution maps of the major crops across China in recent years, allowing the analysis of spatial patterns in cropping system changes. Specifically, the crop mapping products generated in this study include seven single-cropping types, namely maize, rice, wheat, soybean, rapeseed, sugarcane, cotton, and five double-cropping sequences, including wheat–maize, wheat–rice, double rice, rapeseed-rice, and wheat-soybean (Fig. 5a).
At the national scale, single-season maize (spring maize) is mainly cultivated in northern China, particularly in the three northeastern provinces (Heilongjiang, Jilin, and Liaoning) and Inner Mongolia (Fig. 5a, b). Summer maize is primarily cultivated as the second crop within the winter wheat-summer maize double-cropping system, which is concentrated in the central provinces such as Henan, Shandong, and Hebei (Fig. 5b). Single-season rice is mainly distributed in provinces including Heilongjiang, Sichuan, and Anhui, whereas double-season rice is concentrated in southern China, particularly in Guangdong, Jiangxi, Guangxi, Hunan. In addition, the rice-wheat rotation system, one of the dominant double-cropping patterns involving rice, is mainly distributed in Jiangsu Province (Fig. 5b). Soybean cultivation is most concentrated in Heilongjiang, with additional production occurring across several other provinces. In some regions, such as Henan and Anhui, soybeans are commonly rotated with winter wheat (Fig. 5b). Wheat is rarely grown in a single season in China; as mentioned above, it is often rotated with maize, rice, and soybeans (Fig. 5a, b). Rapeseed is widely distributed along the Yangtze River Basin, and the rapeseed-rice rotation system represents one of the dominant double-cropping patterns in China. Furthermore, sugarcane is mainly cultivated in the southern provinces such as Guangxi and Yunnan, while cotton is predominantly grown in Xinjiang (Fig. 5b).
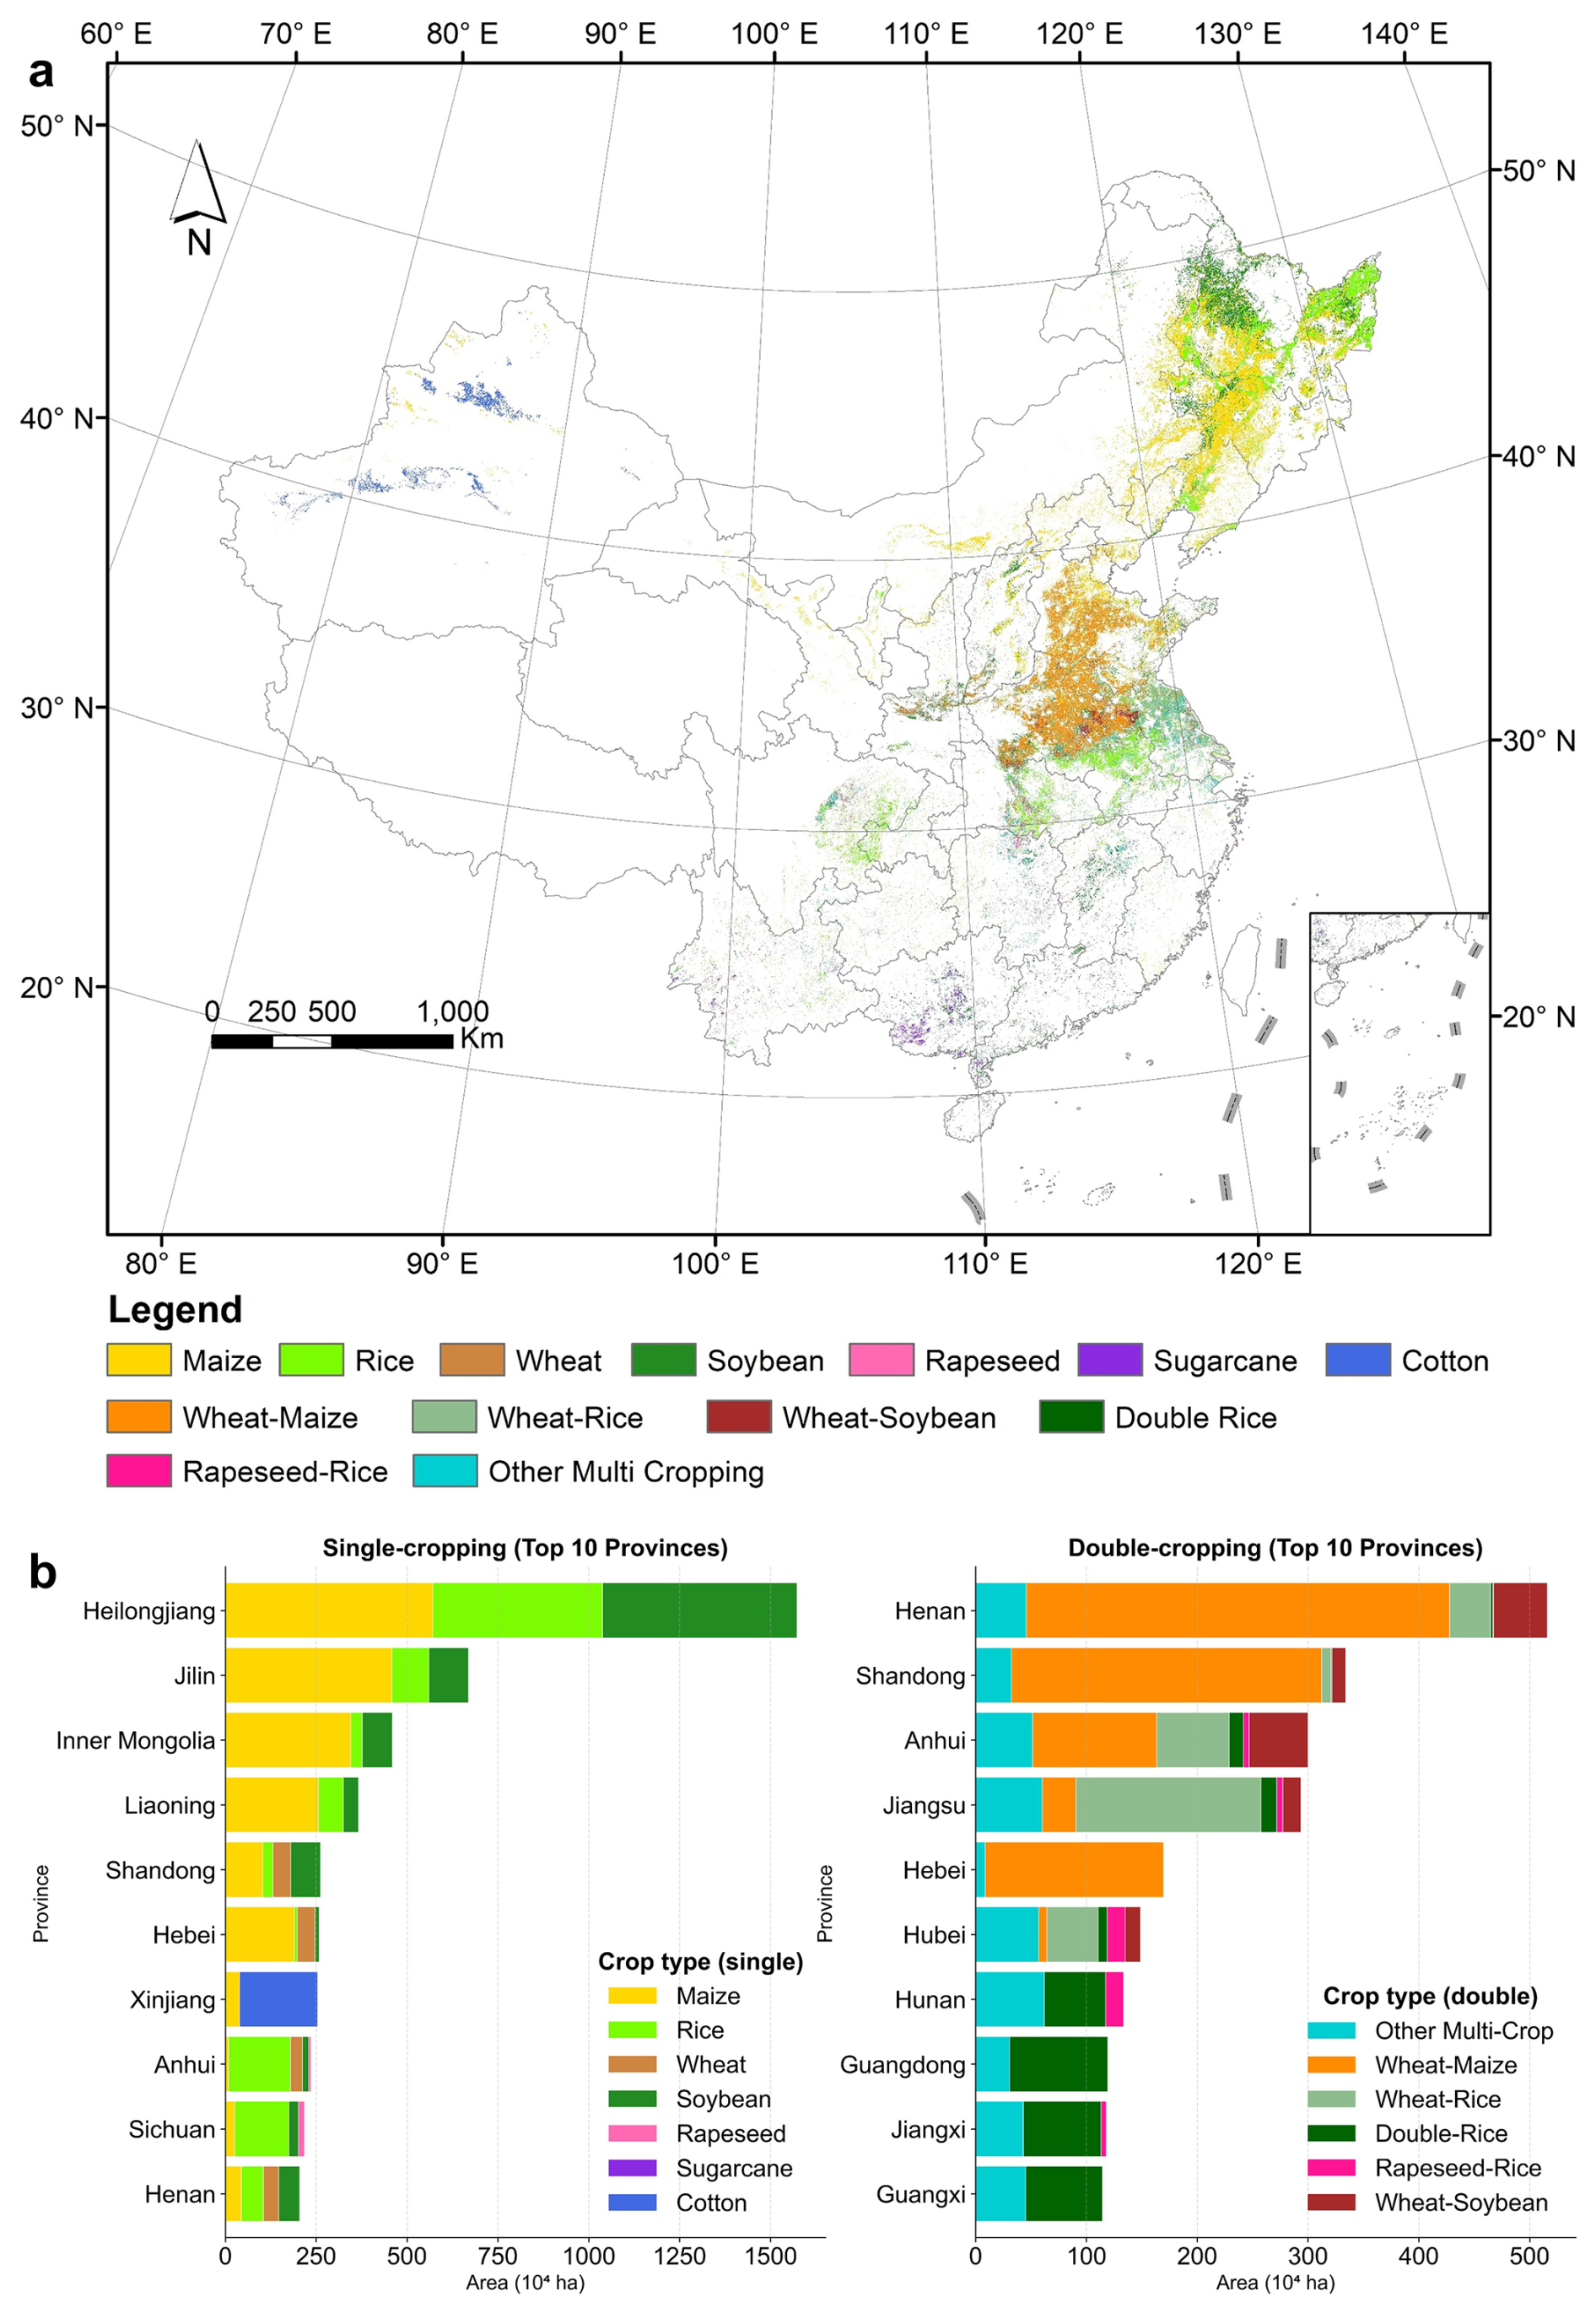
Figure 5Our maps of Cropping Pattern in China (year 2020 as an example). (a) spatial distribution of cropping patterns; (b) crop area aggregated at the province level.
Based on the 10 m resolution mapping results of multi-year cropping patterns, we systematically evaluated recent changes in China's cropping systems. From 2018 to 2021, 64.85 % of the cropland experienced changes in cropping patterns (Fig. 6a, d). Cropland without crop switching were mainly located in the three northeastern provinces (Heilongjiang, Jilin, and Liaoning, excluding northeastern Heilongjiang), Xinjiang, and parts of the North China Plain, whereas the regions with significant changes were concentrated in northeastern Heilongjiang, the North China Plain, and southern China (Fig. 6a, d).
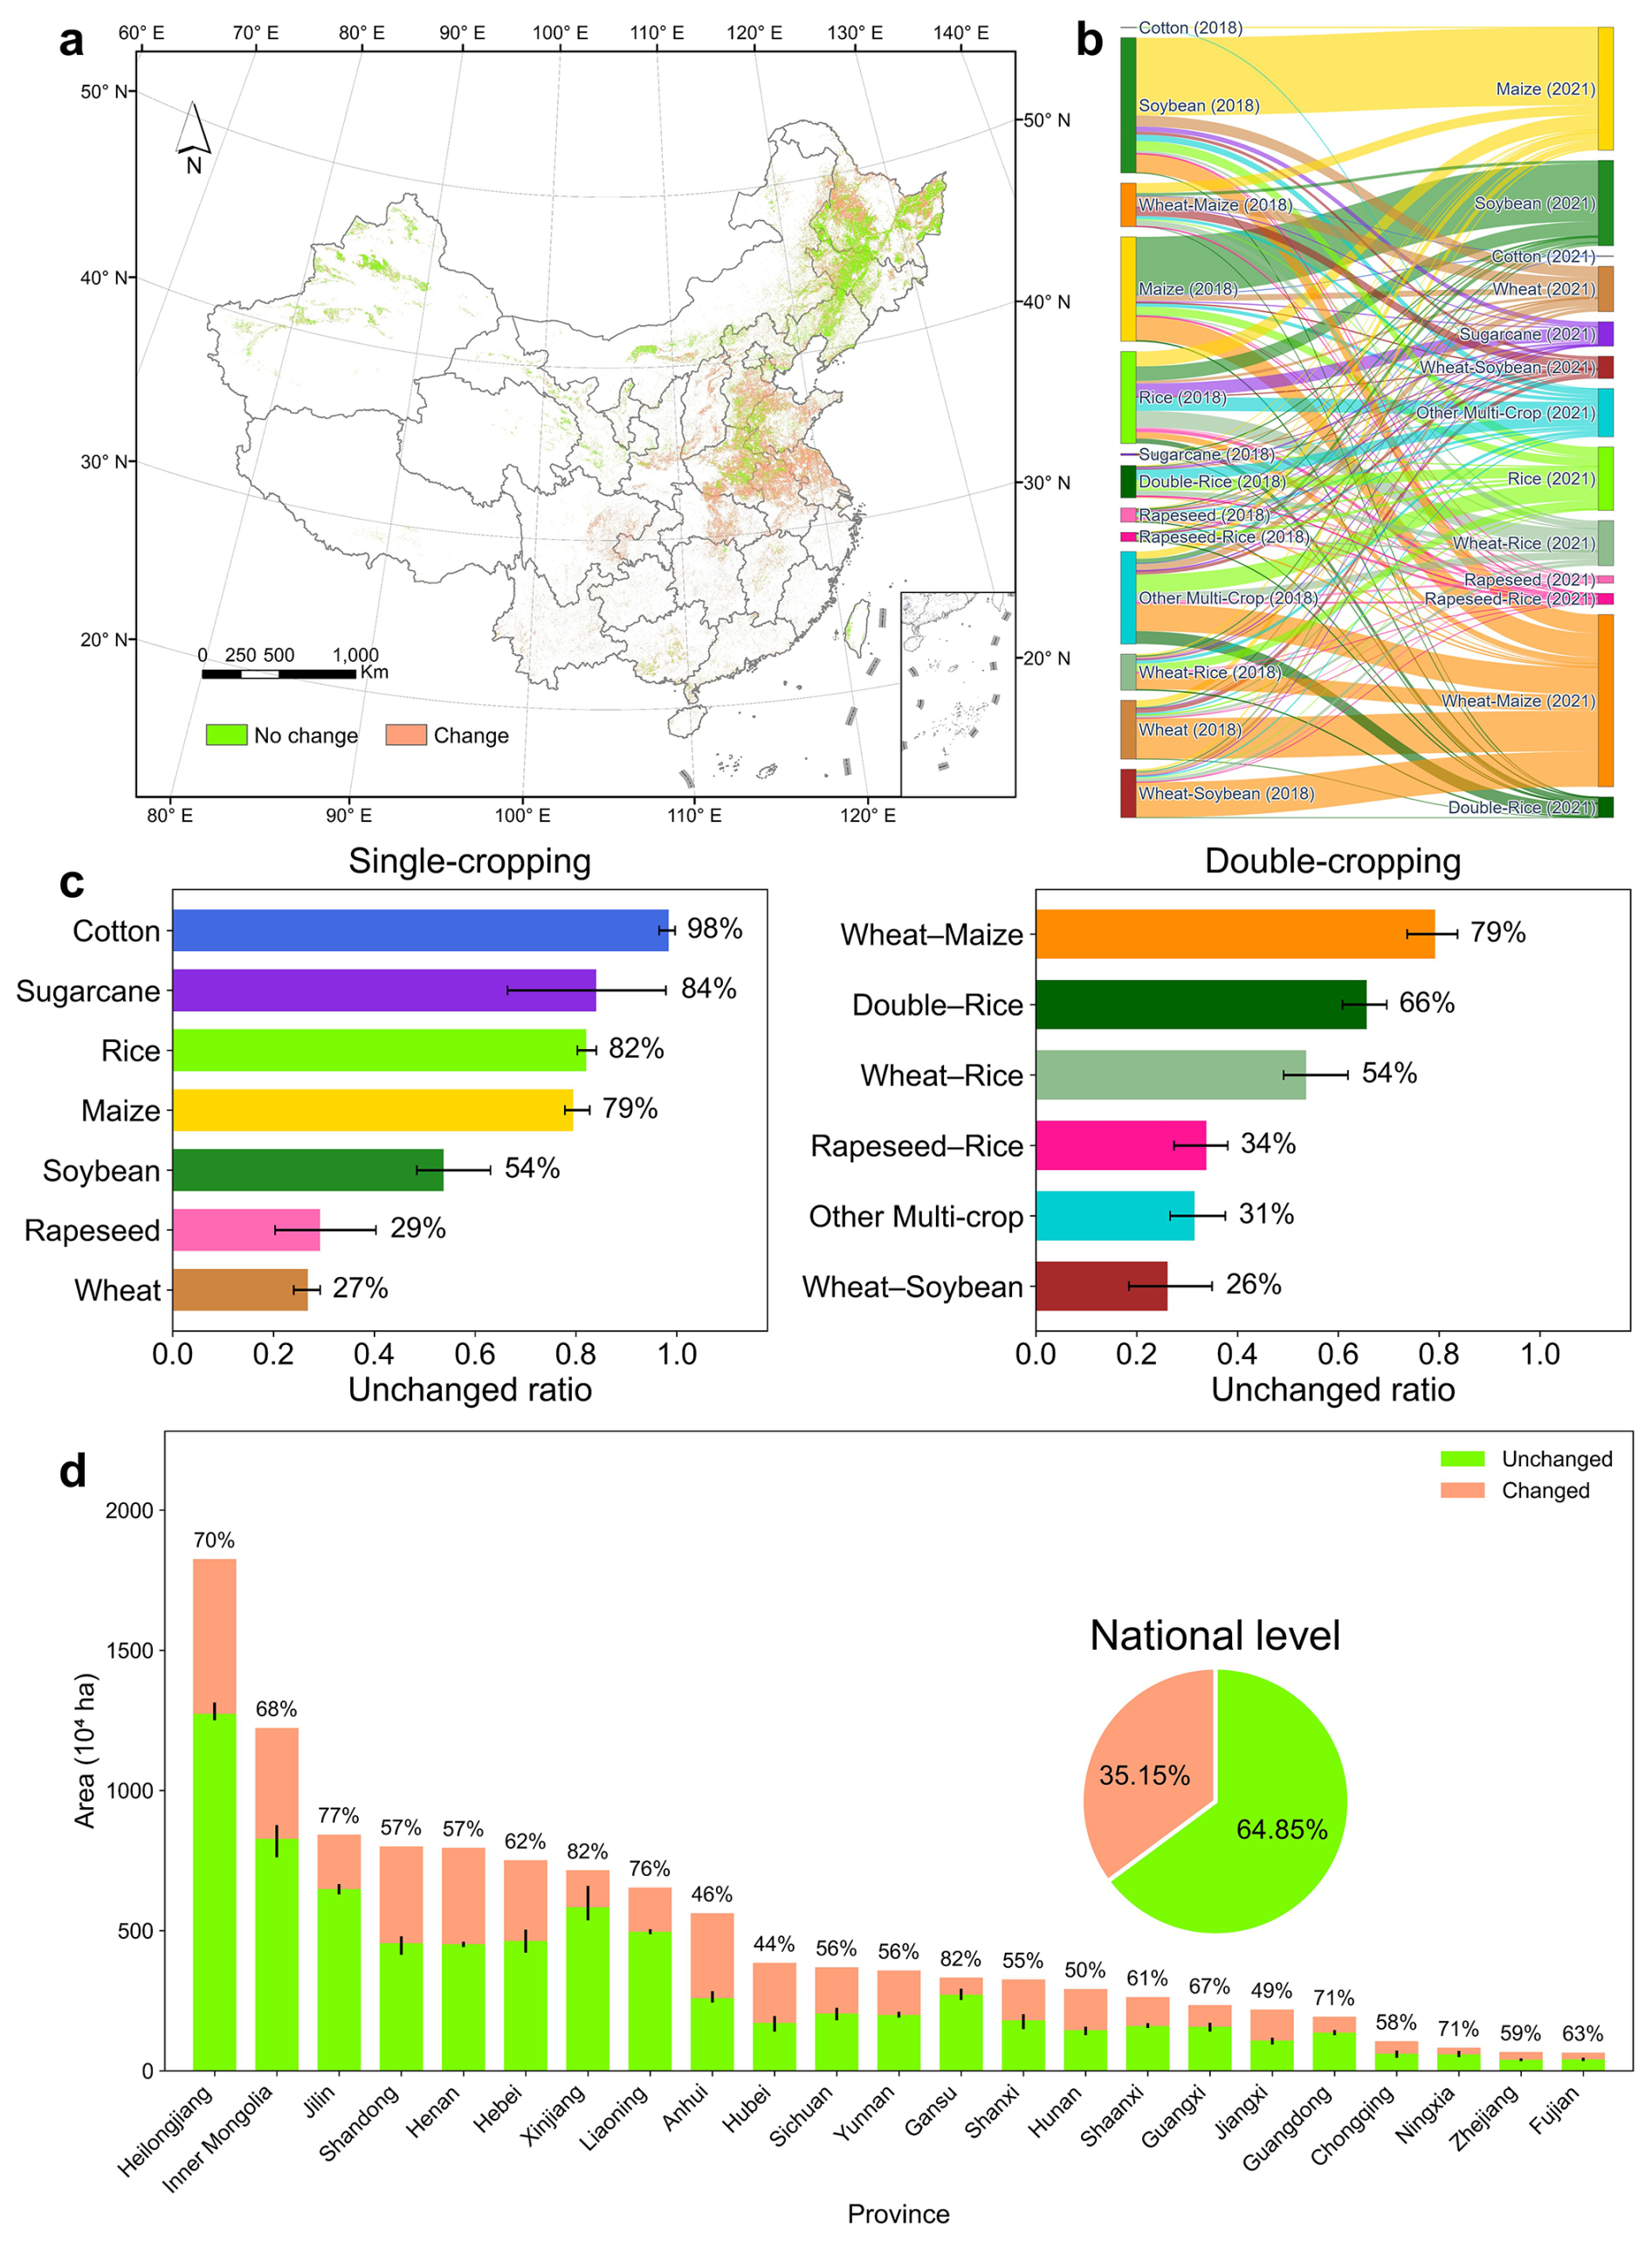
Figure 6Cropping pattern changes between 2018 and 2021 in China. (a) spatial distribution of changed cropping patterns; (b) Flows of cropland transitions among cropping patterns; (c) unchanged ratio of single- and double-cropping systems; (d) Provincial average unchanged and changed cropland areas.
Figure 6b illustrates the transfer of planting areas among different crop types. According to the mapping results, 98 % of the cotton-growing areas remained unchanged, indicating cotton exhibits the highest stability among the examined crop-specific cropping patterns. Among the single-cropping systems, rice and maize also exhibited relatively high stability in cropping patterns, with 82 % and 79 % of their cropping areas remaining unchanged, respectively. In contrast, nearly or more than half of the planting areas for soybean, rapeseed, and wheat changed cropping patterns (Fig. 6c). As for double-cropping systems, the wheat–maize system exhibited the highest stability, with 78 % of the area remaining unchanged, followed by double-rice and wheat-rice, with 66 % and 54 % of their planting area unchanged. While the wheat–soybean and rapeseed–rice systems showed frequent switching, with only 26 % and 34 % of their areas unchanged (Fig. 6c).
Figure 7 illustrates the mean area changes among different cropping patterns. The majority of changes occurred between single-to-single cropping systems, accounting for 62.95 % of the total changed area. Among single crops, the rotation between maize and soybean was the most common, accounting for 32 % of the total soybean area and 13 % of the maize area. Similarly, there was a high degree of alternation from wheat–soybean to wheat–maize systems, accounting for 48 % of the wheat–soybean area, but only 4 % of the wheat–maize systems shifted to wheat–soybean (Fig. 7). Among double-to-double cropping systems changes (accounting for 23.97 % of the total changed area), a substantial proportion of transitions also occurred between double rice and other multi-crop, with the changed area accounting for 15 % of the double-rice system.
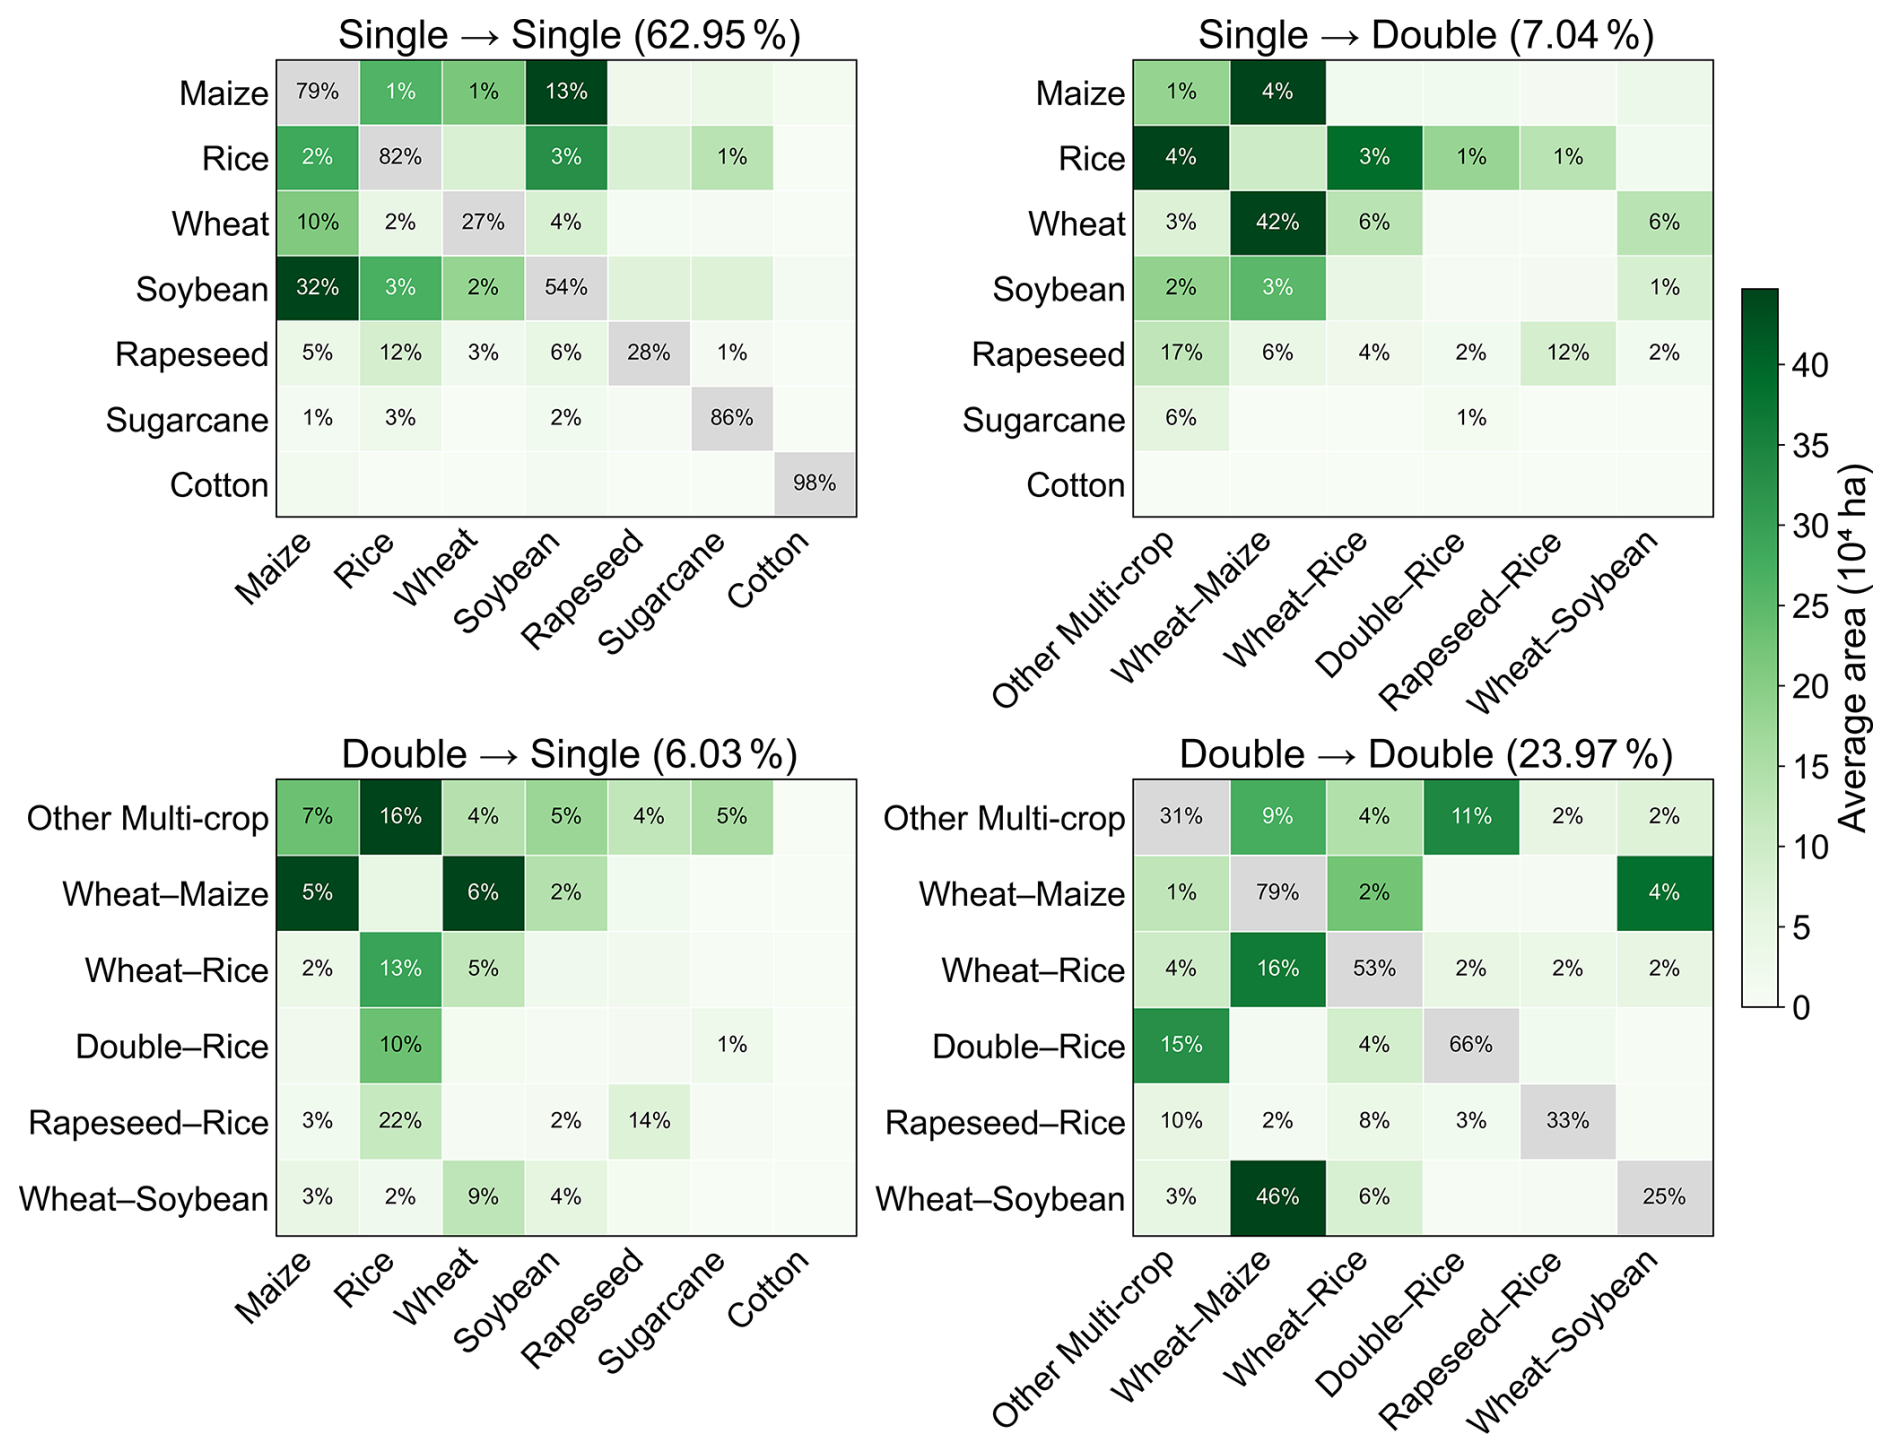
Figure 7Heatmaps showing the average area of transitions among cropping patterns in China from 2018 to 2021.
There were respectively 7.04 % and 6.03 % of the changed area in single-to-double cropping systems and double-to-single cropping systems. For single-season wheat, the largest proportion of cropping-pattern changes occurred between single-season wheat and the wheat–maize double-cropping system, representing 42 % of the total single-wheat area. Conversely, 6 % of the wheat–maize system shifted to single-season wheat, 5 % of that shifted to maize (Fig. 7), reflecting a typical two-year–three-harvest cropping regime in wheat-related systems. As for rice, 10 % of double-season rice shifted to single-season rice, while only 1 % moved in the opposite direction, indicating a decline in planting areas of double-season rice. In addition, a number of crop rotation patterns were not clearly defined by the classification system of this study and were classified as other-multi crops, with a considerable proportion of alternating cultivation involving maize, rice, soybeans, and double-rice (Fig. 7).
In addition, we also selected representative regions of cropping systems across China to present year-over-year changes in mapping results (Fig. 8). The northwestern part of Heilongjiang Province is characterized by a maize–soybean rotation system, where the two crops are cultivated alternately. Maps taken two years apart show more similar cropping structures and patterns, while maps taken one year apart show significant changes in cropping structure and patterns. Similarly, in the southern part of Hebei Province, located in the central Huang–Huai–Hai Plain, double-cropping systems dominated by winter wheat-summer maize prevail. Transitions between double-cropping and single-season maize cultivation have occurred. In more recent years, however, agricultural intensification has increasingly favored the maintenance of the double-cropping system. Furthermore, in the southern part of Jiangsu Province, rice–wheat rotations dominate the agricultural landscape. This system also involves maize, soybean, and rapeseed cultivation, resulting in a more diversified cropping structure compared with the previous regions, as well as more dynamic interannual variations in cropping patterns. In contrast, in the central part of Hubei Province along the Yangtze River, rapeseed and wheat are the primary crops. The cropping structure in this area is highly heterogeneous, characterized by substantial interannual variability in cropping patterns, particularly in crop sequences involving rice and maize. Finally, along the Yellow River in the Huang–Huai–Hai Plain, the dominant system is dryland agriculture characterized by the winter wheat–summer maize double-cropping pattern. However, due to favorable irrigation conditions near the river, some areas also support irrigated fields with more complex structures that include soybean and rice cultivation.
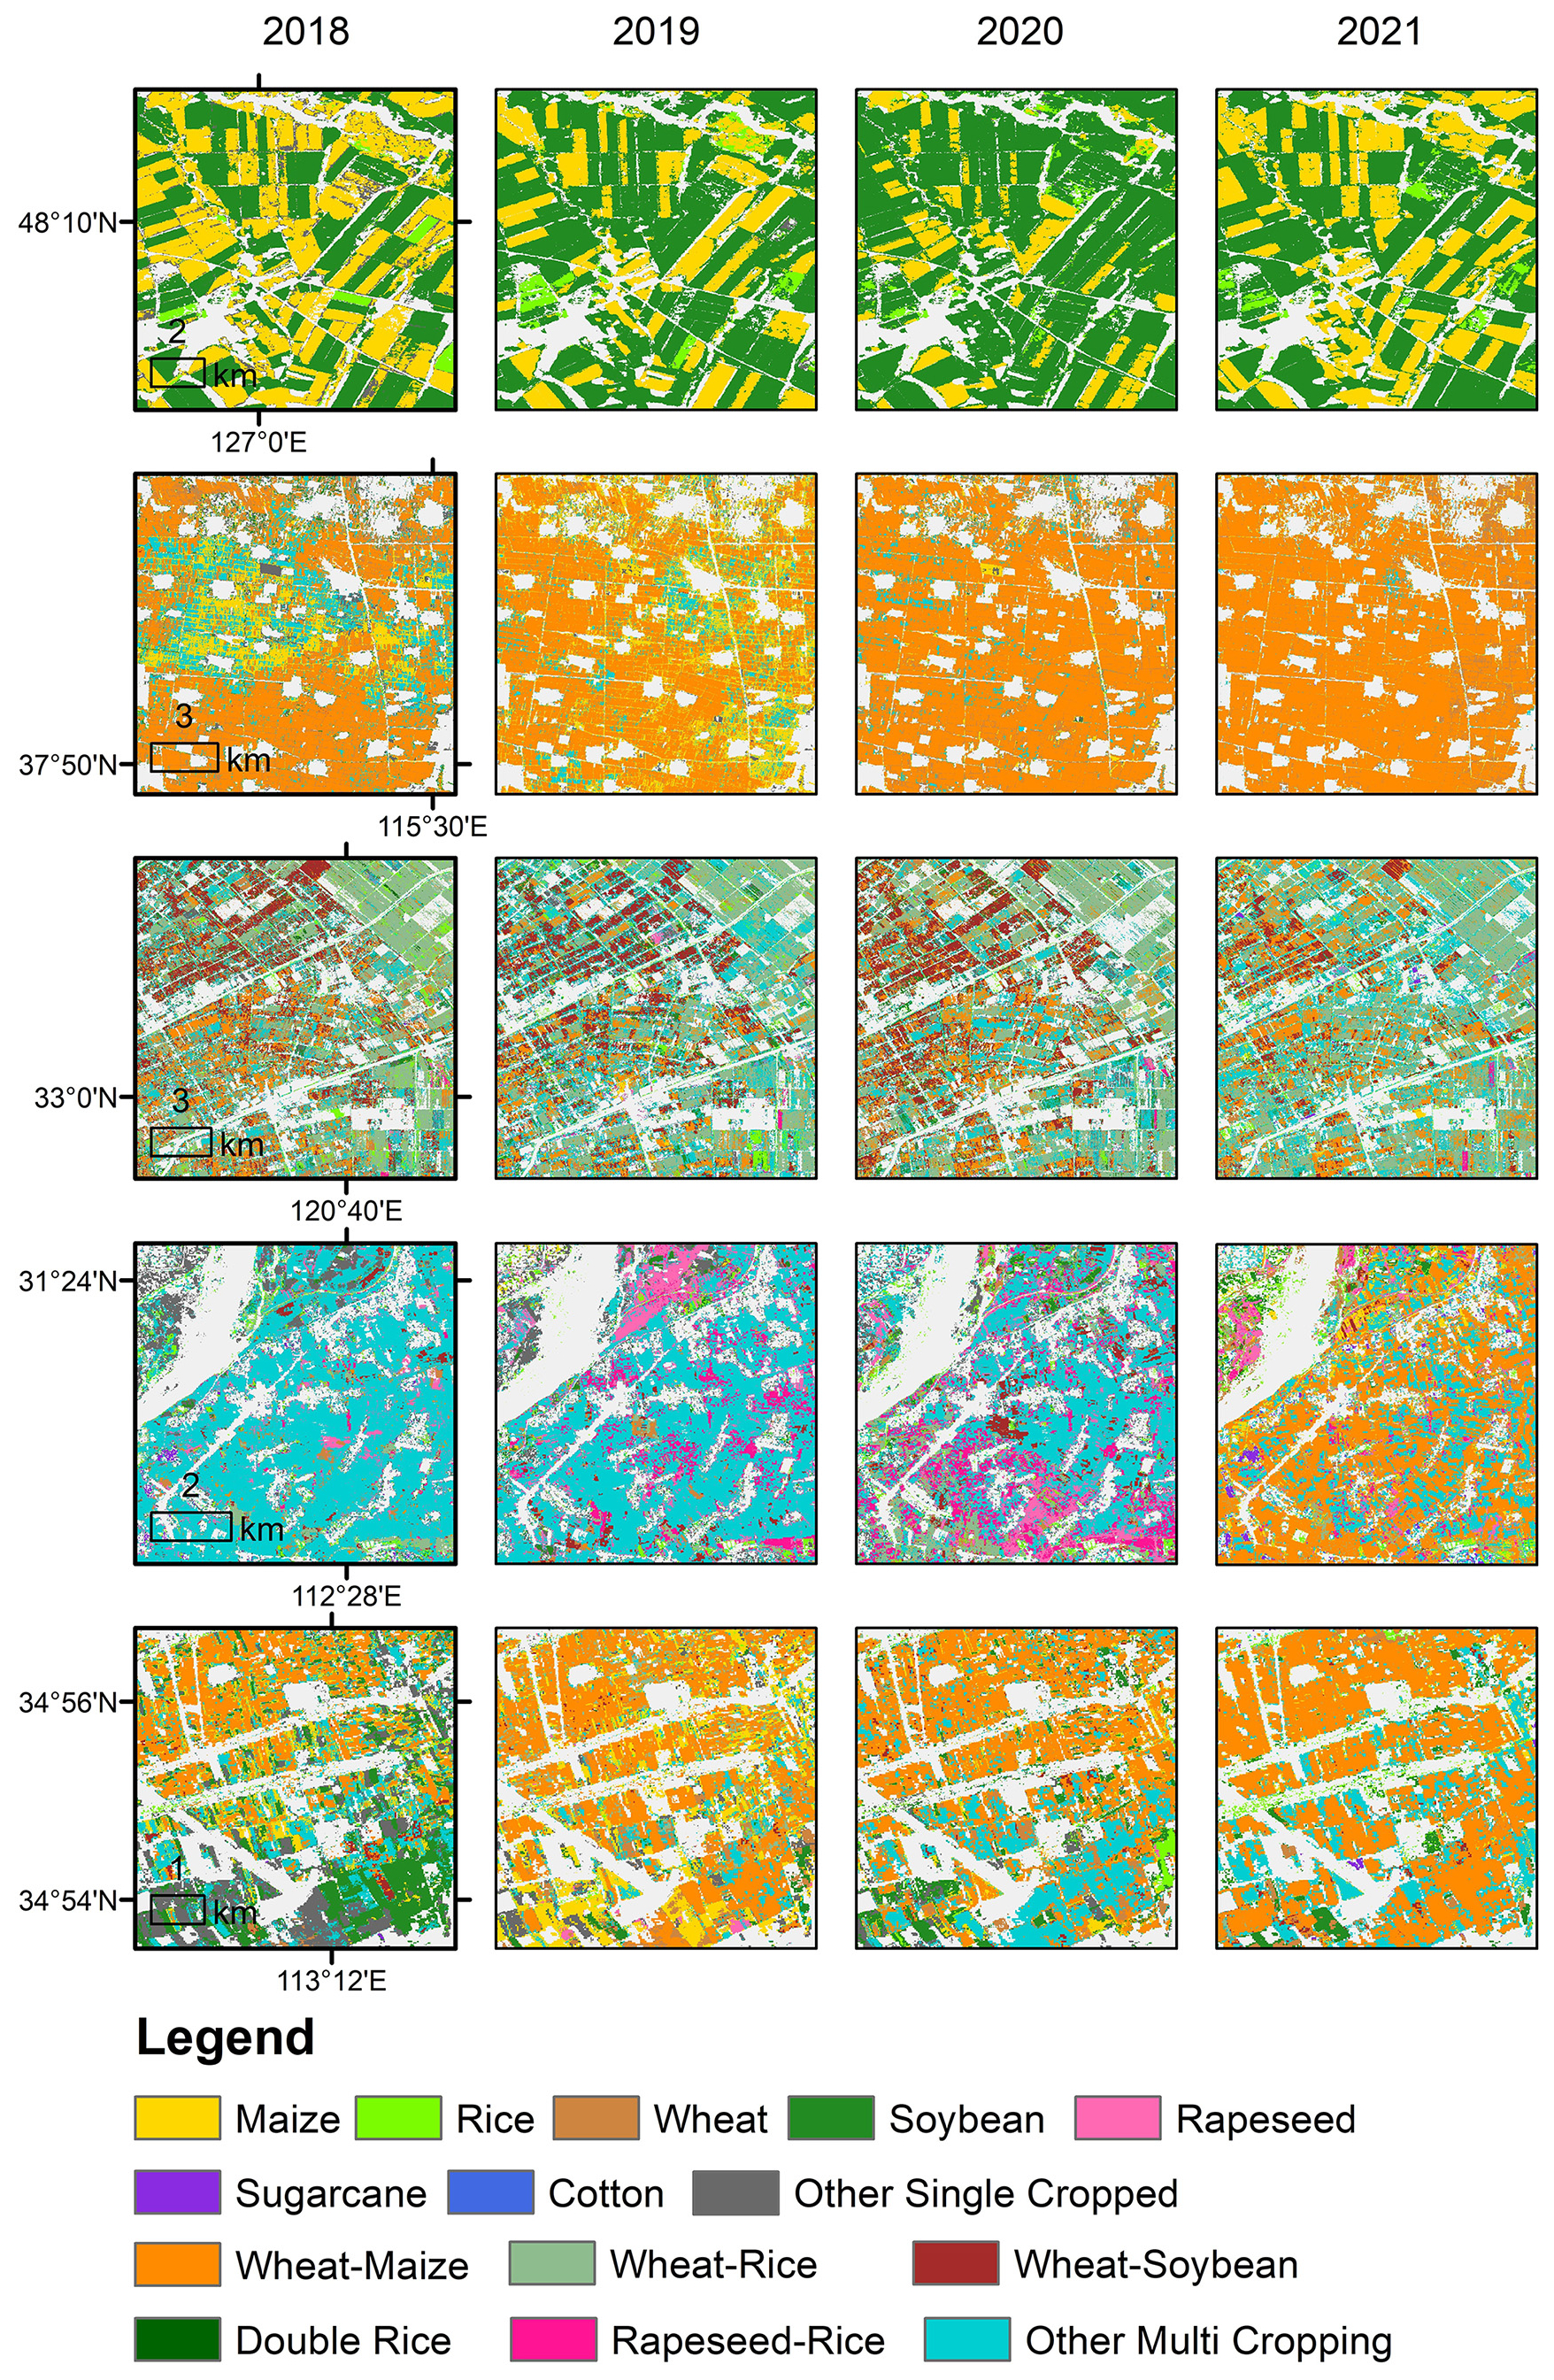
Figure 8Zoom-in results of our maps in Areas where cropping patterns change annually.
3.4 Result validation
Our results showed strong consistency with crop statistical data at both the ADM-1 and ADM-2 levels (Fig. 9). Compared with the provincial statistics (ADM-1), the coefficient of determination (R2) reached 0.863, with an RMSE of 49.96 × 10⁴ ha and an MAE of 32.94 × 10⁴ ha. The slope of the linear fit was 0.934, indicating a general underestimation trend (Fig. 9a). When compared with the ADM-2 statistics, the R2 was 0.849, the RMSE was 4.61 × 10⁴ ha, and the MAE was 2.07 × 10⁴ ha, with a slope of 1.087, which is closer to the 1:1 line (Fig. 9b). In terms of crop types, soybean tended to be overestimated overall, whereas wheat and maize showed an underestimation trend (Fig. 9).
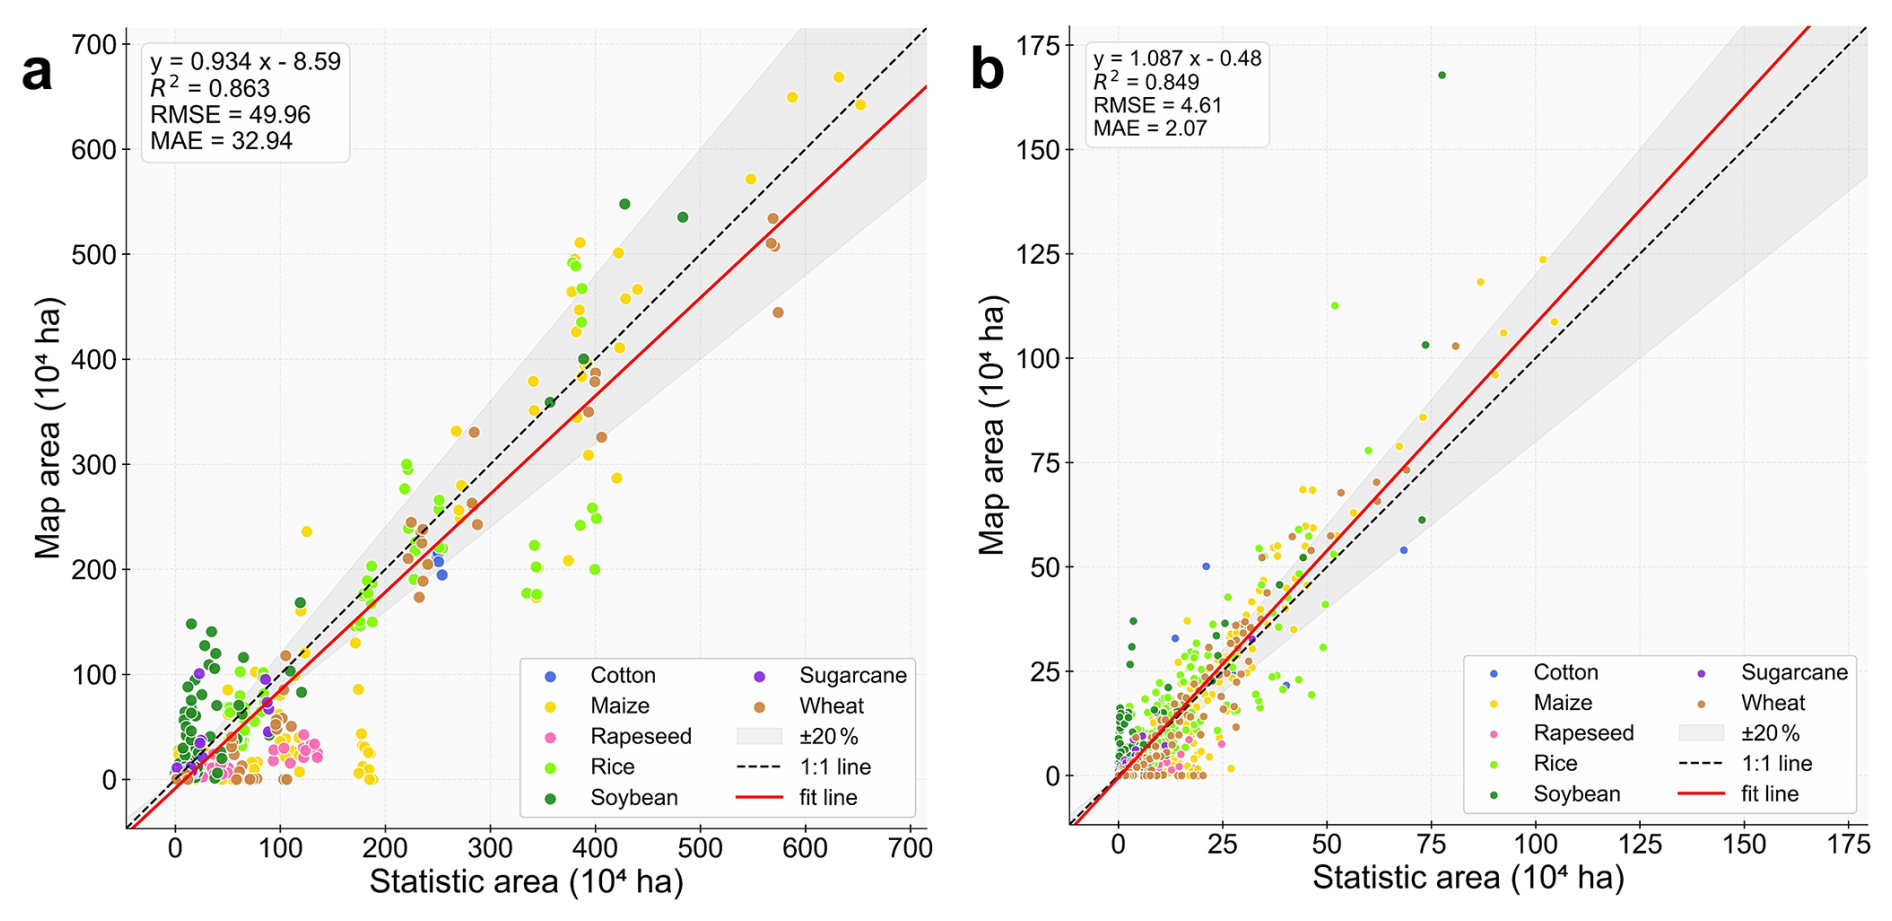
Figure 9Consistency between our crop maps and crop statistics: (a) ADM1 level for 2018–2021, and (b) ADM2 level for 2020.
In addition, we compared the mapping results with multiple single-crop mapping products and input imagery from the same year, and conducted stepwise visual inspections of the workflow to validate the reliability of our results (Figs. 10 and 11). Figure 10 presents representative cases of confusion between two major crop types (including low consistency). For instance, in the Northeast Plain, confusion between maize and soybean is common because these crops have highly overlapped growing seasons and are frequently rotated. Through integrating multiple crop mapping products and performing consistency analysis, our framework effectively delineated consistent and confused areas. Reclassification within confused areas showed strong agreement with the spatial patterns of the embedding features (validated using RGB composites of bands A08, A11, and A33). In addition, in the same region, low-consistency rice mapping products often overlapped with maize–soybean confusion zones (validated using RGB composites of bands A40, A08, and A33). In the Huang–Huai–Hai Plain, where the winter wheat–summer maize double-cropping system predominates, confusion between double-cropping and single-season maize cultivation remains common (validated using RGB composites of bands A08, A11, and A21). Xinjiang, China's major cotton-producing region, also includes crops such as maize, wheat, sugar beet, and high-value specialty crops (e.g., grapes, tomatoes, and melons). Many of these crops are not explicitly included in our mapping framework; nonetheless, our approach effectively complements existing products by refining low-consistency or omitted areas of maize and cotton mapping (validated using RGB composites of bands A08, A11, and A01).
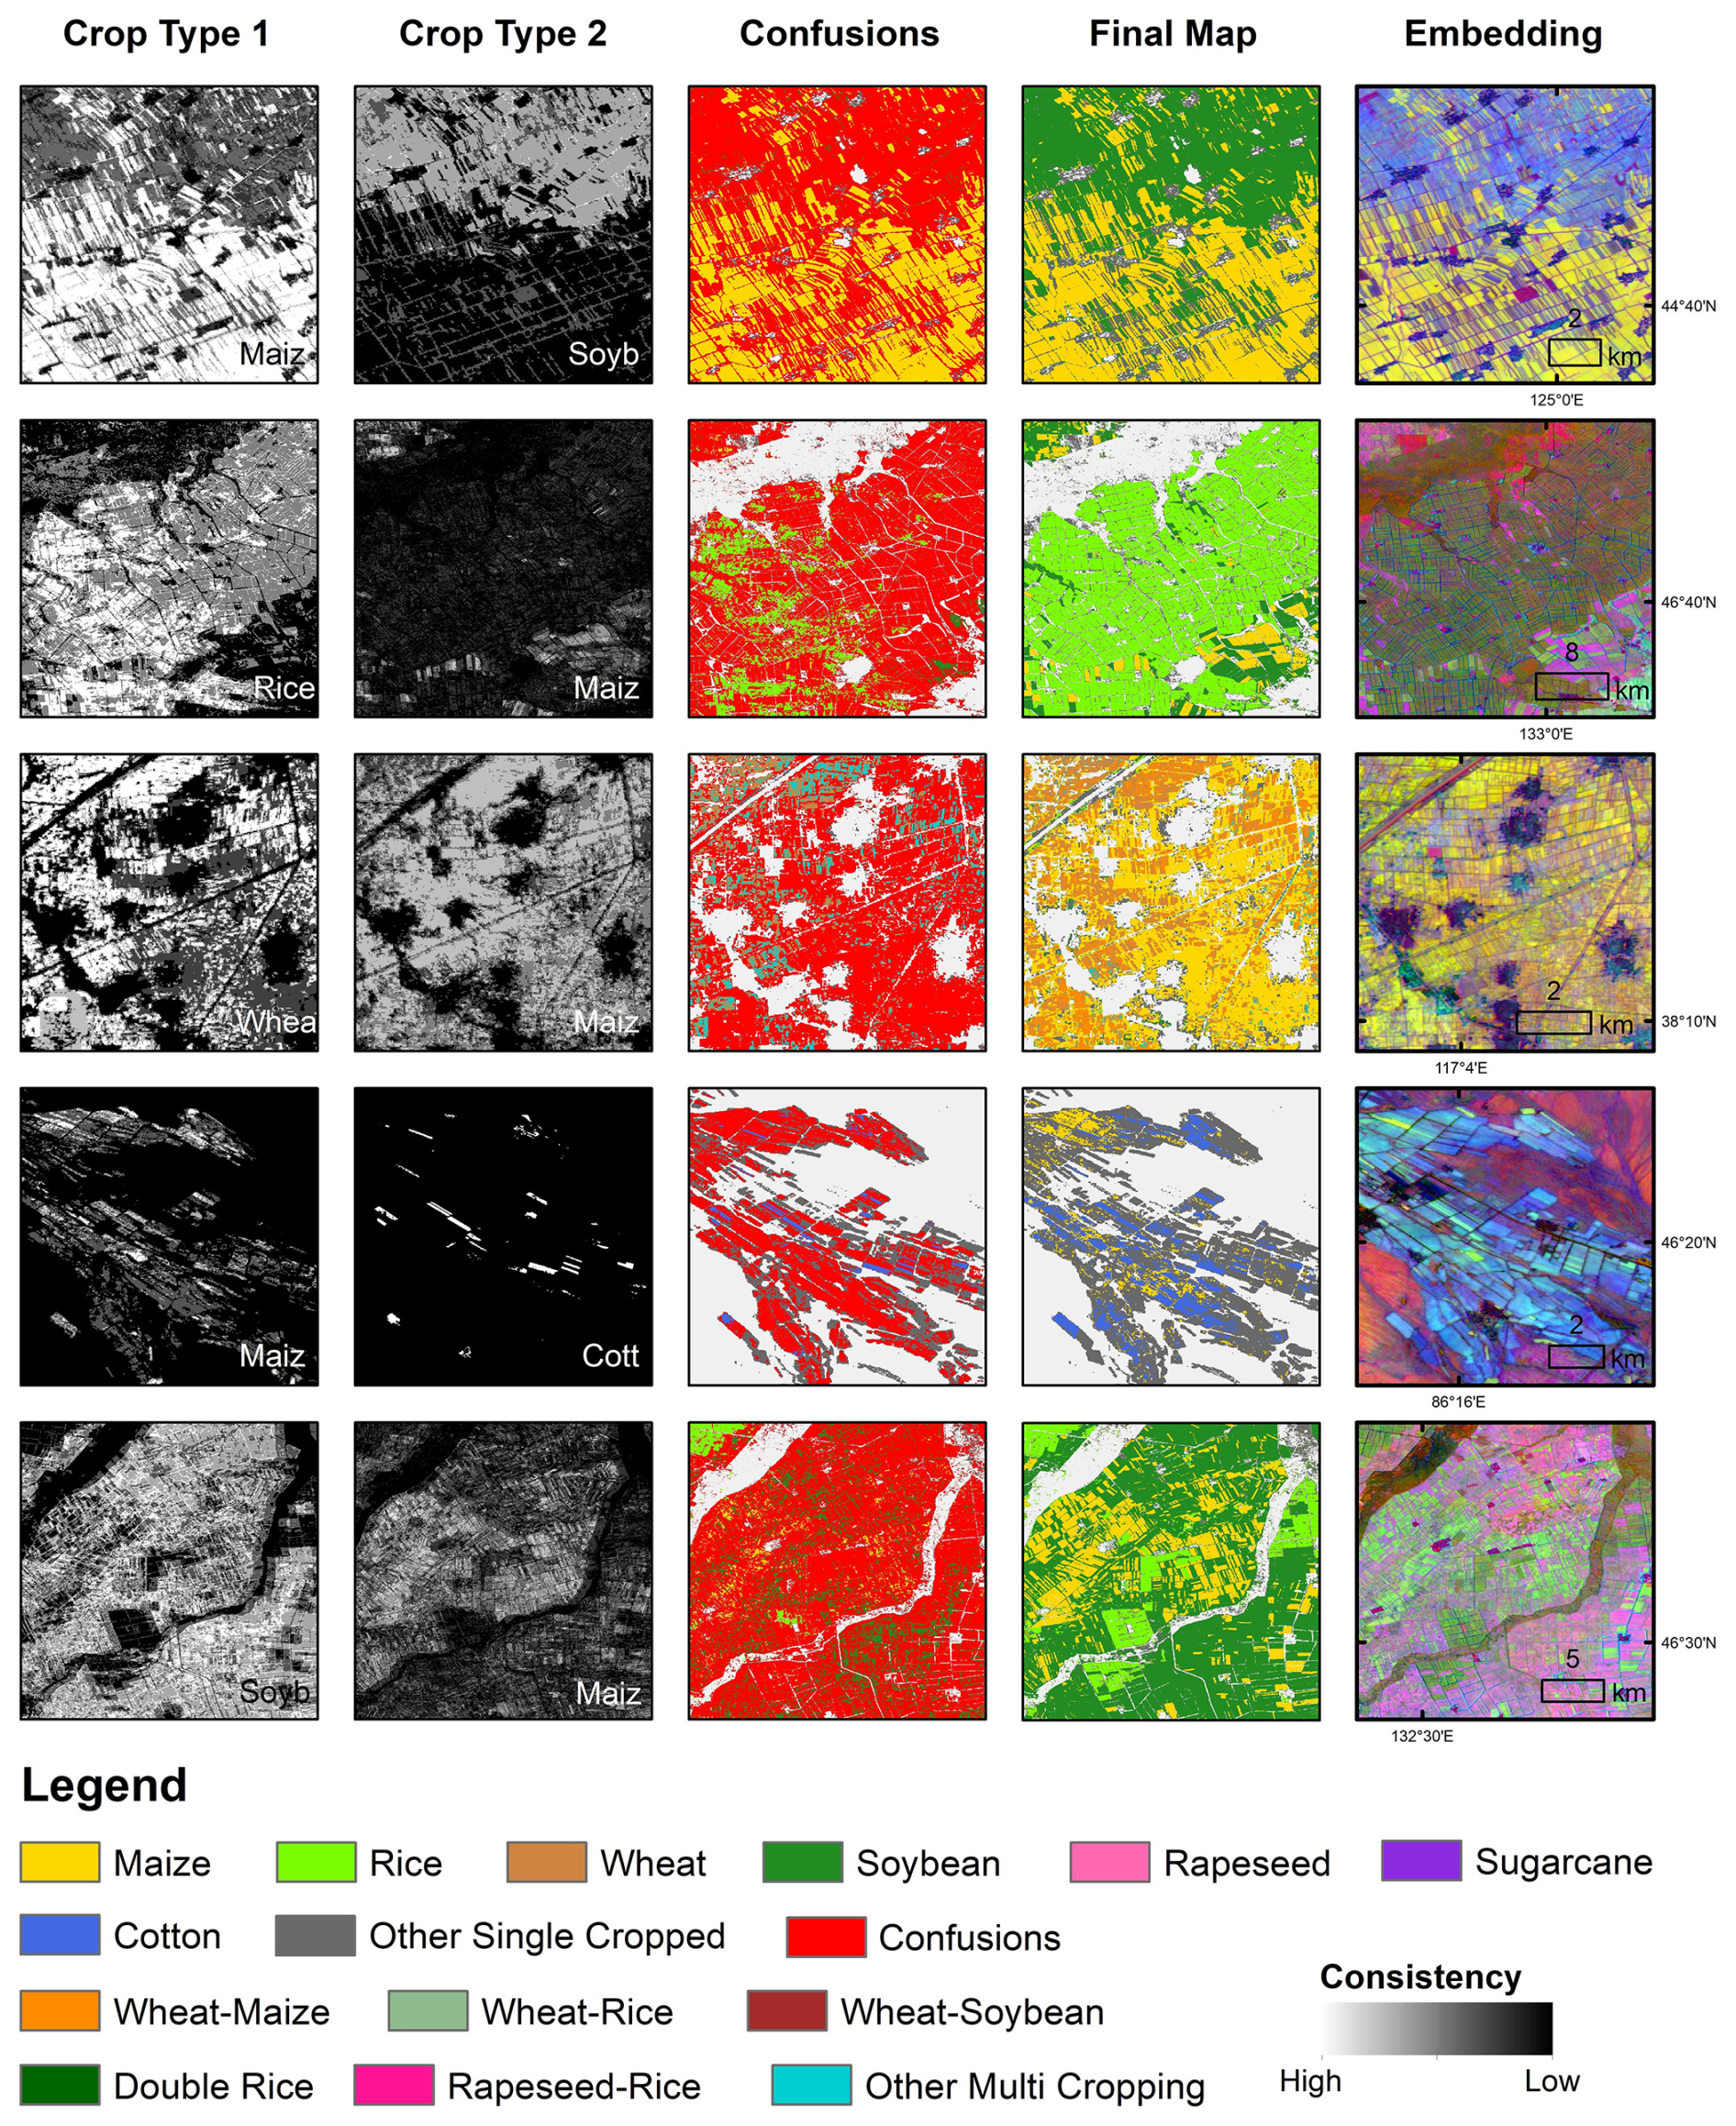
Figure 10Comparisons of our results and other crop maps (confusion mainly between two crop types) in the year 2020.
Figure 11 illustrates mapping results in cropping systems characterized by more complex planting structures and rotation patterns. In the Sichuan Basin and surrounding regions, the cropping system includes a mixture of soybean, rapeseed, maize, and rice, as well as multiple cropping patterns such as double-season rice and rapeseed–rice rotations (validated using RGB composites of bands A10, A40, and A33). In the southern margin of the Huang–Huai–Hai agricultural region, which forms a transitional zone between northern and southern cropping regimes, major crops include wheat, soybean, maize, and rice, along with rotation systems such as rice–wheat. These mixed patterns exhibit considerable complexity (validated using RGB composites of bands A08, A40, and A21). Along the middle reaches of the Yangtze River in central Hubei, the main crops are rapeseed, wheat, rice, and maize, with diversified and temporally dynamic cropping structures, including annual rice–wheat and rapeseed-related double cropping sequences (validated using RGB composites of bands A10, A40, and A21). Overall, the proposed mapping framework provides a systematic and consistent classification approach for regions with diverse cropping structures, effectively harmonizing crop type identification and cropping intensity within a unified mapping system.
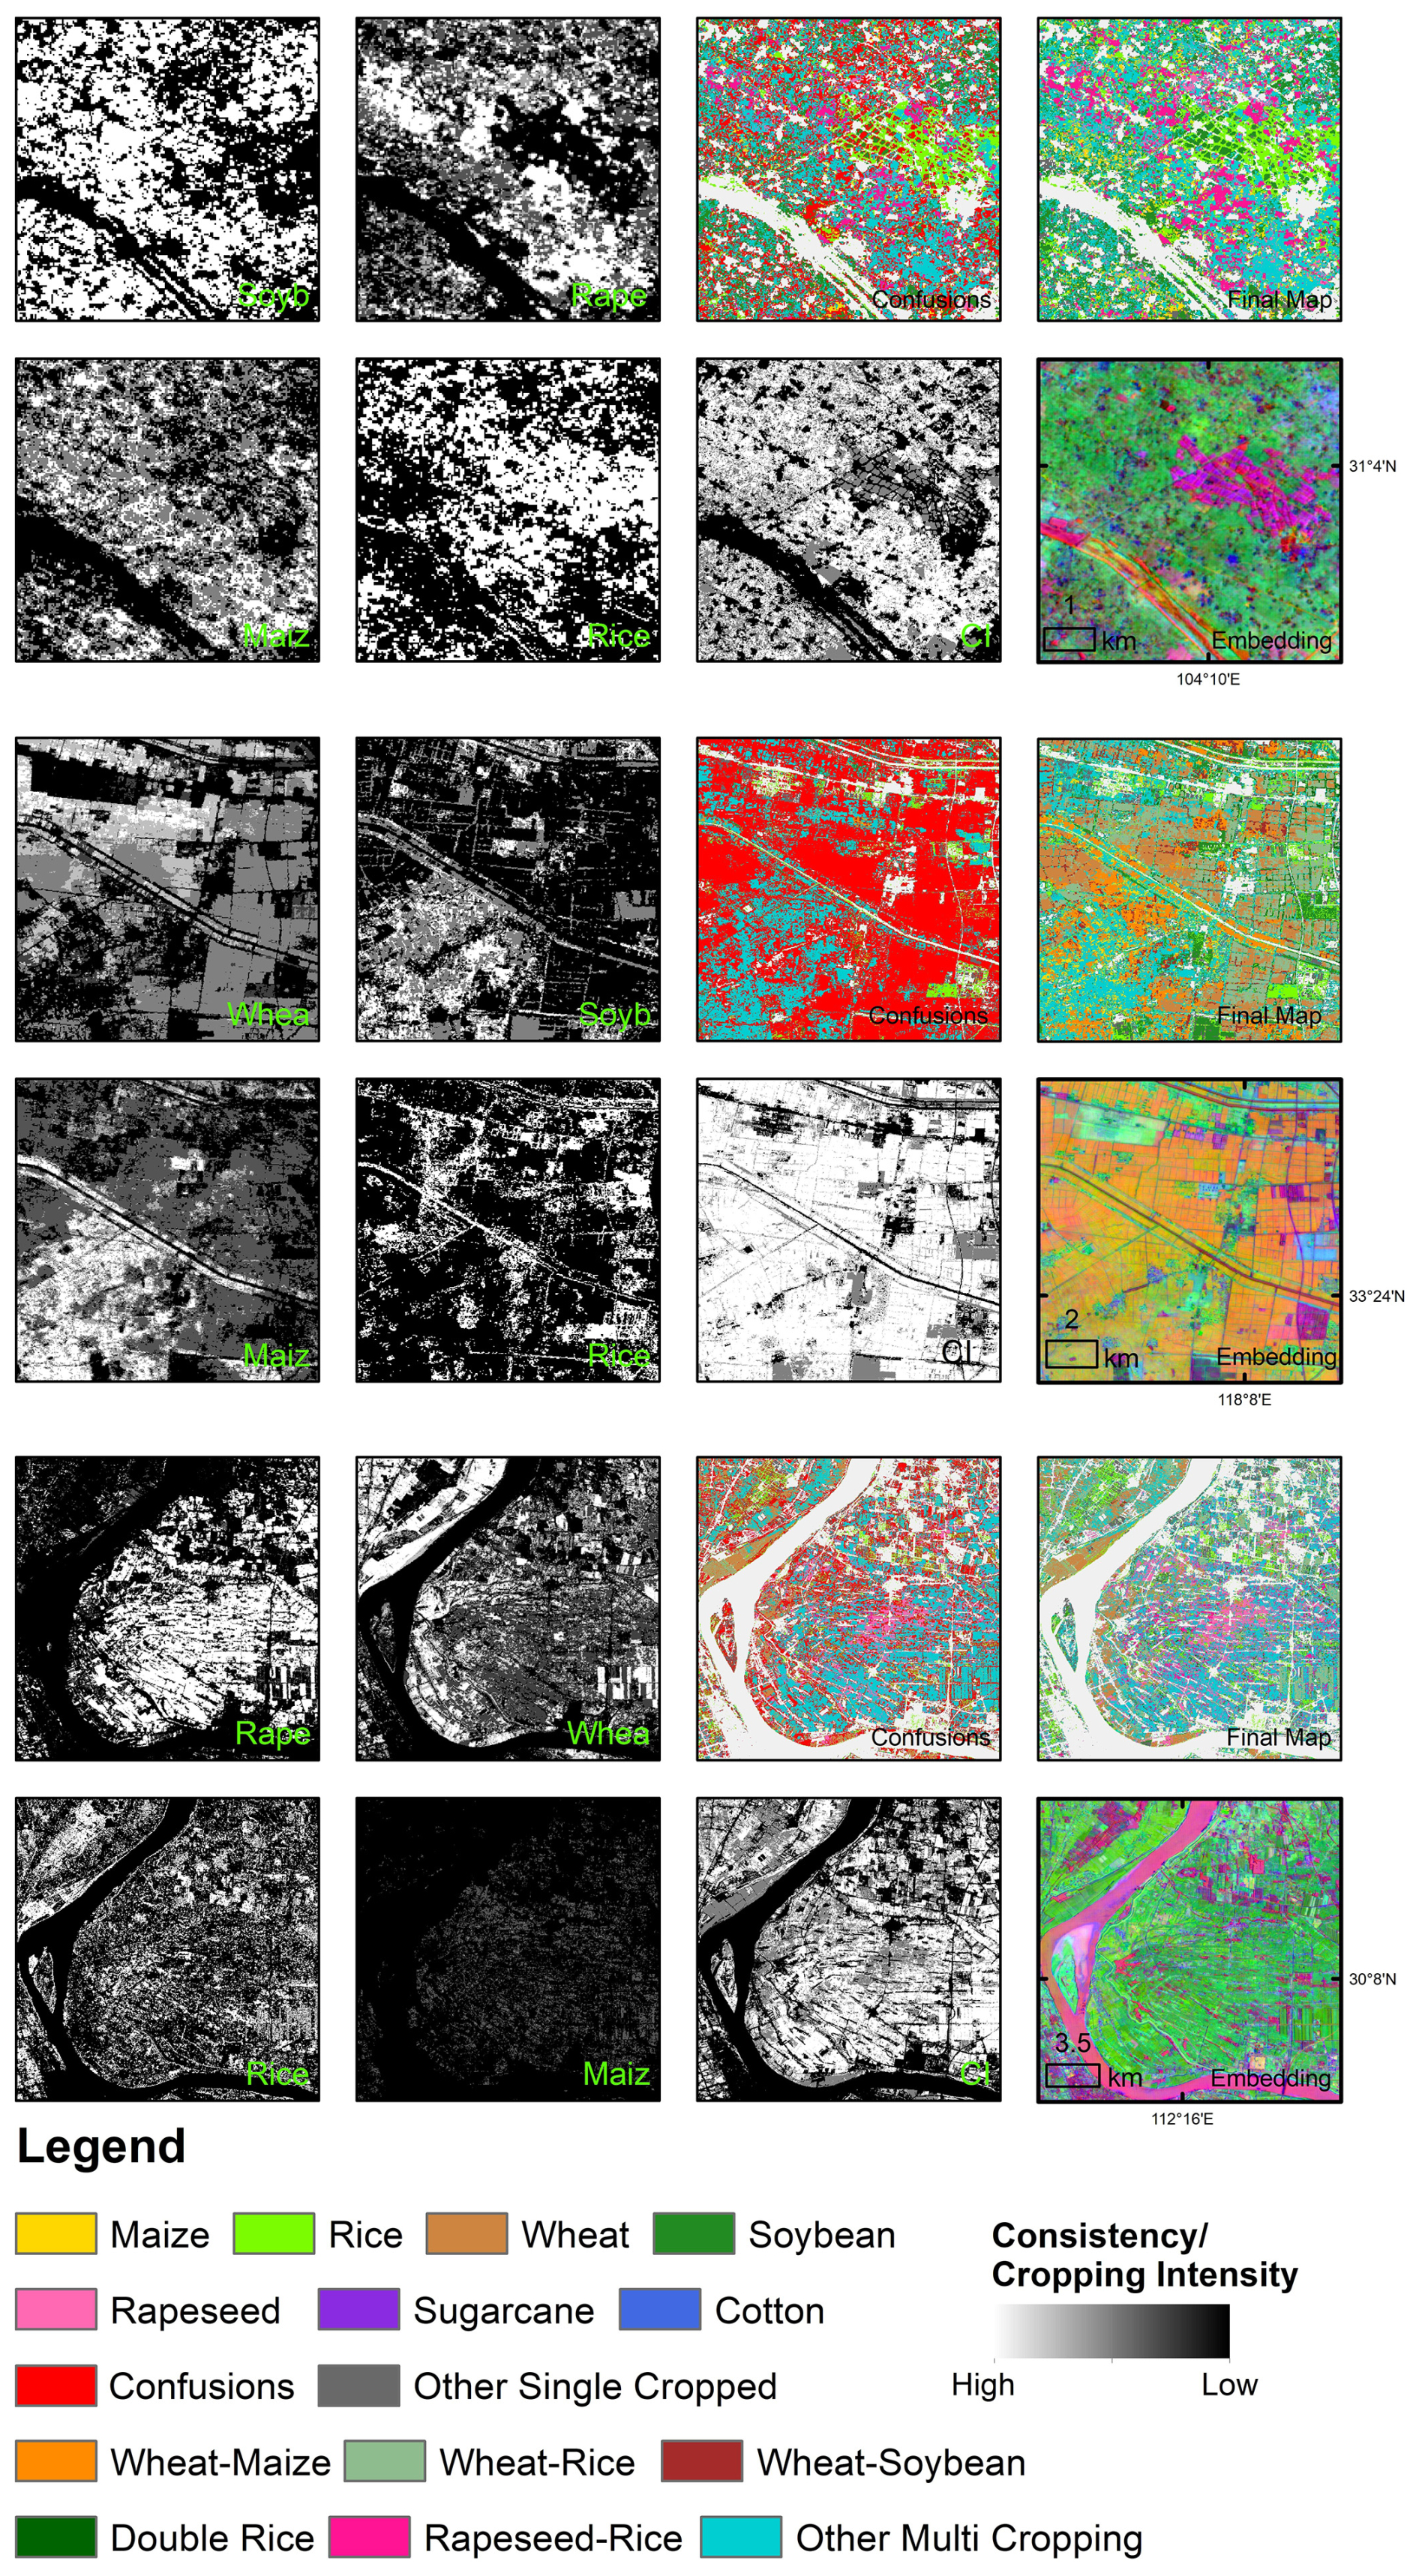
Figure 11Comparisons of our results and other crop maps (more complex cropping systems) in the year 2020.
4.1 Data-Driven and Knowledge-Driven Framework in Crop type mapping
Approaches to crop type mapping in remote sensing can broadly be categorized into knowledge-driven and data-driven frameworks. The knowledge-driven framework relies on expert-defined spectral and phenological indicators and corresponding threshold-based rules for crop identification, whereas the data-driven framework depends on massive samples and statistical or machine learning models to automatically learn discriminative features from data rather than relying on manually defined rules. These two frameworks exhibit distinct advantages under different research tasks and application contexts. Specifically, knowledge-driven approaches represent empirical generalizations derived from existing data and can provide reliable guidance in regions where reference data are scarce. In contrast, data-driven approaches have shown great potential for large-scale studies and applications, as extensive reference datasets enable broader model generalization and application.
To conduct complex cropping patterns mapping in China, our study established a data-driven crop mapping framework based on two major data sources. First, over twenty existing crop mapping products across China were collected and integrated. A consistency analysis was then conducted to identify areas with consistent mapping results, as well as regions characterized by confusion, low consistency, or unlabeled pixels. Second, the study employed the Google Satellite Embeddings generated by the large-scale remote sensing foundation model AlphaEarth. The embedding features produced by this model preserve high-level information from multiple data sources, enabling the implicit representation of crop growth differences even without explicit temporal inputs. This effectively complements traditional knowledge-driven approaches that rely heavily on handcrafted feature selection.
However, knowledge-driven approaches offer better interpretability and contribute to a deeper understanding of crop physiological traits and spectral characteristics. In maize and soybean classification studies, several pigment-related spectral indices have been developed or refined to capture crop-specific traits, such as the Transformed Chlorophyll Absorption in Reflectance Index (TCARI), the Anthocyanin Reflectance Index (ARI) for maize, and the Shortwave Infrared Water Stress Index (SIWSI) for soybean (Huang et al., 2022, 2024). For maize, its high photosynthetic efficiency and increasing chlorophyll concentration during the tasselling stage lead to relatively low TCARI values, while its canopy is dominated by leaves rather than reproductive organs, resulting in relatively low TCARI but generally high vegetation index values. Moreover, maize exhibits markedly lower ARI values than sorghum (red fruits), enabling effective discrimination between the two species (Huang et al., 2024). Soybean is characterized by significant leaf senescence and water loss during the late growth stages, and its chlorophyll content remains lower than that of maize but higher than that of peanut, potato, cotton, and sunflower throughout the growing season. It can therefore be distinguished using water stress indices and chlorophyll-related indices (Huang et al., 2022). As short-wave infrared (SWIR) reflectance increases with decreasing canopy water content, soybean is unique among major crops for showing both high NDVI and high SWIR values during peak growth. Several studies have developed indices based on this characteristic, such as the Greenness and Water Content Composite Index (GWCCI) (Chen et al., 2023).
Rice, winter wheat, and rapeseed exhibit distinct and identifiable phenological stages throughout their growth cycles, which make them clearly distinguishable from other crops. Many studies have developed targeted indices based on these temporal features. Rice is unique in that it is cultivated under mixed water and soil conditions, producing a flooding signal during the transplanting stage. This can be identified by the Land Surface Water Index (LSWI) and vegetation indices (Xiao et al., 2005; Xiao et al., 2006; Zhang et al., 2015). In addition, the backscattering properties change markedly during this stage, with both VV (vertical transmit, vertical receive) and VH (vertical transmit, horizontal receive) polarizations reaching local minima at transplanting and rising sharply thereafter (Zhan et al., 2021; Singha et al., 2019; Han et al., 2021). Based on these reflection and scattering characteristics, several key indices have been proposed, such as the Flooding/Transplanting Index (FTI) (Zhang et al., 2015).
Winter wheat also exhibits distinct phenological stages. Before winter dormancy, winter wheat undergoes a short period of vegetative growth, during which vegetation indices reach a local peak. Growth then stagnates over winter and resumes in early spring with stages including jointing, heading, flowering, grain filling, and maturity. Based on these characteristic phenological patterns, several studies have proposed specialized indices such as the Peak Before Winter Feature (PBWF) (Tao et al., 2017), the Normalized Difference Phenology Index (NDPI) (Dong et al., 2020b), and the Winter Wheat Index (WWI) (Qu et al., 2021).
Rapeseed is easily distinguished from other crops due to its bright yellow flowers during the blooming stage. Based on this unique reflectance feature, many studies have developed spectral indices such as the Band Ratio of Red and Green (BRGR) (Ashourloo et al., 2019), the Normalized Red Green Blue Index (NRGBI) (Danylo et al., 2021), the Normalized Difference Yellow Index (NDYI) (Sulik and Long, 2015), and the Winter Rapeseed Index (WRI) (Zhang et al., 2022). In addition to this distinctive spectral response, the backscattering properties of rapeseed also vary markedly during flowering. The petals reduce VV and VH backscattering, whereas the pods increase VH intensity. This contrast enables rapeseed to be distinguished from other winter crops such as winter wheat, which shows lower VH values during the pod-filling period (around April) (Dong et al., 2020a; Danylo et al., 2021). Other crop-specific indices have also been proposed, including the Cotton Mapping Index (CMI) (Xun et al., 2021).
Although extensive knowledge has been accumulated regarding crop-specific remote sensing signals, their applicability varies across regions, spatial and temporal scales, and data conditions. The threshold settings and implementation methods also lack universality. Therefore, systematically integrating and dynamically updating this knowledge system remains an important direction for future crop mapping research. In the context of rapidly expanding data resources and algorithmic capabilities, exploring the integration of knowledge-driven domain understanding with data-driven model learning holds significant potential. As the spatial scale of mapping continues to expand and agricultural landscapes become increasingly complex, the research focus has shifted from single crop types to multi-type and complex cropping systems. This evolution imposes greater demands on model generalization and feature representation, thereby driving a systematic transition in crop mapping from knowledge-driven approaches that rely on expert experience and rule design to data-driven frameworks grounded in large-scale data and model learning.
4.2 Exploring the Interpretability of Google Satellite Embeddings
Secondly, our model provides an enhanced understanding of the applicability of different bands in the Google Satellite Embeddings product for crop mapping in China. Satellite Embeddings was generated by the Earth observation foundation model AlphaEarth, which learns generalized representations from a wide range of satellite and environmental datasets including Sentinel-1 C-band synthetic aperture radar (SAR), Sentinel-2 multispectral imagery, Landsat-8/9 multispectral, panchromatic, and thermal bands, GEDI canopy height metrics, the GLO-30 digital elevation model, ERA5-Land monthly reanalysis data, ALOS PALSAR-2 SAR imagery, GRACE monthly mass grids, and multiple text-based sources. Embeddings product abstracts these multi-source data into 64 bands, whose physical meanings and functional roles have not yet been fully revealed.
From the perspective of crop mapping, our study contributes to improving the interpretability of these features. The results of feature importance indicate that different embedding features play distinct roles in multi-year crop classification: bands A8 and A11 were most important for maize mapping, A10 for rapeseed, A40 for rice, A33 for soybean, and A21 for wheat (Fig. 12).
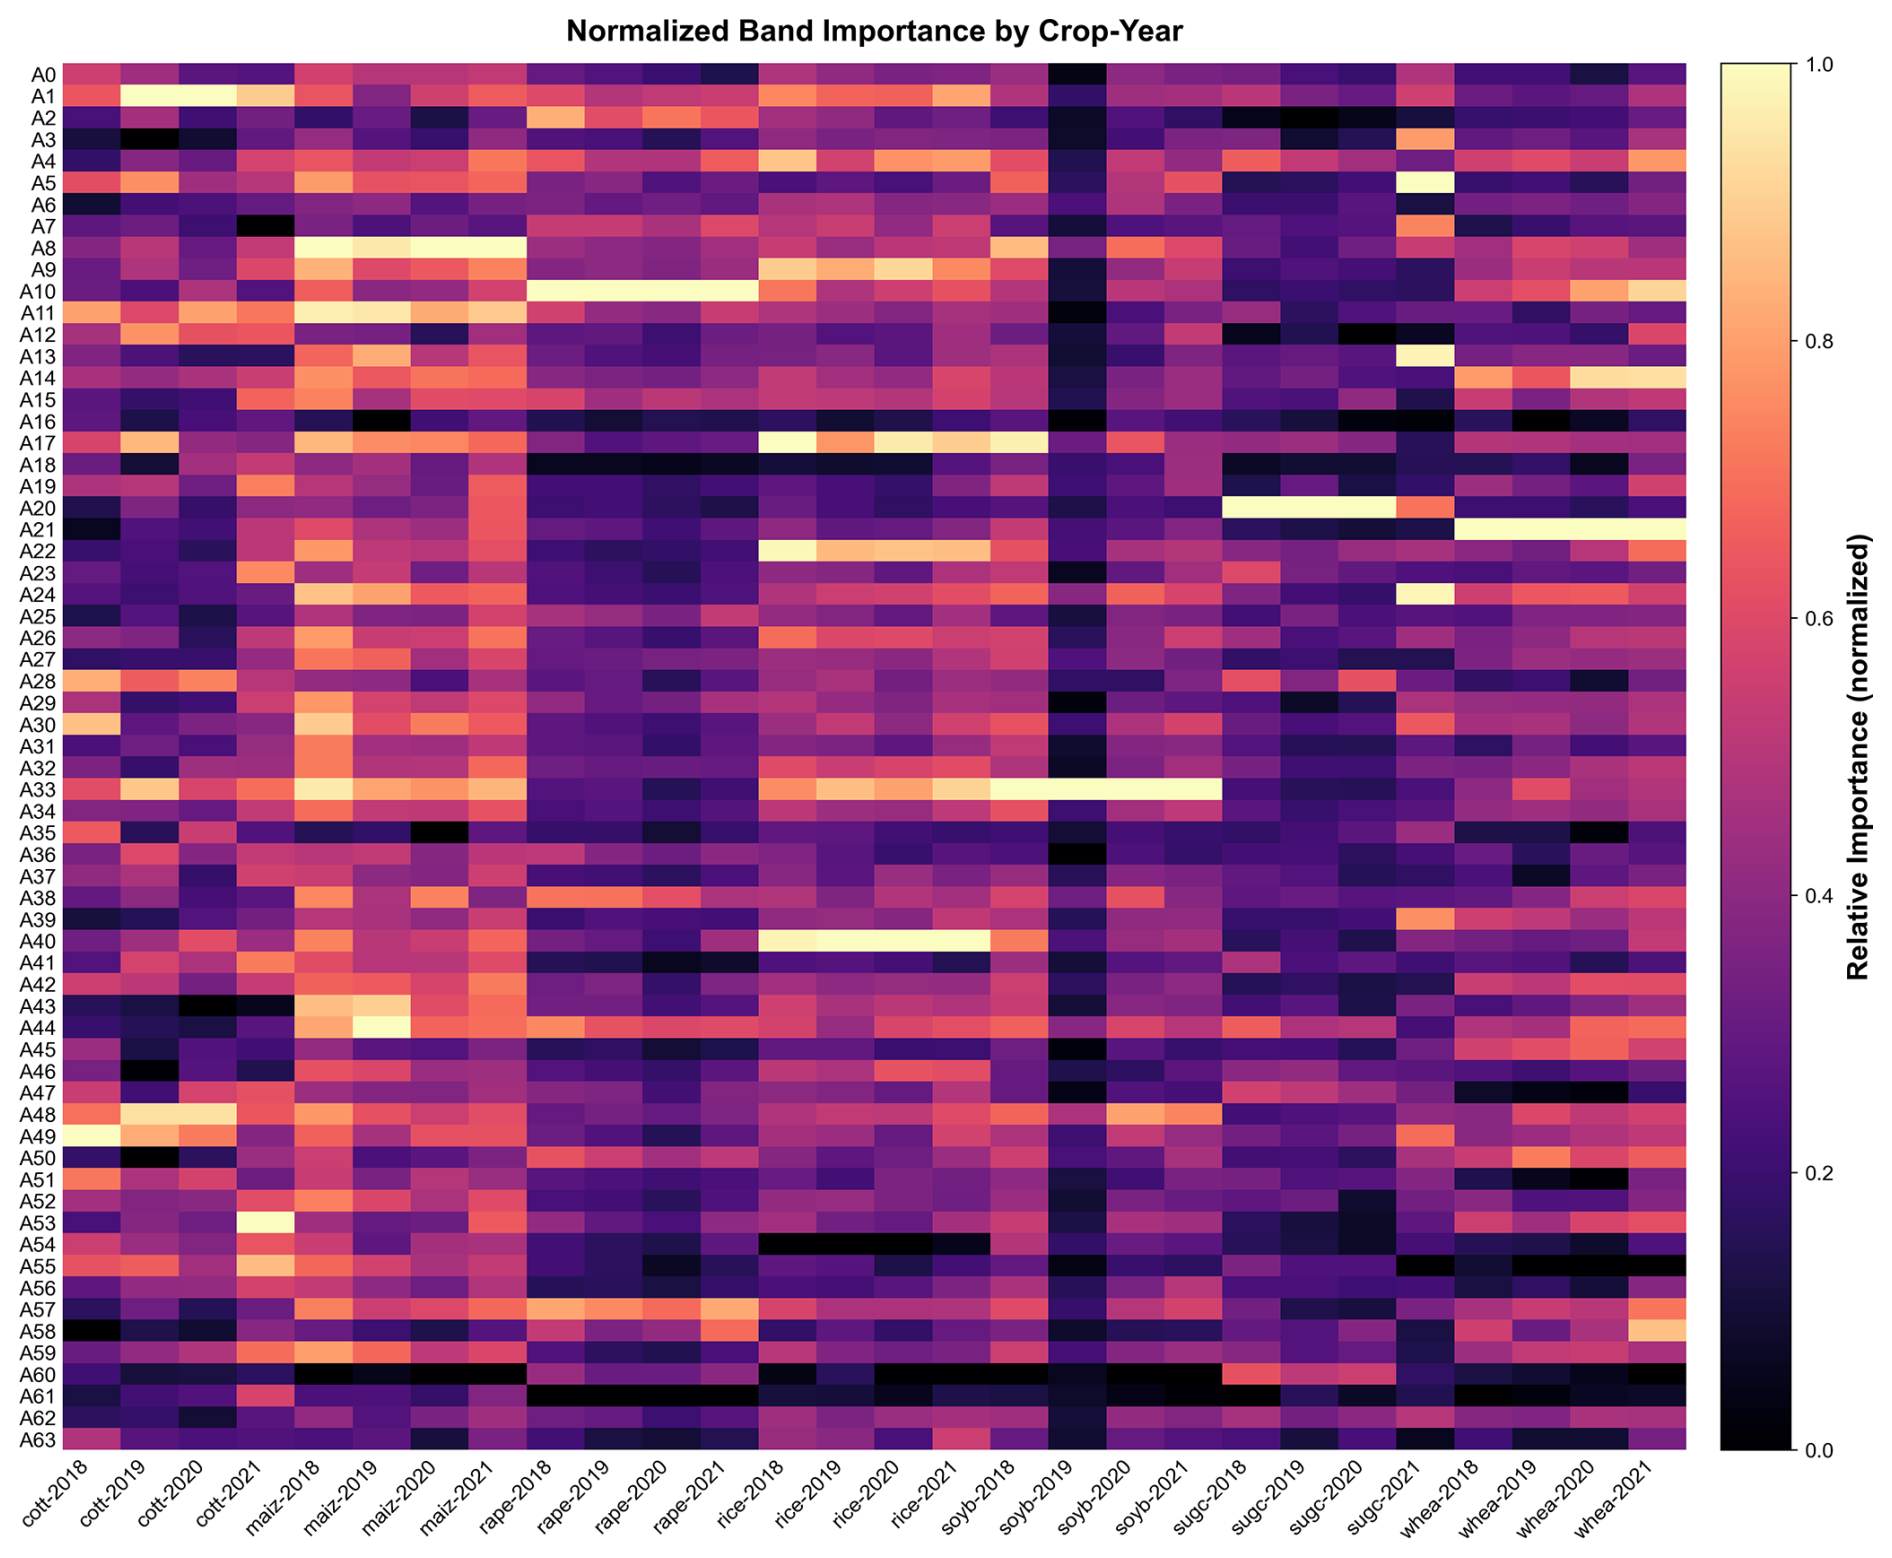
Unlike traditional crop mapping approaches that rely on multi-temporal satellite observations to capture seasonal phenological signals, Google Satellite Embeddings is an annual product containing only 64 general features without explicit temporal information. Our findings suggest that crop seasonal signals are implicitly encoded within these embeddings. Through large-scale learning from multi-source imagery, AlphaEarth effectively removes redundant information and captures the key representations of terrestrial surface patterns.
This capability is consistent with studies that explore satellite embeddings across different levels of application, progressing from general land-cover representation to more task-specific agricultural applications. Recent studies have demonstrated that satellite embeddings outperform traditional spectral indices in land-cover mapping, improving overall accuracy by approximately 5 % and Kappa by about 3 % (Khan and Ahmad, 2025; Mantey et al., 2025). Within this context, satellite embeddings have also shown strong performance in cropland mapping, with contributions more than twice those of traditional remote sensing features (Cai et al., 2026). Their non-linear response patterns suggest that embeddings encode richer and more complex information, although this may reduce their direct interpretability. From a biophysical perspective, recent studies further suggest that satellite embeddings preserve key vegetation-related information, including pigment, structural, and phenological signals, enabling accurate modeling of crop traits (e.g., R2 up to ∼ 0.9) while maintaining efficient representation (Alam and Simic Milas, 2025). Notably, despite their annual temporal resolution, embeddings can still capture growing-season signals, suggesting their ability to retain phenological information relevant to crop dynamics. At a more application-oriented level, embedding-based models have demonstrated strong performance across a range of agricultural tasks, including yield prediction (R2≈ 0.7–0.8 for major crops), as well as tillage and cover cropping (Ma et al., 2025), showing competitiveness with purpose-built remote sensing models. However, several limitations have also been identified. In particular, embedding-based models may exhibit reduced spatial transferability due to region-specific feature representations, and their lack of explicit physical meaning limits interpretability. In addition, the annual temporal resolution constrains sensitivity to within-season dynamics.
Nevertheless, these limitations do not undermine their effectiveness for large-scale crop mapping. Previous applications have primarily focused on relatively homogeneous agricultural regions, such as the U.S. Corn and Soybean Belt. In contrast, our study validates the applicability of satellite embeddings for supervised crop classification in China, where agricultural landscapes are far more fragmented and cropping systems substantially more complex. This further demonstrates that satellite embeddings provide a compact, information-rich, and scalable representation for crop mapping across diverse agro-ecological conditions.
4.3 National-Scale Crop Mapping across Years in Complex Cropping Landscapes
In addition, our study provides a national-scale understanding of China's complex cropping systems and their spatiotemporal dynamics over recent years. Our results are in line with existing studies, while providing a more systematic and in-depth estimation. In addition to nationwide information on the number, spatial distribution, and composition of cropping patterns (Qiu et al., 2025b) or detailed information of one certain crop type (Qiu et al., 2025a), our work produced annual cropping-pattern maps that capture interannual rotations and structural shifts in cropping systems. Such knowledge is essential for understanding the current status of nationwide cropping systems and their interannual changes.
By integrating detailed 10 m crop mapping products at the national scale across years, our results can serve as a valuable reference for developing more comprehensive and full-category crop maps, as well as for extending crop mapping frameworks to broader spatial and temporal contexts. These datasets provide critical support for building crop mapping frameworks suited to China's heterogeneous agricultural landscapes, enabling more timely and accurate identification of crop distributions, including in-season crop mapping and annual map updating (Zhang et al., 2025; Li et al., 2025). Historical crop mapping products have been widely used to support subsequent prediction and in-season mapping. For example, in the United States, the long-term and consistently updated CDL dataset has enabled the development of automated national-scale in-season crop mapping and temporal transfer frameworks (Zhang et al., 2021; Li et al., 2024). Similarly, the mapping results generated in this study provide a foundation for future efforts in spatiotemporal transfer and in-season crop mapping. When combined with weather forecasting and disaster early-warning systems, such frameworks can support agricultural insurance, risk management, and stabilizing crop production (Yu et al., 2025a; Wu et al., 2023).
In addition, our maps enable direct estimation of crop diversity, rotation frequency and non-grain production trends. Crop diversity brings multiple benefits for food security and environmental protection. At the national scale, higher crop diversity can enhance food stability and security (Renard and Tilman, 2021, 2019; Meng et al., 2024). At the field scale, previous studies indicate that rotation and intercropping can raise yields (Yang et al., 2024; Smith et al., 2023) while reducing fertilizer dependence and environmental pollution (Li et al., 2020), and soil-improving crops such as legumes can enhance fertility for subsequent crops (Franche et al., 2009). While the trend of non-grain production reflects the competition for limited agricultural land between food crops and non-food crops (e.g., cash crops), it is therefore an important consideration for national food security (Qiu et al., 2024a; Zhu et al., 2024).
From a policy perspective, our fine-resolution annual maps of cropping patterns offer essential data for optimizing planting patterns and crop switching practices, thereby supporting decisions that address the water–land–energy–economy–environment–food nexus in agricultural production (Wu et al., 2025a; Xie et al., 2023). The insights gained from this study contribute to strategies that advance sustainable intensification, strengthen climate adaptation and mitigation capacities, and ultimately enhance the resilience of China's agricultural systems to future climate variability while minimizing environmental impacts.
4.4 Uncertainties and limitations
Although our framework shows promising performance, several uncertainties and limitations should be acknowledged when interpreting the results and applying the dataset. Firstly, our framework does not directly address biased consensus errors among multi-source products. Although areas with high agreement among existing products are often interpreted as more reliable, such cross-product consensus may reflect shared systematic errors rather than true accuracy. Consequently, pixel-wise agreement may mask underlying misclassification, leading to spatially coherent yet potentially biased predictions.
Secondly, cropping intensity plays a central role in our mapping framework, as it determines whether a pixel is classified as a single or multiple cropping system. We adopted the Cropland Use Intensity maps in China (China-CUI10m), which have achieved high accuracy when compared to ground truth data (Overall accuracy = 90.88 %, F1 scores of 0.87 to 0.92, total size = 42 193) and statistical data (R2>0.94) (Qiu et al., 2024b). However, multi-cropping systems may still be underestimated, especially in southern China, due to limited valid Sentinel-2 observations (Qiu et al., 2023). When the proportion of valid observations drops below 25 %, classification accuracy decreases sharply. However, these low-availability conditions affect less than 10 % of China's cropland (Qiu et al., 2024b).
In addition, reclassification uncertainty may persist in confusion areas. The confusion areas identified in this study represent regions where different crop mapping products disagree. These areas typically include landscapes with fragmented agriculture, weak seasonal spectral contrast, or frequent cloud cover, where reference samples are sparse and crop signatures are less separable. In the absence of sufficient in-situ samples, reclassification of these confusion areas relied on models trained primarily on samples from high-agreement areas, which may not fully capture the distinct characteristics of the confusion areas. Moreover, the embedding features derived from the foundation model provide generalized spatial representations but lack explicit temporal phenological information. This differs from traditional time-series–based crop mapping approaches and may lack interpretability (discussed in Sect. 4.1 and 4.2). In summary, users should interpret classification results with caution in locations where accuracy metrics remain comparatively low (see Sect. 3.2 for details).
It should also be acknowledged that the representation of minor crop types remains incomplete in the classification system of our products. Although the current classification covers the major crop types across China, it may overlook less dominant but locally important crops (such as potato, peanut and various vegetables). Due to their relatively limited spatial extent and low availability in existing mapping products, these crop types may be aggregated into broader “other crops” categories, leading to a partial loss of cropping system diversity in the dataset. Future improvements will focus on integrating more detailed crop inventories and expanding region-specific reference samples to enhance the representation of minor crop systems.
Datasets produced by this study are available to the public at https://doi.org/10.6084/m9.figshare.30582161 (Li and Yu, 2025), which include seven single-cropping types (maize, rice, wheat, soybean, rapeseed, sugarcane, cotton) and five double-cropping sequences (wheat–maize, wheat–rice, double rice, rapeseed–rice, and wheat–soybean). Datasets are provided in a Geotiff format and in ESPG: 4326 (GCS_WGS_1984) spatial reference system at the spatial resolution of 10 m.
In this study, we developed a data-driven crop mapping framework by integrating multiple existing crop products with the Google Satellite Embeddings derived from the AlphaEarth foundation model, and produced 10 m resolution mapping of complex cropping patterns across China from 2018 to 2021. The crop mapping products generated in this study include seven single-cropping types, namely maize, rice, wheat, soybean, rapeseed, sugarcane, cotton, and five double-cropping sequences, including wheat–maize, wheat–rice, double rice, rapeseed–rice, and wheat–soybean.
Firstly, we integrated multiple publicly available crop mapping products within a harmonized framework that applies a unified cropland extent and cropping intensity, providing a systematic assessment of their consistency at pixel level. Consistency analysis results classify the study area into areas with consistency and areas with confusion, the latter serving as the mapping focus. Inconsistent areas were categorized into three classes: Confused, Low-consistency, and Unlabeled. Confused areas are mainly distributed in the northeast Plain (particularly in the northeastern part), the North China Plain, and Yunnan Province; Low-consistency areas are concentrated in northern croplands while Unlabeled areas are mainly distributed in western China.
Then, by combining harmonized crop data layers with random forest classifiers trained on foundation-derived embedding features, our framework effectively enhanced the spatial coherence and temporal stability, achieving an overall accuracy of 92.60 % and an F1 score of 0.7584. Compared with ADM-2 statistics, the mapped cropping areas achieved high consistency (R2= 0.849, RMSE = 4.61 × 10⁴ ha, MAE = 2.07 × 10⁴ ha) with a regression slope of 1.087. Additionally, the results of feature importance indicate that different embedding features play distinct roles in multi-year crop classification: bands A8 and A11 were most important for maize mapping, A10 for rapeseed, A40 for rice, A33 for soybean, and A21 for wheat.
The resulting datasets provide an integrated depiction of China's complex cropping systems, enabling consistent interannual assessments of changes in crop types, cropping sequences, and spatial patterns at 10 m resolution. From 2018 to 2021, 64.85 % of the cropland experienced changes in cropping patterns. Among the single-cropping systems, rice and maize also exhibited relatively high stability in cropping patterns, with 82 % and 79 % of their cropping areas remaining unchanged, respectively. In contrast, nearly or more than half of the planting areas for soybean, wheat, and rapeseed changed cropping patterns. For double-cropping systems, the wheat–maize system exhibited the highest stability, with 78 % of the area remaining unchanged, followed by double-rice and wheat-rice, with 66 % and 54 % of their planting area unchanged. The majority of changes occurred between single-to-single cropping systems, accounting for 62.95 % of the total changed area. Among single crops, the rotation between maize and soybean was the most common, accounting for 32 % of the total soybean area and 13 % of the maize area. Among double-to-double cropping systems changes (accounting for 23.97 % of the total changed area), there was a high degree of alternation from wheat–soybean to wheat–maize systems. In summary, our mapping framework and products established a robust foundation for refined agricultural management and policy decisions, while supporting climate-smart and sustainable land-use planning.
The supplement related to this article is available online at https://doi.org/10.5194/essd-18-5601-2026-supplement.
XL and YL designed the framework and XL developed the datasets. XL prepared the manuscript with contributions from all co-authors.
The contact author has declared that neither of the authors has any competing interests.
Publisher's note: Copernicus Publications remains neutral with regard to jurisdictional claims made in the text, published maps, institutional affiliations, or any other geographical representation in this paper. The authors bear the ultimate responsibility for providing appropriate place names. Views expressed in the text are those of the authors and do not necessarily reflect the views of the publisher.
The authors would like to thank the editor and anonymous reviewers for their constructive comments and suggestions.
This work was supported by the National Key R&D Program of China (grant no. 2025YFE0209600) and the open project of State Key Laboratory of Efficient Utilization of Arable Land in China, the Institute of Agricultural Resources and Regional Planning, Chinese Academy of Agricultural Sciences (grant no. EUAL-2025-03).
This paper was edited by Chaoqun Lu and reviewed by two anonymous referees.
Adnan, M. N. and Islam, M. Z.: One-vs-all binarization technique in the context of random forest, Proceedings of the European Symposium on Artificial Neural Networks, Computational Intelligence and Machine Learning, 385–390, ISBN 978-287587014-8, 2015.
Alam, M. M. T. and Simic Milas, A.: Dimensionality optimized machine learning retrieval of canopy chlorophyll, nitrogen, and phosphorus from google satellite embeddings, Smart Agricultural Technology, 12, 101601, https://doi.org/10.1016/j.atech.2025.101601, 2025.
Ashourloo, D., Shahrabi, H. S., Azadbakht, M., Aghighi, H., Nematollahi, H., Alimohammadi, A., and Matkan, A. A.: Automatic canola mapping using time series of sentinel 2 images, ISPRS J. Photogramm., 156, 63–76, https://doi.org/10.1016/j.isprsjprs.2019.08.007, 2019.
Barbieri, P., Pellerin, S., Seufert, V., and Nesme, T.: Changes in crop rotations would impact food production in an organically farmed world, Nat. Sustain., 2, 378–385, https://doi.org/10.1038/s41893-019-0259-5, 2019.
Bastani, F., Wolters, P., Gupta, R., Ferdinando, J., and Kembhavi, A.: Satlaspretrain: A large-scale dataset for remote sensing image understanding, Proceedings of the IEEE/CVF International Conference on Computer Vision, 16772–16782, https://doi.org/10.1109/ICCV51070.2023.01538, 2023.
Becker-Reshef, I., Barker, B., Whitcraft, A., Oliva, P., Mobley, K., Justice, C., and Sahajpal, R.: Crop Type Maps for Operational Global Agricultural Monitoring, Sci. Data, 10, 172, https://doi.org/10.1038/s41597-023-02047-9, 2023.
Blickensdörfer, L., Schwieder, M., Pflugmacher, D., Nendel, C., Erasmi, S., and Hostert, P.: Mapping of crop types and crop sequences with combined time series of Sentinel-1, Sentinel-2 and Landsat 8 data for Germany, Remote Sens. Environ., 269, 112831, https://doi.org/10.1016/j.rse.2021.112831, 2022.
Boryan, C., Yang, Z., Mueller, R., and Craig, M.: Monitoring US agriculture: the US Department of Agriculture, National Agricultural Statistics Service, Cropland Data Layer Program, Geocarto Int., 26, 341–358, https://doi.org/10.1080/10106049.2011.562309, 2011.
Breiman, L.: Random Forests, Mach. Learn., 45, 5–32, https://doi.org/10.1023/A:1010933404324, 2001.
Brown, C. F., Kazmierski, M. R., Pasquarella, V. J., Rucklidge, W. J., Samsikova, M., Zhang, C., Shelhamer, E., Lahera, E., Wiles, O., and Ilyushchenko, S.: Alphaearth foundations: An embedding field model for accurate and efficient global mapping from sparse label data, arXiv [preprint], https://doi.org/10.48550/arXiv.2507.22291, 2025.
Cai, Y., Li, B., Liu, X., Jiang, X., Zhu, Y., Luo, S., Qin, Y., Xie, S., Ye, J., Shen, H., Guo, Z., Liu, X., and Zeng, Z.: Annual 10-m high-resolution cropland maps for Southeast Asia since 2019 using AlphaEarth embeddings, Earth Syst. Sci. Data Discuss. [preprint], https://doi.org/10.5194/essd-2026-78, in review, 2026.
Chen, H., Li, H., Liu, Z., Zhang, C., Zhang, S., and Atkinson, P. M.: A novel Greenness and Water Content Composite Index (GWCCI) for soybean mapping from single remotely sensed multispectral images, Remote Sens. Environ., 295, 113679, https://doi.org/10.1016/j.rse.2023.113679, 2023.
Cui, K. and Shoemaker, S. P.: A look at food security in China, NPJ Science of Food, 2, 4, https://doi.org/10.1038/s41538-018-0012-x, 2018.
d'Andrimont, R., Taymans, M., Lemoine, G., Ceglar, A., Yordanov, M., and van der Velde, M.: Detecting flowering phenology in oil seed rape parcels with Sentinel-1 and -2 time series, Remote Sens. Environ., 239, 111660, https://doi.org/10.1016/j.rse.2020.111660, 2020.
d'Andrimont, R., Verhegghen, A., Lemoine, G., Kempeneers, P., Meroni, M., and van der Velde, M.: From parcel to continental scale – A first European crop type map based on Sentinel-1 and LUCAS Copernicus in-situ observations, Remote Sens. Environ., 266, 112708, https://doi.org/10.1016/j.rse.2021.112708, 2021.
Dai, K., Cheng, C., Li, B., Xie, Y., Gomez, J. A., Wang, Z., and Wu, X.: Mapping the harvest area of a comprehensive set of crop types in China from 1990 to 2020 at a 1-km resolution, Scientific Data, 12, 1371, https://doi.org/10.1038/s41597-025-05723-0, 2025.
Danylo, O., Pirker, J., Lemoine, G., Ceccherini, G., See, L., McCallum, I., Hadi, Kraxner, F., Achard, F., and Fritz, S.: A map of the extent and year of detection of oil palm plantations in Indonesia, Malaysia and Thailand, Scientific Data, 8, 96, https://doi.org/10.1038/s41597-021-00867-1, 2021.
Di Tommaso, S., Wang, S., Strey, R., and Lobell, D. B.: Mapping sugarcane globally at 10 m resolution using Global Ecosystem Dynamics Investigation (GEDI) and Sentinel-2, Earth Syst. Sci. Data, 16, 4931–4947, https://doi.org/10.5194/essd-16-4931-2024, 2024.
Dong, J., Fu, Y., Wang, J., Tian, H., Fu, S., Niu, Z., Han, W., Zheng, Y., Huang, J., and Yuan, W.: Early-season mapping of winter wheat in China based on Landsat and Sentinel images, Earth Syst. Sci. Data, 12, 3081–3095, https://doi.org/10.5194/essd-12-3081-2020, 2020a.
Dong, Q., Chen, X., Chen, J., Zhang, C., Liu, L., Cao, X., Zang, Y., Zhu, X., and Cui, X.: Mapping Winter Wheat in North China Using Sentinel 2A/B Data: A Method Based on Phenology-Time Weighted Dynamic Time Warping, Remote Sens., 12, 1274, https://doi.org/10.3390/rs12081274, 2020b.
Fisette, T., Rollin, P., Aly, Z., Campbell, L., Daneshfar, B., Filyer, P., Smith, A., Davidson, A., Shang, J., and Jarvis, I.: AAFC annual crop inventory, 2013 Second International Conference on Agro-Geoinformatics (Agro-Geoinformatics), 12–16 August 2013, https://doi.org/10.1109/Argo-Geoinformatics.2013.6621920, 2013.
Foley, J. A., Ramankutty, N., Brauman, K. A., Cassidy, E. S., Gerber, J. S., Johnston, M., Mueller, N. D., O'Connell, C., Ray, D. K., West, P. C., Balzer, C., Bennett, E. M., Carpenter, S. R., Hill, J., Monfreda, C., Polasky, S., Rockström, J., Sheehan, J., Siebert, S., Tilman, D., and Zaks, D. P. M.: Solutions for a cultivated planet, Nature, 478, 337–342, https://doi.org/10.1038/nature10452, 2011.
Franche, C., Lindström, K., and Elmerich, C.: Nitrogen-fixing bacteria associated with leguminous and non-leguminous plants, Plant Soil, 321, 35–59, https://doi.org/10.1007/s11104-008-9833-8, 2009.
Galar, M., Fernández, A., Barrenechea, E., Bustince, H., and Herrera, F.: An overview of ensemble methods for binary classifiers in multi-class problems: Experimental study on one-vs-one and one-vs-all schemes, Pattern Recognition, 44, 1761–1776, https://doi.org/10.1016/j.patcog.2011.01.017, 2011.
Gong, P., Wang, J., Yu, L., Zhao, Y., Zhao, Y., Liang, L., Niu, Z., Huang, X., Fu, H., Liu, S., Li, C., Li, X., Fu, W., Liu, C., Xu, Y., Wang, X., Cheng, Q., Hu, L., Yao, W., Zhang, H., Zhu, P., Zhao, Z., Zhang, H., Zheng, Y., Ji, L., Zhang, Y., Chen, H., Yan, A., Guo, J., Yu, L., Wang, L., Liu, X., Shi, T., Zhu, M., Chen, Y., Yang, G., Tang, P., Xu, B., Giri, C., Clinton, N., Zhu, Z., Chen, J., and Chen, J.: Finer resolution observation and monitoring of global land cover: first mapping results with Landsat TM and ETM+ data, Int. J. Remote Sens., 34, 2607–2654, https://doi.org/10.1080/01431161.2012.748992, 2013.
Gong, P., Liu, H., Zhang, M., Li, C., Wang, J., Huang, H., Clinton, N., Ji, L., Li, W., Bai, Y., Chen, B., Xu, B., Zhu, Z., Yuan, C., Ping Suen, H., Guo, J., Xu, N., Li, W., Zhao, Y., Yang, J., Yu, C., Wang, X., Fu, H., Yu, L., Dronova, I., Hui, F., Cheng, X., Shi, X., Xiao, F., Liu, Q., and Song, L.: Stable classification with limited sample: transferring a 30-m resolution sample set collected in 2015 to mapping 10-m resolution global land cover in 2017, Sci. Bull., 64, 370–373, https://doi.org/10.1016/j.scib.2019.03.002, 2019.
Gunton, R. M., Firbank, L. G., Inman, A., and Winter, D. M.: How scalable is sustainable intensification?, Nat. Plants, 2, 16065, https://doi.org/10.1038/nplants.2016.65, 2016.
Guo, X., Lao, J., Dang, B., Zhang, Y., Yu, L., Ru, L., Zhong, L., Huang, Z., Wu, K., and Hu, D.: Skysense: A multi-modal remote sensing foundation model towards universal interpretation for earth observation imagery, Proceedings of the IEEE/CVF Conference on Computer Vision and Pattern Recognition, 27672–27683, https://doi.org/10.1109/CVPR52733.2024.02613, 2024.
Halpern, B. S., Frazier, M., Verstaen, J., Rayner, P.-E., Clawson, G., Blanchard, J. L., Cottrell, R. S., Froehlich, H. E., Gephart, J. A., Jacobsen, N. S., Kuempel, C. D., McIntyre, P. B., Metian, M., Moran, D., Nash, K. L., Többen, J., and Williams, D. R.: The environmental footprint of global food production, Nat. Sustain., 5, 1027–1039, https://doi.org/10.1038/s41893-022-00965-x, 2022.
Han, J., Zhang, Z., Luo, Y., Cao, J., Zhang, L., Cheng, F., Zhuang, H., Zhang, J., and Tao, F.: NESEA-Rice10: high-resolution annual paddy rice maps for Northeast and Southeast Asia from 2017 to 2019, Earth Syst. Sci. Data, 13, 5969–5986, https://doi.org/10.5194/essd-13-5969-2021, 2021.
Hu, J., Zhang, B., Peng, D., Huang, J., Zhang, W., Zhao, B., Li, Y., Cheng, E., Lou, Z., Liu, S., Yang, S., Tan, Y., and Lv, Y.: Mapping 10-m harvested area in the major winter wheat-producing regions of China from 2018 to 2022, Scientific Data, 11, 1038, https://doi.org/10.1038/s41597-024-03867-z, 2024.
Huang, Y., Qiu, B., Chen, C., Zhu, X., Wu, W., Jiang, F., Lin, D., and Peng, Y.: Automated soybean mapping based on canopy water content and chlorophyll content using Sentinel-2 images, Int. J. Appl. Earth Obs., 109, 102801, https://doi.org/10.1016/j.jag.2022.102801, 2022.
Huang, Y., Qiu, B., Yang, P., Wu, W., Chen, X., Zhu, X., Xu, S., Wang, L., Dong, Z., Zhang, J., Berry, J., Tang, Z., Tan, J., Duan, D., Peng, Y., Lin, D., Cheng, F., Liang, J., Huang, H., and Chen, C.: National-scale 10 m annual maize maps for China and the contiguous United States using a robust index from Sentinel-2 time series, Comput. Electron. Agr., 221, 109018, https://doi.org/10.1016/j.compag.2024.109018, 2024.
Hultgren, A., Carleton, T., Delgado, M., Gergel, D. R., Greenstone, M., Houser, T., Hsiang, S., Jina, A., Kopp, R. E., Malevich, S. B., McCusker, K. E., Mayer, T., Nath, I., Rising, J., Rode, A., and Yuan, J.: Impacts of climate change on global agriculture accounting for adaptation, Nature, 642, 644–652, https://doi.org/10.1038/s41586-025-09085-w, 2025.
IGN – Institut National de l'Information Géographique et Forestière: Registre Parcellaire Graphique (RPG) [data set], https://geoservices.ign.fr/rpg (last access: 25 July 2026), 2024.
Jwaideh, M. A. A. and Dalin, C.: The multi-dimensional environmental impact of global crop commodities, Nat. Sustain., 8, 396–410, https://doi.org/10.1038/s41893-025-01528-6, 2025.
Kang, X., Huang, C., Chen, J. M., Lv, X., Wang, J., Zhong, T., Wang, H., Fan, X., Ma, Y., Yi, X., Zhang, Z., Zhang, L., and Tong, Q.: The 10-m cotton maps in Xinjiang, China during 2018–2021, Scientific Data, 10, 688, https://doi.org/10.1038/s41597-023-02584-3, 2023.
Khan, H. and Ahmad, A.: Evaluating AlphaEarth Foundation Embeddings for Pixel- and Object-Based Land Cover Classification in Google Earth Engine, Preprints.org [preprint], https://doi.org/10.20944/preprints202511.2172.v1, 27 November 2025.
Kirillov, A., Mintun, E., Ravi, N., Mao, H., Rolland, C., Gustafson, L., Xiao, T., Whitehead, S., Berg, A. C., and Lo, W.-Y.: Segment anything, Proceedings of the IEEE/CVF International Conference on Computer Vision, 4015–4026, https://doi.org/10.1109/ICCV51070.2023.00371, 2023.
Li, C., Hoffland, E., Kuyper, T. W., Yu, Y., Zhang, C., Li, H., Zhang, F., and van der Werf, W.: Syndromes of production in intercropping impact yield gains, Nat. Plants, 6, 653–660, https://doi.org/10.1038/s41477-020-0680-9, 2020.
Li, H., Song, X.-P., Hansen, M. C., Becker-Reshef, I., Adusei, B., Pickering, J., Wang, L., Wang, L., Lin, Z., Zalles, V., Potapov, P., Stehman, S. V., and Justice, C.: Development of a 10-m resolution maize and soybean map over China: Matching satellite-based crop classification with sample-based area estimation, Remote Sens. Environ., 294, 113623, https://doi.org/10.1016/j.rse.2023.113623, 2023a.
Li, H., Di, L., Zhang, C., Lin, L., Guo, L., Yu, E. G., and Yang, Z.: Automated In-Season Crop-Type Data Layer Mapping Without Ground Truth for the Conterminous United States Based on Multisource Satellite Imagery, IEEE T. Geosci. Remote, 62, 1–14, https://doi.org/10.1109/TGRS.2024.3361895, 2024.
Li, X. and Yu, L.: Mapping Complex Cropping Patterns in China (2018–2021) at 10 m Resolution: A Data-Driven Framework based on Multi-Product Integration and Google Satellite Embedding, figshare [data set], https://doi.org/10.6084/m9.figshare.30582161.v1, 2025.
Li, X., Yu, L., Du, Z., and Liu, X.: Crop Statistic to Annual Map: Tracking spatiotemporal dynamics of crop-specific areas through machine learning and statistics disaggregating, Scientific Data, 12, 1249, https://doi.org/10.1038/s41597-025-05572-x, 2025.
Li, X., Qu, Y., Geng, H., Xin, Q., Huang, J., Peng, S., and Zhang, L.: Mapping annual 10-m maize cropland changes in China during 2017–2021, Scientific Data, 10, 765, https://doi.org/10.1038/s41597-023-02665-3, 2023b.
Liu, L., Xiao, X., Qin, Y., Wang, J., Xu, X., Hu, Y., and Qiao, Z.: Mapping cropping intensity in China using time series Landsat and Sentinel-2 images and Google Earth Engine, Remote Sens. Environ., 239, 111624, https://doi.org/10.1016/j.rse.2019.111624, 2020.
Liu, W. and Zhang, H.: Mapping annual 10 m rapeseed extent using multisource data in the Yangtze River Economic Belt of China (2017–2021) on Google Earth Engine, Int. J. Appl. Earth Obs., 117, 103198, https://doi.org/10.1016/j.jag.2023.103198, 2023.
Liu, W., Li, S., Tao, J., Liu, X., Yin, G., Xia, Y., Wang, T., and Zhang, H.: CARM30: China annual rapeseed maps at 30 m spatial resolution from 2000 to 2022 using multi-source data, Scientific Data, 11, 356, https://doi.org/10.1038/s41597-024-03188-1, 2024a.
Liu, Y., Ou, C., Liu, Y., Cao, Z., Robinson, G. M., and Li, X.: Unequal impacts of global urban–rural settlement construction on cropland and production over the past three decades, Sci. Bull., 70, 1699–1709, https://doi.org/10.1016/j.scib.2024.12.054, 2025.
Liu, Y., Yu, Q., Zhou, Q., Wang, C., Bellingrath-Kimura, S. D., and Wu, W.: Mapping the Complex Crop Rotation Systems in Southern China Considering Cropping Intensity, Crop Diversity, and Their Seasonal Dynamics, IEEE J. Sel. Top. Appl., 15, 9584–9598, https://doi.org/10.1109/JSTARS.2022.3218881, 2022.
Liu, Y., Chen, X., Chen, J., Zang, Y., Wang, J., Lu, M., Sun, L., Dong, Q., Qiu, B., and Zhu, X.: Long-term (2013–2022) mapping of winter wheat in the North China Plain using Landsat data: classification with optimal zoning strategy, Big Earth Data, 8, 494–521, https://doi.org/10.1080/20964471.2024.2363552, 2024b.
Lobell, D. B. and Di Tommaso, S.: A half-century of climate change in major agricultural regions: Trends, impacts, and surprises, P. Natl. Acad. Sci. USA, 122, e2502789122, https://doi.org/10.1073/pnas.2502789122, 2025.
Ma, Y., Shen, Y., Swatantran, A., and Lobell, D. B.: Harvesting AlphaEarth: Benchmarking the Geospatial Foundation Model for Agricultural Downstream Tasks, arXiv [preprint], https://doi.org/10.48550/arXiv.2601.00857, 2025.
Mantey, S., Attipoe, I., and Alhassan, A.: A Comparative Analysis of Satellite Imagery for Land Cover Classification: Evaluating Google Satellite Embeddings, Sentinel-2, And Landsat-8 Data with XGBoost, Research Square, https://doi.org/10.21203/rs.3.rs-7961146/v1, 2025.
Mei, Q., Zhang, Z., Han, J., Song, J., Dong, J., Wu, H., Xu, J., and Tao, F.: ChinaSoyArea10m: a dataset of soybean-planting areas with a spatial resolution of 10 m across China from 2017 to 2021, Earth Syst. Sci. Data, 16, 3213–3231, https://doi.org/10.5194/essd-16-3213-2024, 2024.
Meng, B., Yang, Q., Mehrabi, Z., and Wang, S.: Larger nations benefit more than smaller nations from the stabilizing effects of crop diversity, Nature Food, 5, 491–498, https://doi.org/10.1038/s43016-024-00992-1, 2024.
Nelson, K. S. and Burchfield, E. K.: Landscape complexity and US crop production, Nature Food, 2, 330–338, https://doi.org/10.1038/s43016-021-00281-1, 2021.
Pan, B., Zheng, Y., Shen, R., Ye, T., Zhao, W., Dong, J., Ma, H., and Yuan, W.: High Resolution Distribution Dataset of Double-Season Paddy Rice in China, Remote Sens., 13, 4609, https://doi.org/10.3390/rs13224609, 2021.
Peng, Q., Shen, R., Li, X., Ye, T., Dong, J., Fu, Y., and Yuan, W.: A twenty-year dataset of high-resolution maize distribution in China, Scientific Data, 10, 658, https://doi.org/10.1038/s41597-023-02573-6, 2023.
Pretty, J., Benton, T. G., Bharucha, Z. P., Dicks, L. V., Flora, C. B., Godfray, H. C. J., Goulson, D., Hartley, S., Lampkin, N., Morris, C., Pierzynski, G., Prasad, P. V. V., Reganold, J., Rockström, J., Smith, P., Thorne, P., and Wratten, S.: Global assessment of agricultural system redesign for sustainable intensification, Nat. Sustain., 1, 441–446, https://doi.org/10.1038/s41893-018-0114-0, 2018.
Qiu, B., Hu, X., Yang, P., Tang, Z., Wu, W., and Li, Z.: A robust approach for large-scale cropping intensity mapping in smallholder farms from vegetation, brownness indices and SAR time series, ISPRS J. Photogramm., 203, 328–344, https://doi.org/10.1016/j.isprsjprs.2023.08.007, 2023.
Qiu, B., Luo, Y., Tang, Z., Chen, C., Lu, D., Huang, H., Chen, Y., Chen, N., and Xu, W.: Winter wheat mapping combining variations before and after estimated heading dates, ISPRS J. Photogramm., 123, 35–46, https://doi.org/10.1016/j.isprsjprs.2016.09.016, 2017.
Qiu, B., Li, Z., Yang, P., Wu, W., Chen, X., Wu, B., Zhang, M., Duan, Y., Kurniawan, S., Tryjanowski, P., and Takacs, V.: Towards automation of national scale cropping pattern mapping by coupling Sentinel-1/2 data: A 10-m map of crop rotation systems for wheat in China, Agr. Syst., 227, 104338, https://doi.org/10.1016/j.agsy.2025.104338, 2025a.
Qiu, B., Jian, Z., Yang, P., Tang, Z., Zhu, X., Duan, M., Yu, Q., Chen, X., Zhang, M., Tu, P., Xu, W., and Zhao, Z.: Unveiling grain production patterns in China (2005–2020) towards targeted sustainable intensification, Agr. Syst., 216, 103878, https://doi.org/10.1016/j.agsy.2024.103878, 2024a.
Qiu, B., Liu, B., Tang, Z., Dong, J., Xu, W., Liang, J., Chen, N., Chen, J., Wang, L., Zhang, C., Li, Z., and Wu, F.: National-scale 10-m maps of cropland use intensity in China during 2018–2023, Scientific Data, 11, 691, https://doi.org/10.1038/s41597-024-03456-0, 2024b.
Qiu, B., Wu, F., Hu, X., Yang, P., Wu, W., Chen, J., Chen, X., He, L., Joe, B., Tubiello, F. N., Qian, J., and Wang, L.: A robust framework for mapping complex cropping patterns: The first national-scale 10 m map with 10 crops in China using Sentinel 1/2 images, ISPRS J. Photogramm., 224, 361–381, https://doi.org/10.1016/j.isprsjprs.2025.04.012, 2025b.
Qu, C., Li, P., and Zhang, C.: A spectral index for winter wheat mapping using multi-temporal Landsat NDVI data of key growth stages, ISPRS J. Photogramm., 175, 431–447, https://doi.org/10.1016/j.isprsjprs.2021.03.015, 2021.
Ray, D. K., Sloat, L. L., Garcia, A. S., Davis, K. F., Ali, T., and Xie, W.: Crop harvests for direct food use insufficient to meet the UN's food security goal, Nature Food, 3, 367–374, https://doi.org/10.1038/s43016-022-00504-z, 2022.
Renard, D. and Tilman, D.: National food production stabilized by crop diversity, Nature, 571, 257–260, https://doi.org/10.1038/s41586-019-1316-y, 2019.
Renard, D. and Tilman, D.: Cultivate biodiversity to harvest food security and sustainability, Curr. Biol., 31, R1154–R1158, https://doi.org/10.1016/j.cub.2021.06.082, 2021.
Rural Payments Agency: Crop Map of England (CROME) 2025, environment.data.gov.uk [data set], https://environment.data.gov.uk/dataset/04dc895b-e25d-485d-9b0c-d912a0259da8 (last access: 25 July 2026), 2025.
RVO – Rijksdienst voor Ondernemend: Basisregistratie Gewaspercelen (BRP), PDOK [data set], https://service.pdok.nl/rvo/brpgewaspercelen/atom/v1_0/basisregistratie_gewaspercelen_brp.xml (last access: 25 July 2026), 2026.
Shen, G., Yu, Q., Zhou, Q., Wang, C., and Wu, W.: From multiple cropping frequency to multiple cropping system: A new perspective for the characterization of cropland use intensity, Agr. Syst., 204, 103535, https://doi.org/10.1016/j.agsy.2022.103535, 2023a.
Shen, R., Dong, J., Yuan, W., Han, W., Ye, T., and Zhao, W.: A 30 m Resolution Distribution Map of Maize for China Based on Landsat and Sentinel Images, J. Remote Sens., https://doi.org/10.34133/2022/9846712, 2022.
Shen, R., Pan, B., Peng, Q., Dong, J., Chen, X., Zhang, X., Ye, T., Huang, J., and Yuan, W.: High-resolution distribution maps of single-season rice in China from 2017 to 2022, Earth Syst. Sci. Data, 15, 3203–3222, https://doi.org/10.5194/essd-15-3203-2023, 2023b.
Singha, M., Dong, J., Zhang, G., and Xiao, X.: High resolution paddy rice maps in cloud-prone Bangladesh and Northeast India using Sentinel-1 data, Scientific Data, 6, 26, https://doi.org/10.1038/s41597-019-0036-3, 2019.
Smith, M. E., Vico, G., Costa, A., Bowles, T., Gaudin, A. C. M., Hallin, S., Watson, C. A., Alarcòn, R., Berti, A., Blecharczyk, A., Calderon, F. J., Culman, S., Deen, W., Drury, C. F., Garcia, A. G. y., García-Díaz, A., Plaza, E. H., Jonczyk, K., Jäck, O., Lehman, R. M., Montemurro, F., Morari, F., Onofri, A., Osborne, S. L., Pasamón, J. L. T., Sandström, B., Santín-Montanyá, I., Sawinska, Z., Schmer, M. R., Stalenga, J., Strock, J., Tei, F., Topp, C. F. E., Ventrella, D., Walker, R. L., and Bommarco, R.: Increasing crop rotational diversity can enhance cereal yields, Communications Earth & Environment, 4, 89, https://doi.org/10.1038/s43247-023-00746-0, 2023.
Sulik, J. J. and Long, D. S.: Spectral indices for yellow canola flowers, Int. J. Remote Sens., 36, 2751–2765, https://doi.org/10.1080/01431161.2015.1047994, 2015.
Sun, X., Wang, P., Lu, W., Zhu, Z., Lu, X., He, Q., Li, J., Rong, X., Yang, Z., Chang, H. J. I. T. o. G., and Sensing, R.: RingMo: A remote sensing foundation model with masked image modeling, IEEE T. Geosci. Remote, 61, 1–22, https://doi.org/10.1109/TGRS.2022.3194732, 2022.
Tang, F. H. M., Nguyen, T. H., Conchedda, G., Casse, L., Tubiello, F. N., and Maggi, F.: CROPGRIDS: a global geo-referenced dataset of 173 crops, Scientific Data, 11, 413, https://doi.org/10.1038/s41597-024-03247-7, 2024.
Tao, J.-B., Wu, W.-B., Zhou, Y., Wang, Y., and Jiang, Y.: Mapping winter wheat using phenological feature of peak before winter on the North China Plain based on time-series MODIS data, J. Integr. Agr., 16, 348–359, https://doi.org/10.1016/S2095-3119(15)61304-1, 2017.
Tu, Y., Wu, S., Chen, B., Weng, Q., Bai, Y., Yang, J., Yu, L., and Xu, B.: A 30 m annual cropland dataset of China from 1986 to 2021, Earth Syst. Sci. Data, 16, 2297–2316, https://doi.org/10.5194/essd-16-2297-2024, 2024.
UN: Transforming our world: the 2030 Agenda for Sustainable Development, United Nations, https://sdgs.un.org/2030agenda (last access: 25 July 2026), 2015.
Wang, S., Di Tommaso, S., Deines, J. M., and Lobell, D. B.: Mapping twenty years of corn and soybean across the US Midwest using the Landsat archive, Scientific Data, 7, 307, https://doi.org/10.1038/s41597-020-00646-4, 2020.
Wu, B., Zhang, M., Zeng, H., Tian, F., Potgieter, A. B., Qin, X., Yan, N., Chang, S., Zhao, Y., Dong, Q., Boken, V., Plotnikov, D., Guo, H., Wu, F., Zhao, H., Deronde, B., Tits, L., and Loupian, E.: Challenges and opportunities in remote sensing-based crop monitoring: a review, Natl. Sci. Rev., 10, nwac290, https://doi.org/10.1093/nsr/nwac290, 2023.
Wu, H., Li, Z., Deng, X., and Zhao, Z.: Enhancing agricultural sustainability: Optimizing crop planting structures and spatial layouts within the water-land-energy-economy-environment-food nexus, Geography and Sustainability, 6, 100258, https://doi.org/10.1016/j.geosus.2024.100258, 2025a.
Wu, K., Zhang, Y., Ru, L., Dang, B., Lao, J., Yu, L., Luo, J., Zhu, Z., Sun, Y., Zhang, J., Zhu, Q., Wang, J., Yang, M., Chen, J., Zhang, Y., and Li, Y.: A semantic-enhanced multi-modal remote sensing foundation model for Earth observation, Nature Machine Intelligence, 7, 1235–1249, https://doi.org/10.1038/s42256-025-01078-8, 2025b.
Xiao, X., Boles, S., Frolking, S., Li, C., Babu, J. Y., Salas, W., and Moore, B.: Mapping paddy rice agriculture in South and Southeast Asia using multi-temporal MODIS images, Remote Sens. Environ., 100, 95–113, https://doi.org/10.1016/j.rse.2005.10.004, 2006.
Xiao, X., Boles, S., Liu, J., Zhuang, D., Frolking, S., Li, C., Salas, W., and Moore, B.: Mapping paddy rice agriculture in southern China using multi-temporal MODIS images, Remote Sens. Environ., 95, 480–492, https://doi.org/10.1016/j.rse.2004.12.009, 2005.
Xie, W., Zhu, A., Ali, T., Zhang, Z., Chen, X., Wu, F., Huang, J., and Davis, K. F.: Crop switching can enhance environmental sustainability and farmer incomes in China, Nature, 616, 300–305, https://doi.org/10.1038/s41586-023-05799-x, 2023.
Xin, Q., Zhang, L., Qu, Y., Geng, H., Li, X., and Peng, S.: Satellite mapping of maize cropland in one-season planting areas of China, Scientific Data, 10, 437, https://doi.org/10.1038/s41597-023-02334-5, 2023.
Xuan, F., Dong, Y., Li, J., Li, X., Su, W., Huang, X., Huang, J., Xie, Z., Li, Z., Liu, H., Tao, W., Wen, Y., and Zhang, Y.: Mapping crop type in Northeast China during 2013–2021 using automatic sampling and tile-based image classification, Int. J. Appl. Earth Obs., 117, 103178, https://doi.org/10.1016/j.jag.2022.103178, 2023.
Xun, L., Zhang, J., Cao, D., Yang, S., and Yao, F.: A novel cotton mapping index combining Sentinel-1 SAR and Sentinel-2 multispectral imagery, ISPRS J. Photogramm., 181, 148–166, https://doi.org/10.1016/j.isprsjprs.2021.08.021, 2021.
Yang, X., Xiong, J., Du, T., Ju, X., Gan, Y., Li, S., Xia, L., Shen, Y., Pacenka, S., Steenhuis, T. S., Siddique, K. H. M., Kang, S., and Butterbach-Bahl, K.: Diversifying crop rotation increases food production, reduces net greenhouse gas emissions and improves soil health, Nat. Commun., 15, 198, https://doi.org/10.1038/s41467-023-44464-9, 2024.
Yao, F., Lu, W., Yang, H., Xu, L., Liu, C., Hu, L., Yu, H., Liu, N., Deng, C., Tang, D., Chen, C., Yu, J., Sun, X., and Fu, K.: RingMo-Sense: Remote Sensing Foundation Model for Spatiotemporal Prediction via Spatiotemporal Evolution Disentangling, IEEE T. Geosci. Remote, 61, 1–21, https://doi.org/10.1109/TGRS.2023.3316166, 2023.
You, L. and Sun, Z.: Mapping global cropping system: Challenges, opportunities, and future perspectives, Crop and Environment, 1, 68–73, https://doi.org/10.1016/j.crope.2022.03.006, 2022.
You, N., Dong, J., Huang, J., Du, G., Zhang, G., He, Y., Yang, T., Di, Y., and Xiao, X.: The 10-m crop type maps in Northeast China during 2017–2019, Scientific Data, 8, 41, https://doi.org/10.1038/s41597-021-00827-9, 2021.
Yu, L., Du, Z., Li, X., Zheng, J., Zhao, Q., Wu, H., weise, D., Yang, Y., Zhang, Q., Li, X., Ma, X., and Huang, X.: Enhancing global agricultural monitoring system for climate-smart agriculture, Climate Smart Agriculture, 2, 100037, https://doi.org/10.1016/j.csag.2024.100037, 2025a.
Yu, L., Du, Z., Li, X., Gu, J., Li, X., Zhong, L., Wu, H., Zhao, Q., Ma, X., Zheng, J., Yang, Y., Song, W., Wang, P., Zhao, Z., Liao, L., Long, Y., Zhang, Y., Peng, J., Shen, M., Li, T., Sun, Z., Zhao, Y., Wu, C., Lin, G., Luo, Y., and Peng, D.: FROM-GLC Plus 3.0: Multimodal Land Change Mapping with SAM and Dense Surface Observations, J. Remote Sens., 5, 0728, https://doi.org/10.34133/remotesensing.0728, 2025b.
Zanaga, D., Van De Kerchove, R., De Keersmaecker, W., Souverijns, N., Brockmann, C., Quast, R., Wevers, J., Grosu, A., Paccini, A., Vergnaud, S., Cartus, O., Santoro, M., Fritz, S., Georgieva, I., Lesiv, M., Carter, S., Herold, M., Li, L., Tsendbazar, N.-E., Ramoino, F., and Arino, O: ESA WorldCover 10 m 2020 v100, Zenodo [data set], https://doi.org/10.5281/zenodo.5571936, 2021.
Zanaga, D., Van De Kerchove, R., Daems, D., De Keersmaecker, W., Brockmann, C., Kirches, G., Wevers, J., Cartus, O., Santoro, M., Fritz, S., Lesiv, M., Herold, M., Tsendbazar, N.-E., Xu, P., Ramoino, F., and Arino, O: ESA WorldCover 10 m 2021 v200, Zenodo [data set], https://doi.org/10.5281/zenodo.7254221, 2022.
Zang, Y., Qiu, Y., Chen, X., Chen, J., Yang, W., Liu, Y., Peng, L., Shen, M., and Cao, X.: Mapping rapeseed in China during 2017-2021 using Sentinel data: an automated approach integrating rule-based sample generation and a one-class classifier (RSG-OC), GISci. Remote Sens., 60, 2163576, https://doi.org/10.1080/15481603.2022.2163576, 2023.
Zhan, P., Zhu, W., and Li, N.: An automated rice mapping method based on flooding signals in synthetic aperture radar time series, Remote Sens. Environ., 252, 112112, https://doi.org/10.1016/j.rse.2020.112112, 2021.
Zhang, C., Di, L., Hao, P., Yang, Z., Lin, L., Zhao, H., and Guo, L.: Rapid in-season mapping of corn and soybeans using machine-learned trusted pixels from Cropland Data Layer, Int. J. Appl. Earth Obs., 102, 102374, https://doi.org/10.1016/j.jag.2021.102374, 2021.
Zhang, G., Xiao, X., Dong, J., Kou, W., Jin, C., Qin, Y., Zhou, Y., Wang, J., Menarguez, M. A., and Biradar, C.: Mapping paddy rice planting areas through time series analysis of MODIS land surface temperature and vegetation index data, ISPRS J. Photogramm., 106, 157–171, https://doi.org/10.1016/j.isprsjprs.2015.05.011, 2015.
Zhang, H., Liu, W., and Zhang, L.: Seamless and automated rapeseed mapping for large cloudy regions using time-series optical satellite imagery, ISPRS J. Photogramm., 184, 45–62, https://doi.org/10.1016/j.isprsjprs.2021.12.001, 2022.
Zhang, H., Lou, Z., Peng, D., Zhang, B., Luo, W., Huang, J., Zhang, X., Yu, L., Wang, F., Huang, L., Liu, G., Gao, S., Hu, J., Yang, S., and Cheng, E.: Mapping annual 10-m soybean cropland with spatiotemporal sample migration, Scientific Data, 11, 439, https://doi.org/10.1038/s41597-024-03273-5, 2024.
Zhang, H. K., Shen, Y., Zhang, X., Li, J., Yang, Z., Xu, Y., Zhang, C., Di, L., and Roy, D. P.: Robust and timely within-season conterminous United States crop type mapping using Landsat Sentinel-2 time series and the transformer architecture, Remote Sens. Environ., 329, 114950, https://doi.org/10.1016/j.rse.2025.114950, 2025.
Zheng, Y., Li, Z., Pan, B., Lin, S., Dong, J., Li, X., and Yuan, W.: Development of a Phenology-Based Method for Identifying Sugarcane Plantation Areas in China Using High-Resolution Satellite Datasets, Remote Sens., 14, 1274, https://doi.org/10.3390/rs14051274, 2022.
Zhong, L., Gong, P., and Biging, G. S.: Efficient corn and soybean mapping with temporal extendability: A multi-year experiment using Landsat imagery, Remote Sens. Environ., 140, 1–13, https://doi.org/10.1016/j.rse.2013.08.023, 2014.
Zhong, L., Hu, L., and Zhou, H.: Deep learning based multi-temporal crop classification, Remote Sens. Environ., 221, 430–443, https://doi.org/10.1016/j.rse.2018.11.032, 2019.
Zhu, W., Peng, X., Ding, M., Li, L., Liu, Y., Liu, W., Yang, M., Chen, X., Cai, J., Huang, H., Dong, Y., and Lu, J.: Decline in Planting Areas of Double-Season Rice by Half in Southern China over the Last Two Decades, Remote Sens., https://doi.org/10.3390/rs16030440, 2024.