the Creative Commons Attribution 4.0 License.
the Creative Commons Attribution 4.0 License.
 | 13 Jul 2026
Recent summer soil moisture drying in Switzerland based on measurements from the SwissSMEX network
Martin Hirschi
Dominik Michel
Dominik L. Schumacher
Wolfgang Preimesberger
Sonia I. Seneviratne
We present curated time series of in situ soil moisture measurements from the Swiss Soil Moisture Experiment (SwissSMEX) network, covering the period 2010–2025. At ten grassland stations on the Swiss Plateau, SwissSMEX provides volumetric soil water content (VWC) data at multiple depths in the soil profile, typically down to a maximum depth of 120 cm. Measurements are obtained from capacitance sensors, as well as from time domain reflectometry (TDR) sensors. The VWC measurements are used to compute integrated soil water content (IWC) down to 50 cm depth as an indicator of root-zone water. We document recent measures that have been taken to secure the SwissSMEX network and to ensure the continuity of its long-term IWC time series. The IWC and the underlying VWC time series are available at https://doi.org/10.3929/ethz-b-000743711 (Hirschi et al., 2025a).
As a use case for the SwissSMEX network, the data are used to investigate drying trends on the Swiss Plateau, where notably drier summers and more frequent droughts have been reported in recent decades. This application of the in situ data is based on summer and summer-half-year anomalies of IWC. Furthermore, the SwissSMEX-based IWC anomalies and trends therein are compared with those derived from soil moisture of a widely used land reanalysis product (ERA5-Land) and a merged passive microwave remote-sensing product (C3S SM PASSIVE). The in situ IWC time series from stations with best temporal coverage agree well with ERA5-Land and C3S SM PASSIVE soil moisture from the corresponding grid cells, with correlations of 0.80 or higher for the median time series calculated across these stations. The non-significant drying over the common period 2010–2025 amounts to for SwissSMEX, to for ERA5-Land, and to for C3S SM PASSIVE in summer. Although the SwissSMEX network indicates that summer soil drying has increased in recent years, the 16 years of in situ data currently available are not yet sufficient to robustly estimate a significant trend. This highlights the importance of sustaining ongoing measurements to ensure a seamless continuation of soil moisture monitoring in Switzerland.
- Article
(7403 KB) - Full-text XML
-
Supplement
(2140 KB) - BibTeX
- EndNote


Droughts in Switzerland have become a significant concern due to their impacts on agriculture, water resources management, energy production, shipping and ecology. After a prolonged period without severe droughts, Switzerland has experienced increasingly frequent events in the last two decades, namely in the summers of 2003, 2015, 2018, and 2022, and in the springs/early summers of 2011 and 2020 (Calanca, 2007; Brunner et al., 2019; Orth et al., 2016; Schumacher et al., 2024; MeteoSchweiz, 2018, 2012; BAFU, 2016). As a result, notable trends towards drier summer half-years were observed in Switzerland from 1981–2020 based on the climatic water balance calculated from meteorological station observations and the soil water content from reanalyses (Scherrer et al., 2022; hereafter referred to as S22). Furthermore, S22 showed that this drying trend is primarily driven by a non-significant decrease in precipitation and a significant increase in evapotranspiration due to rising temperatures. However, the considered reanalysis products (ERA5-Land and ERA5) differed considerably in their representation of summer-half-year soil moisture and evapotranspiration in Switzerland. Both showed a significant increase in evapotranspiration from 1980–2020, but the trend is about twice as strong in ERA5-Land as in ERA5. The latter product already indicated a soil moisture limitation of evapotranspiration in dry years, whereas the former shows an evapotranspiration surplus in these years. Consequently, dry anomalies and the drying trend in soil moisture were more pronounced in ERA5 than in ERA5-Land, with the latter agreeing better with a limited set of in situ stations.
Given these existing uncertainties in the reanalysis data, we present curated in situ time series from the Swiss Soil Moisture Experiment (SwissSMEX) soil moisture network (Mittelbach and Seneviratne, 2012). Although in situ soil moisture measurements have their own inherent problems and challenges (e.g. due to soil heterogeneity, limited representativeness of point measurements, and sensor calibration issues), they are still the only available ground information to contrast with land reanalysis or remotely sensed soil moisture. The SwissSMEX network was installed as a research network between 2008 and 2010. Since then, it has measured volumetric water content (VWC) and soil temperature in profiles from 5 cm down to a maximum depth of typically 120 cm using time domain reflectometry (TDR) and capacitance sensors (Mittelbach and Seneviratne, 2012; Mittelbach, 2011). The number of depth levels varies across the network, and redundant profiles of the same sensor type are available at some stations. The VWC measurements are also used to calculate integrated soil water content (IWC, in mm) down to 50 cm depth as an indicator of root-zone water, which is relevant for plant growth in agriculture and natural vegetation, and is directly related to land water-balance fluxes. While root depths vary greatly in space and depend on plant species, the choice of 50 cm depth covers shallow-rooted plants such as lettuce, onions, potatoes, various vegetables and most native grass species (Brouwer et al., 1989). In addition, this depth is covered by all stations of the network.
Ten SwissSMEX grassland sites on the Swiss Plateau are still operational (Fig. 1), but in recent years sensors have started to fail frequently, leading to temporal interruptions or the complete termination of individual measurement series (Michel et al., 2022b). This prompted an intervention to preserve the measurement network for the coming years. These sensor failures are particularly problematic for deriving IWC, which relies on the simultaneous availability of VWC measurements from sensors at multiple depths. They also impair the capacity of the network for real-time monitoring and trend detection. This is especially relevant as the increasing frequency of droughts in recent years has prompted the Swiss Federal Council to initiate a programme in May 2022 to establish and expand a national early detection and warning system for droughts, including a national in situ soil moisture network (BAFU, 2024). The implementation of the national network at existing SwissSMEX sites will benefit from the secured long-term records.
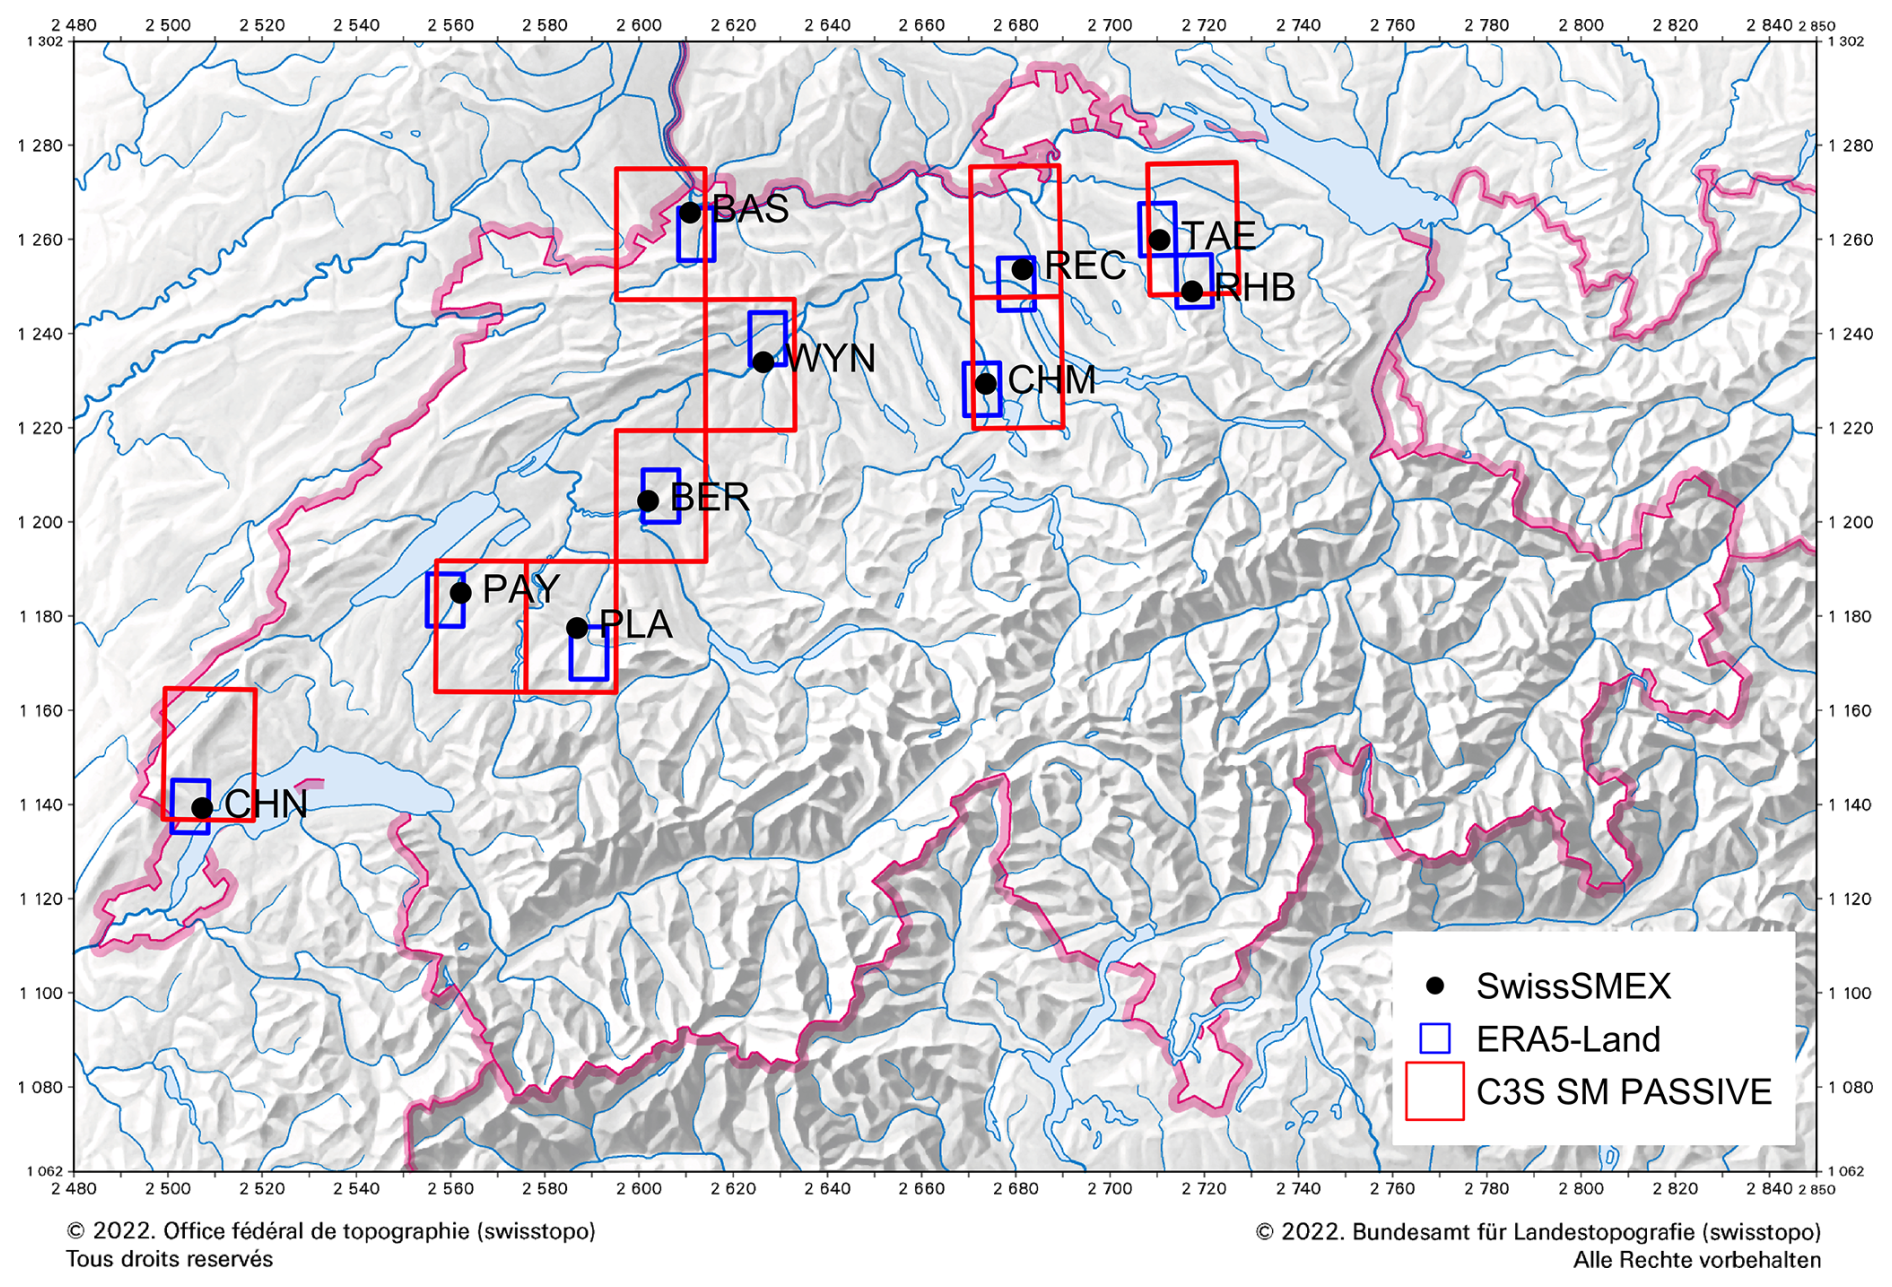
Figure 1Locations of the SwissSMEX stations on the Swiss Plateau, along with the nearest grid cells of ERA5-Land and C3S SM PASSIVE (see Sect. 2.2). Station abbreviations are provided in Table 1.
This data paper presents and documents the SwissSMEX long-term soil moisture time series record and recent measures that have been taken to secure its operational status. It revisits the documented summer drying trends on the Swiss Plateau to demonstrate the validity and applicability of the presented in situ measurements and compares SwissSMEX-based trends with those derived from alternate land reanalysis and remote sensing soil moisture products, extending on the analysis of S22. The in situ time series presented here also contributed to the CH2025 national climate scenarios (MeteoSwiss and ETH Zurich, 2025).
2.1 SwissSMEX
2.1.1 Status of the network and new installations
The standard instrumentation of SwissSMEX, initiated in 2008, consisted of low-cost capacitance soil moisture sensors (Decagon 10HS) at all measurement depths of 5, 10, 30, 50, 80, and 120 cm, and of TDR soil moisture sensors (IMKO TRIME-PICO) at 10 and 80 cm depth (Mittelbach, 2011). Both sensor types provide volumetric water content (VWC, in vol. % or m3 m−3). In the follow-up project SwissSMEX-Veg, selected stations were additionally equipped with TDR sensors at 5, 30 and 50 cm depth in 2010. Ten SwissSMEX grassland sites on the Swiss Plateau are still operational (Fig. 1 and Table 1). The installed low-cost 10HS sensors are prone to higher measurement errors when only the factory calibration is used (e.g., Domínguez-Niño et al., 2019; Mittelbach et al., 2012). Therefore, site-specific exponential calibration functions were derived from the parallel 10HS and TDR measurements and applied to the raw 10HS readings. These site-specific calibrations allow to reduce the absolute error to about 2 vol. % for most 10HS measurements, including under dry and moist soil conditions, and extend the effective measurement range of the sensors to up to 50 vol. % (Mittelbach et al., 2011).
Table 1Overview of the ten SwissSMEX stations on the Swiss Plateau (see also Fig. 1). For more detailed information on soil properties, we refer to Mittelbach (2011, Appendix B therein). The crosses indicate the different station combinations used to calculate the Swiss Plateau median summer and summer-half-year soil moisture anomalies (see Sect. 2.3), and “Missing years” indicates the absence of these anomalies for specific years.
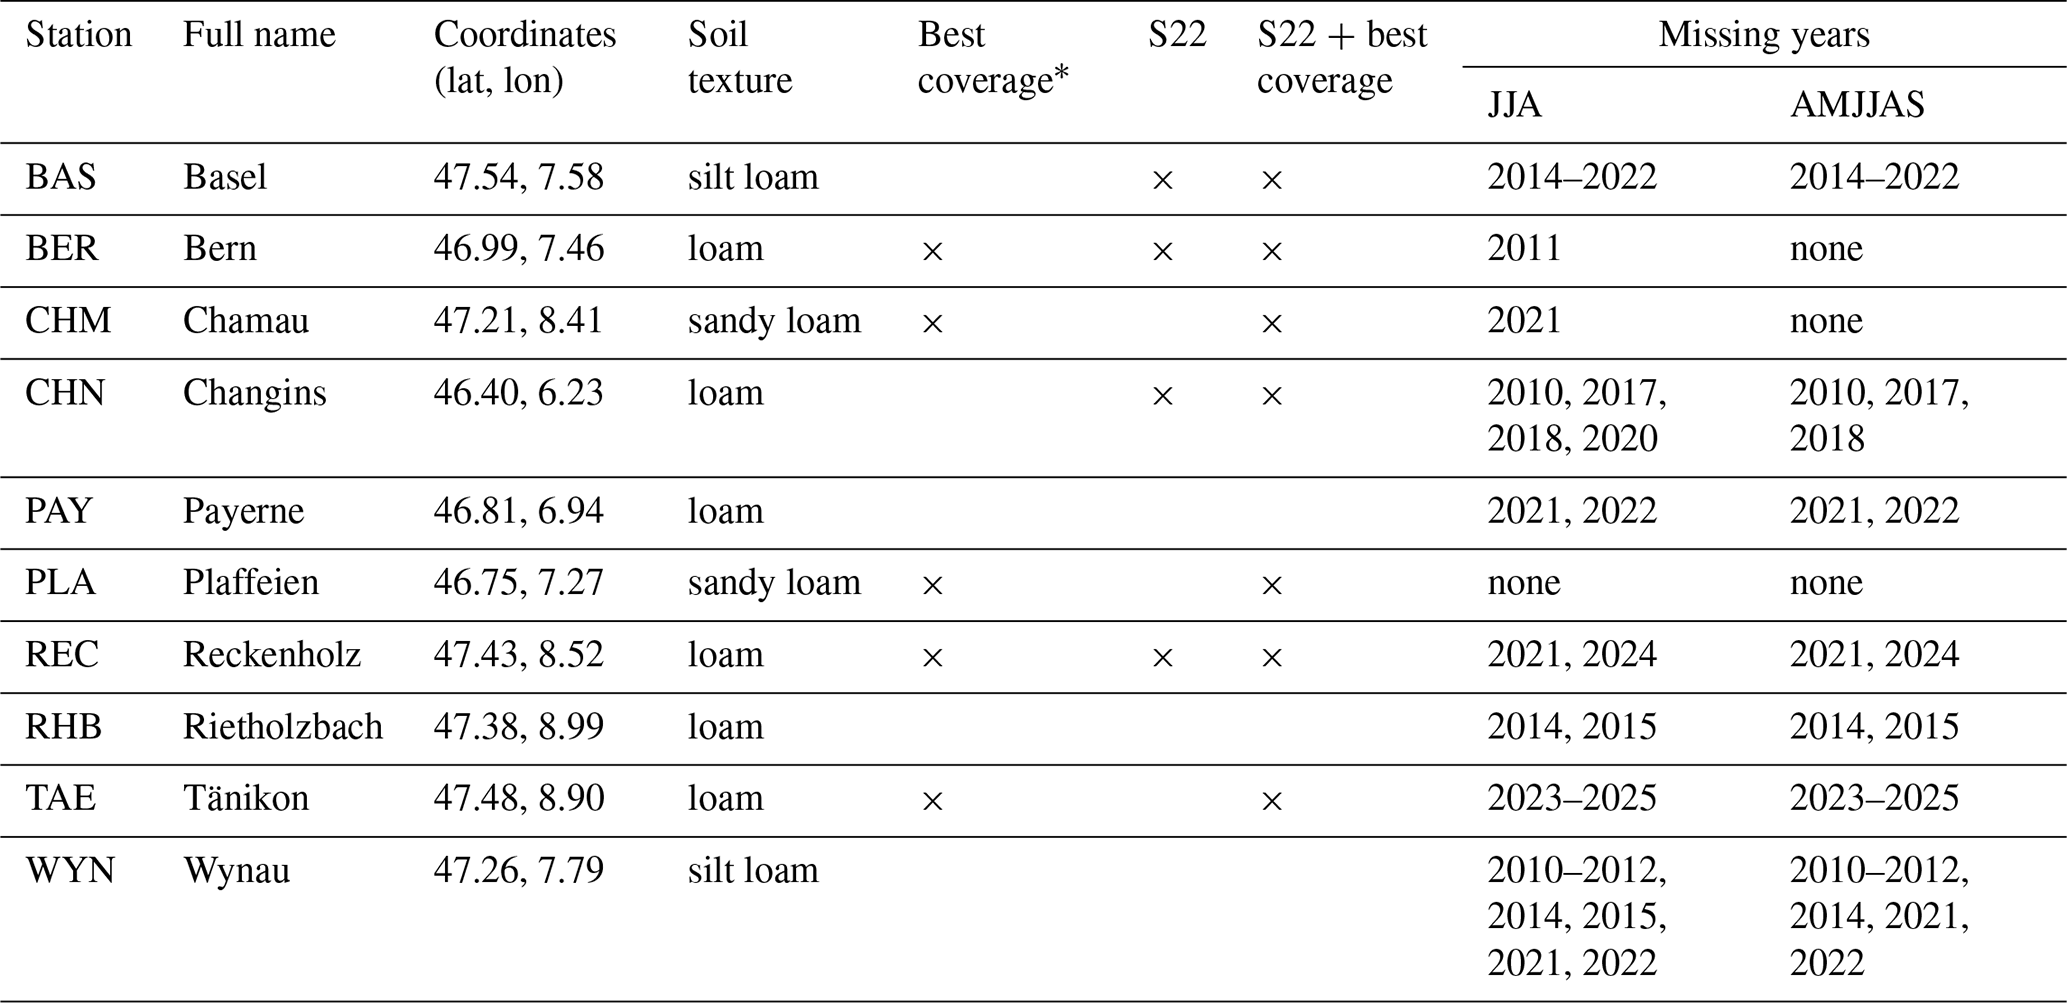
* Maximum one summer/summer half-year missing in the historical 2010–2022 period (see Sect. 2.1.2).
The VWC is measured as 10 min instantaneous values, which are then further aggregated to hourly and daily values. As part of the regular processing of the SwissSMEX measurements, the individual sensor series undergo automatic range and outlier checks, as well as visual inspection. The valid data range is defined as 0–0.7 m3 m−3, and spikes in the ten-minute values are removed by applying a one-day moving average and a threshold of ± two standard deviations. A comprehensive quality assessment and intercomparison of the existing soil moisture time series from the SwissSMEX network revealed a degradation in data availability due to sensor failures over time, compromising the long-term continuity of the time series (Michel et al., 2022b). This analysis showed that, as of 2022, more than one-third of all sensors had ceased to function since their installation between 2008 and 2010 (Figs. 2 and 3). This sensor failure rate is higher for the 10HS capacitance sensors (43 %) than for the TDR sensors (36 %; cf. Appendix A of Michel et al., 2022b).
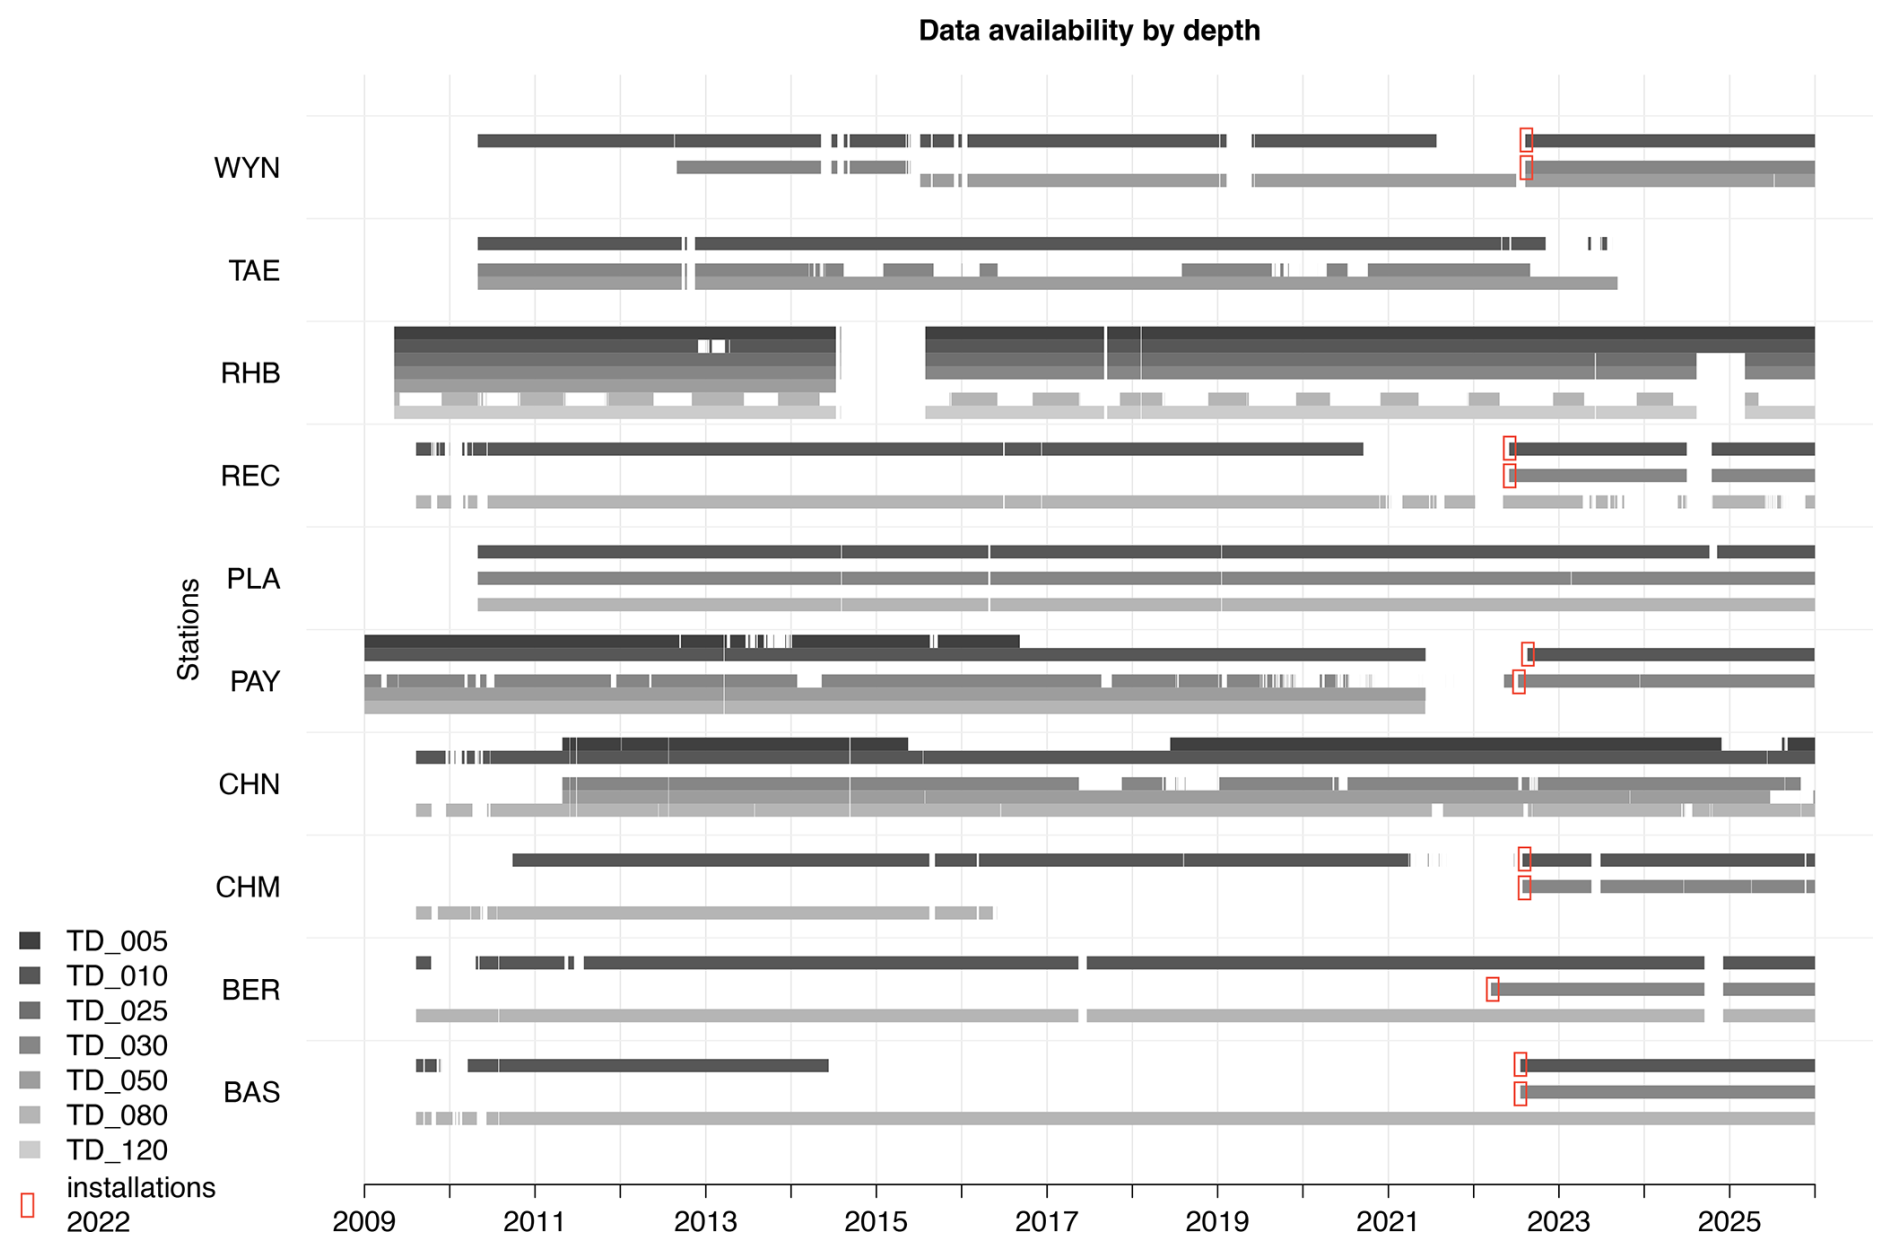
Figure 2Time series diagram of the IMKO TRIME-PICO TDR (TD) sensor availability at the SwissSMEX grassland stations on the Swiss Plateau. Abbreviations for station names are given in Table 1; numbers alongside the sensor type indicate the installation depth in cm. This is a condensed view that combines all redundant sensor profiles. Note that station RHB includes an additional sensor at 25 cm depth, and that the sensors at the other depths are partly shifted by 5 cm in this profile. For simplicity, the sensors installed at depths of 15, 35 and 55 cm are shown as TD_010, TD_030, and TD_050, respectively. The TDR installations in 2022 are highlighted by red rectangles.
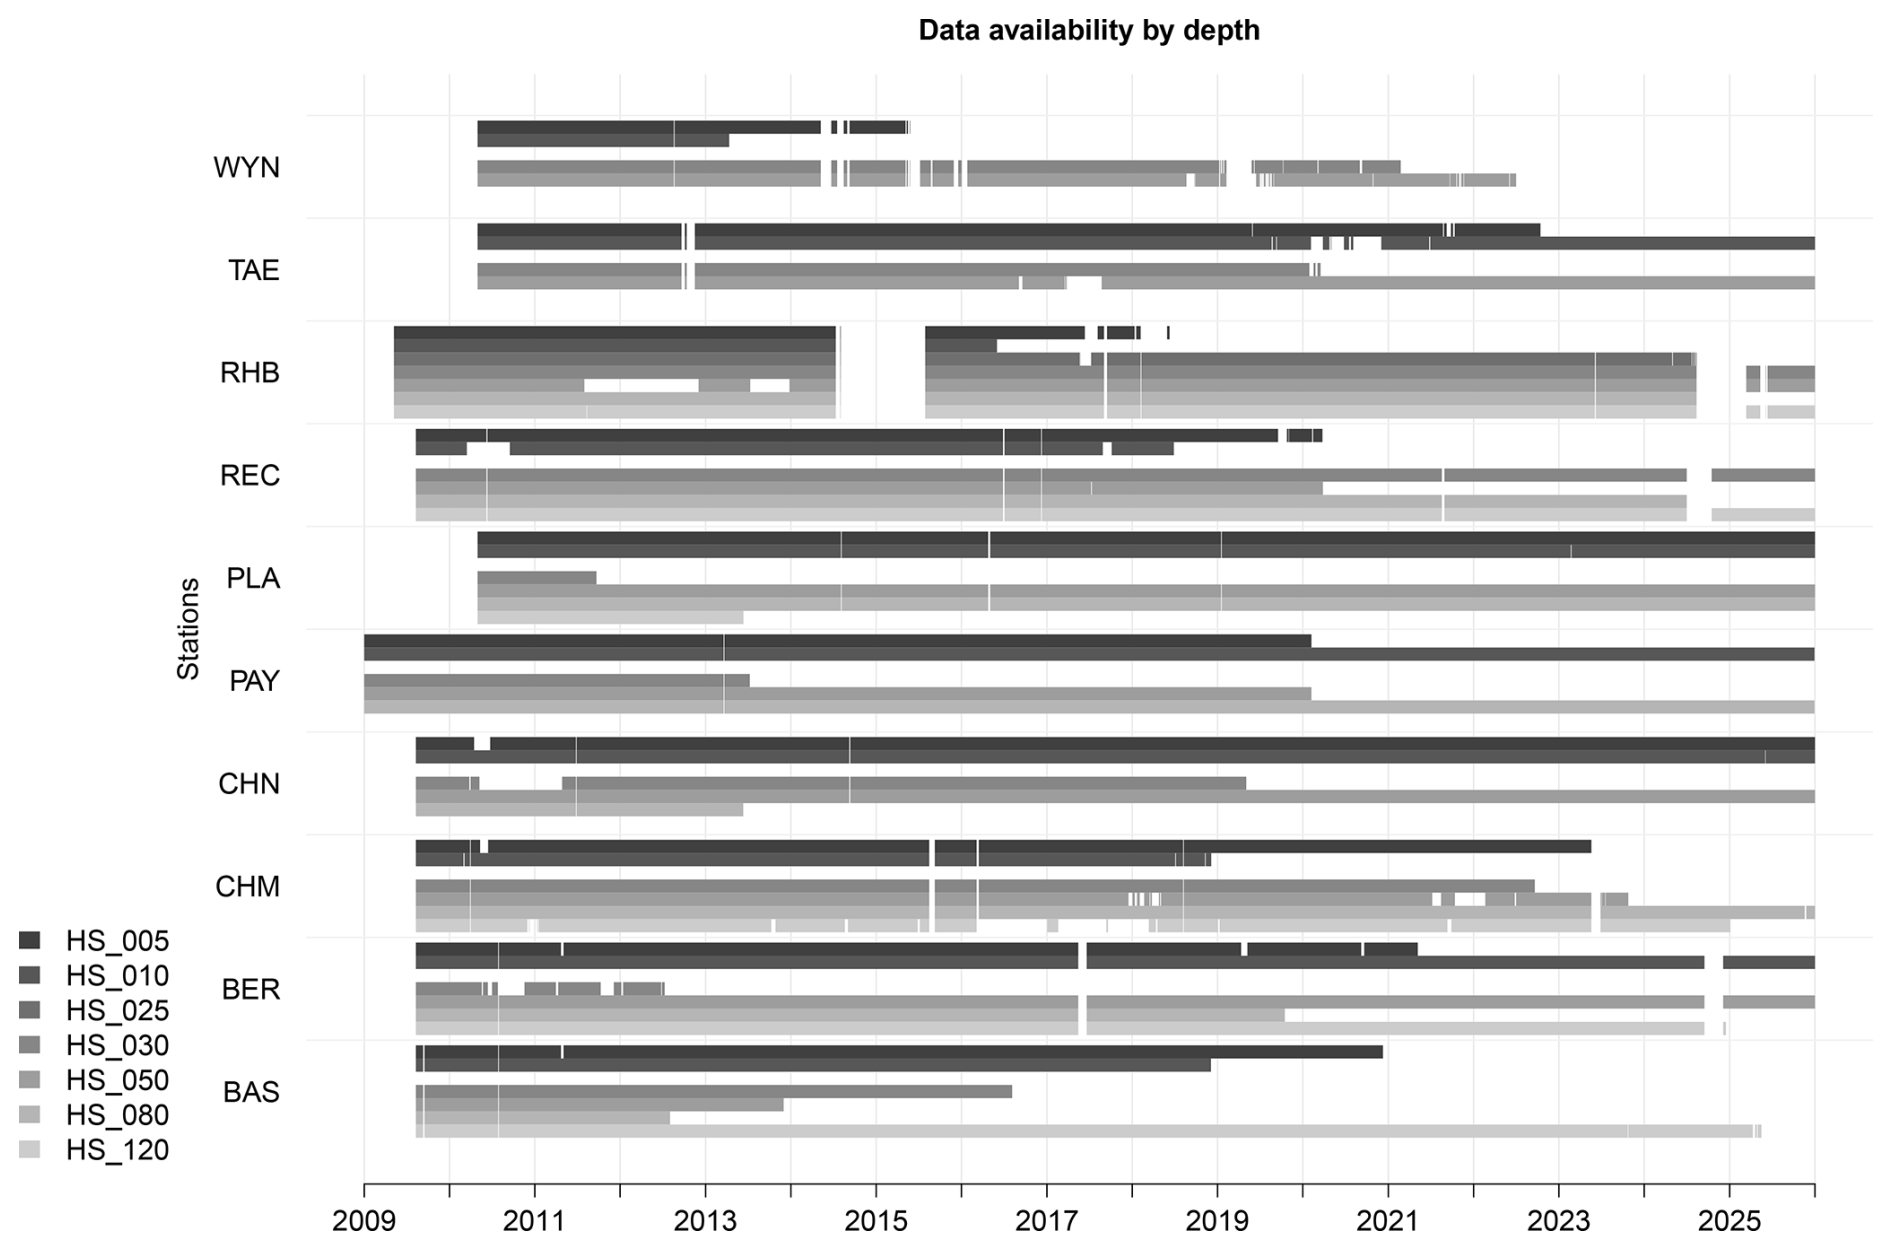
Figure 3As Fig. 2, but for the Decagon 10HS (HS) sensors. In addition to the note on station RHB, REC has a 10HS sensor at 150 cm depth instead of 120 cm, which is shown as HS_120 for simplicity.
In light of this degrading data availability, and to secure the network for the coming years, defective TDR sensors at 10 and 30 cm soil depth were replaced with new IMKO TRIME-PICO64 TDR sensors at the SwissSMEX grassland stations during summer 2022, or, where not already present, additional TDR sensors were installed at these depths in the existing profiles (Fig. 2; Michel et al., 2022a). This intervention at easily accessible depths, carried out without disturbing the ongoing operations, ensured the continuity of the measurement series at these depths.
2.1.2 Vertically integrated soil water content calculation
The degradation of sensor availability is particularly relevant for deriving the 0–0.5 m depth integrated soil water content (IWC, in mm). This integration is performed using the trapezoidal method (e.g. Hupet et al., 2004) and relies on the simultaneous availability of VWC measurements from sensors at multiple depths. The trapezoidal integration approximates the integral by assuming a linear variation between the measurements at the individual depths and was computed using the R-function trapz from the caTools package (Tuszynski, 2021; version 1.18.2). Historically, the integration was performed based on the n VWC measurements (VWCi) at depths zi of 0.05, 0.10, 0.30 and 0.50 m (Mittelbach and Seneviratne, 2012), plus an additional value of VWC at the surface, which is set equal to the measurement at 0.05 m depth (see Eq. 1). These depths were originally fully equipped with 10HS sensors, whereas TDR sensors were predominantly installed at 10 and 80 cm depth (Mittelbach et al., 2011; see also Figs. 2 and 3). Over time, at some stations, already existing TDR sensors were incorporated into the integration to replace defective 10HS sensors (e.g. station Changins in Fig. 5), or the number of sensors (i.e. depths) included in the integration had to be reduced while ensuring the representativeness of the remaining sensor data (e.g. station Chamau in Fig. 4). This set of sensors used for the historical IWC time series is referred to as the original sensor configuration (IWCorig, see also Table S1 in the Supplement).
With the increasing number of sensor failures in recent years (Figs. 2 and 3), however, the calculation of IWCorig based on the original sensor configurations has become impossible at a growing number of sites. With the upgrade of the network in 2022, all grassland stations are now equipped with at least two TDR sensors in the 0–0.5 m soil column, i.e. at 10 and 30 cm depth. These sensors are used as an alternative for deriving the IWC when coverage with the original sensor configuration is lacking. For this TDR-only based IWCTDRonly, the 10 cm measurement is used to represent the 5 and 10 cm depths, and the 30 cm measurement is used to represent the 30 and 50 cm depths (Eq. 2).
The historical hourly IWC time series (IWCorig) and the 10 and 30 cm TDR-only based series (IWCTDRonly) are then merged by correcting the mean offset and difference in standard deviation of the latter with respect to the former to account for the difference in the representative depth (Eqs. 3a and 3b).
The overbar denotes the temporal average, sd the standard deviation, and relsd the ratio of the standard deviations. The offset and relative standard deviation between the two series are calculated from the overlapping hourly time steps (except for BAS and WYN, where there is no overlap and all time steps are therefore used to calculate the scaling parameters). This correction assures that the data distribution of IWCTDRonly_corrected matches that of IWCorig (in terms of mean and standard deviation). Merging IWCorig and IWCTDRonly_corrected substantially increases recent station coverage with IWC. In some cases, historical gaps can also be filled in this way for stations that already had TDR sensors at 10 and 30 cm depth prior to 2022. This is illustrated in Figs. 4 and 5 at the examples of the stations Chamau (CHM) and Changins (CHN), respectively. At Chamau, the historical IWC time series could be extended to the present using the new TDR sensors, while at Changins, historical gaps in IWC could additionally be filled. Corresponding plots for the other stations can be found in Figs. S1–S4 in the Supplement.
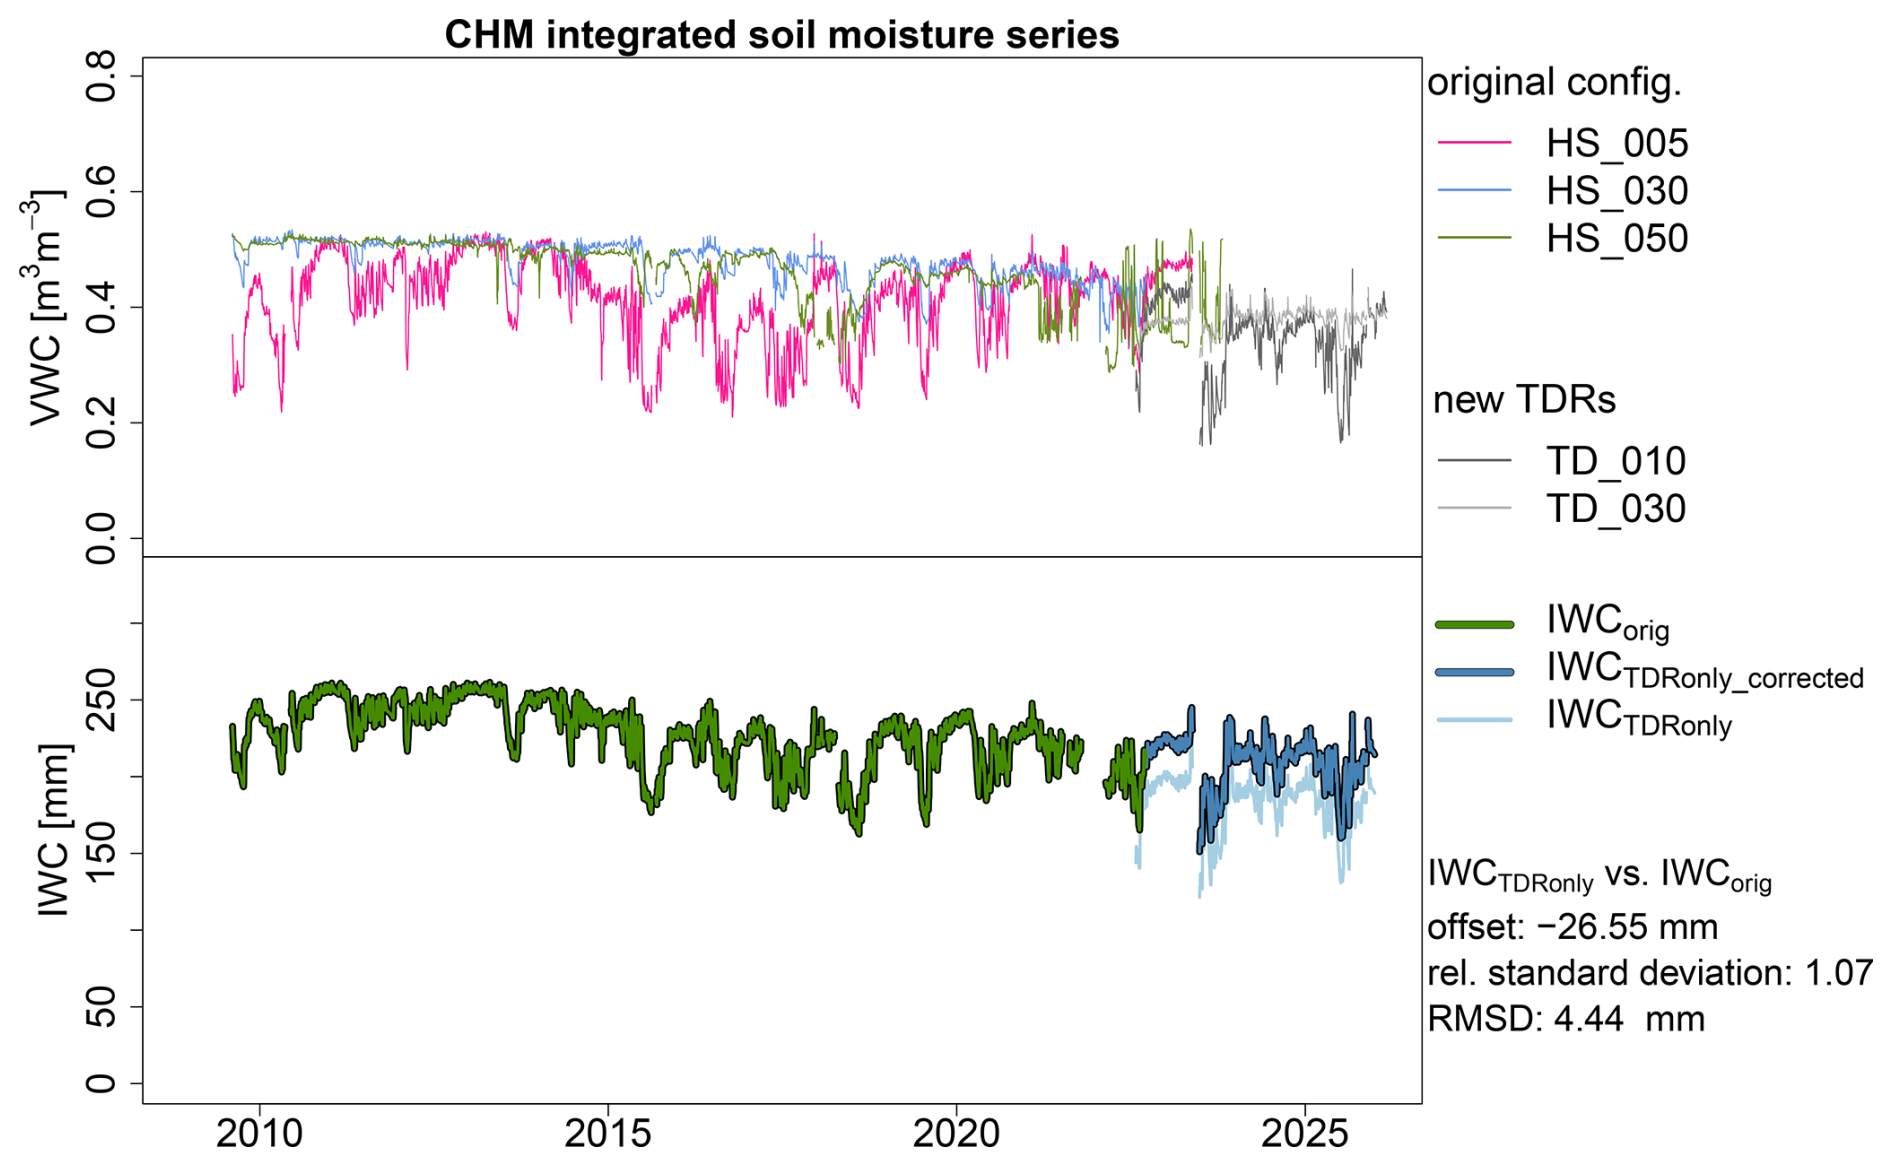
Figure 4Daily time series of volumetric water content (VWC, in m3 m−3) and vertically integrated soil water content (IWC, in mm) at the station Chamau (CHM), where IWCorig could be extended to the present. (Top) VWC from the 10HS sensors contributing to IWCorig, based on the original sensor configuration (see also Table S1), and from the two new TDRs installed in 2022 that are used to calculate IWCTDRonly. (Bottom) IWCorig and the 10 and 30 cm TDR-only based IWCTDRonly and IWCTDRonly_corrected (see Eqs. 3a and 3b). The original offset of IWCTDRonly is also noted, as well as its relative standard deviation and RMSD compared with IWCorig (all metrics are based on the overlapping hourly time steps). See Figs. S1–S4 for similar plots for the other stations.
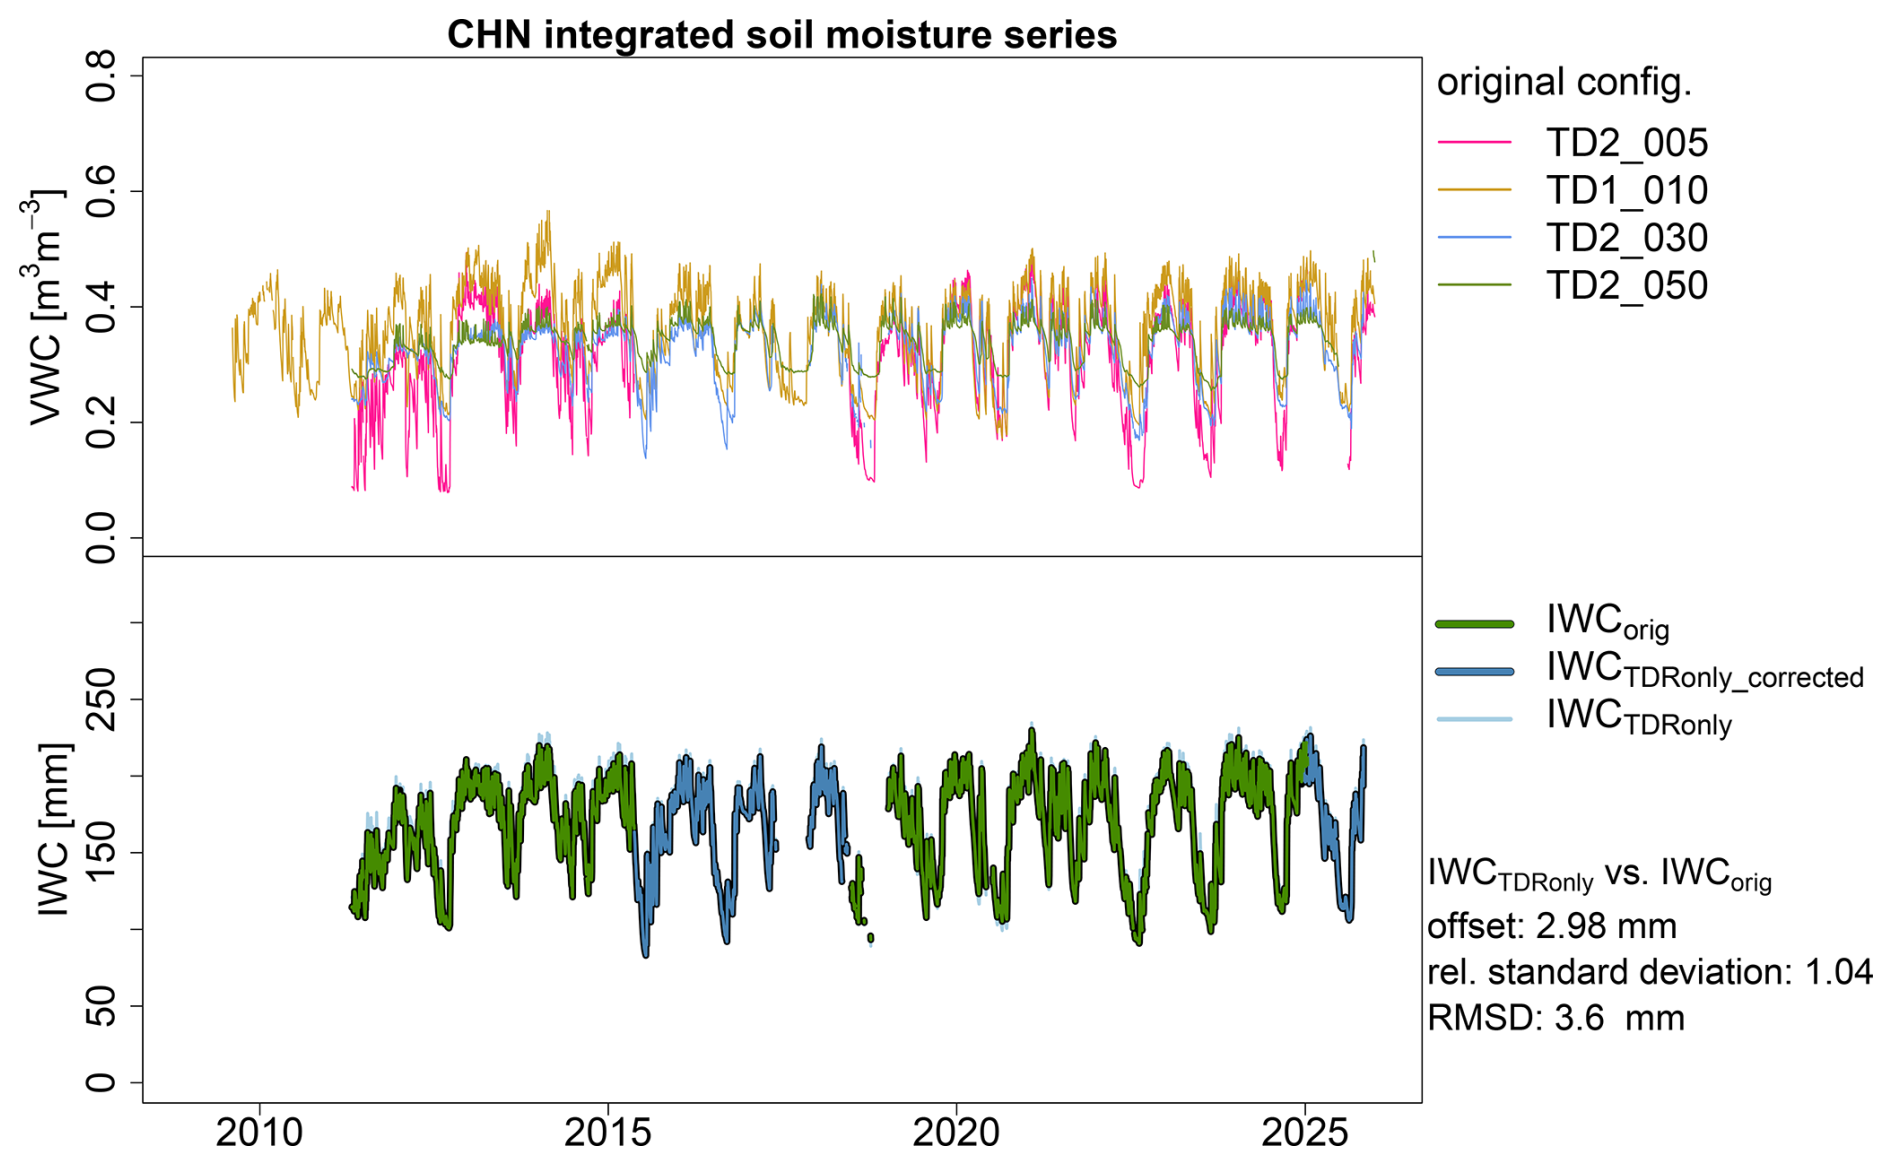
Figure 5As Fig. 4 but for Changins (CHN), where historical gaps in IWCorig could be filled. Note that IWCTDRonly_corrected is only shown when IWCorig is not available.
2.2 Comparison datasets
2.2.1 ERA5-Land
The land component of the ERA5 reanalysis (Hersbach et al., 2020) provides global, hourly, high-resolution information of the water and energy cycles over land in a consistent representation (Muñoz-Sabater et al., 2021). ERA5-Land is a single simulation based on the land-surface model HTESSEL (Hydrology-Tiled ECMWF Scheme for Surface Exchanges over Land, Balsamo et al., 2009) forced by ERA5 near-surface atmospheric reanalysis fields, with additional lapse-rate correction of temperature. HTESSEL distinguishes between four different soil layers with the following layer depths: layer 1 at 0–7 cm; layer 2 at 7–28 cm; layer 3 at 28–100 cm; and layer 4 at 100–289 cm. ERA5-Land soil moisture is regularly used in the analyses of the Copernicus European State of the Climate Reports. The data have been extracted on a 0.1°×0.1° latitude–longitude grid with monthly temporal resolution from the Copernicus Climate Data Store (CDS; C3S, 2022). For the comparison with SwissSMEX, the closest grid cells were used for each station location (see Fig. 1).
The IWC in the 0–0.5 m soil layer, as available from SwissSMEX, has been calculated based on VWC of the soil layers 1–3:
The assumption is that the VWC28−100 cm is representative for the 22 cm between 28 and 50 cm soil depth.
2.2.2 C3S satellite soil moisture
The Copernicus Climate Change Service (C3S) provides up-to-date global satellite surface soil moisture data through the CDS every 10 d (C3S SM; Dorigo et al., 2025). The algorithm for v202505 is the same one as in version 9 of the European Space Agency Climate Change Initiative (ESA CCI) soil moisture products (Dorigo et al., 2024, 2017; Gruber et al., 2019). The PASSIVE product (representative at ∼ 2–5 cm depth) is purely satellite (radiometer)-based and therefore preferred for our study over COMBINED, which may adopt certain model features (Dorigo et al., 2017). The C3S SM PASSIVE data were gap-filled using a stand-alone 3D-interpolation framework, independent of ancillary variables (Preimesberger et al., 2025). Root-zone soil moisture was derived by extrapolating gap-filled surface estimates to deeper soil layers using an exponential filter (Wagner et al., 1999; Albergel et al., 2008), calibrated for four layers with a large number of in situ time series (Pasik et al., 2023): layer 1 at 0–10 cm; layer 2 at 10–40 cm; layer 3 at 40–100 cm; and layer 4 at 100–200 cm. These data are also being used in the Copernicus European State of the Climate Reports (C3S and WMO, 2025) and available on a 0.25°×0.25° latitude–longitude grid with daily temporal resolution. The closest grid cells for each station location (see Fig. 1) were used for comparison with SwissSMEX, and we restrict the usage of C3S SM PASSIVE to data from 1991 onwards due to larger data gaps prior to this date in the non-gap-filled product, and the thereby caused high uncertainties associated with the interpolated values (Preimesberger et al., 2025).
The IWC in the 0–0.5 m soil layer has been calculated based on VWC of the soil layers 1–3:
The assumption is that the VWC40−100 cm is representative for the 10 cm between 40 and 50 cm soil depth.
2.3 Calculation of summer and summer-half-year anomalies and trends therein
To demonstrate the utility of the SwissSMEX data, it is applied to investigate the temporal evolution and drying trends in mean summer (June–August, JJA) and summer-half-year (April–September, AMJJAS) soil moisture anomalies. Calculated based on the daily IWC time series (i.e. the merged IWCorig and IWCTDRonly_corrected; see Sect. 2.1.2), the anomalies are expressed as absolute or percentage deviations from the corresponding summer (Eqs. 6a and 6b) or summer-half-year mean for 2010–2025 (i.e. in mm or % relative to the 2010–2025 mean, respectively).
IWCJJA are the annual mean summer values calculated from the daily IWC time series, and the overbar denotes the temporal average over 2010–2025. The summer-half-year anomalies are calculated analogously. Note that the percentage anomalies should not be confused with the vol. % units of the VWC sensor readings. We deliberately allow up to 35 % missing days when calculating the mean anomalies for each summer and summer half-year, respectively. This choice represents a compromise between the number of stations available for the summer drying analysis (see Table 1) and ensuring reasonable annual data coverage. We also note that certain use cases might warrant stricter data availability thresholds.
Based on the soil moisture anomalies, we test different combinations of stations to investigate the median evolution (and trends therein) of summer and summer-half-year soil moisture on the Swiss Plateau. “Best coverage” includes stations with at most one summer/summer half-year missing within the historical 2010–2022 period (i.e. until the new TDR sensor installations); “S22” includes the stations used in S22 (representative of an average elevation on the Swiss Plateau); “S22 + best coverage” combines both sets; and we also consider the combination of “all stations” listed in Table 1.
The robust Theil-Sen trend estimator (Theil, 1950; Sen, 1968) is used to compute trends, while the non-parametric Mann–Kendall trend test is used to determine trend significance (Mann, 1945; Kendall, 1975). These allow the detection of monotonic changes over time and are robust to non-normally distributed data. Statistical significance is indicated by a p-value below 0.05. The R-functions sens.slope and mk.test from the trend package (Pohlert, 2020; version 1.1.4) are used for the calculations. Trends are computed based on the median time series of the respective station combinations.
3.1 Swiss Plateau station combinations
Figure 6 presents the individual soil moisture anomaly time series of the summer IWC at SwissSMEX stations (2010–2025) for each station combination considered (see Sect. 2.3 and Table 1), along with the respective median anomalies. While there is some variation in the anomalies across the individual stations, the station medians of the four station combinations exhibit a consistent temporal evolution. This is confirmed by the pairwise Pearson correlations between the median time series, which are all at least 0.88, and by the corresponding root-mean-square deviations (RMSD), which reach at most 7.0 mm (Fig. 7, values in the red dashed rectangle). Similar values of agreement are obtained when summer-half-year instead of summer soil moisture is considered (Fig. S5). Thus, the median evolution of IWC on the Swiss Plateau, based on different combinations of stations, is largely consistent.
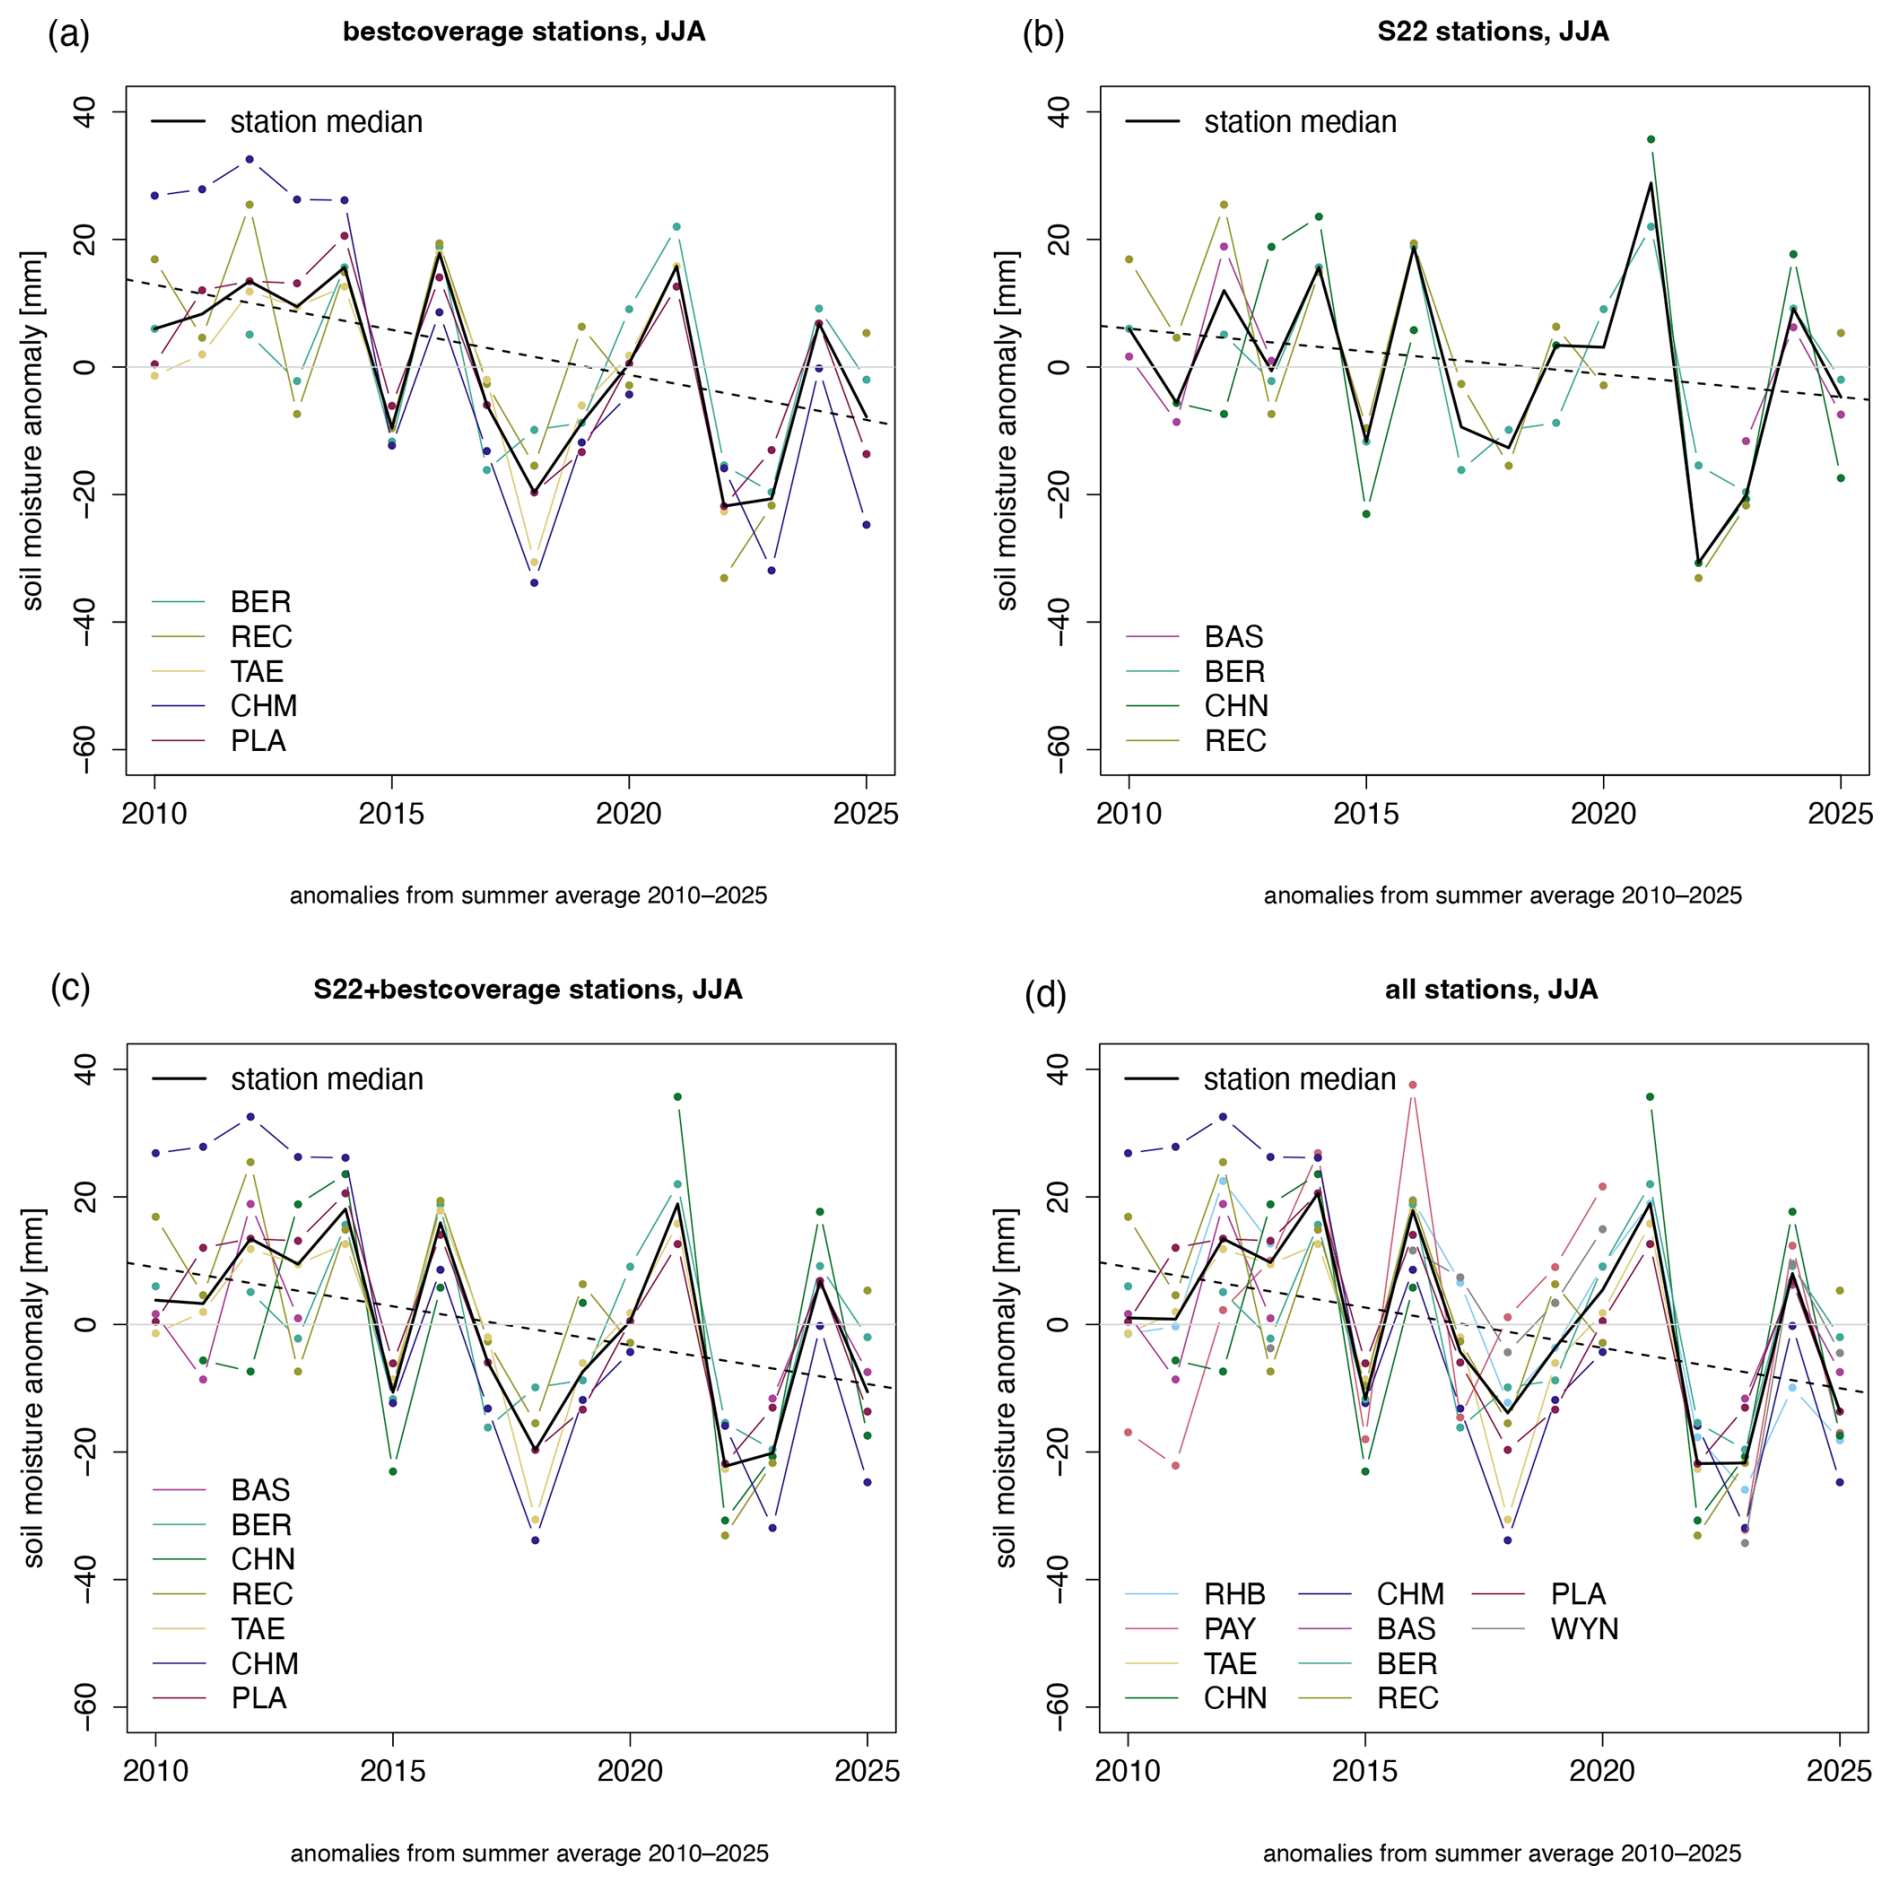
Figure 6Soil moisture anomaly time series of summer IWC of different SwissSMEX station combinations (see Sect. 2.3, Table 1) and respective station medians. (a) Stations with best temporal coverage, (b) station selection as in S22, (c) S22 and best coverage stations combined, (d) all Swiss Plateau stations. Anomalies are expressed as the absolute deviations from the summer mean over 2010–2025. The straight lines show the Theil-Sen trend slopes for the period 2010–2025 based on the respective station median time series (solid lines indicate a significant trend with p<0.05; dashed lines indicate a non-significant trend).
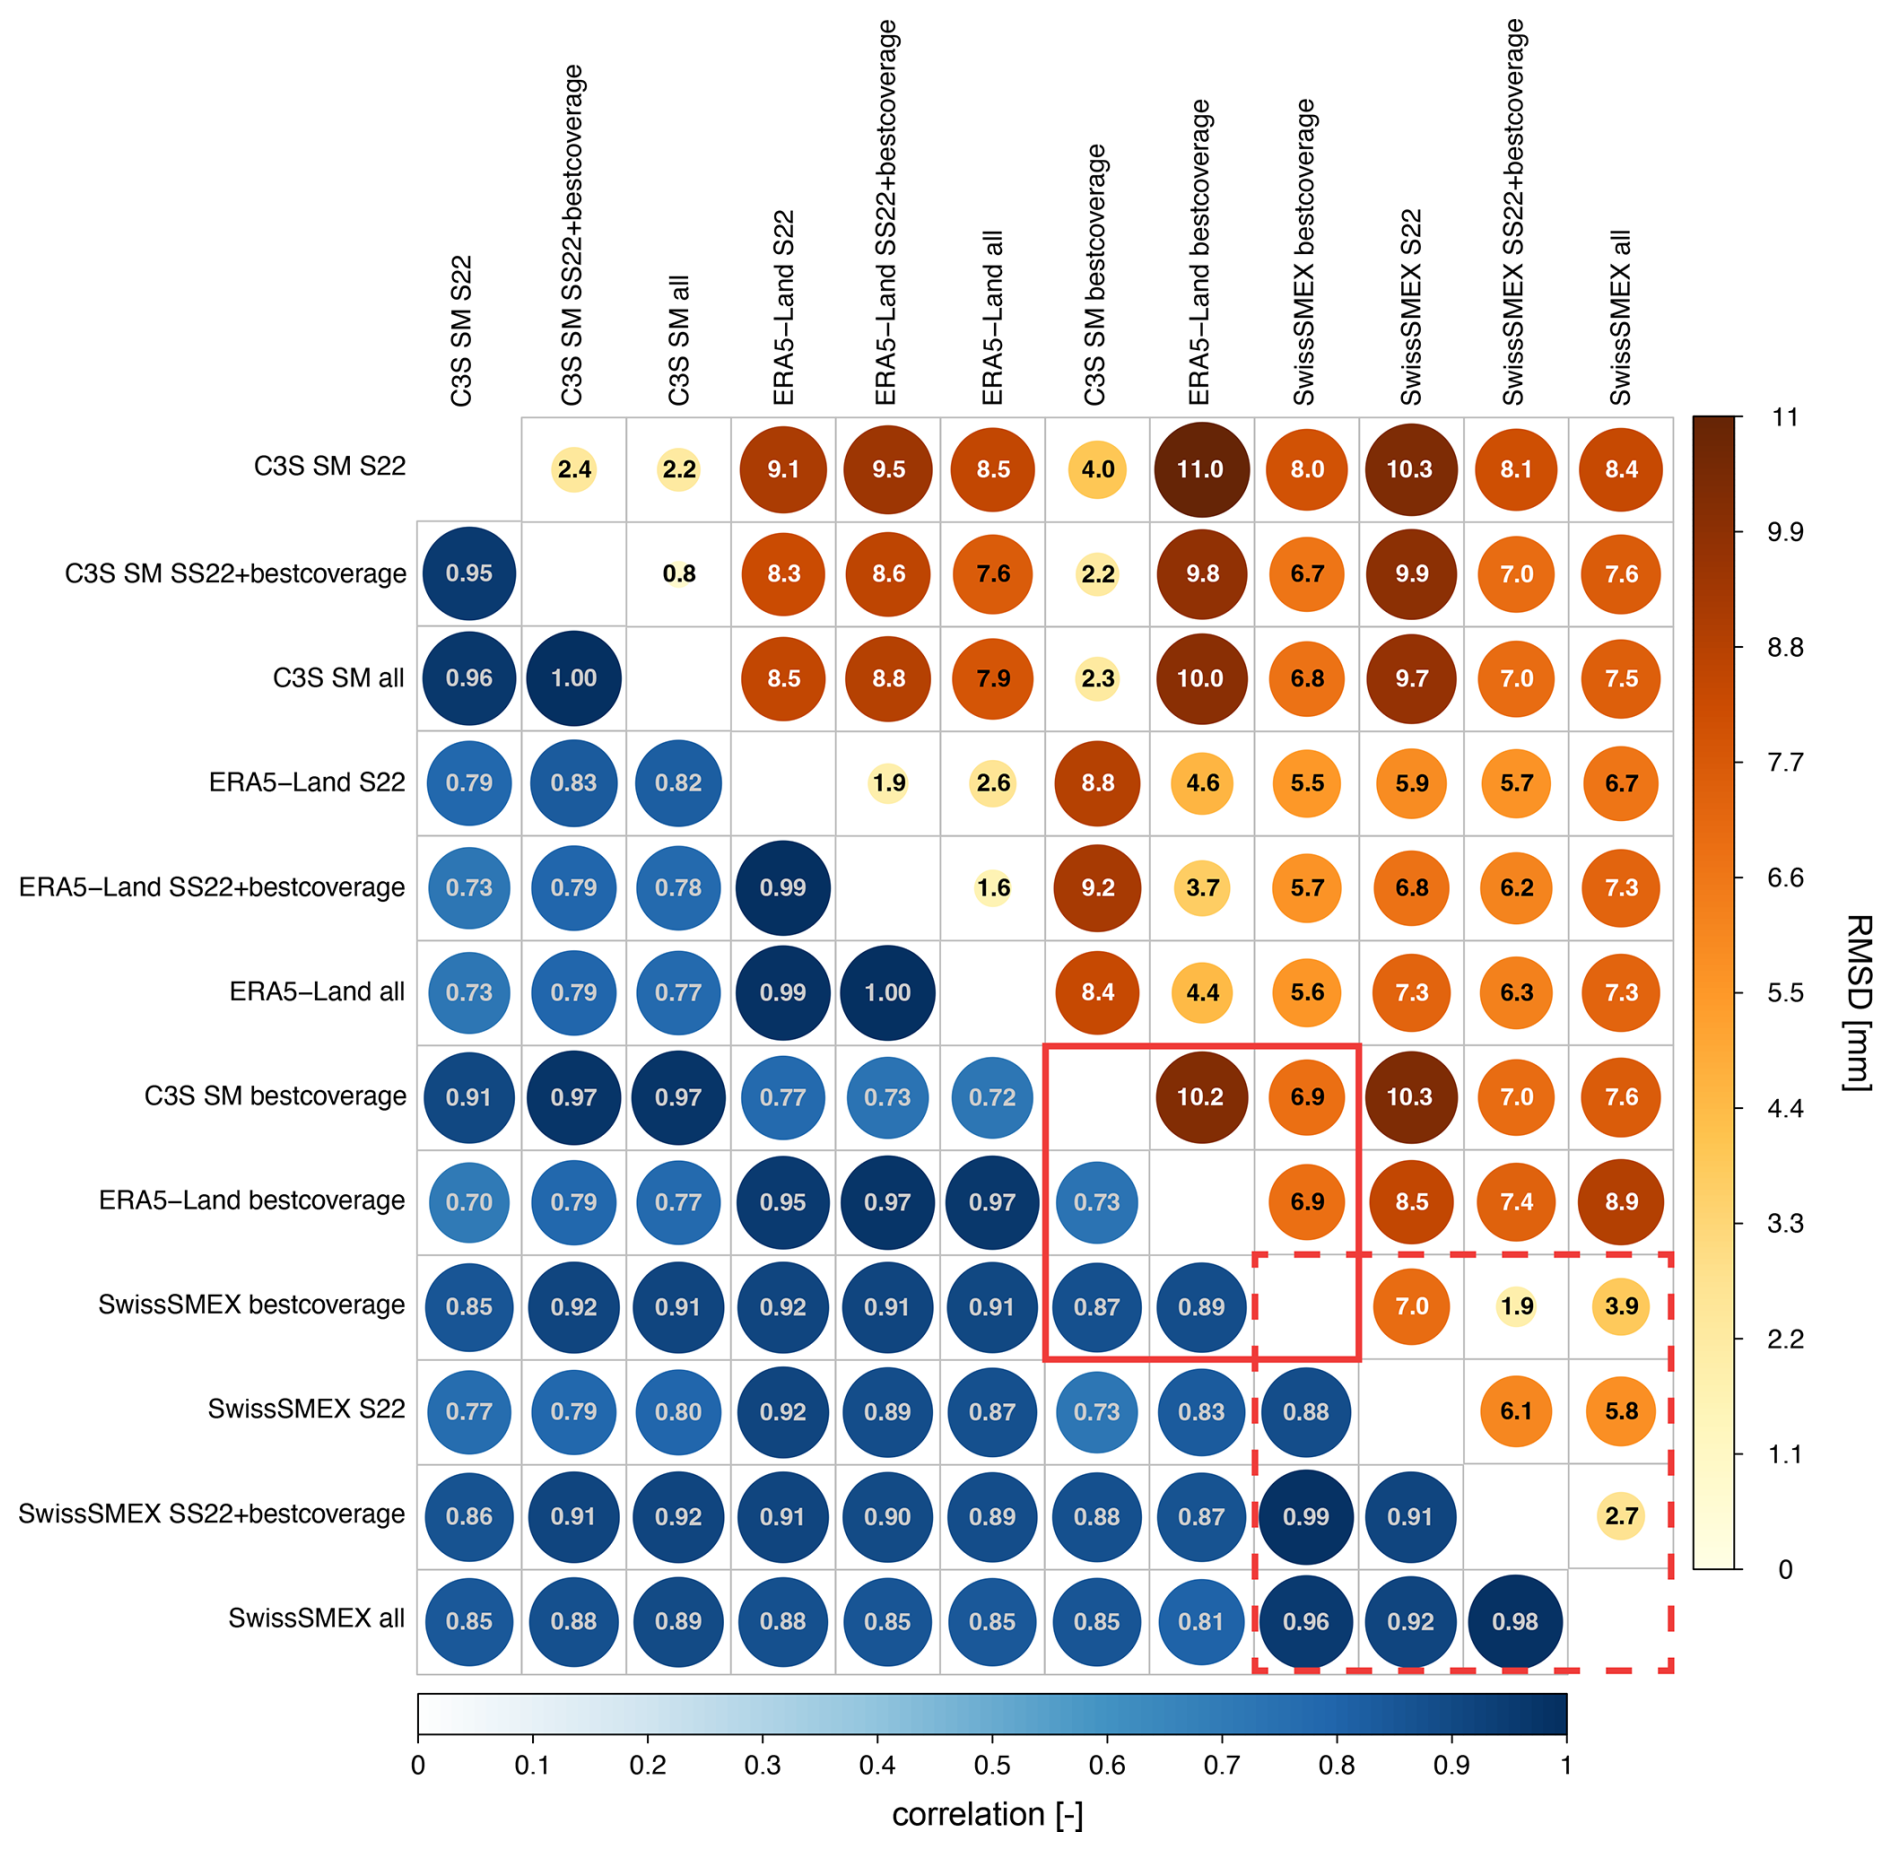
Figure 7Pearson correlation and RMSD matrices from the pairwise comparison of SwissSMEX, ERA5-Land and C3S SM PASSIVE soil moisture, considering the different station combinations for the Swiss Plateau median time series of summer soil moisture anomalies (expressed as the absolute deviations from the 2010–2025 summer mean). Values are calculated for the common period 2010–2025. All correlations are significant (p<0.05). The red dashed rectangle highlights the comparison of the different station combinations based on SwissSMEX, while the red solid rectangle highlights the comparison of the gridded products and SwissSMEX based on the best coverage station combination. See Fig. S5 for the corresponding summer-half-year correlations and RMSDs.
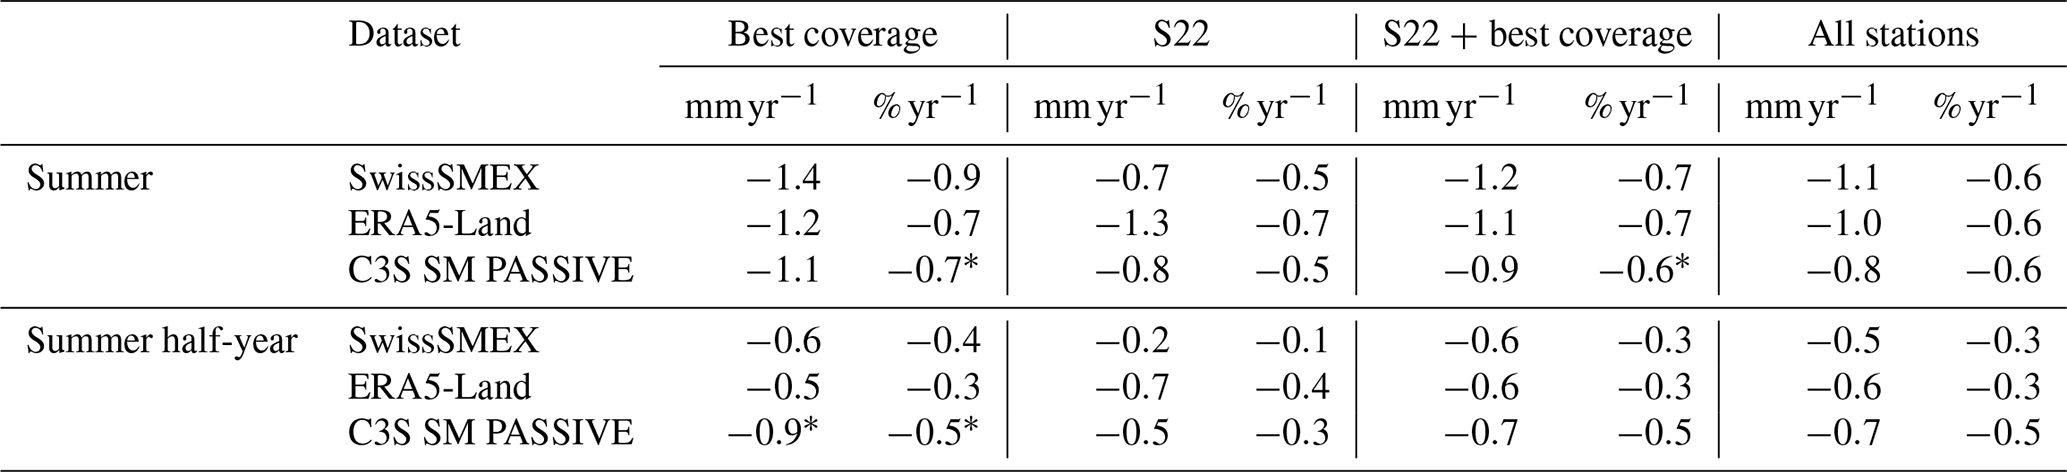
All SwissSMEX station combinations also show a (non-significant) tendency towards drying (see straight lines in Fig. 6). The respective Theil-Sen trend slopes based on the period 2010–2025 range from −1.4 to for summer, and from −0.6 to for summer half-year, when trends tend to be lower (Table 2). The respective trends for the percentage anomalies amount to −0.9 to for summer, and to −0.4 to for summer half-year. Thus, the recent soil drying tendency on the Swiss Plateau is noticeable in all combinations of SwissSMEX stations used for the median time series (see also Fig. 8). However, the trends are not significant and show some degree of variation in their magnitude between the different station combinations.
Table 2Theil-Sen trend slopes of summer and summer-half-year IWC anomalies based on the median of different station combinations (i.e. best coverage, S22, S22 + best coverage, all stations). Anomalies are expressed as the absolute deviations from the summer resp. summer-half-year mean over 2010–2025, and as percentage deviations from this mean. Trend slopes are based on the period 2010–2025, and trend significance is determined using the non-parametric Mann–Kendall trend test.
∗ denotes p<0.05.
3.2 Comparison with alternate long-term reanalysis and remote sensing soil moisture
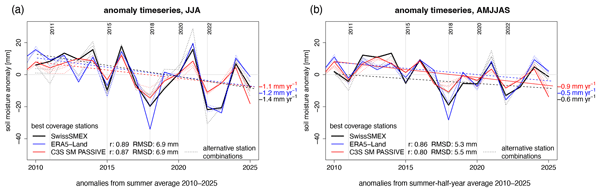
The agreement between the different station combinations regarding the temporal evolution of the Swiss Plateau median soil moisture is also evident in Fig. 8, which, in addition to SwissSMEX, includes the ERA5-Land and the C3S SM PASSIVE soil moisture. The three independent data sources show good agreement in the inter-annual variations of the summer and summer-half-year soil moisture anomalies over the period 2010–2025, with correlations of 0.80 or higher between the gridded products and SwissSMEX based on the median of the best coverage stations (see also Figs. 7 and S5, values within the red solid rectangles). This holds for both the absolute soil moisture anomalies, as well as the percentage anomalies (Fig. S6). The RMSD from SwissSMEX amounts to 6.9 mm for the absolute anomalies (or 4.0 % for the percentage anomalies) for both C3S SM PASSIVE and ERA5-Land in summer (Figs. 8 and S6). For the summer half-year, these values are lower due to the lower year-to-year variability (5.5 mm or 3.1 % for C3S SM PASSIVE, and 5.3 mm or 3.0 % for ERA5-Land). The pairwise correlations between the three data sources are also significant for the other station combinations, both for summer (Fig. 7) and the summer-half-year (Fig. S5).
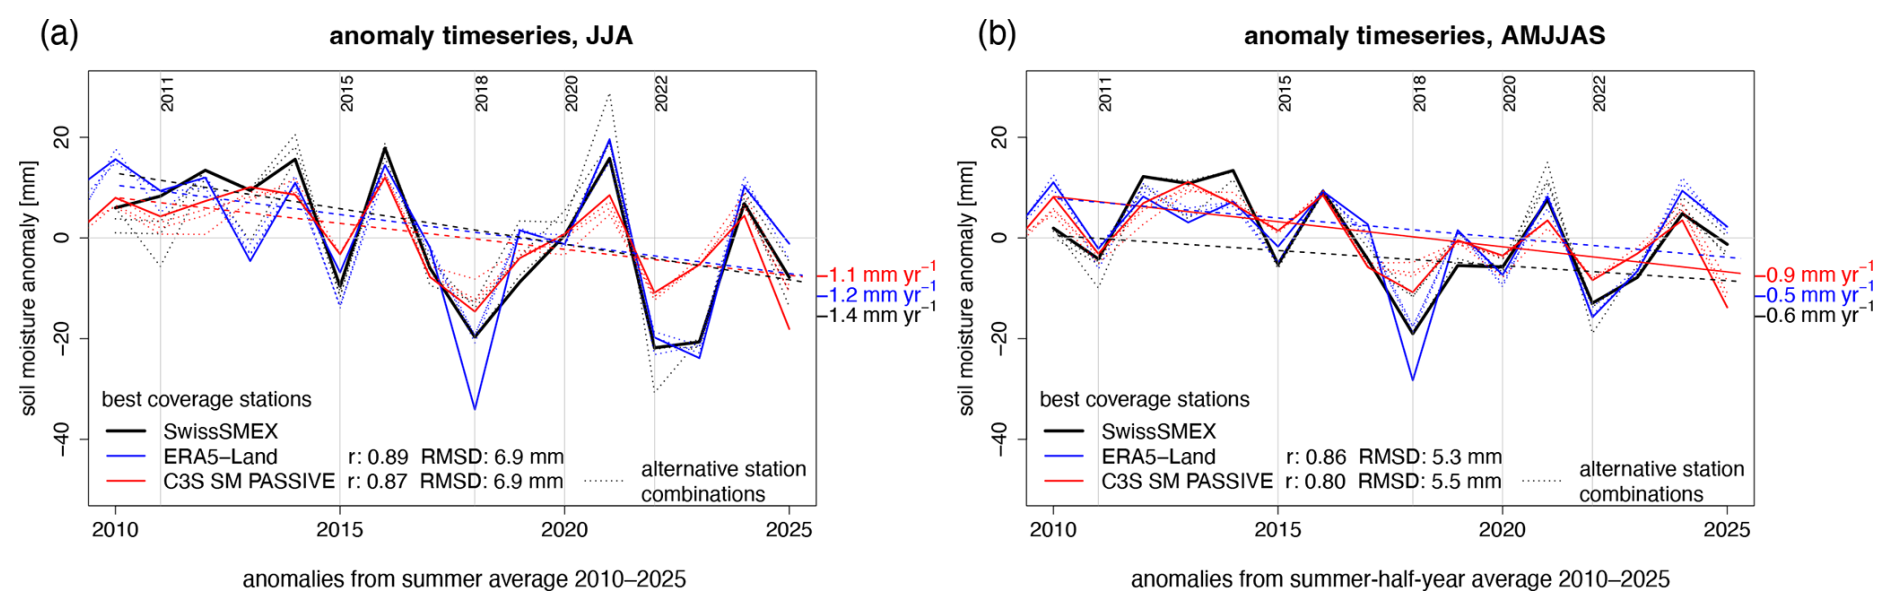
Figure 8Evolution of (a) summer and (b) summer-half-year soil moisture anomalies based on SwissSMEX, ERA5-Land and C3S SM PASSIVE. Anomalies are expressed as absolute deviations from the summer or summer-half-year mean IWC over the period 2010–2025, respectively (see Fig. S6 for corresponding anomalies as percentage deviations from this mean). Shown are the median time series based on the best coverage stations (solid lines), as well as the ones based on the alternative station combinations presented in Sect. 2.3 (dotted lines). For the gridded products, the nearest grid cells to the stations are considered as the basis for the median. Straight lines show the Theil-Sen trend slopes for the period 2010–2025 (based on the best coverage stations time series), which are also indicated to the right of the plots (solid lines indicate a significant trend with p<0.05; dashed lines indicate a non-significant trend). Also noted are the Pearson correlation r and RMSD of the gridded products with respect to SwissSMEX, and known drought summers are indicated by vertical lines.
The Theil-Sen trend slopes for the median of the best coverage stations amount to (or ) for SwissSMEX, to (or ) for ERA5-Land, and to (or ) for C3S SM PASSIVE for summer (Figs. 8 and S6, Table 2). The summer-half-year trends based on the best coverage stations are about half of the summer values for SwissSMEX () and ERA5-Land (), whereas C3S SM PASSIVE shows similar trends for summer and the summer half-year ( for the latter). Over the period 2010–2025, only the C3S SM PASSIVE summer-half-year trends are significant for the absolute anomalies. The same holds for the percentage anomalies of this product for both summer and the summer half-year. This is because the product exhibits lower year-to-year variability and less pronounced negative summer and summer-half-year anomalies compared with SwissSMEX and ERA5-Land (Figs. 8 and S6). The drying tendencies for all station combinations are listed in Table 2.
ERA5-Land and C3S SM PASSIVE also show reasonable agreement in the inter-annual variations of Swiss Plateau soil moisture since 1991 (Fig. A1 in the Appendix and Fig. S6), with correlations of 0.68 for summer and 0.63 for summer half-year (p<0.05 for both) based on the median of the best coverage stations. Even though the sign of the anomalies does not agree in some cases, the dry anomalies of 2003, 2015, 2018, 2022 and 2023 are apparent in both products, with ERA5-Land displaying more negative anomalies compared to C3S SM PASSIVE. This is consistent with previously reported differences in the drought detection capacity of these gridded products (Hirschi et al., 2025b). As in the period 2010–2025, the different station combinations also show largely consistent temporal evolutions since 1991. The long-term trend of ERA5-Land becomes significant when considering summer-half-year anomalies since 1980 (Figs. A1 and S6, see also Appendix B), in agreement with the analysis of S22. Similarly, as in the period 2010–2025, C3S SM PASSIVE trends are significant when considering summer-half-year anomalies since 1991. This temporally extended perspective highlights that the recent evolution of SwissSMEX aligns well with the longer-term evolution of soil moisture from the two gridded products, all of which indicate an increase in summer soil drying in recent years.
3.3 Differences to S22
Compared with S22, the IWC of SwissSMEX presented here relies more heavily on TDR sensors, which have proven to be more robust in operation, and which have been partly renewed or additionally installed in 2022 (see Sect. 2.1.1). Despite the applied site-specific calibration of the 10HS sensors, the temporal variability of the TDR sensors tends to be partly larger than that of the 10HS sensors. This may explain part of the larger temporal variability and stronger anomalies observed in the presented SwissSMEX time series of the Swiss Plateau compared with S22 (cf. Fig. S3 therein). In particular, the IWC at the station CHN was based on 10HS sensors in S22, whereas it is now based on TDR sensors and extended with 10 and 30 cm TDR-based integration (see Fig. 5). Similarly, the station BER now includes a 10 cm TDR sensor in the integration, replacing the 10HS sensor at the same depth, which stopped working in 2021 (see Table S1 for an overview of the sensors used). Given the limited number of stations in S22, these changes in sensor configuration result in the observed differences in the temporal variability of the SwissSMEX IWC time series. Consequently, the agreement between SwissSMEX and ERA5-Land improves considerably compared with S22, in which SwissSMEX showed lower year-to-year variations in IWC than ERA5-Land.
The hourly and daily IWC time series of SwissSMEX (Swiss Plateau stations), i.e. the historical IWCorig based on the original sensor configuration, the TDR-only based IWCTDRonly and IWCTDRonly_corrected, and the merged IWC are available from the ETH Research Collection at https://doi.org/10.3929/ethz-b-000743711 (Hirschi et al., 2025a). Additionally, the VWC of the individual sensors and depths is available from the same location. ERA5-Land is available from the CDS at https://doi.org/10.24381/cds.68d2bb30 (C3S, 2022). The C3S SM PASSIVE gap-filled root-zone soil moisture is available at https://doi.org/10.48436/9j8ad-z2q11 (Preimesberger et al., 2026).
We present a curated and comprehensive set of in situ soil moisture time series from the SwissSMEX stations on the Swiss Plateau, covering the period 2010–2025. SwissSMEX provides data on volumetric soil water content (VWC) at various depths in the soil profile, which are used to calculate integrated soil water content (IWC) down to 50 cm depth as an indicator of root-zone water. We document the steps that have recently been taken to secure the network and its long-term IWC time series, which have been affected by an increasing number of sensor failures in recent years. In summer 2022, defective TDR sensors at 10 and 30 cm depth were replaced, and additional ones were installed where they had not previously been present in the profile at these depths. These new TDR measurements are used as an alternative for the IWC calculation when coverage with the original sensors is lacking. We merge the original IWC with the IWC based on the new TDR sensors by correcting the mean offset and the difference in standard deviation of the latter relative to the former to account for the difference in the representative depth.
As a validation use case for the network, we demonstrate the utility of SwissSMEX and its secured IWC time series for analysing documented summer drying trends on the Swiss Plateau. We focus on summer and summer-half-year IWC anomalies and trends therein, and compare these with ERA5-Land reanalysis and C3S SM PASSIVE remote-sensing soil moisture. We find good agreement in the temporal evolution of SwissSMEX in situ soil moisture across different combinations of stations on the Swiss Plateau. All station combinations share a drying tendency over the period 2010–2025. Comparing the in situ time series with ERA5-Land and C3S SM PASSIVE soil moisture also reveals a good agreement between the three independent data sources, with correlations of 0.80 or higher for the median time series of the stations with best temporal coverage. The non-significant drying over the period 2010–2025, based on the median of these stations, amounts to for SwissSMEX, to for ERA5-Land, and to for C3S SM PASSIVE for summer.
While the SwissSMEX network suggests that summer soil drying has increased in recent years, the 16 years of in situ data currently available are not yet sufficient to robustly estimate a significant trend. The projected increases in air temperature and evaporative demand, combined with a decline in summer precipitation, are expected to lead to further summer drying in Switzerland in the coming years (CH2018, 2018; MeteoSwiss and ETH Zurich, 2025). In this context, the continuation of the SwissSMEX measurements and the ongoing efforts at the federal level to establish a national soil moisture measurement network are crucial for ensuring a seamless continuation of soil moisture monitoring in Switzerland.
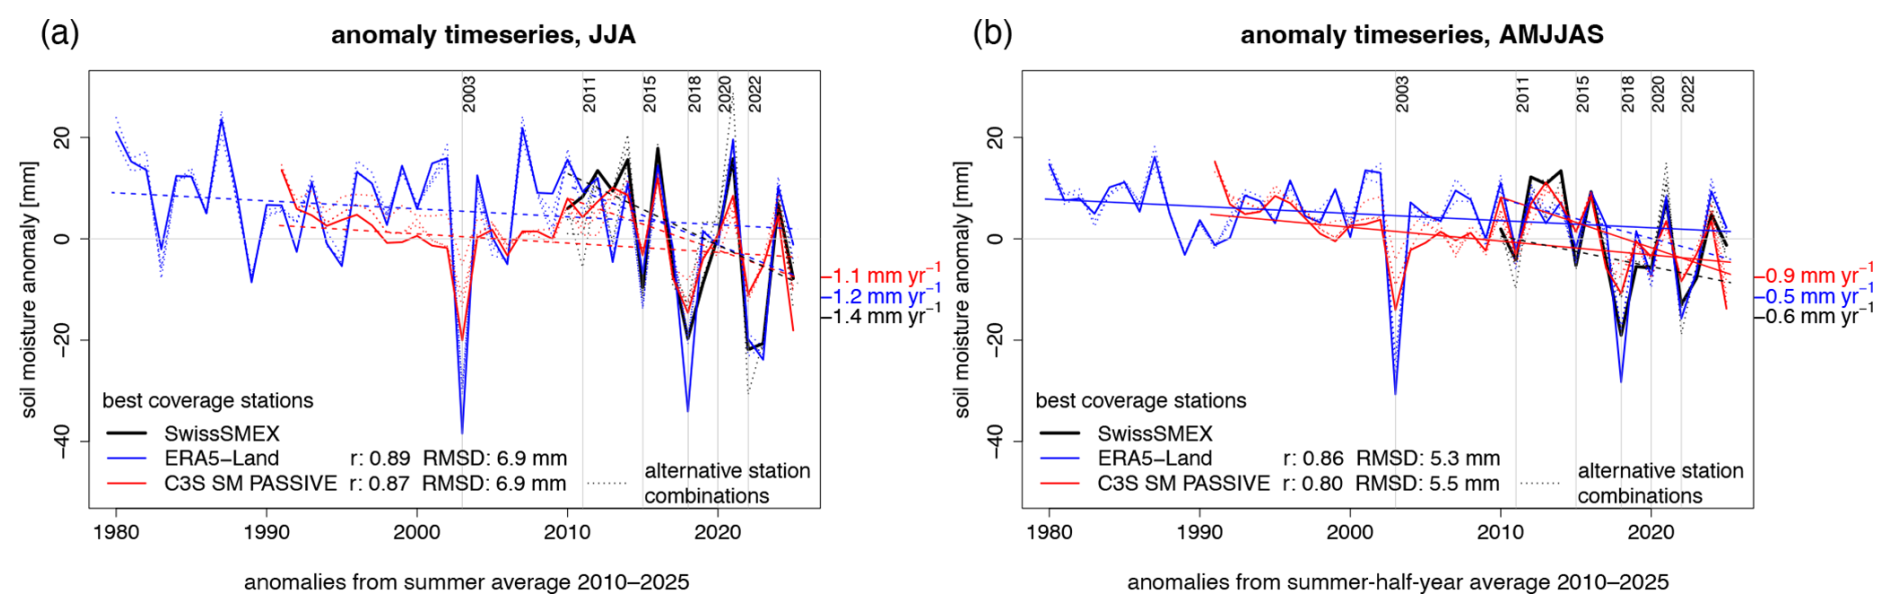
Figure A1As Fig. 8 but extended with the long-term evolution of (a) summer and (b) summer-half-year soil moisture anomalies based on ERA5-Land (starting in 1980) and C3S SM PASSIVE (starting in 1991). For both long-term products, the Theil-Sen trend slopes for the periods 1980–2025 and 1991–2025, respectively, are indicated by straight lines (solid lines indicate a significant trend with p<0.05; dashed lines indicate no significant trend).
To investigate the impact of the shortness of the Swiss-SMEX time series on the significance of the trend, Fig. B1 shows the p-value of the Mann–Kendall trend test based on ERA5-Land soil moisture as a function of the starting year used to calculate the trend (i.e. the length of the time series). A starting year of 2010 corresponds to the 2010–2025 trend (16 years of data, i.e. the SwissSMEX period), while a starting year of 1980 corresponds to the 1980–2025 trend (46 years of data). In addition to the summer and summer-half-year trends, trends based on annual anomalies are also considered.
Due to the larger inter-annual variability, summer trends tend to be overall less significant (i.e. have higher p-values) than trends based on annual and summer-half-year soil moisture anomalies, even though the absolute trend magnitude is larger for summer than for the summer half-year (see Table 2). For the short period 2010–2025, trends in SwissSMEX and ERA5-Land soil moisture anomalies are not significant (circles in Fig. B1, see also Table 2). Trends in summer-half-year soil moisture anomalies become significant for certain periods when extending the starting year of the trend test calculation. Particularly, summer-half-year trends that start before 1983 become significant, consistent with the results of S22. The same partly applies to annual and summer-half-year trends from 1993–1996. Trends in summer anomalies are, however, non-significant (p>0.05) for all starting years, and the corresponding p-values vary considerably over time. Higher p-values are observed when the starting year has a comparably dry summer compared to surrounding years (e.g. as 2003, 1989).
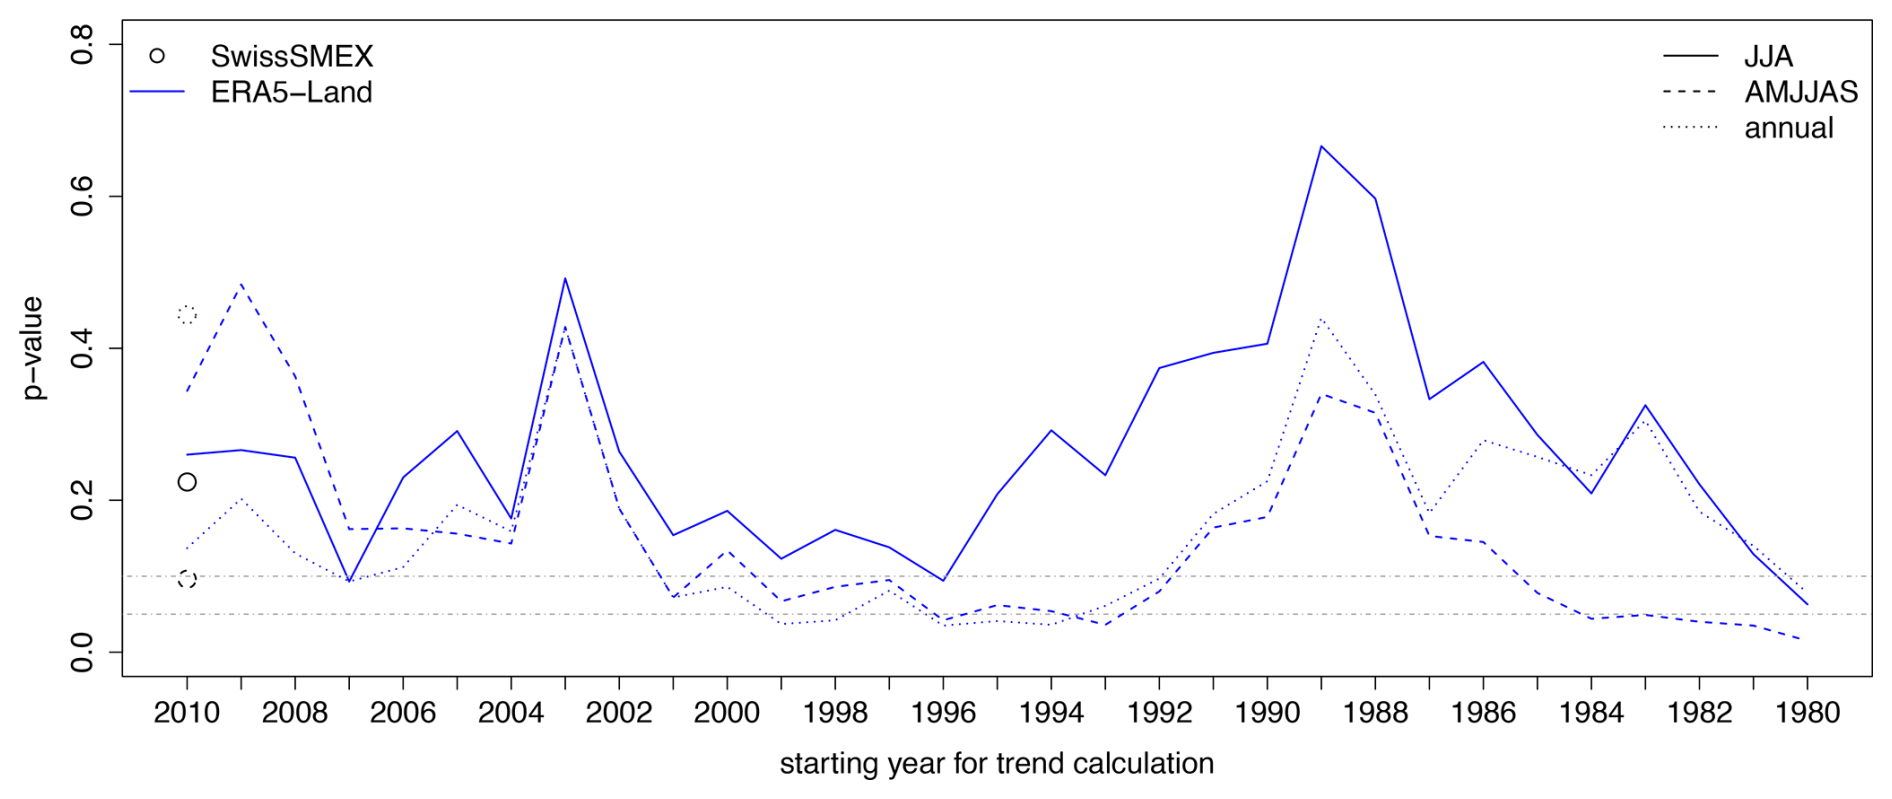
Figure B1Significance of the Theil-Sen trend slope (p-value of the Mann–Kendall trend test) based on ERA5-Land soil moisture as a function of the starting year for calculating the trend (i.e. the length of the time series). The trends are calculated based on the median time series of the absolute soil moisture anomalies from the best coverage stations (solid lines in Fig. 8). In addition to the summer and summer-half-year trends, annual trends are also considered. Starting year 2010 refers to the 2010–2025 trend (or 16 years of data), starting year 1980 refers to the 1980–2025 trend (46 years of data). The p-values for SwissSMEX based on the 16 year time series are shown as circles at starting year 2010. The horizontal lines indicate the p=0.05 and p=0.1 thresholds.
This analysis shows that the significance of the trend depends on both the time frame of the anomalies (annual, summer half-year, or summer) and the period used for the trend calculation. Thus, while the SwissSMEX network indicates that soils have become drier in recent years, the 16 years of in situ data currently available are not yet sufficient to robustly estimate significant trends. Extending the period used to calculate the trend yields significant results, particularly for summer-half-year soil moisture anomalies, although the significance of the trend may still be impacted by anomalous soil moisture conditions in the starting year.
The supplement related to this article is available online at https://doi.org/10.5194/essd-18-4855-2026-supplement.
MH, DM, DLS and SIS: Conceptualization; MH, DM: Formal analysis, Investigation, Methodology, Visualisation; MH, DM, WP: Data curation; MH: Writing – original draft preparation; all authors: Writing – review and editing.
The contact author has declared that none of the authors has any competing interests.
Publisher's note: Copernicus Publications remains neutral with regard to jurisdictional claims made in the text, published maps, institutional affiliations, or any other geographical representation in this paper. The authors bear the ultimate responsibility for providing appropriate place names. Views expressed in the text are those of the authors and do not necessarily reflect the views of the publisher.
We thank Michael Rösch for his technical support and maintenance of the measurement sites. The development of the satellite soil moisture data in this study was funded by the European Space Agency (ESA) Climate Change Initiative (CCI+) Soil Moisture Project (CCN 3 under ESRIN contract no. 4000126684/19/I-NB). Operational implementation is supported by the Copernicus Climate Change Service (C3S2 312a/313c).
We acknowledge partial financial support from GCOS Switzerland for the update of the SwissSMEX network in 2022.
This paper was edited by James Thornton and reviewed by Heye Bogena and Matthias Zink.
Albergel, C., Rüdiger, C., Pellarin, T., Calvet, J.-C., Fritz, N., Froissard, F., Suquia, D., Petitpa, A., Piguet, B., and Martin, E.: From near-surface to root-zone soil moisture using an exponential filter: an assessment of the method based on in-situ observations and model simulations, Hydrol. Earth Syst. Sci., 12, 1323–1337, https://doi.org/10.5194/hess-12-1323-2008, 2008.
BAFU: Hitze und Trockenheit im Sommer 2015: Auswirkungen auf Mensch und Umwelt, Bundesamt für Umwelt BAFU, Berne, Umwelt-Zustand 1629, 108 pp., 2016.
BAFU: Drought: monitoring, forecasting and warning: https://www.bafu.admin.ch/bafu/en/home/topics/water/extreme-events/drought-monitoring-forecasting-and-warning.html (last access: 31 March 2025), 2024.
Balsamo, G., Viterbo, P., Beljaars, A., van den Hurk, B., Hirschi, M., Betts, A. K., and Scipal, K.: A Revised Hydrology for the ECMWF Model: Verification from Field Site to Terrestrial Water Storage and Impact in the Integrated Forecast System, J. Hydrometeorol., 10, 623–643, https://doi.org/10.1175/2008jhm1068.1, 2009.
Brouwer, C., Prins, K., and Heibloem, M.: Irrigation Water Management: Irrigation Scheduling, FAO, https://www.fao.org/4/t7202e/t7202e00.htm (last access: 2 July 2026), 1989.
Brunner, M. I., Liechti, K., and Zappa, M.: Extremeness of recent drought events in Switzerland: dependence on variable and return period choice, Nat. Hazards Earth Syst. Sci., 19, 2311–2323, https://doi.org/10.5194/nhess-19-2311-2019, 2019.
C3S: ERA5-Land monthly averaged data from 1950 to present, Copernicus Climate Change Service (C3S) Climate Data Store (CDS) [data set], https://doi.org/10.24381/cds.68d2bb30, 2022.
C3S and WMO: Soil moisture, in: European State of the Climate 2024, WMO, Geneva, 39–41, https://doi.org/10.24381/14j9-s541, 2025.
Calanca, P.: Climate change and drought occurrence in the Alpine region: How severe are becoming the extremes?, Global Planet Change, 57, 151–160, https://doi.org/10.1016/j.gloplacha.2006.11.001, 2007.
CH2018: CH2018 – Climate Scenarios for Switzerland, National Centre for Climate Services, Zürich, Technical Report, 271 pp., https://www.nccs.admin.ch/nccs/de/home/klimawandel-und-auswirkungen/schweizer-klimaszenarien/technical-report.html (last access: 2 July 2026), 2018.
Domínguez-Niño, J. M., Bogena, H. R., Huisman, J. A., Schilling, B., and Casadesús, J.: On the Accuracy of Factory-Calibrated Low-Cost Soil Water Content Sensors, Sensors, 19, 3101, https://doi.org/10.3390/s19143101, 2019.
Dorigo, W., Wagner, W., Albergel, C., Albrecht, F., Balsamo, G., Brocca, L., Chung, D., Ertl, M., Forkel, M., Gruber, A., Haas, E., Hamer, P. D., Hirschi, M., Ikonen, J., de Jeu, R., Kidd, R., Lahoz, W., Liu, Y. Y., Miralles, D., Mistelbauer, T., Nicolai-Shaw, N., Parinussa, R., Pratola, C., Reimer, C., van der Schalie, R., Seneviratne, S. I., Smolander, T., and Lecomte, P.: ESA CCI Soil Moisture for improved Earth system understanding: State-of-the art and future directions, Remote Sens. Environ., 203, 185–215, https://doi.org/10.1016/j.rse.2017.07.001, 2017.
Dorigo, W., Preimesberger, W., Hahn, S., Van der Schalie, R., De Jeu, R., Kidd, R., Rodriguez-Fernandez, N., Hirschi, M., Stradiotti, P., Frederikse, T., Gruber, A., and Duchemin, D.: ESA Soil Moisture Climate Change Initiative (Soil_Moisture_cci): PASSIVE product, Version 09.1, NERC EDS Centre for Environmental Data Analysis [data set], https://doi.org/10.5285/ca55ac11fc814b0d95e68a34a10539c1, 2024.
Dorigo, W., Preimesberger, W., Lems, J., Frederikse, T., and Dostalova, A.: Soil moisture gridded data from 1978 to present (v202505), Climate Data Store [data set], https://doi.org/10.24381/cds.d7782f18, 2025.
Gruber, A., Scanlon, T., van der Schalie, R., Wagner, W., and Dorigo, W.: Evolution of the ESA CCI Soil Moisture climate data records and their underlying merging methodology, Earth Syst. Sci. Data, 11, 717–739, https://doi.org/10.5194/essd-11-717-2019, 2019.
Hersbach, H., Bell, B., Berrisford, P., Hirahara, S., Horányi, A., Muñoz-Sabater, J., Nicolas, J., Peubey, C., Radu, R., Schepers, D., Simmons, A., Soci, C., Abdalla, S., Abellan, X., Balsamo, G., Bechtold, P., Biavati, G., Bidlot, J., Bonavita, M., De Chiara, G., Dahlgren, P., Dee, D., Diamantakis, M., Dragani, R., Flemming, J., Forbes, R., Fuentes, M., Geer, A., Haimberger, L., Healy, S., Hogan, R. J., Hólm, E., Janisková, M., Keeley, S., Laloyaux, P., Lopez, P., Lupu, C., Radnoti, G., de Rosnay, P., Rozum, I., Vamborg, F., Villaume, S., and Thépaut, J.-N.: The ERA5 Global Reanalysis, Q. J. Roy. Meteor. Soc., 146, 1999–2049, https://doi.org/10.1002/qj.3803, 2020.
Hirschi, M., Michel, D., Mittelbach, H., Rösch, M., and Seneviratne, S. I.: SwissSMEX soil moisture data (Hirschi et al. 2026, ESSD), ETH Zurich [data set], https://doi.org/10.3929/ethz-b-000743711, 2025a.
Hirschi, M., Stradiotti, P., Crezee, B., Dorigo, W., and Seneviratne, S. I.: Potential of long-term satellite observations and reanalysis products for characterising soil drying: trends and drought events, Hydrol. Earth Syst. Sci., 29, 397–425, https://doi.org/10.5194/hess-29-397-2025, 2025b.
Hupet, F., Bogaert, P., and Vanclooster, M.: Quantifying the local-scale uncertainty of estimated actual evapotranspiration, Hydrol. Process., 18, 3415–3434, https://doi.org/10.1002/hyp.1504, 2004.
Kendall, M. G.: Rank Correlation Methods, Griffin, London, ISBN 978-0-8526419-9-6, 1975.
Mann, H. B.: Nonparametric Tests against Trend, Econometrica, 13, 245–259, https://doi.org/10.2307/1907187, 1945.
MeteoSchweiz: Klimabulletin Jahr 2011, MeteoSwiss, Zürich, 12 pp., https://www.meteoschweiz.admin.ch/service-und-publikationen/publikationen/berichte-und-bulletins/2012/klimabulletin-jahr-2011.html (last access: 2 July 2026), 2012.
MeteoSchweiz: Hitze und Trockenheit im Sommerhalbjahr 2018 – eine klimatologische Übersicht, MeteoSwiss, Zürich, Fachbericht MeteoSchweiz 272, 38 pp., https://www.meteoschweiz.admin.ch/service-und-publikationen/publikationen/berichte-und-bulletins/2018/hitze-und-trockenheit-im-sommerhalbjahr-2018-eine-klimatologische-uebersicht.html (last access: 2 July 2026), 2018.
MeteoSwiss and ETH Zurich: Climate CH2025 – Scientific Report, Federal Office of Meteorology and Climatology MeteoSwiss, Zurich, https://doi.org/10.18751/climate/scenarios/ch2025/sr/1.0/, 2025.
Michel, D., Hirschi, M., Buri, R., and Seneviratne, S. I.: Updating the SwissSMEX soil moisture monitoring network infrastructure to secure the continuity of the long-term data series and ensure the data quality, Final report GCOS-CH supported activities, ETH Zurich, https://doi.org/10.3929/ethz-b-000713939, 2022a.
Michel, D., Hirschi, M., Buri, R., Wittneben, B., and Seneviratne, S. I.: Enhancing cross-disciplinary process understanding and scientific exploitation of soil moisture and land evaporation ECV measurements in Switzerland (SMiLE-ECV-CH), Final report GCOS-CH supported activities, ETH Zurich, https://doi.org/10.3929/ethz-b-000713937, 2022b.
Mittelbach, H.: Soil moisture in Switzerland: Analyses from the Swiss Soil Moisture Experiment, ETH Zurich, 133 pp., https://doi.org/10.3929/ethz-a-007142621, 2011.
Mittelbach, H. and Seneviratne, S. I.: A new perspective on the spatio-temporal variability of soil moisture: temporal dynamics versus time-invariant contributions, Hydrol. Earth Syst. Sci., 16, 2169–2179, https://doi.org/10.5194/hess-16-2169-2012, 2012.
Mittelbach, H., Casini, F., Lehner, I., Teuling, A. J., and Seneviratne, S. I.: Soil moisture monitoring for climate research: Evaluation of a low-cost sensor in the framework of the Swiss Soil Moisture Experiment (SwissSMEX) campaign, J. Geophys. Res., 116, D05111, https://doi.org/10.1029/2010JD014907, 2011.
Mittelbach, H., Lehner, I., and Seneviratne, S. I.: Comparison of four soil moisture sensor types under field conditions in Switzerland, J. Hydrol., 430–431, 39–49, https://doi.org/10.1016/j.jhydrol.2012.01.041, 2012.
Muñoz-Sabater, J., Dutra, E., Agustí-Panareda, A., Albergel, C., Arduini, G., Balsamo, G., Boussetta, S., Choulga, M., Harrigan, S., Hersbach, H., Martens, B., Miralles, D. G., Piles, M., Rodríguez-Fernández, N. J., Zsoter, E., Buontempo, C., and Thépaut, J.-N.: ERA5-Land: a state-of-the-art global reanalysis dataset for land applications, Earth Syst. Sci. Data, 13, 4349–4383, https://doi.org/10.5194/essd-13-4349-2021, 2021.
Orth, R., Zscheischler, J., and Seneviratne, S. I.: Record dry summer in 2015 challenges precipitation projections in Central Europe, Sci. Rep.-Uk, 6, 28334, https://doi.org/10.1038/srep28334, 2016.
Pasik, A., Gruber, A., Preimesberger, W., De Santis, D., and Dorigo, W.: Uncertainty estimation for a new exponential-filter-based long-term root-zone soil moisture dataset from Copernicus Climate Change Service (C3S) surface observations, Geosci. Model Dev., 16, 4957–4976, https://doi.org/10.5194/gmd-16-4957-2023, 2023.
Pohlert, T.: trend: Non-Parametric Trend Tests and Change-Point Detection, https://doi.org/10.32614/CRAN.package.trend, 2020.
Preimesberger, W., Stradiotti, P., and Dorigo, W.: ESA CCI Soil Moisture GAPFILLED: an independent global gap-free satellite climate data record with uncertainty estimates, Earth Syst. Sci. Data, 17, 4305–4329, https://doi.org/10.5194/essd-17-4305-2025, 2025.
Preimesberger, W., Lems, J., Hirschi, M., and Dorigo, W. A.: C3S SM PASSIVE Daily Gap-filled Root-Zone Soil Moisture from merged multi-satellite observations (Version v2), TU Wien [data set], https://doi.org/10.48436/9j8ad-z2q11, 2026.
Scherrer, S. C., Hirschi, M., Spirig, C., Maurer, F., and Kotlarski, S.: Trends and drivers of recent summer drying in Switzerland, Environmental Research Communications, 4, 025004, https://doi.org/10.1088/2515-7620/ac4fb9, 2022.
Schumacher, D. L., Zachariah, M., Otto, F., Barnes, C., Philip, S., Kew, S., Vahlberg, M., Singh, R., Heinrich, D., Arrighi, J., van Aalst, M., Hauser, M., Hirschi, M., Bessenbacher, V., Gudmundsson, L., Beaudoing, H. K., Rodell, M., Li, S., Yang, W., Vecchi, G. A., Harrington, L. J., Lehner, F., Balsamo, G., and Seneviratne, S. I.: Detecting the human fingerprint in the summer 2022 western–central European soil drought, Earth Syst. Dynam., 15, 131–154, https://doi.org/10.5194/esd-15-131-2024, 2024.
Sen, P. K.: Estimates of the Regression Coefficient Based on Kendall's Tau, J. Am. Stat. Assoc., 63, 1379–1389, https://doi.org/10.2307/2285891, 1968.
Theil, H.: A rank-invariant method of linear and polynomial regression analysis, Proc. Konink Nederl. Akad. Wetensch. Ser. A Math. Sci., 53, 386–392 (part I), 521–525 (part II), 1397–1412 (part III), 1950.
Tuszynski, J.: caTools: Tools: Moving Window Statistics, GIF, Base64, ROC AUC, etc., https://doi.org/10.32614/CRAN.package.caTools, 2021.
Wagner, W., Lemoine, G., and Rott, H.: A method for estimating soil moisture from ERS scatterometer and soil data, Remote Sens. Environ., 70, 191–207, https://doi.org/10.1016/S0034-4257(99)00036-X, 1999.
- Abstract
- Introduction
- Data and methods
- Application of SwissSMEX for investigating summer soil moisture anomalies and trends
- Data availability
- Summary and conclusion
- Appendix A
- Appendix B: Temporal robustness of trend
- Author contributions
- Competing interests
- Disclaimer
- Acknowledgements
- Financial support
- Review statement
- References
- Supplement
- Abstract
- Introduction
- Data and methods
- Application of SwissSMEX for investigating summer soil moisture anomalies and trends
- Data availability
- Summary and conclusion
- Appendix A
- Appendix B: Temporal robustness of trend
- Author contributions
- Competing interests
- Disclaimer
- Acknowledgements
- Financial support
- Review statement
- References
- Supplement