the Creative Commons Attribution 4.0 License.
the Creative Commons Attribution 4.0 License.
 | 16 Dec 2025
Two centuries of oceanographic data in the Indonesian Seas and surroundings: historical patterns of data availability, gaps, and future challenges
Ghelby M. Faid
Wang Zheng
Li Rui
Mohd. Fadzil Akhir
Weidong Yu
Rangga A. Mulya
Fadli Syamsudin
Ibnu Faizal
Buntora Pasaribu
Teguh Agustiadi
Bayu Priyono
Muhammad Fadli
Priyadi D. Santoso
Wahyu W. Pandoe
Huiwu Wang
Shujiang Li
Zexun Wei
R. Dwi Susanto
Dwiyoga Nugroho
Adi Purwandana
The Indonesian Seas and Surroundings (ISS) play an important role in global ocean circulation by connecting the Pacific and Indian Oceans via the global thermohaline circulation. This region regulates the exchange of water mass, heat, salinity, and biogeochemical elements, further influencing the global climate and carbon cycle. Consequently, in this region, extensive observations and surveys, particularly the in-situ measurements, have been conducted in this region over the past two centuries. This study analyzed over 461 865 oceanographic casts from multiple international repositories, with 360 409 casts, or 21.97 % rejection, after rigorous quality control. The results show that data collection was sparse and temporally limited before the early 19th century, with a marked increase beginning in the mid-20th century. Spatially, observations are heavily concentrated along major international shipping routes, including the Makassar Strait, Malacca Strait, and South China Seas, while vast areas, such as the Halmahera Sea, Timor Sea, Java Sea, and Sulawesi Sea, remain poorly detected. Temperature and salinity are the most collected data, whereas deep-sea observations, particularly below 800 m, are critically lacking, with limited measurements of essential ocean variables such as dissolved oxygen, nutrients, and currents. Additionally, coastal regions exhibit substantial data deficiencies. Given the region's complex ocean-atmosphere interactions and unique topographic features, the current observational coverage remains insufficient to resolve the uncertainties in Indonesian Throughflow (ITF) variability, ocean heat transport, and monsoon forecasting. This study proposes to address the gaps by deploying autonomous monitoring technologies (Argo floats, gliders, moored buoys) in deep-sea and coastal regions, expanding regional observational networks, and enhancing executable data-sharing mechanisms. The raw datasets can be accessed freely from the website provided in the text, and processed datasets are preserved in data repositories with a corresponding assigned DOI. Final datasets and the computed cast per half-degree grid square with Python syntax are freely available on Mendeley repository. The data were in the TXT file format, and we used Ocean Data View Software (ODV Ver. 5.7.2), Python, and QGIS Software to process, visualize, and analyze the data (https://doi.org/10.17632/nm5txj3fps.1, Purba et al., 2025b.
- Article
(16903 KB) - Full-text XML
-
Supplement
(366 KB) - BibTeX
- EndNote


The Indonesian Seas and Surroundings (ISS) is one of the complex systems with unique oceanographic characteristics (Burnett et al., 2000; Susanto et al., 2010; Wijffels et al., 2008). This region is the only one at the low latitude where two oceanic basins (the Pacific and Indian Oceans) connect and interact (Hu and Sprintall, 2017; Tillinger and Gordon, 2009). Given its unique position, the ISS plays a key role in regulating and distributing heat and salinity through the Indonesian Throughflow (ITF) and monsoon currents (Bouruet-Aubertot et al., 2018; Feng et al., 2018). This tropical region is also profoundly affected by climatic factors, including the El Niño–Southern Oscillation (ENSO), the Indian Ocean Dipole (IOD), and seasonal monsoon patterns (Duan et al., 2023; Garternicht and Schott, 1997; Qian et al., 2010). These modes of variability influence weather and regional climate via air-sea interactions and significantly affect marine biodiversity and fisheries (Khan et al., 2024; Wisetya Dewi et al., 2020). This region is also part of the Coral Triangle, a biodiversity hotspot that supports extensive coral reef ecosystems, serves as a critical migratory route for numerous fish species, and plays a vital role in regional and global marine biodiversity (Gusviga et al., 2021; Purba et al., 2025c). However, despite the critical importance of the ISS in regulating the global ocean and climate, the data collection in this region remains inconsistent, with significant data gaps in spatial and temporal scales. In the context of ongoing climate change, understanding the dynamics of the ISS is increasingly crucial (Makarim et al., 2019). The scarcity of observations in critical regions, including the ISS, results in limitations in the evaluation and refinement of coupled climate models, resulting in greater uncertainty in the representation of regional processes and reducing confidence in projections for these areas (Faizal et al., 2021; Freeman et al., 2019; von Schuckmann et al., 2020; Vance et al., 2019).
In the era of satellite technology, previous studies demonstrated that direct in-situ measurement using instruments is still the most reliable method to observe ocean conditions, with the advantage of interior sampling capacity and high-precision data (Buck et al., 2019; Zweng et al., 2018). In recent decades, in situ measurements have increased exponentially, greatly enhancing our ability to monitor oceanic changes (Liu et al., 2017; Roemmich et al., 2019). Various platforms, such as Conductivity Temperature and Depth (CTD) profilers, moorings, and Argo floats, can gather continuous, long-term datasets at great depths from the surface to the deep sea, capturing the vertical structure of the ocean (Whitt et al., 2020; Woo and Pattiaratchi, 2010). Furthermore, the integrated global ocean observation system has taken the strength of in-situ and satellite technology and has been highlighted and emphasized as important (Garzoli et al., 2010; Weller et al., 2019). Despite its accuracy, the main limitation of in-situ data is its sparse and uneven coverage both in temporal and spatial scales. Due to these limitations, analyzing ocean conditions in terms of climate change is challenging, particularly in archipelagic countries and the deep ocean (Beal et al., 2019). To support data collection, several global portals provide freely available oceanographic data, including the World Ocean Database (WOD), which offers comprehensive temperature, salinity, and oxygen profiles. Another global program is the Copernicus Marine Environment Monitoring Service (CMEMS), which provides simulation, reanalysis, and real-time ocean data.
Furthermore, the Argo program, which gathers temperature and salinity data from ocean profiling floats, and the Global Ocean Observing System (GOOS), which integrates data from a variety of oceanographic sources (Bax et al., 2018; Boyer et al., 2018a; Schuckmann et al., 2019). Recently, as part of the UN Ocean Decade Programmes, there have been actions to increase community resilience by enhancing various early warning services for all communities on multi-ocean hazards. The goal is to send these warnings almost instantly or in real-time. The information required for this multi-hazard early warning service (MHEWS) includes geophysical, ecological, biological, weather, climate, and anthropogenic-related ocean and coastal hazards (Pandoe et al., 2024). Meanwhile, various institutions, including universities, research centres, private companies, and other stakeholders, collect and store oceanographic data in a specific database. However, the regulatory frameworks and administrative procedures frequently obstruct access to this information.
This study advances prior research by systematically compiling two centuries of in-situ observations, identifying critical spatial and vertical data gaps, and assessing the implications for climate modelling. Unlike past efforts, we quantify the rejection rates of different datasets, analyze international contributions to ISS data collection, and highlight the disproportionate underrepresentation of local research efforts. This study investigates how spatial and temporal data gaps in the Indonesian Seas impact our understanding of regional ocean dynamics and global climate models. We hypothesize that the uneven distribution of in-situ observations, particularly in deep-sea regions, coastal regions, and ITF pathways, introduces significant uncertainties in ocean heat transport assessments, climate change projections, and regional fisheries management strategies. The output of this result will align with the UN Ocean Decade (2021–2030) and Sustainable Development Goals (SDGs 13 and 14) for the blue economy (Rayner et al., 2019).
2.1 Geographic characteristics
ISS is situated in the equatorial region where dynamic interactions between oceanographic, terrestrial, and atmospheric phenomena occur (Lan et al., 2009; Wang et al., 2017). In this paper, the ISS refers to the region spanning from 15° N to 15° S and 90 to 140° E. The water depth across this region exhibits significant variation, where Karimata Strait and Java Seas are characterized by shallow water (<100 m), monsoonal currents, and strong tides effect (Katavouta et al., 2022; Lana et al., 2017), while the deep region goes up to 6000 m such as in the Banda Sea, the surrounding Indian Ocean and the Pacific Ocean. Due to differences in sea level, the water mass flow from the Pacific to the Indian Ocean via the Indonesian Seas has three branches: eastern throughflow via the Makassar Strait, Maluku Seas, and western throughflow through the Karimata Strait (Putriani et al., 2019; Susanto et al., 2010). The water mass in the ISS predominantly comes from the Pacific, including the South Pacific Subtropical Water (SPSW), the North Pacific Intermediate Water (NPIW), and South Pacific Intermediate Water (SPIW) (Coatanoan et al., 1999; Li et al., 2021). While in the deep southern ISS water, the Antarctic Bottom Water (ABW) flows to the equatorial region near the Savu Seas and surroundings. On the other hand, the mixing processes in the ISS are strongly influenced by monsoonal winds, tidal forces, and internal waves (Atmadipoera and Suteja, 2018). The seasonal monsoons, driven by differential heating between the Asian and Australian continents, generate reversing wind patterns that control surface circulation and upwelling events (Moore et al., 2003) (Fig. 1).
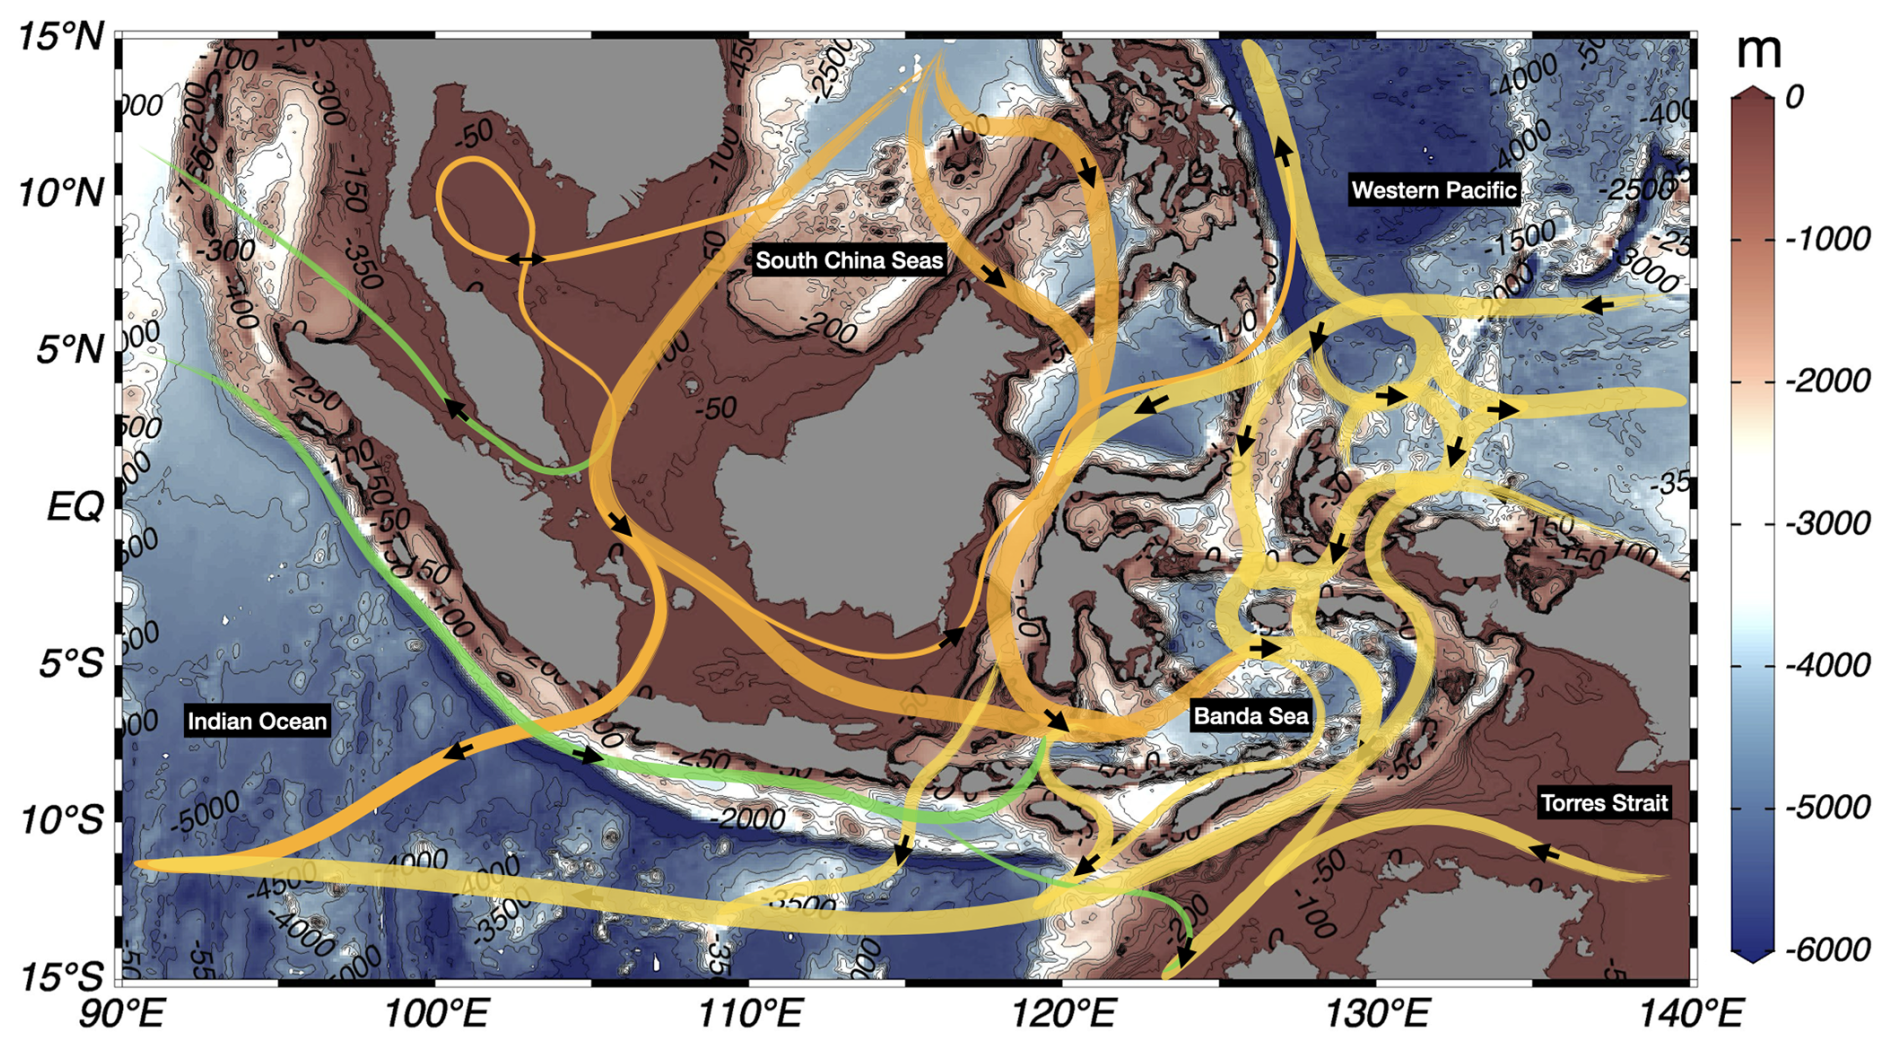
Figure 1A map of Indonesian seas and surroundings (bathymetric derived from https://www.gebco.net/, last access: 2 June 2025). Schematic general circulation is presented with lines and adopted from previous findings (Burnett et al., 2000; Gordon, 2005; Shinoda et al., 2012; Susanto et al., 2010). Yellow lines represent water mass from the Pacific Ocean, orange lines represent water mass from the South China Sea (SCS) through the Karimata Strait, and green lines represent water mass from the Indian Ocean.
Beyond the ITF, circulation patterns in the Indonesian seas are significantly affected by monsoonal winds, tidal forces, and large-scale climate phenomena such as the El Niño–Southern Oscillation (ENSO) and the Indian Ocean Dipole (IOD) (Heryati et al., 2018; Horhoruw et al., 2020; Johari et al., 2021). During the boreal summer monsoon (June–September), strong southeasterly winds enhance the ITF transport, driving water southward into the Indian Ocean. Conversely, in the boreal winter monsoon (December–March), shifts in wind patterns allow water from the South China Sea to flow into the Indonesian seas, temporarily altering the strength of the ITF. These seasonal variations influence coastal upwelling processes, particularly along the southern coasts of Java and Sumatra, which contribute to increased marine productivity (Iskandar et al., 2017; Purba et al., 2025c; Sidik et al., 2025). In addition to monsoonal influences, regional circulations play a vital role in shaping the hydrodynamics of the Indonesian seas. The South China Sea exchanges water with the Indonesian seas through the Karimata and Malacca Straits, affecting salinity and temperature distributions (Duan et al., 2023; Idris et al., 2020; Moore et al., 2003). The Torres Strait, located between Australia and Papua New Guinea, facilitates water exchange between the Arafura Sea and the Coral Sea, further impacting the broader circulation system. These complex interactions underscore the Indonesian seas as a highly dynamic environment where multiple oceanic and atmospheric processes converge.
2.2 Data sources
A comprehensive inventory of oceanographic data sources since the 18th century is essential for understanding the variability and long-term trends in the ISS regions. Various international and national programs have contributed to collecting key oceanographic parameters, including temperature, salinity, pH, dissolved oxygen, chlorophyll a, and nutrients (nitrate and nitrite), using diverse observational platforms. Fortunately, several global open repositories provide open access to the in situ dataset for this study (Table 1). While direct access to national government and institutional data were not available at this stage, we utilized reliable open-source data and look forward to potential future collaborations with various research institutions, particularly in Indonesia, to improve oceanographic data recording in the regions. However, several valuable datasets websites from the Indonesian National Oceanographic Data Centre (NODC) and the National Scientific Repository (Repositori Ilmiah Nasional: RIN) can be accessed freely, although the data are not yet available. Also, the data from BRIN comes from various oceanographic data surveys from 1991 to the present, which were also available. Additional data from the Padjadjaran Oceanic Data Centre (PODC), hosted by Universitas Padjadjaran, provides essential oceanographic data relevant to the region. Furthermore, we also searched for data or metadata that had already been published online on the official government website. These dataset sources provide in-situ data on physical, chemical, and biological oceanographic parameters, allowing for mapping oceanographic conditions and enhancing our understanding of dynamic processes in Indonesian waters (https://doi.org/10.17632/fnn6tsjckn.1, Purba et al., 2025d).
Table 1List of datasets, parameters, and sources of data.
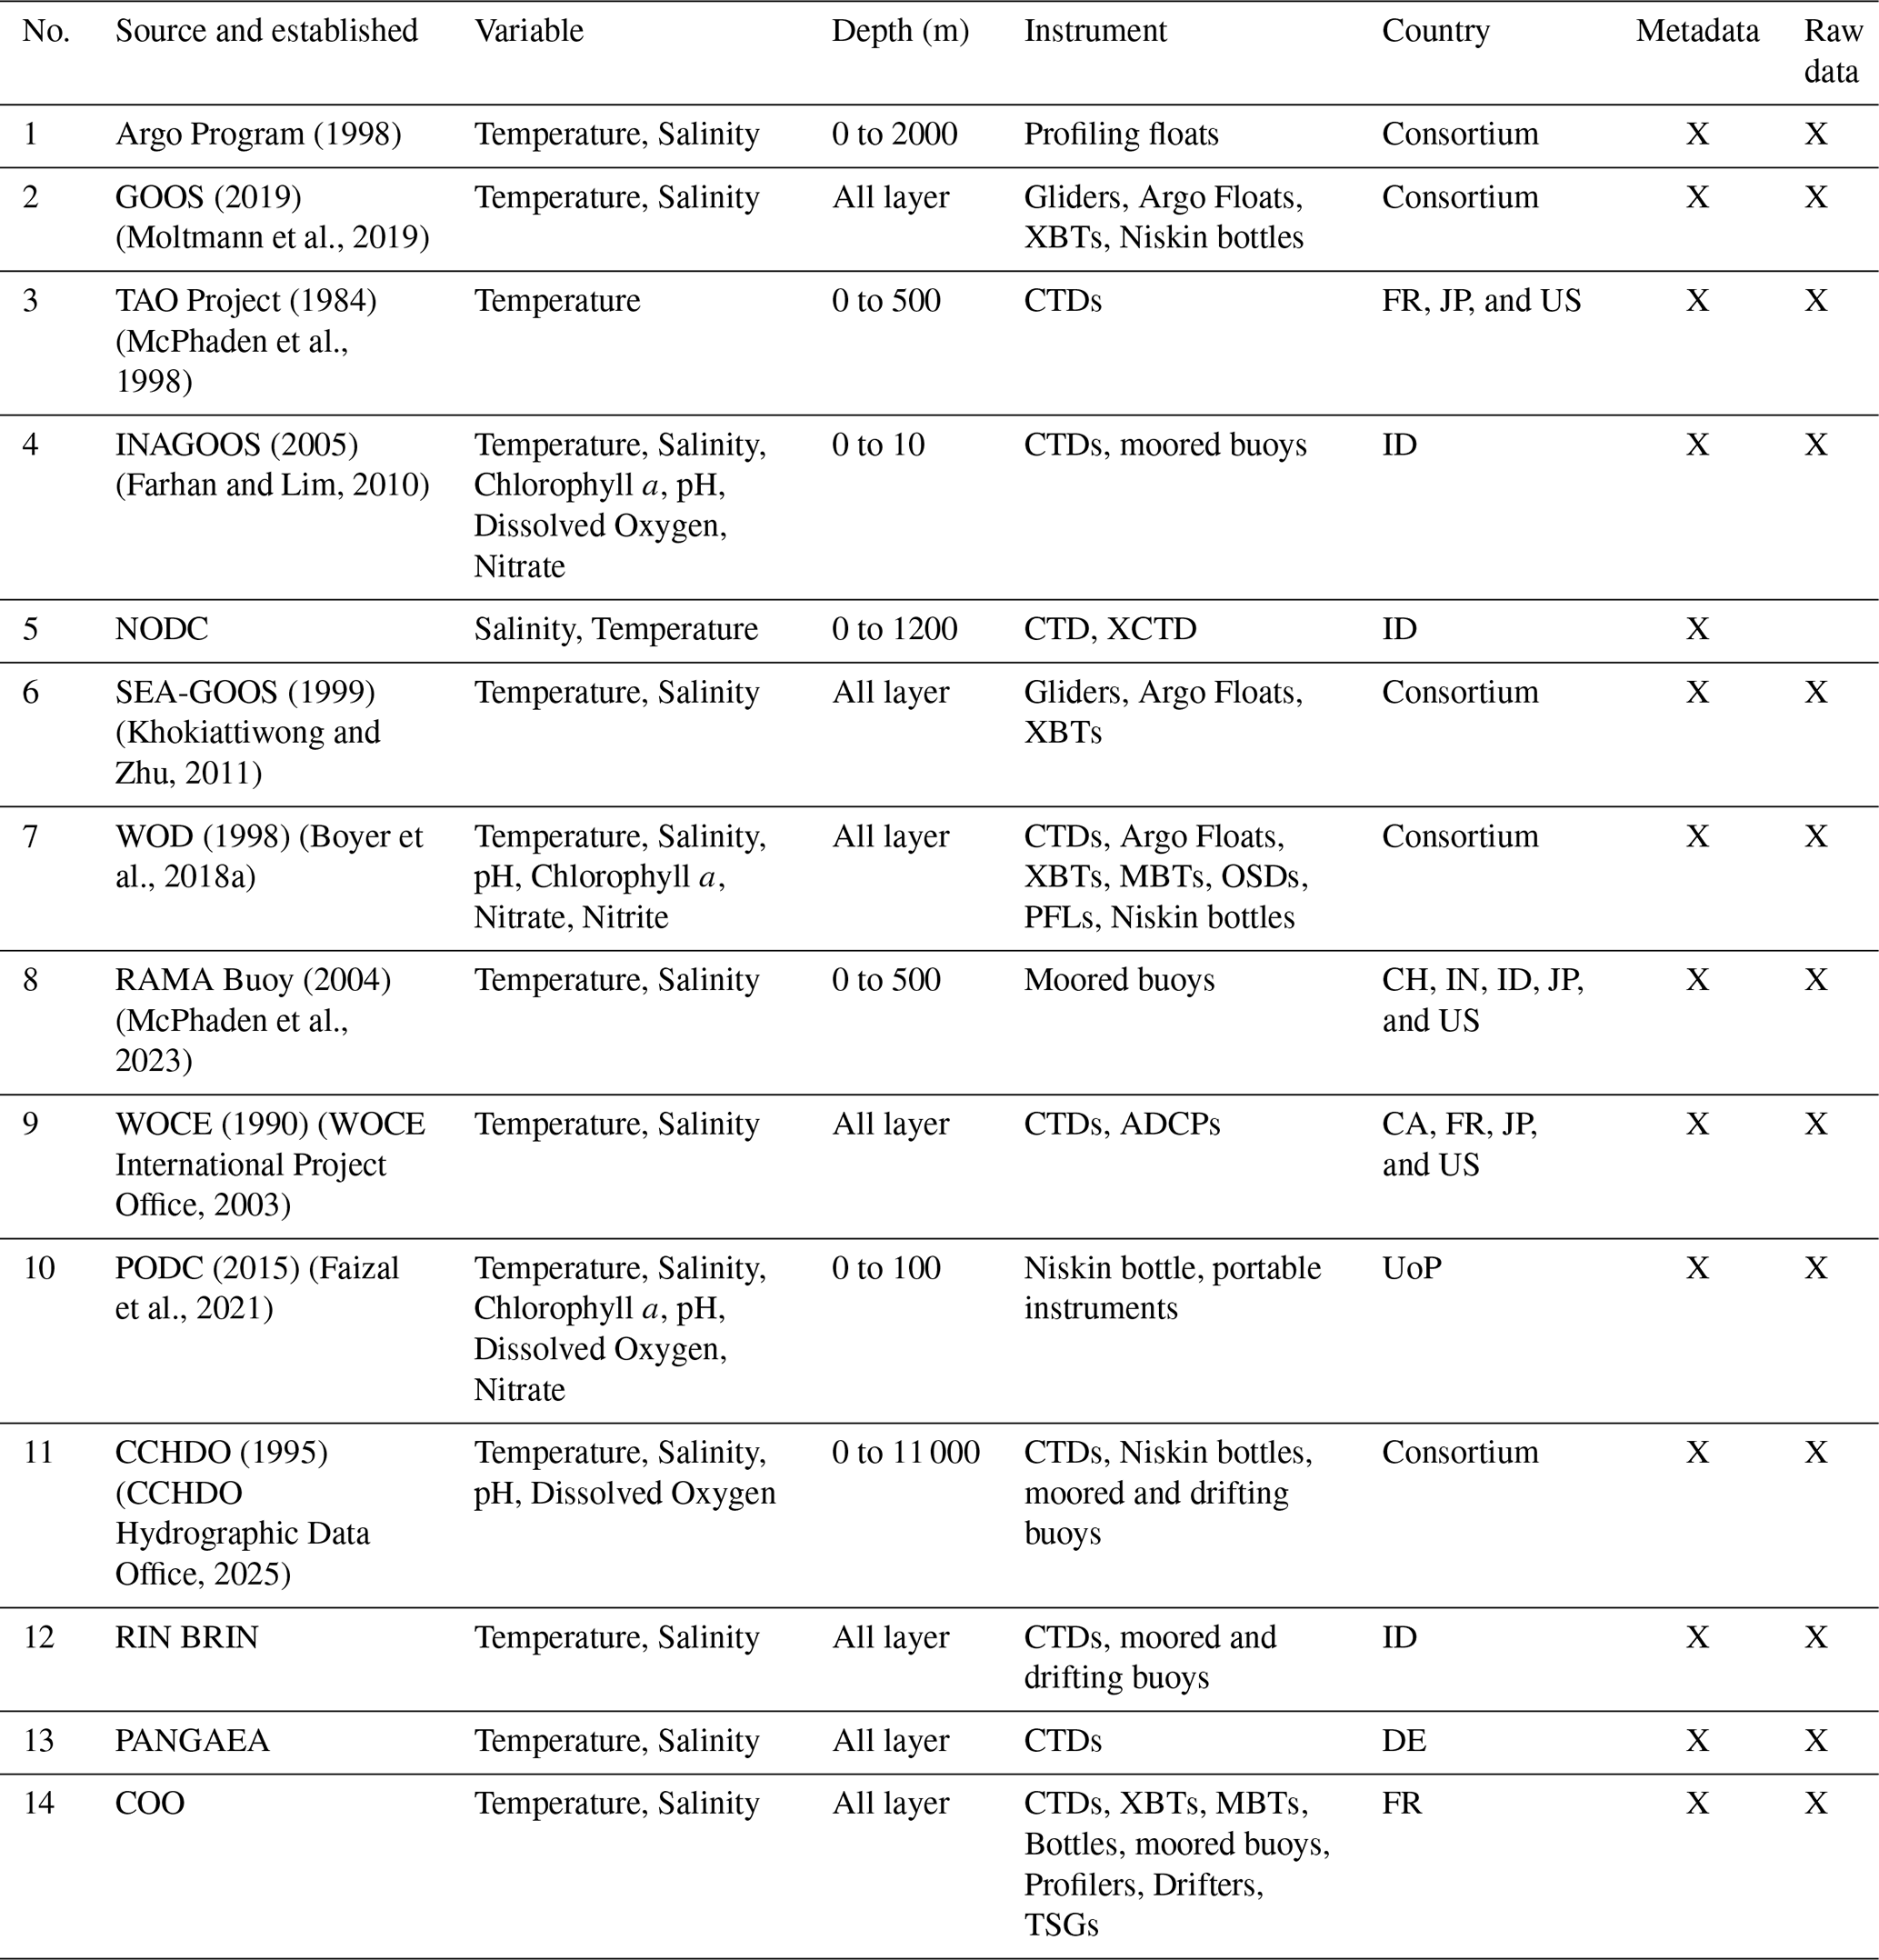
CH, FR, ID, IN, JP, and US stand for China, France, Indonesia, India, Japan, the United States of America, and UoP for the University of Padjadjaran. The technical names follow the standard rule: XBT represents the Expendable Bathythermograph, CTD represents the Conductivity-Temperature-Depth profiler, and MBT represents the Mechanical Bathythermograph.
In detail, some key global projects and initiatives focus on measuring in-situ data in the ISS, such as the Argo Program (https://argo.ucsd.edu, last access: 17 August 2025), Global Ocean Observing System (GOOS) (https://goosocean.org, last access: 17 August 2025), Tropical Atmosphere Ocean (TAO) Project (https://tao.ndbc.noaa.gov, last access: 17 August 2025), Indonesian Global Ocean Observing System (INAGOOS), Indian Ocean Global Ocean Observing System (IOGOOS), and Southeast Asian Global Ocean Observing System (SEA-GOOS) (https://goosocean.org, last access: 21 August 2025). The Argo Program is an initiative that deploys a global network of profiling floats to collect data on ocean conditions, including temperature, salinity, and some chemical and biogeochemical parameters from the surface to 2000 m depth. Argo floats are deployed in the outer ISS waters, contributing to understanding ocean dynamics in the region. Meanwhile, GOOS is a permanent global system for observations, modelling, and analysis of marine and ocean variables to support operational ocean services worldwide. Indonesia participates in GOOS through regional alliances and contributes data from its waters to the global system. The TAO project and its Western Pacific counterpart, TRITON (https://www.jamstec.go.jp/jamstec/TRITON/real_time/, last access: 21 August 2025), maintain an array of moored buoys in the tropical Pacific Ocean, measuring surface meteorological variables and oceanographic variables. The SEA-GOOS is a regional alliance under GOOS focusing on Southeast Asian waters, including Indonesia. It aims to enhance the region's ocean observations and data-sharing capacity. Indonesia is a key participant, contributing to and benefiting from regional oceanographic data. Other data used in this paper were from the World Ocean Database 2018 updated (WOD-18, https://www.ncei.noaa.gov/products/world-ocean-database, last access: 21 August 2025) by the National Centers for Environmental Information (NCEI), RAMA Array (https://www.pmel.noaa.gov/gtmba/pmel-theme/indian-ocean-rama, last access: 21 August 2025) by the Pacific Marine Environmental Laboratory (PMEL) of NOAA, The Hydrographic Program of the World Ocean Circulation Experiment (WOCE, https://ewoce.org/data/index.html, last access: 25 August 2025), CLIVAR and Carbon Hydrographic Data Office (CCHDO: https://cchdo.ucsd.edu/, last access: 25 August 2025), PANGEAE (https://www.pangaea.de/, last access: 25 August 2025), and Coriolis Operational Oceanography (https://www.coriolis.eu.org/, last access: 25 August 2025).
2.3 Data filtering
Most of the information provided is still in its raw form, and comprehensive screening was carried out to ensure there were no duplicates, outliers, or biased data. Duplicate data can exist due to repetition of data input, use of the same source by various data providers, and errors during data input. All data were carefully compared, and the duplicates were determined based on key identifiers: ID, latitude and longitude, cruise name, and timestamps. Data with similarities in these criteria resulted in the same actual values; thus, it was labelled duplicate data and deleted. It is necessary to eliminate all data with errors, such as inconsistent measurements or errors in measuring devices. The data were downloaded and imported into Ocean Data View (ODV ver. 5.7.2) (Schlitzer, 2024) to detect duplicate data, remove biased data, and show the results. The removed temperature and salinity data were those outside Indonesian waters' characteristics, specifically the temperature range of −2 to 35 °C and the salinity range of 20 to 40 PSU, respectively (Purba et al., 2021; Webb, 2021). The typical pH range in the Indonesian seas generally falls between 5 and 9. The concentration of dissolved oxygen (DO) typically varies between 3 and 8 mg L−1 (milligrams per litre). Nitrate concentrations usually range from 0.5 to 20 µmol L−1 (Valdany et al., 2022). Other temperatures and salinity data are all obtained from the WOD-18, so filtering was carried out based on quality flag 0 (accepted value) on the WOD dataset to filter out error data. The weighted-average gridding interpolation method was used in scalar values, and corrections were done according to NCEI Guidance and correction schemes (http://www. nodc.noaa.gov/OC5/XBT_BIAS/xbt_bias.html, last access: 25 August 2025).
The initial screening showed that the dataset comprises 461 865 casts from various oceanographic sources, of which 360 409 casts remained after screening, resulting in an overall 21.97 % rejection rate. The highest rejection rate is observed in WOD XBT (45.36%), followed by Argo Float (19.88 %) and EWOCE (13.20 %). This result indicates significant data filtering for these sources. In contrast, datasets such as WOD OSD (0.09 %), WOD MBT (0.02 %), and WOD CTD (0.03 %) experienced minimal data rejection. Notably, data from Rama Buoy, NANO-DOAP, and TOA Buoy remained intact, with 0.00 % rejection. Other datasets, including PODC (7.71 %), PANGEAE (4.82 %), and CCHDO (3.15 %), had moderate rejection rates. These variations reflect differences in data quality across sources, with some requiring substantial filtering while others maintained high data integrity.
The high rejection rate of WOD XBT (45.36 %) is likely due to several factors related to data quality and instrument limitations. XBTs (Expendable Bathythermographs) estimate depth using a fall-rate equation rather than direct measurement, which can introduce errors due to variations in probe type, water temperature, and deployment conditions. Additionally, many XBT datasets originate from historical observations, some of which may not meet modern quality standards, leading to more rejected profiles. Unlike CTDs, XBTs do not measure salinity or pressure, making their data less comprehensive and more prone to exclusion if supporting parameters are missing. Since commercial vessels frequently deploy XBTs, operational issues such as improper probe deployment, variations in ship speed, or incorrect metadata can further compromise data reliability. Lastly, the WOD-18 applies strict screening procedures to eliminate duplicates, outliers, and spurious values, and given the inherent accuracy limitations of XBTs, a significant portion of the data is filtered out during quality control (Table 2).
Table 2Summary of oceanographic datasets used in this study, including the number of casts before and after data screening and the rejection rate for each dataset.
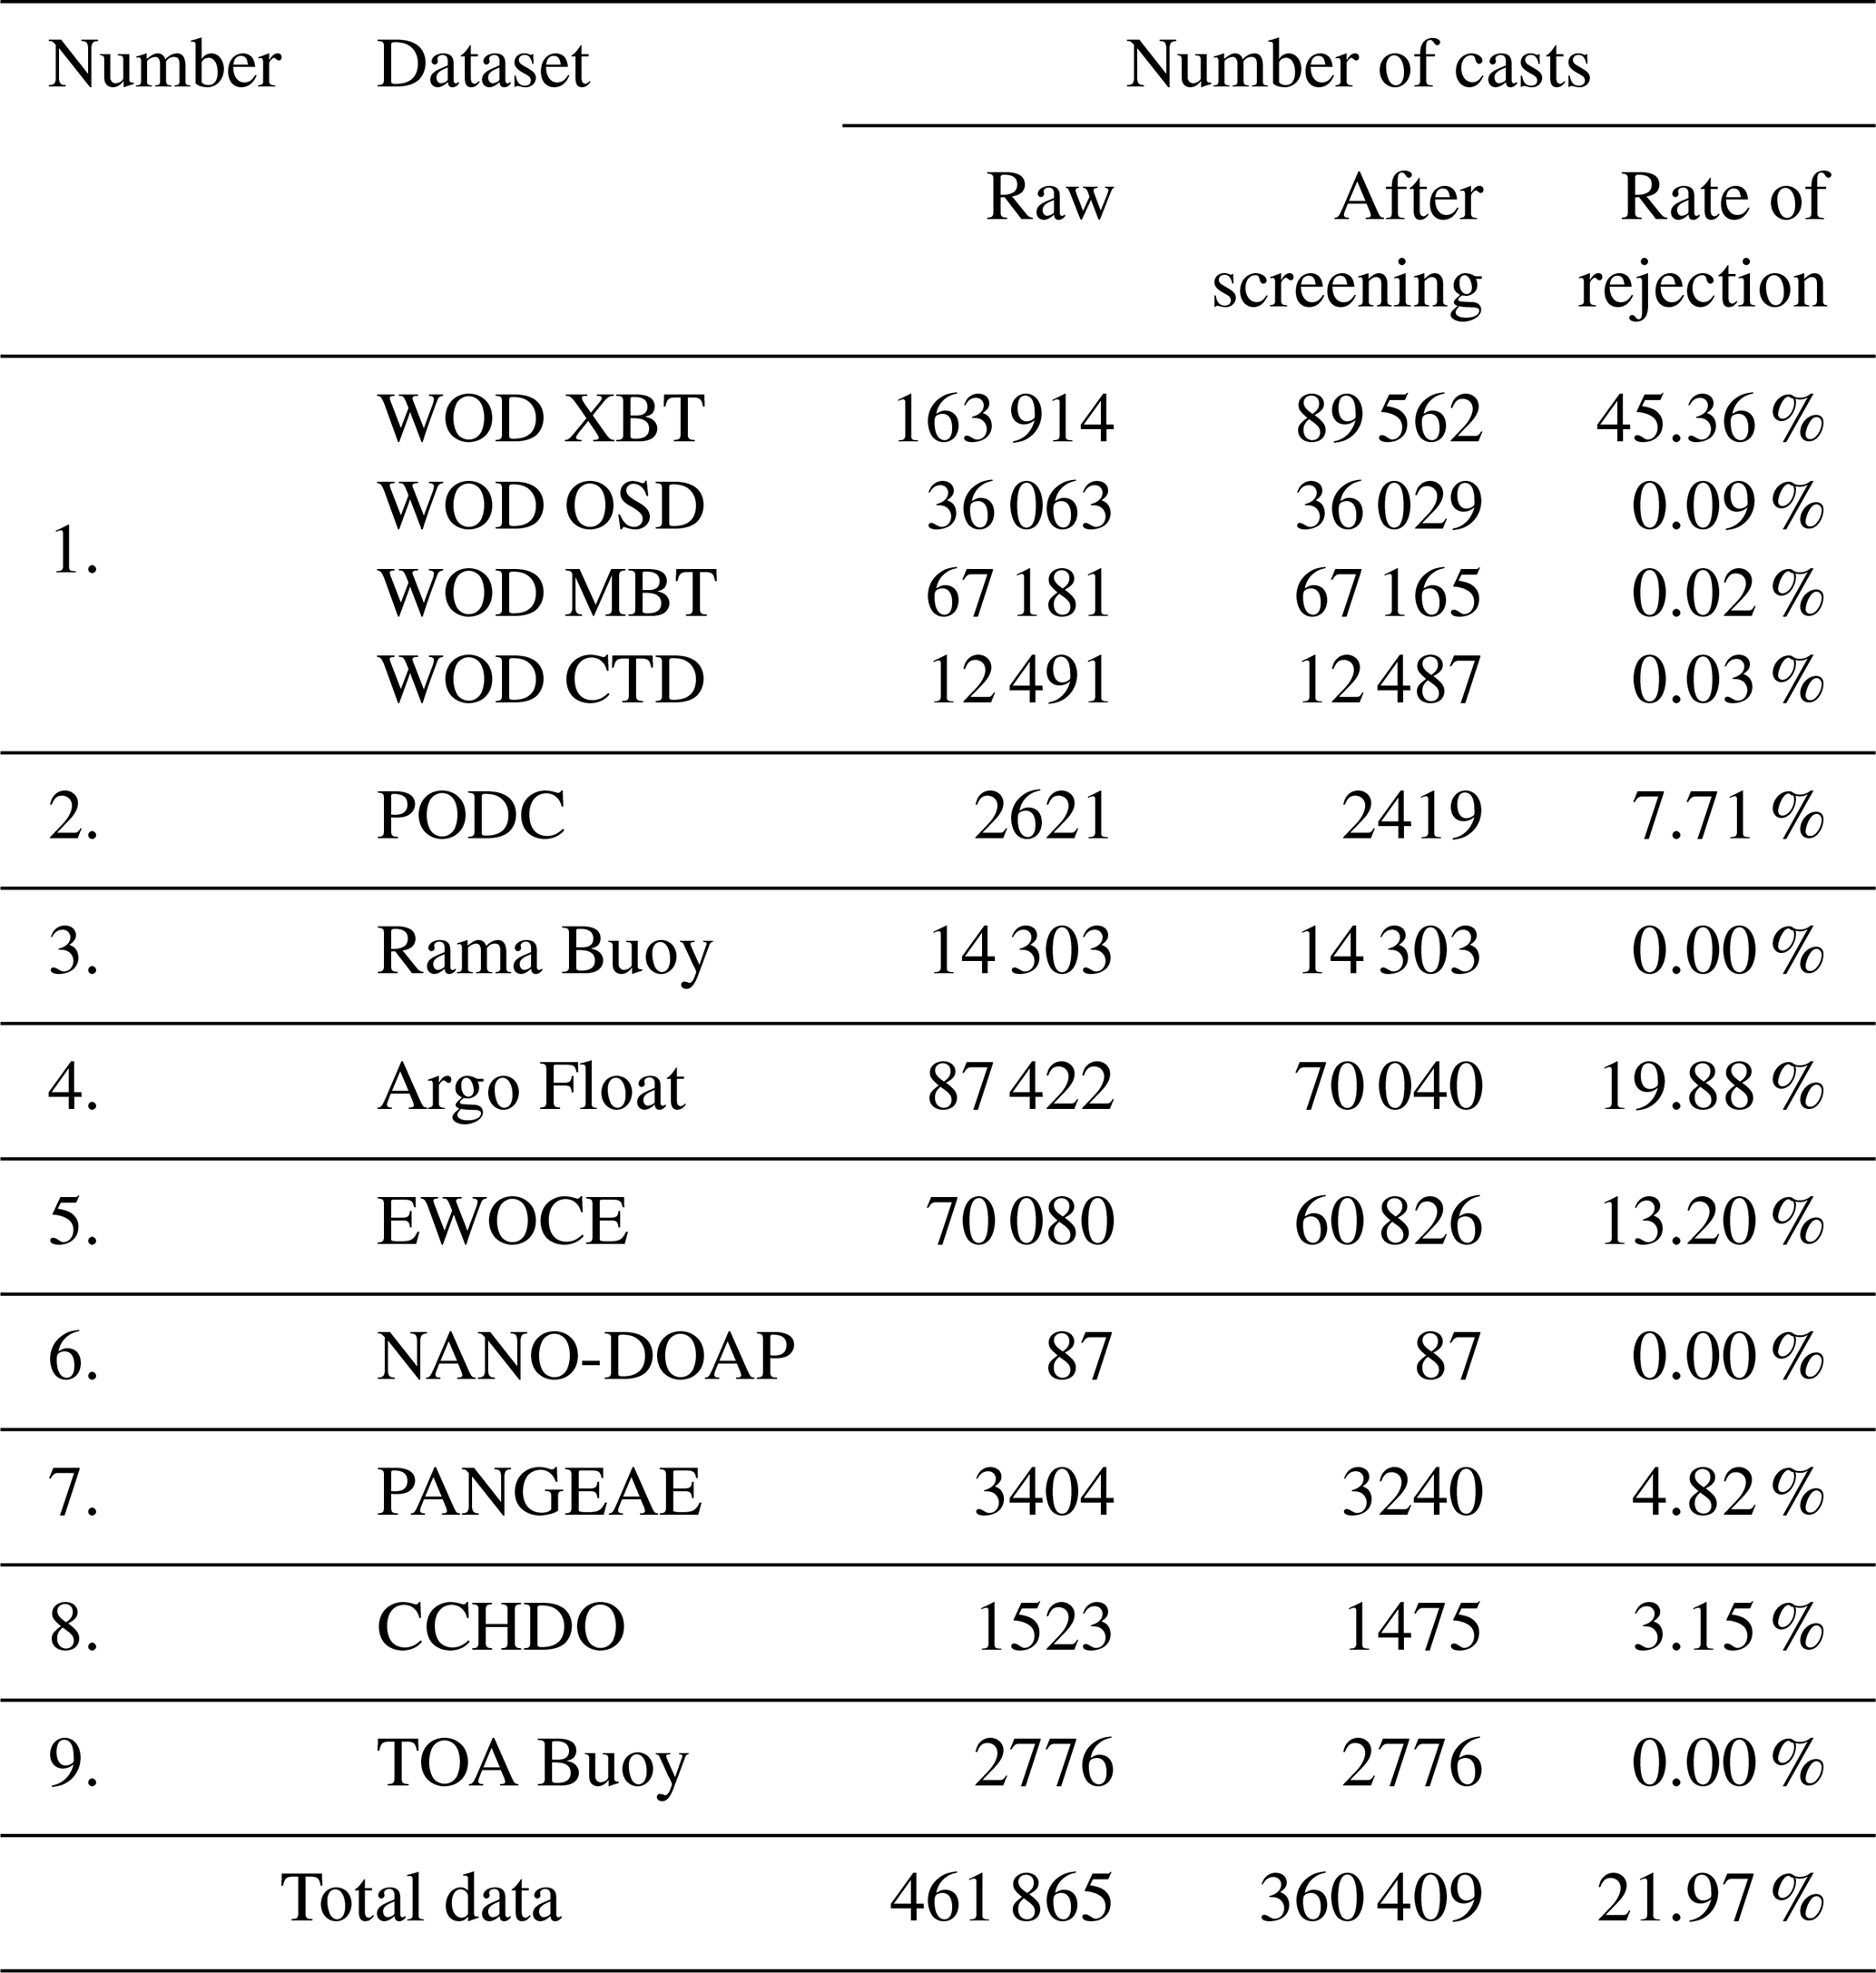
XBT = Expendable Bathythermographs; CTD = Conductivity, Temperature, and Depth Profiler; OSD = Ocean Station Data; MBT = Mechanical Bathythermographs.
The WOD-18 contributes significantly, with its subcategories including XBT, OSD, MBT, and CTD. Among these, the WOD XBT dataset, with 163 914 raw casts and 89 562 after screening, represents the most considerable contribution, followed by the WOD MBT, which shows only a minimal reduction after screening (67 181 raw to 67 165 screened). Other key datasets include the Argo Float data, with 87 422 raw casts, of which 70 040 were retained after screening, and the EWOCE dataset, which contains 70 080 raw casts, reduced to 60 826 after screening. In comparison, smaller datasets such as the PANGEA, NANO-DOAP, and CCHDO represent more specific collections but are still critical to the overall database. Some datasets, like the Rama Buoy, TOA Buoy, and NANO-DOAP, underwent no reduction during the screening process, indicating high-quality, reliable initial data.
2.4 Visualization and data analysis
After filtering, the data were visualized to understand the spatial and temporal patterns of the collected oceanographic parameters. The collected data were analysed across different oceanic regions, including the Pacific Ocean, Indian Ocean, Malacca Strait, Natuna Sea, South China Sea, Makassar Strait, Java Sea, and Banda Sea. This regional approach helped to identify spatial and vertical data distribution, including parameter changes in oceanographic conditions, contributing to a better understanding of data in the ISS region. Visualization was carried out in three forms: surface profiles, vertical profiles, and graphs representing a country's contribution to oceanographic data collection. Surface profiles were generated to illustrate the spatial distribution of oceanographic parameters across different seasons and years, helping to identify gaps in data and future research. Additionally, vertical sections were constructed to analyze subsurface data, particularly in the Indonesian Throughflow (ITF) pathways, such as the Makassar Strait, Lombok Strait, Ombai Strait, and Timor Passage. These profiles provided insights into the existing data, revealing significant gaps in deep-sea measurements, particularly in the water column. We generated graphs categorizing observations by country ID and instrument type to evaluate international contributions to ISS oceanographic data. All visualizations were created using Ocean Data View (ODV) version 5.7.2 and Python-based geospatial libraries, enabling high-resolution spatial mapping and time-series analysis.
We used Kernel Density Estimation (KDE) to estimate the probability density function (PDF) of a continuous random variable. This method works by placing a kernel function on each data point. These kernels are then summed to produce a continuous density curve representing the underlying data distribution. The smoothness of the KDE output depends on the bandwidth parameter, which controls how much each data point influences the overall density estimate. A larger bandwidth results in a smoother distribution, while a smaller bandwidth retains more details but may introduce noise.
where: fx = estimated probability density function (PDF) at point x; n = number of data points; h = bandwidth (smoothing parameter); K = kernel function; xi = observed data points. The kernel function is a smooth function that determines the shape of the contributions from each data point. A common choice is the Gaussian kernel:
The bandwidth h plays a crucial role in KDE, where a small h results in a density estimate that captures more details but may introduce noise (overfitting), and a large h produces a smoother estimate but may obscure important data features (underfitting). Furthermore, the calculation of data density began by creating a grid in the study area with a latitude and longitude coverage in each grid of 0.5°. The grid for which data density was calculated is a grid that completely fits the boundaries of the study area. Meanwhile, grids that did not fully enter the study area were not included in the calculation. The data density in each grid cell was calculated using the following formula:
where: Dij = data density in a specific grid cell (i, j); Nij = number of data points inside that grid cell; A = area of the grid cell.
Since the desired unit is cast per half-degree squares and each grid that has been created is exactly half a degree, then the formula simplifies to:
The data density value in each grid cell is then represented by a centroid located in the middle of each grid cell.
The data density values ??in the study area were further divided into six quantiles to understand more clearly how the data is distributed. The quantile classification was calculated using the following formula:
where: Qk = the actual breakpoints for the six quantiles; F−1 = the inverse Cumulative Distribution Function (CDF) to find out the data values contained in specific cumulative percentiles: = the quantile fraction.
The denominator 6 in the formula above was chosen because the data is divided into six quantiles. The k value has a range from 1 to 5, so it can provide five breakpoints to create six quantiles. To get the quantile distribution, data values were sorted from smallest to largest. Then, the percentile is selected corresponding to: Q1=16.67 % percentile (1/6), Q2=33.33 % percentile (2/6), Q3=50.00 % percentile (3/6, median), Q4=66.67 % percentile (4/6), Q5=83.33 % percentile (5/6). This calculation divides the dataset into six quantiles that have the same number of data points. Empty cells are shown as “Q0 (No Data)” and are not part of the quantile calculation. Thus, the legend on the visualization becomes as follows: Q0 (No Data), Q1, Q2, Q3, Q4, Q5, Q6.
3.1 Summary of data by instruments sampling
In general, expendable instruments such as XBT and MBT are frequently deployed, especially in the SCS region, the Malacca Strait, and from the Sunda Strait to Australia (ALKI 1). Autonomous platforms, such as drifters and profile floats, are more common in deep-ocean regions such as the Banda Seas, west Sumatera, south of Java, and northern Papua. The SCS, Savu Sea, Sulawesi Sea, and Banda Sea are regions with a small number of profile float casts. At the same time, the profile float is lacking in the Malacca Strait, Java Sea, and Arafura Sea (Fig. 2). The highest density of observations is found along major shipping routes (Indonesian Archipelagic Sea Lanes; hereinafter: ALKI), where there are three ALKI lines in Indonesian seas, including the Malacca Strait, SCS to Sunda Strait (ALKI 1), Makassar Strait to Lombok Strait (ALKI 2), Maluku Sea to Savu and Timor Passage via Banda Sea (ALKI 3).
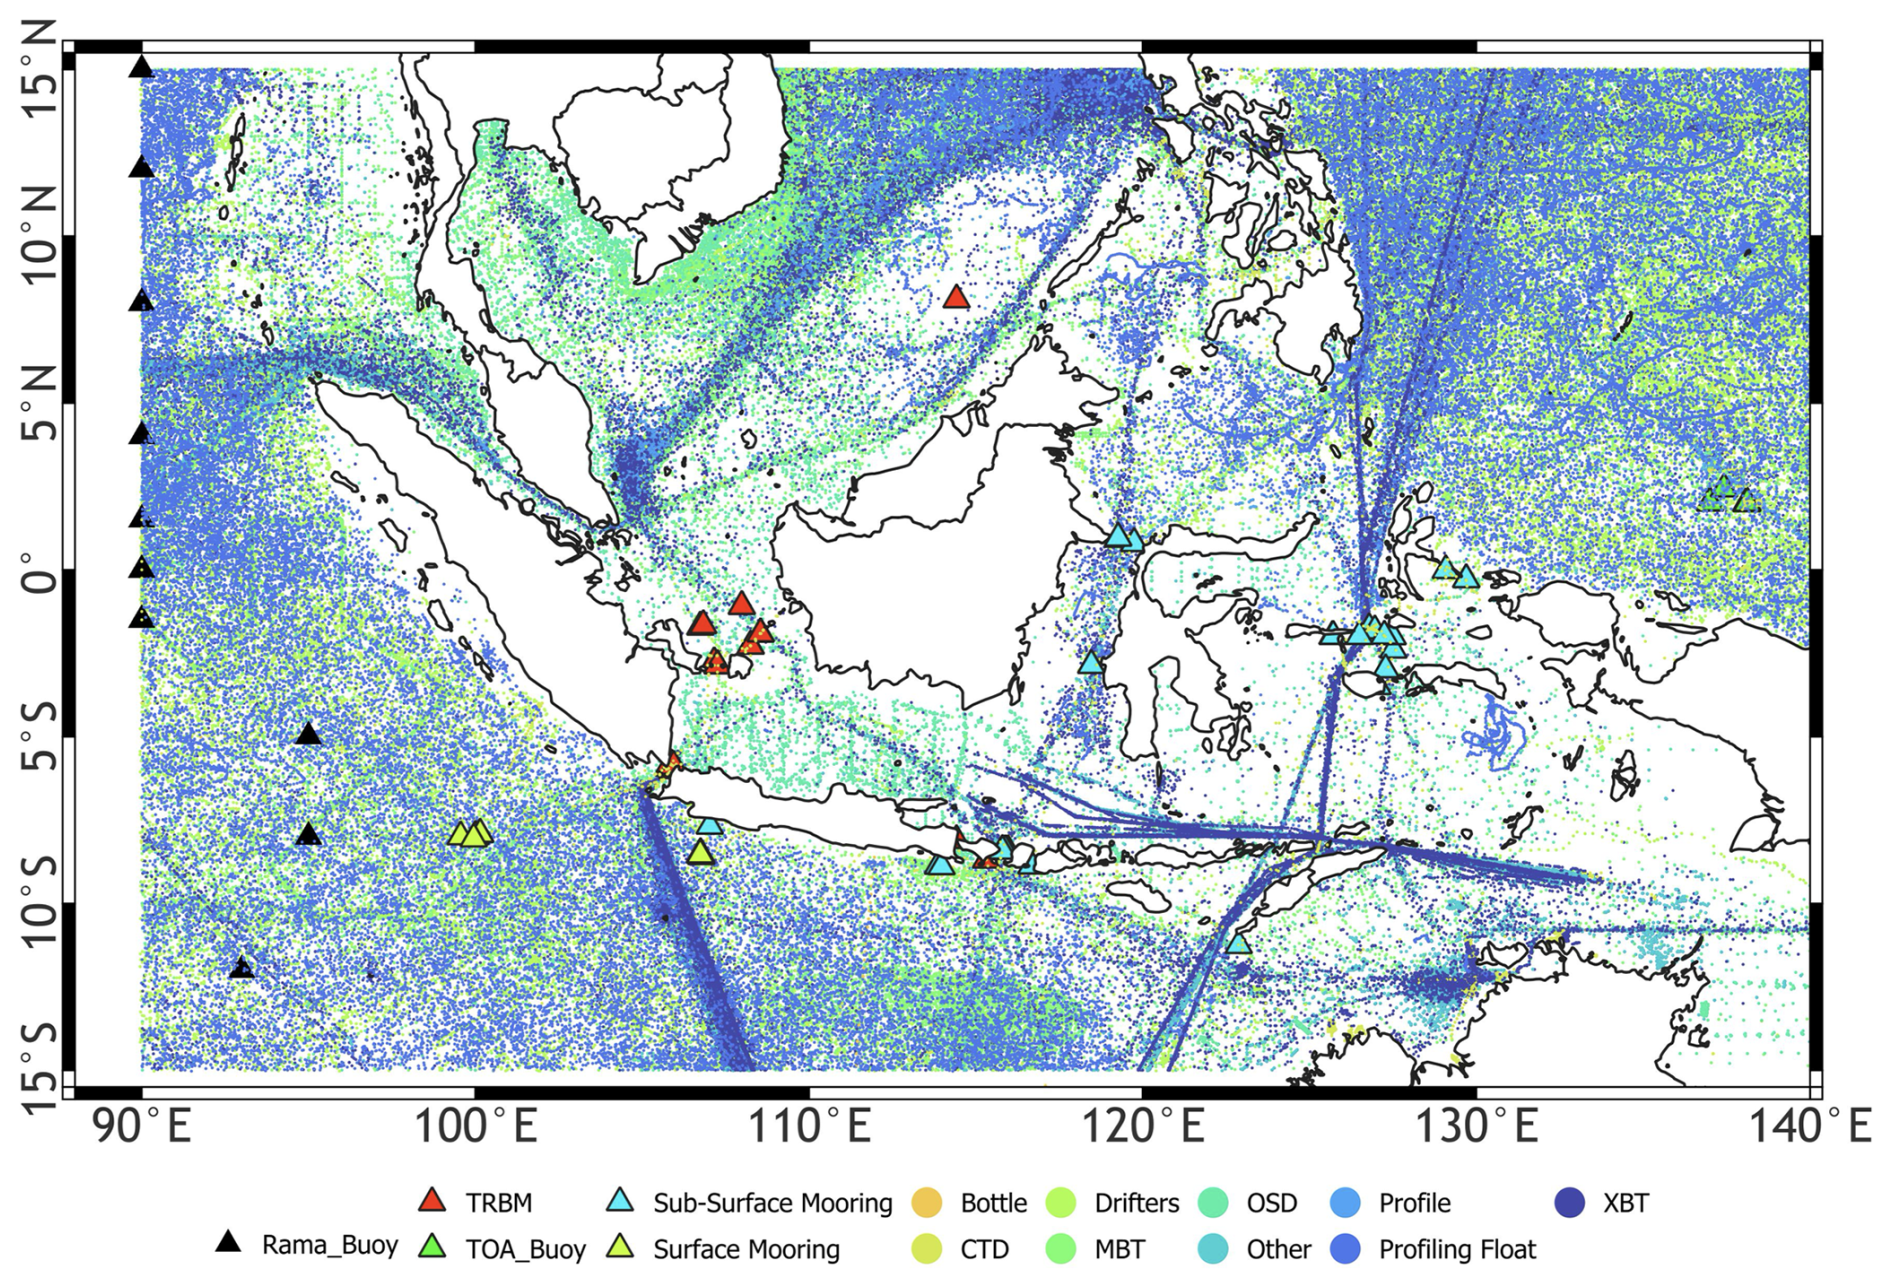
Figure 2Spatial distribution of oceanographic data casts in the ISS region, categorized by different data collection methods. The dataset includes observations from buoys (yellow triangles), bottles (light blue), CTD (orange), OSD (cyan), MBT (red), XBT (light green), drifters (grey), profile floats (magenta), and other sources (dark blue).
The number of cast data from XBT in the Indian Ocean is 36 007, and 16 554 in the Pacific Ocean, with the most dominant location being the area approaching the Philippines. The use of MBT has better coverage in the Indian Ocean, with a total data cast of 23 660, while in the Pacific Ocean is 15 511. The distribution of drifter use in the study area is generally similar to Profile Float, where the instrument is predominantly used to collect data in the Indian and Pacific Oceans. The use of drifters in the Indian Ocean has been recorded with 14 285 data casts, while in the Pacific Ocean is 21 663. Due to the drifter's characteristics of moving with the ocean current, its coverage in the Indian Ocean is almost similar to that of the Profile Float. The SCS, Java Sea, and Banda Sea regions have much less cast drifter data. Then, data collection that falls into the OSD category tends to be mainly carried out in the SCS and Java Sea.
Oceanographic data collection using buoys is only carried out in a small part of the Indian Ocean, especially at longitude 90° E, and a small part of the Pacific Ocean, around 400 km north of Papua. Despite its small coverage, this instrument has recorded 14 334 data casts, with the most significant proportion being in the Pacific Ocean, 14 303, and the remaining 31 in the Indian Ocean. CTD is predominantly used to retrieve oceanographic data in the Pacific Ocean, with the number of data casts being 6017, the second lowest in all categories. Meanwhile, the number of data casts in the Indian Ocean is 3393, the second lowest of all categories. Its distribution in the Pacific and Indian Ocean is relatively even, not concentrated in certain areas. Because CTD has the second-lowest number of data casts among all categories, it fails to cover many water areas, including the Java and Arafura Seas. The number of data casts using bottles is the lowest of all categories. This instrument is only used in the Indian Ocean, the Pacific Ocean, the Makassar Strait, and the Banda Sea. Water areas other than these four areas are not covered at all. The distribution in the Indian Ocean shows only a few data collection transects, with a total of 736 data casts. The same condition is also found in the Pacific Ocean, where the data collection pattern using bottles only shows eight transects with a total of 1290 data casts. The amount of cast bottle data in the Pacific and Indian Oceans is the lowest of all categories.
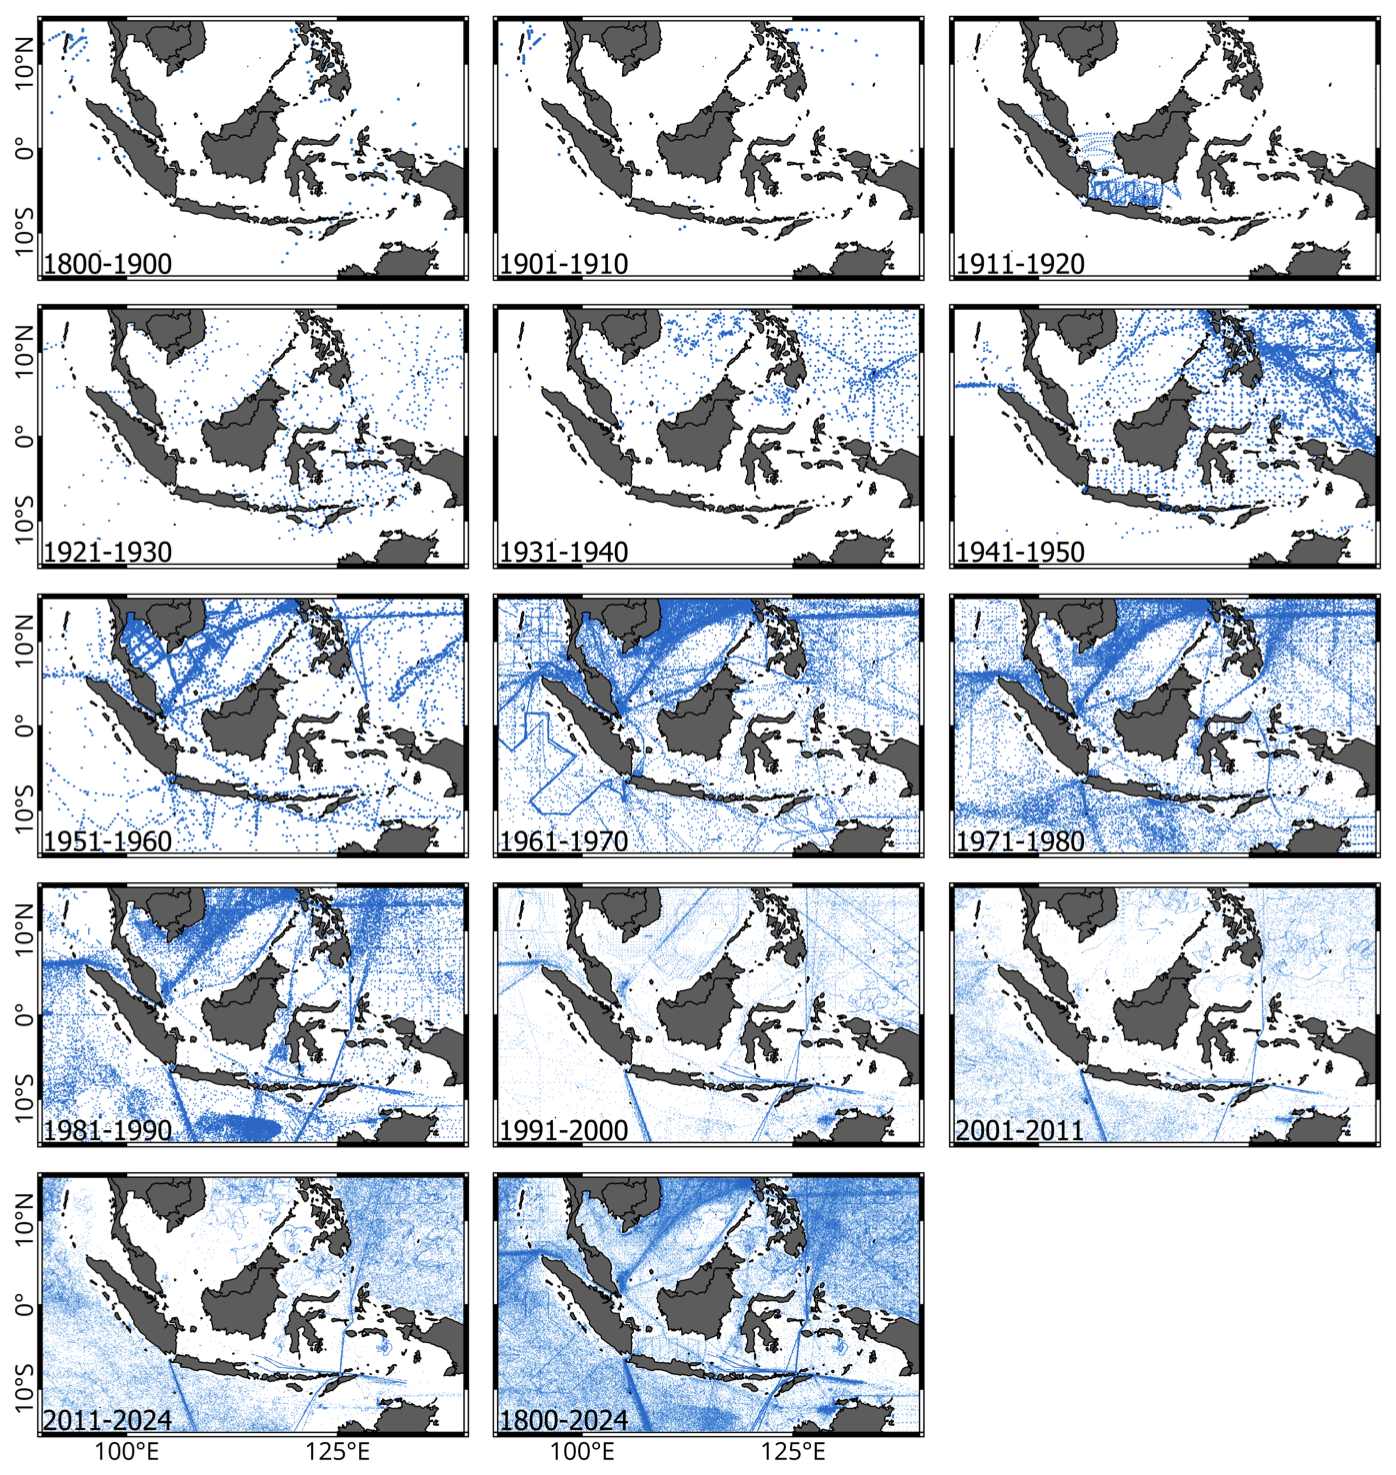
Figure 3Spatial distribution of ocean data represented by blue dots from 1800 to 2024.
3.2 Spatiotemporal trends of oceanographic observations from 1800 to 2024
The quantity of oceanographic observation stations has significantly risen over the last two centuries. The spatial distribution of oceanographic data across ISS demonstrates significant spatial heterogeneity, with higher concentrations along international shipping lanes (ALKI) and major research expeditions. At the same time, vast areas, particularly in remote archipelagic waters, lack continuous monitoring. Spatially, oceanographic data in the study area have been recorded since 1800. Oceanographic measurements continued to develop over time (Fig. 3). From 1800 to 1900, oceanographic measurements were only conducted in several limited regions, including the Andaman Seas, Sulu Seas, Eastern Indian Ocean, and around Papua. The number of measurements began to increase significantly during the period 1911–1920, particularly in the Natuna Seas and SCS, the Malacca Strait, and the Java Seas. The decade 1921–1930 witnessed the increasing measurements in the eastern ISS. The Western Pacific was much sampled in the 1930s and 1940s, likely while the ocean measurements in the SCS bloomed since the 1950s, but noticeably reduced after 2000. During World War II, most measurements were conducted in the eastern Indonesian Seas, including the Banda Sea, Savu Sea, Makassar Strait, Aru Sea, and Seram Sea.
Furthermore, samplings were also done in the Gulf of Thailand and the Sulu Seas near the Philippines. Since the mid-19th century, oceanographic measurements have rapidly increased, mainly due to new technology and the rise of commercial and cargo ships. Global trade has a clear footprint in the spatial distribution of oceanographic data, which aligns with the shipping routes established by the ISS, specifically the ALKI. In this period, the SCS, including the Gulf of Thailand, hosted the densest concentration of data points. The region from southern Sumatra to Papua also appears to have a large distribution of data points showing the shipping lanes. Measurements in the Western Pacific Ocean have kept increasing, with dense data measurements along some shipping lanes from the Philippines. Apart from that, the three water areas that ALKI passes through also significantly increase data collection points. This can be seen in the Sunda Strait, Makassar Strait, and the ALKI III route, which stretches from the Molucca Sea (near Halmahera) to the Savu Sea (near East Nusa Tenggara). However, the latest period from 2001 to 2024 has a different distribution of data points. During this period, oceanographic data measurements in the SCS and the Gulf of Thailand decreased drastically. Not many measurements were made in these two regions, and only a few were made in the central to northern SCS. This condition was most likely caused by the monetary crisis, which resulted in economic instability in Indonesia in the late 1990s. In addition, the global COVID-19 pandemic, which resulted in many restrictions, also weakened in situ data collection in this area. In contrast, the distribution of data points in other water areas has a higher density than in previous periods.
During the measurement period, the number of oceanographic data collection casts increased from 1950 and had a relatively flat growth until 2000. A significant increase occurred between 2000 and 2005, with measurement points approaching 200 000. This increase is higher than the accumulation of previous years. After this period, oceanographic data measurements have shown a decreasing trend until 2024 (Fig. 4).
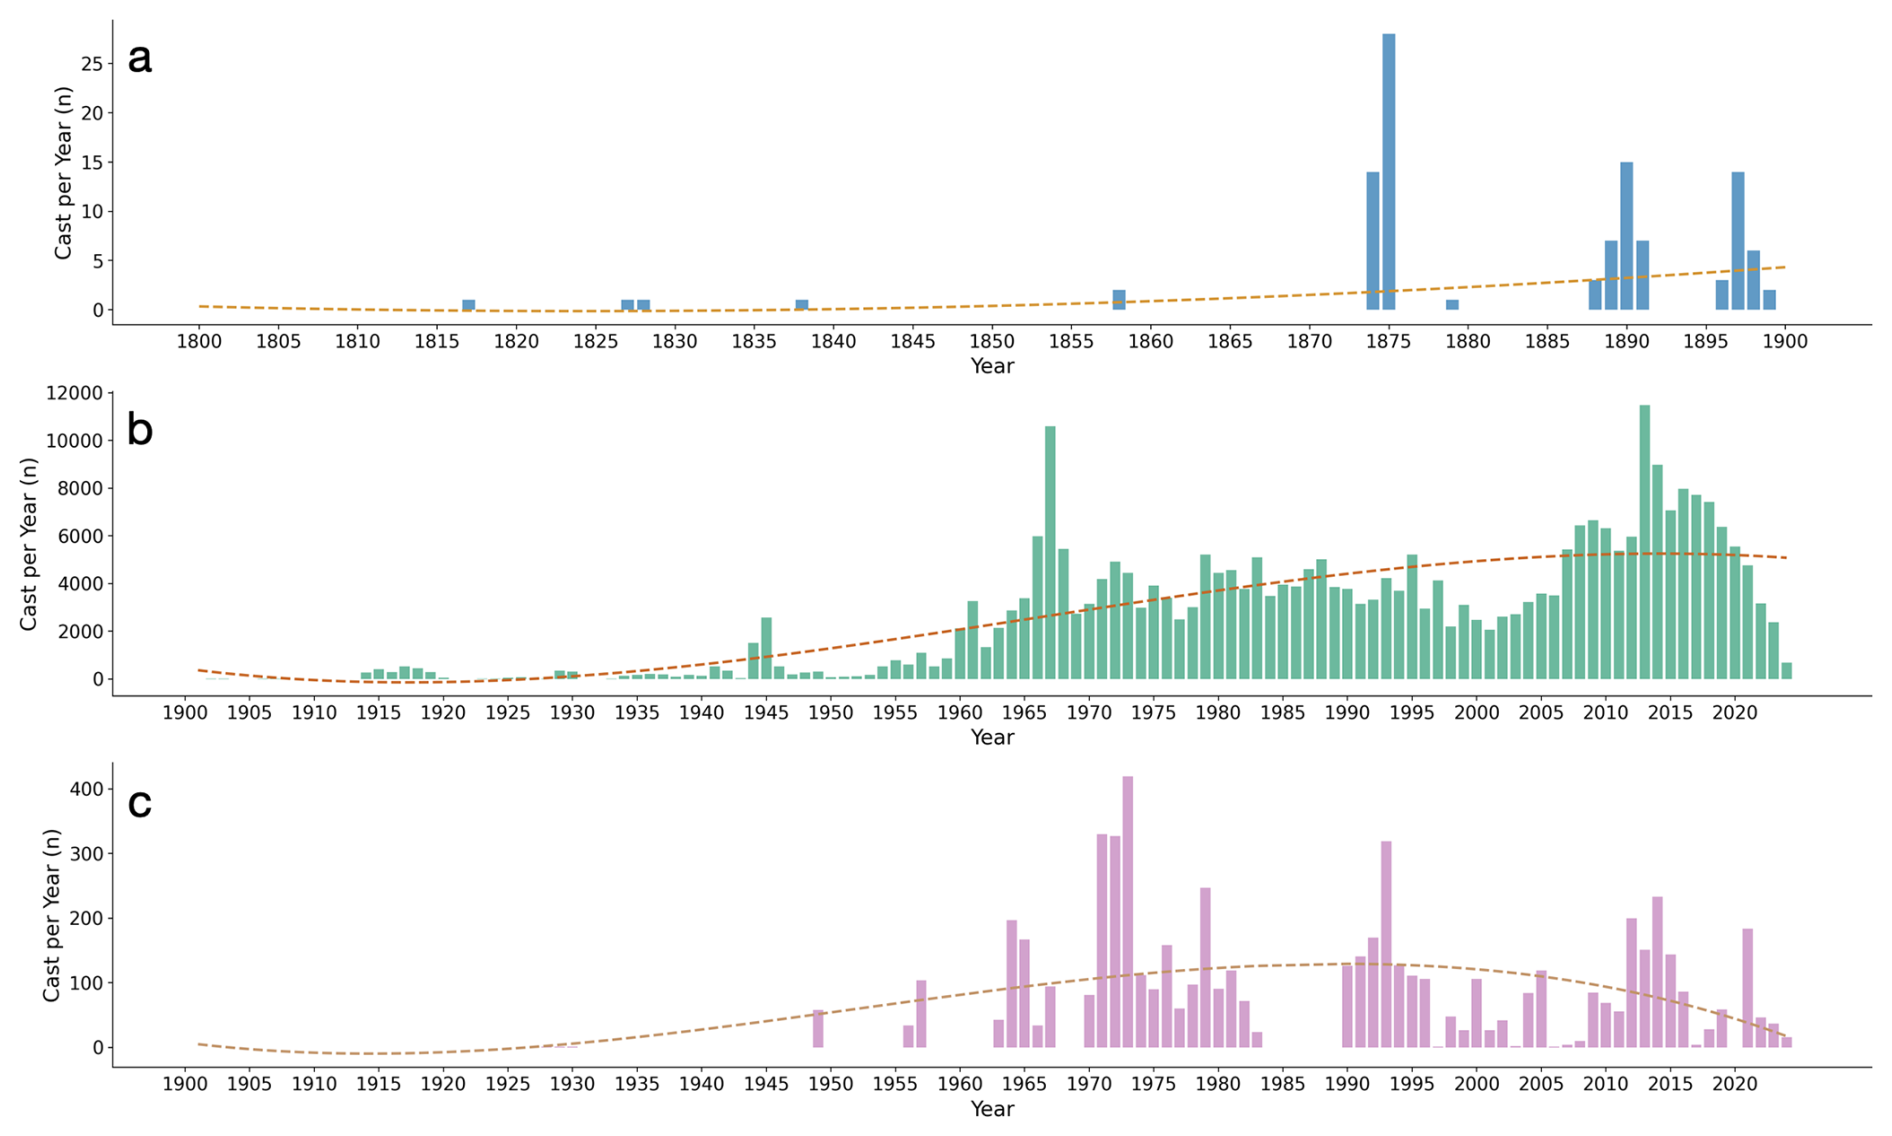
Figure 4In-situ measurement in the ISS region from 1800 to 2024, (a) range from 1800 to 1900, (b) cast data from international (blue bars) and Indonesia (red bars), (c) specific to expedition or measurement by Indonesian institution. Dash lines 10-year trends.
Between 1800 and 1900, only 106 stations existed worldwide, indicating the limited spread and technological advancements of the era. Between 1901 and 1925, the total rose to 2419 stations, signaling the expansion of more organized and extensive oceanographic investigation. The expansion persisted consistently, resulting in the establishment of 8273 stations from 1926 to 1950. Massive oceanographic data measurements in Indonesian waters began to be conducted in 1951. From 1951 to 1975, a substantial increase occurred, with the number of stations escalating to 68 286, driven by breakthroughs in marine technology and increased global interest in oceanic research. In a worldwide perspective, until 1974, there were 1 490 000 total stations. This trend in the ISS continued from 1976 to 2000, with the number of stations increasing to 94 328.
Meanwhile, the global total station on a relatively similar temporal scale is almost 7 000 000 stations. The most significant rise in the ISS occurred in the 21st century, with the number of stations rising to 725 298 from 2001 to 2024, indicative of the global focus on ocean monitoring, satellite integration, and the enhanced accessibility of advanced observational instruments. The same condition occurred in global data recording, where the total number of stations soared to 18 625 988 stations.
Massive oceanographic data collection in Indonesian waters started in 1951, with significant contributions from national and international research programs. The South China Sea (SCS) and the Malacca Strait had the highest number or frequency of oceanographic data measurements between the 1960s and 1990s. During this period, there was likely a significant focus on collecting oceanographic data in these regions, possibly due to research initiatives, increased regional maritime activities, exploration projects, or technological advancements in oceanography.
3.3 National and international project collaboration
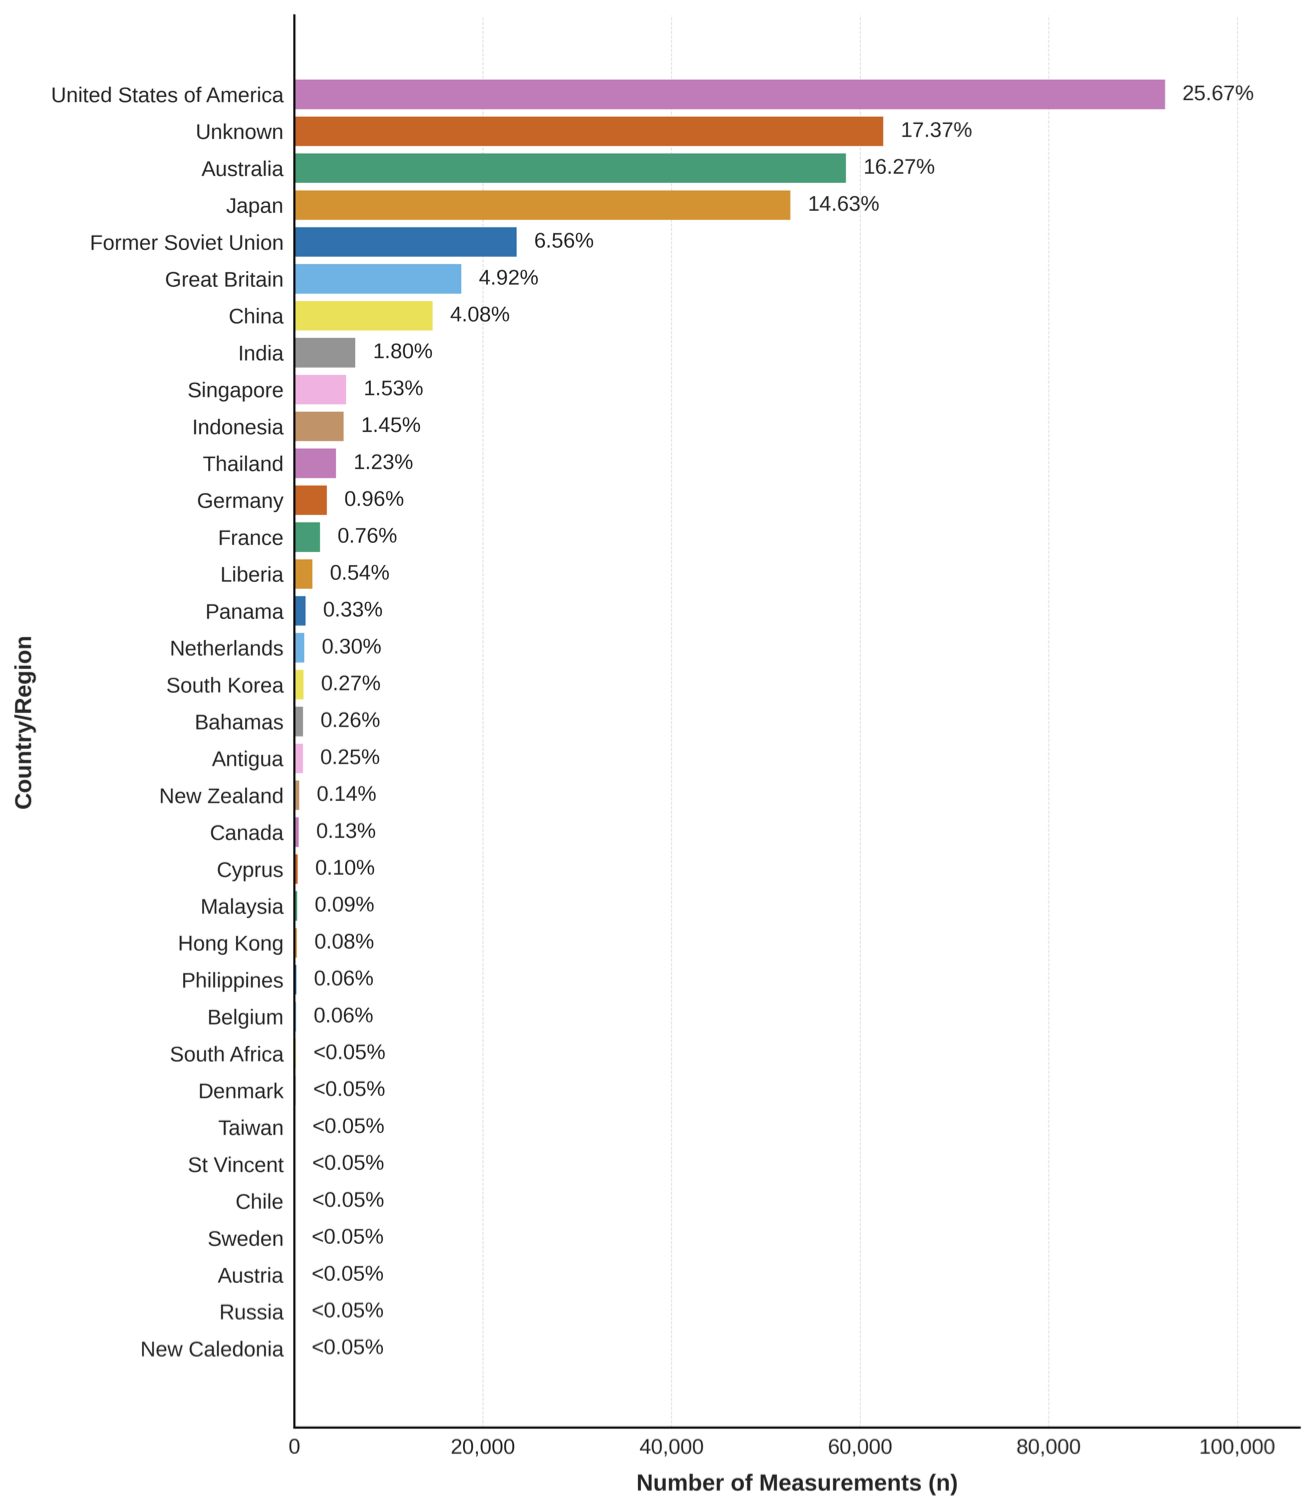
The global distribution of oceanographic data reflects significant disparities in research contributions across different countries. While some nations have established extensive ocean observation programs, others remain underrepresented in global data collection efforts, particularly in developing regions. Countries like the United States, Japan, and Australia lead in the number of casts, contributing valuable in-situ data to international initiatives (Fig. 5). With 92 329 casts annually, the United States shows up as the primary contributor – 25.62 % of all casts, and Australia with 58 508 casts (16.27 %). With 52 612 casts (14.63 %), Japan maintains a significant presence in the Pacific and Indian Oceans through many organizations. Furthermore, China has shown increasing engagement in oceanographic research (14 674 casts, 4.08 %). From European countries, including France (2735 casts, 0.76 %), Germany (3470 casts, 0.96 %), and Great Britain (17 704 casts, 4.92 %).
In Southeast Asia, Singapore (1.53 %), Thailand (1.23 %), and Indonesia (1.45 %) have contributed to regional oceanographic datasets. Interestingly, a substantial portion of oceanographic data is categorized as “Unknown” (17.37 %, or approximately 62 455 casts), which likely originates from historical datasets with missing metadata, classified military data, or contributions from private vessels and commercial ships. Additionally, some countries, such as Russia, New Zealand, and other regions/nations, show minimal data contributions (<0.05 %).
3.4 Variability and frequency distributions of key oceanographic parameters
The KDE analysis highlights distinct oceanographic characteristics across different sea and ocean regions. The height and width of density peaks provide insights into the concentration and variability of key parameters, while multiple peaks indicate clustering around different values. Each region exhibits unique patterns, reflecting the diverse oceanographic processes at play (Fig. 6).
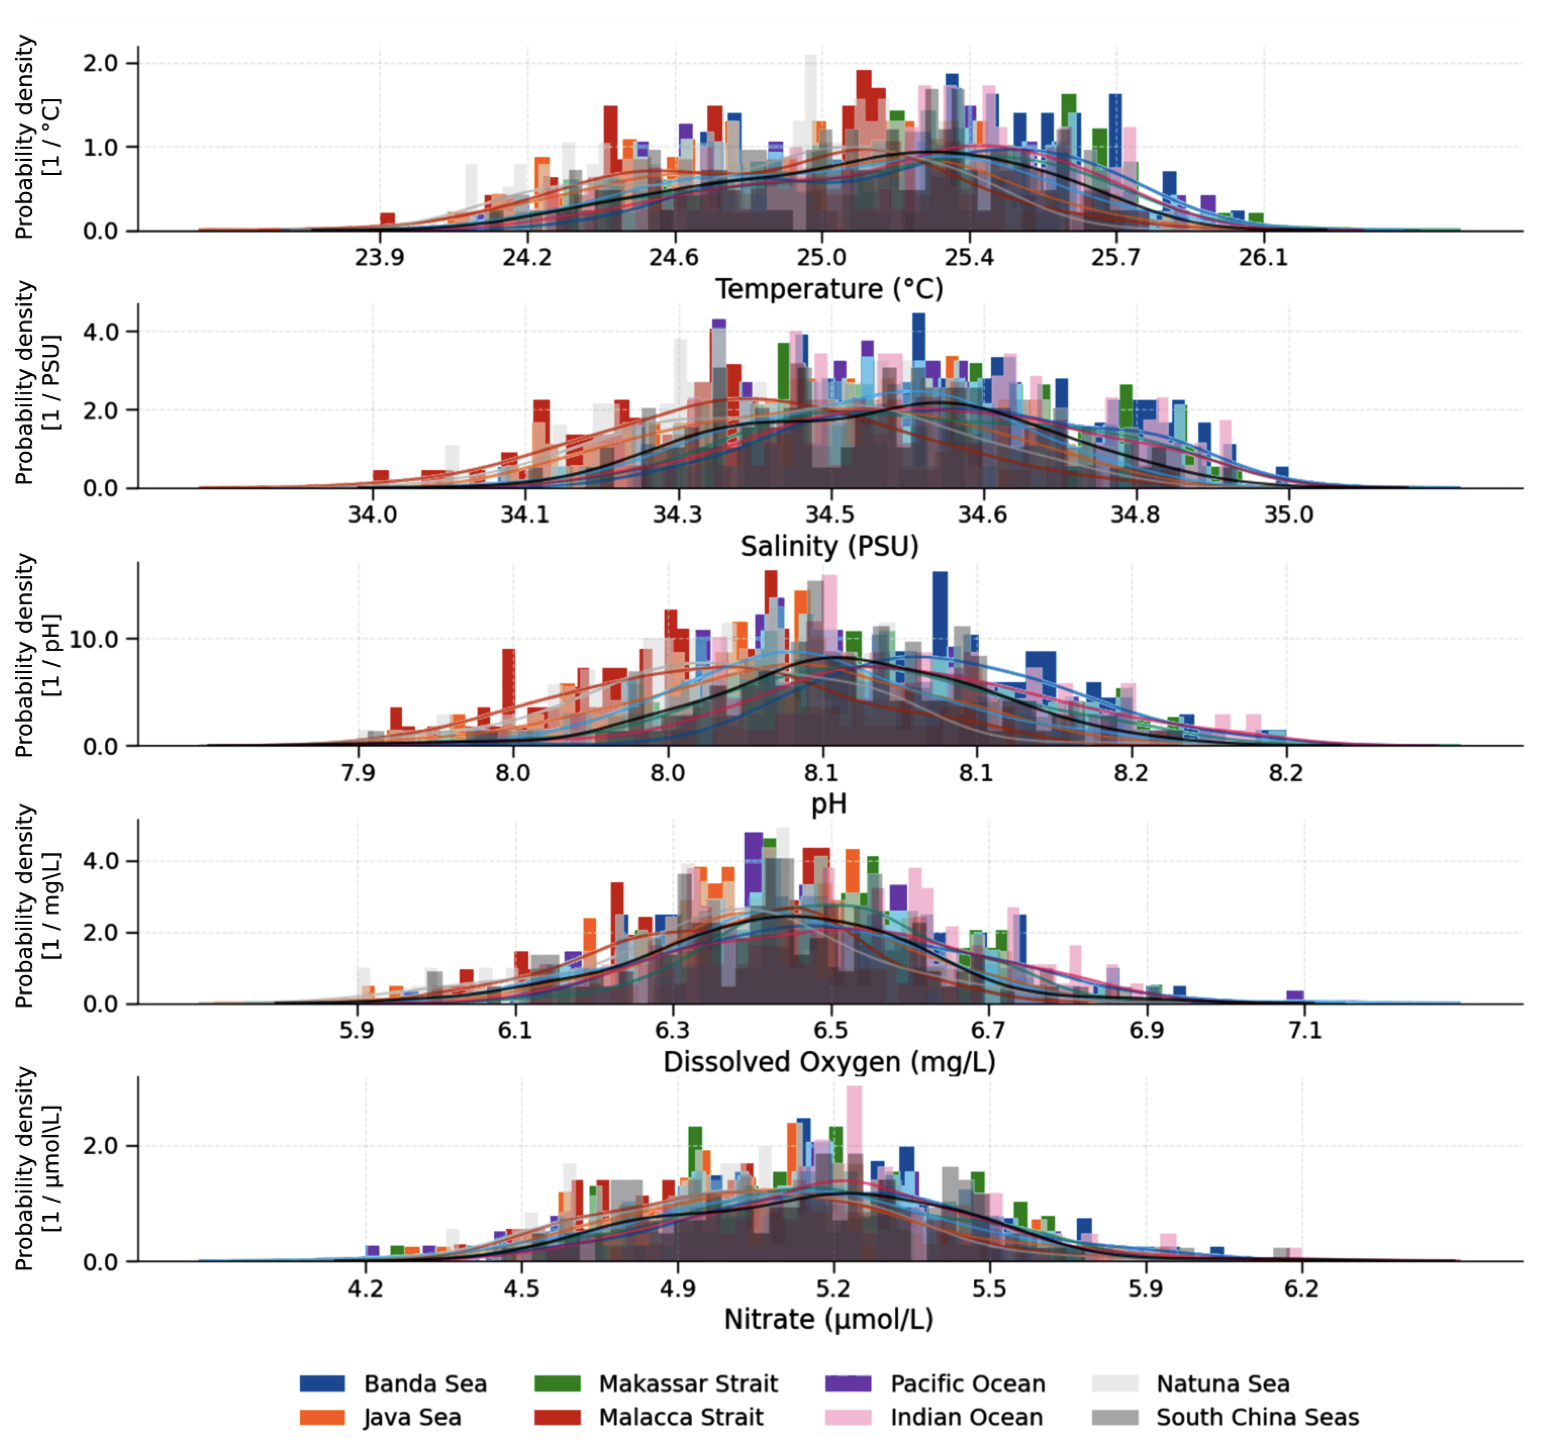
Figure 6Distribution of five essential ocean variables by region. The histograms (filled colours) show the observed data distribution, while line colours represent the smoothed distribution using the KDE estimation method.
The Banda Sea demonstrates consistently high values across multiple parameters. With the highest recorded average temperature of 25.25 °C (24.33 to 26.05 °C), it is one of the warmest regions. This warmth is accompanied by high salinity, averaging 34.62 PSU, making it one of the more saline water bodies in the region. Furthermore, the Banda Sea has notably high dissolved oxygen levels, with a mean concentration of 5.22 mg L−1. The Indian Ocean also exhibits stable, high values across multiple parameters. With a temperature mean of 25.20 °C and high salinity levels, it is a key contributor to regional climate and water mass exchanges. The Indian Ocean shows a relatively stable pH and has one of the highest nitrate concentrations, averaging 5.21 µmol L−1. In contrast, the Malacca Strait exhibits lower pH, dissolved oxygen, and nitrate compared to open oceanic regions. The Natuna Sea consistently shows the lowest values across several parameters, setting it apart as a unique hydrographic region. It records the coolest temperatures, with a mean of 24.87 °C, and has the lowest salinity levels, averaging 24.88 PSU. The dissolved oxygen content in the Natuna Sea is also relatively low, with an average of 6.37 mg L−1.
The complex circulation in the ISS is influenced by multiple drivers, including tide effects, ITF pathways, monsoon currents, IOD, ENSO, and bathymetry (Fig. 1). These phenomena are crucial for regional climate variability, fisheries productivity, and ocean-atmosphere interactions (Fadhilah et al., 2024; Qian et al., 2010). However, based on data collected from sampling stations since 1990, which mainly study specific oceanic phenomena without continuous monitoring, the understanding remains limited. Upwelling events and oceanic eddies are the most studied in the southern part of Java and are commonly associated with fisheries, IOD, and ENSO (Rachmayani et al., 2019). Meanwhile, research has mainly focused on eddies and the warm pool region in the northern waters of Papua (Arruda and Nof, 2003; Kashino et al., 2013). The ITF has also been the focus of studies in the Banda Sea, Makassar Strait, and Seram Sea (Prihatiningsih et al., 2021; Rugebregt et al., 2023).
The data collection in ISS reflects contributions from global, regional, and national initiatives, with many programs, such as Argo, GOOS, SEA-GOOS, and WOD, operating as international collaborations, while INAGOOS and RIN BRIN represent national efforts within Indonesia. The depth range of observations varies significantly among datasets, influencing their applicability for different research objectives. Temperature and salinity are the most commonly measured parameters across all programs, providing essential data for studying ocean circulation and climate variability. However, while these two variables are well-represented, dissolved oxygen, nutrients, and pH observations are less frequently available, often exhibiting spatial and temporal gaps, particularly in coastal and deep-sea regions (Table 1). This is largely due to the higher cost, calibration needs, and historical under-prioritization of biogeochemical sensors compared to physical measurements, as well as the logistical challenges of sustained monitoring in these environments (Kolodziejczyk et al., 2024).
These station points (Figs. 2 and 3) also highlight the growing interest of international researchers, especially since 1990, when intensive measurements have been conducted using Indonesian research vessels and through international collaborations, particularly in the eastern Indonesian seas, where depths exceed 4000 m. This region is also known as a key pathway of the ITF, which is part of the global ocean thermohaline circulation. The data collection efforts include not only scientific expeditions but also the deployment of moorings and buoys. Existing sampling points indicate gaps in data coverage that cannot be addressed solely by commercial vessels operating along Indonesia's designated international shipping lanes (ALKI) (Figs. 2 and 3). Unlike commercial ship-based observations, dedicated research deployments provide more precise and continuous oceanographic measurements, essential for understanding climate variability, deep ocean circulation, and regional marine ecosystems.
From the dataset analyzed in this study (Table 2) is a wide array of oceanographic measurements sourced from various international programs and platforms. The WOD provided the most extensive contributions, particularly its XBT, OSD, MBT, and CTD datasets. However, post-screening, there was a substantial reduction in the XBT dataset, with 45 % of the original data being rejected, likely due to redundancy, bias, incompleteness, or poor data quality. The other factors, such as inconsistent methodologies, varying instruments, or limited calibration, as data collection is also conducted through volunteers and commercial vessels (Boyer et al., 2018a). The OSD and MBT datasets have minimum reductions, reflecting high data quality or fewer redundancies. The CTD dataset, critical for detailed temperature and salinity profiles, maintained almost all of its casts after screening, underscoring its importance for oceanographic studies. The Argo Float data provided 87 422 casts, though, after quality control, only 70 040 remained. This reduction signifies the challenge of maintaining data accuracy, especially in complex oceanic regions like the Indonesian seas. Argo Floats, known for their autonomous measurement capabilities, remain indispensable for real-time ocean monitoring but require continuous data validation to ensure reliability.
Furthermore, the EWOCE contributed 70 080 casts, but 13 % were discarded. RAMA and TOA buoy systems provided valuable stationary measurements with 14 303 and 2776 casts, respectively. In contrast, PODC (Padjadjaran Oceanographic Data Centre) was collected from scholars at Universitas Padjadjaran, and most of the data is collected near the university region, which is the West Java region, providing 2621 raw casts, with 2419 retained after screening (Faizal et al., 2021; Purba et al., 2022). The NANO-DOAP project, established in 2021, has 87 casts. This number remained unchanged after screening, reflecting the high quality of the data. Experts carefully screened the samples after collection to ensure that only well-validated data were released (Franz et al., 2021). From our perspective, all this portal data is vital for understanding the large-scale circulation patterns and their role in global climate systems, especially in regions like the Indonesian Seas that are part of the global thermohaline circulation (Gould, 2003).
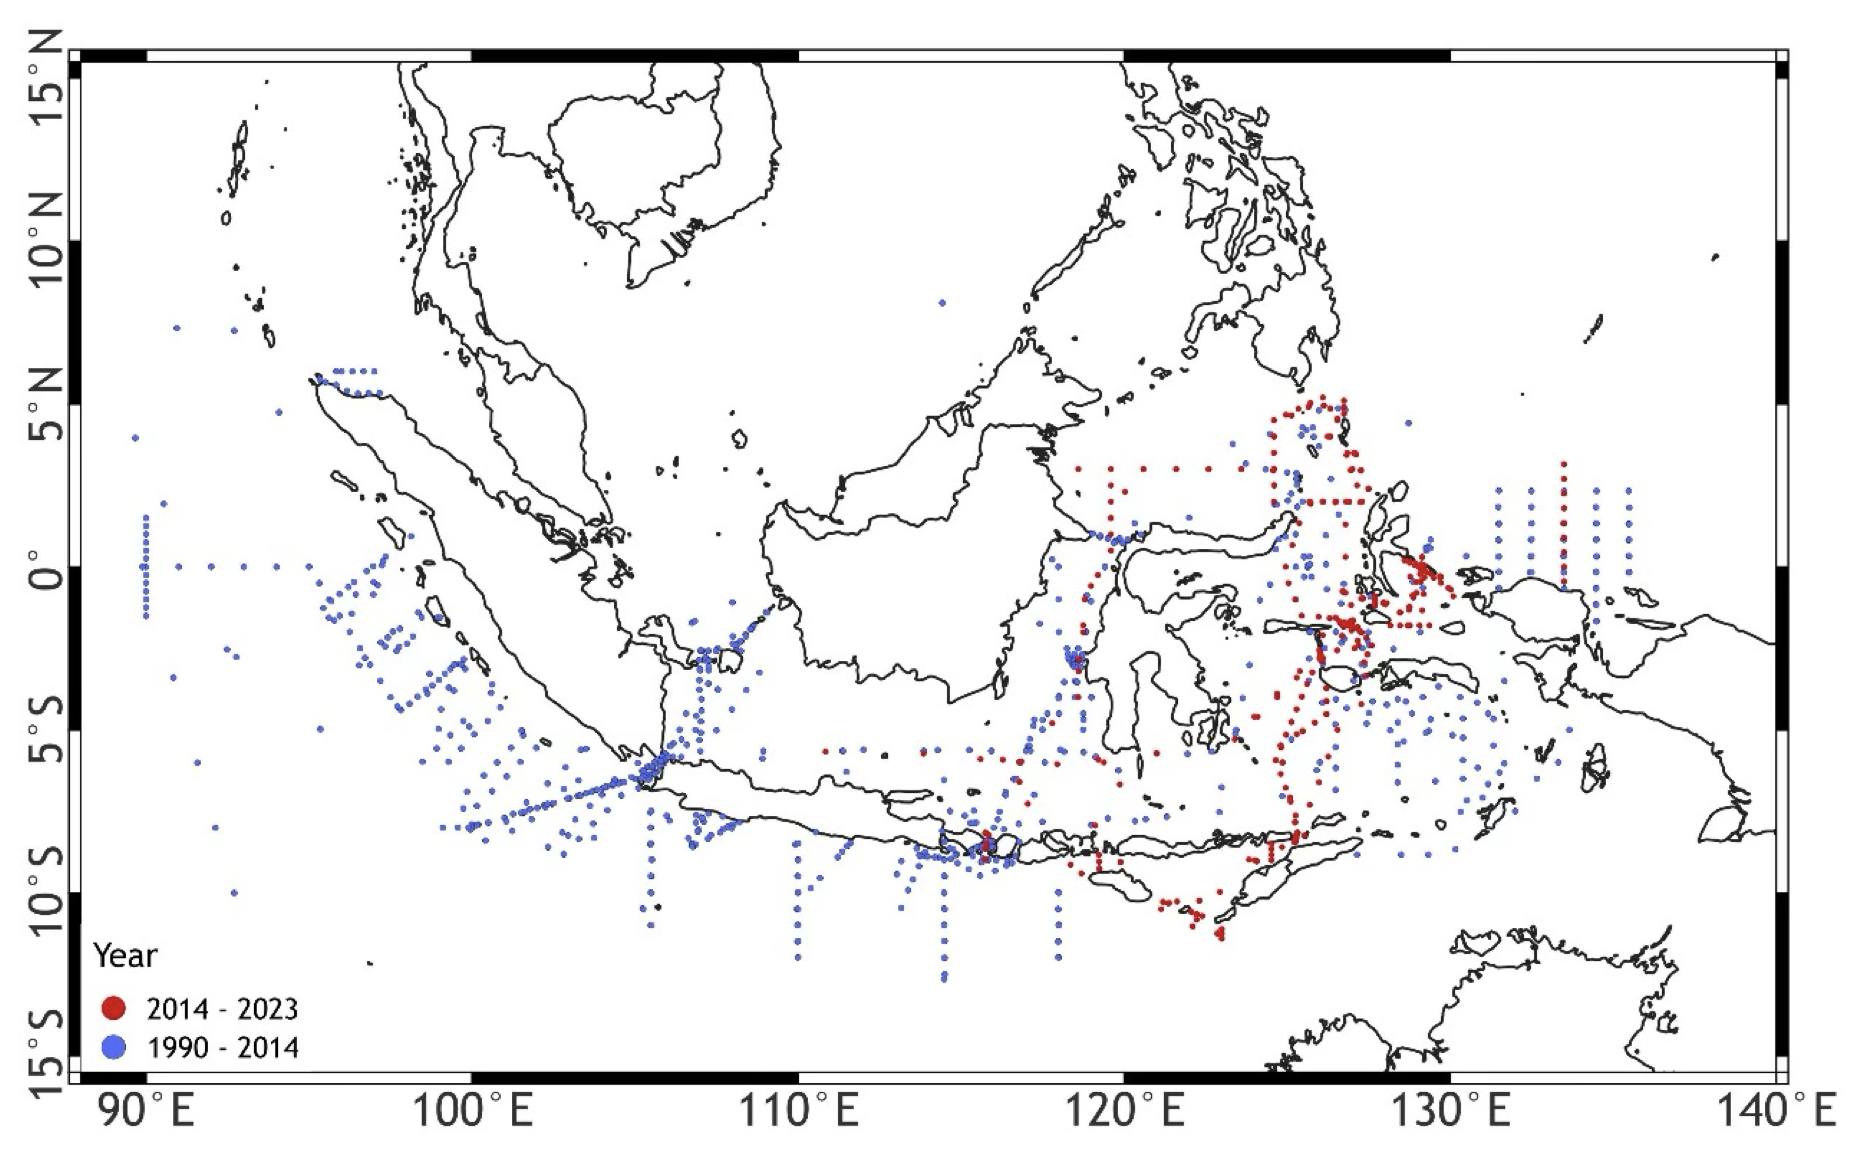
Figure 7Data collection represents an effort of the Indonesian government, such as LIPI and BPPT, which are now integrated into BRIN as part of the organizational restructuring. Other international collaborations include IOCAS and FIO (mostly since 2014). Detailed positions and years can be found in the Supplement.
From historical data, we can conclude that from 1800 to the early 1900s, oceanographic observations were minimal, primarily due to the limited technology and infrastructure available for ocean data collection (Figs. 3 and 4). Most ocean observations during the 19th century were conducted during scientific expeditions parallel with invasion but their availability in modern databases is limited due to incomplete archiving practices and delays in data submission to national and international repositories (Bingham et al., 2002). The increase in data collection in the 1910s can be linked to technological advancements and the growing importance of understanding oceanic conditions for navigation and scientific exploration. Nevertheless, World War I (1914 to 1918) and World War II (1939 to 1945) significantly shifted global priorities from scientific research, including oceanography, as most nations concentrated their resources on military and defence efforts. Oceanographic activities took a backseat during these periods, particularly in Indonesia and other countries in the region, which were undergoing profound social and political changes. Despite these challenges, Indonesia and the surrounding nations maintained their civilization, gradually moving towards modernization. Early initiatives were undertaken during the Snellius I Expedition from 1929 to 1930. P. M. van Riel, a Dutch scientist, conducted this expedition, which concentrated on the eastern region of the Indonesian archipelago, specifically the Lesser Sunda Islands, Banda Sea, and Molucca Sea. The expedition focused on the oceanographic characteristics of the region, such as seafloor mapping, currents, and water column properties, to investigate deep-sea environments (van Aken, 2005).
Oceanographic observations worldwide increased significantly between 1940 and 1970. This increase can be attributed to the naval system's dependence on ocean knowledge. Interestingly, observations increased significantly in the early 1960s, from over 2000 casts in 1960 to over 6000 in 1967. As international cooperation and funding for oceanographic research projects increased, this trend continued into the 1970s and 1980s, with many casts. These included initiatives like the World Ocean Circulation Experiment (WOCE) and building buoys and mooring systems, which substantially contributed to data gathering, especially in under-represented areas like the deep sea and isolated archipelagic waters.
In Indonesia, this global momentum was mirrored by the establishment of national research institutions and the gradual development of local monitoring capacity. The founding of the Indonesian Institute of Sciences (LIPI) in 1967, later integrated into the National Research and Innovation Agency (BRIN), marked a turning point in building systematic oceanographic programs within the archipelago. Through national expeditions and collaborations with international partners, Indonesia began to fill critical gaps in observations, particularly in key regions such as the Makassar Strait and Banda Sea, which form the core pathways of the Indonesian Throughflow. These efforts not only aligned with global initiatives like WOCE but also underscored the strategic importance of the Indonesian Seas to both regional and global climate systems (Fig. 7).
Indonesia was able to address local environmental issues and add to global oceanographic knowledge by establishing LIPI, which was crucial in starting systematic ocean measurements, especially in its vast archipelagic waters. As a result, the 1960s symbolized Indonesia's dedication to comprehending and managing its maritime resources and signalled a global trend toward greater ocean surveillance. The establishment of research institutions in Indonesia also created new avenues for expanding oceanographic data recording capabilities in Indonesian waters, both independently and in collaboration with other institutions..
Oceanographic casts increased sharply in 2000 and peaked in 2003 at 178 823 castings. The rise of autonomous oceanographic technology, explicitly using Argo floats, satellite-based remote sensing, and moored buoy systems like the RAMA Buoy array, correlates with technology development. By enabling continuous monitoring and allowing access to previously inaccessible locations, such as distant areas and deeper ocean layers, these technologies have completely changed the way ocean data is gathered. Following the high in 2003, the historical statistics indicate a decrease in casts. The casts decreased to 2359 by 2023, suggesting that observations occurred less frequently. This decline may be attributed to several factors, including budget cuts in research funding, logistical challenges in maintaining long-term ocean monitoring stations, and the high costs associated with deploying and maintaining autonomous instruments in remote and deep-sea areas.
The considerable contribution highlights the US's substantial investment in oceanographic research infrastructure, including advanced satellite systems, buoys, and research vessels. Additionally, Japan is committed to studying ocean processes by providing casts at 14.6 %. Japan's technological achievements and proximity to the western Pacific Ocean, which affects the Indonesian Seas, probably contribute to its significant involvement. The contributions made by both nations reflect their active participation in furthering world oceanography science. With 16.23 %, Australia ranks second among all contributors. Australia's strong participation demonstrates its attention to monitoring important oceanographic processes, including the ITF and regional upwelling systems. Indonesia's close neighbour and nation with an interest in the Indo-Pacific region is Australia. With 4.07 %, China is also rather important due to its extensive data-collecting activities, which show its increasing investment in marine research and scientific cooperation in the Asia-Pacific (Fig. 5). In contrast, several underrepresented countries, such as Indonesia (6035 casts), Malaysia (319 casts), and the Philippines (223 casts), exhibit much lower data contributions despite their crucial geographical locations.
For instance, Indonesia, situated along the vital Indonesian Throughflow (ITF) that connects the Pacific and Indian Oceans, has limited data collection activities (Sprintall et al., 2019). However, it emphasizes issues including less advanced research vessels, less research funding, and fewer operational oceanographic instruments. Strengthening Indonesia's and regional countries' position in oceanographic research is essential to ensuring that local scientists can play a significant role in studying their seas, which are vital to global climate systems. 4.91 % of Great Britain and 6.54 % of the former Soviet Union mention previous involvement in the oceanographic study. These nations have made significant strides in understanding Indonesian seas through their colonial or Cold War-era research projects. This under-representation suggests that there may be substantial data gaps in these important ocean regions due to resource, technological, and international collaboration issues. This disparity emphasizes how urgently nations must cooperate further and share resources to improve oceanic research (Silveira et al., 2022). Several institutions and organizations conduct marine surveys in Indonesia, although the information gathered frequently does not fully meet the comprehensive understanding of local ocean dynamics. As a result, wealthy and low-income countries have significantly different access to data, resulting in under-representation in crucial areas such as Indonesian waters. It is crucial to form alliances for future projects like mooring deployments to close these data gaps and enhance our understanding of ocean dynamics in general. This draws attention to a crucial component of Indonesia's oceanographic data collection process. The WOD efficiently leverages a range of nautical activities to collect important oceanic data, such as measurements from cargo ships, fishing vessels, commercial ships, and specialized research vessels. Especially in active shipping lanes, this varied sampling approach guarantees thorough coverage of the oceans.
Notably, most data are focused along these international shipping routes in the context of the Surroundings ISS (Fig. 6) because they represent regions of heavy maritime activity where ships naturally collect data. In contrast, in transport, this alignment with shipping channels is important. It also highlights possible data gaps in less-travelled areas, especially in isolated archipelagic waters where monitoring efforts might not be adequate. These differences in data accessibility have a significant impact on our understanding of the oceans worldwide. The absence of sufficient in situ data is especially problematic for areas like the Indonesian Seas, which are essential for researching interactions between the Pacific and Indian Oceans.
Because simple measurement is crucial to understanding ocean dynamics, temperature and salinity are the most commonly measured parameters in oceanographic investigations (Figs. 7–9). For these measures, devices such as Conductivity-Temperature-Depth (CTD) sensors are frequently utilized because they are relatively easy to install and can precisely measure temperature and salinity simultaneously. These factors significantly impact marine ecosystems' physical environment, stratification, and circulation. Modelling ocean dynamics, forecasting changes in marine habitats, and tackling the issues brought on by climate change depend on an understanding of temperature and salinity. For instance, changes in salinity and temperature directly affect marine life, influencing food availability, breeding cycles, and species distribution. With temperature and salinity, other crucial parameters like pH, dissolved oxygen (DO), and Nitrate are also monitored. While DO levels are essential for determining the health of marine organisms, Nitrate is critical for understanding nutrient availability and primary productivity. As ocean acidification threatens marine ecosystems, pH measurements are becoming increasingly important.
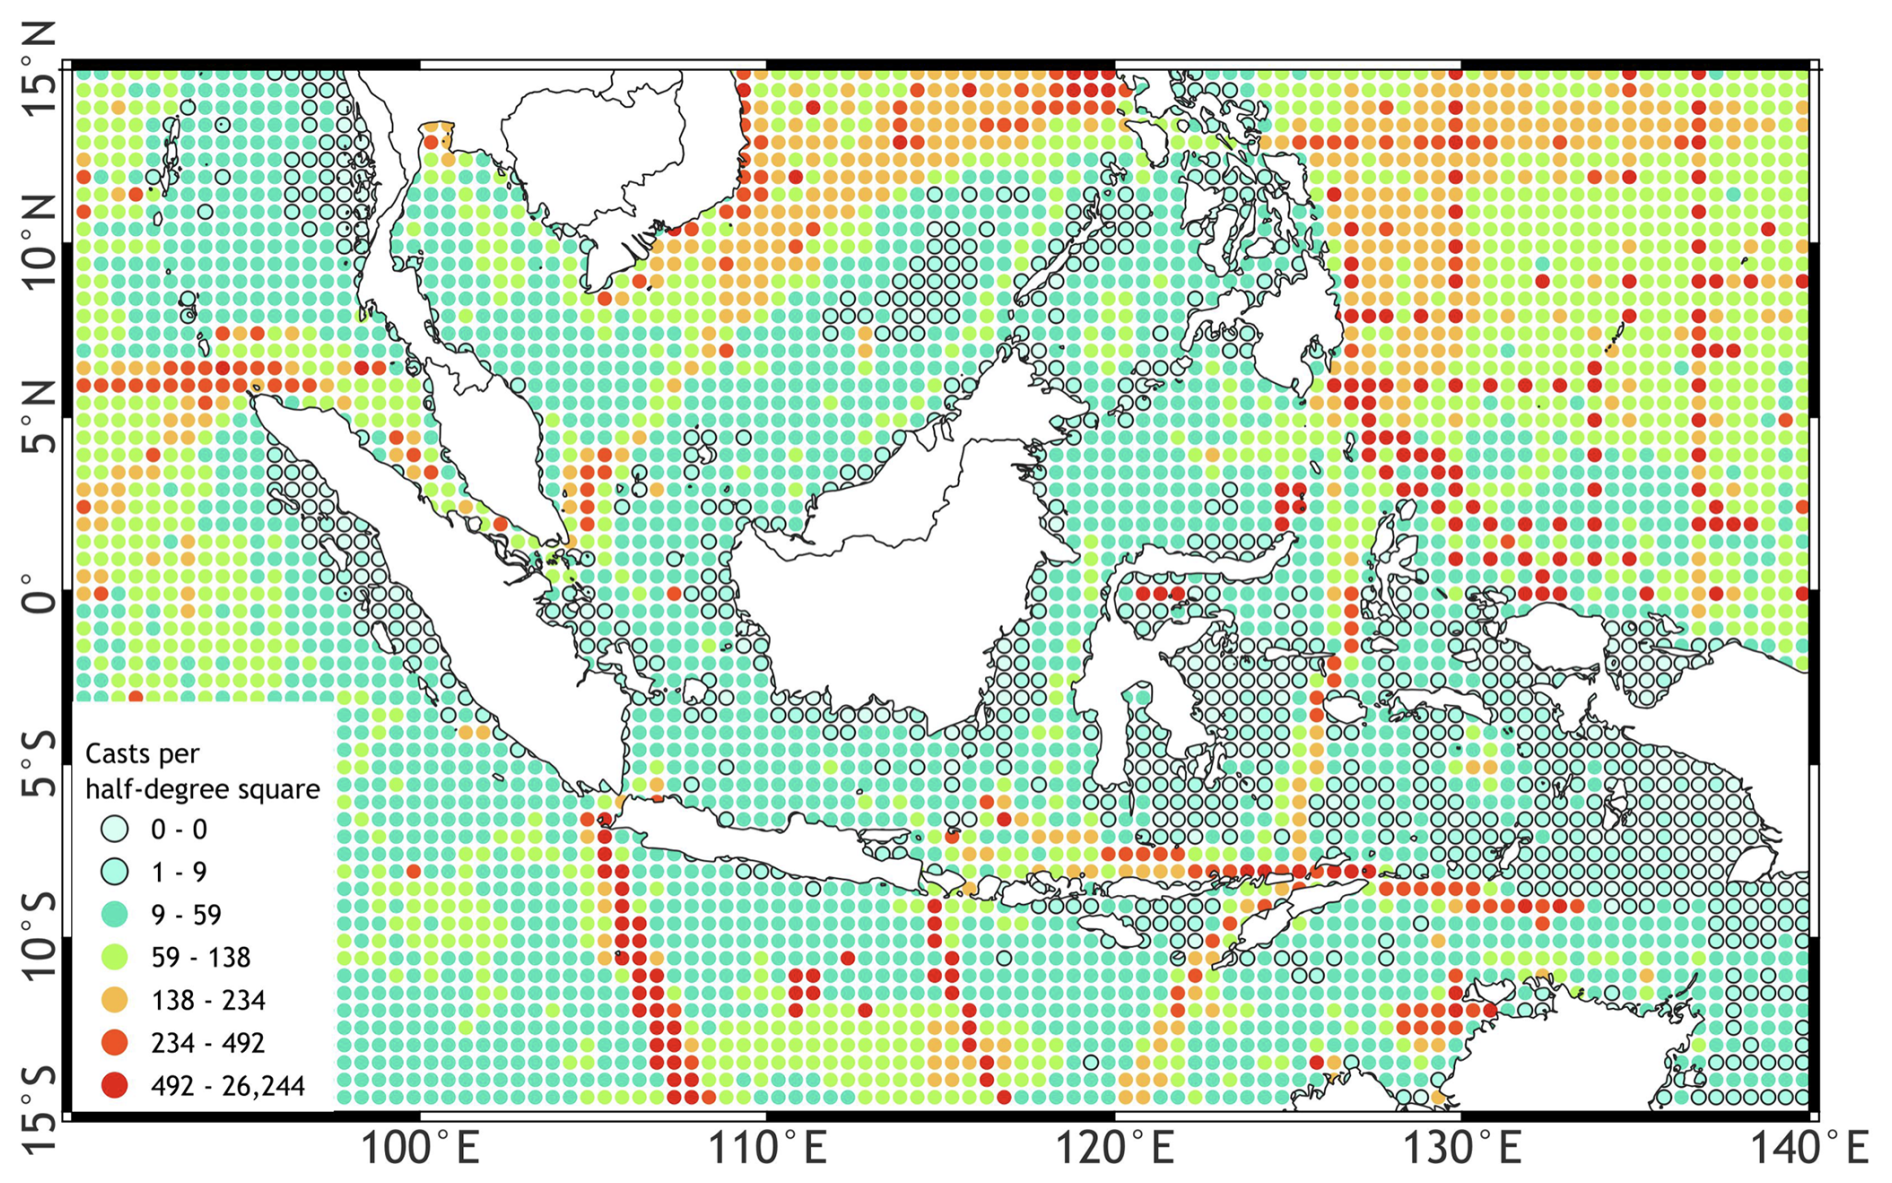
Figure 8Spatial distribution of historical oceanographic casts per half-degree grid square in the ISS region over the observational period. Cast density is categorized into seven quantiles: Q0 (no data), Q1 (1–9 casts), Q2 (10–59 casts), Q3 (60–138 casts), Q4 (139–234 casts), Q5 (235–492 casts), and Q6 (493–26 244 casts).
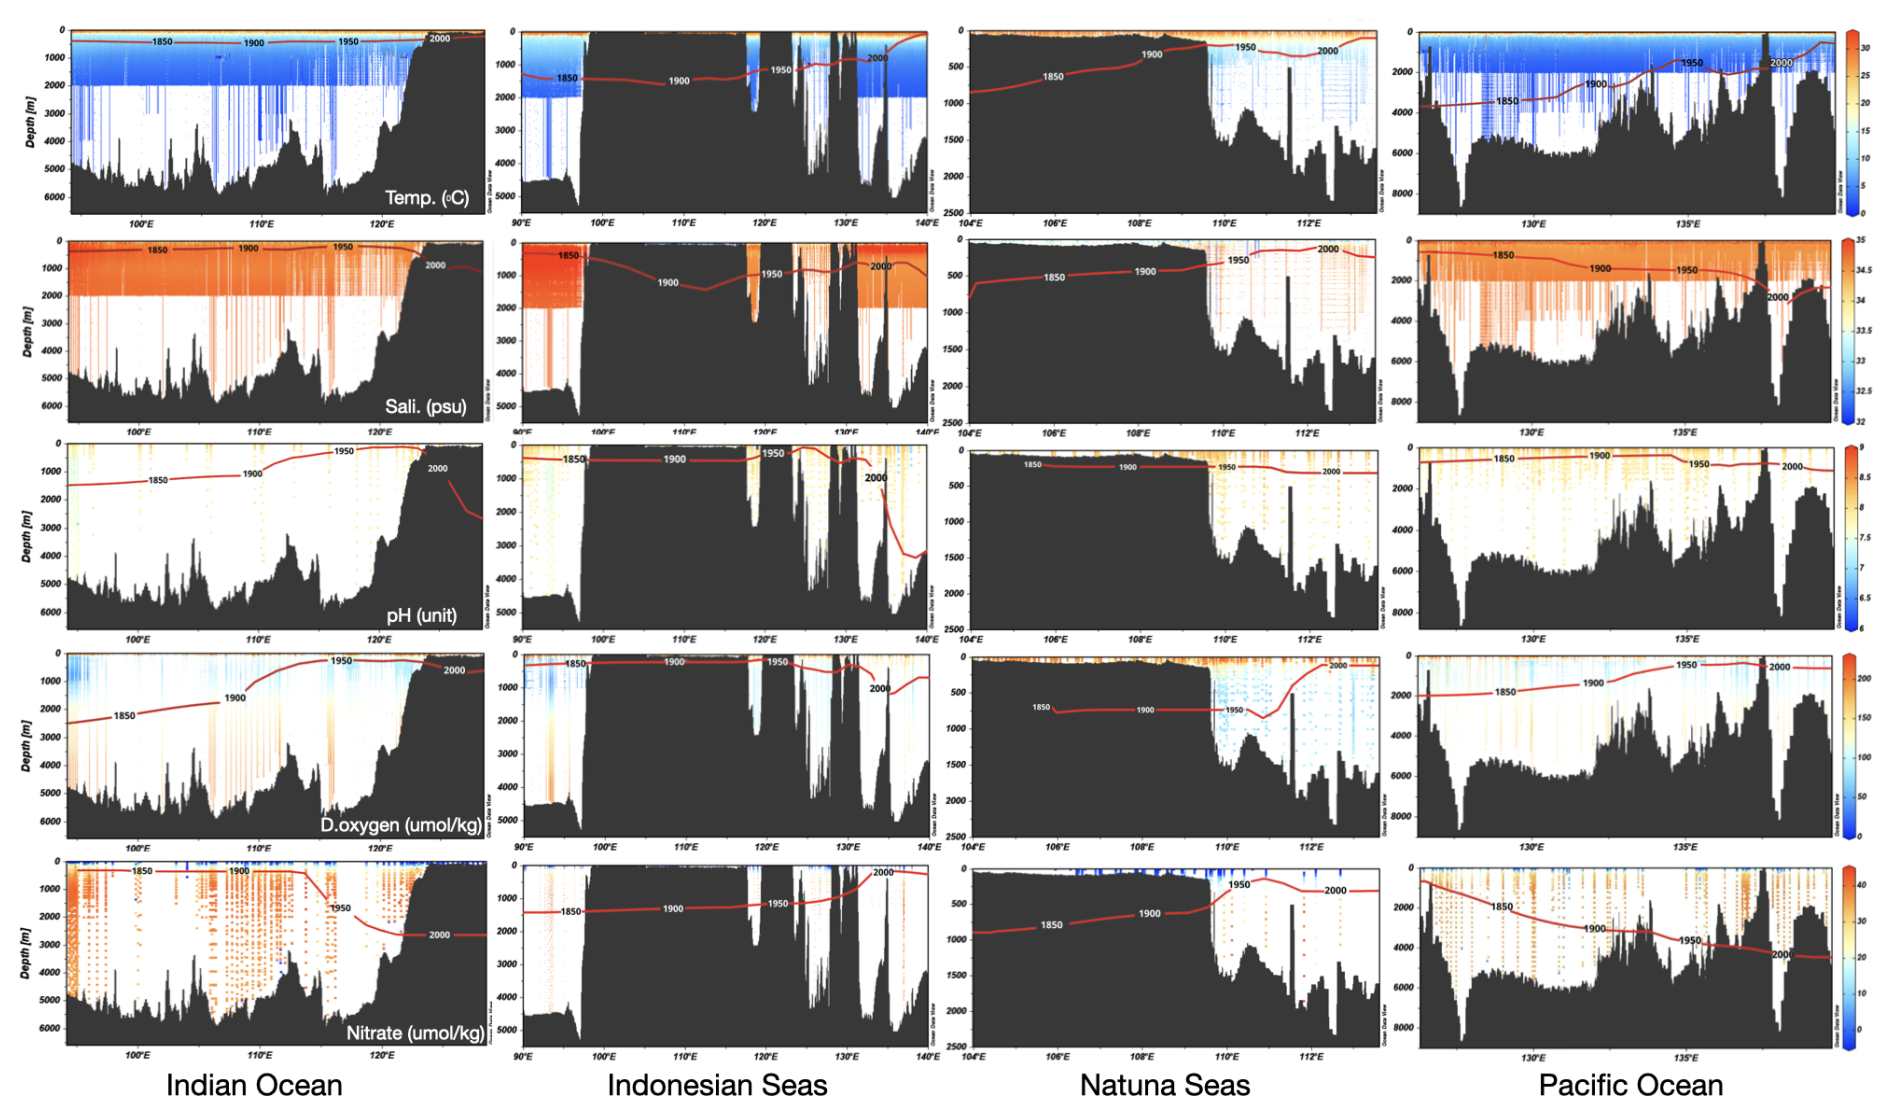
Figure 9Vertical distribution (dots) and trends in several essential ocean variables (temperature, salinity, pH, dissolved Oxygen, and nitrate Levels) in the ISS. Red lines represent the trend measurement over the years. The graph is visualized with ODV (Schlitzer, 2024).
5.1 Recent gaps
While the ISS serves as a key region for various phenomena such as ENSO, IOD, and ITF, we further highlight the vertical gaps in data coverage and analyse the distribution of observational data. We analyse the spatial and temporal data gaps, with the average cast data in the study area being 462 casts per 1° grid square, with the highest and lowest casts on one grid being 26 244 and 1, respectively. There are several hotspots with a data cast density of more than 138 per grid: the Pacific Ocean, Indian Ocean, and SCS (Fig. 8).
The Pacific Ocean has a consistently high datacast density among the other regions. Almost all of this area has a density at quantile 5 with a cast per one-degree grid square range of 492 to 26 244. The number of data casts in this region is 263 957, with an average of 1027 casts per grid. Oceanographic instruments and ships collect data from this area's large number of data casts. The highest number of data casts on one grid in this region is 7751, while the lowest is 5. The Indian Ocean has the highest number of data casts of the three hotspots, with 293 383 data casts. Even though it has a higher total cast data than the Pacific Ocean, the average cast data in the Indian Ocean is lower, 649 casts per one-degree grid square, than the Pacific Ocean because its area is large, and the distribution of data collection is not as homogeneous as the Pacific Ocean. The minimum and maximum range of casts per one-degree grid square in this region is 1 to 26 244 casts per grid. The first (26 244 casts per 1° grid square) and third-highest densities (15 647 casts per one-degree grid square) are also in this area, precisely to the south of Bali.
The SCS is the third hotspot in the study area, with 61 617 casts and an average of 392 casts per one-degree grid square. The impact of shipping lanes in this region is evident because it is very clear that the data distribution is divided into two parts. The area close to Vietnam and Peninsular Malaysia is a high-density region. Meanwhile, the part that approaches Kalimantan Island is a low-density area. The maximum value of the cast data in the SCS is 3644 casts. Apart from the placement of oceanographic instruments, the distribution of these hotspots is also influenced by shipping routes in Indonesian waters, ALKI. The data distribution resembles shipping routes in the western region, stretching from the SCS and the Malacca Strait to the Sunda Strait. The data distribution pattern with a data density of more than 492 resembles ALKI I. The same case can be seen in the eastern region; there is a data distribution pattern with a density of more than 492, which resembles a shipping lane that stretches from the Molucca Sea to the western Banda Sea. Then, it branches towards the west to the Savu Sea via the Timor Passage and east to the Timor Sea. This distribution pattern is identical to ALKI lines. Areas with low maritime traffic or no shipping lanes have much lower data density because methods for collecting oceanographic data by commercial ships cannot be implemented. The Andaman Sea shows cast data density in quantiles 1 to 3, with no more than 138 casts per one-degree grid square. Similar conditions appear in the Gulf of Thailand near Malaysia, the SCS near Kalimantan Island, the Sulu Sea, and the Arafura Sea. On the other hand, even though it is passed by ALKI, the Sulawesi Sea and Makassar Strait have relatively low data density compared to other areas that ALKI also passes. The density in this region is no more than 234 casts per one-degree grid square.
We also analysed the importance of coastal regions in the era of climate change. Almost 60 % of the population in Southeast Asia (SEA) is on the coast and depends on the sea for their livelihood. Likewise, the SEA region is an area rich in biodiversity. Mitigation in this region must start with complete data. Four coastal areas are chosen to represent how coastal measurements have been carried out at a distance of 12 miles (43 km) from the coastline. In general, coastal measurements have small quantities with uneven distribution. For example, the west coast of Sumatra is only found on the west coast of Lampung Province, which has eight measurements and covers an area of no more than 38 km2.
Even though the west coast of Sumatra has become a place of various international shipping lines (ALKI I), coastal measurements in the region are still very low. Java Island has a total of 16 751 measurements along its coast. There are two coastal measurement hot spots on the island of Java, namely the Sunda Strait (ALKI I route), with 1095 cast observations, and the Bali Strait (ALKI II route), with 14 949 cast observations. The busy shipping area in these two straits means they have many casts, almost 96 % of the total casts on the island of Java. The Bali Strait alone contains 89 % of the cast on the island of Java. The northern and southern coastal areas of Java Island have few and uneven coastal measurements. In the north of the coastal region, measurements are generally carried out in Jakarta Bay and its surroundings. Meanwhile, in the southern coastal area, Pelabuhan Ratu Bay has relatively more coastal measurements than the rest of the south coast. Recently, two coastal monitoring stations, supported by the NANO-DOAP Program, have been established in the northern and southern regions of West Java (https://nf-pogo-alumni.org/projects/global/, last access: 21 September 2025).
Both of these stations started in 2021 and measured some of the water quality parameters. Then, the coast of Makassar (Fig. 8), which is in the Makassar Strait, is a busy area because there is a large port that coincides with the ALKI II route. Even though there is much marine activity in this area, the number of coastal measurement casts is only 37 – a small quantity for a water area that passes through one of Indonesia's three main shipping routes. The Arafuru Sea has the fewest coastal measurement casts of the four selected areas, with only one cast. The number of casts is minimal, considering that this region is one of the vital trade routes in Indonesia and is also a water area on the border of Indonesia's Exclusive Economic Zone (EEZ) and Australia's EEZ. We also assumed that most coastal monitoring efforts and data collection in the ISS region have not been conducted over the long term or with sufficient spatial coverage.
Second, while the data cover extensive depths, availability varies across the region, with some areas providing measurements up to 6000 m, while others are limited to only 800 m. These gaps limit the ability to rigorously evaluate ITF climate models, affecting confidence in predictions of ocean heat transport, monsoon variability, and ENSO dynamics. For example, as the main pathways of ITF, the limited high-resolution subsurface data in the Makassar Strait and Lombok Strait constrain the assessment of coupled climate models' performance in simulating ITF variability, which in turn impacts estimates of Pacific-Indian Ocean exchange. Similarly, the scarcity of deep-sea data in the ISS complicates assessments of long-term heat storage and ocean circulation changes, which are crucial for understanding regional climate feedback (Fig. 8).
5.2 Future direction
The ISS region plays a crucial role in global ocean circulation, serving as the primary low-latitude pathway where warm, low-salinity Pacific waters flow into the Indian Ocean via the Indonesian Throughflow (ITF). However, observational gaps limit our ability to model and predict ocean variability under climate change accurately. We believe that many oceanographic measurements in the ISS region remain abundant and are scattered across various institutions, often stored in separate databases with limited accessibility. These datasets, collected by governmental agencies, research institutions, universities, and international collaborations, are crucial for understanding long-term oceanographic trends. To address these challenges, five key observational directions must be emphasized, leveraging regional and global cooperation to enhance data coverage and knowledge-sharing.
5.2.1 Synchronized large-scale horizontal observations
Large-scale ocean monitoring is essential to understanding oceanic teleconnections, particularly how variability in the Pacific Ocean affects the Indian Ocean via the ITF. These interactions, influenced by the El Niño–Southern Oscillation (ENSO), the Indian Ocean Dipole (IOD), and monsoonal cycles, impact global climate patterns, fisheries, and biodiversity. To enhance our understanding of these interactions, synchronized observations must be conducted across broad spatial scales.
5.2.2 Deep-water and coastal observations
A significant data gap exists in the deep layers of the ITF, particularly below 800 m in key passages such as the Makassar Strait, Lombok Strait, and Timor Passage. These regions regulate ITF transport, influencing global thermohaline circulation and ocean heat distribution. However, deep-sea observations remain sparse and intermittent, limiting our ability to detect long-term changes in ocean warming and carbon sequestration. Deploying additional deep-sea Argo floats, moored buoys, and gliders within ITF pathways is essential for improving subsurface and deep-sea data coverage. Coastal monitoring initiatives, such as the NANO-DOAP Programme, play a vital role in tracking changes in Essential Ocean Variables (EOV) at different depths (Sarker et al., 2024). Expanding similar coastal monitoring networks will help bridge data gaps between large-scale oceanic processes and nearshore environmental changes. Coastal observations should be integrated with offshore data collection efforts to improve climate resilience, fisheries management, and conservation planning in Marine Protected Areas (MPAs). Long-term monitoring is crucial for detecting gradual temperature, salinity, and ocean acidification changes linked to climate change and global warming. Unfortunately, long-term observations in the ISS region remain fragmented and underfunded, creating challenges for understanding decadal ocean variability. Establishing permanent ocean monitoring stations, including deep-sea moorings and fixed observation points, is necessary to provide continuous data. These long-term datasets will improve seasonal to decadal-scale predictions and contribute to a more comprehensive understanding of climate variability. Additionally, investments in research vessels equipped with modern oceanographic instruments will be essential for conducting systematic observations across the ISS region.
5.2.3 High-frequency observations
High-frequency monitoring is essential for capturing rapid oceanic changes, such as internal waves, mesoscale eddies, and tidal mixing, which influence marine ecosystems and fisheries productivity. Traditional oceanographic cruises cannot provide the temporal resolution for such short-term phenomena. Regional and global collaboration is vital for advancing real-time data collection technologies. Leveraging cutting-edge technologies, including AI-based data interpolation, machine learning for data gap-filling, and autonomous underwater vehicles (AUVs), can enhance real-time, high-resolution observations. Furthermore, integrating in-situ and satellite-based observations will improve forecasting capabilities for extreme climate events such as prolonged droughts and intensified monsoons.
5.2.4 Interdisciplinary study
Since the existing measurement focuses on physical aspects such as temperature, salinity, and currents, an interdisciplinary approach that merges marine science, climate modelling, biogeochemistry, and socioeconomics is also important. Understanding the impacts of climate change on marine ecosystems, fisheries, and coastal communities necessitates strong global collaboration across multiple disciplines. This interdisciplinary framework will provide deeper insights into the interactions between ocean circulation, climate variability, and marine ecosystems.
5.2.5 Network and collaboration
Despite growing observational efforts, challenges in data accessibility persist due to institutional data restrictions, national security concerns, and inconsistent data management practices. Global collaboration is key to overcoming these barriers. Coordinated monitoring efforts require regional cooperation among countries bordering the Pacific and Indian Oceans, particularly through networks such as the Global Ocean Observing System (GOOS), the Indian Ocean Observing System (IndOOS), and the Argo Program. Beyond regional partnerships, global collaboration is critical to integrating ISS observations into worldwide climate models (Bax et al., 2018). Investing in research infrastructure, including vessels, offshore observatories, and real-time data-sharing systems, is essential for expanding Indonesia's global monitoring contributions. Furthermore, developing cloud-based data repositories and ensuring compliance with FAIR (Findable, Accessible, Interoperable, Reusable) standards will enhance global data accessibility and improve research collaboration (Meyssignac et al., 2019). Open-access data initiatives will promote transparency, allowing for more informed decision-making regarding marine resource management and climate adaptation strategies.
All the code and data are publicly available. The data used in this study are divided into two categories: pre-processed data and processed data. The pre-processed data were obtained from several publicly accessible sources, including the World Ocean Database 2018 (https://doi.org/10.25923/z885-h264, Boyer et al., 2018b), the Argo Program (https://argo.ucsd.edu/data/, last access: 17 August 2025), and the Tropical Atmosphere Ocean (TAO) Project (https://www.tao.ndbc.noaa.gov/tao/data_download/search_map.shtml, last access: 17 August 2025). TRITON counterpart and The Research Moored Array for African–Asian–Australian Monsoon Analysis and Prediction (RAMA) (https://www.pmel.noaa.gov/tao/drupal/disdel/, last access: 21 August 2025). Historical hydrographic data from the World Ocean Circulation Experiment (WOCE, https://ewoce.org/data/index.html, last access: 25 August 2025) and the CLIVAR and Carbon Hydrographic Data Office (CCHDO, https://cchdo.ucsd.edu/, last access: 25 August 2025). Users may use this region to download (15° N to 15° S and 90 to 140° E). Several data points were also gathered from the Padjadjaran Oceanographic Data Centre (PODC) (https://podc.fpik.unpad.ac.id, last access: 28 October 2025). PANGEAE (https://www.pangaea.de/, last access: 25 August 2025), and Coriolis Operational Oceanography (https://www.coriolis.eu.org/, last access: 25 August 2025). These datasets were downloaded in .nc or .txt formats and served as the foundational input for the subsequent analysis. The processed data, which include derived variables, statistical outputs, and visualizations, were generated during the course of this study using standardized analytical methods. These processed datasets are preserved in the Mendeley Data repository with a corresponding assigned DOI, including those from the NANO DOAP Project (TEPAST Station) (https://doi.org/10.17632/fnn6tsjckn.1, Purba et al., 2025d) Some of the metadata, such as the year of observation, project name, contributing institution, and instruments used, are also provided and sourced from the National Research Agency (BRIN), Institute of Oceanology, Chinese Academy of Science (IOCAS), and First Institute of Oceanography (FIO) (Supplement). All metadata and relevant supporting files can be accessed freely in the Supplement. The data were in the TXT file format, and we used Ocean Data View Software (ODV Ver. 5.7.2), Python, and QGIS Software to process, visualize, and analyze the data (https://doi.org/10.17632/nm5txj3fps.1, Purba et al., 2025b). We also use Python to compute the cast per half-degree grid square with syntax freely available at https://doi.org/10.17632/mbvxs72mvd.2 (Purba et al., 2025a).
This study is one of the first comprehensive inventories of oceanographic observations in the Indonesian Seas and Surroundings (ISS), offering a unique analysis of the spatial and vertical data distribution throughout the region. This research identifies critical, previously undocumented data gaps, notably in under-represented deep-sea areas and remote archipelagic regions, by combining data from numerous international programs spanning over two centuries. The study not only emphasizes historical trends in data collection but also introduces a systematic approach to data screening and validation, which ensures the reliability of future climate modelling and marine ecosystem studies. These findings are instrumental in addressing the challenges of data accessibility and coverage, setting a foundation for more equitable and inclusive oceanographic research initiatives in the era of climate change. Collecting data in this region is challenging. However, oceanographic observation stations have dramatically increased over the past two centuries, reflecting the growing recognition of oceanography's critical role in addressing environmental challenges. The acquisition of in-situ data has made substantial progress due to the advancements in autonomous technologies and international programs. Nevertheless, despite these advancements, it is essential to improve data coverage, particularly in remote archipelagic areas and deep-sea regions. Recent discoveries indicate a substantial limitation of data for depths below 800 m, which raises concerns regarding our understanding of the critical oceanic processes in these deeper layers. Many crucial phenomena, such as temperature fluctuations, nutrient cycling, and marine biodiversity dynamics, transpire at these depths. The limited data coverage in these critical zones means our comprehension of marine ecosystems' overall condition and functioning remains inadequate. By addressing these five key observational priorities, the ISS region can significantly enhance its role in global ocean monitoring and climate research. Strengthening regional and international collaborations, improving deep-sea and coastal observations, utilizing advanced monitoring technologies, and ensuring open data accessibility will provide a comprehensive understanding of ocean-climate interactions. These efforts will ultimately support better climate adaptation strategies, improved forecasting of extreme events, and sustainable marine resource management worldwide.
The supplement related to this article is available online at https://doi.org/10.5194/essd-17-7203-2025-supplement.
NPP, GMF, and WZ conceptualized the study, developed the research design, and prepared the original manuscript draft. RAM and GMF curated the research data and led the visualization process. MFA, WY, LR, FS, HW, SL, ZW, and RDS contributed to supervising the data and analysis. IF, BP, TA, and BP performed data verification and validation. WWP and MF provided data support, critical review, and substantive manuscript editing. PDS, DN, and AP carried out data screening and quality control. WZ and NPP secured financial support and coordinated project administration.
The contact author has declared that none of the authors has any competing interests.
Publisher's note: Copernicus Publications remains neutral with regard to jurisdictional claims made in the text, published maps, institutional affiliations, or any other geographical representation in this paper. While Copernicus Publications makes every effort to include appropriate place names, the final responsibility lies with the authors. Views expressed in the text are those of the authors and do not necessarily reflect the views of the publisher.
This research was supported by Universitas Padjadjaran, Institute of Oceanology, Chinese Academy of Sciences (IOCAS), and the KomitmenX Research Grant (KRG). We sincerely thank the NANO-DOAP global project, supported by the Nippon Foundation (NF) and the Partnership for Observation of the Global Ocean (POGO), CAS-ANSO Sustainable Development Research Project (SDRP-2024-02). This collaborative work is facilitated by the Sino-Indonesia Joint Laboratory for Marine Sciences (SIMS). We also thank you for the open-access data that various global oceanographic portals provided, which contributed to this study. We also appreciate the anonymous reviewers' constructive comments that improved this manuscript.
This research has been supported by the Institute of Oceanology, Chinese Academy of Sciences (IOCAS), NANO-DOAP (Global Study of Deoxygenation, Ocean Acidification and Productivity) agreement 8 August 2025.
This paper was edited by Sabine Schmidt and reviewed by two anonymous referees.
Arruda, W. Z. and Nof, D.: The Mindanao and Halmahera Eddies – Twin Eddies Induced by Nonlinearities, J. Phys. Oceanogr., 33, 2815–2830, https://doi.org/10.1175/1520-0485(2003)033<2815:TMAHEE>2.0.CO;2, 2003.
Atmadipoera, A. S. and Suteja, Y.: Deep water masses exchange induced by internal tidal waves in Ombai Strait, in: IOP Conf. Series: Earth and Environmental Science, https://doi.org/10.1088/1755-1315/176/1/012017, 2018.
Bax, N. J., Appeltans, W., Brainard, R., Duffy, J. E., Dunstan, P., Hanich, Q., Davies, H. H., Hills, J., Miloslavich, P., Muller-Karger, F. E., Simmons, S., Aburto-Oropeza, O., Batten, S., Benedetti-Cecchi, L., Checkley, D., Chiba, S., Fischer, A., Garcia, M. A., Gunn, J., Klein, E., Kudela, R. M., Marsac, F., Obura, D., Shin, Y. J., Sloyan, B., Tanhua, T., and Wilkin, J.: Linking capacity development to GOOS monitoring networks to achieve sustained ocean observation, Front. Mar. Sci., 5, 1–8, https://doi.org/10.3389/fmars.2018.00346, 2018.
Beal, L. M., Vialard, J., and Roxy, M. K.: Executive Summary: IndOOS-2: A Roadmap to Sustained Observations of the Indian Ocean for 2020–2030, https://doi.org/10.36071/clivar.rp.4-1.2019, 2019.
Bingham, F. M., Howden, S. D., and Koblinsky, C. J.: Sea surface salinity measurements in the historical database, J. Geophys. Res.-Oceans, 107, https://doi.org/10.1029/2000jc000767, 2002.
Bouruet-Aubertot, P., Cuypers, Y., Ferron, B., Dausse, D., Ménage, O., Atmadipoera, A., and Jaya, I.: Contrasted turbulence intensities in the Indonesian Throughflow: a challenge for parameterizing energy dissipation rate, Ocean Dynam., 68, 779–800, https://doi.org/10.1007/s10236-018-1159-3, 2018.
Boyer, T. P., Baranova, O. K., Coleman, C., Garcia, H. E., Grodsky, A., Locarnini, R. A., Mishonov, A. V, Paver, C. R., Reagan, J. R., Seidov, D., Smolyar, I. V., Weathers, K. W., and Zweng, M. M.: NOAA Atlas NESDIS 87, World Ocean Database 2018, NOAA, 1–207 pp., https://doi.org/10.13140/RG.2.2.34758.01602, 2018a.
Boyer, T. P., Baranova, O. K., Coleman, C., Garcia, H. E., Grodsky, A., Locarnini, R. A., Mishonov, A. V., Paver, C. R., Reagan, J. R., Seidov, D., Smolyar, I. V., Weathers, K. W., and Zweng, M. M.: World Ocean Database 2018, NOAA, https://doi.org/10.25923/z885-h264, 2018b.
Buck, J. J. H., Bainbridge, S. J., Burger, E. F., Kraberg, A. C., Casari, M., Casey, K. S., Darroch, L., Rio, J. Del, Metfies, K., Delory, E., Fischer, P. F., Gardner, T., Heffernan, R., Jirka, S., Kokkinaki, A., Loebl, M., Buttigieg, P. L., Pearlman, J. S., and Schewe, I.: Ocean data product integration through innovation-the next level of data interoperability, Front. Mar. Sci., 6, https://doi.org/10.3389/fmars.2019.00032, 2019.
Burnett, W. H., Kamenkovich, V. M., Jaffe, D. A., Gordon, A. L., and Mellor, G. L.: Dynamical Balance in the Indonesian Seas Circulation, Geophys. Res. Lett., 27, 2705–2708, https://doi.org/10.1029/2000GL011494, 2000.
CCHDO Hydrographic Data Office: CLIVAR and Carbon Hydrographic Data Office, UC San Diego Library Digital Collections, https://cchdo.ucsd.edu/ (last access: 8 December 2025), 2025.
Coatanoan, C., Metzl, N., Fieux, M., and Coste, B.: Seasonal water mass distribution in the Indonesian throughflow entering the Indian Ocean, J. Geophys. Res.-Oceans, 104, 20801–20826, https://doi.org/10.1029/1999jc900129, 1999.
Duan, Y., Liu, H., Feng, M., Song, X., Li, K., Liu, L., Liu, B., Yang, G., and Yu, W.: The onset process of the 2018/2019 Indonesian–Australian summer monsoon: The importance of the air–sea interaction, Front. Mar. Sci., 9, https://doi.org/10.3389/fmars.2022.1089493, 2023.
Fadhilah, R., Faid, G. M., Ekananda, G. A., Lestari, L., Faizal, I., Martasuganda, M. K., and Purba, N. P.: Near-Surface Oceanic Condition During a Triple Dip La Nina in the Pacific Ocean, in: Springer Proceedings in Physics, Springer, 123–136, https://doi.org/10.1007/978-981-97-0740-9_12, 2024.
Faizal, I., Purba, N. P., Valino, D. A., Sidik, M. J., Abimanyu, A., Bratasena, T., Ramdhani, F., and Wulandari, A.: A New Oceanographic Data Portal: Padjadjaran Oceanographic Data Centre (PODC), J. Segara, 17, 155–164, https://doi.org/10.15578/segara.v17i3.10289, 2021.
Farhan, A. R. and Lim, S.: Integrated coastal zone management towards Indonesia Global Ocean Observing System (INA-GOOS): Review and Recommendation, Ocean Coast. Manage., 53, 421–427, https://doi.org/10.1016/j.ocecoaman.2010.06.015, 2010.
Feng, M., Zhang, N., Liu, Q., and Wijffels, S.: The Indonesian throughflow, its variability and centennial change, Geosci. Lett., 5, https://doi.org/10.1186/s40562-018-0102-2, 2018.
Franz, G., Garcia, C. A. E., Pereira, J., de Freitas Assad, L. P., Rollnic, M., Garbossa, L. H. P., da Cunha, L. C., Lentini, C. A. D., Nobre, P., Turra, A., Trotte-Duhá, J. R., Cirano, M., Estefen, S. F., Lima, J. A. M., Paiva, A. M., Noernberg, M. A., Tanajura, C. A. S., Moutinho, J. L., Campuzano, F., Pereira, E. S., Lima, A. C., Mendonça, L. F. F., Nocko, H., Machado, L., Alvarenga, J. B. R., Martins, R. P., Böck, C. S., Toste, R., Landau, L., Miranda, T., dos Santos, F., Pellegrini, J., Juliano, M., Neves, R., and Polejack, A.: Coastal Ocean Observing and Modeling Systems in Brazil: Initiatives and Future Perspectives, Front. Mar. Sci., 8, https://doi.org/10.3389/fmars.2021.681619, 2021.
Freeman, E., Kent, E. C., Brohan, P., Cram, T., Gates, L., Huang, B., Liu, C., Smith, S. R., Worley, S. J., and Zhang, H. M.: The international comprehensive ocean-atmosphere data set – meeting users needs and future priorities, Front. Mar. Sci., 6, 1–8, https://doi.org/10.3389/fmars.2019.00435, 2019.
Garternicht, U. and Schott, F.: Heat fluxes of the Indian Ocean from a global eddy-resolving model, J. Geophys. Res.-Oceans, 102, 21147–21159, https://doi.org/10.1029/97JC01585, 1997.
Garzoli, S. L., Boebel, O., Brydene, H., Fine, R. A., Fukasawa, M., Gladyshev, S., Johnson, G., Macdonald, A., Meinen, C. S., Mercier, H., Orsi, A., Piola, A., Rintoul, S., Speich, S., Visbeck, M., and Wanninkhof, R.: Progressing Towards Global Sustained Deep Ocean Observation, in: OceanObs'09: Sustained Ocean Observation and Information for Society, 1–12, https://doi.org/10.5270/OceanObs09.cwp.34, 2010.
Gordon, A. L.: Oceanography of the Indonesian Seas and Their Through Flow, Oceanography, 18, 14–27, https://doi.org/10.5670/oceanog.2005.01, 2005.
Gould, W. J.: WOCE and TOGA-The foundations of the Global Observing System, Oceanography, 16, 24–30, https://doi.org/10.5670/oceanog.2003.05, 2003.
Gusviga, B. H., Subiyanto, Faizal, I., Yusri, S., Sari, S. K., and Purba, N. P.: Occurrence and Prediction of Coral Bleaching Based on Ocean Surface Temperature Anomalies and Global Warming in Indonesian Waters, IOP Conf. Ser. Earth Environ. Sci., 750, 1–13, https://doi.org/10.1088/1755-1315/750/1/012032, 2021.
Heryati, H., Pranowo, W. S., Purba, N. P., Rizal, A., and Yuliadi, L. P. S.: Java Sea Surface Temperature Variability during ENSO 1997–1998 and 2014–2015, Omni Akuatika, 14, 96–107, https://doi.org/10.20884/1.oa.2018.14.1.429, 2018.
Horhoruw, S. M., Fadli, M., Atmadipoera, A., Lekalette, J., Nugroho, D. Y., Tatipatta, W. M., and Kainama, F.: Horizontal Structure of Banda Eddies and the Relationship to Chlorophyll-a during South East Monsoon in Normal and ENSO Period on 2008–2010, IOP Conf. Ser. Earth Environ. Sci., https://doi.org/10.1088/1755-1315/618/1/012011, 2020.
Hu, S. and Sprintall, J.: Observed strengthening of interbasin exchange via the Indonesian seas due to rainfall intensification, Geophys. Res. Lett., 44, 1448–1456, https://doi.org/10.1002/2016GL072494, 2017.
Idris, M. S., Lee Siang, H., and Amin, R. M.: Data on sea surface biophysical parameters during different monsoon seasons, Data Brief, 28, https://doi.org/10.1016/j.dib.2019.104982, 2020.
Iskandar, I., Sari, Q. W., Setiabudiday, D., Yustian, I., and Monger, B.: The distribution and variability of chlorophyll-a bloom in the southeastern tropical Indian ocean using empirical orthogonal function analysis, Biodiversitas, 18, 1546–1555, https://doi.org/10.13057/biodiv/d180433, 2017.
Johari, A., Akhir, M. F., Satar, M. N., Zainol, Z., and Jingsong, G.: Inter-annual Changes of Water Temperature in the Southern South China Sea's Continental Shelf: The Influence of ENSO on Malaysian Waters, J. Mar. Sci. Technol., 29, https://doi.org/10.51400/2709-6998.1593, 2021.
Kashino, Y., Atmadipoera, A., Kuroda, Y., and Lukijanto: Observed features of the Halmahera and Mindanao Eddies, J. Geophys. Res.-Oceans, 118, 6543–6560, https://doi.org/10.1002/2013JC009207, 2013.
Katavouta, A., Polton, J. A., Harle, J. D., and Holt, J. T.: Effect of Tides on the Indonesian Seas Circulation and Their Role on the Volume, Heat and Salt Transports of the Indonesian Throughflow, J. Geophys. Res.-Oceans, 127, https://doi.org/10.1029/2022JC018524, 2022.
Khan, A. M. A., Ilmi, M. H., Febriani, C., Sidik, T. D. A., Azizah, F. N., Ramadhanti, D. S., and Purba, N. P.: Variability of biophysical parameters during La Niña condition in the Eastern Region of the Indian Ocean, J. Sea Res., 201, https://doi.org/10.1016/j.seares.2024.102533, 2024.
Khokiattiwong, S. and Zhu, W.: South East Asian Global Ocean Observing System (SEAGOOS)'s Activities and Its Role on Ocean Observation, in: Proceedings of the International Symposium for the Integration of Marine-related Data and Information, 7–8 December 2011, Tokyo, Japan, https://www.jodc.go.jp/internationalsymposium/finalverpresentation/1207/Dr.SOMKIATpaper.pdf (last access: 8 December 2025), 2011
Kolodziejczyk, N., Portela, E., Thierry, V., and Prigent, A.: ISASO2: recent trends and regional patterns of ocean dissolved oxygen change, Earth Syst. Sci. Data, 16, 5191–5206, https://doi.org/10.5194/essd-16-5191-2024, 2024.
Lan, J., Hong, J., and Wang, Y.: Relationship of the interannual variability of the Indonesian Throughflow with the IOD over the tropical Indian Ocean, Theor. Appl. Climatol., 97, 75–79, https://doi.org/10.1007/s00704-008-0066-9, 2009.
Lana, A. B., Kurniawati, N., Purba, N. P., and Syamsuddin, M. L.: Thermocline Layers Depth and Thickness in Indonesian Waters when Southeast Monsoon, Omni Akuatika, 37, 36–41, https://doi.org/10.1002/jor.23509, 2017.
Li, X., Yuan, D., Li, Y., Wang, Z., Wang, J., Hu, X., Yang, Y., Corvianawatie, C., Surinati, D., Budiman, A. S., Bayhaqi, A., Avianto, P., Kusmanto, E., Santoso, P. D., Purwandana, A., Ismail, M. F. A., Dirhamsyah, and Arifin, Z.: Moored Observations of Currents and Water Mass Properties between Talaud and Halmahera Islands at the Entrance of the Indonesian Seas, J. Phys. Oceanogr., 51, 3557–3572, https://doi.org/10.1175/JPO-D-21-0048.1, 2021.
Liu, Y., Qiu, M., Liu, C., and Guo, Z.: Big data challenges in ocean observation: a survey, Pers. Ubiq.Comput., 21, 55–65, https://doi.org/10.1007/s00779-016-0980-2, 2017.
Makarim, S., Sprintall, J., Liu, Z., Yu, W., Santoso, A., Yan, X.-H., and Susanto, R. D.: Previously unidentified Indonesian Throughflow pathways and freshening in the Indian Ocean during recent decades, Sci. Rep., 9, 7364, https://doi.org/10.1038/s41598-019-43841-z, 2019.
McPhaden, M. J., Busalacchi, A. J., Cheney, R., DeFlection, J. D., Gage, R., Halpern, D., Julian, P., Meyers, G., Mangum, N. J., Sato, J., Webster, P., and Woodroffe, A.: The Tropical Ocean-Global Atmosphere observing system: A decade of progress, J. Geophys. Res., 103, 14169–14240, https://doi.org/10.1029/97JC02622, 1998.
McPhaden, M. J., Connell, K. J., Foltz, G. R., Perez, R. C., and Grissom, K.: Tropical ocean observations for weather and climate: A decadal overview of the Global Tropical Moored Buoy Array, Oceanography, 36, 32–43, https://doi.org/10.5670/oceanog.2023.211, 2023.
Meyssignac, B., Boyer, T., Zhao, Z., Hakuba, M. Z., Landerer, F. W., Stammer, D., Köhl, A., Kato, S., L'Ecuyer, T., Ablain, M., Abraham, J. P., Blazquez, A., Cazenave, A., Church, J. A., Cowley, R., Cheng, L., Domingues, C., Giglio, D., Gouretski, V., Ishii, M., Johnson, G. C., Killick, R. E., Legler, D., Llovel, W., Lyman, J., Palmer, M. D., Piotrowicz, S., Purkey, S., Roemmich, D., Roca, R., Savita, A., von Schuckmann, K., Speich, S., Stephens, G., Wang, G. G., Wijffels, S. E., and Zilberman, N.: Measuring global ocean heat content to estimate the earth energy imbalance, Front. Mar. Sci., 6, https://doi.org/10.3389/fmars.2019.00432, 2019.
Moltmann, T., Turton, J., Zhang, H.-M., Nolan, G., Gouldman, C., Griesbauer, L., Willis, Z., Piniella, Á. M., Barrell, S., Andersson, E., Gallage, C., Charpentier, E., Belbeoch, M., Poli, P., Rea, A., Burger, E. F., Legler, D. M., Lumpkin, R., Meinig, C., O'Brien, K., Saha, K., Sutton, A., Zhang, D., and Zhang, Y.: A Global Ocean Observing System (GOOS), Delivered Through Enhanced Collaboration Across Regions, Communities, and New Technologies, Front. Mar. Sci., 6, 291, https://doi.org/10.3389/fmars.2019.00291, 2019.
Moore, T. S., Marra, J., and Alkatiri, A.: Response of the Banda Sea to the southeast monsoon, Mar. Ecol.-Prog. Ser., 261, 41–49, https://doi.org/10.3354/meps261041, 2003.
Pandoe, W. W., Purwoadi, M. A., Qonita, Z., Rusdiansyah, A., and Suwarjono, A.: Indonesia Cable-Based Tsunameter (InaCBT): Tsunami detection and identification on other seismic wave signals, Ocean Coast. Res., 72, https://doi.org/10.1590/2675-2824072.23154, 2024.
Prihatiningsih, I., Jaya, I., Atmadipoera, A. S., and Zuraida, R.: Stratification And Characteristic Of Water Masses In Selayar Slope-Southern Makassar Strait, Omni-Akuatika, 17, 27–36, 2021.
Purba, N. P., Pranowo, W. S., Ndah, A. B., and Nanlohy, P.: Seasonal variability of temperature, salinity, and surface currents at 0° latitude section of Indonesia seas, Reg. Stud. Mar. Sci., 44, https://doi.org/10.1016/j.rsma.2021.101772, 2021.
Purba, N. P., Faizal, I., Syamsuddin, M. L., Wulandari, A., Bratasena, T., and Therie, R.: Oceanography dataset in Bonpies archipelago as remote island in Java Seas, Indonesia, Data Brief, 40, https://doi.org/10.1016/j.dib.2021.107769, 2022.
Purba, N. P., Faid, G. M., Mulya, R. A., Zheng, W., Pandoe, W. W., Fadli, M., and Faizal, I.: Cast per half degree Grid Square Python syntax to Compute Data in Indonesian Seas and Surroundings, Mendeley Data, Version 2, Mendeley Data [code], https://doi.org/10.17632/mbvxs72mvd.2, 2025a
Purba, N. P., Faid, G. M., and Mulya, R. A.: Softwares to Process Oceanographic Data in the Indonesian Seas and Surroundings, Mendeley Data, Version 1, Mendeley Data [code], https://doi.org/10.17632/nm5txj3fps.1, 2025b
Purba, N. P., Akhir, M. F., Faid, G. M., Roseli, N. H., Sinaga, I. F., and Faizal, I.: Stratified Ocean Chlorophyll-a and Nutrient Availability in the Eastern Tropical Indian Ocean during La Nina 2022–2023, Egypt. J. Aquat. Biol. Fish., 29, 297–320, https://doi.org/10.21608/ejabf.2025.404325, 2025c.
Purba, N. P., Faid, G. M., Adithya, R. A., Wahyu, Z., Pandoe, W., Fadli, M., and Faizal, I.: Two Centuries of Oceanographic Data in the Indonesian Seas and Surroundings: Historical Trends, Gaps, and Future C, Mendeley Data, Version 1, Mendeley Data [data set], https://doi.org/10.17632/fnn6tsjckn.1, 2025d.
Putriani, P. Y., Atmadipoera, A. S., and Nugroho, D.: Interannual variability of Indonesian throughflow in the Flores Sea, IOP Conf. Ser. Earth Environ. Sci., 1–13, https://doi.org/10.1088/1755-1315/278/1/012064, 2019.
Qian, J. H., Robertson, A. W., and Moron, V.: Interactions among ENSO, the Monsoon, and Diurnal Cycle in Rainfall Variability over Java, Indonesia, J. Atmos. Sci., 67, 3509–3524, https://doi.org/10.1175/2010JAS3348.1, 2010.
Rachmayani, R., Ningsih, N. S., Februarianto, M., and Abdullah, F. A. R.: Response of upwelling variability to the local and remote forcing in the Banda Sea, IOP Conf. Ser. Earth Environ. Sci., https://doi.org/10.1088/1755-1315/339/1/012024, 2019.
Rayner, R., Jolly, C., and Gouldman, C.: Ocean observing and the blue economy, Front. Mar. Sci., 6, https://doi.org/10.3389/fmars.2019.00330, 2019.
Roemmich, D., Alford, M. H., Claustre, H., Johnson, K. S., King, B., Moum, J., Oke, P. R., Owens, W. B., Pouliquen, S., Purkey, S., Scanderbeg, M., Suga, T., Wijffels, S. E., Zilberman, N., Bakker, D., Baringer, M. O., Belbeoch, M., Bittig, H. C., Boss, E., Calil, P., Carse, F., Carval, T., Chai, F., Conchubhair, D. O., D'Ortenzio, F., Dall'Olmo, G., Desbruyères, D., Fennel, K., Fer, I., Ferrari, R., Forget, G., Freeland, H., Fujiki, T., Gehlen, M., Greenan, B., Hallberg, R., Hibiya, T., Hosoda, S., Jayne, S., Jochum, M., Johnson, G. C., Kang, K. R., Kolodziejczyk, N., Koertzinger, A., Le Traon, P. Y., Lenn, Y. D., Maze, G., Mork, K. A., Morris, T., Nagai, T., Nash, J., Garabato, A. N., Olsen, A., Pattabhi, R. R., Prakash, S., Riser, S., Schmechtig, C., Shroyer, E., Sterl, A., Sutton, P., Talley, L., Tanhua, T., Thierry, V., Thomalla, S., Toole, J., Troisi, A., Trull, T., Turton, J. D., Velez-Belchi, P. J., Walczowski, W., Wang, H., Wanninkhof, R., Waterhouse, A., Watson, A., Wilson, C., Wong, A. P., Xu, J., and Yasuda, I.: On the future of Argo: A global, full-depth, multi-disciplinary array, Front. Mar. Sci., 6, 1–28, https://doi.org/10.3389/fmars.2019.00439, 2019.
Rugebregt, M. J., Hudiyono, S., Utomo, S. W., Nurhati, I. S., Susanto, P. D., Fadli, M., Pesilette, R. N., and Ruli, F.: Indonesian Through-Flow Water Mass Circulation in the Makassar Strait and Lombok Strait, Indonesia, Migrat. Lett., 20, 1190–1198, 2023.
Sarker, S., Krug, L. A., Islam, K. M., Basak, S. C., Huda, A. N. M. S., Hossain, M. S., Das, N., Riya, S. C., Liyana, E., and Chowdhury, G. W.: An integrated coastal ecosystem monitoring strategy: Pilot case in Naf-Saint Martin Peninsula, Bangladesh, Sci. Total Environ., 913, https://doi.org/10.1016/j.scitotenv.2023.169718, 2024.
Schlitzer, R.: Ocean Data View, https://epic.awi.de/id/eprint/56921/ (last access: 8 December 2025), 2024.
Schuckmann, K., Le Traon, P.-Y., Smith, N., Pascual, A., Djavidnia, S., Gattuso, J.-P., Grégoire, M., and Nolan, G.: Copernicus Marine Service Ocean State Report, Issue 3, J. Oper. Oceanogr., 12, s1–s123, https://doi.org/10.1080/1755876X.2019.1633075, 2019.
Shinoda, T., Han, W., Metzger, E. J., and Hurlburt, H. E.: Seasonal Variation of the Indonesian Throughflow in Makassar Strait, J. Phys. Oceanogr., 42, 1099–1123, https://doi.org/10.1175/JPO-D-11-0120.1, 2012.
Sidik, T. D. A., Febriani, C., Ilmi, M. H., Azizah, F. N., Ramadhanti, D. S., Faid, G. M., Faizal, I., Martasuganda, M. K., and Purba, N. P.: Sea Surface Conditions of the Milky Sea Phenomenon in the Southern Java Sea: Analysis of SST, Chlorophyll-a, and Nutrient Fluctuations, Egypt. J. Aquat. Biol. Fish., 29, 997–1021, https://doi.org/10.21608/EJABF.2025.407761, 2025.
Silveira, T. M., Carapuço, M. M., and Miranda, J. M.: The Ever-Changing and Challenging Role of Ocean Observation: From Local Initiatives to an Oceanwide Collaborative Effort, Front. Mar. Sci., 8, https://doi.org/10.3389/fmars.2021.778452, 2022.
Sprintall, J., Gordon, A. L., Wijffels, S. E., Feng, M., Hu, S., Koch-Larrouy, A., Phillips, H., Nugroho, D., Napitu, A., Pujiana, K., Dwi Susanto, R., Sloyan, B., Yuan, D., Riama, N. F., Siswanto, S., Kuswardani, A., Arifin, Z., Wahyudi, A. J., Zhou, H., Nagai, T., Ansong, J. K., Bourdalle-Badié, R., Chanut, J., Lyard, F., Arbic, B. K., Ramdhani, A., and Setiawan, A.: Detecting change in the Indonesian seas, Front. Mar. Sci., 6, https://doi.org/10.3389/fmars.2019.00257, 2019.
Susanto, R. D., Fang, G., Soesilo, I., Zheng, Q., Qiao, F., Wei, Z., and Sulistyo, B.: New surveys of a branch of the Indonesian throughflow, Eos (Washington D.C.), 91, 261–263, https://doi.org/10.1029/2010EO300002, 2010.
Tillinger, D. and Gordon, A. L.: Fifty years of the Indonesian throughflow, J. Climate, 22, 6342–6355, https://doi.org/10.1175/2009JCLI2981.1, 2009.
Valdany, F. A., Ihsan, Y. N., Yuliadi, L. P., and Purba, N. P.: The Condition of Acidity, Phosphate, And Nitrate in Indonesian Waters, Omni-Akuatika, 18, 90, https://doi.org/10.20884/1.oa.2022.18.2.912, 2022.
van Aken, H. M.: Dutch Oceanographic Research in Indonesia in Colonial Times, Oceanography, 18, 30–41, https://doi.org/10.5670/oceanog.2005.03, 2005.
Vance, T. C., Wengren, M., Burger, E. F., Hernandez, D., Kearns, T., Merati, N., O'Brien, K. M., O'Neil, J., Potemra, J., Signell, R. P., and Wilcox, K.: From the Oceans to the Cloud: Opportunities and challenges for data, models, computation and workflows, Front. Mar. Sci., 6, 1–18, https://doi.org/10.3389/fmars.2019.00211, 2019.
von Schuckmann, K., Holland, E., Haugan, P., and Thomson, P.: Ocean science, data, and services for the UN 2030 Sustainable Development Goals, Mar. Policy, 121, 104154, https://doi.org/10.1016/j.marpol.2020.104154, 2020.
Wang, J., Yuan, D., and Zhao, X.: Impacts of Indonesian Throughflow on seasonal circulation in the equatorial Indian Ocean, Chin. J. Oceanol. Limnol., 35, 1261–1274, https://doi.org/10.1007/s00343-017-6196-0, 2017.
Webb, P.: Introduction to oceanography, Roger Williams University, https://rwu.pressbooks.pub/webboceanography/ (last access: 17 June 2025), 2021.
Weller, R. A., Baker, D. J., Glackin, M. M., Roberts, S. J., Schmitt, R. W., Twigg, E. S., and Vimont, D. J.: The challenge of sustaining ocean observations, Front. Mar. Sci., 6, 1–18, https://doi.org/10.3389/fmars.2019.00105, 2019.
Whitt, C., Pearlman, J., Polagye, B., Caimi, F., Muller-Karger, F., Copping, A., Spence, H., Madhusudhana, S., Kirkwood, W., Grosjean, L., Fiaz, B. M., Singh, S., Singh, S., Manalang, D., Gupta, A. Sen, Maguer, A., Buck, J. J. H., Marouchos, A., Atmanand, M. A., Venkatesan, R., Narayanaswamy, V., Testor, P., Douglas, E., de Halleux, S., and Khalsa, S. J.: Future Vision for Autonomous Ocean Observations, Front. Mar. Sci., 7, https://doi.org/10.3389/fmars.2020.00697, 2020.
Wijffels, S. E., Meyers, G., and Godfrey, S. J.: A 20-yr average of the Indonesian throughflow: Regional currents and the interbasin exchange, J. Phys. Oceanogr., 38, 1965–1978, https://doi.org/10.1175/2008JPO3987.1, 2008.
Wisetya Dewi, Y., Wirasatriya, A., Nugroho Sugianto, D., Helmi, M., Marwoto, J., and Maslukah, L.: Effect of ENSO and IOD on the Variability of Sea Surface Temperature (SST) in Java Sea, IOP Conf. Ser. Earth Environ. Sci., https://doi.org/10.1088/1755-1315/530/1/012007, 2020.
WOCE International Project Office: WOCE observations 1990–1998: a summary of the WOCE global data resource, WOCE Rep. 179/02, Alfred Wegener Institute/WOCE IPO, Southampton, https://epic.awi.de/id/eprint/28794/1/WOC2003a.pdf (last access: 8 December 2025), 2003.
Woo, M. U. N. and Pattiaratchi, C. B.: How the Capes current ends: an investigation of a west Australian coastal current using an autonomous ocean glider, in: Proceedings of the 15th Physics of Estuaries and Coastal Seas (PECS) conference, 14–17 September 2010, Colombo, Sri Lanka, 14–17, https://doi.org/10.13140/2.1.4854.6244, 2010.
Zweng, M. M., Boyer, T. P., Baranova, O. K., Reagan, J. R., Seidov, D., and Smolyar, I. V.: An inventory of Arctic Ocean data in the World Ocean Database, Earth Syst. Sci. Data, 10, 677–687, https://doi.org/10.5194/essd-10-677-2018, 2018.
Indonesia's seas link the Pacific and Indian Oceans and shape weather and climate. We analyzed more than 460 000 ocean measurements and found major gaps, especially in deep waters and coastal areas. Most data come from ship routes, leaving many regions unobserved. These gaps limit our ability to understand currents and climate patterns. We propose expanding modern ocean monitoring tools to improve future predictions.
Indonesia's seas link the Pacific and Indian Oceans and shape weather and climate. We analyzed...