the Creative Commons Attribution 4.0 License.
the Creative Commons Attribution 4.0 License.
A submesoscale eddy identification dataset in the northwest Pacific Ocean derived from GOCI I chlorophyll a data based on deep learning
Ge Chen
Jie Yang
Zhipeng Gui
Dehua Peng
This paper presents a dataset on the identification of submesoscale eddies, derived from high-resolution chlorophyll a data captured by GOCI I in the northwest Pacific Ocean. Our methodology involves a combination of digital image processing, filtering, and object detection techniques, along with a specific chlorophyll a image enhancement procedure to extract essential information about submesoscale eddies. This information includes their time, polarity, geographical coordinates of the eddy center, eddy radius, coordinates of the upper left and lower right corners of the prediction box, area of the eddy's inner ellipse, and confidence score. The dataset spans eight time intervals, ranging from 00:00 to 08:00 (UTC) daily, covering the period from 1 April 2011 to 31 March 2021. A total of 19 136 anticyclonic eddies and 93 897 cyclonic eddies were identified, with a minimum confidence threshold of 0.2. The mean radius of anticyclonic eddies is 24.44 km (range 2.5 to 44.25 km), while that of cyclonic eddies is 12.34 km (range 1.75 to 44 km). This unprecedented hourly resolution dataset on submesoscale eddies offers valuable insights into their distribution, morphology, and energy dissipation. It significantly contributes to our understanding of marine environments, ecosystems, and the improvement of climate model predictions. The dataset is available at https://doi.org/10.5281/zenodo.13989785 (Wang and Yang, 2023).
- Article
(16342 KB) - Full-text XML
-
Supplement
(1600 KB) - BibTeX
- EndNote
Submesoscale eddies (SMEs) are one of the strong ageostrophic submesoscale processes in the ocean, with horizontal scales ranging from several to tens of kilometers and vertical scales of tens to hundreds of meters. SMEs are intermediate between the mesoscale and the microscale and typically exhibit a short lifespan ranging from hours to days (McWilliams, 2019; Durand et al., 2010; Thomas et al., 2008). SMEs' spirals on the sea result from the cat's eye circulation associated with horizontal shear instability (Munk et al., 2000). SMEs are often energized by the strong mixing induced by ocean currents' instabilities, the convergence of fronts, or the influence of topographic features (Thomas, 2012; Taylor and Thompson, 2023). SMEs are crucial in material and energy exchange, influencing biochemical cycles, marine food webs, and climate change (Lévy et al., 2012, 2018; Wang et al., 2022b). Given their significant impact, SMEs have emerged as a prominent area of research within oceanography.
Numerical simulations are currently the main method used to study SMEs systematically. These simulations provide researchers with a detailed understanding of SMEs by generating a large amount of data that can be analyzed to understand their characteristics, formation, and evolution (Zhang et al., 2020; Cao et al., 2021; Dong et al., 2020; Marchesiello et al., 2011; Chrysagi et al., 2021). However, it is essential to acknowledge that numerical simulations often idealize various parameters in fluid mechanics, which may deviate from the ocean's complex and constantly changing nature (Garabato et al., 2022). In contrast, other analytical methods such as satellite observations, in situ measurements and laboratory experiments are still insufficient for studying SMEs. Studying submesoscale processes presents two primary challenges. Firstly, these processes operate at very small spatial and temporal scales, challenging direct field observations. Presently, the available field observation schemes are expensive and sparse, leading to a lack of comprehensive and systematic global results (e.g., dense submerged buoy arrays and ship-based towed conductivity, temperature, and depth (CTD) measurements). Secondly, there is still a lack of a clear definition of submesoscale processes in terms of dynamics. It appears that these processes at least include frontal instability processes at the edges of mesoscale eddies, inertial gravity waves falling into submesoscale spatiotemporal scales, vortex Rossby waves on mesoscale eddies, and SMEs, etc. (Zhang and Qiu, 2018).
Many studies have utilized machine learning methods to detect, track, and predict mesoscale eddies, owing to the abundance of reliable altimeter observations and the well-developed theory surrounding them (Duo et al., 2019; Choi and Kim, 2018; Franz et al., 2018; Ge et al., 2023; Huang et al., 2022). However, theoretical investigations of SMEs face a shortage of observational data due to the inadequacy of altimeter spatial and temporal resolutions for their detection. Moreover, even with alternative high-resolution observational approaches, submesoscale processes often remain obscured amid the large-scale ocean processes.
Observations of SMEs have been conducted using synthetic aperture radar (SAR) images to identify “black” and “white” eddies (Dokken and Wahl, 1996; Fu and Ferrari, 2008; Xu et al., 2015; Ji et al., 2021; Hamze-Ziabari et al., 2022). Additionally, the existence of submesoscale processes affecting the movement of phytoplankton patches was first observed in 1980 (Gower et al., 1980). Various methods, such as manual labeling, algorithmic identification, and machine learning, are employed to observe SMEs (Park et al., 2012; Ni et al., 2021; Xia et al., 2022). Certain methods, such as SAR and altimeter, solely offer physical insights into the ocean's surface and do not encompass the biological or chemical processes within the eddies. In contrast, using phytoplankton to identify eddies enables researchers to obtain information about the composition and activity of the biological communities residing within the eddies. It is essential to recognize that the utilization of SAR images typically necessitates supplementary data processing and intricate algorithms for the precise identification of SMEs, which can be a laborious and time-consuming task.
We used a combination of digital image processing, filtering, artificial intelligence, and small object detection techniques to identify a large number of SMEs from high-resolution chlorophyll distribution images. We calculated their relevant characteristic information to form the SME dataset. The paper is organized as follows: Sect. 2.1 provides a detailed description of the chlorophyll data used in the study. Next, Sect. 2.2.1 describes the methodology used to highlight SMEs in chlorophyll images. This is followed by Sect. 2.2.2 and 2.2.3, where we elaborate on the machine learning recognition process. Finally, in Sects. 3, 4, and 5, we present the results of our study, provide information on the acquisition of the dataset, and summarize the whole research.
2.1 Chlorophyll a data
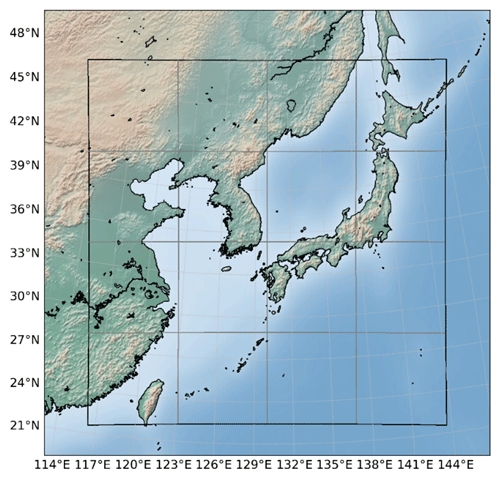
The chlorophyll a (CHL) data used in this study were obtained by applying the OCI empirical algorithm to Level-2 data acquired by the Geostationary Ocean Color Imager I (GOCI) aboard the Oceanography and Meteorology Satellite (COMS) (Ryu et al., 2012; Hu et al., 2012). The GOCI data have a spatial resolution of 500 m and a temporal resolution of 1 h. Measurements were taken within an area of 2500 km×2500 km (center: 36° N, 130° E) and a 20 min window between 00:00 and 08:00 UTC from 1 April 2011 to 31 March 2021. The array size of the data is 5685 in the meridional direction and 5567 in the zonal direction. One unique feature of the GOCI is its geostationary orbit, which allows it to continuously observe the same region of the Earth without moving relative to the ground. This makes it particularly useful for monitoring dynamic ocean phenomena such as coastal currents and ocean color. The GOCI coverage area is illustrated in Fig. 1.
2.2 Identification method
2.2.1 Enhancement of chlorophyll image
Figure 2 presents the flowchart of the CHL image enhancement technique. In the following sections, we will provide a detailed description of each step, explaining the role and parameter selection.
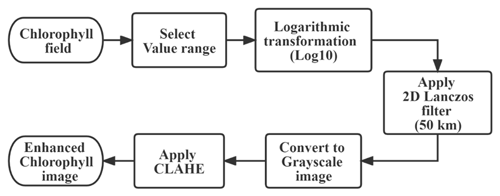
Figure 2The flowchart of the CHL image enhancement. We have selected a data range of 0.001–20 (mg m3) based on the CHL value range of the satellite coverage area. Before applying the contrast-limited adaptive histogram equalization (CLAHE), we will assign a value of 0, i.e., black display, to invalid regions such as those occluded by clouds.
In coastal areas, the vast difference in CHL concentration between coastal and oceanic regions, spanning several orders of magnitude, allows for a more straightforward visual interpretation of SMEs. However, the distinction is nearly indistinguishable in regions characterized by low CHL concentration. Therefore, applying a logarithmic transformation to CHL data is often necessary when plotting CHL fields to avoid color-stacking displays. Employing logarithmic scaling facilitates differentiation among areas with varying CHL concentrations, resulting in more lucid and informative CHL maps. Nonetheless, relying solely on logarithmic transformation proves insufficient, as shown in Fig. 3a. Large-scale circulation, mesoscale eddies, waves, and other processes at larger scales mask the CHL variability caused by submesoscale processes. A 2-D Lanczos filter with a half-power cut-off wavelength of 50 km was utilized to address this issue. This choice of cut-off wavelength aligns with the sea surface height field as depicted in Fig. 3b (Pegliasco et al., 2022).
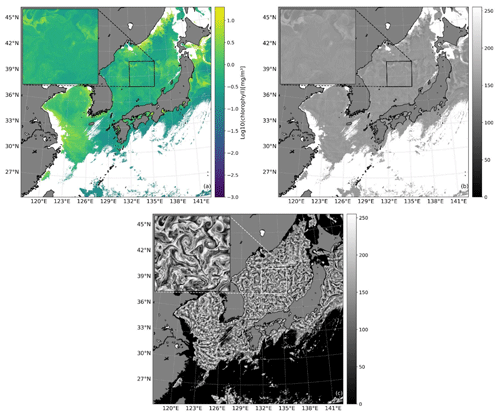
Figure 3A comparison of different CHL image enhancement methods (5 April 2011 at 03:00 UTC). (a) The CHL values were selected in the range of 0–20 mg m−3, and then log10 transformation was applied to them. (b) Apply a 2-D Lanczos filter with a half-power cut-off wavelength of 50 km to image (a) and convert it to a grayscale image with a range of 0–255 for visualization. (c) The final effect of enhancing the entire CHL image by applying CLAHE to image (b). For each image, the top-left inset displays a 3× magnified view of the boxed region in the image, allowing for a clear visualization of the effect of each step in the image enhancement process on the high-resolution image.
We conducted testing on the half-power cut-off wavelength of the filter and observed that when the wavelength is overly long, it tends to obscure the spiral structure within mesoscale eddies, making it challenging to distinguish SMEs and their polarity. Conversely, too short a wavelength generates numerous discontinuous vortex filaments, making it difficult to identify relatively closed SMEs (refer to Fig. 4).
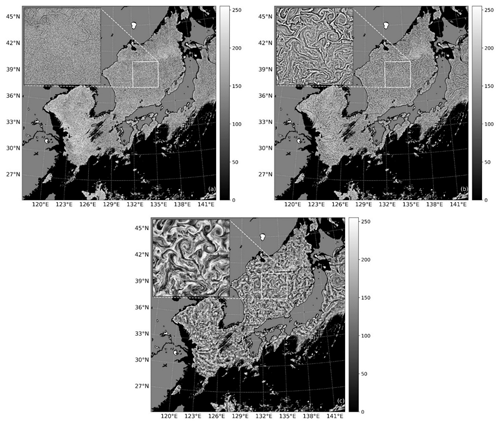
Figure 4A comparison of the CHL image enhancement results using different filter cut-off wavelengths (5 April 2011 at 03:00 UTC). Panels (a), (b), and (c) show the results obtained by selecting a half-power cut-off filter wavelength of 1, 5, and 200 km, respectively.
Finally, we adopted a contrast-limited adaptive histogram equalization (CLAHE) image enhancement technique to highlight the SMEs with the same display effect in the entire image (refer to Fig. 3c). Adaptive histogram equalization (AHE) is a widely used technique for image contrast enhancement, which calculates the image's histogram and applies a nonlinear transformation to stretch the intensity values. However, AHE can lead to excessive amplification of noise in relatively uniform areas of the image. CLAHE is a modification of AHE that helps avoid this problem by limiting the amplification of the contrast to a certain predefined value (Zuiderveld, 1994; Vidhya and Ramesh, 2017). This approach involves dividing the image into small regions, called tiles, and then applying AHE to each tile individually. The CLAHE is employed to improve the clarity of chlorophyll spirals, enabling the training and identification of these spirals using AI in sea areas with chlorophyll concentration differences spanning several orders of magnitude using the same training dataset.
The general histogram equalization formula is the following:
where v represents the intensity of any pixel in the image, h represents the histogram equalization function, cdf is the cumulative distribution function of the image pixel intensities, cdfmin is the minimum non-zero value of the cumulative distribution function, M is the width and N the height of the image, and L is the number of gray levels used (in most cases, 256).
Considering the horizontal scale of SMEs, a sliding window size of 100×100 was chosen when applying adaptive histogram equalization with contrast limiting. Furthermore, the CHL data were transformed into a grayscale image to optimize the visualization and alleviate the computational load for machine learning.
2.2.2 Establishment of the train set
Due to the high image resolution, it is not feasible to categorize the entire image into cyclonic eddies, anticyclonic eddies, and non-eddy regions for eddy recognition model training. As a result, we adopted a labeling strategy that categorized labels into three types: cyclone eddies (CEs), anticyclone eddies (AEs), and bounding boxes (BOXs). The discrimination between cyclones and anticyclones was based on the rotation direction of the eddy-modulated CHL spiral curves from the outside to the inside, which is consistent with the rotation direction of the two types in the Northern Hemisphere, where cyclones rotate counterclockwise and anticyclones rotate clockwise (Chelton et al., 2011; Zhang and Qiu, 2020; Wang et al., 2023). Subsequently, we extracted the BOX from high-resolution images as actual training images for the network. A total of 513 BOXs were annotated, including 160 anticyclones and 500 cyclones. To enhance model robustness and increase training sample diversity, data augmentation techniques, such as adding salt-and-pepper noise, histogram equalization, random angle rotating images, and random Gaussian noise to images, were employed, as shown in Fig. 5.
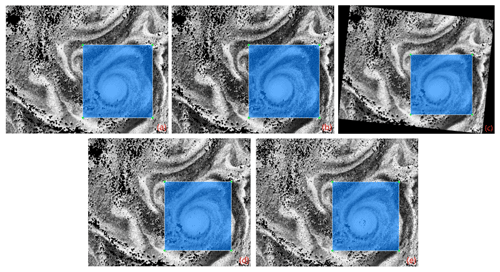
Figure 5Different approaches for the sample set augmentation. An example of a marked CE in a BOX, including the original image (a) and images modified using histogram equalization (b), random angle rotation (c), salt-and-pepper noise (d), and random Gaussian noise (e). After rotation, the parallel marking box is the minimum bounding rectangle of the rotated marking box.
To minimize the uncertainty of establishing the training set manually, we list the following five criteria, as shown in Fig. 6.
-
Chlorophyll spirals should exhibit evident rotation for at least one circle.
-
There should be no more than a 50 % overlap between adjacent SMEs.
-
The entire spiral structure of an eddy is supposed to be labeled rather than just its central part region.
-
Partially missing SMEs meeting the above three criteria should also be labeled.
-
When in doubt about labeling, priority should be given to annotating eddies clearly.
2.2.3 Image preprocessing and SME identification
Detecting small targets in high-resolution images poses a highly challenging task. Small targets are characterized either by their relatively small size compared to the entire image or by having a minor difference in pixel value compared to surrounding pixels. SMEs fully comply with both definitions and are ubiquitous and intertwined with CHL fields. Therefore, we developed an image preprocessing method for identifying SMEs, which includes an image cropping method based on the eddy radius and the conversion between the image and the geographical coordinate system. The cropped image resolution is 640×640, and the overlap percent is calculated based on the diameter of the SMEs, following Eq. (2):
where OP is the overlap percent, D is the maximum diameter of SMEs (100 km), SR is the spatial resolution (0.5 km), and PS is the size of cropped images (640). By applying this calculation, an original image with dimensions of 5685×5567 can be divided into 12×12 small images through cropping, with each cropped image having its corresponding row and column number in the original image. To ensure the effectiveness of the CHL data, we set a requirement that the CHL data rate in each cropped image should not be less than 5 %. The geographic coordinates of the cropped image are calculated based on the row and column numbers of the cropped image and the transformation relationship between the image coordinate system and the geographic coordinate system of the original image. If (x,y) is an image coordinate point in the cropped image, then its geographic coordinate (long, lat) can be calculated as follows in Eq. (3):
where the function f describes the correspondence between the original image coordinates and the geographic coordinates, and col and row represent the column and row number of their corresponding cropped images in the original image, respectively. The flowchart of the overall process of identifying SMEs and generating datasets using enhanced chlorophyll images is shown in Fig. 7.
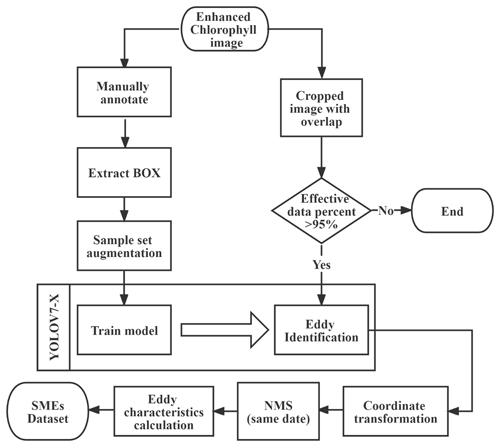
Figure 7The flowchart of identifying SMEs and generating SME datasets using enhanced chlorophyll images.
We used the YOLOv7-X model for identifying SMEs, which perfectly balances speed and accuracy (Wang et al., 2022a). YOLOv7-X was obtained by increasing the number of layers and the number of features extracted per layer in the YOLOv7 model, aiming to amplify the model for improved performance in object detection tasks. The structure of YOLOv7-X mainly consists of three parts: backbone feature extraction network part, strengthen feature extraction network, and YOLO head. To accelerate model convergence and reduce memory consumption, the Adam optimizer is selected to automatically learn the parameters of all models. The loss function of our model inherits the loss function of the YOLO series, which mainly includes shape loss, confidence loss, and classification loss of the predicted box. The total loss function of object detection is defined by the following Eq. (4):
where lossshape, lossconfidence, and lossclass denote the shape loss, confidence loss, and classification loss of the predicted anchor box, respectively; the confidence is a signal to judge whether the anchor box contains objects. Their basic components are binary cross-entropy loss and mean squared error loss (Redmon and Farhadi, 2018; Bochkovskiy et al., 2020; Ge et al., 2021).
Furthermore, a non-maximum suppression technique was utilized to merge them to avoid repeated identification of eddies in the overlapping regions of the cropped images. Since many eddies are formed from the same unstable currents and often overlap, we set the intersection-over-union (IoU) threshold for non-maximum suppression to 20 %. The IoU is the overlap ratio between the detected box (DT) and the corresponding ground truth box (GT). The IoU can be calculated by the following Eq. (5):
where S represents the pixel areas of the anchor box, SDT∩SGT is the intersection area of DT and GT, and SDT∪SGT denotes their union area.
The identification results within 5 pixels of the image edges were removed to ensure the detection of complete eddies. Within the model, flip transformation for image enhancement was turned off, and non-maximum suppression was applied to different categories of eddies to prevent the model from classifying the same eddy differently.
2.2.4 Cloud cover in the identification
The results of SME identification based on the ocean color remote sensing images can not represent the actual distribution pattern of SMEs. The primary obstacle that affects the identification of eddies using this method is the obscuring of ocean color remote sensing signals by cloud cover, which varies across different regions, months, and times of the day. To tackle this problem, we calculated the cloud occlusion probability (cop) for each grid using invalid CHL data, as follows (Eq. 6):
where mask(time,grid) is a Boolean daily grid array (5685, 5567) of whether the data corresponding to hour and month are masked, and fn(time) is the total number of the CHL files at the corresponding to hour and month. Therefore, by using cop, we can roughly calculate the number of detected eddies without cloud cover, as follows (Eq. 7):
where TN is the number of eddies detected after removing cloud cover, and EN is the actual number of detected eddies.
3.1 Identification results of SMEs
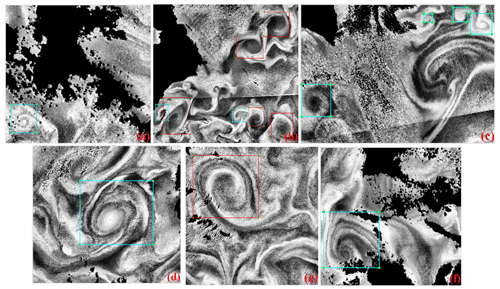
We obtained 29 158 files spanning 1 April 2011 to 31 March 2021, resulting in approximately 7.3 TB of data. The chlorophyll data were extracted and utilized for image enhancement, generating a corresponding set of images. Ultimately, we obtained a total of 544 760 cropped images to identify SMEs. A total of 19 136 anticyclonic eddies and 93 897 cyclonic eddies were identified at the minimum confidence threshold of 0.2. As shown in Fig. 8, our method can effectively identify SMEs from the chlorophyll field, and the chlorophyll spirals traced by the SMEs indicate their position and size. In the AEs, the direction of rotation of the chlorophyll spirals from the outside to the inside is clockwise, whereas in CEs, it is the opposite. The higher the confidence in the identification results, the greater the reliability of the identification results.
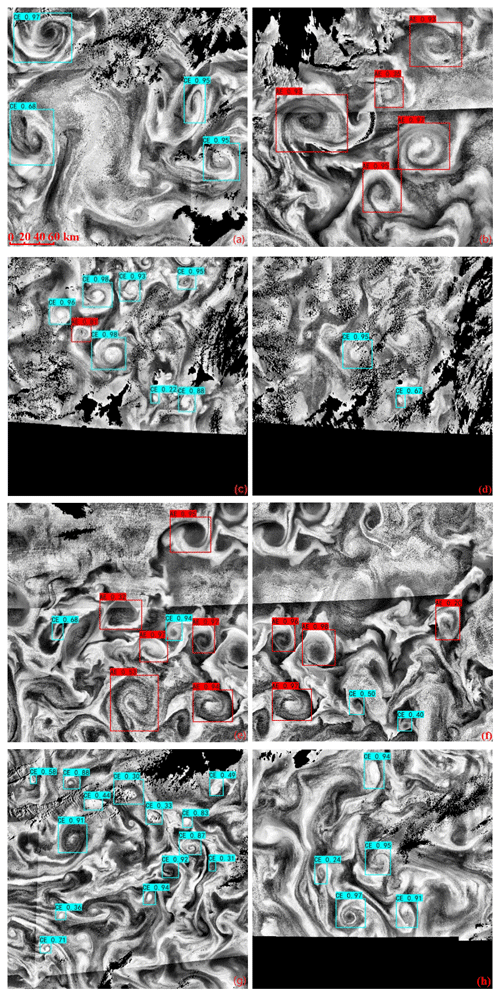
Figure 8Image identification results of SMEs. The blue box represents CE, the red box represents AE, and the number in the upper left corner of each identification box is the confidence score. Panels (c) and (d) show the identification results of the same location at different times of the same day, and panels (e) and (f) show the identification results of adjacent cropped images.
Using the CLAHE technique, the subtle stitching marks became visible in Fig. 8b and f, which are the apparent horizontal dividing lines resulting from the joining of different slots. These stitching marks result from several minutes of measurement interval between slots, leading to variations in chlorophyll values between overlapping slots. Figure 8c and d illustrate that the energy of the SMEs dissipates within just 2 h, making it difficult to trace them in the chlorophyll field. On the other hand, Fig. 8e and f demonstrate the effectiveness of cropped images with a 100 km overlap in preventing missed detections at the edges. Furthermore, the eddies recognized in the overlapping area differ, but they can be eliminated through non-maximum suppression.
Given that the ratio in the detection results is 4.9, this discrepancy could impact subsequent scientific research and lead to erroneous conclusions. To address this issue, the CE category was downsampled to equalize the number of AE and CE samples. After data augmentation, 674 CE and 673 AE samples were used to retrain the model. Due to the reduced training sample size, the retrained model achieved a mean average precision (mAP) of 81.58 % at IoU=0.5. For the image data collected at 03:00 UTC, the model identified 2193 AE and 4461 CE instances, with recall rates of 58.42 % and 81.54 %, respectively. This suggests that even with a model trained on balanced samples, the detection counts for the two categories still exhibit a multiplicative difference.
Given the inherent unpredictability and lack of transparency in deep learning models, relying solely on detection results is insufficient to fully explain these differences. It remains necessary to provide theoretical evidence to determine whether an actual imbalance exists in the occurrence of different types of submesoscale eddies. Nonetheless, since the detected eddies in the dataset were correctly identified, the data can still support meaningful scientific research.
3.2 Geographic and temporal distribution of SMEs
We quantified the coverage frequency of each grid cell by AEs or CEs and reduced the correlation between the spatiotemporal distribution of SMEs and the cop by the method of Sect. 2.2.4. Figure 9 shows that AEs are mainly distributed in the Sea of Japan along the convergence zone of warm and cold currents. Conversely, CEs show a more uniform distribution, with a relatively higher concentration in the vicinity of offshore currents.
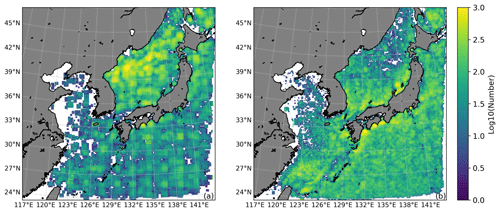
Figure 9Geographical distribution map of SMEs identified. The left figure is for anticyclones (a), and the right is for cyclones (b). The grids where eddies were identified were summed up by time and month after removing the cloud cover factor. Due to the significant differences in the number of eddy geographical distributions, a logarithmic transformation was used for plotting.
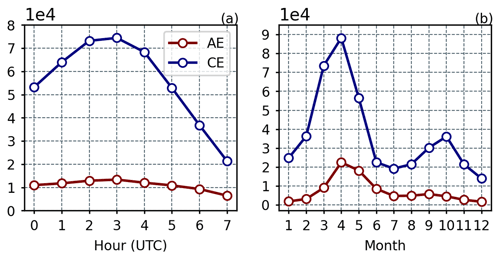
As shown in Fig. 10, both AEs and CEs display similar variation patterns in terms of quantity about hour and season. When calculating the local time at the central longitude of 130° E in the region, the highest number of identified SMEs occurs at around 11:40 UTC. Regarding seasonal variation, both AEs and CEs experience peak numbers in April, with an additional peak in autumn. These peaks in the number of identified eddies coincide with the times of the strongest variations in sea surface temperature, salinity, and wind conditions.
3.3 SMEs' characteristic statistics
In Fig. 11a and b, the diameter distribution of AEs is relatively uniform, whereas the radius of CEs is concentrated within 40 km, perhaps because the CHL field stirred by smaller-scale AEs is challenging to observe. Observed AEs and CEs have the same confidence scores distribution and a majority of the detected eddies have high confidence scores in Fig. 11c and d. To better study SMEs, eddies with higher confidence scores can be selected for analysis. The observed SMEs are non-geostrophic, and their diameter does not decrease with increasing latitude when comparing the estimated Rossby deformation radius in Fig. 11e and f. Additionally, it can be seen that the diameters of SMEs at different latitudes can differ by about 30 km, with the majority of CEs being smaller than the average Rossby deformation radius at the corresponding latitude.
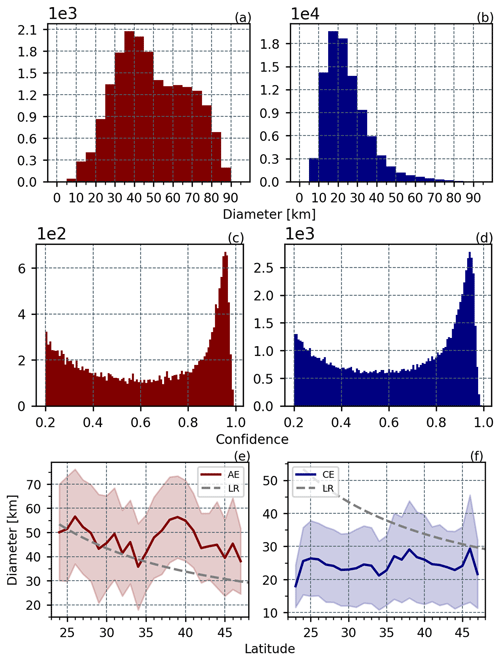
Figure 11Panels (a) and (b) show the diameter distribution histograms of AE and CE, respectively; panels (c) and (d) show the confidence score distribution histograms of AE and CE, respectively; and panels (e) and (f) show the variation of diameter with latitude for AE and CE and the standard deviation, respectively. The dashed gray line represents the variation of the Rossby radius of deformation with latitude (), where g′ is the reduced gravitational acceleration, D is the water depth, and f is the Coriolis parameter.
3.4 Performance of the model for eddy identification
To evaluate the detection performance of the modified YOLOv7-X, some evaluation metrics were used: precision, recall, F1 score, average precision (AP), and mean average precision (mAP). The precision and recall are defined successively using Eqs. (8) and (9):
where TP, FP, and FN denote the number of true positive, true negative, and false positive anchor boxes, respectively. In our experiment, the TP means the number of boxes whose IoU is more significant than 0.5 between the predicted and ground truth boxes.
In addition, the F1 score measures the comprehensive performance of the network, which can be calculated based on precision and recall.
The precision and recall of a specific category are used to draw curves in the 2-D coordinate system, and the area under the curve constitutes the AP of this category.
According to Eq. (11), mAP can be furnished, which represents the average of all categories of AP:
The AP and mAP are commonly considered indicators of model quality. Generally speaking, the two indicators and model quality are positively correlated.
The evaluation metrics in Table 1 demonstrate that the modified YOLOv7-X model, trained using our method on processed and labeled samples, has achieved outstanding performance. From the recall, it can be observed that fewer AEs were identified compared to CEs; this could be attributed to a bias in the number of training sets for AEs and CEs.
When training with a custom dataset, parameters can be fine-tuned based on metrics like mAP (mean average precision), or techniques such as learning rate schedulers can be employed to dynamically adjust the learning rate. Methods like grid search or random search can also be used to explore different combinations of weights and learning rates, with cross-validation serving as a useful tool to evaluate model performance. When selecting a learning rate, note that a higher rate can lead to instability in training and risk missing the optimal solution, while a lower rate may slow down convergence, increasing training time. Regarding the number of weights, too few may result in underfitting, whereas too many can cause overfitting. These optimizations are specialized tasks in deep learning. While technical improvements can further enhance the detection rate of submesoscale eddies, the current dataset's size and quality are already sufficient to support meaningful scientific research.
3.5 Validation and confidence threshold verification using drifter hourly trajectory data
We have matched SMEs with drifter hourly trajectory data, successfully identifying 2177 eddies whose diameters are less than 100 km, and their confidence scores range from 0 to 1. As depicted in Fig. 12a, SMEs are primarily distributed at the periphery of mesoscale eddies, while the drifter trajectories are situated within the mesoscale eddies. To determine whether the drifter trajectory is influenced by mesoscale eddies or is instead the result of SMEs, we refer to Fig. 12b. In this instance, no mesoscale eddies are observed in the vicinity of the drifter trajectory. This observation provides strong evidence that the structure of SMEs exists and possesses the capability to alter drifter trajectories.
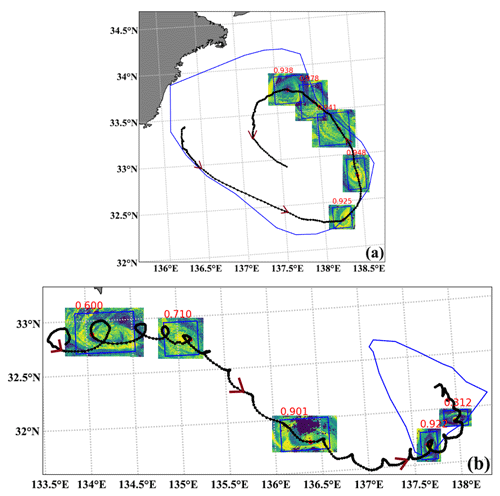
Figure 12Drifter trajectory and SME matching diagram. The black line represents the drifter trajectory, the black points indicate hourly position points, rectangular boxes identify SMEs, and the upper numbers represent the confidence of SME identification. Non-rectangular shapes represent mesoscale cyclonic eddies, and red arrows indicate the drifter's movement direction. The red dots highlight the spatiotemporal matching point between the SMEs and drifter trajectory. (a) Drifter ID 109244, with SME identification times from 2 May 2013 to 6 June 2013 at 00:00 UTC daily. (b) Drifter ID 300534060522490, with SME identification times on 11 March 2021 at 01:00, 14 March 2021 at 02:00, 18 March 2021 at 01:00, 23 March 2021 at 04:00, and 26 March 2021 at 01:00 (all times are in UTC).
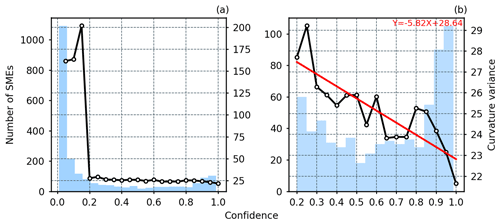
To quantitatively validate the choice of the confidence threshold, we conducted multiple experiments and discovered a correlation between the curvature variance of the drifter trajectory matched by SMEs and the confidence level. The average diameter of this SME dataset is 28 km, and the typical global drifter movement speed is 20 cm s−1. Consequently, each SME can accommodate 40 drifter hourly track points. For analysis, we consider the 20 drifter hourly trajectory points before and after the spatiotemporal matching point of the eddy and drifter trajectory. We calculate the curvature of a circle fitted to every three points, subsequently removing one maximum and one minimum to compute the curvature variance. Curvature variance can describe the degree of curvature variation of drifter trajectories in SMEs. The smaller the curvature variance is, the more stable the influence of SMEs on drifters and the smoother the direction change of drifters.
As depicted in Fig. 13a, a significant anomaly in curvature variance is observed when the confidence of eddies is below 0.2. This indicates the presence of issues, such as incorrect identification and identification of the continental margins. Figure 13b reveals an inverse relationship between confidence and curvature variance. Specifically, higher confidence corresponds to smaller curvature variance, implying more pronounced and smoother chlorophyll spirals.
3.6 Validation and comparison using sea surface temperature
We conducted a comparison between sea surface temperature (SST) data and high-resolution CHL data with significant spatiotemporal trajectory overlap, as illustrated in Fig. 14. Despite the lower spatial resolution of SST data (1 km) compared to the high-resolution CHL data (500 m), SMEs also conduct spiral modulation effects on SST. This means the method for identifying SMEs can be extended to sea surface skin temperature products. Figure 14e and f reveal that eddies with higher confidence levels are more pronounced on SST. The main reason for the difference in identification results is that the deep learning model is trained according to the chlorophyll data, and the resolution of SST is half that of CHL.
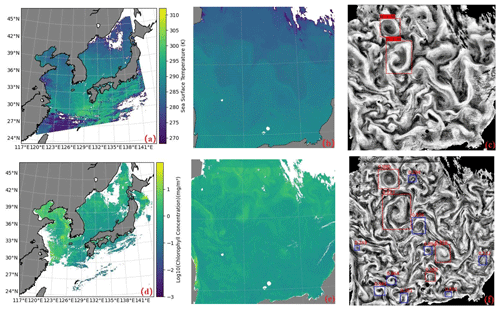
Figure 14A comparison of SME identification between sea surface temperature and GOCI chlorophyll. Panels (a), (b), and (c) represent the MODIS Level 2 sea surface temperature at 04:00 UTC on 7 May 2019, with local amplification and image enhancement, while panels (d), (e), and (f) depict the corresponding chlorophyll distribution map from GOCI. The SMEs and their associated confidence have been overlaid onto the images. The red box indicates AEs, and the blue box corresponds to CEs.
3.7 Validation and comparison of the identification results using Sentinel-3 chlorophyll image
The blue–green spectral bands, calculation coefficients, and image resolutions used for chlorophyll inversion are different between GOCI and OLCI sensors. Nonetheless, as indicated in Fig. 15, this method demonstrates certain applicability. Comparatively, the OLCI sensor with a resolution of 300 m presents more detailed results, capable of identifying S-shaped eddies not visible in Fig. 15c. However, due to the reliance on GOCI images for training, the confidence score of the eddy in Fig. 15d is diminished.
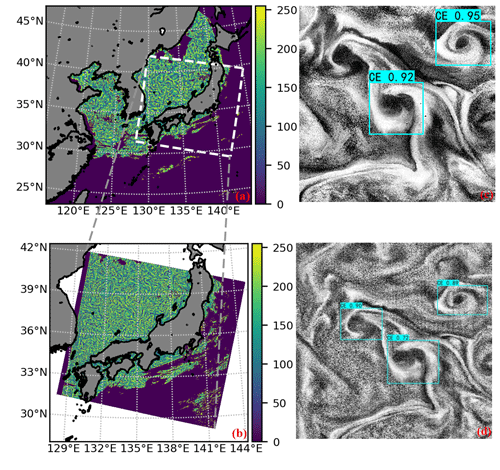
Figure 15A comparison of SMEs identified in chlorophyll images from the GOCI and Sentinel-3 OLCI sensors. Panel (a) is the GOCI enhanced chlorophyll image taken at 01:00 UTC on 7 May 2019, and panel (b) is the Sentinel-3B OLCI enhanced chlorophyll image taken at a similar time. Panels (c) and (d) are the respective identification results of panels (a) and (b).
3.8 Validation and comparison of the identification results using the mesoscale eddy dataset
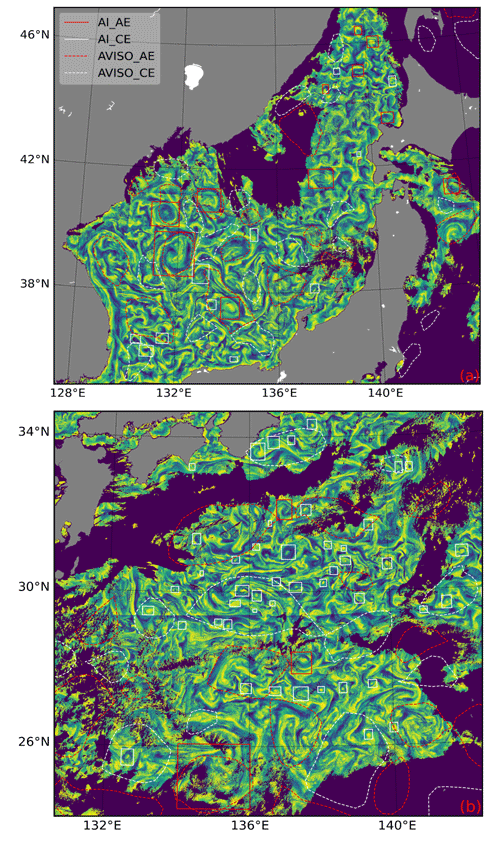
Altimetry is commonly used to identify mesoscale eddies through sea level height data. However, a global mesoscale eddy dataset is obtained by optimal interpolation, which reduces spatial and temporal resolutions. Therefore, we show the comparison between our identification results of SMEs and mesoscale eddies identified by altimetry on the same day in Fig. 16. Although altimetry identifies a more significant number of eddies and is unaffected by cloud cover, our method provides a more detailed identification of SMEs. Many eddies identified by different methods exhibit consistent spatial scales and locations. However, the altimeter fails to identify numerous SMEs within and outside the mesoscale eddies. These SMEs are reflected in our identification results, which are based on the mapping of their physical properties to the chlorophyll field.
The SME v1.0 dataset is saved in JSON format and can be accessed at https://doi.org/10.5281/zenodo.13989785 (Wang and Yang, 2023). The dataset contains information about each identified eddy, including polarity, location, time, geographic coordinates of the predicted box, radius of the inscribed circle, area of the inscribed ellipse, confidence score, and other relevant information. The Supplement contains detailed information about the variables. The code is publicly available at https://github.com/Asita-yan/yolov7-eddy-CHL-GOCI (Wang, 2024).
Other data utilized in this paper can be downloaded from the following websites:
-
GOCI I – https://oceandata.sci.gsfc.nasa.gov/directdataaccess/Level-2/GOCI (last access: 13 December 2024, https://doi.org/10.5067/COMS/GOCI/L2/OC/2014, NASA Goddard Space Flight Center, 2014),
-
Sentinel-3B – https://oceandata.sci.gsfc.nasa.gov/directdataaccess/Level-2/S3B-OLCI/2019/07-May-2019 (last access: 13 December 2024, https://doi.org/10.5067/SENTINEL-3B/OLCI/L2/EFR/OC/2022, NASA Goddard Space Flight Center et al., 2022),
-
mesoscale eddy – https://www.aviso.altimetry.fr/en/data/products/value-added-products/global-mesoscale-eddy-trajectory-product.html (last access: 13 December 2024, https://doi.org/10.24400/527896/a01-2022.005.220209, SSALTO/DUACS, 2024),
-
MODIS SST – https://podaac.jpl.nasa.gov/dataset/MODIS_A-JPL-L2P-v2019.0 (last access: 13 December 2024, https://doi.org/10.5067/GHMDA-2PJ19, JPL/OBPG/RSMAS, 2024),
-
drifter hourly trajectory – https://www.aoml.noaa.gov/phod/gdp/hourly_data.php (last access: 13 December 2024, https://doi.org/10.25921/x46c-3620, Elipot et al., 2022).
Eddies can stir and maintain surface ocean chlorophyll and modulate temperature, mixing layer depth, and euphotic layer depth. As a result, eddies can be observed from the chlorophyll spiral structures on the sea surface. With high-spatiotemporal-resolution chlorophyll data from ocean color sensors, we suppressed large-scale ocean signals by filtering and highlighted eddy-induced chlorophyll spirals by specific image enhancement. Moreover, we modified YOLOv7-X for SME detection and achieved a map score of 97.32 % for these small targets. We identified a total of 19 136 anticyclonic eddies and 93 897 cyclonic eddies from eight CHL images per day for 10 years at the minimum confidence threshold of 0.2, with the number of cyclonic eddies being 4.9 times that of anticyclonic eddies. The mean radius of anticyclonic eddies was 24.44 km (range 2.5 to 44.25 km), while that of cyclonic eddies was 12.34 km (range 1.75 to 44 km). The mean radius of cyclonic eddies was half that of anticyclonic eddies. The identified cyclonic eddies were mainly concentrated in offshore flow regions, while anticyclonic eddies were primarily distributed in the Japan Sea. The number of cyclonic and anticyclonic eddies followed the same pattern over time, increasing and decreasing from around 09:00 to 16:00 UTC, with a peak around 12:00 UTC. There were two peaks in the seasonal variation of both types of eddies, in spring and autumn, both occurring when the mixed layer was relatively unstable. By comparing with chlorophyll products retrieved from OLCI sensors using different bands at a resolution of 300 m, we found that the modified deep learning model had a certain degree of universality. Compared with the mesoscale eddy dataset, the positions and sizes of the eddies identified by the two methods were highly similar.
However, as this is the first hour-level resolution dataset covering 10 years for SMEs in the northwest Pacific Ocean, there are several important points to note when using it. Firstly, submesoscale activities can influence chlorophyll a distributions through various mechanisms, including nonlinear interactions, frontogenesis, mixed-layer instability, surface forcing, and symmetric instability (Mahadevan, 2016). This implies that the submesoscale process is not limited to a mere form of SMEs or a spiral structure. Secondly, differentiating between mesoscale and submesoscale motion primarily hinges on the relative significance of Earth's rotation, with the Rossby number for submesoscale motion being around 1 (Taylor and Thompson, 2023). It is worth noting that the identification of SMEs in this paper relies on diameter, so not all of them meet the requirement that the Rossby number is approximately equal to 1. Thirdly, submesoscale motions have been emphasized as potential mechanisms for transferring energy from ocean mesoscale processes to small-scale turbulence and dissipation scales (Ferrari and Wunsch, 2009; McWilliams, 2016). In other words, the spiral structure of SMEs may not always be clear and continuous due to energy transfer. Finally, surface eddies of cyclonic vorticity are slightly more frequent than anticyclonic eddies, whereas subsurface eddies are mainly associated with anticyclonic vorticity and would be as frequent as surface anticyclonic eddies (Colas et al., 2012; Combes et al., 2015). This indicates that the SME dataset primarily represents surface SMEs. Furthermore, setting the confidence threshold may exclude many real SMEs to avoid retaining the identification of disputed eddies. Nonetheless, the method proposed in this paper effectively detects SMEs, and the presence of chlorophyll spirals induced by SMEs provides a credible and direct representation of their physical properties within the chlorophyll field. These research findings hold considerable scientific significance for a deeper understanding of the role of SMEs in marine ecosystems and their impact on the marine environment.
The supplement related to this article is available online at: https://doi.org/10.5194/essd-16-5737-2024-supplement.
Conceptualization, YW; methodology, YW; validation, YW; visualization, YW; writing (original draft preparation), YW; writing (review and editing), YW, JY, DP, ZG, and GC; funding acquisition, JY and GC. All authors have read and agreed to the published version of the paper.
The contact author has declared that none of the authors has any competing interests.
Publisher's note: Copernicus Publications remains neutral with regard to jurisdictional claims made in the text, published maps, institutional affiliations, or any other geographical representation in this paper. While Copernicus Publications makes every effort to include appropriate place names, the final responsibility lies with the authors.
This research was jointly supported by Laoshan Laboratory Science and Technology innovation projects (no. LSKJ202201302), the National Natural Science Foundation of China (grant nos. 42030406, 42276203, and 42276179), and the International Research Center of Big Data for Sustainable Development Goals (no. CBAS2022GSP01).
This paper was edited by Dagmar Hainbucher and reviewed by Qianguo Xing and one anonymous referee.
Bochkovskiy, A., Wang, C.-Y., and Liao, H.-Y. M.: YOLOv4: Optimal Speed and Accuracy of Object Detection, arXiv [preprint], https://doi.org/10.48550/arXiv.2004.10934, 2020.
Cao, H., Fox-Kemper, B., and Jing, Z.: Submesoscale eddies in the upper ocean of the kuroshio extension from high-resolution simulation: energy budget, J. Phys. Oceanogr., 51, 2181–2201, 2021.
Chelton, D. B., Gaube, P., Schlax, M. G., Early, J. J., and Samelson, R. M.: The Influence of Nonlinear Mesoscale Eddies on Near-Surface Oceanic Chlorophyll, Science, 334, 328–332, https://doi.org/10/cz6575, 2011.
Choi, J. M. and Kim, W.: Applications of Surface Velocity Current Derived from Geostationary Ocean Color Imager (GOCI), in: 2018 OCEANS-MTS/IEEE Kobe Techno-Oceans (OTO), Kobe, Japan, https://doi.org/10.1109/OCEANSKOBE.2018.8559174, 28–31 May 2018.
Chrysagi, E., Umlauf, L., Holtermann, P., Klingbeil, K., and Burchard, H.: High-resolution simulations of submesoscale processes in the Baltic Sea: The role of storm events, J. Geophys. Res.-Oceans, 126, e2020JC016411, https://doi.org/10/grwbpd, 2021.
Colas, F., McWilliams, J. C., Capet, X., and Kurian, J.: Heat balance and eddies in the Peru-Chile current system, Clim. Dynam., 39, 509–529, https://doi.org/10.1007/s00382-011-1170-6, 2012.
Combes, V., Hormazabal, S., and Di Lorenzo, E.: Interannual variability of the subsurface eddy field in the Southeast Pacific, J. Geophys. Res.-Oceans, 120, 4907–4924, https://doi.org/10.1002/2014JC010265, 2015.
Dokken, S. T. and Wahl, T.: Observations of spiral eddies along the Norwegian Coast in ERS SAR images, http://18.195.19.6/handle/20.500.12242/1449 (last access: 13 December 2024), 1996.
Dong, J., Fox-Kemper, B., Zhang, H., and Dong, C.: The scale of submesoscale baroclinic instability globally, J. Phys. Oceanogr., 50, 2649–2667, https://doi.org/10/grwbpc, 2020.
Duo, Z., Wang, W., and Wang, H.: Oceanic Mesoscale Eddy Detection Method Based on Deep Learning, Remote Sens.-Basel, 11, 1921, https://doi.org/10.3390/rs11161921, 2019.
Durand, M., Fu, L.-L., Lettenmaier, D. P., Alsdorf, D. E., Rodriguez, E., and Esteban-Fernandez, D.: The Surface Water and Ocean Topography Mission: Observing Terrestrial Surface Water and Oceanic Submesoscale Eddies, P. IEEE, 98, 766–779, https://doi.org/10/dp5pnh, 2010.
Elipot, S., Sykulski, A., Lumpkin, R., Centurioni, L., and Pazos, M.: Hourly location, current velocity, and temperature collected from Global Drifter Program drifters world-wide, NOAA National Centers for Environmental Information [data set], https://doi.org/10.25921/x46c-3620 2022.
Ferrari, R. and Wunsch, C.: Ocean Circulation Kinetic Energy: Reservoirs, Sources, and Sinks, Annu. Rev. Fluid Mech., 41, 253–282, https://doi.org/10.1146/annurev.fluid.40.111406.102139, 2009.
Franz, K., Roscher, R., Milioto, A., Wenzel, S., and Kusche, J.: Ocean Eddy Identification and Tracking Using Neural Networks, in: IGARSS 2018 – 2018 IEEE International Geoscience and Remote Sensing Symposium, IGARSS 2018 – 2018 IEEE International Geoscience and Remote Sensing Symposium, Valencia, Spain, 6887–6890, https://doi.org/10.1109/IGARSS.2018.8519261, 22–27 July 2018.
Fu, L.-L. and Ferrari, R.: Observing oceanic submesoscale processes from space, Eos T. Am. Geophys. Un., 89, 488–488, https://doi.org/10/dj97v4, 2008.
Garabato, A. C. N., Yu, X., Callies, J., Barkan, R., Polzin, K. L., Frajka-Williams, E. E., Buckingham, C. E., and Griffies, S. M.: Kinetic energy transfers between mesoscale and submesoscale motions in the open ocean's upper layers, J. Phys. Oceanogr., 52, 75–97, https://doi.org/10/grv9xk, 2022.
Ge, L., Huang, B., Chen, X., and Chen, G.: Medium-Range Trajectory Prediction Network Compliant to Physical Constraint for Oceanic Eddy, IEEE T. Geosci. Remote, 61, 1–14, https://doi.org/10.1109/TGRS.2023.3298020, 2023.
Ge, Z., Liu, S., Wang, F., Li, Z., and Sun, J.: YOLOX: Exceeding YOLO Series in 2021, arXiv [preprint], https://doi.org/10.48550/arXiv.2107.08430, 2021.
Gower, J. F. R., Denman, K. L., and Holyer, R. J.: Phytoplankton patchiness indicates the fluctuation spectrum of mesoscale oceanic structure, Nature, 288, 157–159, https://doi.org/10/bb7xzf, 1980.
Hamze-Ziabari, S. M., Foroughan, M., Lemmin, U., and Barry, D. A.: Monitoring mesoscale to submesoscale processes in large lakes with Sentinel-1 SAR imagery: The Case of Lake Geneva, Remote Sens.-Basel, 14, 4967, https://doi.org/10.3390/rs14194967, 2022.
Hu, C., Lee, Z., and Franz, B.: Chlorophyll a algorithms for oligotrophic oceans: A novel approach based on three-band reflectance difference: A novel ocean chlorophyll a algorithm, J. Geophys. Res., 117, C01011, https://doi.org/10/b82xr2, 2012.
Huang, B., Ge, L., Chen, X., and Chen, G.: Vertical Structure-Based Classification of Oceanic Eddy Using 3-D Convolutional Neural Network, IEEE T. Geosci. Remote, 60, 1–14, https://doi.org/10.1109/TGRS.2021.3103251, 2022.
Ji, Y., Xu, G., Dong, C., Yang, J., and Xia, C.: Submesoscale eddies in the East China Sea detected from SAR images, Acta Oceanol. Sin., 40, 18–26, https://doi.org/10/grvn52, 2021.
JPL/OBPG/RSMAS: MODIS Aqua L2P swath SST data set. Ver. 2019.0. PO.DAAC, CA, USA [data set], https://doi.org/10.5067/GHMDA-2PJ19, 2020.
Lévy, M., Ferrari, R., Franks, P. J. S., Martin, A. P., and Rivière, P.: Bringing physics to life at the submesoscale, Geophys. Res. Lett., 39, L14602, https://doi.org/10/ggbm2h, 2012.
Lévy, M., Franks, P. J., and Smith, K. S.: The role of submesoscale currents in structuring marine ecosystems, Nat. Commun., 9, 4758, https://doi.org/10/gf6nb9, 2018.
Mahadevan, A.: The Impact of Submesoscale Physics on Primary Productivity of Plankton, Annu. Rev. Mar. Sci., 8, 161–184, https://doi.org/10.1146/annurev-marine-010814-015912, 2016.
Marchesiello, P., Capet, X., Menkes, C., and Kennan, S. C.: Submesoscale dynamics in tropical instability waves, Ocean Model., 39, 31–46, https://doi.org/10/dgx7rx, 2011.
McWilliams, J. C.: Submesoscale currents in the ocean, P. Roy. Soc. A-Math. Phy., 472, 20160117, https://doi.org/10/gf4bsc, 2016.
McWilliams, J. C.: A survey of submesoscale currents, Geoscience Letters, 6, 1–15, https://doi.org/10/gg8x8f, 2019.
Munk, W., Armi, L., Fischer, K., and Zachariasen, F.: Spirals on the sea, P. Roy. Soc. Lond. A Mat., 456, 1217–1280, https://doi.org/10.1098/rspa.2000.0560, 2000.
NASA Goddard Space Flight Center, Ocean Ecology Laboratory, and Ocean Biology Processing Group: Geostationary Ocean Color Imager (GOCI) Level-2 Ocean Color Data, NASA OB.DAAC, Greenbelt, MD, USA [data set], https://doi.org/10.5067/COMS/GOCI/L2/OC/2014, 2014.
NASA Goddard Space Flight Center, Ocean Ecology Laboratory, and Ocean Biology Processing Group: Ocean and Land Colour Imager (OLCI) Level-2 Earth-observation Full Resolution (EFR) Ocean Color (OC) Data, NASA OB.DAAC, Greenbelt, MD, USA [data set], https://doi.org/10.5067/SENTINEL-3B/OLCI/L2/EFR/OC/2022, 2022.
Ni, Q., Zhai, X., Wilson, C., Chen, C., and Chen, D.: Submesoscale Eddies in the South China Sea, Geophys. Res. Lett., 48, e2020GL091555, https://doi.org/10/gk4vh7, 2021.
Park, K.-A., Woo, H.-J., and Ryu, J.-H.: Spatial scales of mesoscale eddies from GOCI Chlorophyll a concentration images in the East/Japan Sea, Ocean Sci. J., 47, 347–358, https://doi.org/10/grvn5z, 2012.
Pegliasco, C., Delepoulle, A., Mason, E., Morrow, R., Faugère, Y., and Dibarboure, G.: META3.1exp: a new global mesoscale eddy trajectory atlas derived from altimetry, Earth Syst. Sci. Data, 14, 1087–1107, https://doi.org/10.5194/essd-14-1087-2022, 2022.
Redmon, J. and Farhadi, A.: YOLOv3: An Incremental Improvement, arXiv [preprint], https://doi.org/10.48550/arXiv.1804.02767, 2018.
Ryu, J.-H., Han, H.-J., Cho, S., Park, Y.-J., and Ahn, Y.-H.: Overview of geostationary ocean color imager (GOCI) and GOCI data processing system (GDPS), Ocean Sci. J., 47, 223–233, https://doi.org/10/ggfx4h, 2012.
SSALTO/DUACS: Mesoscale Eddy Trajectories Atlas (META3.2 DT), AVISO+ [data set], https://doi.org/10.24400/527896/a01-2022.005.220209, last access: 13 December 2024.
Taylor, J. R. and Thompson, A. F.: Submesoscale Dynamics in the Upper Ocean, Annu. Rev. Fluid Mech., 55, 103–127, https://doi.org/10.1146/annurev-fluid-031422-095147, 2023.
Thomas, L. N.: On the effects of frontogenetic strain on symmetric instability and inertia–gravity waves, J. Fluid Mech., 711, 620–640, https://doi.org/10/f4f7s7, 2012.
Thomas, L. N., Tandon, A., and Mahadevan, A.: Submesoscale processes and dynamics, in: Geophysical Monograph Series, vol. 177, edited by: Hecht, M. W. and Hasumi, H., American Geophysical Union, Washington, D. C., 17–38, https://doi.org/10.1029/177GM04, 2008.
Vidhya, G. R. and Ramesh, H.: Effectiveness of Contrast Limited Adaptive Histogram Equalization Technique on Multispectral Satellite Imagery, in: Proceedings of the International Conference on Video and Image Processing, ICVIP 2017: International Conference on Video and Image Processing, Singapore, 234–239, https://doi.org/10.1145/3177404.3177409, 27–29 December 2017.
Wang, Y.: yolov7-eddy-CHL-GOCI, GitHub [code], https://github.com/Asita-yan/yolov7-eddy-CHL-GOCI, last access: 13 December 2024.
Wang, C.-Y., Bochkovskiy, A., and Liao, H.-Y. M.: YOLOv7: Trainable bag-of-freebies sets new state-of-the-art for real-time object detectors, arXiv [preprint], https://doi.org/10.48550/arXiv.2207.02696, 6 July 2022a.
Wang, S., Jing, Z., Wu, L., Cai, W., Chang, P., Wang, H., Geng, T., Danabasoglu, G., Chen, Z., and Ma, X.: El Niño/Southern Oscillation inhibited by submesoscale ocean eddies, Nat. Geosci., 15, 112–117, https://doi.org/10/gqnh6q, 2022b.
Wang, Y. and Yang, J.: A Submesoscale Eddy Identification Dataset Derived from GOCI I Chlorophyll a Data based on Deep Learning, Zenodo [data set], https://doi.org/10.5281/zenodo.7694115, 2023.
Wang, Y., Yang, J., and Chen, G.: Euphotic Zone Depth Anomaly in Global Mesoscale Eddies by Multi-Mission Fusion Data, Remote Sens.-Basel, 15, 1062, https://doi.org/10/grwp33, 2023.
Xia, L., Chen, G., Chen, X., Ge, L., and Huang, B.: Submesoscale oceanic eddy detection in SAR images using context and edge association network, Front. Mar. Sci., 9, 1023624, https://doi.org/10/grwb2n, 2022.
Xu, G., Yang, J., Dong, C., Chen, D., and Wang, J.: Statistical study of submesoscale eddies identified from synthetic aperture radar images in the Luzon Strait and adjacent seas, Int. J. Remote Sens., 36, 4621–4631, https://doi.org/10.1080/01431161.2015.1084431, 2015.
Zhang, Z. and Qiu, B.: Evolution of Submesoscale Ageostrophic Motions Through the Life Cycle of Oceanic Mesoscale Eddies, Geophys. Res. Lett., 45, 11847–11855, https://doi.org/10/gffhq4, 2018.
Zhang, Z. and Qiu, B.: Surface Chlorophyll Enhancement in Mesoscale Eddies by Submesoscale Spiral Bands, Geophys. Res. Lett., 47, e2020GL088820, https://doi.org/10/gjpqfg, 2020.
Zhang, Z., Zhang, Y., Qiu, B., Sasaki, H., Sun, Z., Zhang, X., Zhao, W., and Tian, J.: Spatiotemporal characteristics and generation mechanisms of submesoscale currents in the northeastern South China Sea revealed by numerical simulations, J. Geophys. Res.-Oceans, 125, e2019JC015404, https://doi.org/10/gnqttd, 2020.
Zuiderveld, K.: Contrast limited adaptive histogram equalization, Graphics Gems, Academic Press, 474–485, https://doi.org/10/grwng6, 1994.


