the Creative Commons Attribution 4.0 License.
the Creative Commons Attribution 4.0 License.
 | 23 Jun 2022
A 30 m annual maize phenology dataset from 1985 to 2020 in China
Quandi Niu
Xuecao Li
Jianxi Huang
Hai Huang
Xianda Huang
Wei Su
Wenping Yuan
Crop phenology indicators provide essential information on crop growth phases, which are highly required for agroecosystem management and yield estimation. Previous crop phenology studies were mainly conducted using coarse-resolution (e.g., 500 m) satellite data, such as the moderate resolution imaging spectroradiometer (MODIS) data. However, precision agriculture requires higher resolution phenology information of crops for better agroecosystem management, and this requirement can be met by long-term and fine-resolution Landsat observations. In this study, we generated the first national maize phenology product with a fine spatial resolution (30 m) and a long temporal span (1985–2020) in China, using all available Landsat images on the Google Earth Engine (GEE) platform. First, we extracted long-term mean phenological indicators using the harmonic model, including the v3 (i.e., the date when the third leaf is fully expanded) and the maturity phases (i.e., when the dry weight of maize grains first reaches the maximum). Second, we identified the annual dynamics of phenological indicators by measuring the difference in dates when the vegetation index in a specific year reaches the same magnitude as its long-term mean. The derived maize phenology datasets are consistent with in situ observations from the agricultural meteorological stations and the PhenoCam network. Besides, the derived fine-resolution phenology dataset agrees well with the MODIS phenology product regarding the spatial patterns and temporal dynamics. Furthermore, we observed a noticeable difference in maize phenology temporal trends before and after 2000, which is likely attributable to the changes in temperature and precipitation, which further altered the farming activities. The extracted maize phenology dataset can support precise yield estimation and deepen our understanding of the future agroecosystem response to global warming. The data are available at https://doi.org/10.6084/m9.figshare.16437054 (Niu et al., 2021).
- Article
(10373 KB) - Full-text XML
-
Supplement
(424 KB) - BibTeX
- EndNote


Accurate and timely crop phenology information, which contains multi-phase growth information from sowing to harvest, is highly required for precision agriculture management (Gao and Zhang, 2021; Zeng et al., 2020), such as irrigation schedules and pest control. The agriculture management schemes should be precisely scheduled according to different growth phases, during which period the water requirements and the possibilities of pest and disease events are different (Yang et al., 2021; Xiao et al., 2020). Besides, the effect of climate change on crop phenology has been widely reported (Abbas et al., 2017; Zhang and Tao, 2013; Tao et al., 2012). Given that the altered growth phases of crops will influence crop production, further research into the response of crop phenology to global warming is necessary, which requires long-term records of phenology change. In addition, information on crop phenology is also helpful for crop mapping because different crops vary in their growth phases (Sakamoto et al., 2014; Zhong et al., 2014; Zhang et al., 2014; Huang et al., 2019b).
Remote sensing has become a profound tool for deriving crop phenology on a large scale (Pan et al., 2015; Liu et al., 2018). The annual variations of crop phenology are affected by many factors, including climate conditions, soil properties, and anthropogenic activities (e.g., sowing dates) (He et al., 2020). The traditional in situ based crop phenology recording is time-consuming and focuses on limited sites (Gao and Zhang, 2021). These limitations have been considerably mitigated by satellite images, which provide revisit observations of crop growth at regional and global scales (Shanmugapriya et al., 2019; Zhang et al., 2003; Cao et al., 2015). Different phenological indicators (such as the start of season and the end of season) are retrieved for crop growth monitoring using satellite observations, including the moderate resolution imaging spectroradiometer (MODIS) data (Sakamoto et al., 2010), the advanced very high resolution radiometer (AVHRR) data (Zhang et al., 2014; Gim et al., 2020). The retrieved multiple phenological indicators can delineate the development stages of crops from sowing to harvest at a regional and global scale.
Fine resolution Landsat satellite data show great potential in providing crop phenological indicators with a fine resolution and a long-term span. Despite the fact that the coarse satellite data (such as MODIS and AVHRR) have a fine temporal resolution, which is helpful to depict the crop growth phases, they are limited in the spatial resolution. Recently, several attempts have been made at deriving phenology datasets using fine resolution satellite data, such as Landsat (Li et al., 2019; Senf et al., 2017), Sentinel-2 (Bolton et al., 2020), and the harmonized Landsat8 and Sentinel-2 (HLS) data (Claverie et al., 2018; Bolton et al., 2020). Compared with medium-resolution satellite data, such as MODIS, the Landsat satellite data can provide numerous land surface records from 1985 to the present, which help to derive the long-term crop phenology dynamics. Unfortunately, limited attempts have been made using Landsat data to map the crop phenology with a fine resolution and a long-term span in China due to the complex planting patterns (Luo et al., 2020; Wu et al., 2010). Also, the computing resources required for such a mapping project are a huge challenge (Dong et al., 2016).
The advent of the Google Earth Engine (GEE) platform relieves the huge stress of data storage and computing at regional and global scales. The GEE platform has included petabyte-scale remote sensing data with high-performance computing capabilities and powerful algorithm libraries (Gorelick et al., 2017). Presently, many successful studies have been conducted using the GEE platform, such as mapping forest dynamics (Xiong et al., 2020), terrace (Cao et al., 2021), and surface water (Pekel et al., 2016). It is convenient to obtain and process satellite data using the GEE platform. The combination of massive satellite observations and a flexible development environment makes it possible to derive annual dynamics of crop phenology with fine resolution in China.
In this study, we extracted spatial and temporal patterns of maize phenology indicators in China from Landsat observations using the GEE platform. The derived phenology indicators include v3 (the date when the third leaf is fully expanded) and maturity (i.e., when the dry weight of maize grains first reaches the maximum) phases. We mapped annual phenological indicators of maize at a fine resolution (30 m) from 1985 to 2020, using the full archive of Landsat images. The remainder of this paper is organized as follows: Sect. 2 introduces the study area and datasets, Sect. 3 presents the method used in this study, Sects. 4 and 5 describe the results with discussion and the derived dataset, respectively, and a conclusion is provided in Sect. 6.
We selected China's main maize producing area as our study area (Fig. 1). Maize is one of the major crops in China and is planted over a wide region, the sown area and production accounted for 36 % and 39 % of food crops in 2019 (National Bureau of Statistics of China, 2021), respectively. The planting pattern and phenology of maize are highly heterogeneous due to the influence of climate conditions, soil properties, and anthropogenic activities (e.g., sowing date) (Wu et al., 2010). The spring maize is mainly distributed in Northeast China, dominated by the single cropping type. However, summer maize is mainly planted in the Huang-Huai-Hai Plain (Fig. 1b), where the double cropping system (rotation between winter wheat and summer maize) is commonly seen (Luo et al., 2020). In addition, there is also a certain amount of maize in other provinces (e.g., Xinjiang province). The growth period of summer maize spans roughly from June (after the harvest of winter wheat) to October compared with that of spring maize from May to October. Furthermore, the maize in Northeast China is mainly rain-fed. In contrast, irrigation is needed for maize and commonly exists in the Huang-Huai-Hai Plain and Northwest China (arid and semi-arid areas) (Wu et al., 2010). Under these diverse cropping systems, phenology dates (such as v3 and maturity) of maize varied significantly between locations.
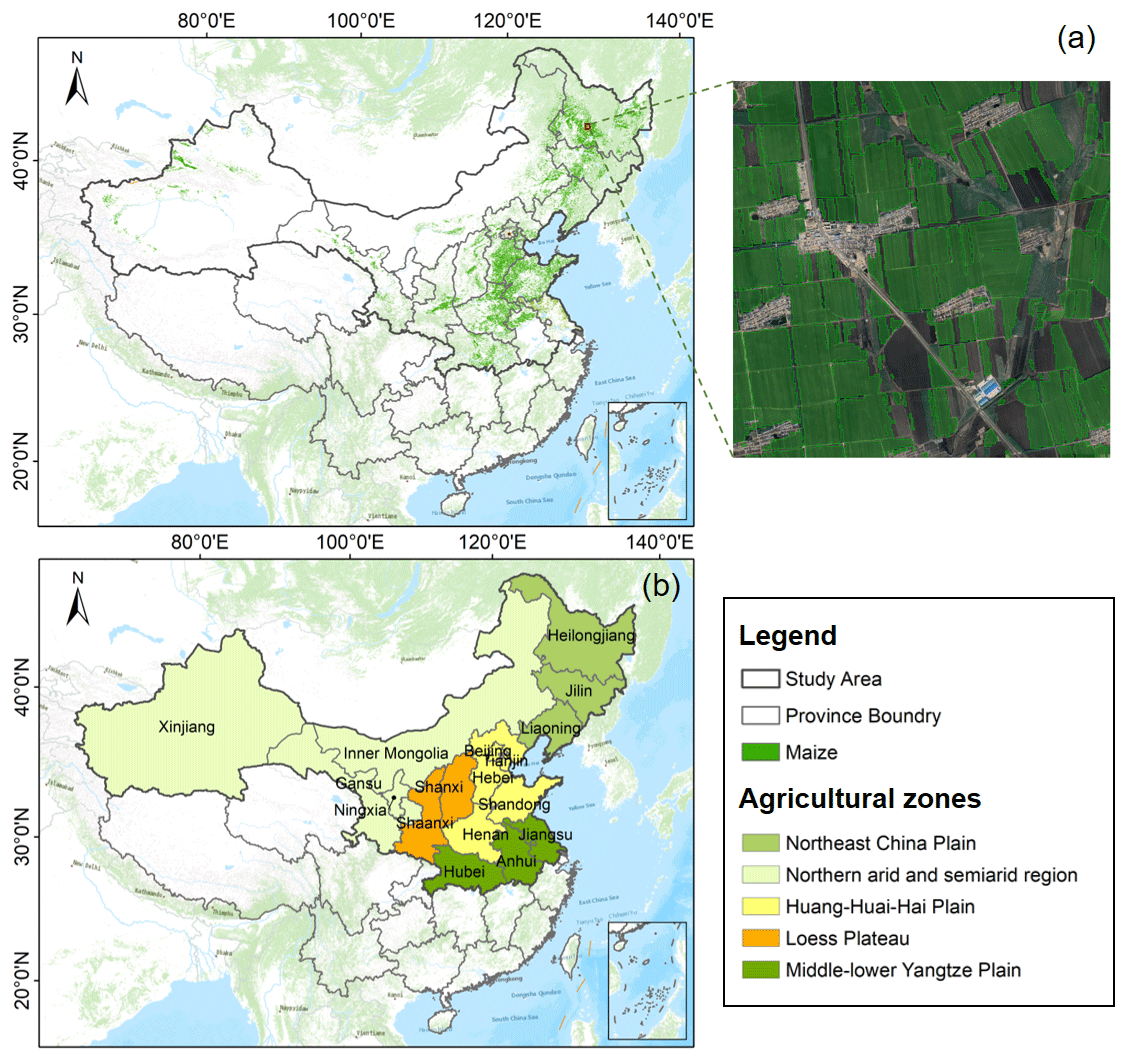
Figure 1Distribution of maize within the study area (a), which contains 17 provincial level administrative regions (b). The green polygons, transformed from pixel-form classification results into vectors in (a), indicate maize cover under a zoomed view in one specific site. Subplot (b) also shows the agricultural zones in China, and the data are from the Institute of Geographic Sciences and Natural Resources Research, Chinese Academy of Sciences. In addition, the base map of figures is from ESRI (https://www.arcgis.com/apps/mapviewer/index.html, last access: 13 August 2021).
We used the Landsat satellite data as the primary data source to characterize the phenological changes of maize in China. We used all available Landsat surface reflectance data in this study, including images obtained from Thematic Mapper (TM), Enhanced Thematic Mapper Plus (ETM+), and Operational Land Imager (OLI), from 1985 to 2020. The Landsat surface reflectance data have been corrected for the radiometric and topographic effects. The atmospheric effect has also been corrected using the Landsat ecosystem disturbance adaptive processing system (LEDAPS) (Masek et al., 2006). Clouds and shadows were removed using the function of the mask procedure (Zhu and Woodcock, 2012). Therefore, all available clear-sky pixels of Landsat observations over the past three decades were used in our study.
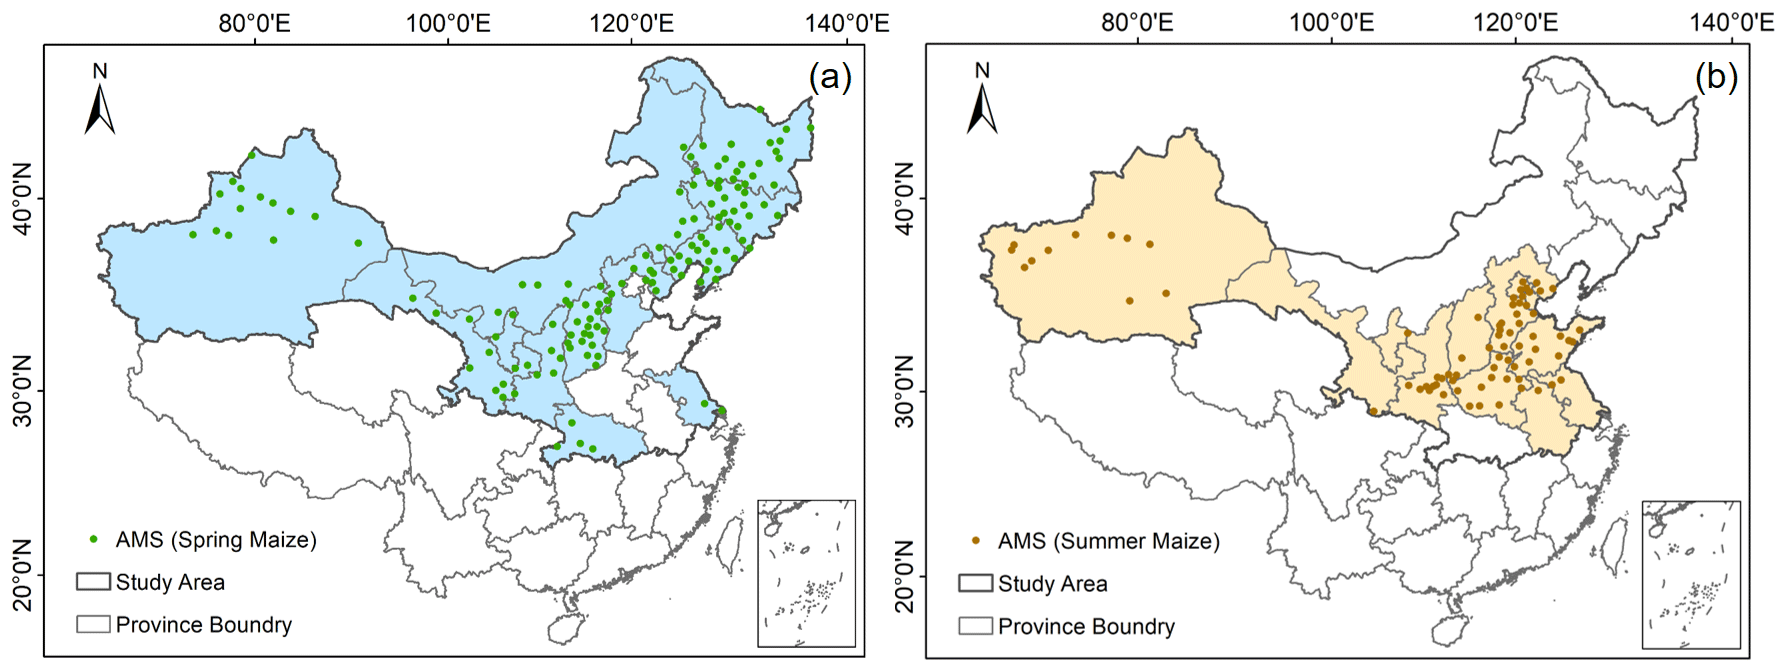
Figure 2Distribution of agricultural meteorological stations (AMS) with phenology records of spring (a) and summer (b) maize. The blue and yellow areas are provinces with available AMS in this study.
Maize maps from multiple resources were adopted to constrain the region of crop phenology mapping. The distribution map of maize in Northeast China was derived using Sentinel-2 data (You et al., 2021), and the maize map used was the classification result in 2019. You et al. (2021) derived the crop maps in Northeast China using a random forest classifier, with optimized features including spectral, temporal, and textural characteristics (gray-level co-occurrence matrix). In other provinces, the maize maps were obtained using the temporal similarity assessment approach proposed by Dong et al. (2020). The distribution of maize is mainly determined by comparing the similarity of the vegetation index series of unknown pixels with a referred curve derived from maize fields. The retrieved maize datasets have been validated with survey data with reliable performance (Fig. S1 in the Supplement). The accuracy of the maize map in Northeast China is 0.85 (more than 8000 samples for cross-validation in 2019), and that of maize maps in other provinces is 0.79 (about 2000 samples for validation). Given that the original resolutions of these two classification maps are 10 m (i.e., Northeast China) and 30 m (i.e., other provinces), we aggregated the 10 m maize map to 30 m in our study. It is worth noting that the maize distribution map is consistent across different years in our study due to the relatively stable planting situation as one of the major crops (Sun et al., 2007; Li et al., 2008). Of course, we also admit that certain dynamics in maize distribution exist due to the changing maize price, climate conditions, and choice of farmers across different years. Mapping the maize dynamics at the national scale in China is challenging because of the scarcity of massive ground samples. There is also no publicly available maize dynamic product with fine spatial resolution and a long temporal span. So we kept the maize distribution map consistent and derived dynamics of maize phenology indicators with tolerable errors.
In addition, we also collected massive datasets to validate our results, such as the agricultural meteorological stations (AMS), PhenoCam network, and the MODIS phenology product (MCD12Q2). First, the records in the AMS include phenology information of major crops (such as maize, wheat, and rice) in China, with large spatial and temporal ranges (Luo et al., 2020; Huang et al., 2019a). Crucial phases during the maize growth periods, including v3 (i.e., the date when the third leaf is fully expanded), and maturity (when the dry weight of maize grains first reaches the maximum) phases, were recorded in the AMS. Thus, this dataset can validate the mapped phenological indicators from remote sensing, and we collected AMS phenology records of the spring and summer maize (Fig. 2). Second, the in situ PhenoCam observation was derived from digital cameras using the green chromatic coordinate (GCC) index, which is composited by visible wavebands and able to characterize the dynamic greenness of vegetation. Third, the MODIS phenology product (MCD12Q2) was also employed in our study to validate the results derived from Landsat observations. The phenological indicators (e.g., dates of green-up and dormancy) in the MODIS product were mainly derived from the two-band enhanced vegetation index (EVI2) time series data (Gray et al., 2019). The multiple cycles (up to two) of crop rotations were also recorded in the MODIS phenology product, which is suitable for validation with our phenology results of maize in this study.
We extracted the phenology indicators of maize using the full archive of Landsat images in GEE. The adopted framework includes three components (Fig. 3). First, we collected all available Landsat images during 1985–2020 in our study area and used the collected maize map as a mask. After the cloud removal, we constructed the long-term time series data of EVI for each pixel. Second, we fitted the long-term mean EVI curve using the harmonic model, which can delineate multiple cycles of crop rotations and identify the number of cycles (i.e., used to distinguish spring and summer maize). Thus, two phenological indicators, the v3 (the date when the third leaf is fully expanded) and the maturity (when the dry weight of maize grains first reaches the maximum) phases, were determined from the long-term mean curve of spring and summer maize. Finally, we identified the annual dynamics of these two phenological indicators by measuring the difference in dates when the vegetation index in a specific year reaches the same magnitude as its long-term mean. Details of each component are given in the following sections.
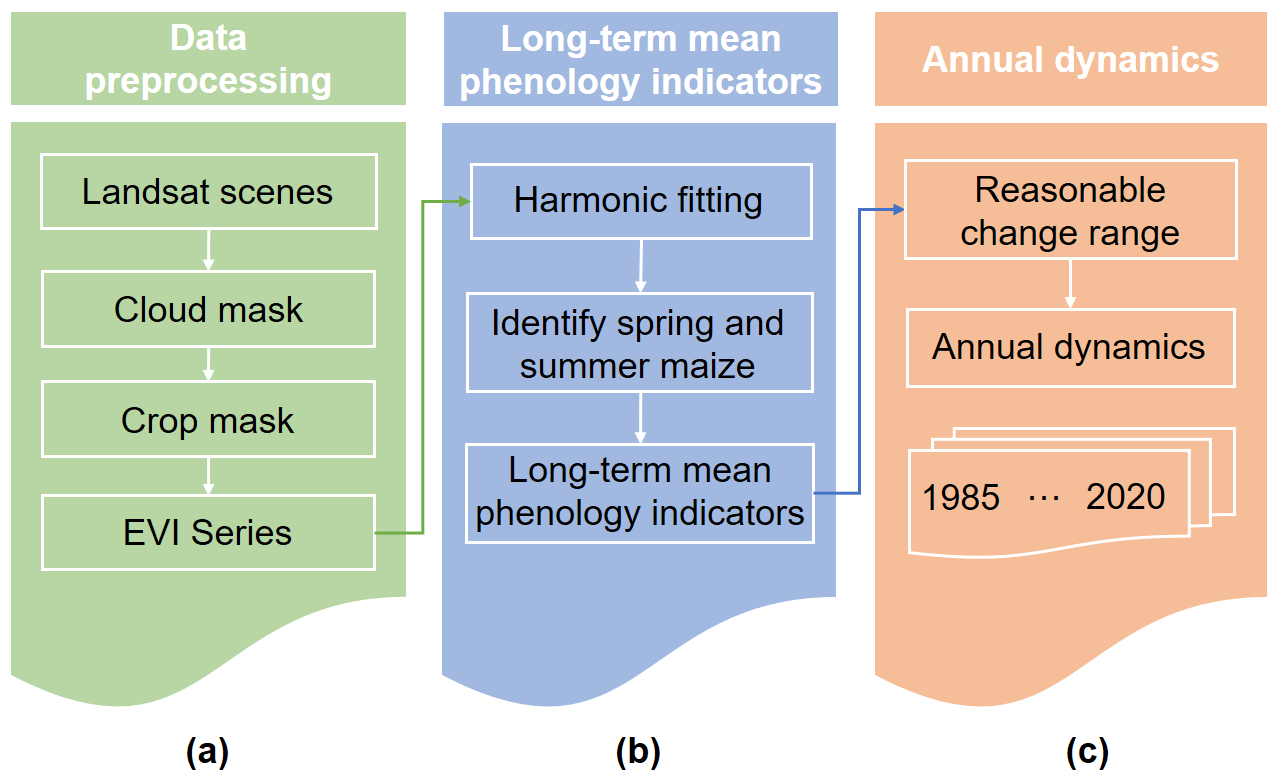
Figure 3The adopted framework for deriving annual phenology dynamics (1985–2020) from Landsat time series data, including data preprocessing (a), mapping the long-term mean phenology indicators (b), and identifying the annual dynamics (c).
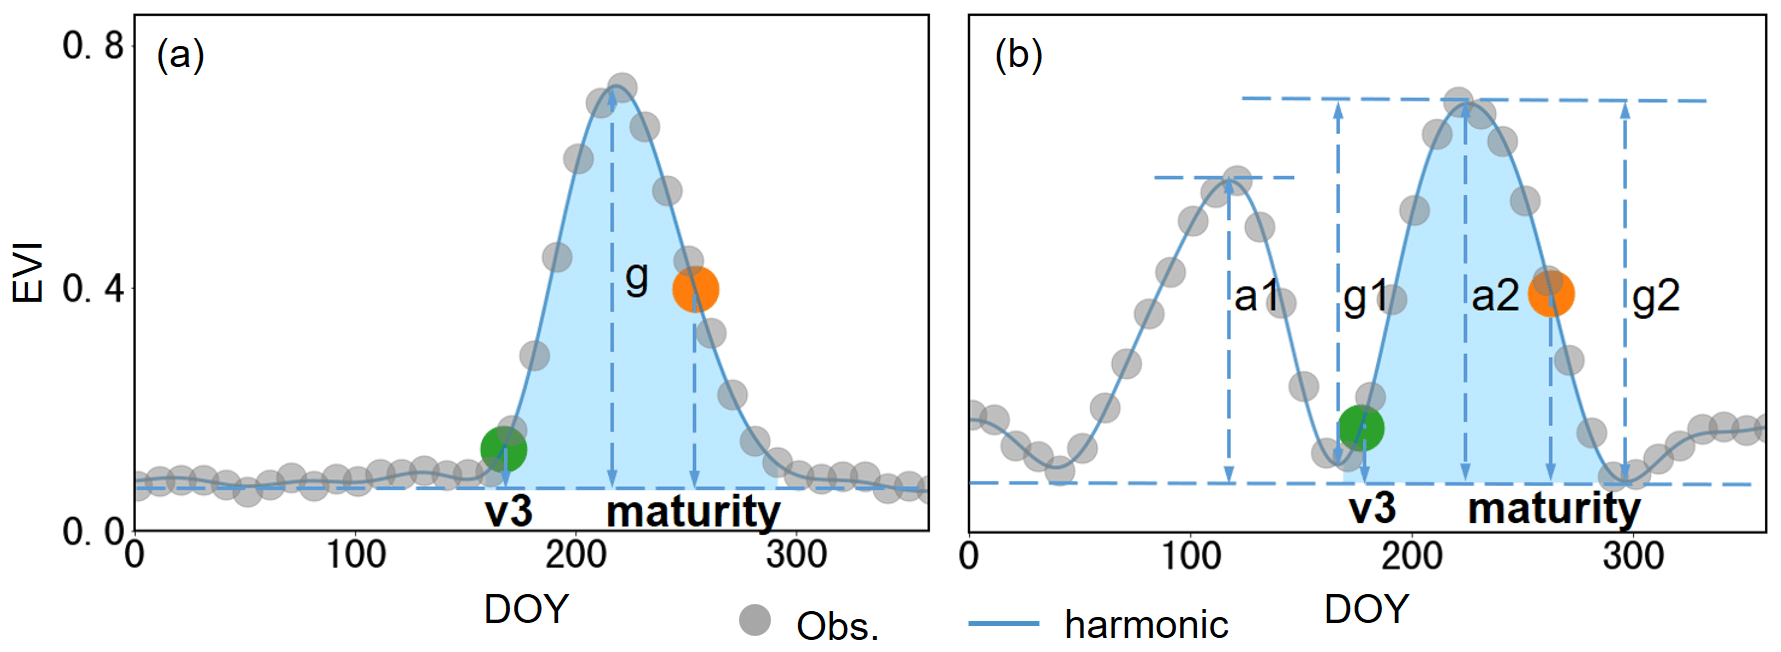
Figure 4Illustration of mapping long-term mean phenology of spring maize (a) and summer maize (b). The blue shaded areas represent the growing period of maize. All acronyms are as follows: g: the EVI amplitude of spring maize; g1 and g2 are the EVI amplitudes of green-up and green-down segments, respectively; a1 and a2 are the EVI amplitudes of the first and second cycles, respectively; DOY: day of year.
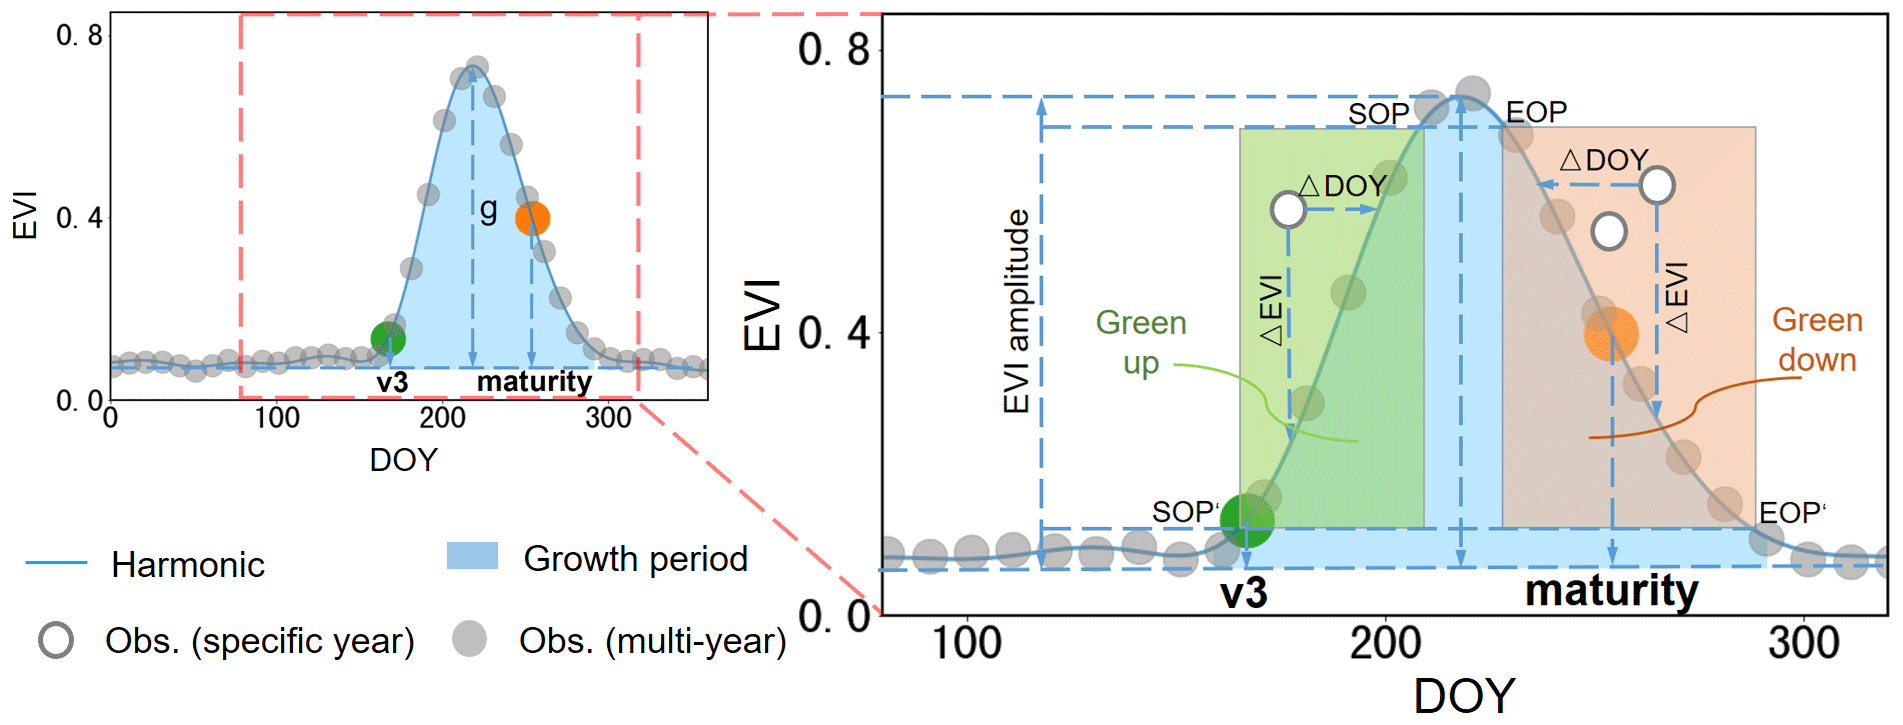
Figure 5Illustration of detecting annual variabilities of phenological indicators (taking the spring maize as an example). The blue shaded areas represent the growth period of maize. In addition, green and orange shaded areas indicate the reasonable change range of v3 and maturity. The solid and empty circles are long-term and year-specific enhanced vegetation index (EVI) observations. The definitions of all the acronyms are as follows: EOP: end of peak; SOP: start of peak.
3.1 Data preprocessing
We implemented the data preprocessing step in the GEE platform. First, we used the quality layer in the Landsat surface reflectance data to remove clouds and shadows. Thus, all available clear-sky pixels can be used to enrich the Landsat observations. Second, we excluded non-maize areas using the maize map, which can significantly reduce the computational requirement. Third, we calculated the EVI indicator using Eq. (1) to minimize the impact of soil and clouds; meanwhile, it is sensitive to vegetation growth and dormancy (Huang et al., 2019a; Li et al., 2019).
where NIR, RED, and BLUE represent surface reflectance of the corresponding spectral bands in Landsat. The parameters G, L, C1, C2 were used to correct the disturbance of aerosols and soil background, as suggested with values of 2.5 (G), 1 (L), 6 (C1), and 7.5 (C2) in Huang et al. (2019a).
3.2 Long-term mean phenological indicators
We derived the long-term mean maize phenological indicators including v3 and maturity. First. we sorted all available EVI observations according to the day of the year (DOY) and fitted the annual crop cycle using the harmonic model (Eq. 2). Compared with other fitting approaches, the harmonic model can easily delineate multiple seasonal cycles of crops within 1 year, with clear physical meaning for each parameter (de Beurs and Henebry, 2010; Chen et al., 2018; Lee et al., 2020).
where f(t) is the fitted EVI value, t is the Julian date of a particular observation, and T is the maximum value of the time variable, bi and ci are coefficients for intra-annual change of the EVI time series data, a1 and a0 represent the slope and intercept of EVI change among different seasonal cycles, n represents the maximum number of harmonic components, and it needs to be calibrated according to different situations. Considering the double crop (winter wheat-summer maize rotation system) and the planting patterns of winter wheat (planted in autumn of the first year and harvested in the second year), we set n as 6 due to the good fitting performance in our study after trial and error tests using multiple sites in different regions.
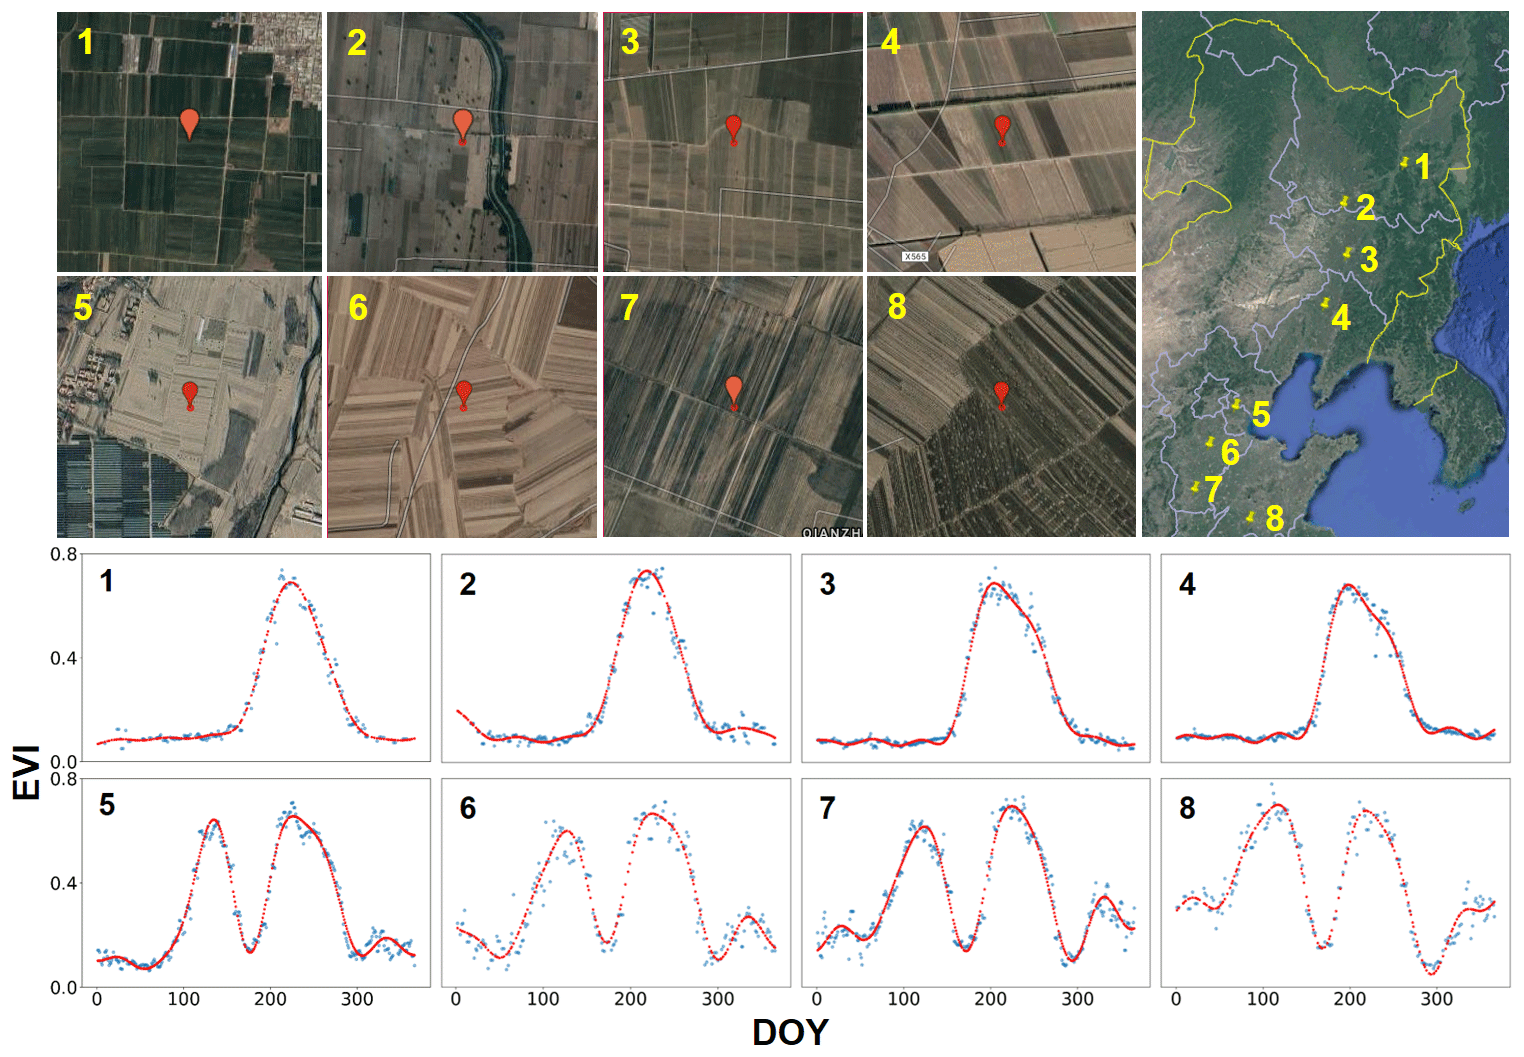
Figure 6Performance of the harmonic model in fitting the time series data of EVI. Cases numbered 1–4, and 5–8 represent the spring and summer maize, respectively. The blue points are the original EVI series of red dots in the center of © Google Earth images, and the red points are the fitted series.
Then, we identified spring and summer maize according to the cycles of the fitted curve (Fig. 4). Spring and summer maize can be identified using the information of EVI cycles. For instance, summer maize always has two crop cycles, notably different from spring maize, with only one cycle. To identify maize with different cycles, we calculated the derivative of the fitted harmonic model and identified the peaks of these cycles. When the EVI peak value before the maize part exceeded 40 % of the maximum EVI value of the maize cycle (Gray et al., 2019; Wu et al., 2010), we regarded it as double cropping, and the second part of it is summer maize (Fig. 4b); otherwise, it is a single crop (i.e., spring maize) (Fig. 4a).
Finally, we adopted the dynamic threshold approach to derive the v3 and maturity dates from the green-up and green-down segments (shadowed blue areas in Fig. 4). These two segments were derived from the cycle of maize growth, separated by the point with peak values of EVI. Given that the EVI amplitudes of green-up and green-down are different for the spring (g in Fig. 4a) and summer maize (g1 and g2 in Fig. 4b), we determined the v3 and maturity dates according to their EVI amplitudes accordingly. For the spring maize, the v3 and maturity dates were defined as the dates with 10 % EVI amplitude (g in Fig. 4a) during the green-up segment and 50 % EVI amplitude (g in Fig. 4a) during the green-down segment (Huang et al., 2019a), respectively. Similarly, for the summer maize, the EVI amplitude during the green-up and green-down segments was referred to g1 and g2 in Fig. 4b to determine v3 and maturity, respectively.
3.3 Annual dynamics of phenological indicators
We adopted a similar approach to Li et al. (2017) to estimate the annual dynamics of phenological indicators. First, we adopted a self-adjusting strategy to determine the rational range of EVIs during the green-up and green-down periods (shaded areas in Fig. 5). These ranges were determined using the derived long-term mean curve, and they can be used to filter outliers in individual years. Then, we measured the difference in dates when the EVI in a specific year reaches the same magnitude as its long-term mean (Fig. 5). The mean value of the date difference between the observations and the long-term mean was adopted as the annual variability of phenological indicators.
4.1 Performance of the harmonic model
The harmonic model can easily delineate the seasonal dynamics of EVI for spring and summer maize. Spring maize belongs to the single cropping type and has one rotation cycle. In contrast, summer maize is mainly distributed in the double cropping system area (i.e., the second rotation cycle is summer maize). These crop growth cycles can be detected by the EVI time series data from Landsat observations (Fig. 6). The fitting performance from the harmonic model suggests that the fitted line can easily delineate the growth phase of crops across different regions and types.
4.2 Comparison with records from the AMS
The derived long-term mean maize phenological indicators from Landsat observations are consistent with the records from the AMS (Fig. 7). We compared results derived from Landsat and AMS from 2001 to 2010, during which period the AMS observations can be maximally used. Due to the lack of accurate locations of observed crops in AMS (i.e., only station locations), we measured the uncertainties of phenological indicators of maize within the range of 5 km to the station. The adopted approach performed well in extracting summer maize phenology. The correlations of v3 and maturity dates of summer maize are 0.60 and 0.80, respectively (Fig. 7c–d). Besides, the RMSE of v3 and maturity dates are 5.20 d and 6.38 d, respectively. Nevertheless, the correlation of derived maturity dates of spring maize and corresponding records from AMS is relatively low, likely attributed to the discrepancies in the definitions between remotely sensed results and AMS. For instance, the v3 phase in AMS is defined as the date when the third leaf is exposed from the second leaf sheath, and the maturity is defined as the date when the dry weight of maize grains first reaches the maximum, more than 80 % of the outer bracts of the plants turn yellow, and the filaments become dry (Li et al., 2021). These definitions in AMS are challenging to measure from remote sensing, and they are slightly different in terms of their definitions.
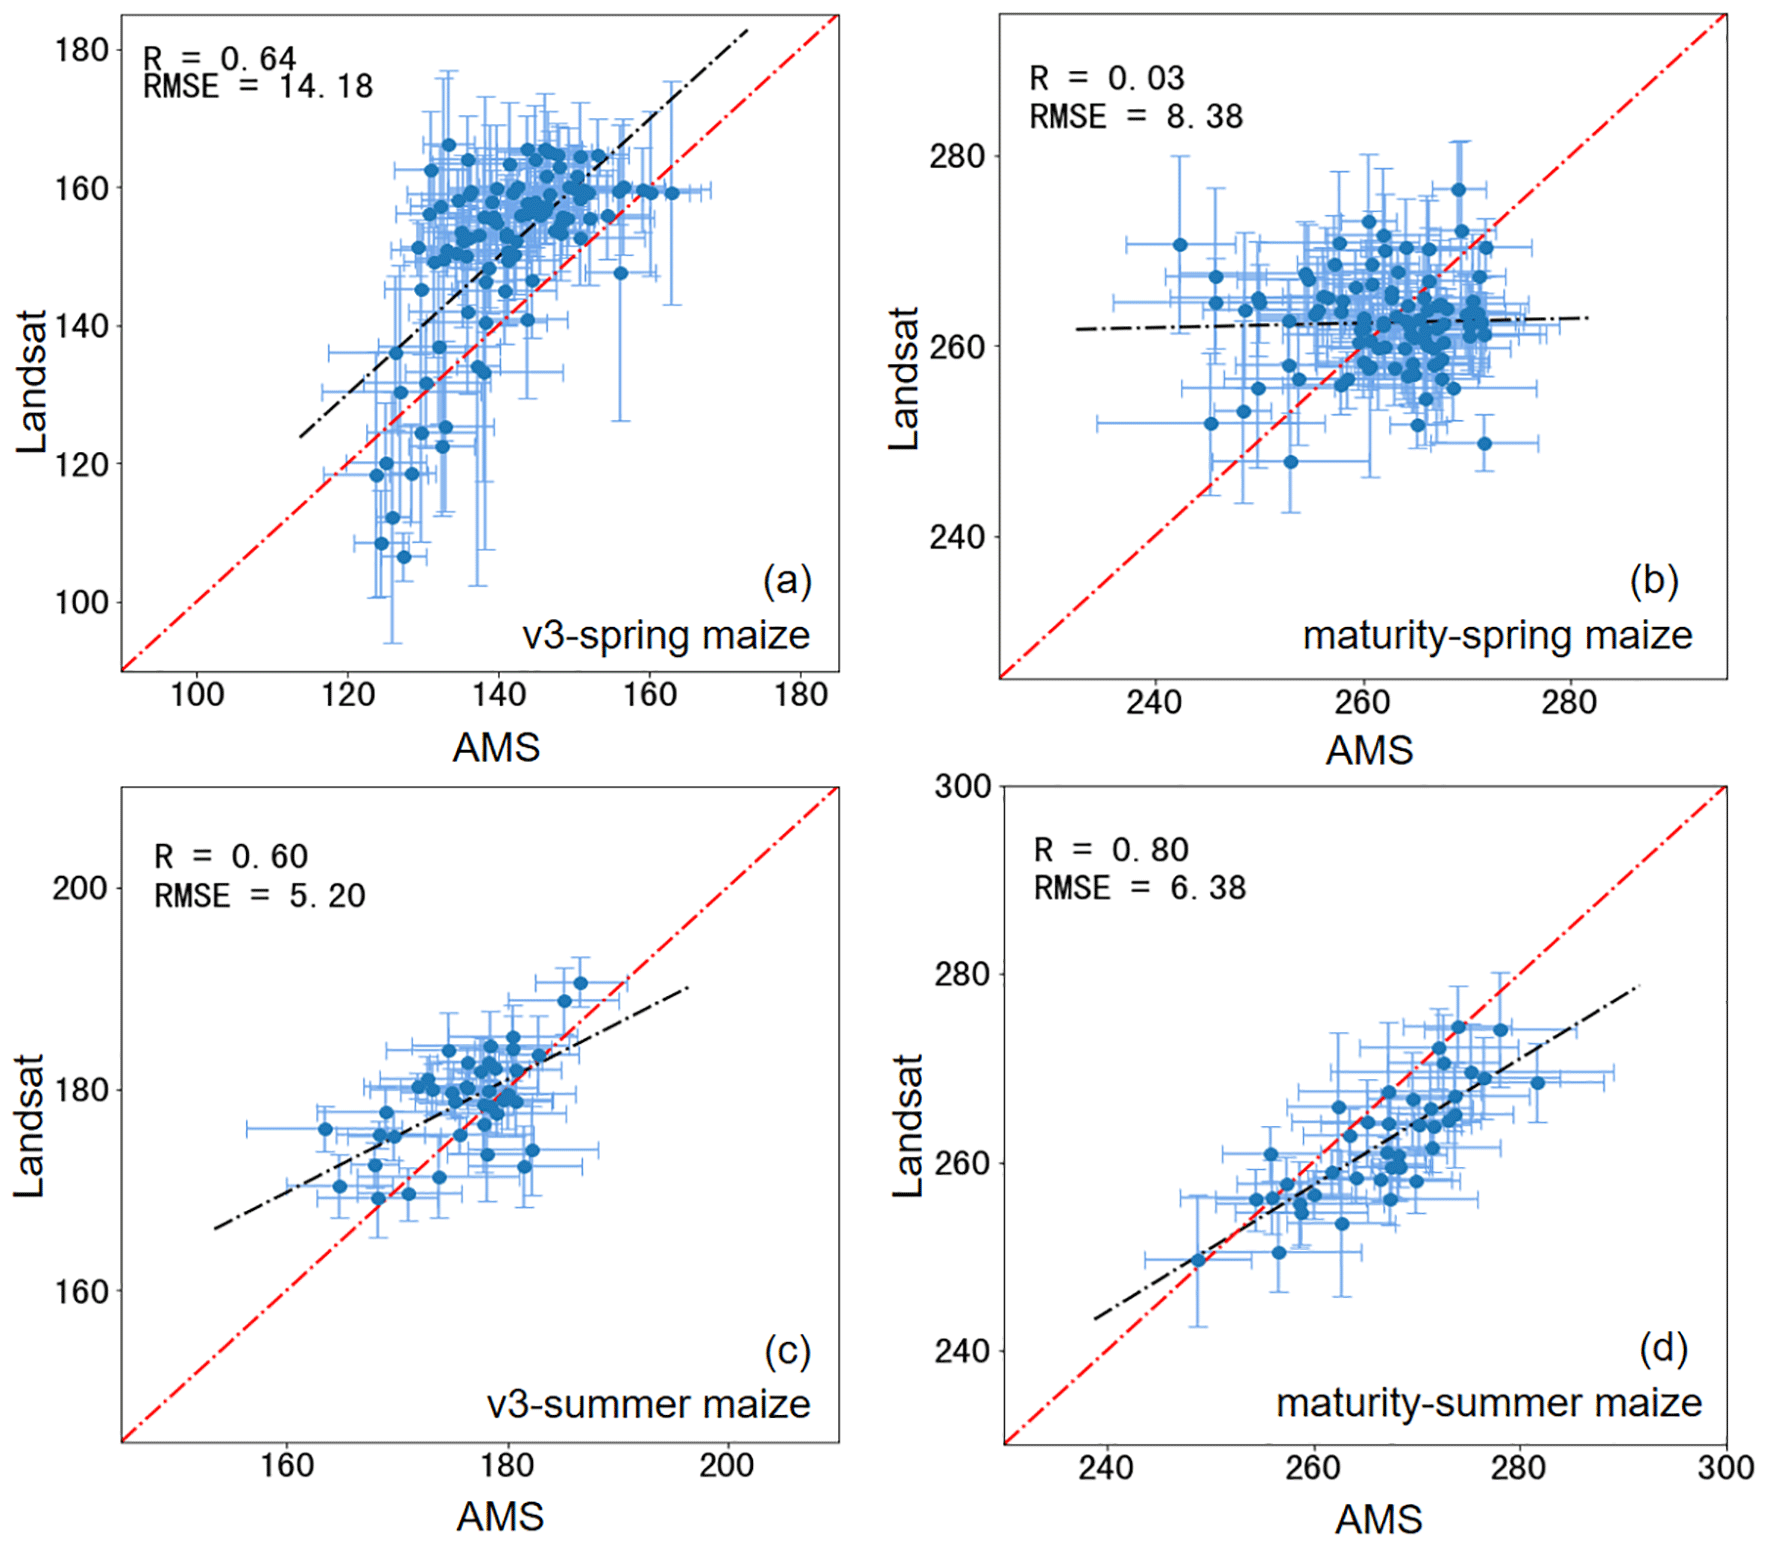
Figure 7Comparison of long-term mean phenological indicators derived from Landsat (satellites) and AMS (in situ). The error bars of the x- and y-axes represent uncertainty (i.e., one standard deviation) of multi-year phenological indicators and the mean phenological indicators within a certain extent (5 km) of the AMS, respectively. (a)–(b) and (c)–(d) represent results from spring and summer maize, respectively.
The annual dynamics of derived phenological indicators (i.e., v3 and maturity) also agree well with the AMS observations (Fig. 8). The comparison of annual results is similar to that of the long-term mean phenology. In general, the annual dynamics of phenological indicators in summer maize are better than that of spring maize (especially at maturity phases), and this finding is consistent with previous studies (Huang et al., 2019a). The correlations of phenological indicators (i.e., v3 and maturity) of summer maize derived from Landsat and AMS are 0.34 and 0.59, respectively and for spring maize, the correlations of v3 and maturity indicators from the two datasets are 0.51 and 0.16. The difference between these two datasets is mainly attributed to (1) lack of accurate locations of the crop in the AMS data, (2) the crop planting patterns may be altered over the years (Fig. 9) and (3) different definitions.
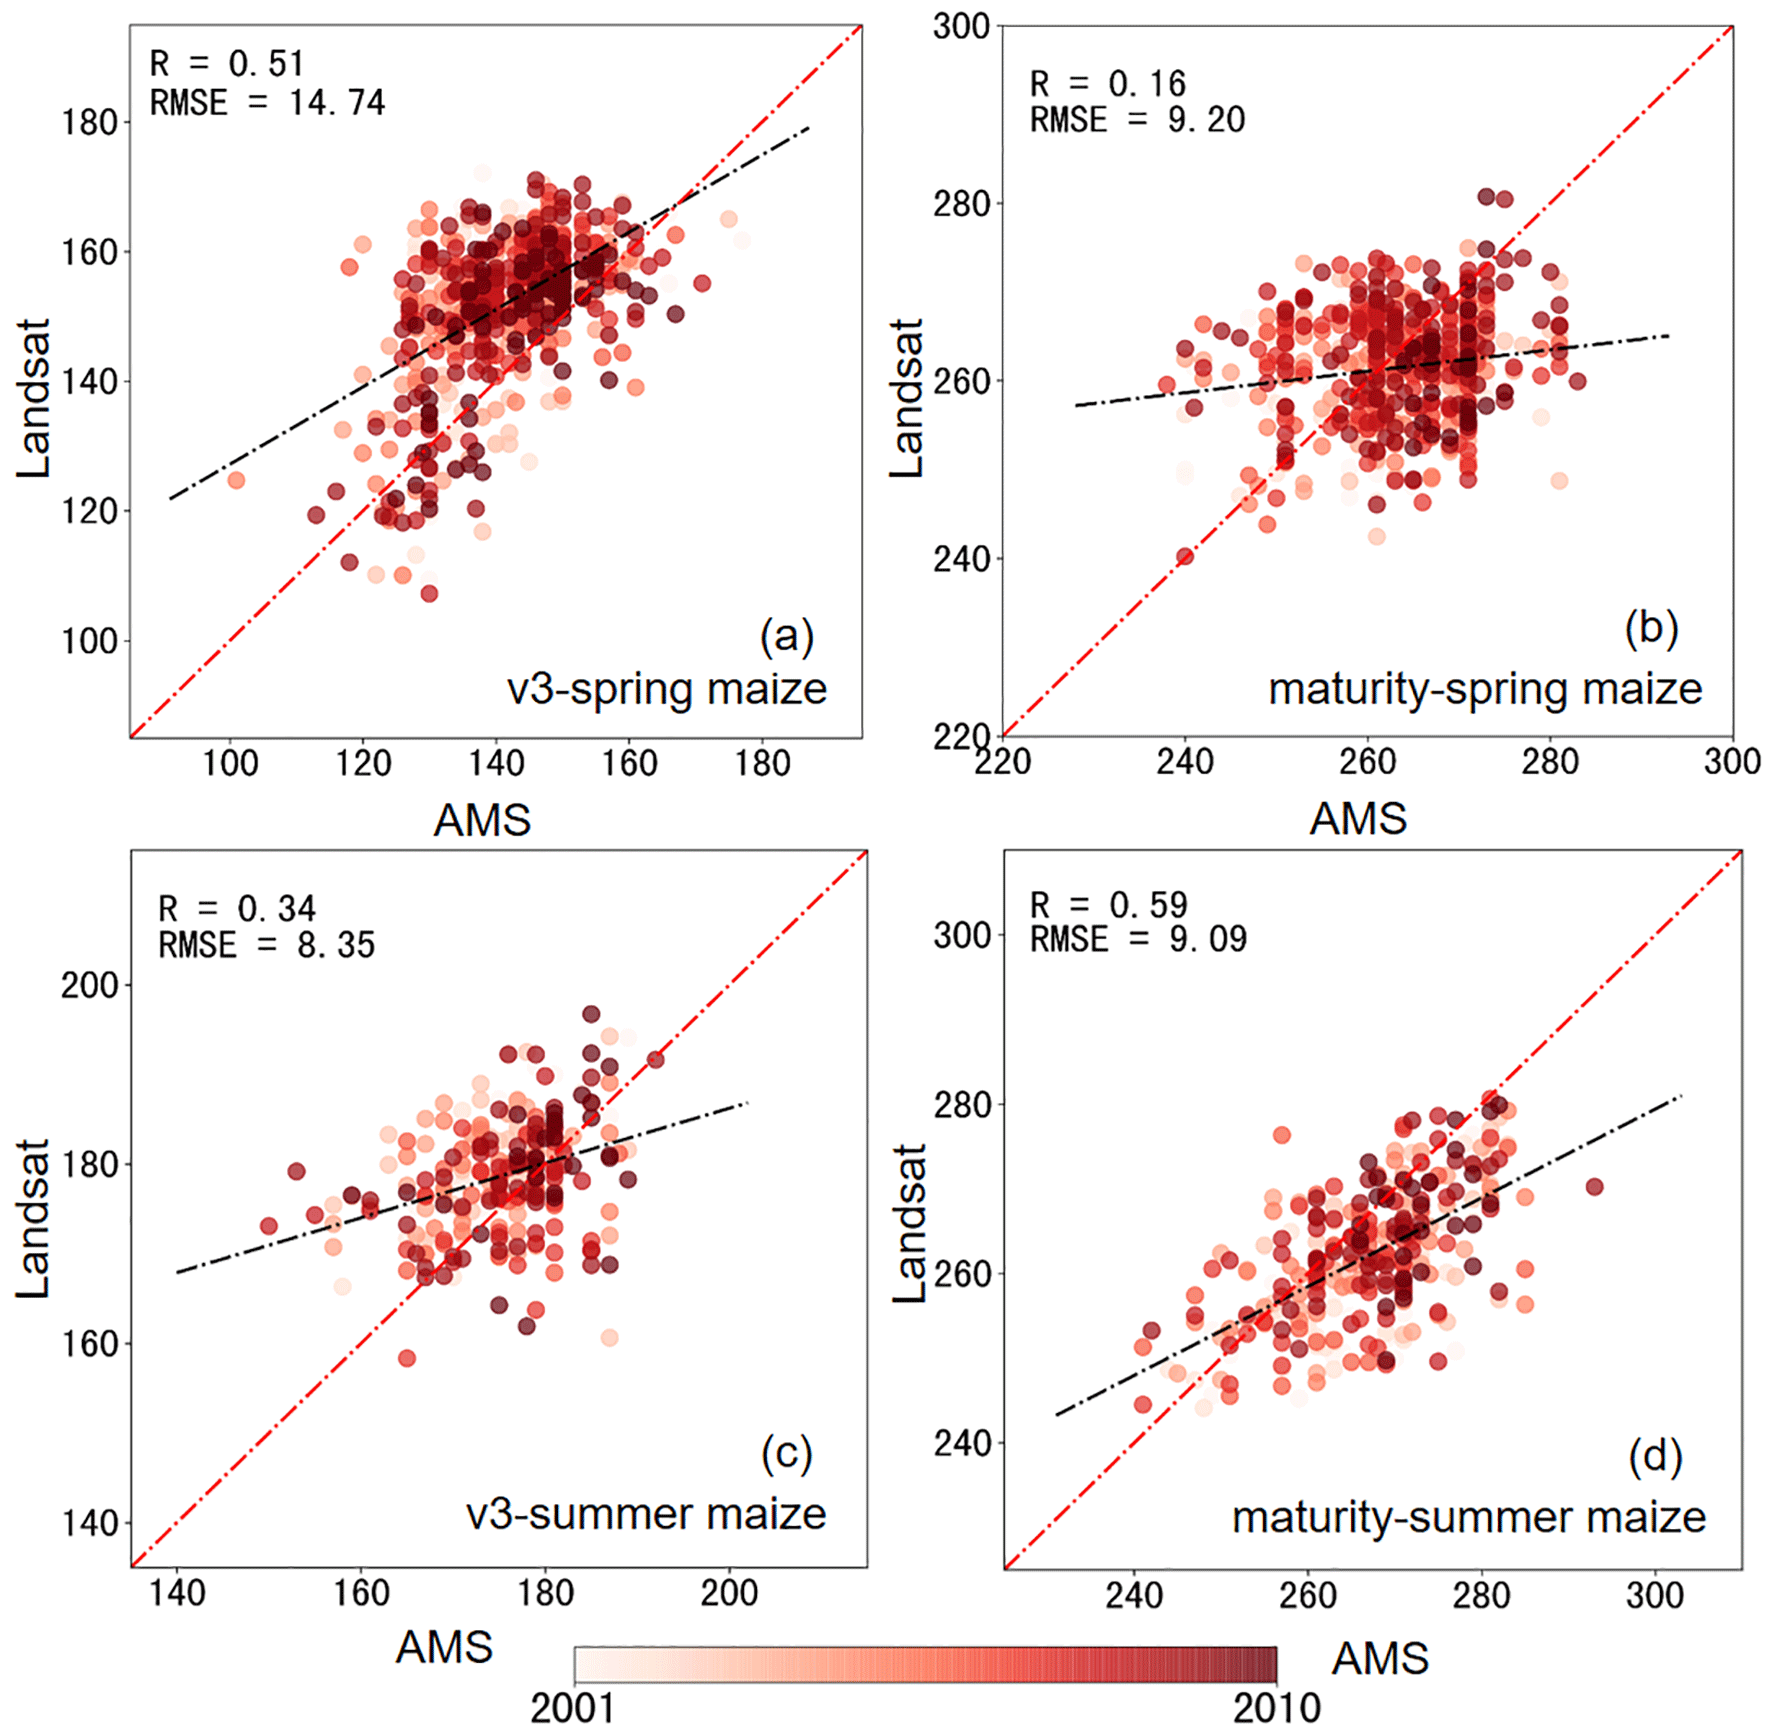
Figure 8Comparison of annual dynamics of derived phenological indicators from Landsat data and AMS observations from 2001 to 2010, including v3 and maturity of spring (a–b) and summer (c–d) maize.
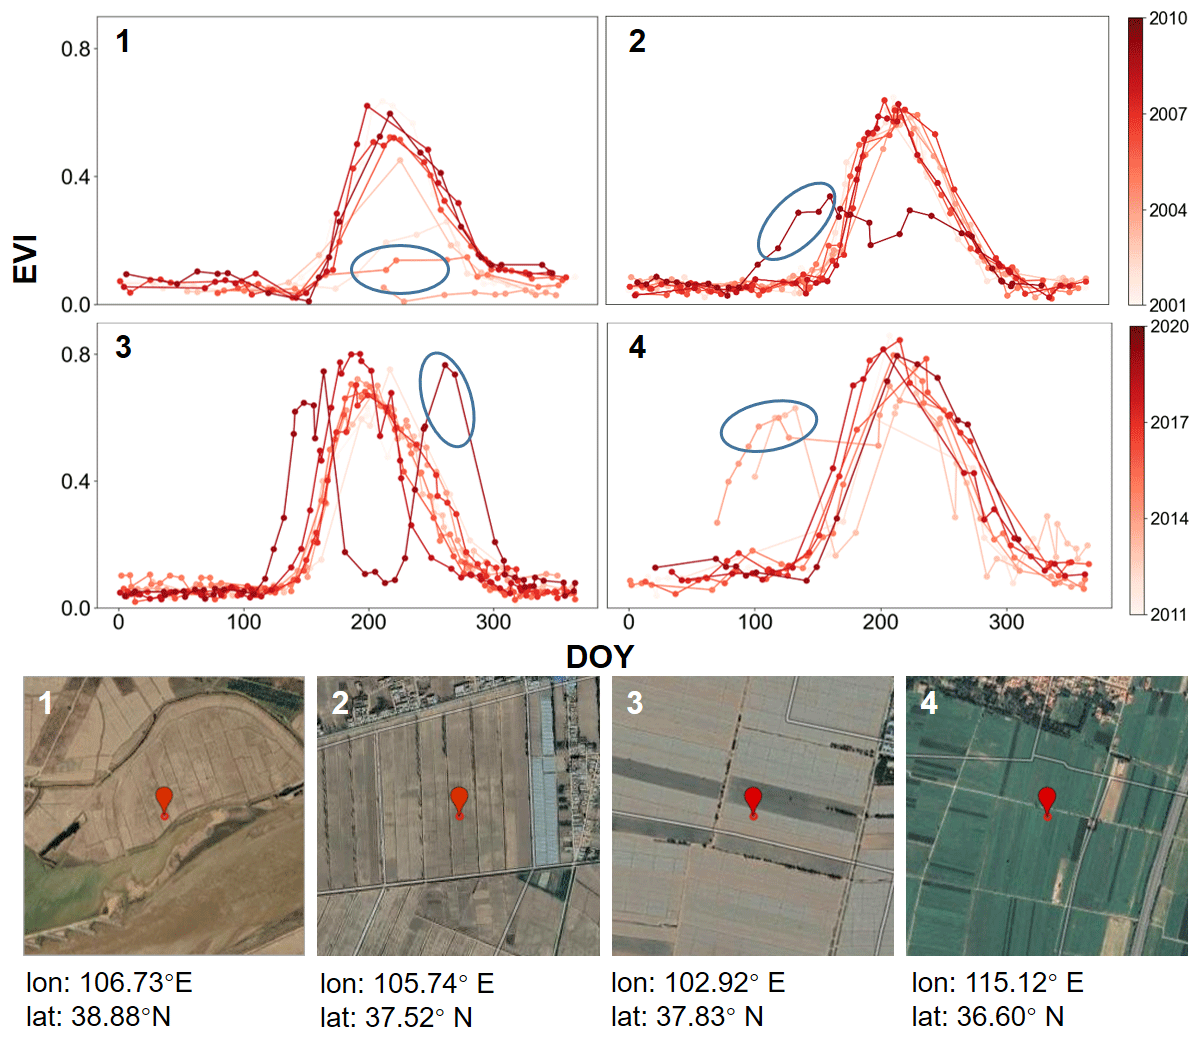
Figure 9Cases with a significant change in crop planting patterns. The blue ellipses indicate identified anomalies of EVI observations. We can note that the red dots are all located in the plots from the © Google Earth images.
4.3 Comparison with PhenoCam data
Using the phenology mapping approach in this study, we observed a good agreement between Landsat derived and PhenoCam derived phenological indicators (Fig. 10). We chose the United States (US) because no PhenoCam data are available in China. The same approach adopted in China for crop phenological indicator mapping was used in the US with agriculture sites where PhenoCam data are accessible. Thus, the feasibility of our approach can be evaluated. The phenology dataset provided by Richardson et al. (2018) is extracted from continuous observations of vegetation growth collected by digital cameras. PhenoCam sites in Fig. 10 are mainly distributed in agriculture ecosystems, with records spanning from 2015 to 2018. Definitions of phenological indicators from Landsat and PhenoCam are consistent, i.e., definitions of transition_10 and transition_50 date when VI series data crossed 10 % and 50 % of the green chromatic coordinate index (Richardson et al., 2018). The correlations of v3 and maturity dates from Landsat and PhenoCam are 0.74 and 0.63, respectively, with the root mean square error (RMSE) of 7.61 (v3) and 7.11 (maturity) days. Observations from these two datasets are located around the 1:1 line, suggesting the adopted mapping approach of phenology from satellite data can well match the in situ observations. Possible reasons behind explaining their difference can be attributed to (1) different vegetation indices used (i.e., EVI and GCC) and (2) the scale effect caused by the data sources.
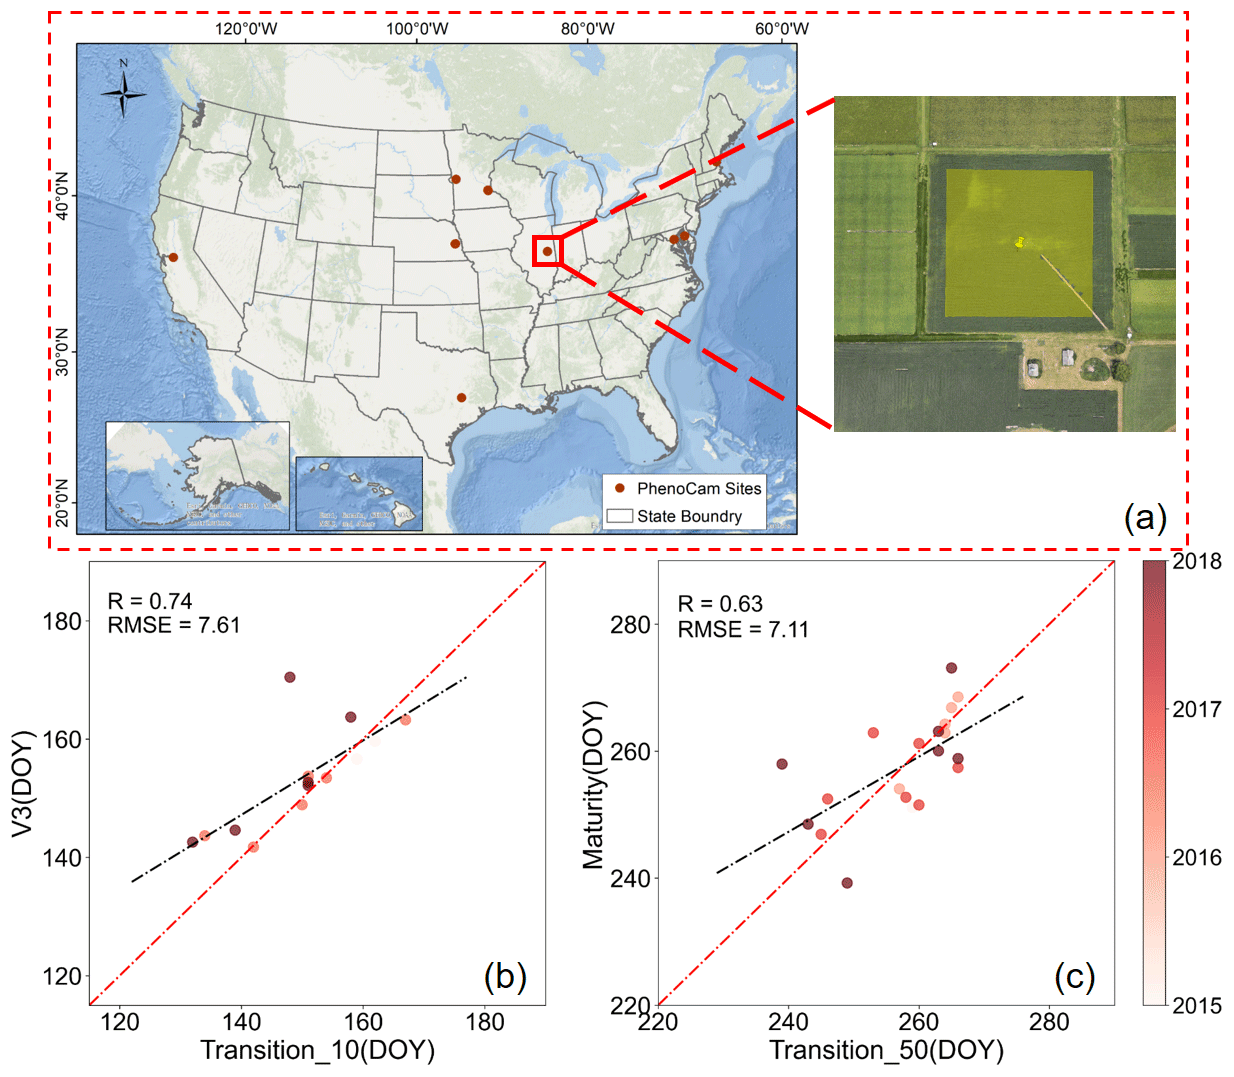
Figure 10Selected PhenoCam sites in agriculture ecosystems (a). The annual v3 (b) and maturity (c) dates were compared between the Landsat, and PhenoCam derived results from 2015 to 2018. The base map is provided by ESRI (https://www.arcgis.com/apps/mapviewer/index.html, last access: 13 August 2021).
4.4 Comparison with MODIS phenology dataset
The derived phenological indicators from Landsat and MODIS have a consistent temporal trend (Fig. 11). The MODIS phenology product (MCD12Q2) provides multiple phenological indicators (e.g., mid-green-down). For areas with two vegetation cycles, we selected the phenological indicators of the second cycle (summer maize) for comparison. In the green-down segment of each crop cycle, the MCD12Q2 product provides three phenological indicators, i.e., dormancy, mid-green-down, and senescence, defined as 90 %, 50 %, and 10 % of the segment EVI2 amplitude in a specific cycle, respectively. We selected the mid-green-down indicator in the MODIS phenology product to compare in this study because it has the same definition as the maturity date in Landsat-derived results. We aggregated the fine-resolution maize data to the same resolution as MODIS and only kept those relatively pure pixels (maize pixels accounting for more than 50 % of them) for comparison. We found the temporal trends of derived phenological indicators of spring and summer maize from Landsat images are consistent with those derived from MODIS data in most years (Fig. 11b). Our approach can easily capture the crop growth phase dynamics (i.e., delay and advancement). The magnitude difference between maturity date derived from Landsat observations and mid-green-down derived from MCD12Q2 is within 3 days in most years. Different data sources and fitting methods (i.e., spline fit was used in MCD12Q2) likely cause discrepancies between the two phenology datasets. In addition, it is worth noting that there is a high correlation of the maturity dates derived from Landsat and MODIS (Fig. 11c).

Figure 11Representative cases of phenology comparison between MODIS and Landsat-derived results. Selected cases of maize (including the raw © Google Earth images and the distribution of maize) are displayed in (a), with the comparison of their temporal trends (b) and corrections (c). Cases 1–2 are the spring maize, and case 3 is the summer maize. Each scene represents a 1.5 km × 1.5 km square. Note that solid lines represent the mean phenology at the regional scale, and the shadowed areas represent the range from 25th to 75th quantiles of maturity date derived from Landsat.
Phenological indicators derived from Landsat observations also have a close spatial pattern to the MODIS phenology product but more spatial details (Fig. 12). For example, there is a noticeable advancement of maturity in 2018 and a delay in 2015 (red boxes in Fig. 12), and these variations are successfully captured by the two phenology datasets. Besides, we can note that Landsat-derived phenological indicators (e.g., maturity) depict the difference in crop growth stages with more spatial details compared to the MODIS phenology product.

Figure 12Comparison of the Landsat derived maturity date and the MODIS derived mid-green-down date from 2011 to 2018. The selected scene is case 1 in Fig. 11. Red boxes are highlighted regions where these two products have a noticeable difference.
4.5 Analysis with climate data
Summer maize has a higher requirement for hydrothermal conditions (especially for temperature) than spring maize (Fig. 13). The Northeast China Plain and Huang-Huai-Hai Plain (Fig. 1b) are the two largest maize-producing areas in China, about 60 % of spring maize is grown in the Northeast China Plain (Fig. 13b), and more than 80 % of summer maize is distributed in the Huang-Huai-Hai Plain (Fig. 13c). In addition, we used the monthly mean air temperature and the total precipitation from May to October (Peng et al., 2019) in the study area for analyses from 2011 to 2020. Overall, the mean total precipitation and mean temperature change range within the spring maize planting areas are larger than in the summer maize. Meanwhile, summer maize growing areas are mainly distributed in high-temperature areas (i.e., above 20 ∘C). These results suggest that summer maize has a higher requirement for hydrothermal conditions than spring maize.
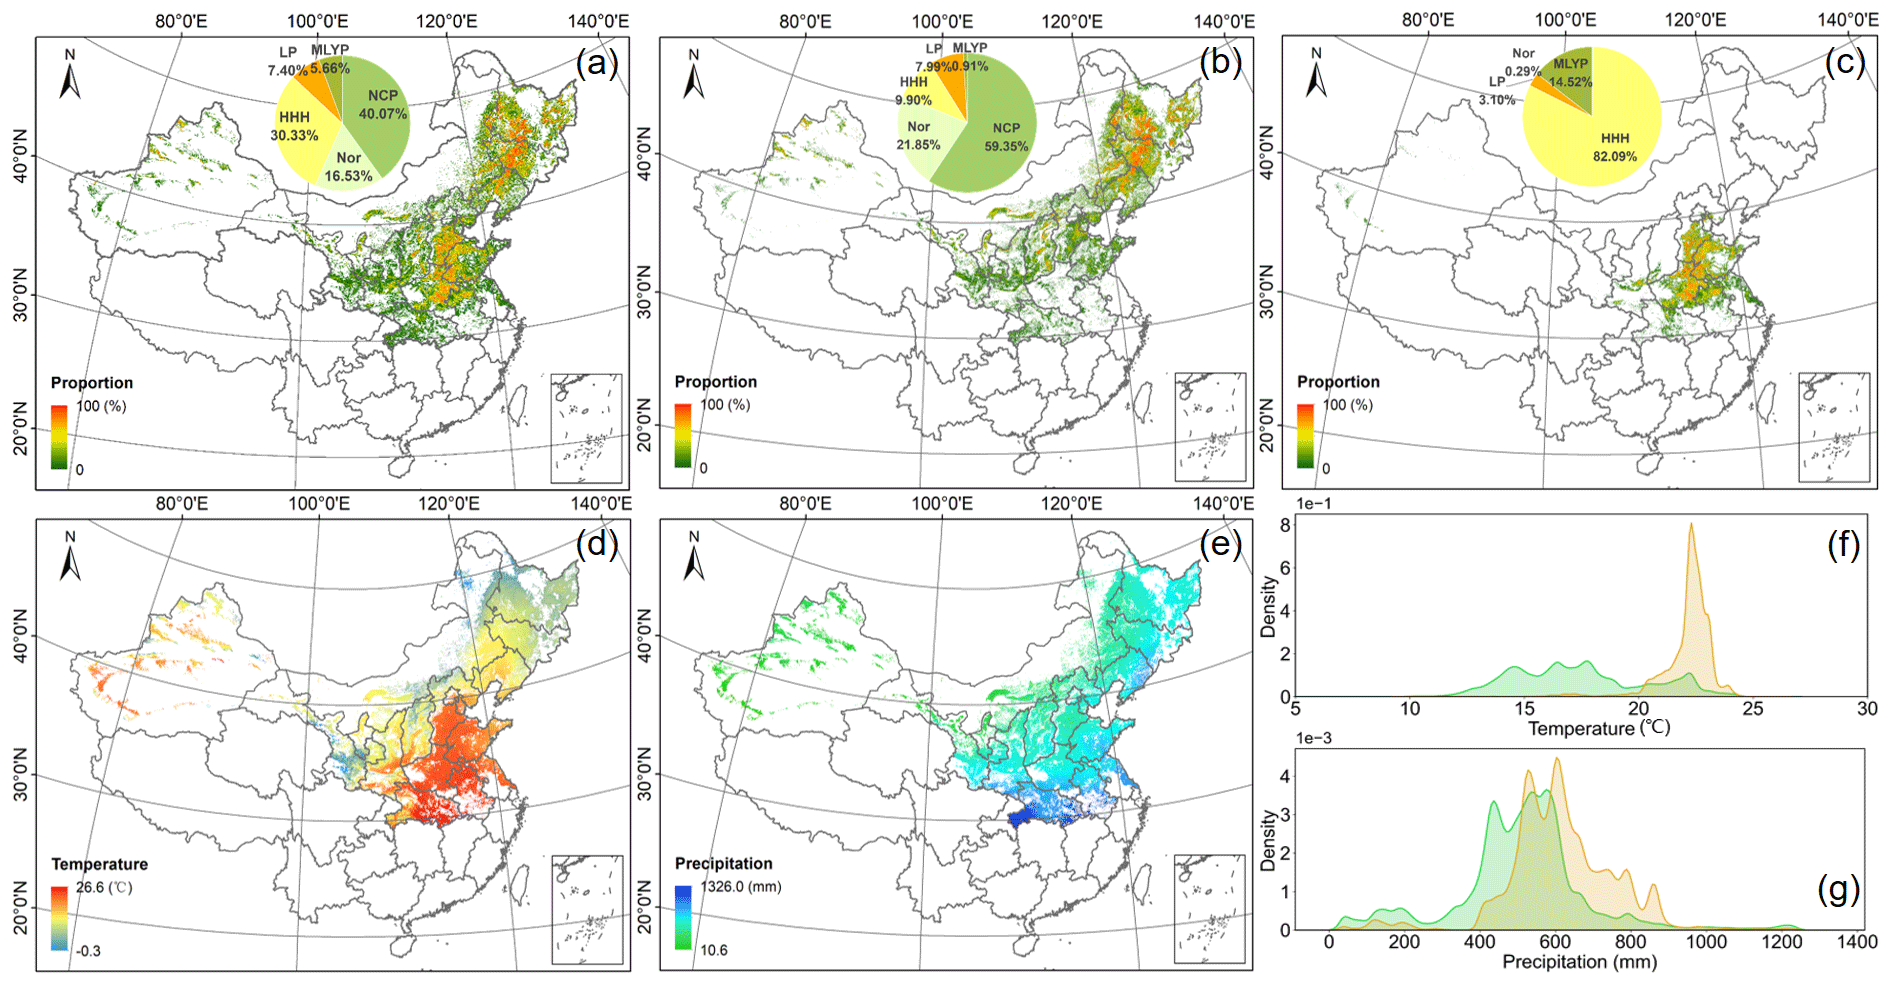
Figure 13The spatial distribution of maize across the study area (a) and pixel values represent the coverage of maize in 1 km and (b) and (c) indicate the coverage of spring and summer maize. Additionally, we also provided the proportion of maize in major agricultural zones. The mean temperature and mean annual total precipitation during the growing period of the crop (from May to October) from 2011 to 2020 are presented in (d) and (e). (f) and (g) show the kernel density curves of the mean temperature and mean annual total precipitation in the study area. The abbreviations are as follows: NCP: Northeast China Plain; LP: Loess Plateau; Nor: northern arid and semiarid region; HHH: Huang-Huai-Hai Plain; MLYP: middle-lower Yangtze Plain.
We observed a noticeable difference in the temporal trends of the derived maize phenological indicators before and after 2000 (Fig. 14). The temporal trends of derived phenological indicators, including v3 and maturity date of spring and summer maize before and after 2000, are notably different. For climate variables, the temperature within maize planting areas has a steeper upward trend (the slope is more than 0.5 ∘C per decade) before 2000 than after 2000. The mean total precipitation shows different trends before and after 2000. It is worth noting that the precipitation within the spring maize producing area has a diverse and sharper tendency compared with that of the summer maize grown area. For phenological indicators, the changes in spring maize phenology are mainly concentrated in the segments after 2000. The v3 date is advanced (−0.37 d yr−1), and the maturity date is delayed (0.38 d yr−1). The v3 and maturity indicators of summer maize have an advanced tendency before 2000, while the maturity date is delayed after 2000. The annual dynamics of maize phenological indicators may be partly attributed to the rising temperature and annual variations of total precipitation. In this research, we did not consider the impact of other factors (such as photoperiod and genotype of maize) on the variations of maize phenology and the response of maize phenology and growth season duration to climate change was also not comprehensively considered.
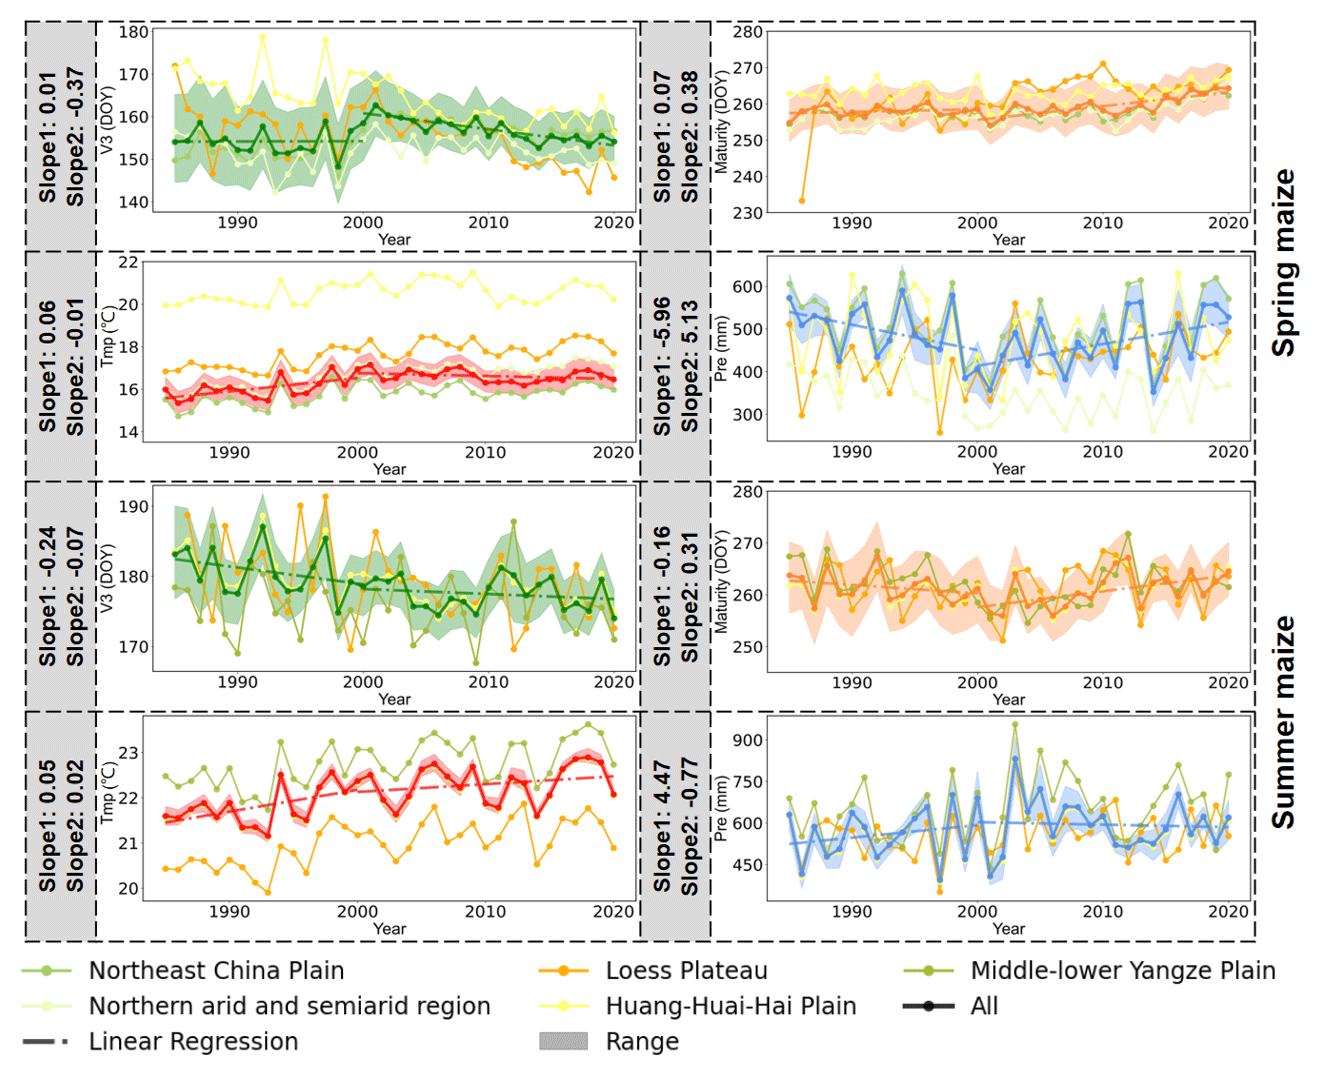
Figure 14Temporal trends of phenological indicators (i.e., v3, maturity) and climate variables (i.e., mean temperature and mean total precipitation) during the growing period (from May to October), from 1985 to 2020. Two segments (i.e., 1985–2000 and 2001–2020) were independently fitted due to their distinct difference in temporal trends. We provide the temporal trend of variables across the study area and the interannual variations within different major agricultural zones.
Table 1Detailed band information in each formation.
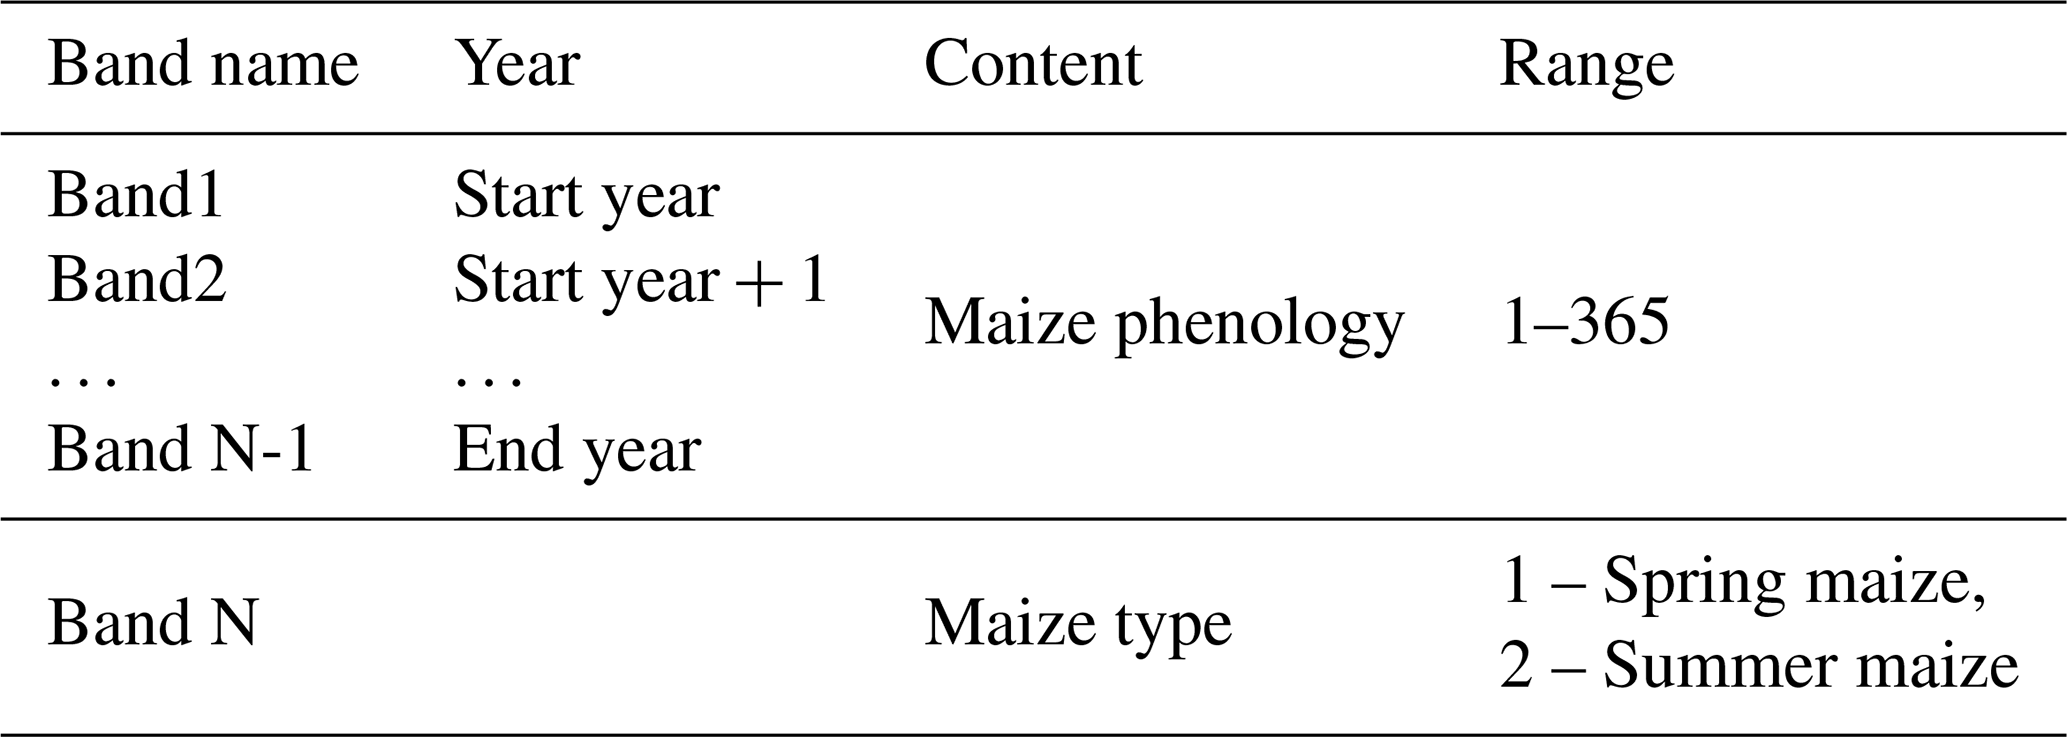
Note: The range of phenology was set between 1 and 366 for leap years.
This dataset provides the annual dynamics of maize phenological indicators with a fine spatial resolution (30 m) and a long temporal span (1985–2020) in China. The extracted phenology indicators include v3 (the date when the third leaf is fully expanded) and maturity (when the dry weight of maize grains first reaches the maximum). The format of this dataset is GeoTiff, with a spatial reference of WGS84. Each file in this dataset is named based on phenological indicators, start year, end year, and province. We divided the maize phenology into three parts: 1985–2000, 2001–2010, and 2011–2020 (Table 1). We included 17 provinces in our study, i.e., Beijing, Tianjin, Hebei, Henan, Shanxi, Shaanxi, Shandong, Hubei, Anhui, Jiangsu, Inner Mongolia, Ningxia, Gansu, Xinjiang, Heilongjiang, Jilin, and Liaoning. The derived annual maize phenology data in China from 1985 to 2020 are available at https://doi.org/10.6084/m9.figshare.16437054 (Niu et al., 2021).
In this study, we generated the first annual maize phenology product with a fine spatial resolution (30 m) and a long temporal span (1985–2020) in China, using all available Landsat images on the GEE platform. First, we extracted long-term mean phenological indicators (including v3 and maturity) from multi-year Landsat observations using the harmonic model. Second, we identified the annual dynamics of phenological indicators by measuring the difference of dates when the EVI in specific years equals the fitted value.
The maize phenology product derived from Landsat data agrees with the commonly used phenology dataset. Our derived maize phenology datasets consistently meet the in situ observations from the AMS and the PhenoCam phenology network. In addition, the phenology dataset in this study has similar temporal trends and can provide more spatial details than the MODIS phenology product. Furthermore, we observed a noticeable difference in the temporal trend of maize phenology before and after 2000, which is likely attributable to increasing temperature and annual variations of precipitation.
The extracted maize phenology dataset has great implications for crop field management and studies of the response of maize phenology to the changing environment. There are noticeable differences in crop growth due to diverse local climates, soil properties, and anthropogenic activities (such as sowing dates). The derived phenology product with a fine spatial resolution can delineate the difference and provide corresponding information to improve the field management and yield estimation (Zeng et al., 2020; Bolton and Friedl, 2013). In addition, this phenology product can also be used to investigate the response of crop phenology to global warming (Badeck et al., 2004; Niu et al., 2021). However, this study does not consider land cover changes (e.g., urban expansion and planting system change), which needs to be further investigated. For example, the maize distribution was regarded as consistent in our study over the past decades.
The supplement related to this article is available online at: https://doi.org/10.5194/essd-14-2851-2022-supplement.
QN, XL, and JH designed the research, performed the analysis, and wrote the paper; HH, XH, WS, and WY revised the manuscript.
The contact author has declared that neither they nor their co-authors have any competing interests.
Publisher’s note: Copernicus Publications remains neutral with regard to jurisdictional claims in published maps and institutional affiliations.
We would like to thank all the co-workers who participated in this research. And we would also acknowledge the editor and reviewers for their valuable comments.
This research has been supported by the National Natural Science Foundation of China (grant no. 41971383).
This paper was edited by Alexander Gruber and reviewed by two anonymous referees.
Abbas, G., Ahmad, S., Ahmad, A., Nasim, W., Fatima, Z., Hussain, S., ur Rehman, M. H., Khan, M. A., Hasanuzzaman, M., Fahad, S., Boote, K. J., and Hoogenboom, G.: Quantification the impacts of climate change and crop management on phenology of maize-based cropping system in Punjab, Pakistan, Agric. For. Meteorol., 247, 42–55, https://doi.org/10.1016/j.agrformet.2017.07.012, 2017.
Badeck, F., Bondeau, A., Böttcher, K., Doktor, D., Lucht, W., Schaber, J., and Sitch, S.: Responses of spring phenology to climate change, New Phytol., 162, 295–309, https://doi.org/10.1111/j.1469-8137.2004.01059.x, 2004.
Bolton, D. K. and Friedl, M. A.: Forecasting crop yield using remotely sensed vegetation indices and crop phenology metrics, Agric. For. Meteorol., 173, 74–84, https://doi.org/10.1016/j.agrformet.2013.01.007, 2013.
Bolton, D. K., Gray, J. M., Melaas, E. K., Moon, M., Eklundh, L., and Friedl, M. A.: Continental-scale land surface phenology from harmonized Landsat 8 and Sentinel-2 imagery, Remote Sens. Environ., 240, 111685, https://doi.org/10.1016/j.rse.2020.111685, 2020.
Cao, B., Yu, L., Naipal, V., Ciais, P., Li, W., Zhao, Y., Wei, W., Chen, D., Liu, Z., and Gong, P.: A 30 m terrace mapping in China using Landsat 8 imagery and digital elevation model based on the Google Earth Engine, Earth Syst. Sci. Data, 13, 2437–2456, https://doi.org/10.5194/essd-13-2437-2021, 2021.
Cao, R., Chen, J., Shen, M., and Tang, Y.: An improved logistic method for detecting spring vegetation phenology in grasslands from MODIS EVI time-series data, Agric. For. Meteorol., 200, 9–20, https://doi.org/10.1016/j.agrformet.2014.09.009, 2015.
Chen, J., Chen, J., Liu, H., and Peng, S.: Detection of Cropland Change Using Multi-Harmonic Based Phenological Trajectory Similarity, Remote Sens., 10, 1020, https://doi.org/10.3390/rs10071020, 2018.
Claverie, M., Ju, J., Masek, J. G., Dungan, J. L., Vermote, E. F., Roger, J.-C., Skakun, S. V., and Justice, C.: The Harmonized Landsat and Sentinel-2 surface reflectance data set, Remote Sens. Environ., 219, 145–161, https://doi.org/10.1016/j.rse.2018.09.002, 2018.
de Beurs, K. M. and Henebry, G. M.: Spatio-Temporal Statistical Methods for Modelling Land Surface Phenology, in: Phenological Research, edited by: Hudson, I. L. and Keatley, M. R., Springer Netherlands, Dordrecht, 177–208, https://doi.org/10.1007/978-90-481-3335-2_9, 2010.
Dong, J., Xiao, X., Menarguez, M. A., Zhang, G., Qin, Y., Thau, D., Biradar, C., and Moore, B.: Mapping paddy rice planting area in northeastern Asia with Landsat 8 images, phenology-based algorithm and Google Earth Engine, Remote Sens. Environ., 185, 142–154, https://doi.org/10.1016/j.rse.2016.02.016, 2016.
Dong, J., Fu, Y., Wang, J., Tian, H., Fu, S., Niu, Z., Han, W., Zheng, Y., Huang, J., and Yuan, W.: Early-season mapping of winter wheat in China based on Landsat and Sentinel images, Earth Syst. Sci. Data, 12, 3081–3095, https://doi.org/10.5194/essd-12-3081-2020, 2020.
Gao, F. and Zhang, X.: Mapping Crop Phenology in Near Real-Time Using Satellite Remote Sensing: Challenges and Opportunities, J. Remote Sens., 2021, 1–14, https://doi.org/10.34133/2021/8379391, 2021.
Gim, H.-J., Ho, C.-H., Jeong, S., Kim, J., Feng, S., and Hayes, M. J.: Improved mapping and change detection of the start of the crop growing season in the US Corn Belt from long-term AVHRR NDVI, Agric. For. Meteorol., 294, 108143, https://doi.org/10.1016/j.agrformet.2020.108143, 2020.
Gorelick, N., Hancher, M., Dixon, M., Ilyushchenko, S., Thau, D., and Moore, R.: Google Earth Engine: Planetary-scale geospatial analysis for everyone, Remote Sens. Environ., 202, 18–27, https://doi.org/10.1016/j.rse.2017.06.031, 2017.
Gray, J., Sulla-Menashe, D., and Friedl, M. A.: User guide to collection 6 modis land cover dynamics (mcd12q2) product, NASA EOSDIS Land Processes DAAC, Missoula, MT, USA [data set], https://doi.org/10.5067/MODIS/MCD12Q2.006, 2019.
He, L., Jin, N., and Yu, Q.: Impacts of climate change and crop management practices on soybean phenology changes in China, Sci. Total Environ., 707, 135638, https://doi.org/10.1016/j.scitotenv.2019.135638, 2020.
Huang, X., Liu, J., Zhu, W., Atzberger, C., and Liu, Q.: The Optimal Threshold and Vegetation Index Time Series for Retrieving Crop Phenology Based on a Modified Dynamic Threshold Method, Remote Sens., 11, 2725, https://doi.org/10.3390/rs11232725, 2019a.
Huang, J., Ma, H., Sedano, F., Lewis, P., Liang, S., Wu, Q., Su, W., Zhang, X., and Zhu, D.: Evaluation of regional estimates of winter wheat yield by assimilating three remotely sensed reflectance datasets into the coupled WOFOST–PROSAIL model, Eur. J. Agron., 102, 1–13, https://doi.org/10.1016/j.eja.2018.10.008, 2019b.
Lee, S., Kim, S., and Yoon, H.: Analysis of differences in vegetation phenology cycle of abandoned farmland, using harmonic analysis of time-series vegetation indices data: the case of Gwangyang City, South Korea, GIScience & Remote Sensing, 57, 338–351, https://doi.org/10.1080/15481603.2019.1698490, 2020.
Li, H., Zheng, L., Lei, Y., Li, C., Liu, Z., and Zhang, S.: Estimation of water consumption and crop water productivity of winter wheat in North China Plain using remote sensing technology, Agric. Water Manag., 95, 1271–1278, https://doi.org/10.1016/j.agwat.2008.05.003, 2008.
Li, L., Ming, B., Xie, R., Wang, K., Hou, P., Gao, S., Chu, Z., Zhang, W., Huang, Z., Li, H., Zhou, X., and Li, S.: The stability and variability of maize kernel moisture content at physiological maturity, Crop Sci., 61, 704–714, https://doi.org/10.1002/csc2.20289, 2021.
Li, X., Zhou, Y., Asrar, G. R., and Meng, L.: Characterizing spatiotemporal dynamics in phenology of urban ecosystems based on Landsat data, Sci. Total Environ., 605–606, 721–734, https://doi.org/10.1016/j.scitotenv.2017.06.245, 2017.
Li, X., Zhou, Y., Meng, L., Asrar, G. R., Lu, C., and Wu, Q.: A dataset of 30 m annual vegetation phenology indicators (1985–2015) in urban areas of the conterminous United States, Earth Syst. Sci. Data, 11, 881–894, https://doi.org/10.5194/essd-11-881-2019, 2019.
Liu, L., Zhang, X., Yu, Y., Gao, F., and Yang, Z.: Real-Time Monitoring of Crop Phenology in the Midwestern United States Using VIIRS Observations, Remote Sens., 10, 1540, https://doi.org/10.3390/rs10101540, 2018.
Luo, Y., Zhang, Z., Chen, Y., Li, Z., and Tao, F.: ChinaCropPhen1km: a high-resolution crop phenological dataset for three staple crops in China during 2000–2015 based on leaf area index (LAI) products, Earth Syst. Sci. Data, 12, 197–214, https://doi.org/10.5194/essd-12-197-2020, 2020.
Masek, J. G., Vermote, E. F., Saleous, N. E., Wolfe, R., Hall, F. G., Huemmrich, K. F., Gao, F., Kutler, J., and Lim, T.-K.: A Landsat Surface Reflectance Dataset for North America, 1990–2000, IEEE Geosci. Remote Sens. Lett., 3, 68–72, https://doi.org/10.1109/LGRS.2005.857030, 2006.
National Bureau of Statistics of China: National statistical yearbook, http://www.stats.gov.cn/tjsj/ndsj/2020/indexeh.htm, last access: 11 September 2021.
Niu, Q., Li, X., Huang, J., Huang, H., Huang, X., Su, W., and Yuan, W.: A 30 m annual maize phenology dataset from 1985 to 2020 in China, FigShare [data set], https://doi.org/10.6084/m9.figshare.16437054, 2021.
Pan, Z., Huang, J., Zhou, Q., Wang, L., Cheng, Y., Zhang, H., Blackburn, G. A., Yan, J., and Liu, J.: Mapping crop phenology using NDVI time-series derived from HJ-1 A/B data, Int. J. Appl. Earth Obs. Geoinformation, 34, 188–197, https://doi.org/10.1016/j.jag.2014.08.011, 2015.
Pekel, J.-F., Cottam, A., Gorelick, N., and Belward, A. S.: High-resolution mapping of global surface water and its long-term changes, Nature, 540, 418–422, https://doi.org/10.1038/nature20584, 2016.
Peng, S., Ding, Y., Liu, W., and Li, Z.: 1 km monthly temperature and precipitation dataset for China from 1901 to 2017, Earth Syst. Sci. Data, 11, 1931–1946, https://doi.org/10.5194/essd-11-1931-2019, 2019.
Richardson, A. D., Hufkens, K., Milliman, T., Aubrecht, D. M., Chen, M., Gray, J. M., Johnston, M. R., Keenan, T. F., Klosterman, S. T., Kosmala, M., Melaas, E. K., Friedl, M. A., and Frolking, S.: Tracking vegetation phenology across diverse North American biomes using PhenoCam imagery, Sci. Data, 5, 180028, https://doi.org/10.1038/sdata.2018.28, 2018.
Sakamoto, T., Wardlow, B. D., Gitelson, A. A., Verma, S. B., Suyker, A. E., and Arkebauer, T. J.: A Two-Step Filtering approach for detecting maize and soybean phenology with time-series MODIS data, Remote Sens. Environ., 114, 2146–2159, https://doi.org/10.1016/j.rse.2010.04.019, 2010.
Sakamoto, T., Gitelson, A. A., and Arkebauer, T. J.: Near real-time prediction of U.S. corn yields based on time-series MODIS data, Remote Sens. Environ., 147, 219–231, https://doi.org/10.1016/j.rse.2014.03.008, 2014.
Senf, C., Pflugmacher, D., Heurich, M., and Krueger, T.: A Bayesian hierarchical model for estimating spatial and temporal variation in vegetation phenology from Landsat time series, Remote Sens. Environ., 194, 155–160, https://doi.org/10.1016/j.rse.2017.03.020, 2017.
Shanmugapriya, P., Rathika, S., Ramesh, T., and Janaki, P.: Applications of Remote Sensing in Agriculture – A Review, Int. J. Curr. Microbiol. Appl. Sci., 8, 2270–2283, https://doi.org/10.20546/ijcmas.2019.801.238, 2019.
Sun, H., Zhang, X., Chen, S., Pei, D., and Liu, C.: Effects of harvest and sowing time on the performance of the rotation of winter wheat–summer maize in the North China Plain, Ind. Crops Prod., 25, 239–247, https://doi.org/10.1016/j.indcrop.2006.12.003, 2007.
Tao, F., Zhang, S., and Zhang, Z.: Spatiotemporal changes of wheat phenology in China under the effects of temperature, day length and cultivar thermal characteristics, Eur. J. Agron., 43, 201–212, https://doi.org/10.1016/j.eja.2012.07.005, 2012.
Wu, W., Yang, P., Tang, H., Zhou, Q., Chen, Z., and Shibasaki, R.: Characterizing Spatial Patterns of Phenology in Cropland of China Based on Remotely Sensed Data, Agric. Sci. China, 9, 101–112, https://doi.org/10.1016/S1671-2927(09)60073-0, 2010.
Xiao, Y., Dong, Y., Huang, W., Liu, L., Ma, H., Ye, H., and Wang, K.: Dynamic Remote Sensing Prediction for Wheat Fusarium Head Blight by Combining Host and Habitat Conditions, Remote Sens., 12, 3046, https://doi.org/10.3390/rs12183046, 2020.
Xiong, B., Chen, R., Xia, Z., Ye, C., and Anker, Y.: Large-scale deforestation of mountainous areas during the 21st Century in Zhejiang Province, Land Degrad. Dev., 31, 1761–1774, https://doi.org/10.1002/ldr.3563, 2020.
Yang, Y., Anderson, M. C., Gao, F., Johnson, D. M., Yang, Y., Sun, L., Dulaney, W., Hain, C. R., Otkin, J. A., Prueger, J., Meyers, T. P., Bernacchi, C. J., and Moore, C. E.: Phenological corrections to a field-scale, ET-based crop stress indicator: An application to yield forecasting across the U.S. Corn Belt, Remote Sens. Environ., 257, 112337, https://doi.org/10.1016/j.rse.2021.112337, 2021.
You, N., Dong, J., Huang, J., Du, G., Zhang, G., He, Y., Yang, T., Di, Y., and Xiao, X.: The 10-m crop type maps in Northeast China during 2017–2019, Sci. Data, 8, 41, https://doi.org/10.1038/s41597-021-00827-9, 2021.
Zeng, L., Wardlow, B. D., Xiang, D., Hu, S., and Li, D.: A review of vegetation phenological metrics extraction using time-series, multispectral satellite data, Remote Sens. Environ., 237, 111511, https://doi.org/10.1016/j.rse.2019.111511, 2020.
Zhang, J., Feng, L., and Yao, F.: Improved maize cultivated area estimation over a large scale combining MODIS–EVI time series data and crop phenological information, ISPRS J. Photogramm. Remote Sens., 94, 102–113, https://doi.org/10.1016/j.isprsjprs.2014.04.023, 2014.
Zhang, S. and Tao, F.: Modeling the response of rice phenology to climate change and variability in different climatic zones: Comparisons of five models, Eur. J. Agron., 45, 165–176, https://doi.org/10.1016/j.eja.2012.10.005, 2013.
Zhang, X., Friedl, M. A., Schaaf, C. B., Strahler, A. H., Hodges, J. C. F., Gao, F., Reed, B. C., and Huete, A.: Monitoring vegetation phenology using MODIS, Remote Sens. Environ., 84, 471–475, https://doi.org/10.1016/S0034-4257(02)00135-9, 2003.
Zhong, L., Gong, P., and Biging, G. S.: Efficient corn and soybean mapping with temporal extendability: A multi-year experiment using Landsat imagery, Remote Sens. Environ., 140, 1–13, https://doi.org/10.1016/j.rse.2013.08.023, 2014.
Zhu, Z. and Woodcock, C. E.: Object-based cloud and cloud shadow detection in Landsat imagery, Remote Sens. Environ., 118, 83–94, https://doi.org/10.1016/j.rse.2011.10.028, 2012.