the Creative Commons Attribution 4.0 License.
the Creative Commons Attribution 4.0 License.
 | 21 Dec 2021
A harmonized global land evaporation dataset from model-based products covering 1980–2017
Guojie Wang
Tiexi Chen
Shijie Li
Daniel Fiifi Tawia Hagan
Giri Kattel
Jian Peng
Tong Jiang
Buda Su
Land evaporation (ET) plays a crucial role in the hydrological and energy cycle. However, the widely used model-based products, even though helpful, are still subject to great uncertainties due to imperfect model parameterizations and forcing data. The lack of available observed data has further complicated estimation. Hence, there is an urgency to define the global proxy land ET with lower uncertainties for climate-induced hydrology and energy change. This study has combined three existing model-based products – the fifth-generation ECMWF reanalysis (ERA5), Global Land Data Assimilation System Version 2 (GLDAS2), and the second Modern-Era Retrospective analysis for Research and Applications (MERRA-2) – to obtain a single framework of a long-term (1980–2017) daily ET product at a spatial resolution of 0.25∘. Here, we use the reliability ensemble averaging (REA) method, which minimizes errors using reference data, to combine the three products over regions with high consistencies between the products using the coefficient of variation (CV). The Global Land Evaporation Amsterdam Model Version 3.2a (GLEAM3.2a) and flux tower observation data were selected as the data for reference and evaluation, respectively. The results showed that the merged product performed well over a range of vegetation cover scenarios. The merged product also captured the trend of land evaporation over different areas well, showing the significant decreasing trend in the Amazon Plain in South America and Congo Basin in central Africa and the increasing trend in the east of North America, west of Europe, south of Asia and north of Oceania. In addition to demonstrating a good performance, the REA method also successfully converged the models based on the reliability of the inputs. The resulting REA data can be accessed at https://doi.org/10.5281/zenodo.4595941 (Lu et al., 2021).
- Article
(10897 KB) - Full-text XML
-
Supplement
(1405 KB) - BibTeX
- EndNote


Land evaporation plays an important role in the exchange of energy, water and carbon in the terrestrial biosphere, hydrosphere and atmosphere. It is one of the dominant components of land water and the energy budget, as well as a key driver of drought episodes (Seneviratne, 2012; Sheffield et al., 2012). Therefore, it is important to quantify the spatial and temporal patterns of land evaporation. In addition, it is used to estimate water requirements for irrigation by agricultural and water resource management groups. The strength of the hydrological cycle determines water availability and affects the climate system in a variety of ways (Mueller et al., 2013). Apart from hydrological applications, land evaporation change is also related to air temperature change and extreme high temperature conditions (Seneviratne et al., 2006, 2010; Hirschi et al., 2011; Mueller and Seneviratne, 2012). It is apparent that land evaporation is regarded as the intermediate variable of soil moisture affecting air temperature. Thus, it could be inferred that the uncertainty in land evaporation estimation will introduce adverse errors into various aspects, which creates the need for a global proxy evaporation (ET) dataset with lower uncertainties.
Since the land surface is more heterogeneous than the ocean, it is difficult to estimate land evaporation accurately due to huge uncertainties resulting from complex land–atmosphere feedback processes. In addition, a major challenge remains to be addressed; that is, there is no direct signal describing land evaporation that has been remotely detected. Recently, solar-induced chlorophyll fluorescence (SIF) has been discovered as an emerging technique to observe the photosynthetic processes of vegetation by quantifying the emission of fluorescent radiation (Joiner et al., 2014). Remotely sensed SIF has potential to empirically track the variation in canopy-level transpiration (Lu et al., 2018; Shan et al., 2019). However, satellite observations relating to surface temperature, soil moisture or vegetation coverage data can be combined with traditional flux formulas as an alternative method to derive global estimates at different temporal and spatial scales (Monteith, 1965; Priestley and Taylor, 1972). The available terrestrial ET datasets have widely varying estimates and even opposite long-term trends, indicating the existence of non-negligible uncertainties. Further, satellite-based land evaporation products show great discrepancies when compared with latent heat flux from flux towers (Jiménez et al., 2011; Mueller et al., 2011; McCabe et al., 2016; Peng et al., 2016, 2020). Although latent heat flux is widely used as a benchmark for assessing the quality of land ET datasets, flux tower data are unevenly distributed around the world, only densely in some regions of North America, Europe and Oceania (as shown in Fig. 1a). On account of these reasons, an alternative product is developed which leverages the strengths of widely used existing model-based ET products.
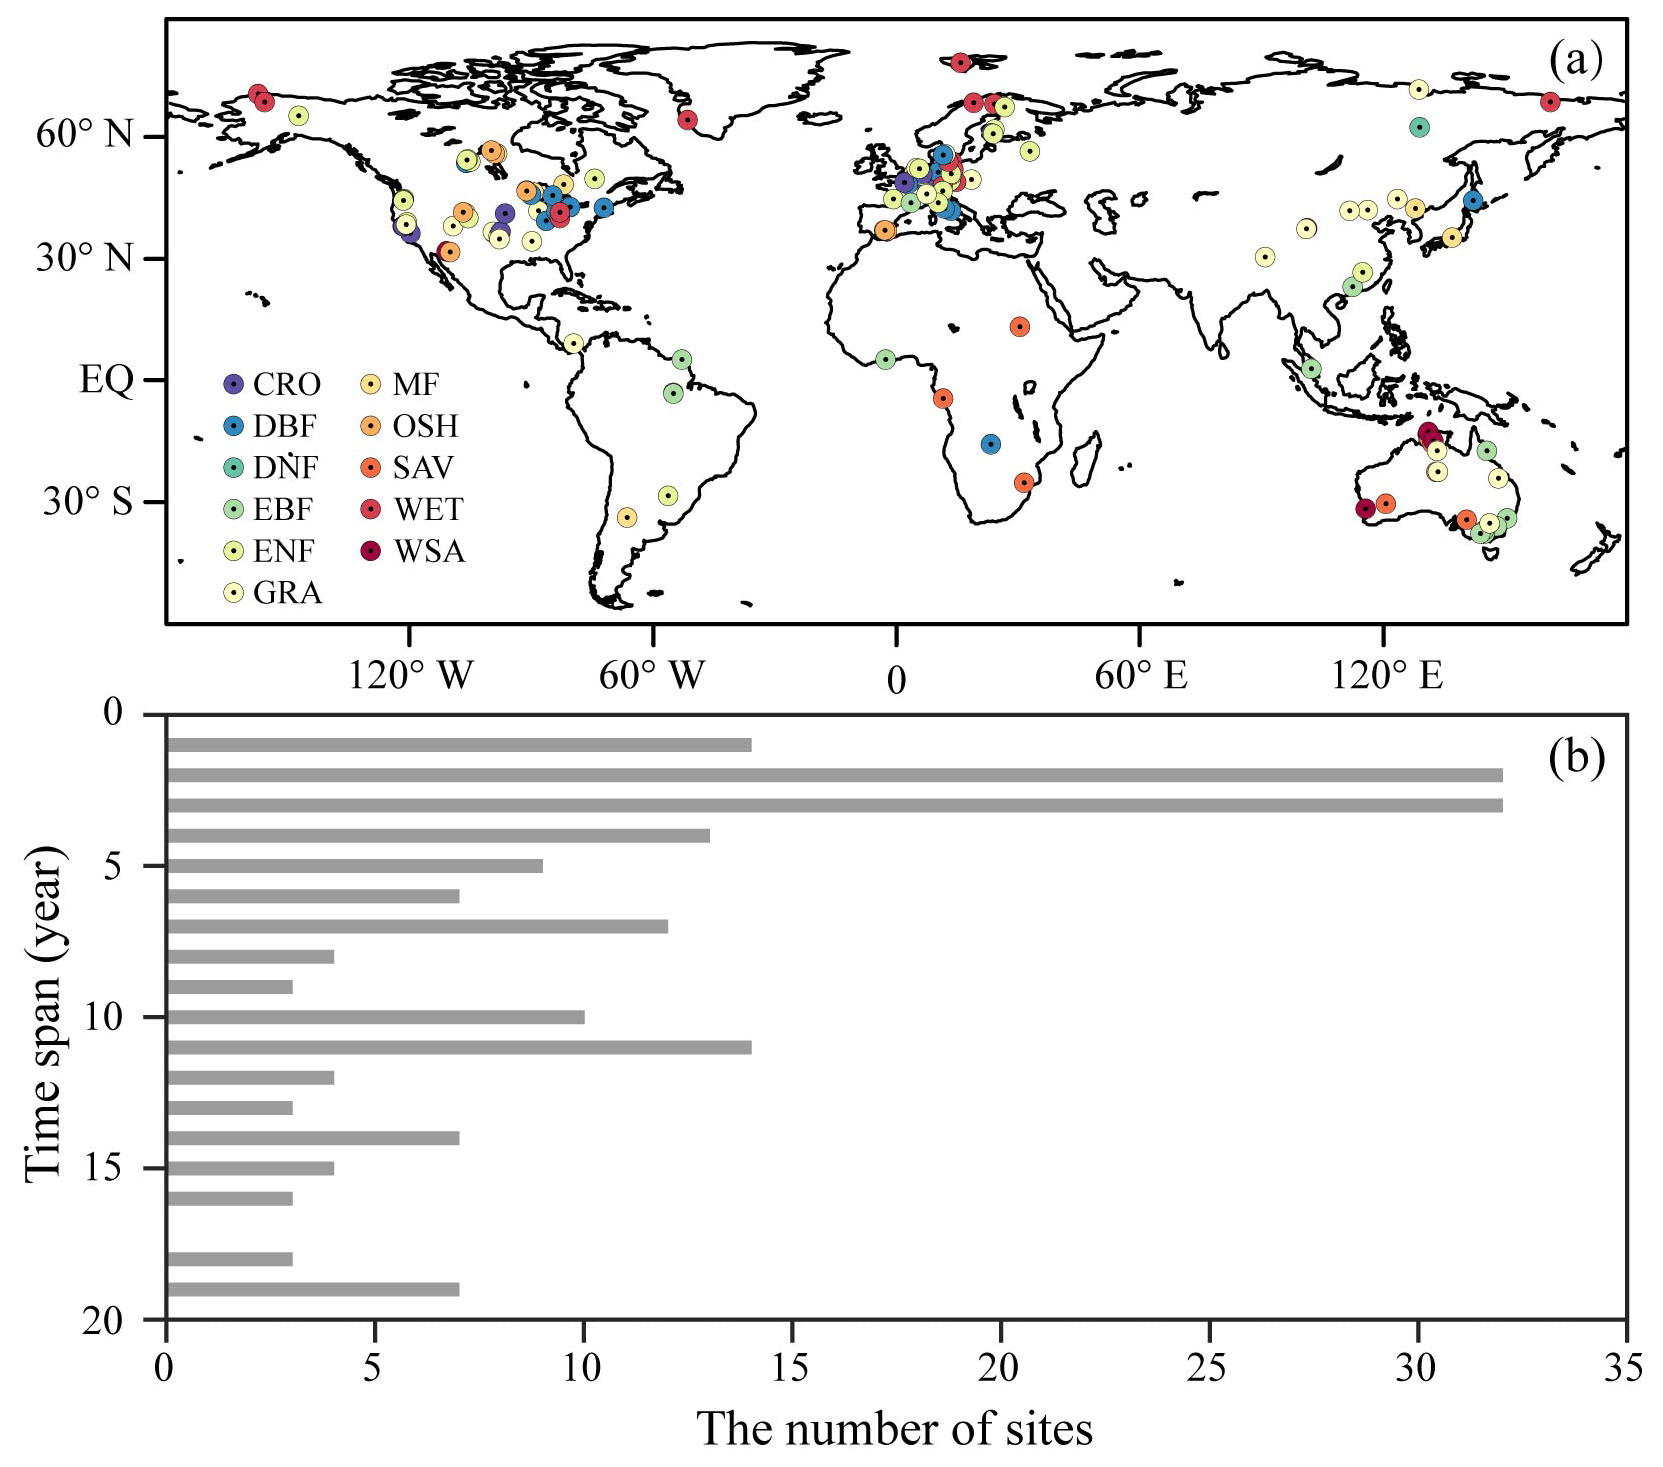
Figure 1(a) Spatial distribution of 181 in situ flux EC sites across the world and (b) the number of sites for different time spans. See Sect. 2.1.5 for definitions of the abbreviations used in (a).
In previous studies, far from hindering the use of these land evaporation datasets, differences among the products have been capable of facilitating research into the best merging methods to obtain datasets with lower uncertainties (Jiménez et al., 2018). Due to differences in algorithms and the calibration coefficient, the simulated results can have greater discrepancies. Obtaining the land evaporation with relatively high precision has been achieved when various methods have been combined. Although this may not necessarily lead to a better prediction ability of land evaporation and increased understanding of physical processes, uncertainties can be reduced by the integration of multiple remote sensing products (Jung et al., 2010; Mueller et al., 2013) and more complex data-merging methods (Yao et al., 2014). The effectiveness of hydrometeorological monitoring can be improved by accurate quantification and further reduction in the uncertainty in water cycle variables, especially land ET. Therefore, a variety of merging techniques have been introduced and applied to water cycle variables such as soil moisture and precipitation in recent years. Least-squares (Yilmaz et al., 2012) and maximization r (Kim et al., 2015, 2018) techniques were proposed for merging satellite soil moisture products. In regard to precipitation data merging, a geographically weighted regression algorithm (Xu et al., 2015), conditional merging (Baik et al., 2016), geographical difference analysis (Cheema and Bastiaanssen, 2012), geographic ratio analysis (Duan and Bastiaanssen, 2013) and the Multi-Source Weighted-Ensemble Precipitation (MSWEP) method (Beck et al., 2017) have been widely used. As for land ET, several relevant studies have evolved through simple averaging to complex methods including the weighted average (Hobeichi et al., 2018); reproducing flux observations combined with the original land evaporation product (Yao et al., 2017a); or seeking consistency between land evaporation and water-cycle-related products such as precipitation, runoff and land water storage (Aires et al., 2014; Munier et al., 2014). Various data-merging methods, such as Kalman filtering algorithms (Pipunic et al., 2008; Liu et al., 2013), Bayesian model averaging (BMA) and empirical orthogonal functions (EOFs), can improve regional ET estimation by merging multiple ET products (Yao et al., 2014, 2016; Feng et al., 2016; Zhu et al., 2016). Since land ET is a complex variable coupling energy, hydrology and the carbon budget, it is difficult to accurately determine the optimal conditional density function in BMA that determines the performance of the method (Yao et al., 2014). Simultaneously, the methods' complexity affects the efficiency of calculating the weight of an individual dataset, which limits their wide application. Simple averaging (SA) (Ershadi et al., 2014) and simple Taylor skill score (STS) merging (Yao et al., 2017b) have been adopted for global ET merging. However, SA assumes the same uncertainty in each dataset, which is actually unreasonable, and the STS is highly dependent on the accuracy of individual datasets, which makes it highly quality-demanding for the datasets involved in the merging process. Khan et al. (2018) analyzed the sources of uncertainties for three different ET products using the triple collocation (TC) method, which estimates the random error standard deviations for three datasets of the same variable according to statistical relations and provides an uncorrelated absolute and relative error structure among datasets. Lastly, Jiménez et al. (2018) proposed an error variance unweighted merging method with the local weights deduced according to the variance of the differences between the outliers of the flux tower and simulated land evaporation. The above merging methods effectively reduce the uncertainties in simulations by estimating the weight of multiple products to generate reliable merged products (Zhu et al., 2016). However, previous studies have mostly focused on the evaluation of ET simulation at regional scales and in regional landscapes (Yang et al., 2016).
Compared with the simple averaging method, the reliability ensemble averaging (REA) method extracts the most reliable information from each model by minimizing the impact of “outliers” or underperforming models, subsequently reducing the uncertainty range in simulated changes, and also stands out in terms of computational efficiency (Giorgi and Mearns, 2002). These standards including the bias in the simulated ET from the reference and the distance of the simulated ET from the ensemble average are regional rather than global, as most models tend to show anomalous behavior or poor performance from one region to another. The the REA method also produces a quantitative measure of reliability, indicating that the simulations need to meet both criteria in order to improve the overall reliability of simulation changes. On the one hand, REA method considers model performance, that is, the ability of models to reproduce current climate, which is defined by the difference between the simulation and observation. On the other hand, the model convergence, a factor to measure the reliability of the models, is taken into consideration as well. This is the distance between the changes in the given model and that of the ensemble average. The REA method has been widely used for meteorological variables such as precipitation and temperature. Giorgi and Mearns (2002) used the REA method to integrate the average seasonal temperature and precipitation of 22 land regions in the world under two emission scenarios simulated by nine atmosphere–ocean circulation models in the late 21st century. However, there are few studies on the application of area-averaged grid-scale merging of long-sequence model-based land evaporation data. This study aims to develop a long-term high-quality global land ET product using merging technology. Merging multiple single datasets is expected to reduce the uncertainties in land ET effectively. The merged product can provide a basis for water cycle research and global water resources management. Hence, systematic and in-depth studies on land evaporation merging are urgently needed.
2.1 Data types
Three widely used land ET datasets were selected for merging, including the fifth-generation ECMWF reanalysis (ERA5; Hersbach et al., 2020), the second Modern-Era Retrospective analysis for Research and Applications (MERRA-2; Gelaro et al., 2017), and Global Land Data Assimilation System Version 2 ET (GLDAS2; Sheffield and Wood, 2007). The differences in spatial and temporal resolution among the ET products were rescaled to a daily timescale and 0.25∘, with the time span from 1980 to 2017. The Global Land Evaporation Amsterdam Model (GLEAM; Miralles et al., 2011) was used for the reference data due to its relative independence from other datasets participating in the merging process. Ideally, in situ data would be the first choice to be used as the reference data for the merging. However, these point-scale datasets are very scarce globally and only representative of their immediate locations. Therefore, area-averaged grid-scale estimates offer a better alternative at this scale. Additionally, GLEAM is not a complex terrestrial model as found in the land models of ERA5, MERRA-2 and GLDAS but a set of algorithms dedicated to estimating terrestrial evaporation using retrieved satellite observations including soil moisture, vegetation optical depth and snow–water equivalent and is a multi-source precipitation product that relies on only radiation and temperature inputs from reanalysis products (Martens et al., 2017). As such GLEAM offers a higher level of independence than the other products. Eddy covariance (EC) ET was used to evaluate the merged product compared with other datasets involved in the merging process. Monthly GIMMS NDVI3g data with a spatial resolution of 0.25∘ from Global Inventory Modeling and Mapping Studies (GIMMS) were used to study how the quality of land evaporation datasets changes with vegetation in our study (Pinzon and Tucker, 2014), with the time span from 1982 to 2014, and is available from https://data.tpdc.ac.cn/en/data/c6113f70-884a-4716-98e3-933421c57f25/ (last access: 11 December 2021). The spatial and temporal resolutions of these ET datasets are shown in Table 1 and are briefly described below.

2.1.1 Global Land Evaporation Amsterdam Model (GLEAM) ET
GLEAM algorithm estimates land evaporation mainly based on the parameterized physical process. Stress conditions are parameterized as a function of dynamic vegetation information and available water in the root zone. In addition, the detailed parameterization of forest interception is one of its key features. Canopy interception loss, a component of land evaporation, is calculated by the daily precipitation using the parameters describing canopy storage, canopy coverage, and the average precipitation and evaporation rate under saturated canopy conditions. It uses extensive independent remote sensing observations such as snow–water equivalent, vegetation optical depth and soil moisture as the basis for calculating land evaporation and its different components, including transpiration, bare-soil evaporation, interception loss, open-water evaporation and sublimation separately (Priestley and Taylor, 1972). The empirical parameters contained in this algorithm such as the evaporation stress factor, the latent heat of evaporation and the slope of the saturated water vapor–temperature curve have been obtained from findings in different fields. On a global scale, GLEAM has been validated with the observations obtained from a eddy covariance instrument, indicating that it can be used to describe terrestrial ET in different ecosystems (Miralles et al., 2011). In addition, GLEAM is a long-sequence dataset predominantly based on remote sensing observations and, on occasion, reanalysis data. GLEAM is unlike traditional land models, such as those found in ERA5, MERRA-2 and GLDAS, in that it is driven by satellite observations to obtain evaporation estimates. The version of GLEAM here relies very little on reanalysis datasets (only the radiation and temperature of ERA-Interim). Therefore, GLEAM has the most independence relative to the model-based products and is selected for the reference data due to its relative independence. The version of the dataset used in this study is 3.2a, which spans a 38-year period through 1980 to 2017, gridded with 0.25∘. It is available from https://www.gleam.eu/ (last access: 11 December 2021).
2.1.2 The fifth-generation ECMWF reanalysis (ERA5) ET
Following ERA-15, ERA-40 and ERA-Interim, the fifth generation of ECMWF reanalysis data ERA5 has been released, which is envisioned to replace ERA-Interim reanalysis (Hersbach et al., 2020). Compared with ERA-Interim, some of the key climatic information of ERA5 has been improved. The most updated version of the Earth system model and data assimilation techniques used at ECMWF have been applied in ERA5, including more sophisticated parameterization of geophysical processes in comparison to the previous versions used in ERA-Interim. ERA5 covers from 1979 to the near-real-time period (on a regular basis); moreover, the temporal and spatial resolutions have been improved in ERA5, from 6-hourly in ERA-Interim to hourly and from 79 to 31 km in the horizontal dimension and 60 to 137 in vertical levels. ERA5 has a better balance of global precipitation and evaporation (Albergel et al., 2018). Martens et al. (2020) evaluated surface energy partitioning in ERA5, especially including latent heat fluxes using different reference datasets and modeling tools, with the analysis showing that there are lower absolute biases in the surface latent heat flux of ERA5 than of ERA-Interim, though ERA5 still appears to overestimate the latent heat flux in most catchments. It is available from https://www.ecmwf.int/en/forecasts/datasets/reanalysis-datasets/era5/ (last access: 11 December 2021).
2.1.3 The second Modern-Era Retrospective analysis for Research and Applications (MERRA-2) ET
MERRA-2 (Gelaro et al., 2017) is an advanced atmospheric reanalysis dataset, which absorbs a mass of satellite data, including new observation types such as hyperspectral radiation, microwaves and aerosols. MERRA-2 is unique in modern reanalysis datasets in that it contains aerosol data assimilation (Randles et al., 2017). Like ERA5, it combines satellite and more traditional weather observations with simulated atmospheric behavior, making an attempt to obtain the optimal possible estimation of the Earth system state. MERRA-2 is the second version of MERRA, which has undergone several major upgrades, including an observation-based precipitation bias correction (Reichle et al., 2017). The land surface model used in MERRA-2 is the Catchment Land Surface Model (Koster et al., 2000), where land evaporation is calculated as part of the energy balance at the land surface. Hourly data with a spatial resolution are provided by the Goddard Earth Sciences Data and Information Service Center (DISC). Daily data from 1980 to 2017 have been used in this study. The accuracy of MERRA-2 has been widely evaluated (Bosilovich et al., 2015; Gelaro et al., 2017), including water cycle variability and the global water balance (Bosilovich et al., 2017). It is available from https://goldsmr4.gesdisc.eosdis.nasa.gov/data/MERRA2/M2T1NXLND.5.12.4/ (last access: 11 December 2021).
2.1.4 Global Land Data Assimilation System ET (GLDAS) ET
GLDAS is a global high-resolution land modeling system based on the North American Land Data Assimilation System (NLDAS). In order to generate better land surface products in different land surface models (LSMs), GLDAS generates the optimal field of surface state and flux by absorbing satellite and surface observation data, taking advantage of advanced land surface modeling (Rodell et al., 2004). Different LSMs are used including Mosaic, Noah, the Community Land Model (CLM) and the Variable Infiltration Capacity (VIC) model, where only Noah has continued being updated until now. Recently, there has been more and more evidence to show that GLDAS1.0 has serious discontinuities due to forcing data such as large precipitation and temperature errors in 1996 and 2000–2005 (Wang et al., 2016). Therefore, both daily and monthly land evaporation data of GLDAS2 combined with Noah LSM (GLDAS2–Noah) have been used in this study, whose spatial resolution is . GLDAS2 includes two datasets, specifically GLDAS2.0 and GLDAS2.1, where the simulations start from 1948 in GLDAS2.0 and 2000 in GLDAS2.1. The product is simulated with the Princeton University meteorological forcing dataset (PUMFD), which has been corrected with observation-based products during the period of 1948–2010 (Sheffield et al., 2006). The time periods of 1980 to 1999 for GLDAS2.0 and 2000 to 2017 for GLDAS2.1 are selected in this study. Details of forcing data and a description of the model are available at https://disc.gsfc.nasa.gov/information?page=1&project=GRACE-DA-DM,FLDAS,GLDAS,NEWS,NLDAS,NCA-LDAS&keywords=hydrology (last access: 11 December 2021). The data are available from https://hydro1.gesdisc.eosdis.nasa.gov/data/GLDAS/GLDAS_NOAH025_3H.2.0/ (last access: 11 December 2021) and https://hydro1.gesdisc.eosdis.nasa.gov/data/GLDAS/GLDAS_NOAH025_3H.2.1/ (last access: 11 December 2021).
2.1.5 Eddy covariance (EC) ET
Latent heat flux (LE) from 181 effective flux towers across the world is used to evaluate the performance of multiple datasets with different estimates and is available from http://fluxnet.fluxdata.org/ (last access: 11 December 2021). Eddy covariance is a widely used energy flux measurement method that provides continuous measurement of the interchange of water and energy (Mu et al., 2011). Measurements are masked with the provided quality flags in the dataset archives. Since there is minimal impact of ground-measured ET on days with strong precipitation on the verification results (Fig. S1 in the Supplement), data on these days are not excluded in order to retain more site data. Figure 1 shows that the data availability of in situ data occurs over different periods. The data cover the period of 1992–2014, including at least 1 year of reliable data. As shown in Fig. 1b, the periods vary from 1 to 19 years, with 14, 32, 32, 13 and 9 sites reporting 1, 2, 3, 4 and 5 years of data, respectively, accounting for 55 % of the sites. Ideally, a fair evaluation of the products could be made if the availability of the datasets fully overlapped. However, here, the limited overlapping times available of the in situ datasets make their use quite inconsistent. Nonetheless, they are still useful since they offer an objective evaluation source. As such no filtering was applied to select specific data apart from the quality control applied. The observed land evaporation is calculated by latent heat flux in the following equation:
where λ is the conversion factor with a fixed value of 2.45 MJ kg−1. The flux towers are located in 11 land cover types including 17 cropland (CRO), 23 deciduous broadleaf forest (DBF), 1 deciduous needleleaf forest (DNF), 13 evergreen broadleaf forest (EBF), 42 evergreen needleleaf forest (ENF), 34 grassland (GRA), 9 mixed forest (MF), 9 open shrubland (OSH), 8 savanna (SAV), 19 permanent wetland (WET) and 6 woody savanna (WSA) sites. In the rest of the paper, the different land cover types listed, which are representative of different ecosystem types, will be simply referred to as ecosystems.
2.2 Methods
In this study, we investigated whether more accurate ET results could be obtained through the weighted combination of ERA5, GLDAS and MERRA-2 estimation. Ideally, the weight assigned to each product should be based on an accurate description of the uncertainty during the merging process. Therefore, the three datasets have been weighted with respect to GLEAM, and the performance of the merged ET products has been studied at the selected sites. A set of weights need to be defined for the weighted combination of three products, usually based on the individual uncertainty in each product. The simplest strategy used in previous studies has been to assume that all three products have the same uncertainty; thus the merged product is a simple average of each product. A more detailed strategy used in this study is to weigh the products based on their uncertainties. The expected goal is to develop a product that minimizes root mean square deviation (RMSD), which we call optimal in the context of our merging strategy.
2.2.1 Coefficient of variation
The coefficient of variation (CV), also known as the relative standard deviation in probability theory and statistics, is used to evaluate the consistency of multiple sets of reanalysis ET data. It is a statistic to measure the degree of variation in the data. The consistency decreases with an increase in the CV. It is calculated from the following equation:
where S represents the standard deviation and represents the average of multiple sets of reanalysis ET data in each pixel.
This approach is superior to standard deviation in terms of evaluating consistency and can eliminate the influence of different units and/or the average on the degree of variation in two or more data points. In this paper, multiple sets of reanalysis land evaporation data are blended into a single product based on their performance and convergence criteria.
2.2.2 Reliability ensemble averaging
The reliability ensemble averaging (REA) method (Giorgi and Mearns, 2002; Xu et al., 2010) was used to combine multiple sets of model-based ET data into a single product. Two reliability criteria were considered in the method: model performance and model convergence, in other words, the model's performance in reproducing the current climate and the convergence of simulated values between models.
In our REA method, the average ET is given by a weighted average of all the ensemble members.
where represents the REA and Ri represents the model reliability factor defined as
The merging is extended to pixels rather than just taking place at the flux tower level, based on the selection of the independent GLEAM as the reference to compensate for the limited EC-measured ET. RB,i and RD,i in Eq. (4) are measures of the model performance and convergence criteria, respectively. RB,i is a factor to measure the reliability of the model through the bias (BET,i) between the simulated ET and the reference; that is, the larger the bias, the lower the reliability of the model. RD,i is a factor to measure the reliability in the aspect of the distance (DET,i) between the simulated ET and the ensemble average; that is, the higher the distance, the lower the reliability of the model.
The parameters m and n in Eq. (4) are used to measure the relative importance of the two criteria. In this work, assuming the importance of the two criteria is equal, m and n were both assigned the value of 1. However, if the two criteria are given different weights, they may be different. The parameter ϵ in Eq. (4) is a measure of natural variability in 38-year ET. In order to calculate ϵ, we estimated moving averages after linearly detrending the 38-year time series data in each pixel. Then, the differences between the maximum and minimum of the moving averages are computed as ϵ. In addition, when B and D are less than ϵ, RB and RD are set to 1. In essence, Eq. (4) indicates that the model is reliable when the bias and the distance from the ensemble average are within the limits of natural variability, where . With the bias or distance growing, the reliability of a given model decreases.
However, the performance of a dataset varies across all time points in a certain region, with some time points performing better and some worse. This will be taken into account in the next release of the data.
The specific merging steps are as follows:
-
Step 1. Select the best climatology according to the root mean square deviation (RMSD) between each dataset and EC-measured ET.
-
Step 2. Calculate the anomalies of each dataset participating in the merging and the reference data.
-
Step 3. Merge the anomalies.
-
Step 4. Add the best climatology to the merged anomalies to obtain the final merged product.
2.2.3 Validation criteria
The error metrics of the Pearson correlation coefficient (r), root mean square deviation (RMSD) and unbiased root mean square deviation (ubRMSD) were used to verify the blending product. The statistic values are defined as follows:
where n represents the sample size and Mi and refi represent multiple sets of reanalysis ET data and reference data, respectively, at time i. and represent the average of Mi and refi.
The consistency of the three datasets has been illustrated in Fig. 2, where Fig. 2a–c show the differences in land evaporation between each dataset and the mean of the three products. In the high latitudes of the Northern Hemisphere, GLDAS2–Noah ET is more than 20 % higher than the mean of the three products and ERA5 ET is almost the same as the mean, while MERRA-2 ET is more than 20 % lower than the mean. In the middle latitudes, ERA5 ET is more than 20 % higher than the ensemble mean, while GLDAS2–Noah ET is more than 20 % lower than it. As for MERRA-2 ET, there are a few areas with values higher than the mean of the three products. In the western part of South America and parts of Oceania in the Southern Hemisphere, ERA5 ET is higher than the mean of the three products while GLDAS2–Noah is lower than it, with MERRA-2 showing no significant difference. In these regions, the three datasets are significantly different, indicating that the estimation of land evaporation is of great uncertainty and low consistency. In order to reduce the risk of inaccuracy in land evaporation merging, the CV is used to select regions with high consistency. The CV analysis aims to evaluate the relative systematic differences between the three model products. Since it does not take the reference data into account, it does not directly translate into the merging scheme. Nonetheless, it serves as an added check to obtain optimum consistencies in the merging process for higher skill in the merged data. Not surprisingly, in the north of North America, west of South America, and desert regions of mid-latitude Africa and Asia, the CV is above 0.8, indicating relatively low consistency and high risk; thus these regions are excluded from the merging region. In essence, these excluded areas are concentrated in hyper-arid areas where some methods for estimating land evaporation are not applicable (Goya and Harmsen, 2013). If the data we used for merging are highly different from each other and none of them are close to the reference data, merging in these regions does not make sense. For the overall reliability of the merged product, we excluded these areas that might be highly uncertain.
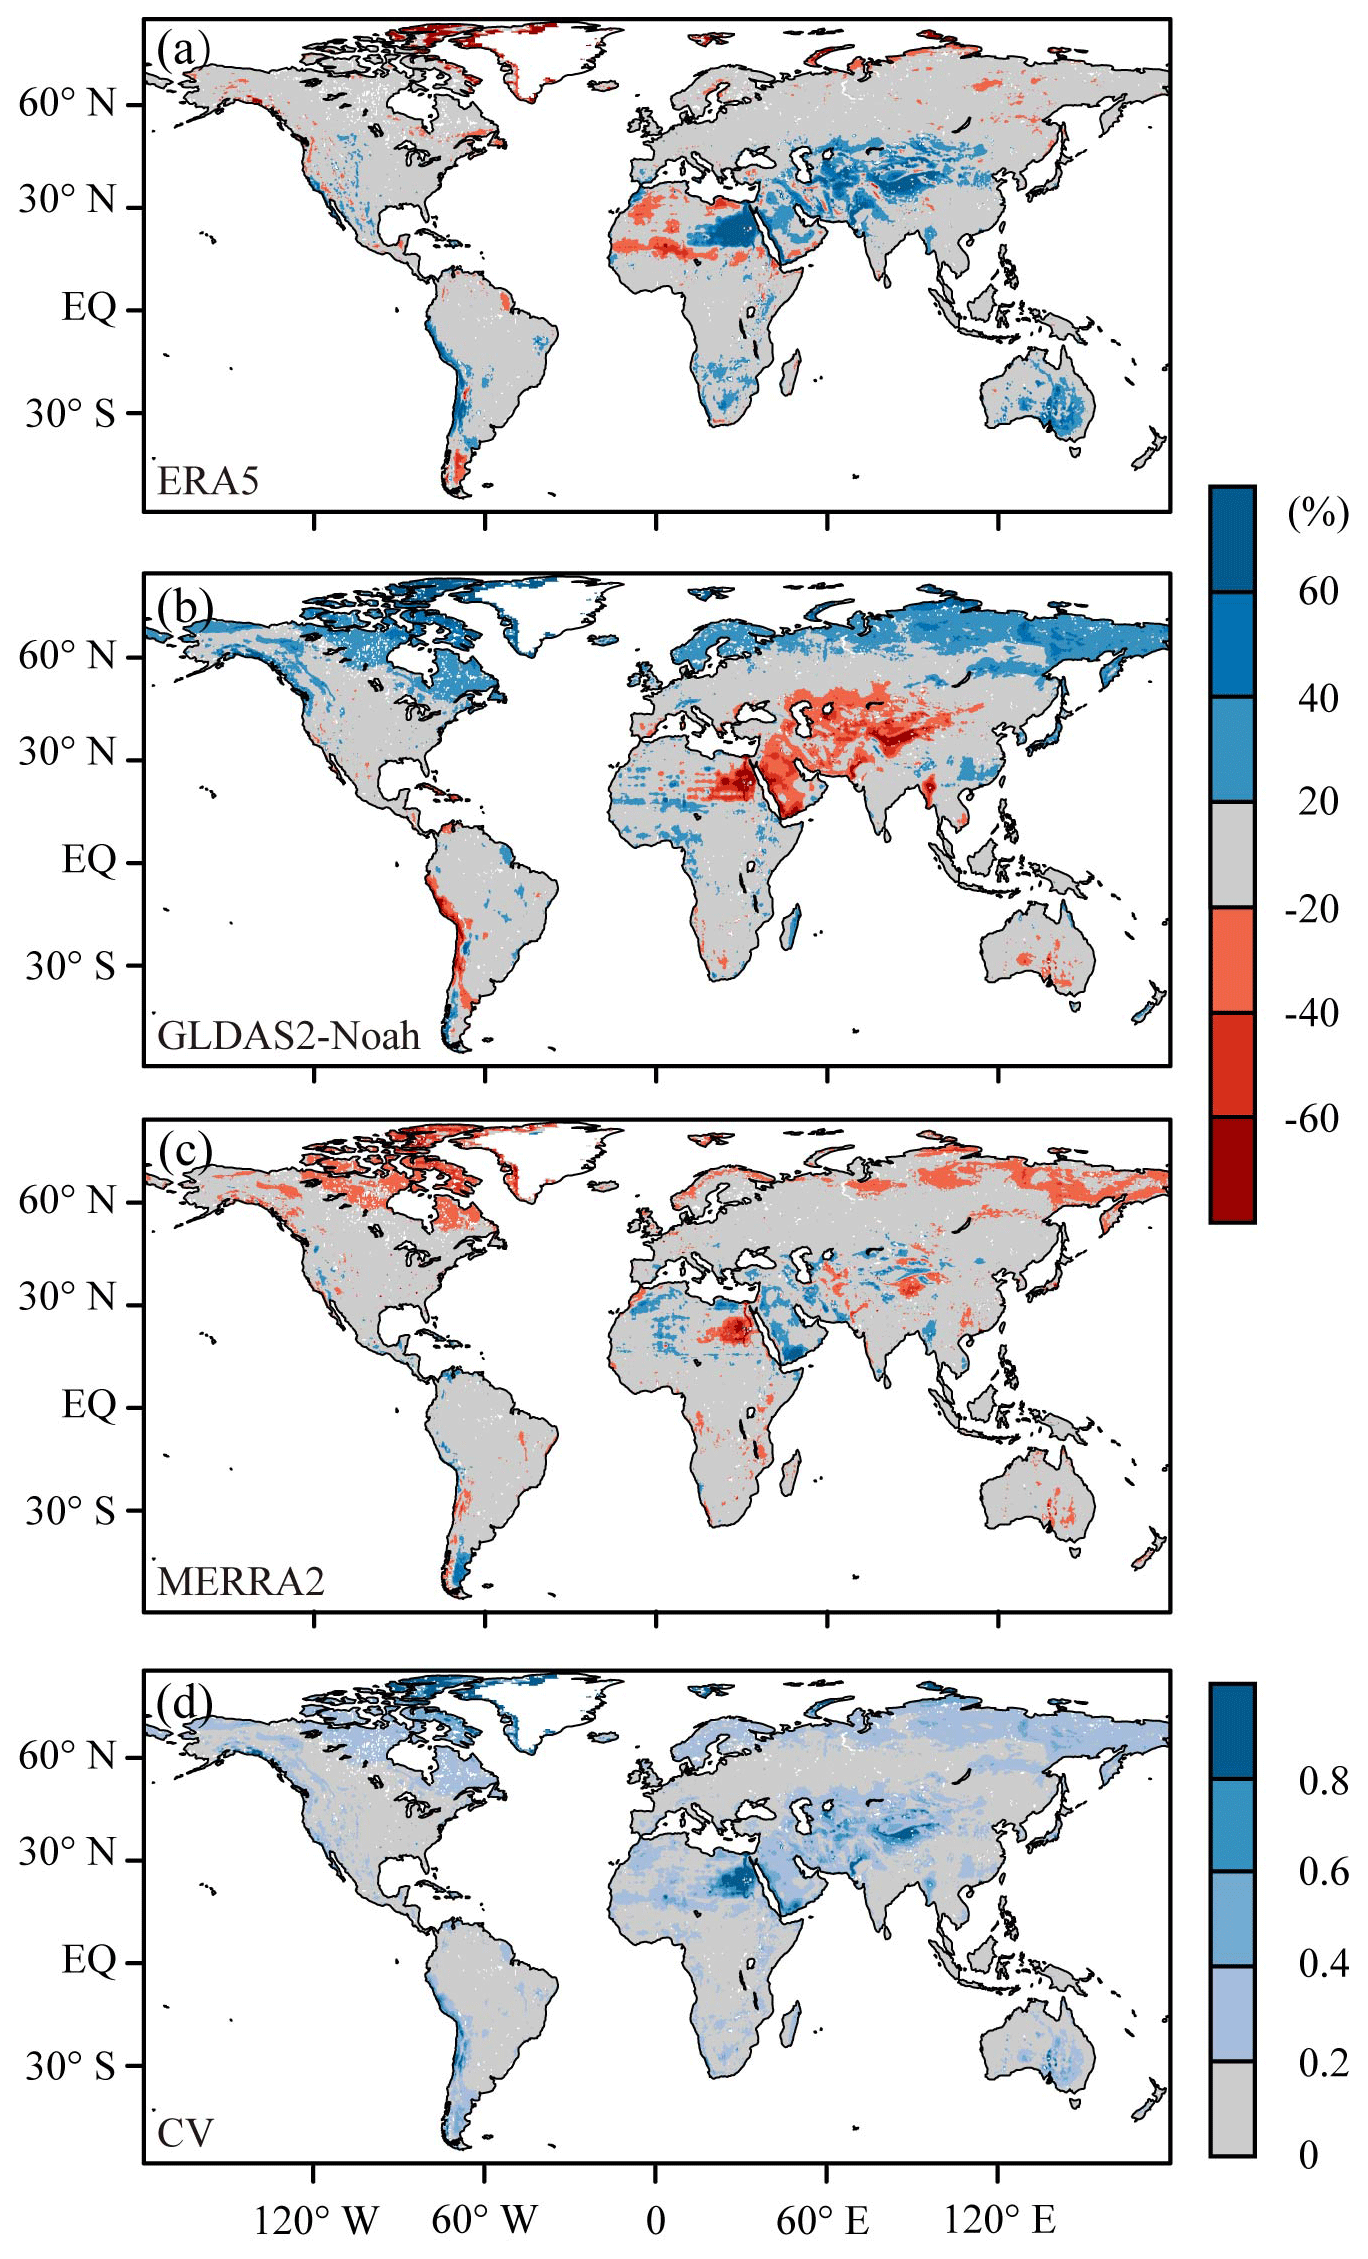
Figure 2(a–c) The percentage of the difference between ERA5, GLDAS2–Noah and MERRA-2 and average of the three datasets. (d) Variable coefficient of the three datasets.
The spatial distribution of weights has been depicted in Fig. 3, representing the contribution of each dataset to the merged product. It is not difficult to find that the weights are within the scope of 0.3–0.35 in most regions, indicating that the contributions of the three datasets in these regions are basically the same. In the Amazon Plain near the Equator, the Congo Basin and the border between Oceania and Asia, the weights of multiple datasets vary greatly. The weights of MERRA-2 ET in these regions are below 0.3, while ERA5 ET and GLDAS2–Noah ET are above 0.35, indicating that MERRA-2 ET contributed less than the other two datasets in these regions. GLDAS2–Noah ET is found to contribute greatly to the Amazon Plain and the border between Oceania and Asia, while in the Congo Basin ERA5 contributes the most. Zonally banded weight of the three datasets are presented in Fig. 3a–c. Three curves are shown in Fig. 3d, which describe the contributions of each dataset at different latitudes. Obviously, the contribution of MERRA-2 ET is less than that of the other two datasets near the Equator; further, GLDAS2–Noah ET contributes slightly more than ERA5 ET. In the high latitudes of the Northern Hemisphere, the difference in contributions among the three datasets is greatest where the contribution of ERA5 ET is the highest. In the Southern Hemisphere, south of 40∘ S, MERRA-2 makes a higher contribution than the other two datasets, with little difference in the contribution of the three datasets in other regions.
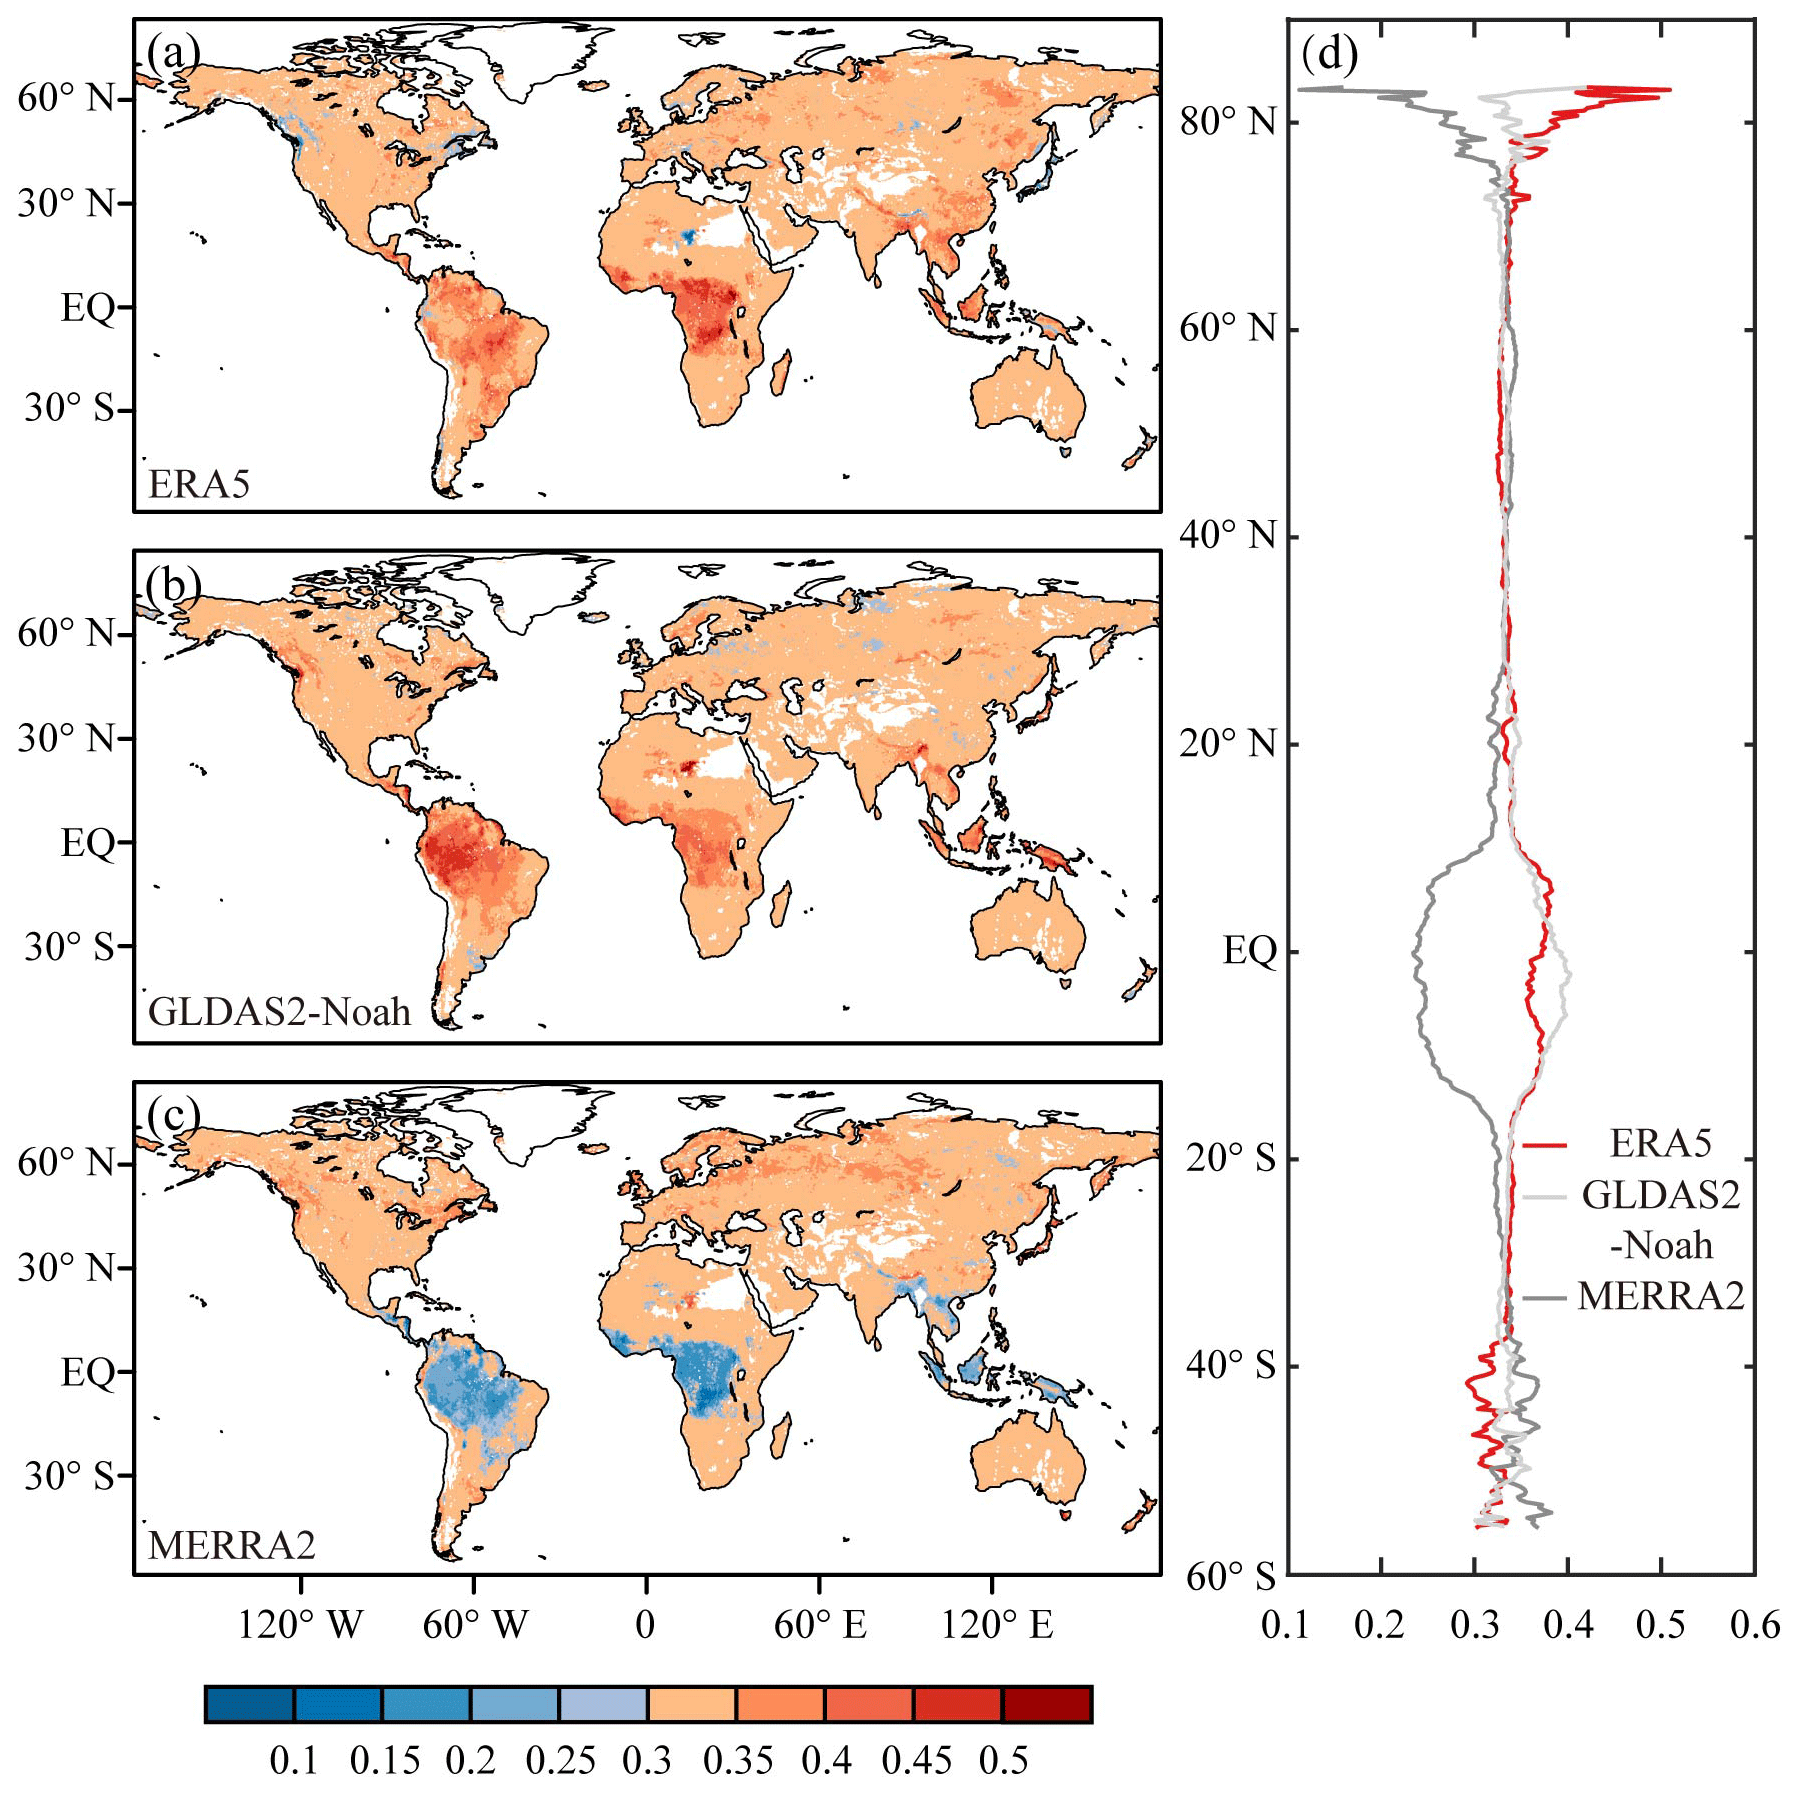
Figure 3(a–c) Spatial distribution of weights and (d) latitudinal distribution of weights.
The latitudinal distribution of the multiyear mean land evaporation of five products is shown in Fig. 4a. General consistency in the spatial pattern is shown in spite of differences in intensity. However, large differences appear in the interannual variation in these products (Fig. 4b), though the long-term trends generally show good consistency. Anomalies for all datasets are shown in Fig. 4b. The comparison reveals similar temporal variations in these datasets over most periods. The land evaporation time series of all datasets reach their low ebb between 2000 and 2005. Most of them peak between 2010 and 2011, except for MERRA-2 ET in 1981 and ERA5 ET in 1998. It is conspicuous that the fluctuations in the merged product and four individual datasets are relatively small in the first half of the 38 years, while in the second half, relatively large fluctuations could be observed from all datasets except ERA5 ET. The merged product as well as four individual datasets shows significant decreasing trends from 1997 to 2002 and increasing trends from 2002 to 2010. Figure 4b also shows that the differences between REA and the other products vary with time in their interannual variation. That is, the errors are not stationary. Nonetheless, their long-term trends generally show good consistency. The obvious differences between the probability density distributions of multiple datasets are clearly visible. In general, the consistency between the merged product and GLEAM ET is better, which may be greatly related to GLEAM as the reference data in the merging process. Due to the discrepancies in the driving data and calculation formulations for land evaporation, anomalies vary from data to data.
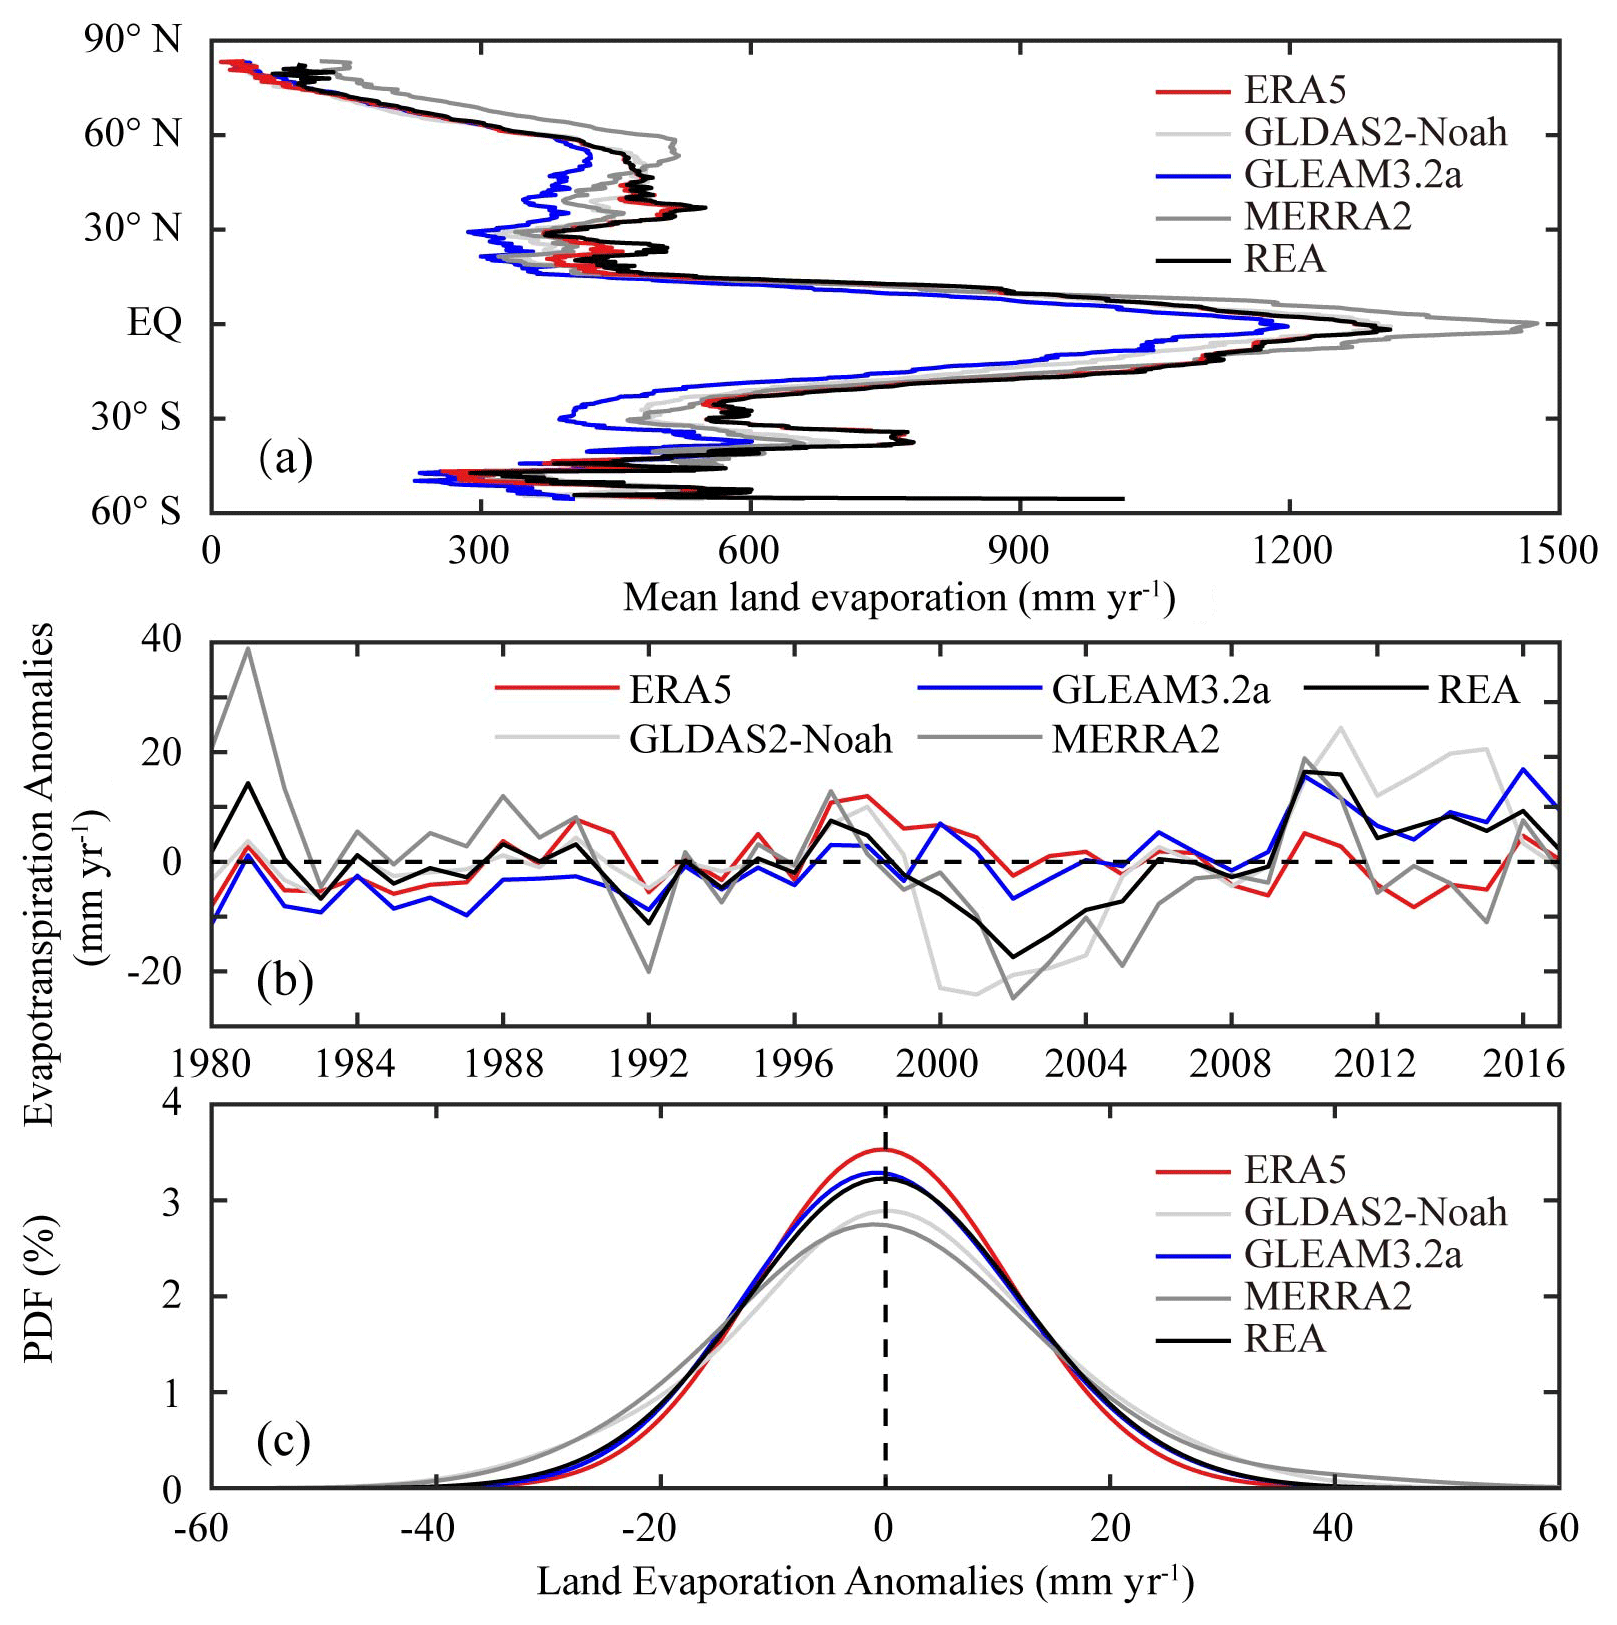
Figure 4(a) Latitudinal distribution of mean land evaporation from five datasets, (b) time series (1980–2017) and (c) probability distribution of annual land evaporation anomalies from five ET products. The bandwidth of the kernel smoothing window was set to 10.
Figure 5a–e show the scatter diagrams of multiple datasets and station-observed data at a daily scale. More points are found concentrated above the 1:1 line, which makes it clear that land evaporation is somewhat overestimated. Among the five datasets, the correlation coefficient between REA and station-observed data is the highest, reaching 0.72, followed by ERA5; the other three datasets are basically the same. Therefore, the correlation coefficient is significantly improved through REA data merging, indicating more consistent changes between REA and station-observed data. Similarly, as for RMSD, REA is the smallest, only 0.91 mm. Therefore, the deviation between the REA data-merging product and station-observed data is significantly reduced compared with other data, indicating that the accuracy is greatly improved. The Taylor chart in Fig. 5f describes the ratio of the standard deviation, correlation coefficient and unbiased root mean square deviation between five datasets and station-observed data on a daily scale, with the ratio of standard deviation representing the ratio between each dataset and station-observed data. The ratio of standard deviation of REA is the smallest, nearly 1, indicating almost the same with station-observed data and the smallest fluctuation among all datasets considered. The ubRMSD values of multiple datasets are slightly smaller than the RMSD while the rank of them remains the same; specifically . The correlation coefficient between REA and station-observed data is the highest; meanwhile the ratios of standard deviation, RMSD and ubRMSD are the lowest, indicating that REA performs optimally under all assessment criteria.
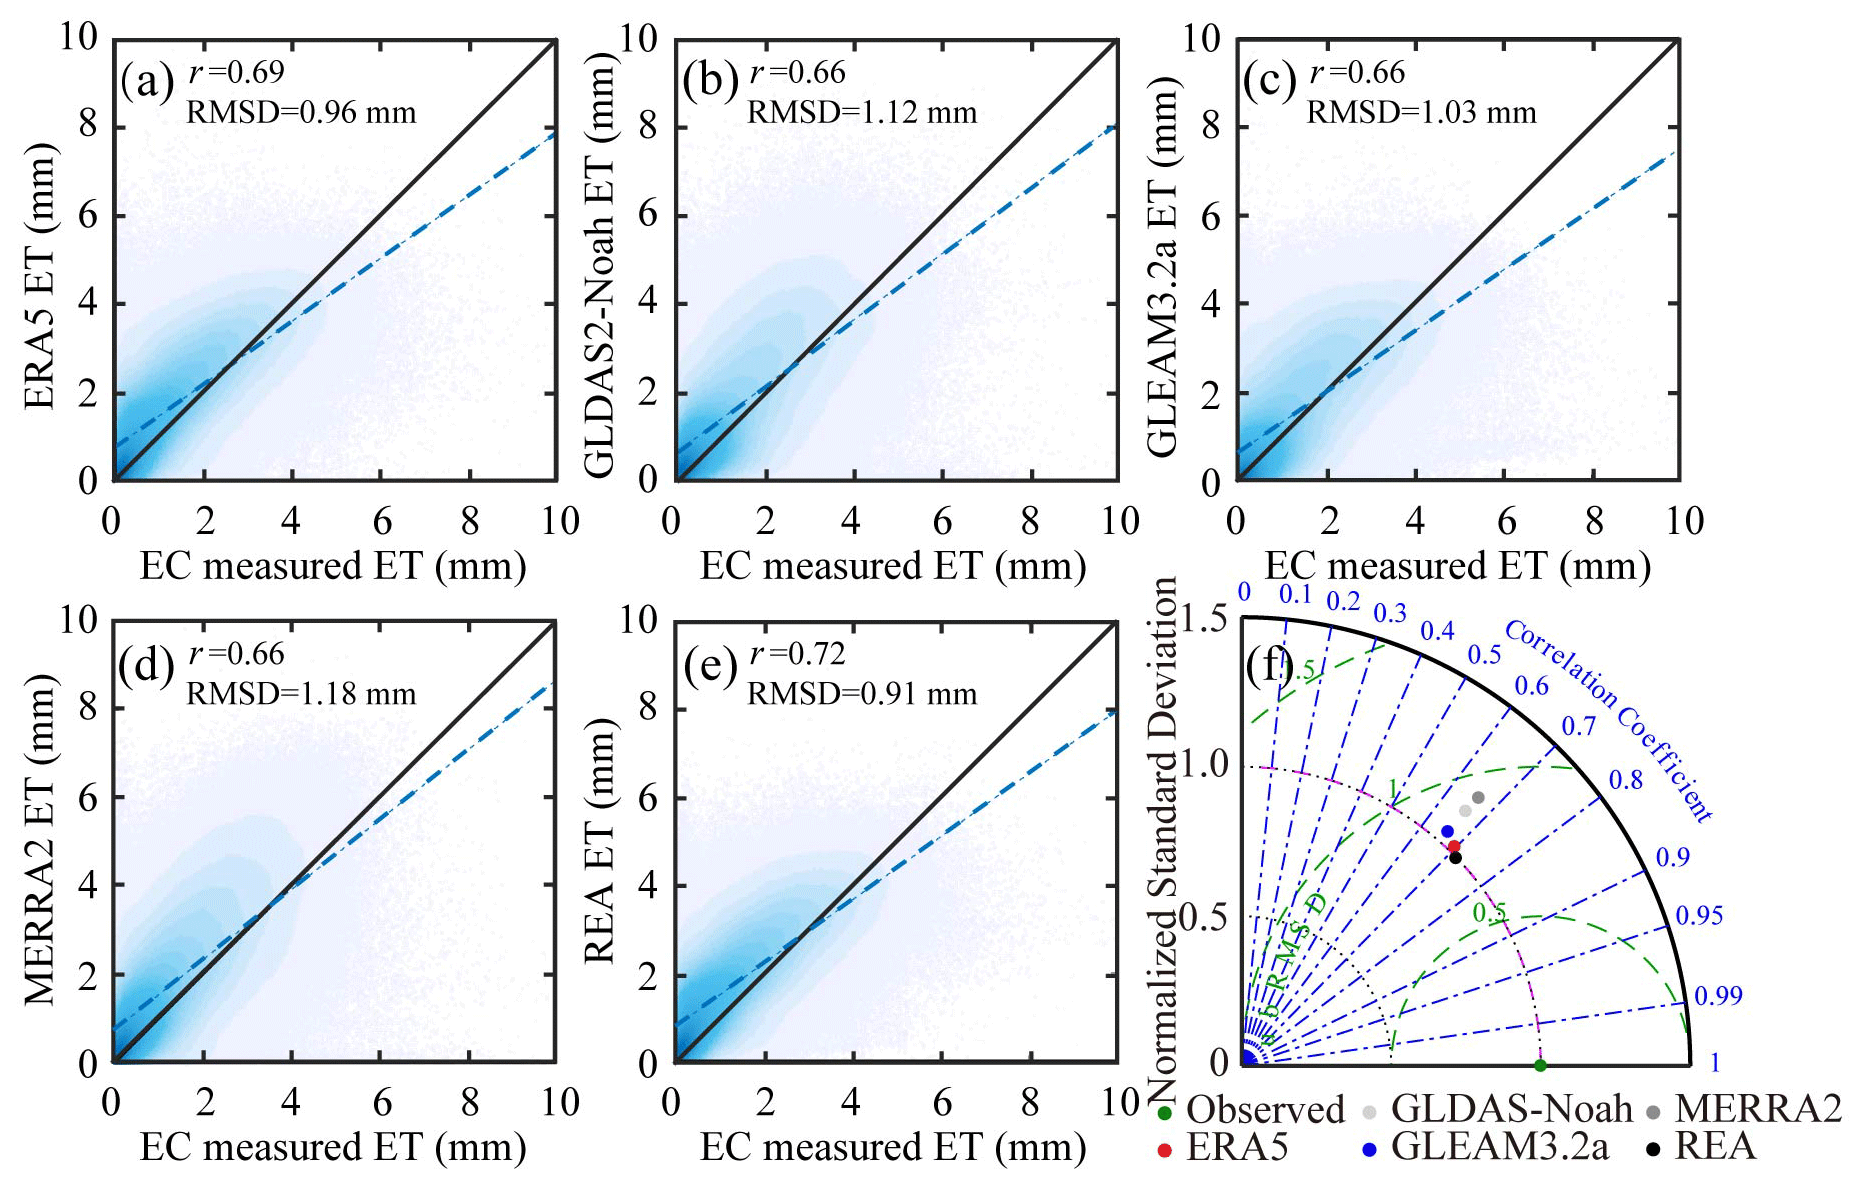
Figure 5(a–e) Scatterplots and (f) Taylor diagrams of daily ground-measured ET and ET from different products. Linear fits are plotted in blue, and the 1:1 line is depicted. The correlation coefficients (r) have passed the 5 % significance test.
Figure 6 verifies the quality of multiple land evaporation datasets at a monthly scale based on station-observed data. The correlation coefficient between these datasets and station-observed data on a monthly scale is higher than that on a daily scale, with REA the highest, reaching 0.77. Among the five datasets, the RMSD between REA and station-observed data is the smallest, only 23.94 mm. It can be seen from the Taylor chart that the ratio of standard deviation of each dataset on a monthly scale is larger than that on a daily scale, indicating the increase in fluctuation. Like the daily scale, REA performs optimally under all assessment criteria.
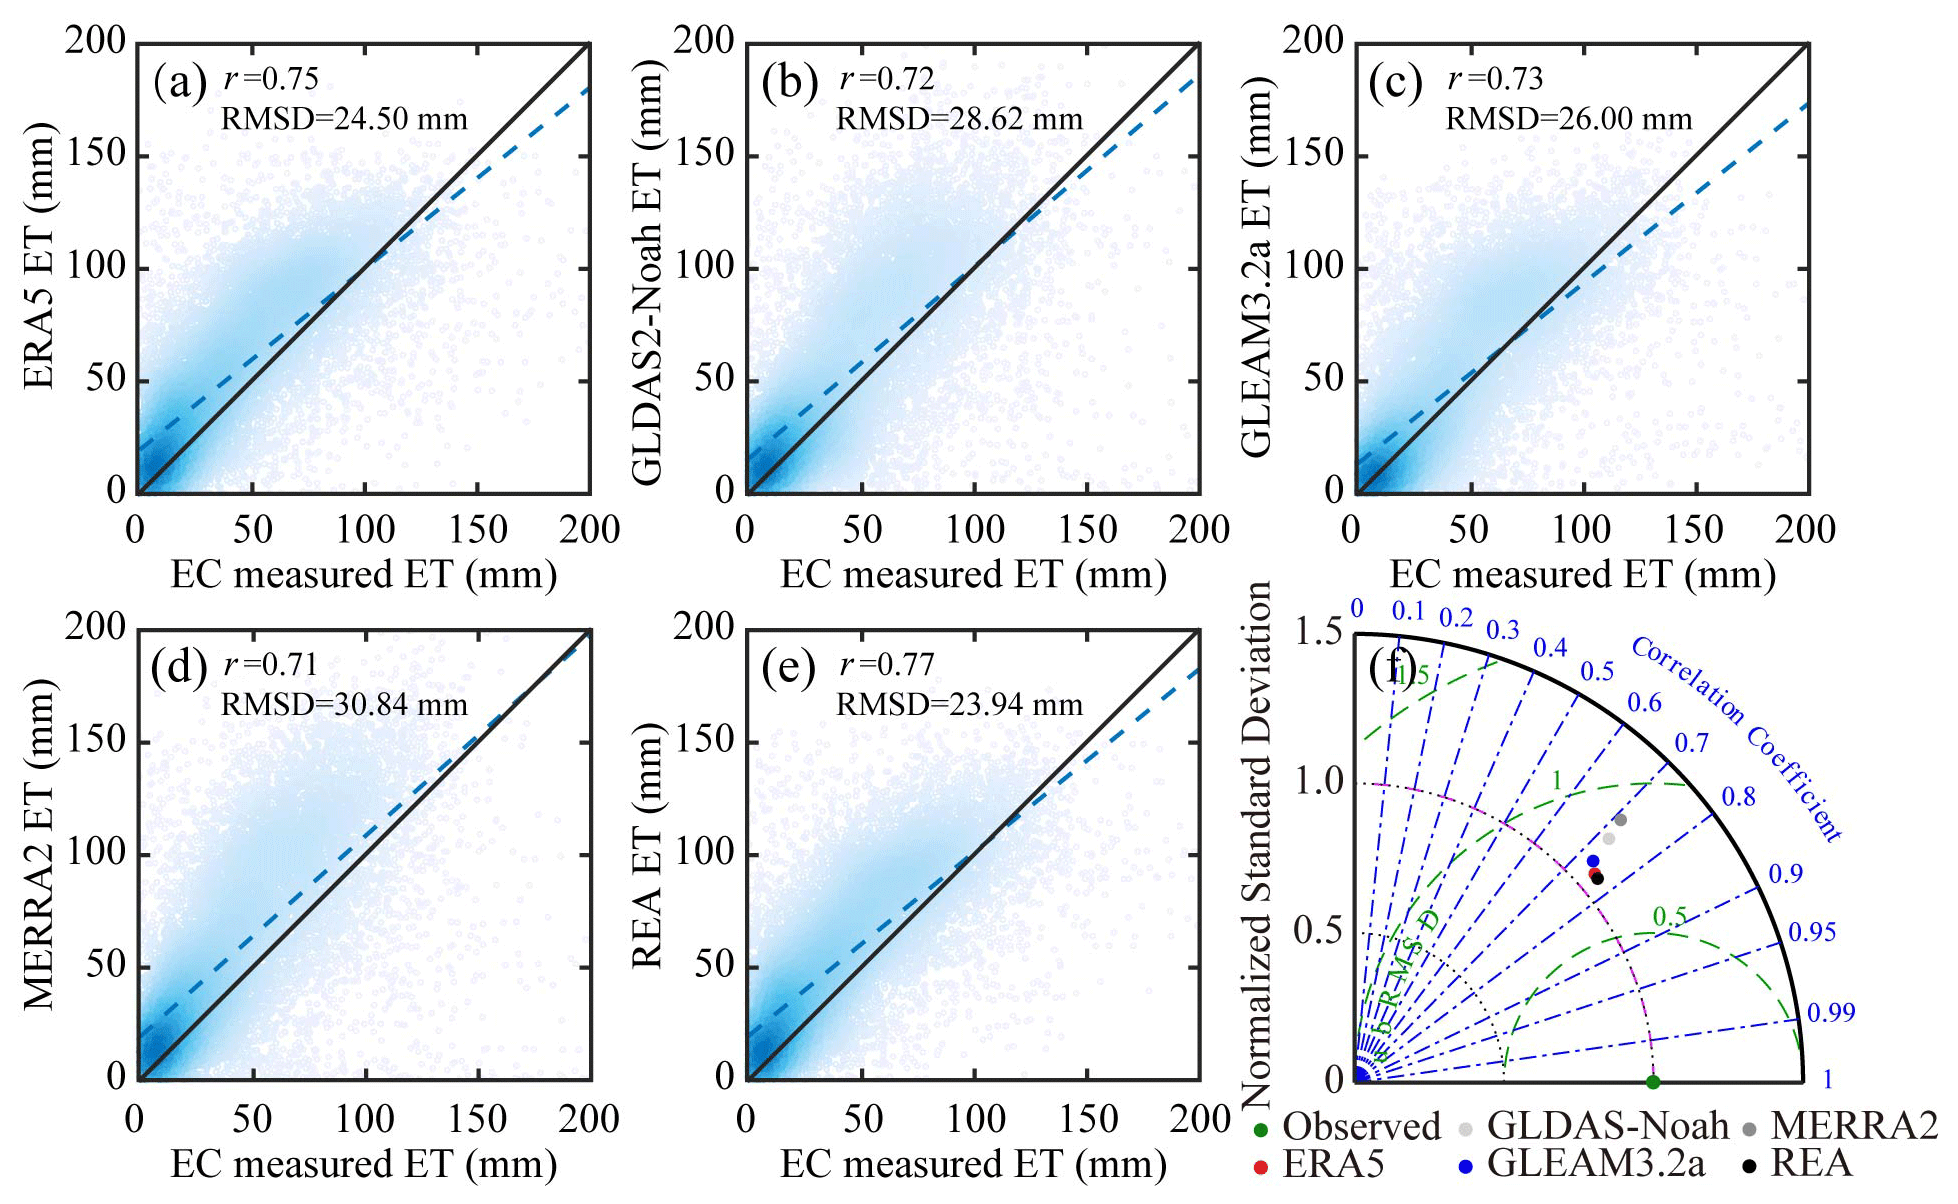
Figure 6(a–e) Scatterplots and (f) Taylor diagrams of monthly ground-measured ET and ET from different products. Linear fits are plotted in blue, and the 1:1 line is depicted. The correlation coefficients (r) have passed the 5 % significance test.
Table 2The verification results including r and RMSD between daily ground-measured ET and daily ET from different products in different ecosystems. Values in bold indicate the highest quality.
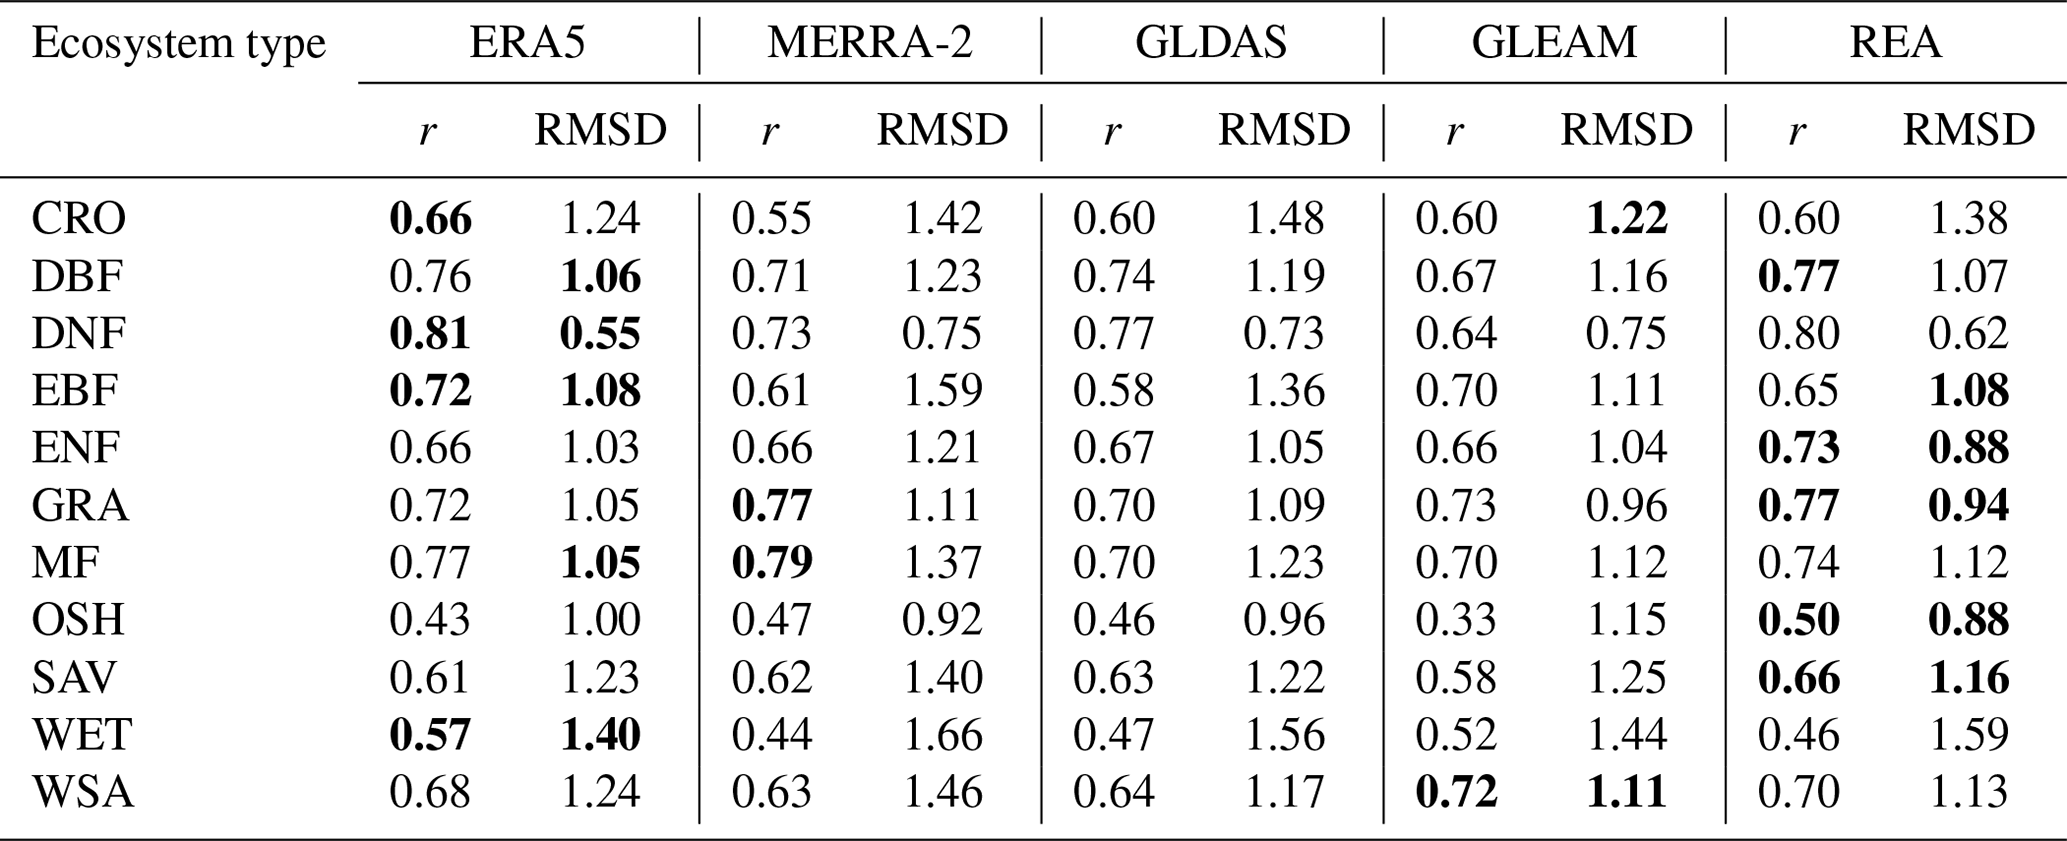
Verification of ET products from different ecosystems has been conducted in order to further evaluate their performances. Table 2 describes quantitatively the performances of the ET products in 11 ecosystem types of site on a daily scale from two indicators, r and RMSD. The values in bold print indicate the best performance of the four products. The results demonstrate that no individual product performs best across all ecosystems. For 42 ENF, 34 GRA, 9 OSH and 8 SAV sites, REA has a higher r and lower RMSD than individual products. For 23 DBF and 13 EBF sites, REA has an optimal r or RMSD, specifically with the highest r of 0.77 and second-lowest RMSD of 1.07 mm d−1 for DBF and the lowest RMSD of 1.08 mm d−1 and the second-highest of 0.65 for EBF. REA performs worse than at least one individual product at 63 other sites. Specifically, REA has an r of 0.60, lower than ERA5, and an RMSD of 1.38 mm d−1, higher than GLEAM and ERA5 at 17 CRO sites. For 1 DNF site, REA has an r of 0.80 and an RMSD of 0.62 mm d−1, lower and higher, respectively, than ERA5. For 9 MF sites, REA has an r of 0.74, lower than ERA5 and MERRA-2, and an RMSD of 1.12 mm d−1, higher than ERA5. For 19 WET sites, REA has an r of 0.46 and an RMSD of 1.59 mm d−1, lower and higher, respectively, than ERA5 and GLDAS. For 6 WSA sites, REA has an r of 0.70 and an RMSD of 1.13 mm d−1, lower and higher, respectively, than GLEAM. Generally, ERA5, MERRA-2, GLEAM and REA show the best performance in four (including CRO, DNF, EBF and WET), two (GRA and MF), one (WSA) and five (DBF, ENF, GRA, OSH and SAV) ecosystems, respectively, in terms of r. Based on RMSD, both ERA5 and REA performed the best in five ecosystems (with the former including DBF, DNF, EBF, MF and WET and the latter including EBF, ENF, GRA, OSH and SAV). REA does not perform the best across all ecosystems; however, it avoids the worst performance in any ecosystem. Taylor diagram results of daily ground-measured ET and ET from the different products in 11 ecosystems are in the Supplement (Fig. S2).
Table 3The verification results including r and RMSD between monthly ground-measured ET and monthly ET from different products in different ecosystems. Values in bold indicate the highest quality.
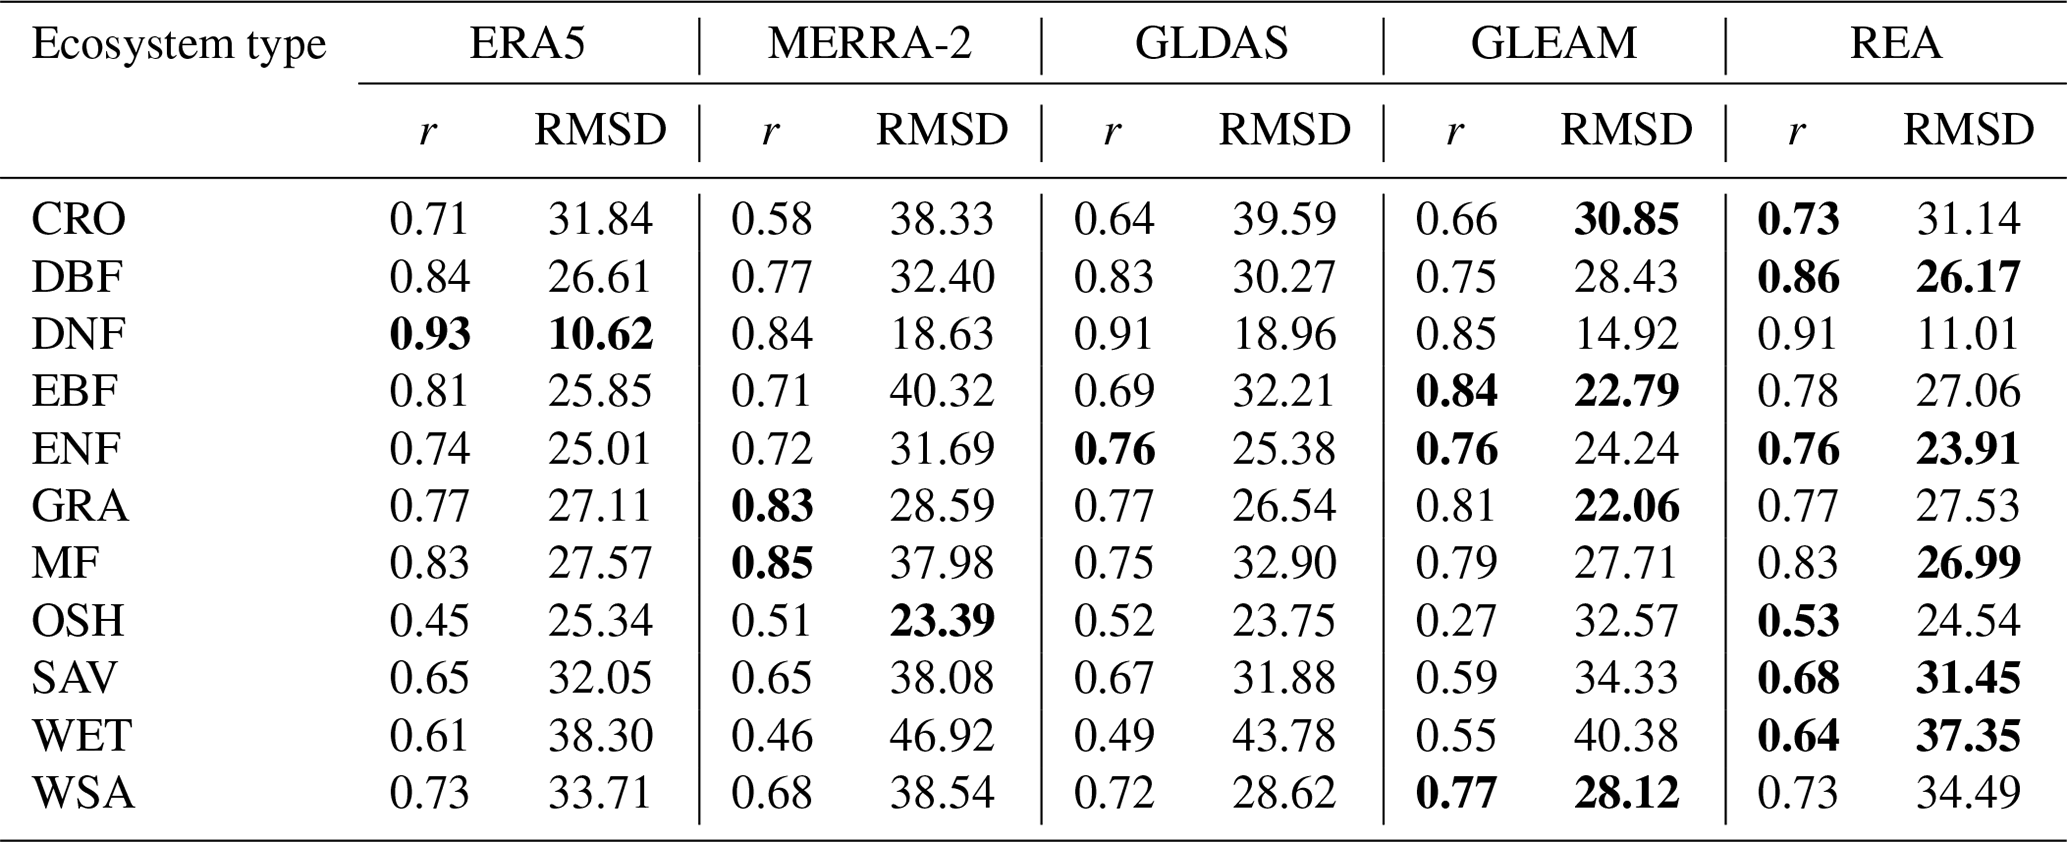
Similarly to Table 2, Table 3 shows the performance of ET products in different ecosystems on a monthly scale. Compared with the daily scale, the performance of each product has changed, among which all of the r values become higher. REA has a higher r and lower RMSD than individual products at 23 DBF, 42 ENF, 8 SAV and 19 WET sites. It has an optimal r or RMSD at 17 CRO, 9 MF and 9 OSH sites. At the other 64 sites, REA has a worse performance than at least one individual product. For 1 DNF site, REA has a lower r and higher RMSD than ERA5. For 13 EBF sites, REA has a lower r and higher RMSD than GLEAM and ERA5. For 34 GRA sites, ERA5 has an r of 0.77, lower than MERRA-2 and GLEAM, and an RMSD of 27.53 mm per month, higher than GLEAM, ERA5 and GLDAS. For 6 WSA sites, REA has an r of 0.73, lower than GLEAM, and an RMSD of 34.49 mm d−1, higher than GLEAM, GLDAS and ERA5. Similarly to the daily scale, REA does not have a better performance than any individual product in all ecosystems but is superior to at least one individual one. Similarly, the Taylor charts of monthly ground-measured ET and ET from the different products in 11 ecosystems are in the Supplement (Fig. S3).
Table 4The verification results including r and RMSD between daily ground-measured ET and daily ET from different products in different seasons. Values in bold indicate the highest quality.
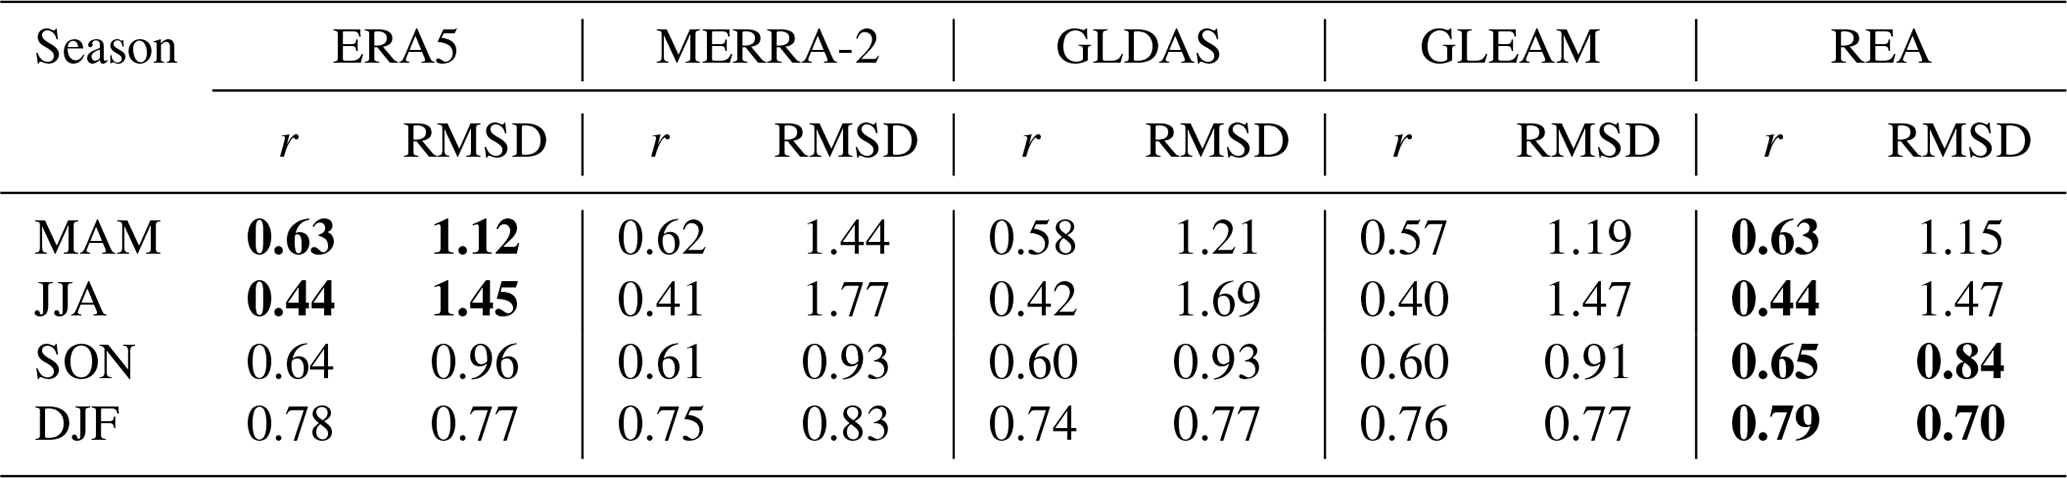
In addition to different ecosystems, seasonal validation has been carried out to try to find out how each ET product performs in different seasons. Table 4 shows the performance of five ET products in different seasons on a daily scale. In general, REA has a better performance than individual products in autumn and winter, while in spring and summer it has a worse performance than ERA5. The r of REA for all seasons varies from 0.44 to 0.79, which remains optimal. In spring and summer, its r is as high as ERA5, and its RMSD is second only to the best-performing ERA5. In addition, MERRA-2, GLDAS and GLEAM perform similarly. In terms of the whole year, the r of all products is higher in winter and lower in summer than in other seasons. Similarly, RMSD is the highest in summer and the lowest in winter, which is mainly caused by the large variation and absolute value of land ET in summer. The Taylor charts of daily ground-measured ET and ET from the different products in four seasons are in the Supplement (Fig. S4).
Table 5The verification results including r and RMSD between monthly ground-measured ET and monthly ET from different products in different seasons. Values in bold indicate the highest quality.
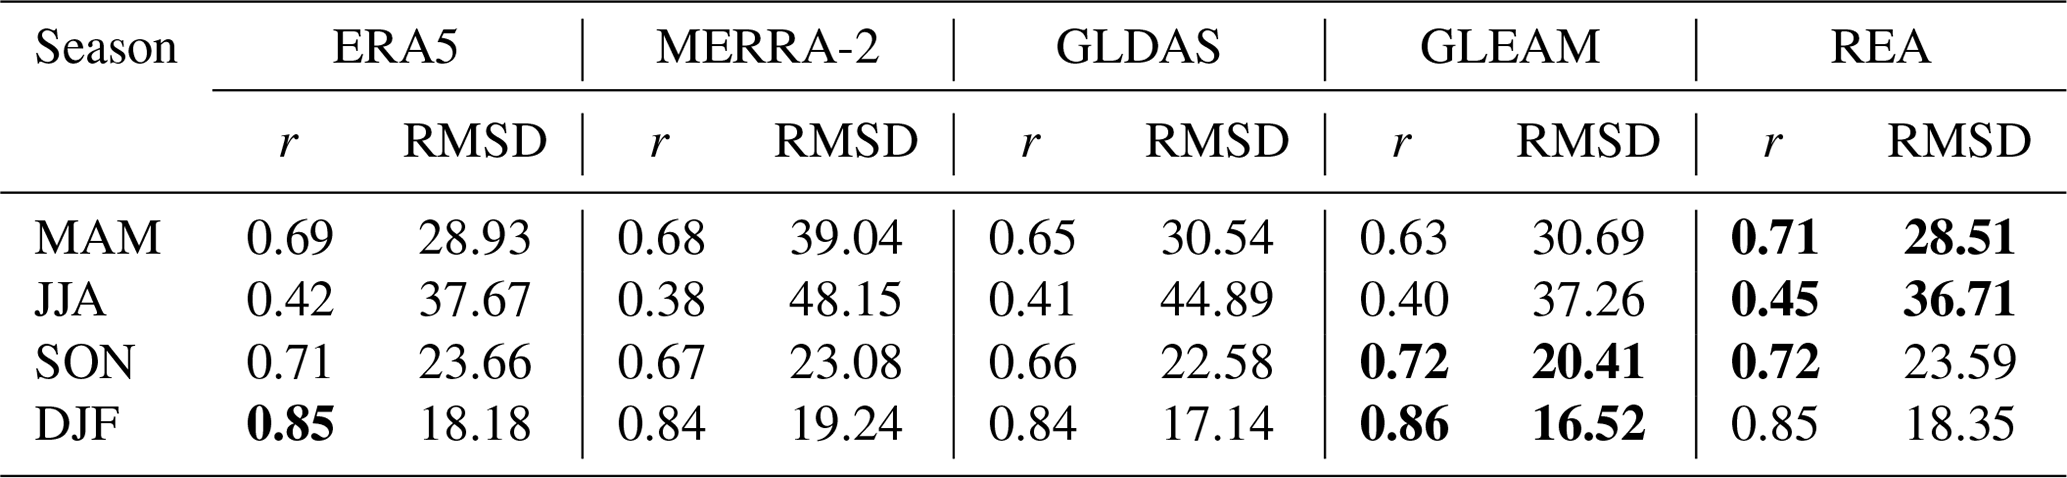
Compared with the daily scale, the performance of REA varies greatly in different seasons at the monthly scale (Table 5). In spring and summer, REA performs better than all individual products, while in autumn, REA has an r of 0.72, higher than individual products and an RMSD of 23.59 mm per month, slightly lower than ERA5. In winter, REA has an r of 0.85, higher than MERRA-2 and GLDAS and an RMSD of 18.35 mm d−1, lower than MERRA-2. Like the daily scale, the performance of all products is still better in winter and worse in summer. Although the performances of REA at the daily and monthly scales vary in each season, the r is always higher than those of individual products except in winter, indicating the high consistency of variation in REA with the observations. Also, the Taylor charts of monthly ground-measured ET and ET from the different products in four seasons are in the Supplement (Fig. S5). Tables 4 and 5 demonstrate that the errors, in both the REA and the other products, vary across different time points, suggesting a non-stationarity of the uncertainties.
Previous studies have shown that there is a close relationship between the quality of land evaporation and vegetation (Miralles et al., 2016). The correlation coefficients between multiple datasets and station-observed data under different vegetation conditions (0.3 to 0.9) are compared in order to understand how the quality of these datasets changes with vegetation. The results show that the quality of all datasets first increases and then decreases with the increase in vegetation density, with the highest quality captured when the normalized difference vegetation index (NDVI) is around 0.55. It is worth noting that all datasets are in a good quality range with a correlation of more than 0.6 when the NDVI is between 0.4 and 0.7. It is well known that vegetation index saturation poses potential issues. Generally speaking, the NDVI is likely to become saturated over a dense canopy for forested areas and becomes saturated rapidly for vegetation with a nearly closed canopy (Liu et al., 2011). Based on the analysis of hyperspectral data, it is found that there is an obvious saturation problem in the relationship between the leaf area index (LAI) and NDVI; that is, when the LAI exceeds 2, the NDVI asymptotically reaches the saturation level (Haboudane et al., 2004). When biomass reaches a certain level, the NDVI is not sensitive to changes in biomass (Huang et al., 2021). Dynamic vegetation is not used in these models, resulting in lower data quality with dense vegetation. Therefore, vegetation index saturation at a high NDVI results in a decrease in the quality of these datasets at high vegetation density. As shown in Fig. 7, the quality of each dataset is relatively low and shows a rapid decline with the increase in vegetation density when the NDVI is greater than 0.7, the case of optimal conditions for vegetation growth. In addition, a lot of remote sensing data have been used in GLEAM, such as satellite soil moisture, which are not of high quality when the vegetation density is high, affecting the quality of the final output. Further, errors in GLEAM will affect the merged product because GLEAM acts as the reference dataset. The merged product demonstrates the ability to capture land evaporation dynamics in a wide range of vegetation densities, which performs best in all datasets when the NDVI ranges from 0.34 to 0.75.

Figure 7Evaluation over different vegetation densities (NDVI) of the merged product based on the correlation coefficient with station-observed data.
There are unique advantages and limitations of the existing land ET datasets for specific land cover types; however, few are globally suitable for meteorology and hydrology. Specific land cover classifications are assigned for each model, leading to the use of land cover classification from different sources bringing about discrepancies in the estimation of land ET. In different climatic regions, the performances of land ET products vary from the model responses. Feng et al. (2018) analyzed correlation between land ET estimated based on the Budyko hypothesis and reanalysis ET products, with results showing that great problems existed in MERRA-2 when describing annual variation and the long-term trend of land ET in China, mainly due to the higher variance amplitude of MERRA-2 than that of other reanalysis products. Further, great uncertainty was captured in semiarid, semihumid and humid regions according to MERRA-2. However, Dembélé et al. (2020) found that MERRA-2 was still one of the best datasets in estimating land ET in the Volta River basin from 2003 to 2012 despite its low spatial resolution, which was probably due to the compensation of high temporal resolution for low spatial resolution. In contrast, ERA5 ET behaved poorly in the region. Baik et al. (2018) studied the uncertainty in four widely used ET products (GLDAS2, GLEAM, MOD16 and MERRA) on the dry continent of Australia during 2005–2014, finding a good consistency of GLDAS2 on arable land. GLEAM performed well in forest and savanna, while GLDAS2 showed the highest correlation in farmland, grassland and shrubland. However, GLDAS2 and GLEAM ET were found to be overestimated in most climatic regions and land cover classifications. The difference between model input variables can effectively explain the difference between estimated ET (Yao et al., 2017b). Specifically for Amazon tropical forests, MERRA-2 tended to overestimate daily net radiation and incident solar radiation, while GLDAS2 tended to overestimate daily radiation and underestimate incident solar radiation (Gomis-Cebolla et al., 2019).
Figure 8 depicts the spatial distribution of annual land evaporation, which seems to be relatively consistent in the five datasets. The regions with high land evaporation are found concentrated near the Equator, generally in very wet regions, including the Amazon Plain in the north of South America, the Congo Basin in central Africa and the border between Asia and Oceania, where the rainfall is usually over 1000 mm yr−1. Extremely low land evaporation is found to be concentrated in very dry desert and permafrost regions, including the Sahara and Arabian Desert in the north of Africa; the Taklimakan, Turkish, Iranian and Indian deserts in central Asia; and the permafrost regions in the north of North America and Eurasia, where the rainfall is under 200 mm yr−1. In comparison with REA, the measurements of MERRA-2 and GLDAS2–Noah are found to be significantly higher in the very wet regions near the Equator and basically the same in other regions, while GLEAM3.2a measurements are slightly lower in the very wet equatorial regions and significantly lower in the very dry regions of central Asia and the west of North America. The spatial distributions of ERA5 and REA are found to be the most consistent.
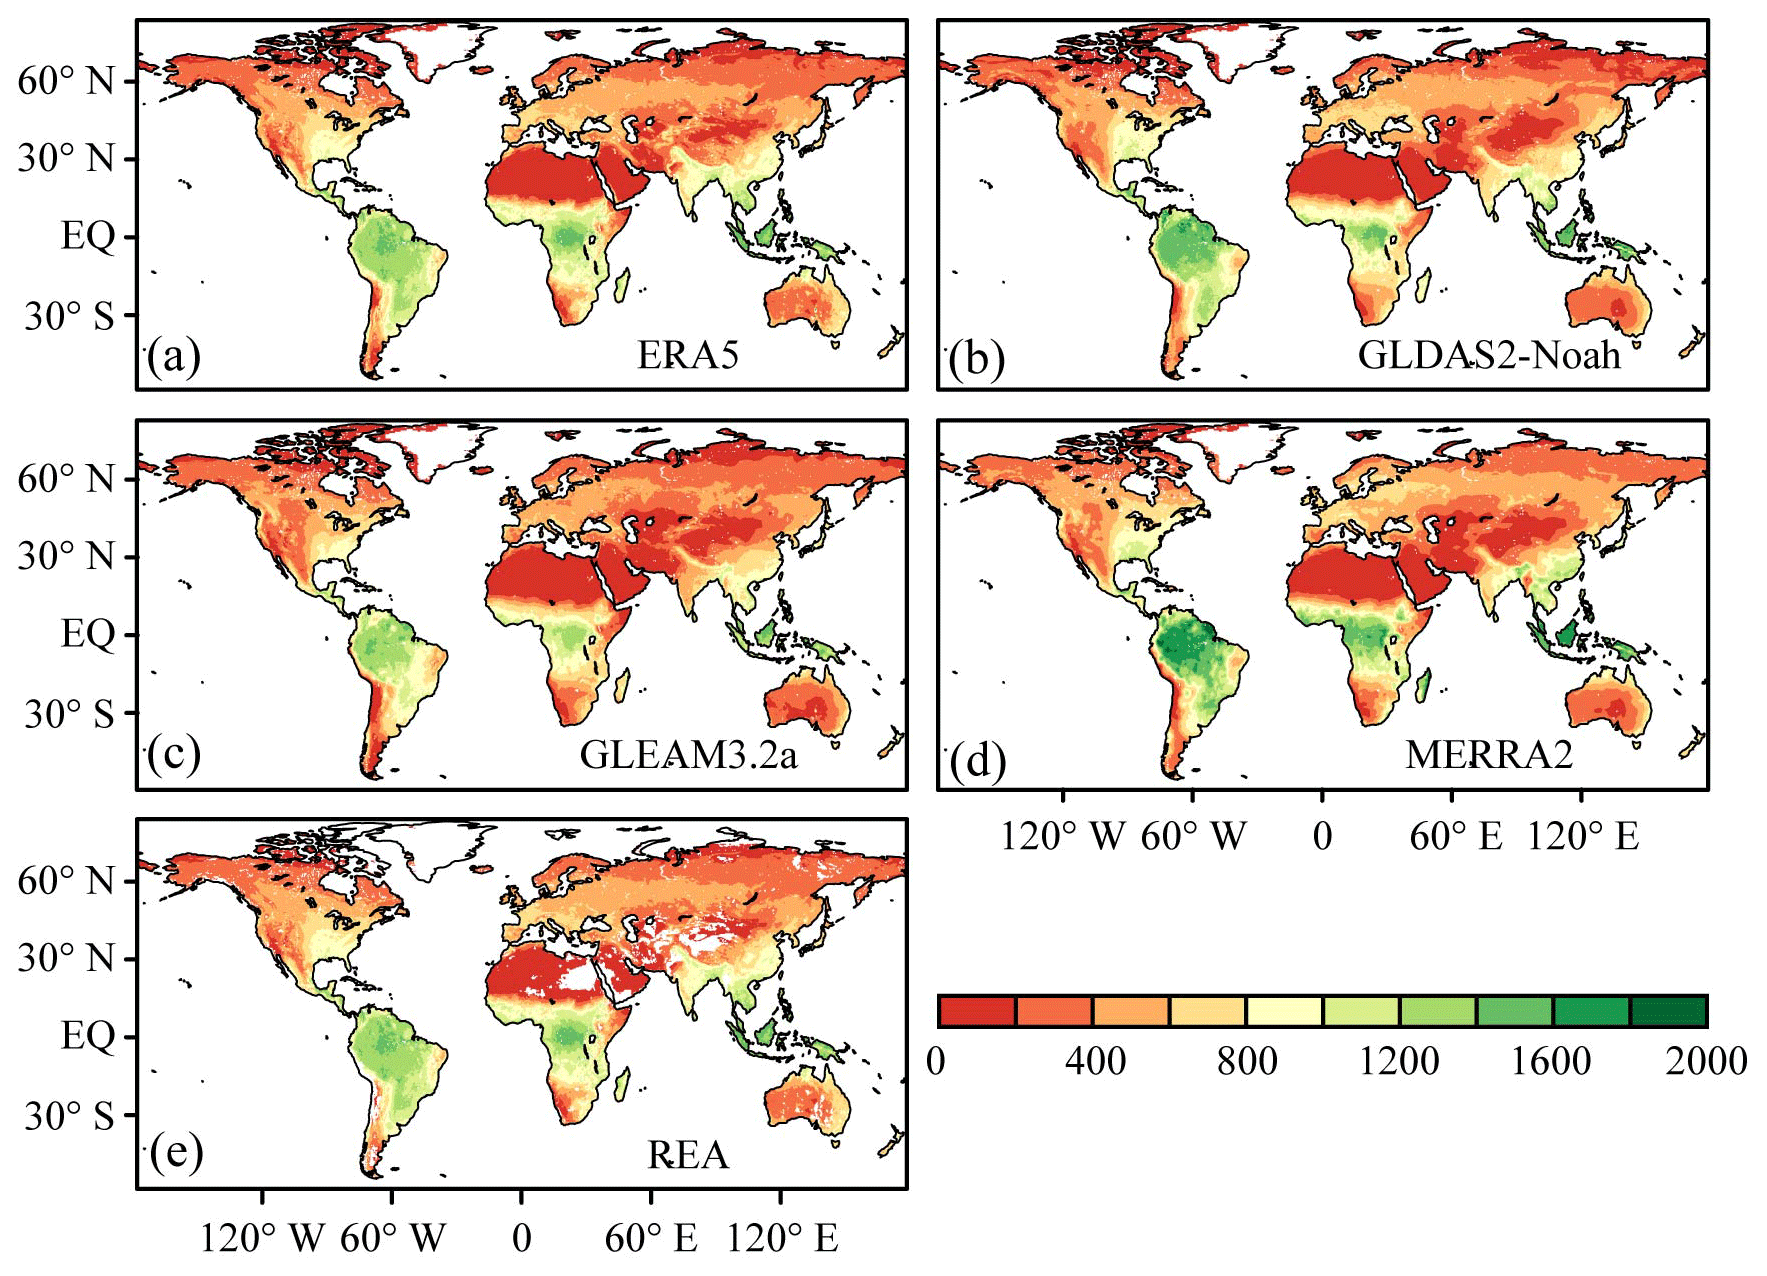
Figure 8Spatial distribution of annual mean land evaporation for the period 1980–2017 (unit: mm).
Figure 9 depicts the variation trends of multiple datasets during 1980–2017, where GLDAS2–Noah has not been calculated for comparison due to two datasets including GLDAS-Noah2.0 and GLDAS-Noah2.1 used throughout the period. Merged products shows that land evaporation significantly decreases in the Amazon Plain in South America and Congo Basin in central Africa, while it increases over almost all the rest of the world covering the east of North America, west of Europe, south of Asia and north of Oceania. The reduction trend in the Amazon is observed in all datasets, with MERRA-2 showing the most significant and intense one. The decreasing trend in the Congo Basin is detected in ERA5 and MERRA-2, while an opposite one is observed in GLEAM3.2a. Burnett et al. (2020) found the Congo Basin had become sunnier and less humid in recent years through the analysis of environmental data. In general, GLEAM ET is fairly close to land ET in tropical Africa (Schuttemeyer et al., 2007; Opoku-Duah et al., 2008; Andam-Akorful et al., 2015; Liu et al., 2016), while MERRA-2 ET has the maximum temporal variability over the Congo Basin (Burnett et al., 2020; Crowhurst et al., 2020). The increase in the east of North America, west of Europe and south of Asia is detectable in all datasets. The increasing trend in the north of Oceania is also detected in GLEAM3.2a and MERRA-2 but not in ERA5.
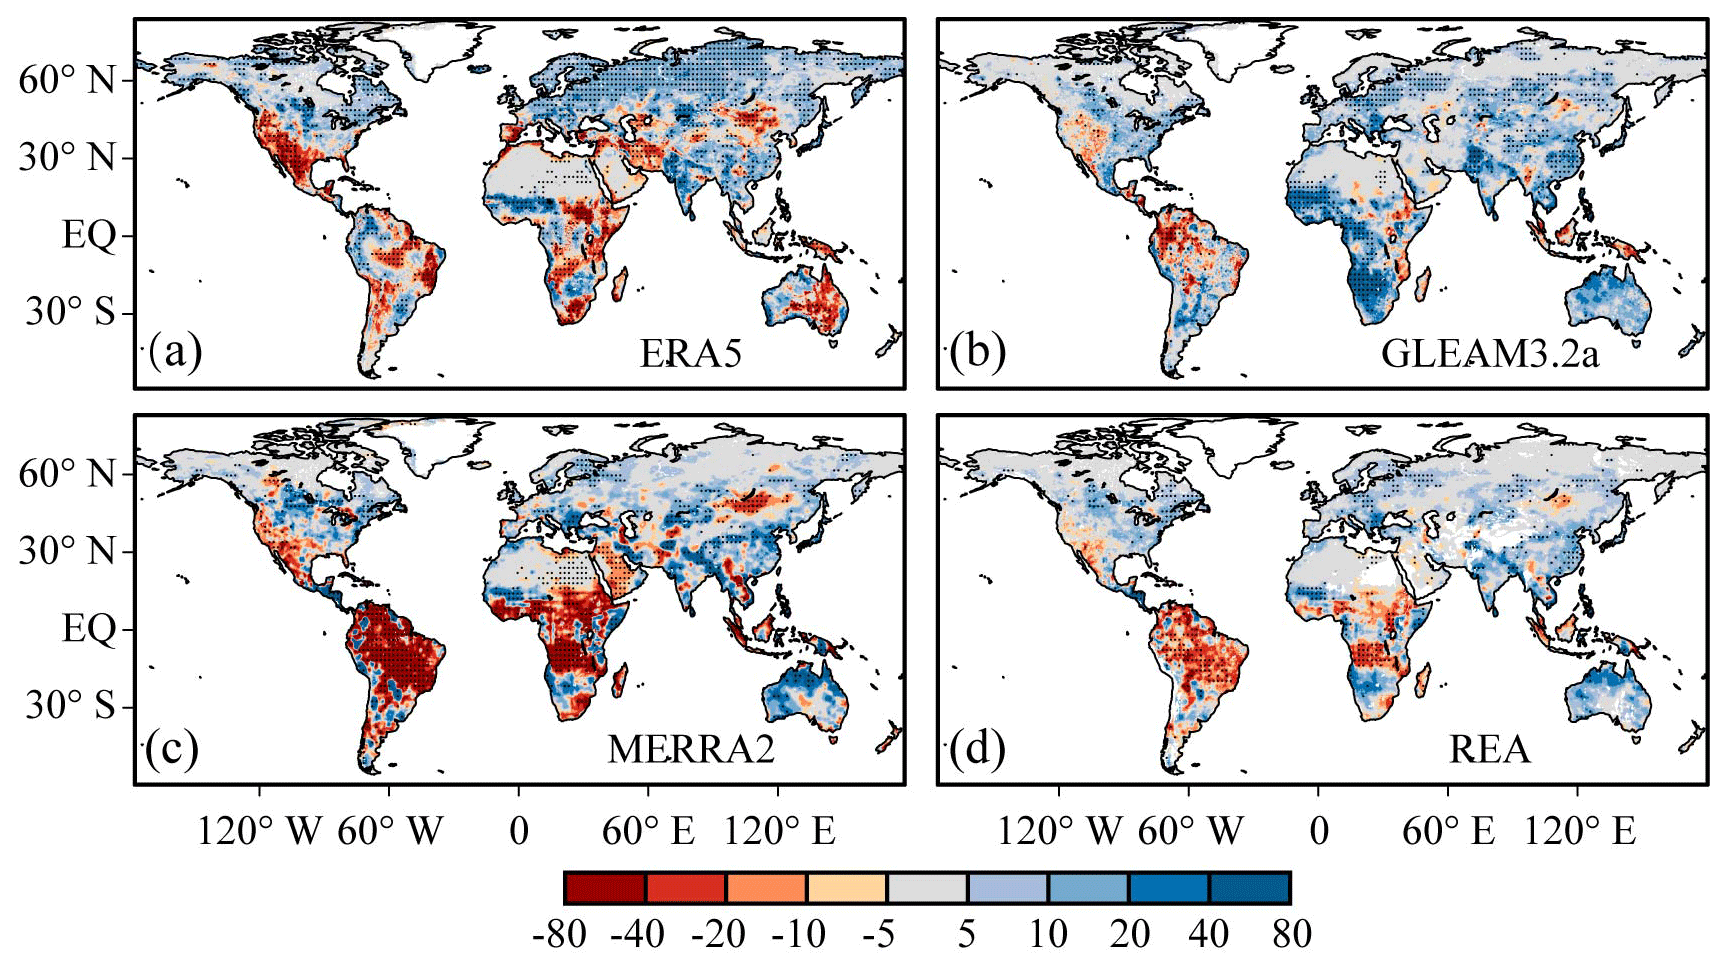
Figure 9Spatial distribution of linear trends of land evaporation for the period 1980–2017 (unit: mm per decade). Stippling indicates statistically significant regions at a 95 % confidence level of the Mann–Kendall test.
Varying degrees of uncertainties exist in models based on satellites according to their theories, structural assumptions and parameterization of the inputs. These limitations are mainly affected by changes in landscape, climatic and hydrological conditions (Xu et al., 2015). Changes in environmental conditions and extensive vegetation types in regional and global ET estimation can lead to great uncertainties in ET products (Yilmaz et al., 2012; Liaqat and Choi, 2015; Liaqat et al., 2015; Khan et al., 2018). Apart from a few ET products, at present, validation and analysis have rarely been adopted to reduce uncertainties. Some research has made some attempts to reduce the uncertainties in hydrological applications (Zhu et al., 2016); so far no such performance has been achieved. An emerging new technology, the REA method, has the ability to combine different ET products (GLDAS, GLEAM, ERA5 and MERRA-2), is becoming increasingly successful in resolving the issue of hydrological uncertainties and holds greater significance for in-depth assessment.
The uncertainties during the merging of ET products are driven by various factors including input errors, the scaling effect and the merging algorithm. Input errors are derived from single ET product and EC ground measurements. EC ground measurement determines the accuracy of the merged ET products, as it is considered to be the “true” value used to calibrate individual product, which persists in giving an error of about 5 %–20 %. It is usually found to be relatively accurate for ET acquisition (Foken et al., 2006). The uncertainties from scaling effects are caused by the mismatch between the spatial resolution of the model and the tower footprint. The uncertainties in merging algorithms are caused by differential calculations of the weight of each product. In addition, there are other factors that lead to uncertainties. For example, uncertainties in remote sensing and meteorological data may affect the calculation of modeled ET. With regard to the model estimation, some common modeling assumptions such as estimation of potential evaporation and shared inputs such as surface radiation make ET estimates from models quite dependent, making the predicted errors correlated (Jiménez et al., 2018).
In general, reasonable information about hydrological variables on a global scale can be extracted from satellite- and reanalysis-based datasets, which is useful in regions lacking sufficient observations (Kim et al., 2018). For the discrepancy of the performances of reanalysis and satellite data under different mechanisms, the merging method can be used to verify the complementary strategy well to reflect the strengths of both. However, the complex structure of these merging methods affects the efficiency of calculating the weight and limits their wider application. In contrast, the simplicity, computational efficiencies and reliable accuracy of the REA method make it more preponderant when considering multi-source datasets (Giorgi and Mearns, 2002). On the basis of previous studies, this study focuses on the global performance of land ET merged products. To reduce the complexity, we introduced the REA method to improve land ET estimation and merged three reanalysis datasets produced by separate algorithms. This method considers not only the performance of individual models but also the convergence of models involved in the merging process. Compared with individual products, an REA-merged ET product is found to outperform them with significantly reduced root mean square deviation (RMSD is 0.05–0.27 mm d−1 on average).
Compared with the widely used merging methods for land ET, REA has certain advantages. Specifically, the simple averaging (SA) method is the simplest among all the methods and depends on the assumption that the uncertainties are the same for each dataset (Ershadi et al., 2014). However, this assumption lacks rationality in terms of the differences between datasets. The REA method gives corresponding weights according to the uncertainty in each dataset, making up for this lack. Empirical orthogonal function (EOF)-based methods introduce biases due to little to no distinction between good and bad pixels in the reconstruction scheme (Feng et al., 2016). In addition, the complexity of the EOF method affects the calculation efficiency of the weights, resulting in high calculation cost. The REA method easily obtains the indicators used in the calculation of the weights, which greatly improves the calculation efficiency. Furthermore, there is a higher efficiency of the REA method than the commonly used machine-learning support vector machine (SVM) algorithms when the sample size is large (Yao et al., 2017a). The simple Taylor skill score (STS) method is highly dependent on the accuracy of the individual data, with a high demand on the quality of individual datasets (Yao et al., 2017b). The REA method depends on not only the performance but also the convergence of the model, making it less sensitive to the performance of individual datasets. Since terrestrial ET is a complex variable coupled with energy, hydrology and the carbon budget, it is difficult to accurately determine the optimal condition density function when using the Bayesian model averaging (BMA) method (Yao et al., 2014; Zhu et al., 2016), whereas the two indicators adopted by the REA method, including the reliability and convergence of the model, are easy to obtain by the deviation between the simulated ET and the reference and the distance between the simulated ET and the ensemble average, respectively. Therefore, the REA method possesses certain reliability and high efficiency in terms of merging land ET.
However, the REA method only takes into consideration the combination of and relationship between each product and the reference dataset. Although the improvement in the correlation coefficient is statistically significant, datasets both participating in the merging process and used as the reference have not been improved substantially. Therefore, the performance of the REA method is highly dependent on the weight of individual dataset, which is calibrated with the reference data. Consequently, the results also demonstrate that REA is more sensitive to higher qualities in GLEAM. As a result, where GLEAM has lower qualities, REA tends to have higher qualities. Meanwhile, they both have very similar qualities, or even higher ones in REA, at regions where GLEAM has higher correlations with and lower differences from the in situ datasets (Fig S6). Thus REA is more sensitive to the reference data where they are more reliable. Future research needs to determine the physical mechanism of the inherent error in each product and strengthen the global quantification of ET products by combining the surface residual energy balance and water balance method without using any reference dataset (Yao et al., 2017b; Baik et al., 2018).
All data used in this study are freely available with the links given in Sect. 2. A convenience copy of the merged global land evaporation product available at the time this paper was created has been registered with Zenodo and is available at https://doi.org/10.5281/zenodo.4595941 (Lu et al., 2021). Both daily and monthly datasets are provided.
In conclusion, we used the CV as an indicator to select the merging regions with high data consistency, and the regions with low consistency were excluded from the merging scope, including the north of North America, west of South America, and desert regions of mid-latitude Africa and Asia. We merged three land ET datasets, ERA5, GLDAS and MERRA-2, using the REA method to generate a set of long-sequence global daily ET data with a spatial resolution of 0.25∘ and a time span of 38 years. The quality of the merged product is found to be significantly improved when compared with the three individual datasets selected for merging. Averaged global validations based on the correlation coefficient and RMSD suggest that the merged product relatively has the best skill to capture ET dynamics over different locations and times among all datasets. Nonetheless, the results also indicate that no one product performs best across all ecosystems and timescales. Under different vegetation conditions when the NDVI ranges from 0.34 to 0.75, the merged product can capture land evaporation dynamics most accurately.
The spatial distribution of the merged product was found to be highly consistent with the other four datasets, indicating that the product successfully captures the spatial difference in land ET effectively. In terms of variation trends of global land ET, conclusions differ among numerous studies due to uncertainties in the data used, and no agreement could be reached. Our merged product shows that there is a significant decreasing trend in the Amazon Plain in South America and Congo Basin in central Africa and an increasing trend in the east of North America, west of Europe, south of Asia and north of Oceania. This is the first time we have used the REA method more precisely in land ET data merging by avoiding the errors likely to be generated by physical mechanisms.
Based on model weighting, the method of combining information into a new dataset reflects the uncertainty behind climate change predictions, which should be explored in depth. A simple and flexible framework is provided for exploration according to the REA method. As we expected, the error was non-stationary. The weight of each day can be estimated by running a time window centered on the day for making the weight change over time. Shorter time windows produce more dynamic weights; nonetheless, the values may be noisier due to fewer samples available to estimate variability in the time series. Under the framework, cross-variable merging can be realized; that is, multiple related variables can be included for weight calculation (Xu et al., 2010). In future studies, the quality of merged products could be improved by adopting an appropriate time window to calculate the dynamic weight and considering more relevant variables to further reduce the uncertainty in the merged product.
The supplement related to this article is available online at: https://doi.org/10.5194/essd-13-5879-2021-supplement.
JL conducted the research, completed the original draft and revised it. TC, SL and DFTH contributed to data processing. GK, JP, TJ and BS revised the draft. GW, the corresponding author, contributed to conceptual designing, reviewing of the manuscript, funding acquisition and project administration. All co-authors reviewed the manuscript and contributed to the writing process.
The contact author has declared that neither they nor their co-authors have any competing interests.
Publisher's note: Copernicus Publications remains neutral with regard to jurisdictional claims in published maps and institutional affiliations.
This study is supported by the National Key Research and Development Program of China (2017YFA0603701), the National Natural Science Foundation of China (41875094) and the Postgraduate Research and Practice Innovation Program of Jiangsu Province (KYCX21_0957). Giri Kattel would like to acknowledge a Longshan professorship and Talent grant (1511582101011) from the Nanjing University of Information Science & Technology (NUIST). We thank all contributors and also our external cooperation partners for their support and work. We thank Alexander Gruber, Brianna Pagán, and the anonymous reviewer for their constructive and helpful comments which improved this paper substantially.
This research has been supported by the Ministry of Science and Technology of the People's Republic of China Key Technologies Research and Development Program (grant no. 2017YFA0603701), the National Natural Science Foundation of China (grant no. 41875094), the Postgraduate Research and Practice Innovation Program of Jiangsu Province (grant no. KYCX21_0957), and the Nanjing University of Information Science & Technology (NUIST (Longshan professorship and Talent grant no. 1511582101011)).
This paper was edited by Alexander Gruber and reviewed by Brianna Pagán and one anonymous referee.
Aires, F.: Combining Datasets of Satellite-Retrieved Products. Part I: Methodology and Water Budget Closure, J. Hydrometeorol., 15, 1677–1691, https://doi.org/10.1175/JHM-D-13-0148.1, 2014.
Albergel, C., Dutra, E., Munier, S., Calvet, J.-C., Munoz-Sabater, J., de Rosnay, P., and Balsamo, G.: ERA-5 and ERA-Interim driven ISBA land surface model simulations: which one performs better? Hydrol. Earth Syst. Sc., 22, 3515–3532, https://doi.org/10.5194/hess-22-3515-2018, 2018.
Andam-Akorful, S. A., Ferreira, V. G., Awange, J. L., Forootan, E., and He, X. F.: Multi-model and multi-sensor estimations of evapotranspiration over the Volta Basin, West Africa, Int. J. Climatol., 35, 3132–3145, https://doi.org/10.1002/joc.4198, 2015.
Baik, J., Park, J., Ryu, D., and Choi, M.: Geospatial blending to improve spatial mapping of precipitation with high spatial resolution by merging satellite-based and ground-based data, Hydrol. Process., 30, 2789–2803, https://doi.org/10.1002/hyp.10786, 2016.
Baik, J., Liaqat, U. W., and Choi, M.: Assessment of satellite- and reanalysis-based evapotranspiration products with two blending approaches over the complex landscapes and climates of Australia, Agr. Forest Meteorol., 263, 388–398, https://doi.org/10.1016/j.agrformet.2018.09.007, 2018.
Beck, H. E., van Dijk, A. I. J. M., Levizzani, V., Schellekens, J., Miralles, D. G., Martens, B., and de Roo, A.: MSWEP: 3-hourly 0.25∘ global gridded precipitation (1979–2015) by merging gauge, satellite, and reanalysis data, Hydrol. Earth Syst. Sci., 21, 589–615, https://doi.org/10.5194/hess-21-589-2017, 2017.
Bosilovich, M. G., Akella, S., Coy, L., Cullather, R., Draper, C., Gelaro, R., Kovach, R., Liu, Q., Molod, A., Norris, P., Wargan, K., Chao, W., Reichle, R., Takacs, L., Vikhliaev, Y., Bloom, S., Collow, A., Firth, S., Labow, G., Partyka, G., Pawson, S., Reale, O., Schubert, S. D., and Suarez, M.: MERRA-2: Initial evaluation of the climate, Technical Report Series on Global Modeling and Data Assimilation, NASA/TM-2015-104606/Vol.43, 1–153, 2015.
Bosilovich, M. G., Robertson, F., Takacs, L., Molod, A., and Mocko, D.: Atmospheric water balance and variability in the MERRA-2 reanalysis, J. Climate, 30, 1177–1196, https://doi.org/10.1175/JCLI-D-16-0338.1, 2017.
Burnett, M. W., Quetin, G. R., and Konings, A. G.: Data-driven estimates of evapotranspiration and its controls in the Congo Basin, Hydrol. Earth Syst. Sci., 24, 4189–4211, https://doi.org/10.5194/hess-24-4189-2020, 2020.
Cheema, M. J. M. and Bastiaanssen, W. G. M.: Local calibration of remotely sensed rainfall from the TRMM satellite for different periods and spatial scales in the Indus Basin, Int. J. Remote Sens., 33, 2603–2627, https://doi.org/10.1080/01431161.2011.617397, 2012.
Crowhurst, D., Dadson, S., Peng, J., and Washington, R.: Contrasting controls on Congo Basin evaporation at the two rainfall peaks, Clim. Dynam., 56, 1609–1624, https://doi.org/10.1007/s00382-020-05547-1, 2020.
Dembélé, M., Ceperley, N., Zwart, S. J., Salvadore, E., Mariethoz, G., and Schaefl, B.: Potential of satellite and reanalysis evaporation datasets for hydrological modelling under various model calibration strategies, Adv. Water Resour., 143, 103667, https://doi.org/10.1016/j.advwatres.2020.103667, 2020.
Duan, Z. and Bastiaanssen, W. G. M.: First results from Version 7 TRMM 3B43 precipitation product in combination with a new downscaling-calibration procedure, Remote Sens. Environ., 131, 1–13, https://doi.org/10.1016/j.rse.2012.12.002, 2013.
Ershadi, A., McCabe, M. F., Evans, J. P., Chaney, N. W., and Wood, E. F.: Multi-site evaluation of terrestrial evaporation models using FLUXNET data, Agr. Forest Meteorol., 187, 46–61, https://doi.org/10.1016/j.agrformet.2013.11.008, 2014.
Feng, F., Li, X., Yao, Y., Liang, S., Chen, J., Zhao, X., Jia, K., Pinter, K., and McCaughey, J. H.: An empirical orthogonal function-based algorithm for estimating terrestrial latent heat flux from eddy covariance, meteorological and satellite observations, PloS ONE, 11, e0160150, https://doi.org/10.1371/journal.pone.0160150, 2016.
Feng, T., Su, T., Ji, F., Zhi, R., and Han, Z.: Temporal characteristics of actual evapotranspiration over China under global warming, J. Geophys. Res.-Atmos., 123, 5845–5858, https://doi.org/10.1029/2017JD028227, 2018.
Foken, T., Wimmer, F., Mauder, M., Thomas, C., and Liebethal, C.: Some aspects of the energy balance closure problem, Atmos. Chem. Phys., 6, 4395–4402, https://doi.org/10.5194/acp-6-4395-2006, 2006.
Gelaro, R., McCarty, W., Suárez, M. J., Todling, R., Molod, A., Takacs, L., Randles, C. A., Darmenov, A., Bosilovich, M. G., Reichle, R., Wargan, K., Coy, L., Cullather, R., Draper, C., Akella, S., Buchard, V., Conaty, A., da Silva, A. M., Gu, W., and Kim, G.-K.: The modern-era retrospective analysis for research and applications, version 2 (MERRA-2), J. Climate., 30, 5419–5454, https://doi.org/10.1175/JCLI-D-16-0758.1, 2017.
Giorgi, F. and Mearns, L. O.: Calculation of average, uncertainty range, and reliability of regional climate changes from AOGCM simulations via the “reliability ensemble averaging” (REA) method, J. Climate, 15,1141–1158, https://doi.org/10.1175/1520-0442(2002)015<1141:COAURA>2.0.CO;2, 2002.
Gomis-Cebollaa, J., Jimeneza, J. C., Sobrinoa, J. A., Corbarib, C., and Mancini, M.: Intercomparison of remote-sensing based evapotranspiration algorithms over amazonian forests, Int. J. Appl. Earth Obs., 80, 280–294, https://doi.org/10.1016/j.jag.2019.04.009, 2019.
Goya, M. R. and Harmsen, E. W.: Evapotranspiration principles and applications for water management, Apple Academic Press, New York, 628 pp., https://doi.org/10.1201/b15779, 2013.
Haboudane, D., Miller, J. R., Pattey, E., Zarco-Tejada, P. J., and Strachan, I. B.: Hyperspectral vegetation indices and novel algorithms for predicting green LAI of crop canopies: Modeling and validation in the context of precision agriculture, Remote Sens. Environ., 90, 337–352, https://doi.org/10.1016/j.rse.2003.12.013, 2004.
Hersbach, H., Bell, B., Berrisford, P., Hirahara, S., Horányi, A., Muñoz-Sabater, J., Nicolas, J., Peubey, C., Radu, R., Schepers, D., Simmons, A., Soci, C., Abdalla, S., Abellan, X., Balsamo, G., Bechtold, P., Biavati, G., Bidlot, J., Bonavita, M., Chiara, G., Dahlgren, P., Dee, D., Diamantakis, M., Dragani, R., Flemming, J., Forbes, R., Fuentes, M., Geer, A., Haimberger, L., Healy, S., Hogan, J. R., Hólm, E., Janisková, M., Keeley, S., Laloyaux, P., Lopez, P., Lupu, C., Radnoti, G., Rosnay, de P., Rozum, I., Vamborg, F., Villaume, S., and Thépaut, J.-N.: The ERA5 global reanalysis, Q. J. Roy. Meteor. Soc., 146, 1999–2049, https://doi.org/10.1002/qj.3803, 2020.
Hirschi, M., Seneviratne, S. I., Alexandrov, V., Boberg, F., Boroneant, C., Christensen, O. B., Formayer, H., Orlowsky, B., and Stepanek, P.: Observational evidence for soil-moisture impact on hot extremes in southeastern Europe, Nat. Geosci., 4, 17–21, https://doi.org/10.1038/NGEO1032, 2011.
Hobeichi, S., Abramowitz, G., Evans, J., and Ukkola, A.: Derived Optimal Linear Combination Evapotranspiration (DOLCE): a global gridded synthesis ET estimate, Hydrol. Earth Syst. Sci., 22, 1317–1336, https://doi.org/10.5194/hess-22-1317-2018, 2018.
Huang, S., Tang, L., Hupy, J. P., Wang, Y., and Shao, G.: A commentary review on the use of normalized difference vegetation index (NDVI) in the era of popular remote sensing, J. Forestry Res., 32, 1–6, https://doi.org/10.1007/s11676-020-01155-1, 2021.
Jiménez, C., Prigent, C., Mueller, B., Seneviratne, S. I., McCabe, M. F., Wood, E. F., Rossow, W. B., Balsamo, G., Betts, A. K., Dirmeyer, P. A., Fisher, J. B., Jung, M., Kanamitsu, M., Reichle, R. H., Reichstein, M., Rodell, M., Sheffield, J., Tu, K., and Wang, K.: Global intercomparison of 12 land surface heat flux estimates, J. Geophys. Res., 116, D02102, https://doi.org/10.1029/2010JD014545, 2011.
Jiménez, C., Martens, B., Miralles, D. M., Fisher, J. B., Beck, H. E., and Fernández-Prieto, D.: Exploring the merging of the global land evaporation WACMOS-ET products based on local tower measurements, Hydrol. Earth Syst. Sci., 22, 4513–4533, https://doi.org/10.5194/hess-22-4513-2018, 2018.
Joiner, J., Yoshida, Y., Vasilkov, A. P., Schaefer, K., Jung, M., Guanter, L., Zhang, Y., Garrity, S., Middleton, E. M., Huemmrich, K. F., Gu, L., and Marchesini, L. B.: The seasonal cycle of satellite chlorophyll fluorescence observations and its relationship to vegetation phenology and ecosystem atmosphere carbon exchange, Remote Sens. Environ., 152, 375–391, https://doi.org/10.1016/j.rse.2014.06.022, 2014.
Jung, M., Reichstein, M., Ciais, P., Seneviratne, S. I., Sheffield, J., Goulden, M. L., Bonan, G., Cescatti, A., Chen, J. Q., de Jeu, R., Dolman, A. J., Eugster, W., Gerten, D., Gianelle, D., Gobron, N., Heinke, J., Kimball, J., Law, B. E., Montagnani, L., Mu, Q. Z., Mueller, B., Oleson, K., Papale, D., Richardson, A. D., Roupsard, O., Running, S., Tomelleri, E., Viovy, N., Weber, U., Williams, C., Wood, E., Zaehle, S., and Zhang, K.: Recent decline in the global land evapotranspiration trend due to limited moisture supply, Nature, 467, 951–954, https://doi.org/10.1038/nature09396, 2010.
Khan, M. S., Waqas, U., Baik, J., and Choi, M.: Stand-alone uncertainty characterization of GLEAM, GLDAS and MOD16 evapotranspiration products using an extended triple collocation approach, Agr. Forest Meteorol., 252, 256–268, https://doi.org/10.1016/j.agrformet.2018.01.022, 2018.
Kim, H., Parinussa, R., Konings, A. G., Wagner, W., Cosh, M. H., Lakshmi, V., Zohaib, M., and Choi, M.: Global-scale assessment and combination of SMAP with ASCAT (active) and AMSR2 (passive) soil moisture products, Remote Sens. Environ., 204, 260–275, https://doi.org/10.1016/j.rse.2017.10.026, 2018.
Kim, S., Parinussa, R. M., Liu, Y. Y., Johnson, F. M., and Sharma, A.: A framework for combining multiple soil moisture retrievals based on maximizing temporal correlation, Geophys. Res. Lett., 42, 6662–6670, https://doi.org/10.1002/2015GL064981, 2015.
Koster, R. D., Suárez, M. J., Ducharne, A., Stieglitz, M., and Kumar P.: A catchment-based approach to modeling land surface processes in a general circulation model: 1. Model structure, J. Geophys. Res., 105, 24809–24822, https://doi.org/10.1029/2000JD900327, 2000.
Liaqat, U. W. and Choi, M.: Surface energy fluxes in the Northeast Asia ecosystem: SEBS and METRIC models using Landsat satellite images. Agr. Forest Meteorol., 214–215, 60–79, https://doi.org/10.1016/j.agrformet.2015.08.245, 2015.
Liaqat, U. W., Choi, M., and Awan, U. K.: Spatio-temporal distribution of actual evapotranspiration in the Indus Basin Irrigation System, Hydrol. Process., 29, 2613–2627, https://doi.org/10.1002/hyp.10401, 2015.
Liu, C., Shu, S., and Gao, W.: Improved sensible and latent heat flux estimation of community land model by using ensemble Kalman filter assimilation, Proc. SPIE, 8869, 886917, https://doi.org/10.1117/12.2021713, 2013.
Liu, W., Wang, L., Zhou, J., Li, Y., Sun, F., Fu, G., Li, X., and Sang, Y. F.: A worldwide evaluation of basin-scale evapotranspiration estimates against the water balance method, J. Hydrol., 538, 82–95, https://doi.org/10.1016/j.jhydrol.2016.04.006, 2016.
Liu, Y. Y., de Jeu, R. A. M., McCabe, M. F., Evans, J. P., and van Dijk, A. I. J. M.: Global long-term passive microwave satellite-based retrievals of vegetation optical depth, Geophys. Res. Lett., 38, L18402, https://doi.org/10.1029/2011GL048684, 2011.
Lu, J., Wang, G., Chen, T., Li, S., Hagan, F. T. D., Kattel, G., Peng, J., Jiang, T., and Su, B.: A Harmonized Global Land Evaporation Dataset from Reanalysis Products Covering 1980–2017, Zenodo [data set], https://doi.org/10.5281/zenodo.4595941, 2021.
Lu, X., Liu, Z., An, S., Miralles, D. G., Maes, W., Liu, Y., and Tang, J.: Potential of solar-induced chlorophyll fluorescence to estimate transpiration in a temperate forest, Agr. Forest Meteorol., 252, 75–87, https://doi.org/10.1016/j.agrformet.2018.01.017, 2018.
Martens, B., Miralles, D. G., Lievens, H., van der Schalie, R., de Jeu, R. A. M., Fernández-Prieto, D., Beck, H. E., Dorigo, W. A., and Verhoest, N. E. C.: GLEAM v3: satellite-based land evaporation and root-zone soil moisture, Geosci. Model Dev., 10, 1903–1925, https://doi.org/10.5194/gmd-10-1903-2017, 2017.
Martens, B., Schumacher, D. L., Wouters, H., Muñoz-Sabater, J., Verhoest, N. E. C., and Miralles, D. G.: Evaluating the land-surface energy partitioning in ERA5, Geosci. Model Dev., 13, 4159–4181, https://doi.org/10.5194/gmd-13-4159-2020, 2020.
McCabe, M. F., Ershadi, A., Jimenez, C., Miralles, D. G., Michel, D., and Wood, E. F.: The GEWEX LandFlux project: evaluation of model evaporation using tower-based and globally gridded forcing data, Geosci. Model Dev., 9, 283–305, https://doi.org/10.5194/gmd-9-283-2016, 2016.
Miralles, D. G., De Jeu, R. A. M., Gash, J. H., Holmes, T. R. H., and Dolman, A. J.: Magnitude and variability of land evaporation and its components at the global scale, Hydrol. Earth Syst. Sci., 15, 967–981, https://doi.org/10.5194/hess-15-967-2011, 2011.
Miralles, D. G., Jiménez, C., Jung, M., Michel, D., Ershadi, A., McCabe, M. F., Hirschi, M., Martens, B., Dolman, A. J., Fisher, J. B., Mu, Q., Seneviratne, S. I., Wood, E. F., and Fernández-Prieto, D.: The WACMOS-ET project – Part 2: Evaluation of global terrestrial evaporation data sets, Hydrol. Earth Syst. Sci., 20, 823–842, https://doi.org/10.5194/hess-20-823-2016, 2016.
Monteith, J. L.: Evaporation and the Environment, Sym. Soc. Exp. Biol., 19, 205–234, 1965.
Mu, Q., Zhao, M., and Steven, W.: Improvements to a MODIS global terrestrial evapotranspiration algorithm, Remote Sens. Environ., 115, 1781–1800, https://doi.org/10.1016/j.rse.2011.02.019, 2011.
Mueller, B. and Seneviratne, S. I.: Hot days induced by precipitation deficits at the global scale, P. Natl. Acad. Sci. USA, 109, 12398–12403, https://doi.org/10.1073/pnas.1204330109, 2012.
Mueller, B., Seneviratne, S. I., Jimenez, C., Corti, T., Hirschi, M., Balsamo, G., Ciais, P., Dirmeyer, P., Fisher, J. B., Guo, Z., Jung, M., Maignan, F., McCabe, M. F., Reichle, R., Reichstein, M., Rodell, M., Sheffield, J., Teuling, A. J., Wang, K., Wood, E. F., and Zhang, Y.: Evaluation of global observations-based evapotranspiration datasets and IPCC AR4 simulations, Geophys. Res. Lett., 38, L06402, https://doi.org/10.1029/2010GL046230, 2011.
Mueller, B., Hirschi, M., Jimenez, C., Ciais, P., Dirmeyer, P. A., Dolman, A. J., Fisher, J. B., Jung, M., Ludwig, F., Maignan, F., Miralles, D. G., McCabe, M. F., Reichstein, M., Sheffield, J., Wang, K., Wood, E. F., Zhang, Y., and Seneviratne, S. I.: Benchmark products for land evapotranspiration: LandFlux-EVAL multi-data set synthesis, Hydrol. Earth Syst. Sci., 17, 3707–3720, https://doi.org/10.5194/hess-17-3707-2013, 2013.
Munier, S., Aires, F., Schlaffer, S., Prigent, C., Papa, F., Maisongrande, P., and Pan, M.: Combining data sets of satellite-retrieved products for basin-scale water balance study: 2. Evaluation on the Mississippi Basin and closure correction model, J. Geophys. Res.-Atmos., 119, 12100–12116, https://doi.org/10.1002/2014JD021953, 2014.
Opoku-Duah, S., Donoghue, D. N. M., and Burt, T. P.: Intercomparison of evapotranspiration over the Savannah Volta Basin in West Africa using remote sensing data, Sensors, 8, 2736–2761, https://doi.org/10.3390/s8042736, 2008.
Peng, J., Loew, A., Chen, X., Ma, Y., and Su, Z.: Comparison of satellite-based evapotranspiration estimates over the Tibetan Plateau, Hydrol. Earth Syst. Sci., 20, 3167–3182, https://doi.org/10.5194/hess-20-3167-2016, 2016.
Peng, J., Kharbouche, S., Muller, J.-P., Danne, O., Blessing, S., Giering, R., Gobron, N., Ludwig, R., Muller, B., Leng, G., Lees, T., and Dadson, S.: Influences of leaf area index and albedo on estimating energy fluxes with HOLAPS framework, J. Hydrol., 580, 124245, https://doi.org/10.1016/j.jhydrol.2019.124245, 2020.
Pinzon, J. E. and Tucker, C. J.: A non-stationary 1981–2012 AVHRR NDVI3g time series, Remote Sens., 6, 6929–6960, https://doi.org/10.3390/rs6086929, 2014.
Pipunic, R. C., Walker, J. P., and Western, A. Assimilation of remotely sensed data for improved latent and sensible heat flux prediction: A comparative synthetic study, Remote Sens. Environ., 112, 1295–1305, https://doi.org/10.1016/j.rse.2007.02.038, 2008.
Priestley, C. H. B. and Taylor, R. J.: On the assessment of surface heat flux and evaporation using large-scale parameters, Mon. Weather Rev., 100, 81–92, https://doi.org/10.1175/1520-0493(1972)100<0081:OTAOSH>2.3.CO;2, 1972.
Randles, C. A., da Silva, A. M., Buchard, V., Colarco, P. R., Darmenov, A., Govindaraju, R., Smirnov, A., Holben, B., Ferrare, R., Hair, J., Shinozuka, Y., and Flynn, C. J.: The MERRA-2 Aerosol Reanalysis, 1980 Onward. Part I: System Description and Data Assimilation Evaluation, J. Climate, 30, 6823–6850, https://doi.org/10.1175/JCLI-D-16-0609.1, 2017.
Reichle, R. H., Liu, Q., Koster, R. D., Draper, C. S., Mahanama, S. P., and Partyka, G. S.: Land surface precipitation in MERRA-2, J. Climate, 30, 1643–1664, https://doi.org/10.1175/JCLI-D-16-0570.1, 2017.
Rodell, M., Houser, P. R., Jambor, U., Gottschalck, J., Mitchell, K., Meng, C.-J., Arsenault, K., Cosgrove, B., Radakovich, J., Bosilovich, M., Entin, J. K., Walker, J. P., Lohmann, D., and Toll, D.: The Global Land Data Assimilation System, B. Am. Meteorol. Soc., 85, 381–394, https://doi.org/10.1175/BAMS-85-3-381, 2004.
Schuttemeyer, D., Schillings, C., Moene, A. F., and de Bruin, H. A. R.: Satellite-based actual evapotranspiration over drying semi-arid terrain in West Africa, J. Appl. Meteorol. Clim., 46, 97–111, https://doi.org/10.1175/JAM2444.1, 2007.
Seneviratne, S. I.: Climate science: Historical drought trends revisited, Nature, 491, 338–339, https://doi.org/10.1038/491338a, 2012.
Seneviratne, S. I., Lüthi, D., Litschi, M., and Schär, C.: Land-atmosphere coupling and climate change in Europe, Nature, 443, 205–209, https://doi.org/10.1038/nature05095, 2006.
Seneviratne, S. I., Corti, T., Davin, E. L., Hirschi, M., Jaeger, E. B., Lehner, I., Orlowsky, B., and Teuling, A. J.: Investigating soil moisture-climate interactions in a changing climate: A review, Earth-Sci. Rev., 99, 125–161, https://doi.org/10.1016/j.earscirev.2010.02.004, 2010.
Shan, N., Ju, W., Migliavacca, M., Martini, D., Guanter, L., Chen, J., Goulas, Y., and Zhang, Y.: Modeling canopy conductance and transpiration from solar-induced chlorophyll fluorescence, Agr. Forest Meteorol., 268, 189–201, https://doi.org/10.1016/j.agrformet.2019.01.031, 2019.
Sheffield, J. and Wood, E. F.: Characteristics of global and regional drought, 1950–2000: Analysis of soil moisture data from off-line simulation of the terrestrial hydrologic cycle, J. Geophys. Res., 112, D17115, https://doi.org/10.1029/2006JD008288, 2007.
Sheffield, J., Goteti, G., and Wood, E. F.: Development of a 50-year high-resolution global dataset of meteorological forcings for land surface modeling, J. Climate, 19, 3088–3111, https://doi.org/10.1175/JCLI3790.1, 2006.
Sheffield, J., Wood, E. F., and Roderick, M. L.: Little change in global drought over the past 60 years, Nature, 491, 435–438, https://doi.org/10.1038/nature11575, 2012.
Wang, W., Cui, W., Wang, X., and Chen, X.: Evaluation of GLDAS-1 and GLDAS-2 forcing data and Noah model simulations over China at the monthly scale, J. Hydrometeorol., 17, 2815–2833, https://doi.org/10.1175/JHM-D-15-0191.1, 2016.
Xu, S., Wu, C., Wang, L., Gonsamo, A., Shen, Y., and Niu, Z.: A new satellite-based monthly precipitation downscaling algorithm with non-stationary relationship between precipitation and land surface characteristics, Remote Sens. Environ., 162, 119–140, https://doi.org/10.1016/j.rse.2015.02.024, 2015.
Xu, Y., Gao, X., and Giorgi, F.: Upgrades to the reliability ensemble averaging method for producing probabilistic climate-change projections, Clim. Res., 41, 61–81, https://doi.org/10.3354/cr00835, 2010.
Yang, Z., Zhang, Q., Yang, Y., Hao, X., and Zhang, H.: Evaluation of evapotranspiration models over semi-arid and semi-humid areas of China, Hydrol. Process., 30, 4292–4313, https://doi.org/10.1002/hyp.10824, 2016.
Yao, Y., Liang, S., Li, X., Hong, Y., Fisher, J., Zhang, N., Chen, J., Cheng, J., Zhao, S., Zhang, X., Jiang, B., Sun, L., Jia, K., Wang, K., Chen, Y., Mu, Q., and Feng, F.: Bayesian multimodel estimation of global terrestrial latent heat flux from eddy covariance, meteorological, and satellite observations, J. Geophys. Res.-Atmos., 119, 4521–4545, https://doi.org/10.1002/2013JD020864, 2014.
Yao, Y., Liang, S., Li, X., Liu, S., Chen, J., Zhang, X., Jia, K., Xie, X., Munier, S., Liu, M., Yu, J., Lindroth, A., Varlagin, A., Raschi, A., Noormets, A., Pio, C., Wohlfahrt, G., Sun, G., Domec, J. C., Montagnani, L., Lund, M., Eddy, M., Blanken, P. D., Grünwald, T., Wolf, S., and Magliulo, V.: Assessment and simulation of global terrestrial latent heat flux by synthesis of CMIP5 climate models and surface eddy covariance observations. Agr. Forest Meteorol., 223, 151–167, https://doi.org/10.1016/j.agrformet.2016.03.016, 2016.
Yao, Y., Liang, S., Li, X., Chen, J., Liu, S., Jia, K., Zhang, X., Xiao, Z., Fisher, J. B., Mu, Q., Pan, M., Liu, M., Cheng, J., Jiang, B., Xie, X., Grnwald, T., Bernhofer, C., and Roupsard, O.: Improving global terrestrial evapotranspiration estimation using support vector machine by integrating three process-based algorithms, Agr. Forest Meteorol., 242, 55–74, https://doi.org/10.1016/j.agrformet.2017.04.011, 2017a.
Yao, Y., Liang, S., Li, X., Zhang, Y., Chen, J., Jia, K., Zhang, X., Fisher, J., Wang, X., Zhang, L., Xu, J., Shao, C., Posee, G., Li, Y., Magliulo, V., Varlagin, A., Moors, E. J., Boike, J., Macfarlane, C., Kato, T., Buchmann, N., Billesbach, D. P., Berimger, J., Wolf, S., Papuga, S. A., Wohlfahrt, G., Montagnani, L., Ardö, J., Paul-Limoges, E., Emmel, C., Hörtnagl, L., Sachs, T., Gruening, C., Gioli, B., López-Ballesteros, A., Steinbrecher, R., and Gielen, B.: Estimation of high-resolution terrestrial evapotranspiration from Landsat data using a simple Taylor skill fusion method, J. Hydrol., 553, 508–526, https://doi.org/10.1016/j.jhydrol.2017.08.013, 2017b.
Yilmaz, M. T., Crow, W. T., Anderson, M. C., and Hain, C.: An objective methodology for merging satellite-and model-based soil moisture products, Water Resour. Res., 48, W11502, https://doi.org/10.1029/2011WR011682, 2012.
Zhu, G., Li, X., Zhang, K., Ding, Z., Han, T., Ma, J., Huang, C., He, J., and Ma, T.: Multi model ensemble prediction of terrestrial evapotranspiration across north China using Bayesian model averaging, Hydrol. Process., 30, 2861–2879, https://doi.org/10.1002/hyp.10832, 2016.