the Creative Commons Attribution 4.0 License.
the Creative Commons Attribution 4.0 License.
Total column ozone measurements by the Dobson spectrophotometer at Belsk (Poland) for the period 1963–2019: homogenization and adjustment to the Brewer spectrophotometer
Janusz W. Krzyścin
Bonawentura Rajewska-Więch
Janusz Jarosławski
The total column ozone (TCO3) measurements by the Dobson spectrophotometer (serial no. 84) have been carried out at Belsk station (51∘50′ N, 20∘47′ E), Poland, since 23 March 1963. In total, ∼115 000 intraday manual observations were made by 31 December 2019. These observations were performed for different combinations of double wavelength pairs in the ultraviolet range and observation types, i.e., direct sun (DS), zenith blue (ZB), and zenith cloudy (ZC) depending on weather conditions. The long-term stability of the instrument was supported by frequent (almost every 4 years) intercomparisons with the world standard spectrophotometer. Trend analyses, based on the monthly and yearly averaged TCO3, can be carried out without any additional corrections to the intraday values. To adjust these data to the Brewer spectrophotometer observations, which were also performed at Belsk, a procedure is proposed to account for less accurate Dobson observations under low solar elevation, presence of clouds, and the temperature dependence of ozone absorption. The adjusted time series shows that the Brewer–Dobson monthly averaged differences are in the range of about ±0.5 %. The intraday TCO3 database, divided into three periods (1963–1979, 1980–1999, and 2000–2019), is freely available at https://doi.org/10.1594/PANGAEA.919378 (Rajewska-Więch et al., 2020).
- Article
(2951 KB) - Full-text XML
- BibTeX
- EndNote
The monitoring of total column ozone (TCO3) started in 1924 in Oxford (the United Kingdom) with a prototype of the Dobson instrument (DI). Before the Second World War, there existed data records from two stations – Oxford (DI serial no. 1) and Arosa (DI serial no. 2) – archived in the World Ozone and Ultraviolet Radiation Data Centre. After the international geophysical year in 1958, the total number of the stations with routine TCO3 increased up to about 50. The number of ozone observations increased sharply in the early 1980s following the discovery of the ozone hole in the Antarctic spring by Chubachi (1984) and Farman et al. (1985). The variability in the ozone layer was of particular interest as ozone is the only gaseous component of the atmosphere that absorbs short-wave solar radiation in the ultraviolet (UV) B range (280–315 nm), which is harmful to all living organisms on Earth. Ozone depletion became a widely debated environmental issue that led to the signing of an international agreement, the Montreal Protocol (MP) 1987, to protect the ozone layer by reducing the production and use of the ozone-depleting substances (ODSs).
Until the late 1970s the Dobson spectrophotometer was the only optical instrument for TCO3 ground-based measurements. Monitoring of TCO3 required a lot of man power because the Dobson observations involve many manual activities, and the obtained TCO3 value depended to some extent on the individual observer's ability to manipulate the instrument. The need to automate TCO3 measurements resulted in the development of an automated instrument – the Brewer spectrophotometer. It was designed in Canada, and after improvements in the 1970s, it was available for ozone monitoring in the early 1980s. However, differences between the Dobson and the Brewer record data were found. Kerr et al. (1988) suggested that this difference was due to the temperature dependence of the ozone absorption coefficients (O3AC). The Bass–Paur O3AC (Bass and Paur, 1985), which replaced the previous Vigroux (1967) coefficients, has been used operationally in the TCO3 ground-based observation network since the early 1990s (Komhyr et al., 1993). Vanicek (2006) found that the difference could reach ∼4 % when comparing the Brewer and Dobson monthly mean data taken in Hradec Králové, Czech Republic, due to the use of the Bass–Paur O3AC at a fixed temperature. There were several attempts to recalculate the O3AC (Redondas et.al., 2014), and finally the recalculation proposed by Serdyuchenko et al. (2014) was recommended for the ground-based TCO3 network. The application of these temperature-dependent absorption coefficients significantly reduced the artificial seasonality in the Dobson–Brewer differences to less than 1 % (Redondas et al., 2014; Fragkos et al., 2015). However, the data from the Dobson network have not yet been recalculated using the new O3AC as the vertical temperature and ozone profiles in the stratosphere are also required for the observation site.
The ozone issue is still relevant as the rate of ozone recovery expected from the regulations of the MP 1987 and its subsequent amendments was also driven by recent climate changes (e.g., Steinbrecht et al., 2017; Ball et al., 2018). In addition, a surprising increase in the concentrations of anthropogenic chlorofluorocarbons in the troposphere has been found in some regions related to ODS leakage from its long-term storing reservoirs (Lickley et al., 2020) and a return to industrial use of ODSs (Montzka et al., 2018; Dhomse et al., 2019). The Antarctic ozone hole is surprising because of its variability from an extreme small extent in 2019 (Krzyścin, 2020) to extreme large one in 2020 (https://public.wmo.int/en/media/news/2020-antarctic-ozone-hole-large-and-deep?, last access: 2 September 2021). Moreover, severe chemical losses occurred in the Arctic stratosphere in spring 2020 (e.g., Manney et al., 2020; Wohltmann et al., 2020). Therefore, it is still worth monitoring ozone with the Dobson spectrophotometer, which was designed and put into operation almost 100 years ago.
The Central Geophysical Laboratory of the Institute of Geophysics, Polish Academy of Sciences, at Belsk (51.84∘ N, 20.78∘ E), Poland, started monitoring atmospheric ozone (TCO3 and the ozone vertical profile by the Umkehr method) on 23 March 1963. There are only two stations in Europe with longer time series: Arosa (since 1926; Staehelin et al., 1998) and Hradec Králové (since 1961; Vaníček et al., 2012). The importance of Belsk's TCO3 time series results from the monitoring carried out regardless of the weather conditions, excluding only days with continuous rain or snow fall. Various efforts have been made to support data quality (e.g., Dziewulska-Łosiowa et al., 1983; Degórska and Rajewska-Więch, 1991) because less accurate zenith sky TCO3 observations during cloud cover were only available on certain days, especially in late autumn and winter. This paper presents further steps in the homogenization of Belsk's TCO3 time series for the period 1963–2019 in the perspective of the long-term variability in the atmospheric ozone and possibility of replacing Belsk's Dobson with a modern Brewer spectrophotometer.
2.1 The Dobson spectrophotometer
The Dobson spectrophotometer was designed to measure TCO3 by the technique of differential optical absorption spectroscopy (Dobson, 1957). The TCO3 values from direct sun (DS) observations are calculated based on the Beer's law applied to spectral UV solar irradiances for selected wavelengths with strong and weak absorption by the ozone layer. These wavelengths are denoted as A (305.5–325.0 nm), C (311.5–332.4 nm), and D (317.5–339.9 nm). The TCO3 value is determined from linear combination of the logarithm of the ratios between A pair and D pair irradiances, called the double AD wavelength pair algorithm, to reduce the effects of the aerosols scattering on calculated ozone. It is also possible to use C pair irradiances instead of the A pair, i.e., the so-called double CD pair, to obtain TCO3 if the solar irradiance at the shorter wavelength of the A pair is too weak because of a large ozone absorption under high air masses (μ>3) and/or during cloudy conditions.
Another option to calculate TCO3 by the Dobson spectrophotometer is to use scattered sunlight from the zenith sky (ZS) at the same wavelengths as for the DS observations. In this case, the same algorithm is implemented, but the result needs to be reduced by empirical charts. The charts proposed by Rindert (1973) were used throughout Belsk's observations for AD and CD double wavelength pairs. The operational data archived in the PANGAEA database was obtained using the Bass–Paur O3AC at fixed temperature of −46.3 ∘C according the recommendation of Komhyr et al. (1993).
Figure 1 shows time series of the number of daily TCO3 means obtained from DS intraday observations with AD and/or CD wavelength pairs in January and July for the 1964–2019 period. The number of the DS daily means per month is larger in June because of usually less cloudy conditions this month compared to January and longer day length in summer (i.e., greater chance for cloudless conditions). The monthly mean TCO3 for January is mostly based on ZS observations. It is worth mentioning that a reduced number of DS observations (less than 15 per month) were found in July for the period 1985–1995. During this period, ZS observations under a cloudless sky, i.e., the so-called zenith blue (ZB) observations, replaced DS observations because the solar disk was not clear due to heavy contamination of Belsk's atmosphere with industrial aerosols. The observers were then recommended to choose ZB measurement for a clear sky.
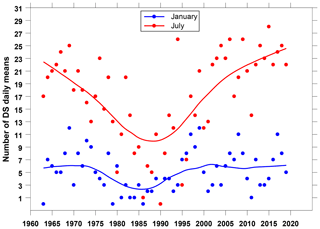
Figure 1Number of TCO3 daily means based on the direct sun measurements for January and July in the period 1964–2019.
The TCO3 values by ZS observations could be calculated for almost all weather conditions (excluding cases with heavy and variable cloudiness), but they are reliable, i.e., close to the DS values, for the air masses up to 2.8 (Fig. 2a). The empirical reduction curves (Rindert, 1973), which were used to convert ZS values to equivalent DS values, did not reflect all possible combinations of cloud types and their positions in the sky. Therefore, the DS–ZS differences can sometimes exceed 5 %. To eliminate the long-term drift of the DS–ZS differences, the following transfer function is used from the regression line fit to the relative differences between DS and ZS TCO3 subsets for :
where TCO3, ZS is the TCO3 value derived from ZS observations, μ is air mass during the Dobson observation, and pertains to the corrected value for μ>2.8. However, the linear correction is not valid if μ>4.0 (Fig. 2a). Only 0.7 % of all TCO3 observations were made at such high μ values. The fixed correction of 1.015 is applied if μ>4.0, but values should be treated with caution. The smoothed pattern of the DS–ZS differences (Fig. 2b) is close to zero after the application of the transfer function according to Eq. (1).
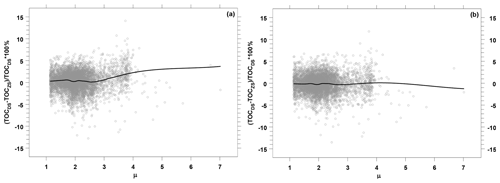
Figure 2Air mass dependence of differences between daily mean TCO3 values by DS and ZS measurements as a percentage of the DS TCO3 values: original data (a) and ZS TCO3 after the correction using Eq. (1) (b).
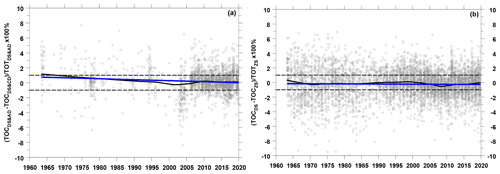
Figure 3Time series of relative differences between daily means of TCO3: DS–AD vs. DS–CD measurements (a) and DS vs. ZS measurements (b). The black curve shows the smoothed pattern of the data. The blue line is the linear regression line.
DS–AD observations provide the most accurate TCO3 values (Dobson, 1957) when μ<2.5. However, these observations are not possible for northern sites, such as Belsk, where the noon air masses above 2.5 appear in the period from 3 November up to 9 February, and the yearly maximum air mass at noon on 23 December is 3.75. Therefore, DS–CD observations are recommended for these periods (Dobson, 1957). Additional intraday TCO3 values, especially after 2005, were calculated using the nearly simultaneous DS–AD and DS–CD observations to find a relationship between these TCO3 values. Figure 3a shows that the relationship is quite stable in the 1963–2019 period, i.e., the smoothed differences (black curve) are within the [0 %,1 %] range, and the linear regression line (blue line) is trendless. A similar comparison between DS and ZS observations, after application of the transfer function (1), ensures that the smoothed differences are close to the zero line throughout the observation period (Fig. 3b).
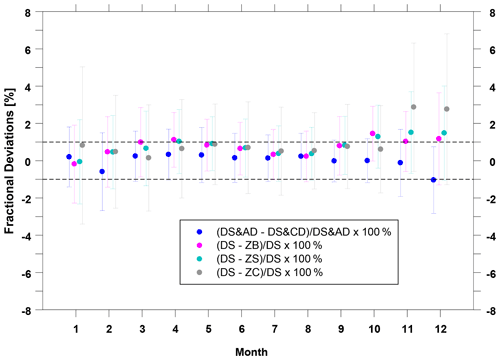
The monthly mean TCO3 differences between various subsets of the TCO3 data over the period 1963–2019 are shown in Fig. 4. The differences are derived from the monthly averaging of the daily mean TCO3 values for the following subsets: DS–AD, DS–CD, ZB, ZS, and for less reliable ZS observations, when the zenith was obscured by clouds, i.e., the so-called zenith cloudy (ZC) observations. For all ZS intraday values if μ≥2.8, the correction function according to Eq. (1) was applied. The TCO3 differences shown in Fig. 4 are in the range of ±1 % almost all year round, excluding autumn/early winter months (October–November–December). Moreover, for each selected month, from January to September, the spread between the monthly mean differences is about ∼1 % for the all considered subsets of the Dobson observations. The maximum spread is 4 % in December based on the difference of −1 % for DS–AD vs. DS–CD and 3 % for DS vs. ZC.
2.2 Calibrations of the Dobson spectrophotometer
The Dobson spectrophotometer serial no. 84 at Belsk has been operated continuously since 23 March 1963 in the same place with only a few breaks in observations (up to several weeks) due to the international calibration campaigns with other Dobson instruments. The frequent comparisons of Belsk's Dobson with the world standard instrument in combination with the recalibration of the optical wedge of the instrument and the calculation of the resulting R–N tables were of key importance for maintaining the quality of Belsk's Dobson. The R–N table is used to convert the dial reading (the so-called R value) obtained by the Dobson observer into the logarithm of the ratio between the light intensities in a pair of the UV wavelengths with weak and strong absorption by ozone (the so-called N value). N values are used in theoretical formulas to calculate TCO3 (e.g., Dobson, 1957).
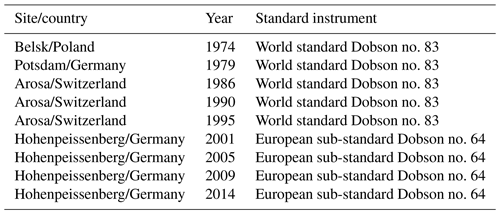
The first DI intercomparison was held at Belsk in June/July 1974. The participating Dobsons were compared against the world primary standard (WPS) Dobson spectrophotometer no. 83 and the optical wedge of Belsk's Dobson was recalibrated (Dziewulska-Łosiowa and Walshaw, 1975). The next DI intercomparison was held in Potsdam (Germany) in June 1979 also with the attendance of the same WPS. During the comparison the new R–N tables were obtained, which only slightly differed from those calculated earlier at Belsk's intercomparison (Dziewulska-Łosiowa et al., 1983). The subsequent campaigns were in Arosa (1986, 1990, and 1995) with the WPS Dobson no. 83. The next intercalibrations (2001, 2005, 2009, and 2014) were organized at the European regional Dobson calibration center, the Meteorological Observatory Hohenpeissenberg, Germany. The local European sub-standard, DI no. 64, was used as the reference instrument for comparisons at the center. After the intercomparisons, the new R–N tables were obtained and used immediately, i.e., after the instrument arrived at the observing site, as input to the TCO3 calculation algorithm. The retrieval software has not been changed since its first operational use in 1978 (Degórska et al., 1978). Table 1 summarizes the intercomparison campaigns with Belsk's Dobson.
The first homogenization of Belsk's TCO3 data for the period 1963–1981 by Dziewulska-Łosiowa et al. (1983) was based on Potsdam's R–N tables, extraterrestrial constants determined at Belsk in 1974 during the first DI intercomparison, and the O3AC by Vigroux (1967). The zenith sky irradiances (for AD and CD observations) were reduced to the DS equivalent values using the empirical charts according to Rindert (1973). The next homogenization was in 1991 by Degórska and Rajewska-Więch (1991). All data collected before 1992 were re-evaluated on a reading-by-reading basis using the Bass–Paur O3AC (at a fixed temperature of −46.3 ∘C) that has been recommended for processing Dobson TCO3 measurements since 1 January 1992.
Optical wedge calibrations performed during the entire period of ozone observations at Belsk had only a slight effect on the TCO3 values. Figure 5 shows the comparison of TCO3 calculated for the first 2-year period (1963–1964) and last 2-year period (1980–1981) of the time series after the first homogenization in 1983. Original TCO3 values from DS–AD observations presented by Dziewulska-Łosiowa et al. (1983), which were based on the Vigroux O3AC, are converted to the values obtained using the Bass–Paur O3AC (i.e., multiplied by 0.9743, as recommended by the International Ozone Commission in 1992) and then compared with the corresponding values obtained from the current retrieval based on the Bass–Paur O3AC and R–N tables obtained in the last intercomparison in 2014. There is almost one-to-one correspondence between the two TCO3 datasets, i.e., the slope of linear fit is 0.9999 and 0.9962 for the periods 1963–1964 and 1980–1981, respectively. The maximum difference between TCO3 values is less than 1 %. Small differences (<1 %) are also found after comparison of the DS–AD subset of TCO3 values in August 2020 calculated using different R–N tables that were operationally used in the 1990s and 2020s (Fig. 6).
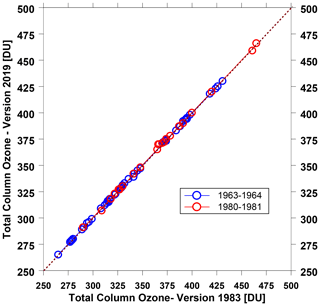
Figure 5TCO3 daily means by AD–DS measurements in the periods 1963–1964 and 1980–1981 calculated with the present (2019) calculation algorithm (R–N tables based on the 2014 intercomparison) vs. those by the same algorithm using old (1979) R–N tables.
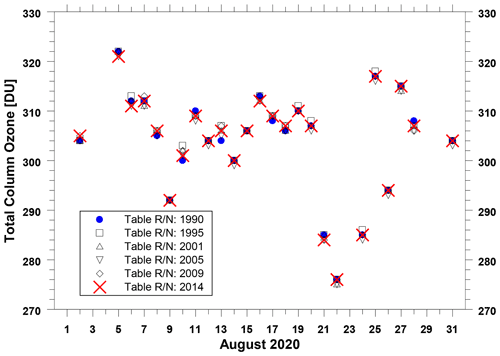
Figure 6Daily means of TCO3 in August 2020 from DS–AD measurements as calculated with different R–N tables obtained during intercomparisons in the 1990s and 2000s (see Table 1).
From these comparisons of the DS–AD measurements, it can therefore be concluded that Belsk's Dobson demonstrated stable performance throughout the measurement period. A linear approximation of TCO3 values in periods between the calibration campaigns was not necessary to account for changes in R–N values and instrument aging.
2.3 Adjustment to the Brewer spectrophotometer
The ozone monitoring with the Brewer spectrophotometer serial no. 64 (BS64) mark II (single monochromator) was launched at Belsk in 1991. Like other Brewers, the BS64 is a fully automated, self-testing, PC-controlled instrument intended for continuous, long-term observations in all weather conditions (e.g., Fioletov et al., 2005). The quality of BS64 measurements has been supported by regular (yearly or at least every 2 years) comparisons with the international travel reference instrument provided by the International Ozone Services Inc. (https://www.io3.ca/index.php, last access: 2 September 2021). The BS64 instrument constants re-defined after each comparison were immediately incorporated into the operating retrieval.
The Brewer TCO3 is derived from a weighted linear combination of solar irradiances at five wavelengths (306.3, 310.0, 313.5, 316.8, and 320.0 nm) to eliminate noise due to SO2 absorption in the UV range (Kerr et al., 1988). The Brewer TCO3 retrieval uses the Bass–Paur O3AC at −45 ∘C for two types (DS and ZS) of observations. There are many daily BS observations regardless of weather conditions. Cycles of five observations, which are performed in ∼3–4 min, are repeated every 5 to 20 min throughout the day depending on the instrument's schedule. The mean TCO3 value, averaged over five observations, is calculated if the scatter of these TCO3 values is small, i.e., standard deviation is less than 2.5 Dobson units (DU). The Dobson spectrophotometer provides instantaneous TCO3 values, while the Brewer instrument gives the average of five observations, so this may be an additional source of differences between the spectrophotometers.
2.3.1 Correction for the effective temperature
Figure 7a shows the time series of the differences between Brewer and Dobson TCO3 daily means (Brewer minus Dobson TCO3 as percent of the Dobson TCO3 value) calculated for the period 2002–2019. This period was selected because more DS–AD and DS–CD observations were performed during the day (see Fig. 3a) to construct a transfer function from the Dobson TCO3 to the Brewer equivalent TCO3 before the predicted change in monitoring policy to less frequent measurements during the day, i.e., only a few observations around noon in perfect weather conditions. The well-known seasonality of the Brewer–Dobson (BD) differences, i.e., underestimation of the Dobson TCO3 in the cold period of the year, could be observed after applying a low-pass filter, the locally weighted scatterplot smoothing (LOWESS, Cleveland, 1979), to the time series of BD differences.
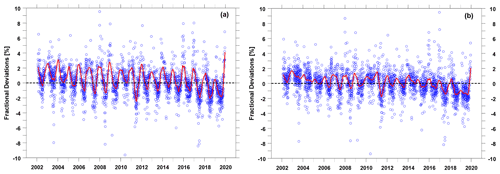
Figure 7The differences between the Brewer and Dobson TCO3 daily means as a percentage of the Dobson TCO3 value: original data after application of the correction function, according to Eq. (1), to the Dobson ZS data (a) and the Dobson and Brewer TCO3 corrected for the effective temperature (b). The red curve represents the smoothed pattern by the LOWESS filter.
To reduce the BD seasonal differences, the temperature-dependent O3AC is applied instead of the operational O3AC assuming fixed temperature T0, i.e., ∘C (Dobson) and ∘C (Brewer). Here we use the temperature correction factor, α, calculated by Redondas et al. (2014), i.e., α=0.104 % K−1 (for Dobson) and α=0.009 % K−1 (for Brewer). These values are based on the O3AC dependence on temperature obtained by the Institute of Experimental Physics (IUP), University of Bremen (Serdyuchenko et al., 2014). The correction function to account for the actual effective temperature is as follows:
where Teff is the effective (weighted by the ozone vertical profile) temperature, TCO3, OLD is the TCO3 value at the fixed temperature, and TCO3, NEW is the temperature-corrected value. Prior to the application of Eq. (2), TCO3 values by ZS Dobson observations need to be converted to the DS TCO3 equivalent using transfer function according to Eq. (1). The effective temperature at noon is taken after the Tropospheric Emission Monitoring Internet Service (TEMIS) overpass data (https://www.temis.nl/climate/efftemp/overpass.php, last access: 2 September 2021), based on the European Centre for Medium-Range Weather Forecasts (ECMWF) model estimates. Koukouli et al. (2016) found that the ECMWF effective temperature was in good agreement with that from the ozone sounding in Northern Hemisphere midlatitudes.
Figure 7b shows the time series of the BD differences after applying the correction function according to Eq. (2). The visible seasonality in Fig.7a disappears, but there are still limited seasonal variations. To find out the range of these oscillations, the monthly mean BD differences are calculated averaging the daily differences. The results are shown in Fig. 8a (DS subset) and Fig. 8b (ZS subset). A comparison of the original DS and ZS data (not accounting for Teff seasonal variability) ensures that the seasonal BD difference is ∼4.5 % as calculated using the monthly mean difference values of ∼3.5 % and −1 % for January and July (or August for ZS data), respectively. After the application of Eq. (2), the BD difference is smaller, i.e., ∼2.5 % (DS) and 3 % (ZS). The smoothed curve in Fig. 7b ensures that the Dobson TCO3 values were ∼1 % lower (2002–2004) and ∼1 % higher (2018–2019) compared to the Brewer values. Such discrepancies may be related to the Brewer ZS TCO3 values because they may be influenced by clouds (the Brewer ZS algorithm is based on a statistical relationship with parallel DS observations), which in some years results in overestimation (or underestimation) in relation to the Dobson TCO3 values.
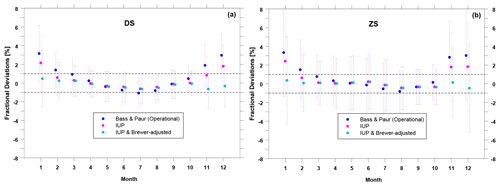
Figure 8The monthly means of the Brewer–Dobson differences for the operational data (Bass–Paur O3AC at fixed temperature) after application of the correction, according to Eq. (2), for the dependence of O3AC on temperature based on IUP measurements and after adjustment of the Dobson TCO3 to the Brewer TCO3 equivalent by Eq. (3) accounting for the stray light effect differences between the spectrophotometers. The results are for DS measurements (a) and ZS measurements (b). Bar denotes the range: mean ± standard deviation.
It is worth mentioning that the monthly BD differences for the temperature-corrected data are out of the ±1 % range only in January and December (DS subset) and additionally in November for the ZS subset. To the authors' knowledge, the BD differences for a less precise ZS subset have not yet been discussed by other authors. It seems that the stray light effect, which may be different in the Dobson and Brewer instruments (Belsk BS64 is a single monochromator spectrophotometer), is responsible for greater differences between these spectrophotometers during low-solar-elevation periods.
2.3.2 Correction for the stray light effect
The stray light within the Dobson instrument causes an underestimation of the TCO3 value by about a few percent, when slant TCO3, μ×TCO3, exceeds 800–900 DU (Evans et al., 2009). This underestimation also applies to the Brewer single monochromator spectrophotometers (e.g., Karppinen et al., 2015). Moeini et al. (2019) discussed the differences between TCO3 values measured almost simultaneously by the Dobson and Brewer spectrophotometers due to the stray light effect. They found that the difference for low solar elevations (slant TCO3>800 DU) was related to the instrument's individual sensitivity to stray light, which may be particularly high for a single monochromator Brewer (Brewer Mark II), i.e., the same type operating at Belsk.
Here, it is decided to construct a simple correction function, which would shift all-monthly BD differences for DS and ZS subset (Fig. 8) to the smallest possible range. The following the Brewer–Dobson adjustment (BDA) function is proposed to transform TCO3, NEW (Dobson TCO3 after the application of the transfer function according to Eq. 1 and the temperature correction according to Eq. 2) to its Brewer equivalent value denoted as :
where constant values γ and μ0 can be different for the ZS and DS subsets. The best pair of γ and μ0 was experimentally derived examining many combinations of γ and μ0, taking values from the range of [0,0.02] and [2.5,3.5], respectively. Finally, the following constants are derived: and (for DS subset), and and (for ZS subset). The corresponding ranges of the monthly mean BD differences are [−0.66 % (July), 0.46 % (January)] and [−0.48 % (December), 0.35 % (January)], for the DS and ZS, respectively. After application of the BDA function, the BD monthly mean differences are almost in the ±0.5 % range (see Fig. 8 for the IUP and Brewer-adjusted subset).
2.4 Uncertainty of the Brewer-adjusted Dobson TCO3
Typically, daily TCO3 averages were archived based on a few measurements around local noon with nominal best quality. The AD–DS observation shows the highest accuracy of all possible combinations of the double wavelength pairs (AD and CD) and observation type (DS, ZB, and ZS). This kind of observation is not always possible because of weather conditions (clouds) and during low solar elevation. At the beginning of the TCO3 observations at Belsk, a decision was made to increase the number of daily observations for selected days in each month in order to assess the uncertainty of TCO3 observations. On such days, there were many, almost simultaneous observations with different instrument settings. For example, Fig. 9 shows the TCO3 measurements at Belsk on 8 August 2017, planned to calculate differences between successive TCO3 values. During the day, 46 observations were made for the following instrument settings: AD–DS, AD–ZS, and CD–DS.
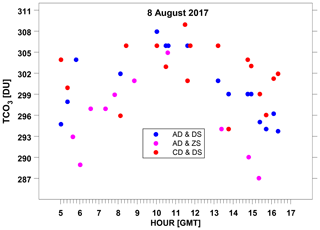
Figure 9The Brewer-adjusted TCO3 values measured at Belsk on 8 August 2017 with different settings of the Dobson spectrophotometer.
The difference between two consecutive TCO3 values sometimes exceeded 10 DU even if the measurements were taken within 10 min. It is impossible for TCO3 to change rapidly over such a short timescale, taking into account natural variability in ozone in the stratosphere. The statistics of TCO3 differences between the almost simultaneous Dobson measurement allows us therefore to estimate the uncertainty of the Brewer-adjusted Dobson TCO3 values.
The statistics were obtained for various selected maximum ranges between the successive measurements, i.e. less than 1, 5, and 10 min. It was found that the statistical parameters did not depend on these ranges, which proved a reliable estimation of the uncertainty. This uncertainty combines the instrumental uncertainty associated with the differences between various types of Dobson measurements with the uncertainty resulting from the observer's skill to perform the measurements. Table 2 presents the statistics of the differences between TCO3 values obtained almost simultaneously for different data subsets.
Table 2The statistics of the differences between the Brewer-adjusted Dobson TCO3 values from two successive measurements taken at an interval of no longer than 10 min for the period 1963–2019. The differences (in % of the mean of the two compared values) are shown for different sub-classes of the data and μ ranges. SD and n denote standard deviation and number of the measurement pairs used in the calculations, respectively.
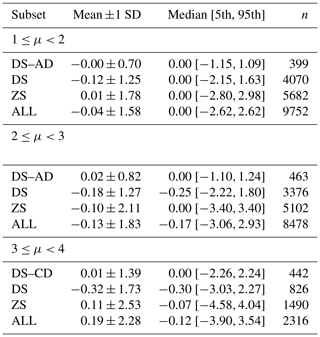
The uncertainty of the Dobson observations for the subset with the nominal highest accuracy (DS–AD) is , calculated as the range from the 5th to 95th percentile. The uncertainty increases with decreasing solar elevation, and the largest value, , is for the ZS subset when air mass is between 3 and 4. The greatest uncertainty for this type of observations seems to be due to the cloud variability over the site as the ozone retrieval for non-DS observations is based on a statistical relationship with nearly parallel DS measurements, not taking into account the specific cloud configuration and optical properties.
The following subjects were considered to construct the Brewer-adjusted record of Belsk's Dobson measurements for the entire observation period (1963–2019): the focus was on the DS–AD type of the Dobson observations during the intercalibration campaigns, DS–AD observations were well calibrated throughout the observation period (within ±1 % range), the inter-comparisons were carried out in the warm period of the year (usually in summer), and there was a seasonal difference between the Dobson and Brewer spectrophotometers, depending to some extent on the effective temperature and the different response to the stray light in these instruments. It is worth mentioning that BS64 will ultimately be the primary ozone monitoring instrument at Belsk.
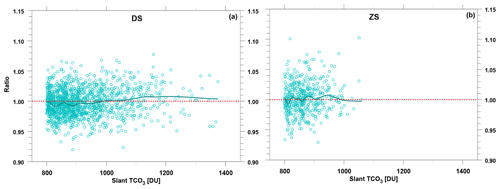
Figure 10The ratio between the daily mean TCO3 value based on the observations during the day with the slant TCO3 smaller than 800 DU and daily mean TCO3 comprising measurements with the slant ozone greater than 800 DU (points): the results are for DS measurements (a) and ZS measurements (b). The curve (in blue) represents the smoothed data.
The first step in the data homogenization was the correction of Dobson's ZS observations, taking into account the drift in relation to DS–AD values (Fig. 2). Application of the correction function according to Eq. (1) removed this shift (Fig. 2b). Moreover, Fig. 3a and b ensured that further correction to other types of the measurements was not necessary to eliminate long-term drift against the quality-controlled DS–AD subset. Thus, ZS-DS conversion charts proposed by Rindert (1973) were valid throughout the observation period, suggesting slight changes in the cloud characteristics at Belsk in the period 1963–2019.
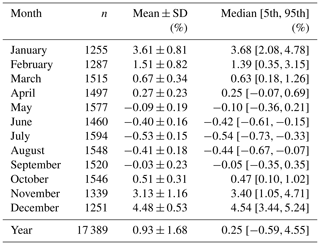
Table 3The monthly and yearly statistics (mean, standard deviation (SD), median, and the 5th–95th percentile range) of the differences between the Brewer-adjusted Dobson TCO3 and original (Bass–Paur O3AC at fixed temperature) TCO3 for the period 1963–2019; n denotes the number of the TCO3 daily means used in the calculations.
The next step was to account for the temperature dependence of O3AC based on the very recent O3AC derived by Serdyuchenko et al. (2014). Application of Eq. (2) removed part of the bias between the Brewer and Dobson spectrophotometers for both DS and ZS subsets of the observations (Figs. 7–8). The BD monthly mean differences within the ±1 % range occur in almost all months but not in months with low solar elevation at noon (November–December–January).
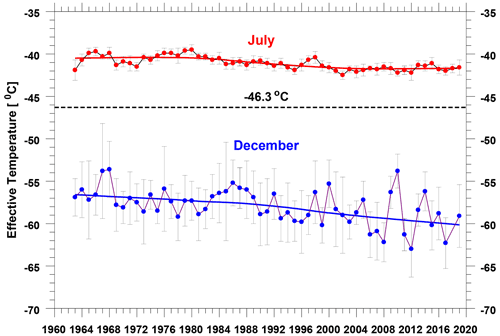
Figure 11Yearly means of the effective temperature at Belsk in December and July in the period 1963–2019.
The last step of the homogenization was to eliminate the differences between the spectrophotometers found in periods of low solar elevation. These are probably related to the presence of stray light in spectrophotometers causing an underestimation of TCO3 values at low solar elevations. The correction for the differences in the stray light effect in the spectrophotometers was proposed using Eq. (3) to reduce the BD TCO3 differences for low solar elevation. The stray light correction was not calculated separately for each instrument. However, Fig. 10 shows that the Brewer-adjusted TCO3 values are only slightly sensitive to changes in slant TCO3, i.e., within the min–max range between 0.99 and 1.01 derived from the smoothed profile of the ratio between TCO3 values unaffected (slant TCO3 <800 DU) and affected by the stray light.
Table 3 provides the monthly mean values of the differences between the final and original TCO3 values. The larger differences of about a few percentage points are found in the late autumn and early winter months. For the warm season (April–September) and the corresponding higher solar elevation at noon, the differences are only in the range of ±0.5 %.
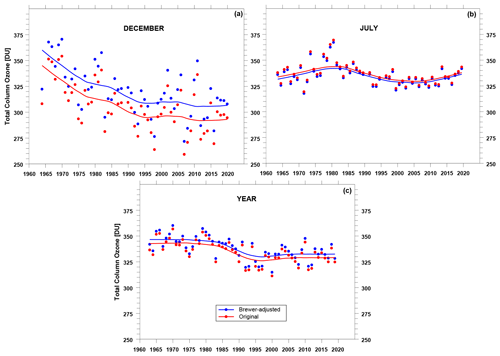
Figure 12Time series of the averaged daily TCO3 means for Belsk in the period 1963–2019 using the original data (Bass–Paur O3AC at fixed temperature) and the Brewer-adjusted Dobson data: monthly means in December (a), monthly means in July (b), and yearly means (c). The red and blue curves show the smoothed pattern for the original data and the Brewer-adjusted Dobson data, respectively.
Figure 11 shows that in December there was a significant decline in the effective temperature by ∼4 ∘C in the period 1963–2019 and a slight decline in July by ∼1 ∘C. For the original TCO3 data (archived in the PANGAEA database), such a decline caused the TCO3 to be underestimated by ∼0.4 % and ∼0.1 % at the end of the time series compared to the TCO3 values at the start, in December and June, respectively.
Figure 12a and b show the long-term variability in the monthly mean TCO3 for December and July, respectively, derived from the original data and the data after application of all correction functions (i.e., the Brewer-adjusted Dobson TCO3). The monthly means were calculated averaging the daily means from DS observations. If there were no such observations within the day, the daily means based only on ZS measurements were considered. The decline in the effective temperature (Fig. 11) does not change the variability of the long-term TCO3 pattern. A constant upward shift is found in the colder months (e.g., Fig. 12a) and a slight downward shift in the warmer months (e.g., Fig. 12b). A constant shift (upward) is also seen in the yearly mean values calculated as the average of all monthly means for each year (Fig. 12c). Therefore, the trend estimates expressed in DU will be almost the same in the original and corrected datasets if the trends are calculated as differences from the reference TCO3 value (e.g., the TCO3 monthly means before 1980).
The dataset used in this article is available on the PANGAEA repository at https://doi.org/10.1594/PANGAEA.919378 (Rajewska-Więch et al., 2020).
The TCO3 observations by the Dobson spectrophotometer at higher latitudes such as Belsk, with frequent non-ideal conditions for ozone observations, i.e., numerous cloudy days and low solar elevation at noon during the cold period of the year, should be subject to special quality checks prior to searching for the long-term trends and comparisons with satellite data. Frequent intercomparisons of Belsk's Dobson spectrophotometer, which were carried out in perfect weather conditions, showed the stability of the instrument throughout the observation period for the most reliable DS–AD observations. However, such observations were not possible for many days, especially in the cold season of the year. The data correction procedure is proposed to account for less accurate observations at low solar elevations, the presence of clouds, and the temperature sensitivity of ozone absorption.
The results of all intraday measurements for the period 1963–2019 were previously stored at the PANGAEA repository base with additional information including time of observation (UTC), cloudiness type, air mass, and description of the wavelength pair and observation type selected for each individual measurement (Rajewska-Więch et al., 2020). The present analysis shows that the Brewer-adjusted Dobson TCO3 values are reliable for μ<4 or slant TCO3 up to 1400 DU (Fig. 10).
Corrections according to Eqs. (1) and (3) are a linear function of air mass, so any user can easily calculate them based on archived air masses for all measurements. The effective temperature can be taken from the TEMIS database, and the correction for the temperature dependence of ozone absorption, given by Eq. (2), also requires simple calculations. Thus, it will be possible to use the homogenized Dobson data for comparative studies with other TCO3 data sources.
The present analysis shows that the original data (archived in the PANGAEA repository) can be used in trend analyses based on the TCO3 monthly and yearly means. The application of all proposed corrections to the original data ensures that the resulting smoothed time series exhibits a constant shift (upward for the cold season and much less downward for the warm season) relative to the original long-term pattern. This finding supports the validity of previous trend analyses of Belsk's Dobson data (e.g., Krzyścin and Rajewska, 2009; Krzyścin et al., 2013, 2014). The resulting Brewer-adjusted Dobson TCO3 values are found to be in good agreement with the Brewer data. This will allow for the construction of the merged Dobson–Brewer time series as the Brewer observations will soon replace the Dobson measurements at Belsk.
JWK wrote the paper and did statistical analysis, BRW carried out the data processing, and JJ provided the Brewer data.
The authors declare that they have no conflict of interest.
Publisher’s note: Copernicus Publications remains neutral with regard to jurisdictional claims in published maps and institutional affiliations.
The authors would like to acknowledge the support from the project Network of Geophysical Observatories of the Institute of Geophysics, Polish Academy of Sciences, subsidized by the Polish Ministry of Education and Science.
This research has been supported by the Polish Ministry of Education and Science (Decision no. 13/E-41/SPUB/SP/2020).
This paper was edited by Nellie Elguindi and reviewed by two anonymous referees.
Ball, W. T., Alsing, J., Mortlock, D. J., Staehelin, J., Haigh, J. D., Peter, T., Tummon, F., Stübi, R., Stenke, A., Anderson, J., Bourassa, A., Davis, S. M., Degenstein, D., Frith, S., Froidevaux, L., Roth, C., Sofieva, V., Wang, R., Wild, J., Yu, P., Ziemke, J. R., and Rozanov, E. V.: Evidence for a continuous decline in lower stratospheric ozone offsetting ozone layer recovery, Atmos. Chem. Phys., 18, 1379–1394, https://doi.org/10.5194/acp-18-1379-2018, 2018.
Bass, A. M. and Paur, R. J.: The Ultraviolet Cross-Sections of Ozone: I. The Measurements, in: Atmospheric Ozone, edited by: Zerefos, C. S. and Ghazi, A., Springer, Dordrecht, 606–610, https://doi.org/10.1007/978-94-009-5313-0_120, 1985.
Chubachi, S.: Preliminary result of ozone observations at Syowa from February 1982 to January 1983, Memoirs of National Institute of Polar Research, 34, 13–19, 1984.
Cleveland, W. S.: Robust weighted regression and smoothing scatterplots, J. Am. Stat. Assoc., 74, 368, 829–836, https://doi.org/10.1080/01621459.1979.10481038, 1979.
Dobson, G. M. B.: Observer's handbook for the ozone spectrophotometer, Ann. Int. Geophys. Year, 5, 46–89, 1957.
Degórska, M. and Rajewska-Więch, B.: Retrospective reevaluation of total ozone and Umkehr profile data from Belsk, Poland, Publs. Inst. Geophys. Pol. Acad. Sci., D-36, 71–76, 1991.
Degórska, M., Rajewska-Więch, B., and Kowalczyk, R.: A program for computing routine total ozone measurements and lamp tests for a Dobson spectrophotometer, Publ. Inst. Geophys. Pol. Acad. Sci., D-7, 67–75, 1978.
Dhomse, S. S., Feng, W., Montzka, S. A., Hossaini, R., Keeble, J., Pyle, J. A., Daniel, J. S., and Chipperfield, M. P.: Delay in recovery of the Antarctic ozone hole from unexpected CFC-11 emissions, Nat. Commun., 10, 5781, https://doi.org/10.1038/s41467-019-13717-x, 2019.
Dziewulska-Łosiowa, A. and Walshaw, C. D.: The international comparisons of ozone spectrophotometers at Belsk, 24 June–6 July 1974, Publ. Inst. Geophys. Pol. Acad. Sci., 89, 3–38, 1975.
Dziewulska-Łosiowa, A., Degórska, M., and Rajewska-Więch, B.: The normalized total ozone record Belsk, 1963–1981, Publ. Inst. Geophys. Pol. Acad. Sci., D-18, 23–73, 1983.
Evans, R., McConville, G., Oltmans, S., Petropavlovskikh, I., and Quincy, D.: Measurement of internal stray light within Dobson ozone spectrophotometers, Int. J. Remote Sens., 30, 4247–4258, https://doi.org/10.1080/01431160902825057, 2009.
Farman, J. C., Gardiner, B. G., and Shanklin, J. D.: Large losses of total ozone in Antarctica reveal seasonal interaction, Nature, 315, 207–210, https://doi.org/10.1038/315207a0, 1985.
Fioletov, V. E., Kerr, J. B., McElroy, C. T., Wardle, D. I., Savastiouk, V., and Grajnar, T. S.: The Brewer reference triad, Geophys. Res. Lett., 32, L20805, https://doi.org/10.1029/2005GL024244, 2005.
Fragkos, K., Bais, A. F., Balis, D., Meleti, C., and Koukouli, M. E.: The Effect of Three Different Absorption Cross-Sections and their Temperature Dependence on Total Ozone Measured by a Mid-Latitude Brewer Spectrophotometer, Atmos. Ocean, 53, 19–28, https://doi.org/10.1080/07055900.2013.847816, 2015.
Karppinen, T., Redondas, A., Garcia, R. D., Lakkala, K., McElroy, C. T., and Kyrö, E.: Compensating for the effects of stray light in single-monochromator Brewer spectrophotometer Ozone Retrieval, Atmos. Ocean, 53, 66–73, https://doi.org/10.1080/07055900.2013.871499, 2015.
Kerr, J. B., Asbridge, I. A., and Evans, W. F. J.: Intercomparison of total ozone measured by the Brewer and Dobson spectrophotometers at Toronto, J. Geophys. Res., 93, 11129–11140, https://doi.org/10.1029/JD093iD09p11129, 1988.
Komhyr, W. D., Mateer, C. L., and Hudson, R. D.: Effective Bass–Paur 1985 ozone absorption coefficients for use with Dobson ozone spectrophotometers, J. Geophys. Res., 98, 20451–20465, https://doi.org/10.1029/93JD00602, 1993.
Koukouli, M. E., Zara, M., Lerot, C., Fragkos, K., Balis, D., van Roozendael, M., Allart, M. A. F., and van der A, R. J.: The impact of the ozone effective temperature on satellite validation using the Dobson spectrophotometer network, Atmos. Meas. Tech., 9, 2055–2065, https://doi.org/10.5194/amt-9-2055-2016, 2016.
Krzyścin, J.: Is the Antarctic ozone hole recovering faster than changing the stratospheric halogen loading?, J. Meteorol. Soc. Jpn., 98, 1083–1091, https://doi.org/10.2151/jmsj.2020-055, 2020.
Krzyścin, J. W. and Rajewska-Więch, B.: Ozone recovery as seen in perspective of the Dobson spectrophotometer measurements at Belsk (52∘ N, 21∘ E) in the period 1963–2008, Atmos. Environ., 43, 6369–6375, https://doi.org/10.1016/j.atmosenv.2009.09.018, 2009.
Krzyścin, J. W., Rajewska-Więch, B., and Jarosławski, J.: The long-term variability of atmospheric ozone from the 50-yr observations carried out at Belsk (51.84∘ N, 20.78∘ E), Poland, Tellus B, 65, 21779, https://doi.org/10.3402/tellusb.v65i0.21779, 2013.
Krzyścin, J. W., Borkowski, J., Głowacka, A., Jarosławski, J., Podgórski, J., Pietruczuk, A., Rajewska-Więch, B., Sawicka, A., Sobolewski, P., Wink, J., and Zawisza, W.: Half century of the ozone observation at the Central geophysical Laboratory, IGF, PAS, Belsk, Poland, in: Achievements, History and Challenges in Geophysics, edited by: Bialik, R., Majdański, M., and Moskalik, M., Springer, Cham, Switzerland, 85–107, https://doi.org/10.1007/978-3-319-07599-0_5, 2014.
Lickley, M., Solomon, S., Fletcher, S., Velders, G. J. M., Daniel, J., Rigby, M., Montzka, S. A., Kuijpers, L. J. M., and Stone, K.: Quantifying contributions of chlorofluorocarbon banks to emissions and impacts on the ozone layer and climate, Nat. Commun., 11, 1380, https://doi.org/10.1038/s41467-020-15162-7, 2020.
Manney, G. L., Livesey, N. J., Santee, M. L., Froidevaux, L., Lambert, A., Lawrence, Z. D., Millán, L. F., Neu, J. L., Read, W. G., Schwartz, M. J., and Fuller, R. A.: Record low Arctic stratospheric ozone in 2020: MLS observations of chemical processes and comparisons with previous extreme winters, Geophys. Res. Lett., 47, e2020GL089063, https://doi.org/10.1029/2020GL089063, 2020.
Moeini, O., Vaziri Zanjani, Z., McElroy, C. T., Tarasick, D. W., Evans, R. D., Petropavlovskikh, I., and Feng, K.-H.: The effect of instrumental stray light on Brewer and Dobson total ozone measurements, Atmos. Meas. Tech., 12, 327–343, https://doi.org/10.5194/amt-12-327-2019, 2019.
Montzka, S. A., Dutton, G. S., Yu, P., Ray, E., Portmann, R. W., Daniel, J. S., Kuijpers, L., Hall, B. D., Mondeel, D., Siso, C., Nance, J. D., Rigby, M., Manning, A. J., Hu, L., Moore, F., Miller, B. R., and Elkins, J. W.: An unexpected and persistent increase in global emissions of ozone-depleting CFC-11, Nature, 557, 413–417, https://doi.org/10.1038/s41586-018-0106-2, 2018.
Rajewska-Więch, B., Krzyścin, J. W., Sobolewski, P., and Wink, J.: Intraday total column ozone measurements at Belsk, Poland, with the Dobson spectrophotometer no.84 since March 23, 1963 up to December 31, 2019, Institute of Geophysics of the Polish Academy of Sciences, Warsaw, Poland, PANGAEA [data set], https://doi.org/10.1594/PANGAEA.919378, 2020.
Redondas, A., Evans, R., Stuebi, R., Köhler, U., and Weber, M.: Evaluation of the use of five laboratory-determined ozone absorption cross sections in Brewer and Dobson retrieval algorithms, Atmos. Chem. Phys., 14, 1635–1648, https://doi.org/10.5194/acp-14-1635-2014, 2014.
Rindert, S. B.: Constructing empirical blue-sky ozone charts, Dept. of Earth Sciences, Meteorology, Uppsala University, Report No. 36, 37 pp., 1973.
Serdyuchenko, A., Gorshelev, V., Weber, M., Chehade, W., and Burrows, J. P.: High spectral resolution ozone absorption cross-sections – Part 2: Temperature dependence, Atmos. Meas. Tech., 7, 625–636, https://doi.org/10.5194/amt-7-625-2014, 2014.
Staehelin, J., Renaud, A., Bader, J., McPeters, R., Viatte, P., Hoegger, B., Bugnion, V., Giroud, M., and Schill, H.: Total ozone series at Arosa (Switzerland): Homogenization and data comparison, J. Geophys. Res., 103, 5827–5841, https://doi.org/10.1029/97JD02402, 1998.
Steinbrecht, W., Froidevaux, L., Fuller, R., Wang, R., Anderson, J., Roth, C., Bourassa, A., Degenstein, D., Damadeo, R., Zawodny, J., Frith, S., McPeters, R., Bhartia, P., Wild, J., Long, C., Davis, S., Rosenlof, K., Sofieva, V., Walker, K., Rahpoe, N., Rozanov, A., Weber, M., Laeng, A., von Clarmann, T., Stiller, G., Kramarova, N., Godin-Beekmann, S., Leblanc, T., Querel, R., Swart, D., Boyd, I., Hocke, K., Kämpfer, N., Maillard Barras, E., Moreira, L., Nedoluha, G., Vigouroux, C., Blumenstock, T., Schneider, M., García, O., Jones, N., Mahieu, E., Smale, D., Kotkamp, M., Robinson, J., Petropavlovskikh, I., Harris, N., Hassler, B., Hubert, D., and Tummon, F.: An update on ozone profile trends for the period 2000 to 2016, Atmos. Chem. Phys., 17, 10675–10690, https://doi.org/10.5194/acp-17-10675-2017, 2017.
Vanicek, K.: Differences between ground Dobson, Brewer and satellite TOMS-8, GOME-WFDOAS total ozone observations at Hradec Kralove, Czech, Atmos. Chem. Phys., 6, 5163–5171, https://doi.org/10.5194/acp-6-5163-2006, 2006.
Vaníček, K., Metelka, L., Skřivánková, P., and Staněk, M.: Dobson, Brewer, ERA-40 and ERA-Interim original and merged total ozone data sets – evaluation of differences: a case study, Hradec Králové (Czech), 1961–2010, Earth Syst. Sci. Data, 4, 91–100, https://doi.org/10.5194/essd-4-91-2012, 2012.
Vigroux, E.: Détermination des coefficients moyens d'absorption de l'ozone en vue des observations concernant l'ozone atmosphérique a l'aide due spectromètre Dobson, Ann. Phys., 2, 209–215, 1967 (in French).
Wohltmann, I., von der Gathen, P., Lehmann, R., Maturilli, M., Deckelmann, H., Manney, G. L., Davies, J., Tarasick, D., Jepsen, N., Kivi, R., Lyall, N., and Rex, M.: Near complete local reduction of Arctic stratospheric ozone by severe chemical loss in spring 2020, Geophys. Res. Lett., 47, e2020GL089547, https://doi.org/10.1029/2020GL089547, 2020.


