the Creative Commons Attribution 4.0 License.
the Creative Commons Attribution 4.0 License.
 | 02 Feb 2026
Two decades of pHT measurements along the GO-SHIP A25 section in the North Atlantic
Fiz F. Pérez
Marcos Fontela
Maribel I. García-Ibáñez
Noelia Fajar
Xosé Antonio Padín
Mónica Castaño-Carrera
Mercedes de la Paz
Lidia I. Carracedo
Marta Álvarez
Herlé Mercier
Pascale Lherminier
The North Atlantic (NA) GO-SHIP (Global Ship-based Hydrographic Investigation Program) A25 OVIDE-BOCATS (Observatoire de la variabilité interannuele à décennale en Atlantique Nord – Biennial Observation of Carbon, Acidification, Transport and Sedimentation in the North Atlantic) section is a long-term repeat hydrographic transect extending from Portugal to Greenland. Since 2002, physical and biogeochemical measurements have been carried out biennially along the OVIDE-BOCATS section, contributing to a better understanding of water mass properties, mixing, circulation, carbon storage, and climate change impacts such as ocean acidification (OA) in the NA. In particular, the high-precision pH measurements on the total hydrogen ion scale (pHT) from the OVIDE-BOCATS program represent a key milestone in monitoring OA in this particularly climate sensitive region. The method used for pHT determination relies on adding meta-cresol purple (mCP) dye to the seawater sample and spectrophotometrically measuring its absorbances at specific wavelengths. The OVIDE-BOCATS program has used unpurified mCP dye, which impurities have been proven to bias pHT values. Here we quantified the bias induced by these impurities in pHT measurements. We found that measurements carried out using the unpurified mCP dye tend to be, on average, 0.011±0.002 pHT units higher than those obtained using the purified mCP dye, with this difference slightly decreasing at higher pHT values. Moreover, we tested independent methods to correct the effect of impurities in both the historical and recent OVIDE-BOCATS pHT data, demonstrating that the correction is consistent across methods. The long-term pHT dataset has been updated to include newly acquired data and absorbance measurements, and to standardize corrections for mCP dye impurities. This effort results in a twenty-year dataset of pHT corrected for mCP dye impurities, that demonstrates the possibility of a global effort to improve the reliability and coherency of spectrophotometric pHT measurements made with unpurified mCP dye. The corrections applied to our pHT dataset have negligible implications for the OA rates previously reported, but they do affect the depth of the aragonite saturation horizon, implying a shoaling of approximately 150 m. The dataset is available at https://doi.org/10.5281/zenodo.17789895 (Pérez et al., 2025).
- Article
(7170 KB) - Full-text XML
-
Supplement
(2367 KB) - BibTeX
- EndNote


The oceanic absorption of anthropogenic CO2 (Cant) is causing major changes in the marine carbonate system chemistry (Friedlingstein et al., 2023; Le Quéré et al., 2015). The ocean is slightly basic generally; however, Cant uptake increases the concentration of total hydrogen ions ([H+]T), decreasing pH and the concentration of carbonate ions. These changes are collectively referred to as ocean acidification (OA) (Caldeira and Wickett, 2003; Orr et al., 2005), and they are especially detrimental for calcifying marine organisms and their ecosystems (IPCC, 2019). OA is a major concern for decision-makers at both local and global scales due to its potential impacts on marine ecosystem health and food security (Gattuso et al., 2015). The future impact of OA will depend on variations in the long-term mean and the short-term temporal variability of the marine carbonate system (Kwiatkowski and Orr, 2018).
Due to their physicochemical characteristics, surface waters in polar and subpolar regions are expected to experience the greatest OA impact (IPCC, 2019; Orr et al., 2005). However, the impact of OA is not limited to surface waters. Recent observations have shown that intermediate layers of the North Atlantic (NA) are experiencing higher OA rates than surface waters (Pérez et al., 2021; Resplandy et al., 2013) due to its distinctive circulation dynamics. The upper limb of the Atlantic Meridional Overturning Circulation (AMOC) transports Cant from the subtropics to the Subpolar North Atlantic (SPNA), where it is transferred to intermediate and deep layers – with lower buffering capacity than surface layers – through deep winter convection and water mass formation (Asselot et al., 2024). This process would ultimately contribute to the deterioration of NA deep-water coral ecosystems (Fontela et al., 2020a; García-Ibáñez et al., 2021; Gehlen et al., 2014; Pérez et al., 2018).
The demand for open-access OA data is increasing, driven by United Nations Sustainable Development Goal (SDG) 14 and by its role as a climate indicator recognized by the World Meteorological Organization (WMO). Although great progress in autonomous marine data collection has been achieved in recent years (Bushinsky et al., 2025), high-quality, ship-based pH measurements remain essential for ensuring the reliability of OA data collected by sensors on autonomous platforms, such as Argo floats and moorings, by enabling rigorous calibration protocols that correct for potential biases over time due to sensor drift, biofouling, and pressure effects (Maurer et al., 2021; Pérez et al., 2023; Takeshita et al., 2018).
Despite the critical role of pH data in understanding OA, significant limitations exist within key ocean databases such as the Global Ocean Data Analysis Project (GLODAPv2) (Olsen et al., 2016; Key et al., 2015). In GLODAPv2, pH data that is reported on the total hydrogen ion scale (pHT) – which accounts for both the aqueous hydrogen ions (H3O+) and the associated form with sulfate ions (HSO) – and have historically been collected less frequently than other carbonate system variables, such as total alkalinity (AT) and total dissolved inorganic carbon (CT) (Key et al., 2015; Lauvset et al., 2024; Olsen et al., 2019). AT and CT measurements are generally considered more reliable due to the availability of standardized reference materials, consensually accepted methods, and quality control procedures. In contrast, although pHT measurements are technically precise, easy to perform, and cost-effective, their intercomparability is more challenging, arising from methodological inconsistencies across various research initiatives (Dickson et al., 2016; Ma et al., 2019; Álvarez et al., 2020; Capitaine et al., 2023). The lack of traceability to a common reference, preferentially the International System of units for spectrophotometric pH measurements (Dickson et al., 2016), and the unavailability of pH reference materials within the seawater pH range (Capitaine et al., 2023), together with the documented issues affecting pHT calculated from AT and CT (including pHT-dependent offsets and larger propagated uncertainties; Álvarez et al., 2020; Carter et al., 2024b), mean that neither unadjusted direct observations nor calculated values currently provide a fully trusted global reference. Both limitations may therefore affect the reliability of pH data for climate-quality OA assessments.
Briefly, the spectrophotometric pH method is a straightforward technique that involves adding an acid-base indicator dye to the seawater sample. The method was initially defined in the 1980s (Robert-Baldo et al., 1985; Byrne and Breland 1989), and the use of meta-cresol purple (mCP) as the indicator dye began in the 1990s (Clayton and Byrne, 1993). The technique has been updated since then, but it still lacks metrological traceability and reference materials (Ma et al., 2019; Carter et al., 2024a). The method is based on the distinct absorbance wavelengths of the indicator dye's acid and basic forms, which are used to calculate an absorbance ratio. Subsequently, pHT is calculated using the indicator dye's dissociation constant and its extinction coefficients through a parameterization in function of temperature and salinity, relating the absorbance ratio with pHT. This method offers a high degree of precision (error even lower than ±0.001 pH units), with an approximate total uncertainty of ±0.01 pHT units (Dickson, 2010; Carter et al., 2024a). A primary source of error in these pHT measurements arises from the impurities present in the mCP dye itself (Liu et al., 2011). Over the last decade, different studies proved that mCP impurities cause the measured pHT to exhibit a bias that is dependent on the sample's pHT and the brand and batch of the mCP dye used (Liu et al., 2011; Yao et al., 2007). Consequently, mCP was proposed to be purified (Liu et al., 2011; Rivaro et al., 2021) to remove these impurities and parameterizations re-evaluated for those purified mCP dyes (Liu et al., 2011; Loucaides et al., 2017; Müller et al., 2018). Although some laboratories, mostly in the US, currently use purified mCP dye (Carter et al., 2018), purified mCP dyes are not commercially available, being scarce and expensive, and therefore not affordable for all laboratories. Alternatively, it is possible to evaluate the effect of these impurities on the absorbance values and correct them accordingly (Douglas and Byrne, 2017; hereafter DB'17; Takeshita et al., 2020, 2021; Woosley, 2021).
Over the past two decades, the GO-SHIP A25 OVIDE-BOCATS ship-based hydrographic section (OVIDE-BOCATS hereafter; see Sect. 2.1) – the only transoceanic cruise with a biennial frequency in the CLIVAR (Climate and Ocean: Variability, Predictability, and Change) and GO-SHIP programs – has built an extensive pHT time series in the NA of more than 23 500 pHT samples measured using unpurified mCP dye. During the 11 OVIDE-BOCATS cruises, pHT was measured spectrophotometrically following a consistent methodology and using the same commercial mCP dye brand, Sigma-Aldrich, which – like other commercial brands – contains impurities (Liu et al., 2011; Yao et al., 2007). As awareness of pHT biases introduced by mCP impurities has grown, so has the need to assess and correct their impact to ensure the internal consistency and long-term comparability of the OVIDE-BOCATS pHT dataset. In this context, we evaluated the bias induced by these impurities by carrying out measurements with purified and unpurified mCP dyes, and assessed independent methods to account for and correct the effect of these impurities in both the historical and contemporary OVIDE-BOCATS pHT data. Here we present (1) the new data from the last two BOCATS cruises of 2021 and 2023, (2) the absorbance measurements along with the evaluation of the impurities effect on them, and (3) the entire OVIDE-BOCATS pHT database product since 2002, consistently adjusted for impurity-related bias. This effort allowed us to evaluate – in a consistent way – the OA rates in the NA and to improve the reliability of the pHT data collected to date, which is fundamental for understanding the ocean's response to climate change.
2.1 OVIDE-BOCATS transoceanic section
The OVIDE-BOCATS section is a high-quality hydrographic transect in the NA, extending from Portugal to Greenland and largely following the GO-SHIP A25 track (Fig. 1), with the objective of studying the SPNA region. Initially focused on physical oceanography (Mercier et al., 2024), its scope rapidly expanded to include critical aspects of the carbon cycle, such as OA and the uptake and storage of Cant in the SPNA – one of the ocean's largest Cant reservoirs (Sabine et al., 2004). Since 2002, in situ physical and on-board biogeochemical measurements have been performed biennially along the OVIDE-BOCATS section. This repeated section is one of the longest-standing and most frequently revisited transects within the GO-SHIP and CLIVAR programs. Accordingly, data management follows strict policies, and all datasets are publicly available (https://www.ncei.noaa.gov/access/ocean-carbon-acidification-data-system/oceans/RepeatSections/clivar_ovide.html, last access: 19 January 2026).
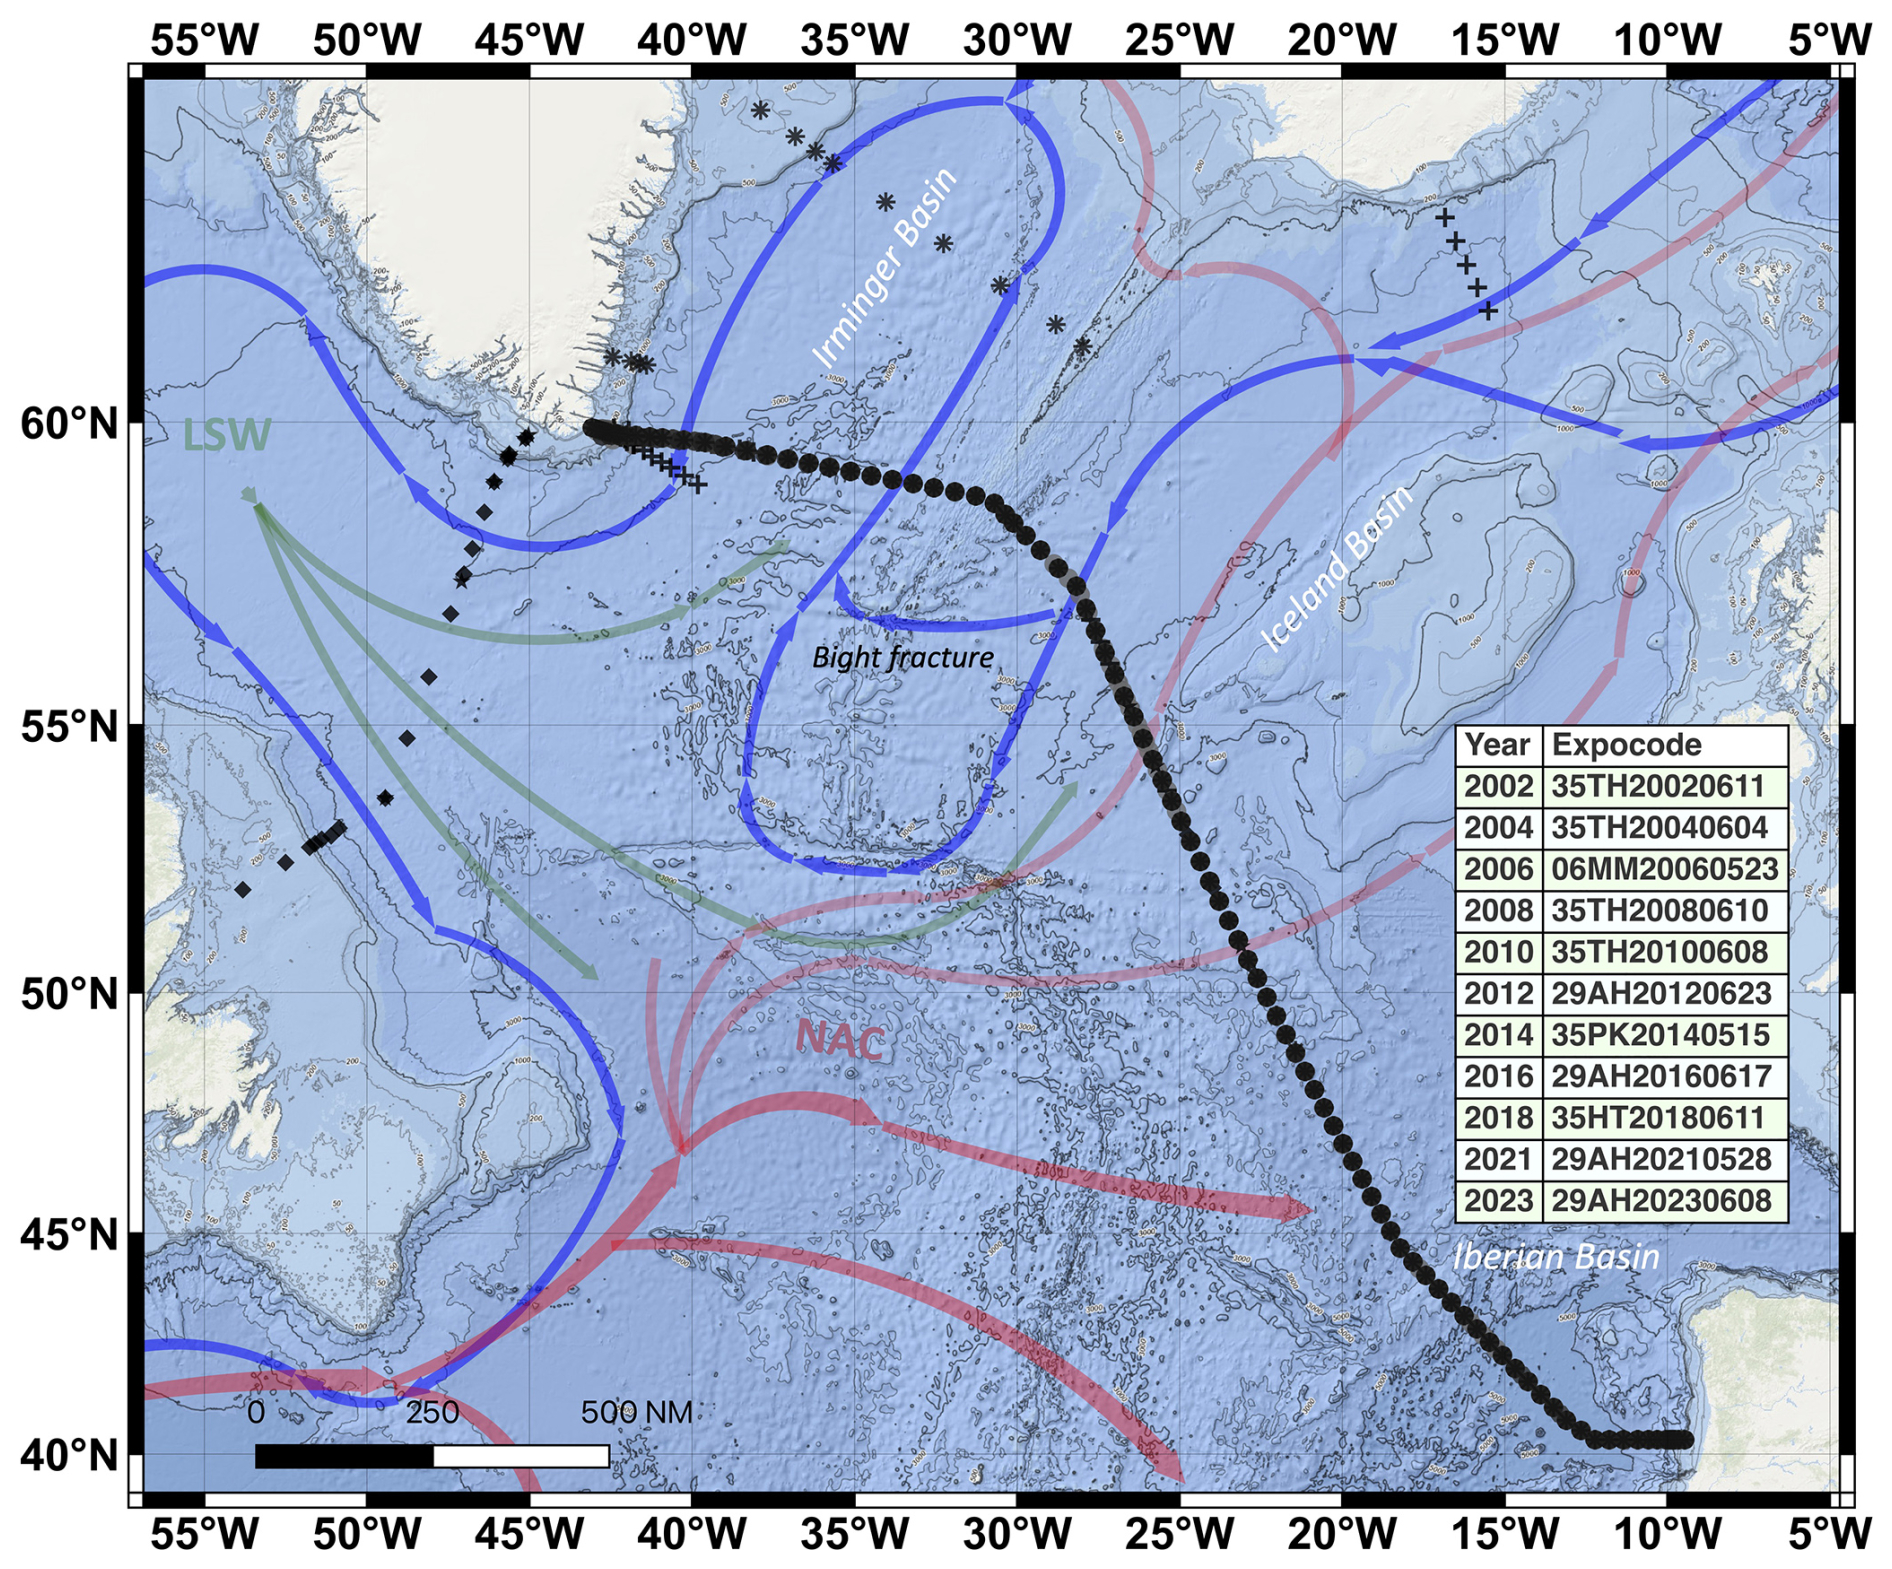
Figure 1Bathymetric map showing the main water masses and circulation patterns within the SPNA region covered by the OVIDE-BOCATS program (station locations indicated by black dots). Stations outside the main OVIDE-BOCATS (A25) section are opportunistic stations, dependent on the ship's route, whose data are also included in the final database product: “plus” symbols near Iceland and Greenland are stations sampled in 2006; “pentagon” and “rhombus” located in the Labrador Sea are stations sampled during 2012 and 2014 cruises; and “asterisk” symbols are stations sampled in 2023, near Greenland and in the Irminger Sea. The inset table lists each biannual cruise along with its corresponding expocode as identified in GLODAP. Major currents and water masses are illustrated in different colors according to their temperature and depth (from red – warmer and shallower – to blue – colder and deeper). The main schematized currents and water masses include the North Atlantic Current (NAC), Labrador Sea Water (LSW), and Iceland-Scotland Overflow Water (ISOW). The principal basins traversed along the OVIDE-BOCATS section, from west to east, are the Irminger, Iceland, and Iberian basins.
Thanks to its high frequency of repeated occupations, the OVIDE-BOCATS dataset offers a unique opportunity to study the biennial evolution of NA processes. The program focuses on water mass properties, mixing, and circulation; the impact of climate events on NA dynamics; volume and heat transports; and AMOC variability. Particular attention is given to investigate key water masses such as Subpolar Mode Water (SPMW) and Labrador Sea Water (LSW) – both formed through deep winter mixing in the SPNA – as well as Denmark Strait Overflow Water (DSOW) and Iceland-Scotland Overflow Water (ISOW) – both resulting from the entrainment of SPMW and LSW into the overflows at the sills between Greenland, Iceland, and Scotland, respectively (García-Ibáñez et al., 2015; Lherminier et al., 2010).
Research within the OVIDE-BOCATS framework has also focused on carbon inventories and the deep biogeochemical imprint, such as the role of the Deep Western Boundary Current (DWBC) in transporting oxygen, nutrients, and dissolved organic carbon (Álvarez-Salgado et al., 2013; Fontela et al., 2019, 2020b). In addition, OVIDE-BOCATS has evaluated OA rates in the NA (Fontela et al., 2020a; García-Ibáñez et al., 2016; Vázquez-Rodríguez et al., 2012) and analyzed its impact on marine biodiversity (Pérez et al., 2018; García-Ibáñez et al., 2021) as well as the ocean's capacity to absorb, store, and transport CO2 (Bajon et al., 2025, manuscript in review; Pérez et al., 2013; Zunino et al., 2015). In summary, the sustained observations from the OVIDE-BOCATS program demonstrated to be essential for detecting OA trends, improving climate models, and understanding the SPNA's response to climate change (DeVries et al., 2023; Rodgers et al., 2023).
2.2 pHT determination
2.2.1 Spectrophotometric pHT method fundamentals
In all OVIDE-BOCATS cruises, pHT was measured manually following the spectrophotometric method proposed by Clayton and Byrne (1993) – hereafter CB'93. This method involves adding a mCP dye solution to the seawater sample and calculating the sample's pHT using the following equation:
where [HI−] and [I−2] represent the concentrations of mono-dissociated and bi-dissociated species of the indicator dye, respectively. The concentration ratio ([I−2] [HI−]) can be determined spectrophotometrically by measuring absorbance at the corresponding maximum absorbance wavelengths (A), i.e., 434 and 578 nm, respectively, corrected for baseline absorbance at 730 nm – hereafter referred to as 434A, 578A, and 730A, respectively. pHT is then calculated using CB'93 parameterization of Eq. (1):
where T is temperature in Kelvin, S is salinity, and R is the ratio of the absorbances of the mono-dissociated and bi-dissociated forms of the indicator dye corrected for baseline absorbance:
The first three terms of Eq. (2) represent the second dissociation constant of mCP dye (pK2, or −pK1 in CB'93). The −pK1 obtained by CB'93 is based on the TRIS buffer characterization of Dickson (1993), which used electromotive force data from Ramette et al. (1977; Lee et al., 2000). DelValls and Dickson (1998) – hereafter DVD'98 – later determined that the pHT values assigned to TRIS buffers needed to be increased by 0.0047, for all temperatures and salinities. These corrected TRIS pHT values have recently been confirmed by Müller et al. (2018). Consequently, spectrophotometric pHT values obtained using the CB'93 parameterization should be adjusted by +0.0047 pHT units (DVD'98; Lee et al., 2000).
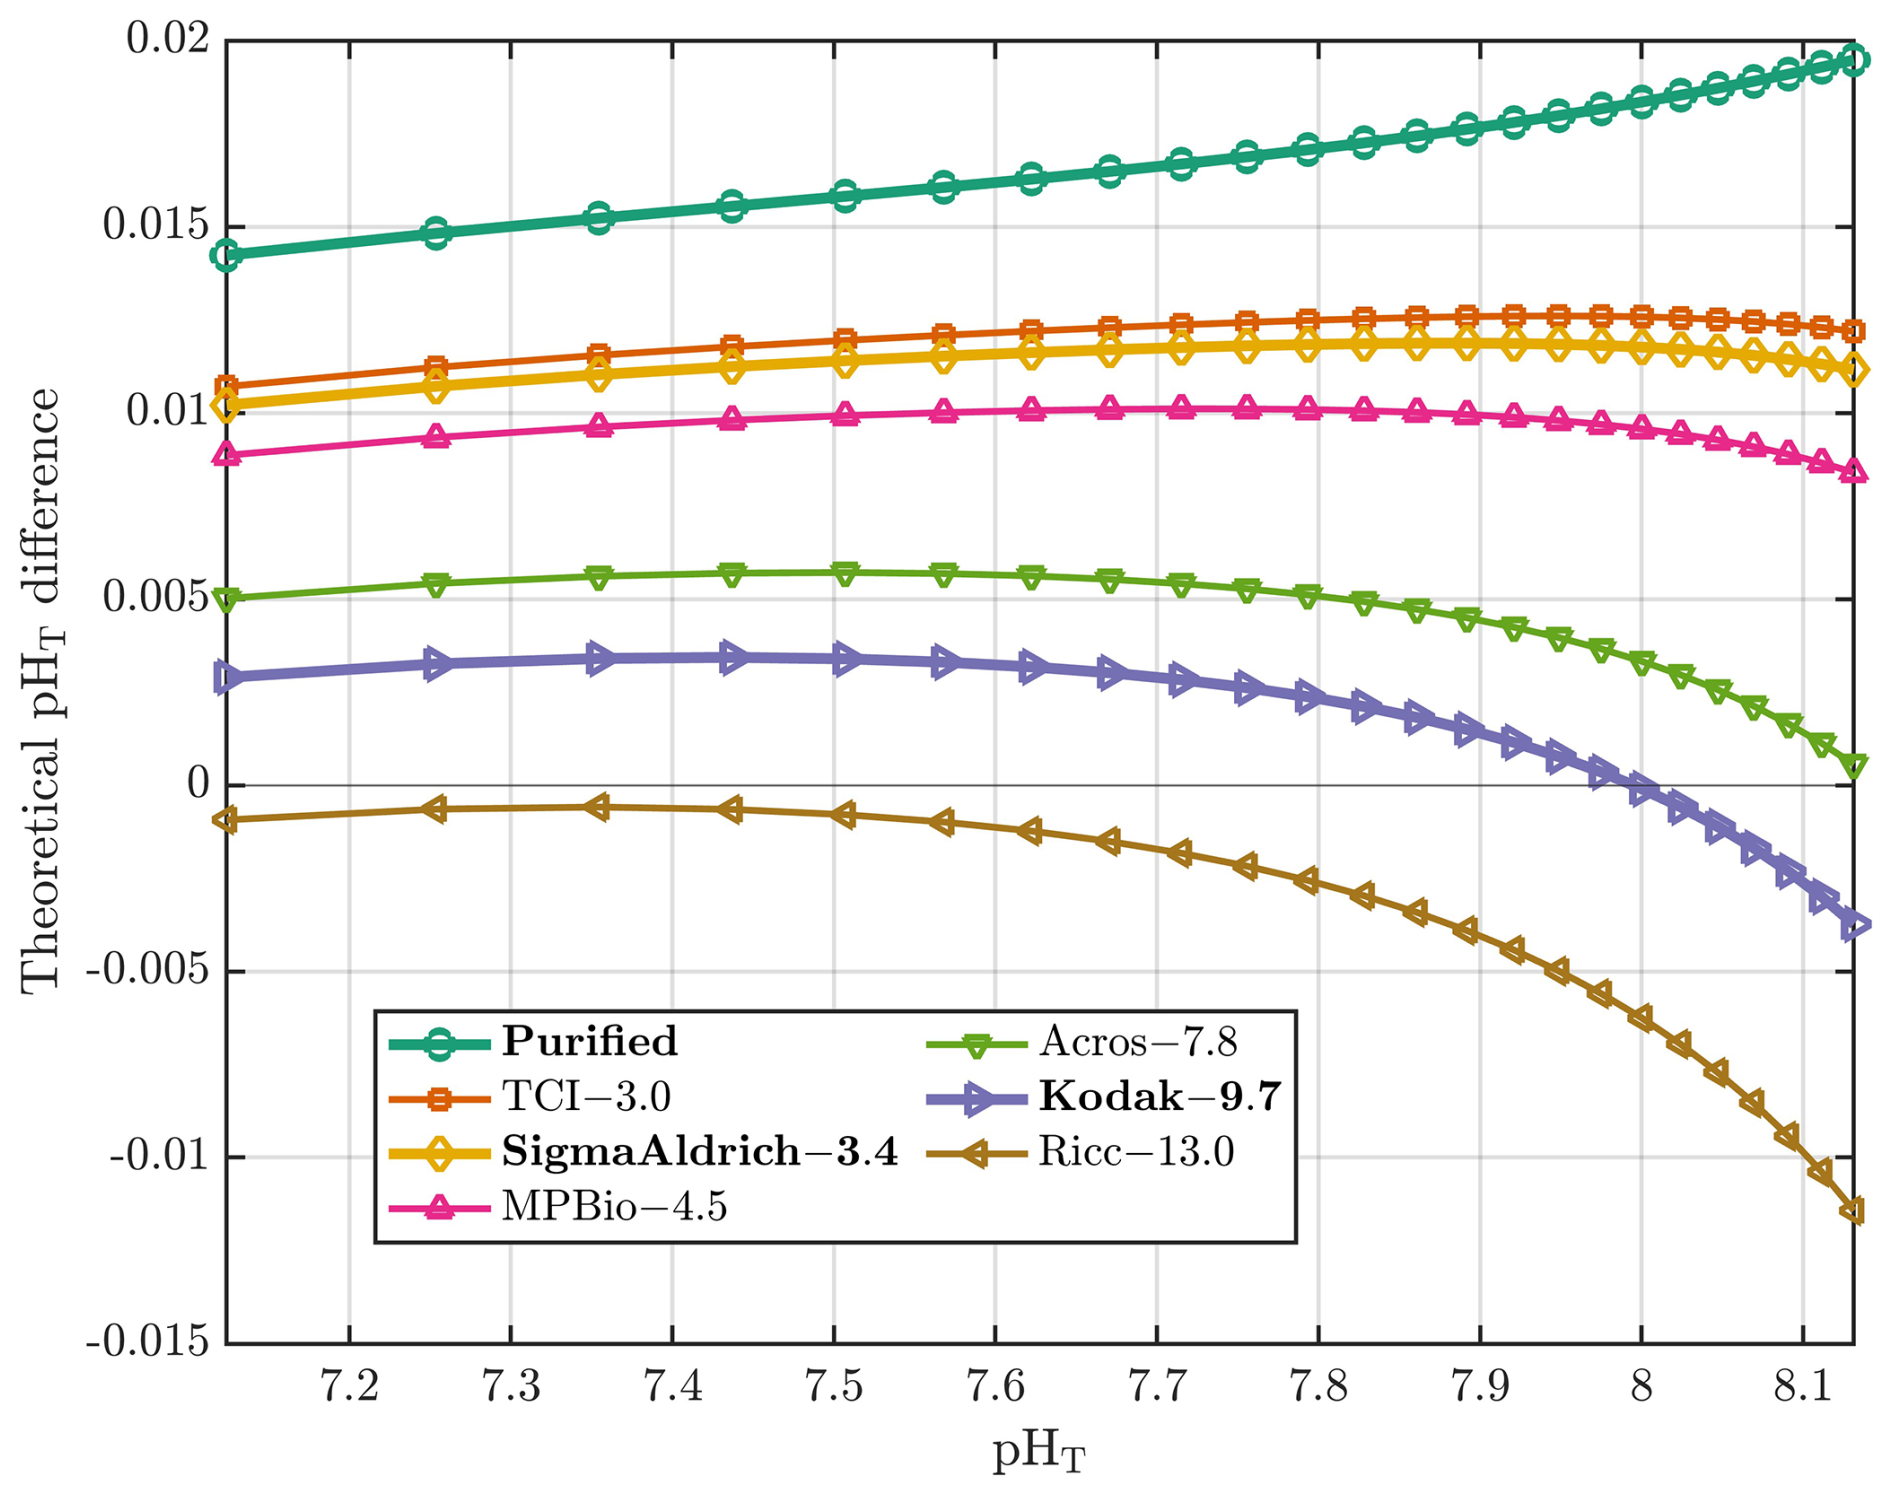
Figure 2Theoretical differences in pHT (y axis) between values using the CB'93 parametrization with the DVD'98 correction (applied to R values derived from mCP dyes with varying impurities) and those calculated using the L'11 parametrization (applied to R values derived from a purified mCP dye). The differences are plotted against pHT computed using the L'11 parameterization (x axis), at S=35 and T=25 °C. Each mCP dye is represented by a different color, with its corresponding 434Aimp value (in units of 10−3 absorbance) specific to the lot used in DB'17, listed after the indicator dye name. Bold indicates mCP dye brands discussed in this work. All 434Aimp values are taken from DB'17 and are specific to the lot used, except for Sigma-Aldrich, whose value was determined in this study.
The CB'93 parameterization was developed using Kodak mCP dye, prepared in deionized water, which contained impurities contributing significant absorbance at 434 nm (referred to as 434Aimp). However, it was not until the 2000s that the impact of impurities on pHT measurements was evidenced. Specifically, Yao et al. (2007) compared pHT determinations using Sigma-Aldrich and Kodak mCP dyes with TRIS buffers, finding that pHT values obtained with Sigma-Aldrich mCP dye were between 0.001 to 0.006 pHT units higher than those with Kodak mCP dye (for pHT ranging from 7.4 to 8.2), attributed to lower 434Aimp values in the Sigma-Aldrich mCP dye. Later, Liu et al. (2011; hereafter L'11) purified mCP dye and developed a new parameterization to determine pHT from R, demonstrating that applying their new parameterization to R data measured with impure mCP dye results in pHT values up to 0.018 pHT units lower. Subsequently, Loucaides et al. (2017) and Müller et al. (2018) produced very similar parameterizations, extending the valid salinity and temperature ranges and confirming the same pHT versus R relationship at 25 °C and oceanic salinities (see Fig. S1 in Álvarez et al., 2025). Thus, ideally, pHT measurements should be performed using purified, well-characterized mCP dyes and following a consensus method that ensures traceability to the International System of Units (SI; Capitaine et al., 2023). However, the purification procedure is not accessible to many laboratories routinely measuring seawater pHT. To overcome this limitation and facilitate high-quality spectrophotometric pHT measurements, DB'17 proposed a method to determine 434Aimp and an associated correction procedure. This approach allows R to be corrected for the contribution of impurities at 434A (i.e., 434Aimp), and consequently enables pHT calculations using parameterizations derived for purified mCP dye, such as the L'11 parameterization.
What is the bias introduced in pHT measurements as a result of mCP dye impurities? Most of the spectrophotometric pHT values in GLODAPv2 (Lauvset et al., 2024) are calculated using the CB'93 parameterization, based on measurements made with mCP dyes that contain impurities. Figure 2 shows a family of curves representing the theoretical differences between pHT values calculated using the CB'93 parameterization with R values that would have been obtained with unpurified mCP dyes (i.e., with varying 434Aimp), and those obtained using the L'11 parameterization applied to R values corresponding to a fully purified mCP dye (i.e., 434Aimp=0). We computed the corresponding 434A values (434Apur, i.e., 434Aimp=0) using the relationship described in Sect. 2.2.4 for a set of theoretical purified R (Rpur) values ranging from 0.3 to 2.6. Both the purified R values and their associated 434A values were then used in Eq. (11) of DB'17 to compute the adjusted R values (Runpur; referred to as Robs in DB'17) that reflect the contribution of mCP dye impurities (434Aimp≠0) as follows:
The mCP dye brands and their corresponding absorbance values due to their impurities, as shown in Fig. 2, are primarily taken from Table 2 of DB'17, that are based on an mCP dye concentration of 3.3 µM in the sample cell. When the CB'93 parameterization is applied to Rpur (434Aimp=0) at S=35 and 25 °C, the largest theoretical pHT differences (>0.015 pHT units) are observed relative to pHT values obtained by applying the L'11 parametrization to the corresponding Rpur under the same conditions (see turquoise line in Fig. 2). In contrast, when CB'93 parametrization is applied to Runpur values obtained with Kodak mCP dye, the resulting pHT values differ by only ±0.003 pHT units from those obtained with the L'11 parameterization with a purified mCP dye, with minimal differences observed in the pHT range of 7.65 to 8.15 (purple line in Fig. 2). This agreement arises because the CB'93 parametrization – developed using Kodak mCP dye and calibrated against TRIS buffers using unpurified mCP dye – yields lower R values than that obtained with purified mCP dye. As a result, both parameterizations converge around the TRIS buffer pHT value (8.093 at 25 °C; DVD'98). Indeed, Fig. 2 shows that larger biases in the final pHT arise when using the CB'93 parameterization with mCP dyes with lower impurity content, while the magnitude and pHT-dependence of these biases increases with higher impurity levels.
2.2.2 pHT sampling and manual spectrophotometric procedure during the OVIDE-BOCATS cruises
On all OVIDE-BOCATS cruises, seawater samples for pHT were collected after oxygen samples, using 100 mm pathlength cylindrical optical glass cells with two stoppers (Dickson et al., 2007). Each sample was taken by rinsing the optical cell twice and flushing it with seawater two or three times its volume, ensuring no air bubbles remained. To achieve this, the cell was held with the outlet above the inlet, the outlet was plugged first, the sampling tube was removed, and the second plug was inserted – taking care to avoid air bubbles. After rinsing and externally drying the cells, they were placed in a thermostatic incubator set at 25 °C for at least 30–45 min to ensure temperature stabilization at 25 °C prior to their measurement.
For each sample, a blank measurement was performed after drying and cleaning both faces of the optical cell and placing it in the spectrophotometer's cell holder. Following blanking at the three target wavelengths (434, 578, and 730 nm) with sampled seawater, 75 µL of 2 mM mCP dye solution were added to each 28 mL sample cell using an adjustable repeater pipette (SOCOREX), resulting in a final mCP dye concentration of 5.36 µM in the cell. Dispenser syringes were wrapped in aluminum foil to prevent photodegradation of the mCP dye (Fontela et al., 2023). After the mCP dye addition, the cell was thoroughly shaken and placed back in the holder in the same orientation as for the blanking, and triplicate absorbance readings were carried out at the same target wavelengths as for the blank. All absorbance readings were carried out in the spectrophotometer's thermostatted cell compartment, maintained at 25.0±0.2 °C.
Byrne and Breland (1989) demonstrated that R measurements are largely insensitive to small temperature variations, for cresol red dye. The same general behaviour applies to mCP dye, in which R values between 0.5 and 2.8 exhibit pHT errors of less than 0.001 pHT units per 1 °C change when using the L'11 parameterization. This insensitivity arises because, for mCP, the temperature dependence of the indicator dye's pK2 closely parallels the temperature dependence of seawater pH. The CB'93 parametrization shows a slightly greater temperature sensitivity, such that temperature deviations must be kept within approximately ±0.5 °C to limit the pHT error to ≤0.0012 pHT units. Therefore, it is recommended to ensure that temperature deviations remain within ±0.5 °C of the reference temperature (25 °C). In our procedure, sample temperature was monitored every five measurements to verify that it remained within this tolerance.
2.2.3 Effect of the indicator dye addition and spectrophotometer performance on the pHT measurements
Throughout the OVIDE-BOCATS program, the mCP dye used was from Sigma-Aldrich (Cat. No. 11,436-7 in the basic form; C21H17NaO5S; molecular weight 404.41 g), with only a few different batches from this brand used over the 11 cruises. Prior to 2018, mCP dye solutions were prepared by dissolving 0.080 g of the mCP sodium salt in 100 mL of natural seawater. Following DB'17 recommendations, the preparation method was modified in 2018, with the mCP dye being dissolved in 0.7 M NaCl instead of seawater. The absorbances of the mCP dye solutions at 434, 578, and 730 nm were measured spectrophotometrically using a 0.1 mm optical cell to ensure that the R values remained close to 1, corresponding to a pHT of approximately 7.67 (Li et al., 2020; at S=35 and T=25 °C). mCP dye solutions were stored in Pyrex bottles, refrigerated, and protected from light using aluminum foil.
The addition of the indicator dye slightly perturbs the sample's pHT, with the magnitude of this effect increasing for shorter optical pathlengths and when the pHT difference between the sample and the indicator dye is large (Chierici et al., 1999). For instance, when using a 100 mm optical pathlength, the indicator dye induced pHT perturbation is typically less than 0.006 pHT units within the pHT range of 7.6 to 8.0 (Chierici et al., 1999; Li et al., 2020; Table 1), which is relatively minor but not negligible. A common approach to account for this effect, as proposed by CB'93, involves performing a double addition of the indicator dye solution to the samples and calculating the difference in the resulting R values (ΔR) between the first (single) and second (double) addition. This ΔR correction is then applied to the measured R values. Alternatively, the correction can be expressed in terms of ΔpHT, which may be directly applied to the computed pHT values (Takeshita et al., 2020, 2022). Both ΔR and ΔpHT correction approaches were evaluated. During each cruise, between two and four double indicator dye addition experiments were performed. In each experiment, seawater samples were modified to obtain four pHT values ranging from 7.4 to 8.2, with four samples per pHT level (N=16 samples per experiment). Following blanking, an initial addition of 50 µL of mCP dye solution was made to each sample, and absorbance was measured as described in Sect. 2.2.2. A second addition of 50 µL of mCP dye solution was then made (resulting in a total of 100 µL of mCP dye solution added), and absorbance measurements were repeated. These double-addition experiments enabled the determination of linear regressions of the change in pHT (; where subscripts 2 and 1 refer to 100 and 50 µL of mCP dye solution added, respectively) or R () as a function of the initial pHT,1 or R1, respectively (Fig. S1 in the Supplement). This two-step 50 µL addition bracketed the typical 75 µL reference volume added to the sample, allowing us to evaluate the dye effect on the ΔR or ΔpHT both below and above this reference. The corresponding relationship was expressed as:
where a is the slope of the linear regression and pH represents the pHT at which the indicator dye addition has no effect. An analogous expression was used for ΔR [, being a′ the particular slope for the ΔR−R linear regression]. Since the standard volume of mCP dye solution used in OVIDE-BOCATS cruises was 75 µL, while the double addition experiments used 50 µL additions, a correction factor of was applied to adjust both ΔpHT and ΔR. The corrected pHT (pHT,corrected) was thus calculated as:
where pHm is the uncorrected measured pHT (i.e., prior to its ΔpHT correction) [analogously: ]. At pH, the R (pHT) of the original sample and the R (pHT) of the indicator dye are the same, so no change is observed. If , then pHT,2 (or R2) < pHT,1 (or R1), as the mCP dye addition lowers pHm; hence, pHT,corrected will be higher than pHm. Conversely, if , the mCP dye addition increases the pHm, and pHT,corrected will be lower than pHm.
Table 1Summary of each OVIDE-BOCATS cruise alias, the spectrophotometer used, and the mean and standard deviation of 488A values (from 2002 to 2018 estimated using Eq. (7), from 2018 to 2023 directly measured). The table also includes the linear regression equations and their explained variance (R2) for the ΔR-vs-R1, -vs-R1, ΔpHT-vs-pHT,1, and Δ(pH)-vs-pHT,1 relationships. Additionally, it reports the corresponding ΔpHT at pHT=7.7 and pHT=8.0, calculated using the Δ(pH)-vs-pHT,1 relationship for each cruise. Note that ΔR-vs-R1 and ΔpHT-vs-pHT,1 regressions are based on an addition of 50 µL mCP dye solution; therefore, a correction factor (e.g., ) must be applied when using ΔR-vs-R1 and ΔpHT-vs-pHT,1 relationships to samples measured with a different addition volumes (e.g., 75 µL).

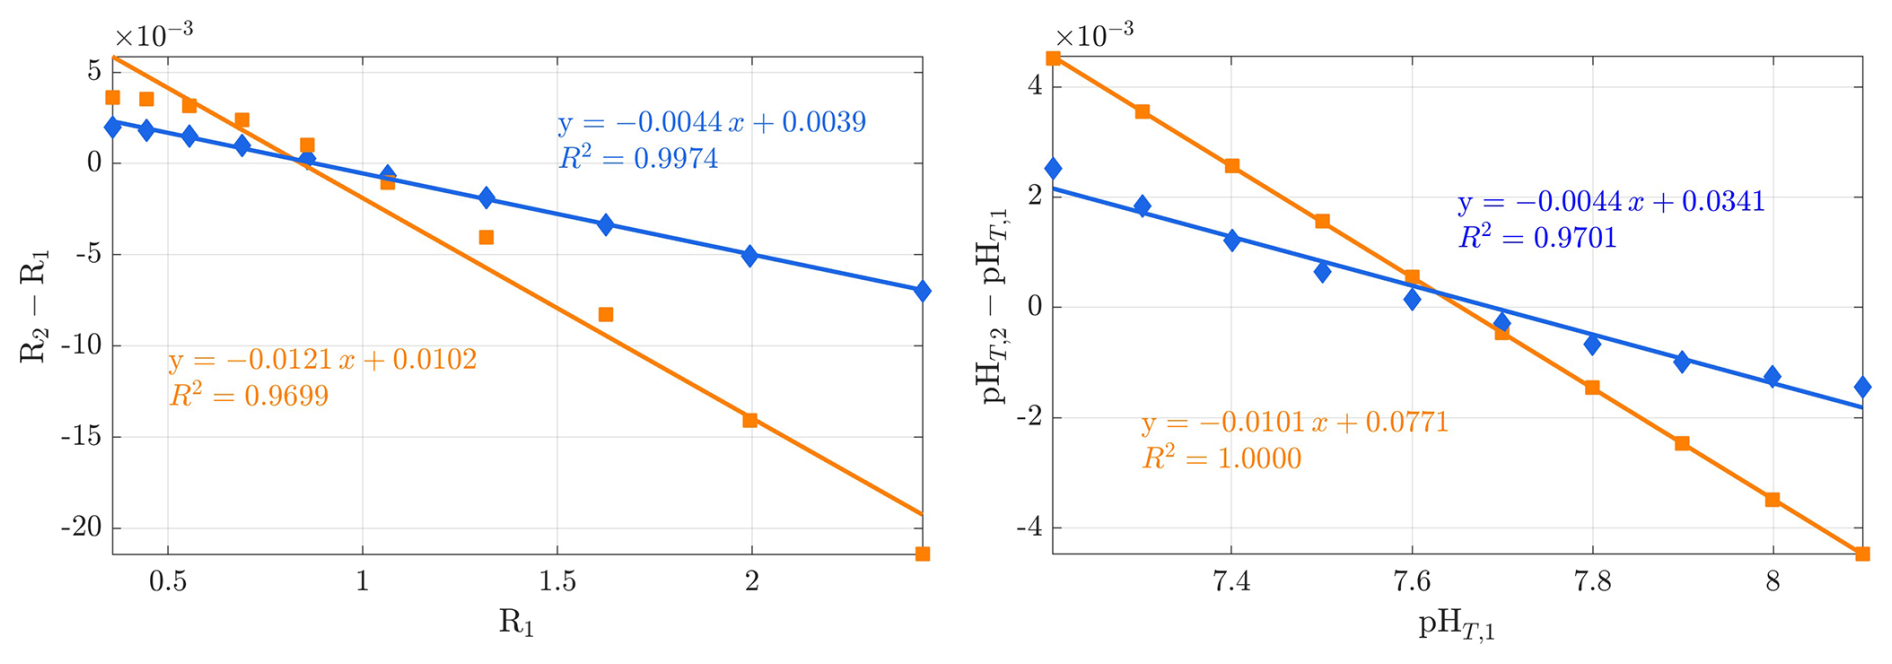
Figure 3Theoretical evaluation of the difference of the impact of mCP dye perturbation on the sample's pHT (S=35; T=25 °C; AT=2300 µmol kg−1), depending on whether the spectrophotometer behaves linearly – i.e., follows the Beer–Lambert law – or not. The left and right panels depict the ΔR-vs-R1 and ΔpHT-vs-pHT,1 relationships, respectively. Blue diamonds represent an ideal, linear spectrophotometer response, derived from the chemical model of Li et al. (2020) based on single and double additions of 50 µL of mCP dye solution ([2 mM]) to a 28 mL sample cell with a 10 cm pathlength (488A=0.242), assuming a pHT of the mCP dye solution of 7.65). Orange squares incorporate an attenuation factor of 0.04 % to simulate a deviation from linearity, thus representing the combined effect of spectrophotometer non-linearity and perturbation in the physico-chemical ionic equilibrium.
The linear regressions of ΔR versus R1 (ΔR-vs-R1) and ΔpHT versus pHT,1 (ΔpHT-vs-pHT,1) obtained for each OVIDE-BOCATS cruise are summarized in Table 1. The slopes for ΔR-vs-R1 range from 0.0048 (BOCATS2-2023 cruise) to 0.0230 (OVIDE-2006 cruise), with the perturbation vanishing (ΔR=0) when , i.e., when the sample pHT closely matches that of the mCP dye solution. Carter et al. (2013) proposed a methodological refinement by normalizing ΔR with the change in absorbances at the isosbestic point (Δ488A; see Sect. 2.2.4), improving the robustness of the correction. Accordingly, using the Carter et al. (2013) approach [ versus R1; -vs-R1] increased the overall explained variability (R2) of the linear fits. Similarly, for ΔpHT-vs-pHT,1 regressions, the smallest slope was recorded for BOCATS2-2021 cruise and the largest again in the OVIDE-2006 cruise (Table 1). When using Δ(pH)-vs-pHT,1, the distribution of regression slopes was similar but less variable (average regression: ; Table 1), consistent with the mCP dye perturbation trends reported by Takeshita et al. (2022) [ΔpH; N=91]. The OVIDE-BOCATS pHT data were corrected using the cruise-specific ΔpH relationships. Overall, the evaluation of the mCP dye's perturbation on the sample's pHT was consistent across all cruises, regardless of whether ΔR- or ΔpHT-based methods were used.
In addition to the impact of the mCP dye addition, both the ΔR and ΔpHT corrections can be influenced by the performance characteristics of the spectrophotometer used (Carter et al., 2013; Álvarez et al., 2020; Takeshita et al., 2021; Fong et al., 2024). If the spectrophotometer follows the Beer–Lambert law (i.e., no optical non-linearity), the effect of the mCP dye addition results in a linear relationship for both ΔR-vs-R1 and ΔpHT-vs-pHT,1 regressions (Li et al., 2020), meaning that the relationships are only affected by chemistry. This only-chemical effect was evaluated by Li et al. (2020) over a wide range of salinities and ATs, including those present during OVIDE-BOCATS cruises, allowing us to replicate their chemical model (blue diamonds in Fig. 3). The ΔR-vs-R1 regression exhibits better linearity than ΔpHT-vs-pHT,1 regression, though both reflect the mCP dye's interference in the physico-chemical ionic equilibrium of the marine carbonate system. However, when introducing a 0.04 % deviation from linearity in the spectrophotometer (i.e., loss of the Beer–Lambert behavior, thus including an additional impact to the chemical effect) the regression slopes for both ΔpHT-vs-pHT,1 and ΔR-vs-R1 roughly double, revealing that this instrumental non-linearity amplifies the chemistry effect of the mCP dye. Notably, while ΔpHT remains linear during this distorsion, ΔR becomes non-linear (orange squares in Fig. 3). When R=1 (i.e., 434A=578A and sample pHT = mCP dye pHT), non-linearity impacts both absorbances equally, resulting in no change in R and therefore in pHT. In contrast, deviations from R=1 (or pHT=7.65; at S=35 and T=25 °C) enhance this artifact due to increasingly unequal absorbances at 434A and 578A, leading to spurious R values and biased pHT.
These results suggest that the ΔpHT-vs-pHT,1 relationship provides a more accurate assessment of the mCP dye's effect on the sample's pHT when the spectrophotometer exhibits even slight deviations from the Beer–Lambert law. Indeed, the small differences between the slopes of the ΔR-vs-R1 and ΔpHT-vs-pHT,1 regressions reported in Table 1 can be attributed to the distinct ways in which pHT and R respond to such nonlinearity. The theoretical slopes of ΔpHT-vs-pHT,1 shown in Fig. 3 are consistent with those derived experimentally (Table 1). The steepest experimental slopes observed during the cruises may reflect greater deviations from the Beer–Lambert law, which can depend on both the spectrophotometer used and the pHT range of the seawater batches used in these assessments. Conversely, cruises with ΔpHT-vs-pHT,1 slopes closer to the chemical model prediction – such as in the 2021 and 2023 cruises – indicate better spectrophotometer performance. Nevertheless, the differences in pHT,corrected when applying either ΔR-vs-R1 or ΔpHT-vs-pHT,1 corrections remain small (<0.001 pHT units; see Fig. S2), implying that the choice of correction method has minimal impact on the final estimation of the mCP dye perturbation. For consistency, OVIDE-BOCATS pHT data were corrected using the ΔpH approach specific to each cruise.
2.2.4 Absorbance at the isosbestic point
During the OVIDE-BOCATS cruises, mCP dye was manually added to samples using an adjustable repeater pipette (see Sect. 2.2.2). For each cruise, volume deviations associated with manual addition were assessed by comparing each sample to the cruise-specific mean 488A, computed from all field-layer samples (∼2000 per cruise). Manual addition resulted in volume deviations exceeding 20 % in approximately 3 % of the samples (∼706 cases), potentially affecting ΔR and ΔpHT determinations. To address variability in the volume of mCP dye solution added, Carter et al. (2013) recommended measuring absorbance at the isosbestic point (488A), which provides a reliable proxy for actual mCP dye concentration in the sample cell. Accurate quantification of the mCP dye concentration is particularly important when applying the DB'17 methodology for impurity correction, since the 434Aimp value is directly proportional to the mCP dye content. Therefore, sample-specific estimates of mCP dye concentration via 488A allow for a more precise estimate of the 434Aimp value.
Since 2018, OVIDE-BOCATS cruises have incorporated measurements at 488A following the recommendation by Carter et al. (2013). The additions of 75 µL of 2 mM mCP dye solution to 28 mL seawater sample resulted in averaged 488A values of 0.359±0.027 (N=2193), 0.358±0.027 (N=2154), and 0.377±0.032 (N=2342) during the 2018, 2021, and 2023 cruises, respectively. These averages were not statistically different from one another, resulting in a 488A mean value of 0.370±0.033 for the period 2018–2023. This 488A mean value was used to derive a parameterization for estimating 488A from R values, fitted for an mCP dye concentration in the cell of 5.36 µM – particularly useful for pre-2018 cruises, where 488A was not measured. For these earlier cruises, 488A was estimated using the following parameterization:
This fit, based on 6910 samples from the 2018, 2021, and 2023 cruises (Fig. S3), explained 98.9 % of the variance (R2=0.989) and reproduces 488A with a mean error of 0.002±0.010. It enabled a more accurate estimation of mCP dye concentrations across all cruises and improved the assessment of mCP dye impurity effects on 434A (see Sect. 3.4). Additionally, it enhanced the accuracy of mCP dye perturbation corrections using A and ΔpH (Table 1). A simplified parameterization using 434A (e.g., for 3.3 µM mCP dye concentration in the sample cell) is possible, but requires correction for 434Aimp.
2.2.5 pHT measurement repeatability
Throughout the 11 OVIDE-BOCATS cruises, a total of 502 duplicate samples were collected to evaluate the reproducibility of pHT measurements using an unpurified mCP dye. At selected stations, two Niskin bottles were closed at the same depth to obtain replicates. Any uncertainty introduced by collecting duplicates on two different Niskin bottles (e.g., small leaks, biological activity, or delay in closing) was neglected. Figure 4 displays the absolute pHT differences between replicates for each cruise. The overall mean and standard deviation of these differences is 0.0014±0.0015 pHT units (N=502). The highest reproducibility was obtained in 2021, with 92 duplicate samples yielding a mean difference of 0.0007±0.0010 pHT units. This improved reproducibility, particularly evident during the two most recent cruises, coincides with more precise evaluations of mCP dye effects (Table 1) and likely reflects the better performance of the spectrophotometer used (PerkinElmer Lambda 800; Table 1), contributing to the overall improvement in data quality. Typical reproducibility across OVIDE-BOCATS cruises ranged between 0.0007 and 0.0018 pHT units.
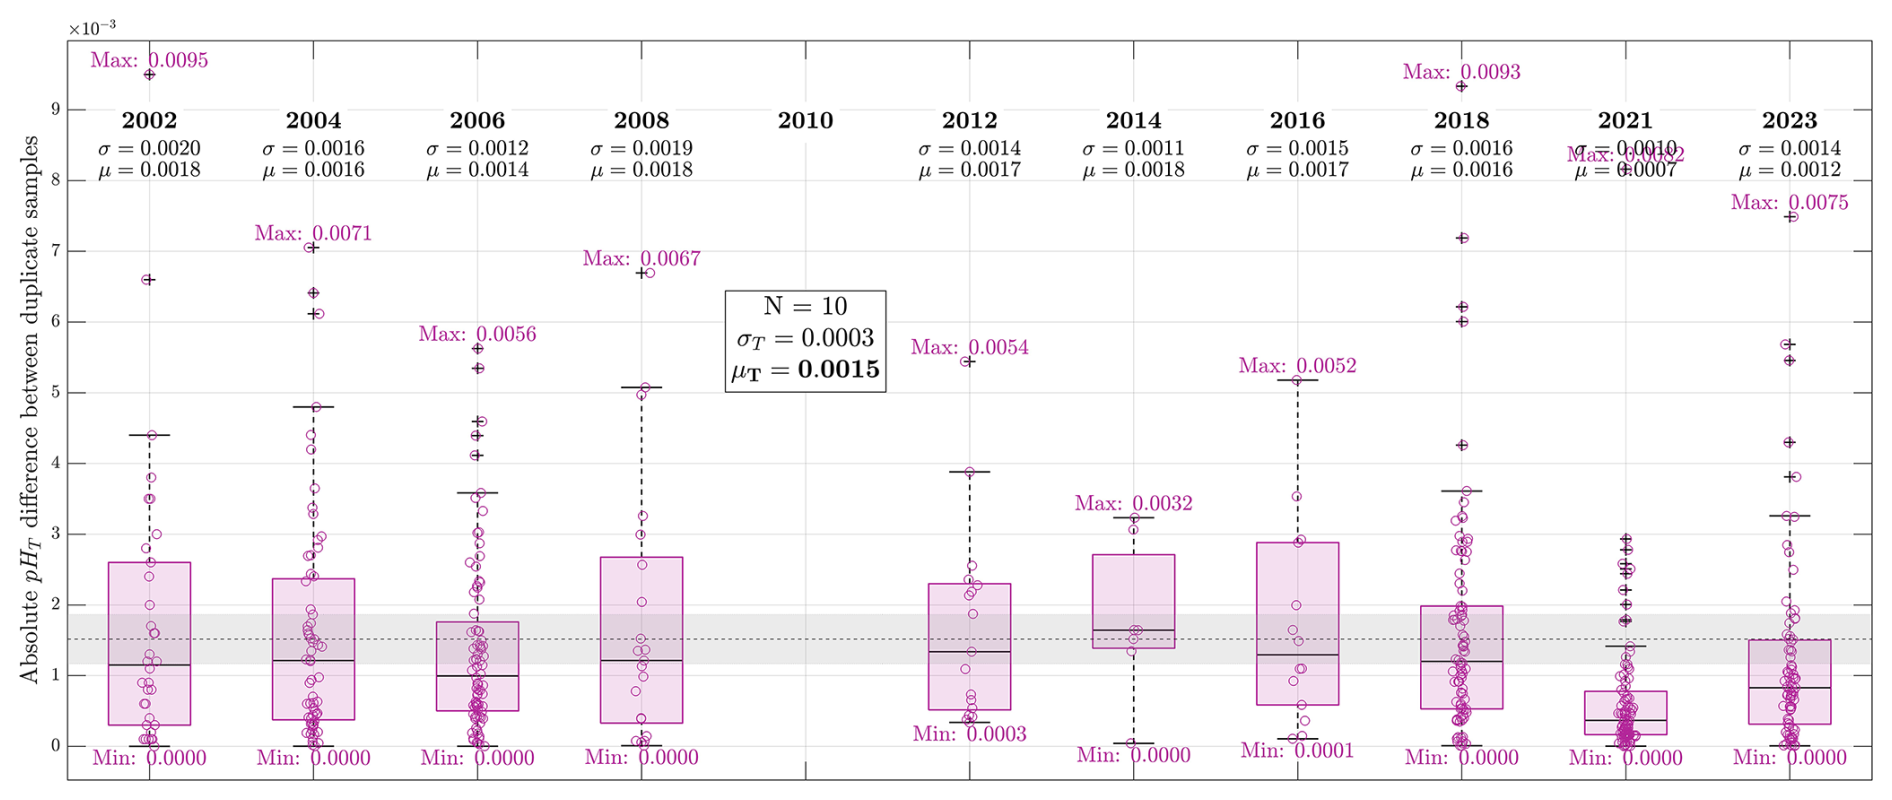
Figure 4Whisker boxplots showing pHT repeatability across OVIDE-BOCATS cruises (2002–2023), represented as the absolute difference between duplicate samples collected during each cruise. The number of duplicate samples analyzed per cruise were: 34 (2002), 64 (2004), 84 (2006), 21 (2008), 0 (2010), 17 (2012), 7 (2014), 14 (2016), 90 (2018), 92 (2021), and 79 (2023). For each cruise, the subset mean (μ) and standard deviation (σ) are indicated, as well as the minimum and maximum values. The overall mean (μT) and standard deviation (σT) across all 10 cruises are shown in the inset textbox. μT is also plotted as a horizontal dashed line, with σT represented as a shaded gray band. Each boxplot displays the median (horizontal line), first (Q1) and third (Q3) quartiles (box edges), and the minimum and maximum within 1.5 times the interquartile range () (whiskers).
During the OVIDE-2018, BOCATS2-2021, and BOCATS2-2023 cruises, paired measurements were performed in duplicate samples collected from the same Niskin bottle and measured using two types of mCP dye: (i) purified mCP, provided by Dr. Byrne's laboratory, University of South Florida, USA (FB6 batch), and (ii) unpurified mCP, commercially available from Sigma-Aldrich (Cat. No. 211761-5G, batch #07005HH). pHT values were obtained applying the L'11 parametrization to R values obtained with purified mCP dye, and the CB'93 parametrization combined with the DVD'98 correction (CB'93 + DVD'98 hereafter) to R values obtained with unpurified mCP dye.
3.1 TRIS buffer validation
TRIS buffers in synthetic seawater (batch numbers 30 and 40) were obtained from Prof. Dickson's laboratory (Scripps Institution of Oceanography; USA). These buffers were supplied in 125 mL borosilicate glass bottles and contained an equimolar mixture of TRIS/TRIS-HCl in a synthetic seawater of nominal salinity 35. The reference pHT values of these batches can be calculated following DVD'98. Multiple bottles from both batches were measured during the BOCATS2-2021 and BOCATS2-2023 cruises using two mCP dye solutions: (i) unpurified mCP (75 µL of 2 mM solution; Sigma-Aldrich; 5.36 µM final mCP dye concentration in the sample cell), and (ii) purified mCP (10 µL of 11 mM solution; provided by Prof. R. Byrne's laboratory; 3.93 µM final mCP dye concentration in the sample cell).
Each buffer sample was measured in quadruplicate. Following blank measurement, the sample was placed in the spectrophotometer's thermostated cell holder and allowed to equilibrate for 10–15 min. Measurements were then conducted at 3-minute intervals. To ensure full thermal stabilization, only the last two measurements out of the four were retained for analysis. Temperature at the end of the fourth measurement was recorded using a calibrated Physics 100-1 thermometer, with an uncertainty of ±0.01 °C.
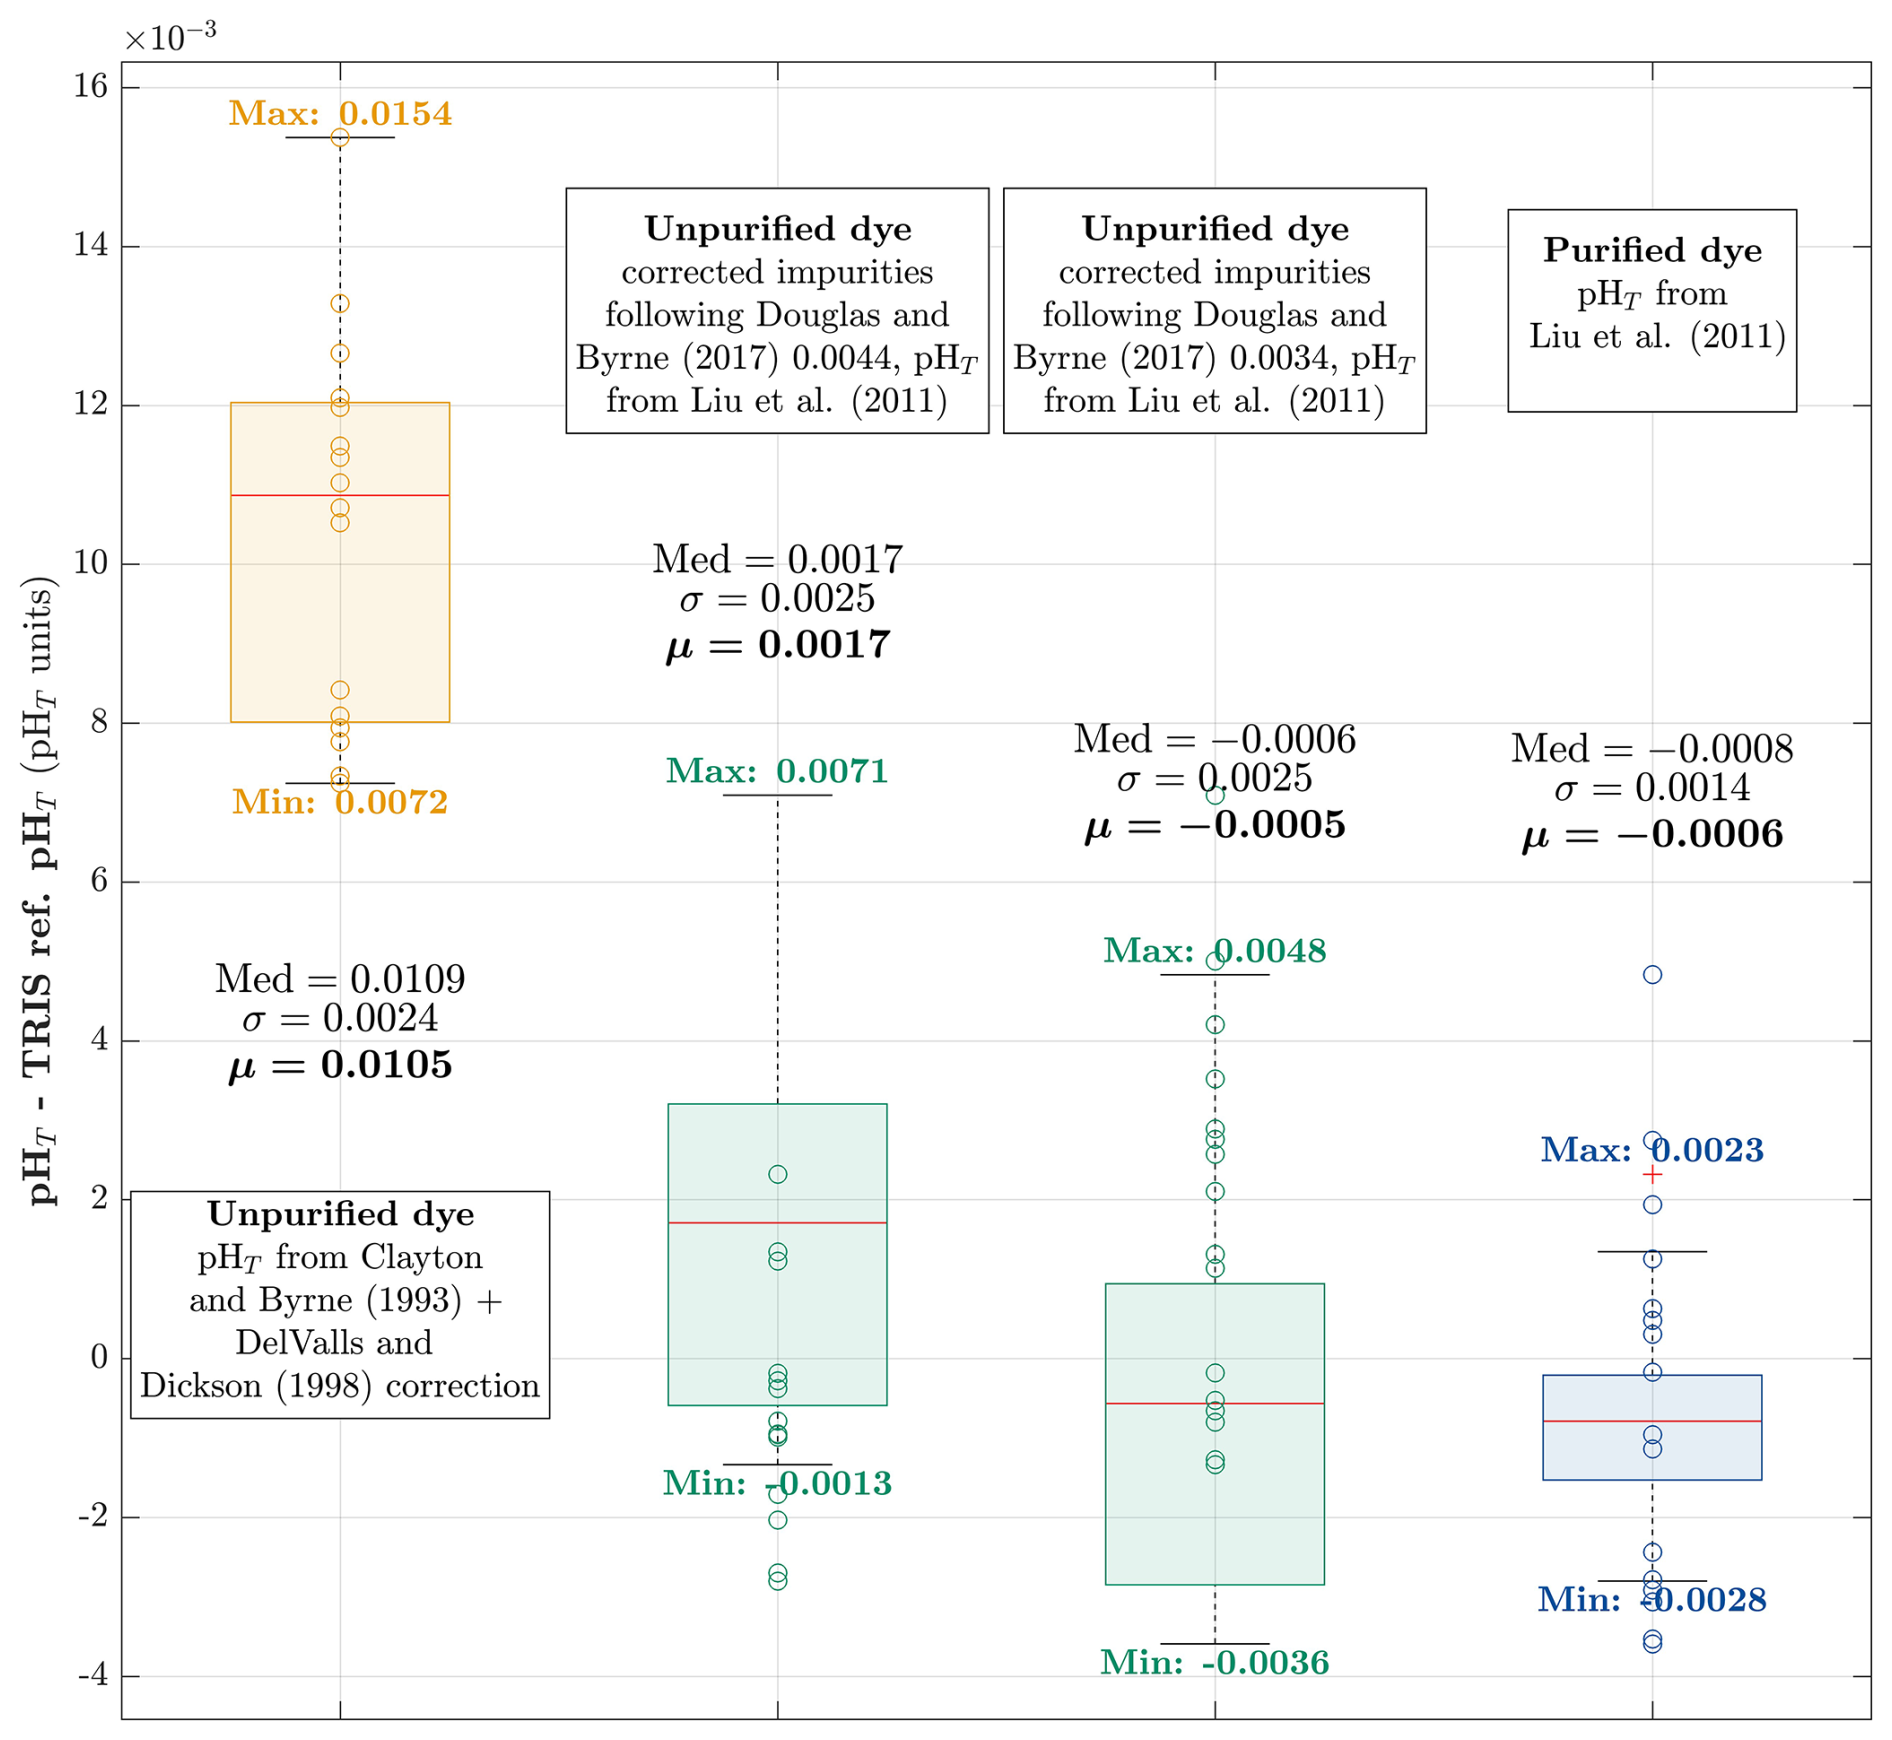
Figure 5Whisker boxplots of pHT differences relative to TRIS buffer reference values, comparing results obtained using purified and unpurified mCP dyes. Each boxplot represents a different calculation approach: the orange boxplot shows pHT computed using unpurified mCP dye with the CB'93 parameterization and DVD'98 correction (N=16); the blue boxplot shows pHT computed using purified mCP dye with the L'11 parameterization (N=15); and green boxplots show pHT computed using unpurified mCP dye corrected for impurities using the DB'17 methodology with 434Aimp=0.0044 and 434Aimp=0.0034 absorbance units, respectively, and pHT then calculated using the L'11 parameterization. Within each boxplot, the red line indicates the median (Med), the box edges denote the first and third quartiles, and whiskers extend to data points within 1.5 times the interquartile range. Mean (μ) and standard deviation (σ) values are provided for each subset, and the minimum and maximum values are indicated.
A total of 16 measurements performed using Sigma-Aldrich unpurified mCP dye, following the OVIDE-BOCATS protocol (CB'93 + DVD'98; see Sect. 2.2.2), showed a consistent positive bias of 0.0105±0.0013 pHT units relative to the nominal TRIS pHT values (Fig. 5). In contrast, 15 measurements conducted with the purified mCP dye, applying the L'11 parameterization, yielded values that were tightly centered around the nominal TRIS pHT values, with a negligible bias of pHT units. No ΔR or ΔpHT corrections were applied to either dataset, as the buffer capacity of TRIS is approximately 20 times higher than that of seawater, rendering the impact of the mCP dye addition on pHT negligible.
The correction of 434Aimp due to mCP dye impurities, as proposed by DB'17, was evaluated using a value of 434Aimp=0.004413 absorbance units (given in their Table 2 of DB'17 for Sigma-Aldrich lot #11517KC at a mCP dye concentration of 3.3 µM in the seawater sample). Applying this correction enabled the use of the L'11 parameterization, substantially reducing the observed difference with purified mCP dye measurements to 0.0020±0.0013 pHT units. Recognizing that impurities can vary between batches of the same mCP dye brand, a second test using 434Aimp=0.0034 absorbance units, consistent with that obtained by Álvarez et al. (2025), further reduced the offset to pHT units.
3.2 Duplicate measurements of natural seawater
During the 2021 cruise, six duplicate pHT samples were collected at each hydrographic station along the OVIDE-BOCATS transect, with sampling points carefully distributed throughout the water column to represent different water masses. In addition to the routine pHT determinations conducted according to the OVIDE-BOCATS protocol (i.e., addition of 75 µL of Sigma-Aldrich [2 mM] mCP dye solution and pHT computed using CB'93 + DVD'98; see Sect. 2.2.2), these six replicate samples per profile were also measured using purified mCP dye (10 µL of [11 mM] mCP dye supplied by Dr. Byrne's laboratory, and pHT determined using the L'11 parameterization).
These duplicate measurements encompassed the full pHT range typically observed during OVIDE-BOCATS cruises (7.7 to 8.0 pHT units). As shown in Fig. 6, the standard OVIDE-BOCATS procedure yields pHT values that are, on average, 0.0113±0.0017 (N=176) pHT units higher than those obtained using the purified mCP dye and the L'11 parameterization. These results align with the findings from the TRIS buffer experiments (see Sect. 3.1). The differences between the two methods showed no significant dependence on pHT (Fig. 7, green dots), in agreement with the theoretical expectation illustrated in Fig. 2 (blue line, Aldrich-3.4).
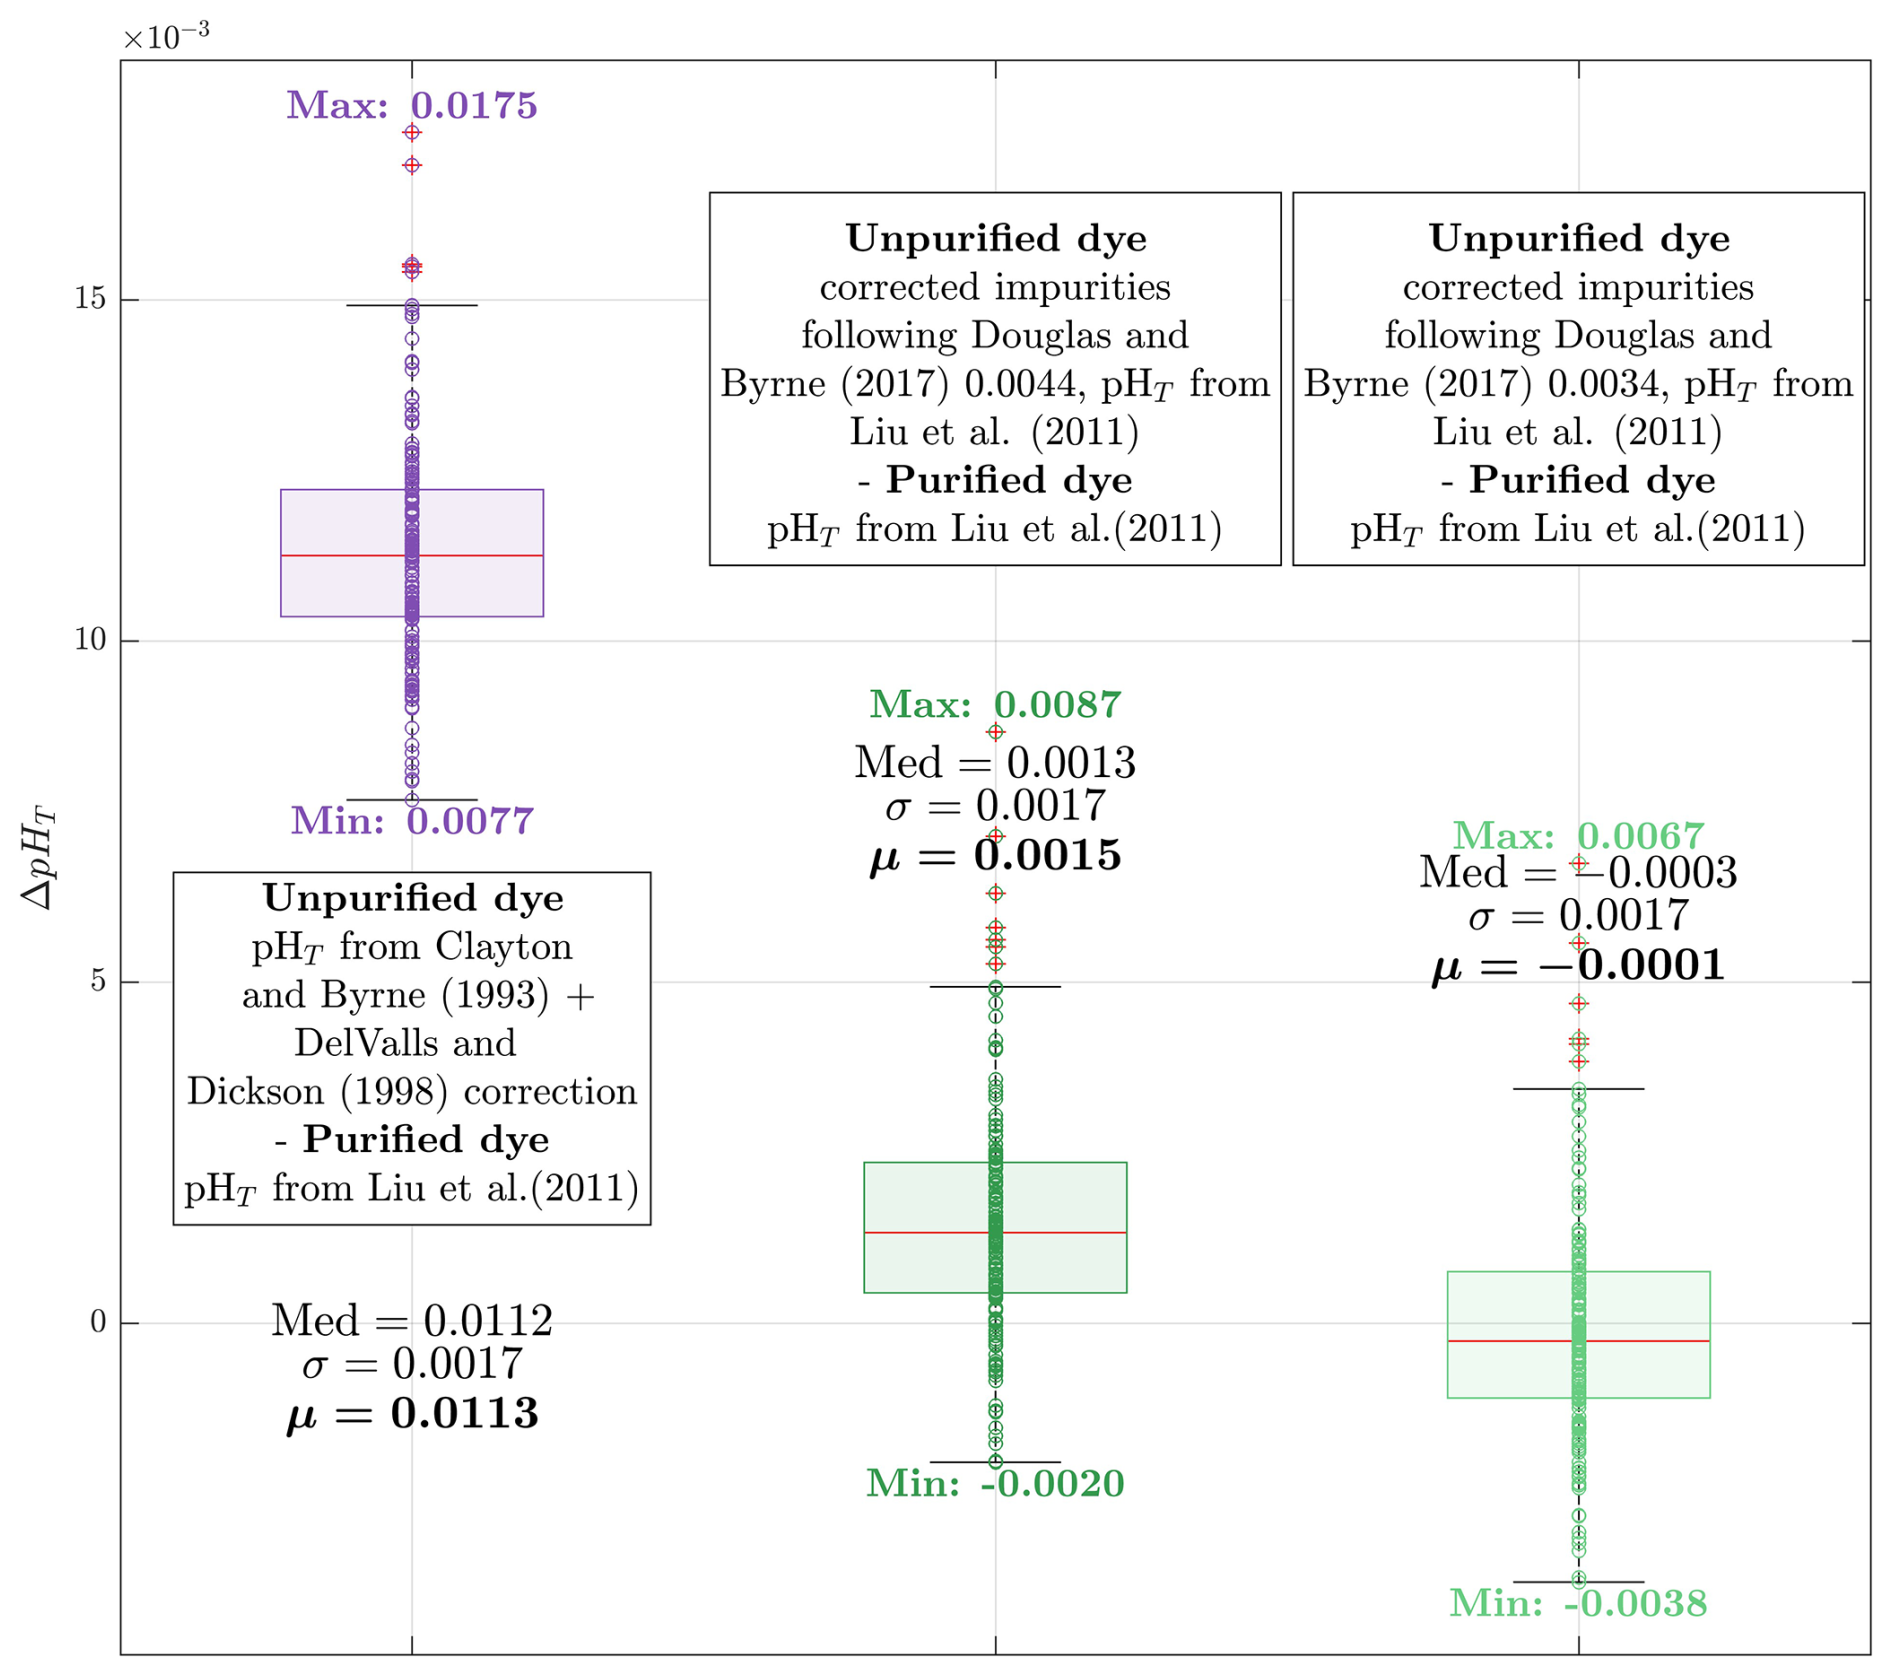
Figure 6Whisker boxplots showing pHT differences between duplicate samples measured using purified and unpurified mCP dyes (N=176). Med indicates the median (red line inside each box), σ the standard deviation, and μ the mean of each subset. The minimum and maximum values are also indicated. The first boxplot (purple) shows the pHT difference between measurements using unpurified mCP dye (pHT calculated with CB'93 + DVD'98) and purified mCP dye (pHT calculated with L'11 parametrization). The second boxplot (first green) shows differences after applying the DB'17 correction to R values obtained with unpurified mCP dye, using 434Aimp=0.0044 absorbance units, followed by pHT computation with L'11 parametrization. The third boxplot (second green) applies the same procedure but with 434Aimp=0.0034 absorbance units.
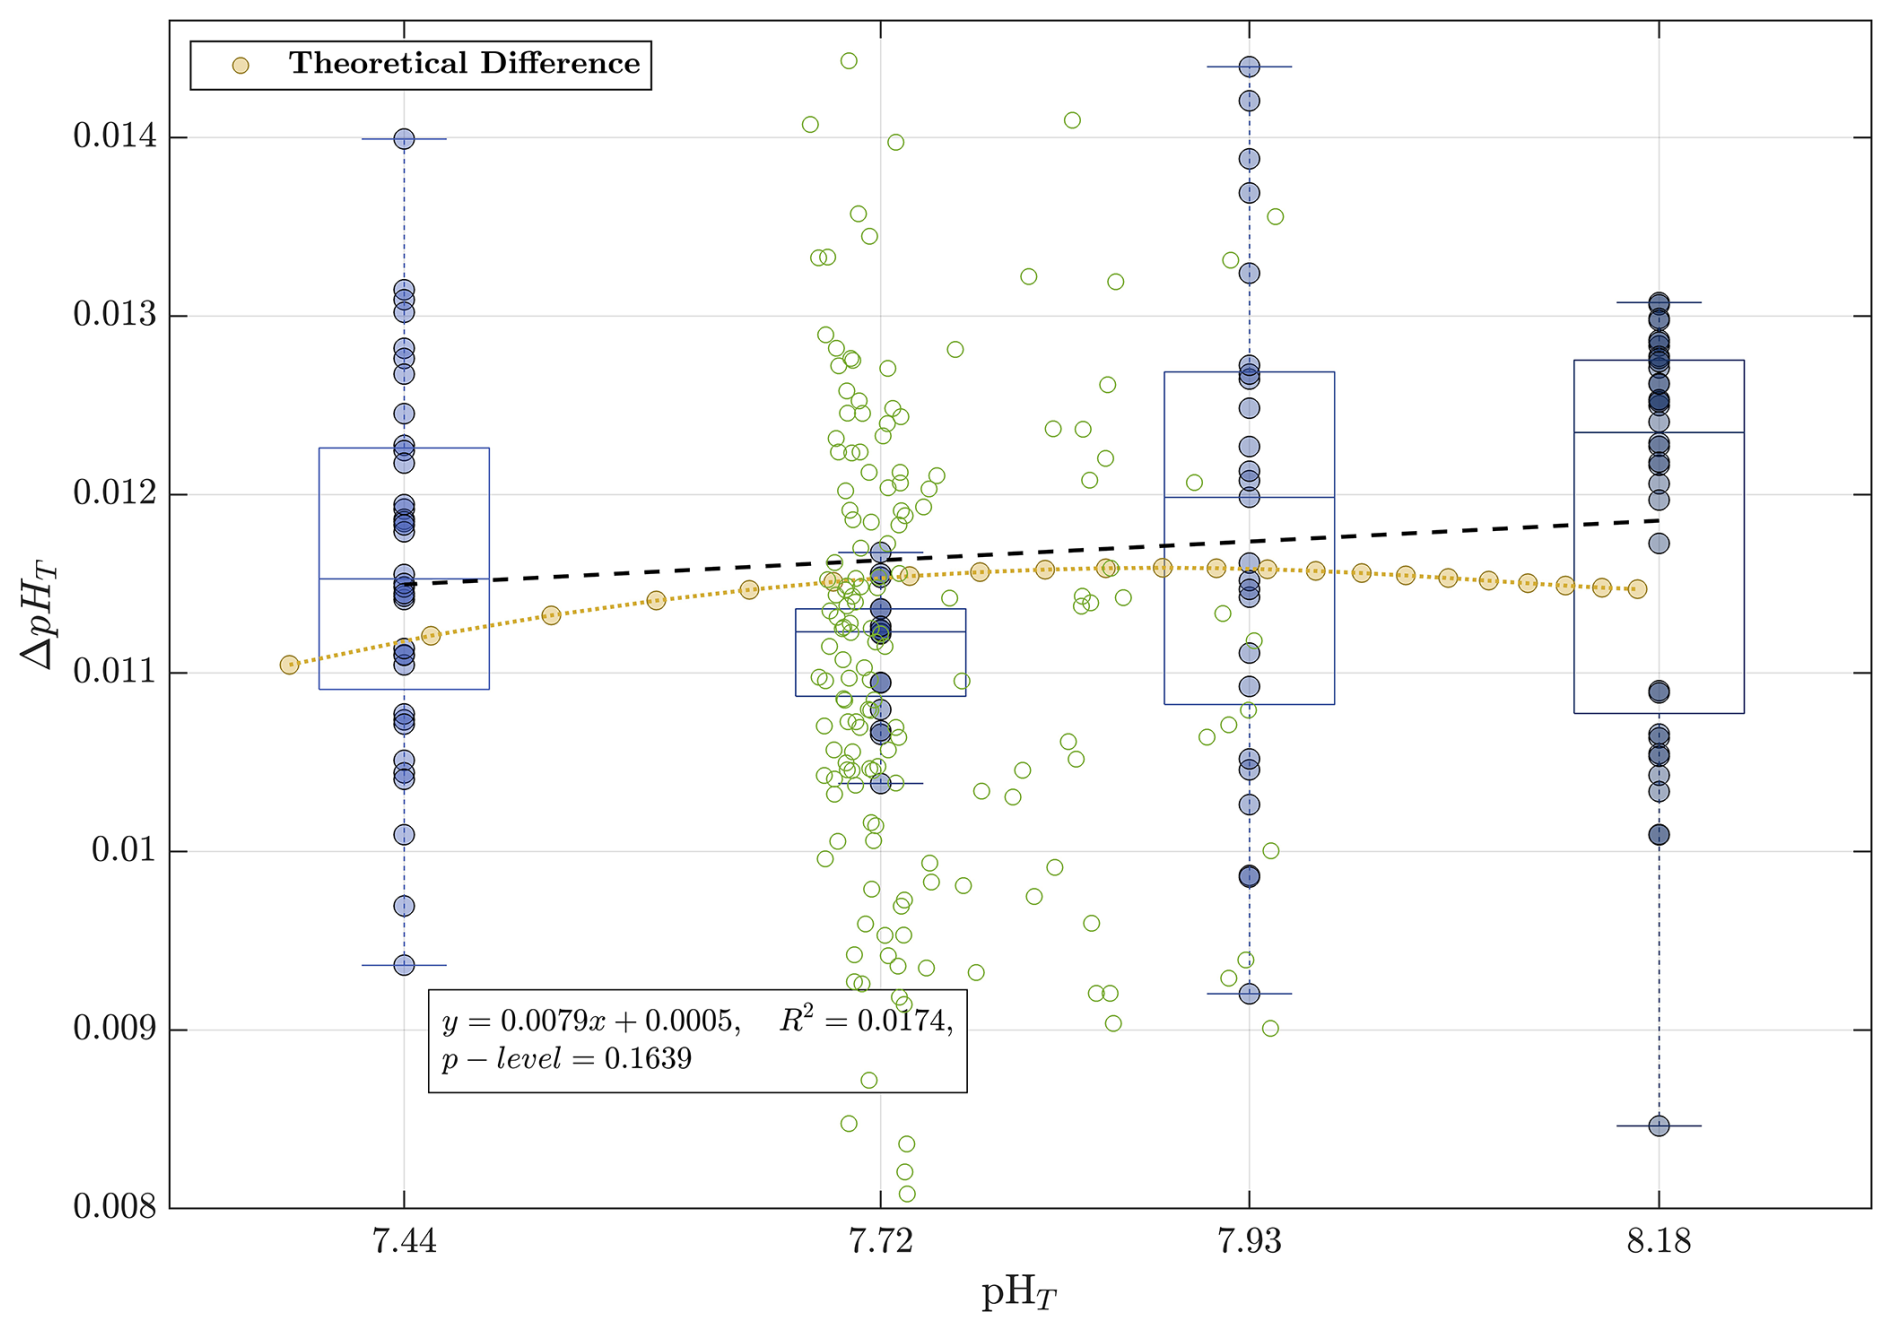
Figure 7Differences in pHT measurements between replicate samples measured using unpurified mCP dye (CB'93 + DVD'98) and purified mCP dye (L'11 parameterization) across four pHT levels obtained from modified seawater experiments. The black dashed line shows the linear regression of the differences as a function of pHT, with regression statistics summarized in the inset box. The yellow line represents the expected pHT differences assuming a 434Aimp value of 0.034 absorbance units, as modeled in Fig. 2. Green dots correspond to the 176 individual pHT differences presented in the first (purple) boxplot of Fig. 6.
When the DB'17 methodology was applied using a 434Aimp value of 0.004413 absorbance units at 488A=0.225, the offset was reduced to 0.0015±0.0017 pHT units – statistically indistinguishable from zero. Using a 434Aimp value of 0.0034 absorbance units further minimized the offset to pHT units, corroborating the impurity correction results from the TRIS buffer experiment. The individual 434Aimp values applied here are proportionally dependent on the 488A in each measurement.
3.3 Duplicate measurements of modified seawater
During the OVIDE-2018 cruise, surface seawater with a salinity of 35.7 was treated using HCl or Na2CO3 to produce four distinct pHT levels (7.45, 7.70, 7.95, and 8.19). These were stored in separate Niskin bottles and sampled using the same protocol as for natural seawater. For each batch, four to six samples were analyzed for pHT using the standard OVIDE-BOCATS procedure (CB'93 + DVD'98 and 75 µL of unpurified Sigma-Aldrich mCP dye [2 mM] solution added to the cell; 5.36 µM final mCP dye concentration in the sample cell), and an equivalent number was measured using purified mCP dye (75 µL of mCP dye [2.5 mM] solution added to the cell; 6.70 µM final mCP dye concentration in the sample cell; FB5-2017 from Dr. Byrne's laboratory and the L'11 parametrization). This experiment extends the comparison conducted with TRIS buffer and natural seawater to a wider pHT range, representative of conditions encountered in the South Atlantic and Pacific Oceans.
The mean pHT offset between the two methods (measuring with unpurified mCP dye and applying CB'93 + DVD'98 versus purified mCP dye and applying the L'11 parameterization) across 22 measurements was 0.0109±0.0011 pHT units, consistent with previous results from TRIS and natural seawater duplicate samples (Sect. 3.1 and 3.2). No significant trend was observed across the pHT range (Fig. 7, regression p-level > 0.05). Similarly, differences observed in natural seawater (green dots in Fig. 7) also showed no significant correlation with pHT (slope = ; p-level > 0.05). Furthermore, the magnitude and behavior of the observed differences are consistent with theoretical expectations (Fig. 2, yellow line), assuming a 434Aimp value of 0.0034 absorbance units for Sigma-Aldrich mCP dye at a final concentration in the cell of 3.3 µM (as per Table 2 of DB'17).
3.4 pHT correction
DB'17 proposed a value of 434Aimp=0.004413 absorbance units for a Sigma-Aldrich mCP dye at a final concentration of 3.3 µM in the sample cell (488A=0.225; Takeshita et al., 2021). Based on our experimental results, we found that a better fit under our conditions corresponded to a 434Aimp value of 0.0034 absorbance units, which is reasonable given that we are working with a different lot of mCP dye. Given that 434Aimp is proportional to 488A, which in turn reflects the final mCP dye concentration in the cell, we derived the following relationship:
Accordingly, the impurity correction was applied to each sample by subtracting the computed 434Aimp (Eq. 8) from the sample measured 434A, yielding:
where 434Acorr,pur is the corrected 434A, and Rcorr,pur corresponds to the R value as if measured with a purified mCP dye. Subsequently, pHT was recalculated using the L'11 parameterization.
Implementing this correction required a comprehensive recovery and reassessment of historical 434A, 578A, and 488A values dating back to the 2002 cruise. Note that for data prior to 2018, 488A values were estimated from Eq. (7). While corrections related to the mCP dye addition effect were included in the data published in GLODAPv2.2023 (Lauvset et al., 2024), the 488A-based correction described in Sect. 2.2.3 had not yet been incorporated. Final pHT values included in this work were computed from the corrected absorbance data, using the recalculated Rcorr,pur, along with the updated mCP dye perturbation correction Δ(pH)-vs-pHT,1.
4.1 Database product
We present a new database comprising 23 843 seawater samples with spectrophotometric pHT values, each accompanied by complete spatiotemporal metadata – including latitude, longitude, pressure, depth, date, and time – as well as in situ measurements of temperature, salinity, and dissolved oxygen. Dissolved oxygen concentrations were primarily determined using the Winkler titration method; where unavailable or deemed unreliable, values from a calibrated oxygen sensor mounted on the Conductivity, Temperature, and Depth (CTD) instrument were used. The dataset incorporates a quality flagging scheme consistent with GLODAPv2 recommendations (Key et al., 2015; Olsen et al., 2016), where flag 2 denotes good data (23 773 samples), 3 (19 samples) and 4 (51 samples) indicate questionable and bad data, respectively, and 9 denotes not measured.
Spectrophotometric pHT data collected between 2002 and 2018, available in the GLODAPv2.2023 release (Lauvset et al., 2024), were computed using the CB'93 parameterization with the DVD'98 correction (+0.0047 pHT units). The newly compiled pHT dataset presented here updates and corrects these data following the procedure presented in Sect. 3.4, applying the DB'17 adjustment and L'11 equation. In addition, the dataset significantly extends the temporal coverage by including pHT measurements from the 2021 and 2023 cruises, which were not previously available; these measurements are also corrected using the same procedure, resulting in a consistent final product across all cruises. In addition, for the first time, associated absorbance readings (434A, 578A, and 488A) are provided alongside pHT values. This comprehensive and corrected pHT dataset provides a robust foundation for future reassessments, such as the application of updated absorbance-to-pHT parameterizations or transformations to alternative pH scales (e.g., the “free” hydrogen ion scale).
4.2 Consistency of the pHT correction
The differences between the former-procedure – applying the CB'93 parameterization with the DVD'98 correction to R values derived from unpurified mCP dye – and the updated method presented here – applying the L'11 parameterization to R values derived from unpurified mCP dye corrected for the impurity effect (see Sect. 3.4) – are, on average, (1σ) pHT units (N=23 843; Fig. S4), in line with results from the assessment experiments described in Sect. 3. These differences show a slight negative correlation with pHT, with smaller offsets observed at higher pHT values (Fig. S4). The slopes of the linear regressions of these differences versus pHT range from to 0.0005±0.0001 pHT units. It should be noted that this range is comparable in magnitude to other uncertainty sources – such as the effect of the addition of mCP dye to the sample pHT, and the instrumental measurement uncertainty (e.g., Sect. 2.2.3) – which may contribute to the overall variability in the observed differences.
To assess the internal consistency and long-term comparability of the corrected pHT values, we examined the deep layer of the Iberian Basin, associated with the North East Atlantic Deep Water (NEADW). This layer has been recognized as a stable reference for the OVIDE-BOCATS program, as its properties show minimal long-term variability (García-Ibáñez et al., 2016). Supporting this minimal variability, Steinfeldt et al. (2024) reported no detectable accumulation of anthropogenic CO2 in this layer based on chlorofluorocarbons measurements.
The average pHT in the NEADW layer over 11 cruises (2002–2023) was 7.7314±0.0015 (1 standard deviation; 1σ), with only two cruises (2008 and 2018) exceeding the mean by more than 1 standard deviation (Fig. 8). The standard deviation within individual cruises was generally low (<0.0018 pHT units), with the exception of the 2004 cruise (0.0022 pHT units). Additionally, the cruise-specific mean pHT values showed no correlation with the difference between the old and new pHT values (Fig. S5). These findings reinforce the reliability of the applied correction for the effects of impurities in the Sigma-Aldrich mCP dye (Sect. 3.4), based on a 434Aimp value of 0.0034±0.0010 absorbance units for 488A=0.225.
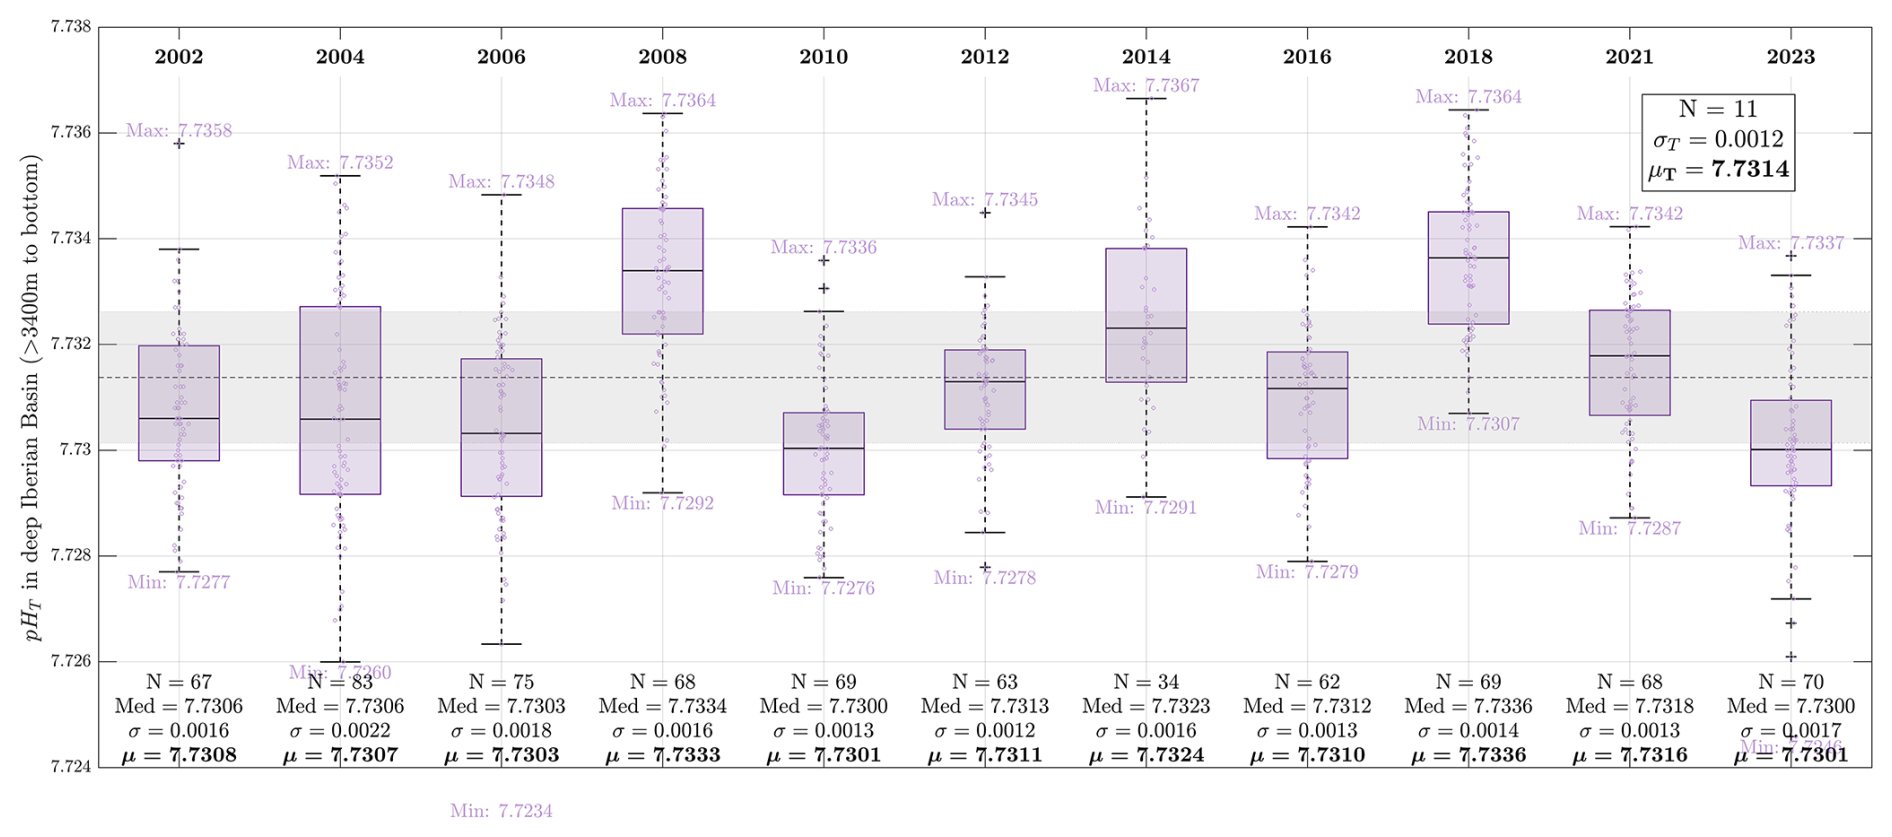
Figure 8Variability of pHT in the lower NEADW (deep Iberian Basin, observations > 3400 m and east of 15.45° W) during the 11 OVIDE-BOCATS cruises. These data are used to assess the internal consistency of pHT measurements over time. N refers to the number of samples analyzed in each cruise; Med indicates the median pHT of each subset (shown as a black line within each boxplot); σ is the standard deviation; and μ is the mean. Minimum and maximum values are also shown for each cruise. The overall mean (μT; dashed horizontal line) and standard deviation σT; shaded gray band) across all 11 cruises are provided in the upper-right inset.
However, it is important to acknowledge a limitation: the 434Aimp value was not directly determined for each individual batch of mCP dye, as recommended by DB'17. In practice, this is challenging – especially for older cruises – since the specific mCP dye batches may no longer be available. While Sigma-Aldrich mCP dye batches have been shown to have a narrow impurity range (typically >90 % purity; Álvarez et al., 2025), variations between batches still exist. Thus, assuming a single correction value (434Aimp=0.0034) across all cruises could be questioned. We conservatively estimate an absorbance uncertainty of ±0.001 due to batch variability, which translates to an uncertainty of approximately ±0.002 pHT units. The estimate is consistent with the inter-cruise variability observed (Fig. 8), supporting the use of 434Aimp=0.0034 as a reasonable and robust correction value for the entire OVIDE-BOCATS dataset.
4.3 Implications of the pHT correction on OA and aragonite saturation horizon
The correction applied to our pHT dataset – an approximately constant offset across cruises – has negligible implications for previously reported OA rates by García-Ibáñez et al. (2016) and Fontela et al. (2020a). However, it does affect the calculation of the aragonite saturation, particularly the saturation horizon depth estimated by Pérez et al. (2018) and García-Ibáñez et al. (2021). To assess this impact, aragonite saturation horizons were recalculated using in situ temperature, salinity, AT, and pHT values, both before and after correcting for 434Aimp (see Sect. 3.4), using the carbonate chemistry constants from Lueker et al. (2000) and the boron formulation of Lee et al. (2010).
This reevaluation reveals a more pronounced reduction in aragonite saturation at the surface (from −0.040 to −0.065), relative to pre-industrial conditions, which progressively diminishes with depth, reaching changes of −0.016 near the seafloor. Although changes at depth appear small in absolute terms, the weak vertical gradient in aragonite saturation in deeper layers translates into a significant vertical shift in the saturation horizon – rising by approximately 120 to 200 m. Based on the reproducibility of the doubloons (Sect. 2.2.5) and the standard deviation of the mean pHT in the NEADW layer over 11 cruises (Sect. 4.2), the uncertainty in the saturation-depth change is estimated at 17 m, while the uncertainty in the aragonite saturation state is 0.0033 units. For instance, in the NA subpolar gyre, where the aragonite saturation horizon currently resides near 2700 m depth, the revised (lower) pHT values shift it upward by approximately 150 m. This shift implies that vulnerable cold-water coral ecosystems may be exposed to undersaturation conditions in shallower and more extensive regions than previously estimated. This reassessment underscores the importance of accurate pHT determinations: even subtle biases can propagate into substantial differences in projected impacts on sensitive deep-sea habitats.
To investigate the spatial and temporal evolution of pHT along the OVIDE-BOCATS section, observations from the new OVIDE-BOCATS database were interpolated onto a common 7 km × 1 dbar grid. Each cruise's station positions were projected onto the grid by identifying the closest grid node (minimum distance), followed by linear interpolations using a Delaunay Triangulation approach (Amidror, 2002). This method ensured optimal station overlap while preserving dataset consistency across years.
Figure 9 displays the pHT distributions from the 11 cruises (2002–2023), along with the overall mean distribution. Surface waters show the highest pHT values, particularly along the eastern boundary, where elevated temperatures (not shown) partly contribute to the increase. Minimum pHT values generally occur in intermediate waters (∼500–1500 m), except in the Iberian Basin, where the presence of Mediterranean Water – characterized by a warm, saline core at ∼1000 m – causes a downward shift of the pHT minimum to ∼2000 m.
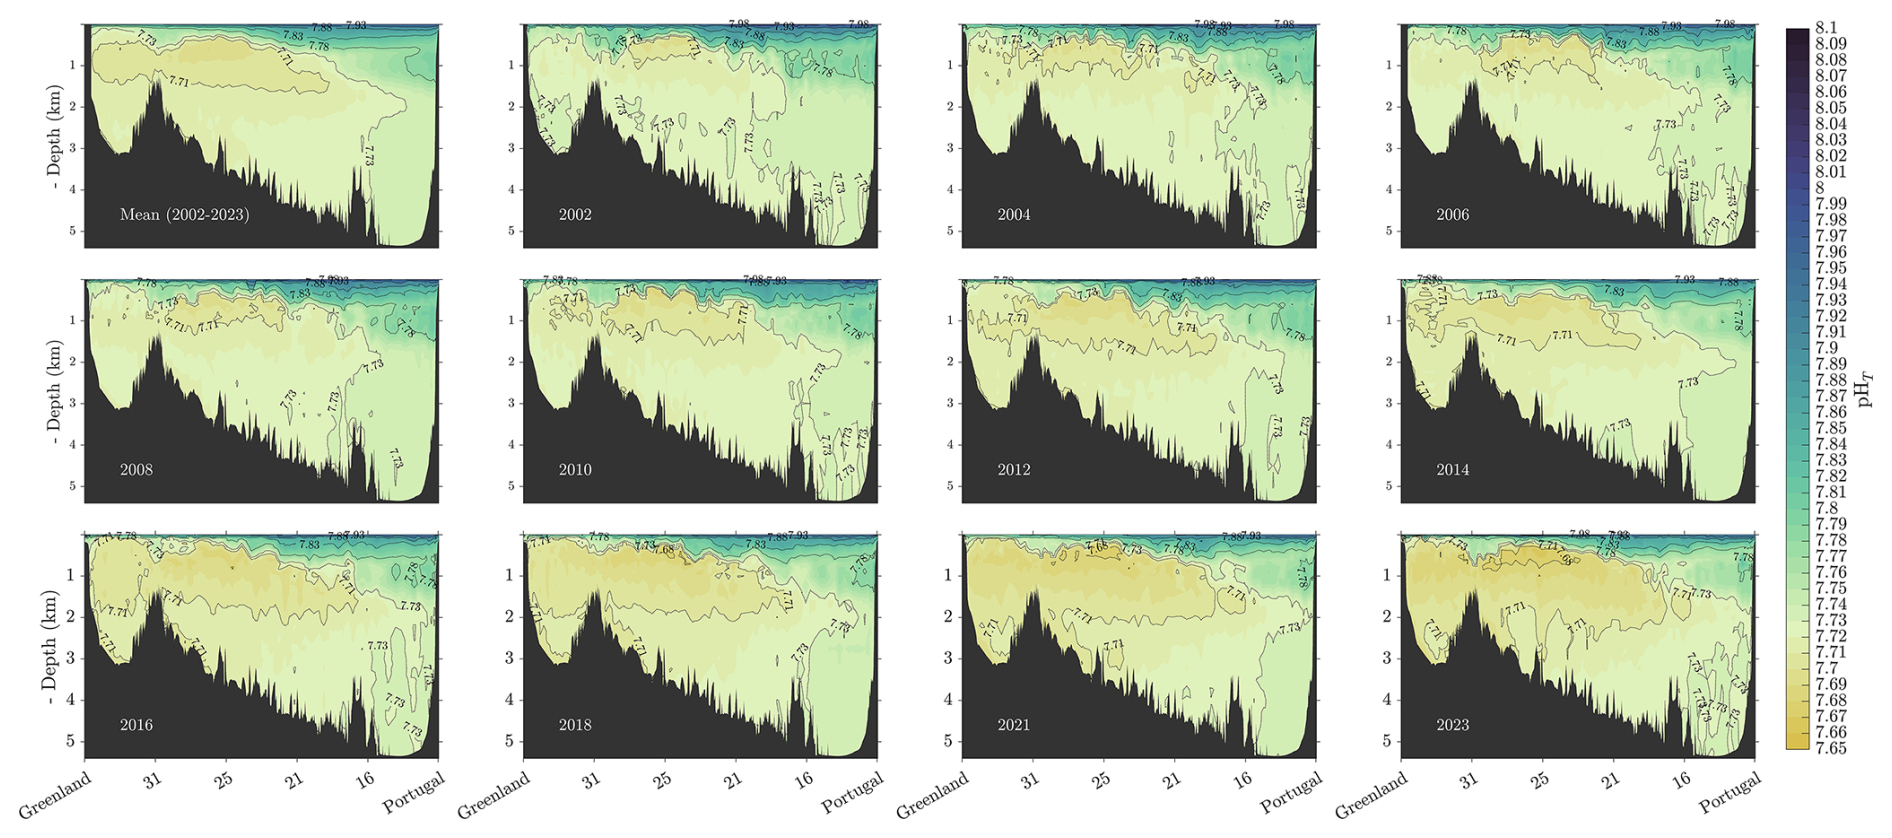
Figure 9Distribution of pHT normalized to 25 °C and 1 atm along the OVIDE-BOCATS section (Fig. 1) for each cruise from 2002 to 2023, as well as the overall mean of all 11 OVIDE-BOCATS cruises. The section is plotted with longitudes (° W) in the x axis.
Notably, a persistent pHT minimum appears in the Iceland Basin between 500 and 1000 m, associated with intermediate waters with high Apparent Oxygen Utilization (AOU; Fig. S6a; Lauvset et al., 2020). This layer, influenced by older water masses transported by the North Atlantic Current (NAC) and exhibiting elevated remineralization rates (de la Paz et al., 2017), has shown significant spatial expansion over time. Since 2016, waters with pHT below 7.71 have progressively expanded eastward, deepening toward ∼2000 m and reaching the Azores-Biscay Ridge (see Fig. 1 for georeference). In addition, the low-pHT layer has spread into the Irminger Basin since 2010.
In the Irminger Basin, a subsurface pHT minimum (<7.73) was already evident in 2002, associated with DSOW. This signal reappeared in 2014 with even lower values (<7.70) and has progressively thickened through to the most recent observations in 2023. Although less intense than the DSOW signal, ISOW in the Iceland Basin has also shown a noticeable OA signal since 2016, reaching comparable pHT values to those found in DSOW. In contrast, the deep pHT maximum observed in 2002 at depths of 2700–3000 m – extending eastward from 20° W – had largely disappeared by 2010, becoming confined to the Iberian Basin. There, maximum pHT values persist between 3000 and 5250 m depth, corresponding to the core of NEADW.
This contrast in deep-ocean pHT between the more recently ventilated waters of the Irminger and Iceland Basins and the older, more stable NEADW is consistent with differential exposure to Cant. Waters in the subpolar basins – having had more recent contact with the atmosphere or mixed with recently ventilated layers – have absorbed more Cant, leading to their enhanced OA (Fig. 10) (García-Ibáñez et al., 2016).
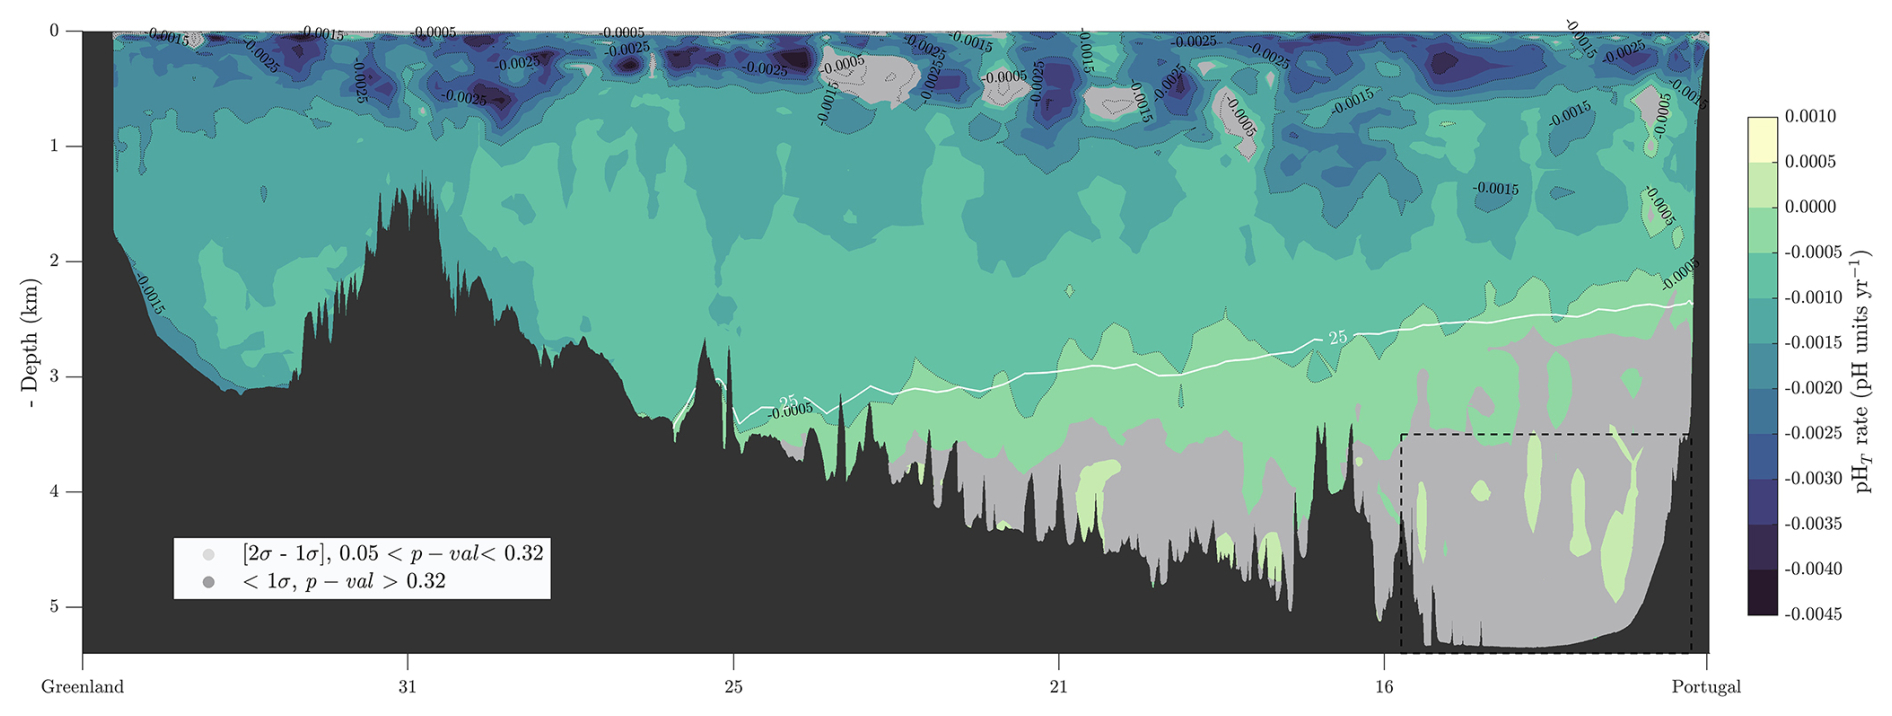
Figure 10Linear trends in pHT at 25 °C and 1 atm from 2002 to 2023 (i.e., OA rates) along the OVIDE-BOCATS section (Fig. 1), based on high-resolution interpolations. Blue (yellow) shading indicates more (less) negative OA rates. Grey areas denote trends that are not statistically significant at the 1σ level. The white contour represents the silicate isoline of 25 µmol kg−1, and the dashed black box marks the deep Iberian Basin region used for measurement quality-control (see Sect. 4.2). Longitude (° W) is shown on the x axis.
DSOW exhibits a particularly strong OA (rate < −0.0015 pHT yr−1), extending along the bottom of the Irminger Basin. A similar, though less intense, signal is seen in ISOW ( pHT yr−1). The highest OA rates ( pHT yr−1) are observed in the surface layers (0–500 m) due to direct air-sea CO2 exchange, consistent with the rate reported in Reverdin et al. (2018) for surface data in the NA subpolar gyre. These upper layers also exhibit high interannual pHT variability (Fig. S7), which correlates negatively with AOU (Fig. S6b). This pHT–AOU relationship suggests a strong influence of mesoscale variability, particularly associated with the NAC, which is known for its energetic and variable meandering in this region (Daniault et al., 2016). As a result, OA rates in NAC-influenced areas may be either enhanced or masked by spatial variability of the natural component in the pHT variability, sometimes leading to non-significant OA rates despite ongoing Cant uptake.
On the other hand, in the deep-water masses east to 30° W, there is a clear transition to non-significant OA rates at depth (Fig. 10). This transition coincides with the 25 µmol kg−1 silicate isoline, which marks the boundary between NA-origin waters and those with Antarctic influence (García-Ibáñez et al., 2015). At this silicate level, García-Ibáñez et al. (2015) estimated that NEADW accounts for ∼30 % of the water mass composition, while LSW and ISOW contribute the remaining 70 %, with proportions varying with depth. NEADW originates from Antarctic Bottom Water, which flows into the Eastern North Atlantic Basin from the Vema Fracture Zone (Mercier and Morin, 1997), and is largely devoid of Cant (Steinfeldt et al., 2024). Consequently, as silicate concentrations increase beyond 25 µmol kg−1, the influence of NEADW becomes dominant, resulting in non-significant OA rates (Fig. 10), and elevated AOU values (Fig. S6a), consistent with the advanced age and limited ventilation of these waters.
The complete OVIDE-BOCATS pHT dataset presented in this study is made available at https://doi.org/10.5281/zenodo.17789895 (Pérez et al., 2025) in multiple formats to ensure broad accessibility and compatibility with different research workflows. The dataset includes 23,843 spectrophotometric pHT measurements along with associated absorbance data (434A, 578A, and 488A) and complete spatiotemporal metadata from 11 cruises spanning 2002–2023. Data are provided as: (1) comma-separated values (CSV) format for general use, (2) WHP-Exchange bottle format following WOCE Hydrographic Program Exchange format standards, (3) NetCDF format with CF-compliant metadata, and (4) Apache Parquet format with both CF standard names and the proposed metadata conventions of Jiang et al. (2022). This multi-format approach ensures the data can be readily integrated into existing oceanographic databases and analysis workflows, adhering to FAIR (Findable, Accessible, Interoperable, and Reusable) data principles. All formats include quality flags for pHT following GLODAP recommendations.
We present a new, rigorously quality-controlled dataset of discrete spectrophotometric pHT measurements from the North Atlantic, spanning over two decades and including absorbance data. This dataset provides a unique resource for the ocean carbon research community, enabling retrospective reassessment of pHT values and derived variables under updated methodological standards.
Our analysis revealed that pHT values measured with an unpurified mCP dye from Sigma-Aldrich exhibit a consistent positive bias of pHT units, on average, compared to those measured using purified mCP dye, with this offset decreasing slightly at higher pHT. While the correction applied has negligible influence on previously published OA trends, it significantly affects derived variables such as the aragonite saturation horizon, which is now estimated to be up to 200 m shallower in certain regions. These changes have implications for assessing the vulnerability of deep-sea ecosystems to OA and underscore the need for highly accurate pHT measurements.
Our results reinforce findings from recent studies (e.g., Carter et al., 2024a; Takeshita et al., 2021, 2022) and support the following recommendations:
-
Ideally, pHT measurements should be carried out using well-characterized, purified mCP dyes and following consensus procedures that ensure SI traceability (Capitaine et al., 2023; Carter et al., 2024a), regardless of mCP dye used.
-
Although the correction applied here (434Aimp=0.0034) yielded consistent results, we recommend the determination of batch-specific 434Aimp values (Douglas and Byrne, 2017; Álvarez et al., 2025).
-
The effect of mCP dye addition on sample pHT is comparable in magnitude to spectrophotometer non-linearity. Our findings support the estimation of this effect via Δ(pH)-vs-pHT,1 approach proposed by Takeshita et al. (2022), and are consistent with recommendations by Li et al. (2020).
-
While the mCP dye does not significantly alter the TRIS buffer pHT, accurate temperature control is essential. TRIS remains suitable for methodological validation, with spectrophotometer behavior being the primary concern (Capitaine et al., 2023).
The supplement related to this article is available online at https://doi.org/10.5194/essd-18-801-2026-supplement.
FFP, MLM, and AV designed the study, conceptualization, methodology, validation and formal analysis. AV, PL and FFP give supervision, administration and funding. The manuscript was written by MLM and FFP and edited, and also revised by MGI and discussed by all authors. The dataset, data curation and validation were done by FFP, AV, MA and MLM.
At least one of the (co-)authors is a member of the editorial board of Earth System Science Data. The peer-review process was guided by an independent editor, and the authors also have no other competing interests to declare.
Publisher's note: Copernicus Publications remains neutral with regard to jurisdictional claims made in the text, published maps, institutional affiliations, or any other geographical representation in this paper. The authors bear the ultimate responsibility for providing appropriate place names. Views expressed in the text are those of the authors and do not necessarily reflect the views of the publisher.
We thank all of the scientists, technicians, personnel, and crew who were responsible for the collection and analysis of the over 23 000 samples included in the final dataset.
Fiz F. Pérez and Xosé Antonio Padín were supported by FICARAM+ (PID2023-148924OB-I00) project funded by MICIU/AEI/10.13039/501100011033 and FEDER, UE. Antón Velo was supported by the European Union under grant agreement no. 101094690 (EuroGO-SHIP). Marta López-Mozos was supported by the grant PRE2020-093138 funded by MICIU/AEI/10.13039/501100011033 and by “ESF Investing in your future”. Marcos Fontela was funded by PTA2022-021307-I, MCIN/AEI/10.13039/501100011033 and by FSE+. Maribel I. García-Ibáñez and Marta Álvarez were supported by the ESMARES (Marine Strategy Directive Framework) program funded by the Spanish Ministry for the Ecological Transition and the Demographic Challenge. Noelia Fajar was supported the Complementary Science Plans for Marine Science of “Ministerio de Ciencia, Innovación y Universidades” included in the Recovery, Transformation and Resilience Plan (PRTR-C17.I1) funded through “Xunta de Galicia” with Next Generation EU and the European Maritime Fisheries and Aquaculture Fund.
This work was co-funded by the European Union under grant agreement no. 101094690 (EuroGO-SHIP) and UK Research and Innovation (UKRI) under the UK government's Horizon Europe funding guarantee [grant numbers: 10051458, 10068242, 10068528]. Views and opinions expressed are however those of the author(s) only and do not necessarily reflect those of the European Union or European Research Executive Agency. Neither the European Union nor the granting authority can be held responsible for them.
The article processing charges for this open-access publication were covered by the CSIC Open Access Publication Support Initiative through its Unit of Information Resources for Research (URICI).
This paper was edited by Sebastiaan van de Velde and reviewed by three anonymous referees.
Álvarez, M., Fajar, N. M., Carter, B. R., Guallart, E. F., Pérez, F. F., Woosley, R. J., and Murata, A.: Global ocean spectrophotometric pH assessment: consistent inconsistencies, Environ. Sci. Technol., 54, 10977–10988, https://doi.org/10.1021/acs.est.9b06932, 2020.
Álvarez, M., García-Ibáñez, M. I., Acerbi, R., Santiago-Domenech, R., Guallart, E. F., and Fajar, N. M.: Ocean acidification at the crossroads I: Harmonizing unpurified and purified meta-cresol purple spectrophotometric pHT measurements based on absorbance data, Limnol. Oceanogr.: Meth., https://doi.org/10.1002/lom3.70023, in press, 2025.
Álvarez-Salgado, X. A., Nieto-Cid, M., Álvarez, M., Pérez, F. F., Morin, P., and Mercier, H.: New insights on the mineralization of dissolved organic matter in central, intermediate, and deep water masses of the northeast North Atlantic, Limnol. Oceanogr., 58, 681–696, https://doi.org/10.4319/lo.2013.58.2.0681, 2013.
Amidror, I.: Scattered data interpolation methods for electronic imaging systems: A survey, J. Elect. Imag., 11, 157–176, https://doi.org/10.1117/1.1455013, 2002.
Asselot, R., Carracedo, L. I., Thierry, V., Mercier, H., Bajon, R., and Pérez, F. F.: Anthropogenic carbon pathways towards the North Atlantic interior revealed by Argo-O2, neural networks and back-calculations, Nat. Commun., 15, 1630, https://doi.org/10.1038/s41467-024-46074-5, 2024.
Bajon, R., Carracedo, L. I., Mercier, H., Asselot, R., and Pérez, F. F.: Seasonal to long-term variability of natural and anthropogenic carbon concentrations and transports in the subpolar North Atlantic Ocean, EGUsphere [preprint], https://doi.org/10.5194/egusphere-2025-4425, 2025.
Bushinsky, S. M., Nachod, Z., Fassbender, A. J., Tamsitt, V., Takeshita, Y., and Williams, N.: Offset between profiling float and shipboard oxygen observations at depth imparts bias on float pH and derived pCO2, Global Biogeochem. Cy., 39, e2024GB008185, https://doi.org/10.1029/2024GB008185, 2025.
Byrne, R. H. and Breland, J. A.: High precision multiwavelength pH determinations in seawater using cresol red, Deep-Sea Res. Pt. A, 36, 803–810, 1989.
Caldeira, K. and Wickett, M. E.: Anthropogenic carbon and ocean pH, Nature, 425, 365, https://doi.org/10.1038/425365a, 2003.
Capitaine, G., Stoica, D., Wagener, T., and Fisicaro, P.: Production of a reference material for seawater pHT measurements by a National Metrology Institute, Mar. Chem., 252, 104244, https://doi.org/10.1016/j.marchem.2023.104244, 2023.
Carter, B. R., Radich, J. A., Doyle, H. L., and Dickson, A. G.: An automated system for spectrophotometric seawater pH measurements, Limnol. Oceanogr.: Meth., 11, 16–27, https://doi.org/10.4319/lom.2013.11.16, 2013.
Carter, B. R., Feely, R. A., Williams, N. L., Dickson, A. G., Fong, M. B., and Takeshita, Y.: Updated methods for global locally interpolated estimation of alkalinity, pH, and nitrate, Limnol. Oceanogr.: Meth., 16, 119–131, https://doi.org/10.1002/lom3.10232, 2018.
Carter, B. R., Sharp, J. D., Dickson, A. G., Alvarez, M., Fong, M. B., García-Ibáñez, M. I., and Wang, Z. A.: Uncertainty sources for measurable ocean carbonate chemistry variables, Limnol. Oceanogr., 69, 1–21, https://doi.org/10.1002/lno.12477, 2024a.
Carter, B. R., Sharp, J. D., García-Ibáñez, M. I., Woosley, R. J., Fong, M. B., Álvarez, M., and Wang, Z. A.: Random and systematic uncertainty in ship-based seawater carbonate chemistry observations, Limnol. Oceanogr., 69, 2473–2488, https://doi.org/10.1002/lno.12674, 2024b.
Chierici, M., Fransson, A., and Anderson, L. G.: Influence of m-cresol purple indicator additions on the pH of seawater samples: Correction factors evaluated from a chemical speciation model, Mar. Chem., 65, 281–290, https://doi.org/10.1016/S0304-4203(99)00020-1, 1999.
Clayton, T. D. and Byrne, R. H.: Spectrophotometric seawater pH measurements: Total hydrogen ion concentration scale calibration of m-cresol purple and at-sea results, Deep-Sea Res. Pt. I, 40, 2115–2129, https://doi.org/10.1016/0967-0637(93)90048-8, 1993.
Daniault, N., Mercier, H., Lherminier, P., Sarafanov, A., Falina, A., Zunino, P., Pérez, F. F., Ríos, A. F., Ferron, B., Huck, T., Thierry, V., and Gladyshev, S.: The northern North Atlantic Ocean mean circulation in the early 21st century, Prog. Oceanogr., 146, 142–158, https://doi.org/10.1016/j.pocean.2016.06.007, 2016.
de la Paz, M., García-Ibáñez, M. I., Steinfeldt, R., Ríos, A. F., and Pérez, F. F.: Ventilation versus biology: What is the controlling mechanism of nitrous oxide distribution in the North Atlantic?, Global Biogeochem. Cy., 31, 745–760, https://doi.org/10.1002/2016GB005507, 2017.
DelValls, T. and Dickson, A.: The pH of buffers based on 2-amino-2-hydroxymethyl-1,3-propanediol (tris) in synthetic seawater, Deep-Sea Res. Pt. I, 45, 1541–1554, https://doi.org/10.1016/S0967-0637(98)00019-3, 1998.
DeVries, T., Yamamoto, K., Wanninkhof, R., Gruber, N., Hauck, J., Müller, J. D., Bopp, L., Carroll, D., Carter, B., Chau, T.-T.-T., Doney, S. C., Gehlen, M., Gloege, L., Gregor, L., Henson, S., Kim, J. H., Iida, Y., Ilyina, T., Landschützer, P., Le Quéré, C., Munro, D., Nissen, C., Patara, L., Pérez, F. F., Resplandy, L., Rodgers, K. B., Schwinger, J., Séférian, R., Sicardi, V., Terhaar, J., Triñanes, J., Tsujino, H., Watson, A., Yasunaka, S., and Zeng, J.: Magnitude, trends, and variability of the global ocean carbon sink from 1985 to 2018, Global Biogeochem. Cy., 37, e2023GB007780, https://doi.org/10.1029/2023GB007780, 2023.
Dickson, A. G.: The measurement of sea water pH, Mar. Chem., 44, 131–142, https://doi.org/10.1016/0304-4203(93)90198-W, 1993.
Dickson, A. G.: Standards for ocean measurements, Oceanography, 23, 34–47, 2010.
Dickson, A. G., Sabine, C. L., and Christian, J. R. (Eds.): Guide to best practices for ocean CO2 measurements, PICES Special Publication 3, https://www.oceandatapractices.org/handle/11329/249 (last access: 19 January 2026), 2007.
Dickson, A. G., Camões, M. F., Spitzer, P., Fisicaro, P., Stoica, D., Pawlowicz, R., and Feistel, R.: Metrological challenges for measurements of key climatological observables. Part 3: seawater pH, Metrologia, 53, R26–R39, https://doi.org/10.1088/0026-1394/53/1/R26, 2016.
Douglas, N. K. and Byrne, R. H.: Achieving accurate spectrophotometric pH measurements using unpurified meta-cresol purple, Mar. Chem., 190, 66–72, https://doi.org/10.1016/j.marchem.2017.02.004, 2017.
Fong, M. B., Takeshita, Y., Easley, R. A., and Waters, J. F.: Detection of impurities in m-cresol purple with Soft Independent Modeling of Class Analogy for the quality control of spectrophotometric pH measurements in seawater, Mar. Chem., 259, 104362, https://doi.org/10.1016/j.marchem.2024.104362, 2024.
Fontela, M., Mercier, H., and Pérez, F. F.: Long-term integrated biogeochemical budget driven by circulation in the eastern subpolar North Atlantic, Prog. Oceanogr., 173, 51–65, https://doi.org/10.1016/j.pocean.2019.02.004, 2019.
Fontela, M., Pérez, F. F., Carracedo, L. I., Padín, X. A., Velo, A., García-Ibáñez, M. I., and Lherminier, P.: The Northeast Atlantic is running out of excess carbonate in the horizon of cold-water coral communities, Sci. Rep., 10, 71793, https://doi.org/10.1038/s41598-020-71793-2, 2020a.
Fontela, M., Pérez, F. F., Mercier, H., and Lherminier, P.: North Atlantic western boundary currents are intense dissolved organic carbon streams, Front. Mar. Sci., 7, 593757, https://doi.org/10.3389/fmars.2020.593757, 2020b.
Fontela, M., Velo, A., Brown, P. J., and Pérez, F. F.: Carbonate system species and pH, in: Marine Analytical Chemistry, edited by: Blasco, J. and Tovar-Sánchez, A., Springer, Cham, https://doi.org/10.1007/978-3-031-14486-8_1, 2023.
Friedlingstein, P., O'Sullivan, M., Jones, M. W., Andrew, R. M., Bakker, D. C. E., Hauck, J., Landschützer, P., Le Quéré, C., Luijkx, I. T., Peters, G. P., Peters, W., Pongratz, J., Schwingshackl, C., Sitch, S., Canadell, J. G., Ciais, P., Jackson, R. B., Alin, S. R., Anthoni, P., and Zheng, B.: Global Carbon Budget 2023, Earth Syst. Sci. Data, 15, 5301–5369, https://doi.org/10.5194/essd-15-5301-2023, 2023.
García-Ibáñez, M. I., Pardo, P. C., Carracedo, L. I., Mercier, H., Lherminier, P., Ríos, A. F., and Pérez, F. F.: Structure, transports and transformations of the water masses in the Atlantic Subpolar Gyre, Prog. Oceanogr., 135, 18–36, https://doi.org/10.1016/j.pocean.2015.03.009, 2015.
García-Ibáñez, M. I., Zunino, P., Fröb, F., Carracedo, L. I., Ríos, A. F., Mercier, H., Olsen, A., and Pérez, F. F.: Ocean acidification in the subpolar North Atlantic: Rates and mechanisms controlling pH changes, Biogeosciences, 13, 3701–3715, https://doi.org/10.5194/bg-13-3701-2016, 2016.
García-Ibáñez, M. I., Bates, N. R., Bakker, D. C. E., Fontela, M., and Velo, A.: Cold-water corals in the subpolar North Atlantic Ocean exposed to aragonite undersaturation if the 2 °C global warming target is not met, Global Planet. Change, 201, 103480, https://doi.org/10.1016/j.gloplacha.2021.103480, 2021.
Gattuso, J.-P., Magnan, A., Billé, R., Cheung, W. W. L., Howes, E. L., Joos, F., Allemand, D., Bopp, L., Cooley, S. R., Eakin, C. M., Hoegh-Guldberg, O., Kelly, R. P., Pörtner, H.-O., Rogers, A. D., Baxter, J. M., Laffoley, D., Osborn, D., Rankovic, A., Rochette, J., and Turley, C.: Contrasting futures for ocean and society from different anthropogenic CO2 emissions scenarios, Science, 349, aac4722, https://doi.org/10.1126/science.aac4722, 2015.
Gehlen, M., Séférian, R., Jones, D. O. B., Roy, T., Roth, R., Barry, J., Bopp, L., Doney, S. C., Dunne, J. P., Heinze, C., Joos, F., Orr, J. C., Resplandy, L., Segschneider, J., and Tjiputra, J.: Projected pH reductions by 2100 might put deep North Atlantic biodiversity at risk, Biogeosciences, 11, 6955–6967, https://doi.org/10.5194/bg-11-6955-2014, 2014.
IPCC: IPCC Special Report on the Ocean and Cryosphere in a Changing Climate, in: Intergovernmental Panel on Climate Change (IPCC)edited by: Pörtner, H.-O., Roberts, D. C., Masson-Delmotte, V., Zhai, P., Tignor, M., Poloczanska, E., Mintenbeck, K., Alegría, A., Nicolai, M., Okem, A., Petzold, J., Rama, B., and Weyer, N. M., Cambridge University Press, Cambridge, UK and New York, NY, USA, https://www.ipcc.ch/srocc/ (last access: 19 January 2026), 2019.
Jiang, L. Q., Pierrot, D., Wanninkhof, R., Feely, R. A., Tilbrook, B., Alin, S., Barbero, L., Byrne, R. H., Carter, B. R., Dickson, A. G., Gattuso, J. P., Greeley, D., Hoppema, M., Humphreys, M. P., Karstensen, J., Lange, N., Lauvset, S. K., Lewis, E. R., Olsen, A., Pérez, F. F., Sabine, C., Sharp, J. D., Tanhua, T., Trull, T. W., Velo, A., Allegra, A. J., Barker, P., Burger, E., Cai, W. J., Chen, C. T. A., Cross, J., Garcia, H., Hernandez-Ayon, J. M., Hu, X., Kozyr, A., Langdon, C., Lee, K., Salisbury, J., Wang, Z. A., and Xue, L.: Best practice data standards for discrete chemical oceanographic observations, Front. Mar. Sci., 8, 705638, https://doi.org/10.3389/fmars.2021.705638, 2022.
Key, R. M., Olsen, A., van Heuven, S., Lauvset, S. K., Velo, A., Lin, X., Schirnick, C., Kozyr, A., Tanhua, T., Hoppema, M., Jutterstrom, S., Steinfeldt, R., Jeansson, E., Ishii, M., Perez, F. F., and Suzuki, T.: Global Ocean Data Analysis Project, Version 2 (GLODAPv2), ORNL/CDIAC-162, ND-P093, CDIAC – Carbon Dioxide Information Analysis Center, https://doi.org/10.3334/CDIAC/OTG.NDP093_GLODAPv2, 2015.
Kwiatkowski, L. and Orr, J. C.: Diverging seasonal extremes for ocean acidification during the twenty-first century, Nat. Clim. Change, 8, 141–145, https://doi.org/10.1038/s41558-017-0054-0, 2018.
Lauvset, S. K., Carter, B. R., Perez, F. F., Jiang, L.-Q., Feely, R. A., Velo, A., and Olsen, A.: Processes driving global interior ocean pH distribution, Global Biogeochem. Cy., 34, e2019GB006229, https://doi.org/10.1029/2019GB006229, 2020.
Lauvset, S. K., Lange, N., Tanhua, T., Bittig, H. C., Olsen, A., Kozyr, A., Álvarez, M., Azetsu-Scott, K., Brown, P. J., Carter, B. R., Cotrim da Cunha, L., Hoppema, M., Humphreys, M. P., Ishii, M., Jeansson, E., Murata, A., Müller, J. D., Pérez, F. F., Schirnick, C., Steinfeldt, R., Suzuki, T., Ulfsbo, A., Velo, A., Woosley, R. J., and Key, R. M.: The annual update GLODAPv2.2023: the global interior ocean biogeochemical data product, Earth Syst. Sci. Data, 16, 2047–2072, https://doi.org/10.5194/essd-16-2047-2024, 2024.
Lee, K., Millero, F. J., Byrne, R. H., Feely, R. A., and Wanninkhof, R.: The recommended dissociation constants for carbonic acid in seawater, Geophys. Res. Lett., 27, 229–232, https://doi.org/10.1029/1999GL002345, 2000.
Lee, K., Kim, T. W., Byrne, R. H., Millero, F. J., Feely, R. A., and Liu, Y. M.: The universal ratio of boron to chlorinity for the North Pacific and North Atlantic oceans, Geochim. Cosmochim. Ac., 74, 1801–1811, https://doi.org/10.1016/j.gca.2009.12.027, 2010.
Lherminier, P., Mercier, H., Huck, T., Gourcuff, C., Perez, F. F., Morin, P., Sarafanov, A., and Falina, A.: The Atlantic Meridional Overturning Circulation and the subpolar gyre observed at the A25-OVIDE section in June 2002 and 2004, Deep-Sea Res. Pt. I, 57, 1374–1391, https://doi.org/10.1016/j.dsr.2010.07.009, 2010.
Le Quéré, C., Moriarty, R., Andrew, R. M., Canadell, J. G., Sitch, S., Korsbakken, J. I., Friedlingstein, P., Peters, G. P., Andres, R. J., Boden, T. A., Houghton, R. A., House, J. I., Keeling, R. F., Tans, P., Arneth, A., Bakker, D. C. E., Barbero, L., Bopp, L., Chang, J., and Zeng, N.: Global Carbon Budget 2015, Earth Syst. Sci. Data, 7, 349–396, https://doi.org/10.5194/essd-7-349-2015, 2015.
Li, X., García-Ibáñez, M. I., Carter, B. R., Chen, B., Li, Q., Easley, R. A., and Cai, W.-J.: Purified meta-cresol purple dye perturbation: How it influences spectrophotometric pH measurements, Mar. Chem., 225, 103849, https://doi.org/10.1016/j.marchem.2020.103849, 2020.
Liu, X., Patsavas, M. C., and Byrne, R. H.: Purification and characterization of meta-cresol purple for spectrophotometric seawater pH measurements, Environ. Sci. Technol., 45, 4862–4868, https://doi.org/10.1021/es200665d, 2011.
Loucaides, S., Rèrolle, V. M., Papadimitriou, S., Kennedy, H., Mowlem, M. C., Dickson, A. G., and Achterberg, E. P.: Characterization of meta-cresol purple for spectrophotometric pH measurements in saline and hypersaline media at sub-zero temperatures, Sci. Rep., 7, 2481, https://doi.org/10.1038/s41598-017-02624-0, 2017.
Lueker, T. J., Dickson, A. G., and Keeling, C. D.: Ocean pCO2 calculated from dissolved inorganic carbon, alkalinity, and equations for K1 and K2: Validation based on laboratory measurements of CO2 in gas and seawater at equilibrium, Mar. Chem., 70, 105–119, https://doi.org/10.1016/S0304-4203(00)00022-0, 2000.
Ma, J., Shu, H., Yang, B., Byrne, R. H., and Yuan, D.: Spectrophotometric determination of pH and carbonate ion concentrations in seawater: Choices, constraints and consequences, Anal. Chim. Ac., 1081, 18–31, https://doi.org/10.1016/j.aca.2019.06.024, 2019.
Maurer, T. L., Plant, J. N., and Johnson, K. S.: Delayed-mode quality control of oxygen, nitrate, and pH data on SOCCOM biogeochemical profiling floats, Front. Mar. Sci., 8, 683207, https://doi.org/10.3389/fmars.2021.683207, 2021.
Mercier, H. and Morin, P.: Hydrography of the Romanche and Chain Fracture Zones, J. Geophys. Res.-Oceans, 102, 10373–10389, https://doi.org/10.1029/97JC00229, 1997.
Mercier, H., Desbruyères, D., Lherminier, P., Velo, A., Carracedo, L., Fontela, M., and Pérez, F. F.: New insights into the eastern subpolar North Atlantic meridional overturning circulation from OVIDE, Ocean Sci., 20, 779–797, https://doi.org/10.5194/os-20-779-2024, 2024.
Müller, J. D., Bastkowski, F., Sander, B., Seitz, S., Turner, D. R., Dickson, A. G., and Rehder, G.: Metrology for pH measurements in brackish waters – Part 1: Extending electrochemical pHT measurements of TRIS buffers to salinities 5–20, Front. Mar. Sci., 5, 176, https://doi.org/10.3389/fmars.2018.00176, 2018.
Olsen, A., Key, R. M., van Heuven, S., Lauvset, S. K., Velo, A., Lin, X., Schirnick, C., Kozyr, A., Tanhua, T., Hoppema, M., Jutterström, S., Steinfeldt, R., Jeansson, E., Ishii, M., Pérez, F. F., and Suzuki, T.: The Global Ocean Data Analysis Project version 2 (GLODAPv2) – an internally consistent data product for the world ocean, Earth Syst. Sci. Data, 8, 297–323, https://doi.org/10.5194/essd-8-297-2016, 2016.
Olsen, A., Lange, N., Key, R. M., Tanhua, T., Álvarez, M., Becker, S., Bittig, H. C., Carter, B. R., Cotrim da Cunha, L., Feely, R. A., van Heuven, S., Hoppema, M., Ishii, M., Jeansson, E., Jones, S. D., Jutterström, S., Karlsen, M. K., Kozyr, A., Lauvset, S. K., and Wanninkhof, R.: GLODAPv2.2019 – An update of GLODAPv2, Earth Syst. Sci. Data, 11, 1437–1461, https://doi.org/10.5194/essd-11-1437-2019, 2019.
Orr, J. C., Fabry, V. J., Aumont, O., Bopp, L., Doney, S. C., Feely, R. A., Gnanadesikan, A., Gruber, N., Ishida, A., Joos, F., Key, R. M., Lindsay, K., Maier-Reimer, E., Matear, R., Monfray, P., Mouchet, A., Najjar, R. G., Plattner, G.-K., Rodgers, K. B., and Yool, A.: Anthropogenic ocean acidification over the twenty-first century and its impact on calcifying organisms, Nature, 437, 681–686, https://doi.org/10.1038/nature04095, 2005.
Pérez, F. F., Mercier, H., Vázquez-Rodríguez, M., Lherminier, P., Velo, A., Pardo, P. C., Rosón, G., and Ríos, A. F.: Atlantic Ocean CO2 uptake reduced by weakening of the meridional overturning circulation, Nat. Geosci., 6, 146–152, https://doi.org/10.1038/ngeo1680, 2013.
Pérez, F. F., Fontela, M., García-Ibáñez, M. I., Mercier, H., Velo, A., Lherminier, P., Zunino, P., Paz, M. de la, Alonso-Pérez, F., Guallart, E. F., and Padin, X. A.: Meridional overturning circulation conveys fast acidification to the deep Atlantic Ocean, Nature, 554, 515–518, https://doi.org/10.1038/nature25493, 2018.
Pérez, F. F., Olafsson, J., Ólafsdóttir, S. R., Fontela, M., and Takahashi, T.: Contrasting drivers and trends of ocean acidification in the subarctic Atlantic, Sci. Rep., 11, 93324, https://doi.org/10.1038/s41598-021-93324-3, 2021.
Pérez, F. F., Becker, M., Goris, N., Gehlen, M., López-Mozos, M., Tjiputra, J., Olsen, A., Müller, J. D., Huertas, I. E., Chau, T. T. T., Cainzos, V., Velo, A., Benard, G., Hauck, J., and Gruber, N.: An assessment of CO2 storage and sea–air fluxes for the Atlantic Ocean and Mediterranean Sea between 1985 and 2018, Global Biogeochem. Cy., 37, e2023GB007862, https://doi.org/10.1029/2023GB007862, 2023.
Pérez, F. F., López-Mozos, M., Fontela, M., García-Ibáñez, M. I., Fajar, N. M., Padin, X. A., Castaño-Carrera, M., de la Paz, M., Carracedo, L. I., Álvarez, M., Lherminier, P., and Velo, A.: Two decades of pHT measurements along the GO-SHIP A25 section – Dataset, Zenodo [data set], https://doi.org/10.5281/zenodo.17789895, 2025.
Ramette, R. W., Culberson, C. H., and Bates, R. G.: Acid-base properties of tris(hydroxymethyl)aminomethane (Tris) buffers in sea water from 5 to 40 °C, Anal. Chem., 49, 867–870, https://doi.org/10.1021/ac50014a049, 1977.
Resplandy, L., Bopp, L., Orr, J. C., and Dunne, J. P.: Role of mode and intermediate waters in future ocean acidification: Analysis of CMIP5 models, Geophys. Res. Lett., 40, 3091–3095, https://doi.org/10.1002/grl.50414, 2013.
Reverdin, G., Metzl, N., Olafsdottir, S., Racapé, V., Takahashi, T., Benetti, M., Valdimarsson, H., Benoit-Cattin, A., Danielsen, M., Fin, J., Naamar, A., Pierrot, D., Sullivan, K., Bringas, F., and Goni, G.: SURATLANT: A 1993–2017 surface sampling in the central part of the North Atlantic subpolar gyre, Earth Syst. Sci. Data, 10, 1901–1924, https://doi.org/10.5194/essd-10-1901-2018, 2018.
Rivaro, P., Vivado, D., Falco, P., and Ianni, C.: HPLC-DAD purification and characterization of meta-cresol-purple for spectrophotometric seawater pH measurements, Water, 13, 3030, https://doi.org/10.3390/w13213030, 2021.
Robert-Baldo, G. L., Morris, M. J., and Byrne, R. H.: Spectrophotometric determination of seawater pH using phenol red, Anal. Chem., 57, 2564–2567, 1985.
Rodgers, K. B., Schwinger, J., Fassbender, A. J., Landschützer, P., Yamaguchi, R., Frenzel, H., Stein, K., Müller, J. D., Goris, N., Sharma, S., Bushinsky, S., Chau, T.-T.-T., Gehlen, M., Gallego, M. A., Gloege, L., Gregor, L., Gruber, N., Hauck, J., Iida, Y., and Velo, A.: Seasonal variability of the surface ocean carbon cycle: A synthesis, Global Biogeochem. Cy., 37, e2023GB007798, https://doi.org/10.1029/2023GB007798, 2023.
Sabine, C. L., Feely, R. A., Gruber, N., Key, R. M., Lee, K., Bullister, J. L., Wanninkhof, R., Wong, C. S., Wallace, D. W. R., Tilbrook, B., Millero, F. J., Peng, T.-H., Kozyr, A., Ono, T., and Rios, A. F.: The oceanic sink for anthropogenic CO2, Science, 305, 367–371, https://doi.org/10.1126/science.1097403, 2004.
Steinfeldt, R., Rhein, M., and Kieke, D.: Anthropogenic carbon storage and its decadal changes in the Atlantic between 1990–2020, Biogeosciences, 21, 3839–3867, https://doi.org/10.5194/bg-21-3839-2024, 2024.
Takeshita, Y., Johnson, K. S., Martz, T. R., Plant, J. N., and Sarmiento, J. L.: Assessment of autonomous pH measurements for determining surface seawater partial pressure of CO2, J. Geophys. Res.-Oceans, 123, 4003–4013, https://doi.org/10.1029/2017JC013387, 2018.
Takeshita, Y., Johnson, K. S., Coletti, L. J., Jannasch, H. W., Walz, P. M., and Warren, J. K.: Assessment of pH dependent errors in spectrophotometric pH measurements of seawater, Mar. Chem., 223, 103801, https://doi.org/10.1016/j.marchem.2020.103801, 2020.
Takeshita, Y., Warren, J. K., Liu, X., Spaulding, R. S., Byrne, R. H., Carter, B. R., DeGrandpre, M. D., Murata, A., and Watanabe, S.: Consistency and stability of purified meta-cresol purple for spectrophotometric pH measurements in seawater, Mar. Chem., 236, 104018, https://doi.org/10.1016/j.marchem.2021.104018, 2021.
Takeshita, Y., Mertz, K. L., Norgaard, A., Gray, S., Verburg, M. H., and Bockmon, E. E.: Accurate spectrophotometric pH measurements made directly in the sample bottle using an aggregated dye perturbation approach, Limnol. Oceanogr.: Meth., 20, 281–287, https://doi.org/10.1002/lom3.10486, 2022.
Vázquez-Rodríguez, M., Pérez, F. F., Velo, A., Ríos, A. F., and Mercier, H.: Observed acidification trends in North Atlantic water masses, Biogeosciences, 9, 5217–5230, https://doi.org/10.5194/bg-9-5217-2012, 2012.
Woosley, R. J.: Long-term stability and storage of meta-cresol purple solutions for seawater pH measurements, Limnol. Oceanogr.: Meth., 19, 810–817, https://doi.org/10.1002/lom3.10462, 2021.
Yao, W., Liu, X., and Byrne, R. H.: Impurities in indicators used for spectrophotometric seawater pH measurements: Assessment and remedies, Mar. Chem., 107, 167–172, https://doi.org/10.1016/j.marchem.2007.06.012, 2007.
Zunino, P., Lherminier, P., Mercier, H., Padín, X. A., Ríos, A. F., and Pérez, F. F.: Dissolved inorganic carbon budgets in the eastern subpolar North Atlantic in the 2000s from in situ data, Geophys. Res. Lett., 42, 9853–9861, https://doi.org/10.1002/2015GL066243, 2015.