the Creative Commons Attribution 4.0 License.
the Creative Commons Attribution 4.0 License.
 | 29 Oct 2026
Extreme precipitation events: a comprehensive catalog for northern Chile (17.5° S to 30.0° S)
Felipe Matus
Marcia Paredes
Miguel Lagos-Zúñiga
Alex Garcés
Diego Pinto
Germán Aguilar
Santiago Montserrat

This study presents a comprehensive catalog of the most extreme seasonal rainfall events of northern Chile between 1979 and 2019. We analyzed its meteorological patterns across three latitudinal bands (17.5–23.5° S, 23.5–27° S, and 27–30° S) using daily precipitation and mean daily temperature from the CR2METv2.5 product, and vertically integrated water vapor transport data (IVT) from the ERA5 reanalysis. These events were classified into three main precipitation categories: Stratiform, Coast, and Andes Mountain. The Andes Mountain category was further subdivided into five subcategories based on IVT patterns and precipitation spatial distribution: North Andes, South Andes, Along Andes, Convergence, and Westerly IVT. In total, the catalog comprises 472 extreme precipitation events corresponding to 408 unique storm dates, each characterized by date, precipitation category, maximum precipitation within the latitudinal band, average storm temperature, and snow line elevation determined through empirical methods and remote sensing from daily MODIS imagery. The dataset is available as a CSV catalog with additional NetCDF files containing gridded precipitation, IVT, and MODIS snow cover fields for each event. To test the applicability of this catalog, we characterized extreme events composite results for the Austral summer between 27–30° S (latitudinal band 3), showing that events within each category yield coherent synoptic patterns. Additionally, we contrasted our catalog with an existing national landslide inventory of 548 events in the study area, finding that just six cataloged storms (all classified as Stratiform) account for 203 debris flow events (37 %), indicating the March 2015 and May 2017 storms were alone responsible for 168 of them. We also estimated the approximate debris flow volumes for the March 2015 Atacama event using a transport-capacity approach, showing reasonable agreement for deposits larger than 4000 m3. These findings enhance our understanding of extreme precipitation events in Chile and provide a valuable resource for storyline analysis and precipitation pattern identification. Catalog is available at Zenodo: https://doi.org/10.5281/ZENODO.14342935 (Matus et al., 2026).
- Article
(10055 KB) - Full-text XML
- BibTeX
- EndNote


In recent decades, the study of extreme weather events from central to northern Chile has received increasing focus (Rondanelli et al., 2019; Valenzuela and Garreaud, 2019; Garreaud et al., 2017) because of their consequences in society: interruption of water supply, floods, debris flows, infrastructure damage and even human fatalities (Valenzuela et al., 2022). The interaction of geographical features, such as the Andes mountains, and Chile's significant latitudinal extent from the tropic to Patagonia (17–57° S), with dynamical features of climate, such as the Southeast Pacific semi-permanent subtropical anticyclone, the synoptic scale disturbances from the westerly wind belt, and the South American-like monsoon system (SAMS), result in a north-south (and east-west) mean precipitation gradient. Annual mean precipitation can vary from approximately 10 mm in the hyper-arid north to over 3000 mm in southern Chile (Aceituno et al., 2021).
Northern Chile features a diverse geomorphological landscape comprising five distinct morphological domains: the Coastal Plain, the Coastal Range, the Intermediate Depression, the Precordillera, and the Andes Mountain Range (Börgel, 1983). Areas of high relief, particularly in the Andean Precordillera and valleys, are prone to debris flows triggered by extreme storms (Wilcox et al., 2016). Human settlements in these regions are often situated on alluvial fans, increasing their exposure to debris flow risks. Consequently, estimating sediment volumes that may reach inhabited alluvial fans is critical for hazard mitigation (Zegers et al., 2020; Garcés et al., 2022).
The magnitude and continuity of sediment transport to alluvial fans are strongly controlled by the hydrological and geomorphological setting of northern Chile, where tributary ravines mainly feature ephemeral streamflow. The mountainous landscape in northern Chile is characterized by abundant sediments accumulating in alluvial, colluvial, and fluvial deposits. Most ravines in this region exhibit a condition of unlimited sediment availability, meaning that the sediment present in the basin exceeds the transport capacity during a flood event (Montserrat et al., 2025). This condition is typically found in ravines ranging from 0.1 to 30 km2, although very steep ravines or those with substantial bedrock presence may not follow this pattern (Aguilar et al., 2020).
While sediment availability and channel connectivity define the preconditioning of these systems, extreme precipitation events act as the primary trigger for sediment mobilization and debris flows in the studied region. Precipitation in the arid northern region mainly occurs during the austral summer (December to February), mostly related to convective systems (linked to the South American Monsoon System, or SAMS), cut-off lows, and the presence of atmospheric rivers (Aceituno et al., 2021; Fuenzalida et al., 2005; Valenzuela and Garreaud, 2019; Rondanelli, 2025). The impact of these precipitation mechanisms on natural hazards is strongly modulated by the geomorphological configuration of northern Chile (Aguilar et al., 2020; Cabré et al., 2020).
The snowline elevation, defined as the elevation where precipitation starts falling as snow – often related to the freezing level, – is another factor that can increase the possibility of hydrometeorological hazards, such as floods and debris flow, as it determines the catchment contributing area to surface runoff generation (e.g. Valenzuela et al., 2022). Garreaud (2013) indicated that watersheds located in north and central Chile are the most affected during warm winter storms (north of 35° S), when the snowline elevation is high.
Depending on the intensity of the events and their warm conditions, they have triggered numerous catastrophic events (Bozkurt et al., 2016). Recent studies have explored the mechanisms behind water vapor sources to induce precipitation, as dry dynamics alone cannot account for the severity of extreme events (e.g., Rondanelli et al., 2019; Vicencio Veloso, 2020; Rutllant et al., 2023). For example, Ortega et al. (2019) showed that since the beginning of the 20th century, about 70 % of alluvial disasters in southern Atacama (26–30° S) were related to the El Niño Southern Oscillation (ENSO) and the Pacific South America teleconnection pattern (PSA; Mo and Higgins, 1998).
One significant and recent historical weather event is the Atacama flood of 2015, caused by a 2 d heavy rain that affected northern and central Chile, resulting in flash floods and debris flows (Wilcox et al., 2016; Bozkurt et al., 2016). Integrated analysis of this event highlights the key roles of ENSO and the Madden–Julian Oscillation (MJO) in the increased water vapor availability and its modulating transport mechanisms (Bozkurt et al., 2016; Rondanelli et al., 2019; Matus et al., 2025). Rutllant et al. (2023) shows that in north-central Chile, rainfall-induced debris flows are related to high-amplitude deep troughs extending into the subtropics off the west coast of South America and maximum integrated water vapor transport (IVT) from the northwest or west-northwest.
While considerable progress has been made in understanding extreme weather events in northern Chile, critical gaps still exist regarding the dominant mesoscale features and the areas they affect. In particular, the meteorological mechanisms and water vapor sources driving extreme rainfall events in this region, which contribute to a complex and heterogeneous precipitation landscape, remain unclear. Despite the increasing focus on extreme climate events and their impacts, no systematic catalog exists that compiles and organizes extreme precipitation events together with their synoptic characteristics, water vapor transport patterns, and snowline conditions across multiple decades, latitudinal bands, and seasons. Key questions arise: What are the precise meteorological conditions that lead to extreme rainfall events in different latitudinal bands of northern Chile? How do integrated water vapor transport patterns contribute to these phenomena? Addressing these questions requires a structured record of extreme events that enables composite analysis, pattern identification, and hazard assessment.
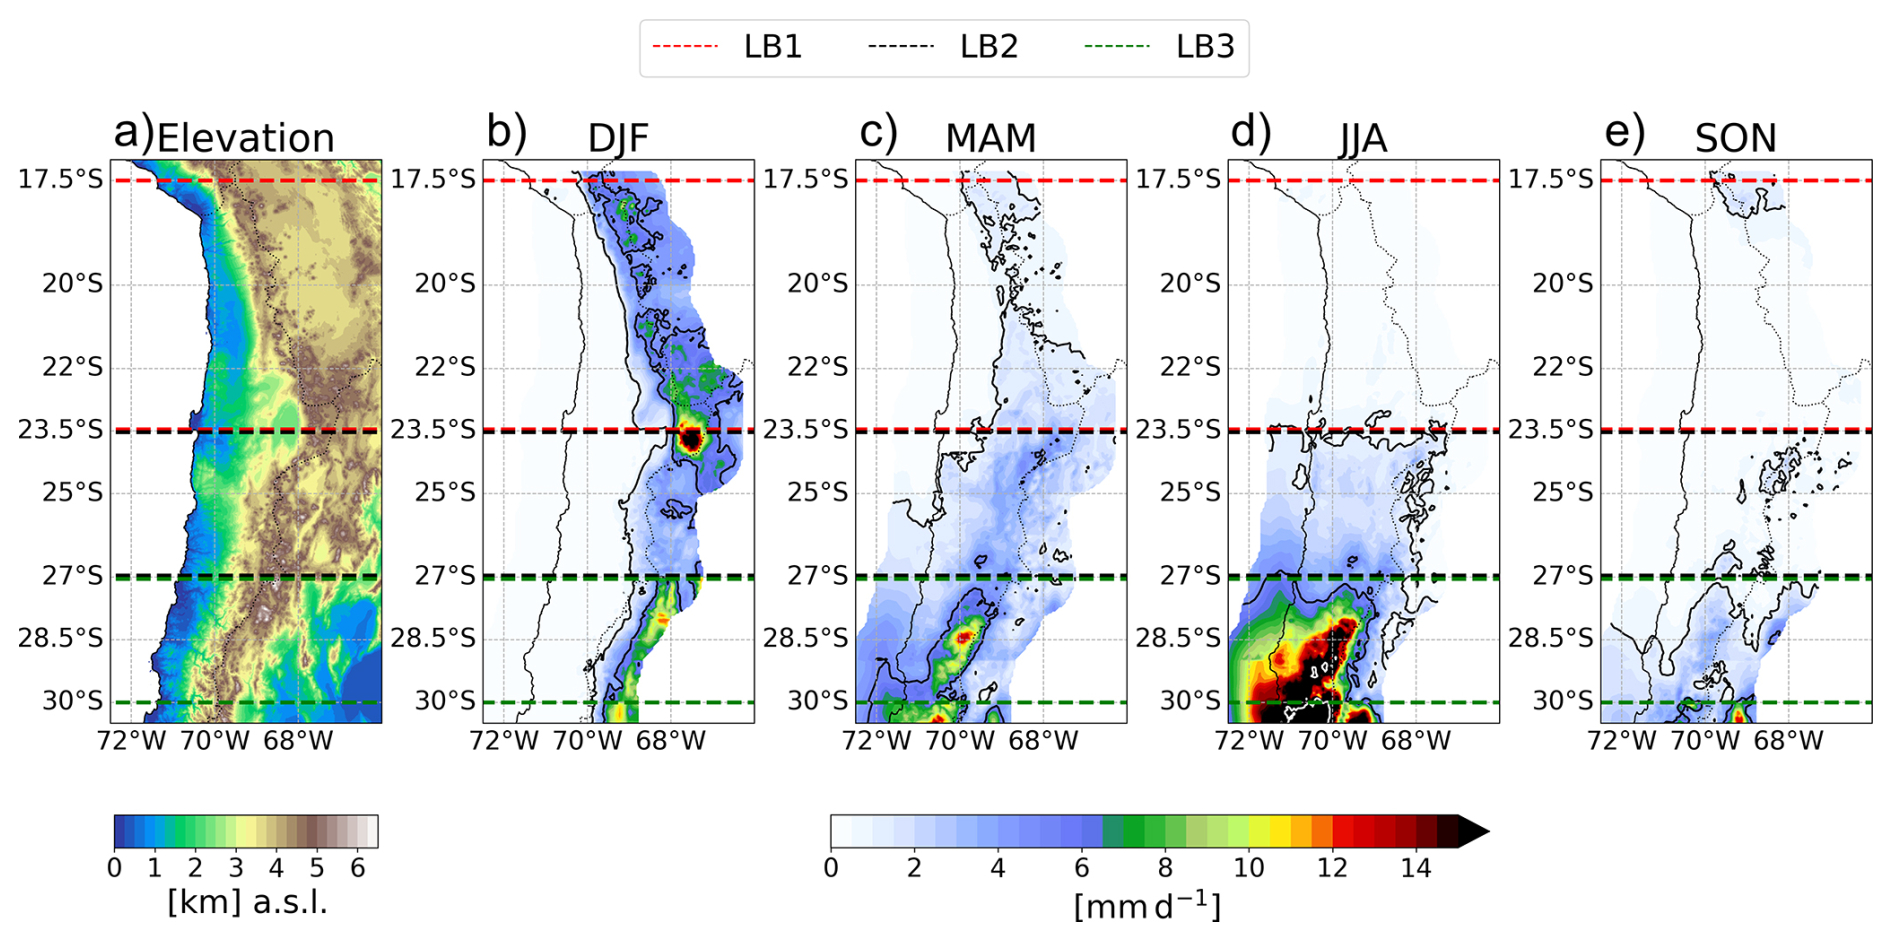
Figure 1Climate and elevation features in northern Chile. (a) Topography (); Panels (b) through (e) show the composite of maximum precipitation events (mm d−1) for each season (1979–2019, 41 events per season). Dashed lines delimit the three latitudinal bands (LB1, LB2, LB3). Black contours indicate the 1 and 5 mm d−1 thresholds; white contours indicate 20 mm d−1.
This study aims to develop a catalog that analyzes and characterizes extreme precipitation events by season. These events have significant implications for the local population, posing risks of disasters such as floods and debris flows, as they represent the most severe weather conditions in the region. Documenting them contributes to meteorological and hydrological risk studies and enables practical applications such as composite analysis of storm dynamics, coarse estimation of debris flow volumes (based on precipitation-driven transport capacity), and characterization of rainfall-induced debris flow events. The catalog provides valuable insights into managing extreme precipitation events in northern Chile, particularly in sediment-rich, mountainous areas where rainfall intensity directly determines debris-flow magnitude. By linking storm characteristics to geomorphic impacts, this work bridges meteorological data with hazard assessment, supporting targeted risk mitigation strategies.
Section 2 outlines the study area, including its latitudinal bands, climate, and geographical context. Section 3 details the datasets and methodologies employed, emphasizing criteria for event selection and analytical frameworks for snow line elevation. Building on this foundation, Sect. 4 presents the catalog results an analysis of extreme precipitation events, identifying storm-dominant characteristics through maps and dynamical diagnostics. Section 5 demonstrates the catalog's applied potential, including composite storm analysis, contrast of rainfall-induced debris flow events, and coarse estimation of debris flow volumes illustrated through a case study of a debris flow triggered by an extreme rainfall event. Finally, Sect. 6 synthesizes key findings, provides discussions, and concludes our research.
To facilitate the isolation of precipitation events from different weather systems, the region is divided into three distinct areas based on the climatological characterization of Chilean precipitation and the synoptic patterns associated with precipitation events (described in Aceituno et al., 2021). The criteria considered latitude, meteorological station density, the spatial distribution of precipitation climatology, and the frequency and intensity of precipitation events. The latitudinal band 1 (LB1, 17.5–23.5° S, see Fig. 1) is dominated by austral summer convective precipitation linked to the SAMS, the latitudinal band 2 (LB2, 23.5–27° S) represents a transitional zone where both summer convective and winter synoptic systems can produce extreme events, and the latitudinal band 3 (LB3, 27–30° S) is increasingly influenced by mid-latitude frontal systems, cut-off lows, and atmospheric rivers.
Figure 1 further characterizes the study area, showing the elevation in northern Chile, reaching over 5000 , and the seasonal composites of precipitation for the strongest daily events across the three latitudinal bands for each year (1979–2019). During summer (December, January, and February, or DJF), extreme precipitation is concentrated over the Andes in the northern part of the study area (average around 10 mm d−1), while winter (JJA) events are strongest in LB3 and extend toward the coast (up to 20 mm d−1). Intermediate seasons (MAM-SON) display transitional patterns with a NE–SW precipitation gradient. These distinct seasonal and latitudinal differences in the spatial distribution of extreme precipitation support the need to analyze events separately across the three defined latitudinal bands.
It is important to note that, since single meteorological events can occur in large spatial extent, some extreme events from the catalog will not be constrained to a single latitudinal band as the same storm date can appear across multiple bands, which can be potentially portrayed as different precipitation categories.
We analyzed seasonal extreme precipitation events from 1979 to 2019 using the CR2METv2.5 precipitation product (Boisier et al., 2018). CR2METv2.5 is a station-based gridded product constructed using logistic regression for precipitation occurrence and multiple linear regression using topographic features and ERA5 fields for the same period. This product was selected because it combines station observations and reanalysis data at a spatial resolution (0.05°) suitable for resolving the sharp topographic gradients of northern Chile, while providing consistent daily coverage over the full study period. However, CR2MET inherits limitations from the sparse station network in the hyperarid north, and any systematic biases in the product are carried into the catalog. We also analyzed vertically integrated water vapor transport (IVT) derived from the ERA5 reanalysis (Hersbach et al., 2020a), calculated between the surface (sfc) and the top of the atmosphere pressure levels (toa, equivalent to 0.01 hPa; Eq. 1). Precipitation data show daily accumulated values, and IVT was analyzed at 20:00 UTC (16:00 local time) to capture vapor transport characteristics during the typical afternoon period of enhanced convective activity (e.g., Falvey and Garreaud, 2005; Garreaud, 2009).
To identify extreme precipitation events, we analyzed precipitation at the grid-cell level rather than using spatially averaged values, capturing the localized signals relevant for small-scale hydrometeorological hazards. In a study region characterized by extreme aridity, precipitation events are infrequent and typically short-lived, often of convective origin, making the daily timescale sufficient to capture each storm as a discrete occurrence without risk of merging distinct events. Furthermore, area-based metrics tend to favor large-scale, low-magnitude events that cover extensive areas but are less sensitive to localized high-intensity storms. By selecting the grid cell (∼ 25 km2) with the highest daily precipitation for each year, season, and latitudinal band, we ensured that these localized extremes were captured. This is particularly relevant for the study area since high-intensity precipitation is a primary trigger for floods and debris flows, whose initiation is governed by rainfall intensity, duration, and antecedent conditions (Berti et al., 2020; Nikolopoulos et al., 2017).
The date of this highest value was then used to extract the full spatial precipitation field for that day, hereafter referred to as the maximum seasonal precipitation event for that band. This approach ensures that each event corresponds to a single coherent day of precipitation while targeting the most intense occurrence in the record. All selected events present in the catalog were also visually inspected to verify that the identified precipitation fields corresponded to coherent storm structures, with affected areas approximately greater than 250 km2, which is consistent with the spatial scale of convective precipitation (around 100 km in one direction; Houze, 2004).
The analysis was conducted at daily resolution, which is the finest temporal scale available from the CR2METv2.5, with a 0.05° per 0.05° spatial resolution (∼ 25 km2 per grid cell). Although sub-daily rainfall characteristics are also relevant for debris flow initiation (Berti et al., 2020; Zhang et al., 2020), daily precipitation maxima provide a robust first-order indicator of extreme forcing in arid environments where sediment availability is generally unlimited and transport capacity is primarily controlled by rainfall magnitude and geomorphic connectivity (Aguilar et al., 2020).
Once identified, extreme precipitation events within the three defined LBs were classified based on two criteria: the spatial distribution of precipitation within the latitudinal band and the associated IVT pattern. Events with precipitation concentrated along or near the coastline were classified as Coast, events with precipitation spread across most of the band as Stratiform, and events with precipitation concentrated over the Andes as Andes Mountain. The Andes Mountain category was further subdivided based on the latitudinal position of precipitation along the cordillera (North, South, or Along Andes) and the IVT structure (Convergence or Westerly IVT). Classification was performed through systematic visual inspection of precipitation and IVT fields, as illustrated in Figs. 3 and 4. While this approach is qualitative, its internal consistency is supported by the coherent synoptic patterns that emerge when compositing events within each category (Figs. 7 to 9). All extreme precipitation events identified from 1979 to 2019 fall under defined main categories; however, not all subcategories appear in every season. Events were excluded when the seasonal maximum precipitation within the latitudinal band was confined to isolated border grid cells or exhibited negligible magnitude, indicating no coherent precipitation signal. This determination was made through visual inspection of each event's spatial precipitation field, discarding those covering fewer than approximately 10 grid cells, equivalent to roughly 250 km2 at the 0.05° resolution of CR2METv2.5. These events are labeled as Omitted in the catalog (20 out of 492 band-season-year combinations), and remain accessible in the dataset for transparency.
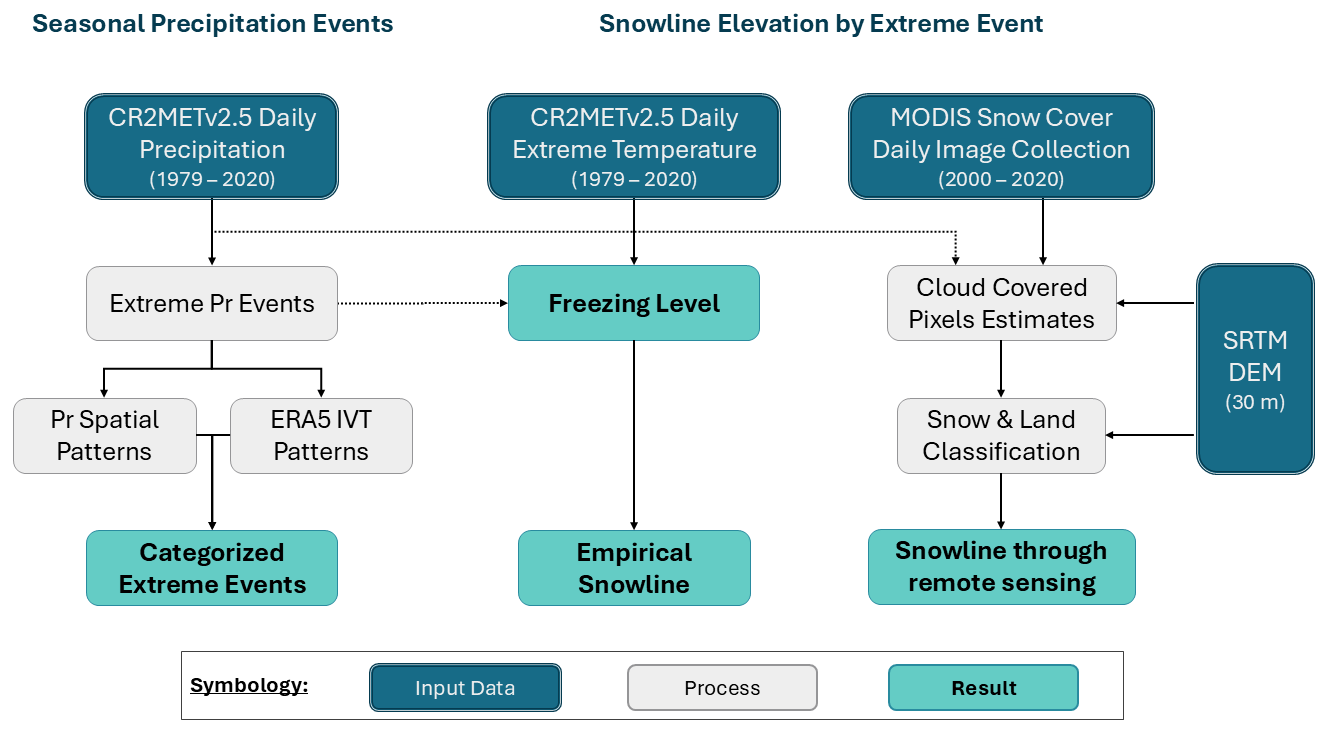
Figure 2Flowchart of the process and selection of extreme precipitation events and the estimation of snowline elevation during the events. The methodology was applied for each latitudinal band from 1979 to 2019.
The snowline elevation was estimated for each event through the use of an empirical method, as well as remote sensing techniques in order to quantify the difference obtained from both methods. Equation (2), proposed by Garreaud (1992), estimates the snow line elevation as the freezing level (0 °C, denoted as H0) of the event minus 300 m; this elevation difference comes from the ratio between the moist lapse rate (γ = 5.8 °C km−1) and the threshold temperature to discriminate between solid and liquid precipitation (around 1 and 2 °C) in Chile. The freezing level H0 was estimated through a linear regression between the surface height and the mean temperature from the CR2MET product during each event, considering only the grid-cells affected by precipitation, as very different conditions may be observed at similar latitudes (see the DJF composite in Fig. 1). For elevation, we upscaled the Shuttle Radar Topography Mission digital elevation model (Farr et al., 2007) to the CR2MET grid resolution (0.05°).
The snow line estimation through remote sensing used the MODIS Snow Cover daily product (MOD10A1 and MYD10A1, version 6.1) derived from the TERRA and AQUA satellites (Hall et al., 2002; Hall and Riggs, 2021a, b). We created a gridded binary time serie with a 500 m spatial resolution during 2000–2019, indicating snow/no snow based on each cell's normalized difference snow index (NDSI) value informed by MODIS Snow Cover. We considered those cells with a NDSI ≥ 0.4 as snow (DeWalle and Rango, 2008), and the opposite case as no snow. Additionally, we estimated the presence of snow/no snow for the cloud-covered pixels (identified as no data by the satellites) for each day according to the methodology proposed by Gafurov and Bárdossy (2009): (1) merging TERRA and AQUA imagery for the same day, where cloud-covered pixels can be filled complementing both satellites, (2) a temporal fill, where missing pixels can be flagged as snow when the previous and/or the next day has snow, (3) an elevation fill, where cloud-covered pixels were filled as snow if their elevation is greater than the maximum snow elevation observed for day i, and not snow otherwise, and (4) neighbor comparison filling, according to the dominant snow presence in their neighborhood. After the gridded binary was complete, the observed snowline elevation by remote sensing () was calculated based on the methodology described by Krajčí et al. (2014): we determined the total number of snow pixels below each elevation in the latitudinal band (PS) and the total number of no snow pixels above it (PL); the snowline is then selected as the elevation H where PS+PL is minimum (Eq. 3). This optimization defaults to the maximum elevation in the latitudinal band when there is no snow cover, and the minimum elevation when the the whole area is covered.
Figure 2 presents a flow chart illustrating the criteria and processes used to identify seasonal extreme precipitation events and determined their associated snowline elevations during the study period.
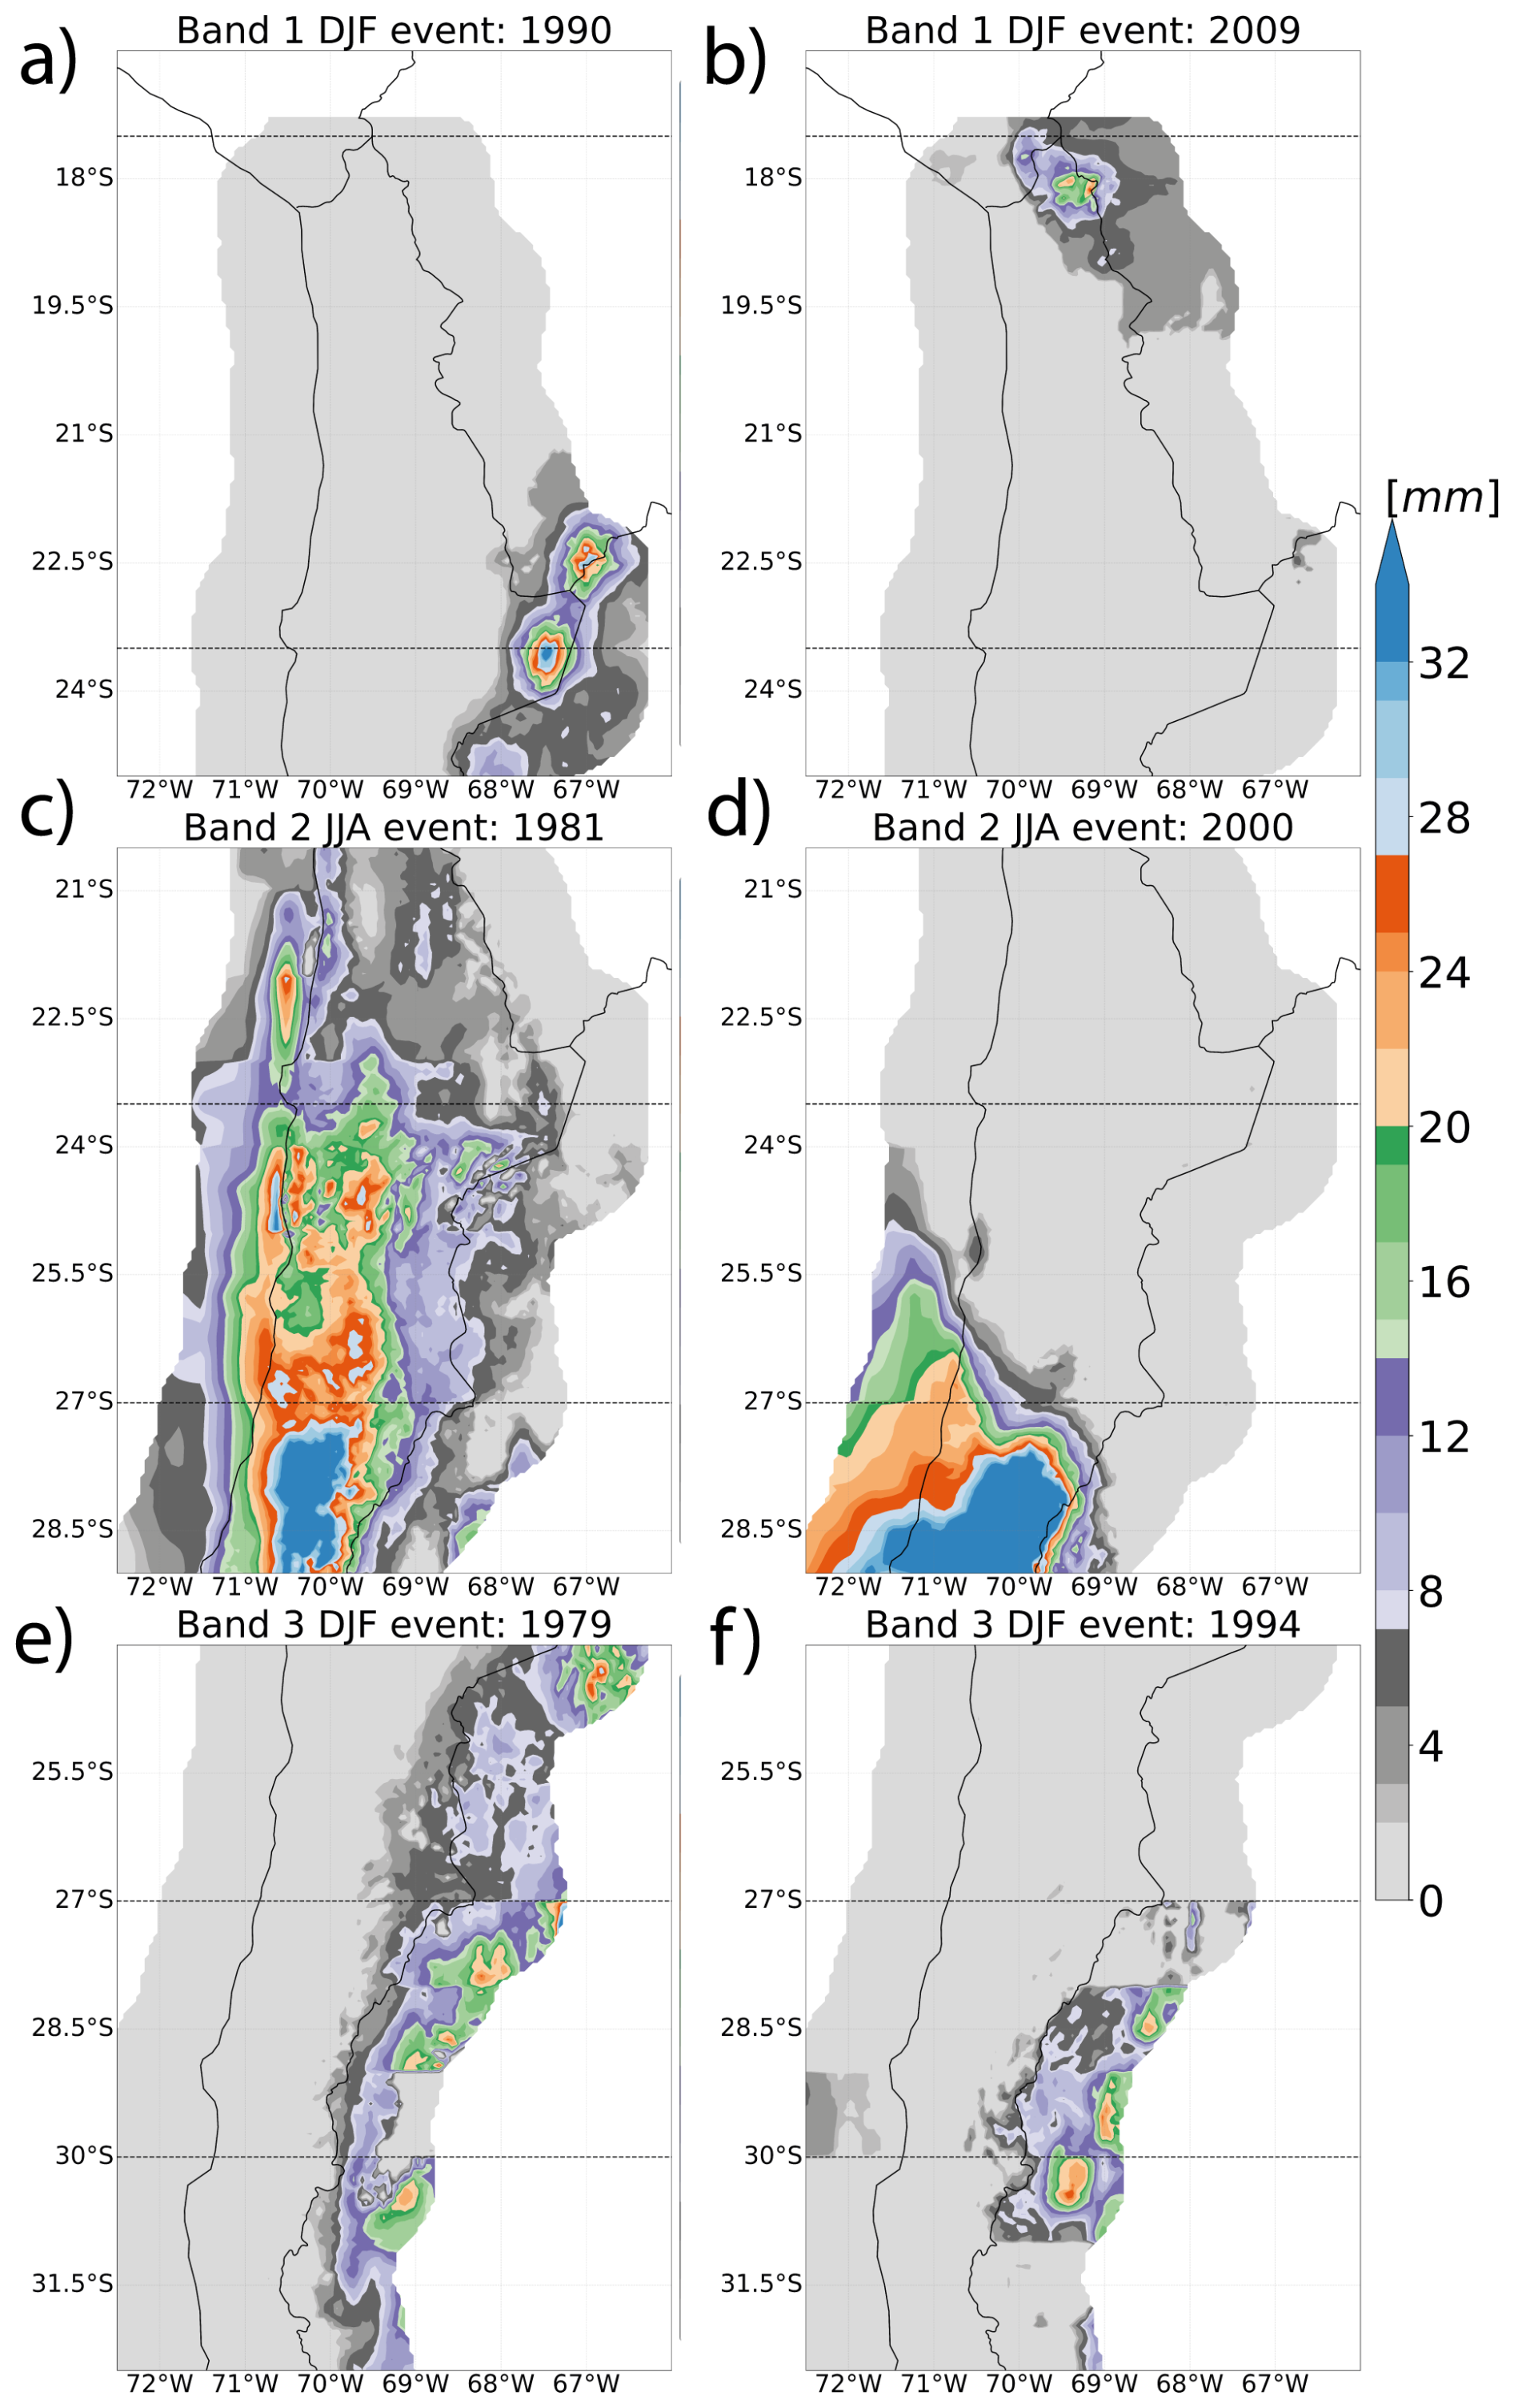
Figure 3Representative examples of precipitation patterns (mm) for the extreme precipitation events identified in the catalog, selected to display typical patterns for each category. The black rectangle delimits the latitudinal band related to the event. The panels (a) and (b) show the summer events of 1990 and 2009 in LB1, with a Andes Mountain/South Andes and Andes Mountain/North Andes category, respectively; panels (c) and (d) correspond to the winter events of 1981 and 2000 in LB2, with a Stratiform and Coast category, respectively; and the panels (e) and (f) are the summer events of 1979 and 1994 in LB3, with a Andes Mountain/Along Andes category.
4.1 Extreme precipitation events classification
To illustrate the diversity of spatial precipitation patterns from the catalog (available at https://doi.org/10.5281/ZENODO.14342935; Matus et al., 2026), Fig. 3 shows representative examples of each precipitation category, with band and season combinations selected to showcase categories that are unique or best represented in specific contexts. For instance, LB2 winter is shown because it is where both Stratiform and Coast categories coexist (Fig. 3c and d), while LB3 summer is presented because it is the only band and season where the Convergence and Westerly IVT subcategories are observed (Fig. 3e and f). These events represent the general precipitation categories for each latitudinal band: (1) Andes Mountain, with precipitation over the Andes (Fig. 3a, b, e, and f); (2) Stratiform, with precipitation spread over most of the latitudinal band (Fig. 3c); and (3) Coast, with precipitation concentrated along and near the coastline (Fig. 3d).
We found that the Andes Mountain category can be further divided into subcategories based on precipitation location and associated water vapor transport, which vary across latitudinal bands and seasons. We identified three main subcategories based on the precipitation distribution along the mountain sector of the LBs: (1) South Andes, with precipitation concentrated in the southern sector (Fig. 3a); (2) North Andes, with precipitation concentrated in the northern sector (Fig. 3b); and (3) Along Andes, with precipitation observed across the Andes sectors (Fig. 3e in the three bands, and Fig. 3f in LB2).
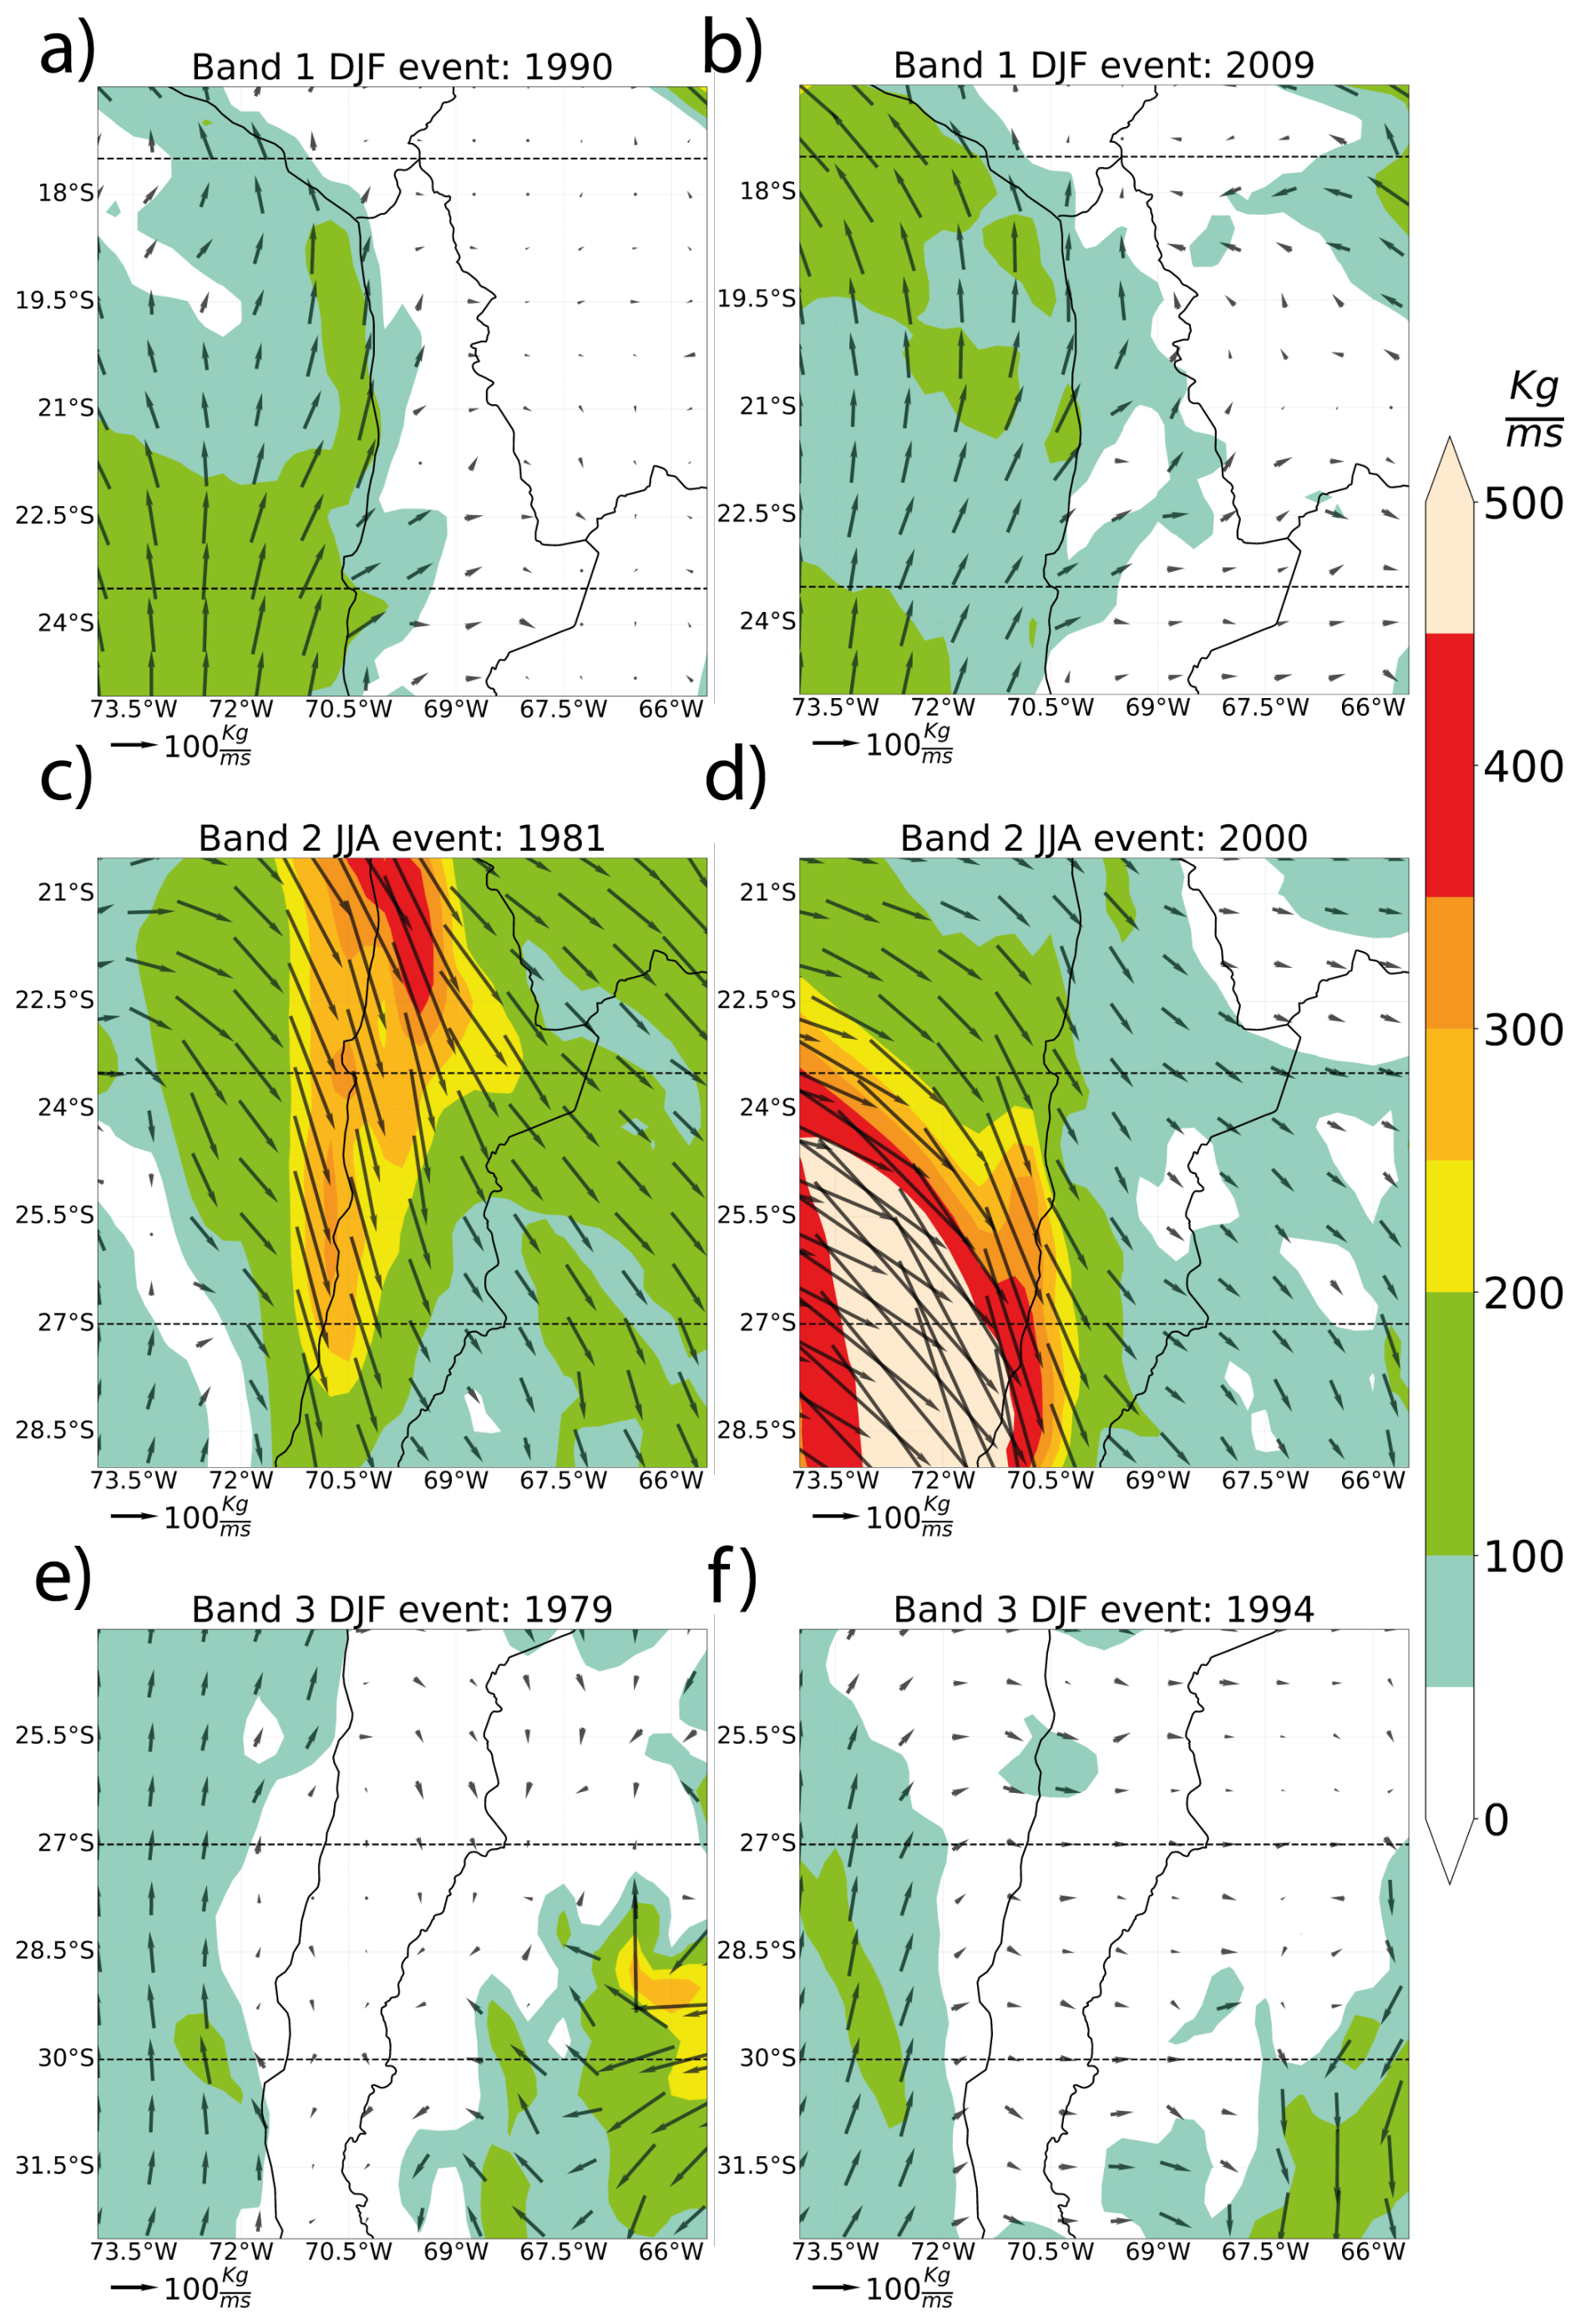
Figure 4Examples of vertically Integrated Water Vapor Transport (kg ms−1) patterns for the representative examples of extreme precipitation events selected in the catalog. The black rectangle encloses the latitudinal band area related to the event. The uppermost panels show DJF LB1 results, the middle section corresponds to JJA LB2, and the lowermost panels are for DJF LB3 precipitation patterns.
Figure 4 shows the IVT patterns for the extreme precipitation events shown in Fig. 3. We analyzed the relationship between precipitation patterns and the associated water vapor transport structures. For example, the precipitation categories Coast and Stratiform (Figs. 3c, d and 4c, d) are associated with a northwesterly IVT signal, although their magnitudes are distributed differently across space. In contrast, events in the category Andes Mountain (Fig. 3a, b, e, and f) with similar precipitation patterns can exhibit different IVT structures, as shown in Figs. 3e, f and 4e, f, characterized by moderate southerly water vapor transport parallel to the Pacific coast, with some intrusion to the continent, but with differences in transport from the Argentinian western Andes.
Table 1Number of events per category, season and latitudinal band of the catalog. Hyphens indicate that the category was not observed for that band and season.
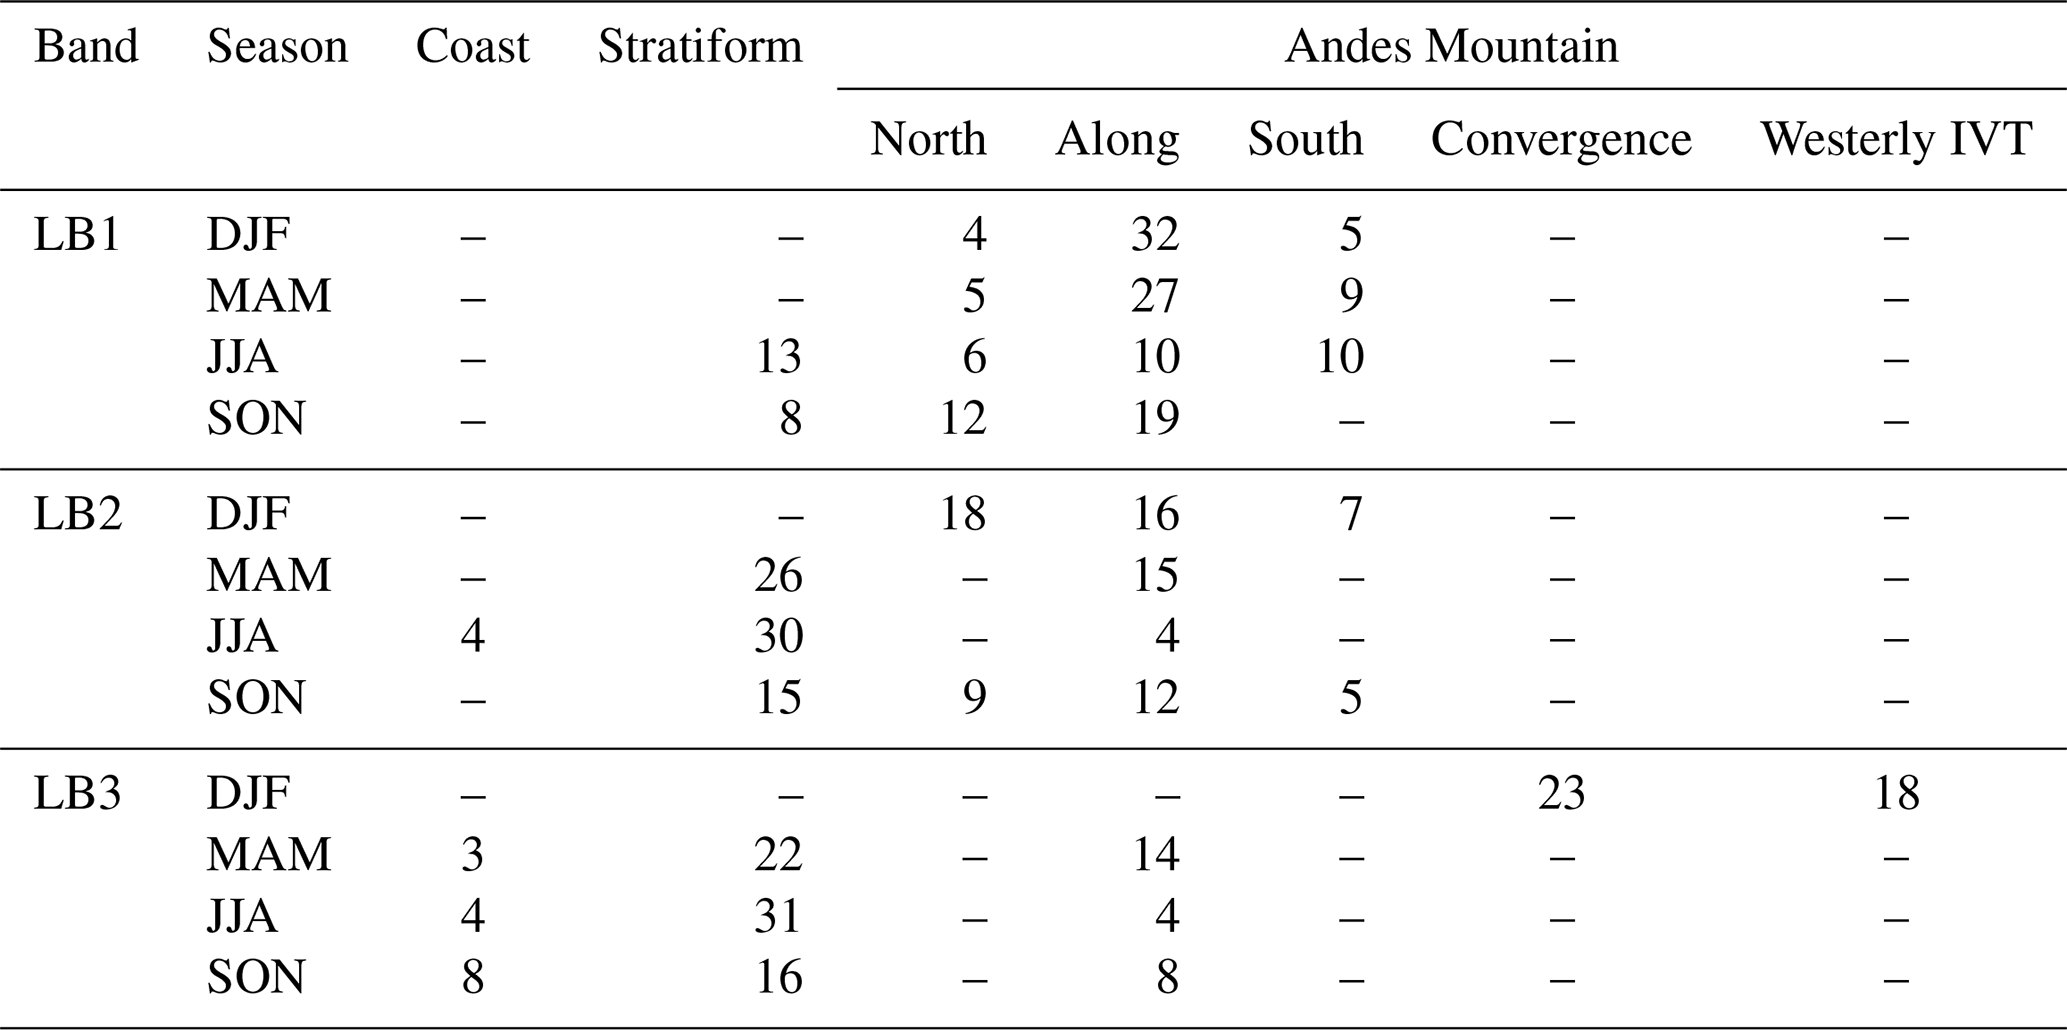
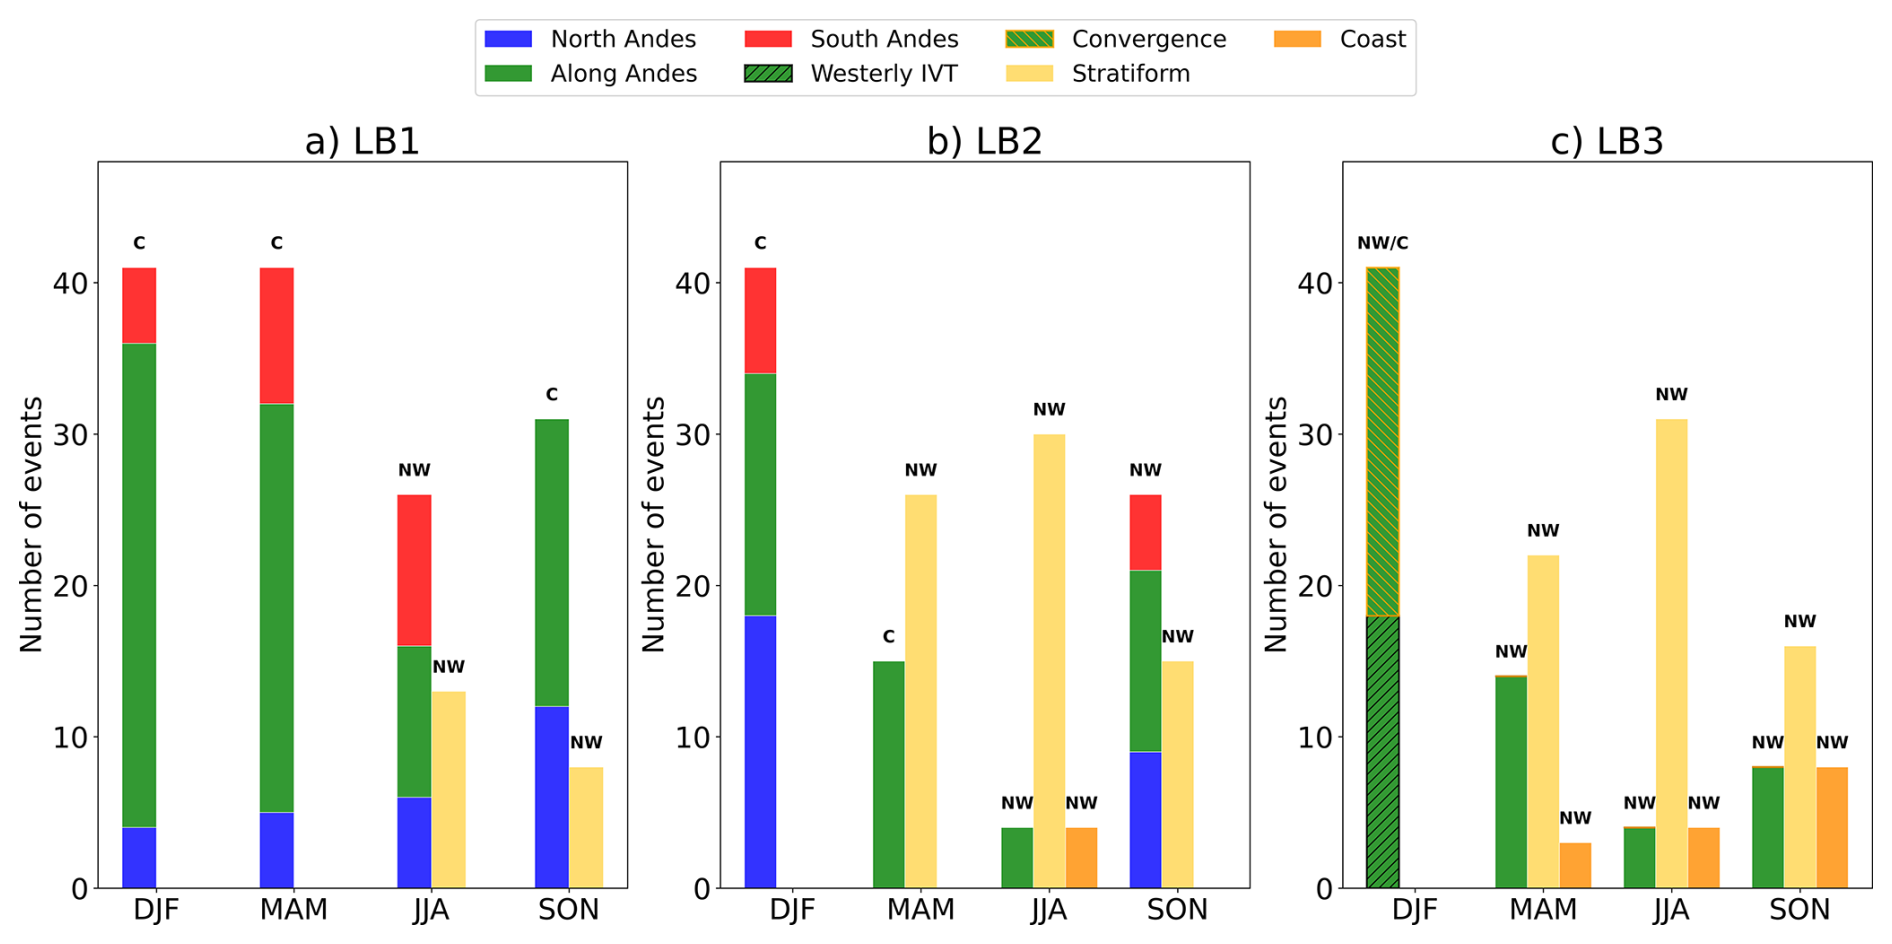
Figure 5Bar plots for the number of events per category, season, and latitudinal band, observed in Table 1. The upper panel exhibit the distribution of events for the three main categories (Andes Mountain, Stratiform, and Coast). The bottom panel depicts the number of events per subdivision of the Andes Mountain category. “NW” and “C” correspond to Northwesterly and Convergence, which are the mean IVT directions observed in the composites of the categories by season over the latitudinal bands.
By comparing Andes Mountain precipitation and IVT patterns, we further divided the subcategory Along Andes. In the austral summer, LB3 was the only region where clear differences in IVT patterns were observed between Along Andes events. As a result, we classified the IVT signals into two distinct patterns: Convergence and Westerly IVT. The Convergence pattern is associated with IVT convergence from the South Pacific and the east of the Andes Mountains (Fig. 4e). In contrast, the Westerly IVT pattern is characterized by transport from the South Pacific (Fig. 4f).
As a summary of our results, we identified three main categories of extreme precipitation events: Andes Mountain, Coast, and Stratiform. The category Andes Mountain showed variability across events and was further divided into subcategories based on precipitation and IVT patterns: North Andes, South Andes, Along Andes, Westerly IVT, and Convergence.
To quantify the distribution of events and identify predominant patterns, Table 1 and Fig. 5 provide a comprehensive overview. Table 1 summarizes the number of events per category, season, and latitudinal band, while Fig. 5 illustrate the mean IVT directions for each category. Together, they offer insight into the spatial and seasonal distribution of extreme events and their associated IVT patterns.
Overall, not all categories are present in every season or latitudinal band, and some are more prevalent than others. As shown in Fig. 5 (upper panel), most events in the catalog occur in the Andes Mountain, followed by Stratiform events, which are primarily found in LB2 and LB3. It also illustrates the events distribution within the Andes Mountain category, showing that Along Andes events are the most frequent, particularly toward LB3 (Fig. 5, bottom panel). While each category is generally associated with a characteristic IVT pattern, the subcategories Convergence and Westerly IVT are observed only in LB3 during the austral summer, reflecting the mixed distribution of IVT patterns in these events rather than a single dominant IVT type, and highlighting the seasonal and spatial specificity of these patterns.
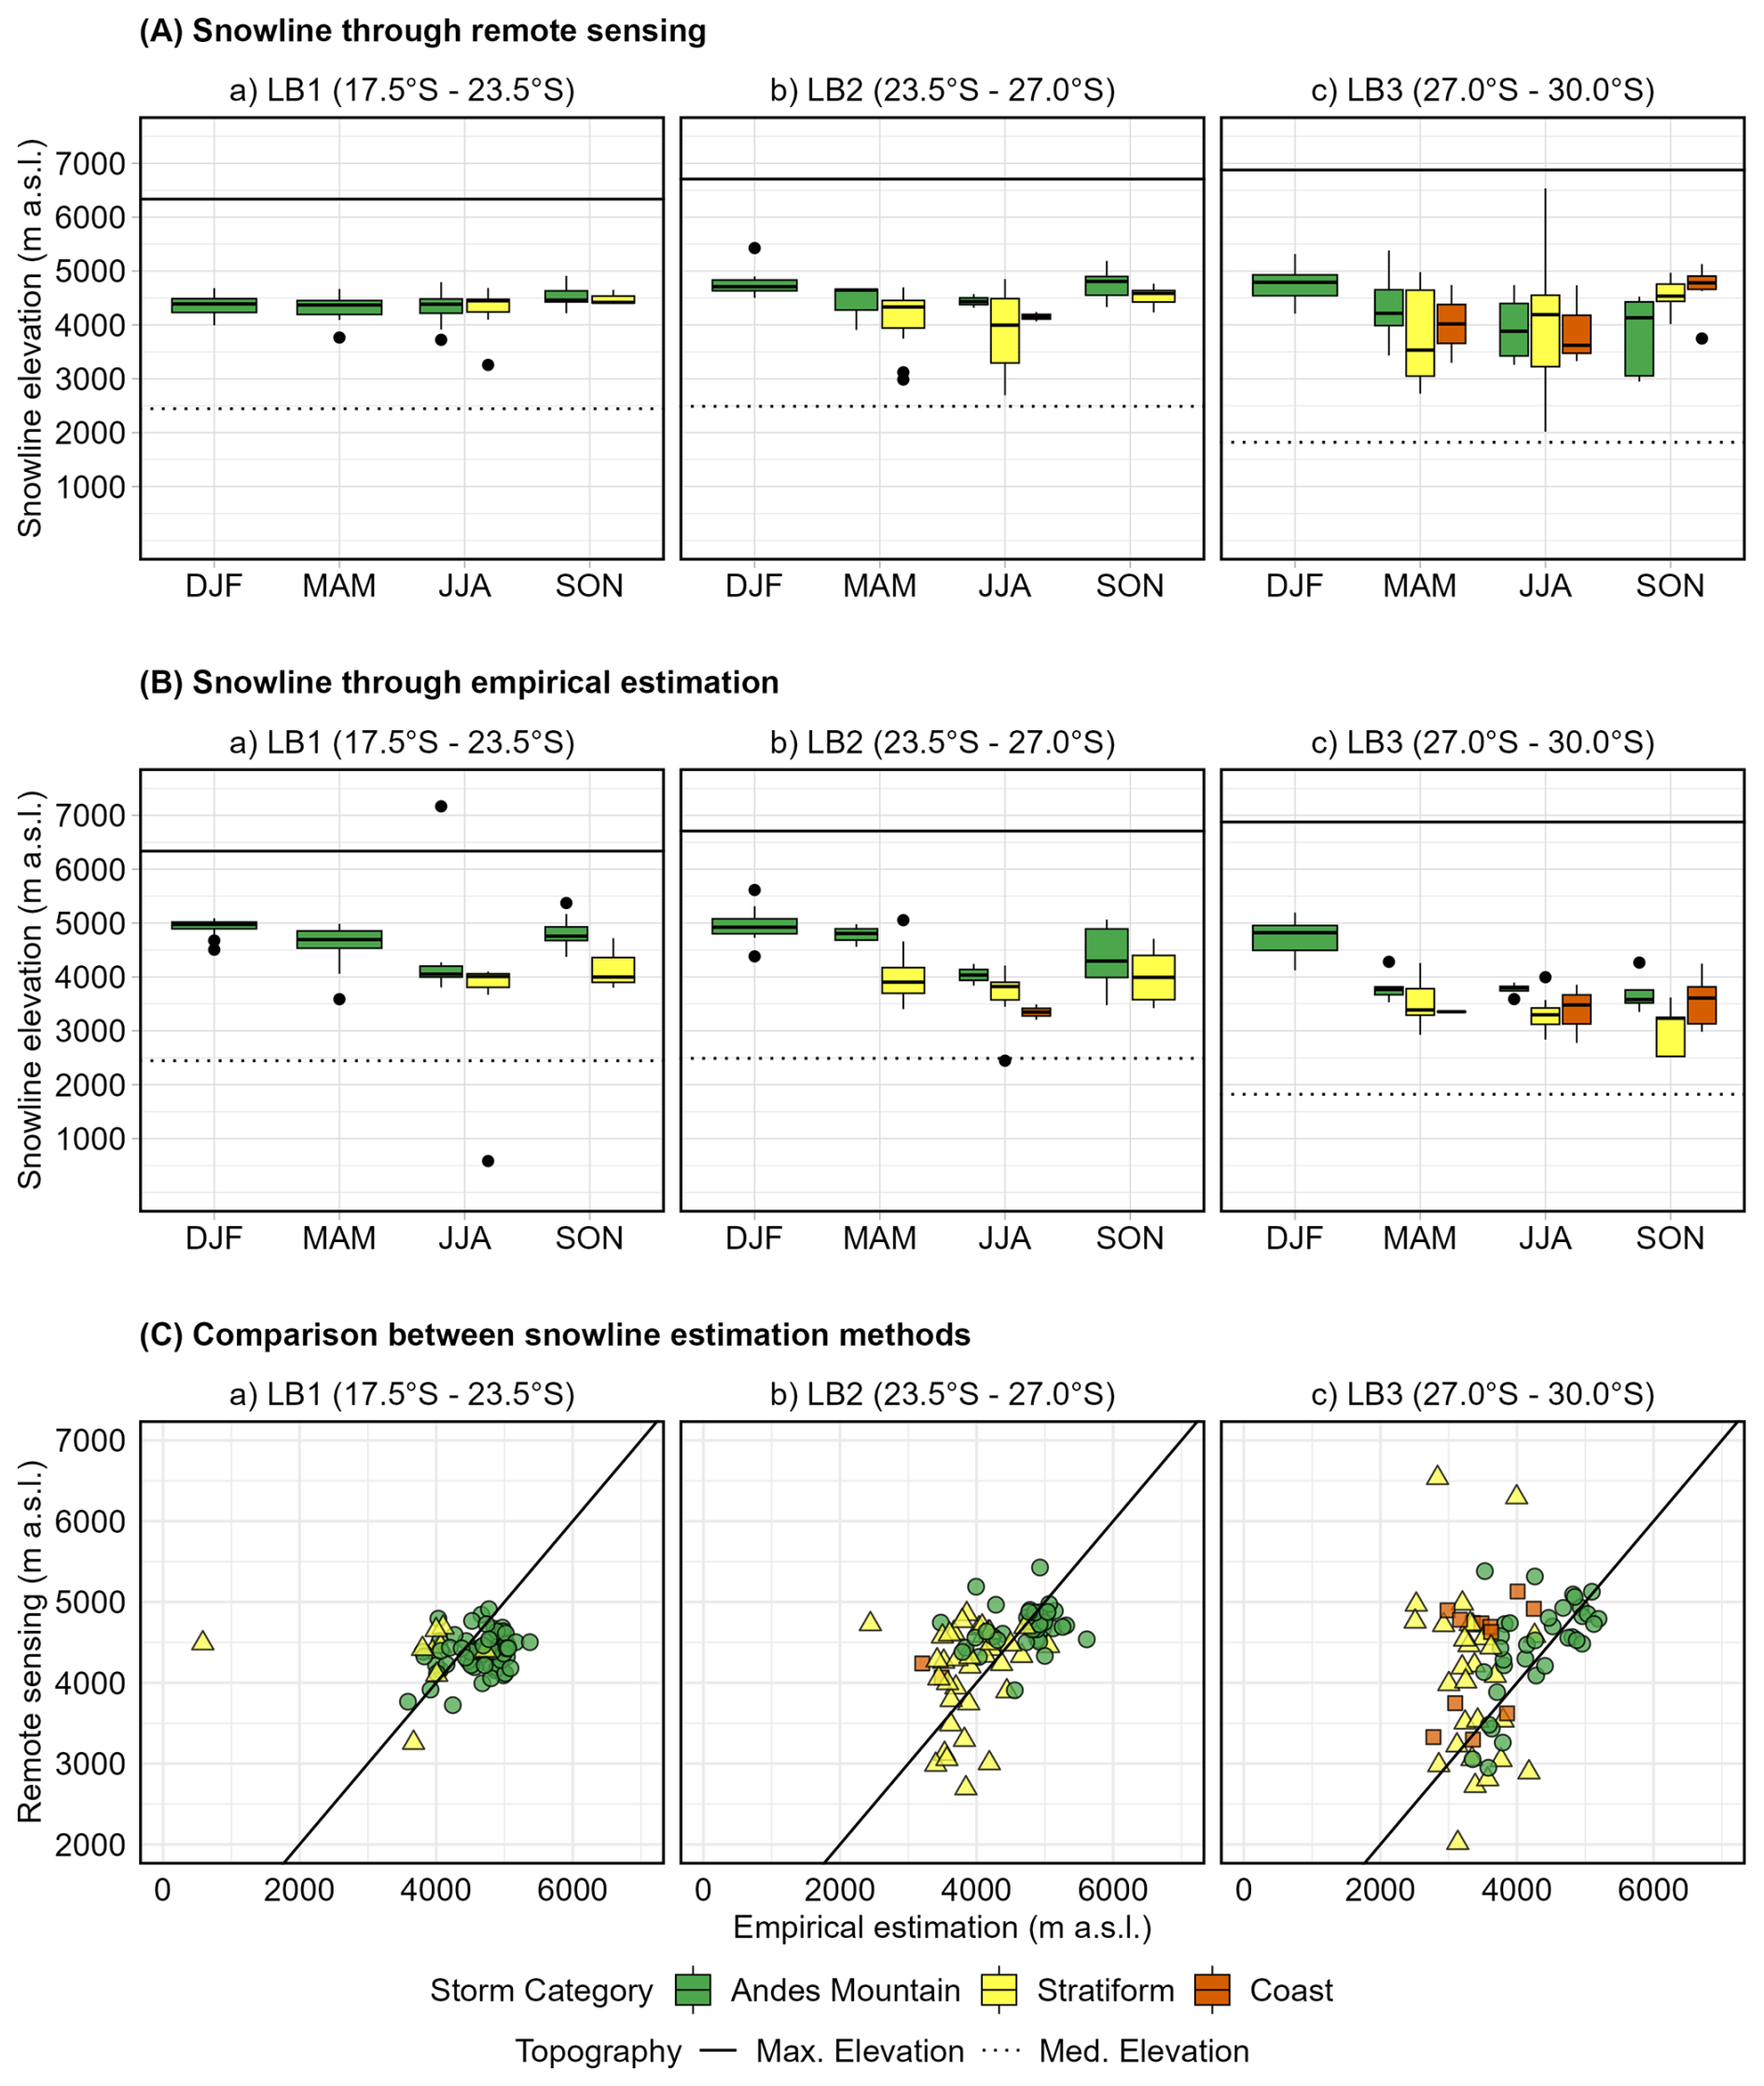
Figure 6(A) Snowline elevation detected through MODIS imagery, (B) estimated empirically in each latitudinal band, and (C) estimation scatter plot, categorized by storm during 2000–2019. The Maximum (solid line) and median (dotted line) elevations by band are also included to illustrate the snow-covered area.
Table 2Mean and standard deviation of the snowline () estimated by both methods for each latitudinal band, season, and storm category for the extreme precipitations events during 2000–2019 and 1979–2019. RMSE and R2 were calculated based on the 2000–2019 data for both methodologies.
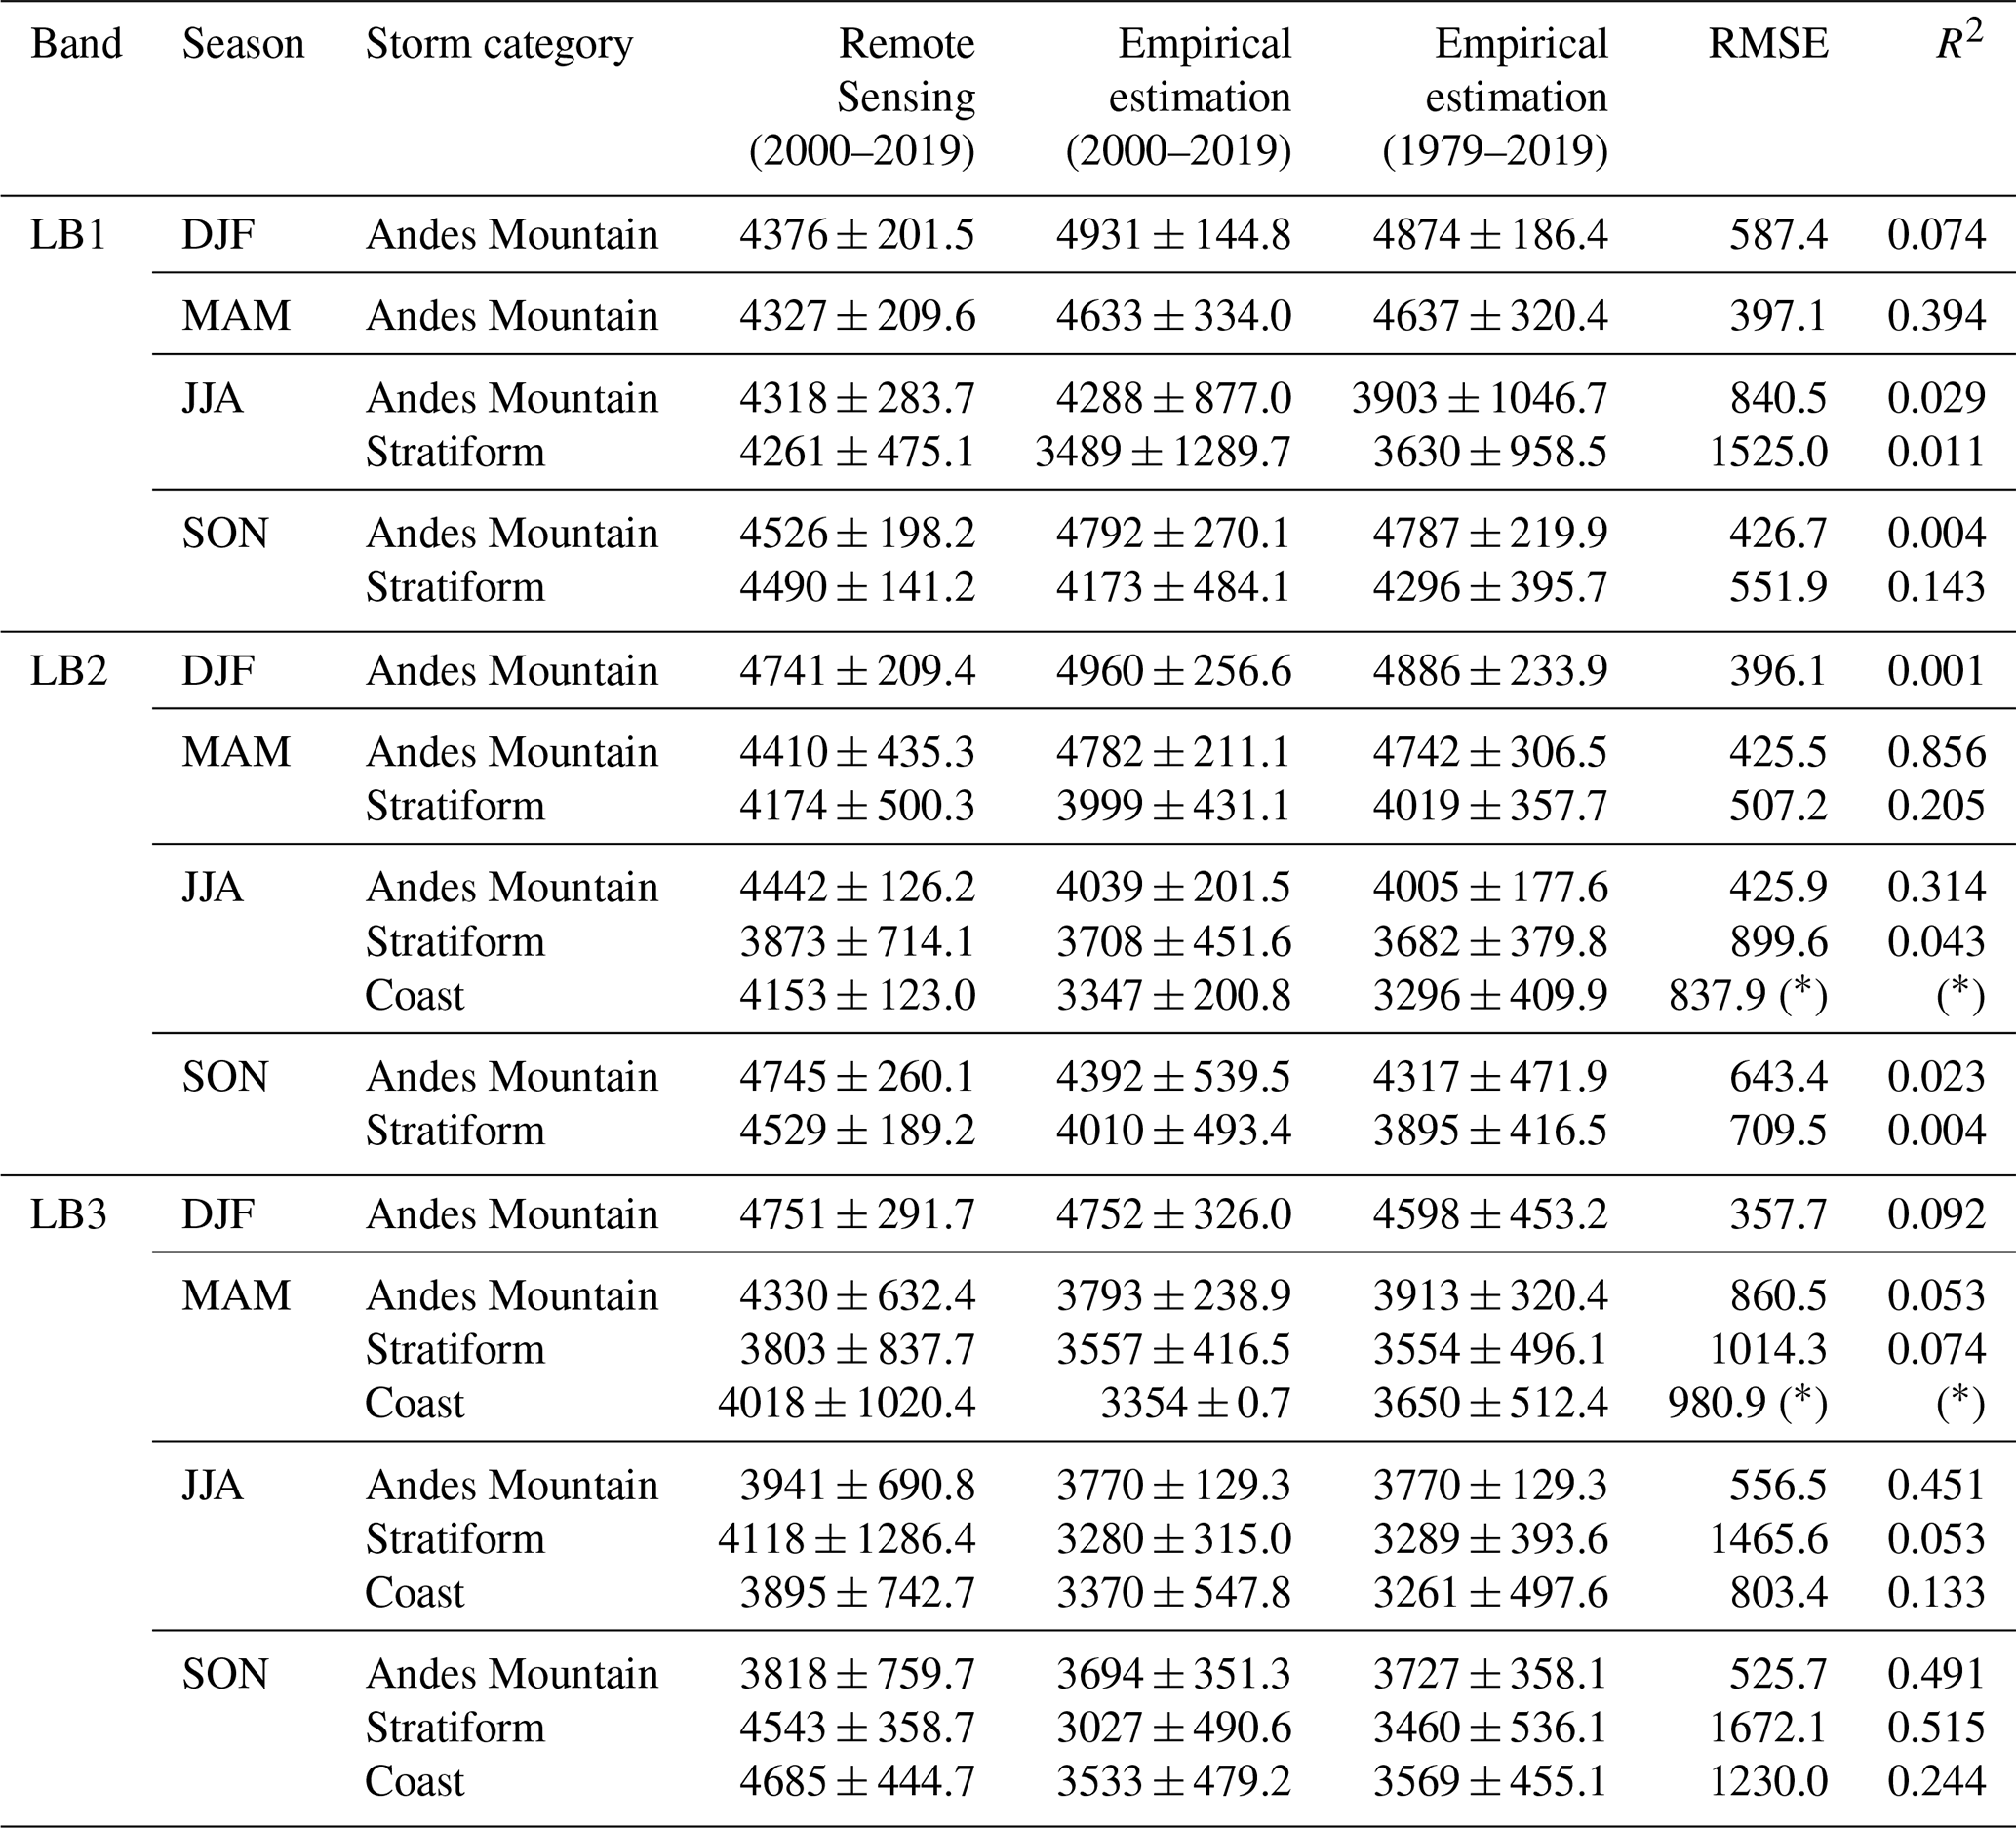
Note: (∗) Only one event was available for this combination; therefore, RMSE is the difference between estimations, and R2 could not be calculated.
4.2 Freezing level and snowline delimitation
The observed snowline elevation derived from remote sensing during 2000–2019 exhibits different seasonal patterns across the latitudinal bands (Fig. 6A). In LB1, the median snowline elevation remains relatively constant throughout the seasons regardless of storm category (4370–4462 , Fig. 6A.a); however, Stratiform events in this band display greater variability and slightly lower mean elevations compared to events occurring in the Andes Mountains (see Table 2).
In contrast, observed snowline elevations in LB2 and LB3 (Fig. 6A.b and 6A.c) display a clear seasonal cycle that closely follows the regional air temperature and rainfall regime. Snowline elevations decrease during fall and winter, and reach their highest elevation during summer. In these bands, summer extreme precipitation events are primarily in the Andes Mountain category, with median snowlines of approximately 4750 and standard deviation of 209 m in LB2 and 292 m in LB3. During colder seasons, Stratiform events in LB2 and LB3 typically show lower snowline elevations that those in the Andes Mountain and Coast categories, with differences of approximately 250 m in their mean values. The Coast category is observed only in LB2 and LB3 and shows higher snowline elevations than the Andes Mountain category during spring in LB3. Since Coast events are less frequent in the study area, its standard deviation is smaller compared to the other categories.
Empirical snowline elevations (Fig. 6B) are estimated using event-specific thermal gradients to determine the freezing level as a baseline for snowfall occurrence; this can result in estimates that may exceed the maximum elevation of the latitudinal band (see Fig. 6B.a, winter season). Unlike the remote sensing approach, the empirical method does not account for pre-existing snow cover, which represents a fundamental difference between the two methodologies. As shown in Fig. 6B.a, empirical snowlines for the Andes Mountain category are located, on average, 274 m higher than those derived from remote sensing, whereas lower elevations are obtained from the Stratiform events' thermic gradients. In LB2 and LB3, summer snowline estimates are similar in magnitude between methods, while the largest discrepancies between methods occur during spring, when empirical snowline elevations for the Stratiform and Coast categories are approximately 1062 m lower than those derived from remote sensing (Fig. 6A).
The main statistics for each method in the period 2000–2019 are presented in Table 2, where it can be seen that the empirical estimation tend to produce higher snowline estimations than remote sensing in LB1, and during austral summer and fall in LB2, however, to higher latitudes this method presented lower estimations around 200 m. These differences may have important consequences for extreme flows and landslide estimations, especially during years prior to 2000, where only empirical estimations could be made because of remote sensing data availability. Because of this, the use of empirical methods, including in-situ and upper-air observations, may help complement the analysis.
Extreme precipitation events in northern Chile have significant hydrometeorological and geomorphic impacts such as flood and debris flows. We explored how cataloged events can be used to identify synoptic-scale drivers of intense rainfall, assess the links between extreme storms and debris flows, and estimate potential sediment yields from high-impact rainfall events. By connecting precipitation patterns with geomorphic responses, these applications demonstrate the catalog's utility for hazard assessment and decision-making in regions prone to extreme rainfall and associated hazards.
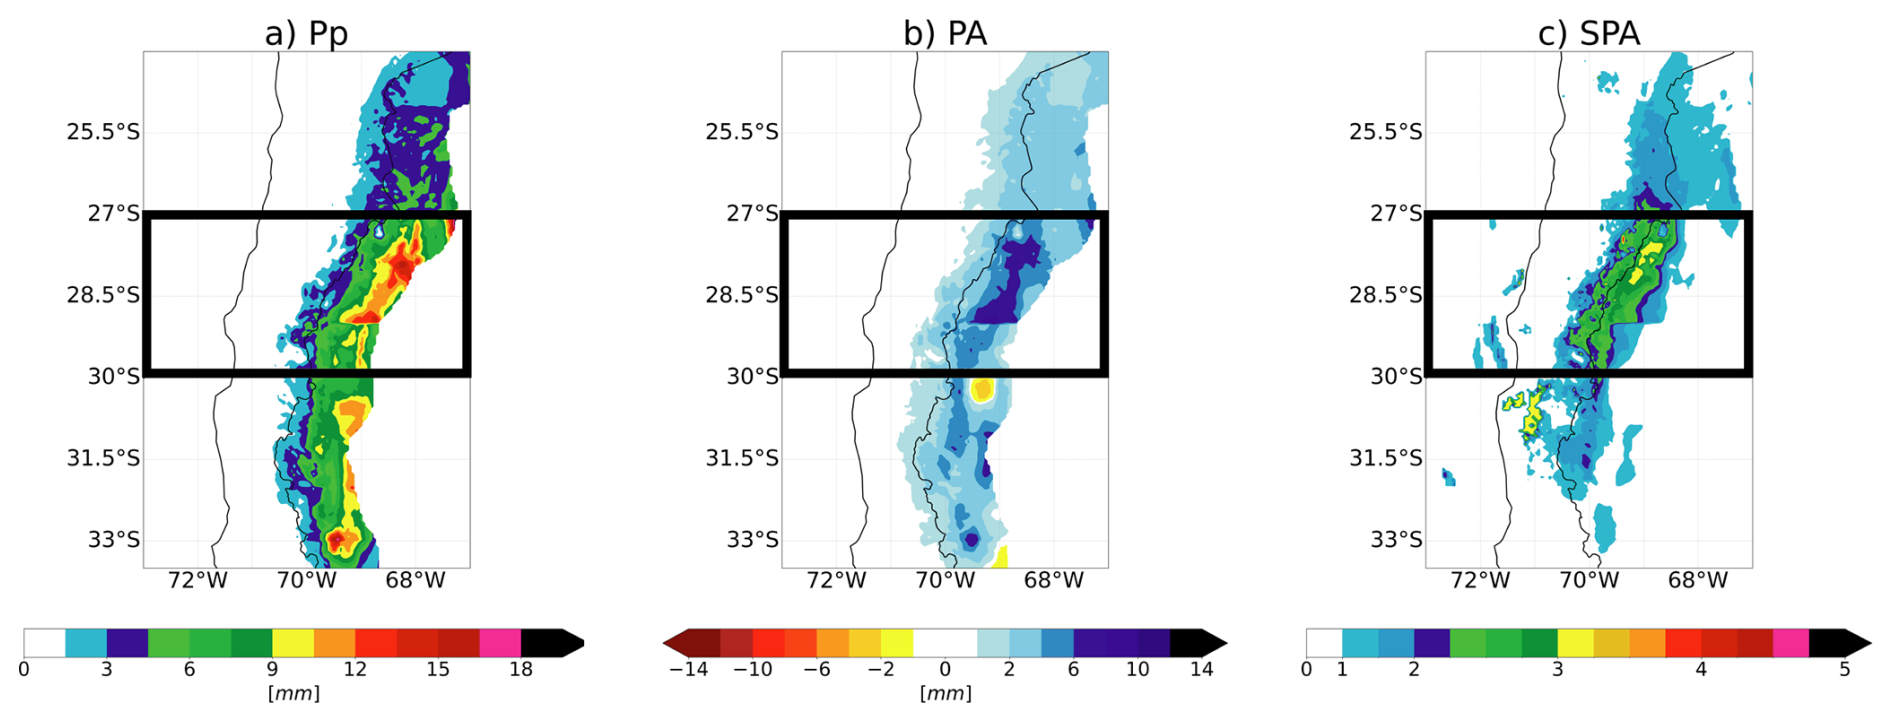
Figure 7Composites for the LB3 Convergence category in austral summer (DJF) of: (a) daily precipitation data (Pp); (b) precipitation anomalies (PA; from daily climatology); and (c) standardized precipitation anomalies (SPA; from daily climatology and daily standard deviation). The black rectangles frame the area related to the LB3 between 27–30° S.
5.1 Composites
We apply composite analysis to the different categories and latitudinal bands in order to explore the precipitation patterns and mechanisms of the registered extreme events. As a result, we capture the mean synoptic patterns associated with each event category. Here, we show the composite results for the LB3 austral summer Convergence category. Figure 7 exhibits precipitation over the Andes Cordillera. However, precipitation and standardized precipitation anomalies in LB3 are the highest. The three standard deviations from the mean observed in the LB3 indicate that the events selected to compose the catalog are extreme events. Under normal distribution conditions, these events are related to probabilities of occurrence of less than 0.1 % (∼ 10 years of return period, e.g. Rutllant et al., 2023).
These precipitation features are interpreted through the circulation patterns shown in the Fig. 8. We observe the presence of a ridge and anticyclonic circulation anomalies over southern South America and a trough with cyclonic circulation anomalies to the southwest of South America. Figure 9 shows the convergence of the IVT between the transport of water vapor from the Pacific and Argentina. The Pacific signal exhibits an anticyclonic circulation from the ridge-structured water vapor transport, with cyclonic deviation toward the LB3. The signal from Argentina displays anticyclonic circulation. Moreover, the anomaly and standardized anomaly analysis show that the IVT signal from Argentina has a higher standard deviation from the mean than the Pacific IVT, which is necessary to overpass the Andes.
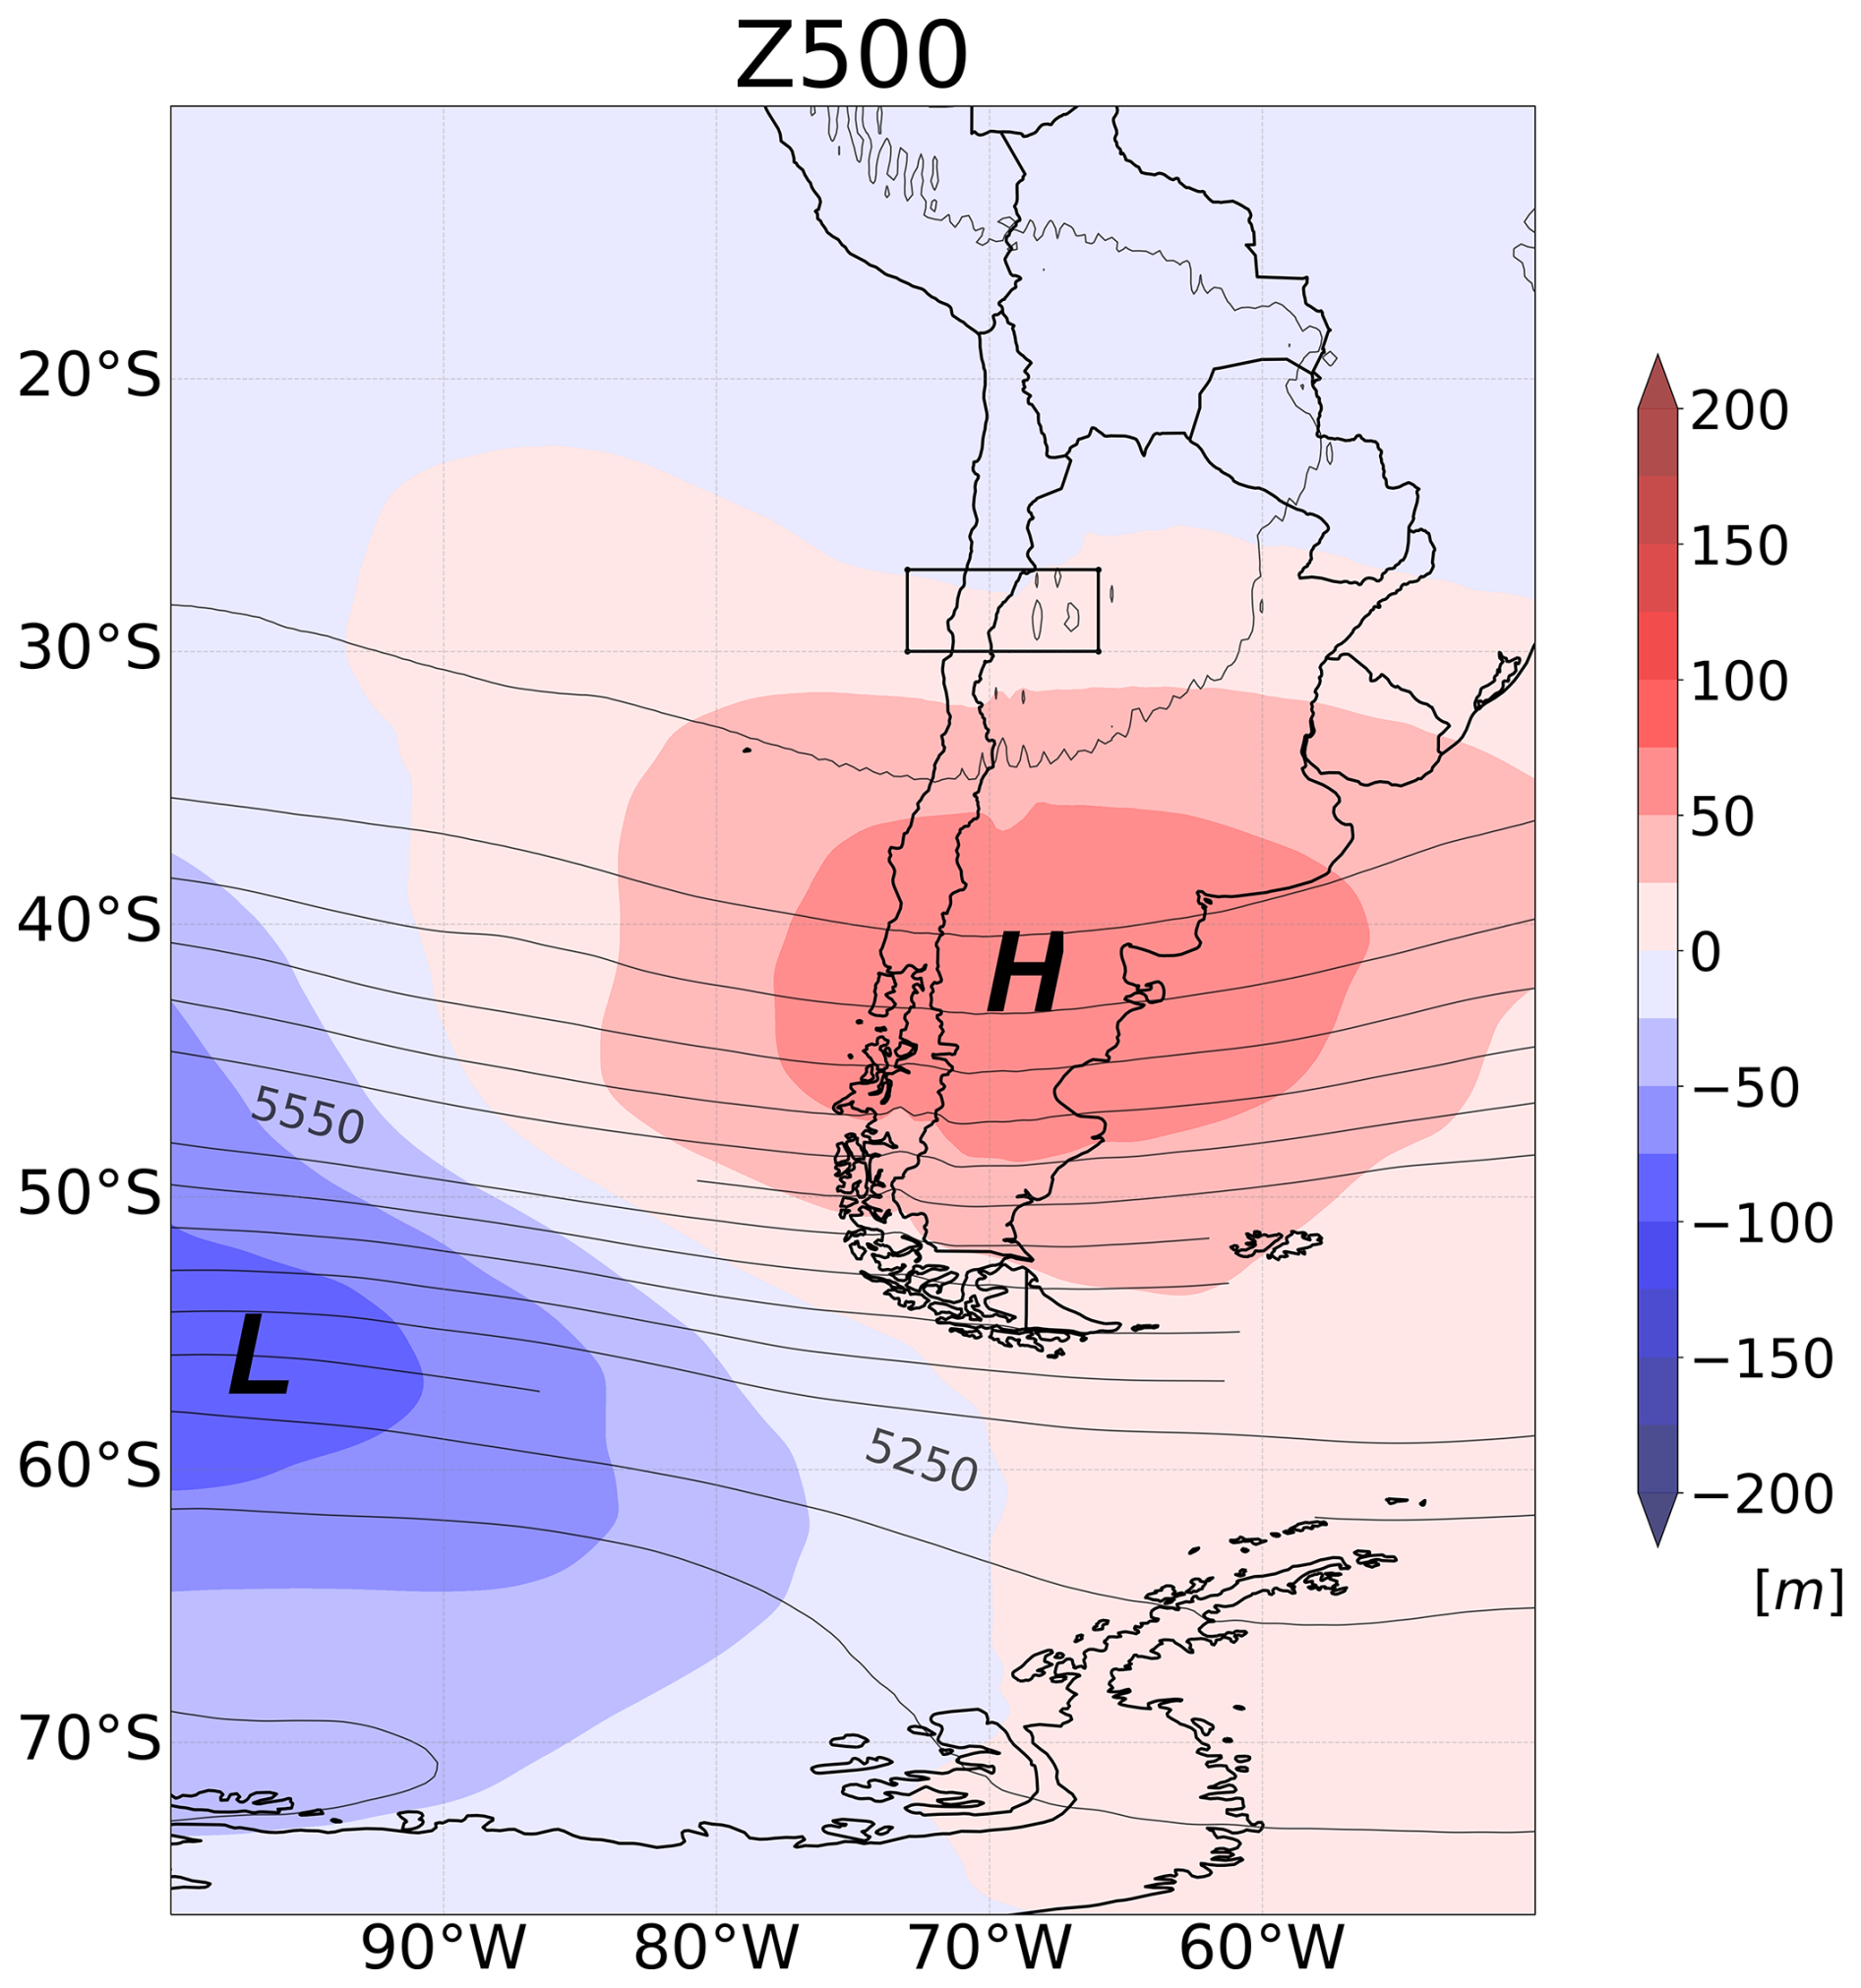
Figure 8Composites of geopotential height at 500 hPa (contours) and its anomalies (colors) for the category Convergence on austral summer (DJF). The black rectangle frames the area related to the LB3 between 27–30° S. Cyclonic (“L”) and anticyclonic (“H”) circulation anomalies are highlighted.
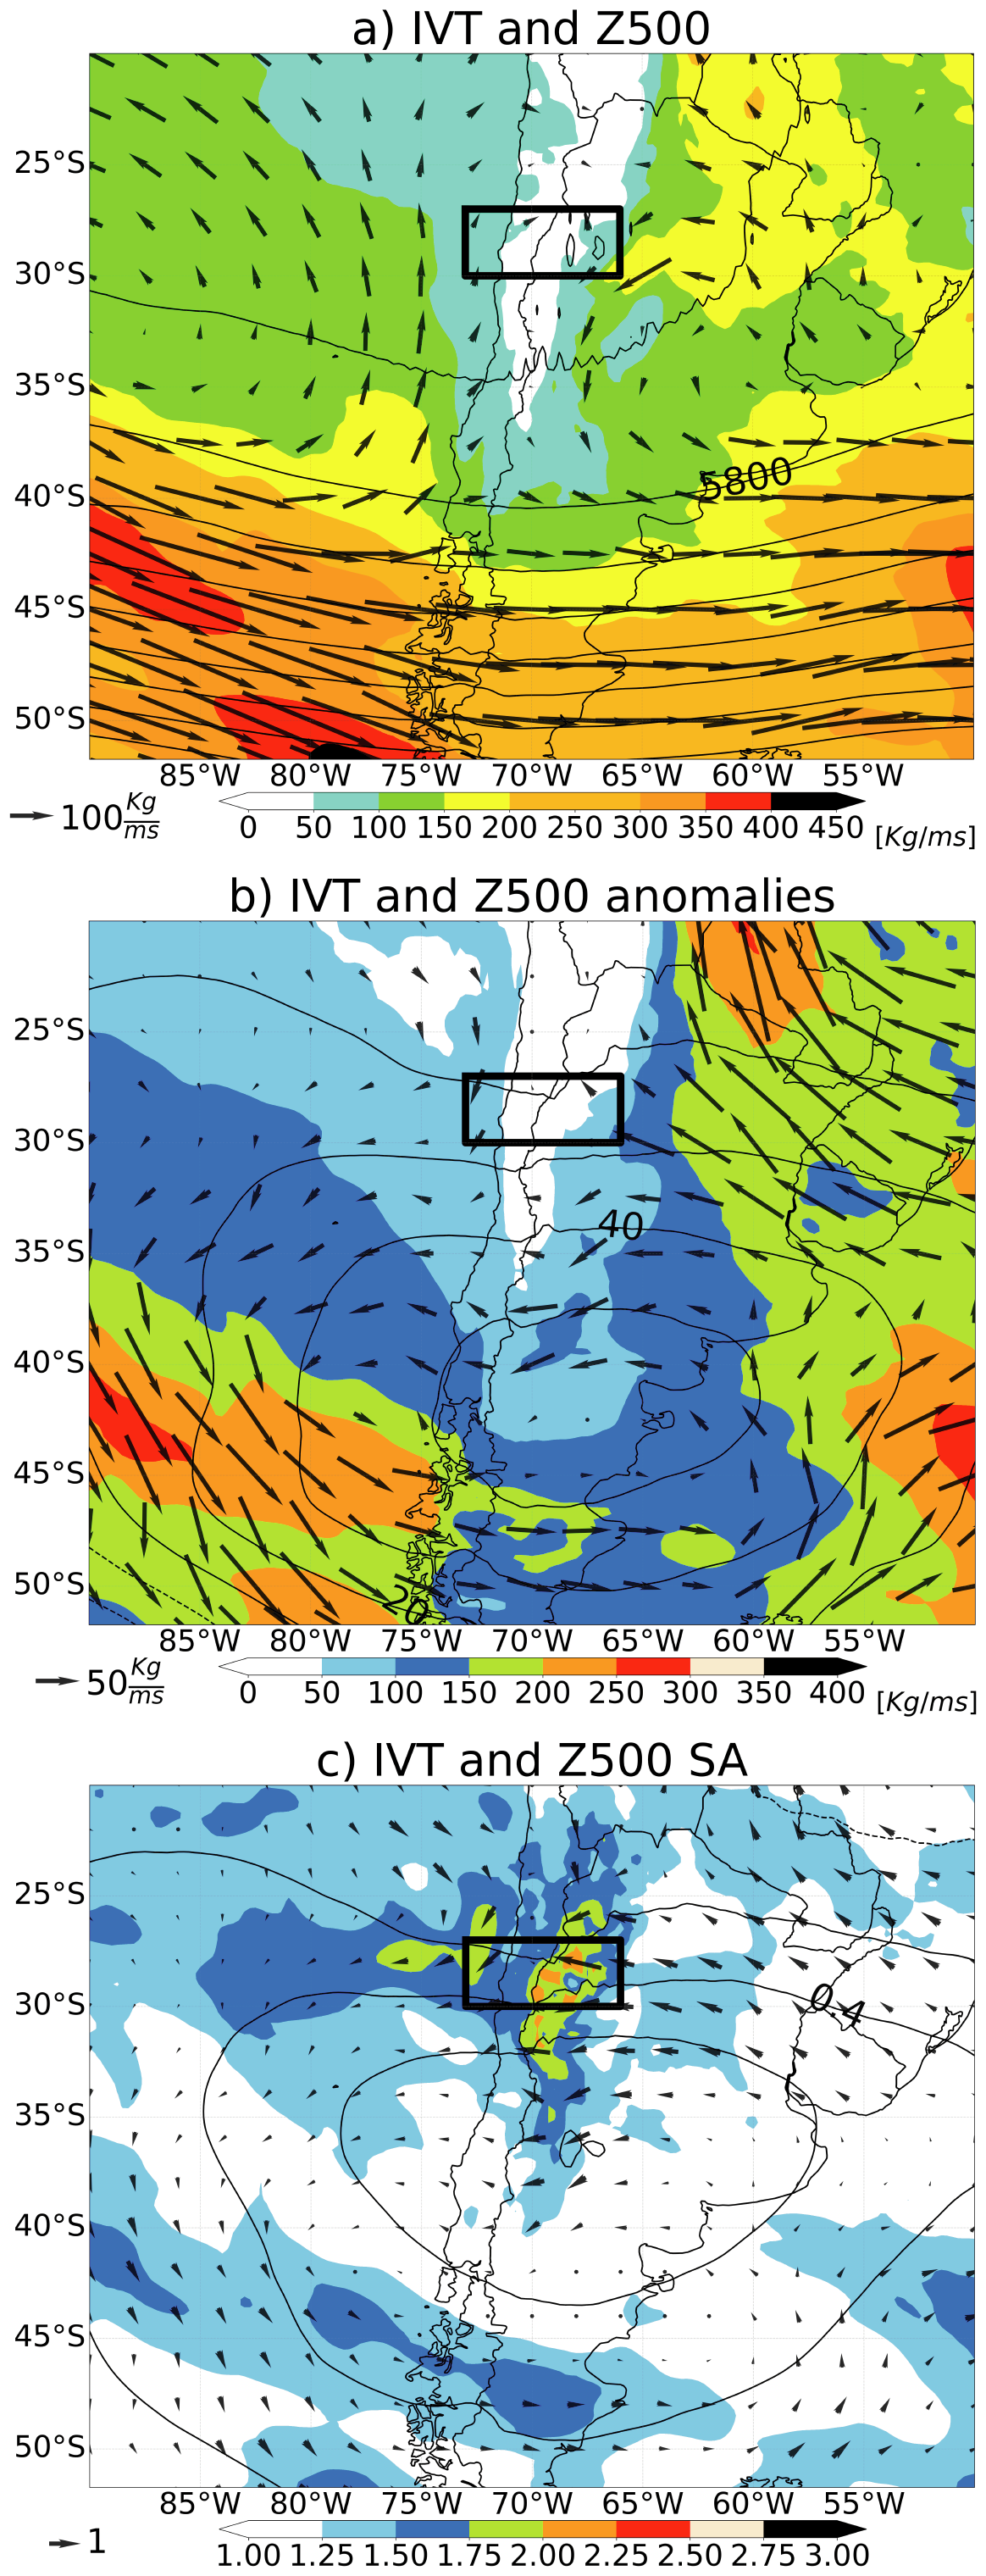
Figure 9Austral summer (DJF) Convergence composites of Integrated water Vapor Transport (IVT; colors and vectors) and Z500 (contours) for (a) raw data, (b) anomalies, and (c) standardized anomalies (SA). The black rectangle frames the area related to the LB3 between 27–30° S.
These results demonstrate that, despite the qualitative nature of the classification, compositing events within each category yields coherent and physically consistent synoptic patterns. In particular, the Convergence composites highlight the contribution of water vapor transport from east of the Andes in enhancing extreme precipitation events in the region, suggesting that this moisture source may play a significant role in modulating event intensity. The extent to which this eastern contribution is necessary for the development of extreme events warrants further investigation.
5.2 Characterization of rainfall-induced mass movement events
The Chilean National Service for Geology and Mining (SERNAGEOMIN) compiled a mass movement inventory (available at https://www.plataformadedatos.cl/, last access: 19 December 2025) reporting 1046 debris flows and landslides caused by rain (excluding undated events), of which 548 (52.4 %) occurred within the study area: 93 (8.9 %) in LB1, 71 (6.8 %) in LB2, and 384 (36.7 %) in LB3. This highlights a significant presence of cataloged debris flow events in the study area. It is important to note that this inventory does not aim to document all events that have occurred. Instead, it focuses on events identified during periods of emergency or when an official threat was declared by authorities. Consequently, there is a gap between the events that actually occurred and those recorded in the inventory.
Table 3Cataloged storms associated with debris flow and mass movement events per latitudinal band.
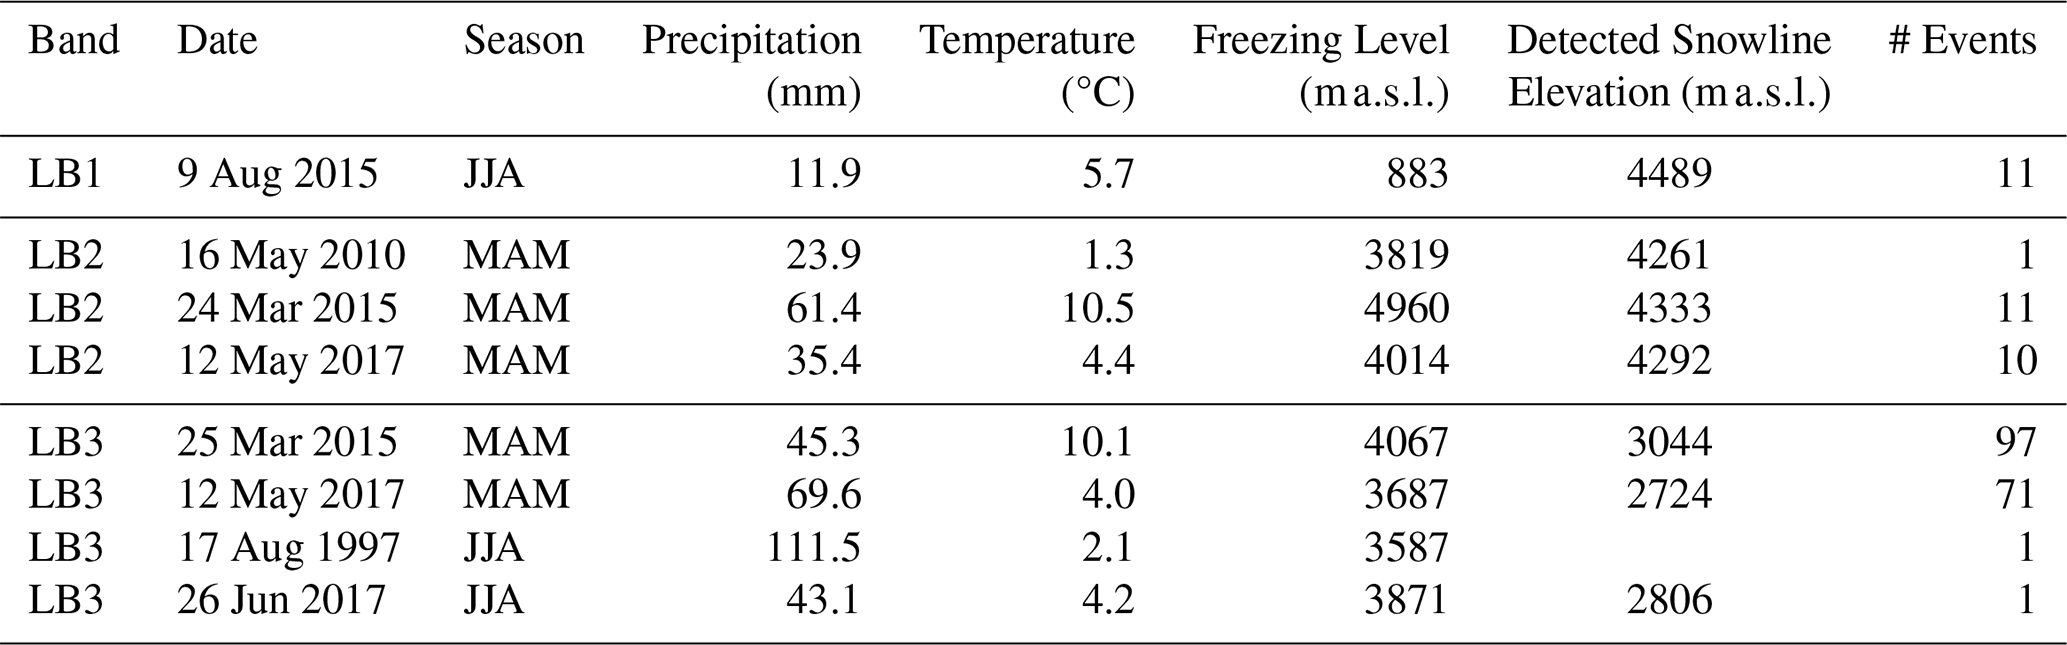
We contrasted the 548 debris-flow events located in the study area against the storm catalog, checking whether those events had the same date of occurrence as an extreme storm in the catalog or, in the case of some debris-flow events lack an exact date, if an extreme storm took place within the date range reported by the SERNAGEOMIN inventory. We found that 203 events (37 %) are associated with six storms from the catalog (Table 3): one in LB1, three in LB2, and four in LB3 (two storms overlap Bands 2 and 3). All storms were stratiform. Most events occurred in Band 3 (170), particularly during two key storms in the MAM season: 25 March 2015 (97 events) and 12 May 2017 (71 events).
These findings show that those six storms in the catalog account for an important portion of the debris flow in the study area (37 %), but not all. This discrepancy may be explained by the nature of rainfall-triggered debris flows, which result in either minor affected areas or in different intensities and durations that were not captured by the adopted criteria of our study (Berti et al., 2020; Zhang et al., 2020; Nikolopoulos et al., 2017). Short-duration, high-intensity events may not be identified as significant in the catalog because the analysis considers only the total daily precipitation of each event.
5.3 Coarse estimation of debris flow volume
This application focuses on areas of high relief, which are prone to debris flows triggered by extreme storm events. Estimating the sediment volume that may reach inhabited alluvial fans is crucial, as human settlements in the Andean region are commonly situated on alluvial fans, making them vulnerable to debris flows (Romero et al., 2022; Garcés et al., 2022).
Research efforts have aimed to quantify erosion rates during extreme storm events (Aguilar et al., 2020) and over the long term (Aguilar et al., 2014). Aguilar et al. (2020) found that topographic attributes are the primary factor influencing the volumes of debris flows reaching the apex, with no significant correlation to lithological attributes. Their findings indicate that precipitation alone is sufficient to trigger debris flows since sediments are available in these lithological contexts. Therefore, assuming unlimited sediment availability in the study area, the debris-flow volume produced by a storm event depends only on transport capacity (and thus not dependent on sediment availability). Consequently, coarse estimates of the debris-flow volume can be obtained from the catalog using a transport-capacity equation such as Eq. (4) (JICA, 2010).
where p is the porosity of the deposit, c is the runoff coefficient, Pp is the precipitation in mm, A is the area of the basin in km2, and Cd is the sediment volumetric concentration, estimated using Eq. (5) (Takahashi, 2014).
where ρs is the density of the sediment, ρ the density of water, ϕ is the angle of internal friction of the sediment, and θ is the slope of the terrain.
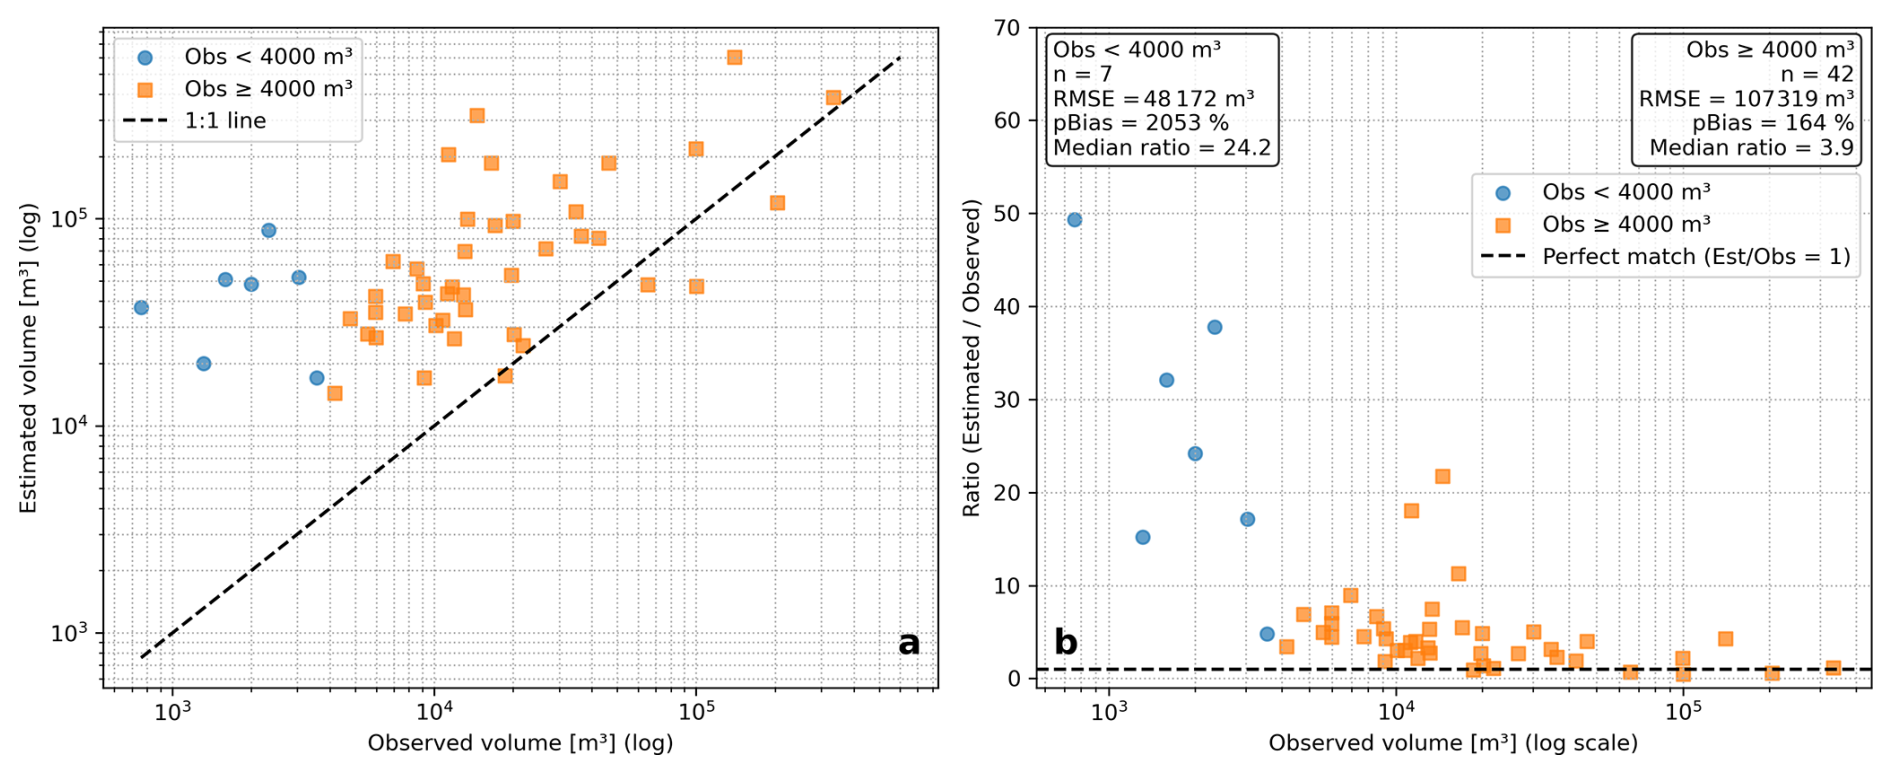
Figure 10(a) Coarse estimation of debris flow volume based on transport capacity for the March 2015 event. Comparison with measured deposited volumes at 49 alluvial fans located in the Huasco River Basin. (b) Ratio of estimated vs. observed to quantify the prediction correlation degree.
Aguilar et al. (2020) surveyed debris–flow deposited volumes in 49 alluvial fans triggered by the 2015 storm event. Figure 10 compares these observed volumes with the transport capacity estimated for each basin based on the precipitation recorded in the event catalog. The estimated sediment transport capacity represents an upper bound on the volume that reaches the alluvial fan, as it does not account for processes that reduce delivery efficiency, such as sediment trapping or channel obstructions.
Figure 10 indicates that this first-order estimation performs poorly for deposits smaller than 4000 m3 (pBIAS = 2053 %). In contrast, the agreement between estimated and observed volumes is substantially higher for the subset of inventoried deposits larger than 4000 m3 (pBIAS = 164 %). This difference reflects the performance of the method within the available dataset, and therefore should not be interpreted as evidence of a volumetric threshold in debris-flow deposits.
The weak performance for small deposits likely reflects their higher sensitivity to measurement uncertainty, whereas larger deposits tend to reduce the relative error associated with field-based volume observation. Additionally, in some catchments, the systematic overestimation of deposited volumes may be influenced by sediment that was mobilized but ultimately bypassed the fan and continued downstream.
This model applies only to events in which prior knowledge of debris-flow occurrence exists, as the amount of rain is insufficient to trigger debris flows. The rainfall event must meet specific conditions not recorded in the catalog, such as rainfall intensity and/or duration. Hence, rainfall amounts in the catalog do not guarantee the occurrence of debris flow for that specific event.
The datasets used in this study are publicly available from the following sources: CR2MET v2.5, available through Zenodo (https://doi.org/10.5281/zenodo.7529682, Boisier, 2023); ERA5 reanalysis available through the Copernicus Climate Data Store (https://doi.org/10.24381/cds.adbb2d47, Copernicus Climate Change Service, 2023); and the MODIS/Terra and MODIS/Aqua daily snow-cover products, Collection 6.1, available through the NASA National Snow and Ice Data Center Distributed Active Archive Center (NSIDC DAAC; https://doi.org/10.5067/MODIS/MOD10A1.061, Hall and Riggs, 2021a and https://doi.org/10.5067/MODIS/MYD10A1.061, Hall and Riggs, 2021b, respectively). All datasets were last accessed on 19 December 2025. The catalog generated by the authors is publicly available in Zenodo (https://doi.org/10.5281/zenodo.14342935, Matus et al., 2026).
All scripts used to process the input datasets and generate the catalog were developed by the authors, and no third-party scripts were incorporated into the workflow. These scripts are not publicly available, as they have not been prepared for distribution and reuse by third parties. However, the resulting catalog is publicly available through Zenodo (https://doi.org/10.5281/zenodo.14342935, Matus et al., 2026) and can be accessed and processed using commonly available software (i.e., Python, R, MATLAB, and Microsoft Excel) as appropriate for the data format.
Based on a comprehensive analysis of the selected maximum seasonal daily precipitation events across three latitudinal bands, we defined several storm categories that describe their main characteristics. These categories were based in systematical visual classification of the geographical region of precipitation and the pattern of water vapor transport they exhibit. On average, three distinct patterns for extreme events were found in each band and season, with the most common variations falling into the categories Coast, Stratiform, and Andes Mountain. In the category Andes Mountain, it was found that in certain seasons it could be further subdivided into North Andes, South Andes, and Along Andes (along the Andes Cordillera), depending on the area of the mountain range where precipitation occurs.
Furthermore, we used the catalog and analyzed the composites for all the categories generated and, considering only the circulation and IVT, two general categories were identified encompassing all extreme events in different seasons and bands: (1) convergence of water vapor transport (Convergence); and (2) IVT from the Pacific (Westerly IVT). An exception arose in the Along Andes pattern during summer in the LB3, where events exhibited a bimodal synoptic pattern. In this case, approximately half of the events were associated with Convergence and the other half with Westerly IVT. Therefore, the Along Andes category for this specific band and season was further subdivided into Convergence and Westerly IVT to represent the dual nature of the underlying mechanisms accurately.
As an example, the IVT convergence covers the results shown in Fig. 9. It is also important to note that significant variations are observed between events classified into these two categories, including variability in the depth of development, circulation intensity, and IVT. These differences in atmospheric circulation and water vapor transport, combined with fluctuations in atmospheric moisture availability, contribute to the formation of a wide range of observed precipitation patterns. These factors also determine the extent to which these events can influence a specific latitudinal band.
The catalog's utility extends beyond classification, enabling actionable insights for hazard management. First, composite analysis provides meteorological storylines – recurring synoptic scenarios like Convergence or Westerly IVT – that explain how extreme rainfall develops. These storylines are critical for early warning systems, as they link observable atmospheric patterns to high-impact precipitation. Second, the correlation of cataloged storms with 37 % of historical debris flows (e.g., the March 2015 MAM event, which triggered 97 mass movements) underscores the catalog's value in identifying high-risk storms that disproportionately threaten Andean communities. Third, the coarse estimation of debris-flow volumes via transport-capacity models (Fig. 10) translates precipitation magnitudes into sediment-yield approximations, providing a first-order proxy for infrastructure planning and mitigation. Finally, the existence of this catalog also opens the door to future studies that delve deeper into the atmospheric dynamics and thermodynamics at different temporal resolutions, analyzing the evolution of each event over time and complementing it with other sources of information such as in situ observations, satellite swaths, and radiosondes, among others.
Together, these applications form a cohesive narrative: the catalog bridges atmospheric dynamics to geomorphic impacts, transforming theoretical classifications into practical frameworks for disaster risk reduction. In total, the catalog comprises 472 band-specific extreme precipitation events corresponding to 408 unique storm dates across the period 1979–2019. Of these, 59 storms affected multiple latitudinal bands simultaneously, with 33 exhibiting different precipitation categories across bands, reflecting how the same synoptic system can manifest distinct spatial patterns depending on latitude. Of the cataloged events, 292 were classified as Andes Mountain, 161 as Stratiform, and 19 as Coast, each characterized by date, storm category, maximum daily precipitation (3.3–111.5 mm d−1), mean temperature (−2.9–15.1 °C), freezing level and empirical snowline elevation, and MODIS-derived snowline elevation when available (237 events from 2001 onward).
It should be noted that the catalog captures the most intense daily event per season and band, and therefore does not account for sub-daily rainfall characteristics, multi-day accumulation, or antecedent conditions, which are also relevant for debris flow initiation. Additionally, the event classification relies on systematic visual inspection rather than quantitative thresholds, which introduces classification uncertainty acknowledged throughout the manuscript. Empirical snowline estimates for events prior to 2000 carry larger uncertainties due to the absence of MODIS observations. Finally, the comparison with the debris flow inventory is constrained by the incomplete nature of the historical record, which does not capture all events that occurred in the study area.
Future work includes extending the catalog beyond 2019, incorporating sub-daily precipitation products as they become available at adequate spatial resolution, and expanding the analysis toward central Chile where different precipitation regimes prevail. By contextualizing extreme rainfall within both meteorological and societal contexts, this work advances preparedness in Chile's complex climatic and topographic setting.
The catalog and the processed dataset (precipitation, IVT, and snowline elevation) are preserved in a Zenodo data repository with a corresponding assigned DOI, available at https://doi.org/10.5281/zenodo.14342935 (Matus et al., 2026).
The repository contains: (1) a CSV file listing all extreme precipitation events with their associated meteorological descriptors, including latitudinal band, date, season, storm category, maximum daily precipitation (mm d−1), mean temperature (°C), freezing level and snowline elevations () estimated through both empirical and MODIS-based methods; (2) NetCDF files with daily precipitation fields from CR2METv2.5 and vertically integrated water vapor transport (IVT) components derived from ERA5 for each cataloged event; (3) a NetCDF file with post-processed MODIS snow cover maps for events from 2001 onward; (4) illustrative figures depicting CR2METv2.5 daily precipitation performance according to weather stations (also described in Appendix A4); and (5) a PDF with detailed description of the catalog, file structure, variable definitions, and coordinate systems.
The catalog is preserved in a Zenodo data repository (https://doi.org/10.5281/zenodo.14342935, Matus et al., 2026) with the following directory structure:
-
ExtremeSeasonalStormEvents_Catalog.csv -
NETCDFs/-
events_pp.nc -
events_ivtu.nc -
events_ivtv.nc
-
-
MODIS/-
events_modis.nc
-
-
A4_CR2METv2.5_performance-
PNG files (per event plots)
-
-
ReadMe.pdf
A1 CSV catalog
The main catalog is stored as a comma-separated value (CSV) file, with each row representing an event and each column detailing a characteristic of that event. The columns are described in Table A1.
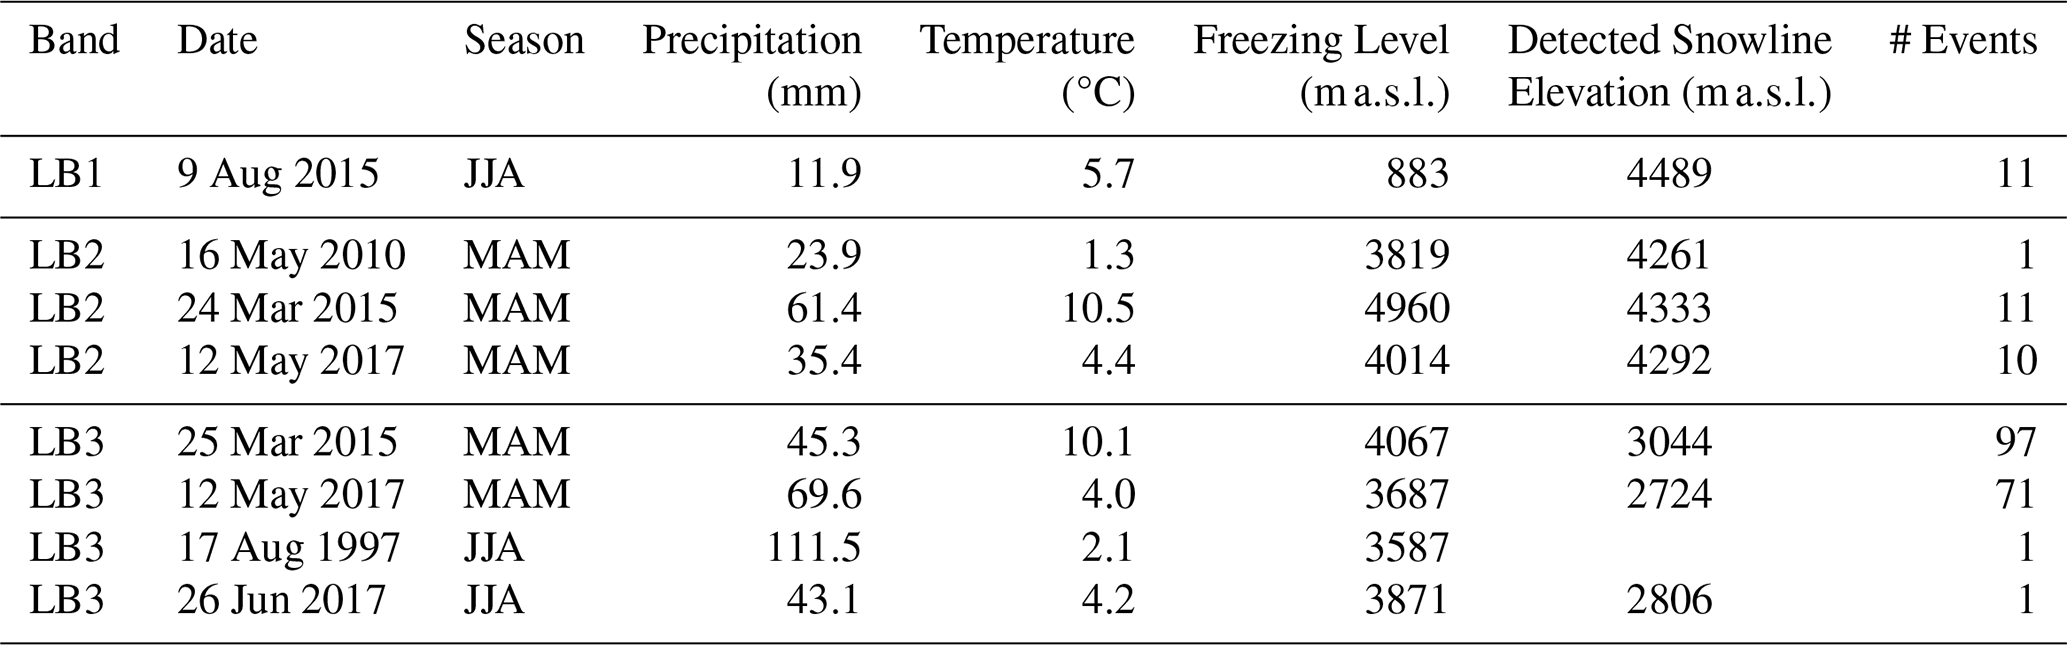
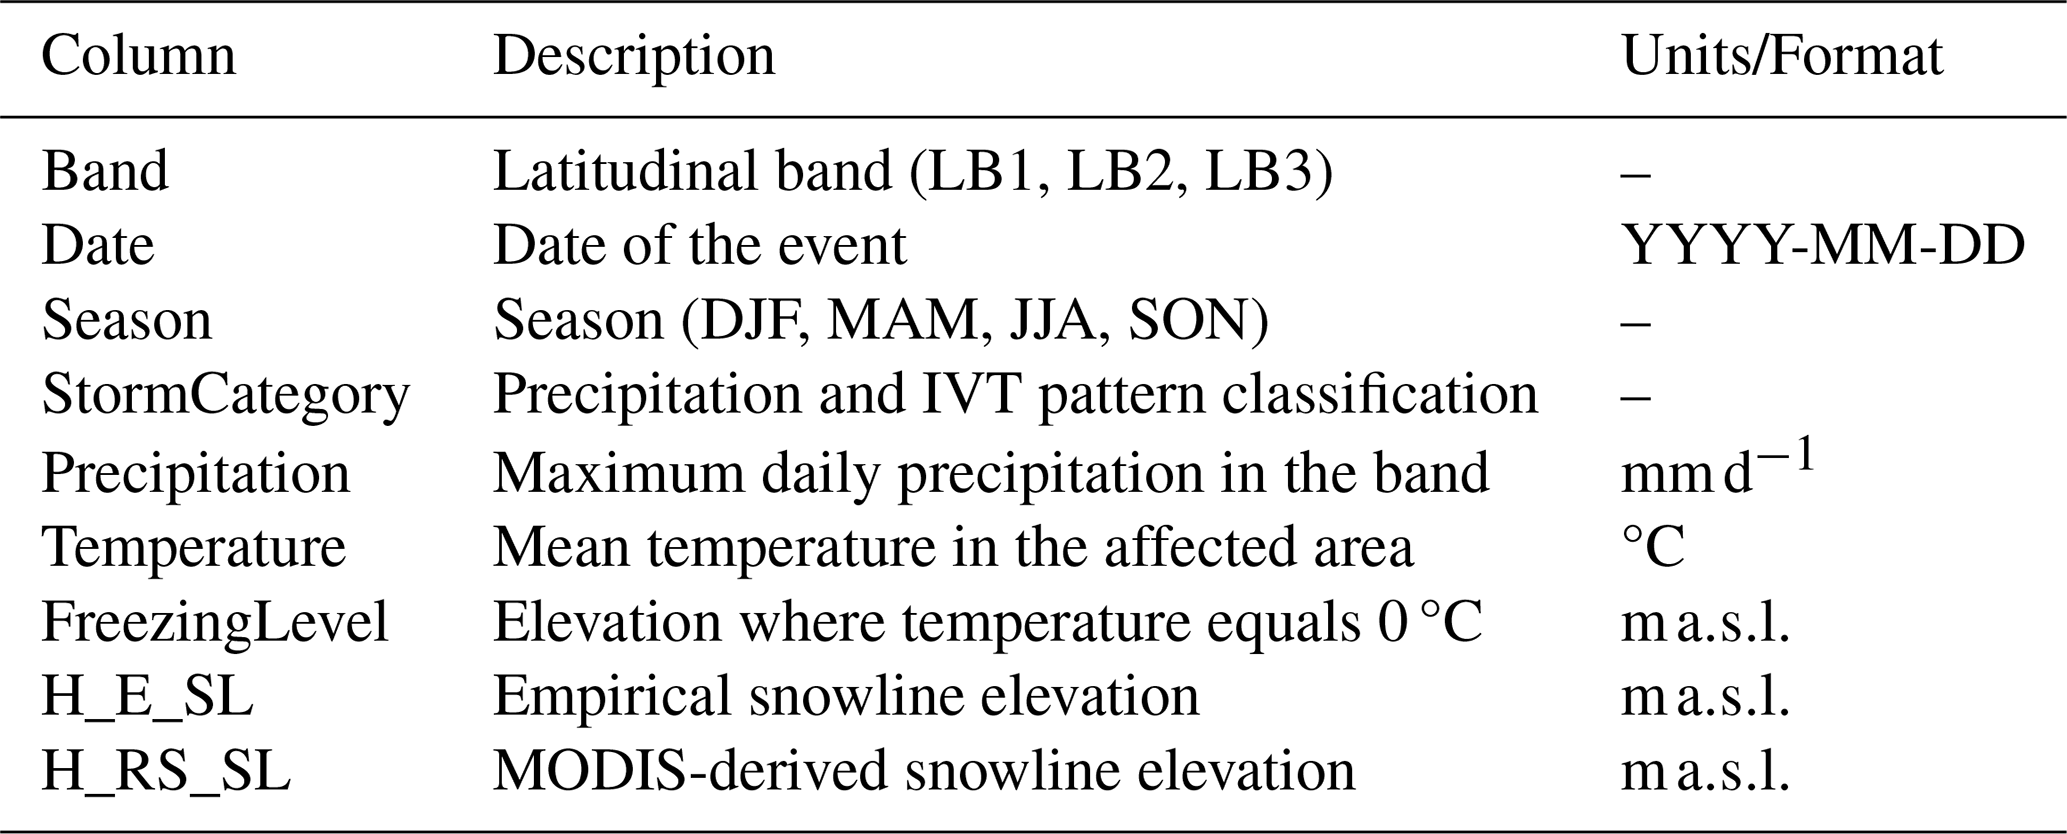
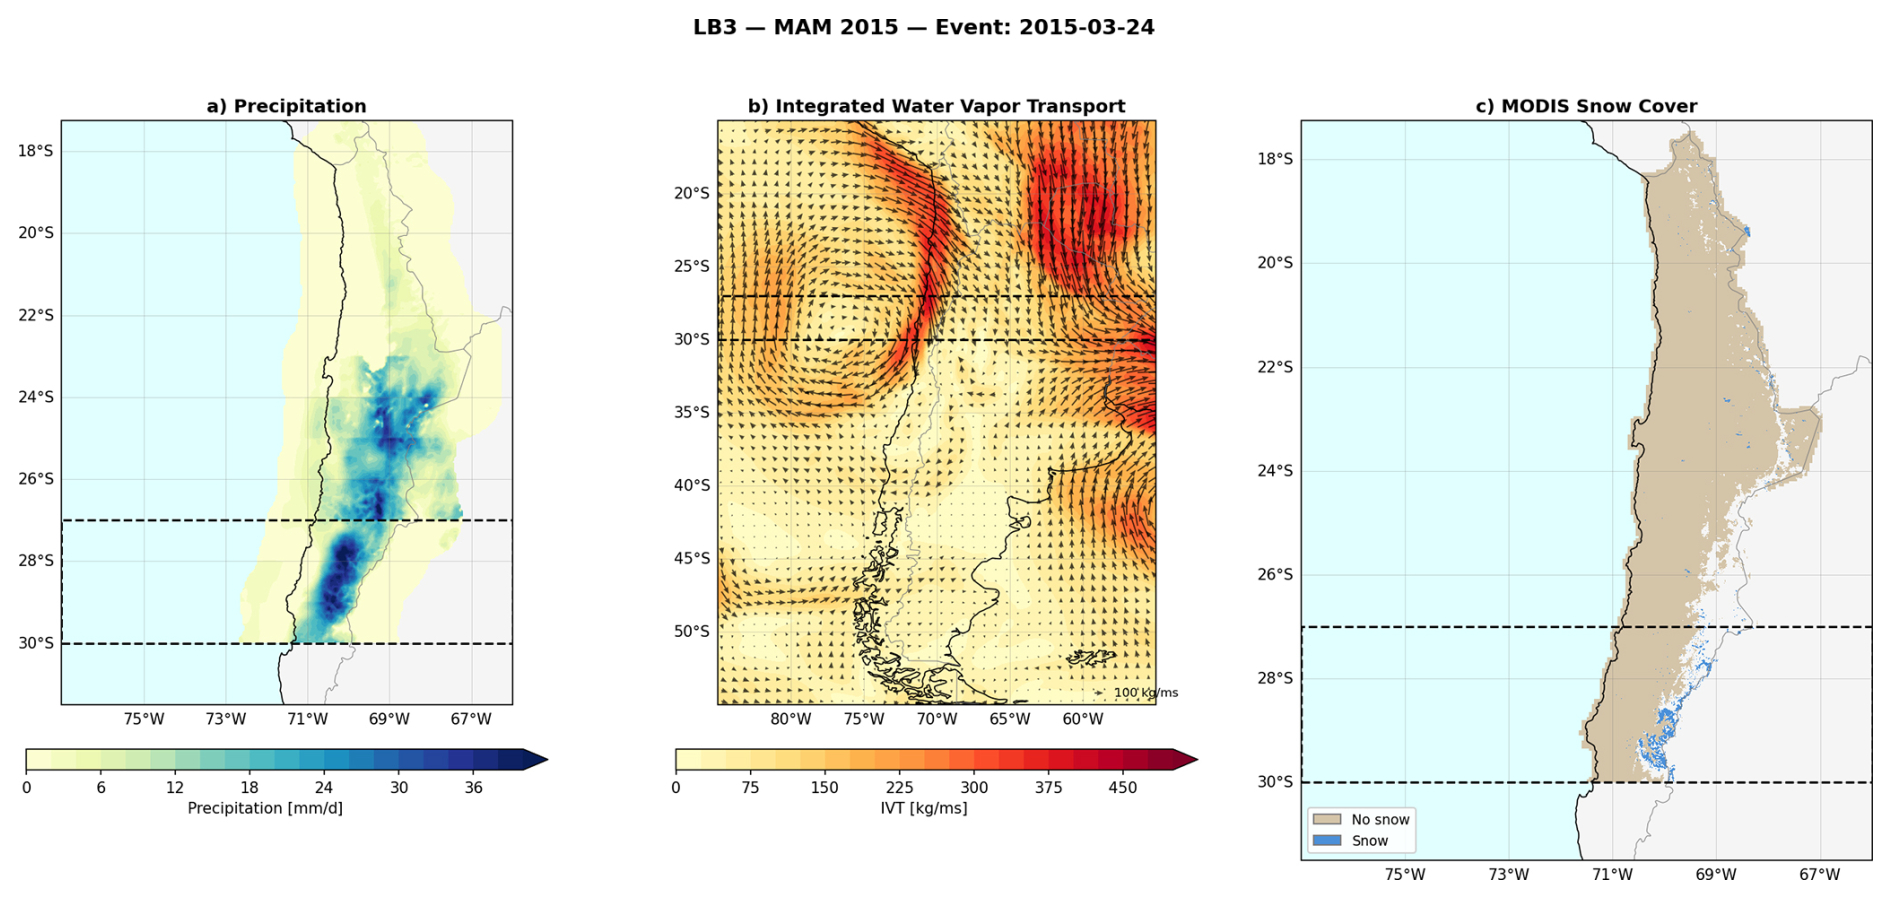
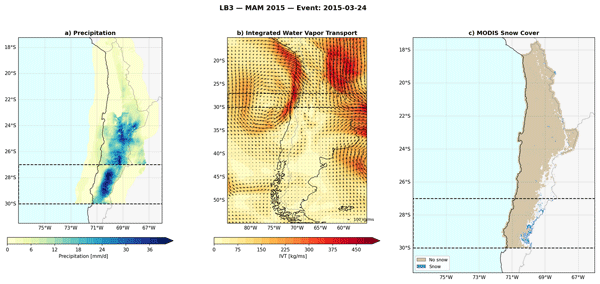
Figure A1Example reading of the catalog for the LB3 MAM 2015 extreme precipitation event (24 March 2015). (a) Daily precipitation (mm d−1) from CR2METv2.5 over the study area (17.25–31.5° S, 77–66° W). (b) Vertically integrated water vapor transport magnitude (kg ms−1; shading) and direction (vectors; reference arrow: 100 kg ms−1) derived from ERA5, shown over a broader South American domain (15–55° S, 85–55° W). (c) MODIS-derived snow cover classification for the event date, distinguishing snow-covered (blue) and snow-free (beige) pixels. Dashed rectangles indicate the LB3 latitudinal band (27–30° S).
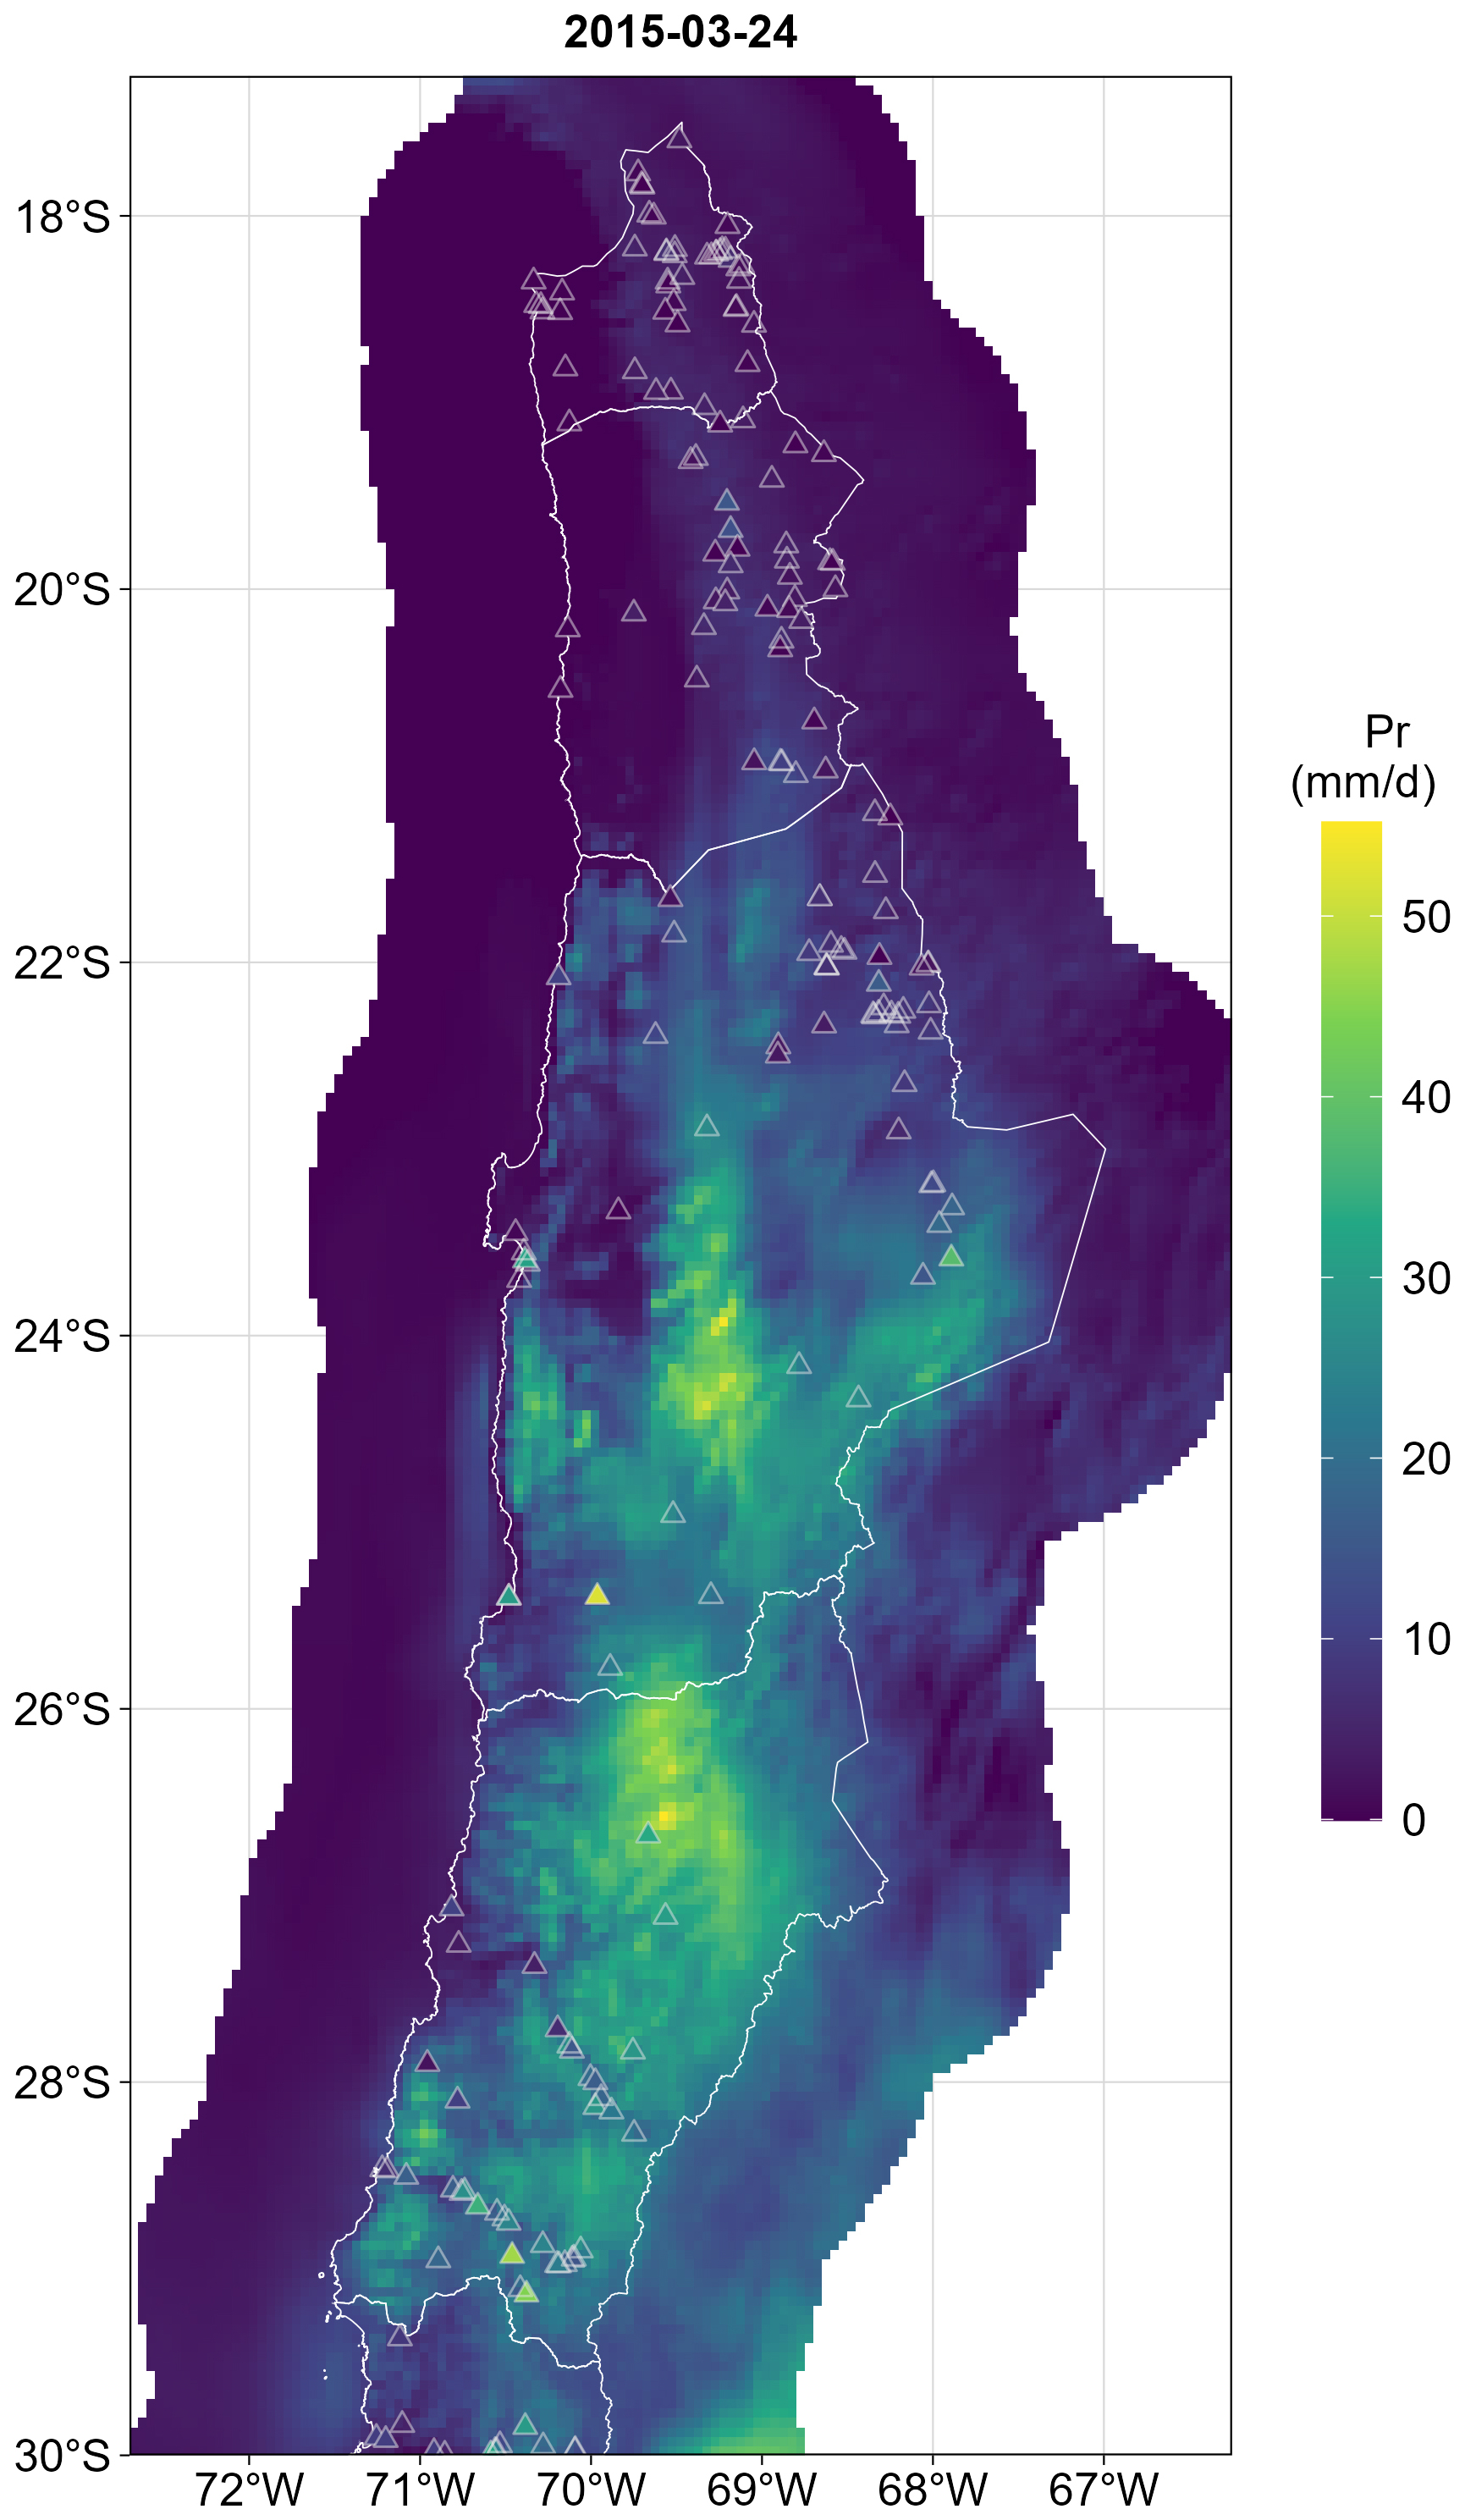
Figure A2Daily precipitation during 24 March 2015 according to CR2METv2.5 (raster) and weather stations (triangles).
The StormCategory column assigns each event to one of the following categories:
-
Andes Mountain: Precipitation concentrated over the Andes, subdivided into North Andes, South Andes, Along Andes, Convergence, or Westerly IVT, depending on the spatial distribution and water vapor transport pattern.
-
Coast: Precipitation concentrated along or near the coastline.
-
Stratiform: Precipitation distributed horizontally across the band, from coast to mountains.
-
Omitted: Season–band combination not considered as an extreme event.
A2 NetCDF files: precipitation and IVT
Daily precipitation and vertically integrated water vapor transport fields are stored in NetCDF files for each cataloged event. Table A2 summarizes the file structure.
Both files share the following dimensions and variables:
-
Dimensions:
lon(longitude),lat(latitude),year(1979–2019),band(0, 1, 2 corresponding to LB1, LB2, LB3),season(DJF, MAM, JJA, SON). -
Data variable: Field values stored as
float32with dimensions (season,lon,lat,year,band). -
Date variables:
dates_{season}_band{band}(char), providing the event date for each year.
A3 NetCDF file: MODIS snow cover
Post-processed snow cover maps derived from MODIS TERRA and AQUA imagery are stored in events_modis.nc for events from 2001 onward. The file structure is as follows:
-
Spatial domain: 17.25–30° S, 77–66° W.
-
Spatial resolution: 500 m (MODIS native).
-
Dimensions:
lon,lat,time(days since 1 January 1970). -
Variable:
SCA(int32) – Snow Covered Area per pixel: 0 = no snow, 1 = snow covered, NA = undetermined.
A4 CR2METv2.5 performance
The Zenodo data repository also contains figures for each cataloged extreme event, comparing the daily precipitation from CR2METv2.5 to available weather stations (Fig. A2).
These supplementary figures also provide seasonal performance according to four different metrics considering all identified events in the catalog: mean absolute error, perceptual bias, root mean square error, and coefficient of determination. Figure A3 illustrates the seasonal results for root mean square error (RMSE).
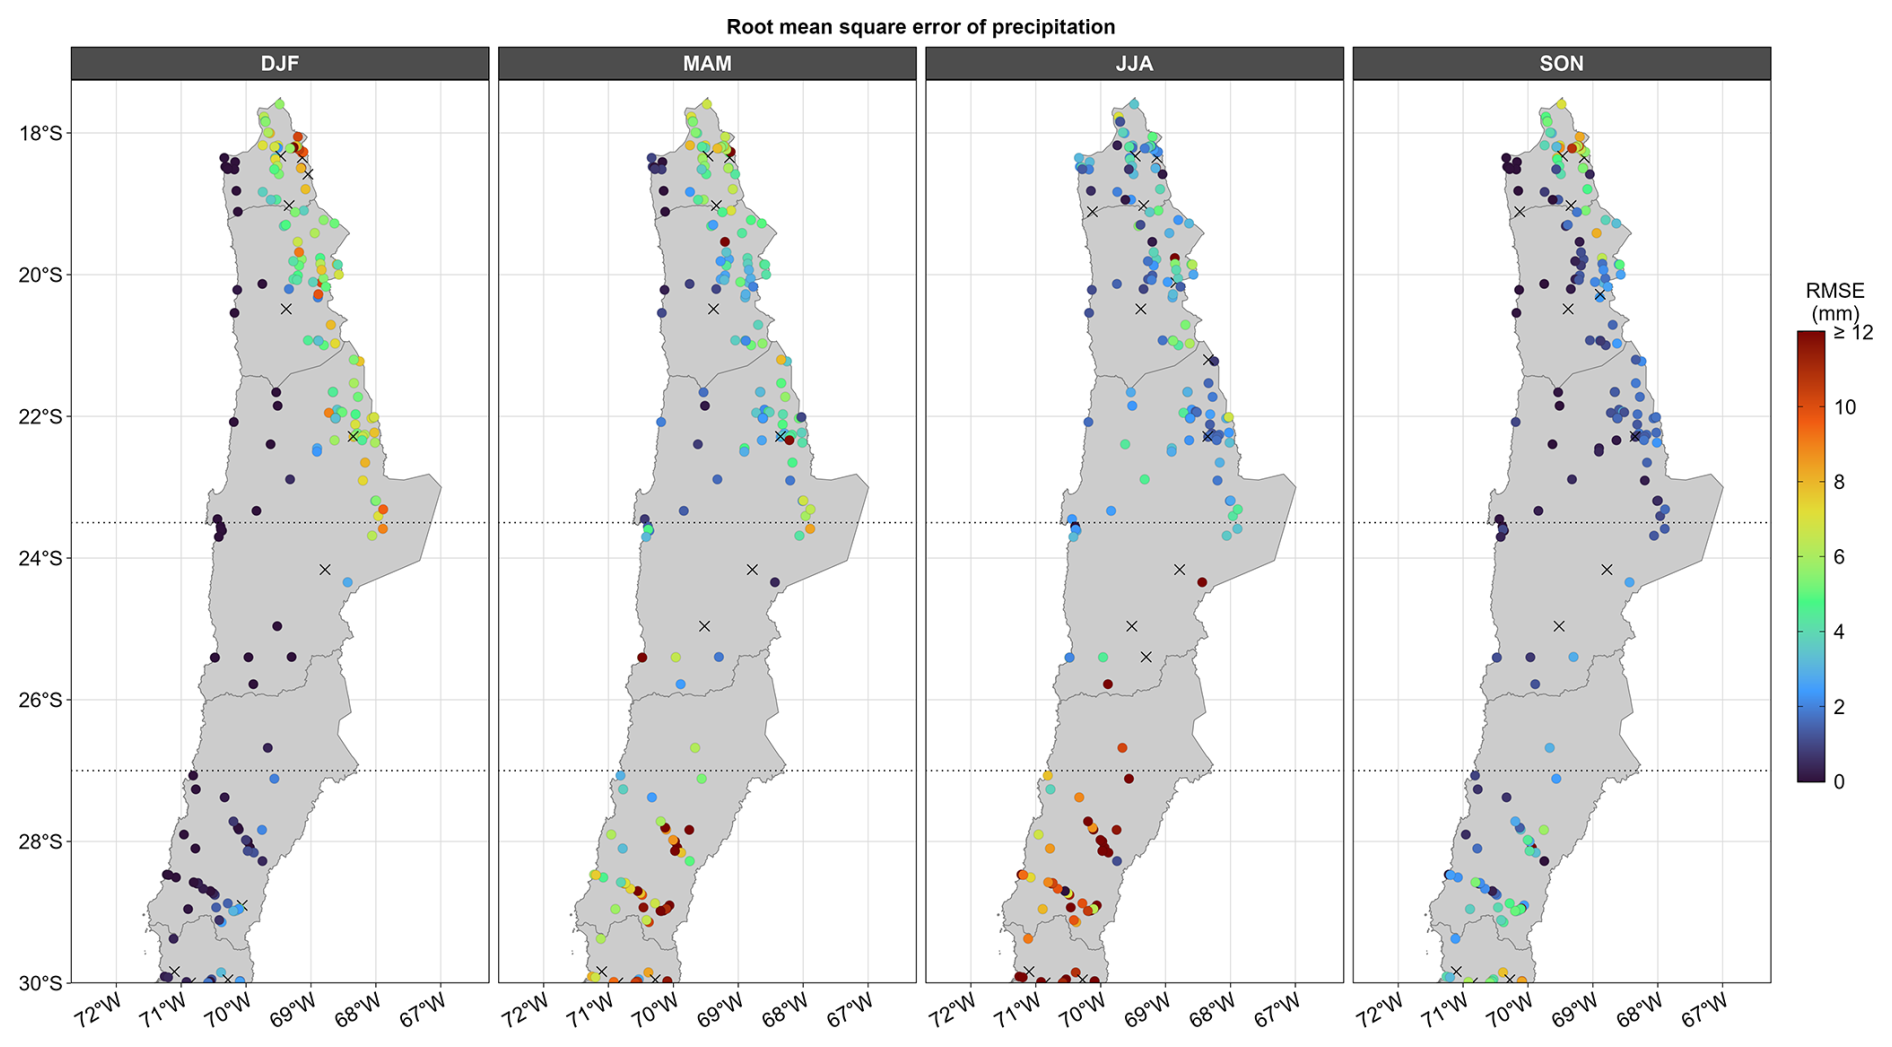
Figure A3Seasonal root mean square error (RMSE) of CR2METv2.5 daily precipitation product. Crosses (X) indicate that not enough observation data was available in order to calculate the metric.
FM: study methodology; data curation of meteorological products (lead); formal analysis of precipitation events and IVT patterns (lead); preparation of the original draft; review and editing of the final draft; creation and management of the Zenodo data repository. MP: study methodology; data curation of snow remote sensing data (lead); formal analysis of snowline estimations (lead); preparation of the original draft (lead); review and editing of the final draft. AG: project coordination; estimation of debris flow volumes; preparation of the original draft. DP: identification and analysis of rainfall-induced mass movement events; preparation of the original draft. ML: original project conceptualization; study methodology; formal analysis of results; supervision of the investigation; preparation of the original draft; review and editing of the final draft. GA: provision of debris flow volume data from previous research; supervision of its appropriate use throughout the investigation; contribution to the preparation of the original draft; review of the final draft. SM: original project conceptualization; funding acquisition; study methodology; formal analysis of results; supervision of the investigation; preparation of the original draft; review of the final draft.
The contact author has declared that none of the authors has any competing interests.
Publisher's note: Copernicus Publications remains neutral with regard to jurisdictional claims made in the text, published maps, institutional affiliations, or any other geographical representation in this paper. The authors bear the ultimate responsibility for providing appropriate place names. Views expressed in the text are those of the authors and do not necessarily reflect the views of the publisher.
This research was funded by the Advanced Mining Technology Center (AMTC) by projects ANID CIA2500010 and FONDEF ID22I10122.
This research was funded by the National Agency for Research and Development of Chile (ANID) through project ANID AMTC CIA250010. Miguel Lagos-Zúñiga was funded by the Center for Interdisciplinary Research on Disaster Risk, Resilience and Recovery (CIGIDEN R+), ANID/CIN250023, and ANID/Fondecyt/Iniciación 1126132.
This paper was edited by Guanyu Huang and reviewed by two anonymous referees.
Aceituno, P., Boisier, J. P., Garreaud, R., Rondanelli, R., and Rutllant, J. A.: Climate and Weather in Chile, in: Water Resources of Chile, Springer, 7–29, ISBN 978-3-030-56900-6, https://doi.org/10.1007/978-3-030-56901-3, 2021. a, b, c
Aguilar, G., Carretier, S., Regard, V., Vassallo, R., Riquelme, R., and Martinod, J.: Grain Size-Dependent 10Be Concentrations in Alluvial Stream Sediment of the Huasco Valley, a Semi-Arid Andes Region, Quat. Geochronol., 19, 163–172, https://doi.org/10.1016/j.quageo.2013.01.011, 2014. a
Aguilar, G., Cabré, A., Fredes, V., and Villela, B.: Erosion after an extreme storm event in an arid fluvial system of the southern Atacama Desert: an assessment of the magnitude, return time, and conditioning factors of erosion and debris flow generation, Nat. Hazards Earth Syst. Sci., 20, 1247–1265, https://doi.org/10.5194/nhess-20-1247-2020, 2020. a, b, c, d, e, f
Berti, M., Bernard, M., Gregoretti, C., and Simoni, A.: Physical Interpretation of Rainfall Thresholds or Runoff-Generated Debris Flows, J. Geophys. Res.-Earth, 125, https://doi.org/10.1029/2019JF005513, 2020. a, b, c
Boisier, J. P.: CR2MET: A High-Resolution Precipitation and Temperature Dataset for the Period 1960–2021 in Continental Chile, Zenodo [data set], https://doi.org/10.5281/ZENODO.7529682, 2023. a
Boisier, J. P., Alvarez-Garretón, C., Cepeda, J., Osses, A., Vásquez, N., and Rondanelli, R.: CR2MET: A High-Resolution Precipitation and Temperature Dataset for Hydroclimatic Research in Chile, in: Geophysical Research Abstracts, vol. 20, https://ui.adsabs.harvard.edu/abs/2018EGUGA..2019739B/abstract (last access: 23 October 2026), 2018. a
Börgel, R.: Geomorfología, Instituto Geográfico Militar (IGM), Santiago, Chile, https://bibliotecadigital.infor.cl/handle/20.500.12220/4923 (last access: 19 December 2025), 1983. a
Bozkurt, D., Rondanelli, R., Garreaud, R., and Arriagada, A.: Impact of Warmer Eastern Tropical Pacific SST on the March 2015 Atacama Floods, Mon. Weather Rev., 144, 4441–4460, https://doi.org/10.1175/MWR-D-16-0041.1, 2016. a, b, c
Cabré, A., Remy, D., Aguilar, G., Carretier, S., and Riquelme, R.: Mapping Rainstorm Erosion Associated with an Individual Storm from InSAR Coherence Loss Validated by Field Evidence for the Atacama Desert, Earth Surf. Proc. Land., 45, 2091–2106, https://doi.org/10.1002/esp.4868, 2020. a
Copernicus Climate Change Service: ERA5 hourly data on single levels from 1940 to present, Copernicus Climate Change Service (C3S) Climate Data Store (CDS) [data set], https://doi.org/10.24381/cds.adbb2d47, 2023. a
DeWalle, D. R. and Rango, A.: Remote Sensing of the Snowpack, in: Principles of Snow Hydrology, Cambridge University Press, 118–145, https://doi.org/10.1017/cbo9780511535673.006, 2008. a
Falvey, M. and Garreaud, R.: Moisture Variability over the South American Altiplano during the SALLJEX Observing Season, J. Geophys. Res.-Atmos., 110, D22105, https://doi.org/10.1029/2005JD006152, 2005. a
Farr, T. G., Rosen, P. A., Caro, E., Crippen, R., Duren, R., Hensley, S., Kobrick, M., Paller, M., Rodriguez, E., Roth, L., Seal, D., Shaffer, S., Shimada, J., Umland, J., Werner, M., Oskin, M., Burbank, D., and Alsdorf, D.: The Shuttle Radar Topography Mission, Rev. Geophys., 45, 2005RG000183, https://doi.org/10.1029/2005RG000183, 2007. a
Fuenzalida, H. A., Sánchez, R., and Garreaud, R. D.: A Climatology of Cutoff Lows in the Southern Hemisphere, J. Geophys. Res.-Atmos., 110, https://doi.org/10.1029/2005JD005934, 2005. a
Gafurov, A. and Bárdossy, A.: Cloud removal methodology from MODIS snow cover product, Hydrol. Earth Syst. Sci., 13, 1361–1373, https://doi.org/10.5194/hess-13-1361-2009, 2009. a
Garcés, A., Zegers, G., Cabré, A., Aguilar, G., Tamburrino, A., and Montserrat, S.: A modeling methodology to study the tributary-junction alluvial fan connectivity during a debris flow event, Nat. Hazards Earth Syst. Sci., 22, 377–393, https://doi.org/10.5194/nhess-22-377-2022, 2022. a, b
Garreaud, R.: Estimación de La Línea de Nieve En Cuencas Andinas de Chile Central, Revista De La Sociedad Chilena De Ingeniería Hidráulica, 7, 21–32, 1992. a
Garreaud, R.: Warm Winter Storms in Central Chile, J. Hydrometeorol., 14, 1515–1534, https://doi.org/10.1175/JHM-D-12-0135.1, 2013. a
Garreaud, R. D.: The Andes climate and weather, Adv. Geosci., 22, 3–11, https://doi.org/10.5194/adgeo-22-3-2009, 2009. a
Garreaud, R. D., Alvarez-Garreton, C., Barichivich, J., Boisier, J. P., Christie, D., Galleguillos, M., LeQuesne, C., McPhee, J., and Zambrano-Bigiarini, M.: The 2010–2015 megadrought in central Chile: impacts on regional hydroclimate and vegetation, Hydrol. Earth Syst. Sci., 21, 6307–6327, https://doi.org/10.5194/hess-21-6307-2017, 2017. a
Hall, D. K. and Riggs, G. A.: MODIS/Terra Snow Cover Daily L3 Global 500 m SIN Grid, Version 61, NASA National Snow and Ice Data Center Distributed Active Archive Center [data set], https://doi.org/10.5067/MODIS/MOD10A1.061, 2021a. a, b
Hall, D. K. and Riggs, G. A.: MODIS/Aqua Snow Cover Daily L3 Global 500 m SIN Grid, Version 61, NASA National Snow and Ice Data Center Distributed Active Archive Center [data set], https://doi.org/10.5067/MODIS/MYD10A1.061, 2021b. a, b
Hall, D. K., Riggs, G. A., Salomonson, V. V., DiGirolamo, N. E., and Bayr, K. J.: MODIS Snow-Cover Products, Remote Sens. Environ., 83, 181–194, https://doi.org/10.1016/S0034-4257(02)00095-0, 2002. a
Hersbach, H., Bell, B., Berrisford, P., Hirahara, S., Horányi, A., Muñoz-Sabater, J., Nicolas, J., Peubey, C., Radu, R., Schepers, D., Simmons, A., Soci, C., Abdalla, S., Abellan, X., Balsamo, G., Bechtold, P., Biavati, G., Bidlot, J., Bonavita, M., De Chiara, G., Dahlgren, P., Dee, D., Diamantakis, M., Dragani, R., Flemming, J., Forbes, R., Fuentes, M., Geer, A., Haimberger, L., Healy, S., Hogan, R. J., Hólm, E., Janisková, M., Keeley, S., Laloyaux, P., Lopez, P., Lupu, C., Radnoti, G., De Rosnay, P., Rozum, I., Vamborg, F., Villaume, S., and Thépaut, J.-N.: The ERA5 Global Reanalysis, Q. J. Roy. Meteor. Soc., 146, 1999–2049, https://doi.org/10.1002/qj.3803, 2020a. a
Houze Jr., R. A.: Mesoscale Convective Systems, Rev. Geophys., 42, https://doi.org/10.1029/2004RG000150, 2004. a
JICA: Technical Standards and Guidelines for Planning and Design of Sabo Structures, https://www.jica.go.jp/english/index.html (last access: 19 December 2025), 2010. a
Krajčí, P., Holko, L., Perdigão, R. A., and Parajka, J.: Estimation of Regional Snowline Elevation (RSLE) from MODIS Images for Seasonally Snow Covered Mountain Basins, J. Hydrol., 519, 1769–1778, https://doi.org/10.1016/j.jhydrol.2014.08.064, 2014. a
Matus, F., Rondanelli, R., Rutllant, J., and Henderson, S.: Mechanisms for the Influence of the Madden–Julian Oscillation on Precipitation in Southwestern South America, J. Geophys. Res.-Atmos., 130, e2024JD041935, https://doi.org/10.1029/2024JD041935, 2025. a
Matus, F., Paredes-Aravena, M., Garces, A., Pinto, D., Lagos-Zúñiga, M. A., Montserrat, S., and Advanced Mining Technology Center: Comprehensive Catalog of Extreme Precipitation Events in Northern-Central Chile (17.5° S–30° S), Zenodo [code and data set], https://doi.org/10.5281/ZENODO.14342935, 2026. a, b, c, d, e, f
Mo, K. C. and Higgins, R. W.: The Pacific-South American Modes and Tropical Convection during the Southern Hemisphere Winter, Mon. Weather Rev., 126, 1581–1596, https://doi.org/10.1175/1520-0493(1998)126<1581:TPSAMA>2.0.CO;2, 1998. a
Montserrat, S., Aguilar, G., Garcés, A., Lagos-Zúñiga, M., Paredes, M., Pinto, D., Jerez, C., Villela, B., Matus, F., Contreras, T., and Iturra, D.: Guía Metodológica Para El Diagnóstico y Cálculo de La Amenaza Aluvional Presente y Futura (Methodological Guide for the Diagnosis and Calculation of Present and Future Debris-Flow Hazard), 1 edn., Advanced Mining Technology Center, Universidad de Chile, Santiago, Chile, 2025. a
Nikolopoulos, E. I., Destro, E., Maggioni, V., Marra, F., and Borga, M.: Satellite Rainfall Estimates for Debris Flow Prediction: An Evaluation Based on Rainfall Accumulation-Duration Thresholds, J. Hydrometeorol., 18, 2207–2214, https://doi.org/10.1175/JHM-D-17-0052.1, 2017. a, b
Ortega, C., Vargas, G., Rojas, M., Rutllant, J. A., Munoz, P., Lange, C. B., Pantoja, S., Dezileau, L., and Ortlieb, L.: Extreme ENSO-driven Torrential Rainfalls at the Southern Edge of the Atacama Desert during the Late Holocene and Their Projection into the 21th Century, Global Planet. Change, 175, 226–237, https://doi.org/10.1016/j.gloplacha.2019.02.011, 2019. a
Romero, J. E., Vergara-Pinto, F., Aguilar, G., Garcés, A., and Montserrat, S.: Triggering Factors, Behavior, and Social Impact of the January 2021 Hail-Debris Flows at the Central Valley of Chile, Landslides, 19, 865–883, https://doi.org/10.1007/s10346-021-01830-2, 2022. a
Rondanelli, R.: Cutoff Lows Over Southwestern South America, in: Oxford Research Encyclopedia of Climate Science, Oxford Academic, https://doi.org/10.1093/acrefore/9780190228620.013.976, 2025. a
Rondanelli, R., Hatchett, B., Rutllant, J., Bozkurt, D., and Garreaud, R.: Strongest MJO on Record Triggers Extreme Atacama Rainfall and Warmth in Antarctica, Geophys. Res. Lett., 46, 3482–3491, https://doi.org/10.1029/2018GL081475, 2019. a, b, c
Rutllant, J. A., Matus, F., Rudloff, V., and Rondanelli, R.: The Role of Atmospheric Rivers in Rainfall-Induced Landslides: A Study from the Elqui Valley, J. Arid Environ., 216, 105016, https://doi.org/10.1016/j.jaridenv.2023.105016, 2023. a, b, c
Takahashi, T.: Debris Flow: Mechanics, Prediction and Countermeasures, in: 2nd Edn., Taylor & Francis, ISBN 978-0-203-57674-8, 2014. a
Valenzuela, R., Garreaud, R., Vergara, I., Campos, D., Viale, M., and Rondanelli, R.: An Extraordinary Dry Season Precipitation Event in the Subtropical Andes: Drivers, Impacts and Predictability, Weather and Climate Extremes, 37, 100472, https://doi.org/10.1016/j.wace.2022.100472, 2022. a, b
Valenzuela, R. A. and Garreaud, R. D.: Extreme Daily Rainfall in Central-Southern Chile and Its Relationship with Low-Level Horizontal Water Vapor Fluxes, J. Hydrometeorol., 20, 1829–1850, https://doi.org/10.1175/JHM-D-19-0036.1, 2019. a, b
Vicencio Veloso, J. M.: Analysis of an Extreme Precipitation Event in the Atacama Desert on January 2020 and Its Relationship to Humidity Advection along the Southeast Pacific, Atmósfera, 35, https://doi.org/10.20937/ATM.52911, 2020. a
Wilcox, A., Escauriaza, C., Agredano, R., Mignot, E., Zuazo, V., Otárola, S., Castro, L., Gironás, J., Cienfuegos, R., and Mao, L.: An Integrated Analysis of the March 2015 Atacama Floods, Geophys. Res. Lett., https://doi.org/10.1002/2016GL069751, 2016. a, b
Zegers, G., Mendoza, P. A., Garces, A., and Montserrat, S.: Sensitivity and identifiability of rheological parameters in debris flow modeling, Nat. Hazards Earth Syst. Sci., 20, 1919–1930, https://doi.org/10.5194/nhess-20-1919-2020, 2020. a
Zhang, S. J., Xu, C. X., Wei, F. Q., Hu, K. H., Xu, H., Zhao, L. Q., and Zhang, G. P.: A Physics-Based Model to Derive Rainfall Intensity-Duration Threshold for Debris Flow, Geomorphology, 351, 106930, https://doi.org/10.1016/j.geomorph.2019.106930, 2020. a, b