the Creative Commons Attribution 4.0 License.
the Creative Commons Attribution 4.0 License.
 | 26 Oct 2026
FineKarstAGB: a 30 m resolution aboveground biomass dataset for Southwest China derived by upscaling plot-level inventory using sub-meter GaoFen satellite data
Yixiang Li

Zhengchao Chen
Caixia Liu
Xuan Yang
Xiaowei Tong
Martin Brandt
Zhaoming Wu
Zeqing Wang
Huaming Gao
Xiaoyi Wang
Sizhuo Li
Xin Xu
Siyu Liu
Southwest China has emerged as a key global carbon stock due to widespread forest expansion and aboveground biomass (AGB) increases driven by major ecological restoration since 2000, making accurate AGB estimates vital for assessing restoration efficacy. However, existing global and national-scale AGB products exhibit substantial limitations in this region, with little correlation with National Forest Inventory (NFI) plot and UAV LiDAR data, which is likely related to the pronounced spatial heterogeneity induced by karst landscapes and large-scale restoration efforts that exacerbate mixed-pixel effects. To address these challenges, this study proposes a Canopy Structure-driven Multi-feature Fusion Network (CSMF-Net) designed for high-precision AGB estimation in complex regions. The method takes NFI plot data as ground truth and integrates GaoFen imagery, horizontal structure derived from tree crown segmentation and vertical structure represented by canopy height data. Based on this approach, we generated a fine-grained 30 m AGB dataset (FineKarstAGB) for 2024, covering four provinces in Southwest China (Yunnan, Guizhou, Guangxi, and Hunan). Accuracy assessment against independent NFI plot data demonstrated the model's robust performance (R2=0.69, RMSE = 28.51 Mg ha−1), showing no evidence of saturation in high-biomass regions. Furthermore, a structural consistency assessment using an independent UAV LiDAR-derived canopy height model confirmed that FineKarstAGB maintains a strong relationship with forest vertical structure (R2=0.54). Other public datasets showed weak relationships with both NFI observations (R2≤0.12) and UAV LiDAR-derived canopy height (R2<0.1). Due to the tree-level segmentation, our dataset also quantifies AGB contributions from sparse trees outside forests, thus enabling more comprehensive and spatially explicit carbon accounting. This dataset provides critical support for regional carbon cycle assessments, fine-scale evaluations of ecological restoration outcomes, and progress toward national carbon neutrality targets. The dataset is available at https://doi.org/10.57760/sciencedb.33452 (Li et al., 2026).
- Article
(12930 KB) - Full-text XML
-
Supplement
(23417 KB) - BibTeX
- EndNote


Forests represent the largest carbon pool in terrestrial ecosystems and play a central role in regulating the global carbon cycle through long-term carbon sequestration in woody biomass (Pan et al., 2011; Cheng et al., 2024; Brandt et al., 2018; Chen et al., 2019). Accurate and spatially explicit estimates of forest aboveground biomass (AGB) are essential for quantifying terrestrial carbon stocks, supporting carbon cycle modeling, and informing climate change mitigation strategies at regional and global scales (Huang et al., 2013; Ma et al., 2024; Araza et al., 2022). High-quality AGB estimates provide crucial inputs for international reporting frameworks, including the Reducing Emissions from Deforestation and Degradation and Enhancement of Carbon Stocks program (REDD+), national greenhouse gas inventories, and the United Nations Sustainable Development Goals (SDGs), all of which rely on AGB datasets that are accurate, spatially detailed, and methodologically transparent to ensure reuse across ecological and policy applications (UNFCCC, 2013; Kashongwe et al., 2023; Zhang et al., 2023a).
Southwest China hosts the world’s largest contiguous distribution of carbonate rocks and is also one of the regions facing the most intense human-land conflicts (Tong et al., 2018). However, long-term state-led ecological restoration programs in this region have demonstrated a significant carbon sink capacity and substantial potential (Tong et al., 2020). A series of initiatives targeting rocky desertification control and ecological restoration in these karst areas, such as the Natural Forest Protection Program, the Grain for Green Program, integrated rocky desertification management, and the Yangtze River Shelterbelt Program, have fundamentally altered forest resources in the region (Tong et al., 2017; Trac et al., 2007), driving a sustained increase in AGB. Against this backdrop, developing accurate, high-spatial-resolution AGB datasets is particularly crucial for effectively evaluating the outcomes of these ecological restoration programs and for identifying and quantifying their ecological contributions. The vegetation in Southwest China exhibits an extremely complex, patchy, and fragmented distribution, as shown in Fig. S1 in the Supplement. The landscape often features composite ecosystems like forest-grassland, agroforestry, and forest-shrubland systems. Numerous restoration projects where farmlands have been transformed to forests include natural regeneration and active tree plantations that often differ from field to field, creating a local patchwork of different forest systems. This complex structure makes it challenging for existing medium- and low-resolution remote sensing imagery, and models built upon them, to accurately capture the region's fine-scale forest composition and high heterogeneity.
Methods for estimating aboveground biomass can be broadly classified into two main categories: field-based approaches and remote sensing-based methods. Field-based approaches typically involve destructive sampling or the application of allometric models that incorporate measurements such as tree height (H) and diameter at breast height (DBH) (Lu et al., 2016; Li et al., 2024b). Although these methods provide highly accurate and reliable estimates at local scales, their labor-intensive, time-consuming, and costly nature makes it challenging to upscale the plot-based data to heterogeneous regions, such as China's karst regions.
With the rapid advancement of remote sensing technology, mapping forest AGB across large spatial scales has become increasingly feasible (Yang et al., 2023; Yan et al., 2023b; Brovkina et al., 2017). The growing availability of diverse remote sensing datasets, such as optical imagery with high spatial, temporal, and spectral resolution (Zhu et al., 2025; Hu et al., 2020; Ma et al., 2023), an increasing number of spaceborne LiDAR missions (Duncanson et al., 2022; Markus et al., 2017), and Synthetic Aperture Radar (SAR) observations (Lu et al., 2021) has greatly propelled the application of remote sensing in forestry and ecological monitoring. However, each remote sensing modality has inherent limitations. Optical sensors cannot penetrate forest canopies, often resulting in saturation effects in high-AGB regions (Mitchard et al., 2012). Although spaceborne LiDAR provides unique advantages for retrieving canopy height and AGB, its discrete sampling footprints and substantial geolocation uncertainties limit its large-scale applicability, in particular for heterogeneous landscapes. Consequently, multi-source data fusion has emerged as the mainstream approach for large-scale forest AGB estimation (Li et al., 2024a; Wang et al., 2023; Schwartz et al., 2023).
Numerous studies have explored the generation of high-resolution, large-scale forest AGB datasets in China (Chang et al., 2021; Huang et al., 2019; Su et al., 2016). These studies typically fuse field plot data with multi-source remote sensing information and conventionally incorporate auxiliary parameters as covariates to enhance model accuracy. For example, Yang et al. (2023) developed a forest AGB dataset for China for 2019 by combining field plot data, canopy height (Liu et al., 2022b) (Fig. S1c), and environmental variables (topography, climate, soil) within a Random Forest model. Zhang et al. (2023b) constructed a Random Forest model based on Landsat bands (Fig. S1b), vegetation indices, topography, and climate variables to produce a national forest AGB dataset for China spanning 2013–2021 (Yan et al., 2023a). Meanwhile, Cai et al. (2025) used GEDI data as a supervisory source, selected features from Landsat bands, tree cover (Cai et al., 2024a) (Fig. S1d), topography, and climate using Recursive Feature Elimination (RFE), and built a CNN model to generate a dynamic, annual forest AGB product for China covering 1985–2023 (Cai et al., 2024b).
Existing methods rely heavily on indirect environmental variables such as topography, climate, and soil in AGB estimation. Although these variables influence AGB distribution and can improve model performance, the relationships established through them often fail to directly reflect the contribution of trees’ intrinsic structural attributes (e.g., individual tree height, crown width, DBH). Consequently, AGB patterns in these datasets may reflect environmental gradients rather than the actual distribution of forest structure. Furthermore, most datasets derived from these coarse-resolution and relatively static variables often fail to capture the landscape heterogeneity and AGB dynamics of southern China adequately.
Recent advances in remote sensing, particularly the availability of sub-meter satellite imagery (Zhang et al., 2023b), combined with the power of deep learning, offer unprecedented potential for detailed forest mapping and structural characterization. Deep learning models represented by U-Net (Ronneberger et al., 2015) and its variants are widely used for individual tree crown segmentation and counting, as well as canopy height and AGB estimation (Tong and Zhang, 2025; Li et al., 2025, 2023b; Campbell et al., 2025; Wagner et al., 2024). For example, Li et al. (2023a) leveraged aerial imagery to train a U-Net model for nationwide individual tree crown mapping in Denmark, indicating that approximately 30 % of the country’s tree cover is contributed by trees outside forests. Extending to larger spatial scales, Liu et al. (2023) applied a U-Net-based approach to PlanetScope imagery to generate wall-to-wall canopy height estimates across Europe.
However, translating these capabilities into accurate AGB estimates, especially in structurally complex and highly heterogeneous landscapes like Southwest China’s karst region, remains a significant hurdle. This raises several critical questions that current methodologies often fail to adequately address: (1) How can we overcome the inherent limitations of traditional pixel-based approaches that struggle with mixed pixels and fail to capture the fine-grained, patchy forest structure typical of karst environments? (2) Given that optical sub-meter data primarily capture spectral and textural information, how can we effectively integrate explicit three-dimensional structural information, both horizontal crown delineation and vertical height, to create more robust and accurate AGB models for these complex terrains? (3) Recognizing that significant biomass exists outside dense forest stands, how can we develop a methodology that reliably quantifies the AGB contribution of sparse trees, e.g., in agricultural lands or fragmented patches, which are often overlooked, to achieve more comprehensive regional carbon accounting? This study aims to answer these questions by developing a novel deep learning framework specifically designed for the challenges of AGB estimation in Southwest China.
2.1 Study area
The study area is located in Southwest China, encompassing the provinces of Yunnan, Guizhou, Guangxi and Hunan (20–31° N, 97–115° E, Fig. 1). Elevation ranges from near sea level in Guangxi to 6740 m in Yunnan, reflecting substantial topographic variability. The region is characterized by karst landforms, including widespread peak-cluster depressions (Fig. 1c, d), trough valleys, basins, plateaus, and hills (Tong et al., 2017), which are associated with fragmented terrain, discontinuous surface hydrology, and strong spatial heterogeneity. The prevailing climate is subtropical monsoon with plateau and mountain influences, characterized by warm, humid conditions and abundant rainfall (Pei et al., 2022). Local microclimates and vertical differentiation in hydrothermal conditions provide favorable habitats for diverse vegetation types. Forests in the region account for over 20 % of China’s total forest area and include evergreen broadleaf forests, mixed evergreen-deciduous broadleaf forests, and a variety of plantations (e.g., Masson pine and eucalyptus) (Liu et al., 2022a; Qian et al., 2025). This unique combination of complex terrain and heterogeneous vegetation patterns provides contextual background for the spatial distribution of forest structure and remotely sensed forest variables.
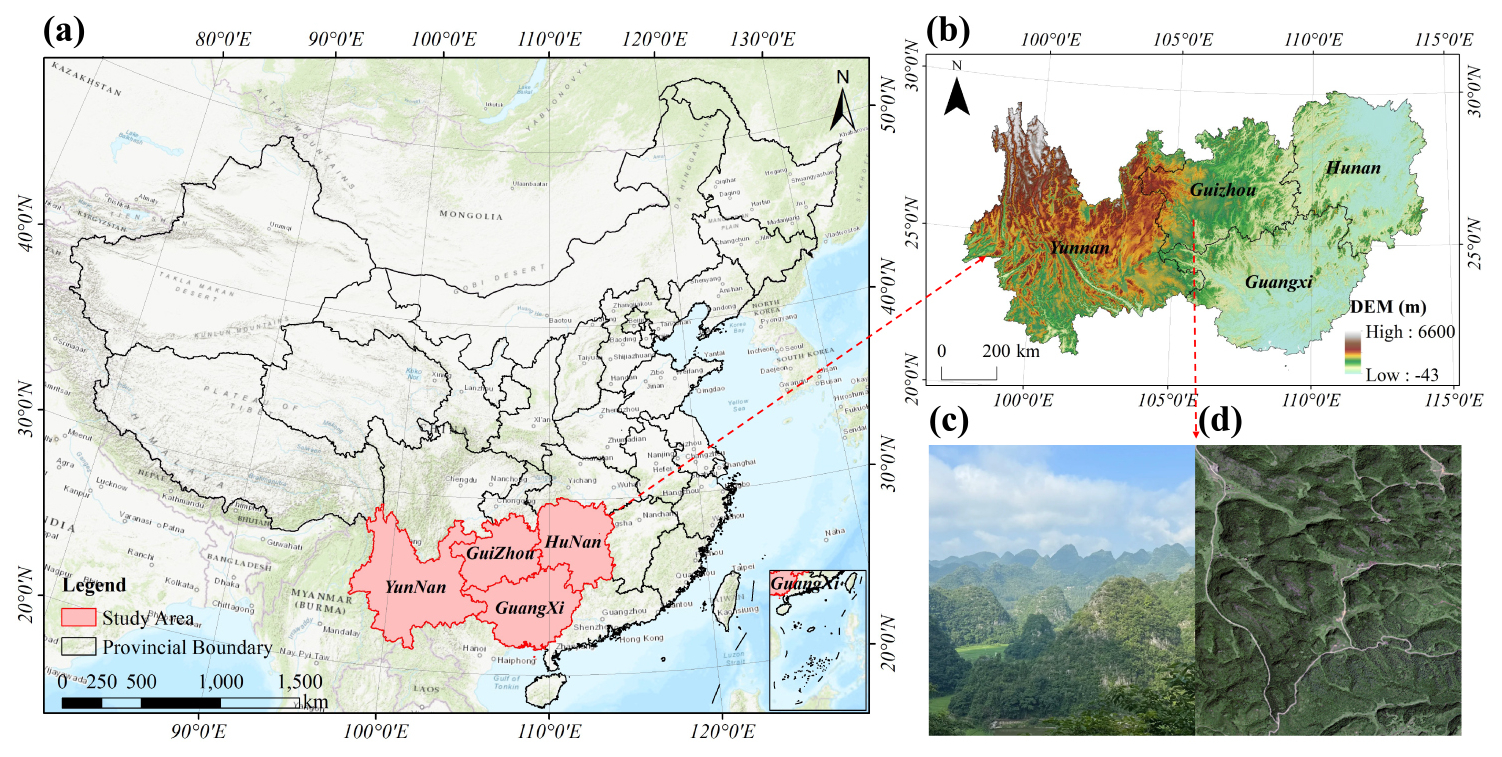
Figure 1Overview and typical landscapes of the study area. (a) Location of the study area (red section; basemap: Esri, USGS, OpenStreetMap | powered by Esri), (b) Digital Elevation Model (DEM) of the study area derived from Copernicus DEM, (c) Field photo of the peak-cluster depression landscape in Southwest China, (d) The corresponding GaoFen imagery (RGB) of the same landscape.
2.2 Remote sensing data
2.2.1 Sub-meter GaoFen imagery
The sub-meter optical imagery used in this study was acquired over the study area by GaoFen-2 (GF-2) and GaoFen-7 (GF-7) of the GaoFen satellite constellation. The image collection includes 10 330 GF-2 scenes and 1299 GF-7 scenes acquired during 2023–2024, with summer 2024 imagery used as the primary source and 2023 imagery used to fill remaining spatial gaps. The panchromatic and multispectral (PMS) sensors onboard GF-2 provide a 0.8 m panchromatic band and four 3.2 m multispectral bands, while GF-7, as a stereo-mapping satellite, offers a similar spectral configuration with a 0.8 m panchromatic band and four 3.2 m multispectral bands (Zhang et al., 2023b; Pan et al., 2015).
All raw images were processed using a comprehensive workflow, including dehazing and enhancement, geometric and radiometric correction, pan-sharpening, cloud detection, mosaicking, and tiling, to generate a continuous GaoFen image mosaic covering the entire four-province study area. The processed imagery was organized into tiles based on a hierarchical grid system analogous to the Google Maps zoom-level framework. The final processed imagery consists of 13 648 image tiles distributed across Yunnan, Guizhou, Guangxi, and Hunan, with the spatial mosaic shown in Fig. S2 and provincial tile statistics summarized in Table S1.
2.2.2 Tree crown segmentation dataset
To characterize the highly heterogeneous patterns of tree distribution across the study area, this study used a tree-crown segmentation dataset derived from sub-meter GaoFen imagery and a U-Net model. The dataset originates from previous tree-mapping efforts (Xu et al., 2026). Using the same methodological framework, tree-crown segmentation was extended across the four-province study area, resulting in more than 21 billion mapped trees. Tree crowns with a mapped area of at least 0.64 m2, equivalent to one pixel in the original GaoFen imagery, were retained; this threshold represents the minimum mapping unit of the dataset.
Tree-crown segmentation accuracy was assessed using 919 independent image-interpretation plots, separate from the NFI plots and covering the major forest types and topographic conditions across the study area. Within these plots, 9061 crowns were manually delineated, and pixel-wise comparison of the binary crown masks yielded a precision of 0.832, a recall of 0.853, and an F1 score of 0.843. The R2=0.82 reported by Xu et al. (2026) refers to the plot-level agreement between labeled and predicted tree counts in Guangxi. The tree counts for Southwest China are summarized in Table S1.
2.2.3 Canopy height dataset
Canopy height is a key parameter of forest vertical structure and plays an important role in large-scale AGB estimation (Yang et al., 2023; Liu et al., 2023). This study used a wall-to-wall canopy-height dataset with a spatial resolution of 0.8 m covering the entire study area. As described by Tong et al. (2025), the dataset was generated using a U-Net model with a ResNet-50 backbone, with sub-meter GaoFen imagery as input and airborne LiDAR-derived CHMs as reference data. The dataset achieved an MAE of 1.94 m and an RMSE of 2.76 m on an independent validation dataset, with no evident saturation in the higher canopy-height range. These errors were substantially lower than those reported by Tong et al. (2025) for the canopy-height products of Liu et al. (2022b), Lang et al. (2023), and Potapov et al. (2021) (MAE ≥5.47 m; RMSE ≥6.98 m).
Further accuracy assessment using independent UAV LiDAR data (described in Sect. 2.3.2) yielded an MAE of 1.50 m and an RMSE of 2.82 m for the GaoFen-derived canopy-height dataset, while the other three products showed MAE ≥4.13 m and RMSE ≥5.88 m. The corresponding validation results are shown in Fig. S3.
2.3 Reference and evaluation data
2.3.1 National Forest Inventory (NFI) data
Ground-truth reference data were derived from China’s 9th National Forest Inventory (NFI) (Jian et al., 2022). As an integral component of the national forest resource monitoring system, the NFI provides forest metrics, including forest area, stock volume, and AGB, based on systematically repeated field surveys conducted at fixed sample plots nationwide at five-year intervals. The NFI plots used in this study encompass six provinces – Yunnan, Guizhou, Guangxi, Guangdong, Hunan, and Hubei, which collectively capture the complex topographic gradients and ecological diversity characteristic of Southwest China. NFI plots are typically square in shape with an area of 0.0667 ha (1 mu). Plot-level AGB is estimated from measured stand volume using biomass expansion factors (BEF) specific to tree species and age classes. The temporal coverage of the dataset spans 2014–2018; however, detailed timestamp information for individual plots is unavailable.
The temporal gap of up to one decade between the NFI data and the remote sensing imagery used in this study introduces potential uncertainty (Yang et al., 2023). In Southwest China, government-led land-use policies and large-scale ecological restoration initiatives, such as afforestation and reforestation programs, have driven extensive forest regeneration and expansion. Consequently, the region is dominated by young to middle-aged, fast-growing forests, where AGB exhibits rapid and substantial decadal dynamics (Tong et al., 2020). Under these conditions, direct use of temporally misaligned datasets for model training or validation may affect the accuracy of AGB estimation.
To identify gross inconsistencies between historical plot AGB and the spectral and structural conditions represented by the recent imagery, we applied an automated cross-source consistency screening workflow. First, an initial data-cleaning step removed plots with incomplete records, missing AGB values, zero or negative AGB, or zero or negative mean tree height. Second, three simple features strongly related to AGB were derived from the high-resolution remote-sensing data for the remaining plots: mean NDVI, crown coverage, and mean canopy height. These features represent the spectral condition, horizontal canopy occupancy, and vertical canopy structure of each plot, respectively.
Third, a parsimonious Random Forest model was constructed using these three variables as predictors and the recorded NFI AGB as the response. To avoid screening plots using in-sample fitted values, five-fold cross-validation was applied. In each iteration, the model was trained using four folds and applied to the remaining fold, ensuring that every plot received an out-of-fold prediction from a model that had not used that plot for training. Plots for which the out-of-fold prediction differed from the recorded NFI AGB by more than 50 % were excluded from subsequent model development. The RF was used only as a preliminary quality-control tool; its parameters and predictions were not transferred to CSMF-Net. Its purpose was to identify pronounced inconsistencies between historical plot AGB and the forest conditions represented by the GaoFen-derived features, rather than to select plots according to CSMF-Net prediction performance or to update the historical NFI AGB values to 2024. This procedure was used as sample-compatibility quality control rather than as a direct temporal correction; it removed plots exhibiting severe structural–label incompatibilities while maintaining the representativeness and diversity of the AGB distribution. However, it could not completely eliminate the uncertainty associated with the temporal mismatch. The final set of selected plots (n=3637) was used for model training (n=2545), validation (n=364), and testing (n=728), and their distribution is shown in Fig. S4.
2.3.2 UAV LiDAR data
The evaluation CHM data used in this study were obtained from LIDARNET (http://lidar.pku.edu.cn, last access: 15 October 2026) and covered typical forest scenes in Guangxi Province. The data comprise 18 UAV LiDAR datasets acquired in 2020, covering approximately 1208 ha across Guilin (n=10), Fangchenggang (n=6), and Wuzhou (n=2). The LiDAR point clouds were acquired using Riegl VUX-1, with an average point-cloud density exceeding 10 pts m−2. The resulting CHMs have a spatial resolution of 0.05 m. Their spatial distribution and a representative example are shown in Fig. S5.
The raw UAV LiDAR data underwent a standardized processing pipeline, including digital terrain modeling, canopy-height extraction, and plot-scale aggregation. We examined all CHM samples and excluded those exhibiting changes unrelated to natural growth (e.g., logging). In total, 3982 CHM validation samples (3591 in forests and 391 outside forests) were obtained and used to evaluate the AGB estimates at the plot level. Only samples with available AGB predictions were included in each product-specific validation, which explains variation in sample size among datasets.
2.4 Comparison AGB datasets
To compare the performance of the AGB dataset developed in this study with existing datasets, we selected four global and national-scale AGB datasets with different spatial resolutions (Table 1). For each dataset, the year closest to this study was chosen to ensure temporal comparability.
Yang et al. (2023)Yan et al. (2023a)Santoro and Cartus (2025)Cai et al. (2024b)
-
Yang Map. This dataset integrates 4789 national ground plot measurements of AGB with multi-source remote sensing data, including forest canopy height products, optical spectral indices, and topographic and climatic variables. A Random Forest regression model was employed to generate the AGB estimates. The resulting product provides a 30 m spatial resolution map of China’s forest AGB for 2019 (Yang et al., 2023).
-
Yan Map. This approach utilized GaoFen and Landsat satellite data combined with a Random Forest model trained on 6667 ground plots. Specifically, GF-1 and GF-2 imagery were used to map forest cover, while time-series Landsat data informed forest AGB estimation. The study aimed to assess China’s forest status and trends in support of Sustainable Development Goal (SDG) evaluations (Zhang et al., 2023a). The dataset provides annual 30 m resolution maps of China’s forest AGB from 2015 to 2021 (Yan et al., 2023a).
-
ESA CCI. The ESA CCI AGB dataset is a global-scale dataset generated using the BIOMASAR semi-empirical algorithm that estimates AGB from C- and L-band SAR data. LiDAR canopy height, external AGB statistics and land cover data are used to calibrate the model. The dataset provides global forest AGB maps at 100 m resolution for the years 2007, 2010 and 2015–2022 (Santoro and Cartus, 2025).
-
Cai Map (CFATD). This dataset employed a deep learning framework combining multi-source remote sensing inputs with ResNet architectures. The model was trained on over 50 000 multi-temporal GEDI-derived AGB training samples and independently validated using multi-year field survey data (Cai et al., 2025). The resulting product delivers annual 30 m resolution forest AGB maps for China from 1985 to 2023 (Cai et al., 2024b).
To enable accurate AGB estimation in the complex terrain and highly heterogeneous landscapes of Southwest China, this study developed an AGB estimation framework that integrates sub-meter remote sensing imagery with tree crown segmentation and canopy height datasets. The overall workflow is illustrated in Fig. 2 and comprises four main stages:
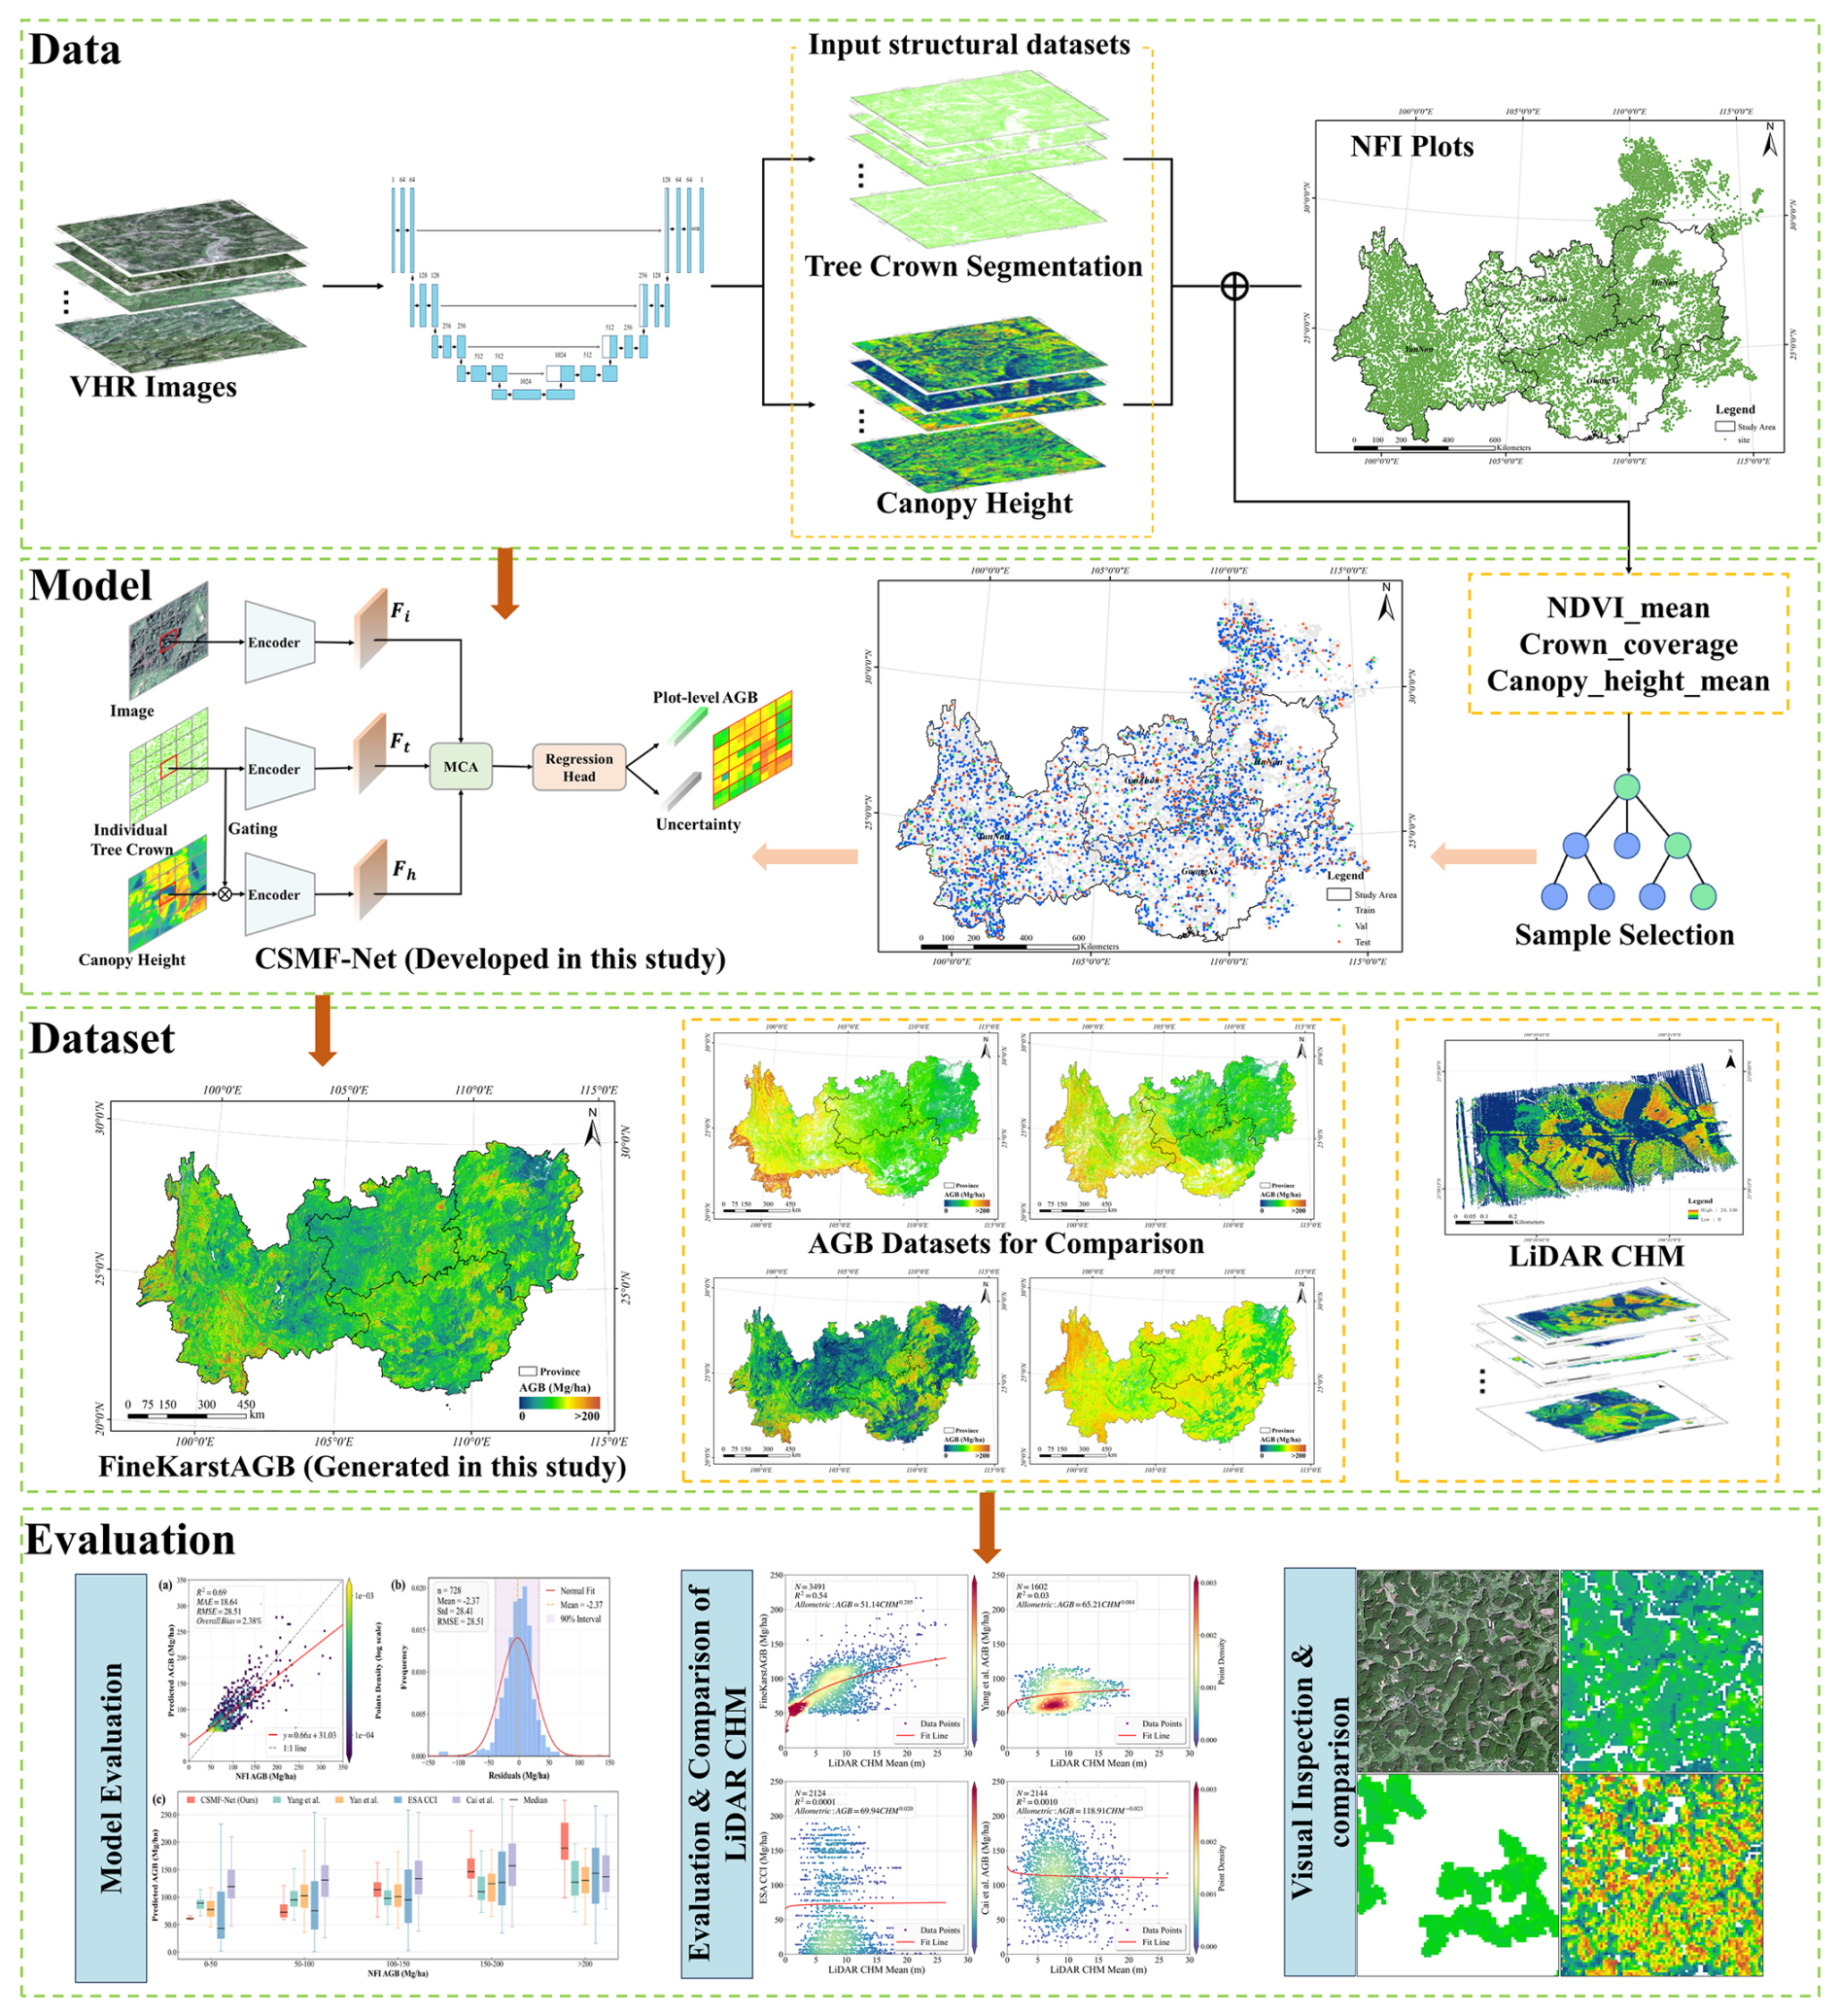
Figure 2Workflow of plot-level aboveground biomass estimation. The tree crown segmentation and canopy height layers are input datasets produced independently of the present AGB study using the methodological frameworks of Xu et al. (2026) and Tong et al. (2025), respectively; CSMF-Net and FineKarstAGB were developed and generated in the present study.
(1) Data and Sample Processing. Remote sensing features were constructed for the NFI plots by combining sub-meter GaoFen imagery with tree crown segmentation and canopy height datasets. Subsequently, a Random Forest model was employed to perform quality control and filter the training samples, ensuring their representativeness and reliability. (2) Model Development. We developed an end-to-end, multi-feature fusion network capable of integrating multi-source remote sensing features with both horizontal and vertical forest structural information. The network regresses plot-level AGB and quantifies its associated uncertainty. (3) AGB Dataset Generation for Southwest China. The trained network was applied across the entire study area to produce a fine-grained AGB dataset for Southwest China. (4) Accuracy Assessment and Comparative Evaluation. Model performance was evaluated using an independent test set to assess accuracy. Further comparative evaluation was conducted, in which the generated AGB dataset and existing global and national-scale AGB datasets were compared against independent UAV LiDAR-derived CHM data.
3.1 Canopy Structure-driven Multi-feature Fusion Network
As illustrated in Fig. 3, this study proposes a Canopy Structure-driven Multi-feature Fusion Network (CSMF-Net) for plot-level AGB regression. The model integrates three spatially aligned inputs with complementary information: sub-meter GaoFen imagery provides the spectral and spatial context of the plot, tree-crown segmentation characterizes the horizontal distribution of the canopy, and canopy height represents its vertical structure. These inputs are processed through separate feature-extraction branches and subsequently integrated by the Multi-feature Cross-Attention module, which enables the imagery features to interact with the horizontal and vertical structural features. The fused representation is then used by the regression head to predict a single plot-level AGB value and its associated uncertainty.
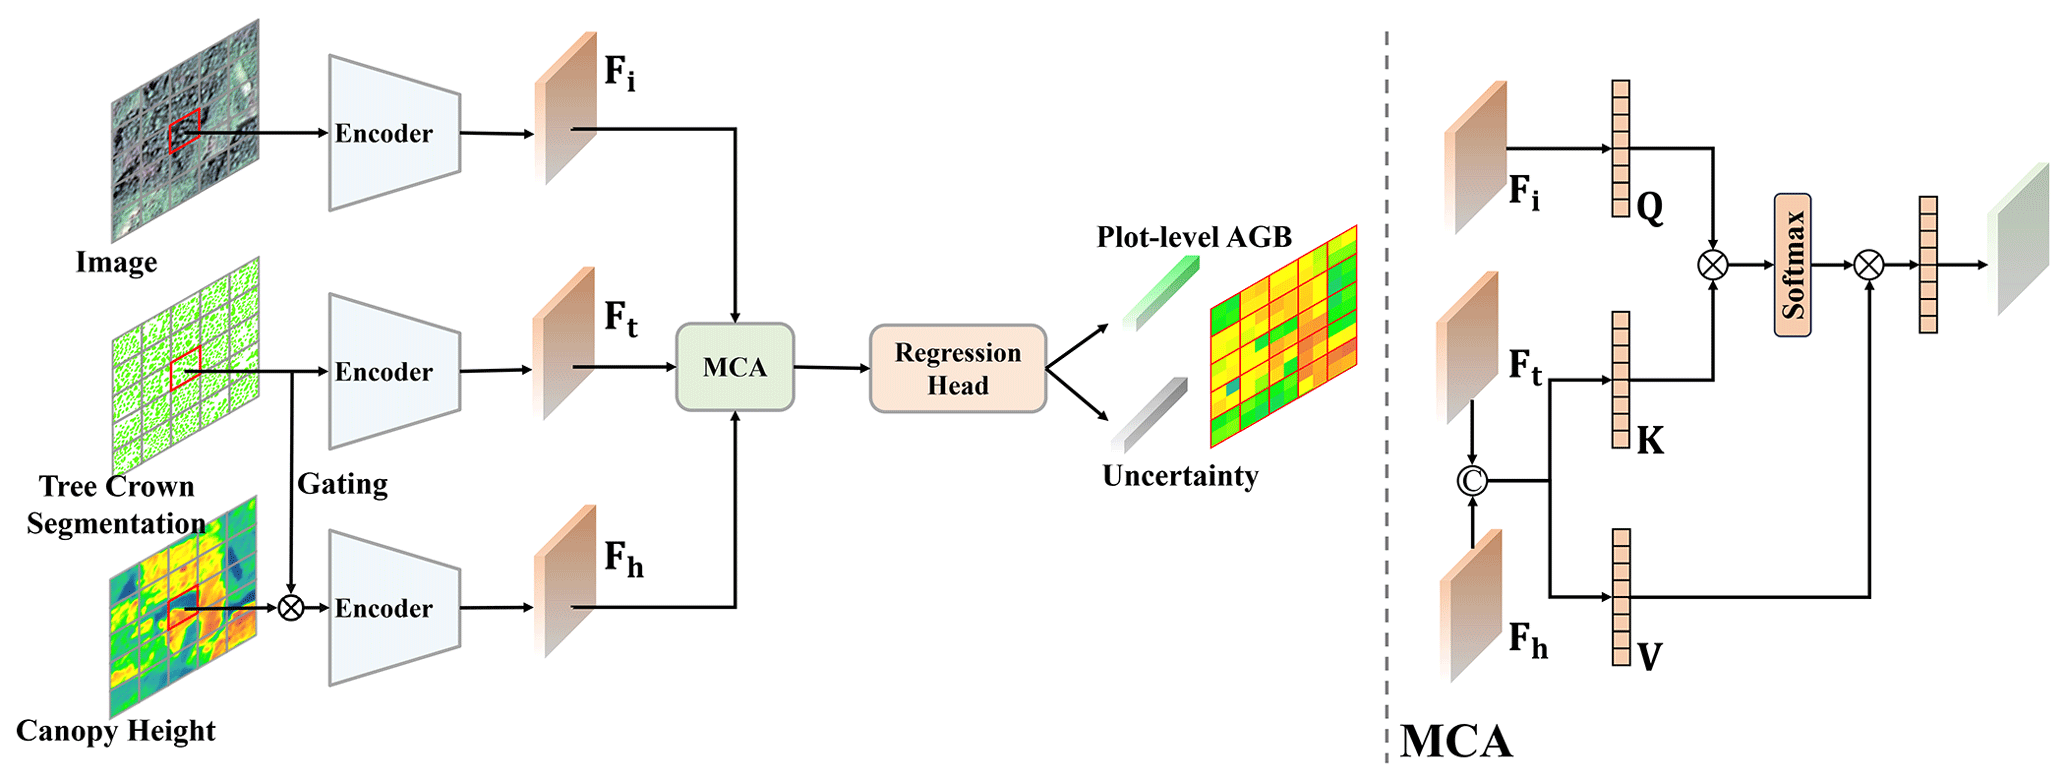
Figure 3Architecture of the Canopy Structure-driven Multi-feature Fusion Network (CSMF-Net) and the Multi-feature Cross-Attention Module.
CSMF-Net adopts a Patch-to-Point regression strategy, in which a preprocessed NFI plot-level data patch is used as input to directly predict a single AGB value and its associated uncertainty for that plot. By using a spatial patch rather than treating individual pixels as independent samples, this strategy retains the spatial context and internal heterogeneity within each patch.
In karst landscapes, vegetation distribution is extremely fragmented due to complex terrain, shallow soils, and strong lithological controls, causing individual medium-resolution pixels to frequently contain mixtures of vegetation, bare rock, and soil. Pixel-level models trained on such mixed signals may smooth local variability. In contrast, the patch-to-point framework aggregates spectral and structural patterns across multiple pixels and learns their joint relationship with plot-level AGB. This design is intended to help account for mixed-pixel effects and spatial heterogeneity within plots when estimating plot-level AGB in karst landscapes.
3.1.1 CSMF-Net model architecture
The overall architecture of the proposed Canopy Structure-driven Multi-feature Fusion Network (CSMF-Net) is illustrated in Fig. 3. It consists of a multi-branch feature extractor, a multi-feature cross-attention module, and a regression head.
First, in the feature extraction stage, the GaoFen optical imagery, tree crown data, and canopy height data for a given plot patch are processed through three parallel encoder branches. A ResNet backbone is employed in each branch to extract deep features from the corresponding data layer. Furthermore, prior to feature extraction on the canopy height data, a gating mechanism is applied. This mechanism performs pixel-wise multiplication of the canopy height data with the tree crown segmentation mask, effectively suppressing background interference and enabling the network to concentrate on the vertical structural information of the canopy.
Subsequently, the extracted features () from the different branches are input into the core Multi-feature Cross-Attention (MCA) module. This module is key to achieving deep fusion of cross-feature information within CSMF-Net. It adaptively learns the interdependencies between spectral and structural features to generate a fused feature representation that is richer in information and more expressive.
Finally, the fused feature is input into a regression head, which consists of multiple fully connected layers. This head outputs the plot-level AGB along with its corresponding heteroscedastic uncertainty.
3.1.2 Multi-feature Cross-Attention module
To achieve effective interaction and informational complementarity between spectral and structural information, we designed a Multi-feature Cross-Attention (MCA) module, the detailed structure of which is illustrated on the right side of Fig. 3.
The features from the sub-meter GaoFen imagery provide spatial context, while the tree crown and canopy height features explicitly capture the horizontal and vertical structural attributes of the forest. Therefore, within the MCA module, we designated the imagery feature as the Query (Q), leveraging its global contextual information to aggregate relevant information from the other structural features. Simultaneously, we concatenated the canopy height feature with the tree crown feature, followed by separate linear projections to derive the Key (K) and the Value (V).
The cross-attention operation is formally expressed mathematically as follows:
where WQ, WK, and WV are learnable weight matrices used for feature projection. The attention weights are computed by evaluating the similarity between the Query and the Key, followed by normalization using the Softmax function. These weights are then applied to the Value to generate the fused feature representation.
where dk is the dimension of the Key, used for scaling to stabilize the gradients during training.
3.1.3 Loss function
To jointly optimize the model’s regression accuracy and its predictive uncertainty, we adopted a composite loss function comprising two components: the R2 loss () and the heteroscedastic uncertainty loss (Lunc).
where λ is a hyperparameter that balances the contributions of the two loss components. In this study, we set λ to 0.1 based on empirical experiments.
The R2 loss is formulated to directly optimize the model’s goodness-of-fit for AGB by maximizing the R2 between the predicted and true values. It is defined as follows:
where N is the number of samples in a batch, yi and represent the true and predicted AGB values for the ith sample, respectively, and is the mean of the true AGB values.
The heteroscedastic uncertainty loss is formulated to capture and explain the discrepancies between the imagery and the plot data, enabling the model to learn the prediction uncertainty associated with the input data. For samples where the model exhibits low prediction confidence, their contribution to the overall loss is proportionally reduced, thereby mitigating the negative impact of noisy or anomalous samples on model training. It is defined as follows:
The first term of this loss function is a Mean Squared Error (MSE) term, which is modulated by an adaptive weight; the second term is a regularization term.
For each pixel, the regression branch outputs the AGB estimate, whereas the uncertainty branch outputs the corresponding input-dependent log variance. The corresponding standard deviation and the lower and upper bounds of an approximately 95 % prediction interval are calculated under an approximately Gaussian error distribution as follows:
In Eq. (7), the exponential factor multiplying the squared residual is the inverse of the predicted variance, whereas the additive log-variance term prevents unconstrained variance inflation. Together, these terms estimate the conditional prediction-error variance for each input patch. The square root of this variance defines the 95 % prediction interval and represents the pixel-level predictive uncertainty, allowing uncertainty to vary with the spectral and structural characteristics of the input. The conversion from the 95 % interval width to an equivalent standard deviation follows Cai et al. (2025).
3.1.4 Model training and implementation details
The model was implemented using the PyTorch deep learning framework. During training, we employed the AdamW optimizer (Loshchilov and Hutter, 2019), which effectively enhances the model’s generalization capability. The initial learning rate was set to , and a learning rate decay strategy was applied to achieve finer parameter adjustments in the later stages of training. Considering both computational constraints and convergence efficiency, the batch size was set to 32. All experiments were conducted on an NVIDIA RTX 3090 GPU.
3.2 Accuracy assessment and cross-dataset comparison
To evaluate the fine-scale AGB dataset developed for Southwest China in this study, we established an integrated assessment framework consisting of three components. (1) An independent test set derived from NFI plots was used to quantitatively evaluate model performance and dataset accuracy. (2) Independent UAV LiDAR-derived CHM data were employed to assess the reliability of the AGB dataset and its consistency with forest vertical structure. (3) Visual inspection and comparisons with representative existing AGB datasets were conducted over typical tree-covered landscapes to examine differences in spatial detail and structural representation among datasets. To ensure objectivity and comparability, the quantitative evaluation approaches described in (1) and (2) were also applied to the comparison datasets.
To quantify the contributions of the three model inputs, leave-one-input-out ablation experiments were conducted under identical data partitions and training settings. Each two-input variant was evaluated against the full model using the independent NFI test set.
Four commonly used statistical metrics were employed to evaluate the consistency between the predicted AGB values and the ground plot reference values: the coefficient of determination (R2), Mean Absolute Error (MAE), Root Mean Square Error (RMSE), and Overall Bias.
where N is the total number of samples, yi and represent the true and predicted AGB values for the ith sample, respectively, and is the mean of the true AGB values.
To assess topographic effects on AGB estimation, we examined variations in residual distributions across slope and aspect classes and calculated Pearson and Spearman correlations between continuous slope and absolute residuals to test whether prediction errors increased linearly or monotonically with slope.
4.1 Evaluation with NFI data
4.1.1 Model performance
The CSMF-Net predictions exhibited strong agreement with the independent NFI observations, achieving R2=0.69, MAE = 18.64 Mg ha−1, RMSE = 28.51 Mg ha−1, and an overall bias of 2.38 % (Fig. 4a). To further evaluate model performance and uncertainty, we grouped the NFI plots in different classes of AGB ranges and CSMF-Net estimates were compared with multiple established AGB datasets across the classes (Fig. 4c). Overall, CSMF-Net shows reduced predictive uncertainty, with narrower interquartile ranges than existing datasets. Notably, CSMF-Net demonstrates a better capability in capturing both high and low values. In high-AGB regions (> 200 Mg ha−1), CSMF-Net achieves a median prediction of approximately 190 Mg ha−1, which is 50–60 Mg ha−1 higher than that of conventional products, highlighting its ability to retain high-AGB signals without saturation effects. At 150–200 Mg ha−1 AGB levels, CSMF-Net maintains a median of around 145 Mg ha−1, aligning well with NFI observations, whereas other datasets underestimate field data by 25–30 Mg ha−1. In lower AGB areas (50–100 Mg ha−1), CSMF-Net exhibits a median of roughly 70 Mg ha−1 with an IQR < 25 Mg ha−1, effectively suppressing high-noise fluctuations observed in products such as ESA CCI (IQR of about 90 Mg ha−1). These results indicate that our map provides both accurate and stable AGB predictions across the full AGB range, offering a robust, uncertainty-aware basis for large-scale AGB mapping in the study area. The average changes in median estimates between adjacent NFI AGB intervals were 9.5 Mg ha−1 for Yang Map, 13.3 Mg ha−1 for Yan Map, and 4.5 Mg ha−1 for Cai Map, compared with 32.1 Mg ha−1 for FineKarstAGB. ESA CCI showed a comparatively stronger interval response of 25.1 Mg ha−1, but with wide interquartile ranges across the intervals (85.5–101.5 Mg ha−1).
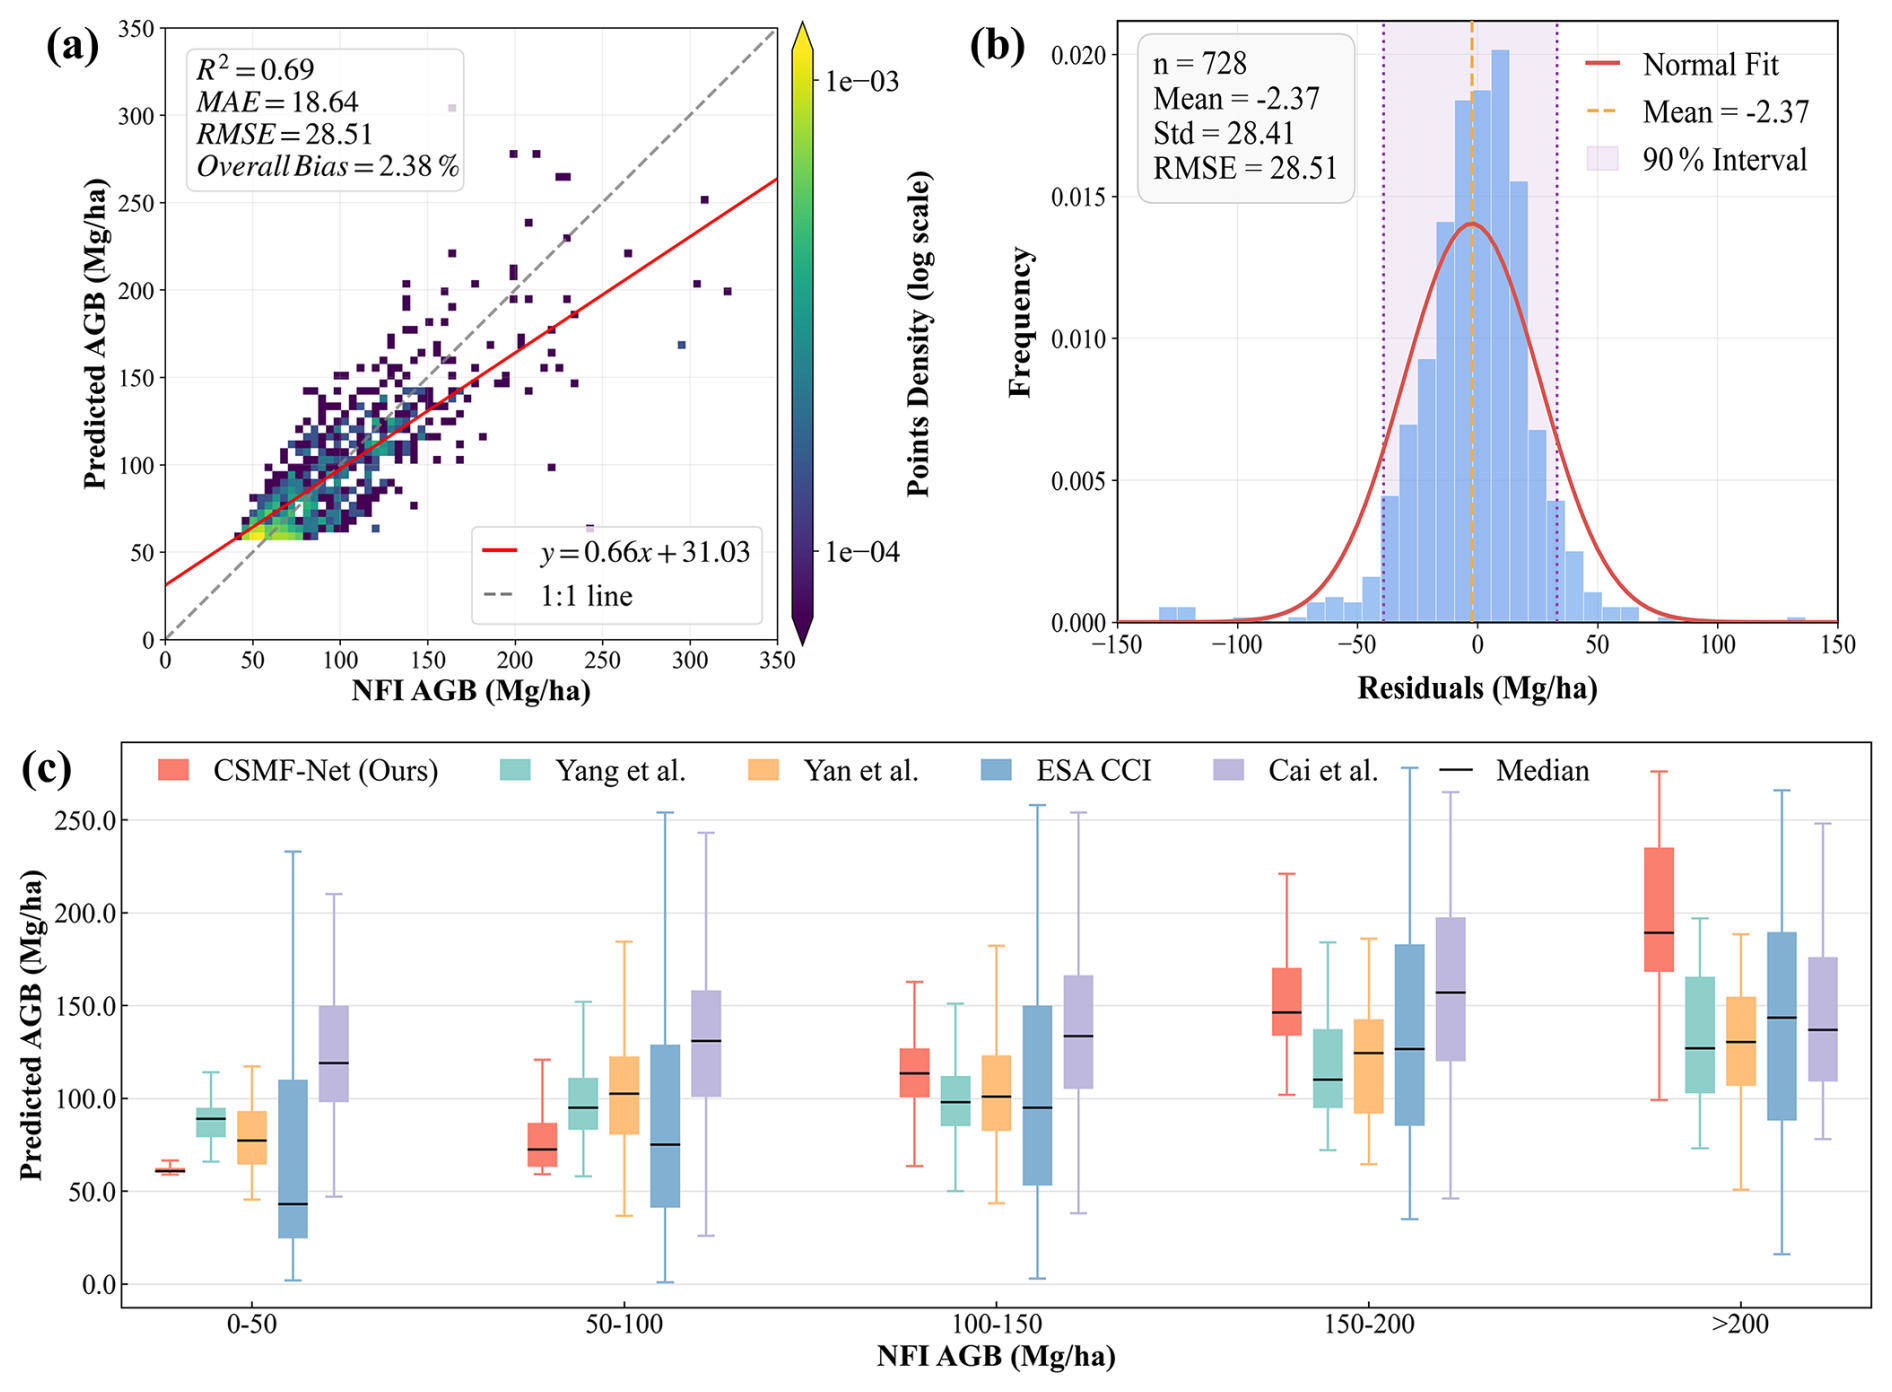
Figure 4Evaluation of the CSMF-Net against independent NFI plots (n=728). (a) Scatter plot of predicted versus observed AGB for independent NFI test plots. (b) Distribution of residuals (predicted AGB minus observed AGB) for the NFI test plots. (c) Binned analysis of the AGB estimated by CSMF-Net (Ours) with the existing datasets.
4.1.2 Contribution of model inputs
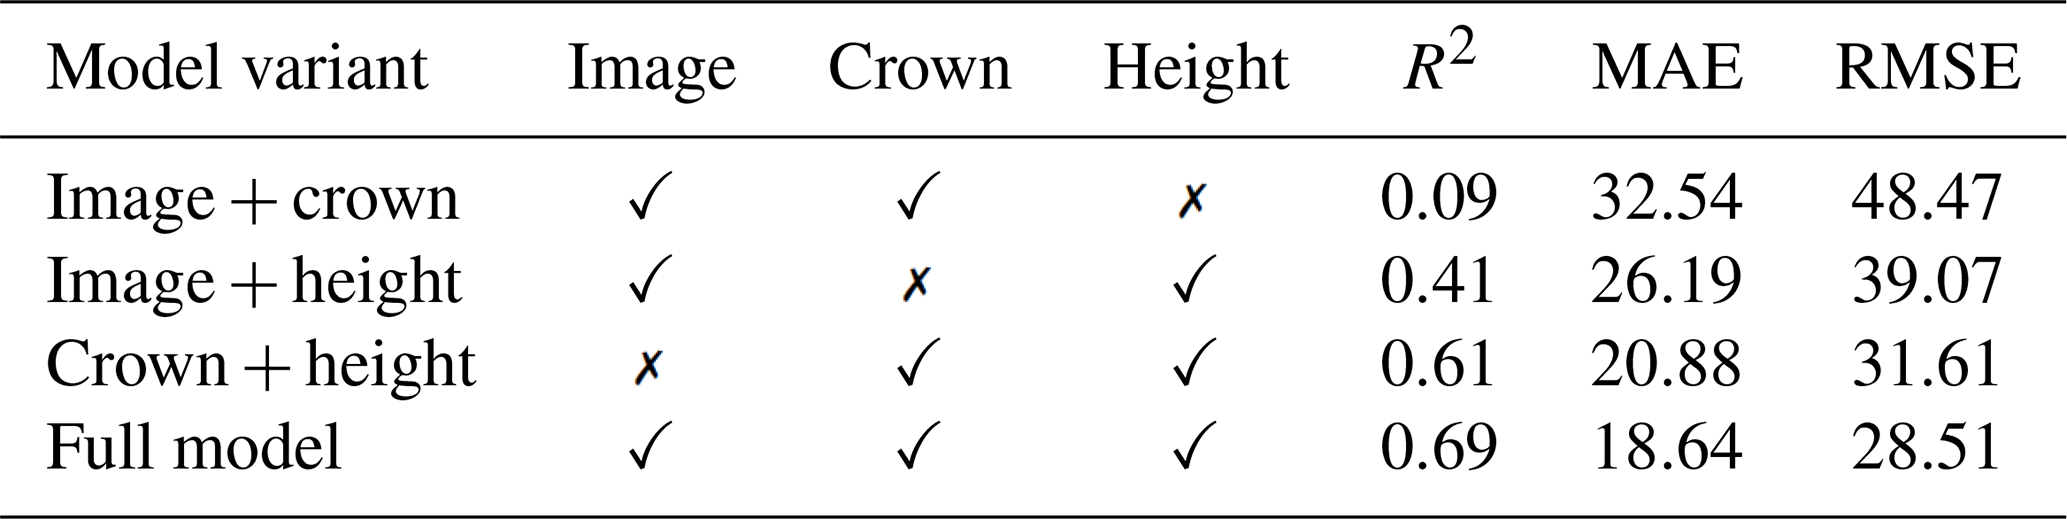
The input-ablation experiments showed that all three inputs contributed to model performance (Table 2). Relative to the corresponding two-input variants, adding GaoFen imagery, tree-crown information, and canopy height reduced RMSE by 9.8 %, 27.0 %, and 41.2 %, respectively, and reduced MAE by 10.7 %, 28.8 %, and 42.7 %, respectively. The full model achieved the highest accuracy (RMSE = 28.51 Mg ha−1, MAE = 18.64 Mg ha−1, and R2=0.69).
Table 2Leave-one-input-out ablation results evaluated against the independent NFI test set.
The evaluation results for the comparison datasets are presented in Fig. 5. Existing global- and national-scale AGB products generally exhibited weaker relationships with the NFI observations in the study area, with R2 values ranging from 0.03 to 0.12 and RMSE values ranging from 51.16 to 72.25 Mg ha−1. Specifically, the R2 values were 0.12 for Yang Map, 0.04 for Yan Map, 0.06 for ESA CCI, and 0.03 for Cai Map. The Cai Map also showed a pronounced systematic bias, with an overall bias of 33.66 %. Moreover, the fitted linear relationships had consistently low slopes (0.13–0.32), accompanied by substantial underestimation in high-AGB regions (>200 Mg ha−1), indicating varying degrees of saturation.
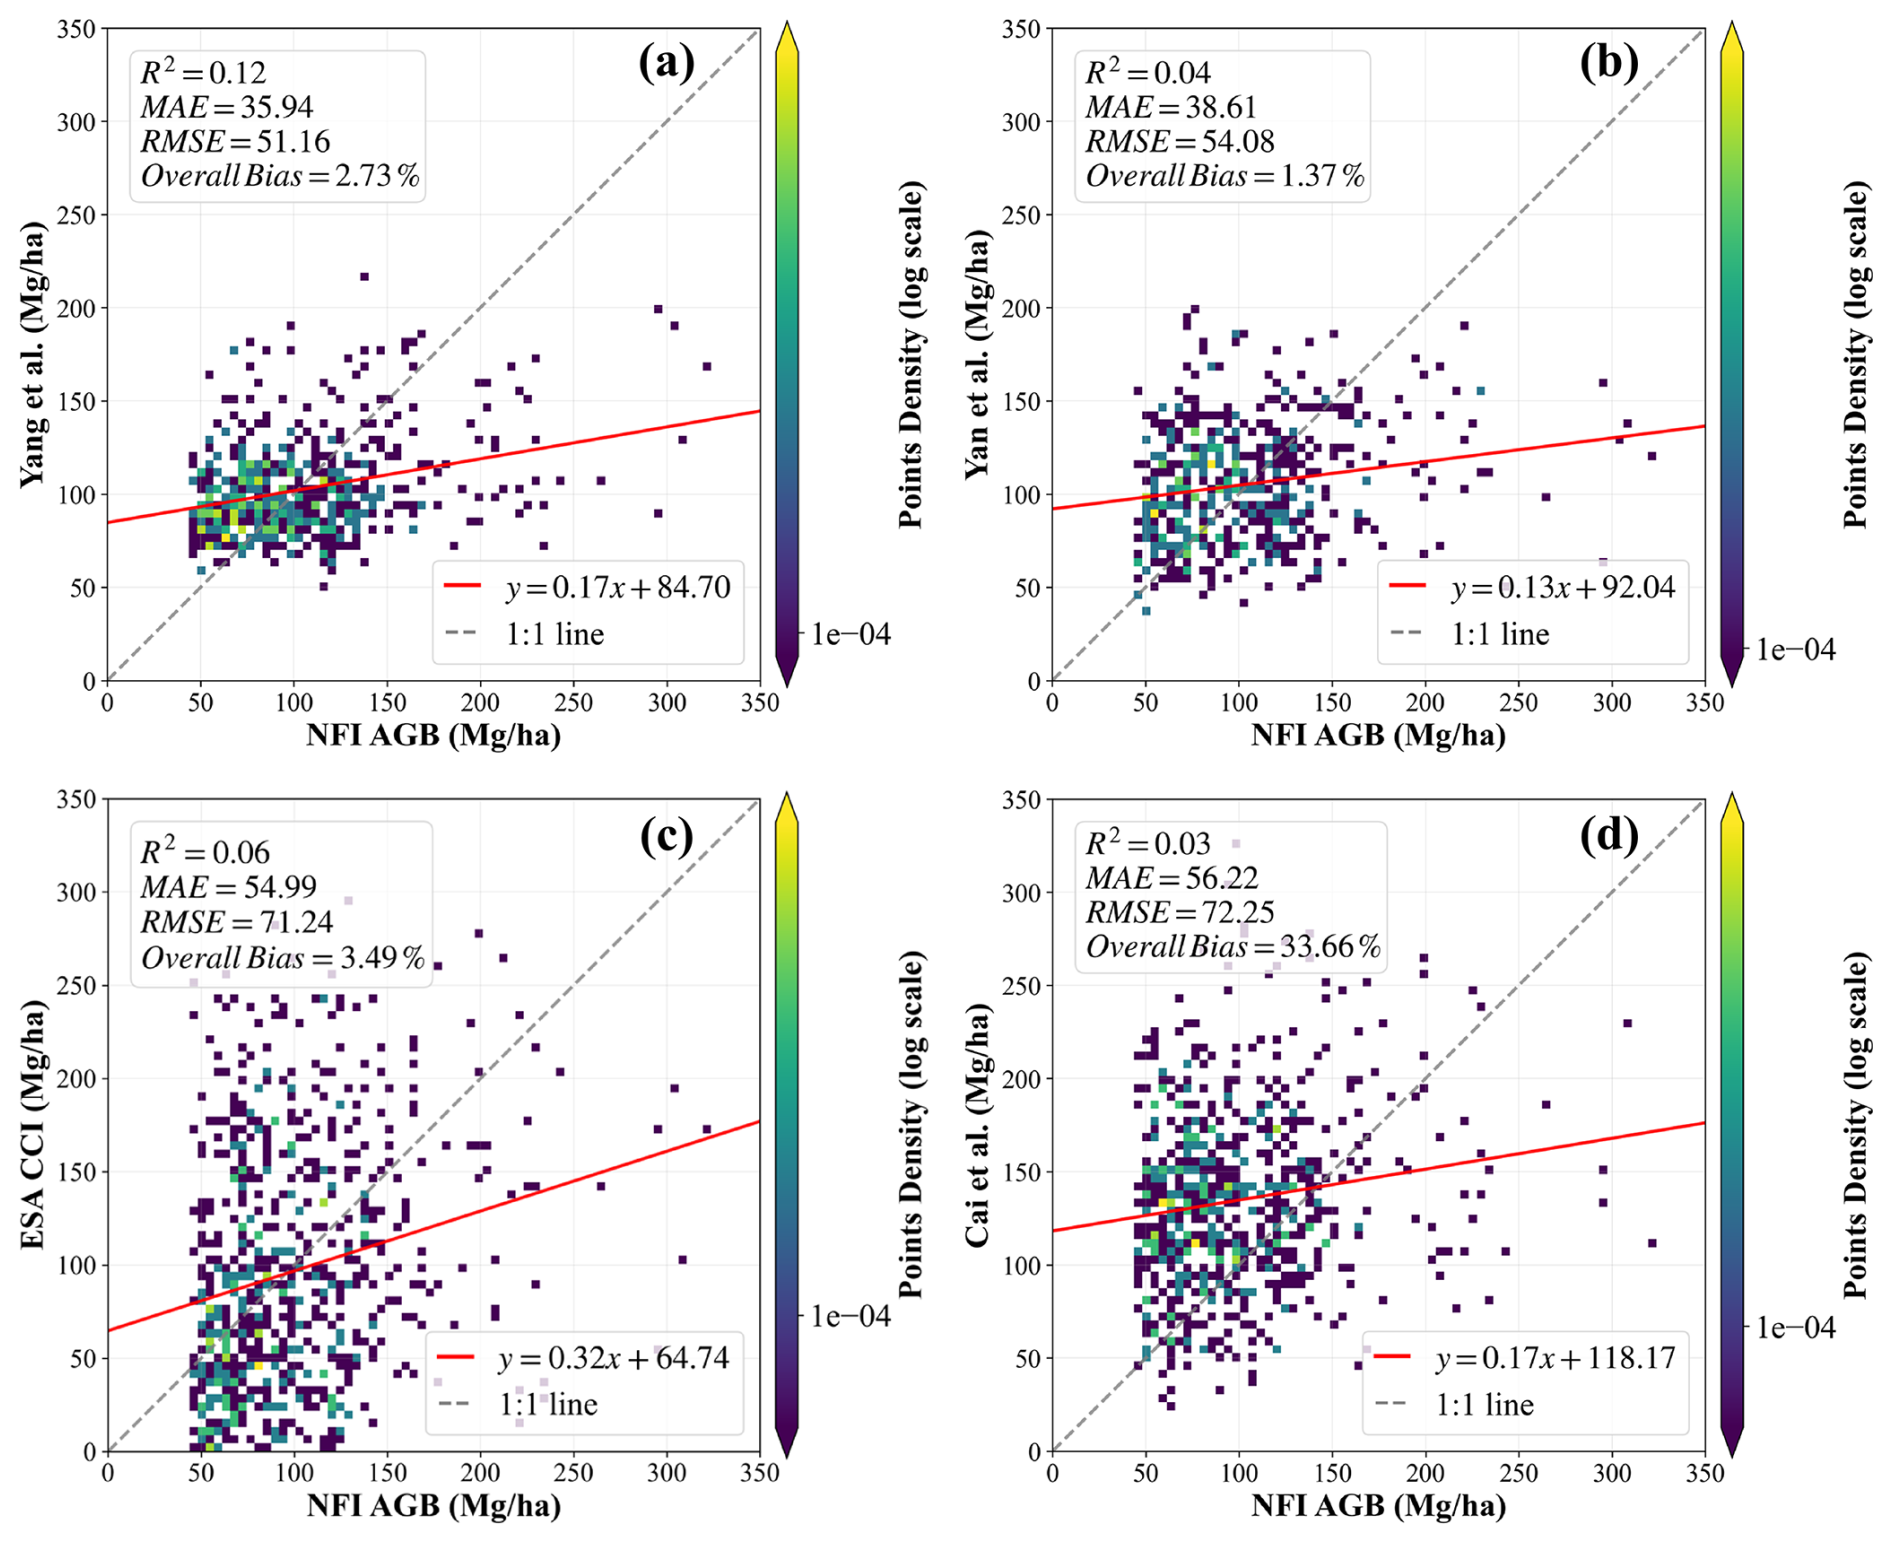
Figure 5Comparison of the existing datasets with NFI data. (a) Yang et al. (2023), (b) Yan et al. (2023a), (c) ESA CCI and (d) Cai et al. (2024b).
To isolate the influence of product year from changes in data availability, the temporal-sensitivity analysis evaluated annual and 2015–2018 median estimates using a fixed product-specific set of NFI plots (Fig. S6). Using the 2015–2018 per-plot median estimates reduced RMSE from 50.95 to 45.90 Mg ha−1 for Yan Map, from 71.09 to 64.54 Mg ha−1 for ESA CCI, and from 73.68 to 66.66 Mg ha−1 for Cai Map; the corresponding MAE reductions were 3.99, 5.77, and 5.52 Mg ha−1, respectively. Temporal mismatch therefore affected the absolute evaluation metrics but did not eliminate the broad differences among the products.
4.1.3 Topographic effects on model accuracy
The residual distributions in some higher-slope classes were slightly wider than those at low slopes, but neither their centers nor their spreads increased consistently with slope (Fig. 6a). Continuous slope was only weakly related to absolute residuals (Pearson r=0.046; Spearman ρ=0.074), indicating a limited slope-related effect on prediction errors. Residual distributions across the eight aspect classes were also generally centered near zero (Fig. 6b). Mean residuals ranged from −5.27 to 1.30 Mg ha−1 and median residuals from −3.57 to 5.36 Mg ha−1. Although residual dispersion varied somewhat among aspect classes, no consistent directional pattern of overestimation or underestimation was observed.
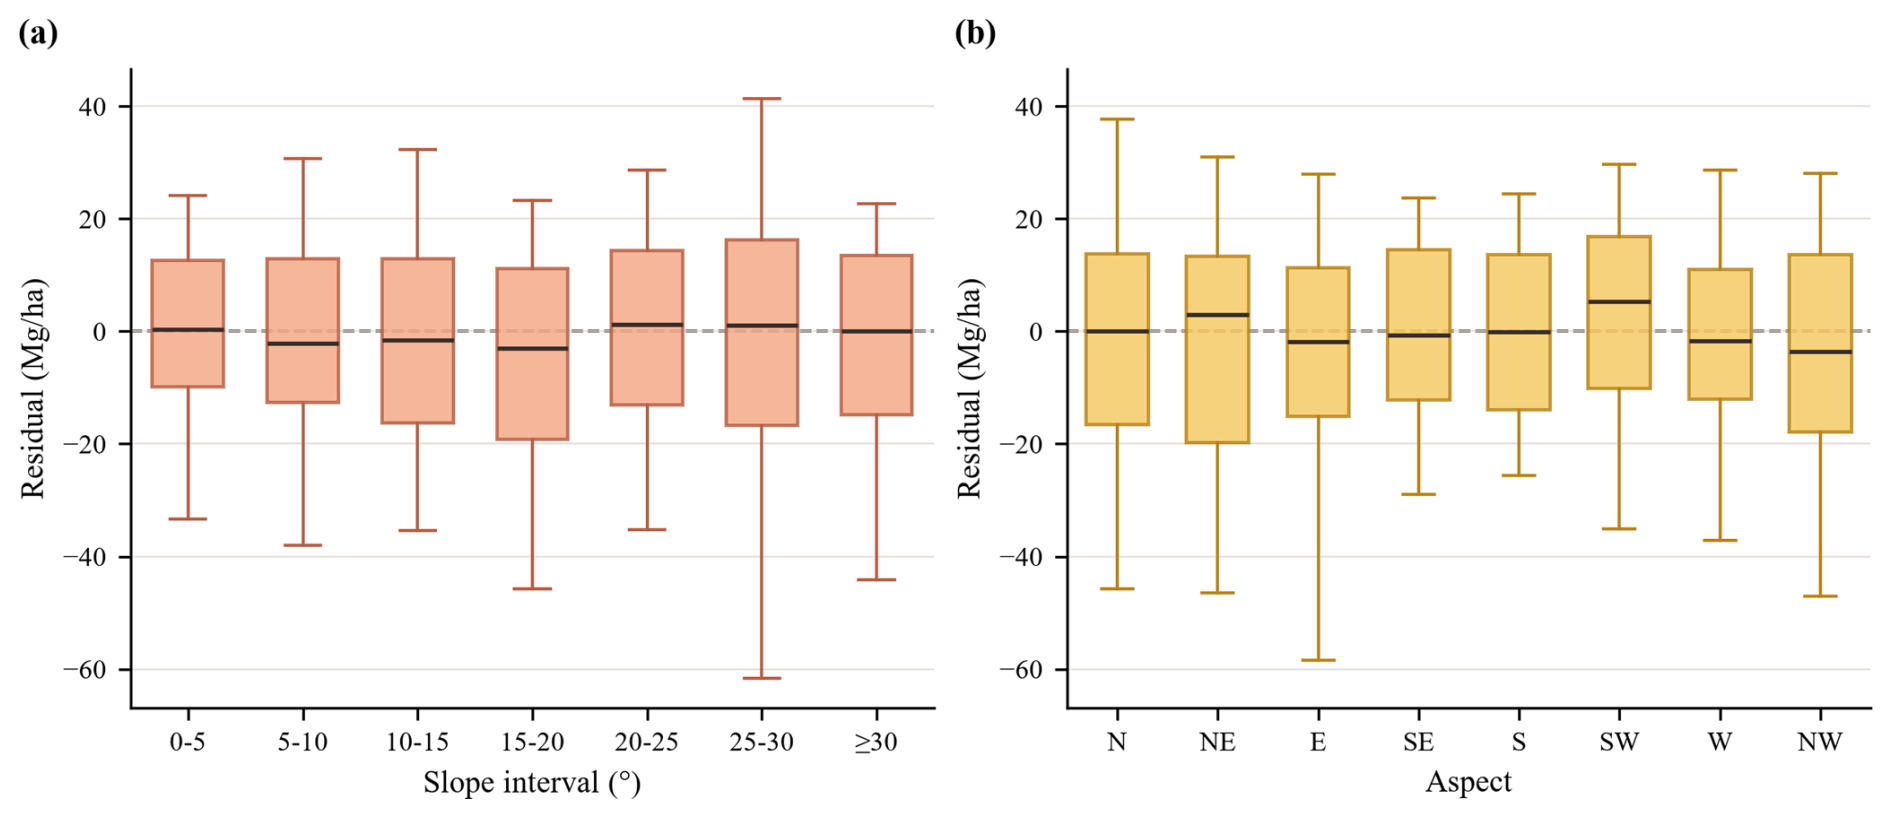
Figure 6Terrain-stratified residual analysis of CSMF-Net AGB estimates using the independent NFI test set. (a) Residual distributions across slope classes. (b) Residual distributions across aspect classes.
4.2 Evaluation with independent UAV LiDAR CHM data
The structural-consistency assessment in Fig. 7 uses the forest subset of the independent UAV LiDAR validation data (n=3591) and is intended to evaluate whether mapped AGB follows expected canopy-height variation rather than to represent the regional AGB frequency distribution.
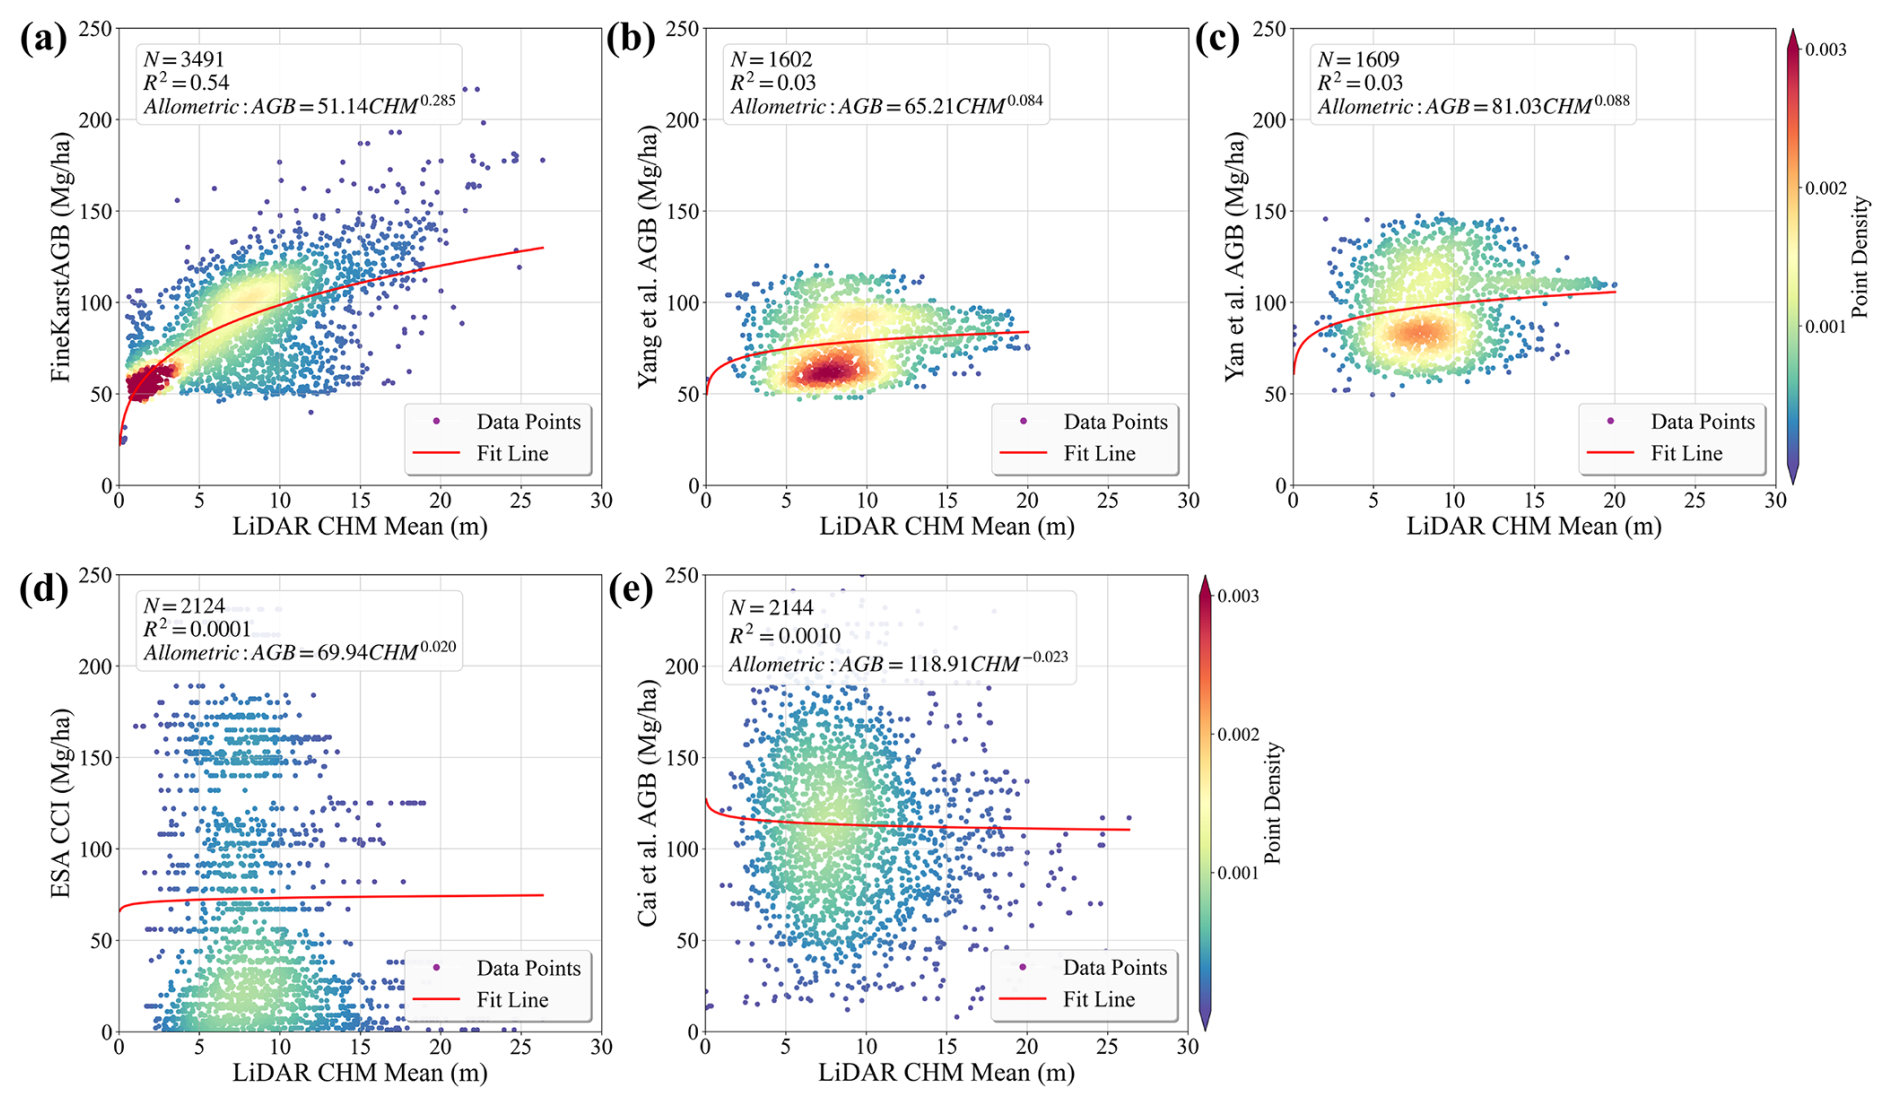
Figure 7Structural-consistency assessment of the AGB datasets against mean UAV LiDAR-derived canopy height using forest validation samples. Results are shown for (a) FineKarstAGB, (b) Yang et al. (2023), (c) Yan et al. (2023a), (d) ESA CCI, and (e) Cai et al. (2024b). Sample sizes in panels (b)–(e) vary because only locations with valid values in the corresponding products were included.
The relationships between UAV LiDAR-derived canopy height model (CHM) metrics and the AGB estimates produced in this study (Fig. 7 for mean CHM, Fig. S7 for maximum CHM, and Fig. S8 for the 95th percentile CHM; fitted using the allometric relationship AGB =aHb) provide further evidence for the reliability of the proposed AGB dataset (FineKarstAGB). As shown in Fig. 7a, our AGB dataset exhibits strong structural consistency with CHM data at the plot level (R2=0.54). Predicted AGB increases monotonically across the full canopy height spectrum, without an evident saturation effect at higher canopy height (> 20 m), indicating that our dataset effectively captures the physical relationship between forest canopy height and AGB in this complex terrain region.
In comparison, the relationships between LiDAR CHM and existing AGB datasets are generally weaker and less distinct. The AGB datasets of Yang et al. (2023) and Yan et al. (2023a) show very limited explanatory power, with R2 values of 0.03 and low scaling exponents (b=0.084 and 0.088), accompanied by broader dispersion and flatter fitted curves, suggesting reduced sensitivity of the estimated AGB to variations in canopy height. The ESA CCI AGB product exhibits the lowest correlation with LiDAR CHM (R2=0.0001), which may partly be attributed to its coarser spatial resolution (100 m), potentially diluting height–AGB relationships at the plot scale. The Cai et al. (2024b) dataset shows a weak negative correlation with LiDAR CHM (R2=0.001) and substantial dispersion across the CHM range, indicating that taller stands are not systematically associated with higher predicted AGB.
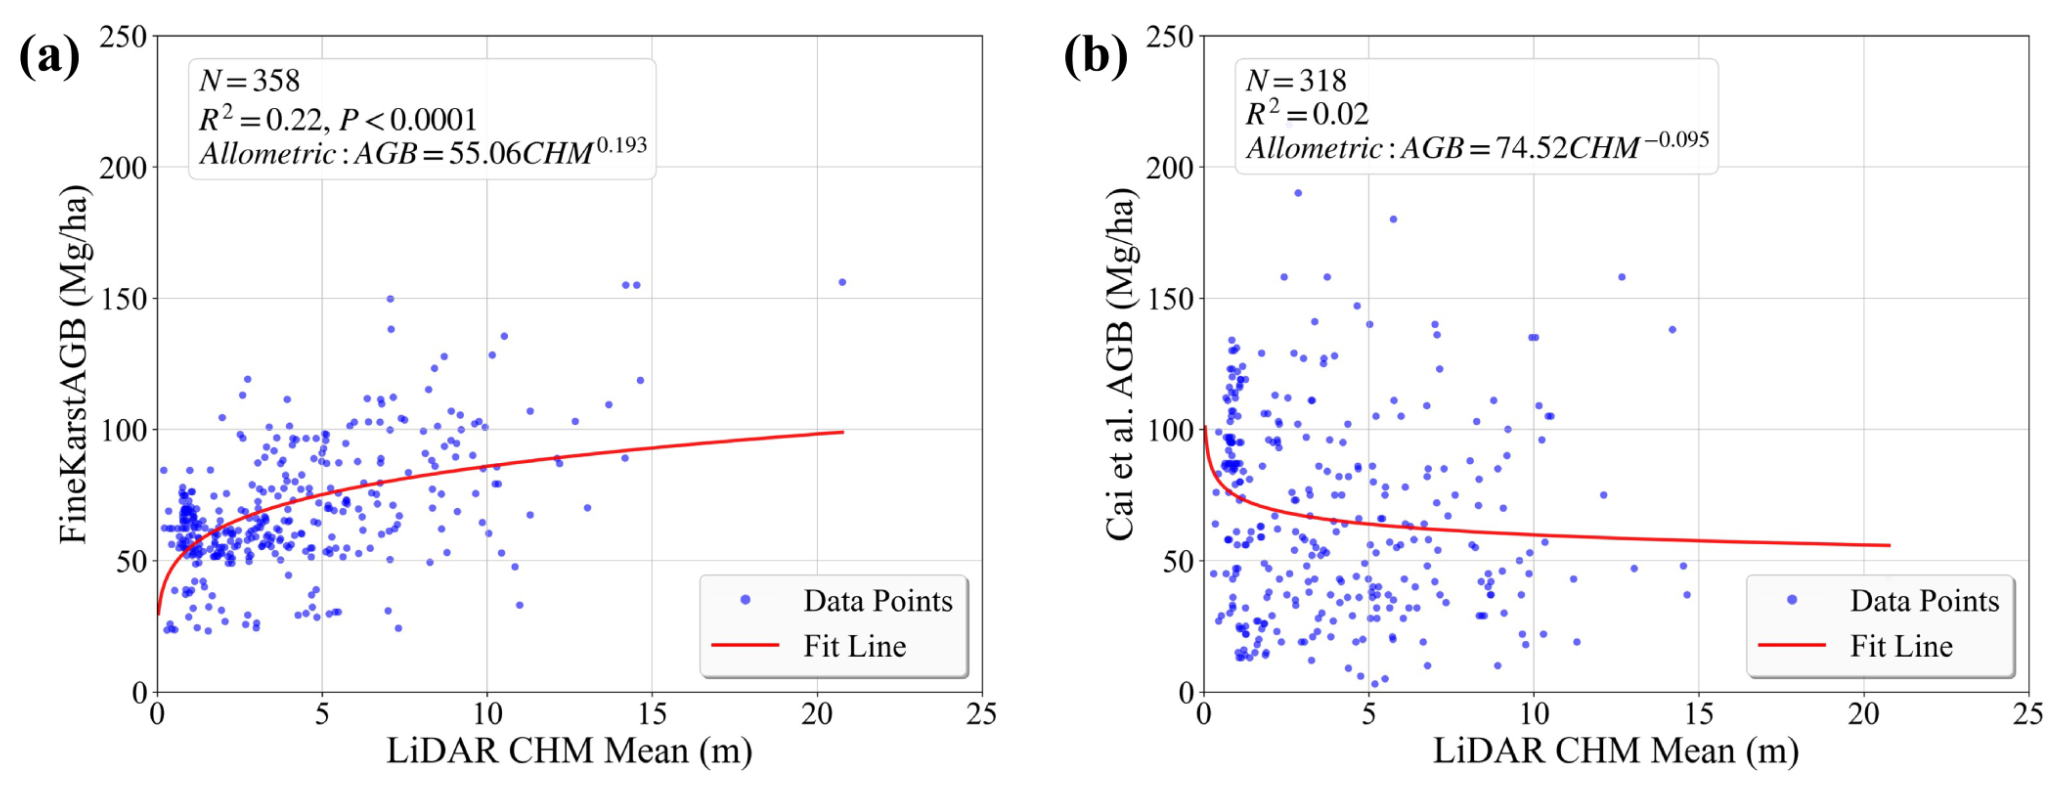
Figure 8Evaluation of our dataset against LiDAR CHM data in non-forest areas. (a) results of FineKarstAGB (Ours), (b) results from Cai et al. (2024b).
We further evaluated our dataset for areas outside contiguous forests (n=391). Considering that most existing AGB products apply strict forest masks during their mapping procedures, while the dataset of Cai et al. (2024b) defines valid AGB values only for areas with tree cover exceeding 20 %, this comparison was limited to the Cai et al. (2024b) dataset. As illustrated in Fig. 8, the FineKarstAGB dataset maintains a significant positive relationship with LiDAR CHM in areas outside forests (R2=0.22, P<0.0001). Although scatter is greater than that observed in forests, AGB generally increases with canopy height. Given the higher spatial heterogeneity and structural complexity of trees outside forests, the results indicate that FineKarstAGB remains sensitive to variations in tree vertical structure in non-forest environments, supporting its applicability beyond contiguous forest regions. In contrast, the Cai et al. (2024b) dataset exhibits only a weak negative relationship with LiDAR CHM in non-forest scenes (R2=0.02), with highly scattered points and no clear trend in AGB with increasing canopy height.
4.3 Spatial pattern of AGB in Southwest China and typical scenarios
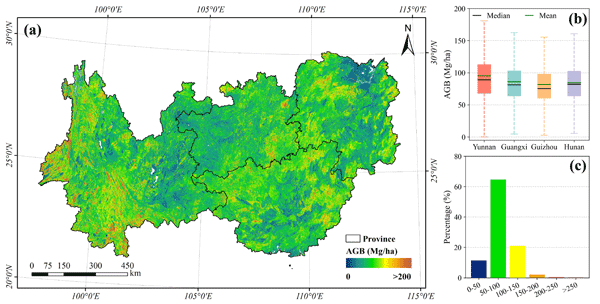
The high-spatial-resolution AGB map of Southwest China (Fig. 9a) reveals a distinct pattern of spatial heterogeneity. In general, high AGB density is predominantly concentrated in western and southern Yunnan, southeastern Guizhou, northern Guangxi, and western Hunan. Visual inspection using GaoFen imagery indicates that these high-value clusters correspond to mountainous regions characterized by rugged terrain, mature natural forests, and high canopy closure. Conversely, low AGB values exhibit a fragmented distribution, appearing sporadically in agro-forestry ecotones, peri-urban zones, and recent logging sites, reflecting areas with intense anthropogenic disturbance. At the provincial scale, spatial patterns vary significantly: mountainous regions in Yunnan and Hunan display continuous high-AGB clusters, whereas Guangxi and Guizhou are characterized by moderate AGB values with scattered high-value patches.
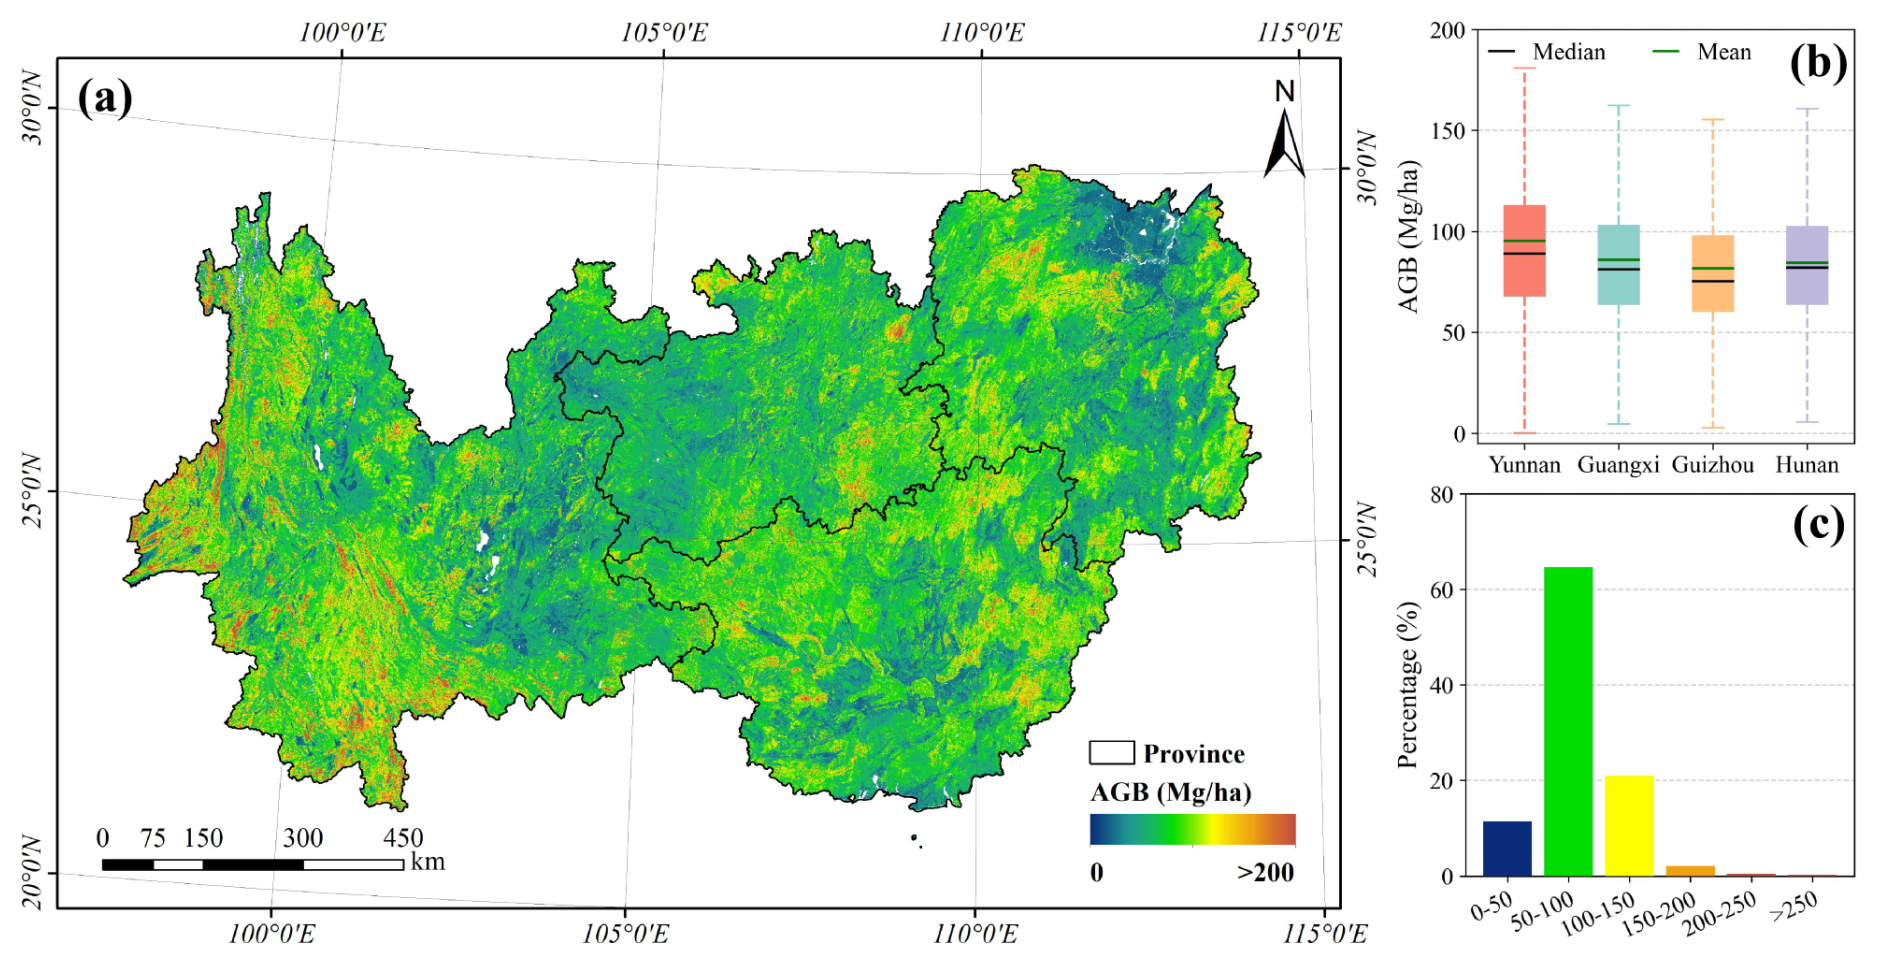
Figure 9Spatial pattern and statistical characteristics of FineKarstAGB for 2024. (a) Spatial distribution of AGB, (b) boxplots of provincial AGB values for the four provinces, and (c) pixel-based frequency distribution of AGB across the study area.
Provincial statistics further quantify the spatial discrepancies (Fig. 9b). The four-province mean AGB is 88.22 Mg ha−1, with Yunnan exhibiting the highest average (95.32 Mg ha−1) and Guizhou the lowest (81.59 Mg ha−1). Notably, our estimate for Yunnan is highly consistent with the reference value of 95.92 Mg ha−1, derived from the forest stock volume and area data of the Yunnan Provincial Results of the National Forest, Grassland, Wetland and Desertification Survey (2025) using the conversion method by Guo et al. (2013). The broad ranges observed in the boxplots indicate substantial intra-provincial variability, particularly in Yunnan and Hunan. This variability reflects the complex spatial heterogeneity driven by the karst topography and diverse forest types inherent to the region.
Pixel-level frequency statistics (Fig. 9c) show that the AGB in the study area is primarily concentrated in the 50–100 Mg ha−1 range, accounting for 64.6 % of the total area. This dominance suggests a prevalence of young to middle-aged forests, likely attributable to active forest management and long-term ecological restoration projects (Tong et al., 2020). The 100–150 Mg ha−1 interval follows, comprising a substantial proportion (20.1 %) of moderate-to-high biomass forests. Areas with AGB < 50 Mg ha−1 constitute a smaller fraction, primarily corresponding to sparse woodlands and trees outside forests. Although regions exceeding 150 Mg ha−1 (and those > 250 Mg ha−1) cover a limited area, they contribute disproportionately to the regional carbon stock.
The pixel-level predictive uncertainty of FineKarstAGB is presented in Fig. 10. Across the study area, the mean and median uncertainties were 9.27 and 8.18 Mg ha−1, respectively, with values ranging from 0 to 79.49 Mg ha−1. More than 90 % of pixels were concentrated between 5 and 15 Mg ha−1. Spatially, relatively high uncertainties occurred as localized patches and were more frequent in Yunnan, whereas low-to-moderate uncertainties dominated most of the study area. At the provincial scale, Yunnan had the highest mean and median uncertainties (9.87 and 8.54 Mg ha−1), Guizhou had the lowest (8.53 and 7.50 Mg ha−1), and Guangxi and Hunan showed intermediate values.
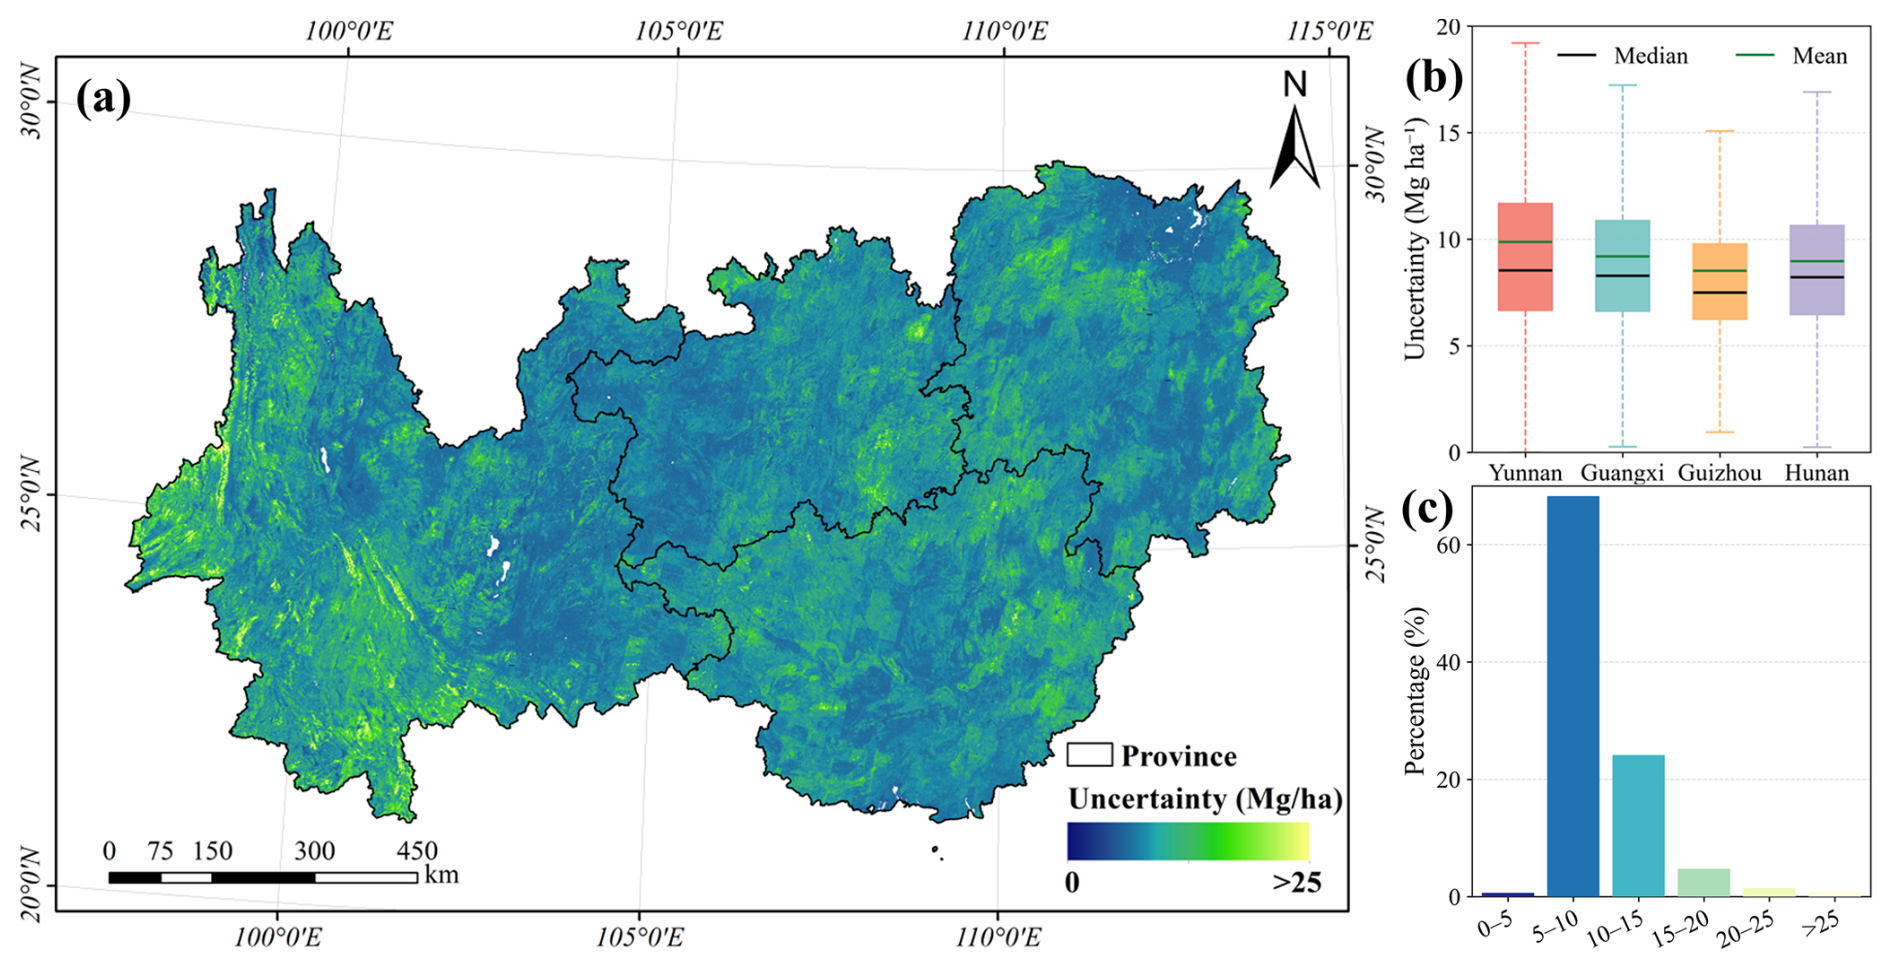
Figure 10Spatial distribution and statistical characteristics of the predictive uncertainty of FineKarstAGB. (a) Spatial distribution of AGB uncertainty, (b) provincial uncertainty statistics, and (c) frequency distribution of uncertainty.
To qualitatively evaluate the capability of FineKarstAGB to delineate spatial heterogeneity, we selected five representative landscapes and compared FineKarstAGB with existing AGB datasets using GaoFen imagery, tree cover, and canopy height as references (Fig. 11). In the dense natural forests of Xishuangbanna, Yunnan (Row 1), FineKarstAGB shows AGB variations corresponding to topographic variation and apparent differences in vegetation structure, while delineating local high- and low-AGB areas in greater detail than the coarser-resolution products. In the plantation landscape of Nanning, Guangxi (Row 2), FineKarstAGB shows distinct AGB values among adjacent afforested plots, potentially reflecting differences in stand development and management.
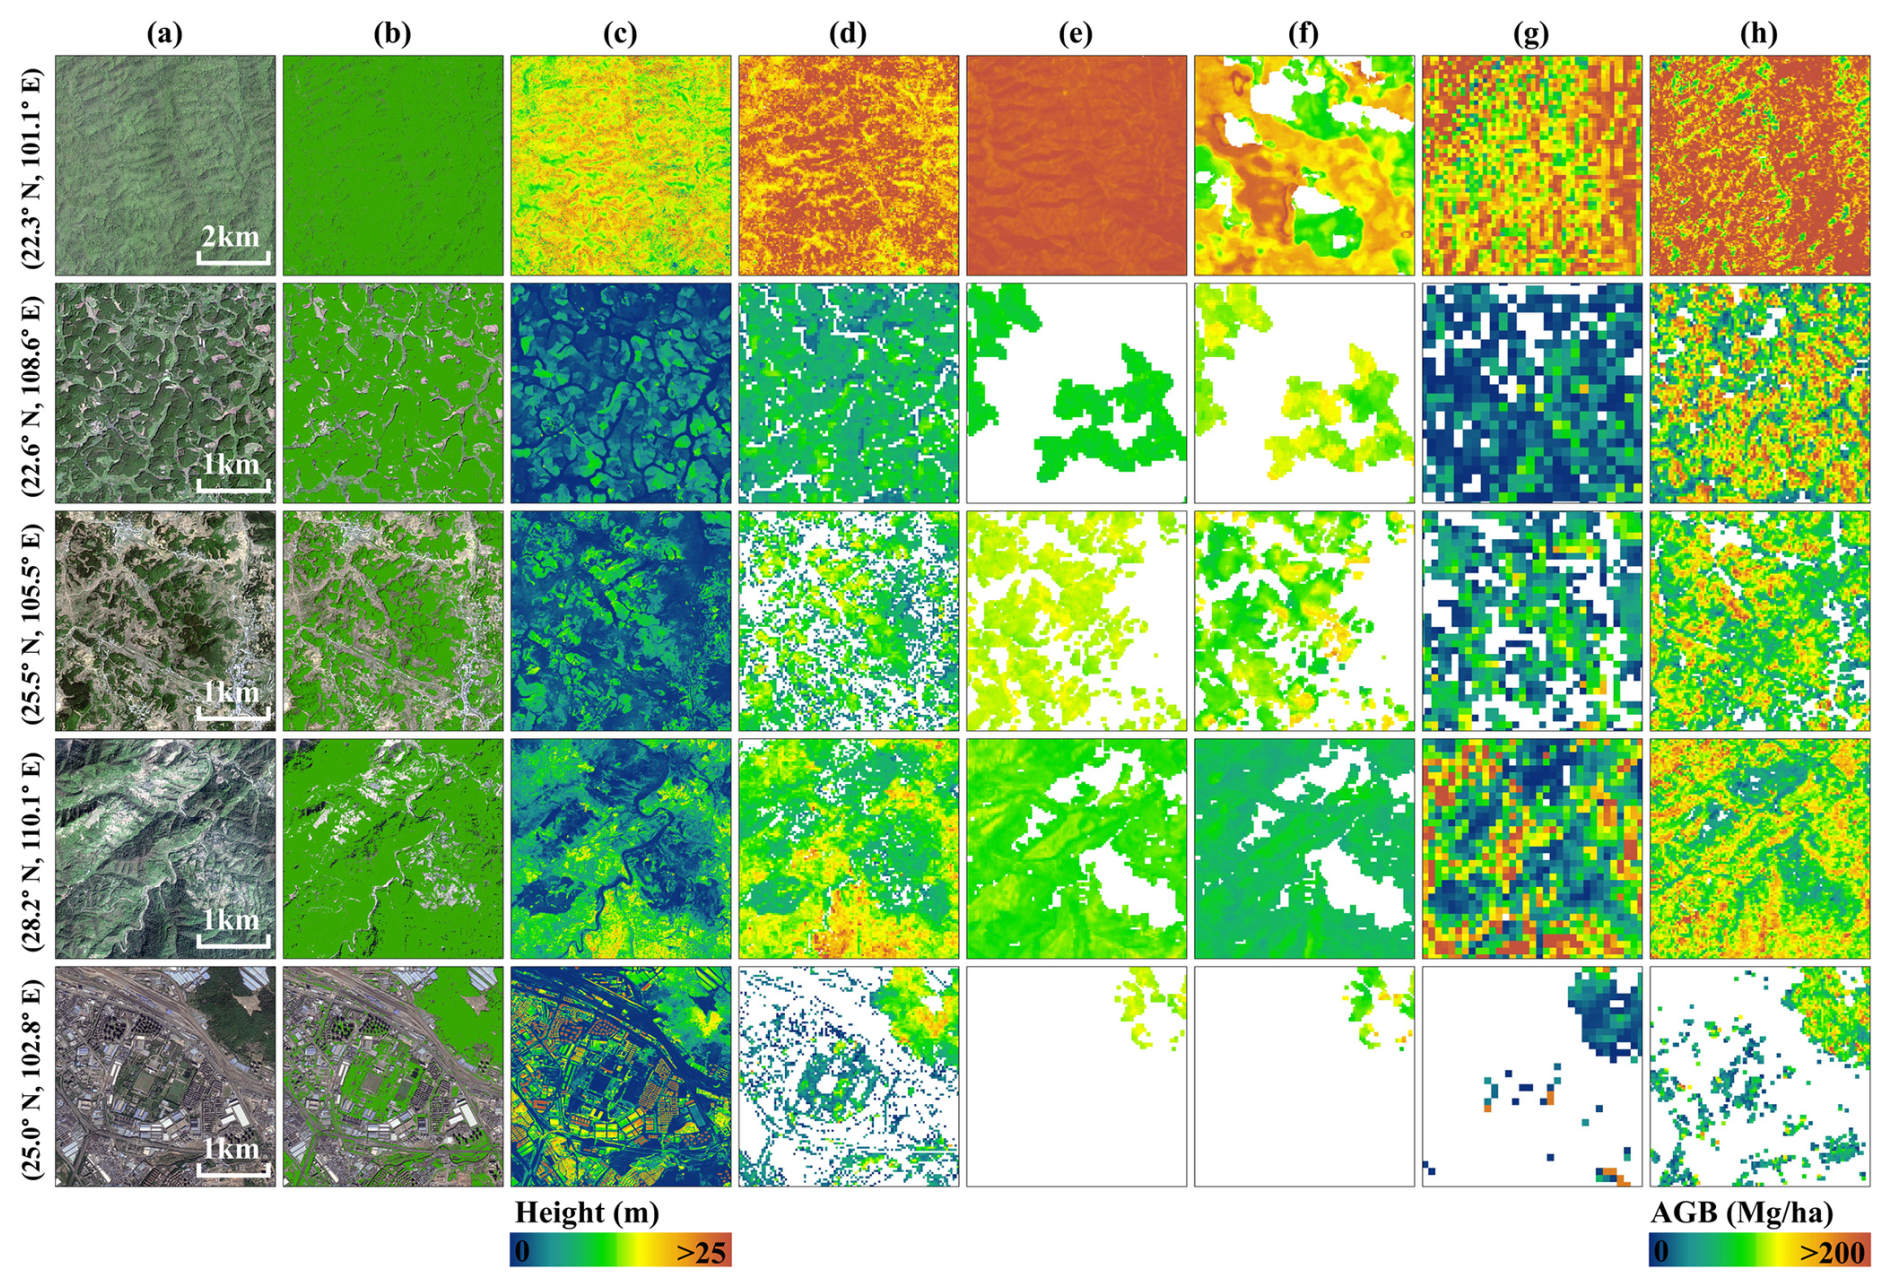
Figure 11Comparison of different AGB datasets across typical landscapes. (a) GaoFen imagery, (b) Tree Cover, (c) Canopy Height, (d) FineKarstAGB (Ours), (e) AGB from Yang et al. (2023), (f) AGB from Yan et al. (2023a), (g) AGB from ESA CCI and (h) AGB from Cai et al. (2024b).
In highly heterogeneous landscapes, FineKarstAGB represents patchy, linear, and scattered trees within the agricultural matrix of Qianxinan, Guizhou (Row 3). In the forest–shrubland mosaic of Xiangxi, Hunan (Row 4), the dataset shows local AGB differences associated with variations in vegetation height and density. In Kunming, Yunnan (Row 5), FineKarstAGB assigns biomass values to scattered urban trees, including trees along streets and in parks, despite their distribution among non-vegetated features such as buildings and roads. Together, these examples illustrate the spatial representation of FineKarstAGB across natural forests, plantations, agroforestry systems, forest–shrubland mosaics, and urban environments.
5.1 Comparison with other AGB datasets
To systematically characterize the differences among the AGB products and identify their potential causes, comparisons were conducted at both the overall statistical and spatial-pattern levels. At the overall statistical level, pixel-wise comparisons indicate that our estimates are closer to those of Yang et al. (2023) and Yan et al. (2023a), with mean differences of −14.66 and −15.36 Mg ha−1, respectively (Fig. 12). In contrast, although the comparison with ESA CCI yields the smallest mean difference (μ=8.09 Mg ha−1), the substantially larger dispersion of differences (σ=54.52 Mg ha−1) indicates pronounced inconsistencies at local scales. Comparisons with the dataset of Cai et al. (2024b) reveal a much larger overall bias, with a mean difference of −40.98 Mg ha−1. It is important to note that these discrepancies do not manifest as spatially homogeneous or systematic biases across the study region, but instead exhibit pronounced spatial heterogeneity.
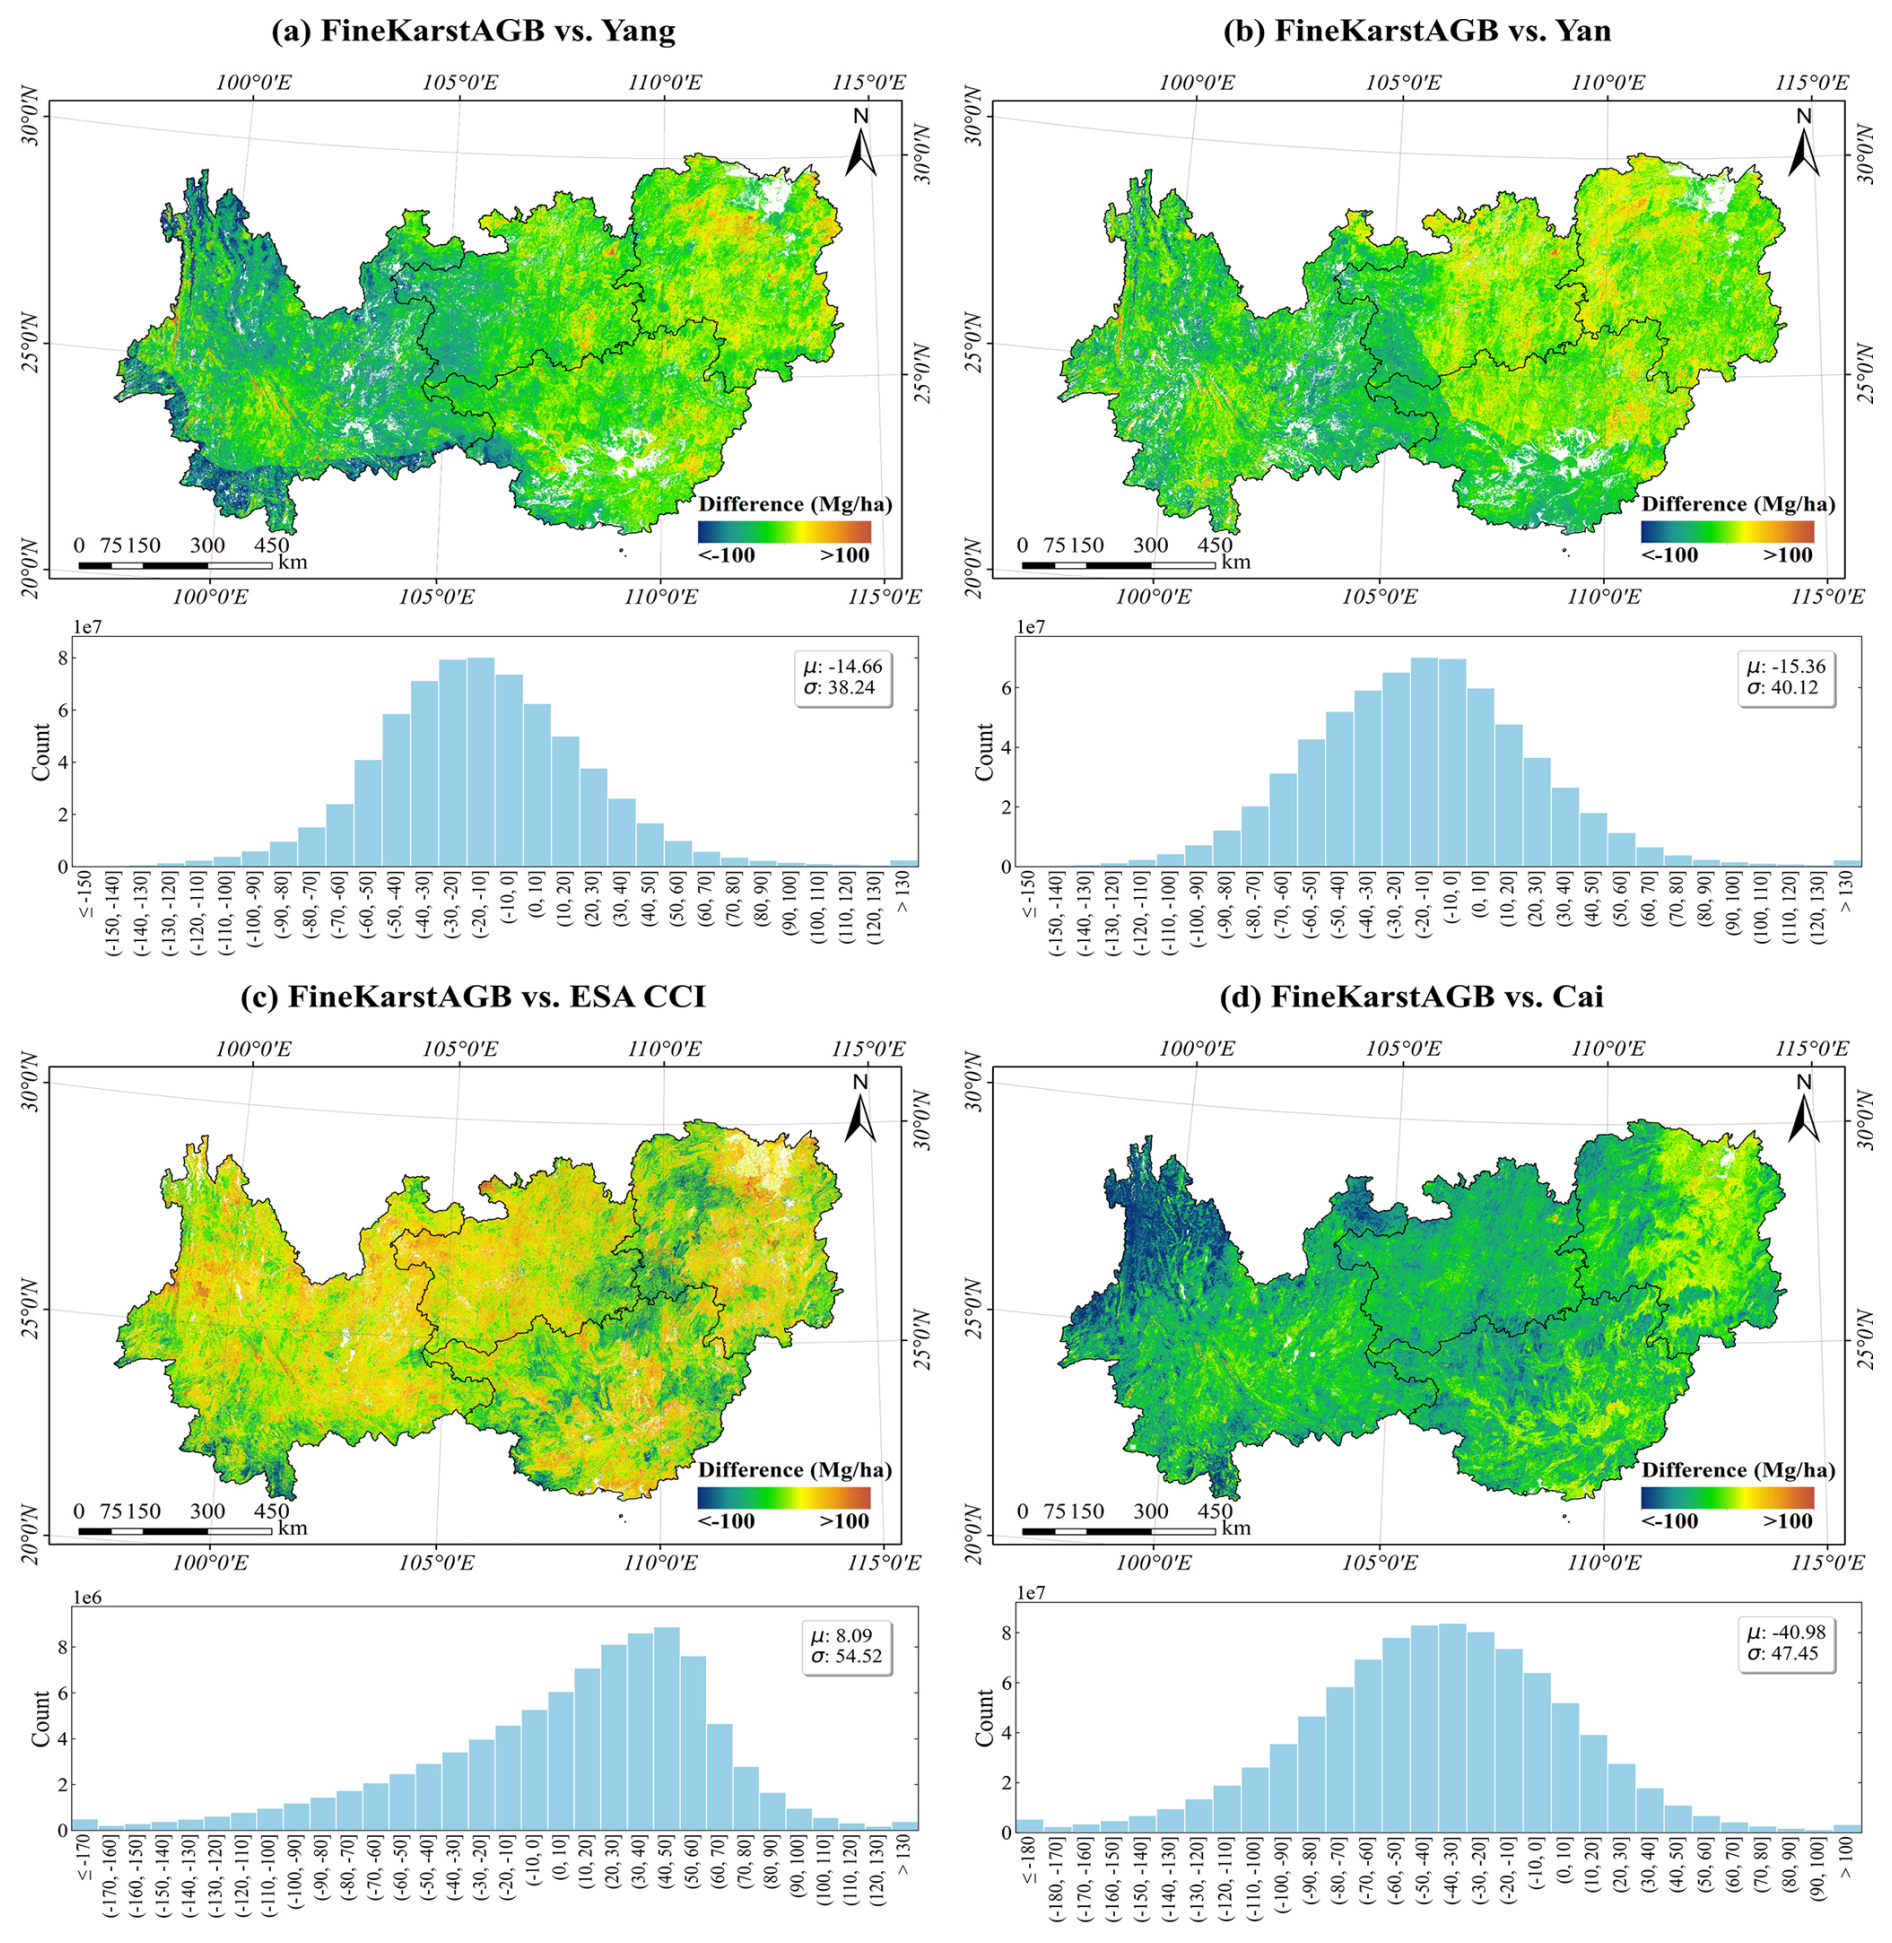
Figure 12Spatial distribution and statistics of AGB differences between FineKarstAGB and the comparison datasets: (a) Yang et al. (2023), (b) Yan et al. (2023a), (c) ESA CCI, and (d) Cai et al. (2024b). Pairwise differences were calculated after spatial alignment using only pixels with valid estimates in both products. FineKarstAGB was aggregated to the native 100 m grid for comparison with ESA CCI. μ and σ denote the mean and standard deviation of the AGB differences, respectively.
The spatial patterns of the differences further highlight the influence of modeling strategies on the representation of AGB spatial structure. In the comparison with Yang et al. (2023) (Fig. 12a), the differences display a clear regional boundary, particularly evident in southwestern Yunnan, where FineKarstAGB tends to be lower than the estimates of Yang et al. (2023) to the west of the boundary and higher east of the boundary. This abrupt spatial transition is closely associated with the vegetation-zone-based modeling strategy adopted by Yang et al. (2023). A similar boundary pattern is also observed in the comparison with Yan et al. (2023a) (Fig. 12b), notably in western Guizhou and northern Guangxi. These results suggest that while geographically or vegetation-stratified modeling approaches can improve internal coherence within individual zones, they may introduce discontinuities at zone boundaries. Such boundary effects are especially pronounced in the study area, where complex topography, steep ecological gradients, and highly heterogeneous vegetation amplify inconsistencies.
In addition to the effects of vegetation zonation, differences in structural inputs may also contribute to the patterns observed for the datasets of Yang et al. (2023) and Yan et al. (2023a). Both products incorporated the national forest canopy height product of Liu et al. (2022b), which was derived through interpolation of GEDI and ICESat-2 observations. Under complex terrain and canopy conditions, limitations in these observations may reduce the local representativeness of the resulting canopy-height information (Fu et al., 2025). The combined effects of zonation-based modeling and uncertainty in structural inputs therefore provide plausible explanations for the regional boundaries and local discrepancies described above.
The comparison between FineKarstAGB and ESA CCI shows pronounced differences (Fig. 12c). These differences may partly arise from the global modeling framework and coarser spatial resolution of ESA CCI. In mountainous and fragmented forest landscapes, spatial aggregation effects tend to smooth fine-scale AGB variability, limiting the ability of such products to capture ecologically meaningful AGB heterogeneity. Although no clear zonal boundaries are evident in the comparison with the dataset of Cai et al. (2024b) (Fig. 12d), the overall magnitude of the bias is substantially large, with very high values in western and southern Yunnan. For the dataset of Cai et al. (2024b), the large differences may partly reflect uncertainties in the GEDI reference data under complex terrain and the lack of fine-grained canopy-height input in its spatial prediction. GEDI measurements are susceptible to slope effects and footprint geolocation uncertainties under complex terrain, which can increase the uncertainty of AGB reference values (Tang et al., 2023). Its spatial prediction instead relied more strongly on remote-sensing texture, spectral, and tree-cover information. This difference in input information may contribute to the observed discrepancies, although it is worth noting that tree-cover information used in such approaches retains distinct advantages for long-term, large-scale monitoring of forest densification and degradation.
Beyond these product-specific factors, discrepancies between FineKarstAGB and the comparison datasets may also arise from differences in acquisition year, spatial resolution, input data, and modeling strategy. FineKarstAGB represents 2024 conditions, whereas Yang Map, Yan Map, ESA CCI, and Cai Map correspond to 2019, 2021, 2022, and 2023, respectively. The comparison products therefore do not represent exactly the same forest conditions, including changes caused by growth, harvesting, or recovery. This temporal difference is particularly important in regions where human disturbance can drive rapid changes in forest landscapes. FineKarstAGB derives its 30 m estimates from 0.8 m imagery and structural layers, whereas the comparison products use different combinations of medium- or coarse-resolution imagery, spaceborne lidar observations, and interpolated structural variables. These differences in input scale and information content can lead to contrasting representations of heterogeneous landscapes. Fine-resolution inputs are particularly relevant for representing fragmented scenes such as agroforestry systems, forest–shrub mosaics, urban green spaces, and scattered trees within 30 m pixels.
The temporal difference between the NFI observations and the evaluated products represents a source of uncertainty in the plot-level comparison. The additional sensitivity analysis showed that using product estimates corresponding more closely to the NFI observation period improved their agreement with the NFI observations, but did not eliminate the differences among the products.
To further examine the regional discrepancies at the local scale, Fig. S10 presents detailed comparisons for Pu'er and Tongren, where pronounced differences among the AGB datasets were observed. The products of Yang et al. (2023) and Yan et al. (2023a) show broader zonal patterns, with generally higher AGB estimates in the tropical monsoon forest–rainforest zone of Pu'er and predominantly moderate-to-high values in the subtropical evergreen broadleaf forest zone of Tongren, suggesting a stronger influence of geographic and vegetation zonation. The visible no-data gaps in Yan et al. (2023a) further suggest that forest masks that are temporally mismatched with the AGB reference year or contain classification errors may exclude areas that currently contain tree biomass. The discrepancies in Cai et al. (2024b) occur mainly in complex terrain and dense forests, consistent with the product-specific differences in reference data and input variables discussed above. Together, these local examples support the causes inferred from the regional difference patterns.
5.2 Significance of fine-scale vertical structure in characterizing AGB heterogeneity
Forest vertical structure, particularly canopy height, provides important information for accurately estimating AGB. Ecologically, this relationship is governed by allometric scaling, whereby tree height serves as a proxy for accumulated biomass. From a remote-sensing perspective, canopy height is also one of the most directly observable structural metrics. Numerous studies have used canopy height as an important structural variable to establish relationships between forest vertical structure and AGB or carbon stocks (Liu et al., 2023; Zhu et al., 2025).
Our study further illustrates the role of fine-scale vertical structural information in characterizing AGB heterogeneity in complex landscapes. The datasets of Yang et al. (2023) and Yan et al. (2023a) used 30 m canopy-height products to represent AGB spatial variation at a broader scale. In Fig. 11 and Fig. S10, the spatial patterns of FineKarstAGB correspond to local variations visible in the GaoFen imagery and high-resolution canopy-height data. These comparisons indicate that higher-resolution canopy-height information provides additional spatial detail for characterizing local AGB heterogeneity. This contribution is further supported by the input-ablation experiments, in which excluding canopy height produced the largest decline in model performance. FineKarstAGB also showed a positive relationship with independent UAV LiDAR-derived mean canopy height (R2=0.54), providing additional evidence of its consistency with forest vertical structure.
AGB is not determined by canopy height alone. Stand age affects biomass accumulation during forest succession (Poorter et al., 2016), while stem diameter and wood density are also important allometric predictors of tree biomass (Chave et al., 2014). These factors may result in different AGB values among stands with similar canopy heights. Canopy height is therefore treated as an important component of forest structure rather than as the sole determinant of AGB, and CSMF-Net combines it with spectral information and horizontal crown structure. Within this multi-feature framework, fine-scale vertical structural information complements spectral and crown features by providing direct information on vegetation stature. This information is particularly important for distinguishing local biomass contrasts associated with differences in canopy height within dense forests, fragmented agroforestry systems, forest–shrub mosaics, and scattered tree cover. Thus, fine-scale canopy-height information contributes to AGB estimation and helps characterize biomass heterogeneity across structurally complex landscapes.
5.3 Limitations and future improvements
5.3.1 Input-data and plot-matching uncertainties
The National Forest Inventory (NFI) plot data serve as an indispensable source of ground truth for remote sensing–based AGB estimation, yet their application often encounters two major challenges. First, the spatial extent of traditional NFI plots is typically comparable to the pixel size of commonly used medium-resolution remote sensing datasets (e.g., Landsat), which can easily result in incomplete or partial spatial overlap between plots and imagery (Fu et al., 2024; Ma et al., 2024). This spatial mismatch introduces substantial bias and uncertainty, particularly in regions with complex terrain and highly fragmented landscapes. In this study, by leveraging sub-meter GaoFen imagery, we effectively mitigated this spatial mismatch between field plots and remote sensing data, thereby reducing AGB estimation uncertainty. However, a considerable temporal gap between the NFI data collection and the remote sensing observation period remains a systemic challenge (Qin et al., 2025). Despite the implementation of rigorous quality control and filtering procedures, forest ecosystems are inherently dynamic, leading to model uncertainty arising from real AGB changes caused by growth, harvesting, or natural disturbances.
Alongside uncertainties related to plot-data matching, tree-crown segmentation remains subject to uncertainty in dense forests. Although connected crowns are separated through crown-center detection and weighted-distance reassignment (Xu et al., 2026), adjacent crowns may still be merged when their centers or visible boundaries cannot be reliably distinguished. The influence of these errors on AGB estimation may be partly reduced because the NFI plots represent diverse canopy conditions and CSMF-Net integrates crown segmentation with spectral and textural information from GaoFen imagery and vertical structural information from canopy height. Nevertheless, these complementary inputs cannot eliminate the underlying crown-segmentation uncertainty. Future work will investigate more advanced crown-deblending methods and three-dimensional canopy information.
To examine the historical stability of the retained plots using information independent of the CSMF-Net inputs, we additionally evaluated the 2235 retained plots that could be matched between NFI8 and NFI9. The annualized logarithmic AGB change between repeated observations was standardized within forest-origin and age groups using robust z-scores. A plot was classified as stable when its AGB change remained within the robust range of its forest group (), no Hansen forest loss was recorded during 2014–2024 (Hansen et al., 2013), no persistent decline was jointly detected by at least two of Landsat NDVI, NBR, and NDMI (Cohen et al., 2018), and sufficient temporal observations were available. Plots with extreme AGB changes () or independent evidence of disturbance were classified as anomalous, while the remaining plots were treated as uncertain. In total, 1852 matched plots (82.9 %) showed stable temporal trajectories. This result indicates that the retained dataset was predominantly composed of plots with consistent historical forest conditions. Nevertheless, it does not demonstrate that every retained plot remained unchanged until the acquisition of the GaoFen imagery, and the screening should be interpreted as consistency-oriented quality control rather than a direct temporal correction of the historical NFI AGB values.
To further quantify the remaining temporal uncertainty, an independent nonlinear growth-slowdown analysis based on repeated NFI8–NFI9 observations estimated median potential AGB increases of 13.45–20.23 Mg ha−1 over assumed intervals of 6–10 years (Fig. S9). These scenario-based estimates were not used to update the NFI labels or FineKarstAGB map, but indicate the possible magnitude of the remaining temporal uncertainty.
In the future, where feasible, temporally synchronized or annually updated NFI datasets should be employed to minimize the influence of this temporal discrepancy on model development and validation.
5.3.2 Trade-off between VHR data acquisition and coverage
This study employed GaoFen imagery as the primary data source, whose high spatial and radiometric quality was fundamental to achieving accurate AGB estimation. The raw GF imagery was subjected to geometric and radiometric correction, as well as cloud masking and removal. Nevertheless, a few small areas remained affected by residual cloud contamination; their corresponding AGB estimates were excluded from the final dataset to ensure the reliability of the dataset. Furthermore, the acquisition and processing costs of VHR imagery remain substantial. Although this study achieved seamless coverage across the entire Southwest China region, extending such coverage to larger spatial domains (e.g., national scale) or for long-term temporal monitoring remains challenging. This limitation underscores the trade-off between spatial resolution and geographic or temporal coverage. Future research should therefore explore the integration of alternative high-resolution imagery sources, such as wide-swath GaoFen missions (e.g., GF-1, GF-6) or commercial constellations with high revisit frequency (e.g., PlanetScope), for regional AGB estimation (Mugabowindekwe et al., 2023). Expanding both spatial and temporal coverage while maintaining high estimation accuracy will be a key research priority moving forward.
Obtaining spatially and temporally consistent sub-meter imagery over a large region remains challenging. Unlike medium- and coarse-resolution sensors that provide broad-swath and frequently repeated coverage, sub-meter GaoFen imagery requires a large number of individual scenes to achieve wall-to-wall coverage. This difficulty is further increased in the humid and mountainous environment of Southwest China, where frequent clouds, fog, and haze limit the availability of usable observations acquired under comparable conditions. Consequently, the GaoFen mosaic combines scenes acquired on different dates and under varying atmospheric, illumination, viewing-angle, and vegetation conditions. Despite geometric and radiometric corrections, image enhancement, cloud detection, and mosaicking, residual scene- or orbit-related discontinuities remain in some local areas and may propagate into the corresponding AGB estimates. These discontinuities should not be interpreted as abrupt ecological changes, and caution is required when analyzing fine-scale AGB variations across visible image boundaries. Future versions of the dataset will explore multi-temporal radiometric harmonization, improved blending of overlapping observations, and seamline optimization to reduce these artifacts.
5.3.3 Validation of non-forest areas and higher-resolution AGB estimation
This study extended AGB estimation to non-forest landscapes with high spatial heterogeneity, including scattered farmland trees, urban green spaces, and sporadic urban vegetation. By leveraging VHR GaoFen imagery, we achieved fine-scale mapping of AGB in these complex environments. It is important to note that accurate AGB estimation in non-forest scenes relies heavily on VHR data; only such imagery can effectively capture and distinguish these small, heterogeneous vegetation units. However, the validation of AGB estimates in non-forest areas remains a challenge, because NFI plots are mostly found in closed canopy forests. The absence of scale-matched, high-quality ground truth data for validating sub-meter or higher-resolution AGB products remains a critical limitation. Traditional NFI plots, constrained by their coarse spatial scale, cannot adequately represent AGB variation arising from fine-scale structural differences. Future research urgently needs to construct or acquire high-quality, scale-matched validation data specifically for non-forest scenes and VHR AGB products. Future work could involve conducting Terrestrial Laser Scanning (TLS) or Airborne Laser Scanning (ALS) data acquisition, such as LIDARNET, to directly measure AGB across urban trees, agroforestry landscapes, and other structurally complex environments at the sub-meter scale. These TLS and ALS datasets can generate high-density 3D point clouds that enable individual tree-level feature extraction, thereby supporting robust validation of VHR AGB products. Incorporating such high-quality, high-resolution reference data will significantly improve the quantitative accuracy and reliability of AGB estimation in non-forest areas, providing a stronger empirical foundation for urban carbon accounting, agroforestry carbon management, and precision forestry.
The FineKarstAGB dataset presented in this study is publicly accessible through the Science Data Bank repository under https://doi.org/10.57760/sciencedb.33452 (Li et al., 2026).
To accurately estimate aboveground biomass in the highly heterogeneous forests of Southwest China, a globally critical ecoregion, this study developed a Canopy Structure-driven Multi-feature Fusion Network (CSMF-Net). Using plot-level patches allows CSMF-Net to represent fine-scale spectral and structural variation in heterogeneous landscapes. Within this framework, spectral information from sub-meter GaoFen imagery is integrated with horizontal crown structure and vertical canopy-height information through the Multi-feature Cross-Attention (MCA) module. The ablation experiments further showed that all three inputs contributed to model performance, with the omission of canopy height resulting in the largest reduction in performance. The proposed CSMF-Net achieved robust AGB estimation when evaluated against independent NFI plots (R2=0.69, RMSE = 28.51 Mg ha−1). Based on this model, we produced the first fine-grained, high-spatial-resolution AGB dataset for the four provinces of Southwest China for 2024. The dataset captures the spatial distribution of AGB across natural forests, plantations, and agroforestry systems, while also quantifying biomass from trees outside forests, including urban trees and scattered farmland trees that are often overlooked in conventional large-scale AGB products. The AGB estimates in these non-forest areas were also positively related to independent UAV LiDAR-derived canopy height. This inclusion promotes more comprehensive and spatially explicit carbon accounting. Furthermore, the AGB estimates demonstrate strong consistency with three-dimensional forest structure; a comparative evaluation against UAV LiDAR CHM shows a high degree of agreement (R2=0.54). Overall, this research establishes a reliable benchmark dataset for assessing biomass and carbon storage in one of China’s most ecologically important regions. It provides spatially detailed evidence to evaluate the outcomes of major national ecological restoration initiatives, such as the Grain for Green Program and Karst Rocky Desertification Control. Moreover, the dataset offers fine-scale data support for regional carbon cycle modeling, biodiversity conservation, and sustainable forest management, contributing directly to China’s long-term carbon neutrality goals.
The supplement related to this article is available online at https://doi.org/10.5194/essd-18-7719-2026-supplement.
YL and YB designed the research. YL conducted the research and drafted the manuscript. YB, ZC, CL, XT and MB reviewed and revised the paper. XY provided part of the related data. ZWu, ZWa, HG and XW provided advice. SizL, XX and SiyL provided technical support. All authors contributed to the final draft of the manuscript.
The contact author has declared that none of the authors has any competing interests.
Publisher's note: Copernicus Publications remains neutral with regard to jurisdictional claims made in the text, published maps, institutional affiliations, or any other geographical representation in this paper. The authors bear the ultimate responsibility for providing appropriate place names. Views expressed in the text are those of the authors and do not necessarily reflect the views of the publisher.
We gratefully acknowledge LIDARNET (http://lidar.pku.edu.cn, last access: 15 October 2026) for providing the UAV LiDAR data, which were used to evaluate both the canopy height dataset employed in this study and the AGB dataset.
This work was supported by the National Key Research and Development Program of China for Young Scientists (grant no. 2023YFF1305700), the National Natural Science Foundation of China (grant nos. 42371129 and 42371118), the Science and Technology Innovation Program of Hunan Province (grant no. 2024RC1067).
This paper was edited by Zhen Yu and reviewed by three anonymous referees.
Araza, A., De Bruin, S., Herold, M., Quegan, S., Labriere, N., Rodriguez-Veiga, P., Avitabile, V., Santoro, M., Mitchard, E. T., Ryan, C. M., Phillips, O. L., Willcock, S., Verbeeck, H., Carreiras, J., Hein, L., Schelhaas, M.-J., Pacheco-Pascagaza, A. M., Da Conceição Bispo, P., Laurin, G. V., Vieilledent, G., Slik, F., Wijaya, A., Lewis, S. L., Morel, A., Liang, J., Sukhdeo, H., Schepaschenko, D., Cavlovic, J., Gilani, H., and Lucas, R.: A Comprehensive Framework for Assessing the Accuracy and Uncertainty of Global Above-Ground Biomass Maps, Remote Sens. Environ., 272, 112917, https://doi.org/10.1016/j.rse.2022.112917, 2022. a
Brandt, M., Yue, Y., Wigneron, J. P., Tong, X., Tian, F., Jepsen, M. R., Xiao, X., Verger, A., Mialon, A., Al-Yaari, A., Wang, K., and Fensholt, R.: Satellite-Observed Major Greening and Biomass Increase in South China Karst during Recent Decade, Earth's Future, 6, 1017–1028, https://doi.org/10.1029/2018EF000890, 2018. a
Brovkina, O., Novotny, J., Cienciala, E., Zemek, F., and Russ, R.: Mapping Forest Aboveground Biomass Using Airborne Hyperspectral and LiDAR Data in the Mountainous Conditions of Central Europe, Ecol. Eng., 100, 219–230, https://doi.org/10.1016/j.ecoleng.2016.12.004, 2017. a
Cai, Y., Xu, X., Zhu, P., Nie, S., Wang, C., Xiong, Y., and Liu, X.: Unveiling Spatiotemporal Tree Cover Patterns in China: The First 30 m Annual Tree Cover Mapping from 1985 to 2023, ISPRS J. Photogramm., 216, 240–258, https://doi.org/10.1016/j.isprsjprs.2024.08.001, 2024a. a
Cai, Y., Zhu, P., Xu, X., Li, X., Zhang, H., Nie, S., Wang, C., Wang, J., Shen, Q., Li, B., Wu, C., Liu, X., and Chen, Y.: CFATD: The First High-Spatiotemporal-Resolution Mapping of Forest Aboveground Biomass in China from 1985 to 2023 (Part VI: 2022–2023), Zenodo [data set], https://doi.org/10.5281/zenodo.12747329, 2024b. a, b, c, d, e, f, g, h, i, j, k, l, m, n
Cai, Y., Zhu, P., Li, X., Liu, X., Chen, Y., Shen, Q., Xu, X., Zhang, H., Nie, S., Wang, C., Wang, J., Li, B., Wu, C., and Zhuang, H.: Dynamics of China's forest carbon storage: the first 30 m annual aboveground biomass mapping from 1985 to 2023, Earth Syst. Sci. Data, 17, 6993–7018, https://doi.org/10.5194/essd-17-6993-2025, 2025. a, b, c
Campbell, M. J., Eastburn, J. F., Brewer, S. C., and Dennison, P. E.: Deep Learning and Machine Learning Enable Broad-Scale Woodland Height, Cover, and Biomass Mapping, ISPRS J. Photogramm., 226, 187–203, https://doi.org/10.1016/j.isprsjprs.2025.05.016, 2025. a
Chang, Z., Hobeichi, S., Wang, Y.-P., Tang, X., Abramowitz, G., Chen, Y., Cao, N., Yu, M., Huang, H., Zhou, G., Wang, G., Ma, K., Du, S., Li, S., Han, S., Ma, Y., Wigneron, J.-P., Fan, L., Saatchi, S. S., and Yan, J.: New Forest Aboveground Biomass Maps of China Integrating Multiple Datasets, Remote Sens., 13, https://doi.org/10.3390/rs13152892, 2021. a
Chave, J., Réjou-Méchain, M., Búrquez, A., Chidumayo, E., Colgan, M. S., Delitti, W. B. C., Duque, A., Eid, T., Fearnside, P. M., Goodman, R. C., Henry, M., Martínez-Yrízar, A., Mugasha, W. A., Muller-Landau, H. C., Mencuccini, M., Nelson, B. W., Ngomanda, A., Nogueira, E. M., Ortiz-Malavassi, E., Pélissier, R., Ploton, P., Ryan, C. M., Saldarriaga, J. G., and Vieilledent, G.: Improved Allometric Models to Estimate the Aboveground Biomass of Tropical Trees, Glob. Change Biol., 20, 3177–3190, https://doi.org/10.1111/gcb.12629, 2014. a
Chen, C., Park, T., Wang, X., Piao, S., Xu, B., Chaturvedi, R. K., Fuchs, R., Brovkin, V., Ciais, P., Fensholt, R., Tømmervik, H., Bala, G., Zhu, Z., Nemani, R. R., and Myneni, R. B.: China and India Lead in Greening of the World through Land-Use Management, Nat. Sustain., 2, 122–129, https://doi.org/10.1038/s41893-019-0220-7, 2019. a
Cheng, K., Yang, H., Tao, S., Su, Y., Guan, H., Ren, Y., Hu, T., Li, W., Xu, G., Chen, M., Lu, X., Yang, Z., Tang, Y., Ma, K., Fang, J., and Guo, Q.: Carbon Storage through China's Planted Forest Expansion, Nat. Commun., 15, 4106, https://doi.org/10.1038/s41467-024-48546-0, 2024. a
Cohen, W. B., Healey, S. P., Yang, Z., Stehman, S. V., Brewer, C. K., Brooks, E. B., Gorelick, N., Huang, C., Hughes, M. J., Kennedy, R. E., Loveland, T. R., Moisen, G. G., Schroeder, T. A., Vogelmann, J. E., Woodcock, C. E., Yang, L., and Zhu, Z.: A LandTrendr Multispectral Ensemble for Forest Disturbance Detection, Remote Sens. Environ., 205, 131–140, https://doi.org/10.1016/j.rse.2017.11.015, 2018. a
Duncanson, L., Kellner, J. R., Armston, J., Dubayah, R., Minor, D. M., Hancock, S., Healey, S. P., Patterson, P. L., Saarela, S., Marselis, S., Silva, C. E., Bruening, J., Goetz, S. J., Tang, H., Hofton, M., Blair, B., Luthcke, S., Fatoyinbo, L., Abernethy, K., Alonso, A., Andersen, H.-E., Aplin, P., Baker, T. R., Barbier, N., Bastin, J. F., Biber, P., Boeckx, P., Bogaert, J., Boschetti, L., Boucher, P. B., Boyd, D. S., Burslem, D. F., Calvo-Rodriguez, S., Chave, J., Chazdon, R. L., Clark, D. B., Clark, D. A., Cohen, W. B., Coomes, D. A., Corona, P., Cushman, K., Cutler, M. E., Dalling, J. W., Dalponte, M., Dash, J., de-Miguel, S., Deng, S., Ellis, P. W., Erasmus, B., Fekety, P. A., Fernandez-Landa, A., Ferraz, A., Fischer, R., Fisher, A. G., García-Abril, A., Gobakken, T., Hacker, J. M., Heurich, M., Hill, R. A., Hopkinson, C., Huang, H., Hubbell, S. P., Hudak, A. T., Huth, A., Imbach, B., Jeffery, K. J., Katoh, M., Kearsley, E., Kenfack, D., Kljun, N., Knapp, N., Král, K., Krůček, M., Labrière, N., Lewis, S. L., Longo, M., Lucas, R. M., Main, R., Manzanera, J. A., Martínez, R. V., Mathieu, R., Memiaghe, H., Meyer, V., Mendoza, A. M., Monerris, A., Montesano, P., Morsdorf, F., Næsset, E., Naidoo, L., Nilus, R., O'Brien, M., Orwig, D. A., Papathanassiou, K., Parker, G., Philipson, C., Phillips, O. L., Pisek, J., Poulsen, J. R., Pretzsch, H., Rüdiger, C., Saatchi, S., Sanchez-Azofeifa, A., Sanchez-Lopez, N., Scholes, R., Silva, C. A., Simard, M., Skidmore, A., Stereńczak, K., Tanase, M., Torresan, C., Valbuena, R., Verbeeck, H., Vrska, T., Wessels, K., White, J. C., White, L. J., Zahabu, E., and Zgraggen, C.: Aboveground Biomass Density Models for NASA's Global Ecosystem Dynamics Investigation (GEDI) Lidar Mission, Remote Sens. Environ., 270, 112845, https://doi.org/10.1016/j.rse.2021.112845, 2022. a
Fu, L., Shu, Q., Yang, Z., Xia, C., Zhang, X., Zhang, Y., Li, Z., and Li, S.: Accuracy assessment of topography and forest canopy height in complex terrain conditions of Southern China using ICESat-2 and GEDI data, Front. Plant Sci., 16, 1547688, https://doi.org/10.3389/fpls.2025.1547688, 2025. a
Fu, Y., Li, R., Zhu, Z., Xue, Y., Ding, H., Wang, X., Na, J., and Xia, W.: SCARF: A New Algorithm for Continuous Prediction of Biomass Dynamics Using Machine Learning and Landsat Time Series, Remote Sens. Environ., 314, 114348, https://doi.org/10.1016/j.rse.2024.114348, 2024. a
Guo, Z., Hu, H., Li, P., Li, N., and Fang, J.: Spatio-Temporal Changes in Biomass Carbon Sinks in China's Forests from 1977 to 2008, Sci. China Life Sci., 56, 661–671, https://doi.org/10.1007/s11427-013-4492-2, 2013. a
Hansen, M. C., Potapov, P. V., Moore, R., Hancher, M., Turubanova, S. A., Tyukavina, A., Thau, D., Stehman, S. V., Goetz, S. J., Loveland, T. R., Kommareddy, A., Egorov, A., Chini, L., Justice, C. O., and Townshend, J. R. G.: High-Resolution Global Maps of 21st-Century Forest Cover Change, Science, 342, 850–853, https://doi.org/10.1126/science.1244693, 2013. a
Hu, Y., Xu, X., Wu, F., Sun, Z., Xia, H., Meng, Q., Huang, W., Zhou, H., Gao, J., Li, W., Peng, D., and Xiao, X.: Estimating Forest Stock Volume in Hunan Province, China, by Integrating in Situ Plot Data, Sentinel-2 Images, and Linear and Machine Learning Regression Models, Remote Sens., 12, https://doi.org/10.3390/rs12010186, 2020. a
Huang, H., Liu, C., Wang, X., Zhou, X., and Gong, P.: Integration of Multi-Resource Remotely Sensed Data and Allometric Models for Forest Aboveground Biomass Estimation in China, Remote Sens. Environ., 221, 225–234, https://doi.org/10.1016/j.rse.2018.11.017, 2019. a
Huang, W., Sun, G., Dubayah, R., Cook, B., Montesano, P., Ni, W., and Zhang, Z.: Mapping Biomass Change after Forest Disturbance: Applying LiDAR Footprint-Derived Models at Key Map Scales, Remote Sens. Environ., 134, 319–332, https://doi.org/10.1016/j.rse.2013.03.017, 2013. a
Jian, N., Zhao, H., and Liu, M.: Driving Force and Potential of Forest Resource Change: Based on the Results of the Ninth National Forest Resources Inventory, Journal of Forestry and Grassland Policy, 2, 64–71, https://doi.org/10.12344/lczcyj.2022.09.22.0001, 2022. a
Kashongwe, H., Roy, D., and Skole, D.: Examination of the Amount of GEDI Data Required to Characterize Central Africa Tropical Forest Aboveground Biomass at REDD+ Project Scale in Mai Ndombe Province, Science of Remote Sensing, 7, 100091, https://doi.org/10.1016/j.srs.2023.100091, 2023. a
Lang, N., Jetz, W., Schindler, K., and Wegner, J. D.: A High-Resolution Canopy Height Model of the Earth, Nature Ecology & Evolution, 7, 1778–1789, https://doi.org/10.1038/s41559-023-02206-6, 2023. a
Li, H., Hiroshima, T., Li, X., Hayashi, M., and Kato, T.: High-Resolution Mapping of Forest Structure and Carbon Stock Using Multi-Source Remote Sensing Data in Japan, Remote Sens. Environ., 312, 114322, https://doi.org/10.1016/j.rse.2024.114322, 2024a. a
Li, J., Bao, W., Wang, X., Song, Y., Liao, T., Xu, X., and Guo, M.: Estimating Aboveground Biomass of Boreal Forests in Northern China Using Multiple Datasets, IEEE T. Geosci. Remote, 62, 1–10, https://doi.org/10.1109/TGRS.2024.3408316, 2024b. a
Li, Q., Yin, J., Zhang, X., Hao, D., Ferreira, M. P., Yan, W., Tian, Y., Zhang, D., Tan, S., Nie, S., An, T., Li, X., Huang, J., Su, W., and Zeng, Y.: Tree-Level Carbon Stock Estimations across Diverse Species Using Multi-Source Remote Sensing Integration, Comput. Electron. Agr., 231, 109 904, https://doi.org/10.1016/j.compag.2025.109904, 2025. a
Li, S., Brandt, M., Fensholt, R., Kariryaa, A., Igel, C., Gieseke, F., Nord-Larsen, T., Oehmcke, S., Carlsen, A. H., Junttila, S., Tong, X., d'Aspremont, A., and Ciais, P.: Deep Learning Enables Image-Based Tree Counting, Crown Segmentation, and Height Prediction at National Scale, PNAS Nexus, 2, pgad076, https://doi.org/10.1093/pnasnexus/pgad076, 2023a. a
Li, S., Brandt, M., Tong, X., Oehmcke, S., Igel, C., Gieseke, F., Nord-Larsen, T., Fensholt, R., Chave, J., and Ciais, P.: Deep Learning Tree and Forest Biomass from Sub-Meter Resolution Images, Research Square [preprint], https://doi.org/10.21203/rs.3.rs-3335298/v1, 2023b. a
Li, Y., Bai, Y., and Chen, Z.: FineKarstAGB: A Fine-Grained, High-Resolution Dataset of Aboveground Biomass in Southwest China, Science Data Bank [data set], https://doi.org/10.57760/sciencedb.33452, 2026. a, b
Liu, S., Brandt, M., Nord-Larsen, T., Chave, J., Reiner, F., Lang, N., Tong, X., Ciais, P., Igel, C., Pascual, A., Guerra-Hernandez, J., Li, S., Mugabowindekwe, M., Saatchi, S., Yue, Y., Chen, Z., and Fensholt, R.: The Overlooked Contribution of Trees Outside Forests to Tree Cover and Woody Biomass across Europe, Science Advances, 9, eadh4097, https://doi.org/10.1126/sciadv.adh4097, 2023. a, b, c
Liu, X., Liu, S., Bao, W., Li, X., Li, G., Zhu, W., Yu, L., Cai, L., Pan, H., Feng, Q., Li, H., Xu, Z., Hu, Z., Zhang, L., and Liu, Q.: Constructing Approaches and Ecological Countermeasures for Ecological Security Barrier in Southwest China, Terrestrial Ecosystem and Conservation, 2, 84–94, https://doi.org/10.12356/j.2096-8884.2022-0043, 2022a. a
Liu, X., Su, Y., Hu, T., Yang, Q., Liu, B., Deng, Y., Tang, H., Tang, Z., Fang, J., and Guo, Q.: Neural Network Guided Interpolation for Mapping Canopy Height of China's Forests by Integrating GEDI and ICESat-2 Data, Remote Sens. Environ., 269, 112844, https://doi.org/10.1016/j.rse.2021.112844, 2022b. a, b, c
Loshchilov, I. and Hutter, F.: Decoupled Weight Decay Regularization, OpenReview.net, https://openreview.net/forum?id=Bkg6RiCqY7 (last access: 15 October 2026), 2019. a
Lu, D., Chen, Q., Wang, G., Liu, L., Li, G., and Moran, E.: A Survey of Remote Sensing-Based Aboveground Biomass Estimation Methods in Forest Ecosystems, Int. J. Digit. Earth, 9, 63–105, https://doi.org/10.1080/17538947.2014.990526, 2016. a
Lu, H., Zhang, H., Fan, H., Liu, D., Wang, J., Wan, X., Zhao, L., Deng, Y., Zhao, F., and Wang, R.: Forest Height Retrieval Using P-band Airborne Multi-Baseline SAR Data: A Novel Phase Compensation Method, ISPRS J. Photogramm., 175, 99–118, https://doi.org/10.1016/j.isprsjprs.2021.02.022, 2021. a
Ma, T., Hu, Y., Wang, J., Beckline, M., Pang, D., Chen, L., Ni, X., and Li, X.: A Novel Vegetation Index Approach Using Sentinel-2 Data and Random Forest Algorithm for Estimating Forest Stock Volume in the Helan Mountains, Ningxia, China, Remote Sens., 15, https://doi.org/10.3390/rs15071853, 2023. a
Ma, T., Zhang, C., Ji, L., Zuo, Z., Beckline, M., Hu, Y., Li, X., and Xiao, X.: Development of Forest Aboveground Biomass Estimation, Its Problems and Future Solutions: A Review, Ecological Indic., 159, 111653, https://doi.org/10.1016/j.ecolind.2024.111653, 2024. a, b
Markus, T., Neumann, T., Martino, A., Abdalati, W., Brunt, K., Csatho, B., Farrell, S., Fricker, H., Gardner, A., Harding, D., Jasinski, M., Kwok, R., Magruder, L., Lubin, D., Luthcke, S., Morison, J., Nelson, R., Neuenschwander, A., Palm, S., Popescu, S., Shum, C. K., Schutz, B. E., Smith, B., Yang, Y., and Zwally, J.: The Ice, Cloud, and Land Elevation Satellite-2 (Icesat-2): Science Requirements, Concept, and Implementation, Remote Sens. Environ., 190, 260–273, https://doi.org/10.1016/j.rse.2016.12.029, 2017. a
Mitchard, E. T. A., Saatchi, S. S., White, L. J. T., Abernethy, K. A., Jeffery, K. J., Lewis, S. L., Collins, M., Lefsky, M. A., Leal, M. E., Woodhouse, I. H., and Meir, P.: Mapping tropical forest biomass with radar and spaceborne LiDAR in Lopé National Park, Gabon: overcoming problems of high biomass and persistent cloud, Biogeosciences, 9, 179–191, https://doi.org/10.5194/bg-9-179-2012, 2012. a
Mugabowindekwe, M., Brandt, M., Chave, J., Reiner, F., Skole, D. L., Kariryaa, A., Igel, C., Hiernaux, P., Ciais, P., Mertz, O., Tong, X., Li, S., Rwanyiziri, G., Dushimiyimana, T., Ndoli, A., Uwizeyimana, V., Lillesø, J.-P. B., Gieseke, F., Tucker, C. J., Saatchi, S., and Fensholt, R.: Nation-Wide Mapping of Tree-Level Aboveground Carbon Stocks in Rwanda, Nat. Clim. Change, 13, 91–97, https://doi.org/10.1038/s41558-022-01544-w, 2023. a
Pan, Y., Birdsey, R. A., Fang, J., Houghton, R., Kauppi, P. E., Kurz, W. A., Phillips, O. L., Shvidenko, A., Lewis, S. L., Canadell, J. G., Ciais, P., Jackson, R. B., Pacala, S. W., McGuire, A. D., Piao, S., Rautiainen, A., Sitch, S., and Hayes, D.: A Large and Persistent Carbon Sink in the World's Forests, Science, 333, 988–993, https://doi.org/10.1126/science.1201609, 2011. a
Pan, T., Guan, H., and He, W.: GF-2 Satellite Remote Sensing Technology, Spacecraft Recovery & Remote Sensing, 36, 16–24, https://doi.org/10.3969/j.issn.1009-8518.2015.04.003, 2015. a
Pei, J., Wang, L., Huang, H., Wang, L., Li, W., Wang, X., Yang, H., Cao, J., Fang, H., and Niu, Z.: Characterization and Attribution of Vegetation Dynamics in the Ecologically Fragile South China Karst: Evidence from Three Decadal Landsat Observations, Front. Plant Sci., 13, 1043389, https://doi.org/10.3389/fpls.2022.1043389, 2022. a
Poorter, L., Bongers, F., Aide, T. M., Almeyda Zambrano, A. M., Balvanera, P., Becknell, J. M., Boukili, V., Brancalion, P. H. S., Broadbent, E. N., Chazdon, R. L., Craven, D., de Almeida-Cortez, J. S., Cabral, G. A. L., de Jong, B. H. J., Denslow, J. S., Dent, D. H., DeWalt, S. J., Dupuy, J. M., Durán, S. M., Espírito-Santo, M. M., Fandino, M. C., César, R. G., Hall, J. S., Hernandez-Stefanoni, J. L., Jakovac, C. C., Junqueira, A. B., Kennard, D., Letcher, S. G., Licona, J.-C., Lohbeck, M., Marín-Spiotta, E., Martínez-Ramos, M., Massoca, P., Meave, J. A., Mesquita, R., Mora, F., Muñoz, R., Muscarella, R., Nunes, Y. R. F., Ochoa-Gaona, S., de Oliveira, A. A., Orihuela-Belmonte, E., Peña-Claros, M., Pérez-García, E. A., Piotto, D., Powers, J. S., Rodríguez-Velázquez, J., Romero-Pérez, I. E., Ruíz, J., Saldarriaga, J. G., Sanchez-Azofeifa, A., Schwartz, N. B., Steininger, M. K., Swenson, N. G., Toledo, M., Uriarte, M., van Breugel, M., van der Wal, H., Veloso, M. D. M., Vester, H. F. M., Vicentini, A., Vieira, I. C. G., Vizcarra Bentos, T., Williamson, G. B., and Rozendaal, D. M. A.: Biomass Resilience of Neotropical Secondary Forests, Nature, 530, 211–214, https://doi.org/10.1038/nature16512, 2016. a
Potapov, P., Li, X., Hernandez-Serna, A., Tyukavina, A., Hansen, M. C., Kommareddy, A., Pickens, A., Turubanova, S., Tang, H., Silva, C. E., Armston, J., Dubayah, R., Blair, J. B., and Hofton, M.: Mapping Global Forest Canopy Height through Integration of GEDI and Landsat Data, Remote Sens. Environ., 253, 112165, https://doi.org/10.1016/j.rse.2020.112165, 2021. a
Qian, C., Qiang, H., and Li, M.: A Novel Multiscale Geographically and Temporally Gravity-Weighted Regression Model: Algorithm Principle and an Application in Assessment of Forest Biomass in Karst Region, IEEE T. Geosci. Remote, 63, 1–14, https://doi.org/10.1109/TGRS.2025.3537324, 2025. a
Qin, S., Wang, H., Rogers, C., Bermúdez, J., Lourenço, R. B., Zhang, J., Li, X., Chau, J., Tompalski, P., and Gonsamo, A.: Aboveground Biomass Mapping of Canada with SAR and Optical Satellite Observations Aided by Active Learning, ISPRS J. Photogramm., 226, 204–220, https://doi.org/10.1016/j.isprsjprs.2025.05.022, 2025. a
Ronneberger, O., Fischer, P., and Brox, T.: U-Net: Convolutional Networks for Biomedical Image Segmentation, in: International Conference on Medical Image Computing and Computer-Assisted Intervention, Springer, 234–241, https://doi.org/10.1007/978-3-319-24574-4_28, 2015. a
Santoro, M. and Cartus, O.: ESA Biomass Climate Change Initiative (Biomass_cci): Global Datasets of Forest above-Ground Biomass for the Years 2007, 2010, 2015, 2016, 2017, 2018, 2019, 2020, 2021 and 2022, v6.0, CEDA Archive [data set], https://doi.org/10.5285/95913FFB6467447CA72C4E9 D8CF30501, 2025. a, b
Schwartz, M., Ciais, P., De Truchis, A., Chave, J., Ottlé, C., Vega, C., Wigneron, J.-P., Nicolas, M., Jouaber, S., Liu, S., Brandt, M., and Fayad, I.: FORMS: Forest Multiple Source height, wood volume, and biomass maps in France at 10 to 30 m resolution based on Sentinel-1, Sentinel-2, and Global Ecosystem Dynamics Investigation (GEDI) data with a deep learning approach, Earth Syst. Sci. Data, 15, 4927–4945, https://doi.org/10.5194/essd-15-4927-2023, 2023. a
Su, Y., Guo, Q., Xue, B., Hu, T., Alvarez, O., Tao, S., and Fang, J.: Spatial Distribution of Forest Aboveground Biomass in China: Estimation through Combination of Spaceborne Lidar, Optical Imagery, and Forest Inventory Data, Remote Sens. Environ., 173, 187–199, https://doi.org/10.1016/j.rse.2015.12.002, 2016. a
Tang, H., Stoker, J., Luthcke, S., Armston, J., Lee, K., Blair, B., and Hofton, M.: Evaluating and Mitigating the Impact of Systematic Geolocation Error on Canopy Height Measurement Performance of GEDI, Remote Sens. Environ., 291, 113571, https://doi.org/10.1016/j.rse.2023.113571, 2023. a
Tong, F. and Zhang, Y.: Individual Tree Crown Delineation in High Resolution Aerial RGB Imagery Using StarDist-based Model, Remote Sens. Environ., 319, 114618, https://doi.org/10.1016/j.rse.2025.114618, 2025. a
Tong, X., Wang, K., Yue, Y., Brandt, M., Liu, B., Zhang, C., Liao, C., and Fensholt, R.: Quantifying the Effectiveness of Ecological Restoration Projects on Long-Term Vegetation Dynamics in the Karst Regions of Southwest China, Int. J. Appl. Earth Obs., 54, 105–113, https://doi.org/10.1016/j.jag.2016.09.013, 2017. a, b
Tong, X., Brandt, M., Yue, Y., Horion, S., Wang, K., Keersmaecker, W. D., Tian, F., Schurgers, G., Xiao, X., Luo, Y., Chen, C., Myneni, R., Shi, Z., Chen, H., and Fensholt, R.: Increased Vegetation Growth and Carbon Stock in China Karst via Ecological Engineering, Nat. Sustain., 1, 44–50, https://doi.org/10.1038/s41893-017-0004-x, 2018. a
Tong, X., Brandt, M., Yue, Y., Ciais, P., Rudbeck Jepsen, M., Penuelas, J., Wigneron, J.-P., Xiao, X., Song, X.-P., Horion, S., Rasmussen, K., Saatchi, S., Fan, L., Wang, K., Zhang, B., Chen, Z., Wang, Y., Li, X., and Fensholt, R.: Forest Management in Southern China Generates Short Term Extensive Carbon Sequestration, Nat. Commun., 11, 129, https://doi.org/10.1038/s41467-019-13798-8, 2020. a, b, c
Tong, X., Xu, Q., Yue, Y., Wang, K., Du, H., Fensholt, R., Li, S., Xu, X., Bai, Y., Yang, X., Gominski, D., Ciais, P., Chave, J., Chen, Z., Jepsen, M., Igel, C., Liu, S., Qi, X., and Brandt, M.: Old-Growth Forest Patches Are Widespread Outside Nature Reserves in Southern China, Research Square [preprint], https://doi.org/10.21203/rs.3.rs-7643250/v1, 2025. a, b, c
Trac, C. J., Harrell, S., Hinckley, T. M., and Henck, A. C.: Reforestation Programs in Southwest China: Reported Success, Observed Failure, and the Reasons Why, J. Mt. Sci., 4, 275–292, https://doi.org/10.1007/s11629-007-0275-1, 2007. a
UNFCCC: Warsaw Framework for REDD-plus, https://redd.unfccc.int/fact-sheets/warsaw-framework-for-redd.html (last access: 15 October 2026), 2013. a
Wagner, F. H., Roberts, S., Ritz, A. L., Carter, G., Dalagnol, R., Favrichon, S., Hirye, M. C., Brandt, M., Ciais, P., and Saatchi, S.: Sub-Meter Tree Height Mapping of California Using Aerial Images and LiDAR-informed U-Net Model, Remote Sens. Environ., 305, 114099, https://doi.org/10.1016/j.rse.2024.114099, 2024. a
Wang, Y., Peng, Y., Hu, X., and Zhang, P.: Fine-Resolution Forest Height Estimation by Integrating Icesat-2 and Landsat 8 OLI Data with a Spatial Downscaling Method for Aboveground Biomass Quantification, Forests, 14, https://doi.org/10.3390/f14071414, 2023. a
Xu, X., Brandt, M., Tong, X., Mugabowindekwe, M., Yue, Y., Li, S., Xu, Q., Liu, S., Reiner, F., Wang, K., Chen, Z., Bai, Y., and Fensholt, R.: Large-Scale Characterization of Horizontal Forest Structure from Remote Sensing Optical Images, Remote Sensing in Ecology and Conservation, 12, 611–628, https://doi.org/10.1002/rse2.70058, 2026. a, b, c
Yan, S., He, G., and Zhang, X.: Forest Aboveground Biomass Products in China, 2013–2021, Science Data Bank [data set], https://doi.org/10.57760/sciencedb.07122, 2023a. a, b, c, d, e, f, g, h, i, j, k, l, m, n
Yan, X., Li, J., Smith, A. R., Yang, D., Ma, T., Su, Y., and Shao, J.: Evaluation of Machine Learning Methods and Multi-Source Remote Sensing Data Combinations to Construct Forest above-Ground Biomass Models, Int. J. Digit. Earth, 16, 4471–4491, https://doi.org/10.1080/17538947.2023.2270459, 2023b. a
Yang, Q., Niu, C., Liu, X., Feng, Y., Ma, Q., Wang, X., Tang, H., and Guo, Q.: Mapping High-Resolution Forest Aboveground Biomass of China Using Multisource Remote Sensing Data, GISci. Remote Sens., 60, 2203303, https://doi.org/10.1080/15481603.2023.2203303, 2023. a, b, c, d, e, f, g, h, i, j, k, l, m, n, o, p
Zhang, X., He, G., Yan, S., Long, T., Peng, X., Zhang, Z., and Wang, G.: Forest Status Assessment in China with SDG Indicators Based on High-Resolution Satellite Data, Int. J. Digit. Earth, 16, 1008–1021, https://doi.org/10.1080/17538947.2023.2190625, 2023a. a, b
Zhang, Z., Lu, L., Zhao, Y., Wang, Y., Wei, D., Wu, X., and Ma, X.: Recent Advances in Using Chinese Earth Observation Satellites for Remote Sensing of Vegetation, ISPRS J. Photogramm., 195, 393–407, https://doi.org/10.1016/j.isprsjprs.2022.12.006, 2023b. a, b, c
Zhu, N., Yang, B., Gong, W., Ying, S., Dai, W., and Dong, Z.: An Explicit Forest Carbon Stock Model and Applications, Geo-spatial Information Science, 1–12, https://doi.org/10.1080/10095020.2025.2469889, 2025. a, b