the Creative Commons Attribution 4.0 License.
the Creative Commons Attribution 4.0 License.
 | 19 Oct 2026
TED: a global temperature-driven thermoelastic displacement dataset for GNSS reference stations (2000–2023)
Zhao Li

Lingfeng Ye
Peng Yuan
Yanming Feng
Nonlinear variations in GNSS station height time series include contributions from non-tidal mass loading and temperature-driven thermoelastic displacement (TED). However, a globally consistent station-level TED product has not been widely available. Here we present a global dataset of vertical TED for approximately 14 000 GNSS stations over 2000–2023, generated using a full-spectrum layered finite-element model. The model is driven by hourly ERA5 soil-temperature forcing and parameterized with SoilGrids-derived depth-dependent subsurface properties, allowing within-day temperature variability to be incorporated into daily TED time series that retain seasonal and nonseasonal components. For the 2612 stations with documented foundation-depth information, site-information-constrained solutions agree closely with SoilGrids-based solutions, with annual-amplitude differences mostly about 0.01–0.03 mm and annual-phase differences generally within 1–3°. Sensitivity tests using ± 10 % perturbations in the linear thermal expansion coefficient, thermal diffusivity, and Young's modulus indicate that the amplitude and phase of the annual TED component are stable under reasonable parameter uncertainty. Globally, annual TED amplitudes are mostly within about 0.2–1.2 mm and locally exceed 1.5 mm, with larger signals concentrated in arid inland and continental regions. The percentile-based peak-to-peak variability of the full daily TED series commonly reaches 2–4 mm and locally approaches 5–6 mm. When applied alone to GNSS height time series, TED produces positive WRMS reductions at about 79 % of the assessed stations, with most improvements within 3 %–5 % and the largest reductions reaching about 10 %. The dataset is publicly available for direct use in GNSS height time series correction and related geophysical applications: https://doi.org/10.5281/zenodo.21069958 (Lu et al., 2026a).
- Article
(16425 KB) - Full-text XML
- BibTeX
- EndNote


Over recent decades, Global Navigation Satellite System (GNSS) reference station coordinate time series have become an important data source for investigating crustal deformation, vertical land motion, surface mass redistribution, and terrestrial reference frame stability (Clarke et al., 2005; Jiang et al., 2013; Blewitt et al., 2018; Li et al., 2020). In GNSS height time series, non-tidal atmospheric loading, non-tidal ocean loading, and hydrological loading induced vertical displacement have been reported to explain roughly 40 %–50 % of the annual signal (Dong et al., 2002; van Dam et al., 2007; Fritsche et al., 2012; Li et al., 2025). In addition to mass loading, temperature variations can induce thermal expansion and contraction of GNSS station monuments and the surrounding ground materials, producing thermoelastic deformation in GNSS height time series (Romagnoli et al., 2003; Prawirodirdjo et al., 2006; Fang et al., 2014; Xu et al., 2017; Li et al., 2024). If mass loading and thermoelastic effects are not properly accounted for, they may complicate the geophysical interpretation of coordinate time series and potentially affect the long-term stability of the terrestrial reference frame (Altamimi et al., 2023).
Temperature-related deformation at GNSS stations can arise from both above-ground monument thermal expansion and subsurface thermoelastic displacement. Monument thermal expansion can often be estimated using relatively direct expansion models when the monument height, material, and structural configuration are known (Yan et al., 2010; Lu et al., 2024; Wang et al., 2025). In contrast, subsurface thermoelastic displacement (TED) depends on the downward propagation of temperature variations, the vertical distribution of soil and bedrock properties, as well as the elastic response of the shallow subsurface. As temperature variations diffuse into the shallow ground, they cause depth-dependent thermal strain in soil and bedrock beneath GNSS stations. This strain is transferred elastically to the ground surface and appears in GNSS height time series (Biot, 1956; Berger, 1975). Previous studies have shown that shallow subsurface thermoelastic effects can contribute to seasonal height variations at some GNSS sites (Yan et al., 2009; Hill et al., 2009). Although the annual component is usually dominant, thermoelastic displacement may also contain semiannual and nonseasonal components because the temperature forcing includes variations beyond a simple annual cycle and the subsurface thermal response is site dependent. Millimetre-level nonseasonal thermoelastic displacements have been reported in some regions and can be detected by high-precision geodetic observations (Lei et al., 2020). On the other hand, unmodelled thermoelastic station motion may also affect the estimation of global geodetic parameters, such as geocenter motion. For example, Wei et al. (2025) showed that unmodelled thermoelastic displacement at GNSS stations can project into the annual signal of the Z component in GNSS-derived geocenter estimates. This signal should be interpreted as an apparent geocenter variation associated with station displacement and network geometry, rather than true motion of the Earth's centre of mass. Accounting for thermoelastic station motion may therefore reduce this apparent annual signal and improve the consistency of GNSS-derived geocenter estimates across independent solutions.
Thermoelastic modelling approaches for GNSS stations include both analytical models and numerical methods. Analytical models have been developed using idealized elastic media, such as elastic half-space and uniform elastic-sphere models, to describe temperature-driven deformation at GNSS sites (Dong et al., 2002; Yan et al., 2009, 2010; Fang et al., 2014; Xu et al., 2017). These models provide useful physical insight into thermoelastic deformation and can be computationally efficient once the analytical solution is formulated. However, many of them rely on homogeneous or effectively depth-invariant thermophysical and elastic properties, or on simplified descriptions of shallow subsurface structure. This limits their ability to represent the attenuation and phase lag of thermal signals caused by soil–bedrock stratification, and makes it difficult to account for station-to-station differences in shallow subsurface conditions. Recent studies have therefore emphasized the importance of incorporating more realistic subsurface structure, such as bedrock depth, lithology, and depth-dependent material properties, when modelling temperature-driven deformation in GNSS height time series (Li et al., 2024; Lu et al., 2024). By comparison, one-dimensional finite-element model (FEM) provides a practical numerical approach for addressing these limitations because it can represent material heterogeneity and layer-interface effects more flexibly than analytical models based on idealized elastic media. For thermoelastic problems in layered media, FEM can solve the transient heat-conduction problem and compute surface displacement induced by the resulting temperature-dependent strain within a consistent numerical model (Lei et al., 2020).
For global TED applications, broad station coverage, extended temporal coverage, globally available temperature and subsurface properties are needed to describe TED variability across different climate and subsurface settings. Public GNSS archives now provide access to on the order of 14 000 continuous stations, making it necessary to develop a globally consistent TED product for direct use with daily GNSS height time series. In this study, we implement a full-spectrum layered finite-element model (FEMFL) at the global scale and release a public dataset of daily vertical TED time series for approximately 14 000 GNSS stations worldwide over 2000–2023. The model is driven by hourly ERA5 soil-temperature forcing and parameterized using SoilGrids-derived depth-dependent subsurface properties (Lu et al., 2026b). The dataset is released as a versioned product, with station information and data-description files provided to facilitate consistent use and future updates. The resulting TED series are intended as a subsurface thermoelastic correction that can be used alongside non-tidal loading products in GNSS time series analysis, with potential applications in vertical land-motion studies, terrestrial reference frame assessment, and geocenter-related investigations (Altamimi et al., 2023; Wei et al., 2025).
The remainder of this paper is organized as follows. Section 2 describes the input data, model configuration, and computational procedure used to generate the TED dataset. Section 3 presents the main spatiotemporal characteristics of the dataset, assesses its stability and internal consistency, and examines its effect on GNSS height time series. Section 4 describes the data availability and usage of the TED product. Section 5 discusses the applicability and limitations of the dataset and outlines possible future updates.
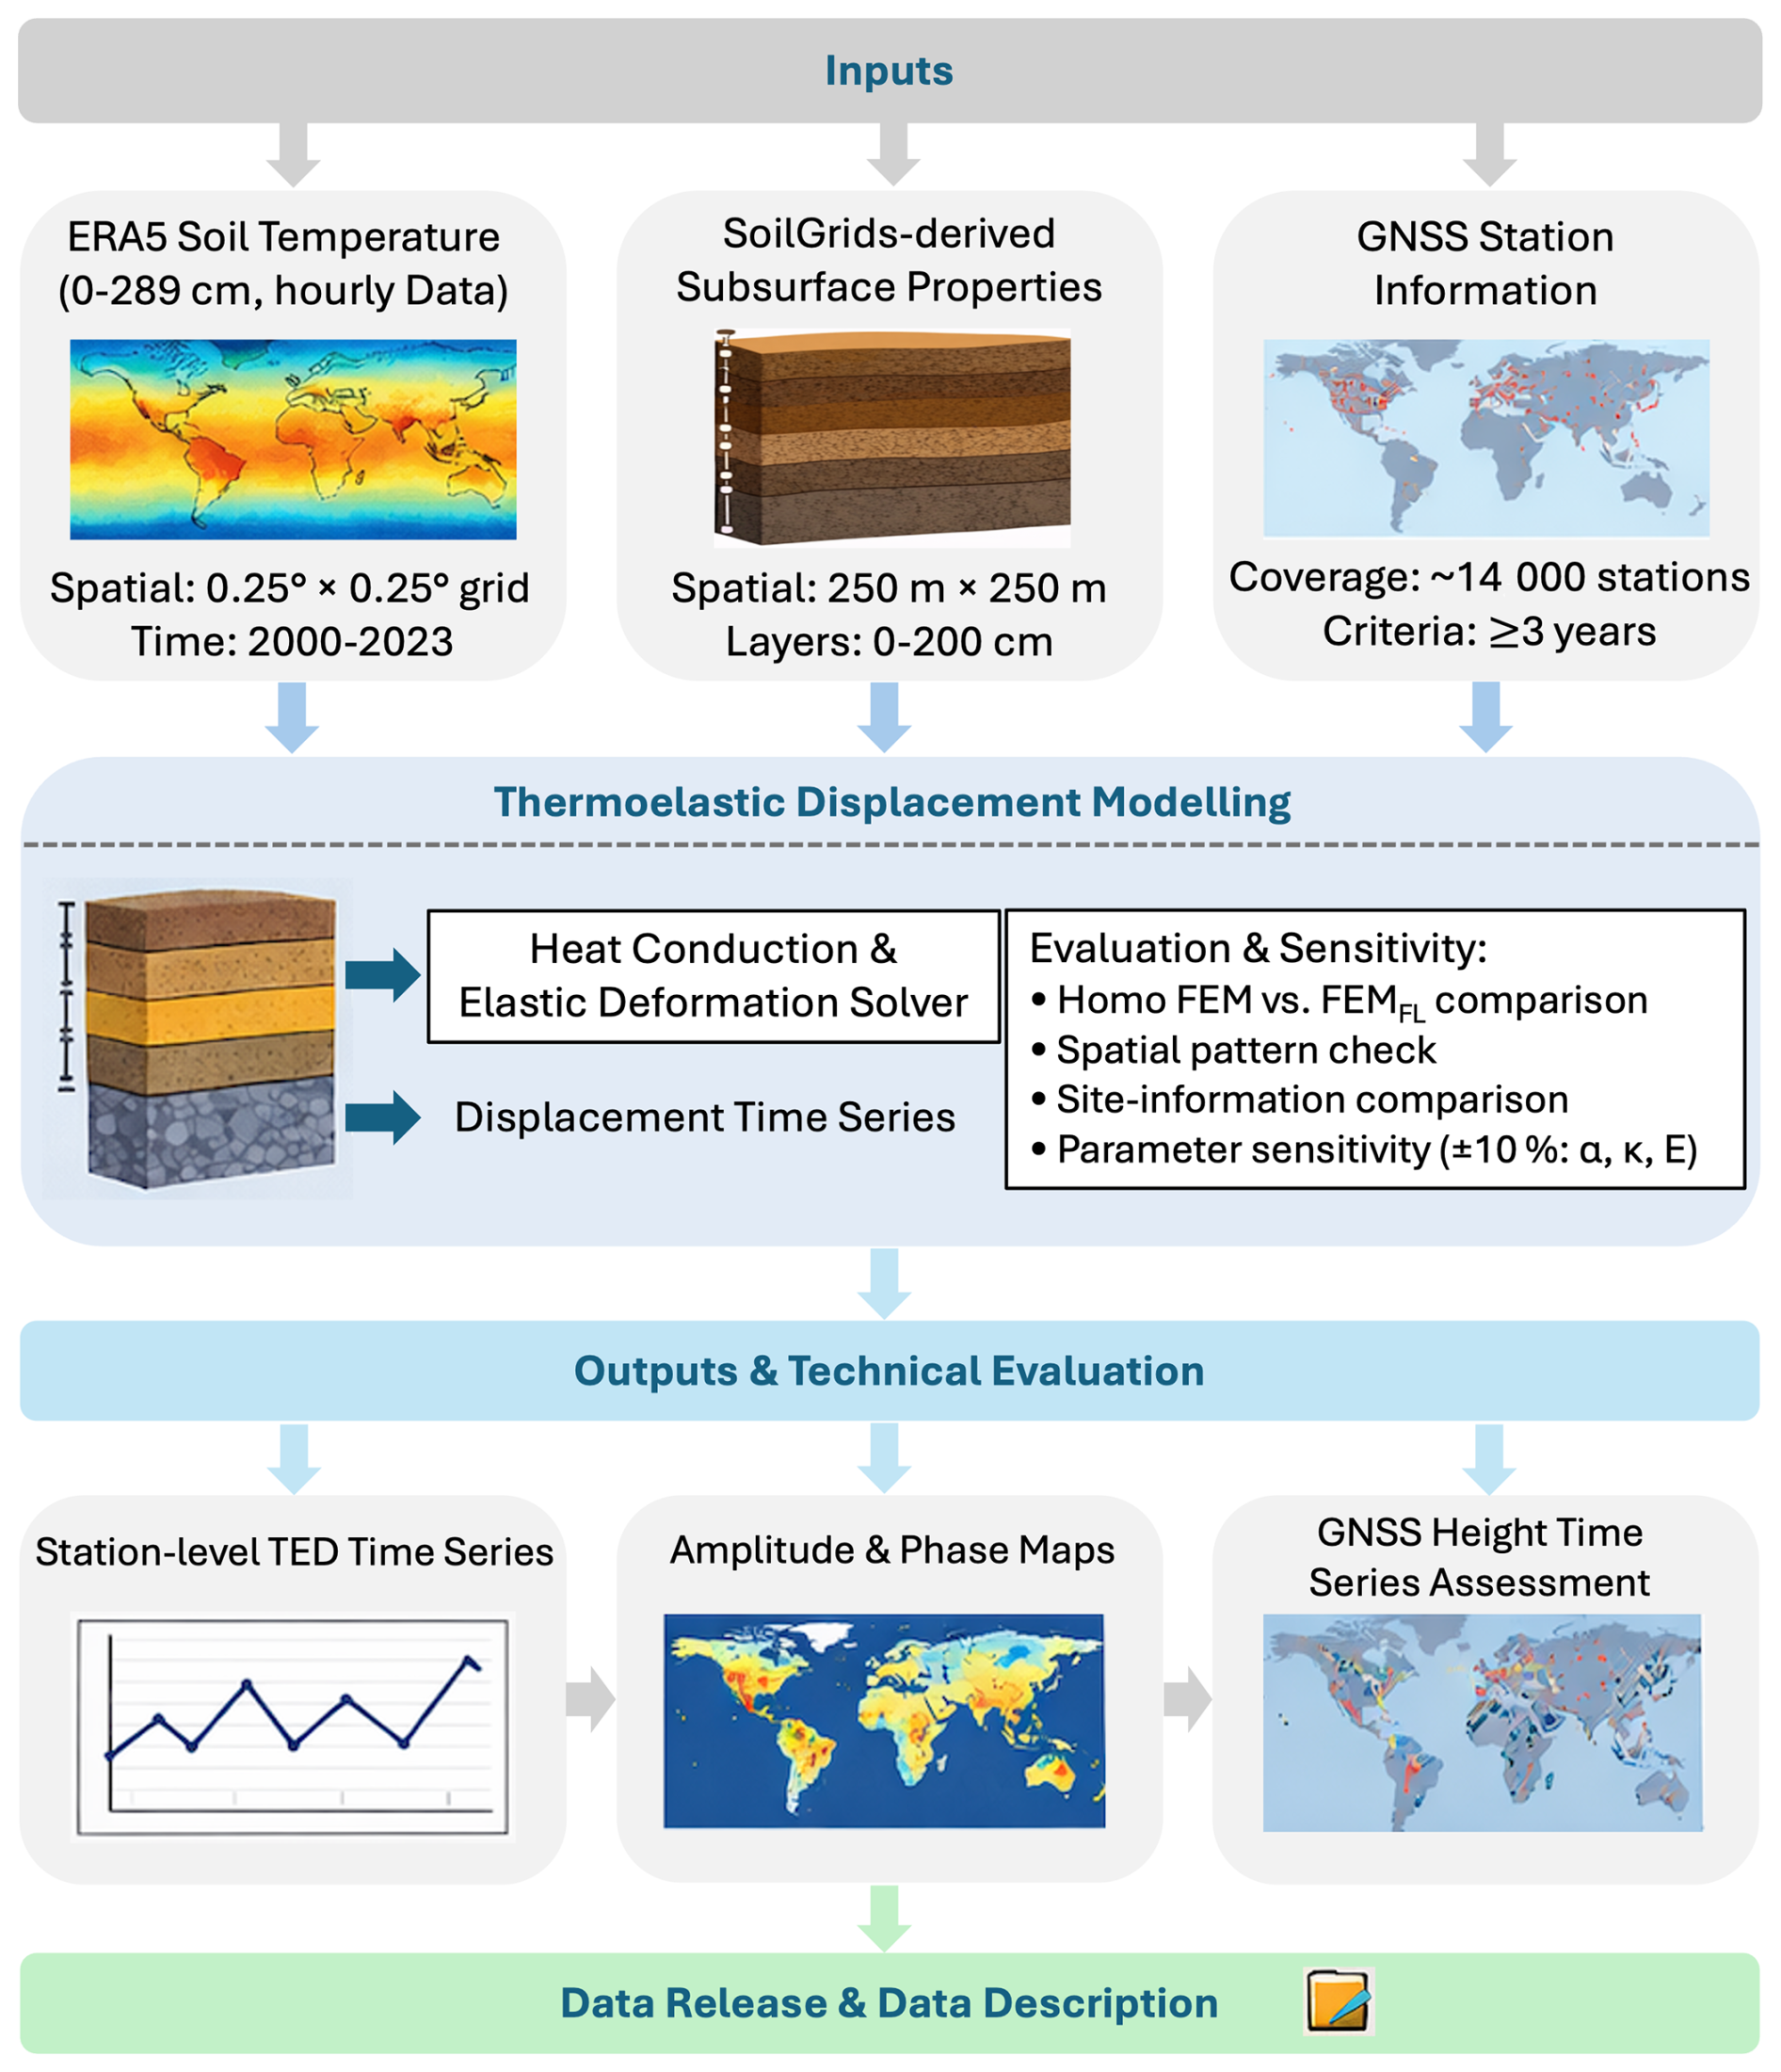
Figure 1Overview of the data sources, modelling procedure, evaluation steps, and release structure of the TED dataset. The main inputs include ERA5 soil-temperature forcing, SoilGrids-derived layered subsurface properties, and GNSS station information. The procedure includes station selection, temperature-forcing preparation, subsurface parameterization, FEMFL computation, consistency checks, technical evaluation, and release of station-level TED time series with file organization and data-description information.
This section describes the data sources, model configuration, and processing procedure used to generate the global TED dataset. The dataset provides daily vertical temperature-driven subsurface thermoelastic displacement time series for approximately 14 000 continuously operating GNSS stations over 2000–2023. It is produced using a consistent processing procedure, as summarized in Fig. 1. This procedure includes defining the station list and data span, preparing the ERA5 soil-temperature forcing, building the layered subsurface model parameters, computing station-level TED time series with FEMFL, checking the consistency of the output files, and organizing the data for release. Station locations and data spans are compiled from publicly available GNSS station information. The thermal forcing is derived from ERA5 soil-temperature fields, and depth-dependent subsurface properties are parameterized using SoilGrids. The vertical thermoelastic response is then computed with FEMFL and distributed in a standardized station-level format for direct use with daily GNSS height time series.
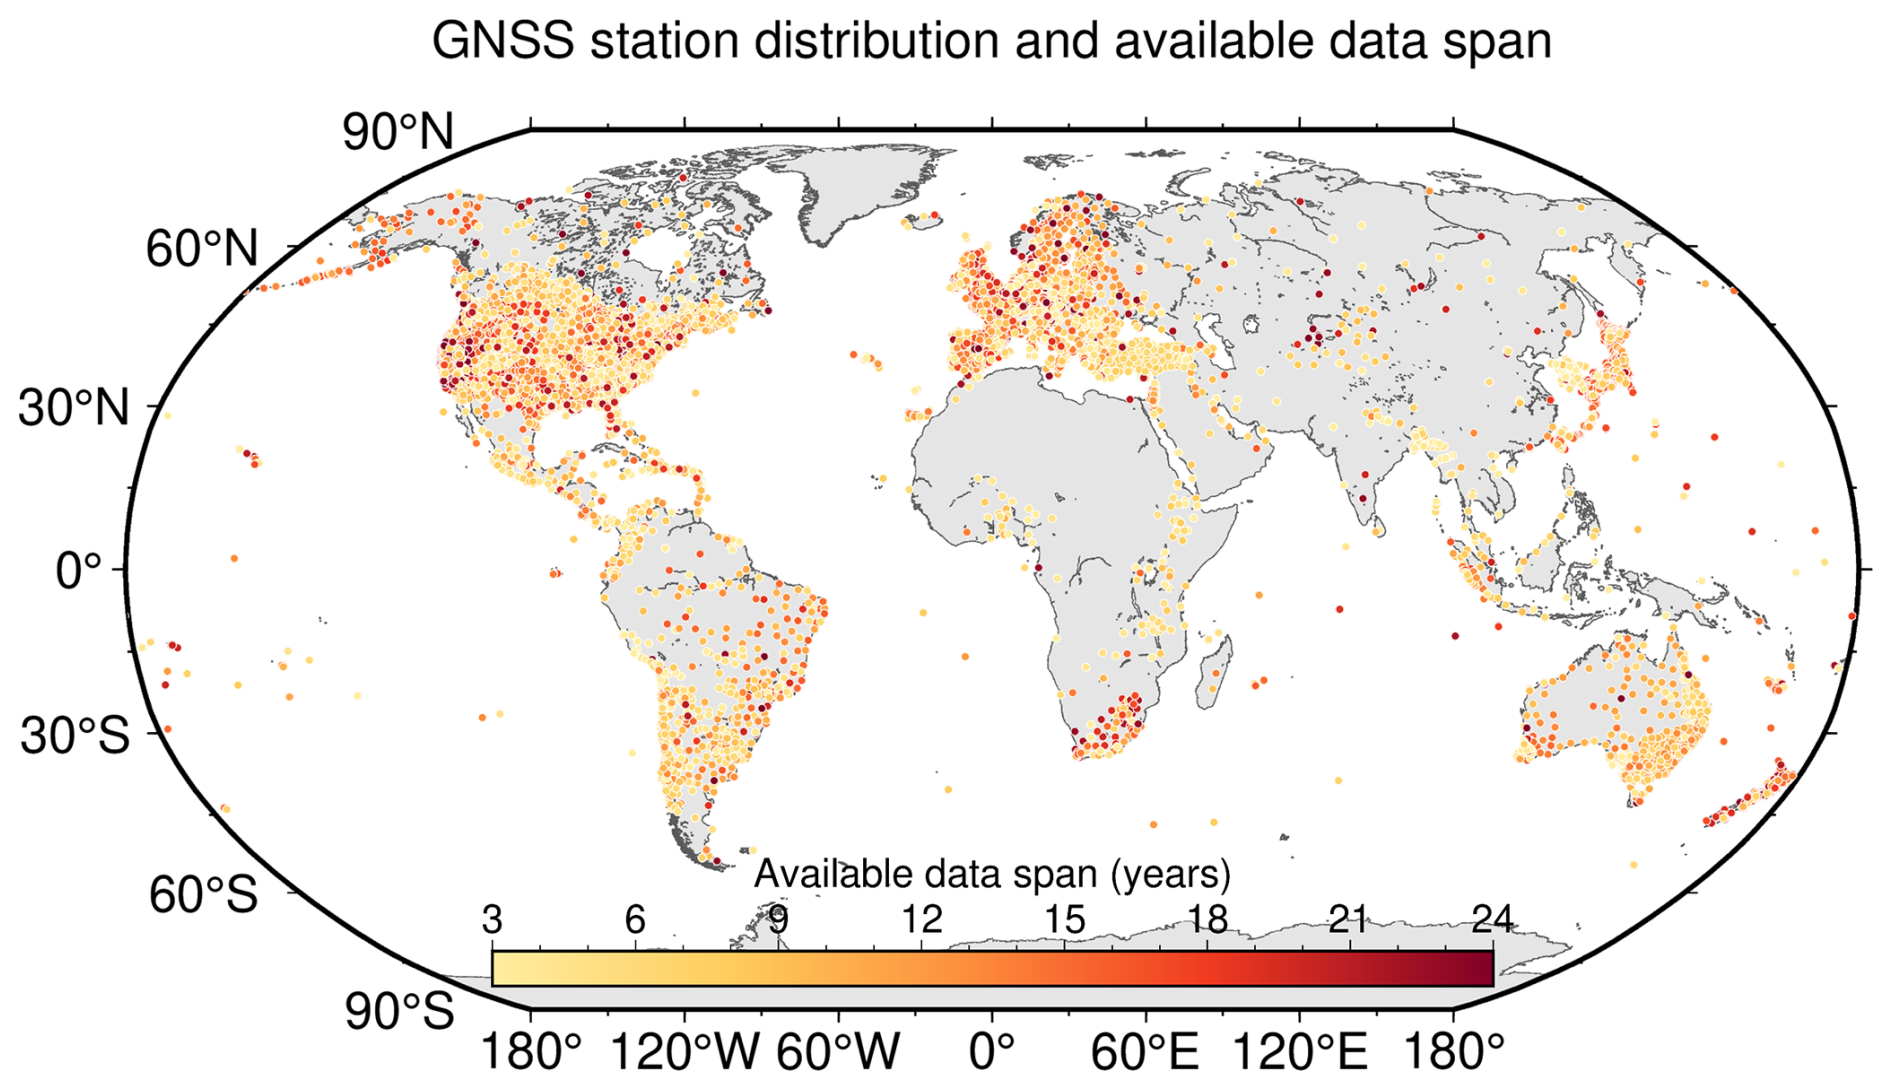
Figure 2Spatial distribution and temporal coverage of GNSS stations.
2.1 GNSS station selection and temporal coverage
The GNSS station information and daily position time series are obtained from global GNSS solutions produced by Nevada Geodetic Laboratory (NGL). These solutions are based on continuous observations from stations in the International GNSS Service (IGS) network together with many regional GNSS networks (Blewitt et al., 2018). For this study, we use stations with at least three years of valid daily coordinate solutions within 2000–2023. This threshold provides a basic requirement for estimating annual and semiannual components, while retaining a sufficiently large station sample for global analysis.
Because the present model requires land-based soil-temperature forcing and shallow subsurface properties, we exclude stations located in Antarctica, Greenland, permanent ice-covered regions, glacier-covered regions, and their surrounding buffer zones. These sites are not included in the released dataset or subsequent statistical analyses because their surface thermal boundary conditions and shallow subsurface properties cannot be reliably represented using the current global input datasets. In contrast, stations located in coastal or lake-side environments are retained as long as valid land-based temperature forcing and subsurface properties are available.
Stations affected by seasonal snow cover are not systematically removed, because doing so would exclude many otherwise useful GNSS stations in northern Europe, Canada, the northern United States, northern Japan, and mountainous regions. Instead, the influence of seasonal snow cover is treated as a source of uncertainty and discussed as a limitation of the current product. After this screening, the dataset contains approximately 14 000 stations distributed across the major ice-free land regions and a wide range of climate settings (Fig. 2). The same screening criteria are applied to all subsequent statistical analyses and figures.
2.2 Temperature forcing data
The temperature-driven thermoelastic deformation is controlled by near-surface temperature perturbations that propagate downward through heat conduction, produce thermal strain, and are converted into vertical elastic displacement at the ground surface. The timing of the temperature forcing is therefore important, especially when daily TED corrections are derived from temperature fields that vary within the day. In this study, soil temperature from ECMWF ERA5 reanalysis is used as the thermal forcing (Hersbach et al., 2018). The shallowest ERA5 soil-temperature layer, representing 0–7 cm depth, is used to prescribe the near-surface upper thermal boundary forcing. Since ERA5 soil temperature is used rather than air temperature, part of the effects associated with surface insulation processes, including seasonal snow cover, is implicitly included in the thermal forcing. However, snow depth and snow thermal properties are not explicitly represented in the current model, which may introduce additional uncertainty in regions with strong seasonal snow cover. ERA5 soil-temperature fields are used on the 0.25° × 0.25° regular latitude–longitude grid. For stations close to coastlines or large lakes, ocean and lake grid cells are not used for the upper-boundary forcing. Only valid land grid cells with soil-temperature values are considered.
To account for within-day temperature variability and reduce the potential aliasing associated with a single globally fixed sampling epoch, the hourly ERA5 soil-temperature record is sampled at four equally spaced epochs per day. The selected 0–7 cm soil temperatures are then used as the upper-boundary forcing at 6 h intervals. This treatment captures the main diurnal-scale variability relevant to daily TED estimates while keeping the global computation tractable. In addition to the 0–7 cm layer, the ERA5 soil-temperature layers at 7–28, 28–100, and 100–289 cm are used as auxiliary information on the subsurface temperature profile and the deeper thermal background (Lu et al., 2026b).
2.3 Layered thermophysical and mechanical properties
Thermal diffusivity controls how temperature variations attenuate and lag with depth, while linear thermal expansion coefficient and elastic parameters control how the resulting thermal strain is converted into surface displacement. To describe the shallow subsurface conditions at each station, we use SoilGrids-derived depth-dependent soil properties (Hengl et al., 2017). SoilGrids provides soil-property predictions for six standard depth intervals: 0–5, 5–15, 15–30, 30–60, 60–100, and 100–200 cm. These layers allow the main vertical variations in shallow soil properties within the upper 2 m to be represented. In this study, we use SoilGrids 2.0, which provides global land soil-property maps at 250 m spatial resolution (Poggio et al., 2021). Ocean and lake areas are not assigned valid SoilGrids values; therefore, for stations close to coastlines or large lakes, only valid land soil-property values are used to construct the layered subsurface column.
For each GNSS station, the SoilGrids-derived depth profiles are extracted and used to estimate the thermophysical parameters required by the model, including thermal conductivity and volumetric heat capacity, from which thermal diffusivity is derived. Elastic and thermoelastic parameters, including Young's modulus, Poisson's ratio, and the linear thermal expansion coefficient, are assigned according to the corresponding material class and then mapped onto the layered structure. Below 2 m, globally consistent high-resolution soil-property information is not available from SoilGrids. The use of 2 m as the lower limit of the SoilGrids-derived layers therefore reflects the depth range of the available global soil dataset, rather than an assumption that thermoelastic effects vanish below this depth. In the model, the medium below 2 m is represented by a homogeneous bedrock background with prescribed thermal and elastic properties. This treatment preserves the shallow-layer contrasts represented by SoilGrids while using a simplified description of the deeper thermal and elastic background.
It should be noted that SoilGrids does not provide globally consistent and reliable shallow subsurface properties beneath ice sheets, glaciers, or ice shelves. Stations located in these regions and their surrounding buffer zones are therefore excluded from the released dataset and the subsequent statistical analyses. The present subsurface parameterization also does not explicitly include time-varying soil moisture. Because soil moisture can modify thermal conductivity, volumetric heat capacity, and effective thermal diffusivity, its influence is treated as a source of uncertainty and is partly reflected in the parameter-sensitivity tests.
2.4 Thermoelastic displacement modelling
We compute temperature-driven vertical TED using FEMFL. The detailed formulation and numerical implementation of FEMFL are described in Lu et al. (2026b); here we summarize the main settings used to generate the global TED dataset. For each GNSS station, the shallow subsurface is represented by a one-dimensional, vertically layered soil–bedrock column. The model is run independently for each station and does not use a horizontal finite-element mesh, so the spatial sampling of the dataset is determined by GNSS station locations. The layered column consists of SoilGrids-derived layers in the upper 2 m and a homogeneous bedrock background below. The thermophysical, elastic, and thermoelastic parameters of each layer are assigned using the SoilGrids-based parameterization described in Sect. 2.3 and are assumed to be uniform within each layer. The half-space is assigned prescribed thermal and elastic properties and represents the deeper thermal and elastic background where globally consistent station-scale stratigraphic information is not available.
The released TED product represents subsurface thermoelastic deformation only. It does not include thermal expansion of the above-ground structures, such as concrete pillars, steel masts, rooftop monuments, buildings, or antenna-support structures. These monument-related effects can be important at individual stations and have been reported in previous studies (e.g., Romagnoli et al., 2003; Yan et al., 2009, 2010; Lu et al., 2026b). They are not included in this release because globally complete information on monument height, material, geometry, anchoring condition, and local thermal environment is not available for most GNSS stations. The TED series should therefore be interpreted as a subsurface thermoelastic correction, rather than a complete correction for all temperature-related site effects.
The thermal part of the model is based on one-dimensional transient heat conduction. Temperature and heat flux are continuous across layer interfaces. The upper boundary temperature is prescribed using ERA5 soil-temperature forcing, while the lower boundary represents a stable deep thermal background and reduces boundary effects associated with the finite model depth. The model is driven at 6 h intervals, so within-day temperature variations can be considered while the final product remains a daily TED time series. As an order-of-magnitude estimate, the characteristic thermal penetration depth can be approximated by , where κ is thermal diffusivity and P is the forcing period. For typical near-surface diffusivities of 0.3 × 10⁻⁶ to 1.0 × 10⁻⁶ m2 s−1, diurnal temperature variations mainly affect the upper 0.1–0.2 m, whereas annual temperature variations can reach about 1.7–3.2 m. The SoilGrids-based layering in the upper 2 m therefore captures the main shallow subsurface contrasts, while deeper annual-scale thermal effects are represented in a simplified way by the homogeneous bedrock half-space. In the mechanical part of the model, temperature changes produce thermal strain within each layer, and the finite-element system is solved to obtain the corresponding vertical displacement at the ground surface. To reduce the influence of uncertain initial deep-temperature conditions, a spin-up calculation is applied before generating the final TED series for 2000–2023.
GNSS coordinate time series are typically provided at daily resolution, whereas near-surface temperature and the resulting thermoelastic response depend strongly on local solar time. If temperature forcing is sampled at only one fixed epoch, stations at different longitudes correspond to different local times, and part of the diurnal temperature signal may be aliased into longer-period components. To reduce this effect, FEMFL is driven by ERA5 soil-temperature forcing sampled at 00:00, 06:00, 12:00, and 18:00 UTC, producing four TED realizations for each station. Each realization is decomposed into annual, semiannual, and residual components. The annual and semiannual components are averaged using amplitude–phase vectors to treat the cyclic nature of phase consistently and to preserve the mean magnitude and timing of the seasonal signal. The residual component is averaged from the four 6 h samples within each day. The final daily TED series is obtained by adding vector-averaged harmonic component and the daily averaged residual component, producing a correction series compatible with daily GNSS height time series.
2.5 Model performance metrics
To consistently quantify the key amplitude characteristics of the TED product and its correction impact on GNSS vertical time series, we compute the annual-cycle amplitude and phase, the nonseasonal variability, and the WRMS improvement of GNSS residuals. For each TED series u(t), we fit an annual and semiannual harmonic model with a linear term:
where a0 is the constant term, b is the linear term, ω1 and ω2 correspond to the annual and semiannual frequencies, respectively, and ϵ(t) denotes the residual. The annual amplitude and phase are defined as:
To quantify the remaining variability after removing linear term and the annual/semiannual harmonics, let denote the fitted reconstruction. The residual is , and the nonseasonal variability is measured by the root-mean-square (RMS) of r(t):
where N is the number of valid samples.
For the GNSS height time series x(t), we quantify scatter using the weighted root-mean-square (WRMS):
where the weights are ; when observation uncertainties are unavailable, we use equal weights (ωi=1). The WRMS reduction rate is defined as:
where WRMSraw and WRMScorr denote the WRMS of the original GNSS vertical time series and the WRMS after applying the TED correction alone, respectively.
In the parameter-sensitivity analysis, we apply a ± 10 % relative perturbation to a selected key parameter at each station and recompute TED. The difference between the perturbed and baseline solutions in the annual cycle is then quantified as:
where the perturbed and baseline solutions are compared in terms of their annual-cycle amplitude and phase. For summary statistics, we use the absolute amplitude and phase differences to represent the sensitivity magnitude.
This section presents the main results and technical evaluation of the FEMFL-derived TED product. We first describe the spatial and temporal characteristics of the TED time series and compare their amplitudes with above-ground monument thermal expansion, non-tidal loading displacements, and the traditional homogeneous FEM solution. We then assess the stability and internal consistency of the product using comparisons with site-information-constrained FEMFL solutions, parameter perturbation tests, and spectral diagnostics. Finally, we examine the effect of TED on GNSS height time series through TED-only WRMS changes.
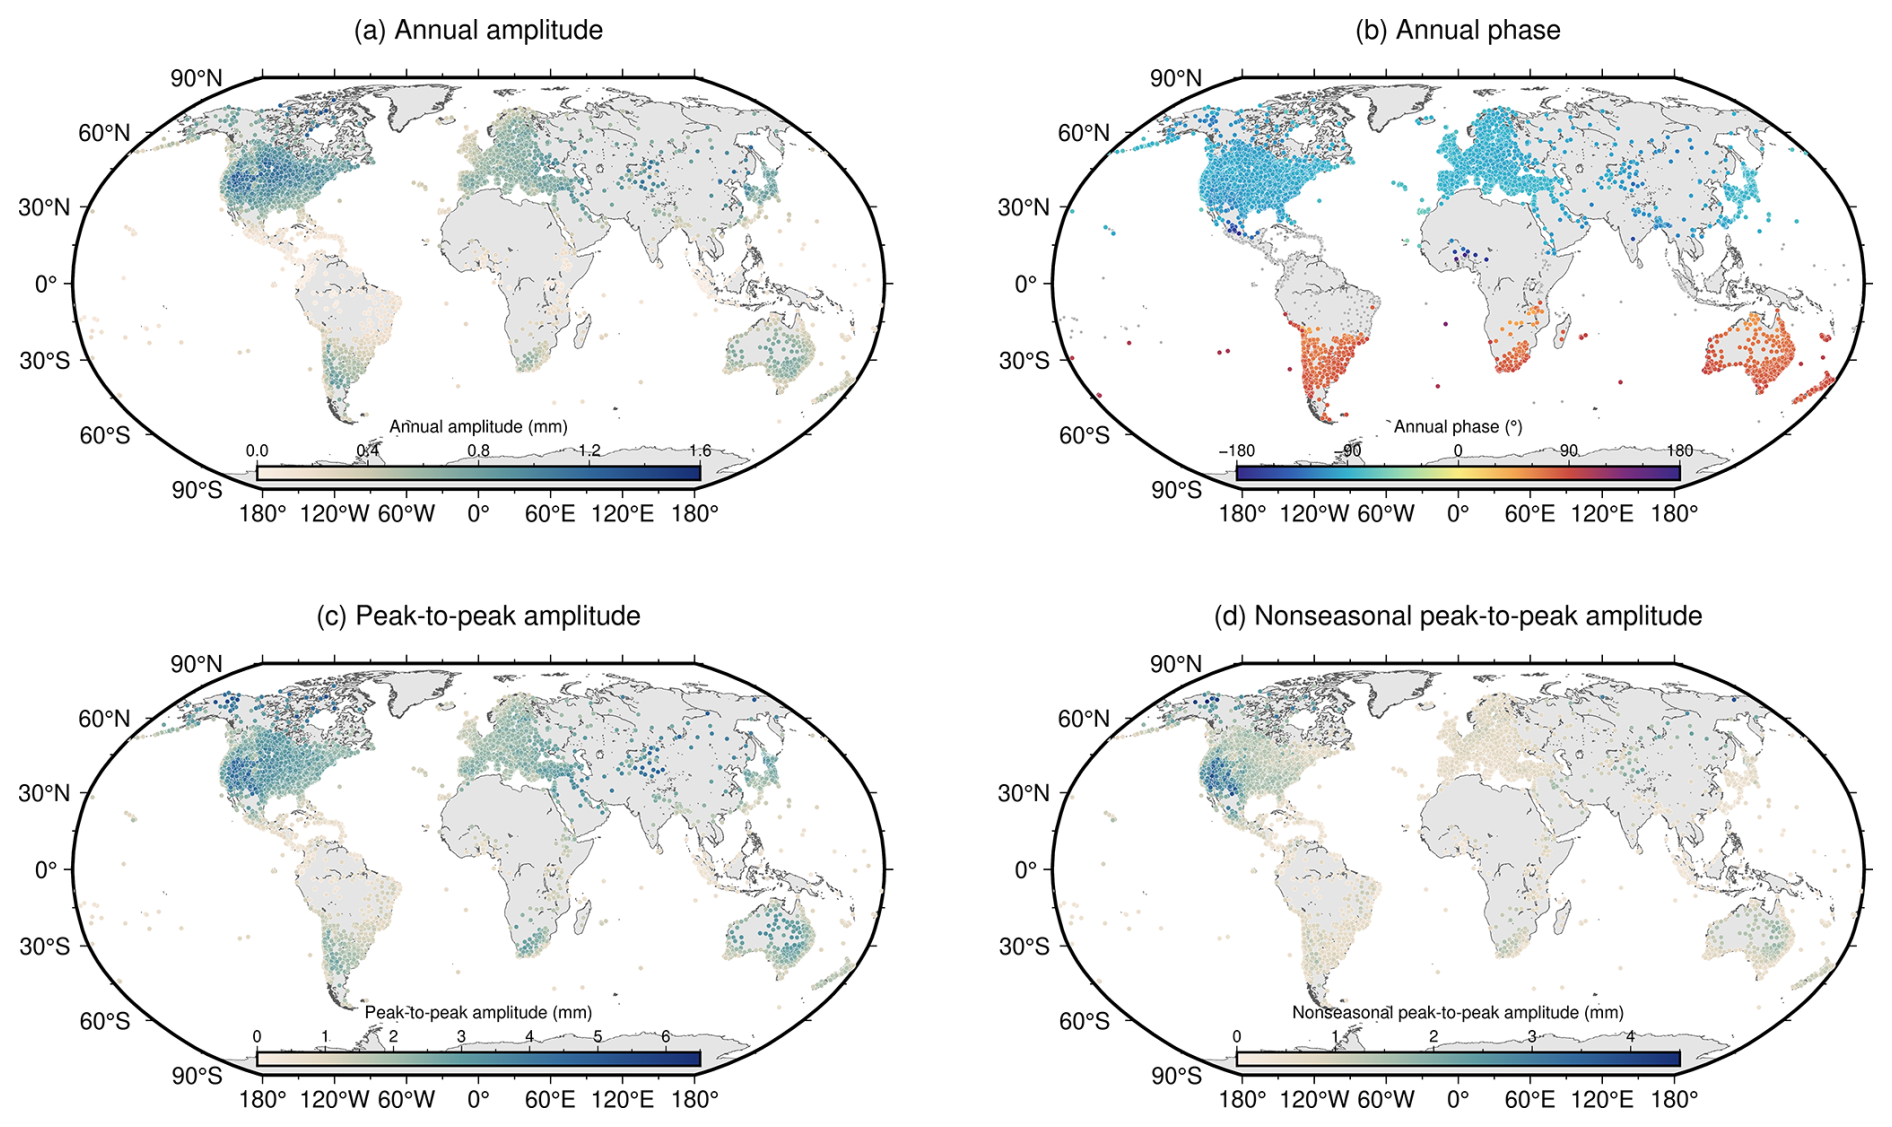
Figure 3Station-based characteristics of the FEMFL TED product: (a) annual amplitude, (b) annual phase, (c) percentile-based peak-to-peak variability of the full daily TED series, and (d) nonseasonal variability after removing the linear term and annual and semiannual harmonics.
3.1 Thermoelastic displacement characteristics
The station-based characteristics of the FEMFL TED product are shown in Fig. 3. The annual amplitudes are mostly within about 0.2–1.2 mm, with locally larger values exceeding 1.5 mm in regions with strong seasonal temperature contrasts. Relatively large signals are mainly found in mid-latitude continental areas, including parts of North America, Europe, East Asia, and Australia, whereas humid maritime regions and low-latitude areas generally show weaker annual responses. The annual phase shows a clear hemispheric contrast, consistent with the opposite seasonal heating cycles in the Northern and Southern Hemispheres. In addition to the fitted annual component, we use the difference between the 95th and 5th percentiles of the full daily TED series to describe the robust peak-to-peak variability. This metric reduces the influence of occasional extreme values while retaining the main range of the modelled displacement. The robust peak-to-peak variability commonly reaches 2–4 mm in continental regions and locally approaches 5–6 mm. After removing linear term and the annual and semiannual harmonics, the remaining nonseasonal TED variability is mostly below 1 mm, but can locally reach millimetre level. These results indicate that the TED product is dominated by annual signal at most stations, while nonseasonal variability remains detectable in some regions.
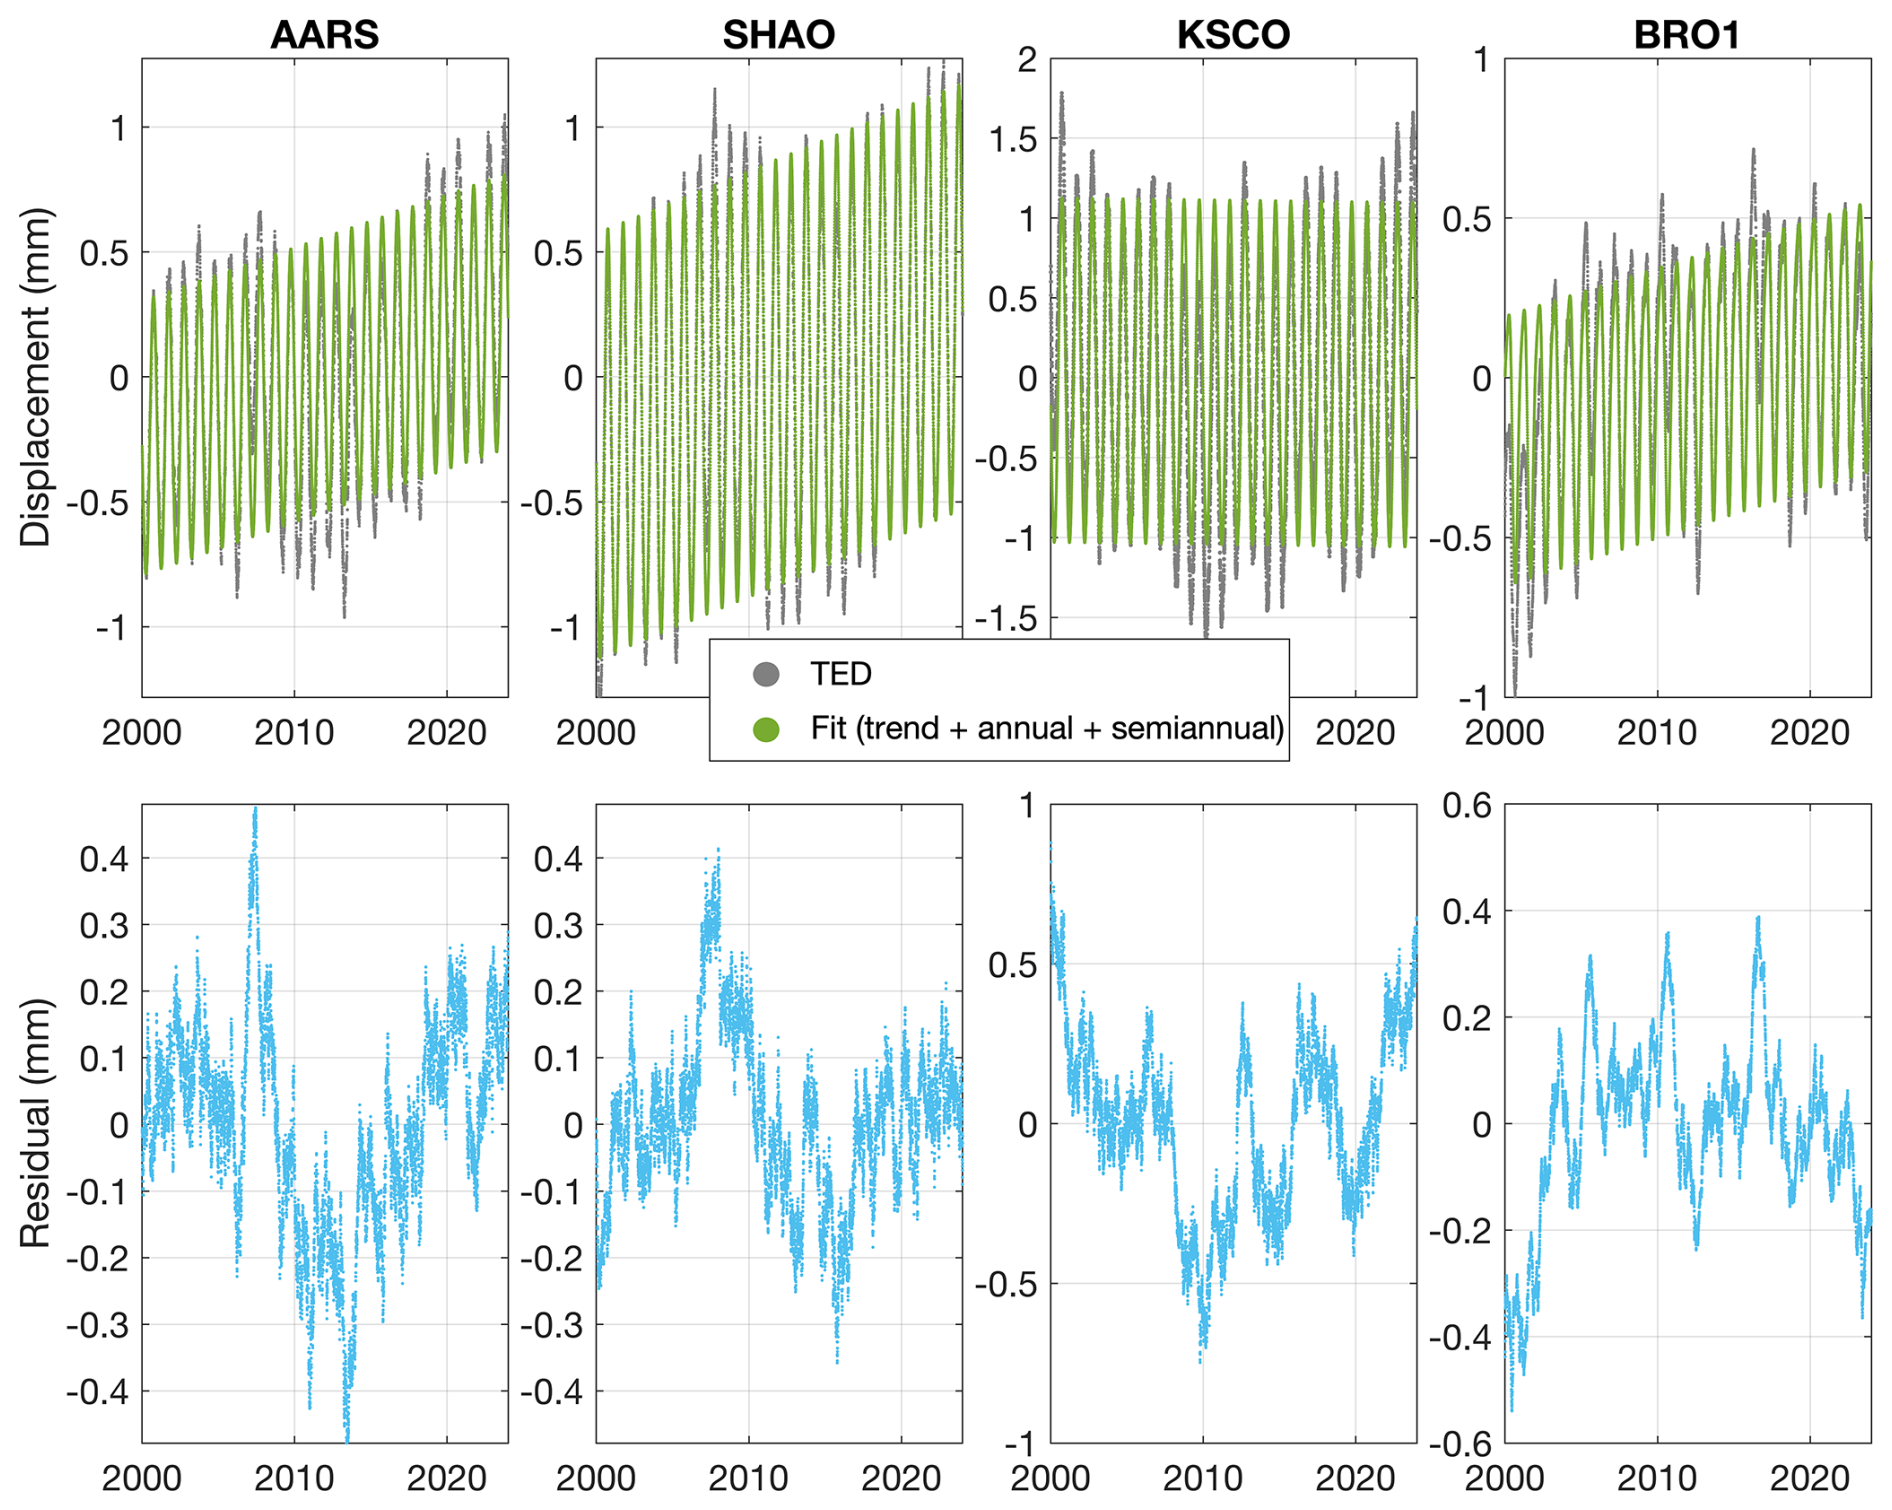
Figure 4Examples of vertical TED time series at four representative GNSS stations. The upper panels show the daily FEMFL TED series together with the fitted linear, annual, and semiannual components. The lower panels show the residuals after removing these fitted components.
The temporal behaviour of TED is further illustrated using four representative stations, AARS, SHAO, KSCO, and BRO1 (Fig. 4). These examples show that the modelled displacement is generally dominated by a clear seasonal cycle, with nonseasonal variations superimposed on the annual signal. The linear, annual, and semiannual terms describe the dominant seasonal structure of the TED series, while the residuals retain variability that is not represented by these fitted components. The peak-to-trough displacement reaches about 1–2 mm at AARS, SHAO, and BRO1, and is larger at KSCO. After removing the fitted components, the residual TED is generally below 1 mm, with some variations approaching 0.5–1.0 mm. These examples show that the released product contains both the dominant seasonal thermoelastic response and smaller nonseasonal components.
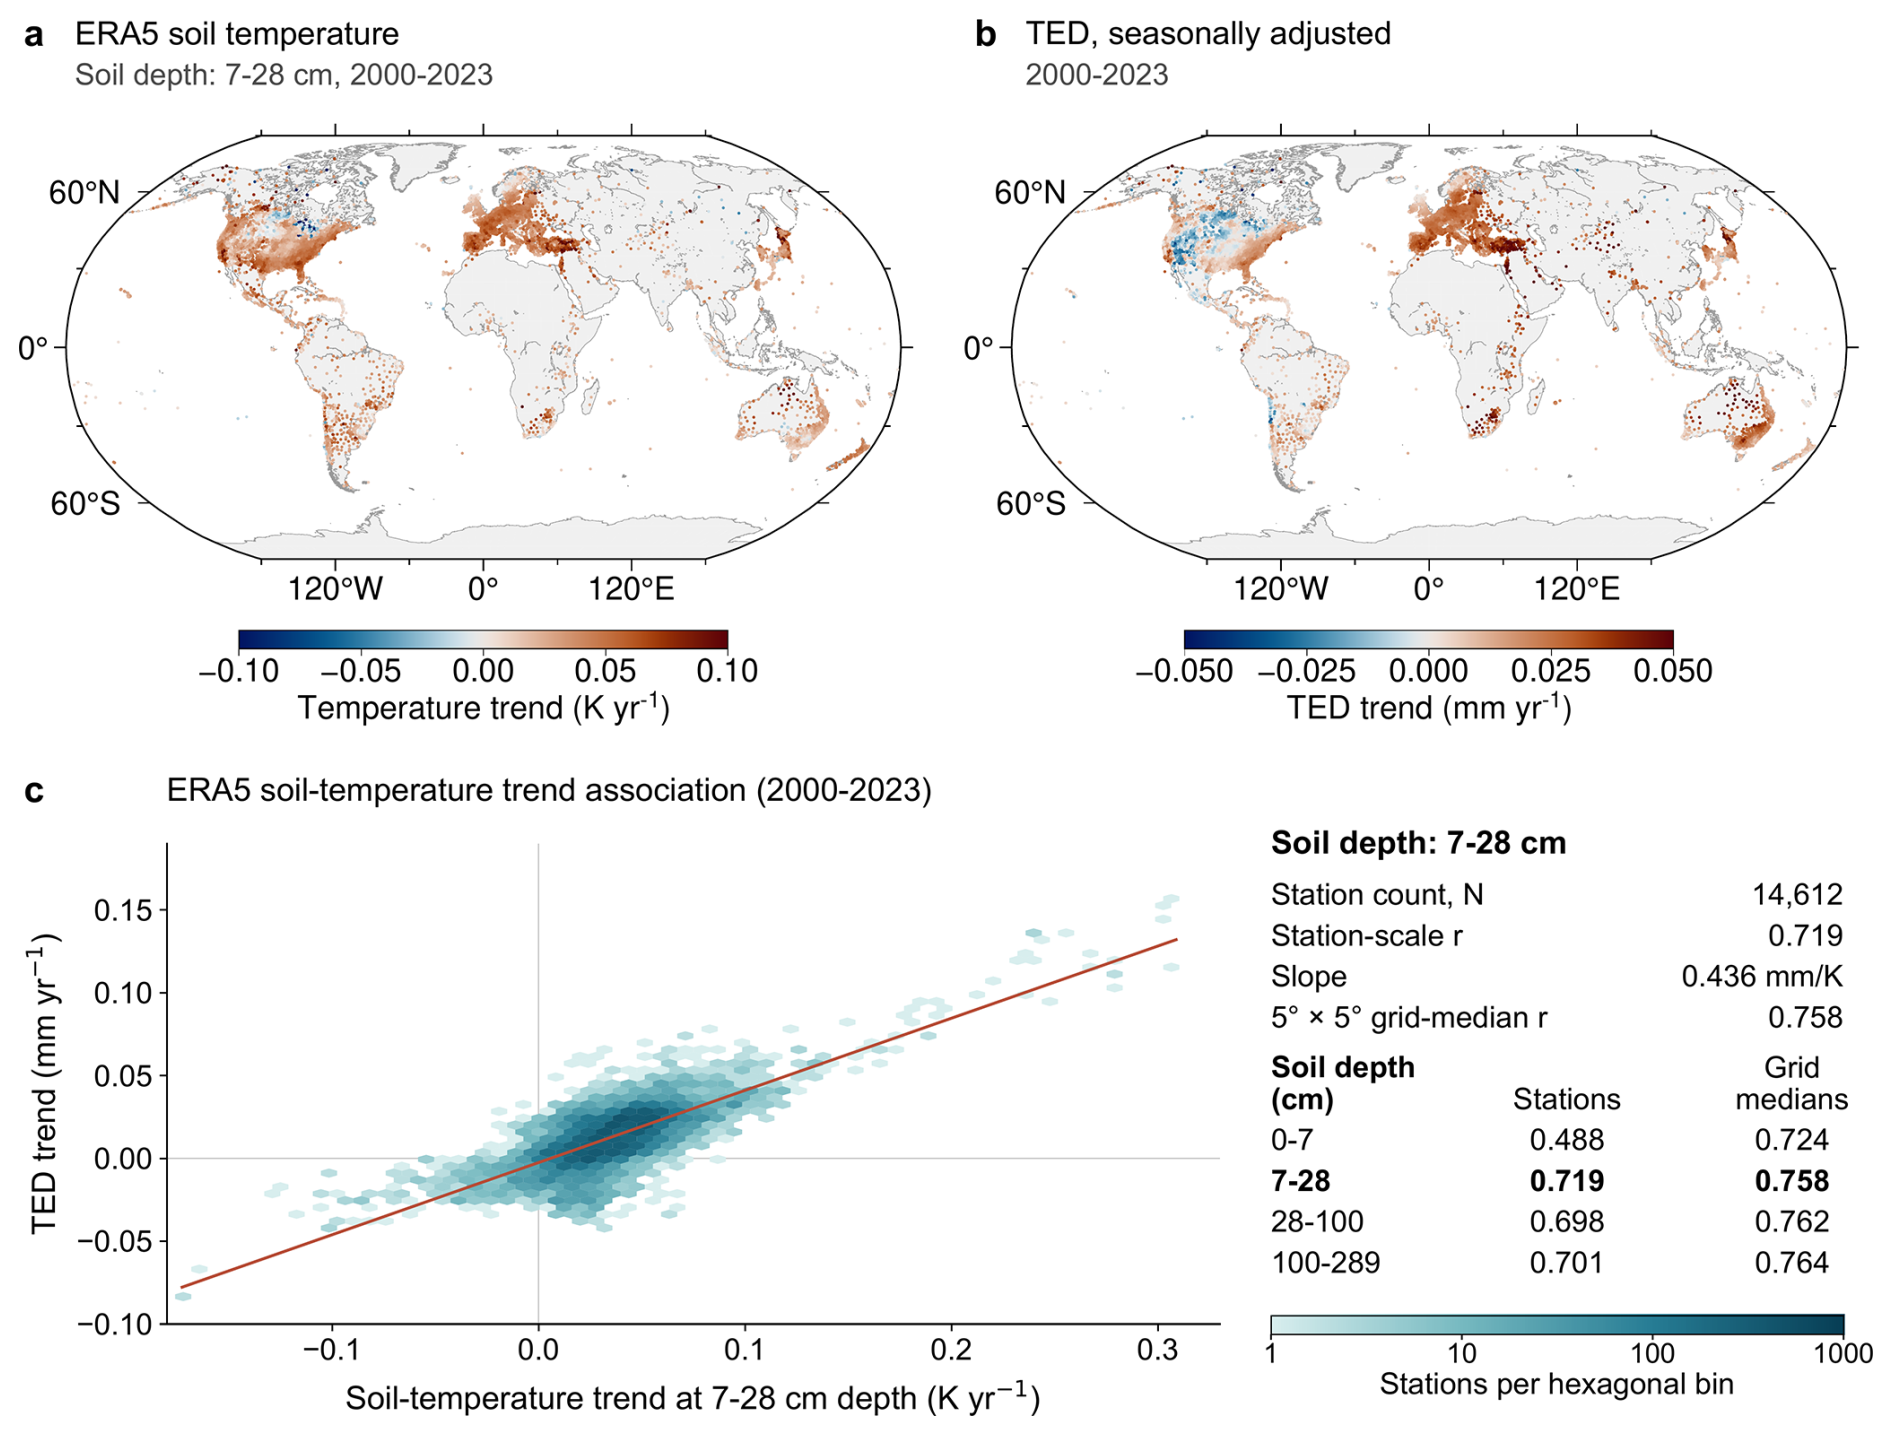
Figure 5Relationship between low-frequency TED variations and ERA5 soil-temperature trends. (a) Linear trends of ERA5 soil temperature at 7–28 cm depth during 2000–2023. (b) Linear trends of TED after removing the annual and semiannual components. (c) Relationship between soil-temperature trends and TED trends at GNSS stations. The table in panel (c) summarizes Pearson correlation coefficients for the four ERA5 soil-temperature layers at the station and 5° × 5° grid-cell scales.
The representative time series in Fig. 4 also show low-frequency variations that appear as trend-like signals over 2000–2023. To examine the possible origin, Fig. 5 compares the long-term trends in ERA5 soil temperature with those in the TED series. The spatial pattern of TED trends is broadly consistent with that of the ERA5 soil-temperature trends, particularly over continental regions with pronounced temperature variations. Among the four ERA5 soil-temperature layers, the 7–28 cm layer shows the strongest station-scale relationship with TED trends (Pearson r = 0.719). This relationship becomes slightly stronger when using 5° × 5° grid-cell median values (r = 0.758). These results suggest that the low-frequency variations in TED mainly reflect the long-term variability of the temperature forcing and the associated subsurface thermal response, rather than being dominated by numerical artefacts.
Figure 6 compares the annual amplitude of TED with monument thermal expansion and non-tidal loading displacements. The median annual amplitude is about 0.50 mm for the traditional homogeneous FEM solution and about 0.71 mm for the FEMFL product, indicating that introducing depth-dependent subsurface properties generally increases the annual TED amplitude. The FEMFL TED amplitude is comparable to monument thermal expansion, whose median value is about 0.40 mm for stations with available monument information. Compared with non-tidal loading, TED is generally smaller than hydrological loading, but its annual amplitude overlaps with the lower-to-middle ranges of NTOL and NTAL. These comparisons suggest that TED is a small but measurable correction component for high-precision GNSS height analysis.
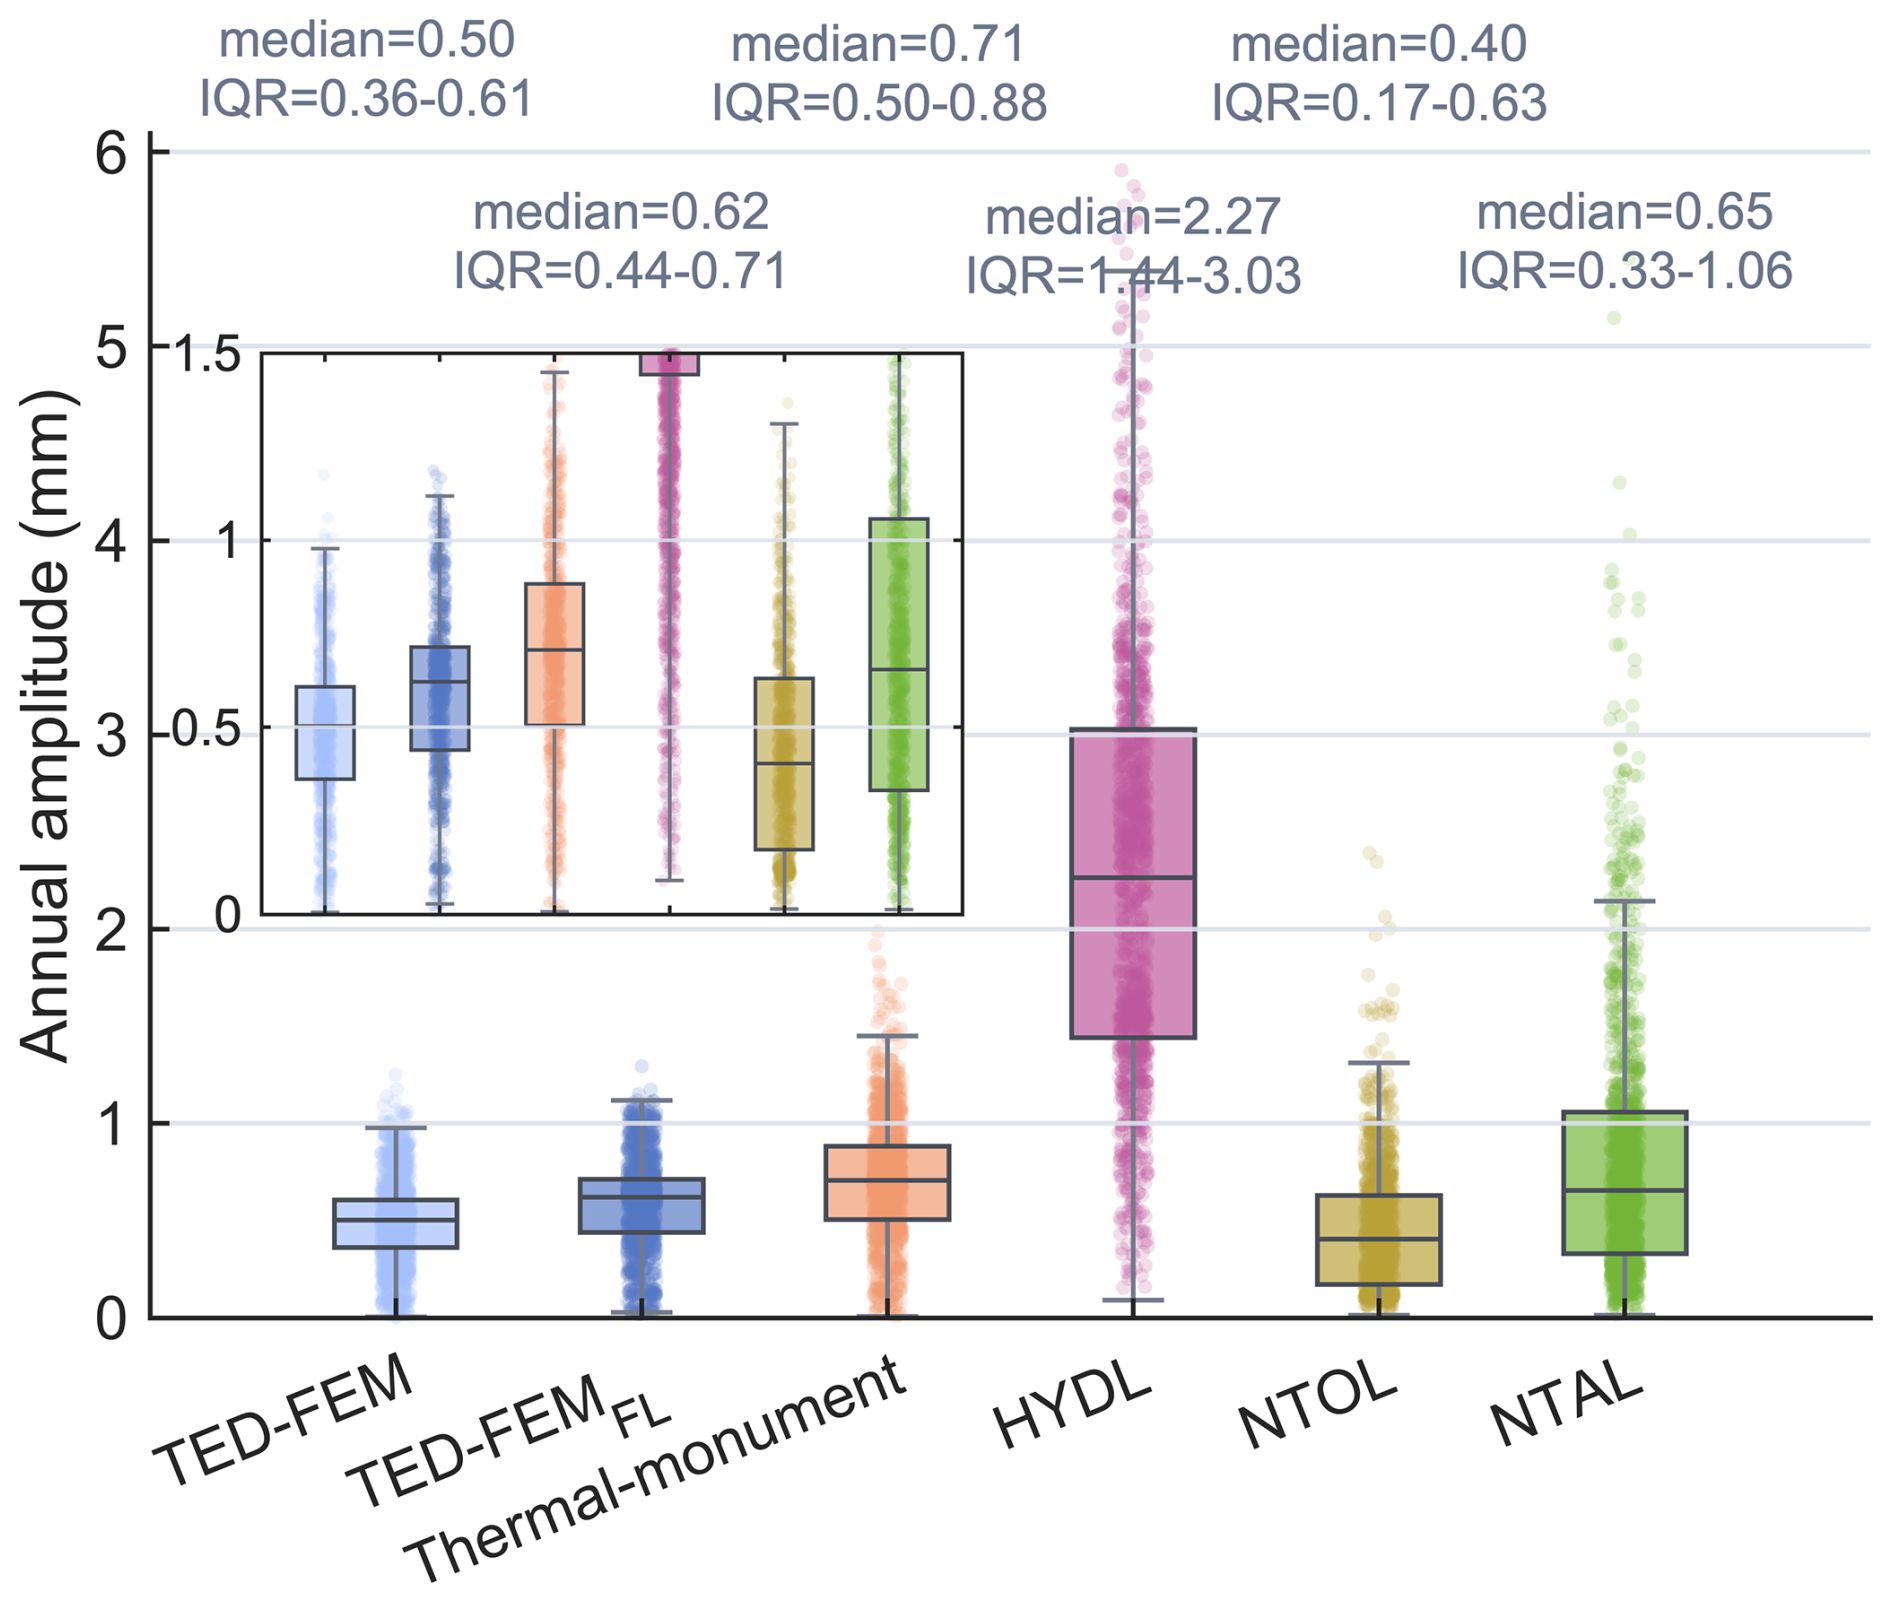
Figure 6Comparison of annual vertical displacement amplitudes from TED, monument thermal expansion, and non-tidal loading at 2612 GNSS stations with documented monument information. TED-FEM denotes the traditional homogeneous FEM solution, while TED-FEMFL denotes the FEMFL solution used for the released TED product. Thermal-monument denotes above-ground monument thermal expansion estimated from the available monument information. HYDL, NTOL, and NTAL denote hydrological, non-tidal oceanic, and non-tidal atmospheric loading displacements, respectively. The inset plot provides a magnified view of the annual amplitudes of TED and monument thermal expansion.
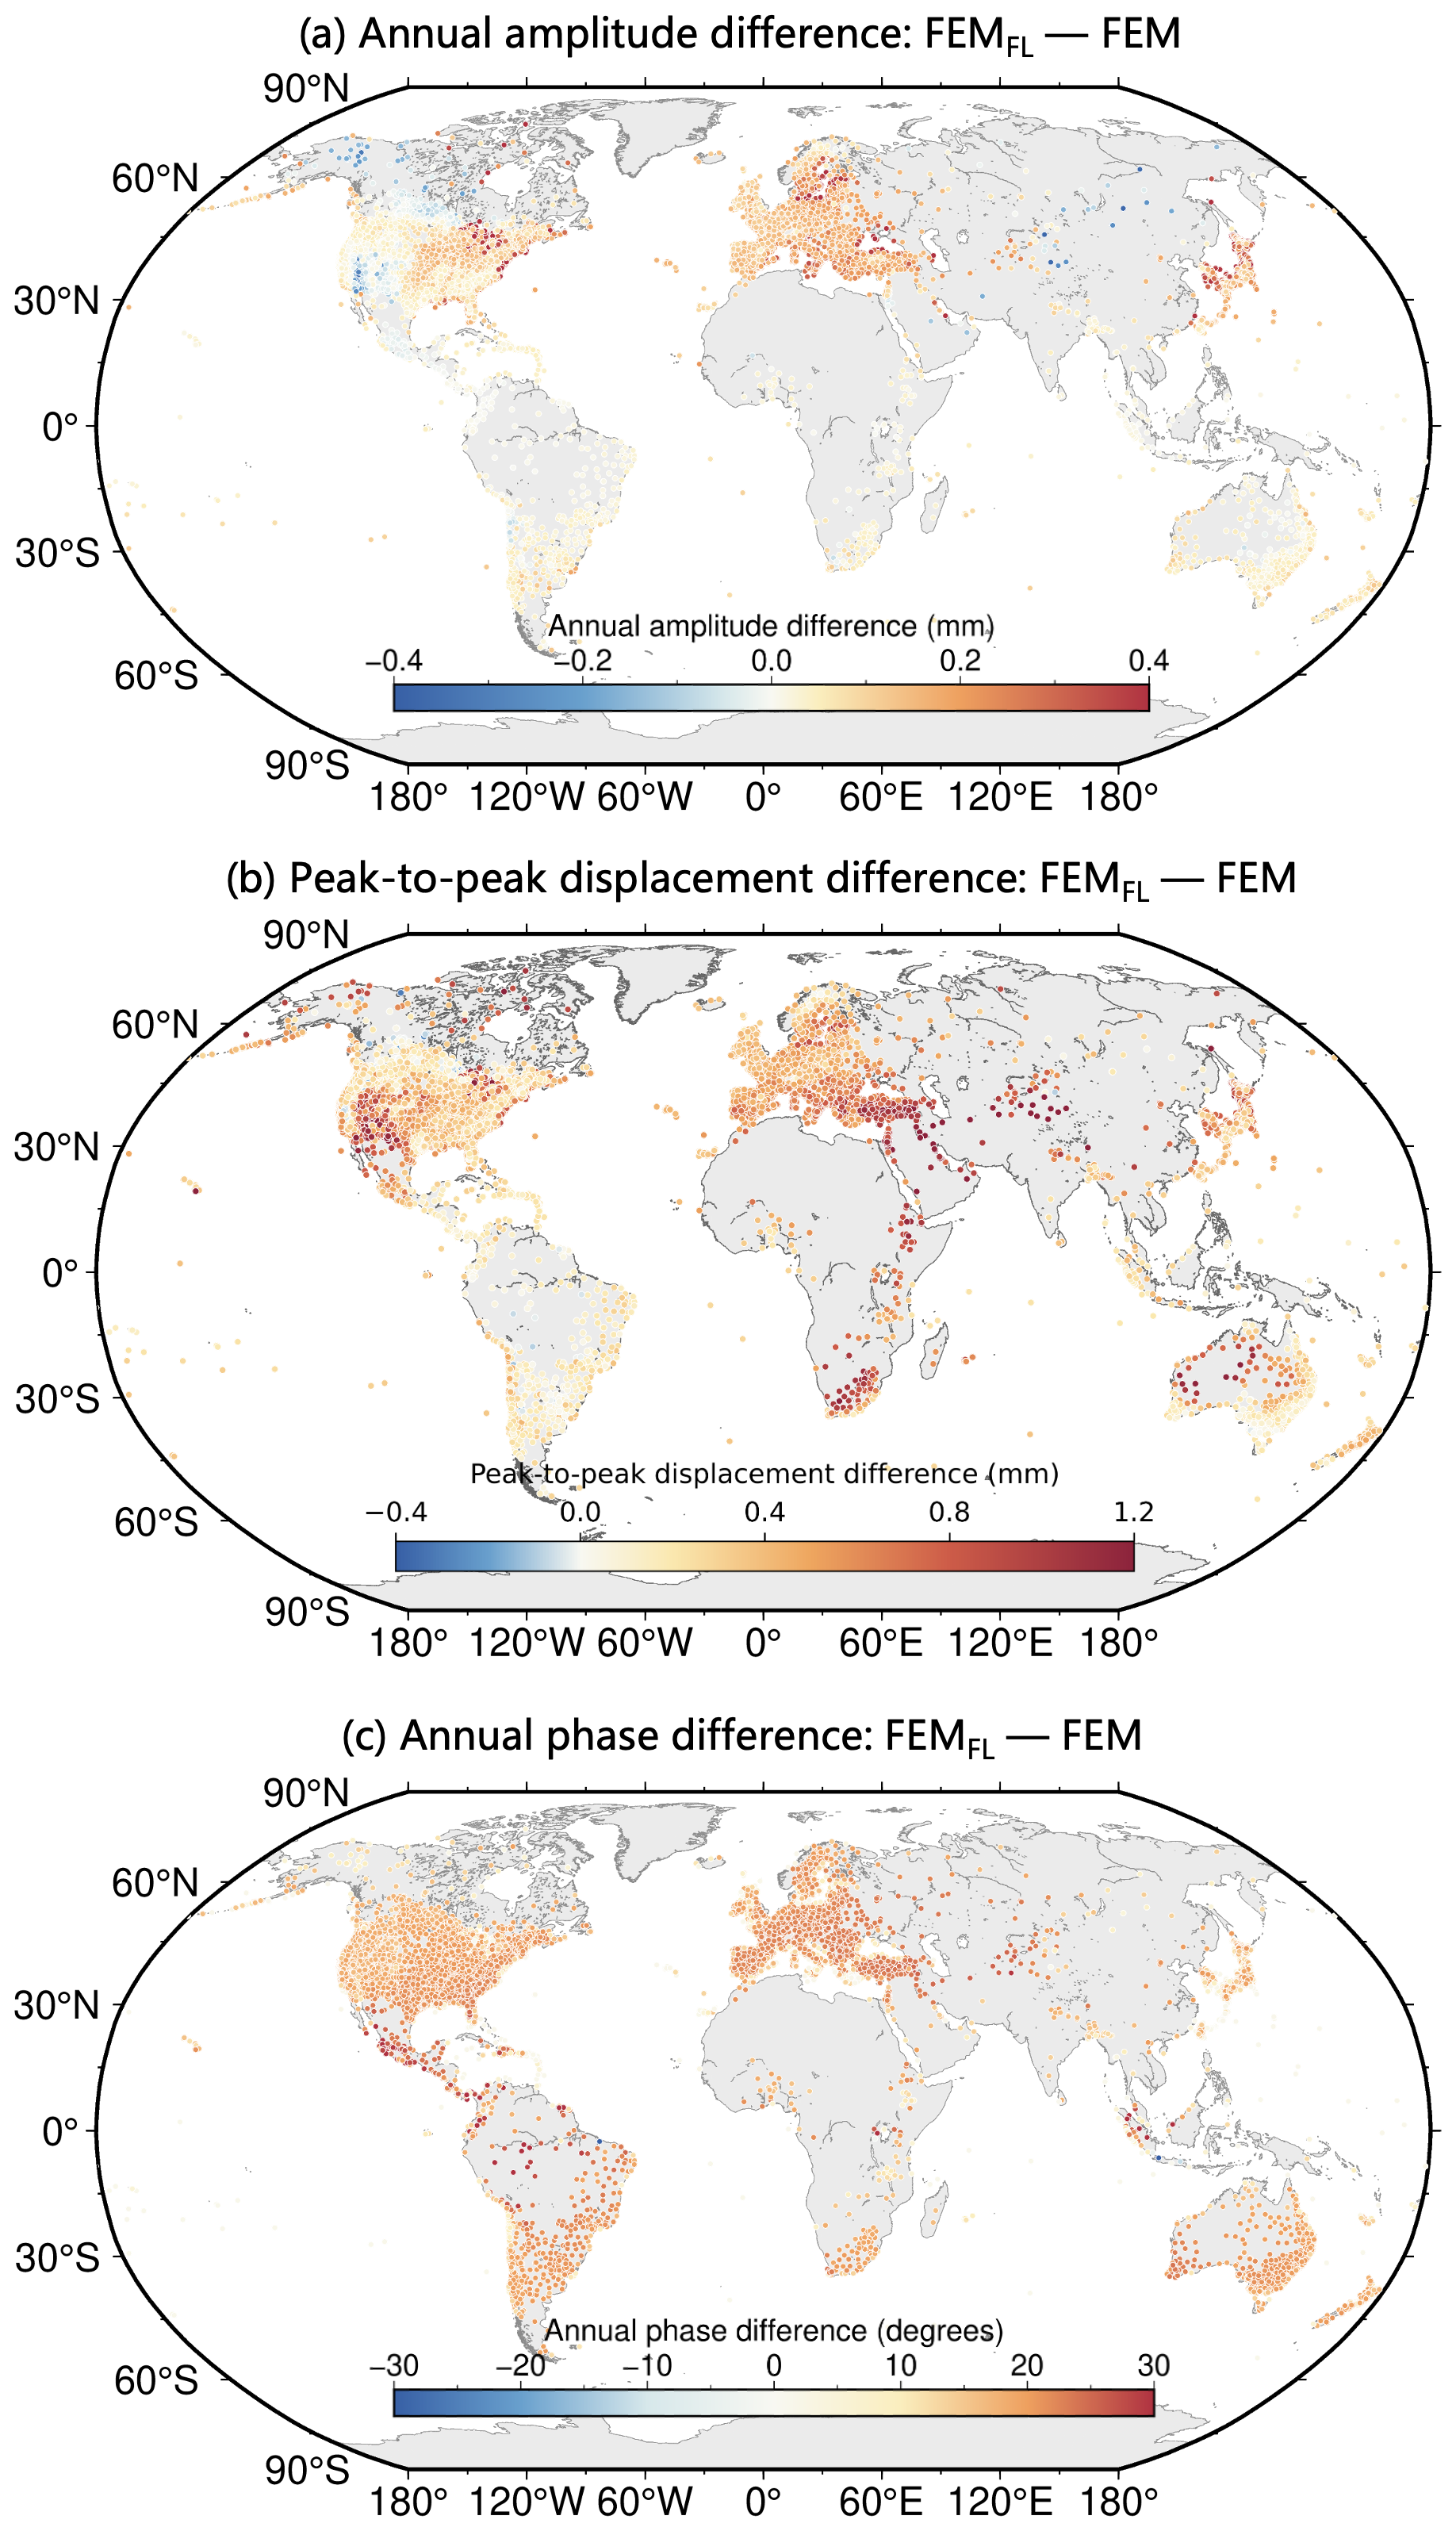
Figure 7Station-based differences between the FEMFL TED product and the traditional homogeneous FEM solution. Panels (a–c) show the differences in annual amplitude, percentile-based peak-to-peak displacement, and annual phase, respectively.
The boxplot comparison in Fig. 6 shows the overall amplitude difference between FEM and the FEMFL solutions. To further examine how these differences are distributed spatially, Fig. 7 maps the station-by-station differences in annual amplitude, robust peak-to-peak variability, and annual phase. Both solutions use the same temperature forcing and temporal sampling strategy, so their differences mainly reflect the effect of introducing depth-dependent thermophysical, elastic, and thermoelastic properties. The annual-amplitude difference, defined as FEMFL minus homogeneous, is generally within about ± 0.2 mm at most stations, but locally reaches 0.3–0.4 mm. The peak-to-peak displacement difference shows a similar spatial pattern, suggesting that subsurface layering affects not only the annual component but also the overall range of the TED series. The annual-phase difference is expressed as the minimum angular difference between two solutions and is mostly within several tens of degrees. These spatially coherent differences indicate that subsurface layering modifies both amplitude and the timing of TED, especially in regions where shallow soil–bedrock contrasts are more pronounced.
3.2 Technical evaluation of the TED dataset
The TED dataset is evaluated here from three aspects: influence of the SoilGrids-based subsurface parameterization, sensitivity to key thermal and elastic parameters, and spectral behaviour of the modelled time series. These tests are intended to assess the stability and internal consistency of the released TED product. They should not be interpreted as an independent validation of the FEMFL model itself, because the same modelling framework is used in the comparisons. All evaluations in this section use the updated station set after applying the screening criteria described in Sect. 2.1.
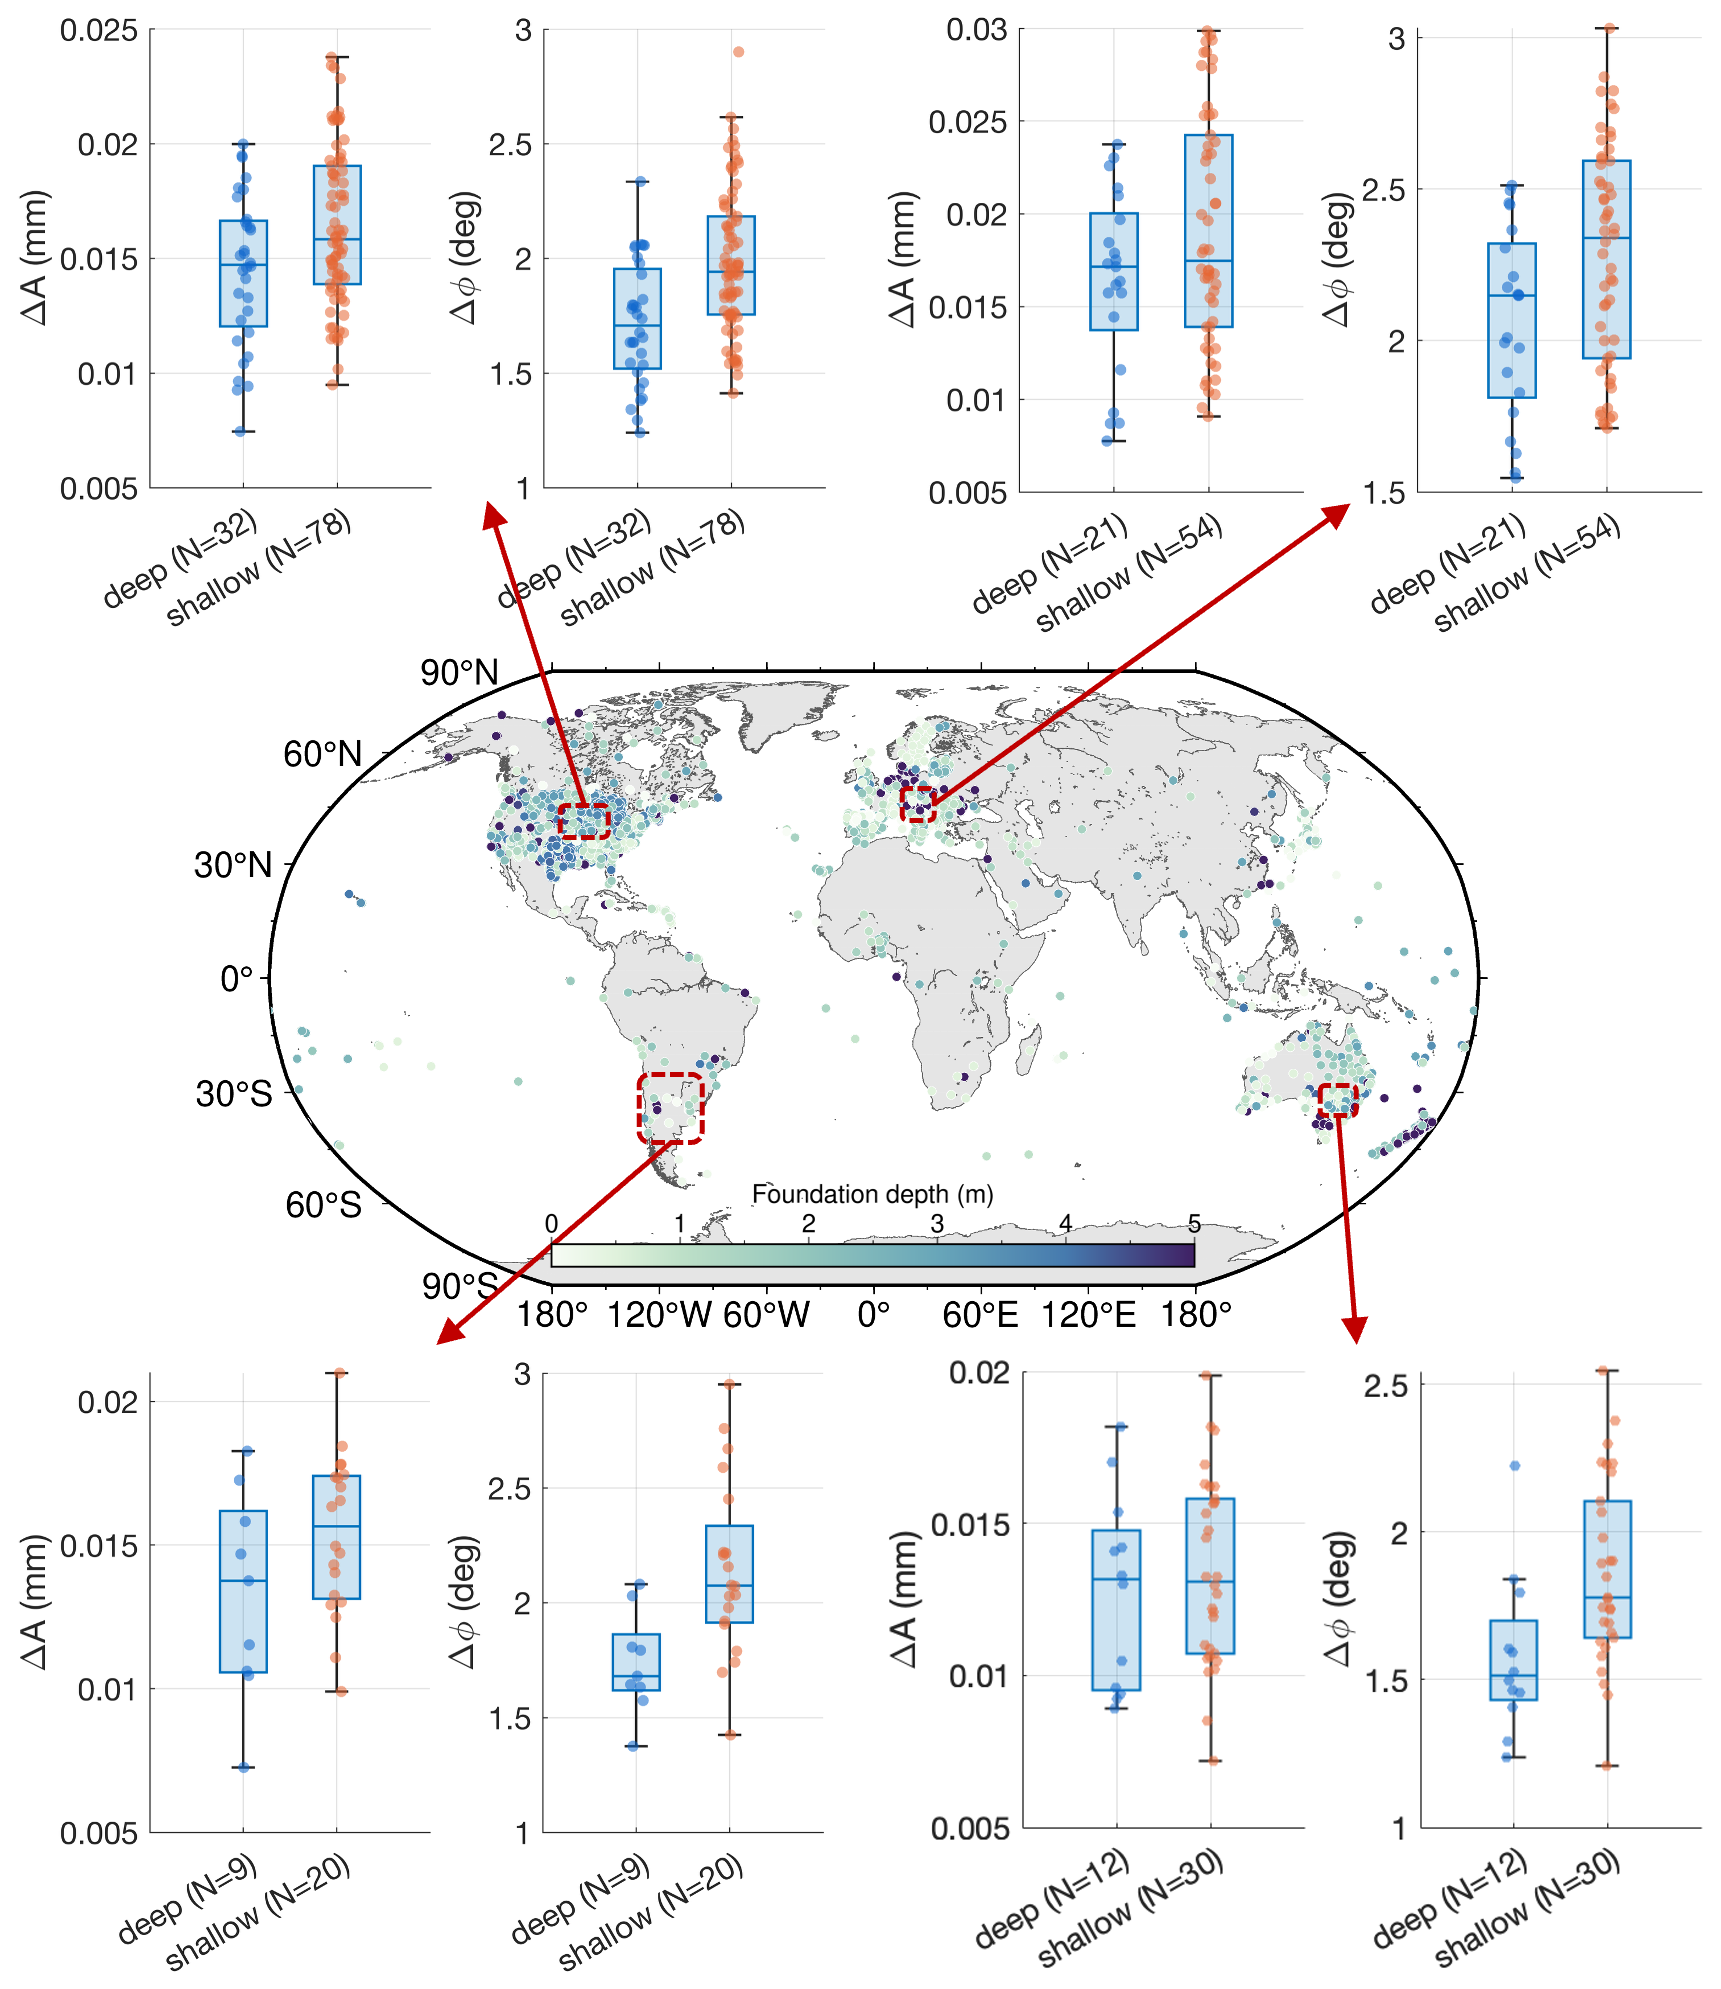
Figure 8Effect of SoilGrids-based subsurface parameterization on TED estimates. The map shows spatial distribution of the 2612 stations with documented foundation-depth information. The inset box-and-scatter plots compare the annual-amplitude and annual-phase differences between SoilGrids-based and site-information-constrained FEMFL solutions for shallow- and deep-foundation groups in selected regions.
Figure 8 examines the effect of using SoilGrids as the global source of shallow subsurface information. For the 2612 stations with documented foundation-depth information, FEMFL solutions generated with SoilGrids-based parameters are compared with solutions constrained by the available site information. These stations are mainly distributed in North America, Europe, Australia, and parts of South America, where foundation records are relatively complete. The resulting differences are small: annual-amplitude differences are mostly about 0.01–0.03 mm, and annual-phase differences are generally within about 1–3°. Stations with shallow foundations show slightly larger differences than those with deeper foundations, which is expected because they are more directly affected by near-surface temperature variations. Overall, these differences are much smaller than the typical annual TED signal, suggesting that the SoilGrids-based parameterization introduces limited uncertainty in the modelled annual cycle for these stations.
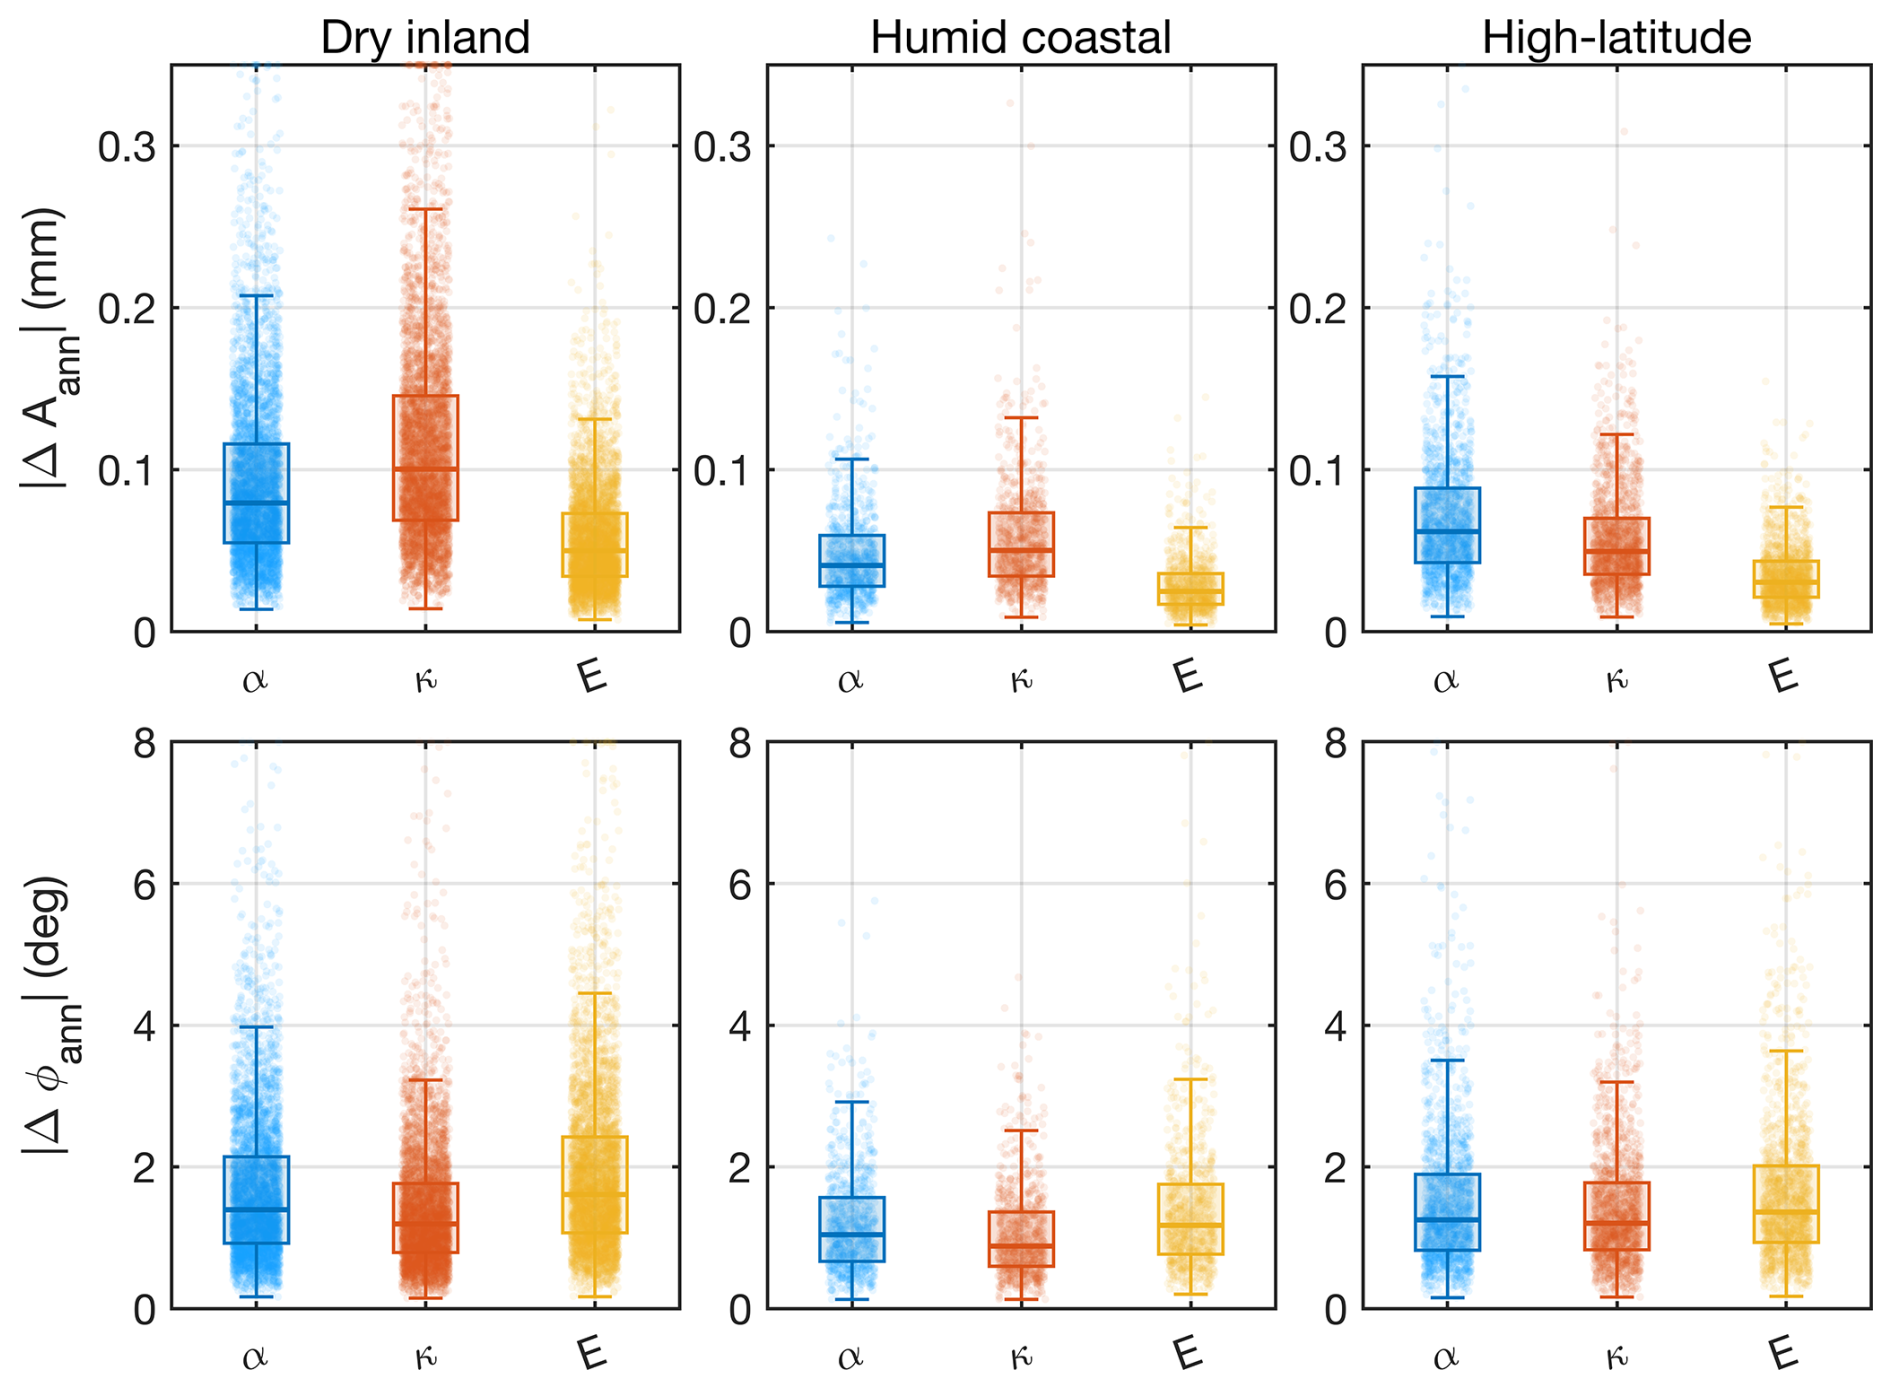
Figure 9Sensitivity of the annual TED cycle to ± 10 % perturbations in key parameters. Box-and-scatter summaries are shown for three regional groups: arid interior, humid coastal, and high latitude (defined as stations with absolute latitude ≥ 60°). The tested parameters are α (linear thermal expansion coefficient), κ (thermal diffusivity), and E (Young's modulus).
The parameter-sensitivity results are summarized in Fig. 9. The linear thermal expansion coefficient α, thermal diffusivity κ, and Young's modulus E are each perturbed by ± 10 %, and the resulting changes in the annual TED amplitude and phase are examined. The amplitude response is generally limited. The largest sensitivity occurs mainly in dry inland regions, where stronger seasonal temperature forcing also produces larger TED signals. In these regions, most annual-amplitude changes remain below about 0.15 mm, although a small number of stations show larger responses. Humid coastal regions usually show weaker sensitivity, mostly below 0.1 mm, while high-latitude regions show intermediate behaviour. Among the three tested parameters, α and κ have a more direct influence on the annual amplitude, whereas the effect of E is generally smaller. The phase response is also moderate, with most annual-phase changes within about 1–3° and only a limited number of stations reaching several degrees. These results indicate that the modelled annual TED cycle is relatively stable under reasonable perturbations of the main thermal and elastic parameters, although larger sensitivity can occur in regions with stronger near-surface thermal contrasts.
The spectral behaviour of TED series provides an additional check on the temporal structure of the dataset (Figs. 10 and 11). The latitudinally stacked spectra show a dominant annual peak at 1 cpy and a weaker semiannual peak near 2 cpy in all latitude bands, consistent with temperature-driven origin of the modelled displacement. Spectral power is also present at higher frequencies, indicating that the released series retain nonseasonal variability rather than representing only fitted annual and semiannual terms. The annual peak is stronger in mid- and high-latitude bands than in low-latitude bands, reflecting the stronger seasonal temperature cycle outside the tropics. The regional spectra show similar features, but with clear differences in spectral power among regions. North America, Europe, and East Asia generally show stronger annual and semiannual peaks, whereas Australia and some lower-latitude or maritime regions show weaker seasonal power. The spectra decrease smoothly toward higher frequencies, with no clear artificial high-frequency artefacts. Taken together, the SoilGrids comparison, parameter perturbation tests, and spectral diagnostics suggest that the TED dataset is internally consistent and reasonably stable for the main annual and subannual signals. Larger uncertainties may still occur at stations with complex monument structures, poorly documented foundations, strong seasonal snow cover, time-varying soil moisture, or freeze–thaw conditions.
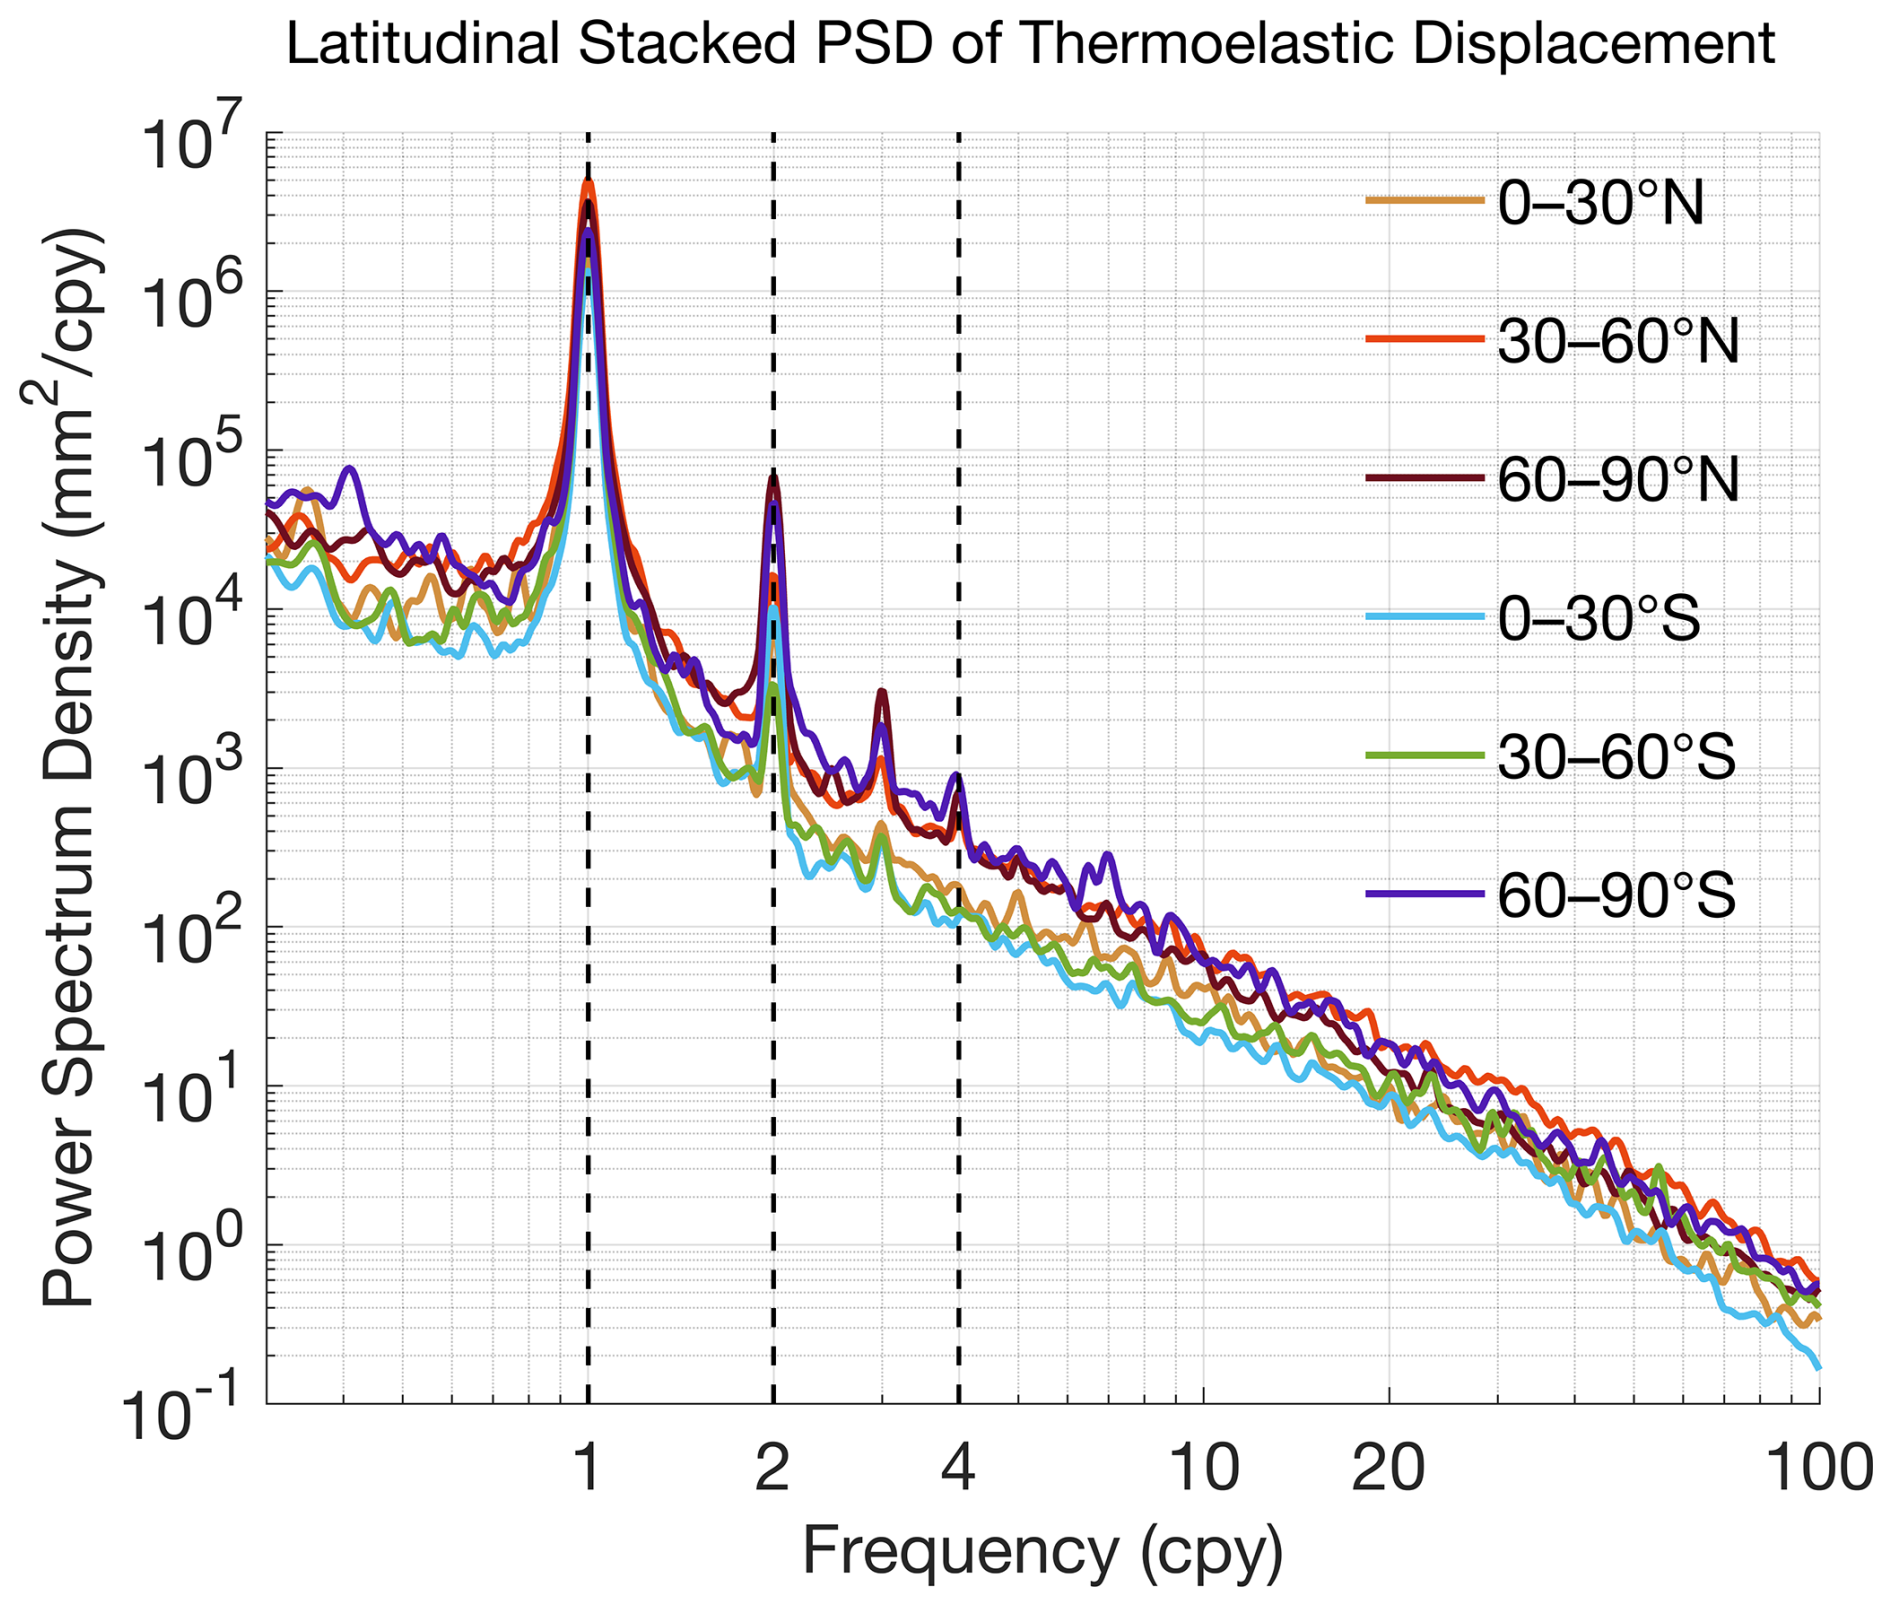
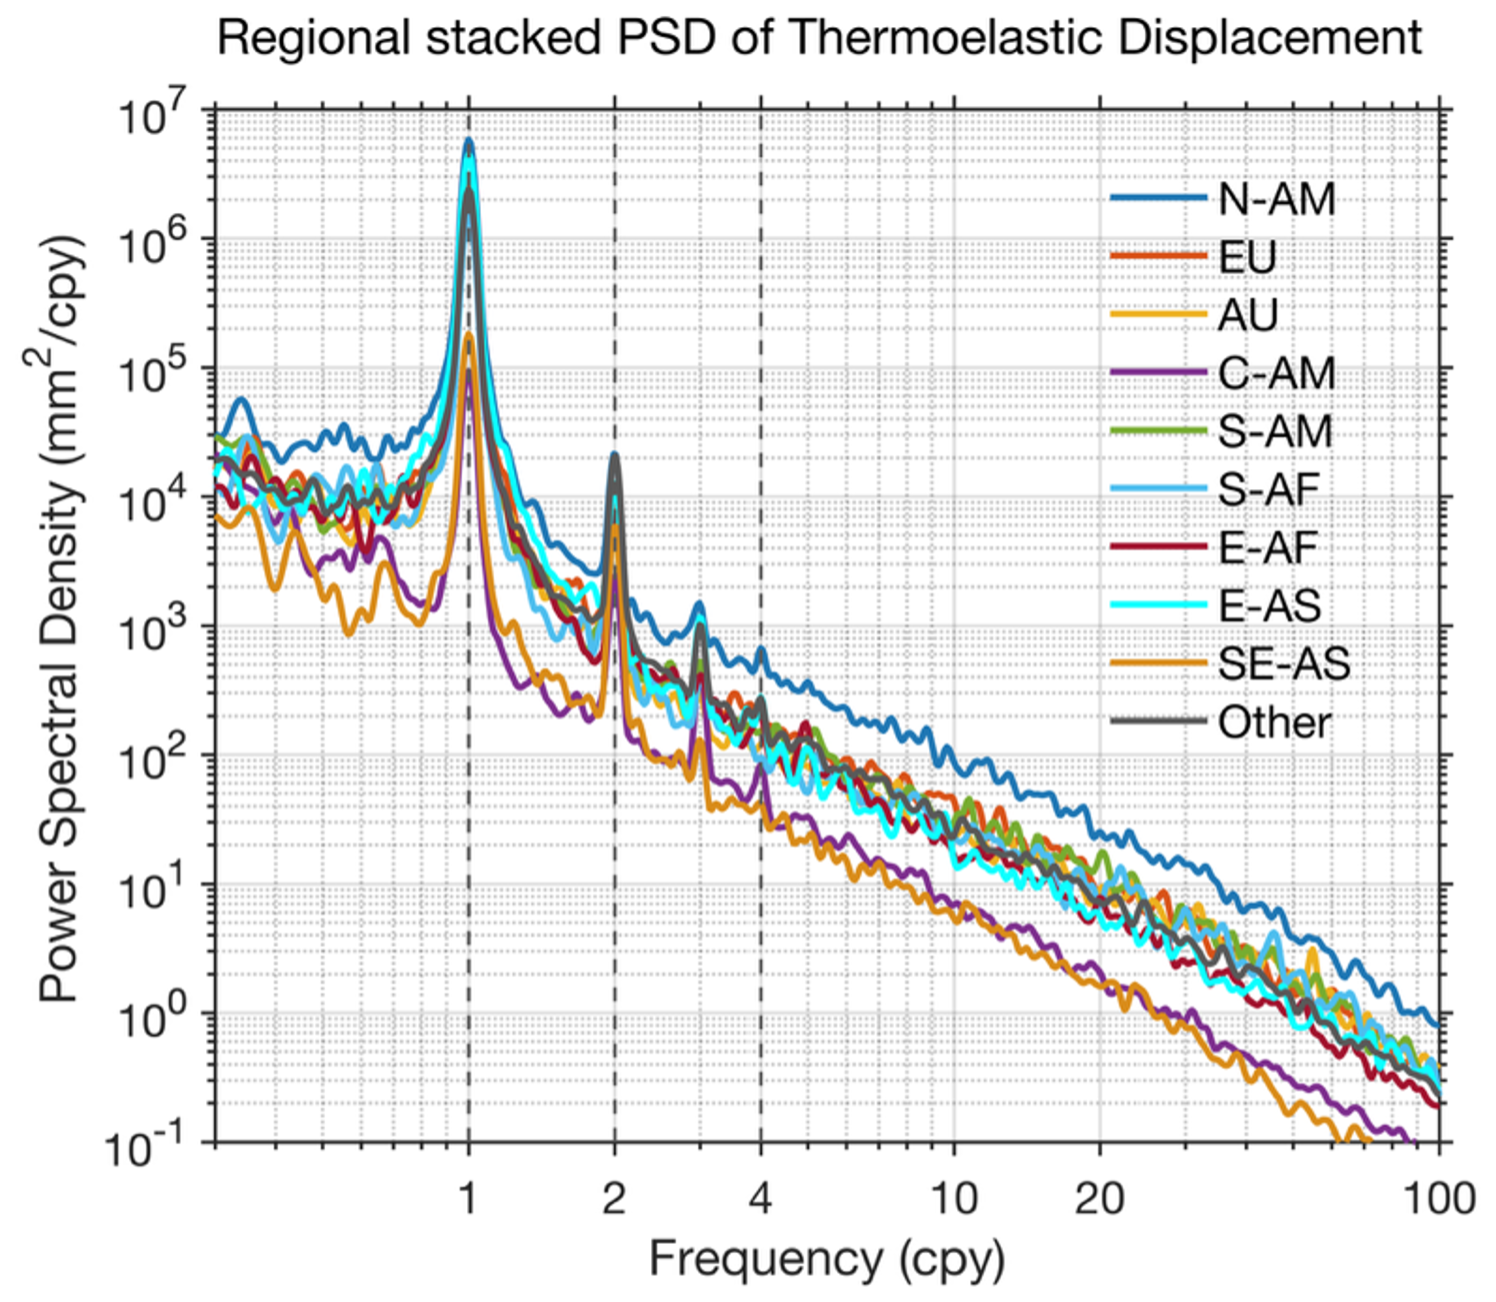
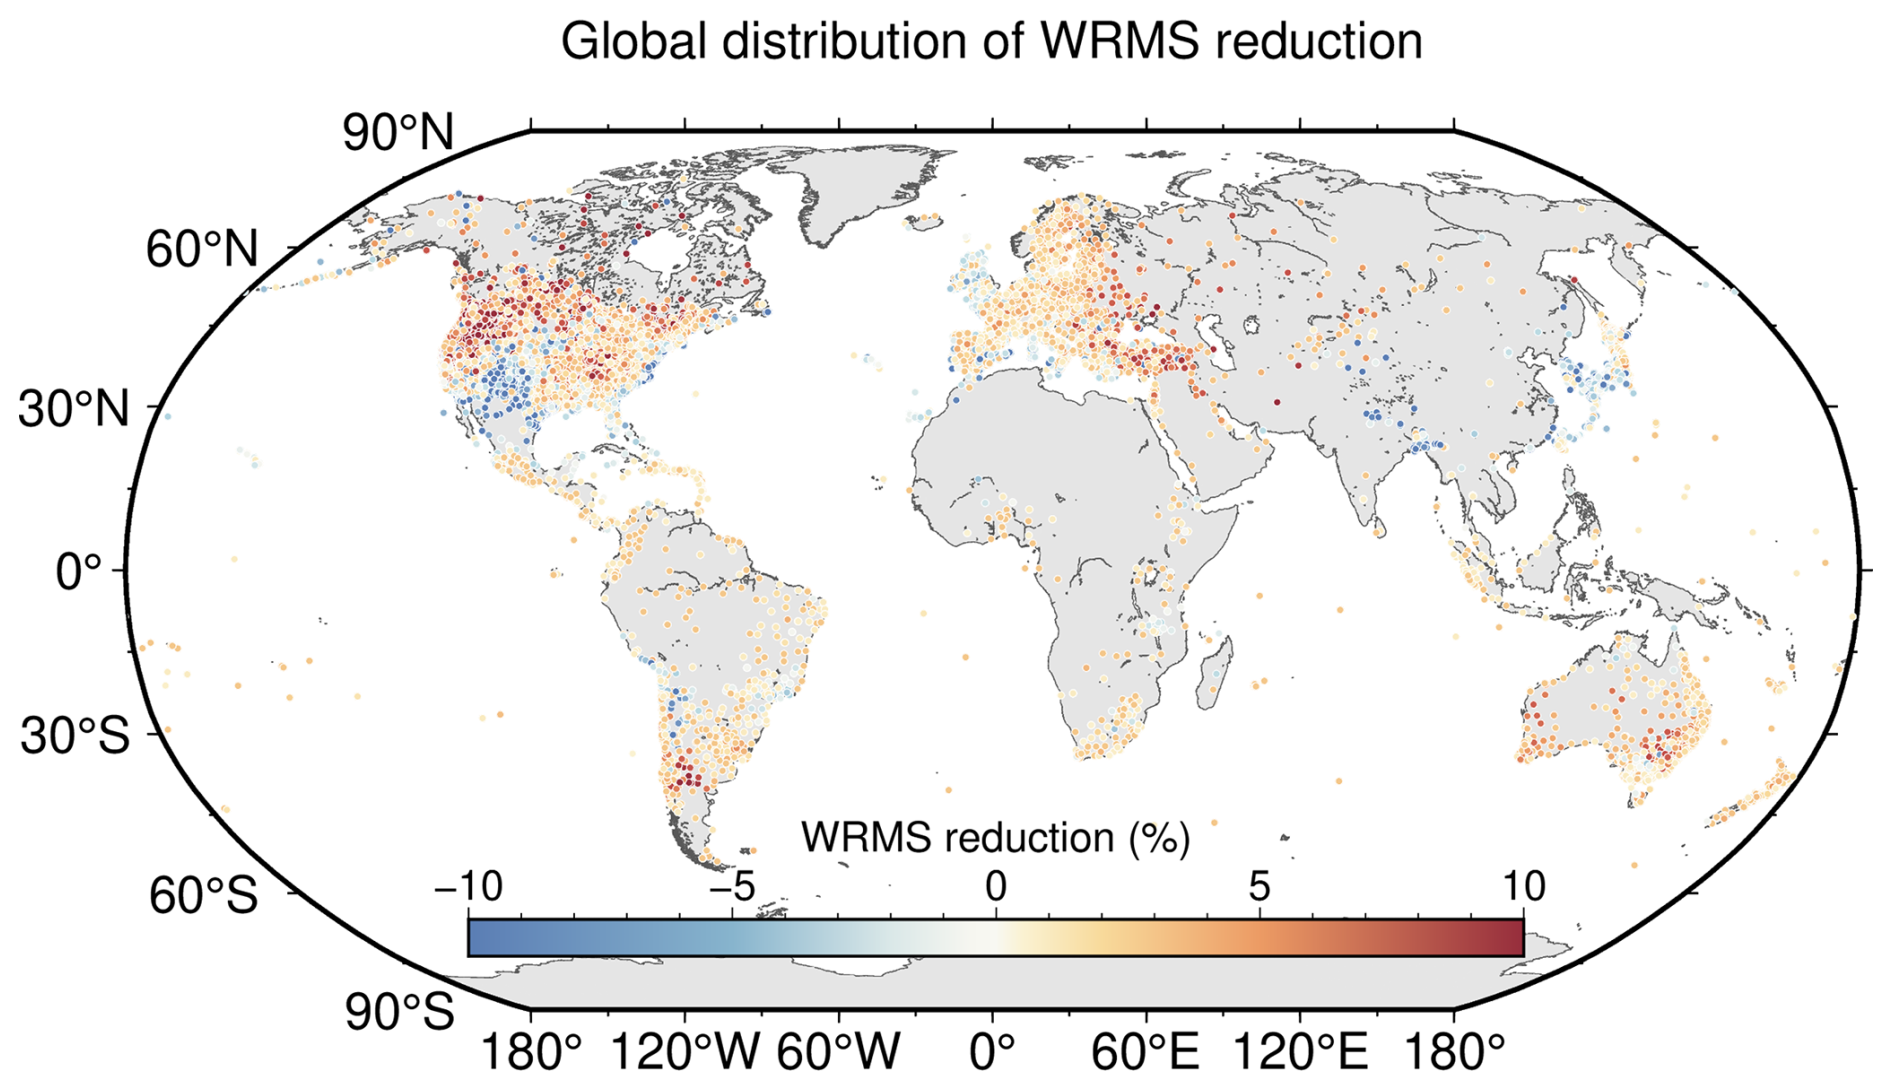
Figure 12Global distribution of WRMS changes after applying the TED-only correction to GNSS height time series. Positive values indicate reduced WRMS after removing TED, while negative values indicate increased WRMS.
3.3 Effect of TED on GNSS height time series
The effect of TED on GNSS height time series is first examined by applying the TED correction alone, without removing NTAL, NTOL, or HYDL (Fig. 12). Positive WRMS reductions are found at about 79 % of the assessed stations, indicating that removing TED reduces the scatter of GNSS height series at most sites. The improvement is generally modest, mostly within 3 %–5 %, and locally reaches about 5 %–10 %. Some stations show negative WRMS reductions, locally around −2 % to −5 %, indicating that the TED-only correction does not improve every GNSS height series. This behaviour is expected because TED is only one part of the non-tectonic vertical displacement observed by GNSS, and its amplitude is usually smaller than hydrological loading and many local site-dependent signals. Even so, the spatial pattern suggests that TED explains part of the GNSS height variability, especially in continental regions with stronger seasonal temperature forcing.
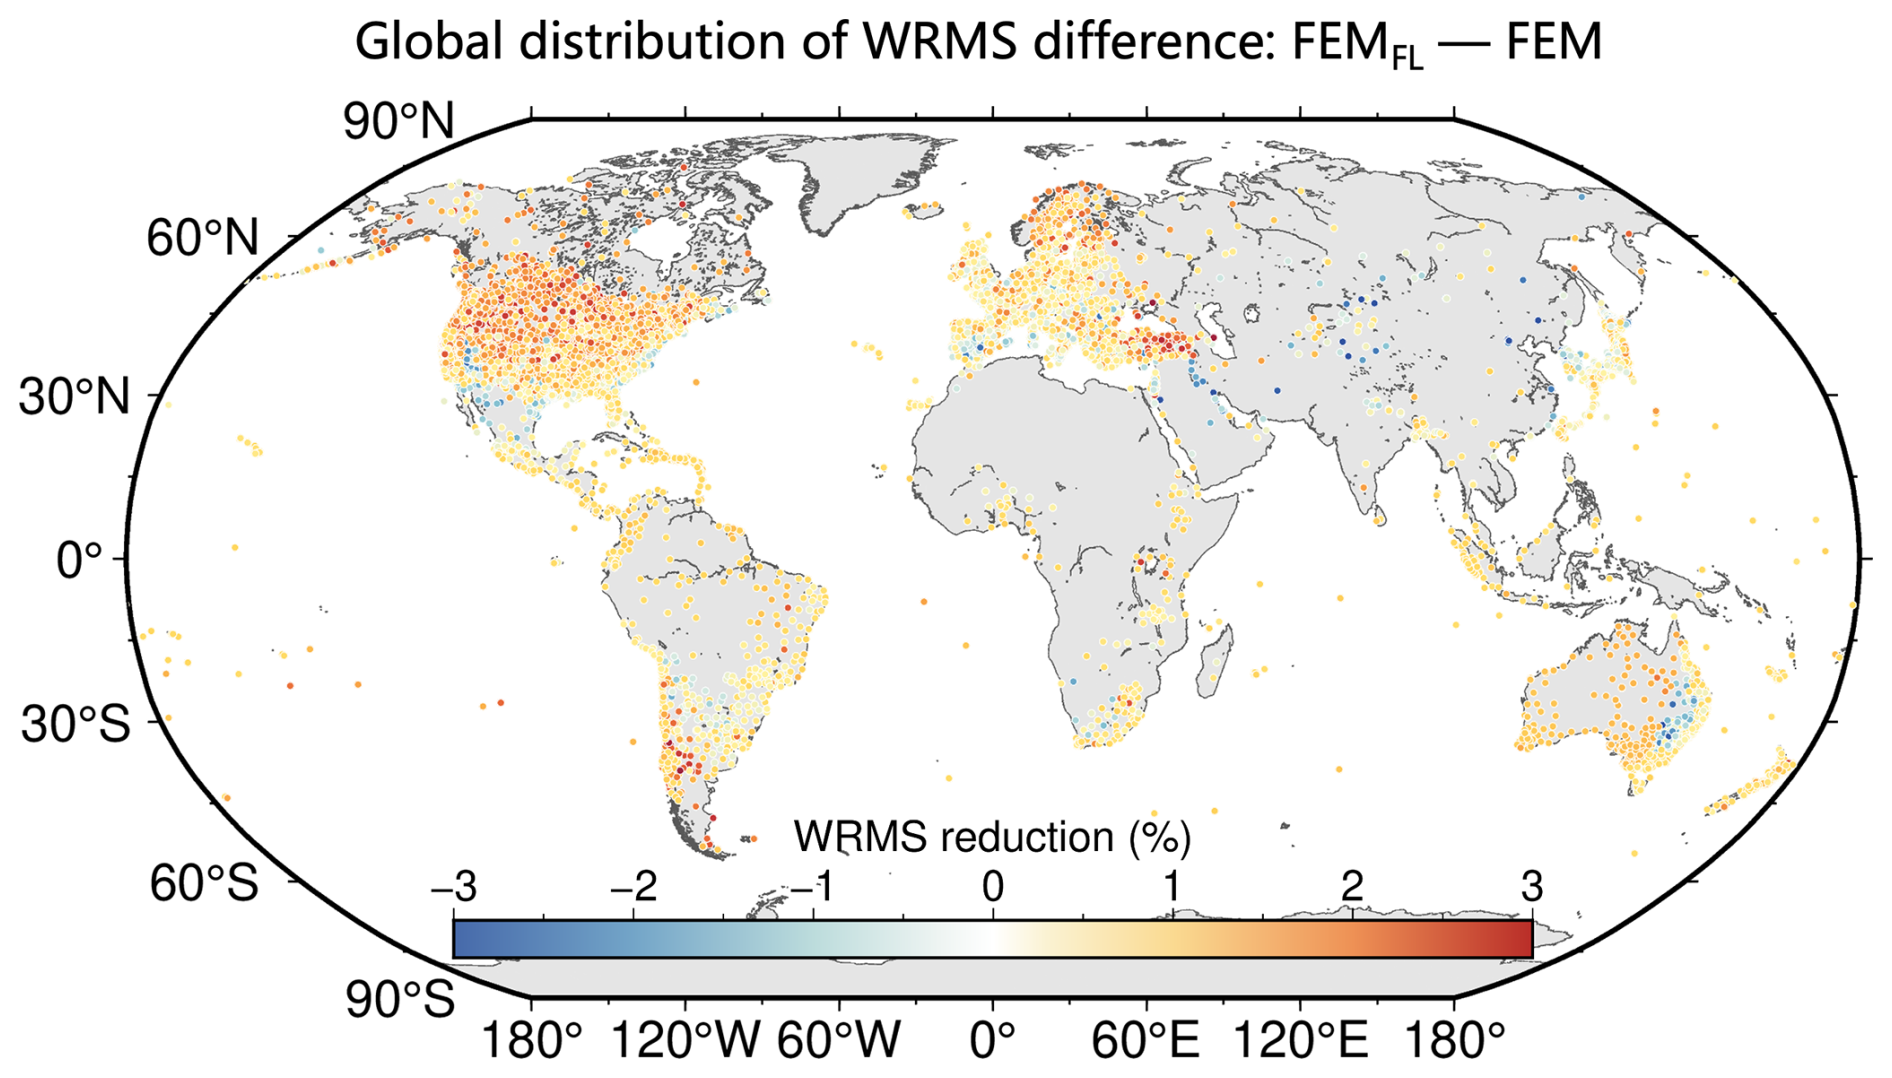
Figure 13Difference in WRMS reduction between FEMFL TED correction and the traditional homogeneous FEM correction. Positive values indicate a larger WRMS reduction from the FEMFL correction.
Figure 13 compares the WRMS changes obtained from the FEMFL correction and the traditional homogeneous FEM correction. The difference between the two corrections is smaller than the TED-only WRMS reduction itself, mostly within about ± 1 %–2 % and locally approaching ± 3 %. Positive values are more common in parts of North America and Europe, where FEMFL gives slightly larger WRMS reductions than the homogeneous FEM solution. This pattern is broadly consistent with the annual-amplitude and annual-phase differences shown in Fig. 6. The improvement from FEMFL should therefore be interpreted as a refinement of the homogeneous FEM correction through depth-dependent subsurface parameterization, rather than as a large change in the overall scatter of the GNSS residuals.
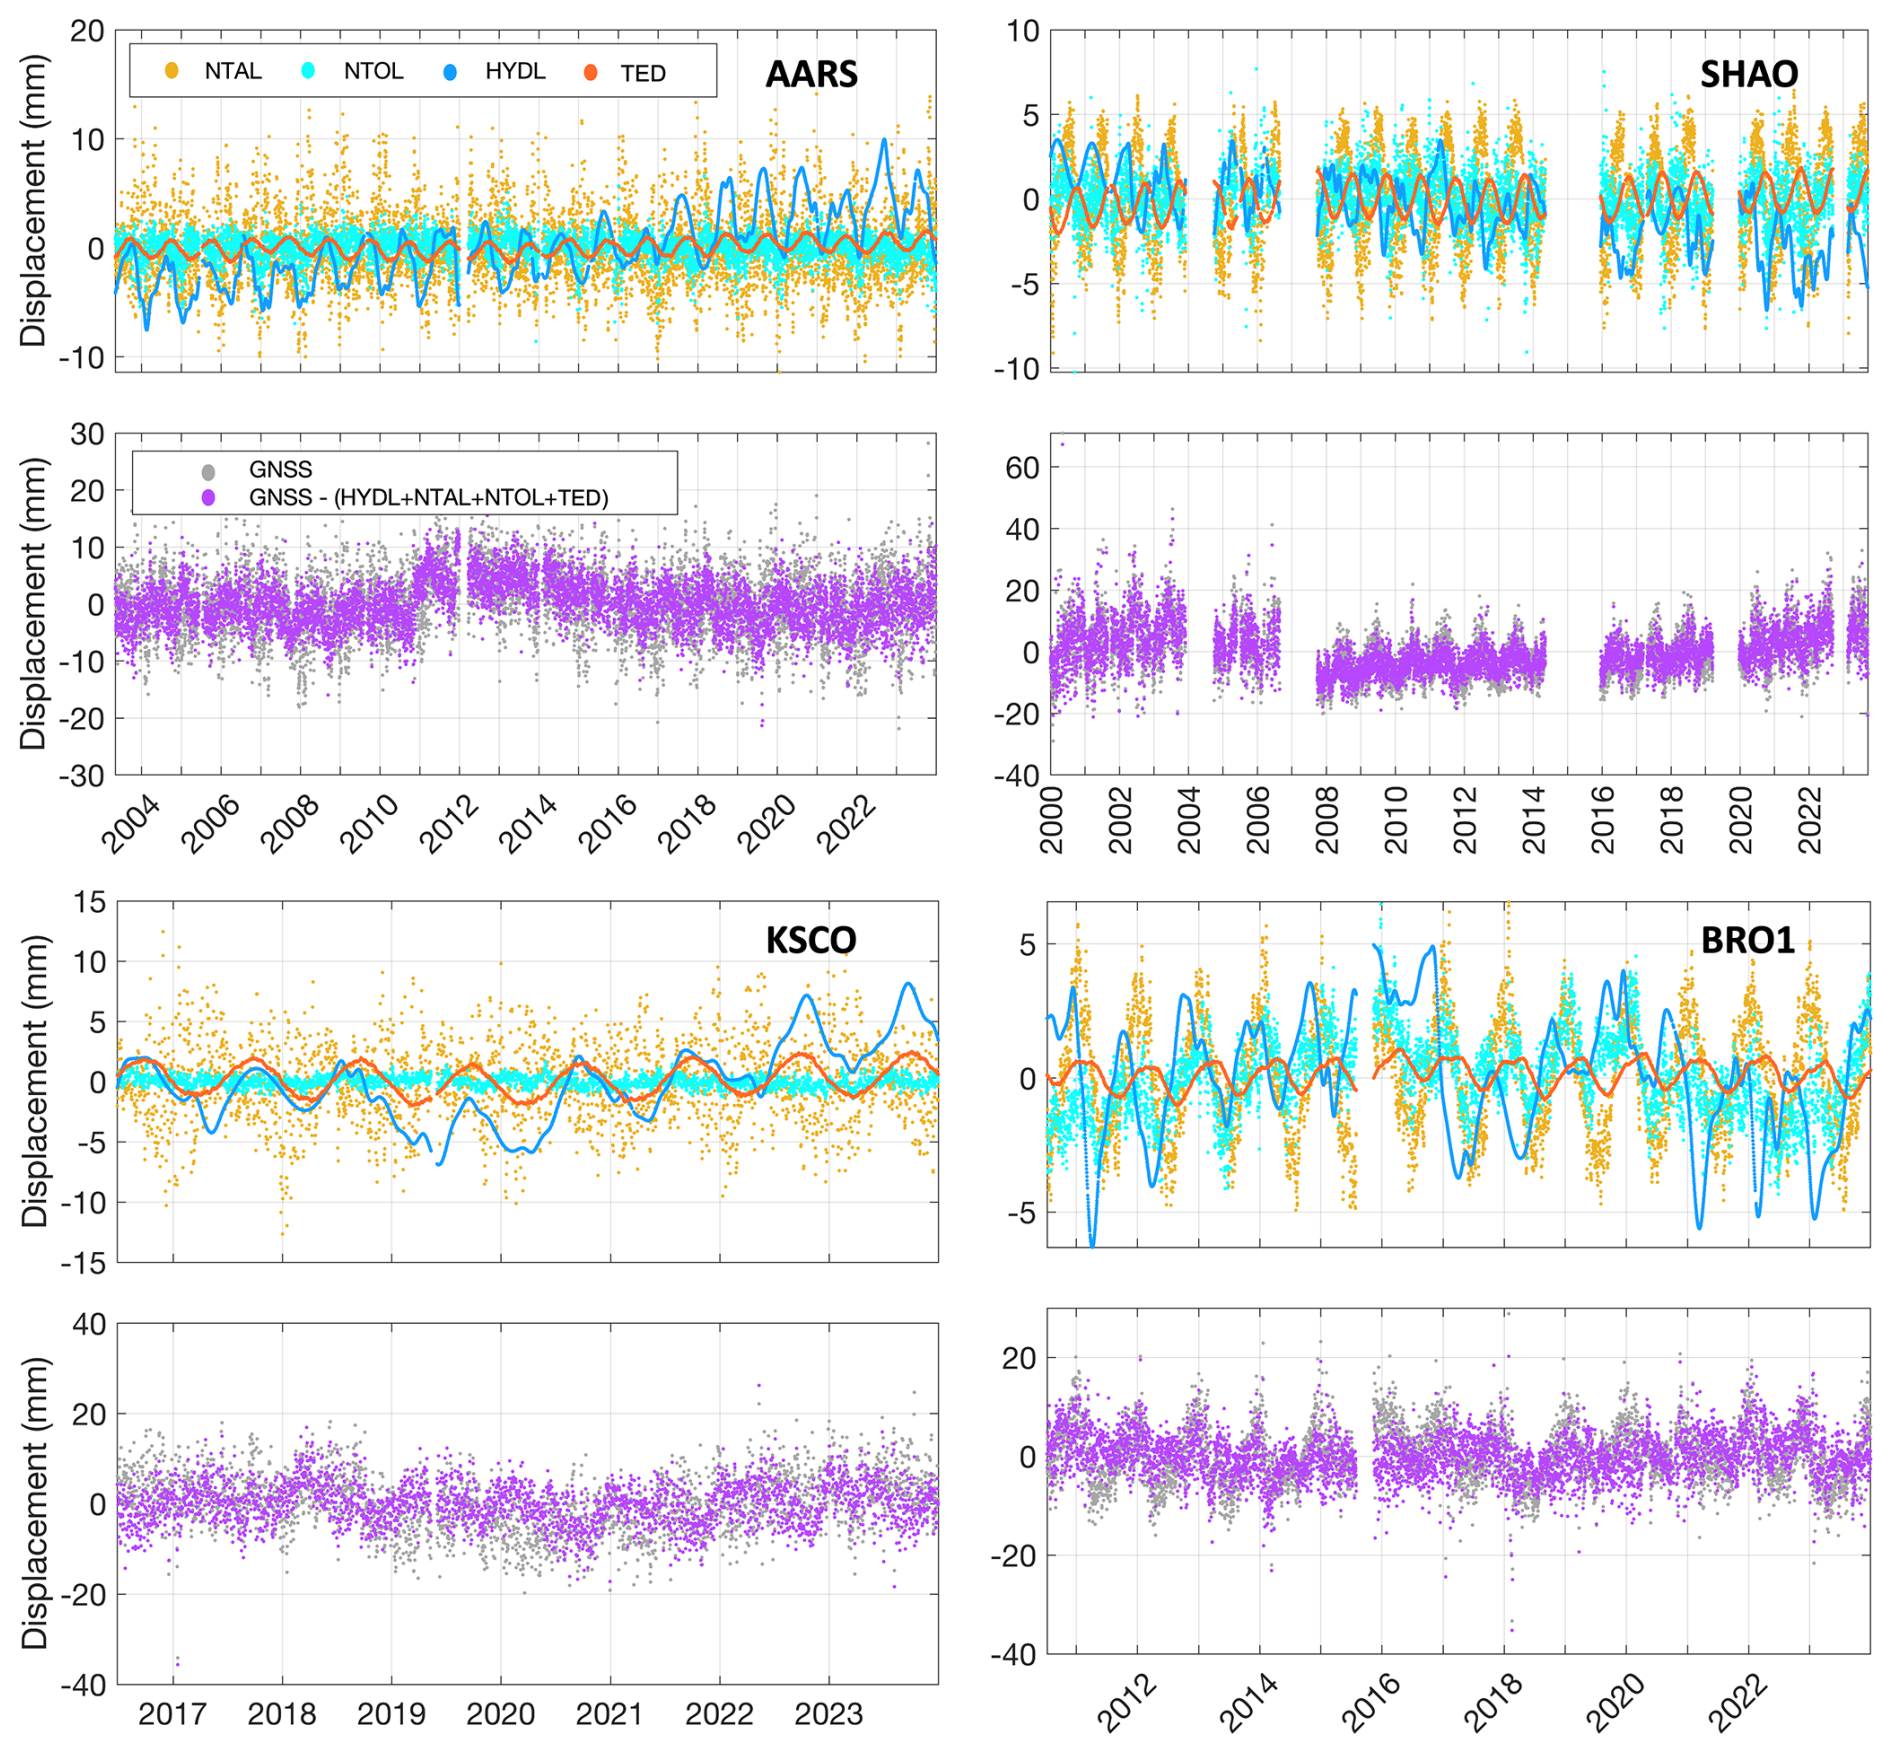
Figure 14Component comparison at four representative GNSS stations. The upper panels show modelled displacements from NTAL, NTOL, HYDL, and TED. The lower panels compare the raw GNSS height series with the series after removing the combined TED, HYDL, NTAL, and NTOL corrections. These panels are shown only to illustrate the relative timing and amplitude of different environmental displacement components, rather than to evaluate the correction performance of TED alone.
The representative stations in Fig. 14 help explain why the TED-only improvement is limited at some sites. At AARS and KSCO, HYDL and NTAL can reach several millimetres, and individual NTAL fluctuations can exceed 10 mm. At SHAO and BRO1, the non-tidal loading displacements are generally smaller, mostly within a few millimetres, but hydrological and ocean loading still contribute clear seasonal variations. By comparison, TED is smoother and usually remains around the 1–2 mm level. The lower panels show the GNSS height series before and after removing the combined TED, HYDL, NTAL, and NTOL corrections, only to illustrate the relative timing and amplitude of these displacement components. The direct assessment of the TED product is based on the TED-only WRMS reduction in Fig. 12 and the FEMFL–homogeneous FEM comparison in Fig. 13.
The released TED dataset provides daily temperature-driven vertical thermoelastic displacement time series for approximately 14 000 continuously operating GNSS stations over 2000–2023. The archived dataset is available from Zenodo (https://doi.org/10.5281/zenodo.21069958; Lu et al., 2026a) and is also accessible through the Ground Motion Data Service (GMDS) platform (https://gmds.gnss.net.au/, last access: 15 September 2026). On GMDS, users can search by station name and time span and download station-level TED time series together with the corresponding station information. The files are organized by station and include date tags, vertical TED displacements in millimetres, station latitude and longitude, record start and end dates, and dataset version information. Although the FEMFL model can be applied to earlier periods when the required temperature forcing and subsurface information are available, the current release covers 2000–2023. Future extensions to earlier periods will be considered after evaluating the consistency of the corresponding input datasets and broader application requirements.
This release provides daily vertical TED time series for direct use with daily GNSS height time series. Horizontal components are not included because the one-dimensional FEMFL model used here estimates vertical thermoelastic displacement only. Although the model is driven by hourly ERA5 soil-temperature forcing, sub-daily TED series are not released in this version because the technical evaluation and GNSS-based assessment are based on daily GNSS coordinate time series. Sub-daily TED products may be considered in future releases after further validation with sub-daily GNSS solutions.
The TED dataset is distributed as a versioned release. Future revisions or extensions, if any, will be archived as updated Zenodo releases, with the version number, release date, and a brief description of changes provided for each release. Users should cite the Zenodo DOI together with the specific dataset version used in their analysis. The TED series are intended mainly for correcting seasonal and nonseasonal thermoelastic variability in GNSS height time series. Linear trends fitted to the TED series should be interpreted with caution, because they may be affected by uncertainties in the long-term behaviour of the temperature forcing and model inputs.
This study presents a global dataset of temperature-driven vertical thermoelastic displacement for approximately 14 000 continuous GNSS stations over 2000–2023. The dataset was generated using ERA5 soil-temperature forcing, SoilGrids-derived shallow subsurface properties, and FEMFL. By using four temperature samples within each day, the model reduces the dependence on a single fixed sampling time and allows within-day temperature variability to be considered while producing daily TED time series. Compared with the traditional homogeneous FEM solution, FEMFL represents shallow soil–bedrock stratification and therefore reduces the simplification associated with treating the shallow subsurface as homogeneous. The released product provides a globally consistent station-level TED correction that can be directly aligned with daily GNSS height time series.
The results show that annual TED amplitudes are mostly within about 0.2–1.2 mm and can exceed 1.5 mm in regions with strong seasonal temperature contrasts. Larger values are mainly found in continental and arid inland regions, whereas humid maritime and low-latitude areas generally show weaker responses. The percentile-based peak-to-peak variability of the full daily TED series commonly reaches 2–4 mm in continental regions and locally approaches 5–6 mm. After removing the linear term and the annual and semiannual harmonics, the remaining nonseasonal variability is mostly below 1 mm, but can locally reach the millimetre level. These results indicate that the TED product is dominated by the annual component at most stations, while still retaining smaller semiannual and nonseasonal variations.
The order-of-magnitude comparison shows that TED amplitudes are comparable to above-ground monument thermal expansion at stations with available monument information. TED is generally smaller than hydrological loading, but its annual amplitude overlaps with the lower-to-middle ranges of NTOL and NTAL. Technical evaluation based on documented foundation-depth information, parameter perturbation tests, and spectral diagnostics suggests that the annual TED cycle is relatively stable under reasonable uncertainty in the main thermal and elastic parameters. In GNSS height applications, applying TED alone reduces WRMS at about 79 % of the analysed stations, although the improvements are generally modest, mostly within 3 %–5 % and locally reaching about 5 %–10 %. This indicates that TED can help reduce part of the temperature-related variability in high-precision GNSS height time series, but it should be used as a complementary correction together with non-tidal loading products rather than as a replacement for them.
Several limitations should be considered when using the dataset. The present product represents subsurface thermoelastic deformation only and does not include thermal expansion of above-ground monuments or other engineered structures, which may be important at individual stations such as tall pillars, rooftop installations, steel masts, or building-mounted antennas. The model also uses static shallow subsurface properties and does not explicitly represent time-varying soil moisture, snow depth and snow thermal properties, freeze–thaw processes, or permanent ice conditions. Although ERA5 soil temperature is used as the upper thermal forcing and therefore may implicitly include part of the snow-related thermal effects associated with seasonal snow cover, the lack of explicit snow properties in the subsurface model may introduce additional uncertainty in snow-covered regions. Larger uncertainties may therefore occur at stations affected by strong seasonal snow cover, frozen ground, large soil-moisture variations, complex coastal or lake-side environments, or poorly documented local site conditions. Future updates would improve the representation of snow, soil moisture, and frozen ground processes, and may consider sub-daily products or other model extensions after further validation with appropriate GNSS solutions and improved input datasets.
RL proposed the initial idea, designed the experiments, developed the software, and wrote the manuscript. ZL and YF reviewed and revised the manuscript, focusing on the paper structure, correctness of concept, data, and analysis. LY assisted in developing the GMDS website. PY reviewed and revised the manuscript. All authors approved of the manuscript.
The contact author has declared that none of the authors has any competing interests.
Publisher's note: Copernicus Publications remains neutral with regard to jurisdictional claims made in the text, published maps, institutional affiliations, or any other geographical representation in this paper. The authors bear the ultimate responsibility for providing appropriate place names. Views expressed in the text are those of the authors and do not necessarily reflect the views of the publisher.
We gratefully acknowledge the Nevada Geodetic Laboratory (NGL) for providing the GNSS coordinate time series, GFZ for the non-tidal atmospheric and ocean loading displacement products (NTAL and NTOL), and the GRACE/GRACE-FO Mascon solutions provided by NASA that were used to derive the hydrological loading (HYDL). We also thank ECMWF for the ERA5 temperature datasets. Figures were generated using the Generic Mapping Tools (GMT) software (Wessel et al., 2013).
This research was supported in part by the National Natural Science Foundation of China (grant nos. 42574041, 424B2026, 42192531, and 42388102) and by the Scientific Research Innovation Capability Support Project for Young Faculty (grant no. SRICSPYF-ZY2025007), and by the National Key Research and Development Program of China (grant no. 2024YFC3810500).
This paper was edited by Benjamin Männel and reviewed by Matt King and one anonymous referee.
Altamimi, Z., Rebischung, P., Collilieux, X., Métivier, L., and Chanard, K.: ITRF2020: an augmented reference frame refining the modeling of nonlinear station motions, Journal of Geodesy, 97, 47, https://doi.org/10.1007/s00190-023-01738-w, 2023.
Berger, J.: A note on thermoelastic strains and tilts, Journal of Geophysical Research, 80, 274–277, https://doi.org/10.1029/JB080i002p00274, 1975.
Biot, M. A.: Thermoelasticity and irreversible thermodynamics, J. Appl. Phys., 27, 240–253, https://doi.org/10.1063/1.1722351, 1956.
Blewitt, G., Hammond, W. C., and Kreemer, C.: Harnessing the GPS data explosion for interdisciplinary science, Eos, 99, https://doi.org/10.1029/2018EO104623, 2018.
Clarke, P. J., Lavallée, D. A., Blewitt, G., van Dam, T. M., and Wahr, J. M.: Effect of gravitational consistency and mass conservation on seasonal surface mass loading models, Geophys. Res. Lett., 32, L08306, https://doi.org/10.1029/2005GL022441, 2005.
Dong, D., Fang, P., Bock, Y., Cheng, M. K., and Miyazaki, S.: Anatomy of apparent seasonal variations from GPS-derived site position time series, J. Geophys. Res., 107, ETG 9-1–ETG 9-16, https://doi.org/10.1029/2001JB000573, 2002.
Fang, M., Dong, D., and Hager, B. H.: Displacements due to surface temperature variation on a uniform elastic sphere with its centre of mass stationary, Geophys. J. Int., 196, 194–203, https://doi.org/10.1093/gji/ggt335, 2014.
Fritsche, M., Döll, P., and Dietrich, R.: Global-scale validation of model-based load deformation of the Earth's crust from continental watermass and atmospheric pressure variations using GPS, J. Geodyn., 59–60, 133–142, https://doi.org/10.1016/j.jog.2011.04.001, 2012.
Hengl, T., Mendes de Jesus, J., Heuvelink, G. B. M., Ruiperez Gonzalez, M., Kilibarda, M., Blagotić, A., Shangguan, W., Wright, M. N., Geng, X., Bauer-Marschallinger, B., Guevara, M. A., Vargas, R., MacMillan, R. A., Batjes, N. H., Leenaars, J. G. B., Ribeiro, E., Wheeler, I., Mantel, S., and Kempen, B.: SoilGrids250m: Global gridded soil information based on machine learning, PLOS ONE, 12, e0169748, https://doi.org/10.1371/journal.pone.0169748, 2017.
Hersbach, H., Bell, B., Berrisford, P., Biavati, G., Horányi, A., Muñoz-Sabater, J., Nicolas, J., Peubey, C., Radu, R., Rozum, I., Schepers, D., Simmons, A., Soci, C., Dee, D., and Thépaut, J.-N.: ERA5 hourly data on single levels from 1940 to present, Copernicus Climate Change Service (C3S) Climate Data Store (CDS) [data set], https://doi.org/10.24381/cds.adbb2d47, 2018.
Hill, E. M., Davis, J. L., Elósegui, P., Wernicke, B. P., Malikowski, E., and Niemi, N. A.: Characterization of site-specific GPS errors using a short-baseline network of braced monuments at Yucca Mountain, southern Nevada, J. Geophys. Res.-Sol. Ea., 114, B11402, https://doi.org/10.1029/2008JB006027, 2009.
Jiang, W., Li, Z., van Dam, T., and Ding, W.: Comparative analysis of different environmental loading methods and their impacts on the GPS height time series, J. Geodesy, 87, 687–703, https://doi.org/10.1007/s00190-013-0642-3, 2013.
Lei, J., Chen, W., Li, Z., Li, F., and Zhang, S.: A full-spectrum bedrock thermal expansion model and its impact on the Global Positioning System height time series, Geophys. Res. Lett., 47, e2019GL086022, https://doi.org/10.1029/2019GL086022, 2020.
Li, Z., Chen, W., van Dam, T., Rebischung, P., and Altamimi, Z.: Comparative analysis of different atmospheric surface pressure models and their impacts on daily ITRF2014 GNSS residual time series, J. Geodesy, 94, 42, https://doi.org/10.1007/s00190-020-01370-y, 2020.
Li, Z., Lu, R., Jiang, W., Dong, D., Lei, J., Lu, Y., Ding, X., Yang, K., Chen, H., and Chen, Q.: A refined full-spectrum temperature-induced subsurface thermal expansion model and its contribution to the vertical displacement of global GNSS reference stations, J. Geodesy, 98, 25, https://doi.org/10.1007/s00190-024-01834-5, 2024.
Li, Z., Jiang, W., van Dam, T., Zou, X., Chen, Q., and Chen, H.: A review on modeling environmental loading effects and their contributions to nonlinear variations of global navigation satellite system coordinate time series, Engineering, 47, 26–37, https://doi.org/10.1016/j.eng.2024.09.001, 2025.
Lu, R., Li, Z., Chen, Q., Ding, X., Yang, K., Zhang, M., Lu, Y., Fan, W., Chen, H., and Jiang, W.: On the contributions of refined thermal expansion model to nonlinear variations in different GNSS height time series products, GPS Solut., 28, 80, https://doi.org/10.1007/s10291-024-01625-7, 2024.
Lu, R., Li, Z., and Feng, Y.: TED: A global temperature-driven thermoelastic displacement dataset for GNSS reference stations (2000–2023), Zenodo [data set], https://doi.org/10.5281/zenodo.21069958, 2026a.
Lu, R., Liu, K., Chen, Y., Zhang, M., Zou, X., and Feng, Y.: Joint monument–subsurface thermoelastic modelling of temperature-induced displacement at global GNSS reference stations, Int. J. Appl. Earth Obs., 150, 105360, https://doi.org/10.1016/j.jag.2026.105360, 2026b.
Poggio, L., de Sousa, L. M., Batjes, N. H., Heuvelink, G. B. M., Kempen, B., Ribeiro, E., and Rossiter, D.: SoilGrids 2.0: producing soil information for the globe with quantified spatial uncertainty, SOIL, 7, 217–240, https://doi.org/10.5194/soil-7-217-2021, 2021.
Prawirodirdjo, L., Ben-Zion, Y., and Bock, Y.: Observation and modeling of thermoelastic strain in Southern California Integrated GPS Network daily position time series, J. Geophys. Res., 111, B02408, https://doi.org/10.1029/2005JB003716, 2006.
Romagnoli, C., Zerbini, S., Lago, L., Richter, B., Simon, D., Domenichini, F., Elmi, C., and Ghirotti, M.: Influence of soil consolidation and thermal expansion effects on height and gravity variations, J. Geodyn., 35, 521–539, https://doi.org/10.1016/S0264-3707(03)00012-7, 2003.
van Dam, T., Wahr, J., and Lavallée, D.: A comparison of annual vertical crustal displacements from GPS and Gravity Recovery and Climate Experiment (GRACE) over Europe, J. Geophys. Res.-Sol. Ea., 112, B03404, https://doi.org/10.1029/2006JB004335, 2007.
Wang, K., Yang, L., Li, S., Zhang, T., Li, Z., and Deng, L.: Assessment of the diurnal and semidiurnal signals induced by monument thermal effect with time series of very short GPS baselines, Geodesy and Geodynamics, 16, 158–171, https://doi.org/10.1016/j.geog.2024.07.002, 2025.
Wei, N., Zhou, Y., Shi, C., Xu, X., Rebischung, P., and Liu, J.: Toward a refined estimation of geocenter motion from GNSS displacements: mitigating thermoelastic deformation and systematic errors, J. Geophys. Res.-Sol. Ea., 130, e2024JB028967, https://doi.org/10.1029/2024JB028967, 2025.
Wessel, P., Smith, W. H. F., Scharroo, R., Luis, J., and Wobbe, F.: Generic Mapping Tools: improved version released, Eos T. Am. Geophys. Un., 94, 409–410, https://doi.org/10.1002/2013EO450001, 2013.
Xu, X., Dong, D., Fang, M., Zhou, Y., Wei, N., and Zhou, F.: Contributions of thermoelastic deformation to seasonal variations in GPS station position, GPS Solut., 21, 1265–1274, https://doi.org/10.1007/s10291-017-0609-6, 2017.
Yan, H., Chen, W., Zhu, Y., Zhang, W., and Zhong, M.: Contributions of thermal expansion of monuments and nearby bedrock to observed GPS height changes, Geophys. Res. Lett., 36, L13301, https://doi.org/10.1029/2009GL038152, 2009.
Yan, H., Chen, W., Zhu, Y., Zhang, W., Zhong, M., and Liu, G.: Thermal effects on vertical displacement of GPS stations in China, Chinese J. Geophys.-Ch., 53, 825–832, https://doi.org/10.1002/cjg2.1492, 2010.