the Creative Commons Attribution 4.0 License.
the Creative Commons Attribution 4.0 License.
 | 09 Oct 2026
Ground-motion dataset for shallow earthquakes in Colombia
Daniel Martinez-Jaramillo

Sreeram-Reddy Kotha
F. Ramón Zúñiga
Pierre Lacan
The tectonics of Colombia is characterised by the interaction of multiple oceanic plates subducting beneath the continent, generating active transpressional deformation and a wide range of subduction-related and crustal earthquakes. We present a flatfile containing ground-motion intensity measurements (IMs) from 667 shallow earthquakes. Magnitudes were homogenised using S-wave corner-frequency-based estimates where a reliable agency-reported moment magnitude was unavailable. The dataset includes 7550 three-component acceleration records that were uniformly processed. The computed IMs include peak ground velocity, peak ground acceleration, and 5 %-damped spectral accelerations for 31 periods ranging from 0.01 to 8 s. Furthermore, the Fourier Amplitude Spectra for each component is provided in the frequency range from 0.04 to 50.00 Hz. Epicentral and hypocentral distances are reported for all events, while finite-fault distance metrics are estimated for earthquakes with M> 5.5. Site conditions are characterised using VS30 and the horizontal-to-vertical spectral ratio (). Hypocentre locations are constrained using the ISC-EHB catalogue and the Integrated Seismological Catalogue of the Colombian Geological Survey. For validation and consistency checks, the dataset was compared to a global and region-adapted Ground Motion Prediction Model. This flatfile constitutes a valuable resource for seismic hazard analysis, ground-motion modelling, risk assessment, earthquake engineering applications, seismic-site response and source physics characterisation in Colombia, surrounding regions, and other comparable tectonic environments. The dataset is available at https://doi.org/10.5281/zenodo.22031680 (Martinez-Jaramillo et al., 2026).
- Article
(7565 KB) - Full-text XML
- BibTeX
- EndNote


The subduction of the Nazca and Caribbean plates, together with the indentation (or possible additional subduction) of the Panamá-Chocó block against the northwestern South American plate, generates moderate to large earthquakes in the region. As a result, Colombia experiences a complex mixture of interface, intraslab, shallow continental, lithospheric continental, and volcanic-related earthquakes. Several significant earthquakes have strongly affected Colombia, for example:
-
18 May 1875, M 6.8, in Cúcuta, Norte de Santander, occurred near the Colombia–Venezuela border, causing approximately 1000 fatalities. The likely source is the Aguas Calientes Fault System, part of the Boconó Fault System in the Mérida Andes (Rodríguez et al., 2018).
-
31 January 1906, M 8.8 in the Colombia–Ecuador border, a megathrust event along the Nazca subduction zone that generated a devastating tsunami and caused around 600 fatalities – one of the largest earthquakes recorded globally.
-
12 December 1979, M 8.2 (Tumaco, Nariño): Another major subduction earthquake that caused a tsunami and a death toll of more than 450.
-
31 March 1983, M 5.5 (Popayán, Cauca): Caused approximately 300 fatalities; the source is attributed to one of the structures belonging to the Romeral Fault System (RFS) (Marín-Arias et al., 2006).
-
18 October 1992, M 7.2, Murindó, Antioquia, caused more than 10 fatalities and widespread environmental effects, including soil liquefaction. This earthquake is associated with the Murindó Fault (Paris et al., 2000; Marín-Arias et al., 2009; Mosquera-Machado et al., 2009).
-
25 January 1999, M 6.1 (Eje Cafetero): Produced more than 2000 deaths and has been linked to the Córdoba Fault of the RFS (Paris et al., 2000; Vargas-Jiménez and Monsalve-Jaramillo, 2009).
This brief set of examples highlights the importance of characterising and quantifying the intensity caused by shallow crustal earthquakes in Colombia. Globally, several major initiatives have undertaken the compilation and processing of seismograms to make ground-motion IMs widely available. These include the Next Generation Attenuation (NGA) projects for Western (NGA-West2) and Eastern U.S. (Ancheta et al., 2014; Goulet et al., 2021), the Near-Source Ground-motion Flatfile (Pacor et al., 2018; Sgobba et al., 2021), and regional efforts covering Europe (Akkar et al., 2014; Lanzano et al., 2019), Italy (Oliveti et al., 2021), France (Buscetti et al., 2025), Belgium (Vanneste et al., 2026), India (Sharma et al., 2025), Japan (Dawood et al., 2016), and Chile (Bastías and Montalva, 2016) among others.
For Northern South America, Arteta et al. (2021) developed a Ground Motion Prediction Model (GMPM) for subduction earthquakes, Arteta et al. (2023) developed a GMPM for shallow crustal earthquakes with 709 records of 56 earthquakes, also Pájaro et al. (2024) developed a GMPM for the Bucaramanga Nest.
The accessibility of IMs for a wide [M,R] range is essential for the development of GMPMs, probabilistic seismic hazard assessment (PSHA), engineering seismology, and earthquake engineering. The development of GMPMs, particularly the partially non-ergodic kind, relies heavily on the quantity and quality of ground-motion IMs, and associated event, path, and site metadata. Such datasets are often referred to as flatfiles. Here, we present a flatfile generated from consistently processed ground-motion recordings from the shallow earthquakes across Colombia and tested with a global and a region-adapted GMPM for consistency check purposes.
The flatfile (Martinez-Jaramillo et al., 2026) is arranged as a table that contains verified and reliable metadata and IMs of processed waveforms recorded by the Colombian Geological Survey (SGC, per its Spanish acronym). SGC provided, upon request, more than 10 000 quality-checked acceleration time series. The criteria used to select earthquakes from the SGC database were:
-
Events in the latitude range 0 to 14° N;
-
Events in the longitude range 69 to 82° W;
-
Events with depth estimation < 50 km;
-
Any magnitude > 4;
-
Records with Repi < 400 km.
After applying these earthquake selection criteria, we obtained more than 700 earthquakes. After filtering out volcanic events and spikes in the signals, we ultimately retained 667 events and 7550 records.
SGC has a national network consisting of 506 seismological and accelerometric stations operating since 1993 installed around Colombia; some of them were removed or operated in temporary networks. The FDSN code for this network is CM. In addition, there are local networks within the country to specifically monitor volcanoes, mining districts, and oil and gas fields; some of these stations were shared with SGC and contributed to this flatfile. The sampling frequency of accelerometric stations is predominantly 200 Hz, with a few stations (3) at 100 Hz.
2.1 Flatfile structure
The fields of flatfile are grouped as: (1) Event metadata; (2) Site metadata; (3) Metrics of event-to-site distances; (4) Intensity measures.
The 667 events are defined by their location (Latitude, Longitude, depth), origin time (date), and moment magnitude (M). Magnitudes were taken from the Integrated Seismic Catalog for Colombia (Montejo et al., 2023). This catalog was reviewed for locations and homogenised in M. For the events not included in the dataset of Montejo et al. (2023), we followed the same criteria, prioritizing locations made by ISC-EHB (Weston et al., 2018; International Seismological Centre, 2026) and SGC. M was compiled from the Global CMT catalog (Ekström et al., 2012), USGS-NEIC, ISC, and SGC. Focal mechanisms were taken from GCMT and SGC. Geometry of the rupture plane is a simple description from the nodal plane preferred from the focal mechanism selected by the authors of this dataset from the geological context, with strike, dip, and rake for slip kinematics.
M is the preferred magnitude in GMPMs and PSHA. Magnitude range is 3.5 to 7.2. When M was not available, mb or ML values were taken depending on availability. To homogenise these magnitudes into M, we estimated corner frequencies (fc) for each station-event recording. A single-corner ω−2 Brune (1970) source model was then fit to each corrected spectrum via a coarse grid search followed by non-linear least-squares refinement in log-log space, minimizing the residual between the observed and predicted spectral shape. From the resulting fc, the source radius r was computed following Brune (1970), ), using a shear-wave velocity β= 3.5 km s−1 representative of active continental crust. The seismic moment M0 was then obtained from the Eshelby circular-crack relation, , under an assumed constant stress drop (Δσ), and converted to M following Hanks and Kanamori (1979), log10(M0) − 10.7. Values of , and 5 MPa were tested and compared against independently reported M (GCMT and other M solutions) to select the value that best reproduced the catalog magnitudes. Ultimately, a stress drop of 5 MPa was chosen as it yielded the best agreement. This calculated magnitude was used when a reliable agency-reported M was unavailable.
The 227 sites featured in this dataset have been installed, maintained, and administered by SGC (Fig. 1). Of these, 154 sites are also present in the Mercado et al. (2024) database for north-western South America, where the predominant site period (Tn) and the ratios in the Fourier (HVFSR) and pseudo-spectral acceleration (HVRSR) domains were derived from seismograms, they also reported the amplitude of the HVSR at the peak corresponding to Tn (P*). Within this subset, 28 sites additionally have in-situ, microtremor-based measured VS30, available from Mercado et al. (2024). For the remaining sites without in-situ measurements, we report an inferred VS30 taken from the topographic-slope-based VS30 map for Colombia (Eraso and Montejo, 2019).
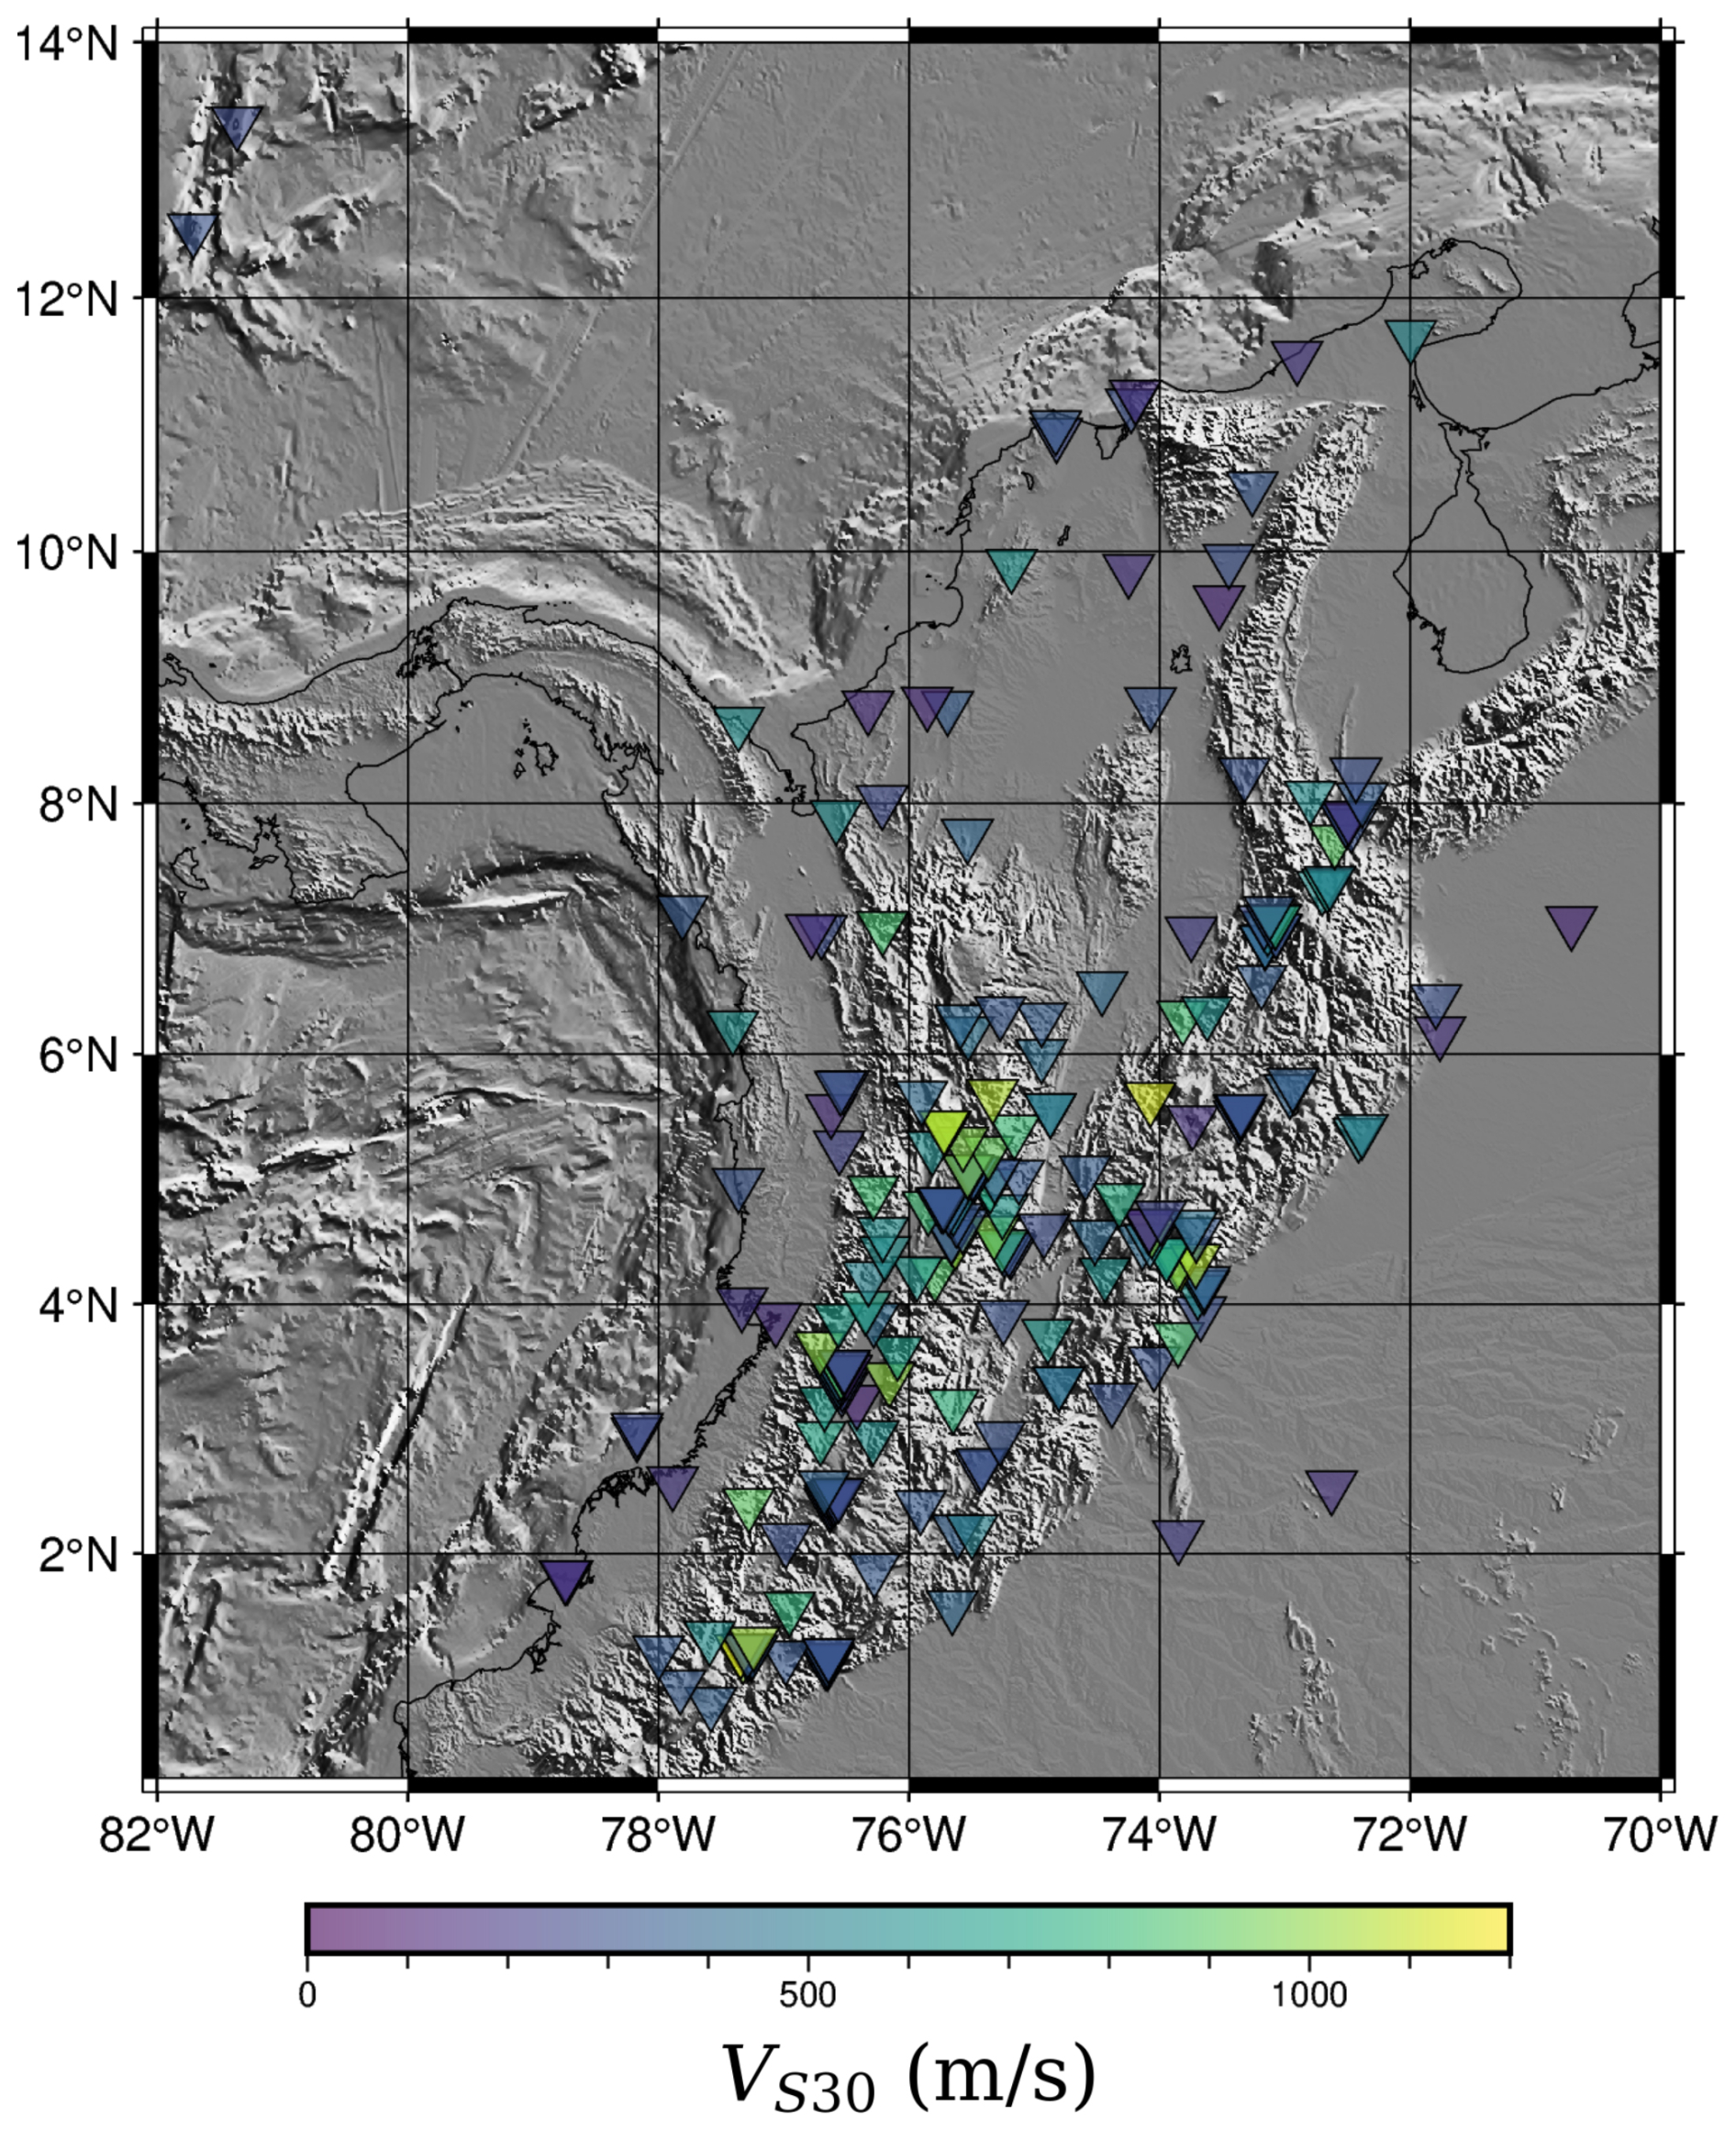
Figure 1Sites used in this work and VS30 (Eraso and Montejo, 2019; Mercado et al., 2024).
Epicentral (Repi) and hypocentral (Rhyp) distances and Azimuth are reported for the entire dataset. Additionally, finite fault distances were computed from the geometry of the rupture plane derived from the preferred nodal plane for events with M> 5.5. Rupture dimensions were computed following Strasser et al. (2010) for subduction interface-related earthquakes and following Wells and Coppersmith (1994) for continental events. The hypocenter was placed at the midpoint of the fault plane, but for earthquakes with hypocentral depths shallower than 10 km, the midpoint of the rupture plane was placed at 12.5 km depth as the average thickness of the seismogenic depth. Joyner-Boore distance (RJB) was computed as the closest horizontal distance from the site to the surface projection of the rupture plane. Rx represents the horizontal distance from the top edge of the rupture measured perpendicular to the fault strike, with positive and negative values indicating sites on the hanging-wall (Rx>0) and footwall (Rx<0) sides, respectively. Ry0 is the horizontal distance measured parallel to the strike from the fault midpoint.
For the waveform processing, we followed the steps presented by Paolucci et al. (2011) and Lanzano et al. (2019):
-
Baseline correction;
-
Cosine taper;
-
Application of a second order acausal bandpass Butterworth filter to the acceleration time-series;
-
Double integration to obtain displacement time series;
-
Linear detrending of the displacement;
-
Double differentiation to get the corrected acceleration.
For the bandpass filter limits, we used median values from Lanzano et al. (2019). As they pointed out, the low-pass filter frequency (flp) is magnitude independent, we took the mean value of 32.26 Hz, while for the high pass (fhp) filter we used a magnitude-dependent function as:
We test the sensitivity of the parameter RotD50 peak ground acceleration (PGA) with the fixed flp of the bandpass filter at 32.26 Hz, taking the records and changing flp in a range of 27 to 37 Hz. The sensitivity analysis shows that most records are weakly affected by the choice of flp, as the average variation is 2.31 % and the 90th quantile is 7.0 %. However, 6.4 % of the recordings exhibit variation larger than 10 % in RotD50 PGA. These records are concentrated around M 4.5 and Repi> 250 km (Fig. A1). These differences are likely related to high-frequency signal content or noise close to the selected filter corner frequency, which could affect the peak acceleration amplitude.
Fourier Amplitude Spectrum (FAS) from the acceleration records in the three components are computed in the frequency range 0.04 to 50.00 Hz, applying Konno and Ohmachi (1998) function with smoothing (Lanzano et al., 2019). An example of FAS computed for an M 6.1 earthquake recorded at 13 km is shown in Fig. 2.
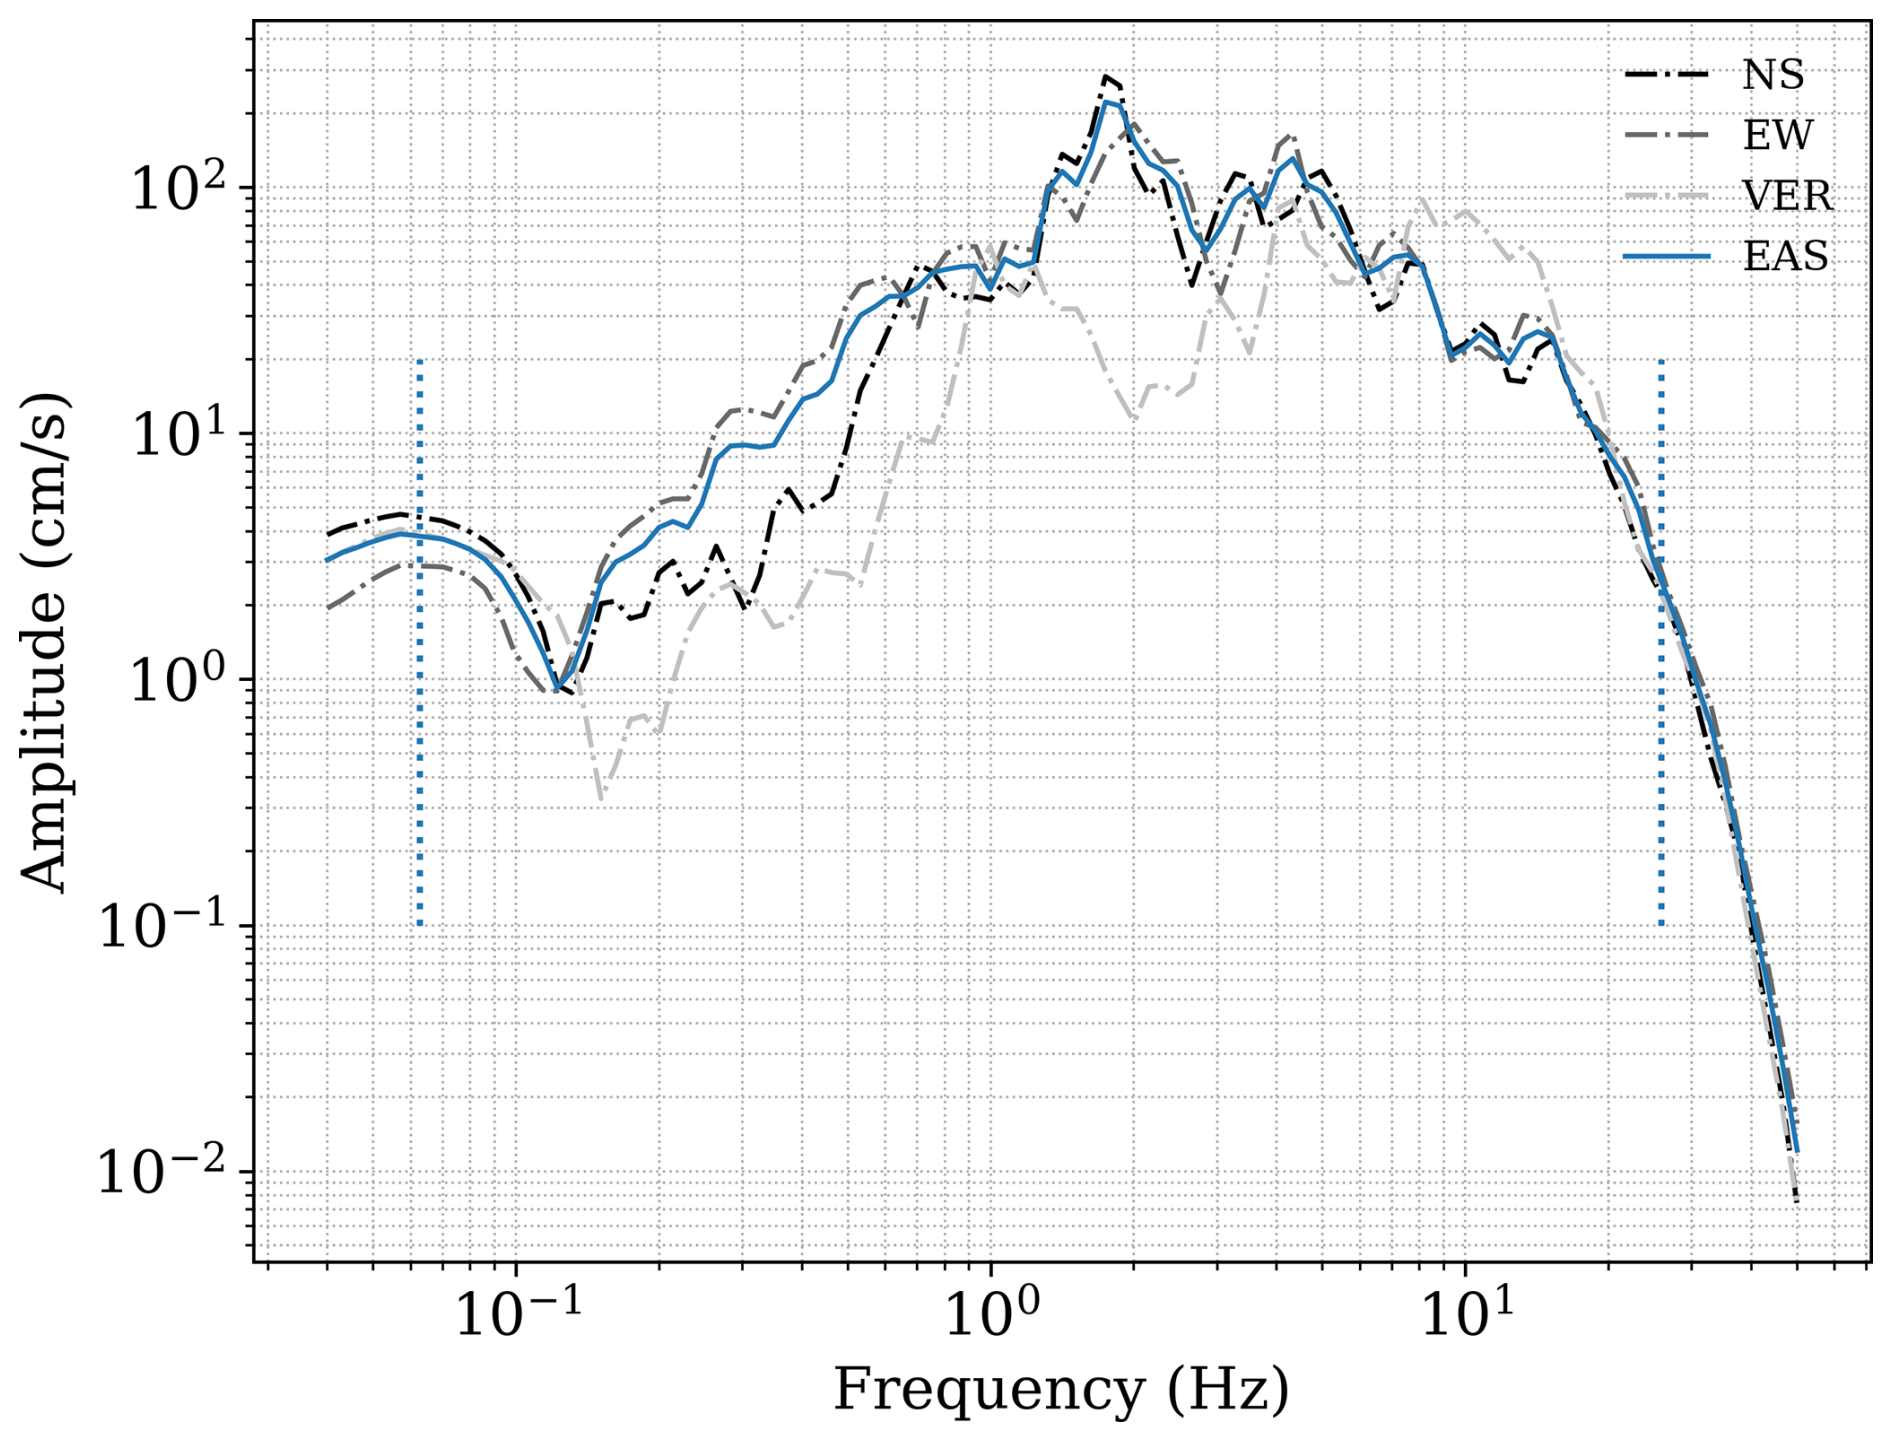
Figure 2Fourier amplitude spectrum recorded by each component at ARMEC. Earthquake occurred on 25 January 1999 with M=6.1. Dotted vertical blue lines represent bandwidth limits of the usable spectra for this earthquake.
Usable frequencies are limited to those between the high-pass and low-pass by a safety factor of 1.25 to ensure that the filters do not have a significant effect on the response spectral values (Abrahamson and Silva, 1997). Hence, the usable bandwidth decreases at low frequencies for small magnitudes, and the upper limit for our dataset is 25.808 Hz. Lowest usable frequencies (LUF) are:
To facilitate direct use of the usable frequency range by the community, we added two columns to the FAS dataset – LUF_Hz and UF_Hz – reporting the lowest and highest usable frequency for each record, respectively.
A compilation of Effective Amplitude Spectrum (EAS) (Kottke et al., 2018), defined in Eq. (3), binned by magnitude, is shown in Fig. 3.
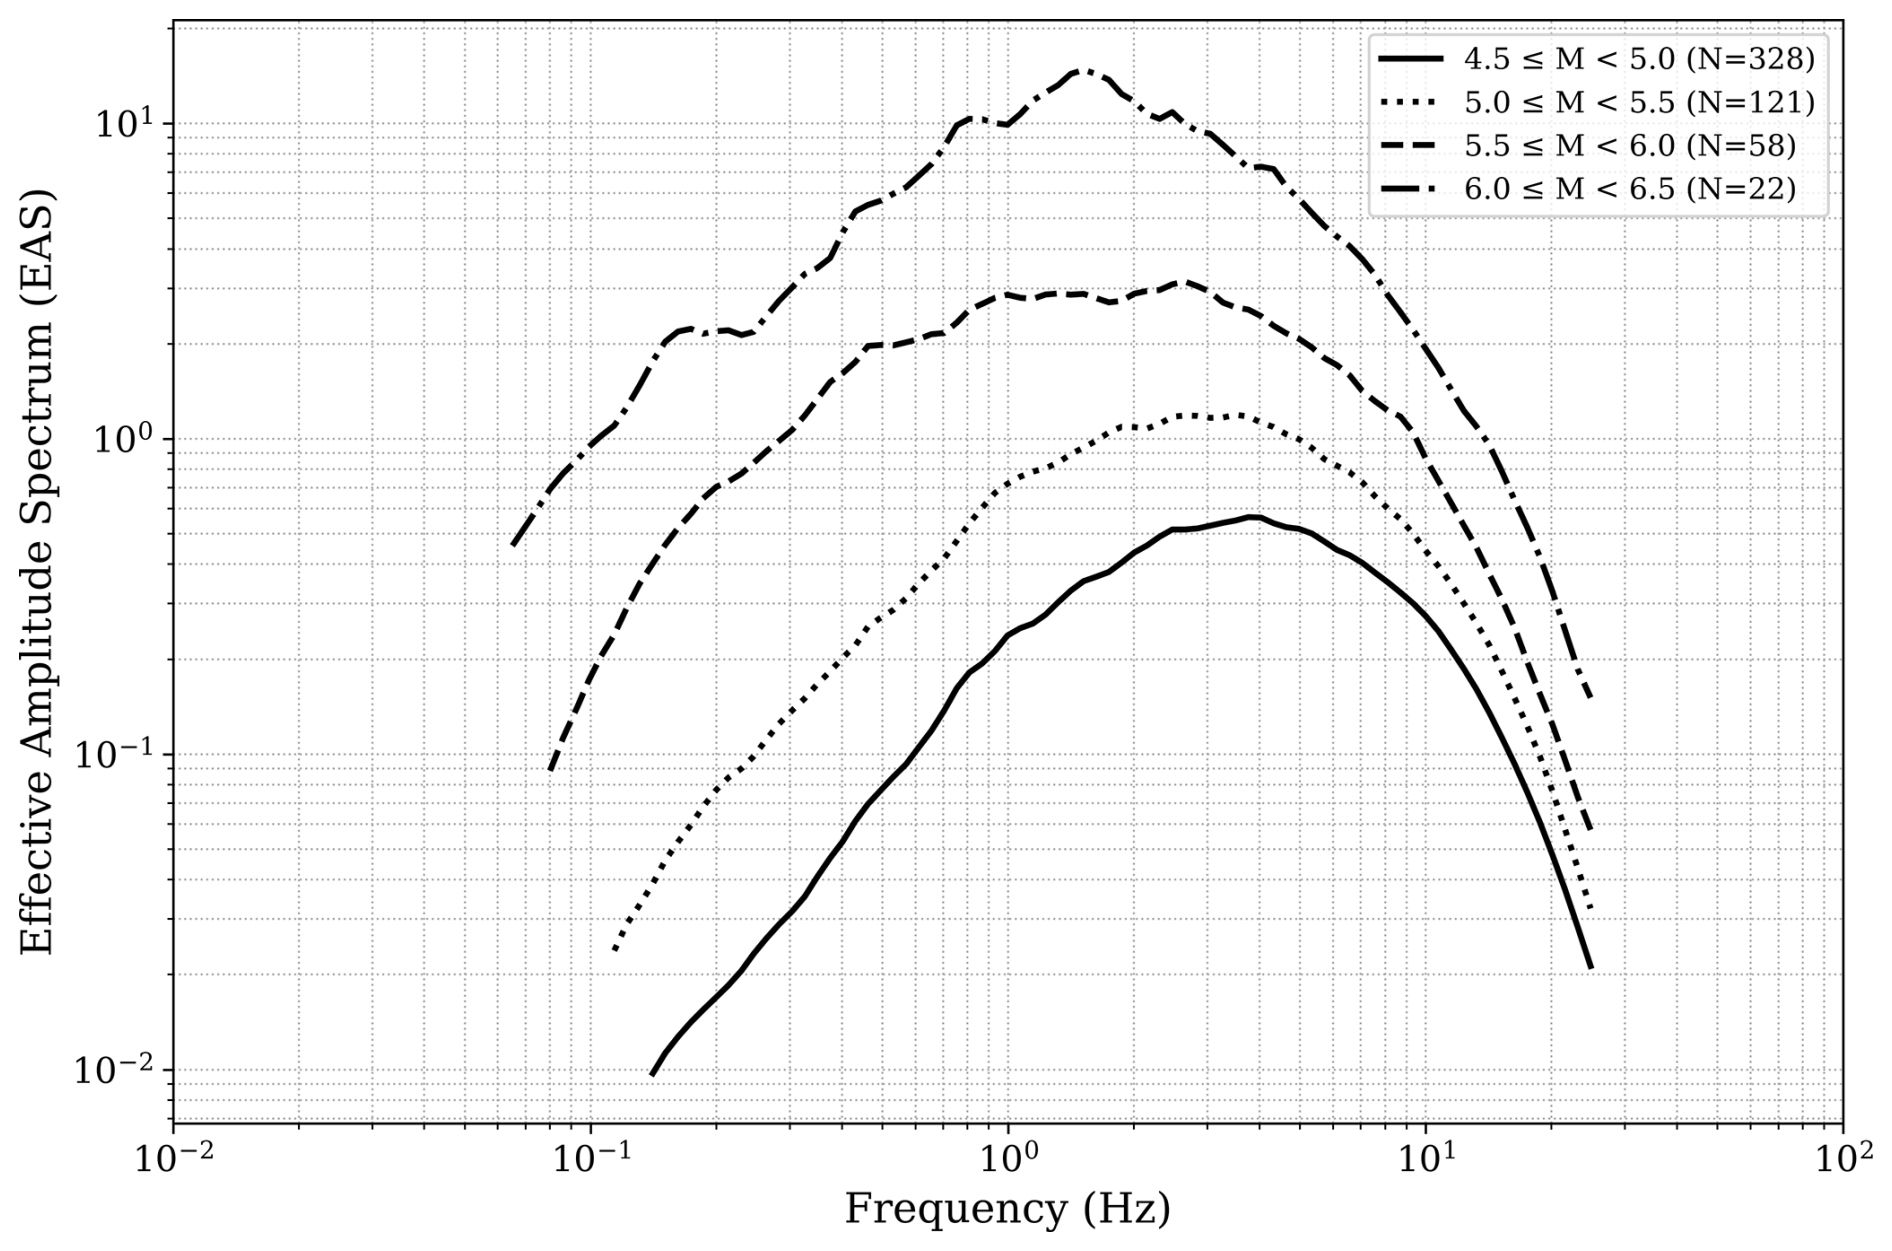
Figure 3Fourier amplitude spectrum geometric mean of the horizontal components (EAS) is binned by magnitudes for records with Repi< 100 km. The limits of usable frequencies as a function of magnitude can be appreciated.
The dataset includes IMs that are independent of sensor orientation, calculated using the median and maximum spectral ordinates over all non-redundant horizontal orientations, RotD50 and RotD100 (Boore, 2010), respectively. All spectral values were computed from the corrected accelerograms using standard response-spectrum analysis. Furthermore, the EAS is computed from the two horizontal components of FAS. The following IMs are provided:
-
RotD50 PGA from the horizontal components.
-
PGA, PGV and PGD for the three components.
-
RotD50 spectral accelerations for 5 % damping and oscillator periods ranging from 0.010 to 8.0 s.
-
Amplitudes of the Fourier Spectrum in the range 0.04 to 50.00 Hz for the three components.
-
EAS defined as
where H1 and H2 are the given horizontal components at specific frequency f of the FAS.
The [M, Repi] distribution of 7550 records from 667 earthquakes in the catalogue is shown in Fig. 4. Epicenters of 488 earthquakes are located in the continental territory, whereas 179 are located offshore of the Colombian coastline. The classification between tectonic environments, such as subduction interface and intraslab among others is left for user determination depending on the slab models and classification methods used.
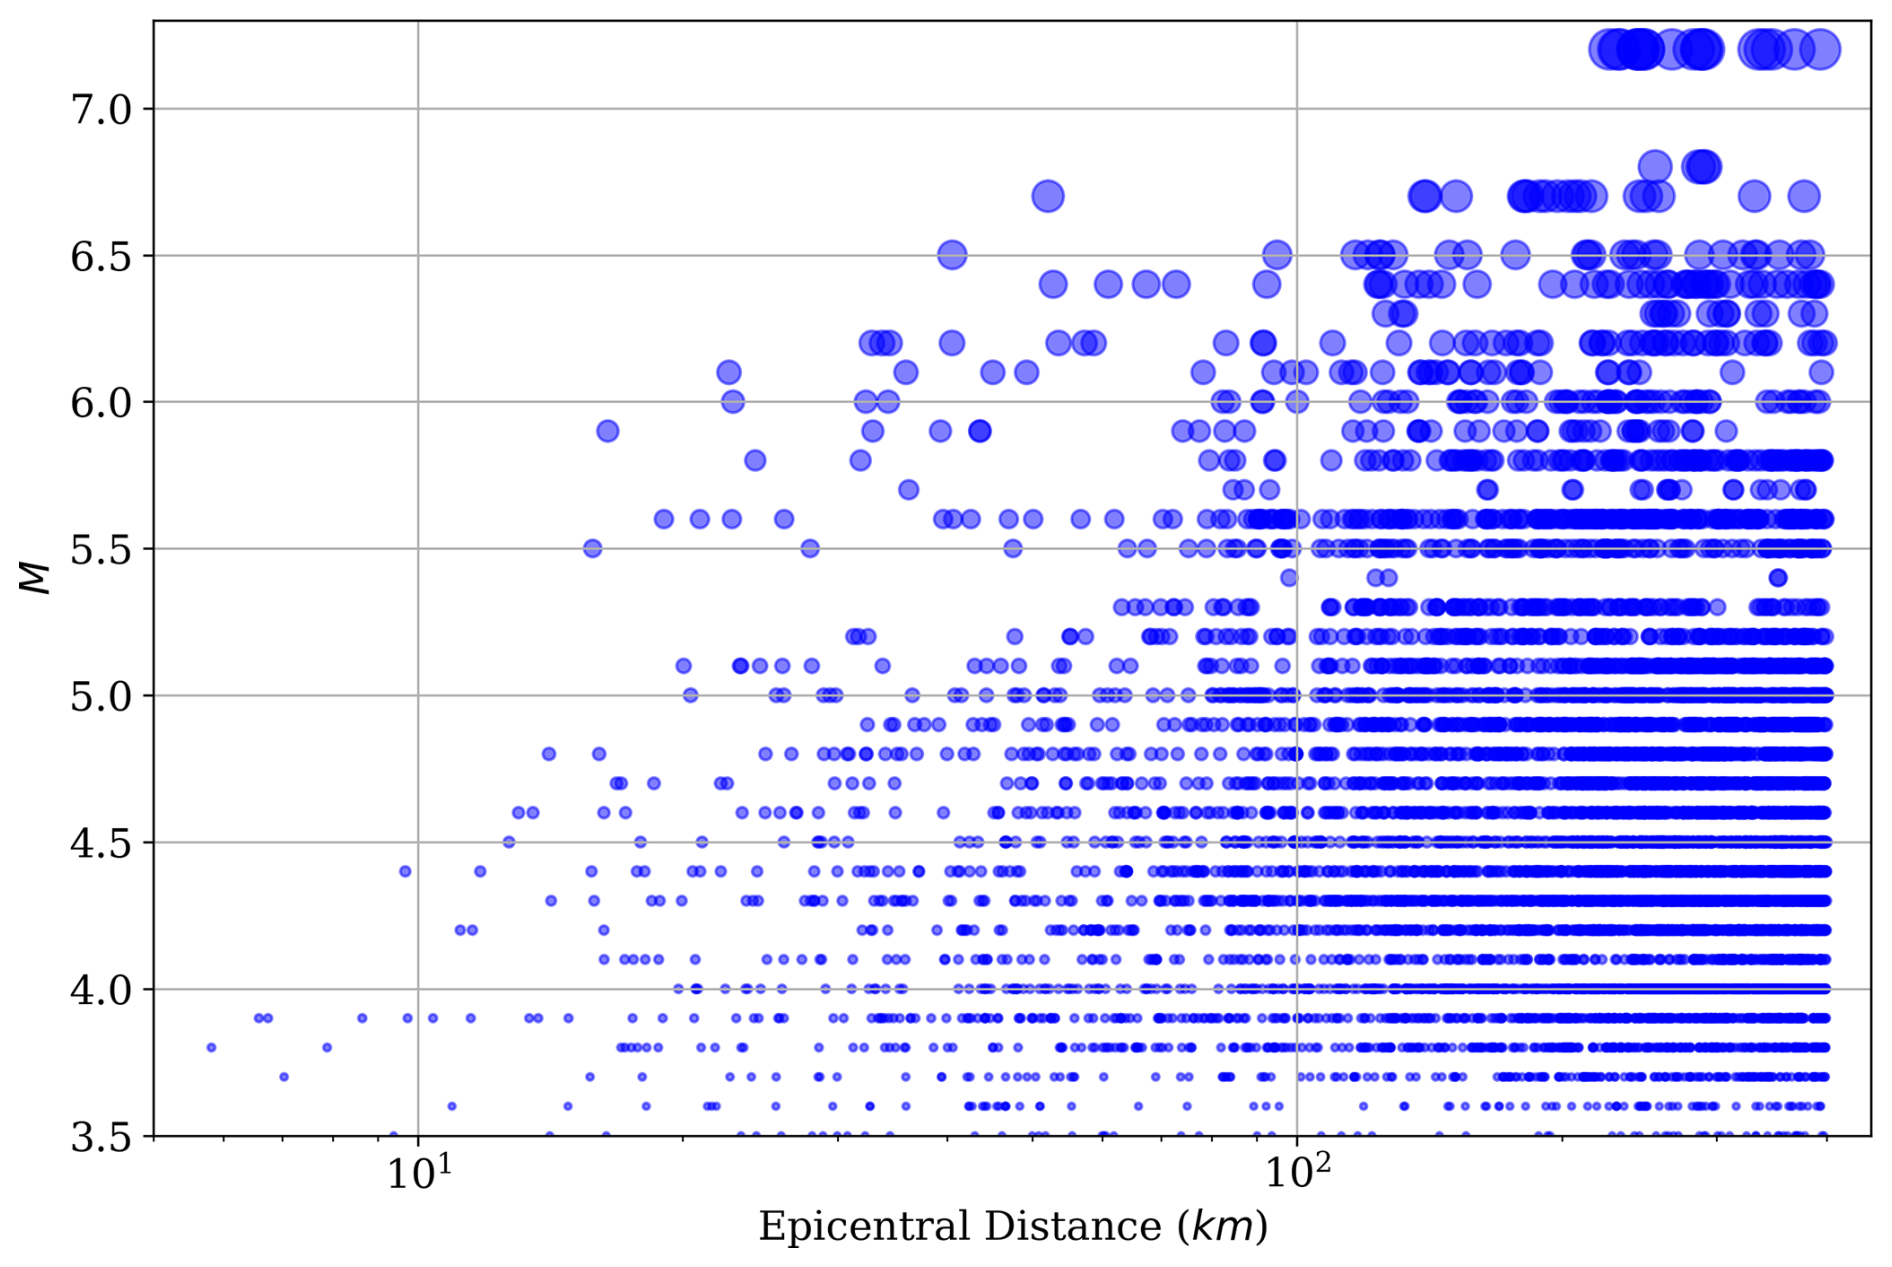
Data are sampled in the magnitude range 3.5–7.2 and for epicentral distances up to 400 km. There is also a significant number of records related to strong events with a magnitude greater than 5.5, corresponding to 9.5 % of the records (716) from 42 earthquakes. In addition, there are 15 events with magnitudes larger than 6.0, such as the M 6.1 1999 Eje Cafetero earthquake, M 7.2 2004 Pizarro earthquake on the Pacific coast, and M 6.1 2023 San Juanito earthquake in eastern Colombia.
Figure 5 shows the number of records by Repi, M, depth, and VS30 in the dataset. Most of the data correspond to distances larger than 100 km (about 85 %); 5.3 % of the records correspond to distances shorter than 50 km. The distribution of recordings by depth shows that most of the data have focal depths shallower than 20 km, corresponding to about 65.4 % of the total records in the flatfile, indicating a predominance of shallow crustal events in the dataset. About 2610 records (34.6 %) correspond to 20 < depth (km) < 55. Although the initial catalogue selection required a raw, non-homogenised magnitude greater than 4, recalculating magnitude to a homogeneous M widened the final magnitude range downward, with 162 of the 667 events (24 %) falling below M 4.
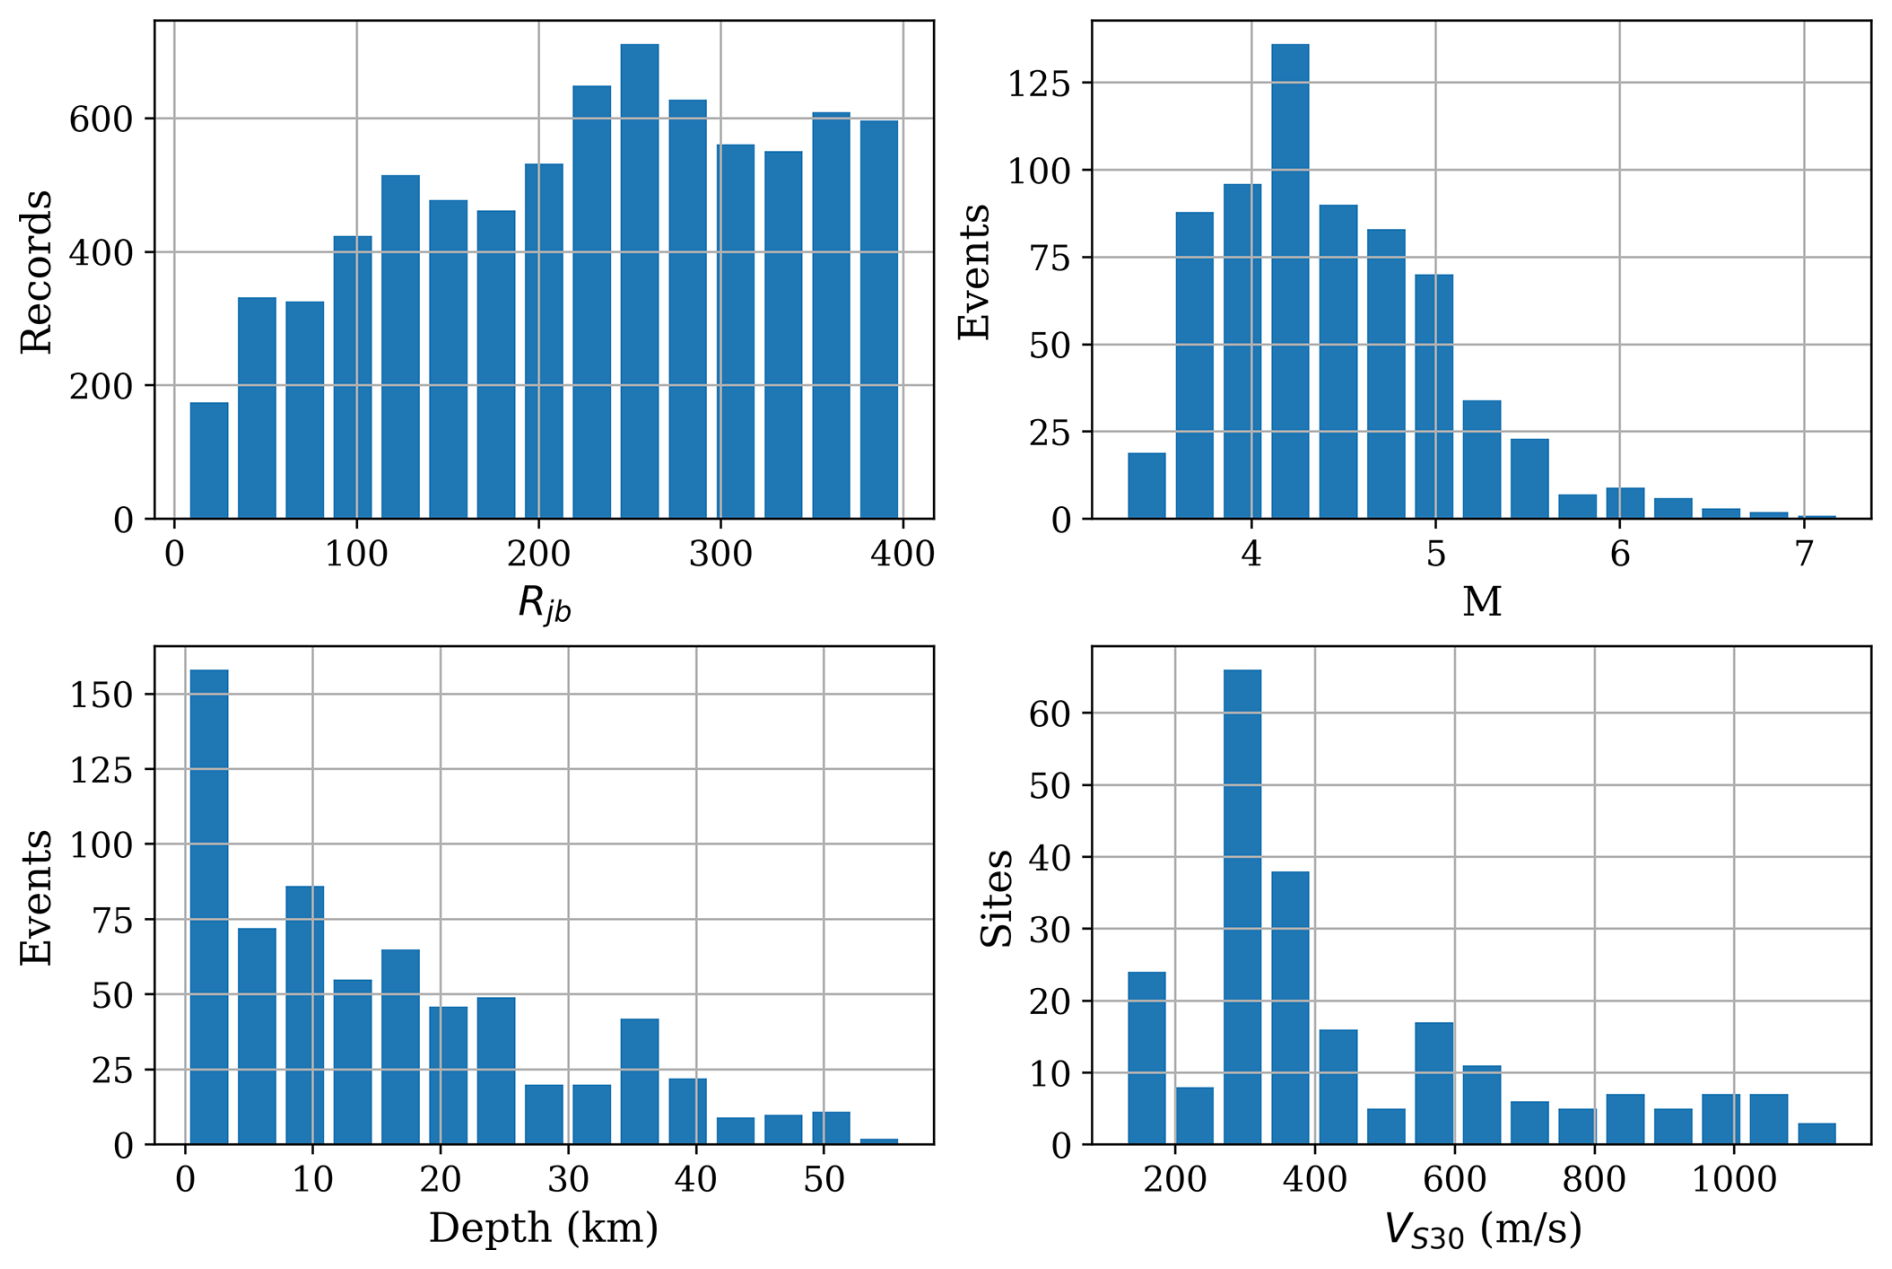
Figure 5Histograms of the records used in the flatfile showing epicentral distance, VS30, magnitude and focal depth of the earthquakes, records and sites used in the dataset.
3.1 Consistency check: Residual analysis
For validation purposes (Bindi et al., 2019), we predicted PGA, SA (RotD50), and EAS IMs of the continental earthquakes in our dataset (488 events) – to compute residuals (Eq. 4) – using the input parameters in the GMPM.
The GMPMs used here are the global development of Abrahamson et al. (2014) – made with the NGA-West 2 dataset – and the one of Arteta et al. (2023), which is a regional development for Northern South America of Abrahamson et al. (2014).
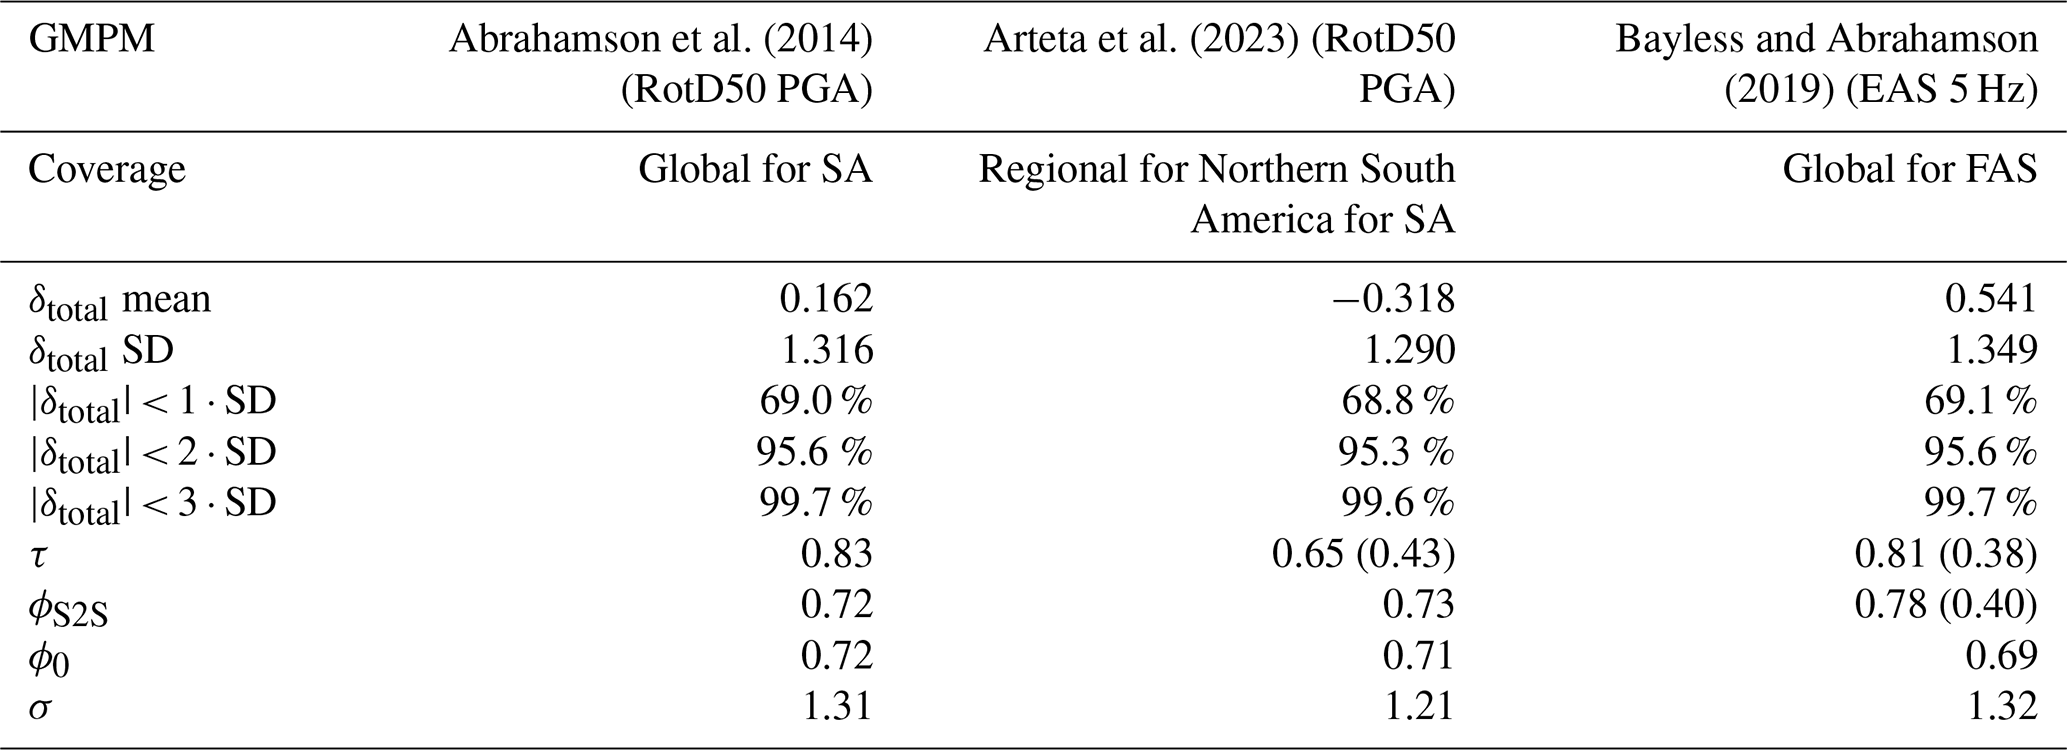
Table 1Basic statistics and standard deviation of the residuals of the dataset from GMPM of Abrahamson et al. (2014), Arteta et al. (2023), and Bayless and Abrahamson (2019). In parentheses is shown the standard deviation from the publication in the original paper.
The comparison between observed and predicted IMs provides a consistency check for the data quality and processing methodology as shown in Fig. 6, where the total residual (δtotal) is plotted against Rhyp and M, without significant biases.
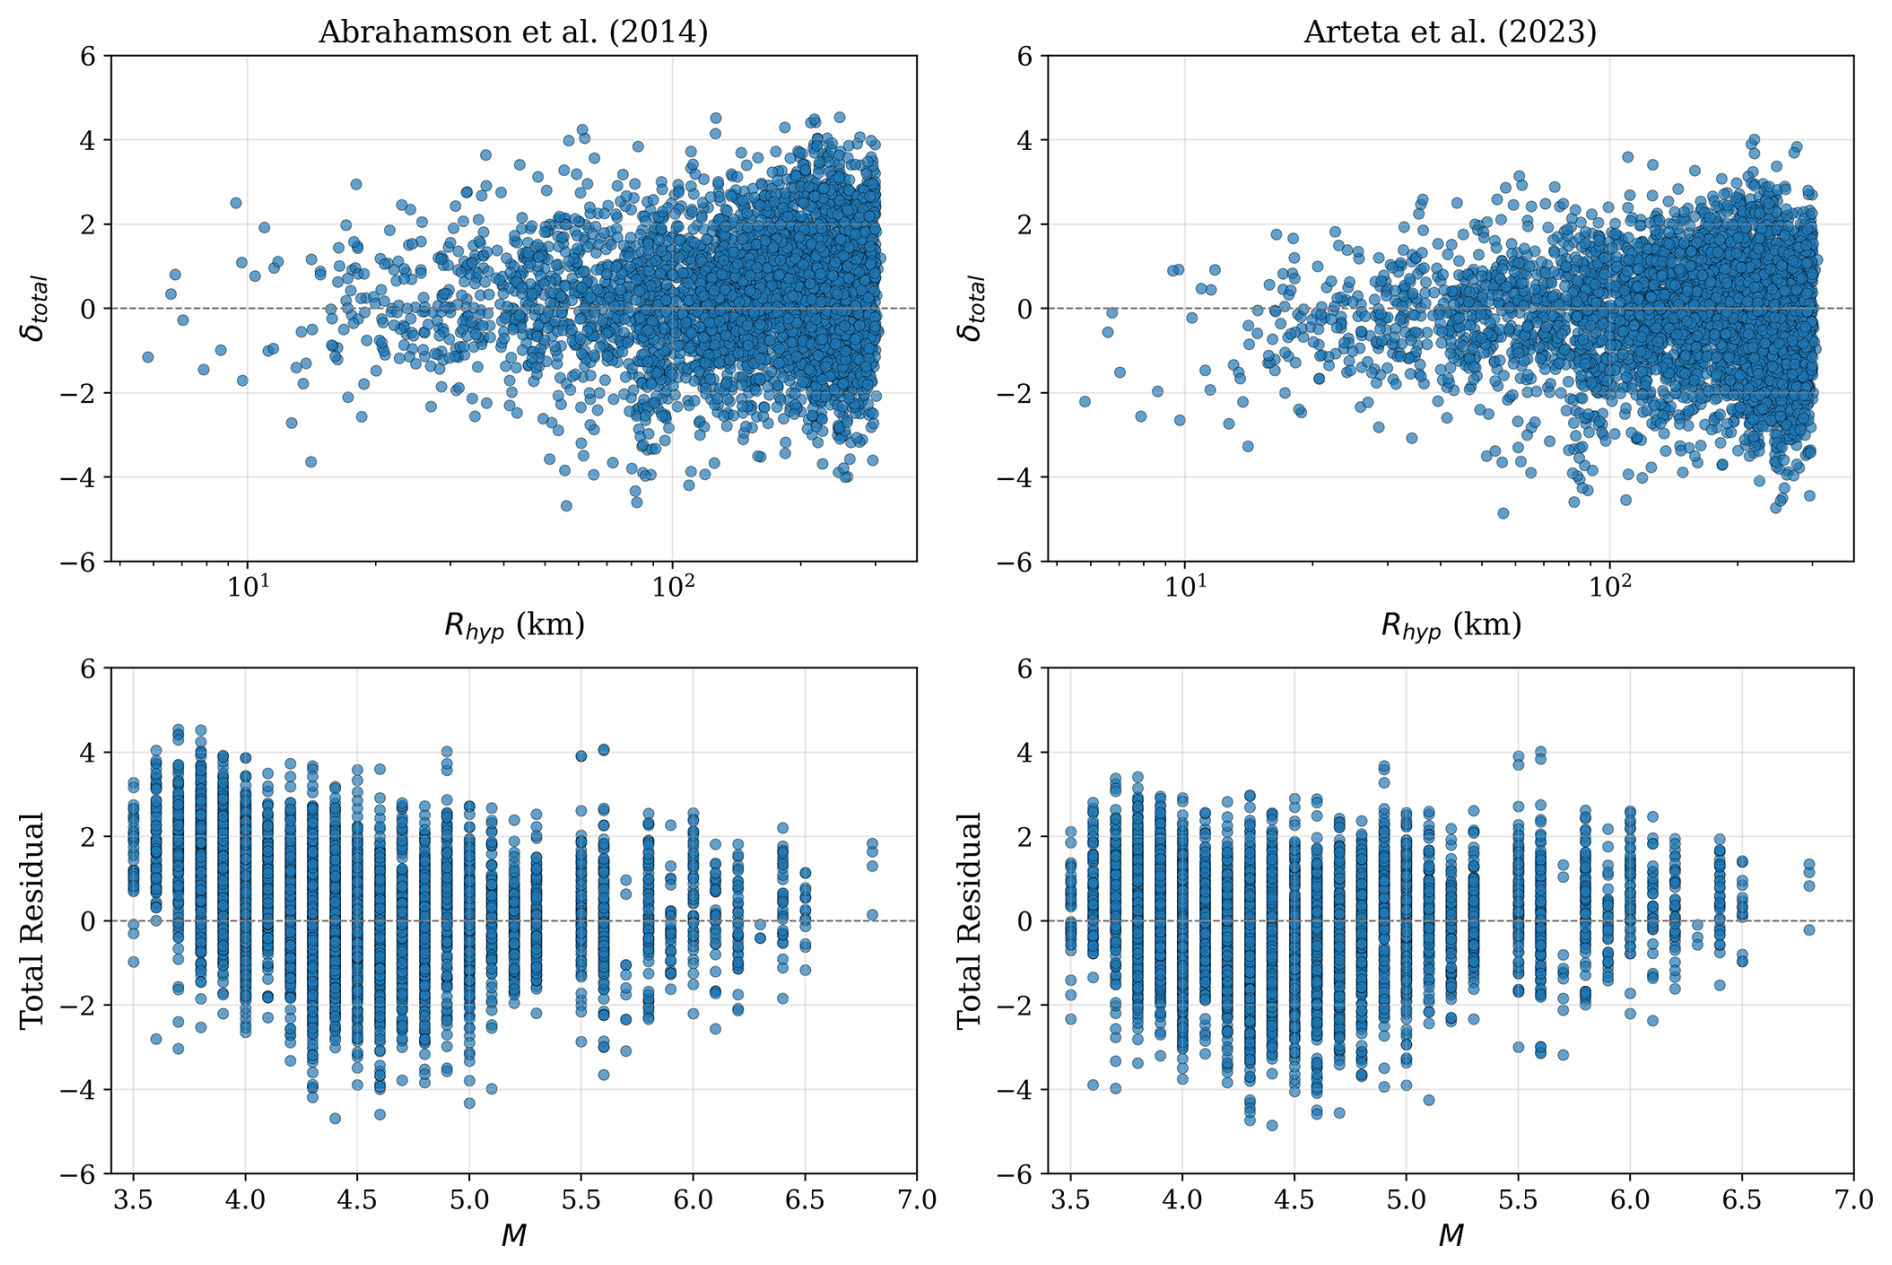
Figure 6Scatterplots of the total residual of the RotD50 PGA of the continental earthquakes in the dataset vs. Rhyp and M. The left panel figures are computed from Abrahamson et al. (2014) and right panel figures are computed from Arteta et al. (2023).
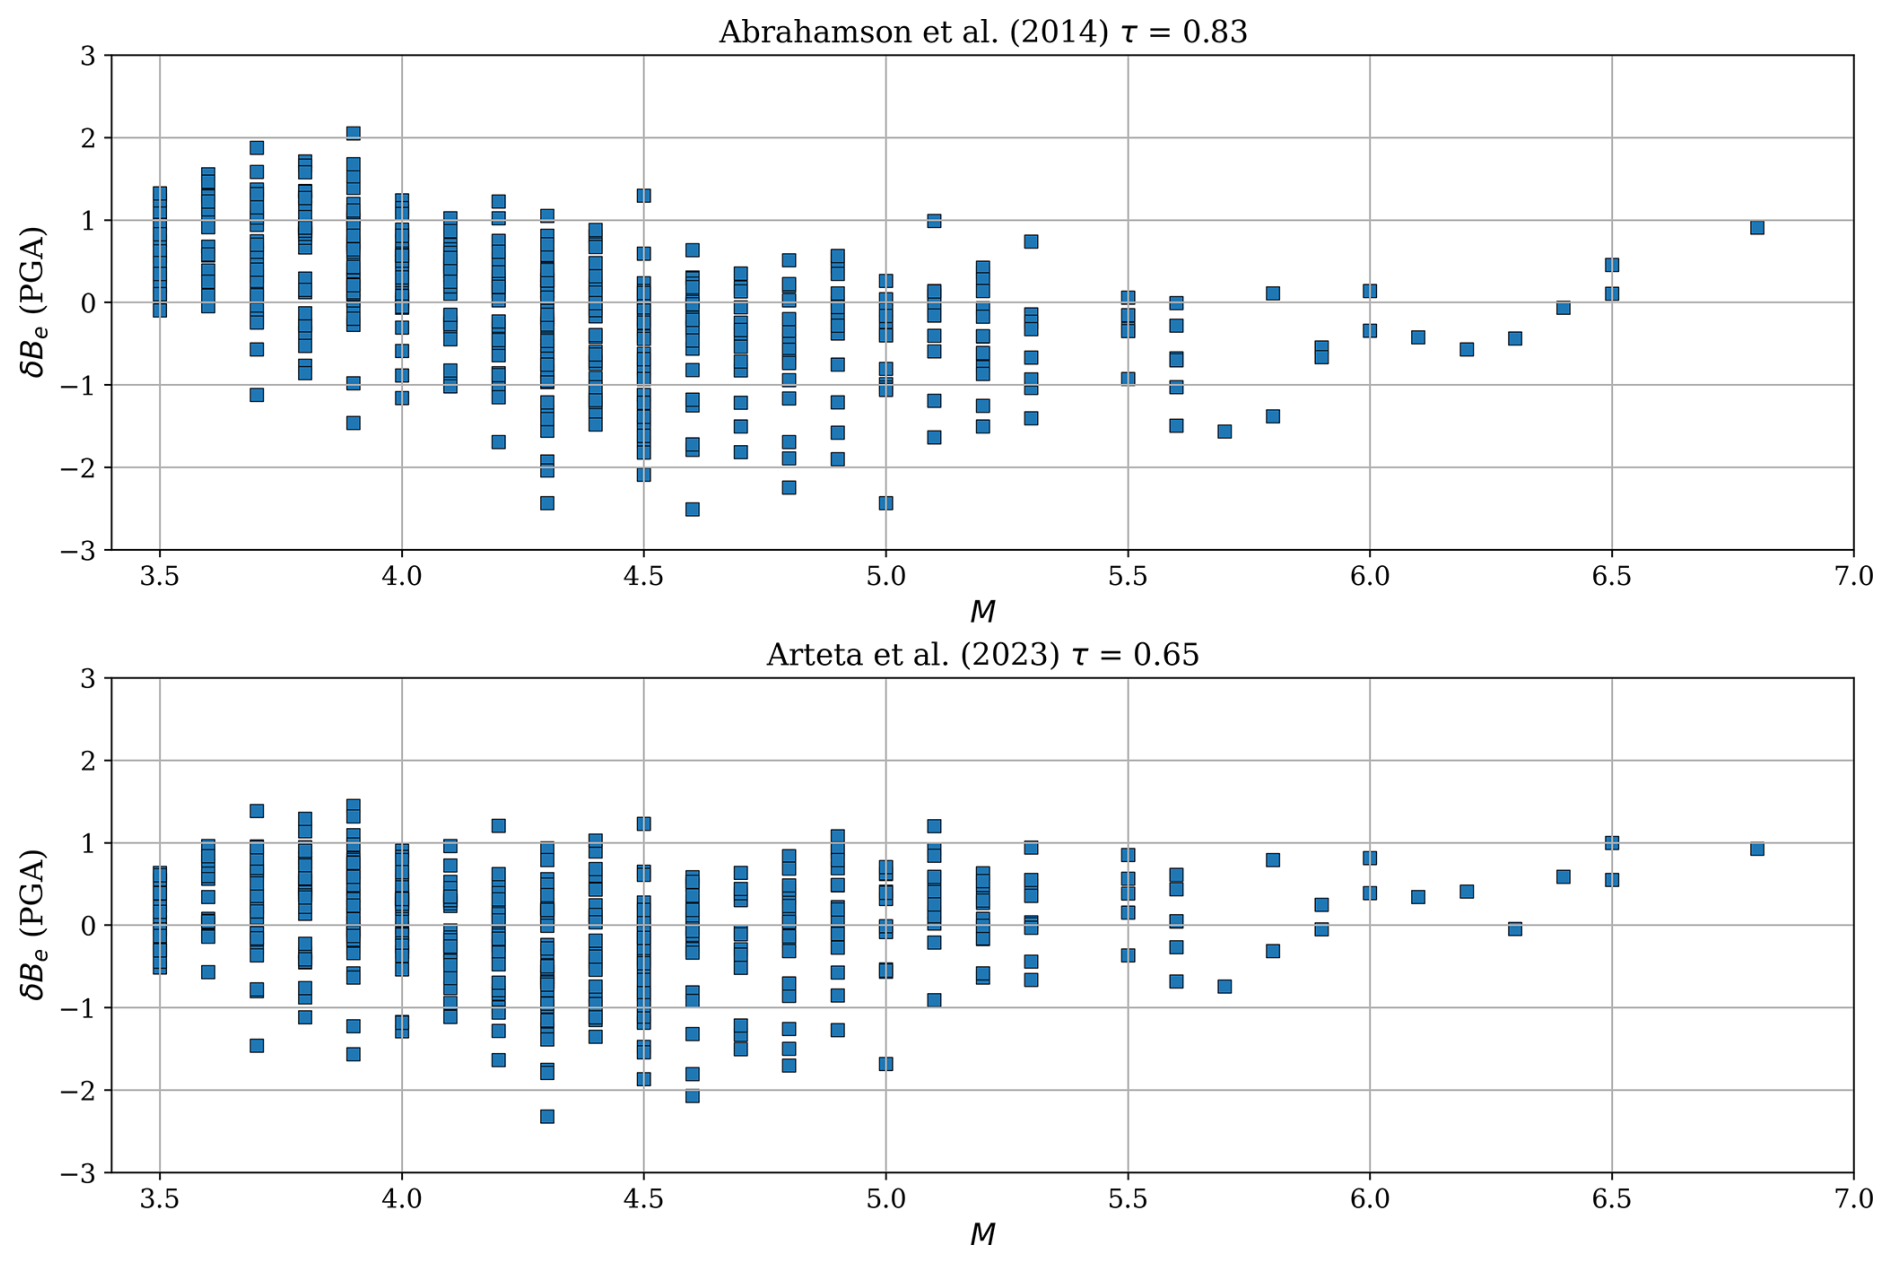
Figure 7Between event variability (δBe) of the continental earthquakes in the dataset and its standard deviation (τ). δBe in the upper panel is computed with Abrahamson et al. (2014) while in the lower panel is computed with Arteta et al. (2023).
The δtotal can be decomposed into between-event (δBe), between-site (δS2Ss), and leftover residuals (ϵ) (Al Atik et al., 2010) as:
where y is the natural logarithm of the observed IMs from an individual earthquake, e, with magnitude M observed at site, s, with VS30 located at a distance Res. ues is the predicted median IMs from the GMPM.
The total standard deviation of the GMPM (σ) can be written as:
where τ, ϕS2S, ϕ0 are the standard deviation of δBe, δS2Ss and ϵ respectively.
Following residual decomposition of Eq. (4), we get δBe and δS2Ss to show their distribution, results are shown in Figs. 7 and 8, respectively, and compiled in Table 1.
Trends of δBe observed in Fig. 7 support the consistency of this dataset, where both GMPMs show low variability. As expected, the regional GMPM (Arteta et al., 2023) shows lower overall variability than the global one (Abrahamson et al., 2014). Within the M [4.2, 4.7) range, around M 4.5, δBe in Arteta et al. (2023) shows a negative trend, suggesting that further magnitude calibration at these levels could help reconcile this discrepancy.
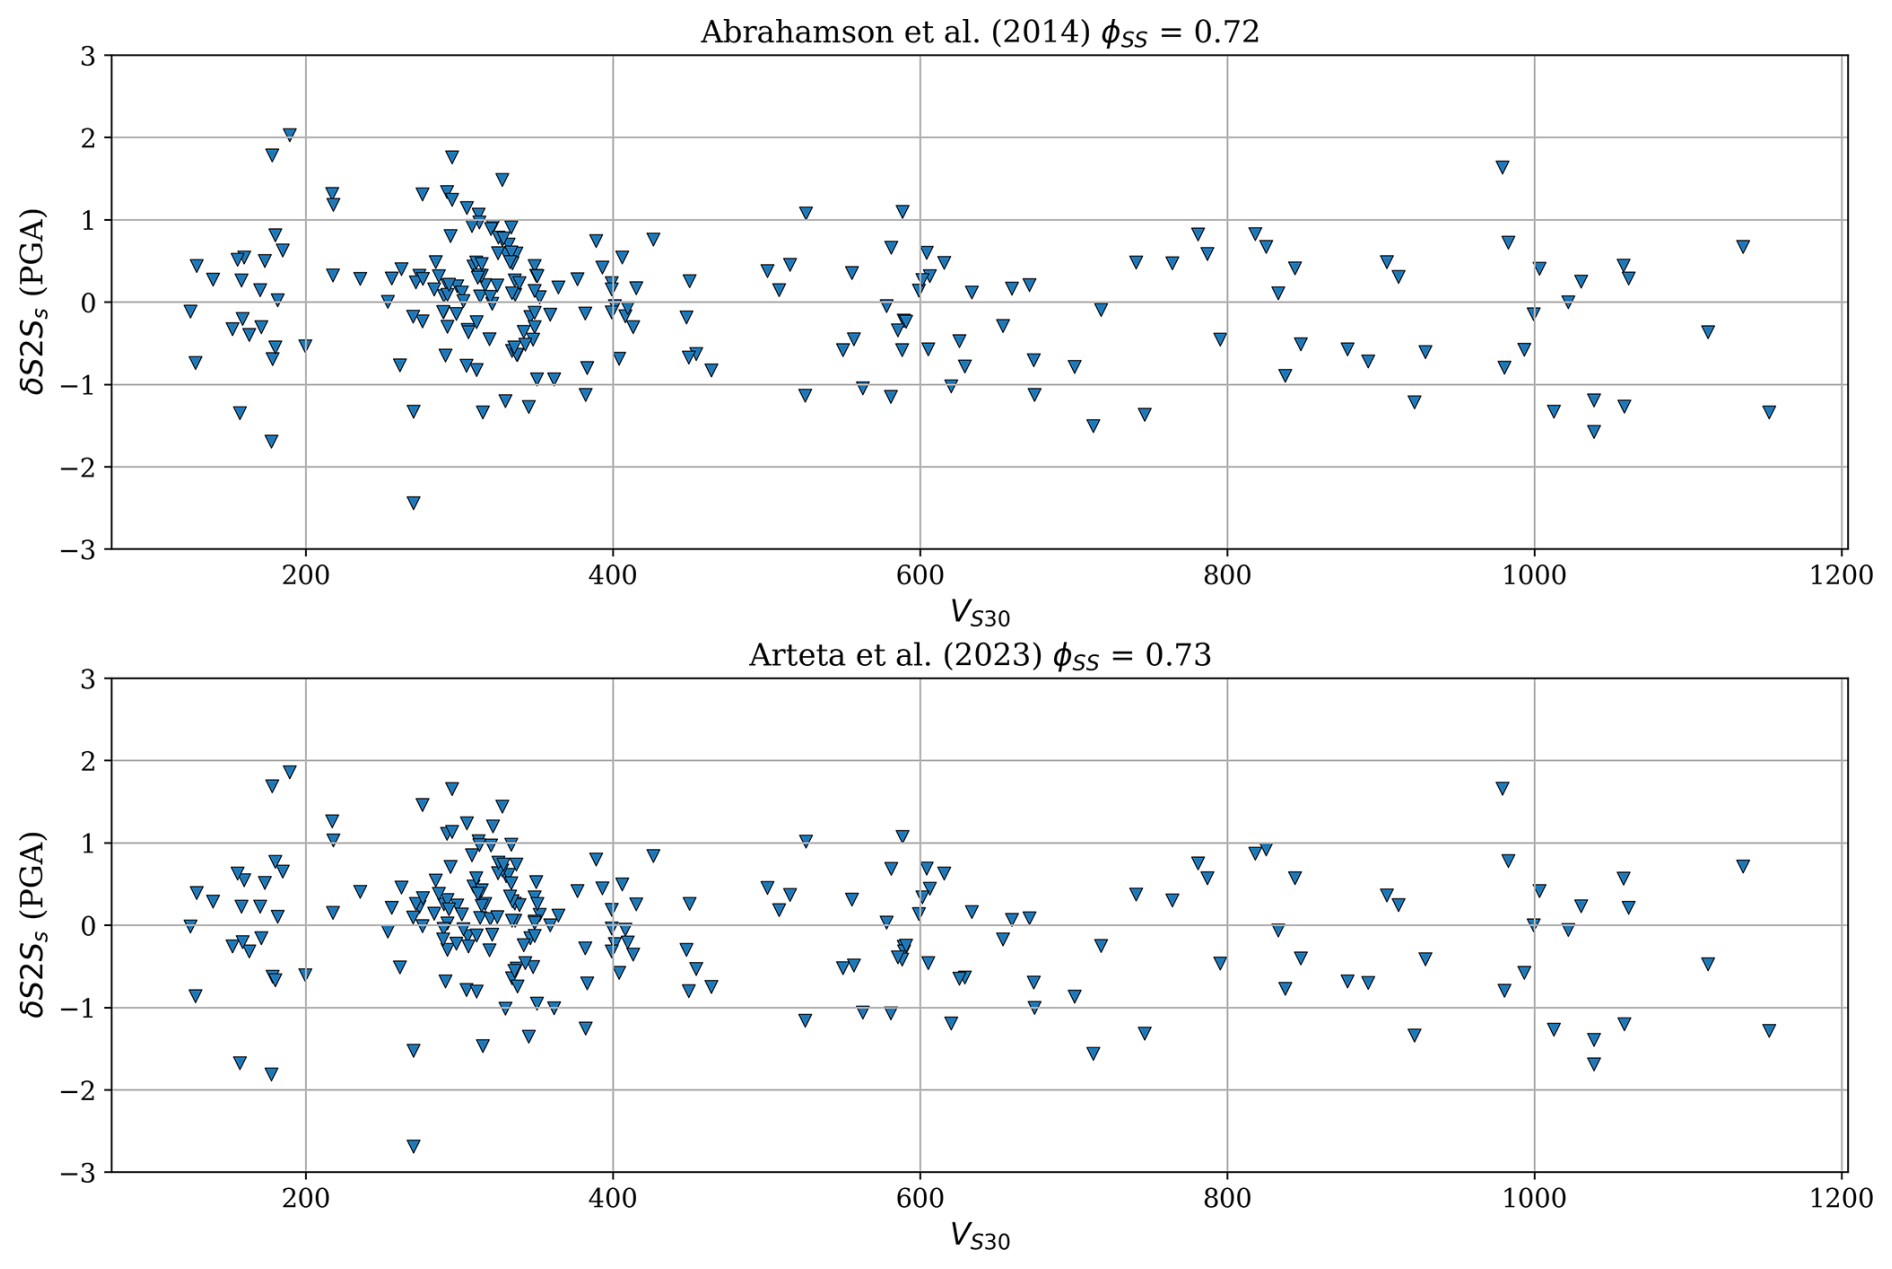
Figure 8Site-to-site residuals (δS2Ss) and their standard deviation (ϕS2S). δS2Ss in the upper panel is computed with respect to Abrahamson et al. (2014), while in the lower panel it is computed with respect to Arteta et al. (2023).
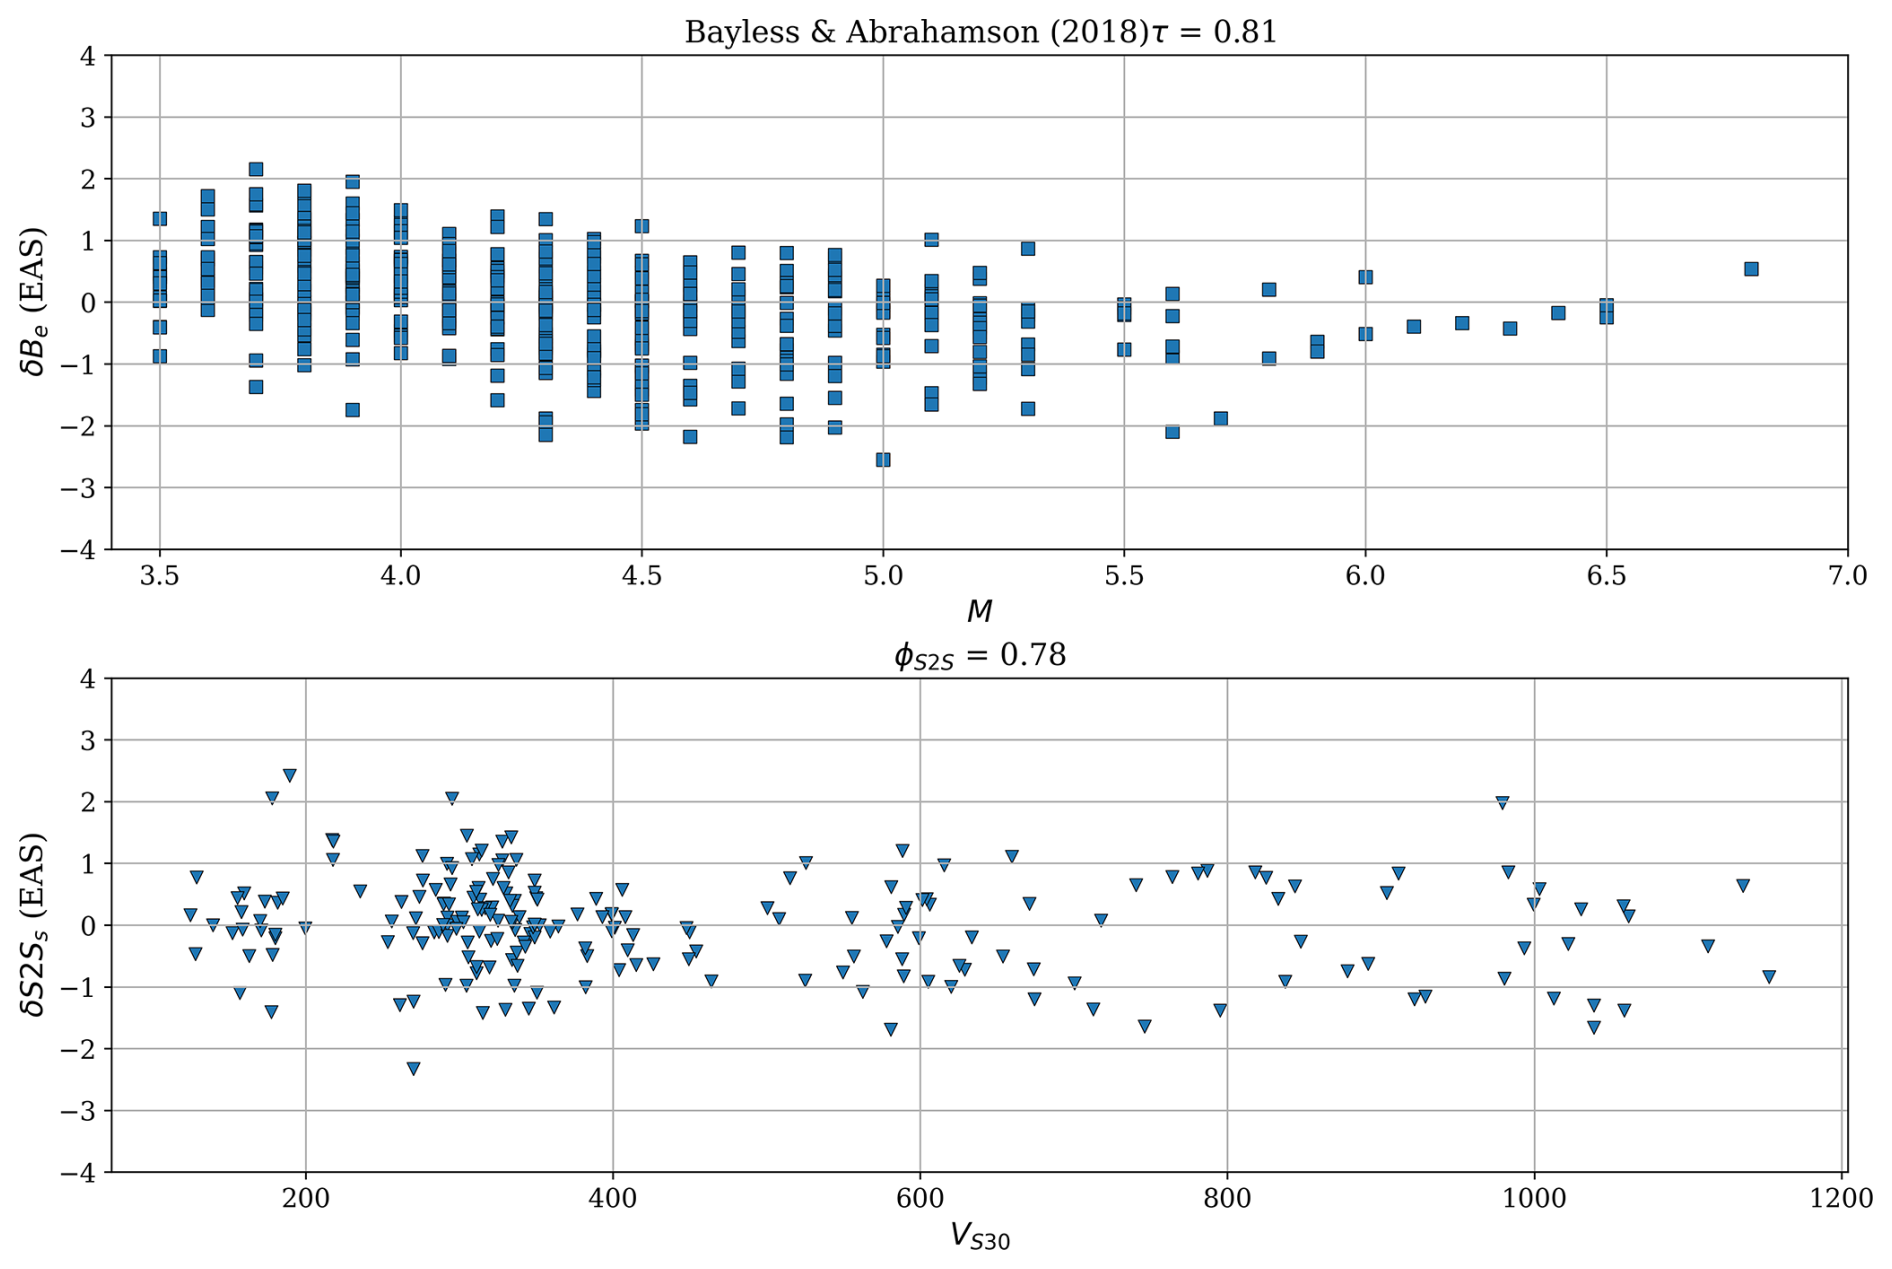
Figure 9δBe and δS2Ss from the EAS (5 Hz) presented in the flatfile and the Bayless and Abrahamson (2019) GMPM. Upper panel: Between event variability (δBe) of the continental earthquakes and its standard deviation (τ). Lower panel: Site-to-site residuals (δS2S) and its standard deviation (ϕS2S).
Given that only 28 of the 227 sites in this dataset have in-situ, microtremor-based measured VS30 (Mercado et al., 2024), the remaining sites rely on inferred VS30 from a topographic-slope-based proxy (Eraso and Montejo, 2019). We argue that this proxy-based approach could introduce additional epistemic uncertainty into the site parameter, potentially increasing the ϕS2S reported in this study. Some authors, such as Mercado et al. (2024), have proposed site classification schemes based on spectral ratio characteristics (HVRSR and HVFSR) as a robust alternative/complement to VS30 based proxies for constraining site response in future applications of this dataset.
For Fourier IMs, we follow the same procedure with the EAS (5 Hz), comparing it with the GMPM of Bayless and Abrahamson (2019). Results are shown in Fig. 9. Statistical values computed are shown in Fig. 9 and Table 1.
We check the mean, standard deviation, and Gaussian-like shape of ϵ, and the Shapiro-Wilk test for normality. Residuals are Gaussian-like distributed for this dataset with respect to both GMPMs, the global and the regional developed one (Table 1 and Figs. A2 and A3). The same result is determined for the Fourier IMs EAS (Table 1 and Fig. A4).
The flatfile described in this paper is openly available under a CC BY 4.0 licence at Zenodo: https://doi.org/10.5281/zenodo.22031680 (Martinez-Jaramillo et al., 2026). The acceleration time series were provided by the SGC and are available at https://catalogo-aceleraciones.sgc.gov.co/ (last access: 5 October 2026) and via FDSN (network CM, https://doi.org/10.7914/SN/CM, Servicio Geológico Colombiano, 1993).
A ground motion flatfile is presented after homogeneous preprocessing of the acceleration records following Paolucci et al. (2011) and Lanzano et al. (2019) of the 7550 three-component records of 667 shallow earthquakes in Colombia, a region with several devastating earthquakes recorded in pre-instrumental and instrumental times. This flatfile is highly useful for characterising and modeling the ground motion associated with shallow tectonic structures in the northwestern Andes, as well as to be used in any seismic hazard assessment in Northern South America or in any comparable tectonic region around the world.
A compilation of the site parameters, such as VS30, , and Tn, was carried out to constrain the characterisation of the sites and their seismic response.
The dataset was validated through residual analysis with a modern and widely used GMPM of Abrahamson et al. (2014), furthermore, with a region adaptation for Northern South America of Arteta et al. (2023). For FAS data, we used the Bayless and Abrahamson (2019) GMPM for validation. We showed the Gaussian-like distribution of the dataset with the aforementioned GMPM.
The Fourier Amplitude Spectrum presented here is a powerful tool that can be used to study source parameters, such as corner frequency, seismic moment, and stress drop.
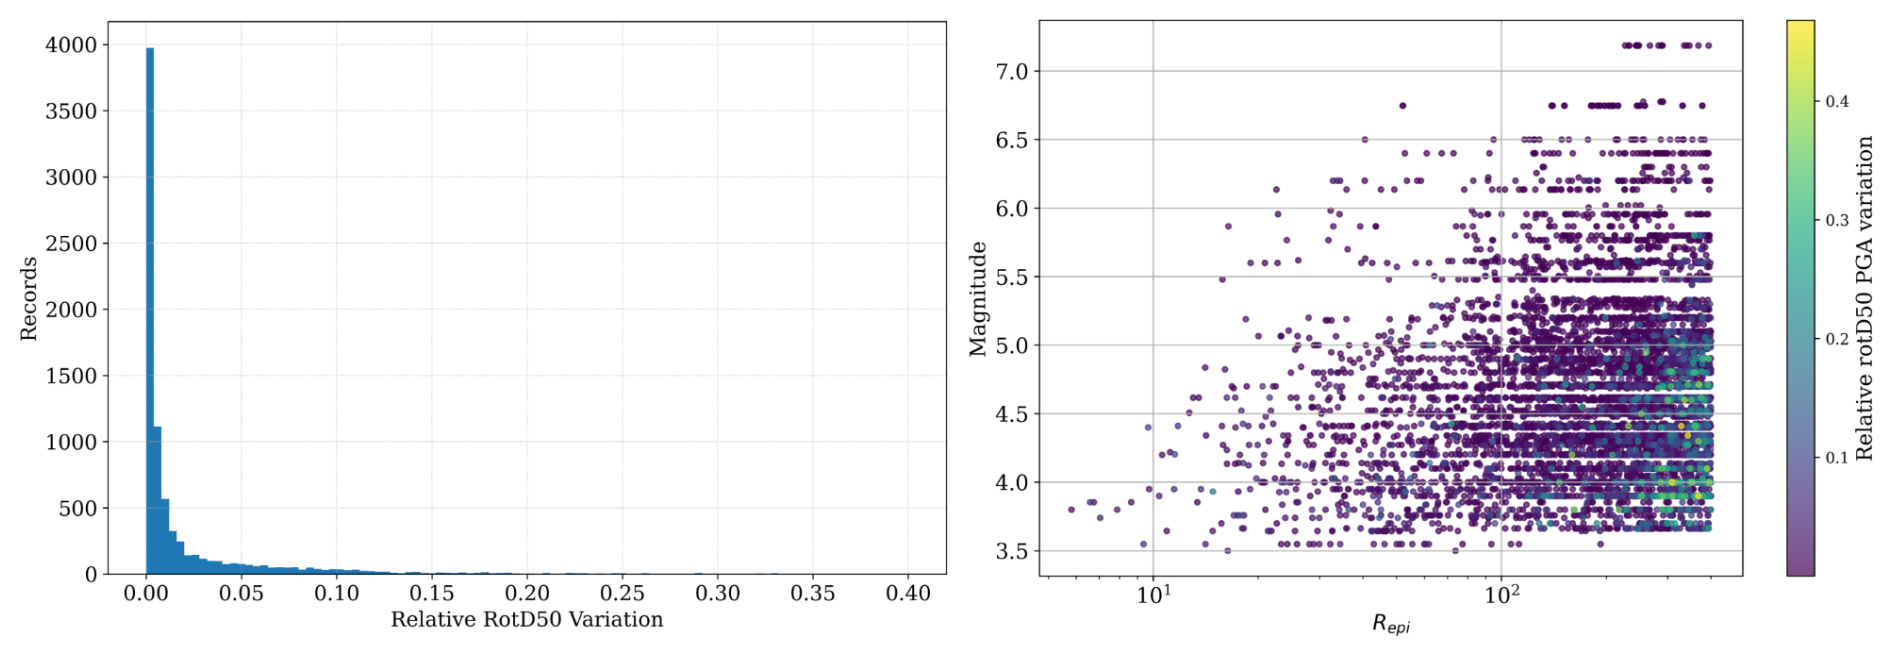
Figure A1Sensitivity test of the low pass frequency for the bandpass filter used in the preprocessing. flp was tested in the range 27 to 37 Hz.
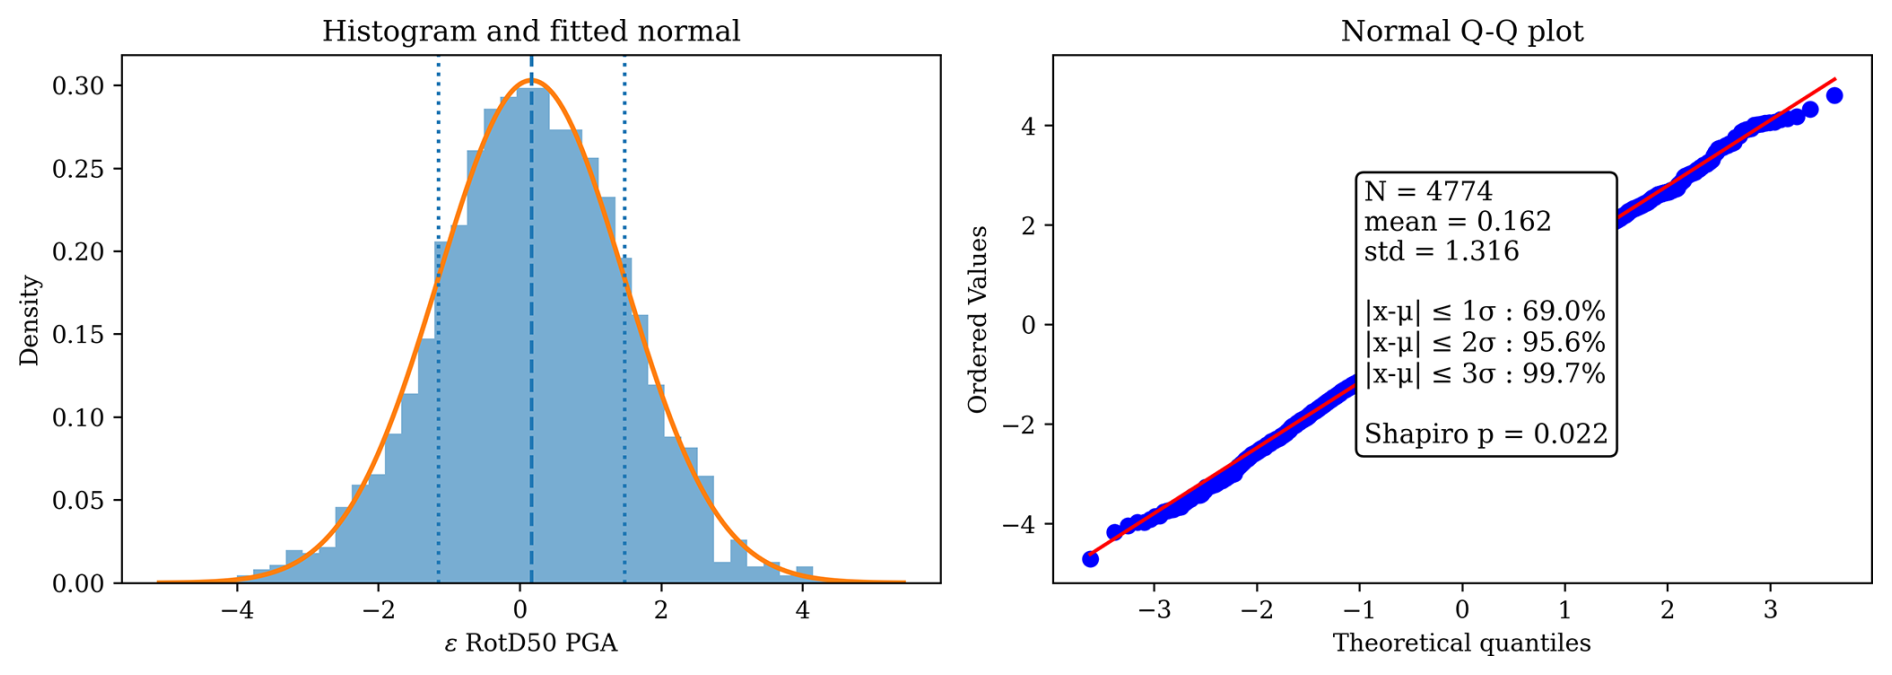
Figure A2Basic normal analysis of the total residuals of RotD50 PGA of the dataset from the GMPM of Abrahamson et al. (2014).
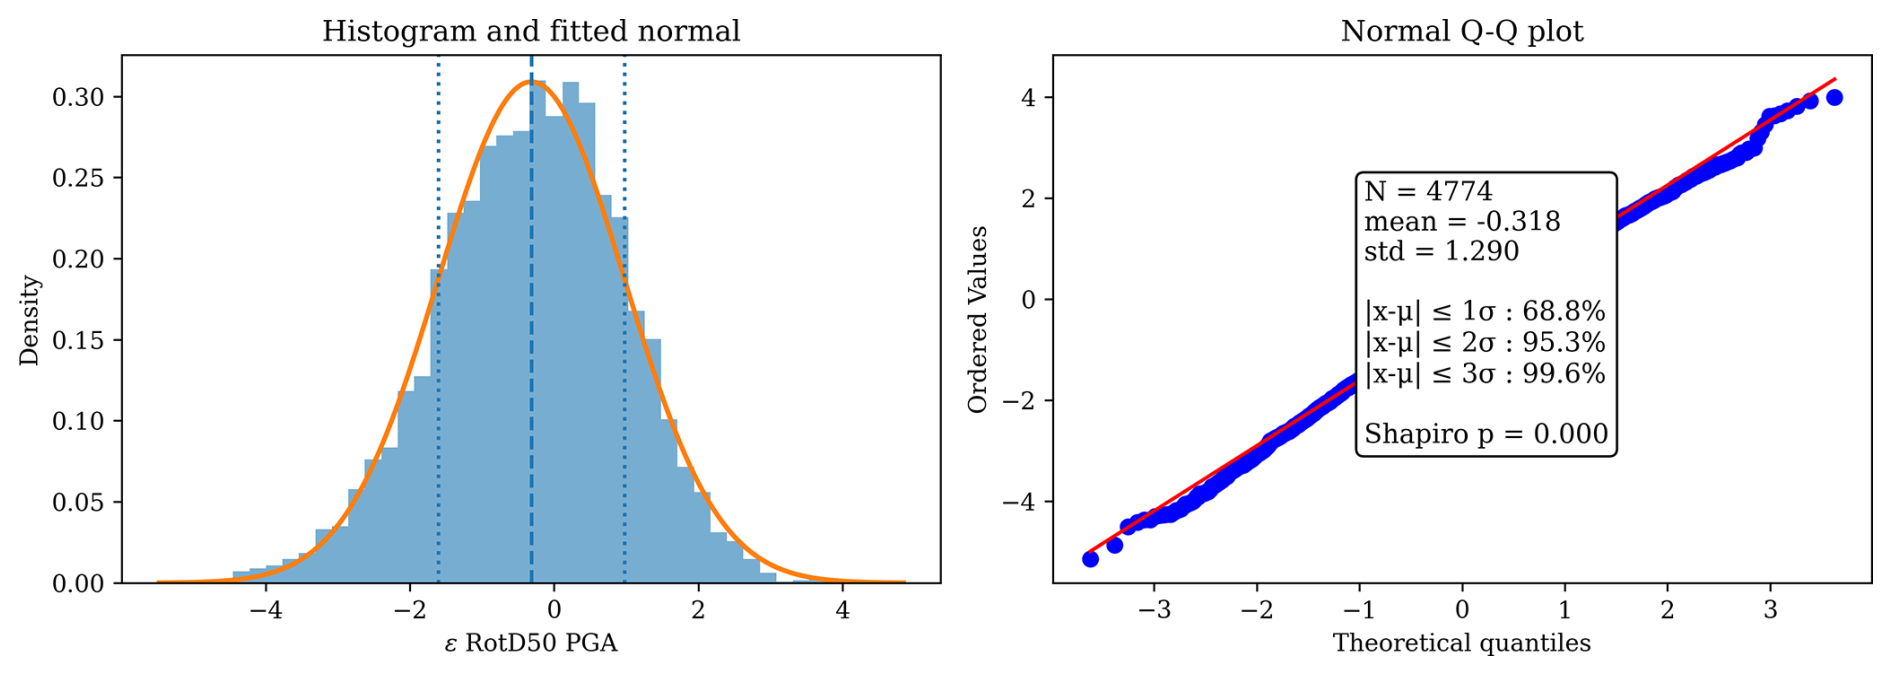
Figure A3Basic normal analysis of the total residuals of RotD50 PGA of the dataset from the GMPM of Arteta et al. (2023).
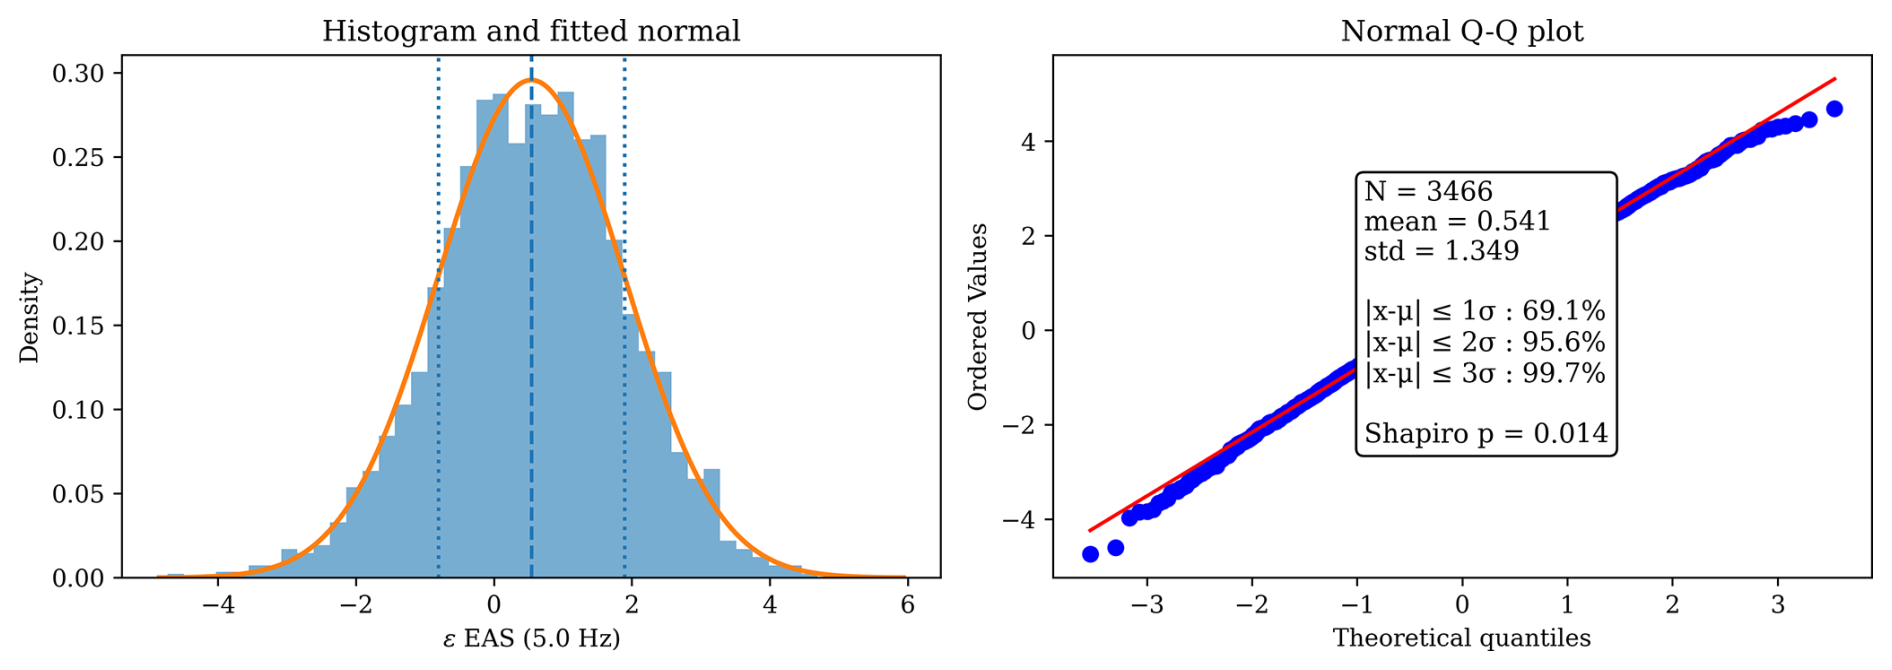
Figure A4Basic normal analysis of the total residuals of EAS (5 Hz) of the dataset from the GMPM of Bayless and Abrahamson (2019).
DMJ: Conceptualization, formal analysis, software, validation, writing original draft. SRK: Conceptualization, formal analysis, software, validation, writing original draft. FRZ: Validation, funding acquisition, writing review and editing. PL: Validation, funding acquisition, writing review and editing.
The contact author has declared that none of the authors has any competing interests.
Publisher's note: Copernicus Publications remains neutral with regard to jurisdictional claims made in the text, published maps, institutional affiliations, or any other geographical representation in this paper. The authors bear the ultimate responsibility for providing appropriate place names. Views expressed in the text are those of the authors and do not necessarily reflect the views of the publisher.
The acceleration time series were given by SGC under request, but also available at: https://catalogo-aceleraciones.sgc.gov.co/ (last access: 5 October 2026).
Daniel Martinez-Jaramillo is a doctoral student of the Earth Sciences Graduate School, Universidad Nacional Autónoma de México and has received a SECIHTI scholarship 1184401. Partial support was received from the France-Mexico collaborative project SEP-CONACYT-ANUIES-ECOS no. 321193.
This paper was edited by Andrea Rovida and reviewed by two anonymous referees.
Abrahamson, N. A. and Silva, W. J.: Empirical response spectral attenuation relations for shallow crustal earthquakes, Seismol. Res. Lett., 68, 94–127, https://doi.org/10.1785/gssrl.68.1.94, 1997.
Abrahamson, N. A., Silva, W. J., and Kamai, R.: Summary of the ASK14 ground motion relation for active crustal regions, Earthq. Spectra, 30, 1025–1055, https://doi.org/10.1193/070913EQS198M, 2014.
Akkar, S., Sandıkkaya, M. A., Şenyurt, M., Azari Sisi, A., Ay, B. Ö., Traversa, P., Douglas, J., Cotton, F., Luzi, L., Hernandez, B., and Godey, S.: Reference database for seismic ground-motion in Europe (RESORCE), B. Earthq. Eng., 12, 311–339, https://doi.org/10.1007/s10518-013-9506-8, 2014.
Al Atik, L., Abrahamson, N., Bommer, J. J., Scherbaum, F., Cotton, F., and Kuehn, N.: The variability of ground-motion prediction models and its components, Seismol. Res. Lett., 81, 794–801, https://doi.org/10.1785/gssrl.81.5.794, 2010.
Ancheta, T. D., Darragh, R. B., Stewart, J. P., Seyhan, E., Silva, W. J., Chiou, B. S.-J., Wooddell, K. E., Graves, R. W., Kottke, A. R., Boore, D. M., Kishida, T., and Donahue, J. L.: NGA-West2 database, Earthq. Spectra, 30, 989–1005, https://doi.org/10.1193/070913EQS197M, 2014.
Arteta, C. A., Pajaro, C. A., Mercado, V., Montejo, J., Arcila, M., and Abrahamson, N. A.: Ground-motion model for subduction earthquakes in northern South America, Earthq. Spectra, 37, 2419–2452, https://doi.org/10.1177/87552930211027585, 2021.
Arteta, C. A., Pajaro, C. A., Mercado, V., Montejo, J., Arcila, M., and Abrahamson, N. A.: Ground-motion model (GMM) for crustal earthquakes in Northern South America (NoSAm crustal GMM), B. Seismol. Soc. Am., 113, 186–203, https://doi.org/10.1785/0120220168, 2023.
Bastías, N. and Montalva, G. A.: Chile Strong Ground Motion Flatfile, Earthq. Spectra, 32, 2549–2566, https://doi.org/10.1193/102715EQS158DP, 2016.
Bayless, J. and Abrahamson, N. A.: Summary of the BA18 ground-motion model for Fourier amplitude spectra for crustal earthquakes in California, B. Seismol. Soc. Am., 109, 2088–2105, https://doi.org/10.1785/0120190077, 2019.
Bindi, D., Kotha, S. R., Weatherill, G., Lanzano, G., Luzi, L., and Cotton, F.: The pan-European engineering strong motion (ESM) flatfile: consistency check via residual analysis, B. Earthq. Eng., 17, 583–602, https://doi.org/10.1007/s10518-018-0466-x, 2019.
Boore, D. M.: Orientation-independent, nongeometric-mean measures of seismic intensity from two horizontal components of motion, B. Seismol. Soc. Am., 100, 1830–1835, https://doi.org/10.1785/0120090400, 2010.
Brune, J. N.: Tectonic stress and the spectra of seismic shear waves from earthquakes, J. Geophys. Res., 75, 4997–5009, https://doi.org/10.1029/JB075i026p04997, 1970.
Buscetti, M., Traversa, P., Perron, V., Rischette, P., Hollender, F., and Shible, H.: Epos-France Database of Earthquake Ground Motion for Mainland France: 1996–2021 Updated Version, Seismol. Res. Lett., 96, 1214–1226, https://doi.org/10.1785/0220240053, 2025.
Dawood, H. M., Rodriguez-Marek, A., Bayless, J., Goulet, C., and Thompson, E.: A flatfile for the KiK-net database processed using an automated protocol, Earthq. Spectra, 32, 1281–1302, https://doi.org/10.1193/071214EQS106, 2016.
Ekström, G., Nettles, M., and Dziewonski, A. M.: The global CMT project 2004–2010: Centroid-moment tensors for 13,017 earthquakes, Phys. Earth Planet. In., 200–201, 1–9, https://doi.org/10.1016/j.pepi.2012.04.002, 2012.
Eraso, J. and Montejo, J.: Mapa de Vs30 Integrado para Colombia, Servicio Geológico Colombiano, Bogotá, https://doi.org/10.32685/4.3.2020.927, 2019.
Goulet, C. A., Kishida, T., Ancheta, T. D., Cramer, C. H., Darragh, R. B., Silva, W. J., Hashash, Y. M. A., Harmon, J., Parker, G. A., Stewart, J. P., and Youngs, R. R.: PEER NGA-east database, Earthq. Spectra, 37, 1331–1353, https://doi.org/10.1177/87552930211015695, 2021.
Hanks, T. C. and Kanamori, H.: A moment magnitude scale, J. Geophys. Res., 84, 2348–2350, https://doi.org/10.1029/JB084iB05p02348, 1979.
International Seismological Centre: ISC-EHB dataset, International Seismological Centre [data set], https://doi.org/10.31905/PY08W6S3, 2026 (last access: 12 August 2026).
Konno, K. and Ohmachi, T.: Ground-motion characteristics estimated from spectral ratio between horizontal and vertical components of microtremor, B. Seismol. Soc. Am., 88, 228–241, https://doi.org/10.1785/BSSA0880010228, 1998.
Kottke, A., Abrahamson, N. A., Boore, D. M., Bozorgnia, Y., Goulet, C. A., Hollenback, J., Kishida, T., Der Kiureghian, A., Ktenidou, O.-J., Kuehn, N., Rathje, E. M., Silva, W. J., Thompson, E., and Wang, X.: Selection of random vibration procedures for the NGA East Project, PEER Report No. 2018/05, Pacific Earthquake Engineering Research Center, University of California, Berkeley, CA, https://peer.berkeley.edu/publications/2018-05 (last access: 5 October 2026), 2018.
Lanzano, G., Sgobba, S., Luzi, L., Puglia, R., Pacor, F., Felicetta, C., D'Amico, M., Cotton, F., and Bindi, D.: The pan-European Engineering Strong Motion (ESM) flatfile: compilation criteria and data statistics, B. Earthq. Eng., 17, 561–582, https://doi.org/10.1007/s10518-018-0480-z, 2019.
Marín-Arias, J. P., Castillo González, H., and Salcedo Hurtado, E. de J.: Modelo geométrico del foco del terremoto de Popayán (Colombia) a partir de datos macrosísmicos, Bol. Geol., 28, 93–109, https://www.redalyc.org/articulo.oa?id=349631992005 (last access: 5 October 2026, 2006.
Marín-Arias, J. P., Valencia Muñoz, L. Y., and Rendón Cardona, L. M.: Macroseismic analysis of Murindo earthquake, Antioquia (Colombia) October 1992, Bol. Geol., 31, 85–93, http://www.scielo.org.co/pdf/boge/v31n1/v31n1a06.pdf (last access: 5 October 2026), 2009.
Martinez-Jaramillo, D., Kotha, S. R., Zúñiga, F. R., and Lacan, P.: Ground-Motion Dataset for Shallow Earthquakes in Colombia (v2), Zenodo [data set], https://doi.org/10.5281/zenodo.22031680, 2026.
Mercado, V., Díaz-Parra, F. J., Pajaro, C. A., Montejo, J., Posada, G., Arcila, M., and Arteta, C. A.: Performance evaluation of parameters as estimators of seismic site effects in northern South America, Soil Dyn. Earthq. Eng., 180, 108584, https://doi.org/10.1016/j.soildyn.2024.108584, 2024.
Montejo, J., Arcila Rivera, M., and Zornosa, D. G.: Integrated Seismic Catalog for Colombia, Bol. Geol., 50, https://doi.org/10.32685/0120-1425/bol.geol.50.1.2023.665, 2023.
Mosquera-Machado, S., Lalinde-Pulido, C., Salcedo-Hurtado, E., and Michetti, A. M.: Ground effects of the 18 October 1992, Murindo earthquake (NW Colombia), using the Environmental Seismic Intensity Scale (ESI 2007) for the assessment of intensity, Geol. Soc. Spec. Publ., 316, 123–144, https://doi.org/10.1144/SP316.7, 2009.
Oliveti, I., Faenza, L., and Michelini, A.: Intensity-ground motion dataset for Italy (INGe), version 2.0, Istituto Nazionale di Geofisica e Vulcanologia (INGV) [data set], https://doi.org/10.13127/inge.2, 2021.
Pacor, F., Felicetta, C., Lanzano, G., Sgobba, S., Puglia, R., D'Amico, M., Russo, E., Baltzopoulos, G., and Iervolino, I.: NESS1: A worldwide collection of strong-motion data to investigate near source effects, Seismol. Res. Lett., 89, 2299–2313, https://doi.org/10.1785/0220180149, 2018.
Pájaro, C. A., Arteta, C. A., Mercado, V., Montejo, J., Arcila, M., and Abrahamson, N. A.: Partially non-ergodic ground motion model for the Bucaramanga seismic nest in Northern South America (NoSAm Nest GMM), B. Earthq. Eng., 22, 3677–3702, https://doi.org/10.1007/s10518-024-01898-w, 2024.
Paolucci, R., Pacor, F., Puglia, R., Ameri, G., Cauzzi, C., and Massa, M.: Record processing in ITACA, the new Italian strong-motion database, in: Earthquake Data in Engineering Seismology, edited by: Akkar, S., Gülkan, P., and van Eck, T., Springer, Dordrecht, 99–113, https://doi.org/10.1007/978-94-007-0152-6_8, 2011.
Paris, G., Machette, M. N., Dart, R. L., and Haller, K. M.: Map and database of Quaternary faults and folds in Colombia and its offshore regions, US Geological Survey Open-File Report 00-284, https://doi.org/10.3133/ofr00284, 2000.
Rodríguez, L., Diederix, H., Torres, E., Audemard, F., Hernández, C., Singer, A., and Yepez, S.: Identification of the seismogenic source of the 1875 Cucuta earthquake on the basis of a combination of neotectonic, paleoseismologic and historic seismicity studies, J. S. Am. Earth Sci., 82, 274–291, https://doi.org/10.1016/j.jsames.2017.09.019, 2018.
Servicio Geológico Colombiano: Red Sismologica Nacional de Colombia, International Federation of Digital Seismograph Networks [data set], https://doi.org/10.7914/SN/CM, 1993.
Sgobba, S., Felicetta, C., Lanzano, G., Ramadan, F., D'Amico, M., and Pacor, F.: NESS2.0: An Updated Version of the Worldwide Dataset for Calibrating and Adjusting Ground-Motion Models in Near Source, B. Seismol. Soc. Am., 111, 2358–2378, https://doi.org/10.1785/0120210080, 2021.
Sharma, S., Mannu, U., and Bora, S. S.: A Flat-File Compilation of Strong Ground-Motion Intensity Measures for Crustal Earthquakes in the Indian Region, Seismica, 4, https://doi.org/10.26443/seismica.v4i2.1620, 2025.
Strasser, F. O., Arango, M. C., and Bommer, J. J.: Scaling of the source dimensions of interface and intraslab subduction-zone earthquakes with moment magnitude, Seismol. Res. Lett., 81, 941–950, https://doi.org/10.1785/gssrl.81.6.941, 2010.
Vanneste, K., Onvani, M., Rapagnani, G., and Van Noten, K.: The BELSHAKE Database of Earthquake Ground Motion in Belgium, Seismol. Res. Lett., 97, 918–933, https://doi.org/10.1785/0220250321, 2026.
Vargas-Jiménez, C. A. and Monsalve-Jaramillo, H.: 3D velocity structure around the source area of the Armenia earthquake: 25 January 1999, Mw= 6.2 (Colombia), Bol. Soc. Geol. Mex., 61, 339–351, 2009.
Wells, D. L. and Coppersmith, K. J.: New empirical relationships among magnitude, rupture length, rupture width, rupture area, and surface displacement, B. Seismol. Soc. Am., 84, 974–1002, https://doi.org/10.1785/BSSA0840040974, 1994.
Weston, J., Engdahl, E. R., Harris, J., Di Giacomo, D., and Storchak, D. A.: ISC-EHB: Reconstruction of a robust earthquake dataset, Geophys. J. Int., 214, 474–484, https://doi.org/10.1093/gji/ggy155, 2018.