the Creative Commons Attribution 4.0 License.
the Creative Commons Attribution 4.0 License.
 | 01 Oct 2026
The WoKaS-Iso database: workflow for a global compilation of oxygen-18 and deuterium records in karst springs and cave drip water for enhanced understanding of karst systems
Yining Zang

Kei Yoshimura
Jayson Gabriel Pinza
Fengbo Zhang
Kübra Özdemir Çallı
Xiaojun Mei
Admin Husic
Alena Gessert
Andrej Stroj
Bartolomé Andreo
Bernard Ladouche
Christine Stumpp
Diana Mance
Eleni Zagana
Fen Huang
Giuseppe Sappa
Harald Kunstmann
Heike Brielmann
Hong Zhou
Huaying Wu
Jakob Garvelmann
James Berglund
Jean-Baptiste Charlier
Jens Lange
Juan Antonio Barberá Fornell
Junbing Pu
Konstantina Katsanou
Kun Ren
Laura Toran
Laurence Gill
Maria Filippini
Martin Kralik
Matías Mudarra Martínez
Min Zhao
Mingming Luo
Nico Goldscheider
Nikolaos Lambrakis
Pantaleone De Vita
Qiong Xiao
Shi Yu
Silvia Iacurto
Silvio Coda
Ted McCormack
Vincenzo Allocca
W. George Darling
Walter D'Alessandro
Xulei Guo
Yundi Hu
Zhijun Wang
Eva Kaminsky
Jiří Faimon
Marek Lang
Pavel Pracný
Aurel Persoiu
Andreas Hartmann
For analysing karst hydrogeological systems, observations of karst springs and cave drips are considered indispensable. In addition to hydrometric observations, knowing the oxygen and hydrogen stable isotope ratios has improved the understanding of vadose zone and aquifer dynamics, likewise supporting system characterisation and modelling. However, limited accessibility and high costs of the analysis of stable isotopes in karst aquifers have hindered progress in karst research and impeded the accurate understanding of karst processes especially when it comes to comparative or large-scale studies. In this study, we present our workflow to compile the WoKaS-Iso database, the first extensive collection of time series data for Oxygen-18 and Deuterium isotopes in karst springs and cave drip water from diverse sources, encompassing publications, theses, reports, online archives, and collaborative initiatives worldwide. The database incorporates data sourced from 241 springs and 74 caves, of which 73 caves contain 365 individual drip sites and one cave contains input data only. In total, the database comprises 1007 time series, including 389 spring time series and 618 cave drip water time series. The compiled isotope records span the period from 1967 to 2024, with the strongest temporal coverage during the 2010s and continuing coverage into the early 2020s. Of these sites, 148 springs and 64 caves contain both δ18O and δ2H records, while 93 springs and 9 caves contain only one isotope tracer. These datasets provide coverage across significant karst regions globally, spanning China, the USA, Europe, the Middle East, and Australia. Within datasets, 79 % for springs and 68 % for cave drip water exhibit resolutions finer than monthly intervals. In addition, by integrating isotopic records with ancillary environmental variables including spring discharge, cave drip rate, precipitation, and rainwater isotopes, the database offers a more comprehensive perspective on hydrological behaviours in karst aquifers, hence advancing hydrogeological characterisation and modelling. The WoKaS-Iso database not only deepens the understanding of the complex systems but also promotes sustainable water resource management as well as the potential to foster collaborative research. The database can be accessed at: https://doi.org/10.25532/OPARA-909 (Zang, 2025).
- Article
(6033 KB) - Full-text XML
-
Supplement
(11899 KB) - BibTeX
- EndNote


Carbonate rock areas, particularly those with highly karstified systems, are home to 16.5 % of the global population (Goldscheider et al., 2020) and serve as a critical source of potable water for an estimated 9.2 % of the global population (Stevanović, 2019). Beyond water supply, these aquifers encompass extensive cave networks that preserve valuable paleoclimate records, reflecting key variability patterns of past environmental conditions (McDermott, 2004). The karstification leads to inherent structural heterogeneity and strong nonlinearities of hydraulic properties (Frank et al., 2021; Jourde et al., 2018; Labat et al., 2016) that drive subsurface water flow regimes and storage mechanisms including fast conduit turbulent flow and slow matrix storage (Bakalowicz, 2005; Goldscheider and Drew, 2007) while challenging characterization of karst aquifer structures, hydraulic dynamics, and contamination pathways. Consequently, a comprehensive understanding of hydrogeological behaviours in karst systems is essential for sustainable water resource management and protection. This is also a matter of urgency for certain European regions that appear to be sensitive to the effects of global warming (Giese et al., 2025).
Stable isotopes of oxygen and hydrogen, being part of the water molecule itself, are ideal tracers for identifying water sources (Hartmann et al., 2014), delineating subsurface flow paths, estimating transit times (Liu and Yamanaka, 2012; McDonnell et al., 2010), and quantifying mixing processes (Rusjan et al., 2019). In karst hydrogeology, spring isotope signatures, integrating responses from both saturated and unsaturated zones, often provide additional information about complex recharge patterns that are not captured by discharge data alone. Isotope data thus provide critical complementary information for resolving flow and transport dynamics. Meanwhile, in speleological research, stable isotopes are central to understanding recharge processes through the epikarst, providing a distinctive window into unsaturated zone and recharge processes (Hartmann and Baker, 2017). Cave drips act as a medium for monitoring flow paths through the epikarst that is directly linked to climate signals preserved in speleothems formed from cave drips, which can serve as archives for paleoclimate reconstruction (Bradley et al., 2010; McDermott et al., 2006). Long-term rainfall and drip water monitoring is crucial for distinguishing local or regional climatic influences on cave system isotope variability (Pape et al., 2010). Moreover, stable isotopes provide critical information on water transit times through karst systems, allowing the identification of fast conduit flow versus slow matrix storage contributions. This capability is essential for understanding the temporal dynamics of recharge, flow pathways, and aquifer vulnerability to contamination, as it directly links precipitation events to spring or cave drip responses. Incorporating isotope-based transit time estimates into hydrological models enhances the characterization of flow heterogeneity and improves predictions of contaminant transport and residence times within karst aquifers.
More recently, isotope-based models have emerged to couple hydrological dynamics with stable isotopes (Birkel and Soulsby, 2015; Zhang et al., 2019). Andreo et al. (2004) applied δ18O and δ2H in precipitation and groundwater to determine the water origin and understand aquifer dynamics in the Yunquera-Nieves karstic massif in Spain. Wang et al. (2022) coupled hydrochemical and stable isotopic compositions to identify the groundwater hydrochemistry evolution in the Western Yellow Sea Coast of China. Hartmann et al. (2012) utilized isotopic information (δ18O) to calibrate their recharge model. Hydrological functions such as water storage, flux and water age distributions are effectively quantified by these isotope-coupled models, providing essential indicators of understanding the behaviour of the karst aquifer (Mayer-Anhalt et al., 2022). Additionally, coupling isotopic and hydrological data has proven valuable for facilitating multi-objective calibration and validation (Hartmann et al., 2013), enhancing the model evaluation, mitigating overparameterization, and reducing potential uncertainties (Li et al., 2022; Zhang et al., 2019). On the other hand, recent cave-based research has used stable water isotopes to advance the understanding of karst vadose zone hydrology. Priestley et al. (2023) combined δ18O from speleothems and drip waters with modelled soil moisture data to show how regional drying in southwestern Australia disrupted rainfall recharge to shallow karst aquifers – an unprecedented shift over the past 800 years. Baker et al. (2019) analysed δ18O from 163 global drip sites and found that in seasonal climates, drip water isotopes reflect recharge-weighted precipitation, refining the interpretation of speleothem records. Treble et al. (2022) demonstrated that isotopic variability within caves is largely driven by differences in flow path properties – fracture versus matrix flow – highlighting the importance of hydrological heterogeneity in shaping δ18O signals. Together, these studies underline the growing potential of isotope-hydrology approaches for resolving spatial and temporal variability in karst recharge and for reconstructing past hydroclimatic conditions. All these applications highlight the growing value of isotopic datasets for both process understanding and model development in karst systems.
Several global databases have been established to archive stable water isotope data, most notably the Global Network of Isotopes in Precipitation (GNIP) and the Global Network of Isotopes in Rivers (GNIR) maintained by the International Atomic Energy Agency (IAEA) and the World Meteorological Organization (WMO). In addition, Staudinger et al. (2020) developed a long-term δ18O and δ2H database for streamflow and precipitation across 23 catchments in Switzerland, and Li et al. (2025) established the first global surface water stable isotope database from measured data, web-sourced records and referenced data. While these databases provide essential resources for hydrological studies, they were not designed to systematically represent karst environments, and stable isotope observations from karst springs and cave drip waters remain scattered across individual studies. δ18O and δ2H signatures in karst springs and cave drip waters as natural tracers have been proven invaluable, offering insights into characterizing recharge patterns, validating and enhancing the accuracy of hydrological models and calibrating the reconstruction of paleoclimate through speleothem records (Tremaine et al., 2011). Despite this significance, the broader use of isotopic applications has remained constrained by the high cost of stable isotope analysis and limited accessibility to existing datasets for large-scale modelling and comparative studies across karst regions.
To allow broader applications and comparative studies, we developed the WoKaS-Iso – a global compilation of time series of stable isotope (δ18O and δ2H) records from karst springs and cave drip water. As complementary information, this database also includes the karst discharge, drip rate, precipitation, and precipitation δ18O and δ2H observations. For springs, datasets were aggregated from collaborators, reviewed publications, technical reports and theses. For caves, data were sourced from the SISAL_mon_v1 cave drip monitoring database (Treble et al., 2026), under consistent formatting and quality control. Metadata considered karst springs and cave names, geological information on the sites, monitoring starting and ending dates, observation lengths, and data source details. We present the methodology of the WoKaS-Iso database construction, describe dataset records, datasets quality control, data usage notes, and discuss its applications and outlook. Furthermore, we evaluate the performance of three global precipitation isotope models, offering perspectives on model selection in karst hydrology.
The WoKaS-Iso database is built upon the foundational WoKaS (World Karst Spring hydrograph) database, the first global repository of karst spring discharge records encompassing over 400 karst springs (Olarinoye et al., 2020), which, however, does not contain stable isotope records. WoKaS-Iso extends this framework by comprising stable isotope data (δ18O and δ2H) for 241 karst springs worldwide. Initially developed from a compilation of 119 stable isotope time series from Europe (Hartmann et al., 2021), the database has since expanded in scope to global coverage. Among these, 29 springs are also included in WoKaS, enabling their isotope records to be directly linked with the corresponding discharge data. For the remaining springs, available isotopic, hydrological, and climatological data were compiled from peer-reviewed literature, technical reports, open-access data repositories, and direct contributions from research collaborators.
The cave component was developed in collaboration with the SISAL (Speleothem Isotope Synthesis and Analysis) working group (https://pastglobalchanges.org/science/wg/sisal/intro, last access: 29 September 2026). Of the 74 caves incorporated in the database, 66 were derived from SISAL_mon_v1 (Treble et al., 2026), while the remaining 8 were compiled from research collaborators' contributions. WoKaS-Iso extends SISAL_mon_v1 by integrating cave drip water stable isotope compositions and drip rate measurements with spring isotope records within a unified database framework. The dataset is further augmented by supplementary datasets including drip rate measurements and GNIP station records, that were recoverable from the original data sources but were not incorporated into SISAL_mon_v1. All cave records were systematically standardised in accordance with the WoKaS-Iso data schema to ensure interoperability and to facilitate cross-referencing across database components. Detailed descriptions of the data recovery, standardisation procedures, and quality control measures applied to the cave monitoring records are provided in Sect. 2.1.2 (“Cave Monitoring”) and Chap. 4.
WoKaS-Iso also synthesizes paired hydrological and climatic parameter datasets, including karst spring discharge, rainfall, and rainwater isotopes to support interpretation of the water isotope signature. These datasets were gathered from peer-reviewed publications, theses, reports, and research collaborators. In addition to site-based observations, we integrated modelled climatic datasets from gridded global products, including precipitation amount (MSWEP), air temperature (ERA5), evapotranspiration (GLEAM), and precipitation isotope models (IsoGSM, Isoscape, Sine Curve). Where observed data were unavailable, the precipitation amount and precipitation isotopes from nearby GNIP stations were used as substitutes.
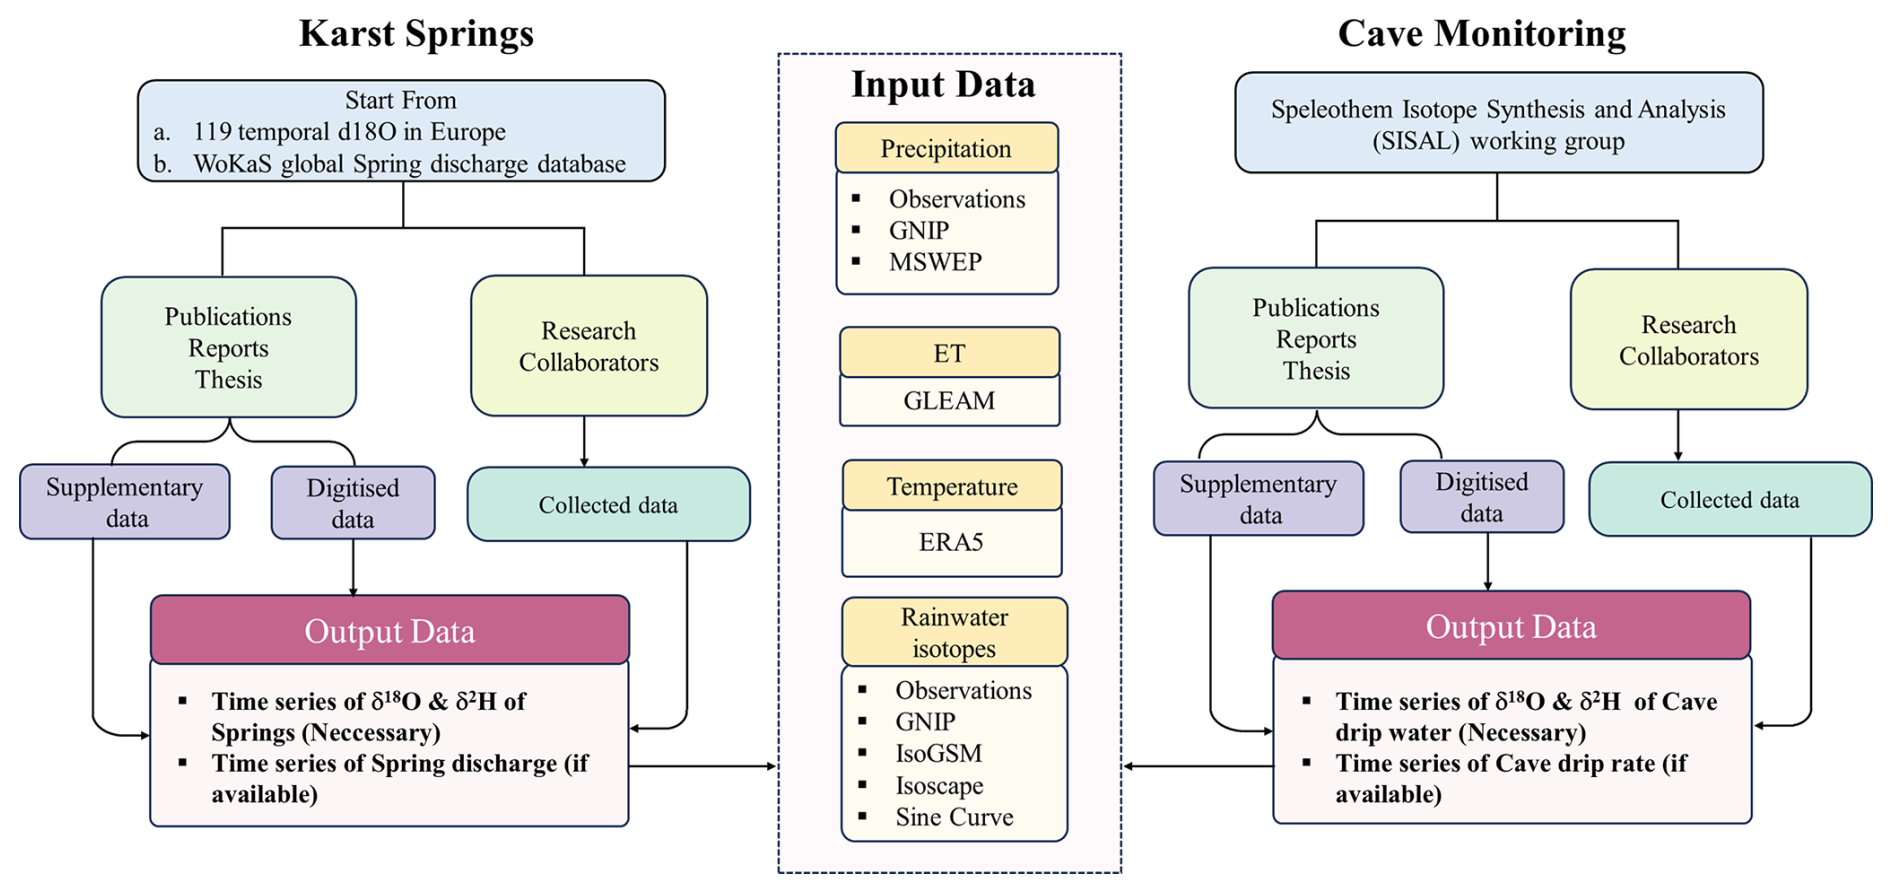
Figure 1Workflow of the karst spring and cave drip water stable isotopes database construction. The left branch illustrates the karst spring component, built upon the WoKaS global spring discharge database and an initial European stable isotope compilation (Hartmann et al., 2021), with data sourced from publications, reports, theses, and research collaborators via collection and digitization. The right branch shows the cave monitoring component, developed in collaboration with the SISAL working group and drawing primarily on SISAL_mon_v1 (Treble et al., 2026), supplemented by additional published and contributed cave datasets. The central panel depicts the system input data, comprising observed and modelled precipitation amounts (MSWEP), precipitation isotopes (GNIP, IsoGSM, Isoscape, Sine Curve), evapotranspiration (GLEAM), and air temperature (ERA5). The main workflow is described in the preceding paragraphs, with further methodological details on output data compilation and input data integration provided in Sects. 2.1.2 and 2.2.1.
From a modelling perspective, the datasets in WoKaS-Iso are organized into two main categories: system output data (spring isotopes, spring discharge, cave drip isotopes, cave drip rate) and system input data (precipitation amounts, precipitation isotopes). The overview workflow of WoKaS-Iso database creation is illustrated in Fig. 1.
2.1 System output data
2.1.1 Available data types
The WoKaS-Iso database compiles observations of oxygen (δ18O) and hydrogen (δ2H), expressed in delta (δ) notation relative to the Vienna Standard Mean Ocean Water (VSMOW), from 241 karst springs and 74 caves accommodating a total of 365 drip observation points (e.g., different speleothems). In addition, WoKaS-Iso includes associated karst spring discharge, cave drip rate, precipitation amount observations and precipitation isotope observations for karst springs and cave sites. Table 1 details the number of time series included in the database for various variables.
Table 1Summary of observations for karst springs and cave drip sites.
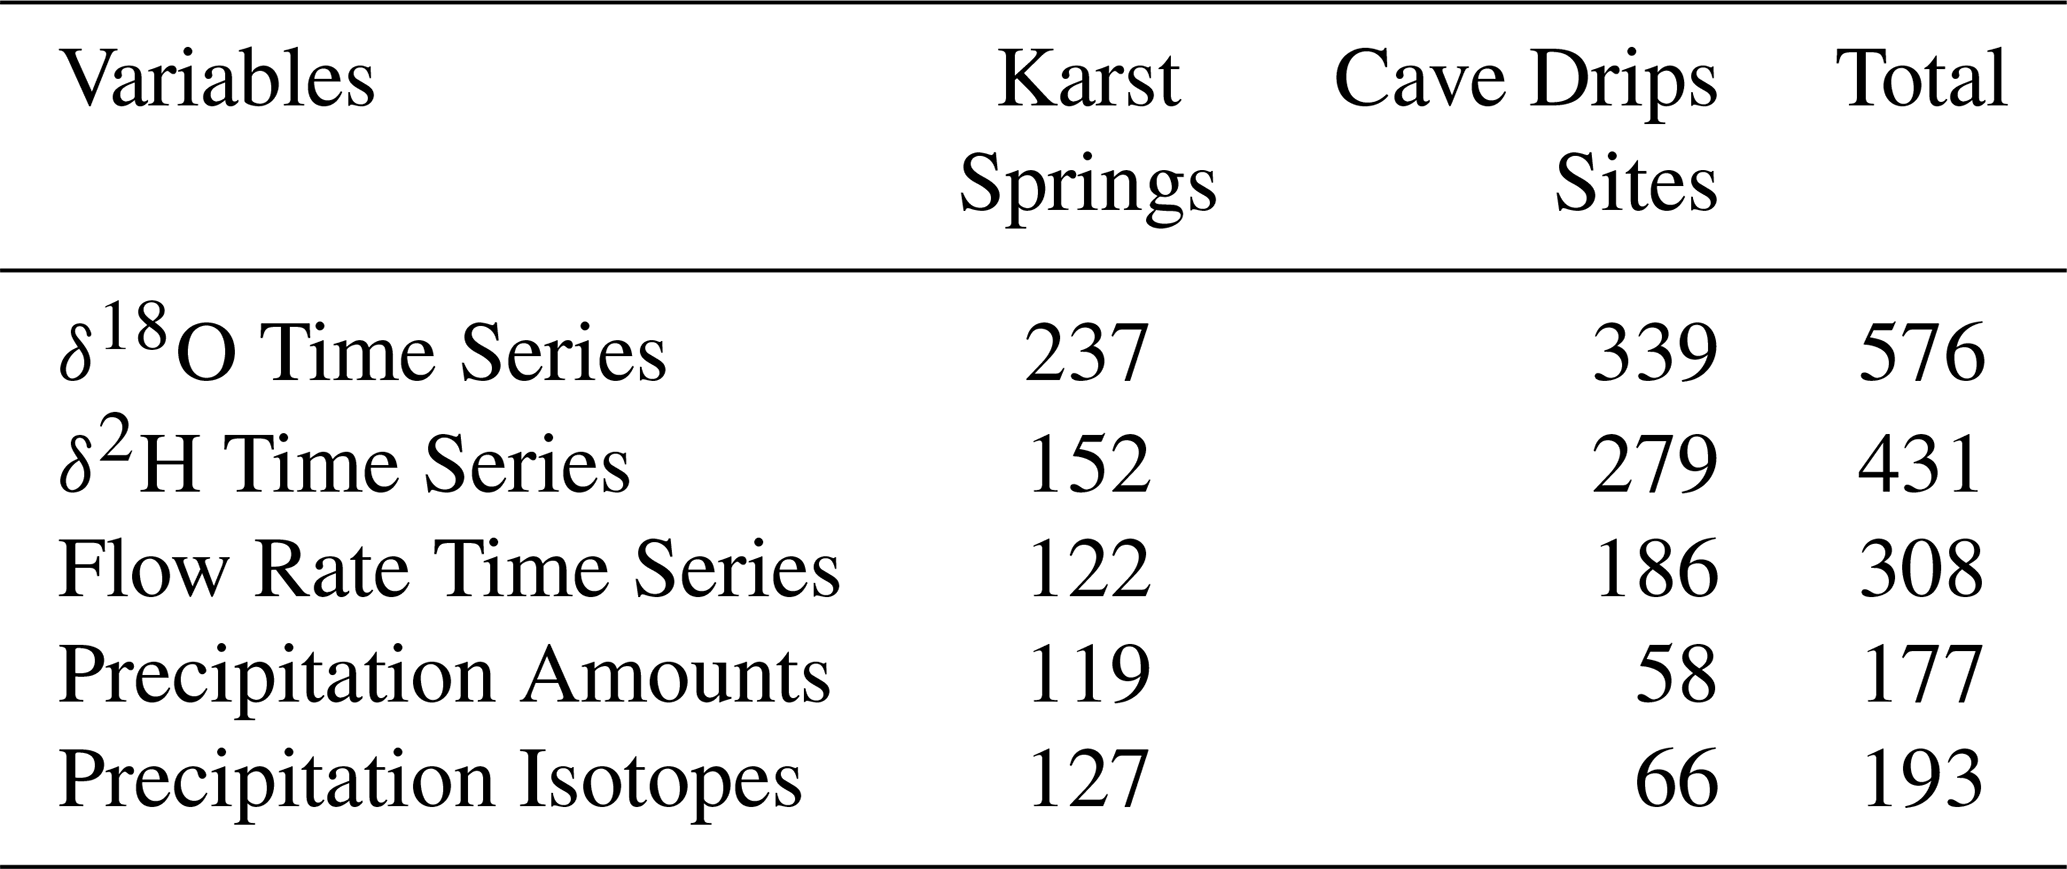
Among the 241 karst springs, 122 (51 %) are accompanied by discharge data. Of these, 95 springs include both discharge and output δ18O and δ2H data, while 27 springs possess discharge data paired with either δ18O or δ2H measurements. The remaining 119 springs (49 %) include only output isotope data: 53 springs with both δ18O and δ2H data, and 66 with either δ18O or δ2H data. Within the 74 caves, one cave includes input data alone but lacks output data. The remaining 73 caves comprise 365 drip sites, among these, 162 drip sites (44 %) combine drip rate with drip water isotope data, of these, 155 drip sites have drip rate along with δ18O and δ2H measurements, while 7 drip sites have drip rate and only δ18O data. Additionally, 25 drip sites (7 %) were measured containing drip rate only. Furthermore, 178 drip sites (49 %) contain drip water isotope data alone, 125 drip sites with both δ18O and δ2H data, and 53 drip sites with δ18O only. In addition, the database includes 127 time series of rainwater isotopes and 119 time series of rainfall associated with karst springs, as well as 66 time series of rainwater isotopes and 58 time series of rainfall associated with cave sites. The complete list of karst springs and caves included in the database, along with their coordinates and referenced literature, is presented in Tables S1 and S2 in the Supplement.
2.1.2 Origin of the collected data
Figure 2 illustrates the sources of the karst spring and cave drip data, respectively. For the karst springs, 90 % of the isotope data are raw observations, while 10 % are digitized (extracted from a reference paper). The corresponding karst spring discharge data consist of 86 % raw data from collaborators, the WoKaS discharge database, or online open-access national databases. For the rainwater isotopes, 8 % of the data are from local measurements, 45 % from weather stations, and 47 % from global isotope model products. Besides, 50 % of the rainfall data are sourced from local observations and meteorological station data. In terms of cave drip waters, 96 % of drip water isotopes derive from direct field measurements, with only 4 % digitized. A parallel distribution is observed for drip rate records, where 72 % are sourced from observations. In the case of rainwater, the majority of rainwater isotopes are obtained from both local sampling campaigns and meteorological stations, with approximately 45 % originating from local observations. Likewise, 78 % of rainfall data are acquired from local records and meteorological station datasets.
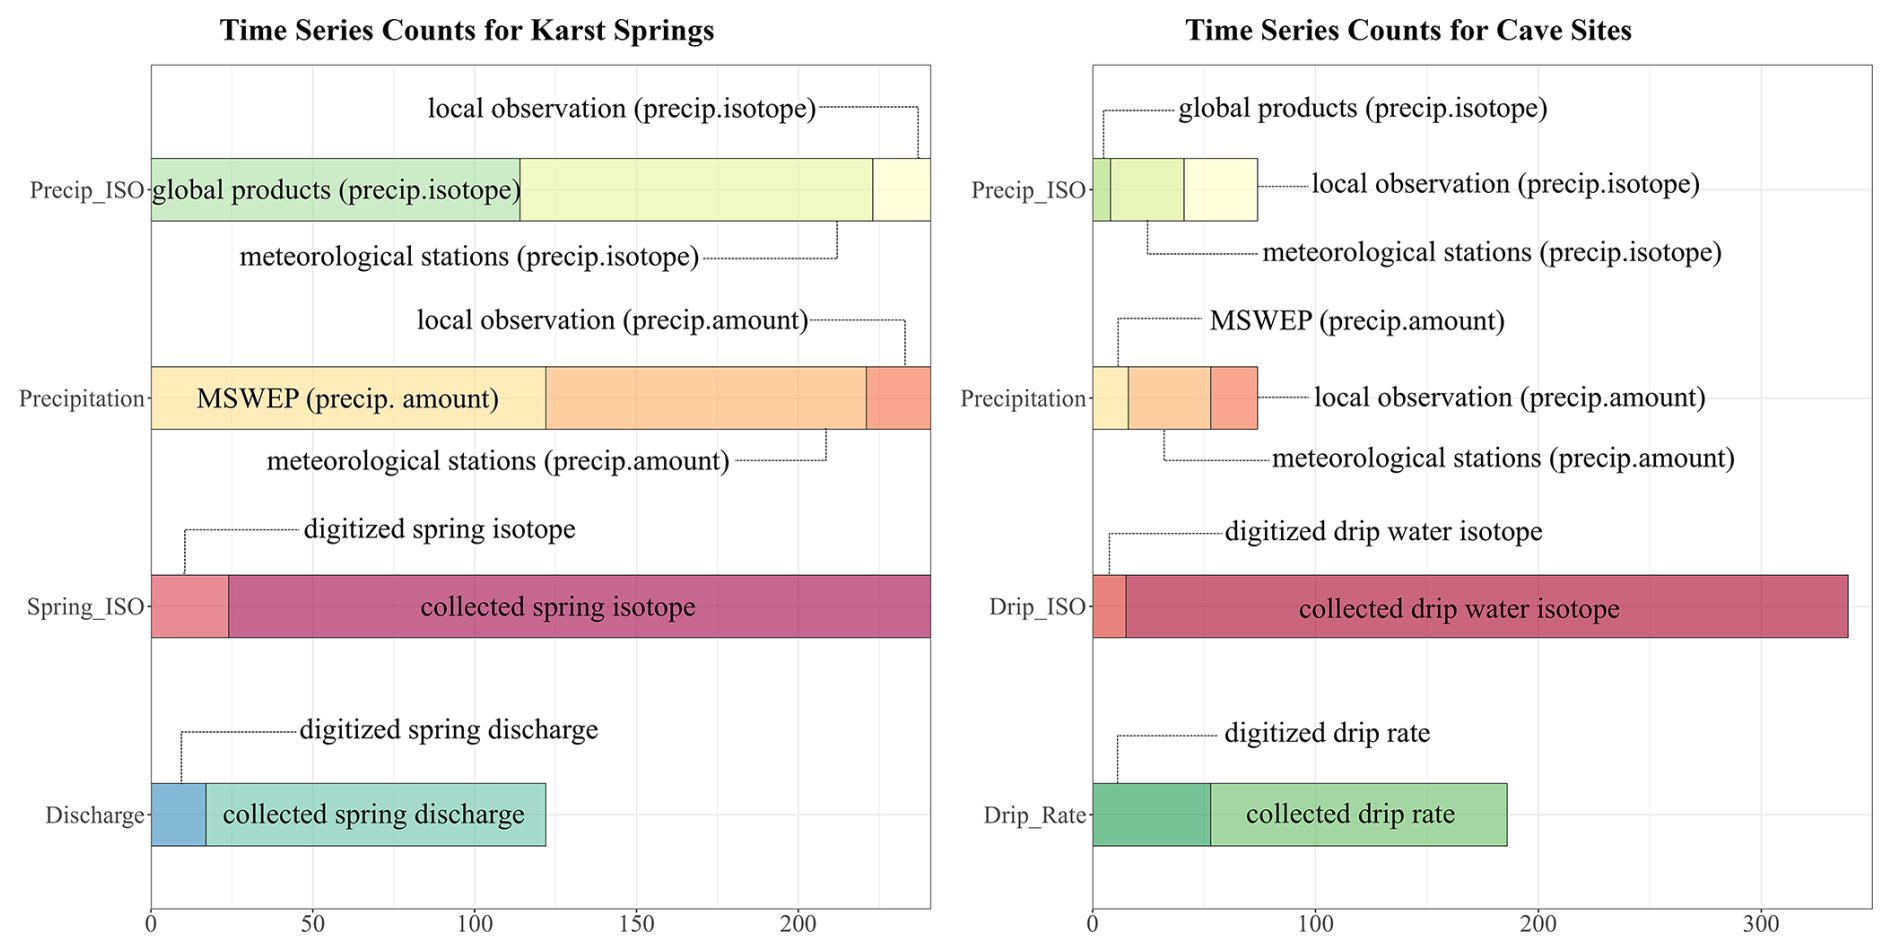
Figure 2Distribution of time series counts for hydrological and isotopic datasets in the WoKaS-Iso database, categorized by source types. For karst springs, precipitation isotopes come from local observations (18), meteorological stations (109), and global model products (114), while precipitation amounts come from local observations (20), meteorological stations (99), and MSWEP (122). Spring water isotopes include collected (217) and digitized (24) data, and spring discharge includes collected (105) and digitized (17) data. For caves, precipitation isotopes come from local observations (33), meteorological stations (33), and global model products (8). Cave drip water isotopes include collected (324) and digitized (15) data, and cave drip rates include collected (133) and digitized (53) data.
Karst Springs: As summarized in the left branch of Fig. 1, the time series of δ18O and δ2H output data were collected from (1) published data in peer-reviewed literature, scientific reports, and academic theses; (2) research collaborators within the network. Published data: The publications containing stable isotope time series data for karst springs were identified through systematic searches of academic databases and web search engines using targeted keywords (e.g. “karst spring isotopes”). Some isotope datasets were obtained directly from the supplementary documents accompanying these publications. For the data that were not readily accessible, requests were sent to the corresponding authors to solicit contributions to the database. In cases where no response was received, the datasets were digitized from figures in scientific articles, reports and theses using WebplotDigitizer (Rohatgi, 2023), a web-based open-source tool for data extraction. To maximize digitization accuracy, high-quality figures in articles were retrieved programmatically. The extracted datasets were then visually validated by replotting and comparing them with the original figures to ensure the consistency of the trends. Previous methodological studies have shown that carefully extracted graphical data can closely reproduce original numerical data and generally have limited influence on downstream statistical analyses, although extraction accuracy depends on graph quality, axis scaling, symbol clarity, and the size of plotted features (Van der Mierden et al., 2021; Turner et al., 2023). Following the approach used in the WoKaS database, digitization uncertainty is treated qualitatively through metadata documentation and data quality attribution rather than through fixed numerical error estimates (Olarinoye et al., 2020). All digitized records are explicitly identified in the metadata, allowing users to distinguish them from directly collected observations and to account for this additional uncertainty in subsequent analyses. Research collaborators: To further enrich the WoKaS-Iso database, additional data were acquired through communications with research project partners and institutional collaborations. Advertisements were disseminated to relevant academic departments, organizations and researchers. Furthermore, calls for contributions were made to the karst community through poster and oral presentations at international conferences and workshops. In addition to the sources above, the corresponding karst discharge data were obtained from online national databases such as the U.S. Geological Survey (USGS)'s National Water Information System, and Austria's Bundesministerium für Nachhaltigkeit und Tourismus (eHYD) database.
Cave Monitoring: As illustrated in the right branch of Fig. 1, the compilation of cave drip water isotopes and drip rate for the WoKaS-Iso database followed a structured workflow analogous to that of karst springs. In collaboration with SISAL (Kaushal et al., 2024), data acquisition primarily drew upon the SISAL_mon_v1 (Treble et al., 2026), which provided a key foundation for this component. GNIP station data excluded from SISAL_mon_v1 (as noted in the SISAL workbooks) are retained in WoKaS-Iso to preserve the completeness and representativeness of the original monitoring datasets. For some caves, SISAL_mon_v1 includes only the drip water isotope data provided by the authors, while the original drip rate measurements were not available. To address this, WoKaS-Iso digitized the drip rate information from figures in the publications and incorporated these data into the database, thereby enabling quantitative analyses of cave hydrology, drip water dynamics, and speleothem formation processes. Furthermore, additional cave monitoring sites, independent of SISAL_mon_v1, have been incorporated from published studies and research collaborators. All cave drip water datasets were systematically standardized, and additional quality control according to the WoKaS-Iso protocol (see Chap. 4) was applied. For datasets originating from SISAL_mon_v1, this quality control focused on additional harmonization and alignment with the WoKaS-Iso structure, building on the quality control already performed in Treble et al. (2026). The datasets were then organised within a structure specifically designed to ensure interoperability with the broader WoKaS-Iso. To ensure transparency and facilitate cross-referencing, the corresponding SISAL_mon_v1 cave identifiers are provided in the WoKaS-Iso metadata tables where applicable. Additional information on the cave drip water data collection methodology and site selection in SISAL_mon_v1 is provided in Treble et al. (2026).
2.1.3 Description of available datasets
The spatial distributions of springs and caves within the database are shown in Fig. 3 together with the World Karst Aquifer Map (WOKAM) (Chen et al., 2017). The locations in the database are primarily situated across key global karst regions, including China, Europe, Australia, the Middle East, and the USA. We summarized the detailed statistics of data type combinations of 241 springs and 339 cave drip sites with isotopic data records in Fig. 4, stratified by the predominant karst areas identified in Fig. 3. Springs are analysed for China, the USA, and Europe, while cave drip sites are grouped by China, Australia, and Europe. The stacked histograms display the distribution of dataset types across these regions and align with the regional distribution trends described in the preceding section. Figure 5 further illustrates regional differences in isotope dynamics by presenting example δ18O time series from three karst springs and three cave drip water systems across North America, Europe, and Asia.
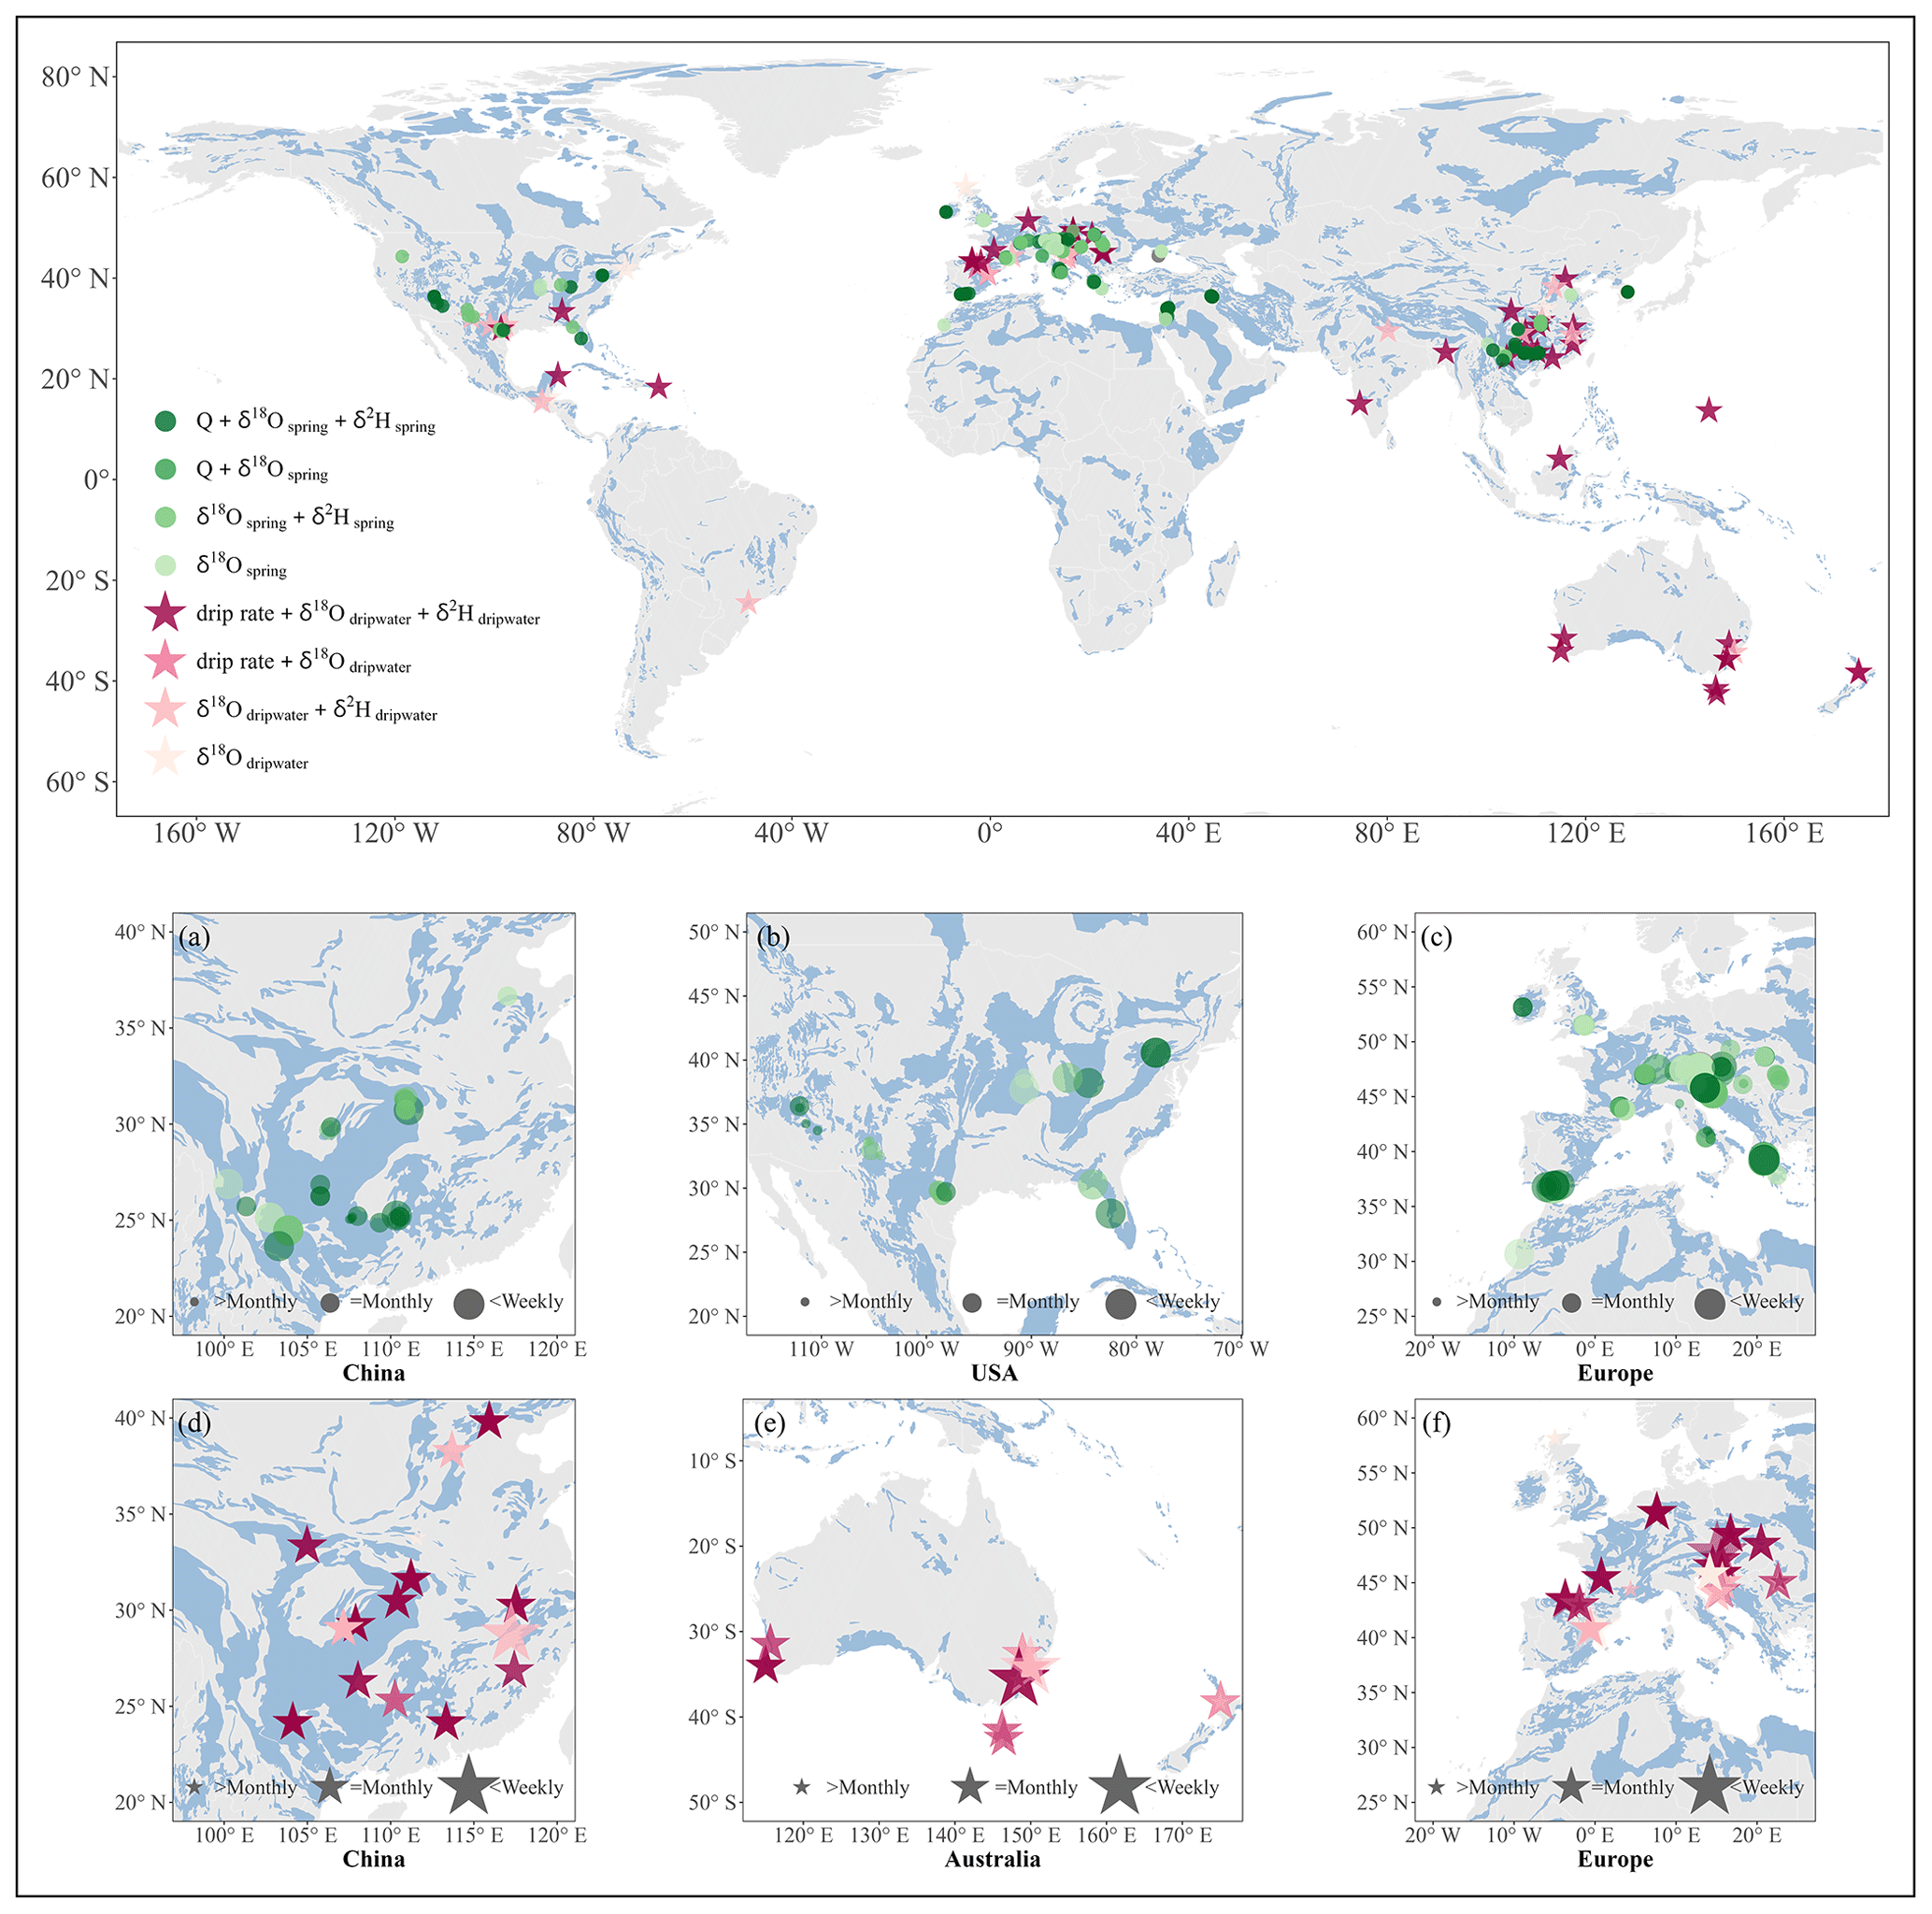
Figure 3Geographic distribution of karst springs and cave sites included in the WoKaS-Iso database, along with the types of data available at each site. Blue areas indicate karst regions from the World Karst Aquifer Map (WOKAM, Chen et al., 2017). “Q” in the legend refers to karst spring discharge. “Green round” symbols represent karst springs; “red star” symbols represent caves. The symbol color intensity reflects the richness of available data combinations at each site, categorized into four subgroups: flow rate + δ18O + δ2H, flow rate + δ18O, δ18O + δ2H, δ18O, with darker color indicating more comprehensive datasets including both hydrological and isotopic data. Panels (a)–(c) show zoomed-in maps of karst springs in China, the USA, and Europe, respectively. Panels (d)–(f) show zoomed-in maps of cave sites in China, Australia, and Europe. In the zoomed maps, the size of each symbol presents the sampling resolution of δ18O and δ2H time series at each spring and cave drip site. The temporal resolution is categorized into three classes: less than biweekly, monthly and coarser than monthly, corresponding to large, medium and small markers respectively.
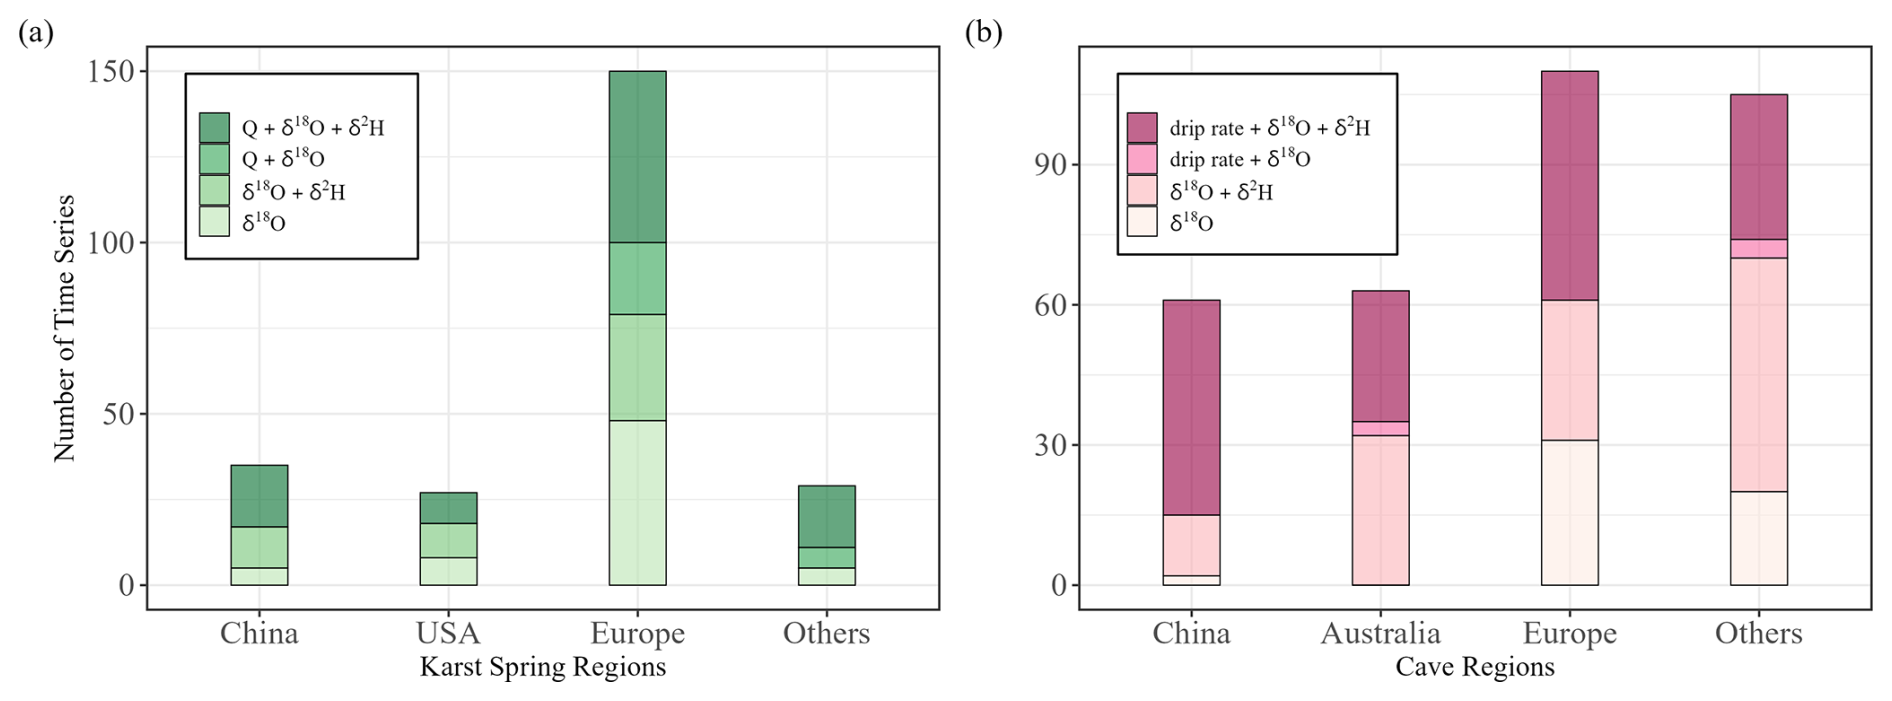
Figure 4Summaries of data types across the major karst regions for (a) karst springs and (b) cave drip water sites. In panel (a), “Q” in the legend represents karst spring discharge.
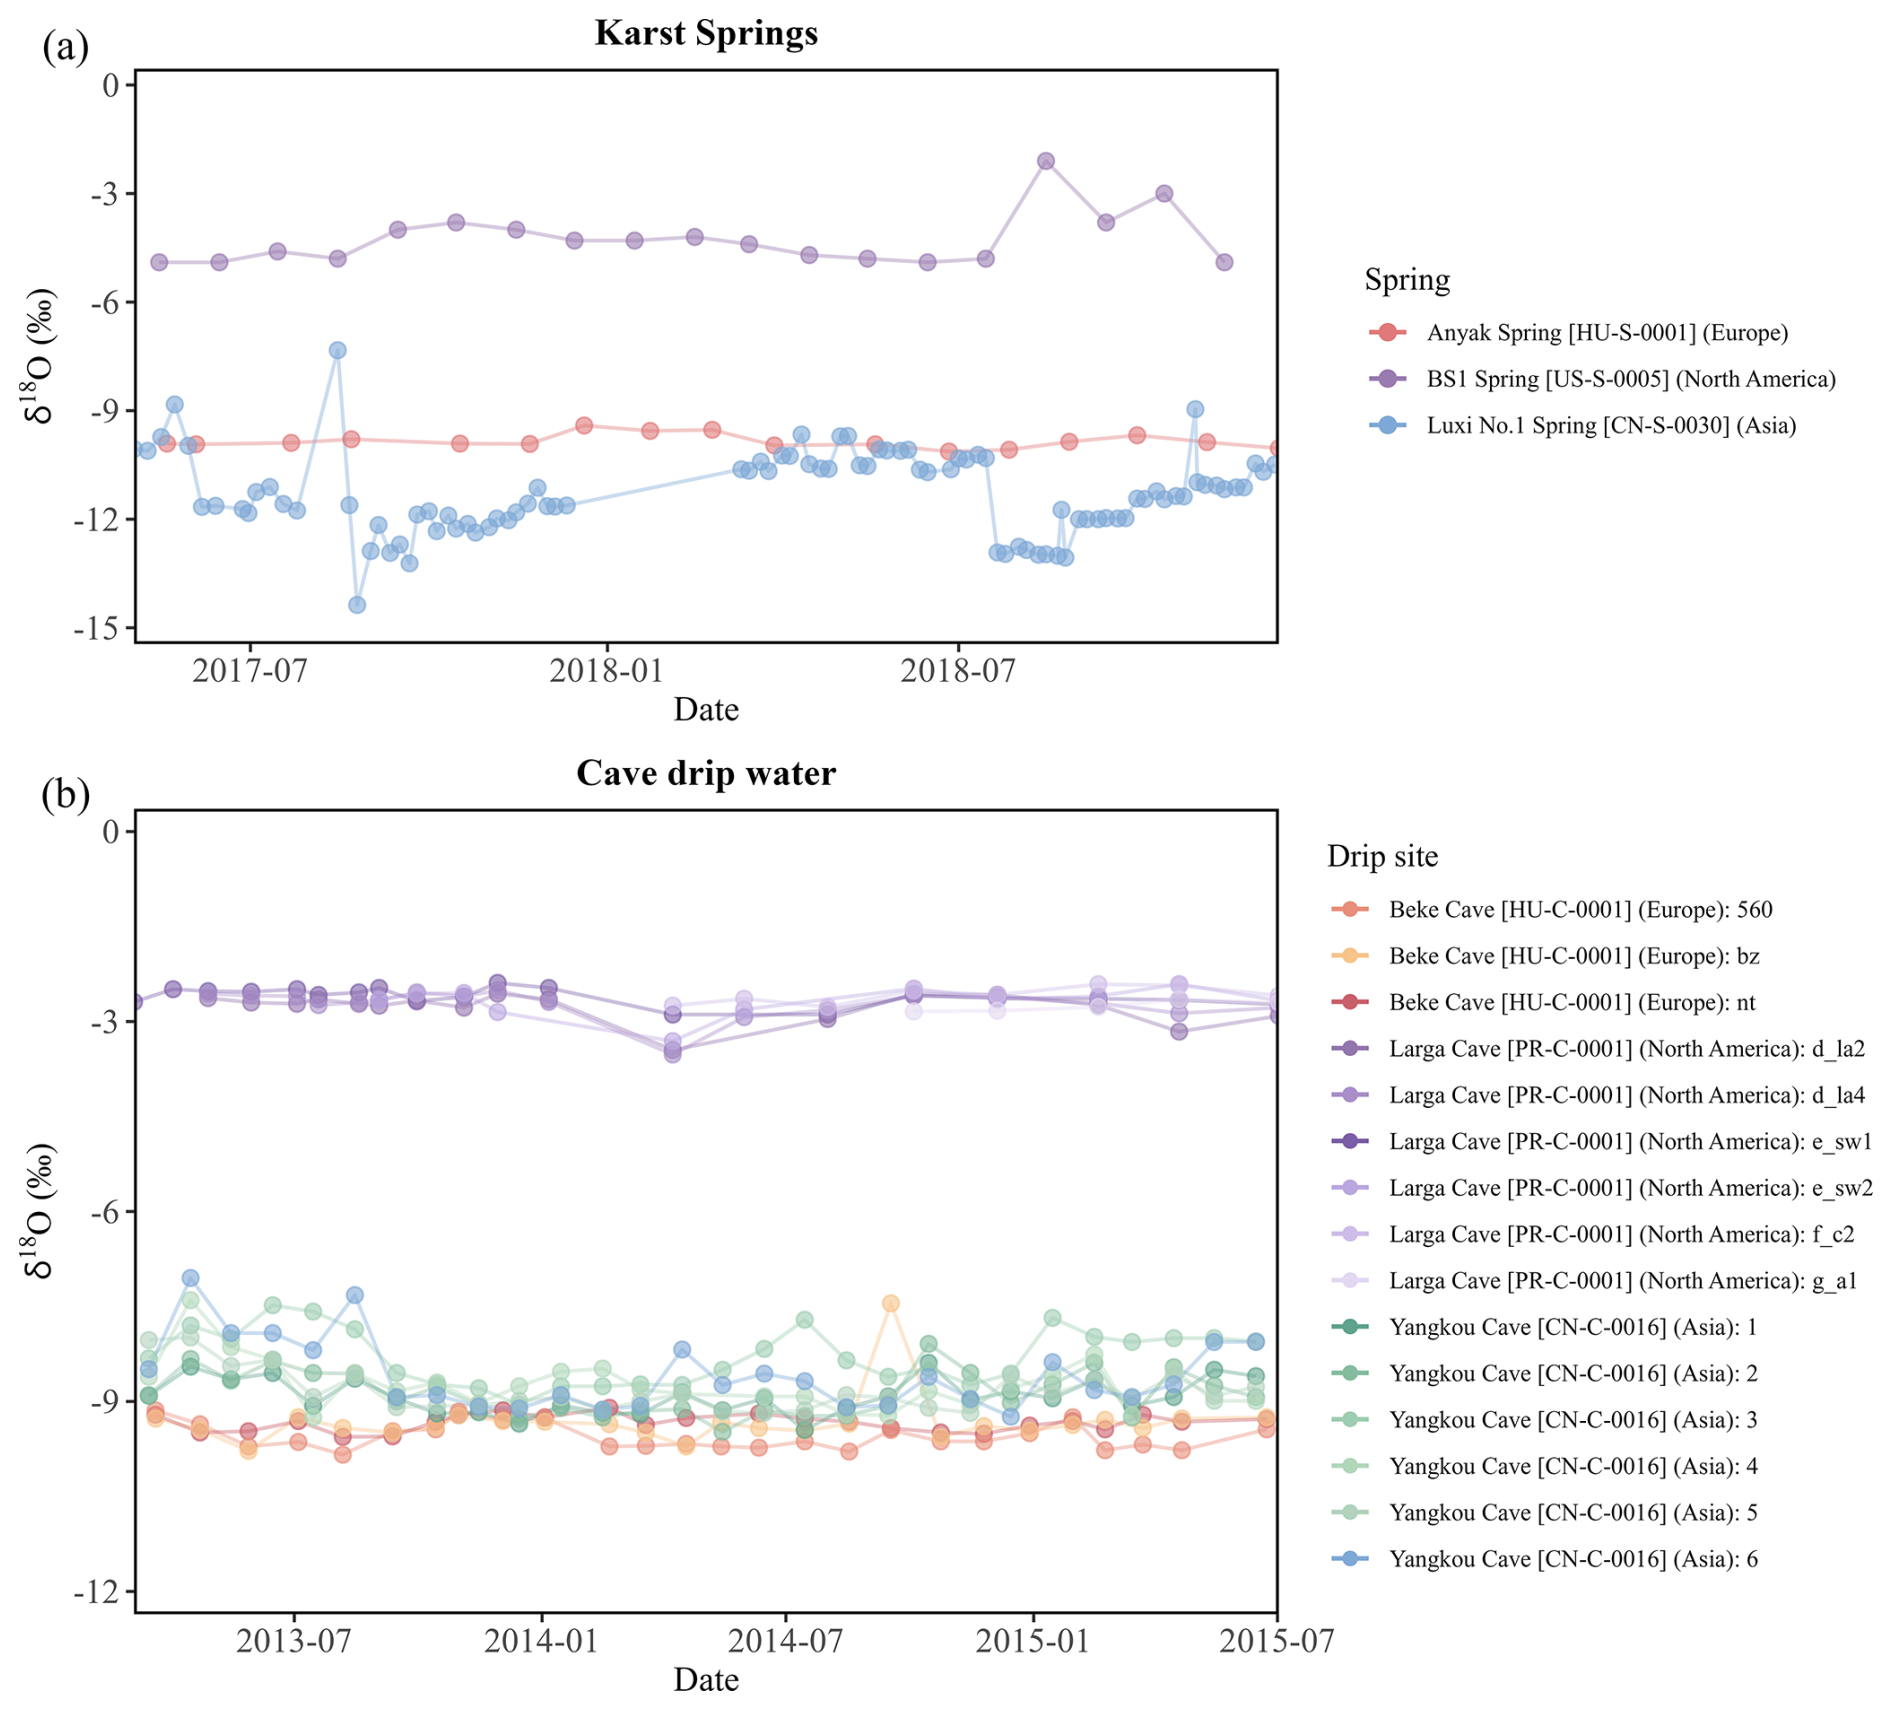
Figure 5Representative δ18O time series from selected karst springs and caves across North America, Europe, and Asia. (a) Karst spring records from BS1 Spring, Anyak Spring, and Luxi No.1 Spring. (b) Cave drip water records from Larga Cave, Beke Cave, and Yangkou Cave. Multiple drip sites are shown for each cave to illustrate intra-cave variability.
Most karst spring records are collected in Europe, with approximately half of them accompanied by discharge measurements (Fig. 4a). Similar proportions are observed in China, whereas only one-third of spring records in the USA include discharge data. In contrast, more than 80 % of spring records from other regions are associated with discharge measurements. Regarding stable isotope observations, datasets containing both δ18O and δ2H are most common in China (86 %), followed by the USA (70 %) and other regions (62 %). For cave drip water systems (Fig. 4b), drip rate observations are most frequently available in China and are present in roughly half of the records from Australia and Europe. In addition, more than 95 % of cave drip water records in China and Australia include both δ18O and δ2H measurements, while the proportion exceeds 70 % in Europe and other regions.
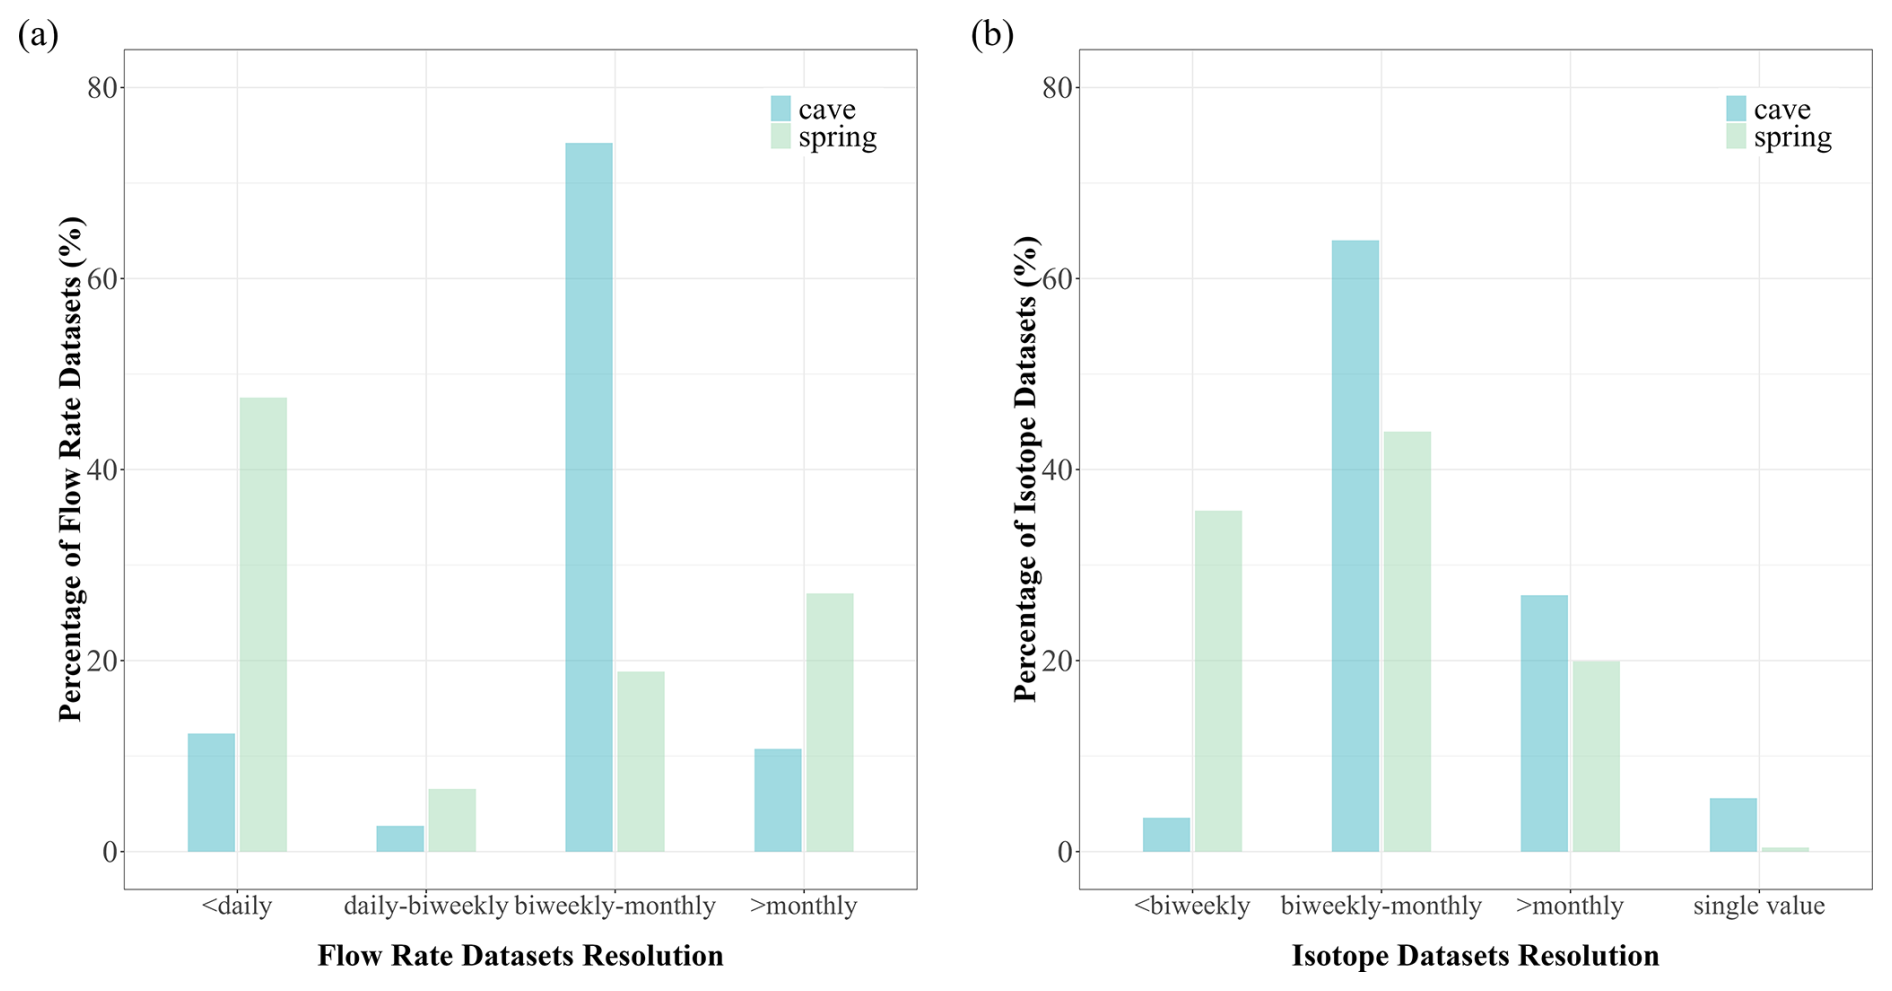
Figure 6(a) Proportions of temporal resolution categories of discharge and drip rate datasets for karst springs and cave drip sites; The datasets are divided into four resolution levels: finer than daily, daily to biweekly, biweekly to monthly and coarser than monthly. (b) Proportions of temporal resolution categories of stable isotopes for karst springs and caves. The resolutions are stratified into four categories: finer than biweekly, biweekly to monthly, coarser than monthly and single-value records.
Stable isotope dynamics generally differ among regions due to differences in climatic conditions, precipitation isotope inputs, and karst hydrological processes. Therefore, three karst springs and three caves with overlapping observation periods were selected from North America, Europe, and Asia as illustrative examples to show the temporal dynamics of δ18O. Figure 5a shows considerable differences in both isotope values and temporal variability among the three springs. BS1 Spring (North America) exhibits relatively enriched δ18O values (approximately −5 ‰ to −2 ‰), whereas Anyak Spring (Europe) remains comparatively stable around −10 ‰. In contrast, Luxi No.1 Spring (Asia) displays larger temporal fluctuations, with δ18O values ranging from approximately −14 ‰ to −9 ‰. Similar regional differences are also evident in cave drip water records (Fig. 5b). Larga Cave (North America) is characterised by relatively enriched isotope values around −3 ‰, while Beke Cave (Europe) and Yangkou Cave (Asia) exhibit more depleted values between approximately −10 ‰ and −7 ‰. Moreover, multiple drip sites within individual caves show common temporal behaviour but differ in absolute δ18O values.
Stable isotopes in spring discharge and drip waters can show strong seasonal variability due to fluctuations in precipitation and temperature under changing climatic conditions. Adequate temporal resolutions are necessary to quantify these seasonal dynamics in detail and capture short-term hydrological patterns during rainfall or snowmelt events. The regional maps in Fig. 3a–f provide the spatial context of isotope sampling resolution, showing that monthly sampling is common across the main data-rich regions, particularly for cave drip water records. Higher resolution isotope records are mainly available for karst springs in Europe, whereas finer than biweekly resolution is rare for cave drip water records in China, Australia, and Europe. Figure 6 provides a summary of temporal resolution for hydrological and isotope measurements in the WoKaS-Iso. Spring discharge datasets generally have the highest temporal resolution, with nearly half available at daily or finer intervals, compared with just over 12 % of cave drip rate datasets (Fig. 6a). Cave drip rate records are mainly concentrated in the biweekly-to-monthly category, reaching approximately 74 %, whereas spring discharge records are more evenly distributed across the resolution classes. For stable isotope observations, resolution between biweekly and monthly is the dominant category for both springs and cave drip waters, accounting for around 64 % of cave drip isotope datasets and more than 40 % of spring isotope datasets (Fig. 6b). In addition, 36 % of spring isotope datasets have a resolution finer than biweekly, while 27 % of cave drip water isotope records are sampled at intervals coarser than monthly.
2.2 System input data
2.2.1 Available data types
The workflow for compiling the input datasets is summarized in the central panel of Fig. 1. The WoKaS-Iso database includes precipitation amount and precipitation δ18O and δ2H observations for karst springs and cave sites, compiled from the same sources described in Sect. 2.1.2 (also see Table 1 and Fig. 2). To ensure adequate spatial and temporal coverage, karst springs and cave sites lacking local rainfall and rainwater isotope records were supplemented with the data from Global Network of Isotopes in Precipitation (GNIP) database. Firstly, the geographic coordinates of karst springs, cave sites, and GNIP stations within the related countries were imported into ArcGIS where the closest GNIP station to each karst spring and cave site was identified. Secondly, the distances between the springs or caves and their nearest GNIP stations were measured using ArcGIS. With the aim of reflecting the representativeness of the local climatic and isotopic characteristics for karst springs and caves, only GNIP stations within 25 km were retained. This threshold was selected to be consistent with the spatial resolution of the Isoscape and Sine Curve datasets (5 arcmin, approximately 10 km), corresponding to roughly twice the grid-cell diagonal (∼28 km). It is therefore a conservative choice that is also compatible with the coarser ERA5 dataset (∼31 km). Although this approach cannot fully account for topographic differences between GNIP stations and karst sites, it provides a consistent spatial matching criterion for all products evaluated in this study.
For karst springs, 20 sites possess local rainfall measurements, and 99 springs derive precipitation data from nearby meteorological stations, including GNIP stations, while the remaining 122 springs lack rainfall data. Regarding precipitation isotope observations, only 18 springs have auxiliary local isotope data, 109 springs use data from the meteorological or GNIP networks, and 114 springs have no related isotope records. For cave sites, 21 caves include locally measured rainfall, 37 caves obtain rainfall data from adjacent weather stations, and 16 caves lack rainfall records. As for precipitation isotopes, 33 caves are associated with local measurements, 33 caves rely on weather station-based isotope datasets or GNIP-derived data, and 8 caves lack isotope observations. To offer comprehensive metadata for input observations, the distances from the precipitation and precipitation isotopes sampling sites to cave/spring sites were calculated where geographic coordinates were available and then documented in the metadata tables for spring input and cave input datasets.
Since datasets on precipitation amount and precipitation δ18O and δ2H, observed locally or provided by GNIP, were not available at all output locations or were limited in their temporal extent, the WoKaS-Iso database includes complementary datasets from six global products for continuous rainfall, precipitation δ18O and δ2H, air temperature as well as both actual and potential evapotranspiration. The information on these global products used in this study is listed in Table 2, including relevant modelled variables, time span, spatial and temporal resolution and the source for the construction of models.
Table 2Information of the global products included in the WoKas-Iso database.
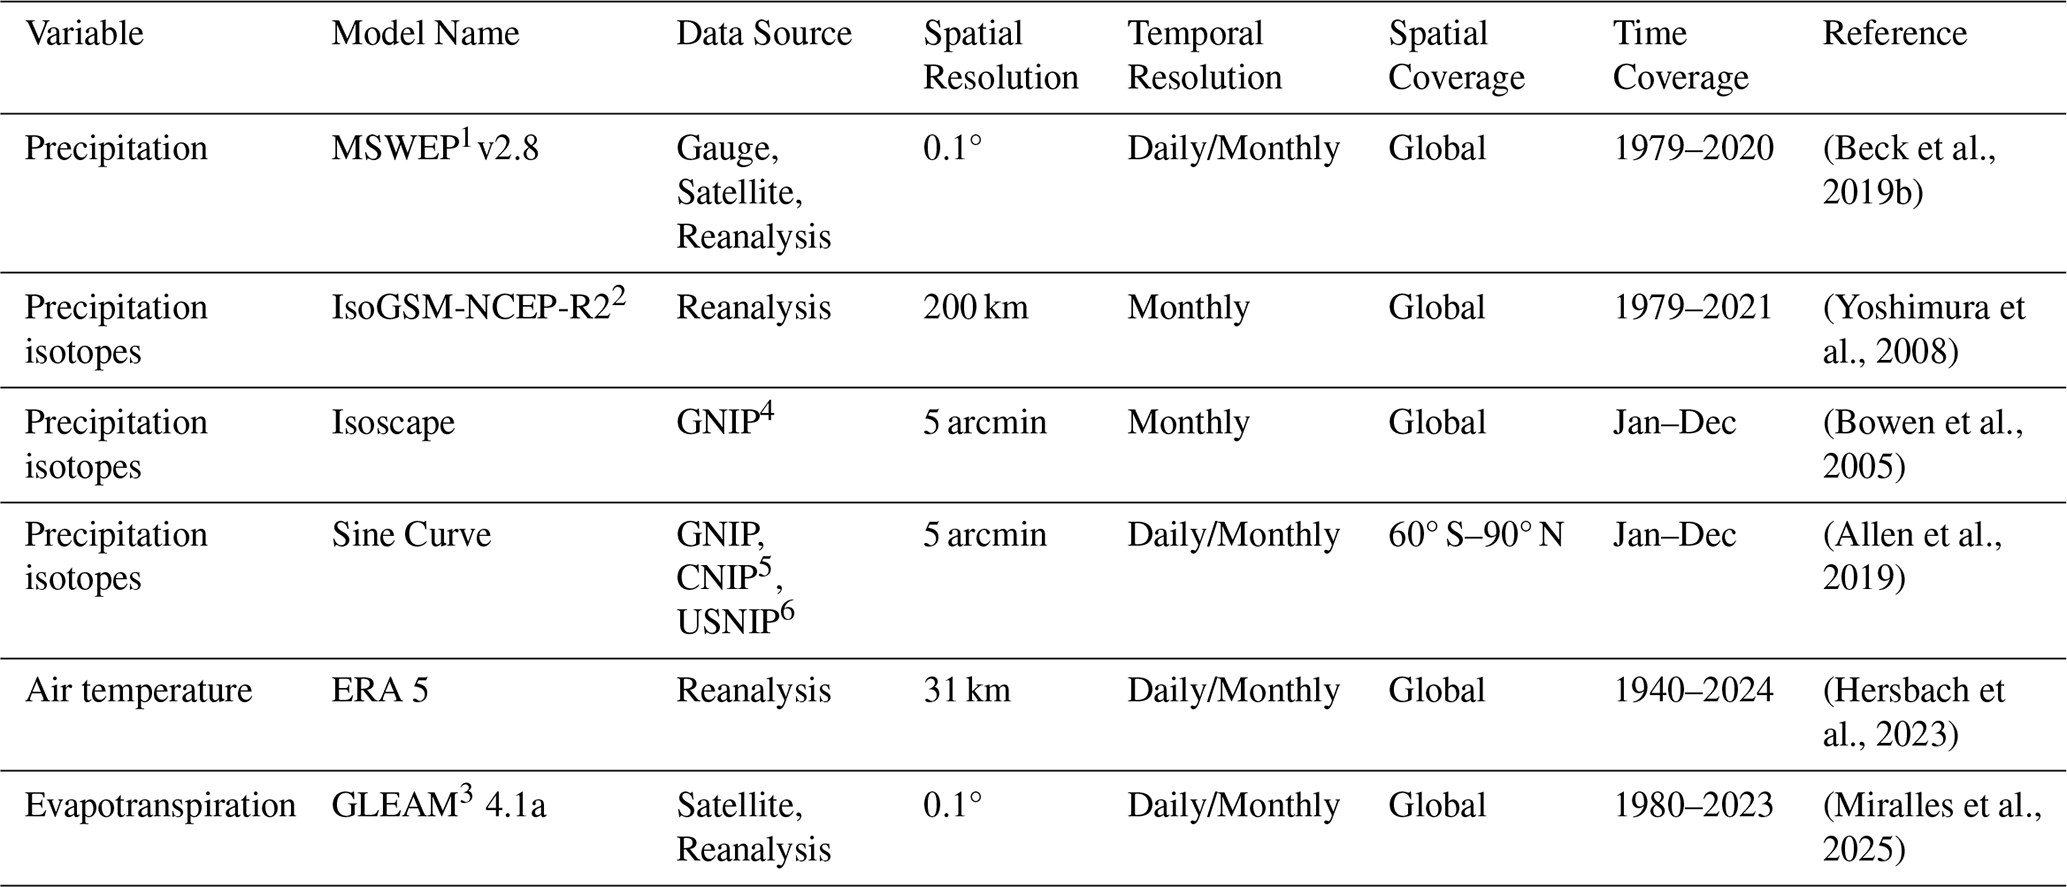
1 Multi-Source Weighted-Ensemble Precipitation; 2 Isotopes-integrated Global Spectral Model; 3 Global Land Evaporation Amsterdam Model; 4 Global Network of Isotopes in Precipitation; 5 Canadian Network for Isotopes in Precipitation; 6 US Network for Isotopes in Precipitation.
Precipitation data were obtained from MSWEP v2.8 (Beck et al., 2017, 2019a, b), a multi-source ensemble product offering daily and monthly estimates at 0.1° resolution from 1979–2020. MSWEP improves global precipitation accuracy by combining gauge, satellite, and reanalysis data using a weighted ensemble based on network density and local performance (Liu et al., 2019). Evaporation estimates were sourced from GLEAM v4.1a (Hulsman et al., 2023; Koppa et al., 2022; Martens et al., 2017; Miralles et al., 2011, 2025; Zhong et al., 2022), which integrates satellite data and physical modelling with machine learning to estimate daily and monthly actual and potential evaporation at 0.1° resolution from 1980–2023. Air temperature time series were extracted from ERA5, the fifth-generation atmospheric reanalysis developed by ECMWF (Hersbach et al., 2020, 2023), which provides consistent daily climate data since 1940 at 0.25° resolution using the 4D-Var data assimilation technique and the CY41R2 forecasting system. To characterize precipitation isotope variability, we used monthly δ18O and δ2H outputs from IsoGSM (Kanamitsu et al., 2002a, b; Nan et al., 2021; Yoshimura et al., 2008; Bong et al., 2024), a general circulation model incorporating isotopic fractionation and nudged with NCEP (National Centers for Environmental Prediction) reanalysis data, covering 1979–2021. Additionally, long-term spatial isotope patterns were derived from the Isoscape product (etopo5, 2025; Bowen et al., 2005; Bowen and Revenaugh, 2003; Bowen and Wilkinson, 2002), which interpolates GNIP data using topographic and geographic predictors at a 5 arcmin resolution. Finally, seasonal isotope dynamics were represented using the sinusoidal precipitation isotope model (Allen et al., 2019), which fits annual sine curves to global precipitation isotope records and maps the resulting parameters to derive daily and monthly isotope predictions from 60° S to 90° N. Together, these products provide a consistent climatological and isotopic framework for interpreting site-level karst and cave hydrology.
2.2.2 Evaluation of different precipitation isotope data
While global precipitation and evapotranspiration data were evaluated against observations in their original studies (see Table 2), an evaluation of the isotopic composition of rainfall provided by the three precipitation isotope models – IsoGSM, Isoscape, and the Sine Curve model – is still required. For that, we compared monthly simulated precipitation δ18O and δ2H against site-specific observations from both cave drip water and karst spring locations. For precipitation δ18O comparison, a total of 55 sites were analysed, comprising 26 cave locations, 15 spring locations, and 14 nearby meteorological stations to compensate for the limited availability of isotopic measurements at spring locations. For precipitation δ2H, 40 sites were assessed, including 25 caves and 15 springs. For sites with daily precipitation, the monthly amount-weighted precipitation isotopes were calculated by weighting the available isotope measurements with the corresponding daily precipitation amounts and aggregating them to monthly values. For sites lacking daily precipitation, the stepwise interpolation of precipitation isotopes was applied to derive monthly means.
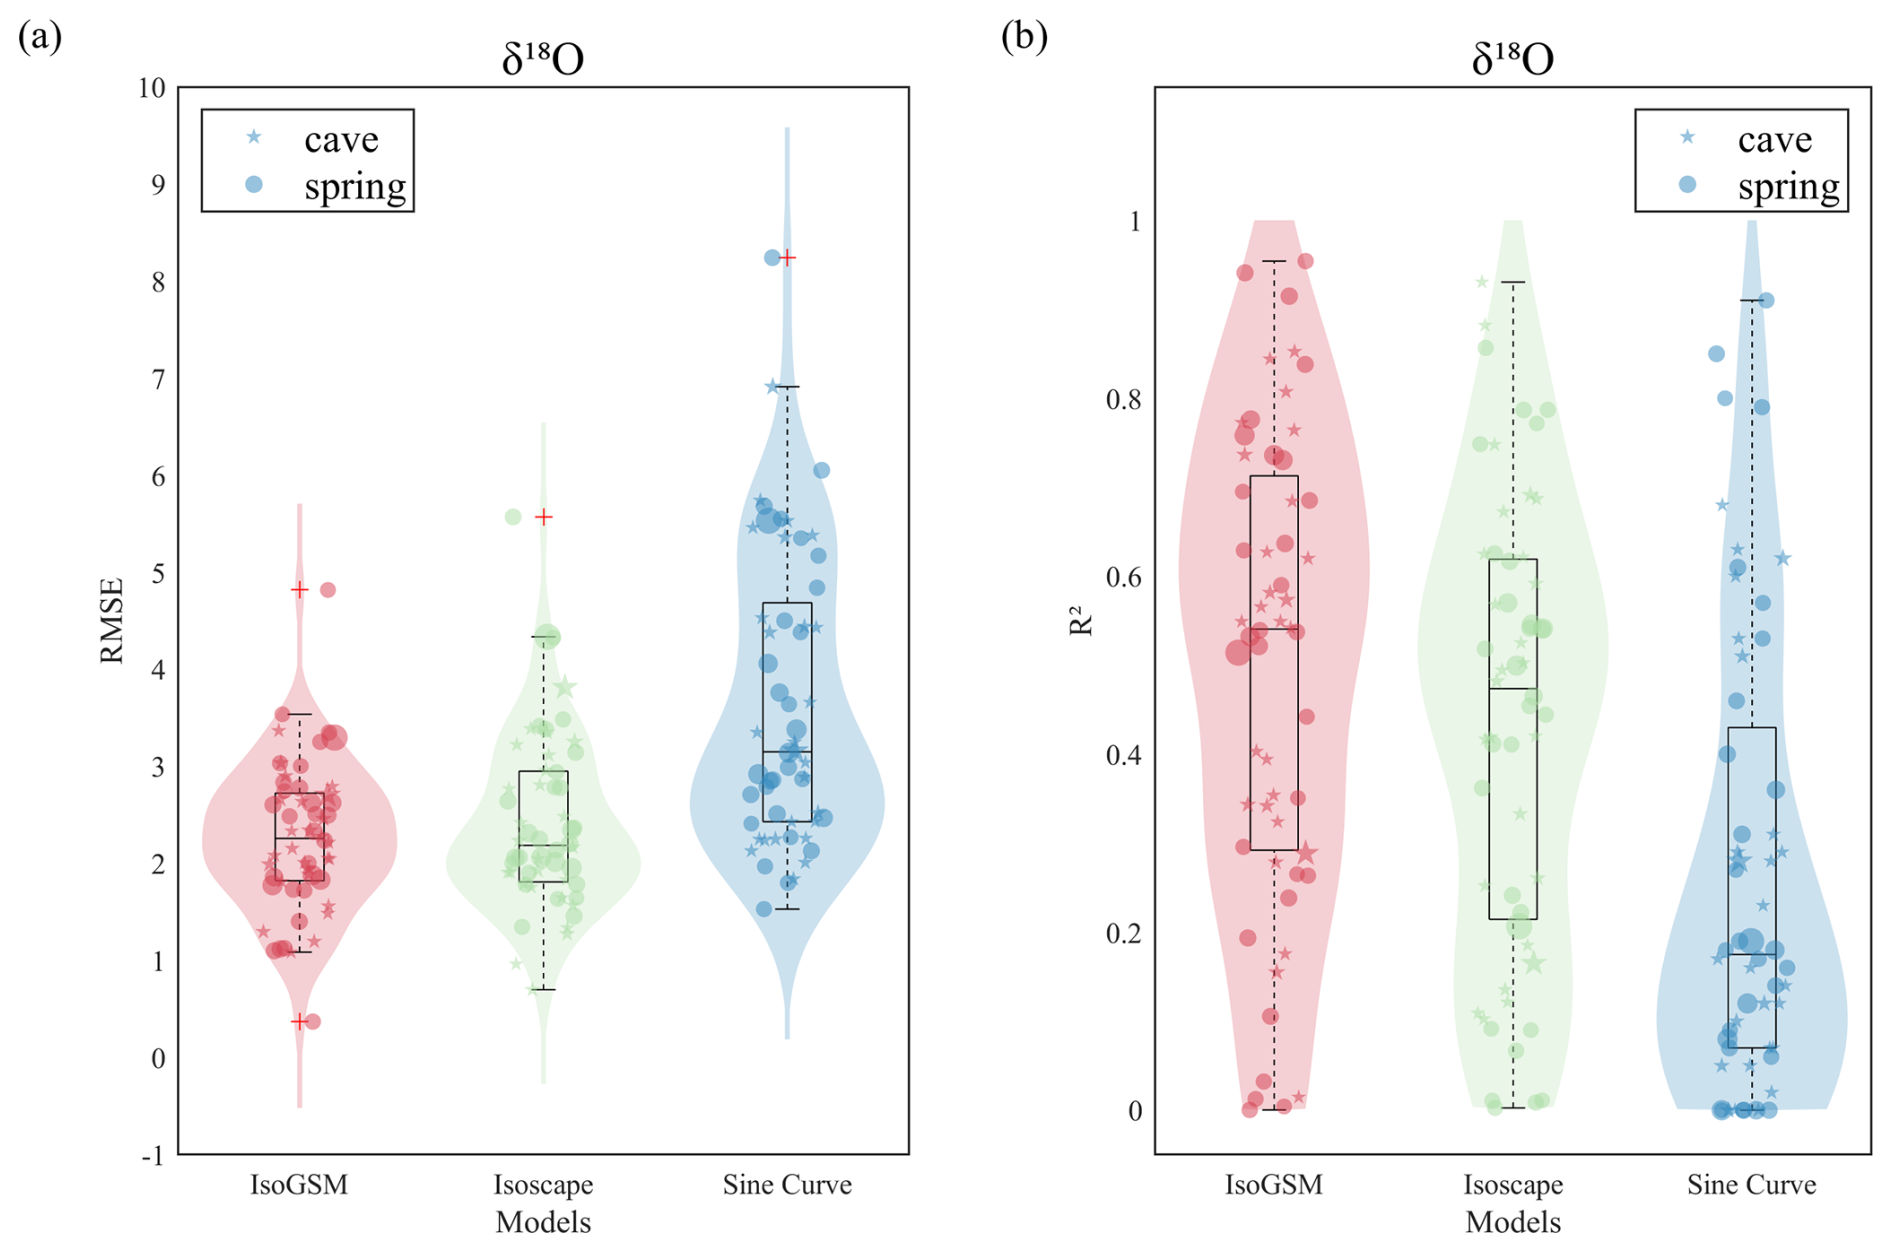
Figure 7Statistical comparison of three model performance for δ18O in precipitation at cave (stars) and springs sites (circles). (a) Root Mean Square Error (RMSE); (b) Coefficient of determination (R2). Violin plots show the distribution of performance metrics for each model: IsoGSM (red), Isoscape (green), and Sine Curve (blue). Boxplots within violin indicate the median, interquartile range and outliers. Lower RMSE and higher R2 indicate better model performance.
We quantified the agreement between the global products and the observed isotopic composition of precipitation using the root-mean-square error (RMSE) and the coefficient of determination (R2). Figure 7 presents the performance metrics in predicting δ18O. Based on RMSE, IsoGSM displays a lowest median RMSE value (∼2 ‰) with a narrow interquartile range and minimal outliers, indicating the most consistent predictions across both caves and springs. The Isoscape model exhibits a comparable median RMSE, though with greater variability and higher outliers, reflecting less robustness. In contrast, the Sine Curve model yields the highest median error (>3 ‰) and broader distributions, highlighting significantly inferior performance. Concerning R2, IsoGSM achieves the highest median R2 (∼0.6); however, its R2 values span a wide range. The Isoscape model, having a slightly lower median R2 value (∼0.5), shows a tighter distribution. The Sine Curve model performs worst, with a median R2 of less than 0.2 and a concentration of low values, indicating poor explanatory power.
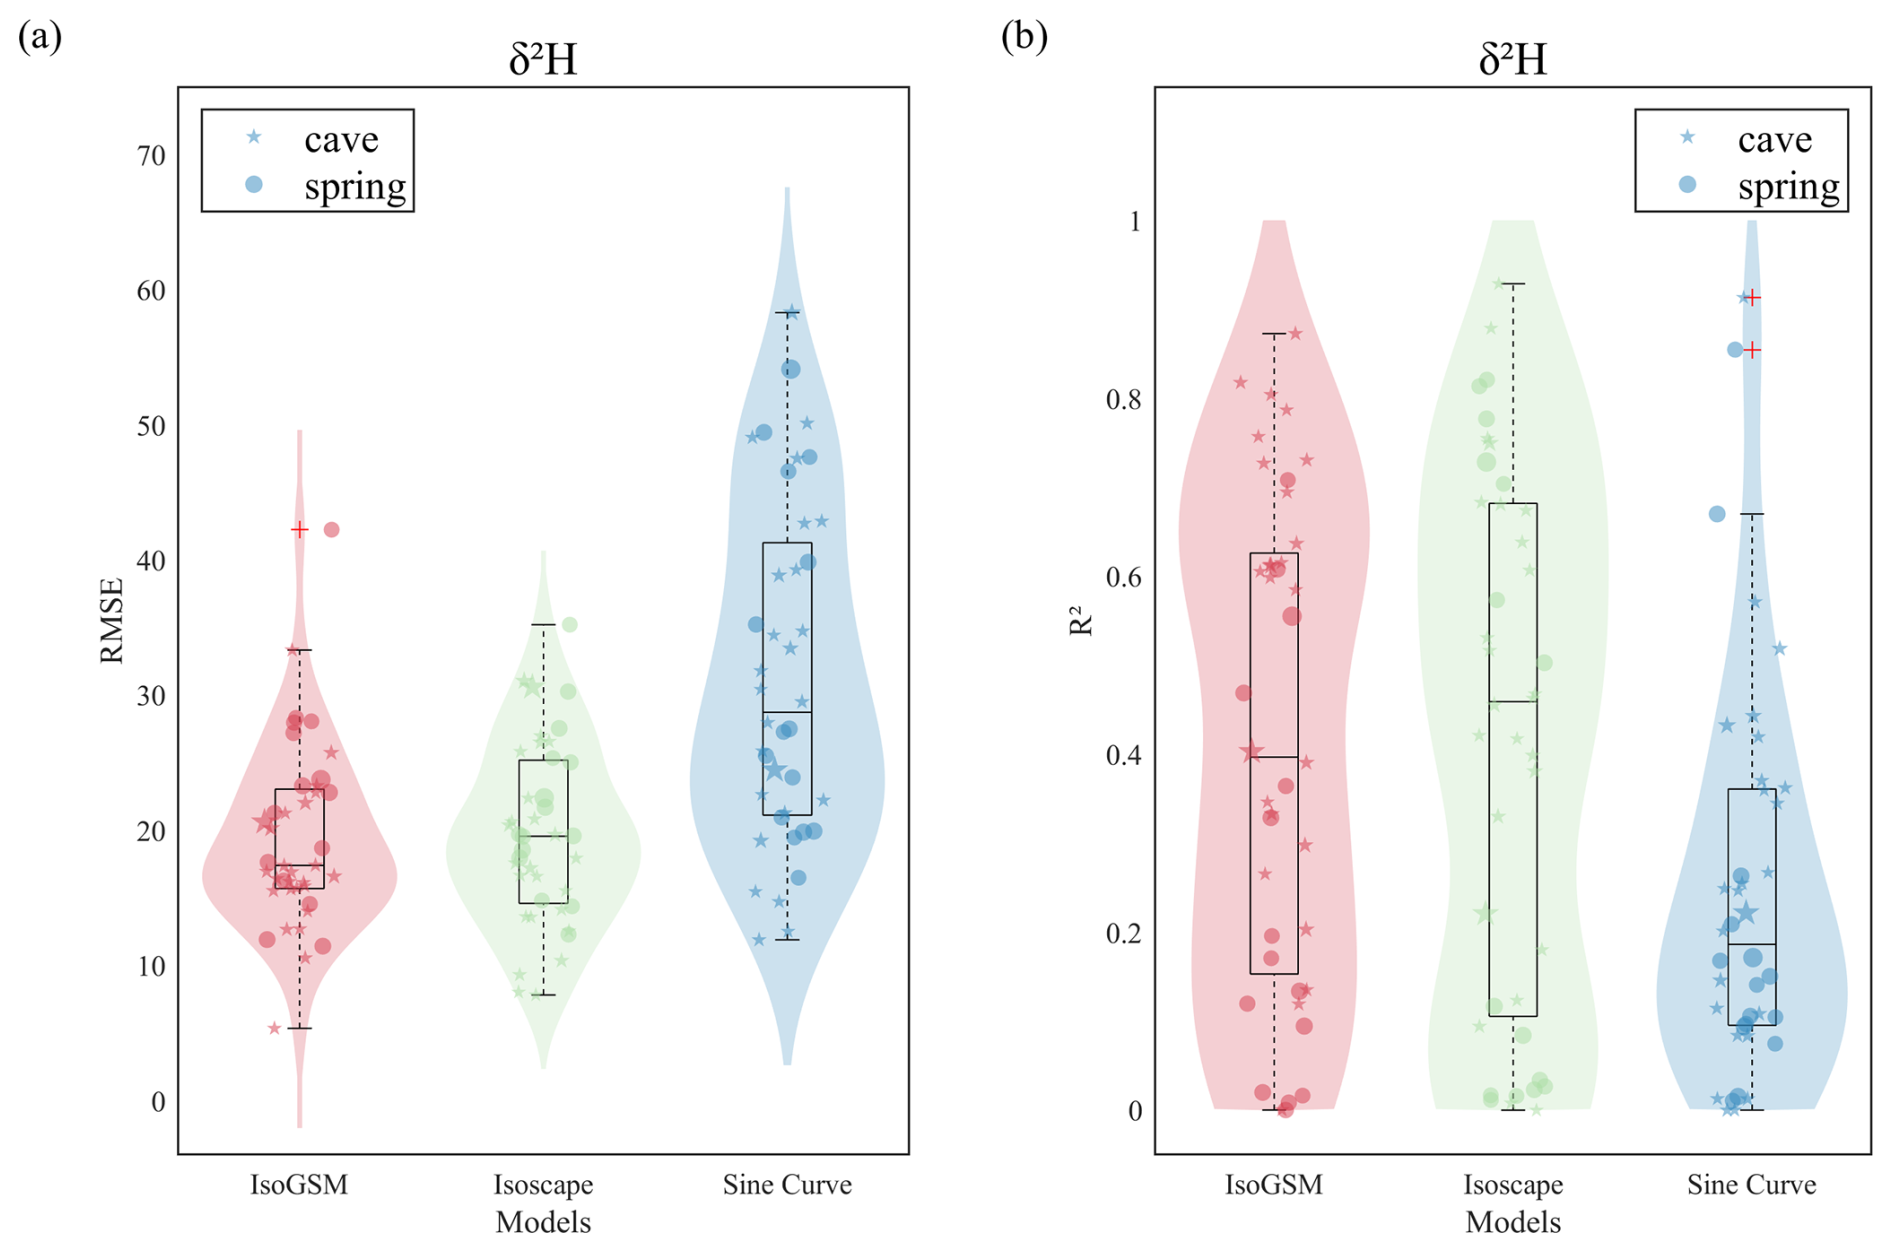
Figure 8Statistical comparison of three model performance for δ2H in precipitation at cave (stars) and springs sites (circles). (a) Root Mean Square Error (RMSE); (b) Coefficient of determination (R2). Violin plots show the distribution of performance metrics for each model: IsoGSM (red), Isoscape (green), and Sine Curve (blue). Boxplots within violin indicate the median, interquartile range and outliers. Lower RMSE and higher R2 indicate better model performance.
Figure 8 presents similar performance trends for δ2H predictions. IsoGSM achieves the lowest median RMSE (∼17 ‰) with a relatively narrow spread, reflecting the most accurate and consistent predictions. The Isoscape model follows closely with a slightly higher RMSE (∼19 ‰) and greater variability. The Sine Curve model shows the highest median RMSE value (∼29 ‰) and the broadest RMSE distribution. For R2, there is a slight shift in performance ranking compared to δ18O. The Isoscape model has the highest R2 value (∼0.5). The IsoGSM model has a lower R2 (∼0.4) with a more balanced distribution. The Sine Curve model exhibits the poorest fit, with a median R2 below 0.2.
To evaluate the different performances of the global datasets, we compared time series of observed monthly δ18O and δ2H with model outputs from the Sine Curve, IsoGSM, and Isoscape models across all selected locations. Figure 9 shows the δ18O comparisons at four representative sites: Liangfeng Cave, Yongxing Cave, Chaoshuidong Spring and the Met-II.uz meteorological station near Anyak Spring (see Sect. S1 in the Supplement for a complete comparison of other 51 sites). Overall, the Sine Curve model shows limited ability to reproduce the temporal course of the observations. In contrast, the IsoGSM model closely aligns with the observed δ18O dynamics at the four sites, yielding high R2 values (0.85, 0.81, 0.94, and 0.78 for Liangfeng Cave, Yongxing Cave, Chaoshuidong Spring and the Met-II.uz meteorological station near Anyak Spring, respectively) alongside relatively low RMSE values, reflecting robust performance in both correlation and prediction accuracy. The Isoscape model attains moderate predictions, with R2 exceeding 0.5 at all four sites. Although it outperforms the Sine Curve model, it tends to be less reliable than IsoGSM in capturing the isotopic variability.
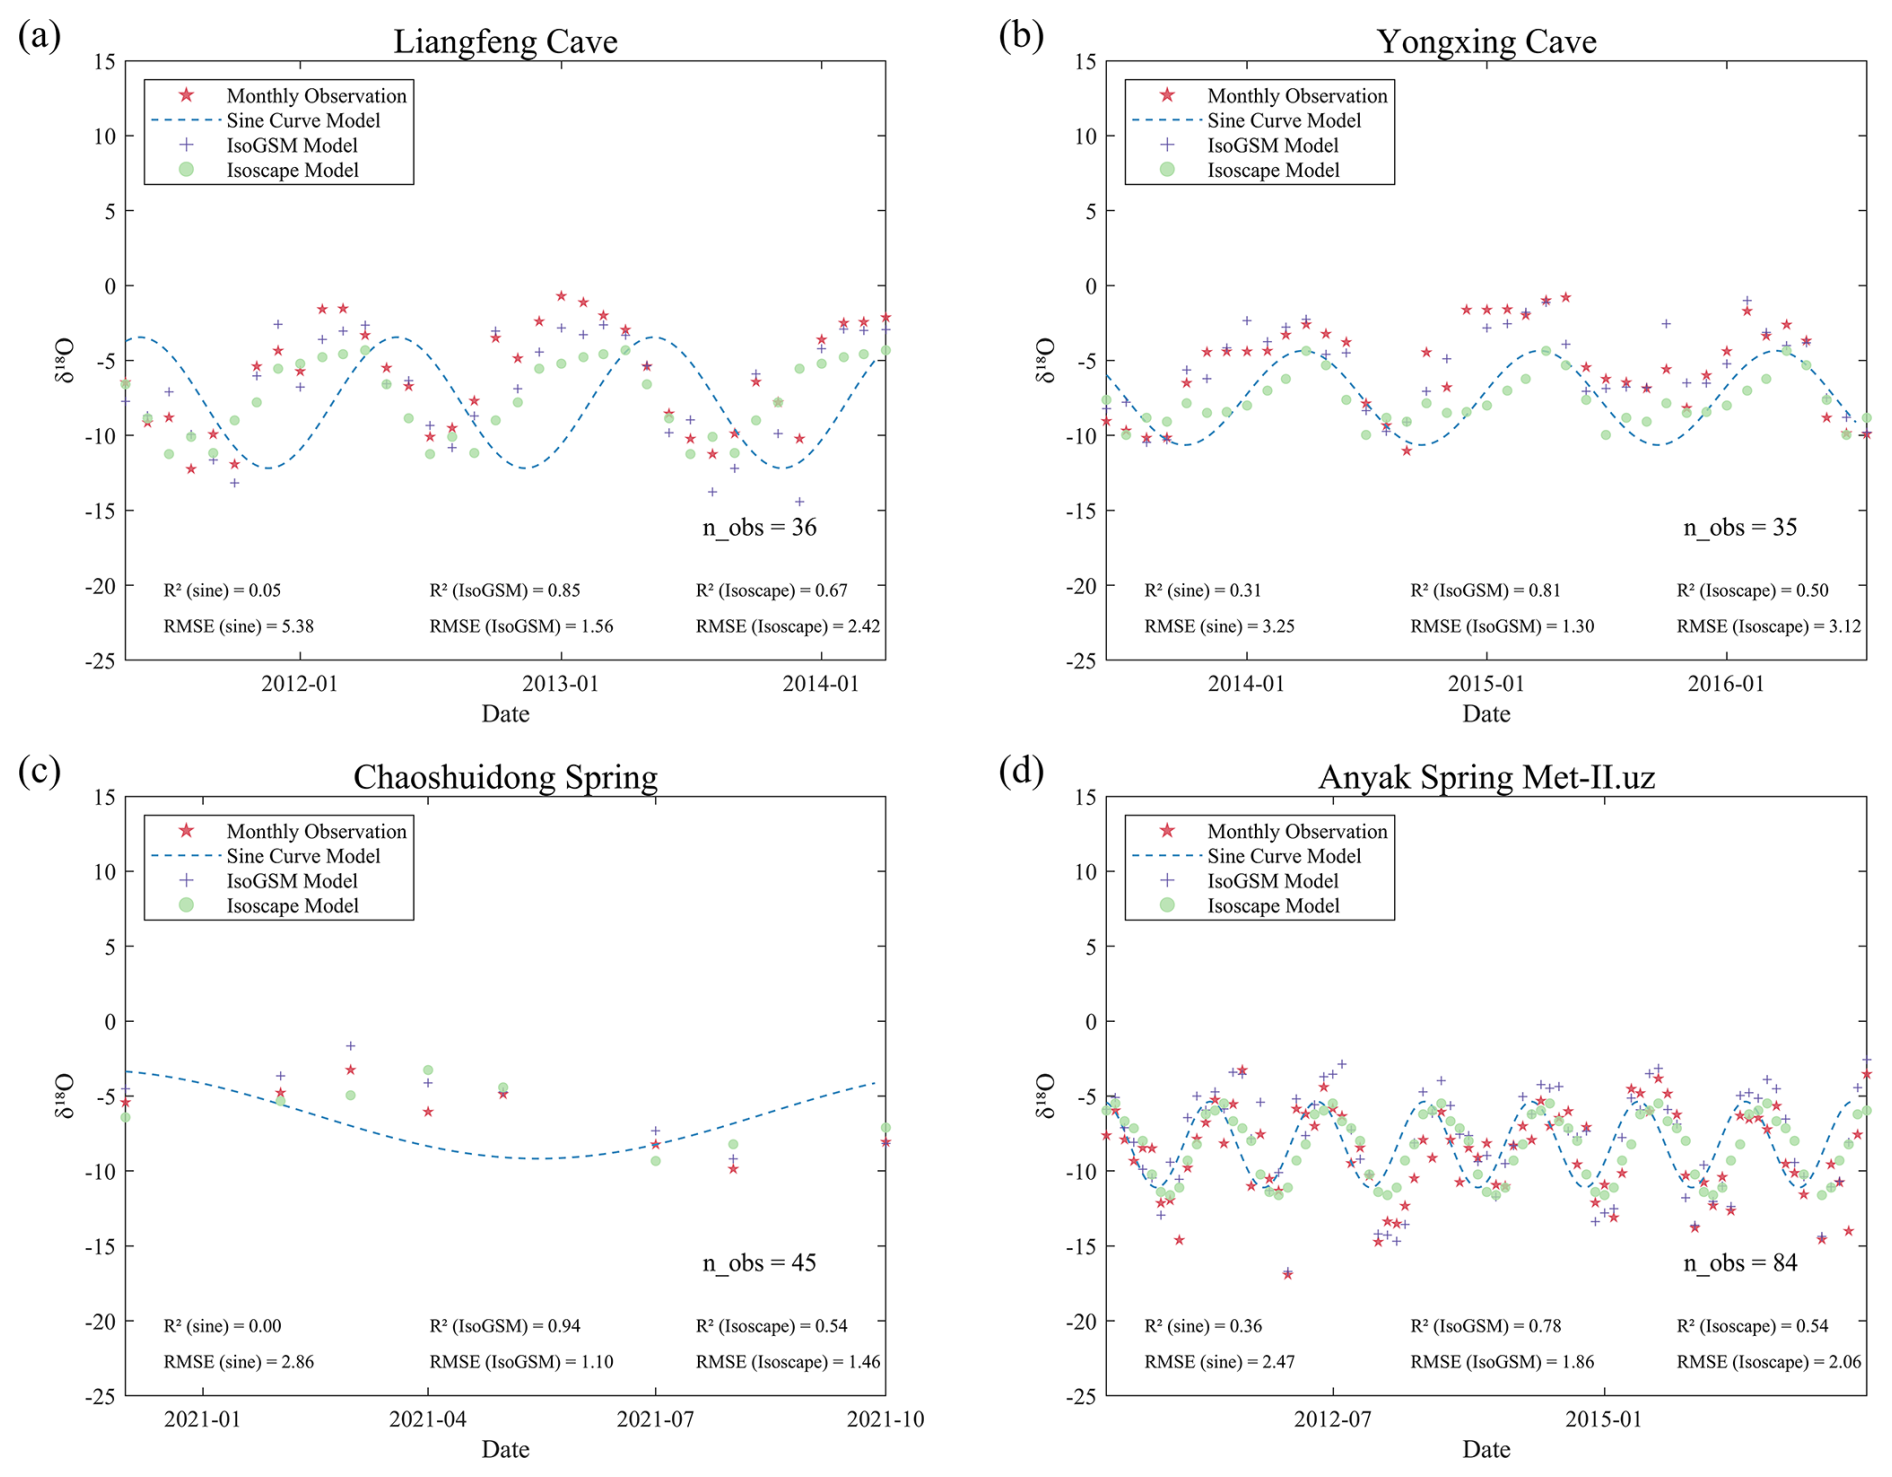
Figure 9Time series comparison of modelled and observed monthly δ18O in precipitation at two cave sites (a, b) and two spring sites (c, d). Observations (red stars) are compared with estimates from the Sine Curve model (dashed blue line), IsoGSM (purple crosses), and the Isoscape model (green circles). Each panel shows the number of monthly observations (n.obs) and model performance statistics (R2 and RMSE).
Figure 10 presents δ2H time series comparisons between observations and simulations from three models at four sites: Heshang Cave, Yongxing Cave, Krbavica Spring and Laolongshui Spring (comparisons for other sites are shown in Fig. S2 in the Supplement). Similarly, the Sine Curve model shows the poorest agreement with observations at Heshang Cave, Yongxing Cave, and Krbavica Spring, as reflected by low R2 values of 0.37, 0.57, and 0.1 respectively, and high RMSEs (up to 50.11 ‰). Although it shows relatively higher R2 values of 0.85 at Laolongshui Spring, its corresponding large RMSE value of 46.55 ‰ reveals substantial absolute predictive errors. The IsoGSM model shows the best performance at Heshang Cave and Yongxing Cave, with the highest R2 (0.8 and 0.82) and lowest RMSE (15.53 ‰ and 10.56 ‰). These results highlight the IsoGSM model's strong predictive accuracy in tracking δ2H variability at both sites. At Krbavica Spring, IsoGSM and Isoscape exhibit comparable performance in terms of correlation, with R2 values of 0.71 and 0.7. However, IsoGSM shows a lower RMSE (21.3 ‰) compared to Isoscape (35.21 ‰), indicating that although both models reproduce the temporal variation similarly, IsoGSM offers more precise estimates of δ2H magnitudes. At Laolongshui Spring (Fig. 10d), the Isoscape model outperforms the IsoGSM model and Sine Curve model, with the highest R2 and lowest RMSE values.
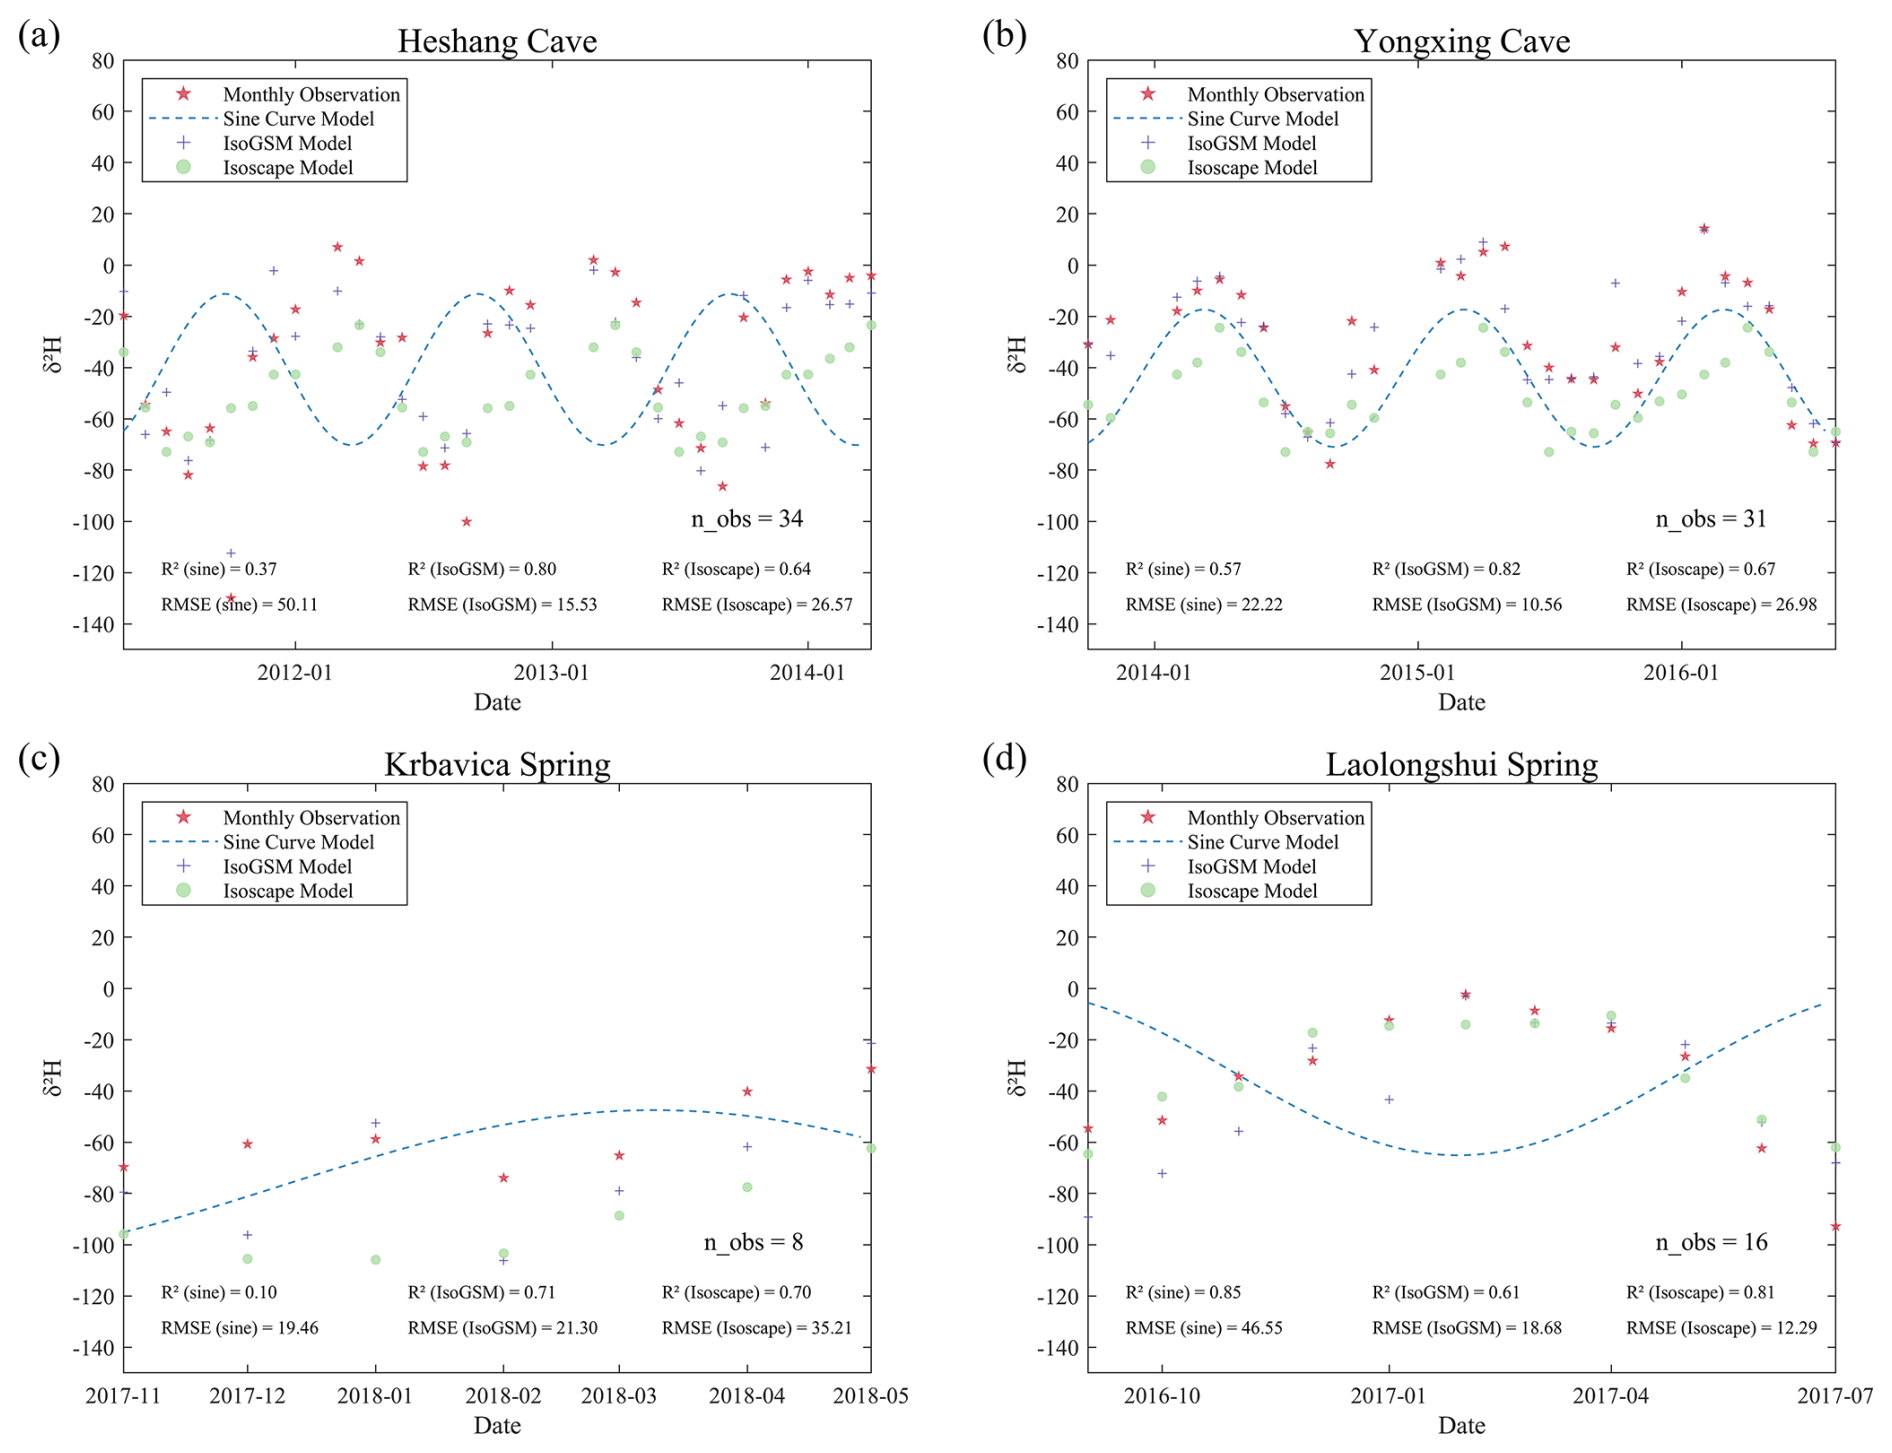
Figure 10Time series comparison of modelled and observed monthly δ2H in precipitation at two cave sites (a, b) and two spring sites (c, d). Observations (red stars) are compared with estimates from the Sine Curve model (dashed blue line), IsoGSM (purple crosses), and the Isoscape model (green circles). Each panel shows the number of monthly observations (n.obs) and model performance statistics (R2 and RMSE).
Overall, the comparisons indicate that IsoGSM shows slightly superior performance over Isoscape and pronouncedly superior performance over the Sine Curve model. Different phase shifts between δ18O and δ2H in the Sine Curve model indicate a poor representation of their physical covariance, which is given through the global/local meteoric water line. Based on these results, IsoGSM is recommended as the preferred product for cave and spring locations where no local observations are available.
The datasets compiled in the WoKaS-Iso database are publicly archived as a zipped package titled “WoKaS_Iso_Data_Records” in OPARA, an open-access repository of research data from Saxon Universities (https://doi.org/10.25532/OPARA-909; Zang, 2025). The zip file is organized into three main folders: WoKaS_Iso_Input_Data, WoKaS_Iso_Output_Data, and Global_Products_Data. Each folder is subdivided into several subfolders, with their structure and contents described in the following section:
3.1 WoKaS_Iso_Input_Data
Contains precipitation amounts and precipitation isotopes (δ18O and δ2H) metadata tables and corresponding datasets for karst springs and cave sites:
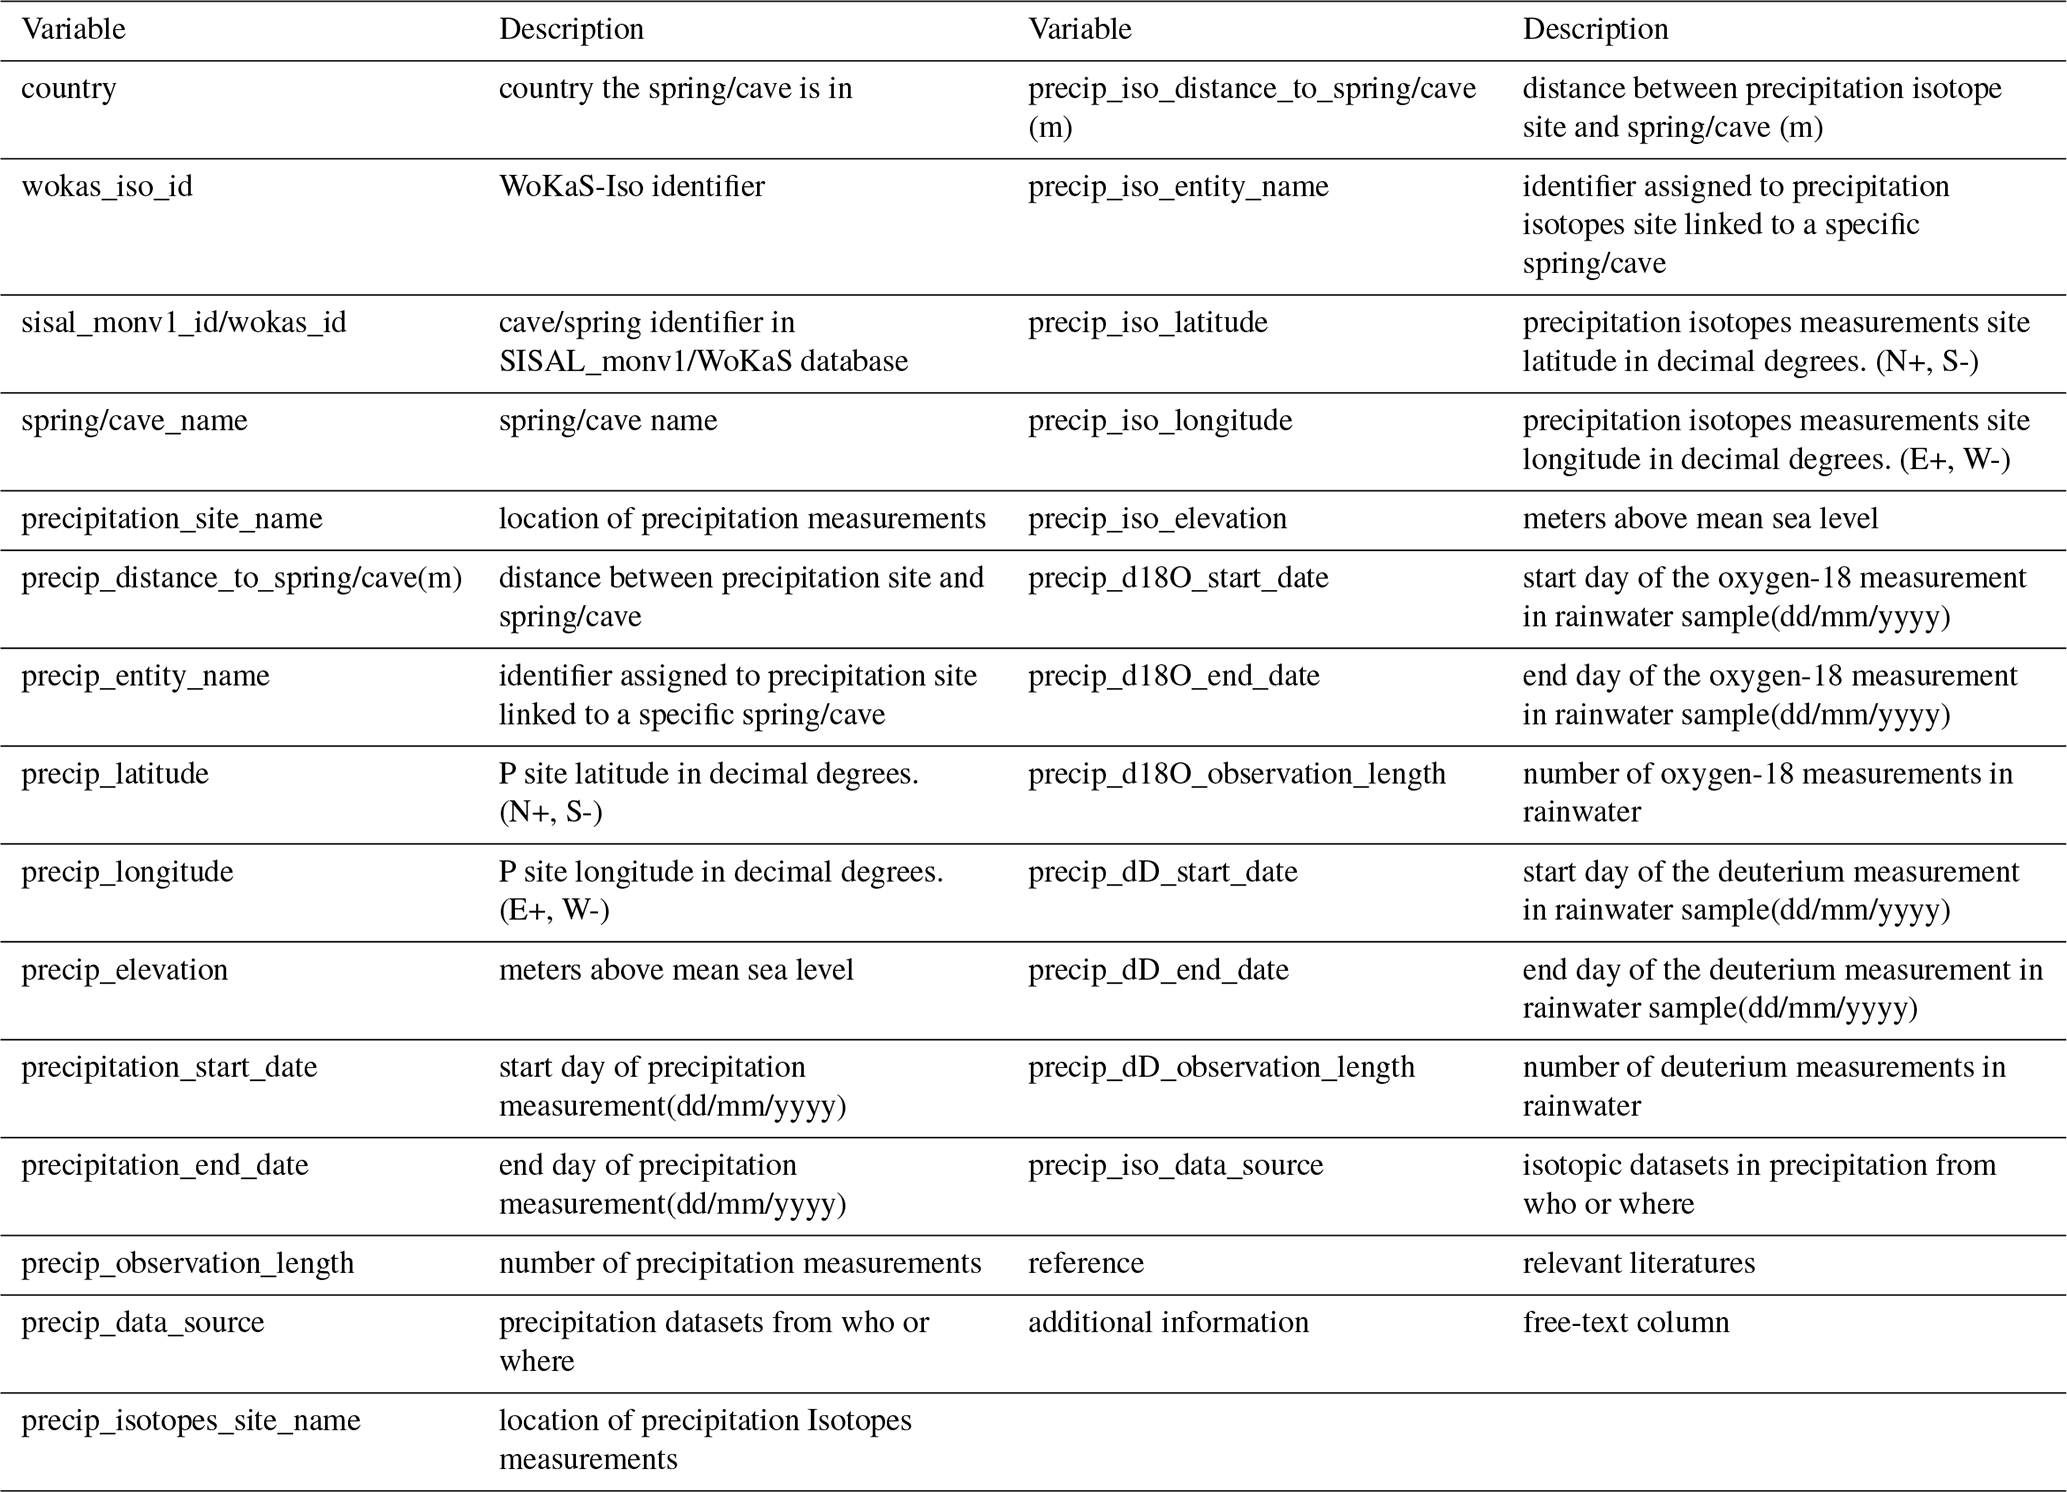
Table 3Description of variables in the spring/cave input data metadata files.
- i.
WoKaS_Iso_Spring_Input_Metadata provides summarised information on the precipitation and precipitation isotope sites associated with each spring included in the database. Each spring is assigned a unique identifier as wokas_iso_id, which is constructed by using the ISO country code (e.g., AT for Austria), a data type indicator (S for spring and C for cave), and a serial number (e.g., AT-S-0001). Some springs are associated with multiple precipitation or precipitation isotopes sites sharing the same wokas_iso_id, but each site is assigned its own precipitation_entity_name and precip_iso_entity_name as keys to link the metadata with their corresponding dataset. Furthermore, the precip_distance_to_spring and precip_iso_distance_to_spring indicate the distances in meters from each site to the specific spring. This structure allows users to flexibly select the desirable sites for their use. The full list of variables included in the spring input metadata table is explained in the Table 3.
- ii.
WoKaS_Iso_Spring_Input_Datasets consists of 140 csv files. Each csv file represents the time series of precipitation amount and precipitation δ18O and δ2H for a specific spring. The csv file naming format is Input-wokas_iso_id@spring_name (e.g., Input-AT-S-0002@Wasseralmquelle(A)). Each csv file contains wokas_iso_id, precipitation_entity_name, date_precip (precipitation observation date), precipitation, unit (precipitation amount unit), precip_iso_entity_name, date_precip_iso (precipitation isotope sampling date), d18O, dD, and note.
- iii.
WoKaS_Iso_Cave_Input_Metadata offers metadata summaries for cave sites input data, structured in the same way as the spring input metadata table. Similarly, each cave identifier is assigned a unique identifier consisting of the ISO country code, the cave data type indicator C, and its serial number (e.g., AT-C-0001). The entity name and distance fields align with the same conventions as springs. All variables are consistent with those used for the spring metadata and are presented in Table 3.
- iv.
WoKaS_Iso_Cave_Input_Datasets contains 67 csv files; each refers to a specific cave site. The csv file naming convention and internal structure follow the same pattern (e.g., Input-AT-C-0001@Obir Cave) as described in the spring input datasets section.
3.2 WoKaS_Iso_Output_Data
Includes output metadata tables and output datasets for karst springs and cave drip sites:
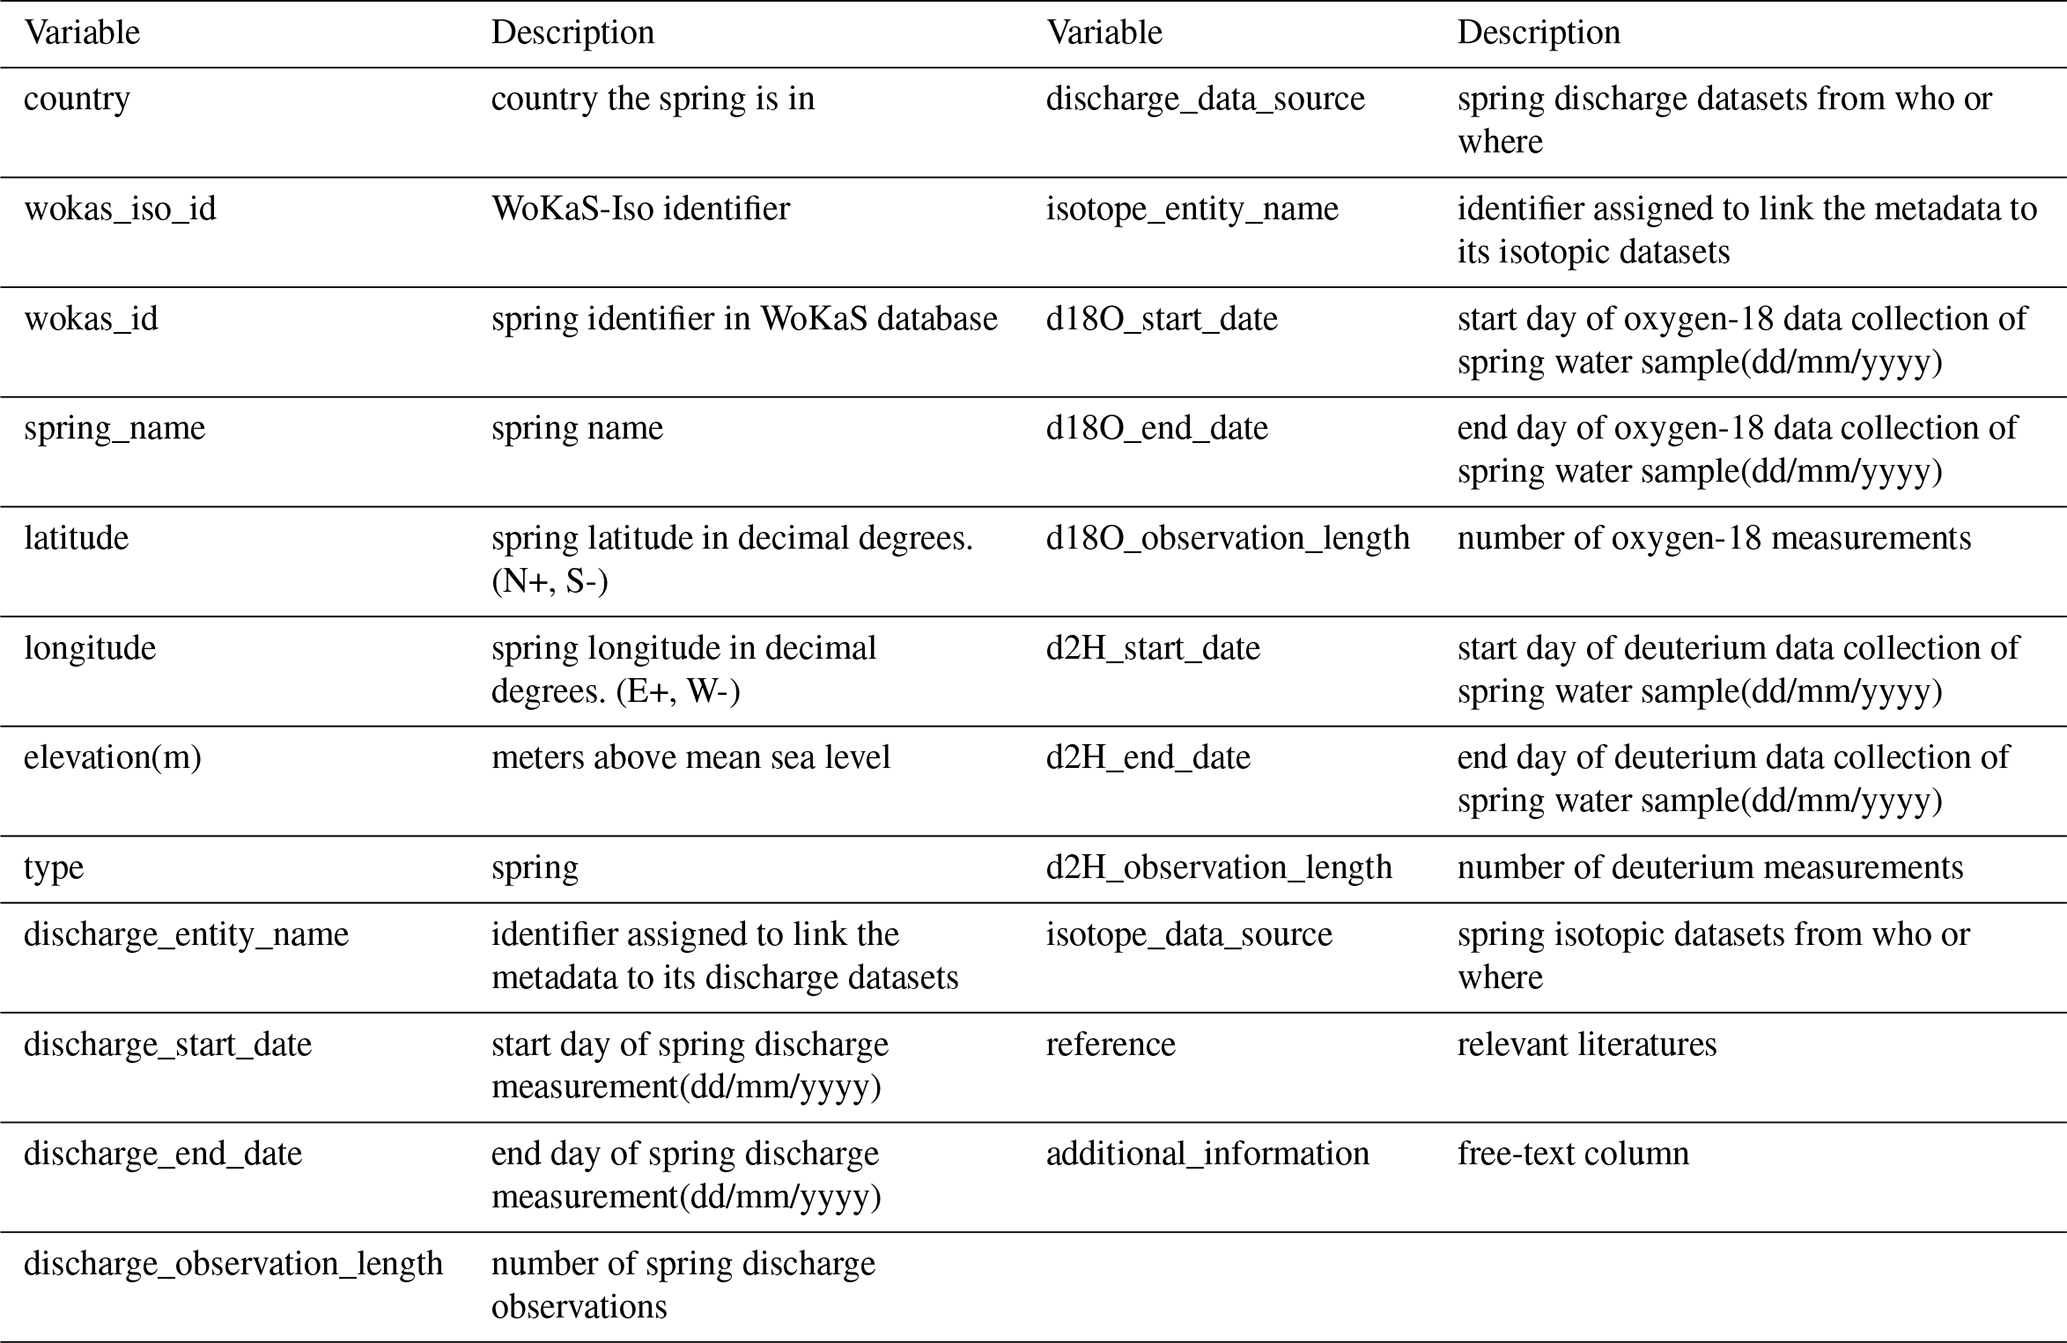
Table 4Description of variables in the spring output metadata table.
- i.
WoKaS_Iso_Spring_Output_Metadata summarizes attributes for karst springs documented in the WoKaS-Iso database including the geographic information on the springs and an overview of karst spring discharge and isotopes for each spring. Each spring has the consistent identification through unique wokas_iso_id, the same identifier used in the spring input data records. In the same way, the specific fields discharge_entity_name and isotope_entity_name are designed to establish the connection to their corresponding datasets. The complete list of parameters contained in the spring output metadata table is shown in Table 4.
- ii.
WoKaS_Iso_Spring_Output_Datasets presents karst spring discharge, δ18O and/or δ2H datasets for 241 springs, organized as 241 separate csv files. Every csv file follows a standardized naming format “Output-wokas_iso_id@spring_name” (e.g., Output-AT-S-0002@Wasseralmquelle(A)). The uniform internal structure of each workbook includes the following columns: wokas_iso_id, discharge_entity_name, date_discharge (measurements date), discharge, discharge_unit (the unit of discharge), iso_entity_name, date_iso (isotope data sampling date), d18O, and dD.
- iii.
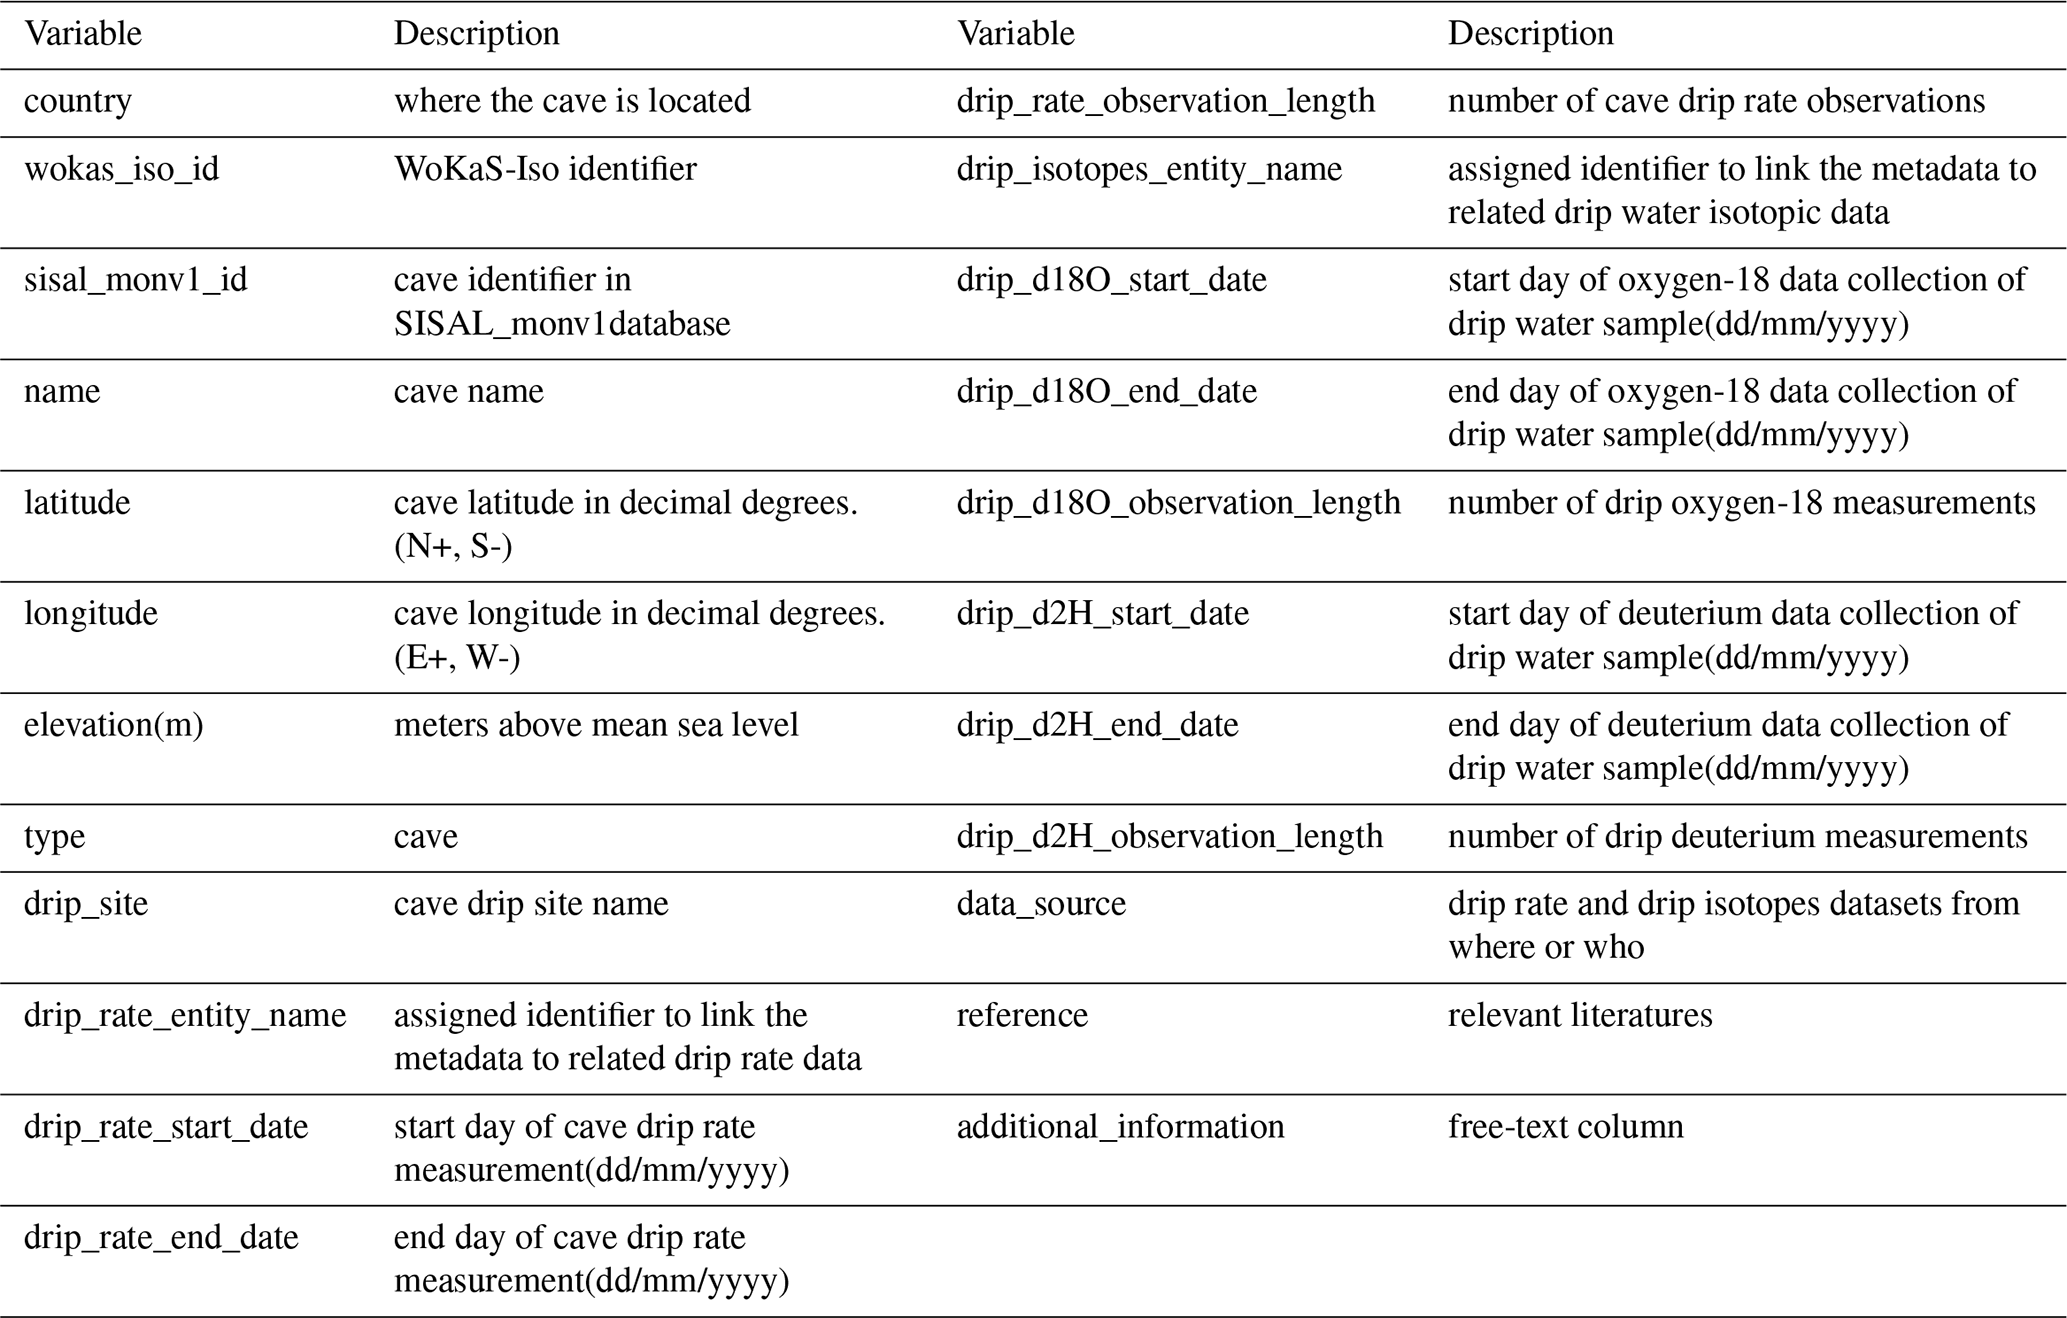
WoKaS_Iso_Cave_Output_Metadata comprises a comprehensive overview of cave drip rate and cave drip isotopic records (δ18O and δ2H) for all cave drip sites. Each cave includes multiple drip sites that are assigned the same wokas_iso_id in the cave input section but are distinguished by the unique drip_rate_entity_name and drip_iso_entity_name entries. Explanations for each variable in the cave output metadata table are presented in Table 5.
- iv.
WoKaS_Iso_Cave_Output_Datasets contains 73 csv files. Each csv file stores the drip rate and drip isotope datasets for an individual cave. The csv file name follows the format Output-wokas_iso_id@cave_name (e.g., Output-AT-C-0001@Obir Cave). Within each csv, multiple drip sites are documented using their unique entity names. The content includes the following columns: wokas_iso_id, drip_rate_entity_name, date_rate (drip rate measurement date), unit (the unit of drip rate), drip_iso_entity_name, date_iso (sampling date of drip water isotope), d18O, and dD.
Table 5Description of variables in the cave output metadata table.
3.3 Global_Products_Data
Contains gridded global product data and associated extraction tools used in WoKaS-Iso. It includes extracted datasets for WoKaS-Iso spring and cave sites from six global products, global IsoGSM2 datasets prepared for user-defined extraction, and MATLAB scripts for extracting selected global products at specified geographic coordinates. The folder is organized into the following subfolders: WoKaS_Iso_MSWEP, WoKaS_Iso_GLEAM, WoKaS_Iso_ERA5, WoKaS_Iso_IsoGSM, WoKaS_Iso_Isoscape, WoKaS_Iso_Sine_Curve, IsoGSM2_Global_DAT_for_Extraction, and WoKaS_Iso_Scripts.
-
WoKaS_Iso_MSWEP, WoKaS_Iso_GLEAM, WoKaS_Iso_ERA5, WoKaS_Iso_Sine_Curve: the modelled data from these products are systematically sorted into four subfolders according to location type (spring or cave) and temporal resolution (daily or monthly). For example, WoKaS_Iso_MSWEP folder includes WoKaS_Iso_Daily_MSWEP_Caves, WoKaS_Iso_Daily_MSWEP_Springs, WoKaS_Iso_Monthly_MSWEP_Caves, and WoKaS_Iso_Monthly_MSWEP_Springs. Each subfolder contains compatible csv files storing continuous time series for individual springs or caves. The csv file names adhere to a standardized naming rule, combining the product name, temporal resolution, the wokas_iso_id, and spring/cave name. For instance, MSWEP_Daily_AT-C-0001@Obir Cave refers to the daily gridded datasets from MSWEP for Obir Cave in Austria.
-
WoKaS_Iso_IsoGSM, WoKaS_Iso_Isoscape: Since IsoGSM2 and Isoscape provide monthly δ18O and δ2H data only, each folder is subdivided into two categories for caves and springs: WoKaS_Iso_IsoGSM/Isoscape_Monthly_Caves and WoKaS_Iso_IsoGSM/Isoscape_Monthly_Springs. The csv file naming is slightly different from the other products and is constructed using IsoGSM/Isoscape_wokas_iso_id@spring/cave_name (e.g., IsoGSM_AT-C-0001@Obir Cave; Isoscape_AT-C-0001@Obir Cave).
-
IsoGSM2_Global_DAT_for_Extraction: This folder contains the global IsoGSM2 precipitation isotope datasets in DAT format. These data are not limited to WoKaS-Iso sites and can be used with the provided MATLAB extraction script to extract monthly precipitation δ18O and δ2H values at any geographic coordinates of interest.
-
WoKaS_Iso_Scripts: This folder contains MATLAB scripts developed to aid users in data extraction from selected global products. The scripts include routines for extracting daily and monthly hydroclimate data from NetCDF files of MSWEP, GLEAM, and ERA5, as well as routines for extracting precipitation isotope data from IsoGSM2 DAT files and Sine Curve model TIFF files. The accompanying README.md file provides detailed instructions on obtaining and preparing the required input datasets, including links to download or access the relevant global product data, preparing coordinate files for user-specified extraction, setting file paths, running the scripts, selecting temporal resolution where applicable, and interpreting the resulting CSV outputs. It also provides example coordinate input and describes the expected output CSV structures for daily hydroclimatic data, monthly hydroclimatic data, and precipitation isotope data. The scripts were developed for the global product versions and file formats listed in Table 2 and described in the README.md file. For NetCDF-based products, users should verify the product version, temporal coverage, variable names, dimensions, and time metadata from the downloaded NetCDF files or the corresponding data provider documentation, as the extractable time period and version depend on the files provided by the user. If updated product versions are used and these properties differ from the supported formats, the script settings may need to be adjusted. In addition, detailed comments are included within each script to guide users through the extraction workflow.
3.4 Usage notes
-
Metadata: The columns precip_data_source, precip_iso_data_source (in the spring and cave input metadata tables), discharge_data_source, isotope_data_source (in the spring output meta table), and data_source (in the cave output metadata table) specify the origins of the respective data: precipitation, precipitation isotopes, discharge, spring isotope data, cave drip rate and cave drip isotopes, respectively. These sources can include data contributors, or digitization from specific figures or tables in publications, reports or theses, or retrieval from online repositories with links provided if applicable. All metadata tables include the reference column listing all related literature in which: (1) the spring/cave drip site was studied; (2) the data were originally published; (3) figures and tables were digitized. These references enable users to get further context regarding dataset sampling methods, climate conditions, and hydrogeological settings of the studied spring/cave system. For peer-reviewed publications, DOIs are offered, while URLs for reports or theses are provided if available.
-
Machine-readability: All csv files storing input and output datasets are designed in a machine-readable format to facilitate efficient and automated data processing.
-
Link metadata to datasets: Each csv file name incorporates the unique wokas_iso_id that is recorded in the metadata tables. This identifier enables the related spring or cave dataset to be located by matching it with the file name (e.g. Output-wokas_iso_id@spring_name). Additionally, within each csv file, the entity name fields (precip_entity_name, precip_iso_entity_name, discharge_entity_name, isotope_entity_name, drip_rate_entity_name, and drip_iso_entity_name) can work as the identified keys to connect with the corresponding metadata entries. These identifiers can be utilized to retrieve specific time series data from the measurement sites of interest.
-
Global products datasets: Model-derived data corresponding to each site are provided in CSV files named according to their respective wokas_iso_id for easy reference. In monthly datasets, dates are separated into two columns: year and month, while daily data use a single dd/mm/yyyy format. These data represent the closest grid cell to each site; therefore, users should be aware of potential spatial differences when comparing them with local observations. Proper citation of original data sources is required when utilizing these datasets.
-
Global product scripts: The MATLAB scripts allow users to extract selected global product data for additional coordinates or updated input datasets. For MSWEP, GLEAM, and ERA5, the extractable time period depends on the NetCDF files provided by the user. IsoGSM2 extraction is based on the provided monthly DAT-format datasets covering 1979–2021, while the Sine Curve model can generate daily or monthly values for any year. Automated data download is not included; users should follow the README.md file for data preparation, path settings, and script execution.
-
Isoscape data extraction: The Isoscape product provides gridded raster datasets in GeoTiff format. In WoKaS-Iso, the precipitation isotope values were extracted from the global gridded maps using ArcGIS Pro. The global gridded maps of precipitation δ18O and δ2H are available from WaterIsotopes.org (Bowen, 2026). For the mean monthly precipitation isotope grids, the interpolation method follows Bowen et al. (2005), with GNIP data used as the main data source (IAEA/WMO, 2015). The monthly Isoscape products consist of separate gridded maps for each month from January to December, for both δ18O and δ2H. To extract values for new locations, users should first download the relevant monthly maps, load them into ArcGIS, and import the corresponding coordinates as a CSV file. After extraction, the resulting table provides monthly δ18O and δ2H estimates for each site from January to December. Since this procedure relies on GIS-based raster extraction, no MATLAB extraction routine is provided for Isoscape in WoKaS_Iso_Scripts.
-
Example use case: A typical workflow starts by selecting a spring or cave site from the output metadata tables and identifying its wokas_iso_id and spring/cave name, for example, CN-S-0006 and Banzhai Spring. Users can then locate the matching output CSV file Output-CN-S-0006@Banzhai Spring in the WoKaS_Iso_Spring_Output_Datasets folder (or the WoKaS_Iso_Cave_Output_Datasets folder for a selected cave site) using this identifier CN-S-0006 or spring name Banzhai Spring. In this output file, the columns date_iso, d18O, and dD provide the isotope time series, while date_discharge and discharge provide the discharge record where available. If precipitation or precipitation isotope input data are required, users can check the input metadata tables and locate the corresponding input CSV file Input-CN-S-0006@Banzhai Spring in WoKaS_Iso_Spring_Intput_Datasets (or WoKaS_Iso_Cave_Input_Datasets folder for a cave).
If measured input data are unavailable, global product data can be used as an alternative. For Banzhai Spring, users first select the relevant product folder according to the required variable, such as WoKaS_Iso_MSWEP for precipitation, WoKaS_Iso_GLEAM for AET and PET, WoKaS_Iso_ERA5 for air temperature, and WoKaS_Iso_IsoGSM, WoKaS_Iso_Isoscape, or WoKaS_Iso_Sine_Curve for precipitation isotopes. Within each product folder, users then select the subfolder corresponding to spring sites and the required temporal resolution. For example, daily precipitation data can be found in WoKaS_Iso_MSWEP/WoKaS_Iso_Daily_MSWEP_Springs/ in the file MSWEP_Daily_CN-S-0006@Banzhai Spring, while monthly precipitation data can be found in WoKaS_Iso_MSWEP/WoKaS_Iso_Monthly_MSWEP_Springs/ with the file MSWEP_Monthly_CN-S-0006@Banzhai Spring. The same logic applies to other products, for example, GLEAM_Daily_CN-S-0006@Banzhai Spring or GLEAM_Monthly_CN-S-0006@Banzhai Spring in the corresponding GLEAM spring subfolders, ERA5_Daily_CN-S-0006@Banzhai Spring or ERA5_Monthly_CN-S-0006@Banzhai Spring in the corresponding ERA5 spring subfolders, and Sine_Curve_Daily_CN-S-0006@Banzhai Spring or Sine_Curve_Monthly_CN-S-0006@Banzhai Spring in the corresponding Sine Curve spring subfolders. IsoGSM2 and Isoscape are provided at monthly resolution only and can be accessed through their spring subfolders using files such as IsoGSM_CN-S-0006@Banzhai Spring and Isoscape_CN-S-0006@Banzhai Spring.
For cave sites, users can follow the same procedure using the corresponding cave metadata tables, cave input and output dataset folders, cave subfolders within Global_Products_Data, and cave identifiers or names in the CSV file names.
4.1 Data quality control
A series of quality control measures were implemented throughout the large datasets synthesized in the WoKaS-Iso database to ensure data precision, consistency, and integrity:
Site information verification: All spring and cave drip site names, coordinates, elevations, data units, precipitation sites, and precipitation isotope sampling sites were initially cross-checked against the original sources: supplementary materials, tables, original data contributed by collaborators or related figures from which data were digitized. Additionally, all time series were reviewed for consistency with the original datasets, ensuring that each sampling date accurately matched its associated measurements to avoid any discrepancies.
Standardized formatting:
- i.
Naming convention: All wokas_iso_id entries were validated to confirm conformity with the standardized naming convention, including verification of the ISO country code, data type indicator (C for cave and S for spring) and sequential numbering within each country. The csv file names were systematically reviewed folder by folder to ensure compliance with the naming patterns stated in Sect. 3.
- ii.
CSV file structure: All files were checked to ensure that they were machine-readable in comma-delimited csv format. Each csv file was examined to guarantee a consistent internal structure with uniform column headers.
- iii.
Date and coordinate formatting: The dates were formatted consistently as dd/mm/yyyy across all datasets. The latitude and longitude were formatted to four decimals.
Consistency checks:
- i.
Data consistency: The dates and corresponding time series of all datasets were checked to confirm that they were sorted chronologically.
- ii.
Spatial consistency: Latitude and longitude were validated to ensure that they fell within valid ranges (N+, S-, E+, W-), and the spatial distribution on the map were verified through visualization.
- iii.
Metadata and dataset matching: The identifiers wokas_iso_id, precip_entity_name, precip_iso_entity_name, discharge_entity_name, iso_entity_name, drip_rate_entity_name and drip_iso_entity_name were cross validated against the metadata to ensure correct linkage with the corresponding datasets. In addition, the start date, end date, and observation length of all time series were checked to ensure alignment with the actual datasets.
Data source verification: Checking data sources recorded in the metadata tables was implemented to ensure proper citation and traceability. The indicated figures and tables were checked to be correctly represented. All provided URLs giving access to online database were tested to verify dataset retrieval. The DOIs (provided as web links) were confirmed to be working and accurately linked to the cited publications. Where available, links to reports and theses were also tested for accessibility.
For cave drip water datasets originating from SISAL_mon_v1, WoKaS-Iso builds on the automated quality control already applied by Treble et al. (2026). Within WoKaS-Iso quality control, the SISAL_mon_v1 records were therefore not reprocessed from scratch but underwent additional harmonisation and validation steps: mapping to the WoKaS-Iso file and naming conventions, cross-checking identifiers and time ranges against the new metadata structure and ensuring consistent linkage and interoperability with associated precipitation and spring datasets and references as described in the following.
4.2 Data quality attribution
The dataset quality for each spring and cave site was assessed using a scoring scheme that considers data availability and data source reliability for both system output and input variables (Table 6). For system output data, collected spring discharge/drip rate and collected spring/drip water isotope data were obtained from research collaborators, original authors, online databases or supplementary materials of publications. These sources are generally of high quality and were hence assigned a score of 3. digitized spring discharge/drip rate and digitized spring/drip water isotope data were digitized from plots in publications or reports or theses. Although the extraction process was carried out as precisely as possible, some inaccuracies and uncertainties inherently remained due to the resolution and temporal coverage of the original plots. Thus, a score of 2 was assigned to the digitized data. Locations without relevant data were given a score of 0. For system input data, three quality levels were defined according to the sources of precipitation isotope and precipitation amount data: local measurements, meteorological stations, and global models. The local observation (precip. isotope/amount) acquired from on-site monitoring, which are rare and particularly valuable for karst springs, were thus assigned the highest score of 3. The meteorological stations (precip.isotope/amount) data sourced from meteorological stations, while still based on measurements, are deemed less directly representative of site-specific conditions and were scored 2. In cases where neither local nor station-based inputs were available, the input data from Global products were provided as substitutes and assigned a score of 1. The total grade for each spring and cave site was calculated from the sum of its output and input data scores, based on the assessment criteria stated above. The site evaluation was then divided into three classes that reflect the overall reliability and completeness of the data collection.
Table 6The grading system for evaluation of the WoKaS-Iso database for karst springs and caves. Example: a spring with collected spring discharge (3 points), collected spring isotopes (3 points), local observation of precipitation isotopes (3 points), and local precipitation amount (3 points) receives a total score of 12.
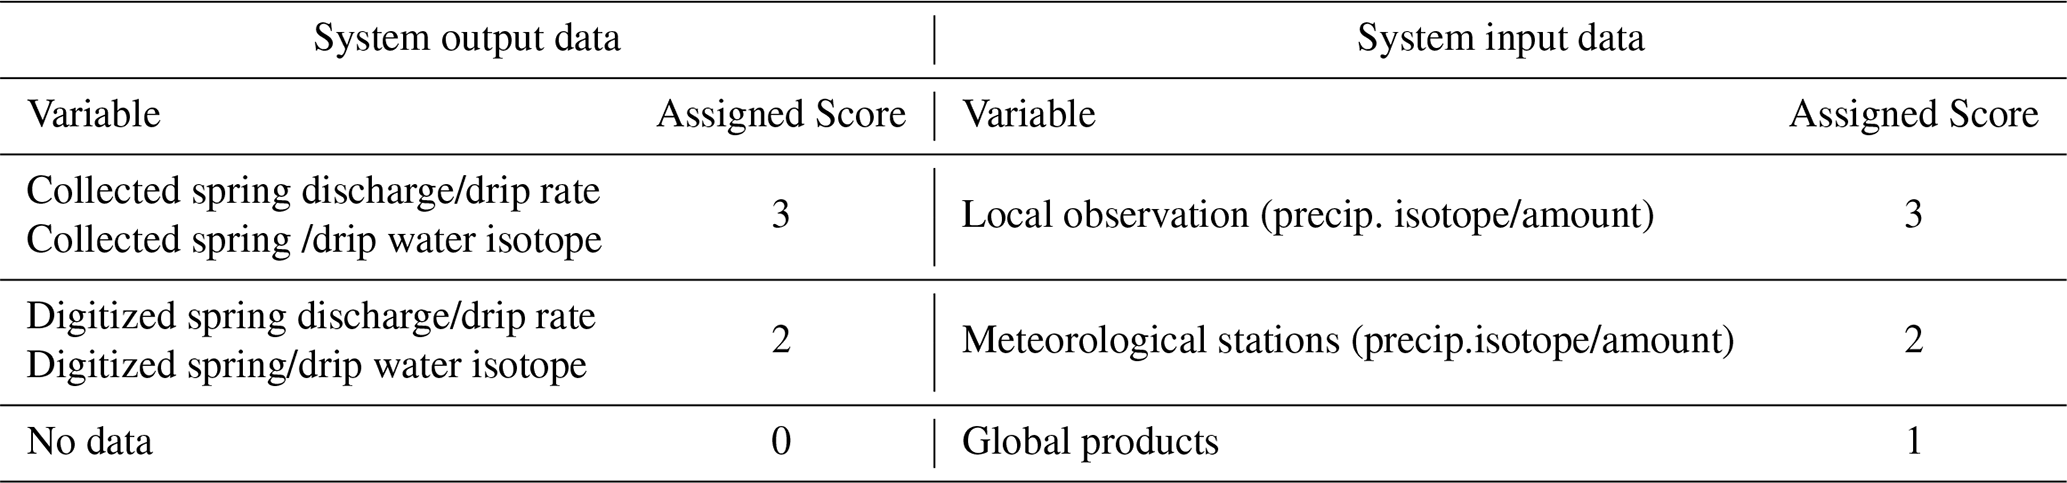
Note: The “No data” category is assigned to sites without flow rate data or aligned with SISAL_mon_v1 database at Shenqi Cave, as no cave drip water data are available and only input data are provided.
-
Class I (scores from 10 to 12): indicates robust datasets of high quality, generally obtained from raw output origins and/or locally measured inputs. Sites in this category keeps the most complete and reliable datasets, providing comprehensive information for the interpretation and modelling of karst systems.
-
Class II (scores from 7 to 9): reflects datasets of moderate quality. These sites usually retain the main output and input information required for analysis, but some records may be digitized or supplemented by less site-specific input sources. Although less strong, these data are still valuable for studies in both karst geohydrology and speleology.
-
Class III (scores below 7): represents datasets with limited data availability and lower source reliability. Sites in this category are generally characterized by missing variables and/or stronger reliance on digitized records or global model data. These datasets are helpful in identifying data-scarce regions and highlighting the need for more data collection.
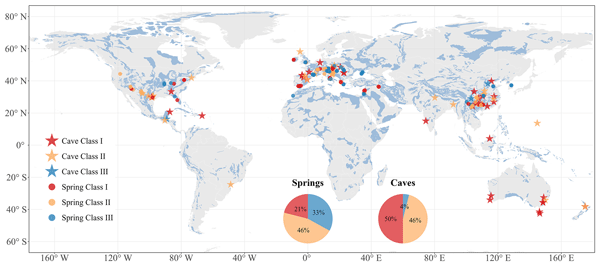
Attributing the quality classes to all our sites shows that most of them fall within Class I and Class II (Fig. 11). For springs, 21 % are categorized as Class I, and are predominantly distributed in China, Europe and the Middle East. Class II springs, the most common category, occupied 46 %, due to the scarcity and limited availability of locally measured rainfall and rainwater isotopes for karst springs; while Class III accounts for 33 %, with a high proportion due to the absence of paired precipitation and precipitation isotope measurements for karst springs, the substitute modelled data were used. Class I and Class II springs are spread relatively evenly globally, while Class III springs are primarily found in Europe where karst spring monitoring is more extensive in the WoKaS-Iso database. For cave sites, a high proportion of 50 % is classified as Class I, Class II reached 46 %, with only a small proportion of 4 % falling into Class III. The distribution characteristics reflect the more complete and robust monitoring systems available for caves compared to karst springs. The Class I cave sites are mainly situated in Australia, China and Europe. The Class II caves are mostly located in Europe and the USA. Only 4 caves are grouped as Class III, scattered across various regions.
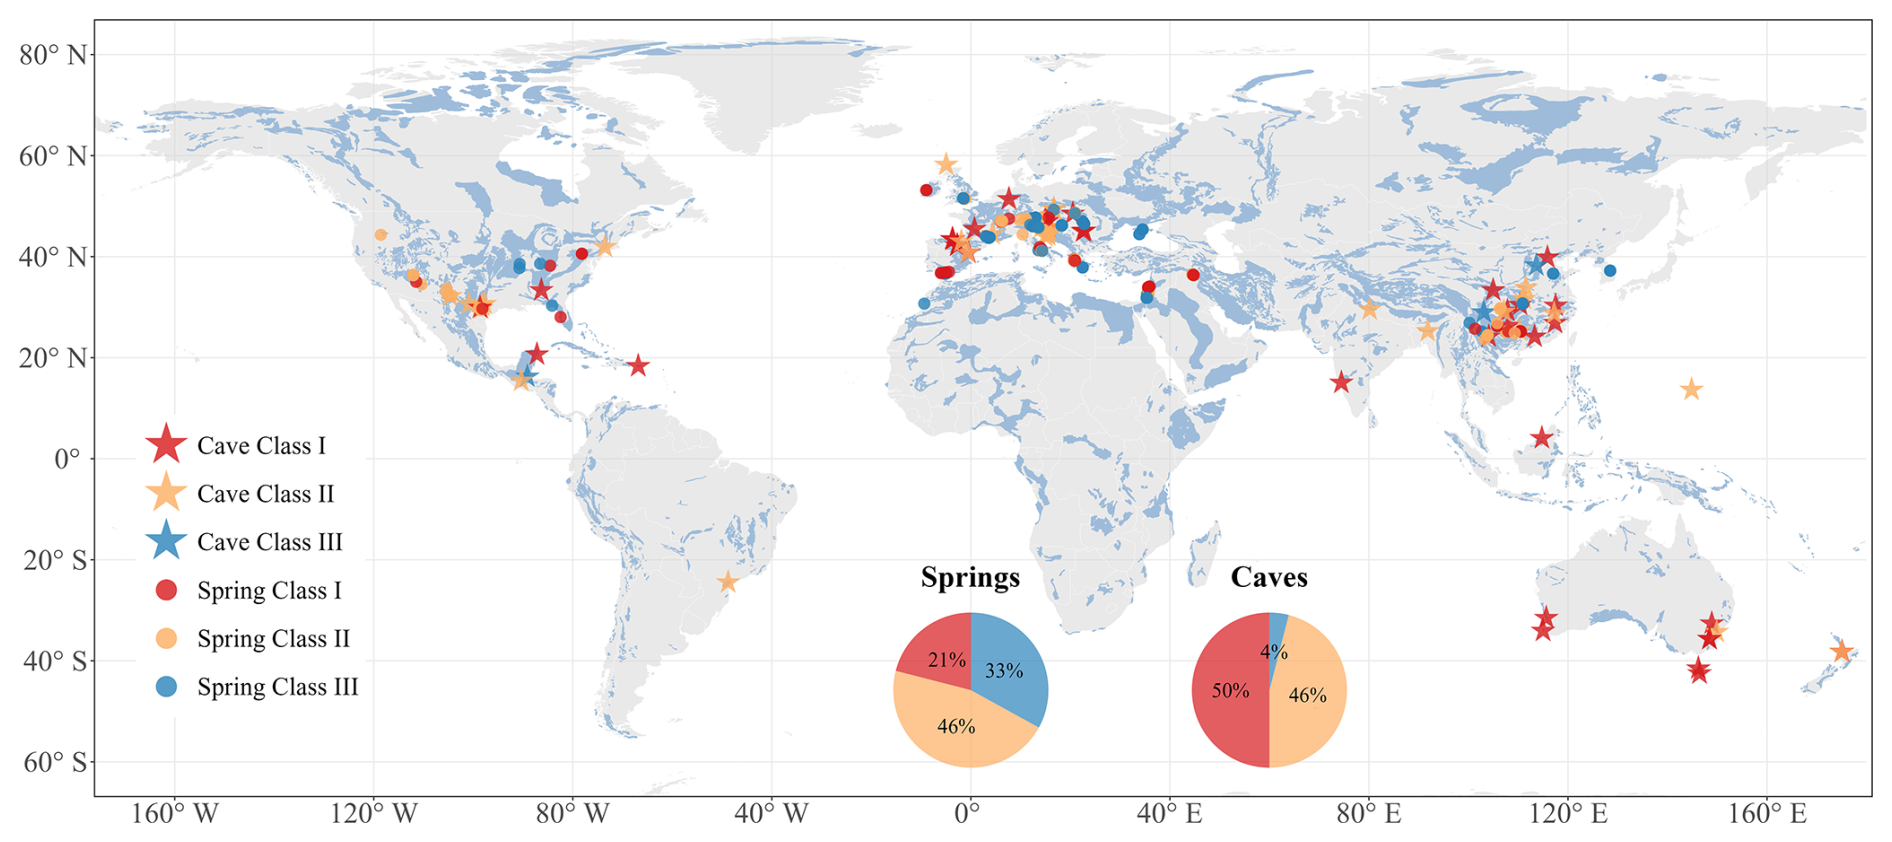
Figure 11Spatial distribution of karst springs and cave sites in the WoKaS-Iso database according to data quality evaluation classes. Blue areas indicate karst regions as delineated in the World Karst Aquifer Map (WOKAM, Chen et al., 2017). Star symbols refer to caves and circle symbols represent springs. Colours represent the three quality tiers: Class I (red), Class II (orange), and Class III (blue). Accompanying pie charts illustrate the proportion of each quality class for springs and caves, respectively.
4.3 Measurement gap characteristics of isotope records
In addition to the source-based quality control and completeness checks, we provide an additional characterization of isotope measurement intervals within WoKaS-Iso. Since stable isotope records are often collected at irregular frequencies, the time interval between consecutive observations provides useful complementary information on the temporal structure of the dataset. For this purpose, time gaps were calculated between successive sampling dates within each individual isotope record for karst springs and cave drip water using all available δ18O and δ2H observations. The resulting gap distributions were summarized separately for karst spring and cave drip water records using empirical cumulative distribution functions (ECDFs; Fig. 12).
For karst spring records, the ECDF curve (Fig. 12a) rises markedly around the 7 d threshold, showing a substantial contribution of weekly observations. The median gap is 15 d, and the interquartile range of 7–30 d indicates that the middle 50 % of spring observation intervals span from weekly to monthly timescales, reflecting heterogeneous observation frequencies across sites. Accordingly, 34 % of spring gaps are shorter than or equal to 7 d, while nearly 80 % are shorter than or equal to 31 d.
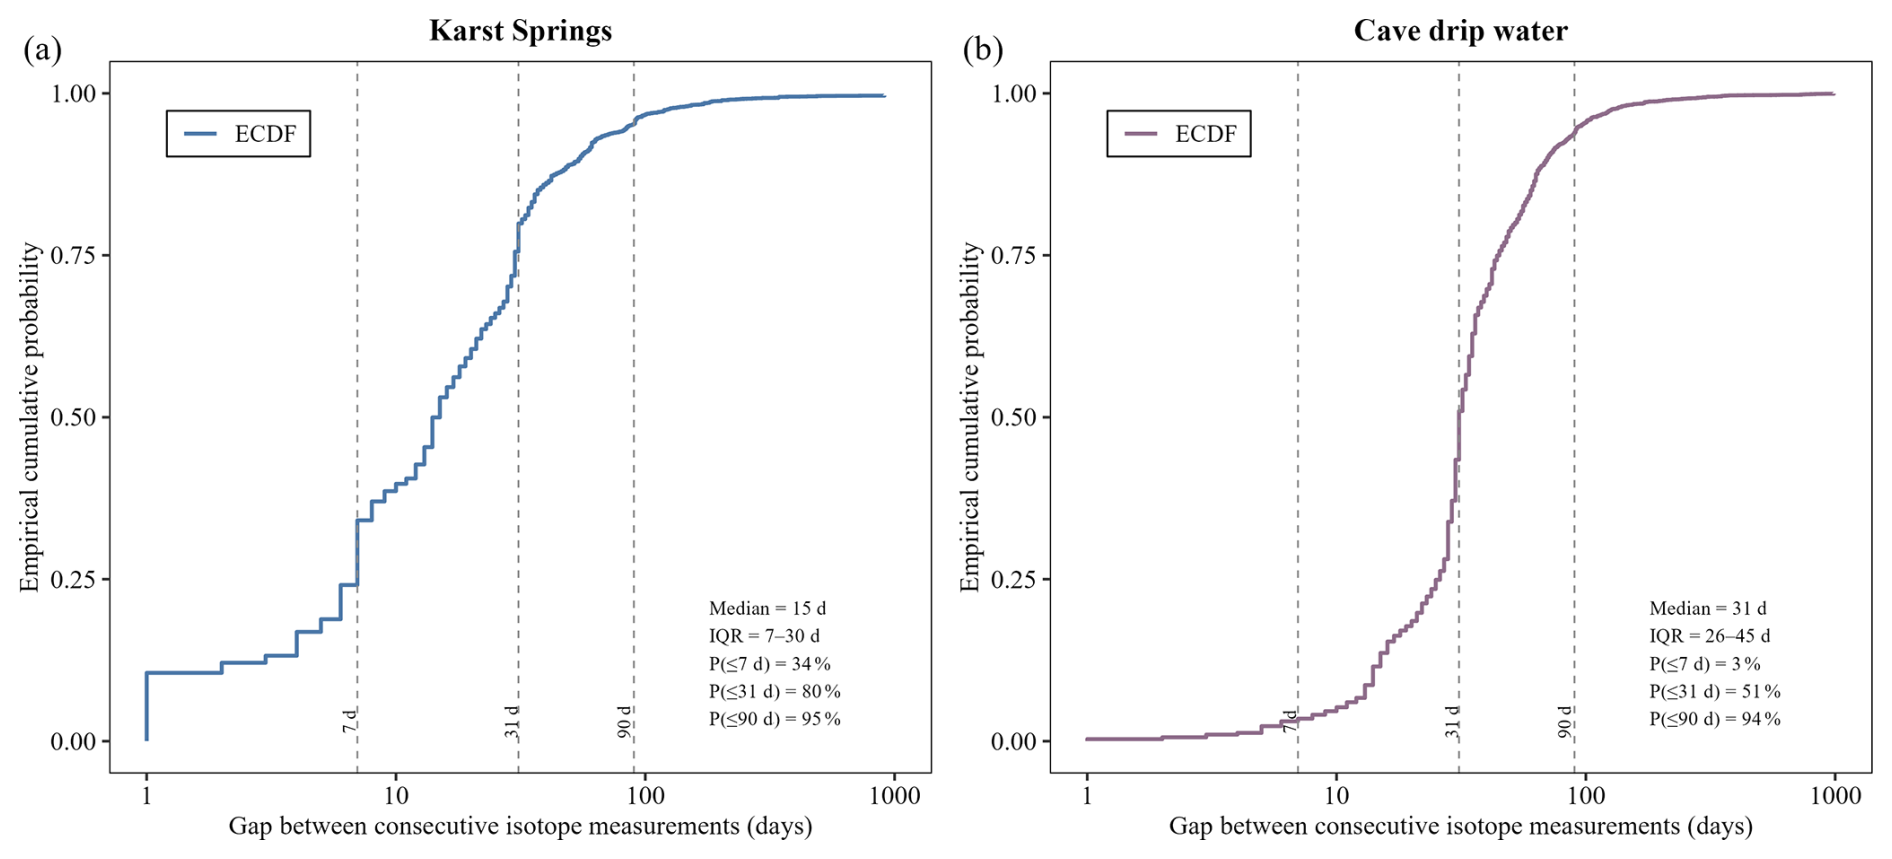
Figure 12Empirical cumulative distribution functions (ECDFs) of time gaps between consecutive stable isotope measurements for (a) karst spring and (b) cave drip water records included in WoKaS-Iso. Statistics within each panel show the median gap, interquartile range (IQR), and the proportion of observations sampled within 7, 31, and 90 d. Dashed lines denote the corresponding temporal thresholds.
The cave drip water ECDF remains low at weekly timescales but rises sharply around 31 d. This pattern indicates that cave drip water isotope measurements are strongly concentrated around monthly intervals. The median gap of 31 d and the narrower interquartile range of 26–45 d further suggest more regular observation intervals compared with karst springs. Only 3.5 % of cave drip-water gaps are shorter than or equal to 7 d, whereas 51 % are shorter than or equal to 31 d.
Despite these differences at weekly-to-monthly timescales, both systems converge near the 90 d threshold, with more than 94 % of gaps shorter than 90 d, indicating that most records were sampled at frequencies finer than seasonal timescales.
The dataset is available in the public repository at: https://doi.org/10.25532/OPARA-909 (Zang, 2025).
The data quality classification provides guidance for users on the proper application and interpretation of the datasets from each site. Class I datasets, with the most complete observational records, are recommended for process-based model calibration and validation, characterization of karst systems and paleoclimate construction. Class II datasets, consisting of partial measurements, or digitized output data, or station-based input data/modelled sources, are appropriate for regional-scale comparative studies, trend analysis and model sensitivity testing. Although less precise than Class I, these datasets remain valuable in regions with limited monitoring. Class III datasets, which rely heavily on digitized outputs and global products inputs, are useful for global exploratory studies, particularly in data-scarce regions.
The choice of input data source should depend on the specific research objective, required temporal coverage, spatial representativeness, and target variable. For site-specific process studies, local observations should be prioritised whenever available, as they provide the closest representation of the monitored spring or cave system. Where local precipitation or precipitation isotope observations are unavailable or incomplete, nearby meteorological stations or GNIP records can provide useful alternatives, provided that the distance, elevation difference, and record continuity are suitable for the intended application. Global products are recommended for large scale comparative analyses, gap filling, or studies requiring spatially consistent and temporally continuous forcing data across multiple sites. They may also be useful alongside local observations to provide broader spatial context or to extend temporal coverage. Among the evaluated global precipitation isotope products, IsoGSM generally showed the most consistent performance and is therefore recommended as the preferred global substitute when local or nearby station-based precipitation isotope observations are not available. Nevertheless, users should consider site-specific uncertainties and compare alternative products where possible, particularly in regions with complex karst topography or sparse observational networks, where the spatial representativeness of a single station or grid cell may be limited.
Future development efforts for WoKaS-Iso will focus on expanding spatial coverage and improving data quality by encouraging the sharing of raw data from literature, reports, internal databases, and unpublished records by researchers, institutions and monitoring programs, especially in underrepresented regions such as Africa, South America and Southeast Asia. Enhancements will include more detailed metadata, uncertainty estimates, data quality flags to improve usability. A web-based interface with visualizations is planned to facilitate data access.
The supplement related to this article is available online at https://doi.org/10.5194/essd-18-7199-2026-supplement.
YZ and AH collected the karst spring datasets. PCT and YZ contacted data contributors to obtain cave drip water data and aligned this dataset with the SISAL_mon_v1 dataset. YZ designed the structure of WoKaS-Iso database and organized the datasets. YZ digitized data from publication figures. YZ, AH, JGP and FZ contributed to data quality control. KY extracted IsoGSM datasets for each site and YZ performed data extraction from other global products. YZ developed extraction scripts for MSWEP, GLEAM and ERA5, with KÖC and XM assisting in code testing. YZ drafted the manuscript under the supervision of AH. All other authors contributed data to the WoKaS-Iso database.
The contact author has declared that none of the authors has any competing interests.
Publisher's note: Copernicus Publications remains neutral with regard to jurisdictional claims made in the text, published maps, institutional affiliations, or any other geographical representation in this paper. The authors bear the ultimate responsibility for providing appropriate place names. Views expressed in the text are those of the authors and do not necessarily reflect the views of the publisher.
Yining Zang acknowledges the financial support from the China Scholarship Council (202207720061). Yining Zang and Andreas Hartmann were supported by the German Research Foundation (DFG, grant no. HA 8113/6–1, project “Robust Conceptualisation of KArst Transport (ROCKAT)”). We want to thank Nikita Kaushal (American Museum of Natural History) for her help in aligning WoKaS-Iso with SISAL_mon_v1, and Qi Li (Robotics Research Lab, University Kaiserslautern-Landau) for assistance in writing global products extraction scripts. We also extend our gratitude to all researchers and institutions who provided data essential for this compilation. In addition, we acknowledge Albert Goede (Retired, formerly University of Tasmania, Australia), Chaojun Chen (No. 68, Juxian Street, Chenggong District, Kunming, Yunnan, 650500, China), Juan Pablo Bernal (Instituto de Geociencias, Campus UNAM Juriquilla, Querétaro, México, 76230), Paul W. Williams (Retired, formerly University of Auckland, School of Environment, Auckland, New Zealand), Quan Wang, Sebastian Breitenbach (Department of Geography and Environmental Sciences, Ellison D116, Northumbria University, Newcastle upon Tyne, NE1 8ST, UK), Yongjin Wang (School of Geography, Nanjing Normal University, Nanjing 210023, China), Yunxia Li (Hunan Normal University, No. 36 Lushan South Road, Changsha 410081, China) for their valuable contribution to both the SISAL_mon_v1 and WoKaS-Iso databases.
This research has been supported by the China Scholarship Council (grant no. 202207720061) and the German Research Foundation (DFG, grant no. HA 8113/6–1).
This paper was edited by Attila Demény and reviewed by Vianney Sivelle and one anonymous referee.
Allen, S. T., Jasechko, S., Berghuijs, W. R., Welker, J. M., Goldsmith, G. R., and Kirchner, J. W.: Global sinusoidal seasonality in precipitation isotopes, Hydrol. Earth Syst. Sci., 23, 3423–3436, https://doi.org/10.5194/hess-23-3423-2019, 2019.
Andreo, B., Liñán, C., Carrasco, F., Jiménez de Cisneros, C., Caballero, F., and Mudry, J.: Influence of rainfall quantity on the isotopic composition (18O and 2H) of water in mountainous areas: application for groundwater research in the Yunquera-Nieves karst aquifers (S Spain), Appl. Geochem., 19, 561–574, https://doi.org/10.1016/j.apgeochem.2003.08.002, 2004.
Bakalowicz, M.: Karst groundwater: A challenge for new resources, Hydrogeol. J., 13, 148–160, https://doi.org/10.1007/S10040-004-0402-9, 2005.
Baker, A., Hartmann, A., Duan, W., Hankin, S., Comas-Bru, L., Cuthbert, M. O., Treble, P. C., Banner, J., Genty, D., Baldini, L. M., Bartolomé, M., Moreno, A., Pérez-Mejías, C., and Werner, M.: Global analysis reveals climatic controls on the oxygen isotope composition of cave drip water, Nat. Commun., 10, 2984, https://doi.org/10.1038/s41467-019-11027-w, 2019.
Beck, H. E., van Dijk, A. I. J. M., Levizzani, V., Schellekens, J., Miralles, D. G., Martens, B., and de Roo, A.: MSWEP: 3-hourly 0.25° global gridded precipitation (1979–2015) by merging gauge, satellite, and reanalysis data, Hydrol. Earth Syst. Sci., 21, 589–615, https://doi.org/10.5194/hess-21-589-2017, 2017.
Beck, H. E., Pan, M., Roy, T., Weedon, G. P., Pappenberger, F., van Dijk, A. I. J. M., Huffman, G. J., Adler, R. F., and Wood, E. F.: Daily evaluation of 26 precipitation datasets using Stage-IV gauge-radar data for the CONUS, Hydrol. Earth Syst. Sci., 23, 207–224, https://doi.org/10.5194/hess-23-207-2019, 2019a.
Beck, H. E., Wood, E. F., Pan, M., Fisher, C. K., Miralles, D. G., van Dijk, A. I. J. M., McVicar, T. R., and Adler, R. F.: MSWEP V2 Global 3-Hourly 0.1° Precipitation: Methodology and Quantitative Assessment, B. Am. Meteorol. Soc., 100, 473–500, https://doi.org/10.1175/BAMS-D-17-0138.1, 2019b.
Birkel, C. and Soulsby, C.: Advancing tracer-aided rainfall–runoff modelling: a review of progress, problems and unrealised potential, Hydrol. Process., 29, 5227–5240, https://doi.org/10.1002/HYP.10594, 2015.
Bong, H., Cauquoin, A., Okazaki, A., Chang, E.-C., Werner, M., Wei, Z., Yeo, N., and Yoshimura, K.: Process-based intercomparison of water isotope-enabled models and reanalysis nudging effects, J. Geophys. Res.-Atmos., 129, e2023JD038719, https://doi.org/10.1029/2023JD038719, 2024.
Bowen, G. J.: Gridded maps of the isotopic composition of meteoric waters, WaterIsotopes.org, https://wateriso.utah.edu/waterisotopes/pages/data_access/ArcGrids.html (last access: 29 September 2026), 2026.
Bowen, G. J. and Revenaugh, J.: Interpolating the isotopic composition of modern meteoric precipitation, Water Resour. Res., 39, 1299, https://doi.org/10.1029/2003WR002086, 2003.
Bowen, G. J. and Wilkinson, B.: Spatial distribution of δ18O in meteoric precipitation, Geology, 30, 315–318, https://doi.org/10.1130/0091-7613(2002)030<0315:SDOOIM>2.0.CO;2, 2002.
Bowen, G. J., Wassenaar, L. I., and Hobson, K. A.: Global application of stable hydrogen and oxygen isotopes to wildlife forensics, Oecologia, 143, 337–348, https://doi.org/10.1007/S00442-004-1813-Y, 2005.
Bradley, C., Baker, A., Jex, C. N., and Leng, M. J.: Hydrological uncertainties in the modelling of cave drip-water δ18O and the implications for stalagmite palaeoclimate reconstructions, Quaternary Sci. Rev., 29, 2201–2214, https://doi.org/10.1016/J.QUASCIREV.2010.05.017, 2010.
Chen, Z., Auler, A. S., Bakalowicz, M., Drew, D., Griger, F., Hartmann, J., Jiang, G., Moosdorf, N., Richts, A., Stevanovic, Z., Veni, G., and Goldscheider, N.: The World Karst Aquifer Mapping project: concept, mapping procedure and map of Europe, Hydrogeol. J., 25, 771–785, https://doi.org/10.1007/s10040-016-1519-3, 2017.
etopo5: https://pubs.usgs.gov/of/1998/of98-801/bathy/metadata/etopo5.htm, last access: 9 April 2025.
Frank, S., Goeppert, N., and Goldscheider, N.: Improved understanding of dynamic water and mass budgets of high-alpine karst systems obtained from studying a well-defined catchment area, Hydrol. Process, 35, e14033, https://doi.org/10.1002/HYP.14033, 2021.
Giese, M., Caballero, Y., Hartmann, A., and Charlier, J.-B.: Trends in long-term hydrological data from European karst areas: insights for groundwater recharge evaluation, Hydrol. Earth Syst. Sci., 29, 3037–3054, https://doi.org/10.5194/hess-29-3037-2025, 2025.
Goldscheider, N. and Drew, D.: Methods in karst hydrogeology, Int. Contrib. Hydrogeol., 264 pp., ISBN 978-0-415-42873-6, 2007.
Goldscheider, N., Chen, Z., Auler, A. S., Bakalowicz, M., Broda, S., Drew, D., Hartmann, J., Jiang, G., Moosdorf, N., Stevanović, Z., and Veni, G.: Global distribution of carbonate rocks and karst water resources, Hydrogeol. J., 28, 1661–1677, https://doi.org/10.1007/s10040-020-02139-5, 2020.
Hartmann, A. and Baker, A.: Modelling karst vadose zone hydrology and its relevance for paleoclimate reconstruction, Earth-Sci. Rev., 172, 178–192, https://doi.org/10.1016/J.EARSCIREV.2017.08.001, 2017.
Hartmann, A., Kralik, M., Humer, F., Lange, J., and Weiler, M.: Identification of a karst system's intrinsic hydrodynamic parameters: Upscaling from single springs to the whole aquifer, Environ. Earth Sci., 65, 2377–2389, https://doi.org/10.1007/s12665-011-1033-9, 2012.
Hartmann, A., Wagener, T., Rimmer, A., Lange, J., Brielmann, H., and Weiler, M.: Testing the realism of model structures to identify karst system processes using water quality and quantity signatures, Water Resour. Res., 49, 3345–3358, https://doi.org/10.1002/wrcr.20229, 2013.
Hartmann, A., Goldscheider, N., Wagener, T., Lange, J., and Weiler, M.: Karst water resources in a changing world: Review of hydrological modeling approaches, Rev. Geophys., 52, 218–242, https://doi.org/10.1002/2013RG000443, 2014.
Hartmann, A., Jasechko, S., Gleeson, T., Wada, Y., Andreo, B., Barberá, J. A., Brielmann, H., Bouchaou, L., Charlier, J., Darling, W. G., Filippini, M., Garvelmann, J., Goldscheider, N., Kralik, M., Kunstmann, H., Ladouche, B., Lange, J., Lucianetti, G., Martín, J. F., Mudarra, M., Sánchez, D., Stumpp, C., Zagana, E., and Wagener, T.: Risk of groundwater contamination widely underestimated because of fast flow into aquifers, P. Natl. Acad. Sci. USA, 118, e2024492118, https://doi.org/10.1073/pnas.2024492118, 2021.
Hersbach, H., Bell, B., Berrisford, P., Hirahara, S., Horányi, A., Muñoz-Sabater, J., Nicolas, J., Peubey, C., Radu, R., Schepers, D., Simmons, A., Soci, C., Abdalla, S., Abellan, X., Balsamo, G., Bechtold, P., Biavati, G., Bidlot, J., Bonavita, M., De Chiara, G., Dahlgren, P., Dee, D., Diamantakis, M., Dragani, R., Flemming, J., Forbes, R., Fuentes, M., Geer, A., Haimberger, L., Healy, S., Hogan, R. J., Hólm, E., Janisková, M., Keeley, S., Laloyaux, P., Lopez, P., Lupu, C., Radnoti, G., de Rosnay, P., Rozum, I., Vamborg, F., Villaume, S., and Thépaut, J. N.: The ERA5 global reanalysis, Q. J. Roy. Meteor. Soc., 146, 1999–2049, https://doi.org/10.1002/qj.3803, 2020.
Hersbach, H., Bell, B., Berrisford, P., Biavati, G., Horányi, A., Muñoz-Sabater, J., Nicolas, J., Peubey, C., Radu, R., Rozum, I., Schepers, D., Simmons, A., Soci, C., Dee, D., and Thépaut, J.-N.: Copernicus Climate Change Service, Climate Data Store, (2023): ERA5 hourly data on single levels from 1940 to present, Copernicus Climate Change Service (C3S) Climate Data Store (CDS), https://doi.org/10.24381/cds.adbb2d47, 2023.
Hulsman, P., Keune, J., Koppa, A., Schellekens, J., and Miralles, D. G.: Incorporating Plant Access to Groundwater in Existing Global, Satellite-Based Evaporation Estimates, Water Resour. Res., 59, https://doi.org/10.1029/2022WR033731, 2023.
IAEA/WMO: Global Network of Isotopes in Precipitation, The GNIP Database, https://nucleus.iaea.org/wiser (last access: 17 June 2026), 2015.
Jourde, H., Massei, N., Mazzilli, N., Binet, S., Batiot-Guilhe, C., Labat, D., Steinmann, M., Bailly-Comte, V., Seidel, J. L., Arfib, B., Charlier, J. B., Guinot, V., Jardani, A., Fournier, M., Aliouache, M., Babic, M., Bertrand, C., Brunet, P., Boyer, J. F., Bricquet, J. P., Camboulive, T., Carrière, S. D., Celle-Jeanton, H., Chalikakis, K., Chen, N., Cholet, C., Clauzon, V., Soglio, L. D., Danquigny, C., Défargue, C., Denimal, S., Emblanch, C., Hernandez, F., Gillon, M., Gutierrez, A., Sanchez, L. H., Hery, M., Houillon, N., Johannet, A., Jouves, J., Jozja, N., Ladouche, B., Leonardi, V., Lorette, G., Loup, C., Marchand, P., de Montety, V., Muller, R., Ollivier, C., Sivelle, V., Lastennet, R., Lecoq, N., Maréchal, J. C., Perotin, L., Perrin, J., Petre, M. A., Peyraube, N., Pistre, S., Plagnes, V., Probst, A., Probst, J. L., Simler, R., Stefani, V., Valdes-Lao, D., Viseur, S., and Wang, X.: SNO KARST: A French Network of Observatories for the Multidisciplinary Study of Critical Zone Processes in Karst Watersheds and Aquifers. Vadose Zone J., 17, 180094, https://doi.org/10.2136/vzj2018.04.0094, 2018.
Kanamitsu, M., Kumar, A., Juang, H. H., Schemm, J., Wang, W., Yang, F., Hong, S., Peng, P., Chen, W., Moorthi, S., and Ji, M.: NCEP dynamical seasonal forecast system 2000, B. Am. Meteorol. Soc., 83, 1019–1038, https://doi.org/10.1175/1520-0477(2002)083<1019:NDSFS>2.3.CO;2, 2002a.
Kanamitsu, M., Ebisuzaki, W., Woollen, J., Yang, S., Hnilo, J. J., Fiorino, M., and Potter, G. L.: NCEP–DOE AMIP-II Reanalysis (R-2), B. Am. Meteorol. Soc., 83, 1631–1643, https://doi.org/10.1175/BAMS-83-11-1631, 2002b.
Kaushal, N., Lechleitner, F. A., Wilhelm, M., Azennoud, K., Bühler, J. C., Braun, K., Ait Brahim, Y., Baker, A., Burstyn, Y., Comas-Bru, L., Fohlmeister, J., Goldsmith, Y., Harrison, S. P., Hatvani, I. G., Rehfeld, K., Ritzau, M., Skiba, V., Stoll, H. M., Szűcs, J. G., Tanos, P., Treble, P. C., Azevedo, V., Baker, J. L., Borsato, A., Chawchai, S., Columbu, A., Endres, L., Hu, J., Kern, Z., Kimbrough, A., Koç, K., Markowska, M., Martrat, B., Masood Ahmad, S., Nehme, C., Novello, V. F., Pérez-Mejías, C., Ruan, J., Sekhon, N., Sinha, N., Tadros, C. V., Tiger, B. H., Warken, S., Wolf, A., Zhang, H., and SISAL Working Group members: SISALv3: a global speleothem stable isotope and trace element database, Earth Syst. Sci. Data, 16, 1933–1963, https://doi.org/10.5194/essd-16-1933-2024, 2024.
Koppa, A., Rains, D., Hulsman, P., Poyatos, R., and Miralles, D. G.: A deep learning-based hybrid model of global terrestrial evaporation, Nat. Commun., 13, https://doi.org/10.1038/s41467-022-29543-7, 2022.
Labat, D., Sivakumar, B., and Mangin, A.: Evidence for deterministic chaos in long-term high-resolution karstic streamflow time series, Stoch. Env. Res. Risk A., 30, 2189–2196, https://doi.org/10.1007/s00477-015-1175-5, 2016.
Li, G., Chen, X., Zhang, Z., Wang, L., and Soulsby, C.: Effects of passive-storage conceptualization on modeling hydrological function and isotope dynamics in the flow system of a cockpit karst landscape, Hydrol. Earth Syst. Sci., 26, 5515–5534, https://doi.org/10.5194/hess-26-5515-2022, 2022.
Li, R., Zhu, G., Chen, L., Qi, X., Lu, S., Meng, G., Wang, Y., Li, W., Zheng, Z., Yang, J., and Gun, Y.: Global Stable Isotope Dataset for Surface Water, Earth Syst. Sci. Data, 17, 2135–2145, https://doi.org/10.5194/essd-17-2135-2025, 2025.
Liu, J., Shangguan, D., Liu, S., Ding, Y., Wang, S., and Wang, X.: Evaluation and comparison of CHIRPS and MSWEP daily-precipitation products in the Qinghai-Tibet Plateau during the period of 1981–2015, Atmos. Res., 230, 104634, https://doi.org/10.1016/J.ATMOSRES.2019.104634, 2019.
Liu, Y. and Yamanaka, T.: Tracing groundwater recharge sources in a mountain–plain transitional area using stable isotopes and hydrochemistry, J. Hydrol., 464–465, 116–126, https://doi.org/10.1016/j.jhydrol.2012.06.053, 2012.
Martens, B., Miralles, D. G., Lievens, H., van der Schalie, R., de Jeu, R. A. M., Fernández-Prieto, D., Beck, H. E., Dorigo, W. A., and Verhoest, N. E. C.: GLEAM v3: satellite-based land evaporation and root-zone soil moisture, Geosci. Model Dev., 10, 1903–1925, https://doi.org/10.5194/gmd-10-1903-2017, 2017.
Mayer-Anhalt, L., Birkel, C., Sánchez-Murillo, R., and Schulz, S.: Tracer-aided modelling reveals quick runoff generation and young streamflow ages in a tropical rainforest catchment, Hydrol. Process., 36, e14508, https://doi.org/10.1002/hyp.14508, 2022.
McDermott, F.: Palaeo-climate reconstruction from stable isotope variations in speleothems: a review, Quaternary Sci. Rev., 23, 901–918, https://doi.org/10.1016/j.quascirev.2003.06.021, 2004.
McDermott, F., Schwarcz, H., and Rowe, P. J.: Isotopes in speleothems, in: Isotopes in Palaeoenvironmental Research, Developments in Paleoenvironmental Research, vol. 10, edited by: Leng, M. J., Springer, Dordrecht, the Netherlands, 127–144, https://doi.org/10.1007/1-4020-2504-1, 2006.
McDonnell, J. J., McGuire, K., Aggarwal, P., Beven, K. J., Biondi, D., Destouni, G., Dunn, S., James, A., Kirchner, J., Kraft, P., Lyon, S., Maloszewski, P., Newman, B., Pfister, L., Rinaldo, A., Rodhe, A., Sayama, T., Seibert, J., Solomon, K., Soulsby, C., Stewart, M., Tetzlaff, D., Tobin, C., Troch, P., Weiler, M., Western, A., Wörman, A., and Wrede, S.: How old is streamwater? Open questions in catchment transit time conceptualization, modelling and analysis, Hydrol. Process., 24, 1745–1754, https://doi.org/10.1002/hyp.7796, 2010.
Miralles, D. G., Holmes, T. R. H., De Jeu, R. A. M., Gash, J. H., Meesters, A. G. C. A., and Dolman, A. J.: Global land-surface evaporation estimated from satellite-based observations, Hydrol. Earth Syst. Sci., 15, 453–469, https://doi.org/10.5194/hess-15-453-2011, 2011.
Miralles, D. G., Bonte, O., Koppa, A., Baez-Villanueva, O. M., Tronquo, E., Zhong, F., Beck, H. E., Hulsman, P., Dorigo, W., Verhoest, N. E. C., and Haghdoost, S.: GLEAM4: global land evaporation and soil moisture dataset at 0.1° resolution from 1980 to near present, Sci. Data, 12, 416, https://doi.org/10.1038/s41597-025-04610-y, 2025.
Nan, Y., He, Z., Tian, F., Wei, Z., and Tian, L.: Can we use precipitation isotope outputs of isotopic general circulation models to improve hydrological modeling in large mountainous catchments on the Tibetan Plateau?, Hydrol. Earth Syst. Sci., 25, 6151–6172, https://doi.org/10.5194/hess-25-6151-2021, 2021.
Olarinoye, T., Gleeson, T., Marx, V., Seeger, S., Adinehvand, R., Allocca, V., Andreo, B., Apaéstegui, J., Apolit, C., Arfib, B., Auler, A., Barberá, J. A., Batiot-Guilhe, C., Bechtel, T., Binet, S., Bittner, D., Blatnik, M., Bolger, T., Brunet, P., Charlier, J. B., Chen, Z., Chiogna, G., Coxon, G., De Vita, P., Doummar, J., Epting, J., Fournier, M., Goldscheider, N., Gunn, J., Guo, F., Guyot, J. L., Howden, N., Huggenberger, P., Hunt, B., Jeannin, P. Y., Jiang, G., Jones, G., Jourde, H., Karmann, I., Koit, O., Kordilla, J., Labat, D., Ladouche, B., Liso, I. S., Liu, Z., Massei, N., Mazzilli, N., Mudarra, M., Parise, M., Pu, J., Ravbar, N., Sanchez, L. H., Santo, A., Sauter, M., Sivelle, V., Skoglund, R. Ø., Stevanovic, Z., Wood, C., Worthington, S., and Hartmann, A.: Global karst springs hydrograph dataset for research and management of the world's fastest-flowing groundwater, Sci. Data, 7, https://doi.org/10.1038/s41597-019-0346-5, 2020.
Pape, J. R., Banner, J. L., Mack, L. E., Musgrove, M. L., and Guilfoyle, A.: Controls on oxygen isotope variability in precipitation and cave drip waters, central Texas, USA, J. Hydrol., 385, 203–215, https://doi.org/10.1016/j.jhydrol.2010.02.021, 2010.
Priestley, S. C., Treble, P. C., Griffiths, A. D., Baker, A., Abram, N. J., and Meredith, K. T.: Caves demonstrate decrease in rainfall recharge of southwest Australian groundwater is unprecedented for the last 800 years, Commun. Earth Environ., 4, 206, https://doi.org/10.1038/S43247-023-00858-7, 2023.
Rohatgi, A.: WebPlotDigitizer, version 4.6, https://apps.automeris.io/wpd4/ (last access: 29 September 2026), 2023.
Rusjan, S., Sapač, K., Petrič, M., Lojen, S., and Bezak, N.: Identifying the hydrological behavior of a complex karst system using stable isotopes, J. Hydrol., 577, https://doi.org/10.1016/j.jhydrol.2019.123956, 2019.
Staudinger, M., Seeger, S., Herbstritt, B., Stoelzle, M., Seibert, J., Stahl, K., and Weiler, M.: The CH-IRP data set: a decade of fortnightly data on δ2H and δ18O in streamflow and precipitation in Switzerland, Earth Syst. Sci. Data, 12, 3057–3066, https://doi.org/10.5194/essd-12-3057-2020, 2020.
Stevanović, Z.: Karst waters in potable water supply: a global scale overview, Environ. Earth Sci., 78, 662, https://doi.org/10.1007/s12665-019-8670-9, 2019.
Treble, P. C., Baker, A., Abram, N. J., Hellstrom, J. C., Crawford, J., Gagan, M. K., Borsato, A., Griffiths, A. D., Bajo, P., Markowska, M., Priestley, S. C., Hankin, S., and Paterson, D.: Ubiquitous karst hydrological control on speleothem oxygen isotope variability in a global study, Commun. Earth Environ., 3, 29, https://doi.org/10.1038/s43247-022-00347-3, 2022.
Treble, P. C., Zang, Y., Kaushal, N., Hatvani, I. G., Tanos, P., Kern, Z., Baker, A., Hartmann, A., Lechleitner, F. A., Belanger, B., Daudt de Oliveira, B., Sinclair, W., Riechelmann, D. F. C., Hidas, A., Yoshimura, K., Comas-Bru, L., and the SISAL working group members: SISAL_monv1: a global database of cave monitoring observations, Earth Syst. Sci. Data Discuss. [preprint], https://doi.org/10.5194/essd-2026-31, in review, 2026.
Tremaine, D. M., Froelich, P. N., and Wang, Y.: Speleothem calcite farmed in situ: modern calibration of δ18O and δ13C paleoclimate proxies in a continuously monitored natural cave system, Geochim. Cosmochim. Ac., 75, 4929–4950, https://doi.org/10.1016/j.gca.2011.06.005, 2011.
Turner, S. L., Korevaar, E., Cumpston, M. S., Kanukula, R., Forbes, A. B., and McKenzie, J. E.: Effect estimates can be accurately calculated with data digitally extracted from interrupted time series graphs, Res. Synth. Methods, 14, 622–638, https://doi.org/10.1002/jrsm.1646, 2023.
van der Mierden, S., Spineli, L. M., Talbot, S. R., Yiannakou, C., Zentrich, E., Weegh, N., Struve, B., zur Brügge, T. F., Bleich, A., and Leenaars, C. H. C.: Extracting data from graphs: a case study on animal research with implications for meta-analyses, Res. Synth. Methods, 12, 701–710, https://doi.org/10.1002/jrsm.1481, 2021.
Wang, Z., Su, Q., Wang, S., Gao, Z., and Liu, J.: Coupling hydrochemistry and stable isotopes (δ2H and δ18O) to identify the major factors affecting the hydrochemical evolution of groundwater in the Western Yellow Sea Coast, China, Appl. Geochem., 138, 105221, https://doi.org/10.1016/j.apgeochem.2022.105221, 2022.
Yoshimura, K., Kanamitsu, M., Noone, D., and Oki, T.: Historical isotope simulation using Reanalysis atmospheric data, J. Geophys. Res.-Atmos., 113, D19108, https://doi.org/10.1029/2008JD010074, 2008.
Zang, Y.: The WoKaS-Iso database: workflow for a global compilation of oxygen-18 and deuterium records in karst springs and cave drip water for enhanced understanding of karst systems, OPARA [data set], https://doi.org/10.25532/OPARA-909, 2025.
Zhang, Z., Chen, X., Cheng, Q., and Soulsby, C.: Storage dynamics, hydrological connectivity and flux ages in a karst catchment: conceptual modelling using stable isotopes, Hydrol. Earth Syst. Sci., 23, 51–71, https://doi.org/10.5194/hess-23-51-2019, 2019.
Zhong, F., Jiang, S., van Dijk, A. I. J. M., Ren, L., Schellekens, J., and Miralles, D. G.: Revisiting large-scale interception patterns constrained by a synthesis of global experimental data, Hydrol. Earth Syst. Sci., 26, 5647–5667, https://doi.org/10.5194/hess-26-5647-2022, 2022.