the Creative Commons Attribution 4.0 License.
the Creative Commons Attribution 4.0 License.
 | 30 Sep 2026
History of anthropogenic Phosphorus inputs (HaPi) to the terrestrial biosphere from 1860 to 2020

Rui Li
Fei Lun
Francesco N. Tubiello
Nathaniel D. Mueller
Shiyu You
Rong Hao
Jiageng Ma
Longhui Li
Changchun Huang
Yuanzhi Yao
Nitrogen (N) and Phosphorus (P) are essential nutrients for sustaining life on Earth and regulating ecosystem productivity and Earth system biogeochemistry, and have been increasingly applied in global agriculture to meet the growing demand for food production. Quantifying the spatial and temporal dynamics of nutrient inputs to the terrestrial biosphere is crucial for understanding global biogeochemical cycles, analyzing nutrient flows in crop-livestock systems, managing nutrient resources sustainably, and mitigating nutrient-related environmental impacts. Here, built upon our previous work mapping global nitrogen inputs (History of anthropogenic Nitrogen inputs, HaNi), this study presents the History of anthropogenic P inputs (HaPi) dataset, a comprehensive quantification of human-driven P fluxes to terrestrial ecosystems. HaPi covers the period from 1860 to 2020 and has a spatial resolution of 5 arcmin (about 10 km at the equator) with an annual time-step. This harmonized dataset integrates seven components, including P fertilizer application on croplands and pastures, manure P application on croplands and pastures, manure P deposition on pastures and rangelands, and atmospheric P deposition. The results reveal that global total P input increased more than tenfold, from 3.8 Tg yr−1in the 1860s to 41.0 Tg yr−1 in the 2010s, with mineral fertilizer and livestock manure contributing equally to the increase. Regional patterns have shifted significantly over the study period, with China, South Asia, and Brazil surpassing Europe and the USA as the regions with the highest P inputs in recent decades. Furthermore, mineral fertilizers dominate P inputs in most industrialized countries in the Northern Hemisphere, whereas manure P remains the primary source in many countries of the Southern Hemisphere. The HaPi dataset improves P mass budget calculations and provides essential forcing data for empirical or mechanistic models, supporting critical research in Earth system biogeochemistry, agricultural nutrient management, water quality control, and assessments of the coupled human-Earth system. The dataset is available at https://doi.org/10.6084/m9.figshare.29930279 (Bian et al., 2026).
- Article
(9583 KB) - Full-text XML
- Companion paper
-
Supplement
(1773 KB) - BibTeX
- EndNote


The global nitrogen and phosphorus (P) cycle has been unprecedentedly disturbed in the Anthropocene, posing significant risks to planetary boundaries and societal sustainability (Steffen et al., 2015). Driven by rising food demand, mining of phosphate rocks for mineral P fertilizers and livestock feed has significantly increased (Cordell et al., 2009). Anthropogenic activities have substantially intensified global P flows, contributing to half of global agricultural soil P uptake in recent decades (Demay et al., 2023) and tripling the P mobilization in the land-water continuum (Yuan et al., 2018). However, agriculture's growing demand for mineral P fertilizers raises critical concerns regarding the depletion of non-renewable phosphate rock reserves. Moreover, the unevenly distributed phosphate rock resources and potential geopolitical conflicts threaten the resilience of agricultural systems (Barbieri et al., 2022; Elser and Bennett, 2011). To mitigate these challenges, a better understanding of the spatial and temporal distribution of P supply and demand would support improved assessment of future P requirements for crop and livestock production (Sattari et al., 2012; Tian et al., 2010; Zhang et al., 2005).
The historical and current management of anthropogenic P in croplands and livestock production has resulted in serious environmental issues. In particular, the global P flux from terrestrial to aquatic ecosystems has been amplified by inefficient agricultural applications, which accelerated P losses to rivers, lakes, and oceans via water transport. Generally, P is the major limiting nutrient for phytoplankton growth in freshwaters, since its easy adsorption to particles reduces its biological availability (Conley et al., 2009). However, worldwide mineral P fertilizer applications and related runoff have resulted in elevated levels of bioavailable P in freshwaters, causing widespread eutrophication and ecological damage to freshwater systems (Carpenter, 2005; Fink et al., 2018). Beyond contemporary P inputs, legacy P accumulated in soils from historical fertilizer and manure applications continues to leach into aquatic environments. This reduces the efficacy of long-term conservation efforts aimed at improving water quality (Stackpoole et al., 2019). Spatial-temporal patterns of agricultural legacy P and associated water pollution are fundamentally driven by historical fertilizer and manure applications. Consequently, understanding the quantity, sources, and trends of P pollution is useful information needed for advancing effective water quality management strategies.
To address the challenges of food security and environmental issues related to anthropogenic P use, accurately quantifying global anthropogenic P inputs since the pre-industrial era is critical for evaluating historical trajectories of soil P fertility, P use efficiency (PUE), and P pollution. Many efforts have been carried out to develop global P input datasets (Lu and Tian, 2017; Lun et al., 2018; Ringeval et al., 2024). The Food and Agriculture Organization (FAO) and the International Fertilizer Association (IFA) provide widely adopted country-level mineral P fertilizer data in agricultural land (FAO, 2024). This dataset has been used to evaluate P budgets and surpluses at the country level. For example, Zou et al. (2022) used FAO P fertilizer data to evaluate national P budget and PUE. However, FAO's manure data only cover national nitrogen excretion, necessitating estimation of manure P via N : P ratios. For spatially explicit modeling, several gridded datasets have emerged. Mueller et al. (2012) generated crop-specific P fertilizer maps at a global scale circa 2000. Bouwman et al. (2013) developed gridded P fertilizer and livestock manure data by combining FAO fertilizer use, animal production data, and multiple ancillary datasets. This P input dataset has been applied in the IMAGE-Global Nutrient Model to assess global soil P pools, crop uptake, and riverine P fluxes (Beusen et al., 2016). More recently, gridded data of P application rates for 173 crops, at 5 km resolution and in the year 2020, have been published (Nguyen et al., 2024). Furthermore, Lu and Tian (2017) developed an annual global P fertilizer dataset from 1961 to 2013 at a resolution of 0.5°×0.5°, based on the IFA national P fertilizer statistics. Bouwman's dataset and Lu's P fertilizer data have been used to develop the global dataset on P in agricultural soil, GPASOIL-v0 (Ringeval et al., 2017) and GPASOIL-v1 (Ringeval et al., 2024), respectively. GPASOIL-v1 also provides manure P application rates on cropland and pasture based on a global constant N : P ratio and spatially explicit manure N data developed by Xu et al. (2018) and Zhang et al. (2017a). Nevertheless, inconsistencies exist in temporal coverage, spatial resolution, spatial allocation algorithms, and the baseline land use data among different P input datasets, which may propagate uncertainties in assessments of soil P fertility, legacy P accumulation and its environmental impacts. To resolve these issues, we propose to reconstruct a harmonized History of Anthropogenic Phosphorus Inputs (HaPi) dataset, which will integrate available FAO statistics, historical land use, grid-level manure N : P ratios, and atmospheric P deposition within a consistent spatiotemporal framework.
In our recent study, we have developed the History of anthropogenic Nitrogen inputs (HaNi) dataset, which consists of N fertilizer, manure N, and atmospheric N inputs on cropland, pasture, and rangeland (i.e., grassland) from 1860 to 2020 (Tian et al., 2022). Since its publication, HaNi has been widely adopted to estimate global N2O emission (Tian et al., 2024), NH3 concentrations (Ma et al., 2025) and emissions, and N loading (Dai et al., 2023). Complementary to the HaNi data, the HaPi dataset provides P fertilizer/manure application to cropland, P fertilizer/manure application to pasture, manure P deposition on pasture/rangeland, and atmospheric P deposition. The HaPi dataset advances over previous datasets in five aspects: (1) the impact of dynamic crop rotation is considered when allocating P fertilizer on cropland; (2) the annual spatial-explicit manure N : P ratio data is developed to generate manure P data based on manure N inputs; (3) all P inputs are at an annual step from 1860 to 2020 and a high spatial resolution of 5 arcmin; (4) beyond agricultural land, P inputs to all terrestrial ecosystems are estimated; and (5) consistent baseline land use maps are used when allocating fertilizer and manure P to cropland, pasture, and rangeland. The HaPi dataset is anticipated to improve P mass budget calculation and serve as forcing data for empirical or mechanistic models, thereby supporting diverse research on soil fertility, water pollution, P resource sustainability, and food security, etc.
2.1 Fertilizer application on cropland and pasture
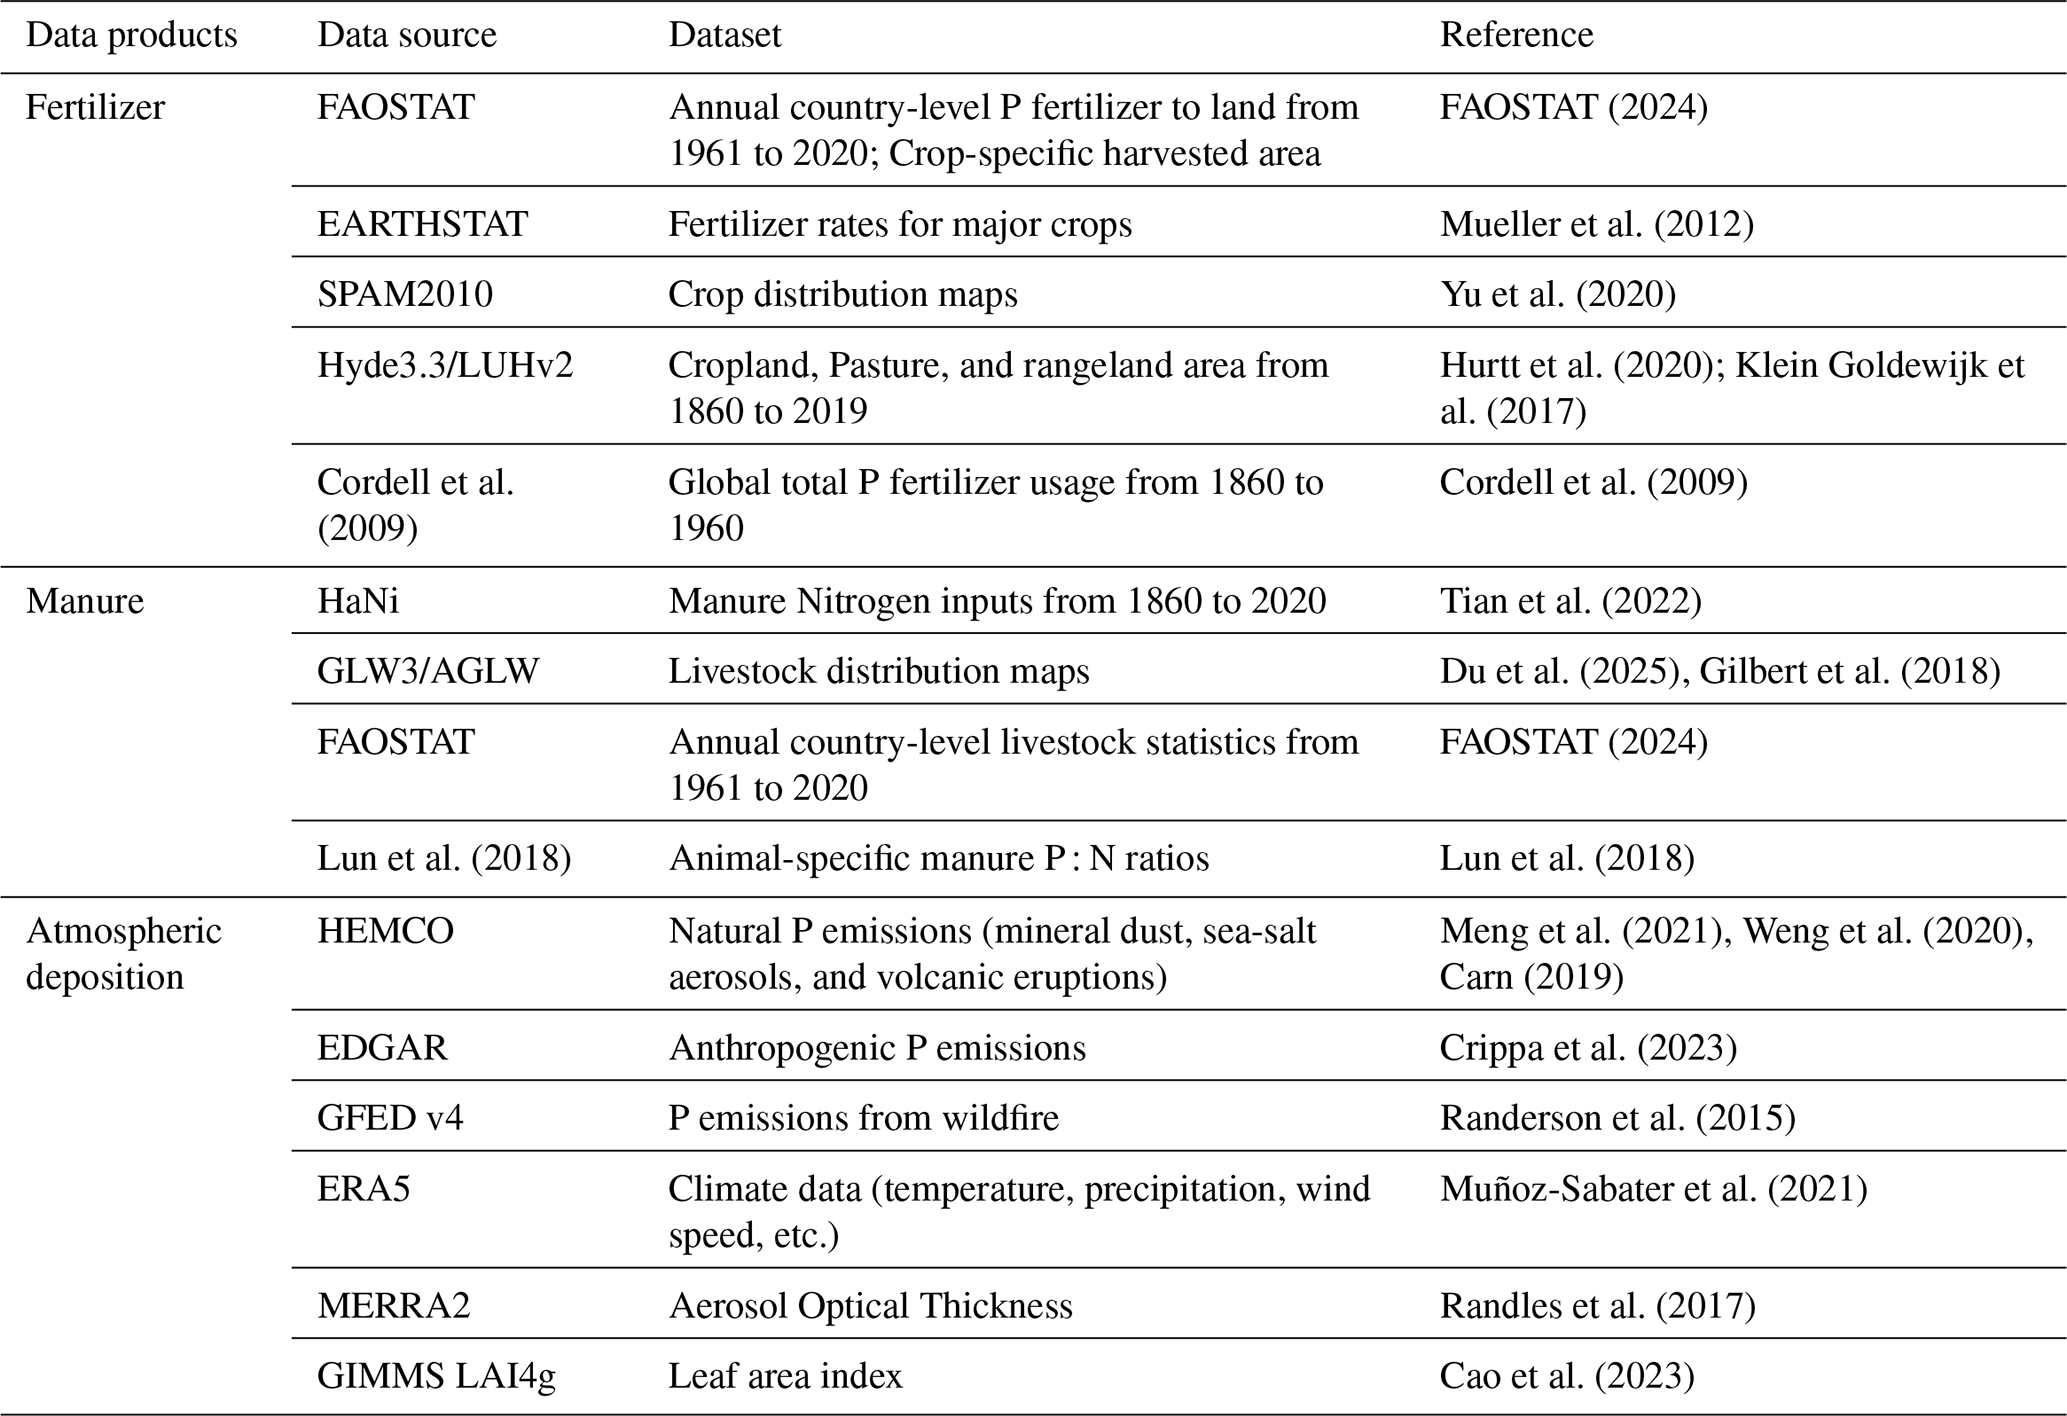
The fertilizer P application maps are developed by allocating country-level inventory data into grid cells according to land use maps, crop rotation maps, and crop-specific fertilizer application data (Table 1). Annual national P fertilizer inputs on agricultural land during 1961–2020 were obtained from FAOSTAT (2024). We first separated total P fertilizer use into P application on cropland and pasture by assuming fractions of P used for cropland and pasture are the same as those of N fertilizer, following the method used in Zou et al. (2022). The annual fractions of fertilizer use allocated to cropland and pasture for major countries from 1961 to 2019 were adopted from Einarsson et al. (2021) and Lassaletta et al. (2014). Then, the country-level P fertilizer data were spatially distributed with cropland and pasture maps following the workflow in Fig. 1.
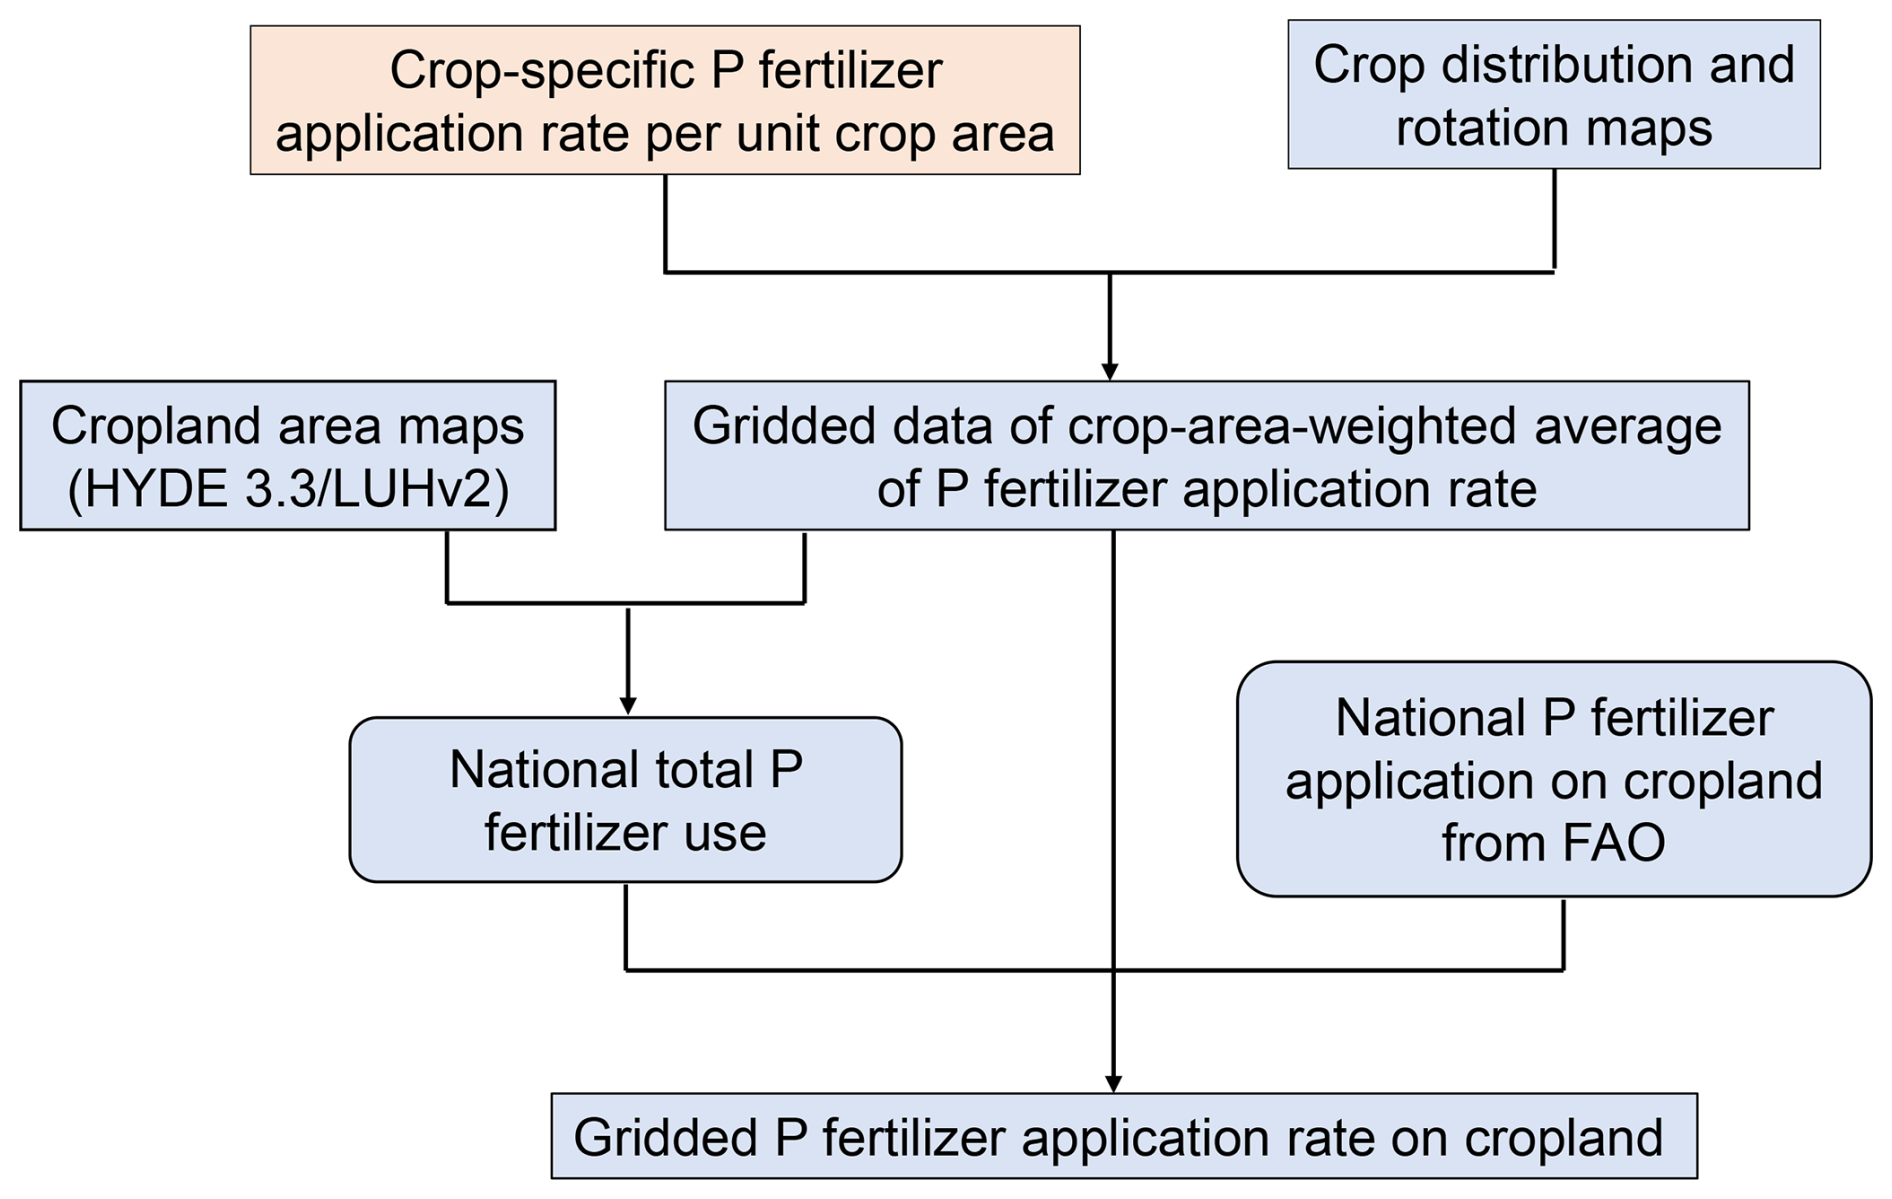
Figure 1Workflow of developing data for phosphorus fertilizer application on cropland. The blue box represents the annual data during 1961–2020, and the orange box represents the static variable.
To determine the P fertilizer application on cropland, we considered 17 dominant crop types (wheat, maize, rice, barley, millet, sorghum, soybean, sunflower, potato, cassava, sugarcane, sugar beet, oil palm, rapeseed, groundnut, cotton, and rye) and crop-specific harvested areas to generate crop-area-weighted average of P fertilizer application in each grid during 1961–2020, which is calculated as follows:
where is the crop-area-weighted average of P fertilizer application rate in a cropland grid g (g P m−2 cropland per year) in year y, and AHi,y are P fertilizer application rate (g P m−2) and harvested area (m2), respectively, for crop type i in year y. used a fixed value derived from the global crop-specific P fertilizer application data circa 2000 (at a resolution of 5 arcmin) developed by Mueller et al. (2012). This dataset was used as the spatial baseline for distributing fertilizer inputs across cropland. The crop distribution maps for individual years were derived by allocating FAO statistics for crop-specific harvested area into grids using the Dissever algorithm (Malone et al., 2012), which is a general spatial downscaling method using fine-resolution covariate data. Specifically, the covariate data included climate variables (temperature and precipitation) (Fick and Hijmans, 2017), soil information (FAO and IIASA, 2023), and topography. In each year, crop-specific distribution from SPAM2010 (Yu et al., 2020) was used as initial inputs for starting an iterative process to obtain an optimal machine learning model within a region in each year. Though this climate-based disaggregation strategy for statistical analysis inevitably brings uncertainties, it has usually been adopted in generating crop distribution maps (e.g., Li et al., 2025; Yu et al., 2020). In practice, to minimize these uncertainties, the machine learning-based distribution maps are adjusted to meet multiple constraints. For example, the sum of areas of all crops in a grid should not exceed the actual arable land area (see our cropland data generation using HYDE3.3 and LUHv2 in text below), and the area of a specific farming system should not exceed the suitable area within the grid (adopted from SPAM2010).
Annual national P fertilizer consumption from FAOSTAT was subsequently used to scale the baseline application rates, allowing fertilizer inputs to vary over time:
where represents the regulation ratio (unitless) for the year y and country j, FAO is the national total P fertilizer usage (g P yr−1) on cropland, AC is the cropland area (m2) for the year y and grid g of the country. The historical land use data (cropland, pasture, rangeland) covers 1860–2020 and has an annual time-step and a 5 arcmin spatial resolution, developed by reconciling the HYDE 3.3 (https://landuse.sites.uu.nl/datasets/, last access: 25 October 2024) and LUHv2 datasets (Hurtt et al., 2020; Klein Goldewijk et al., 2017; Tian et al., 2022). For the period prior to 1949, HYDE 3.3 provides land use maps only at decadal intervals (i.e., one map every ten years). To generate continuous annual data, we applied a temporal downscaling approach: the LUHv2 data for each year within a given decade were used to proportionally interpolate the HYDE 3.3 map from the beginning of that decade. This method preserves the decadal baseline provided by HYDE 3.3 while incorporating the interannual variability captured by LUHv2. The P fertilizer in cropland grid g of the country j in year y, Pfercrop (g P m−2 yr−1), was then calculated as the product of and .
The earliest year of P fertilizer statistics that the FAO database provides is 1961. Prior to the widespread adoption of phosphate rock as a fertilizer in the 1940s, guano – accumulated bird droppings over millennia – and human excreta were utilized as fertilizers for food crops. The historical P fertilizer data during 1860–1960 were generated based on data reported by Cordell et al. (2009), which provide global total P fertilizer usage estimates back to 1800. Annual relative change rates of global P fertilizer were first calculated based on the estimates from Cordell et al. (2009). These change rates were then applied to the spatially explicit P fertilizer distribution in the reference year of 1961 to reconstruct annual global P fertilizer maps for the period 1860–1960. This approach assumes that temporal dynamics of P fertilizer data before 1961 were primarily driven by global-scale trends.
2.2 Manure application on cropland/pasture and deposition on pasture/rangeland
The grid-level manure P inputs, including manure application on cropland, manure application on pasture, manure deposition on pasture, and manure deposition on rangeland, were generated by multiplying the corresponding manure N inputs from HaNi (Tian et al., 2022) and manure P : N ratios (Fig. 2):
where Pmany,g and Nmany,g indicate the P and N manure application or deposition on grid g in year y, respectively. The HaNi dataset offers global manure input data on cropland, pasture, and rangeland during 1860–2020 at a resolution of 5 arcmin. RPNy,g represents the manure P : N ratio in grid g.
The annual grid-level manure P : N ratios RPNy,g were estimated as the animal-number weighted sum of these animal-specific P : N ratios within grids. We obtained manure P : N ratio APNy,t for each animal species t from Lun et al. (2018). Livestock distribution data Anum were derived by fusing the annual gridded livestock of the world (AGLW) dataset (Du et al., 2025) and a newly downscaled product. The AGLW dataset covers 1961–2021 at a 5 km resolution and was developed based on annual FAOSTAT census information using a machine learning method. But in some areas (particularly the former Soviet Union region), livestock information is missing. To fill the gaps, we used the national FAO livestock statistics and the Global Livestock of the World 3 (GLW3) database (Gilbert et al., 2018) to generate a long time-series gridded livestock distribution dataset. Specifically, GLW3 provides global livestock populations GLMnumg,t at a 5 arcmin resolution for cattle, buffaloes, horses, sheep, goats, pigs, chickens, and ducks, but the data are available for a single reference year. Therefore, the annual country-level livestock population data LFAO from FAOSTAT were employed to extend the GLW3 dataset into a time series of livestock distribution maps spanning from 1961 to 2020 following the method used in Eqs. (2) and (3). Based on the fused product of livestock distribution, a spatially explicit manure P : N ratio dataset covering the period 1961–2020 was constructed and subsequently used to estimate manure P inputs from corresponding N inputs. The final nutrient ratio dataset is highly consistent both spatially and temporally (Fig. S1 in the Supplement). Notably, although temporal changes in livestock composition are considered when estimating manure P : N ratios, potential changes in species-specific manure nutrient ratios associated with evolving feed composition and livestock management practices are not explicitly represented, which may introduce biases in manure P estimates.
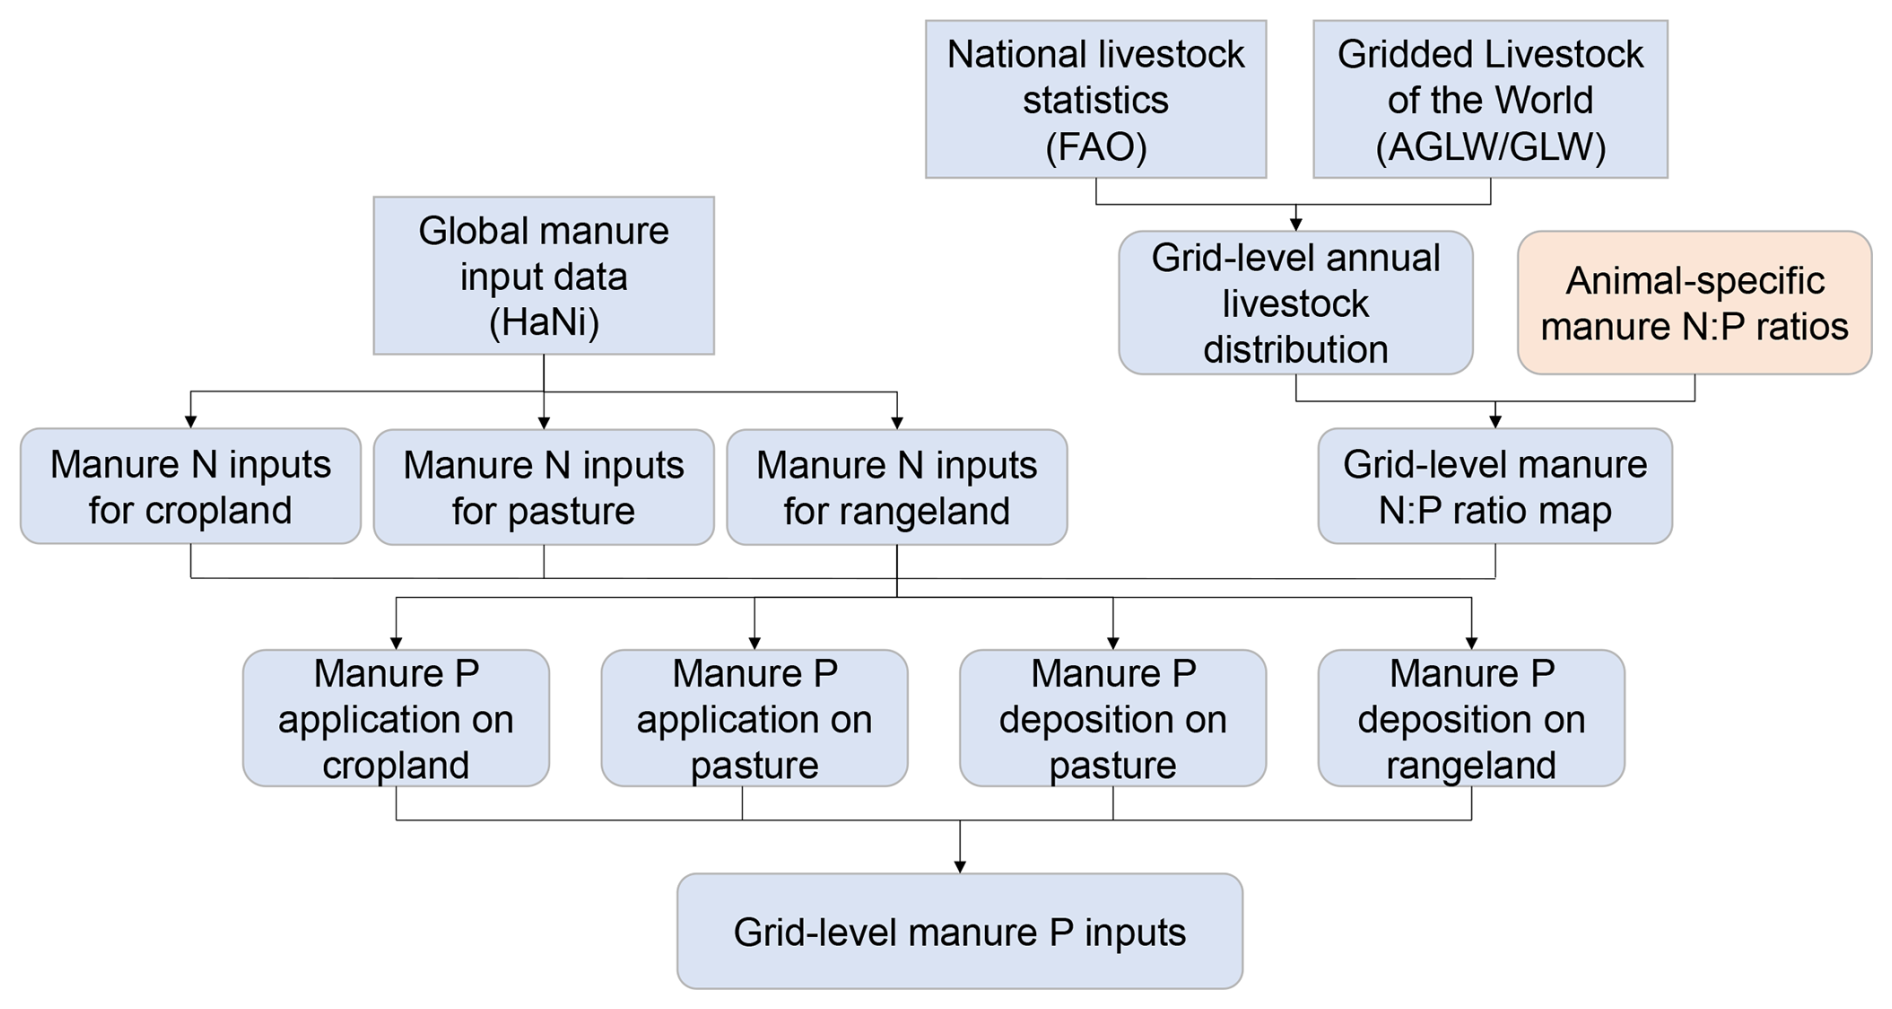
Figure 2Workflow of developing manure phosphorus input data. The blue box represents the annual data during 1961–2020, and the orange box represents the static variable.
2.3 Atmospheric P deposition
Atmospheric P deposition originates from both natural and anthropogenic sources and was estimated by combining a P emission inventory, an atmospheric chemical model, and an algorithm (Fig. 3 and Table 1) (You et al., 2026). Natural P emissions primarily comprise dust, sea salt, Primary Biological Aerosol Particles (PBAPs), volcanoes, and wildfires. In this study, emissions from dust, sea salt, and volcanoes were derived from the GEOS-Chem HEMCO data (Meng et al., 2021; Weng et al., 2020; Carn, 2019; Carn et al., 2015; Ge et al., 2016). PBAPs emissions were estimated by utilizing specific humidity data and LAI data according to the method used in Myriokefalitakis et al. (2016). Wildfire emission data were sourced from the GFED4 dataset (Randerson et al., 2015). Meanwhile, anthropogenic emissions were estimated using monthly sector-specific data from the EDGAR database (Crippa et al., 2023). By integrating all the emission sources, we developed a global atmospheric P emission inventory, which was subsequently used as input for the GEOS-Chem model (Feng et al., 2021) to simulate global atmospheric P deposition from 2001 to 2019. GEOS-Chem is a global three-dimensional atmospheric chemical model driven by meteorological inputs provided by the Goddard Earth Observing System (GEOS) of the NASA Global Modeling and Assimilation Office. It has been widely applied to address various atmospheric composition issues. The modeled P deposition by GEOS-Chem was at a resolution of 2.5°×2°.
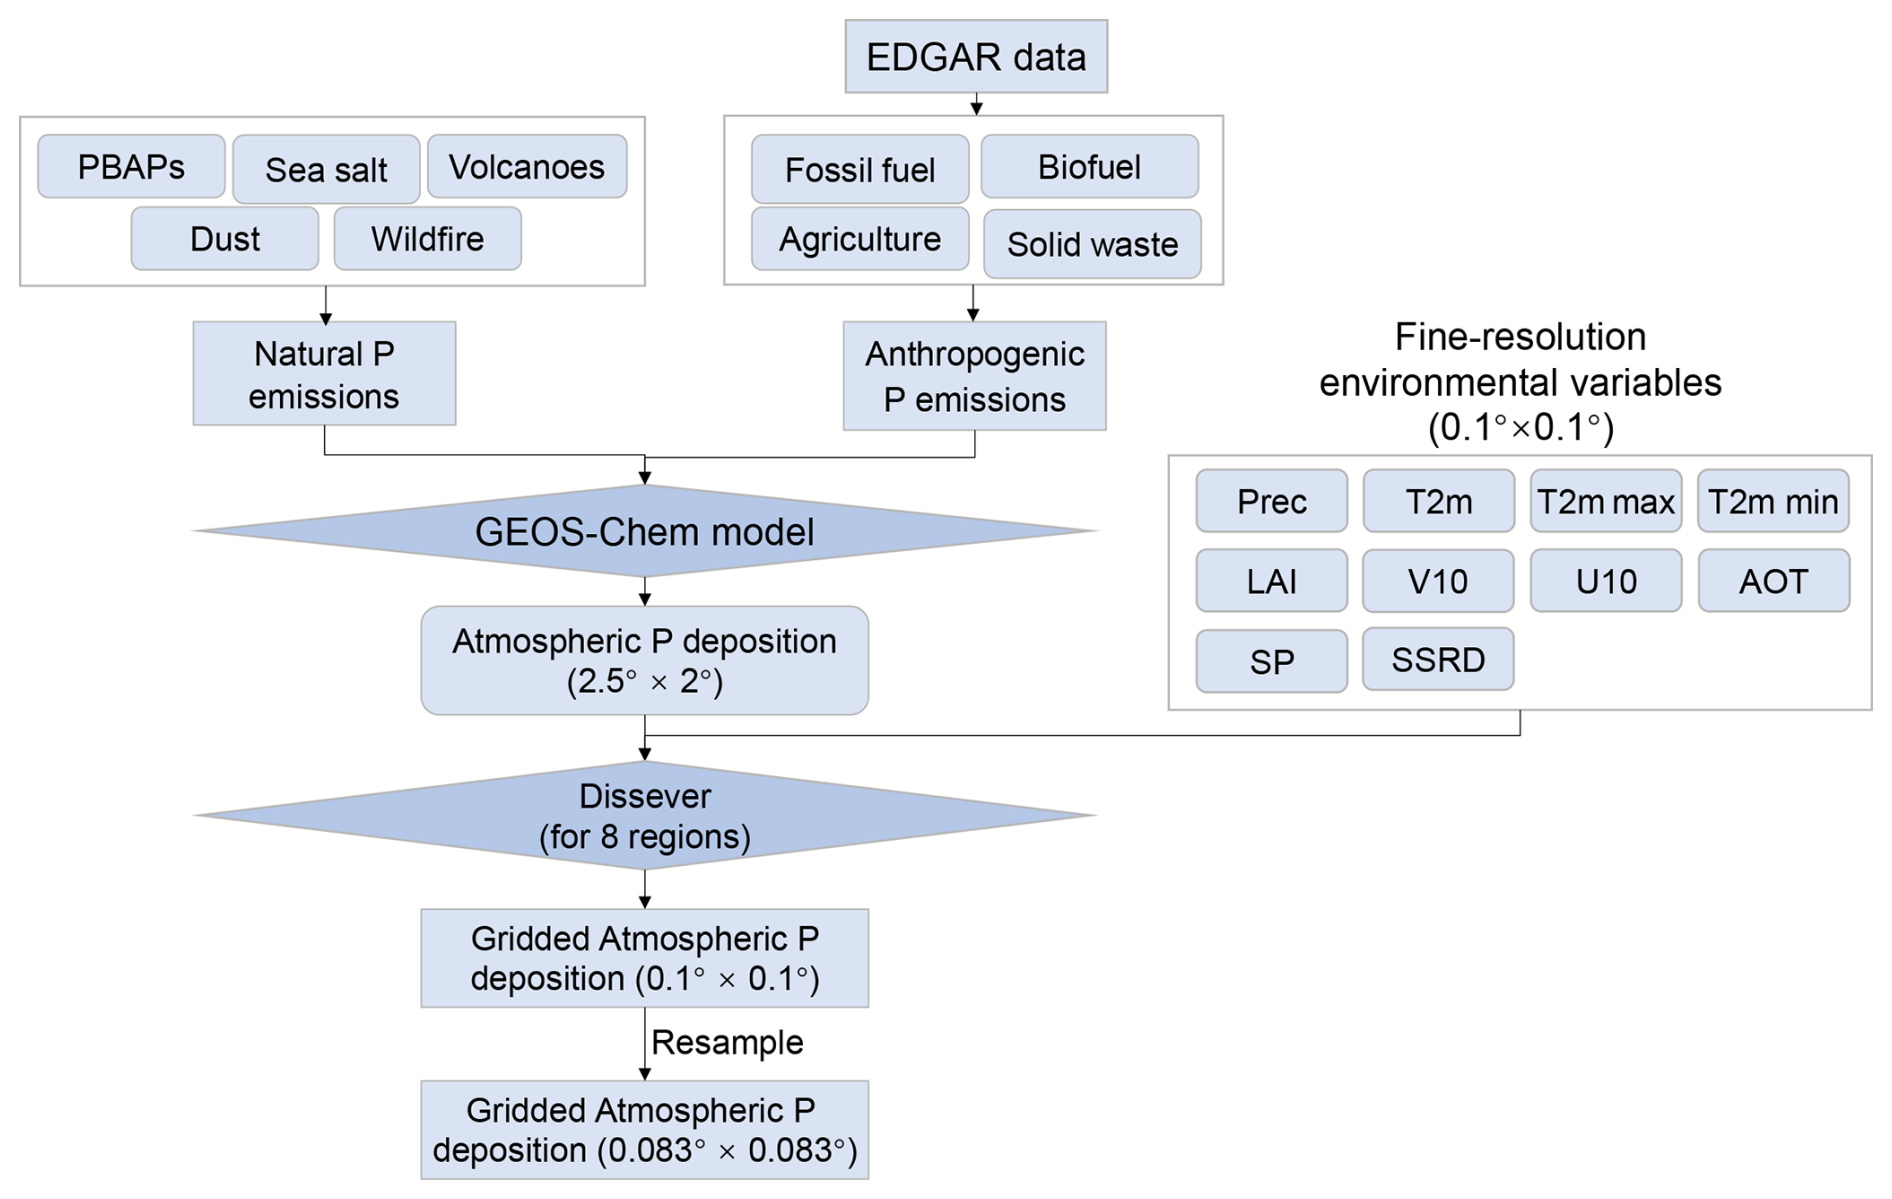
Figure 3Workflow of developing atmospheric phosphorus input data. Where PBAPs represent Primary Biological Aerosol Particles. Prec refers to precipitation. T2m indicates the 2 m air temperature, while T2m max and T2m min refer to the maximum and minimum air temperatures at 2 m height. U10 and V10 denote the eastward and northward wind speeds at 10 m height, respectively. AOT stands for Aerosol Optical Thickness. SP represents Surface Pressure, and SSRD refers to Surface Solar Radiation Downwards.
To obtain the atmospheric P deposition at a high resolution, the dissever algorithm (Malone et al., 2012; Roudier et al., 2017), which is a mass-conserving spatial downscaling method, was applied to the GEOS-Chem outputs. First, the coarse-resolution P deposition data were resampled to 0.1°×0.1°; Second, the dissever algorithm was used to iteratively train an XGBoost model for eight different regions, including Africa, Asia excluding China and India, China, Europe, India, North America, Oceania, and South America, to retrieve resampled P deposition and fine-resolution environmental variables. These environmental variables included ERA5 climate factors (wind components, temperature, surface net solar radiation, surface pressure, and monthly total precipitation) (Muñoz-Sabater et al., 2021), LAI (Cao et al., 2023), Aerosol Optical Thickness (AOT, Randles et al., 2017), and P emission data. The iterative model training process was terminated when the improvement in performance between successive generations fell below a predefined threshold. Model performance was assessed using the Mean Absolute Error (MAE; unit: g ha−1), calculated for each model's target region across all terrestrial grid cells using the test dataset. The convergence threshold for MAE was initially set to 0.001 g ha−1. Using this approach, we generated global atmospheric P deposition estimates at a spatial resolution of 0.1° for the period 2000–2019. To ensure consistency with the HaPi dataset, the 0.1° data were subsequently resampled to a 5 arcmin resolution and temporally extended back to 1900 using annual P deposition change rates derived from Ringeval et al. (2024). P deposition for the period 1860–1899 was assumed to remain constant and equal to the early 20th century levels.
Table 2Decadal mean P inputs to the terrestrial biosphere (Tg P yr−1).
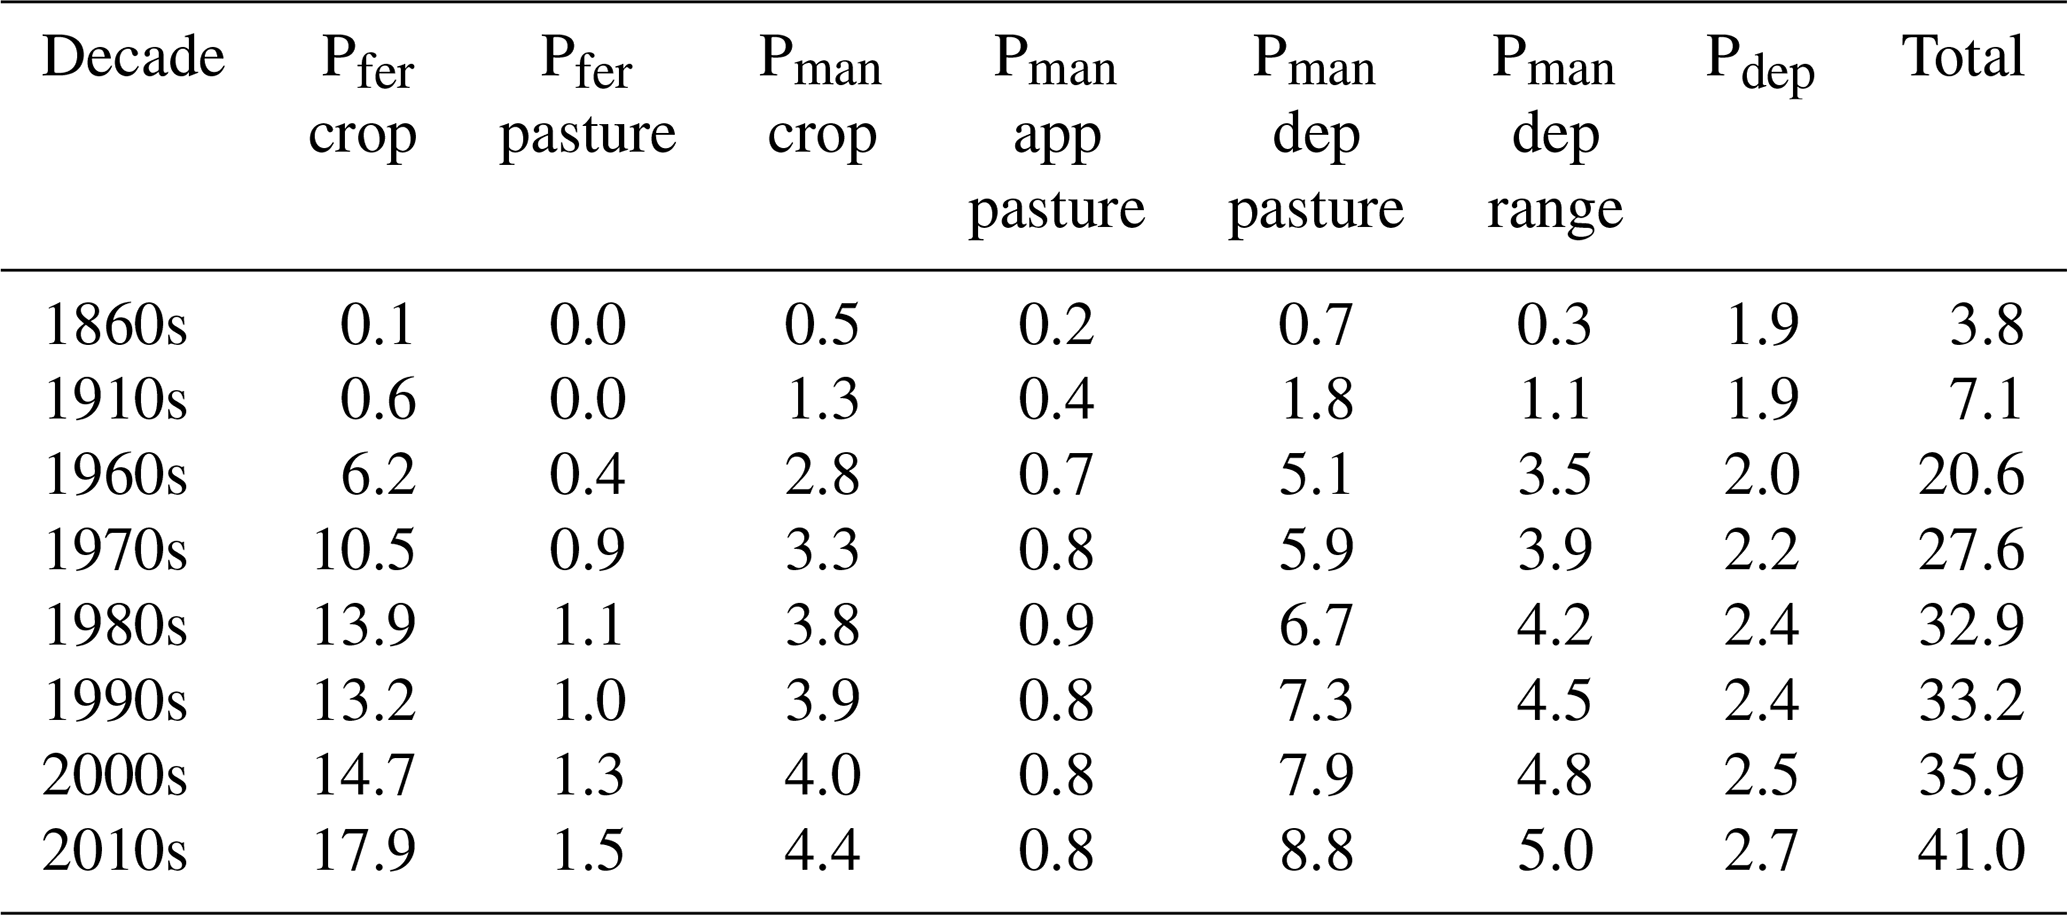
Note: the following abbreviations are used in the table: Pfer – P fertilizer, Pman – manure P, Pdep – Atmospheric P deposition, App – Application, and Dep – Deposition.
3.1 Global total P inputs
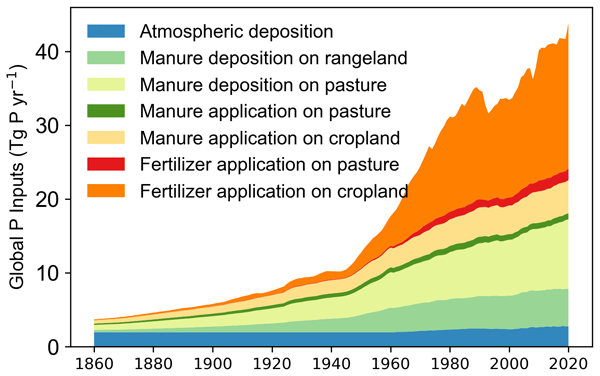
Global anthropogenic P inputs have undergone dramatic changes since the Industrial Revolution, increasing from 3.8 Tg P yr−1 in the 1860s to 41.0 Tg P yr−1 in the 2010s, a nearly 11-fold increase (Fig. 4). The most rapid acceleration occurred between 1945 and 1989, coinciding with post-war agricultural intensification. The amplified usage of mineral fertilizer and livestock manure P contributed nearly equally, over the study period, i.e., 52 % and 46 % of the increase in TP inputs to the terrestrial biosphere, respectively. The composition of P inputs shifted significantly over this period (Table 2). Prior to the 1980s, livestock manure accounted for over half of total P (TP) inputs. However, by the 2010s, mineral fertilizer P in TP inputs surpassed manure P for the first time. Atmospheric P deposition, while relatively stable, declined from 50 % to only 7 % of TP inputs from the 1860s to the 2010s, due to the marked increase in anthropogenic inputs. The intensified application of P fertilizer on cropland was the primary driver behind the increased TP inputs after 1945.
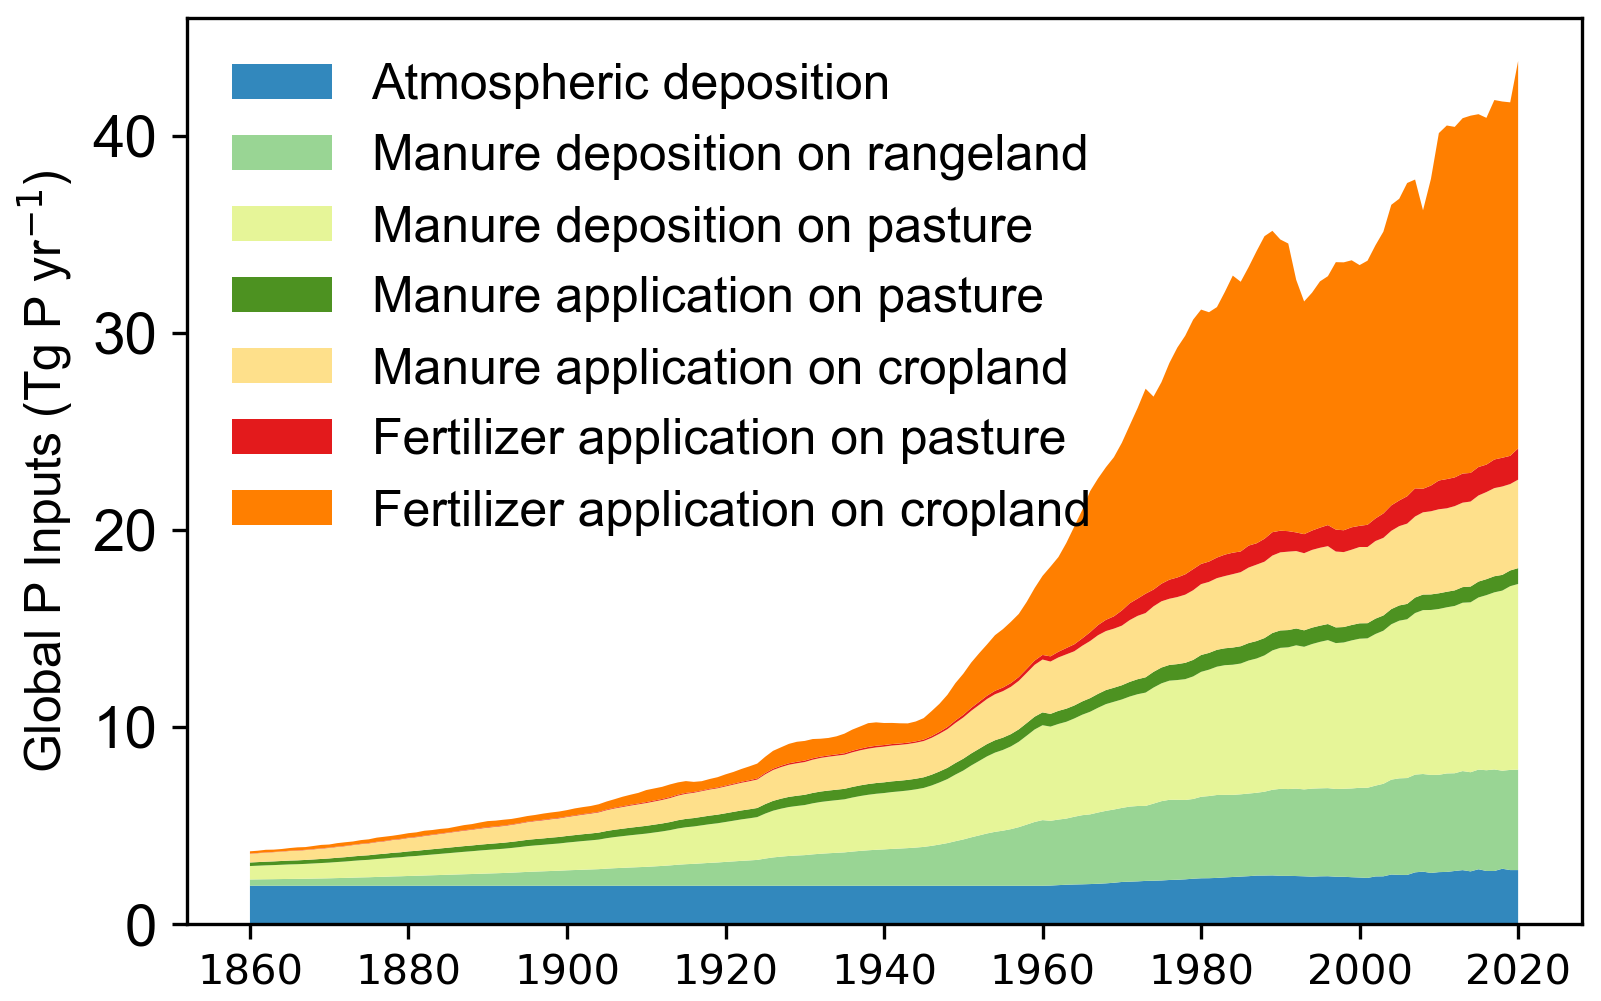
Figure 4Annual changes of anthropogenic phosphorus inputs to terrestrial ecosystems from 1860 to 2020.
Regionally, the TP inputs initially increased in Europe and eastern USA between the 1860s and the 1910s, primarily due to enhanced manure inputs (Figs. 5 and 6). Subsequently, P input hotspots emerged in Europe, driven by the rising use of P fertilizer. Europe (5.2 Tg P yr−1) and the USA (2.8 Tg P yr−1) were the top two regions with the highest P inputs in the 1960s. After the 1980s, TP inputs in Europe declined quickly, while leveling off in the USA. By the 2010s, new hotspots emerged in eastern China, northern India, southern Brazil, and eastern Africa, sourcing from the widespread application of mineral P fertilizer and the expansion of livestock production in these regions. Notably, TP inputs in China began to decrease around 2010, whereas inputs in South Asia and Brazil maintained growth trends. Livestock manure remains the dominant P source in most regions of the South Hemisphere (Africa, South America, Oceania), while P fertilizer plays a more important role in industrialized regions of the North Hemisphere (Asia, Europe, North America). In addition to Europe, TP inputs in Russia, Korea, and Japan (KAJ), and Central Asia (CAS) also declined substantially, largely due to the reduction in P fertilizer usage. Manure P inputs continued to increase in Africa, South/Southeast Asia, and Central America (CAM), but have shifted to a decreasing trend in Oceania, Europe, and Russia in recent decades.
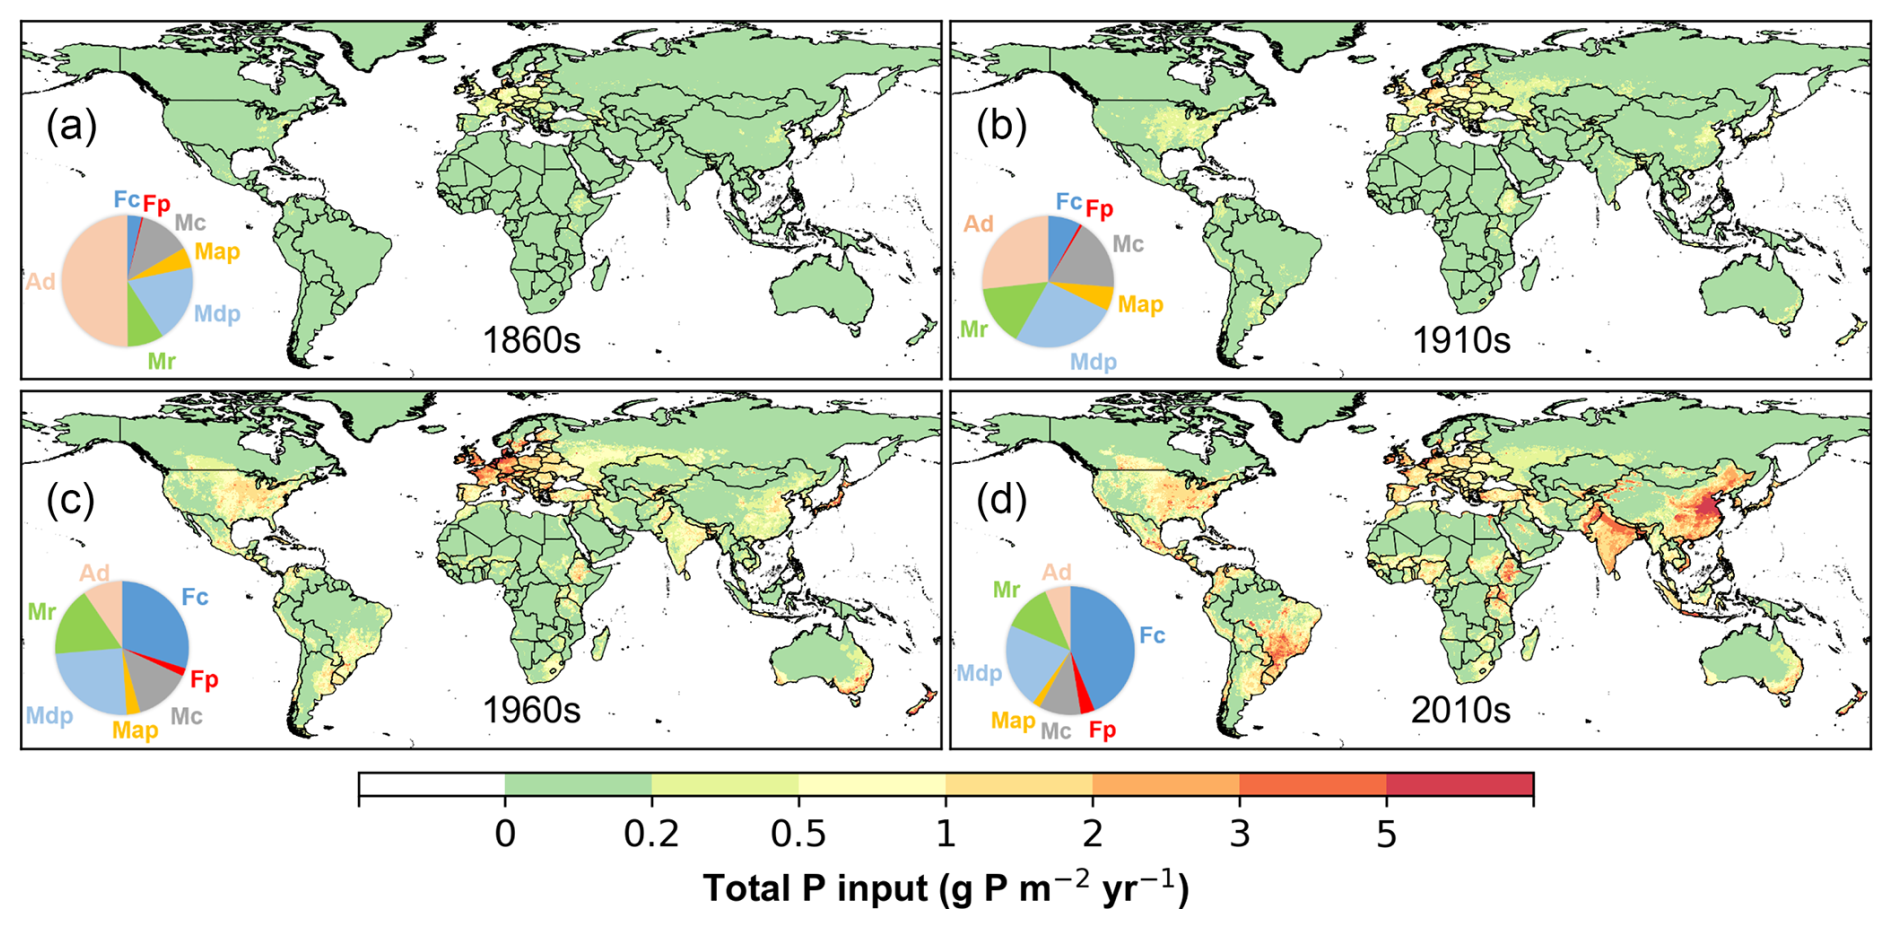
Figure 5Spatial patterns in total phosphorus input in the (a) 1860s, (b) 1910s, (c) 1960s, and (d) 2010s. The labels in the inset pie charts represent the percentage of each component: Fc – P fertilizer applied to cropland, Fp – P fertilizer applied to pasture, Mc – Manure P application on cropland, Map – Manure P application on pasture, Mdp – Manure P deposition on pasture, Mr – Manure P deposition on rangeland, Ad – Atmospheric P deposition.
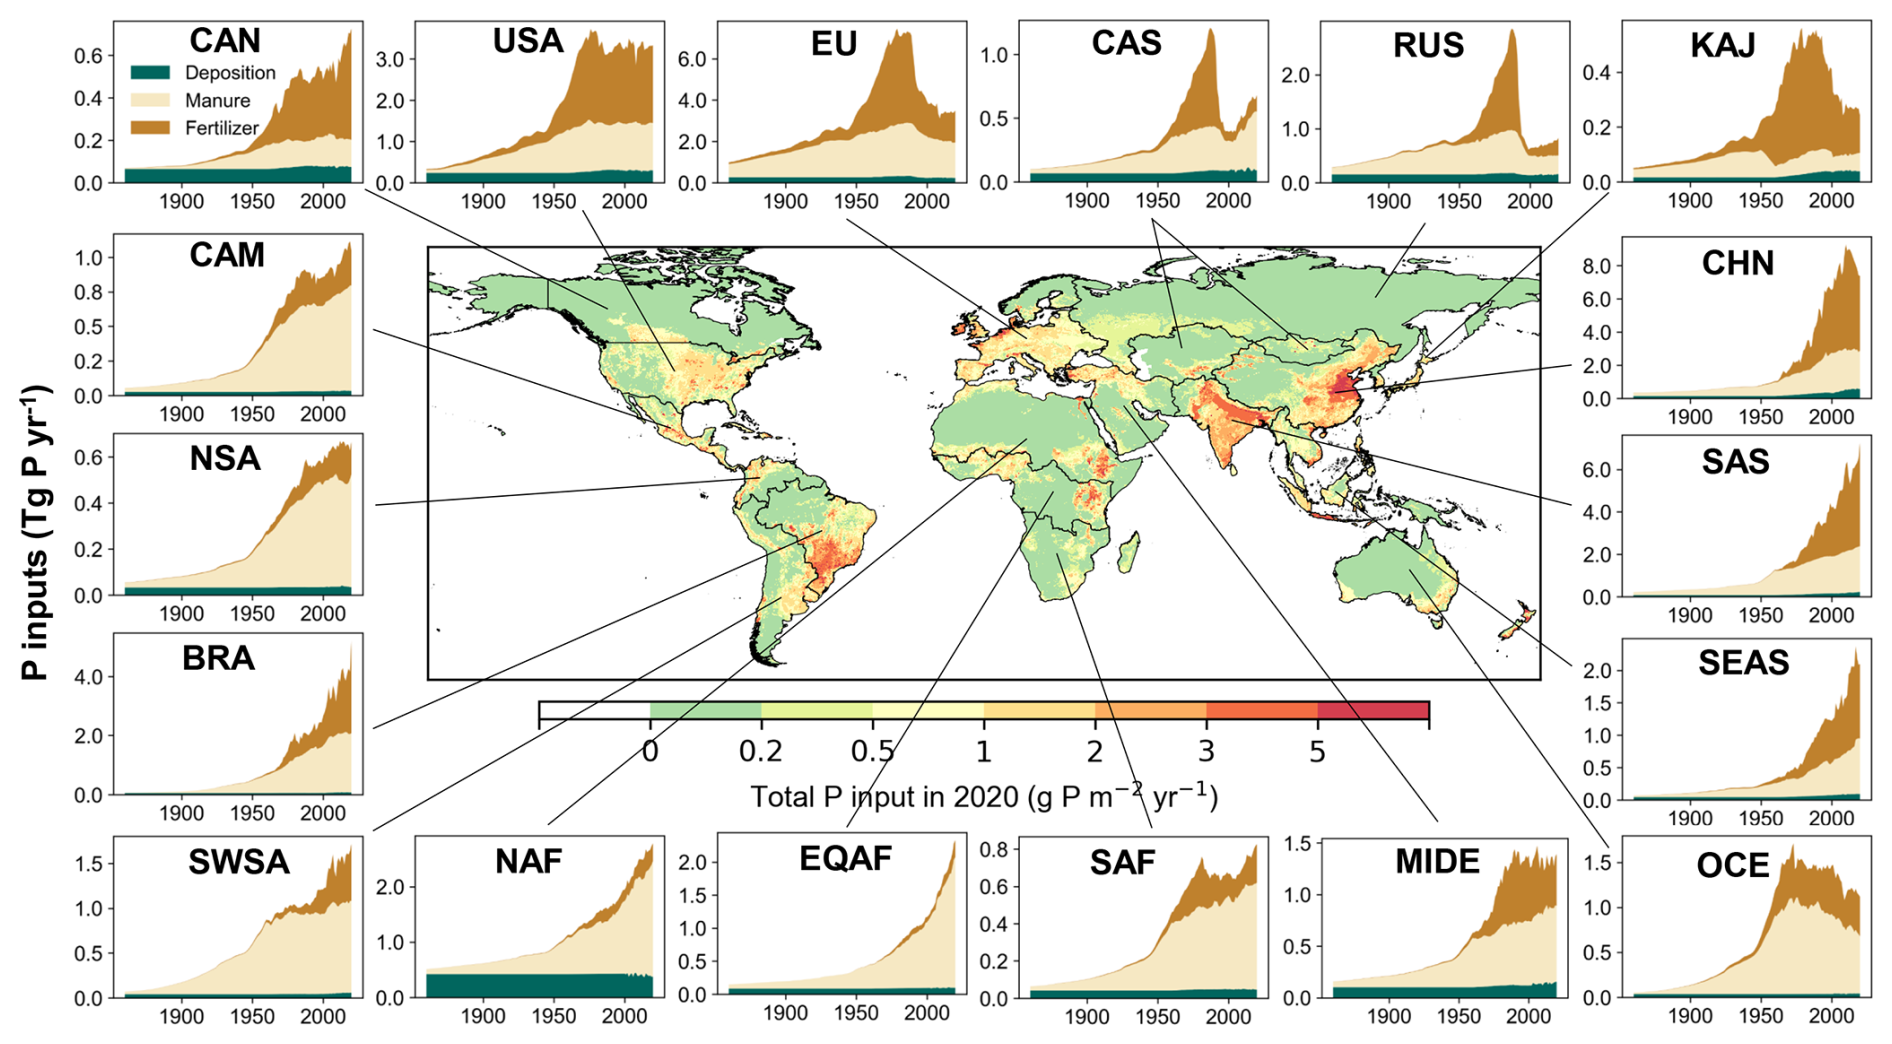
Figure 6Annual variations of phosphorus inputs in 18 regions during 1860–2020. The 18 regions are Canada (CAN), USA (USA), Europe (EU), Central Asia (CAS), Russia (RUS), Korea and Japan (KAJ), China (CHN), South Asia (SAS), Southeast Asia (SEAS), Oceania (OCE), Middle East (MIDE), Southern Africa (SAF), Equatorial Africa (EQAF), Northern Africa (NAF), southwestern South America (SWSA), Brazil (BRA), northern South America (NSA), and Central America (CAM).
3.2 P fertilizer inputs on cropland and pasture
The global total P fertilizer inputs surged from 6.6 Tg P yr−1 in the 1960s to 19.4 Tg P yr−1 in the 2010s, with cropland receiving over 90 % of these inputs (Fig. 7). Annual P fertilizer applied to croplands increased rapidly at a rate of 0.4 Tg yr−2 during 1961–1989, then declined sharply until 1995 before resuming an upward trajectory. Despite this global growth, significant regional disparities emerged (Figs. 6 and 8). Europe and the USA were the dominant regions for early P fertilizer consumption, accounting for 38 % and 24 % of global usage, respectively, in the 1960s. By the 2010s, China (30 %) and South Asia (20 %) had become the predominant consumers of P fertilizers, driven by intensive agricultural expansion. Regional shifts in P fertilizer inputs were pronounced. In the USA, P fertilizer application to cropland decreased from 2.0 Tg P yr−1 in the 1970s to 1.5 Tg P yr−1 in the 2000s. In Europe, P fertilizer usage peaked in the 1980s but decreased by 66 % in the 2010s. The increase in P fertilizer usage in China and South Asia contributed to 44 % and 29 % of the global total increase in P fertilizer application on cropland from the 1960s to the 2010s, respectively. However, China's usage plateaued in the 2010s, while South Asia's continued to increase rapidly. In the 2020s, hotspot regions with high P fertilizer application rates (>3 g P m−2 yr−1) were mainly distributed in eastern China, northern India, and southern Brazil. The P fertilizer application rates on cropland were consistently low across most areas in Africa over the whole study period, accounting for only 4 % of global consumption in the recent decade.
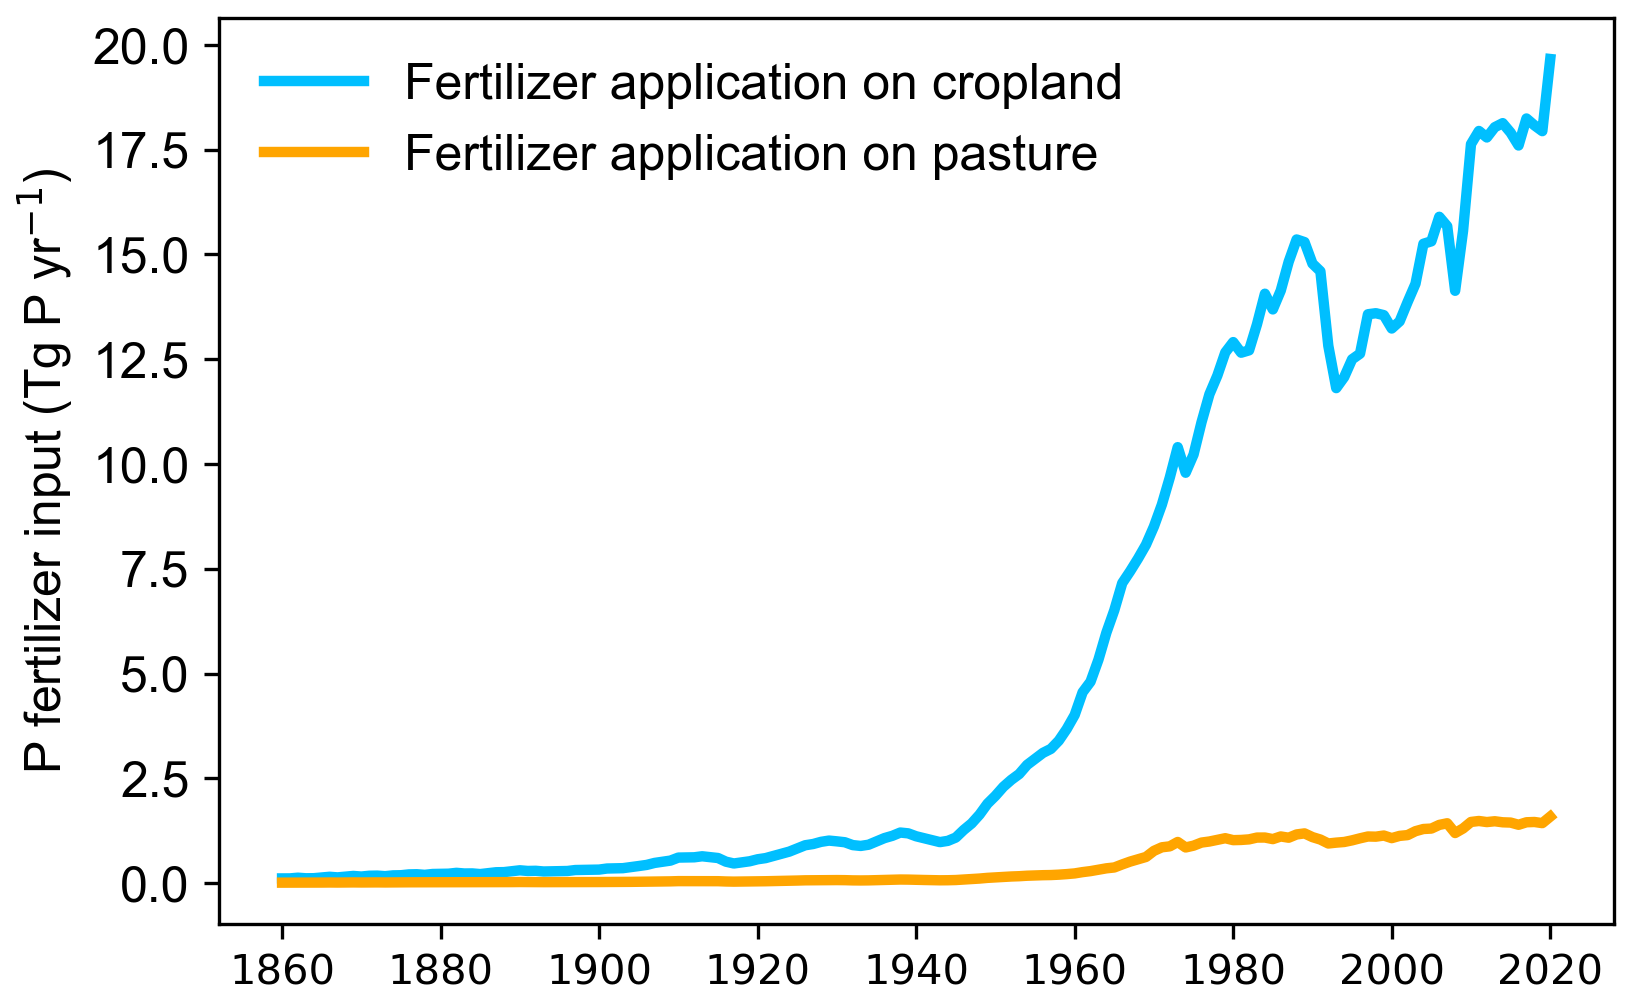
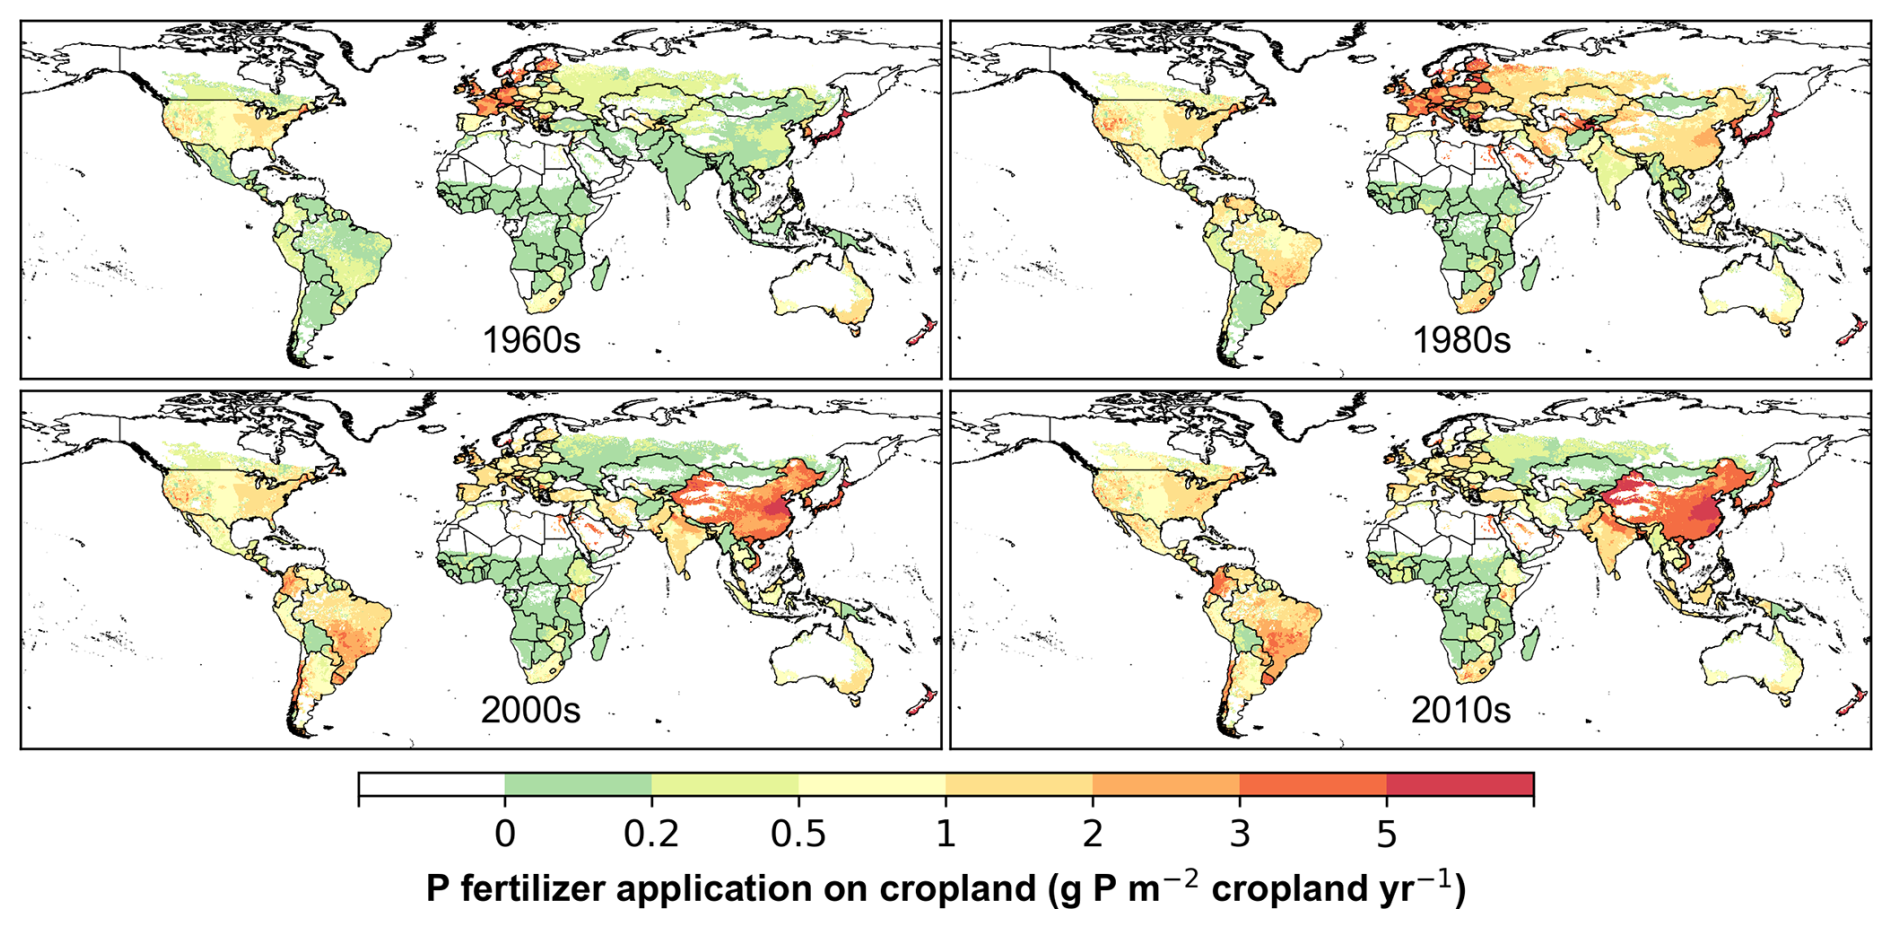
Figure 8Global patterns of phosphorus fertilizer application on cropland in the 1960s, 1980s, 2000s, and 2010s.
Global P fertilizer application on pasture increased from 0.3 to 1.6 Tg P yr−1 during 1961–2020. Before the 1980s, European countries were the predominant consumers of P fertilizer on pasture (Fig. S2). Thereafter, the USA and India significantly increased their usage, accounting for 23 % and 22 % of total P fertilizer application on pasture, respectively, in the 2010s. P fertilizer application rate per pasture land was high in India, Japan, and southern Canada, but remained low in most other countries in recent decades.
3.3 Manure P inputs on cropland, pasture, and rangeland
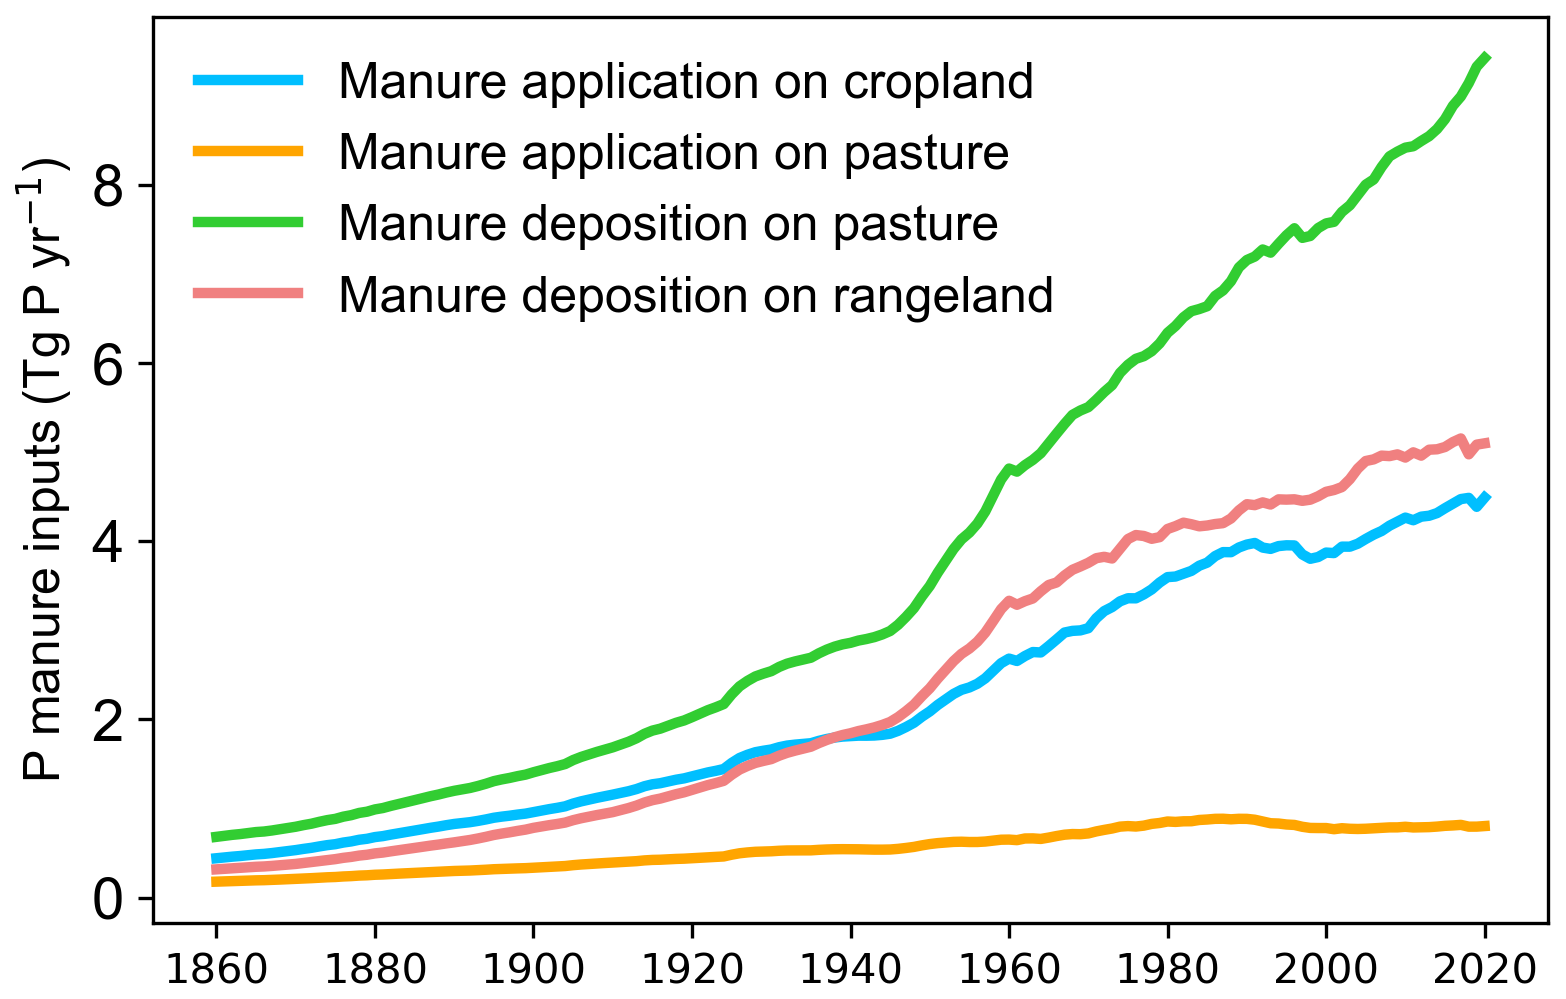
Livestock manure served as the primary P source for agricultural soils historically, with global manure P inputs on cropland, pasture, and rangeland increasing from 1.7 to 18.9 Tg P yr−1 during the period from the 1860s to the 2010s (Fig. 9). Pasture received half of total manure P inputs, while cropland and rangeland each shared a similar proportion of the remaining half. Over 1961–2020, manure P deposition on pasture kept increasing at a rate of 0.07 Tg P yr−2, while manure P application on pasture was relatively stable. Meanwhile, annual manure inputs on cropland and rangeland both increased, but at relatively slow rates than those on pasture. In the context of rising global manure P inputs, developing countries have demonstrated stronger growth rates than developed countries in recent decades. China has surpassed Europe as the region receiving the largest manure P inputs since the 2000s, as manure P inputs in Europe have declined since the 1980s. Over the past four decades, manure usage in North Africa (NAF) and Equatorial Africa (EQAF) has grown at the fastest rate, increasing by 96 % and 138 %, respectively. In the 2010s, China, South Asia, Brazil, and North Africa, as the top four regions, received 13 %, 11 %, 11 %, and 10 % of the global total manure P inputs, respectively.
Application rates of manure P per unit area of cropland increased significantly in Asia, Europe, and North and South America since 1860 (Fig. 10). Manure P application on cropland initially increased in western Europe in the 1910s, with subsequent intensified application occurring in eastern Asia and northern South America by the 2010s. Manure application and deposition rates on pasture were extremely high in South and Southeast Asia over the last century (Figs, 11, S3, and S4). The proportion of manure deposition in total manure inputs to pasture gradually increased from 79 % to 92 % from the 1860s to the 2010s. Prominent manure P deposition on rangeland was observed in South and Southeast Asia, with new hotspots developing in Central Africa, eastern South America, northern China, and Europe in the 2010s (Fig. 12).
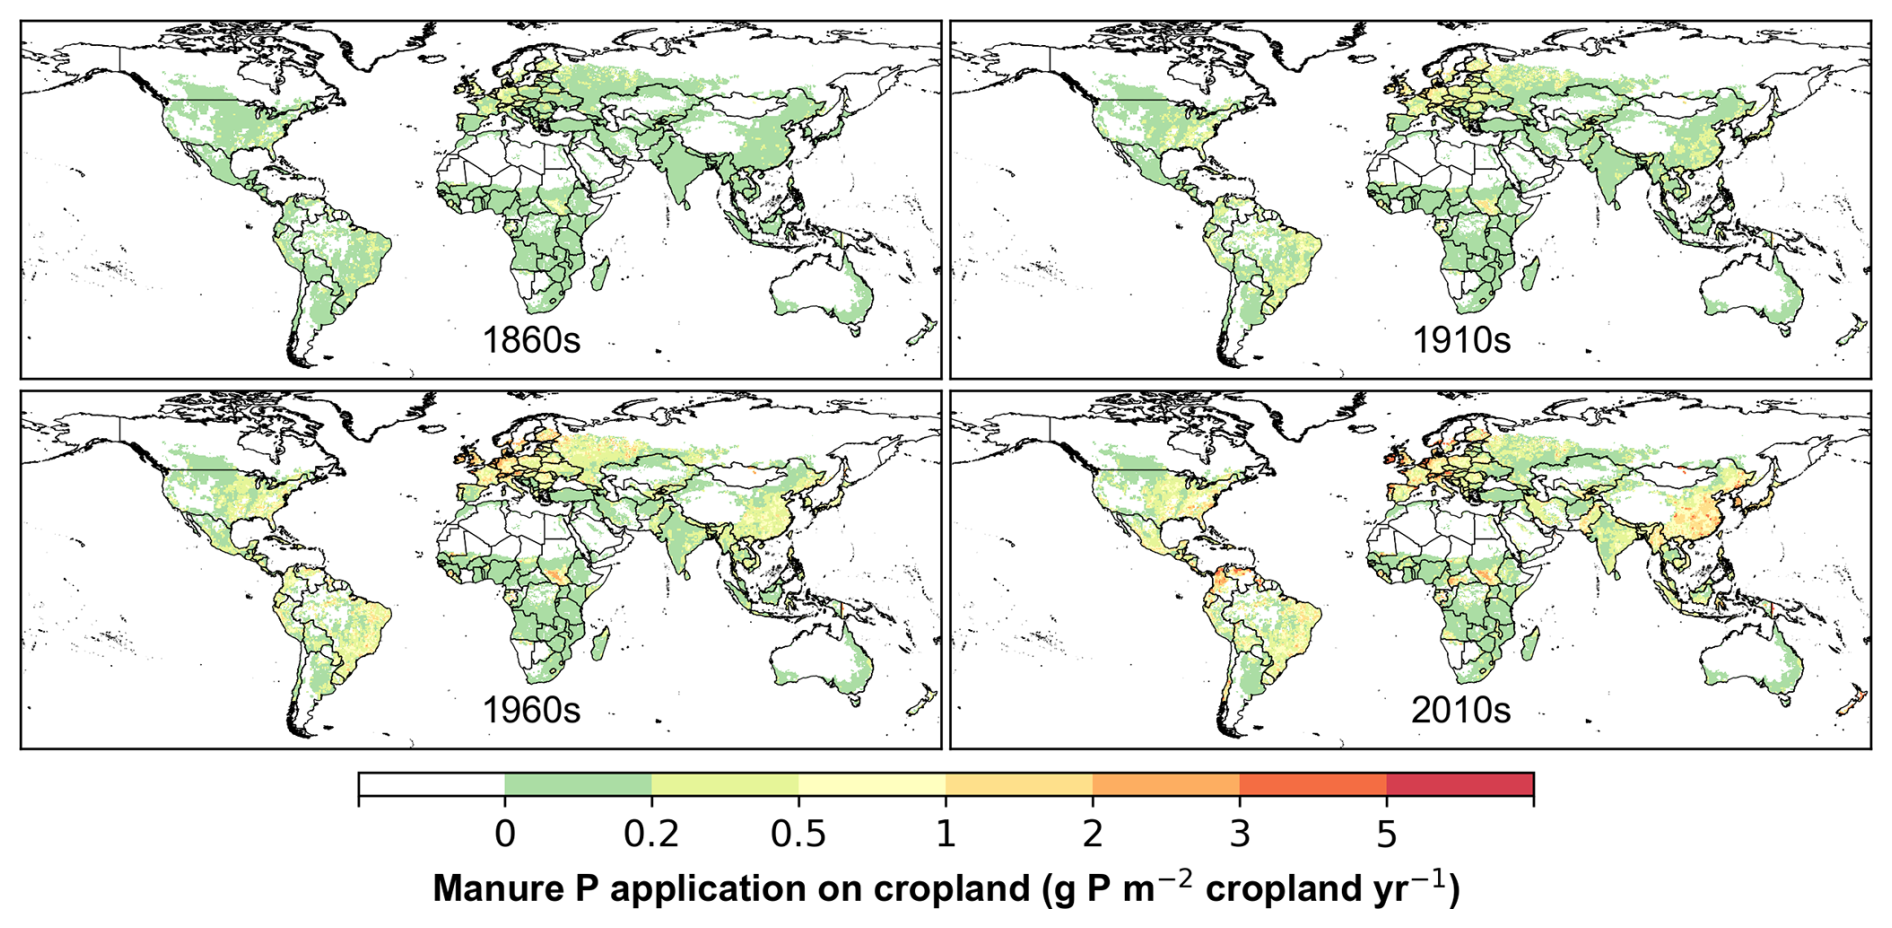
Figure 10Global patterns of manure phosphorus application on cropland in the 1860s, 1910s, 1960s, and 2010s.
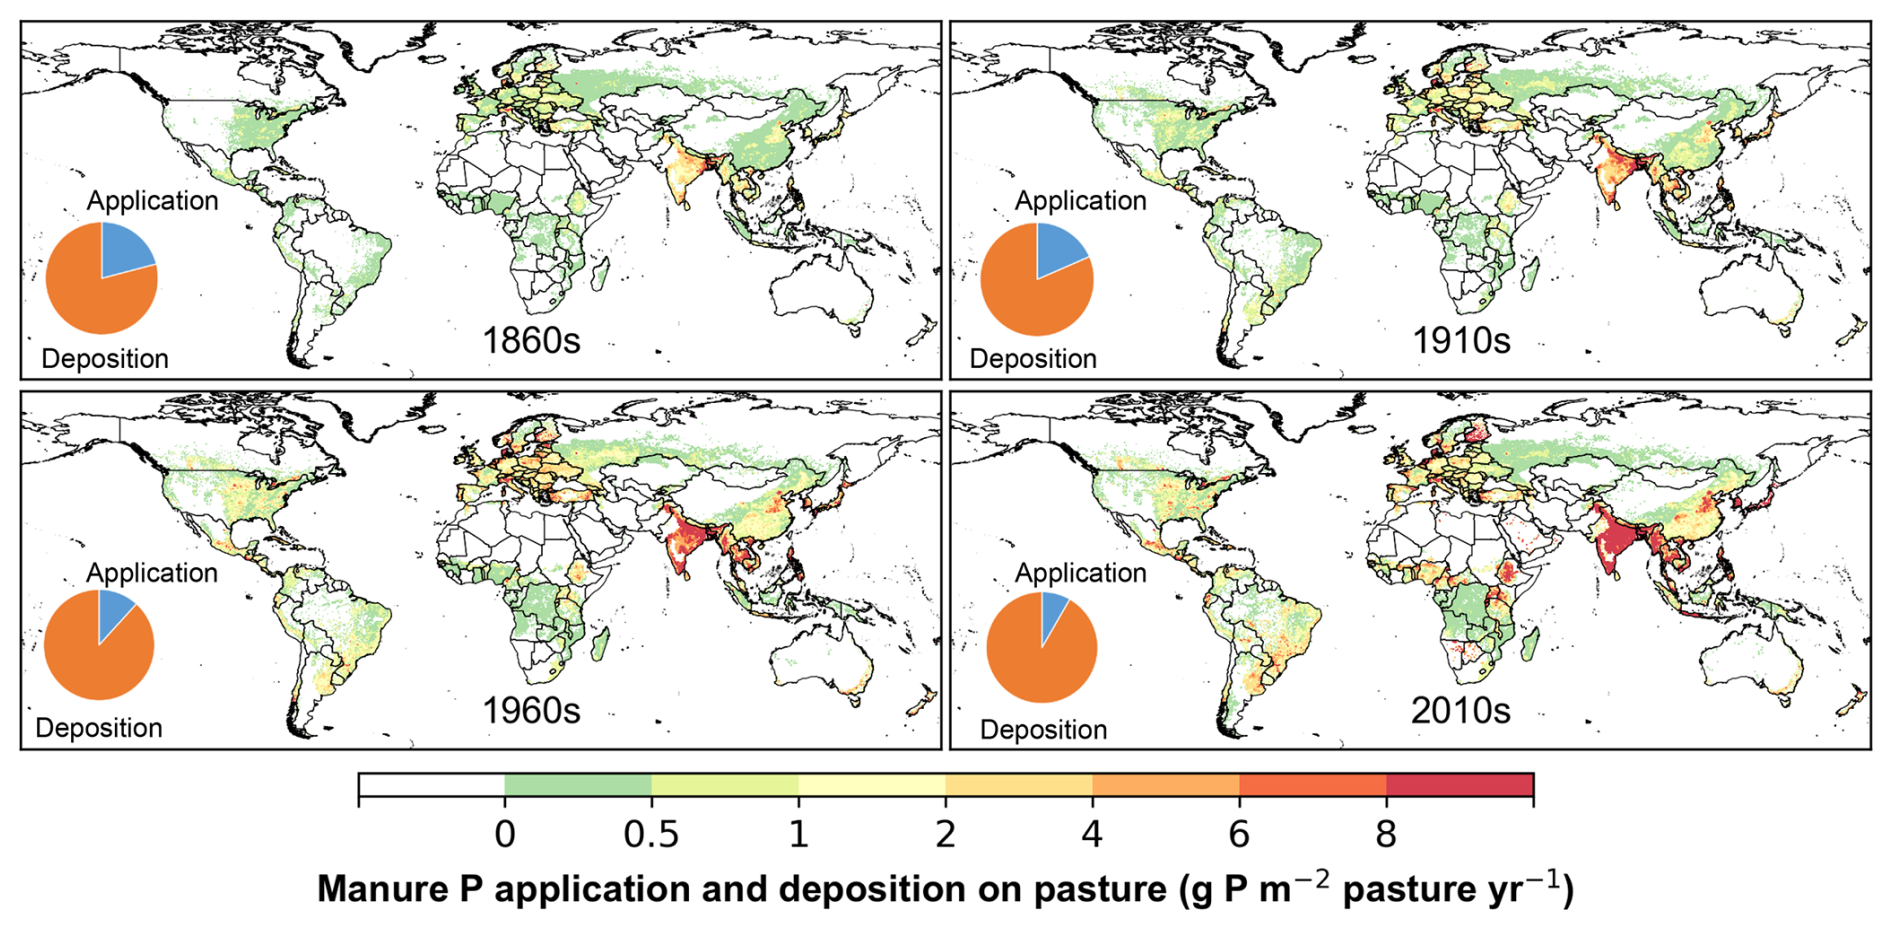
Figure 11Global patterns of manure phosphorus application and deposition on pasture in the 1860s, 1910s, 1960s, and 2010s.
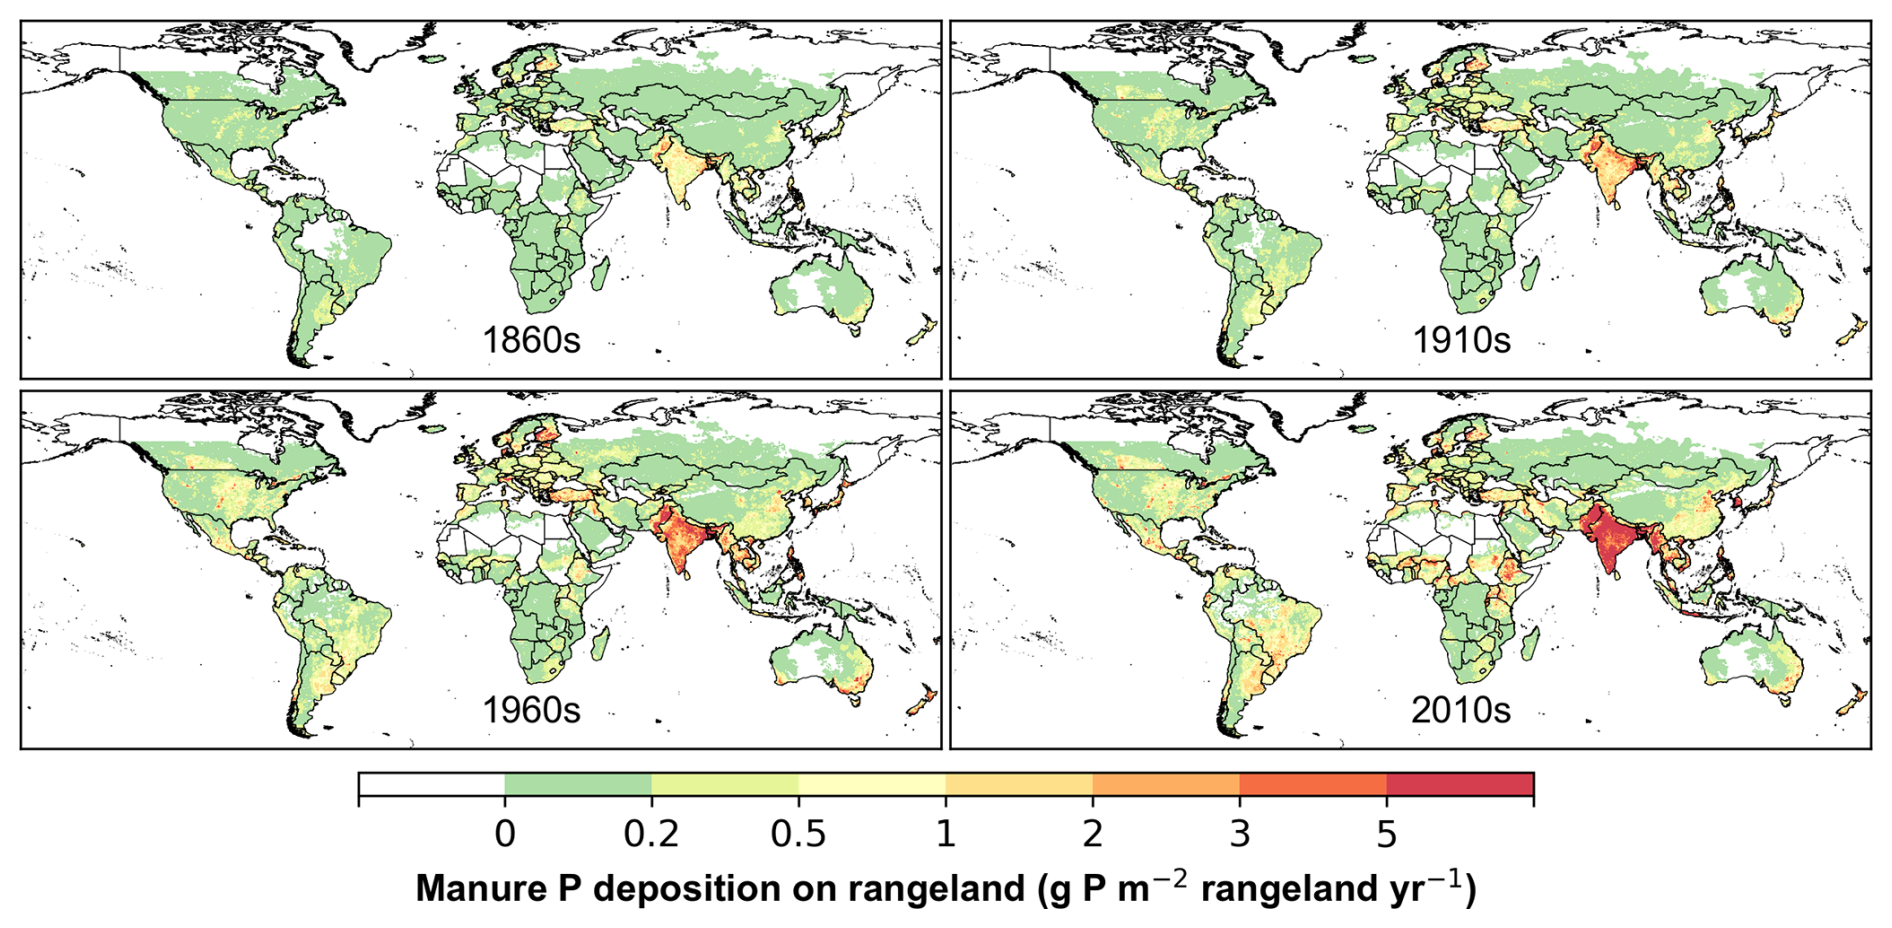
Figure 12Global patterns of manure phosphorus deposition on rangeland in the 1860s, 1910s, 1960s, and 2010s.
3.4 Atmospheric P deposition
Atmospheric P deposition is the major P source for natural ecosystems, such as forests and shrubs, but plays a less important role in cropland. Although anthropogenic activities have led to the increase of atmospheric P deposition from 2.0 Tg P yr−1 in the 1960s to 2.7 Tg P yr−1 in the 2010s, the proportion of atmospheric P deposition in total P inputs decreased dramatically to only 7 % by the 2010s. China was the region with the largest atmospheric P deposition (21 % of the global total) in the 2010s, followed by North Africa (15 %), the USA (11 %), and Europe (9 %) (Fig. 13). Atmospheric P deposition in northern Africa was primarily derived from natural sources and remained relatively stable during the study period. Influenced by anthropogenic activities, atmospheric P deposition in China has continually increased since the 1960s, while that in Europe has shifted from an increase to a decrease in the 1980s. Atmospheric P deposition was relatively low across most regions, with the exception of several notable hotspots in northern Africa, eastern China, central Europe, and eastern USA.
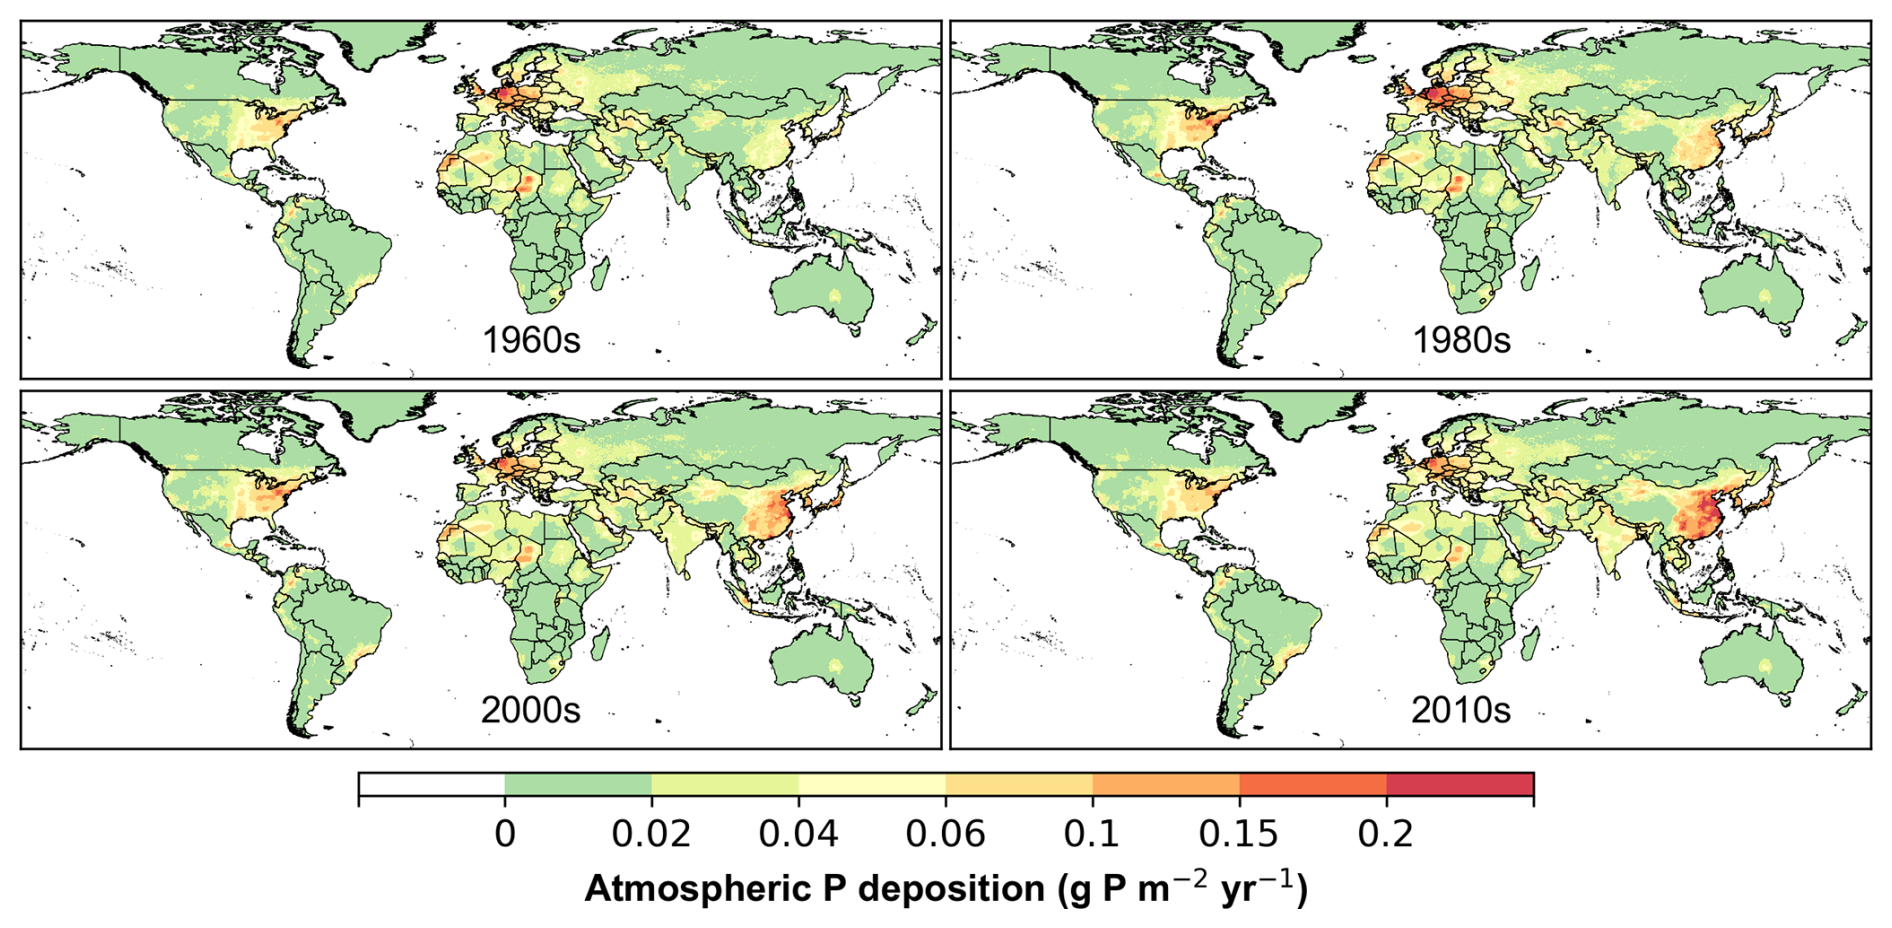
Figure 13Global patterns of atmospheric phosphorus deposition in the 1960s, 1980s, 2000s, and 2010s.
The History of Anthropogenic P Inputs (HaPi) dataset is available at https://doi.org/10.6084/m9.figshare.29930279 (Bian et al., 2026).
5.1 Comparison with previous studies
The HaPi dataset provides spatially explicit, annual estimates of anthropogenic P inputs to the terrestrial biosphere. This gridded P input dataset reveals subnational heterogeneity, enabling the detection of localized hotspots of high P input that national averages may obscure. When aggregated to the global scale, HaPi aligns well with existing studies, particularly for cropland fertilizer P inputs, which have been extensively evaluated (Table 3). Nearly all these studies rely on the country-level fertilizer inventory data provided by FAO or IFA, which give consistent global totals. Additional validation against independent national statistics from China and the US shows that HaPi captures comparable magnitudes and similar spatial-temporal patterns of P fertilizer use (Fig. S5), although with slightly lower estimates relative to both datasets. These results provide further support for the robustness of national-scale temporal dynamics in HaPi.
Table 3Comparison of P input data with other global estimates.
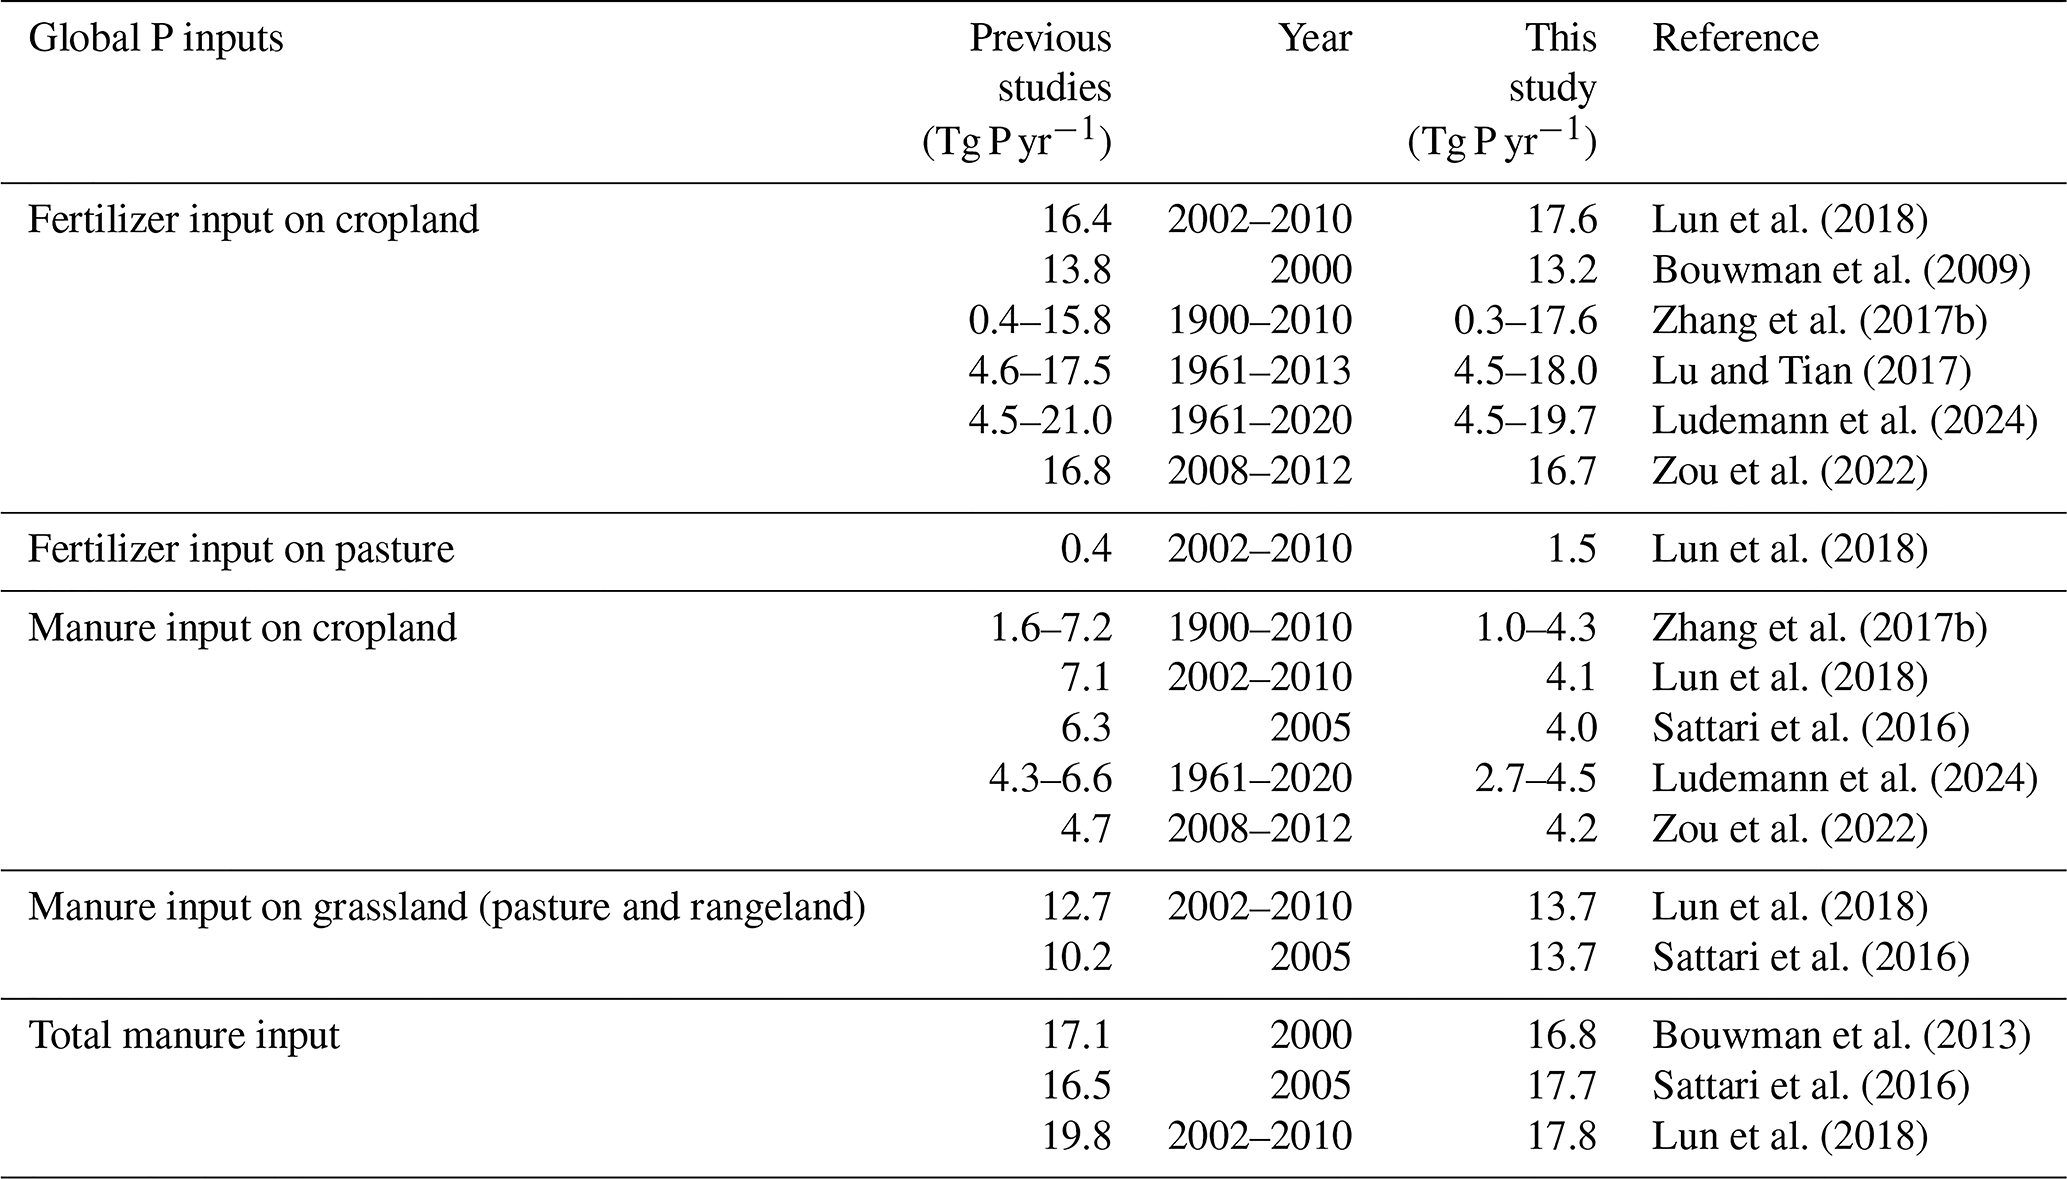
In contrast, the HaPi estimates of manure P applied to cropland are consistent with those reported by Zou et al. (2022) but are lower than other estimates, while manure P inputs in grasslands (pasture and rangeland) are higher than previous estimates. Despite these differences, total manure P inputs in HaPi remain consistent with other studies. The primary source of discrepancy arises from differences in the allocation of manure inputs between cropland and grassland and is partly driven by inconsistencies in cropland definitions, especially regarding the inclusion of temporary pastures. In previous studies, manure P inputs were calculated by multiplying manure N inputs provided by FAO and P : N ratio in livestock manure products. According to the latest FAOSTAT dataset, around 75 % of total manure N inputs are deposited on grassland, and the remaining 25 % is applied to cropland (around 21 %) and grassland (4 %) soils. The majority of manure is directly deposited on grasslands through grazing animal excretion, whereas a smaller proportion is collected and subsequently applied to pastures and croplands as a managed nutrient input. HaPi estimates 23 % of manure P was applied on cropland, closely matching FAOSTAT's current methodology. In contrast, Lun et al. (2018) and Sattari et al. (2016) estimated 36 % and 38 % of total manure P inputs to cropland.
Compared to previous studies, the HaPi dataset offers the most comprehensive coverage of anthropogenic P input fluxes, featured by a high spatial resolution and extended historical coverage. These features support the analysis of legacy P accumulation and depletion, and simultaneously provide consistent forcing data for land surface and biogeochemical models. This harmonized P input dataset enhances our ability to assess regional nutrient trends, environmental risks, and management needs at multiple spatial scales.
5.2 The implication of changes in manure and fertilizer P inputs
Globally, mineral P fertilizer has surpassed manure P as the largest P input to cropland, while livestock manure remains the dominant P source for pasture and rangeland. Overall, livestock manure is a more significant source of P for terrestrial ecosystems compared to mineral fertilizer. In recent decades, livestock manure contributed over half of the P sources in most regions, especially in Africa where around 90 % of total P inputs were derived from manure. As P fertilizer application began to decrease in European countries, manure P application on cropland played an increasingly important role in food production. Grassland, including pasture and rangeland, received over 70 % of global manure P inputs and over 40 % of total P inputs; therefore, it is critical to take account of grassland when investigating global P balance and P-related environmental issues. For instance, it is estimated that P loading to the Gulf of Mexico originated primarily from manure on pasture and rangeland (37 %), followed by corn and soybeans (25 %) within the Mississippi River Basin (Alexander et al., 2008). Despite high manure P input, manure excretion is still partly an internal P cycling in the grassland-livestock system since it derives from soil P uptake by grass. Furthermore, global manure P input cannot compensate for the grazing P output in grassland systems because around 23 % of manure was transferred from grassland to cropland systems. Due to the limited application of fertilizer to grasslands, global grasslands are facing the challenge of a negative P budget (Sattari et al., 2016). Given the projected increase in livestock production to meet future demand for meat and milk, effectively managing P flows in the whole crop-livestock production systems is critical for the sustainable human P cycle (Bouwman et al., 2013).
Socio-economic development clearly drives the long-term changes in total anthropogenic P inputs to agricultural lands (Fig. S6). The rapid increase in P fertilizer application on cropland in the latter half of the 20th century stimulated crop production but ultimately resulted in a decrease in P use efficiency. After about 60 years of growth, global total P fertilizer use has leveled off in the 2010s. Europe, previously the largest consumer of P fertilizer, began reducing its usage in the 1980s. China, currently the largest consumer, has also shown a decrease in P fertilizer consumption since 2013. Although P fertilizer application decreases, crop yield and P uptake may not decline correspondingly. The large P surpluses due to previous P application in European countries have built up soil residual P pool which can continually supply crop production (Sattari et al., 2012). Similarly, the reduced usage of P fertilizer in China may also result from the supply of soil legacy P resources accumulated over the last decades. The increased crop yield and decreased P fertilizer usage indicated an enhancement in P use efficiency in these industrialized countries. Meanwhile, many developing countries, such as India and Brazil, continue to experience elevated P fertilizer usage and an amplified P surplus on croplands (Zhang et al., 2017b). Utilizing residual soil P can be a key strategy to reduce reliance on imported mineral P fertilizer and improve the sustainability of agriculture in these countries.
5.3 Limitations in data development
Despite numerous improvements in the HaPi dataset over previous P input datasets, several limitations remain in its development. First, the fertilizer input dataset was developed using the spatial distribution of crop-specific fertilizer application rates around the year 2000 as a baseline map. Although fertilizer application rates vary over time through scaling with national statistics, the fixed spatial pattern of fertilizer use would disregard subnational variability in fertilizer application rates for each crop, and HaPi may not fully capture temporal changes in relative fertilizer intensity among individual crops. Furthermore, the climate-based disaggregation strategy for FAOSTAT crop harvest area needs further improvement. A key challenge is the lack of globally consistent, dynamic maps (e.g., yearly suitable area for specific farming systems) for constraining spatial allocation of statistical data. To improve the crop-specific harvest area estimates, more efforts are required to obtain fine-grained statistics (national- or provincial-level statistical data is used in this study) of varied crops. Another plausible solution is to fuse satellite-retrieved crop distribution products with these statistical disaggregation maps. But the major limits of this pathway are the discontinuous temporal coverage and lack of global availability for many crop types in satellite products.
Second, we used historical cropland, pasture, and rangeland data from HYDE/LUHv2 to spatialize country-level P fertilizer use amounts, but HYDE/LUHv2 data have been shown to exhibit inconsistent spatial and temporal patterns of land use relative to satellite-derived land use at the regional scale. For example, the HYDE dataset overestimates the cropland area in India, which can lead to the underestimation of the P fertilizer application rate on cropland. In this study, we assumed that the ratios of P fertilizer application on pasture relative to cropland were the same as those for N fertilizer, which may not accurately reflect the actual allocation of P fertilizer usage on pasture. Since country-level data for P fertilizer are only available from 1961 onwards, we assumed that the change rates of global fertilizer inputs before 1961 followed the annual global trends reported by Cordell et al. (2009). Although this approach provides a temporally continuous long-term dataset, it cannot explicitly represent historical changes in crop composition, fertilizer accessibility, and agricultural management practices, and it ignores regional variations in the changes of P fertilizer usage across different countries before 1961. Consequently, uncertainties are substantially higher in the pre-1961 period, and the resulting maps should be interpreted primarily as broad-scale reconstructions rather than precise representations of historical subnational fertilizer distributions.
Third, we calculated manure P inputs based on manure N inputs and P : N ratio with spatiotemporal heterogeneity, but the gridded manure P data were not constrained by survey data, as country-level manure P inputs data were not available from the Soil Nutrient Budget database in FAOSTAT. Although temporal changes in livestock composition are considered when estimating manure N : P ratios, potential changes in species-specific manure nutrient ratios associated with evolving feed composition and livestock management practices are not explicitly represented, which may introduce biases in manure P estimates. Aside from mineral fertilizer, livestock manure, and atmospheric deposition, other anthropogenic P sources, including guano, livestock bones, and human excreta, were historically used to enhance soil fertility. These P sources were difficult to quantify at a global level without reliable data sources and were therefore not included or accurately quantified in the HaPi dataset.
5.4 Uncertainty
The uncertainties in the HaPi dataset mainly arise from the input datasets and methodological assumptions used in developing the global P input estimates. Quantifying the overall uncertainties in the HaPi dataset is challenging due to the heterogeneity of underlying data sources and the scarcity of independent datasets for robust validation. Four major sources of uncertainty were identified as contributing to the overall uncertainty in the HaPi dataset. First, the FAO survey data, which serve as the primary constraint for national total P inputs, represent a critical source of uncertainty in estimating total P inputs to the terrestrial biosphere. Based on expert judgment, a generic uncertainty of approximately 20 % was assigned to the FAO national estimates (Tubiello et al., 2021). Consequently, the spatially explicit P input maps derived from these national data inherently carry at least the same level of uncertainty, with a minimum estimated uncertainty of 20 %. Second, uncertainties arise from the land use maps used to spatialize P inputs. Uncertainties in land cover classification or temporal interpolation in HYDE/LUHv2 data may propagate into the spatial allocation of P fertilizer and manure applications, thereby affecting local input rates and hotspot identification. Third, uncertainties stem from empirical assumptions and static parameters used during dataset construction, including the assumption of partitioning ratios for fertilizer use between cropland and pasture, the use of time-invariant crop-specific fertilizer and manure application patterns, the fixed manure N : P ratios for different livestock species, and the application of globally uniform change rates for reconstructing pre-1961 data. Finally, uncertainties in atmospheric P deposition simulated by the GEOS-Chem model are primarily associated with model structure and parameterization. Although the HaPi dataset primarily focuses on anthropogenic P inputs, it additionally includes both natural and anthropogenic sources. Collectively, these sources contribute to uncertainties in both the magnitude and spatial distribution of anthropogenic P inputs. Given the limitations and uncertainties in the HaPi dataset, it is important to collect or conduct surveys of crop-specific P fertilizer and manure use at subnational scales and update global land use data to reflect more precise regional patterns of global fertilizer and manure P inputs.
The supplement related to this article is available online at https://doi.org/10.5194/essd-18-7125-2026-supplement.
ZB, HS, and HT designed this work and developed the datasets. RL, SY, BH, and JM estimated atmospheric P deposition. FNT provided the FAO dataset. NDM provided the crop-specific P fertilizer application datasets. LF, HR, LL, HC, and YY contributed to the development of methodology. All authors contributed to the writing of the manuscript.
At least one of the (co-)authors is a member of the editorial board of Earth System Science Data. The peer-review process was guided by an independent editor, and the authors also have no other competing interests to declare.
The views expressed in this work are the authors' only and do not reflect FAO positions on the subject matter.
Publisher's note: Copernicus Publications remains neutral with regard to jurisdictional claims made in the text, published maps, institutional affiliations, or any other geographical representation in this paper. The authors bear the ultimate responsibility for providing appropriate place names. Views expressed in the text are those of the authors and do not necessarily reflect the views of the publisher.
FAOSTAT data are produced under FAO regular budget, with inputs from national experts in member countries. This work is a contribution to the collaborative program on the Terrestrial–Inland water–Atmosphere Nexus, supported by the Global Carbon Project Boston Office (GCP-Boston) and Center for Earth System Science and Global Sustainability (CES3) at Boston College.
Zihao Bian acknowledges funding support from the National Natural Science Foundation of China (grant no. 42401015) and Jiangsu Provincial Department of Science and Technology (grant no. BK20240599). Hao Shi received support from the National Natural Science Foundation of China (grant no. 42561144300). Hanqin Tian acknowledges the funding support from US National Science Foundation (grant no. 1903722), USDA CBG (grant no. TENX12899) and Humboldt Research Award.
This paper was edited by Yuyu Zhou and reviewed by three anonymous referees.
Alexander, R. B., Smith, R. A., Schwarz, G. E., Boyer, E. W., Nolan, J. V., and Brakebill, J. W.: Differences in Phosphorus and Nitrogen Delivery to The Gulf of Mexico from the Mississippi River Basin, Environ. Sci. Technol., 42, 822–830, https://doi.org/10.1021/es0716103, 2008.
Barbieri, P., MacDonald, G. K., Bernard de Raymond, A., and Nesme, T.: Food system resilience to phosphorus shortages on a telecoupled planet, Nat. Sustain., 5, 114–122, https://doi.org/10.1038/s41893-021-00816-1, 2022.
Beusen, A. H. W., Bouwman, A. F., Van Beek, L. P. H., Mogollón, J. M., and Middelburg, J. J.: Global riverine N and P transport to ocean increased during the 20th century despite increased retention along the aquatic continuum, Biogeosciences, 13, 2441–2451, https://doi.org/10.5194/bg-13-2441-2016, 2016.
Bian, Z., Shi, H., and Tian, H.: HaPi: A Historical dataset of Anthropogenic Phosphorus Inputs to the terrestrial biosphere (1860–2020), figshare [data set], https://doi.org/10.6084/m9.figshare.29930279, 2026
Bouwman, A. F., Beusen, A. H., and Billen, G.: Human alteration of the global nitrogen and phosphorus soil balances for the period 1970–2050, Global Biogeochem. Cy., 23, GB0A04, https://doi.org/10.1029/2009GB003576, 2009.
Bouwman, L., Goldewijk, K. K., Van Der Hoek, K. W., Beusen, A. H. W., Van Vuuren, D. P., Willems, J., Rufino, M. C., and Stehfest, E.: Exploring global changes in nitrogen and phosphorus cycles in agriculture induced by livestock production over the 1900–2050 period, P. Natl. Acad. Sci. USA, 110, 20882–20887, https://doi.org/10.1073/pnas.1012878108, 2013.
Cao, S., Li, M., Zhu, Z., Wang, Z., Zha, J., Zhao, W., Duanmu, Z., Chen, J., Zheng, Y., Chen, Y., Myneni, R. B., and Piao, S.: Spatiotemporally consistent global dataset of the GIMMS leaf area index (GIMMS LAI4g) from 1982 to 2020, Earth Syst. Sci. Data, 15, 4877–4899, https://doi.org/10.5194/essd-15-4877-2023, 2023.
Carn, S.: Multi-Satellite Volcanic Sulfur Dioxide L4 Long-Term Global Database V3, GES DISC [data set], https://doi.org/10.5067/MEASURES/SO2/DATA404, 2019.
Carn, S. A., Yang, K., Prata, A. J., and Krotkov, N. A.: Extending the long-term record of volcanic SO2 emissions with the Ozone Mapping and Profiler Suite nadir mapper, Geophys. Res. Lett., 42, 925–932, https://doi.org/10.1002/2014GL062437, 2015.
Carpenter, S. R.: Eutrophication of aquatic ecosystems: Bistability and soil phosphorus, P. Natl. Acad. Sci. USA, 102, 10002–10005, https://doi.org/10.1073/pnas.0503959102, 2005.
Conley, D. J., Paerl, H. W., Howarth, R. W., Boesch, D. F., Seitzinger, S. P., Havens, K. E., Lancelot, C., and Likens, G. E.: Controlling Eutrophication: Nitrogen and Phosphorus, Science, 323, 1014–1015, https://doi.org/10.1126/science.1167755, 2009.
Cordell, D., Drangert, J.-O., and White, S.: The story of phosphorus: Global food security and food for thought, Global Environ. Change, 19, 292–305, https://doi.org/10.1016/j.gloenvcha.2008.10.009, 2009.
Crippa, M., Guizzardi, D., Schaaf, E., Monforti-Ferrario, F., Quadrelli, R., Risquez Martin, A., Rossi, S., Vignati, E., Muntean, M., Brandao De Melo, J., Oom, D., Pagani, F., Banja, M., Taghavi-Moharamli, P., Köykkä, J., Grassi, G., Branco, A., and San-Miguel, J.: GHG emissions of all world countries: 2023, Publications Office of the European Union, JRC134504, https://doi.org/10.2760/953322, 2023.
Dai, M., Zhao, Y., Chai, F., Chen, M., Chen, N., Chen, Y., Cheng, D., Gan, J., Guan, D., Hong, Y., Huang, J., Lee, Y., Leung, K. M. Y., Lim, P. E., Lin, S., Lin, X., Liu, X., Liu, Z., Luo, Y.-W., Meng, F., Sangmanee, C., Shen, Y., Uthaipan, K., Talaat, W. I. A. W., Wan, X. S., Wang, C., Wang, D., Wang, G., Wang, S., Wang, Y., Wang, Y., Wang, Z., Wang, Z., Xu, Y., Yang, J.-Y. T., Yang, Y., Yasuhara, M., Yu, D., Yu, J., Yu, L., Zhang, Z., and Zhang, Z.: Persistent eutrophication and hypoxia in the coastal ocean, Camb. Prisms Coast. Futur., 1, e19, https://doi.org/10.1017/cft.2023.7, 2023.
Demay, J., Ringeval, B., Pellerin, S., and Nesme, T.: Half of global agricultural soil phosphorus fertility derived from anthropogenic sources, Nat. Geosci., 16, 69–74, https://doi.org/10.1038/s41561-022-01092-0, 2023.
Du, Z., Yu, L., Zhao, Y., Li, X., Liu, X., Li, X., Hao, P., Chen, Z., Guo, Z., You, L., Ma, X., and Wang, H.: Annual global grided livestock mapping from 1961 to 2021, Earth Syst. Sci. Data, 17, 5543–5556, https://doi.org/10.5194/essd-17-5543-2025, 2025.
Einarsson, R., Sanz-Cobena, A., Aguilera, E., Billen, G., Garnier, J., van Grinsven, H. J. M., and Lassaletta, L.: Crop production and nitrogen use in European cropland and grassland 1961–2019, Sci. Data, 8, 288, https://doi.org/10.1038/s41597-021-01061-z, 2021.
Elser, J. and Bennett, E.: A broken biogeochemical cycle, Nature, 478, 29–31, https://doi.org/10.1038/478029a, 2011.
FAO: Cropland nutrient balance – Global, regional and country trends, 1961–2022, 95, FAO, Rome, https://openknowledge.fao.org/handle/20.500.14283/cd3164en (last access: 12 August 2025), 2024.
FAO and IIASA: Harmonized World Soil Database Version 2.0, Rome, Laxenburg, https://www.fao.org/soils-portal/data-hub/soil-maps-and-databases/harmonized-world-soil-database-v20/en/ (last access: 12 May 2024), 2023.
FAOSTAT – Food and Agriculture Organization Corporate Statistical Database: FAO online database, http://www.fao.org/faostat/ en/#data (last access: April 2024), 2024.
Feng, X., Lin, H., Fu, T.-M., Sulprizio, M. P., Zhuang, J., Jacob, D. J., Tian, H., Ma, Y., Zhang, L., Wang, X., Chen, Q., and Han, Z.: WRF-GC (v2.0): online two-way coupling of WRF (v3.9.1.1) and GEOS-Chem (v12.7.2) for modeling regional atmospheric chemistry–meteorology interactions, Geosci. Model Dev., 14, 3741–3768, https://doi.org/10.5194/gmd-14-3741-2021, 2021.
Fick, S. E. and Hijmans, R. J.: WorldClim 2: new 1‐km spatial resolution climate surfaces for global land areas, Int. J. Climatol., 37, 4302–4315, https://doi.org/10.1002/joc.5086, 2017.
Fink, G., Alcamo, J., Flörke, M., and Reder, K.: Phosphorus Loadings to the World's Largest Lakes: Sources and Trends, Global Biogeochem. Cy., 32, 617–634, https://doi.org/10.1002/2017GB005858, 2018.
Ge, C., Wang, J., Carn, S., Yang, K., Ginoux, P., and Krotkov, N.: Satellite-based global volcanic SO2 emissions and sulfate direct radiative forcing during 2005–2012, J. Geophys. Res.-Atmos., 121, 3446–3464, https://doi.org/10.1002/2015JD023134, 2016.
Gilbert, M., Nicolas, G., Cinardi, G., Van Boeckel, T. P., Vanwambeke, S. O., Wint, G. R. W., and Robinson, T. P.: Global distribution data for cattle, buffaloes, horses, sheep, goats, pigs, chickens and ducks in 2010, Sci. Data, 5, 180227, https://doi.org/10.1038/sdata.2018.227, 2018.
Hurtt, G. C., Chini, L., Sahajpal, R., Frolking, S., Bodirsky, B. L., Calvin, K., Doelman, J. C., Fisk, J., Fujimori, S., Klein Goldewijk, K., Hasegawa, T., Havlik, P., Heinimann, A., Humpenöder, F., Jungclaus, J., Kaplan, J. O., Kennedy, J., Krisztin, T., Lawrence, D., Lawrence, P., Ma, L., Mertz, O., Pongratz, J., Popp, A., Poulter, B., Riahi, K., Shevliakova, E., Stehfest, E., Thornton, P., Tubiello, F. N., van Vuuren, D. P., and Zhang, X.: Harmonization of global land use change and management for the period 850–2100 (LUH2) for CMIP6, Geosci. Model Dev., 13, 5425–5464, https://doi.org/10.5194/gmd-13-5425-2020, 2020.
Klein Goldewijk, K., Beusen, A., Doelman, J., and Stehfest, E.: Anthropogenic land use estimates for the Holocene – HYDE 3.2, Earth Syst. Sci. Data, 9, 927–953, https://doi.org/10.5194/essd-9-927-2017, 2017.
Lassaletta, L., Billen, G., Grizzetti, B., Anglade, J., and Garnier, J.: 50 year trends in nitrogen use efficiency of world cropping systems: the relationship between yield and nitrogen input to cropland, Environ. Res. Lett., 9, 105011, https://doi.org/10.1088/1748-9326/9/10/105011, 2014.
Li, X., Yu, L., Du, Z., and Liu, X.: Crop Statistic to Annual Map: Tracking spatiotemporal dynamics of crop-specific areas through machine learning and statistics disaggregating, Sci. Data, 12, 1249, https://doi.org/10.1038/s41597-025-05572-x, 2025.
Lu, C. and Tian, H.: Global nitrogen and phosphorus fertilizer use for agriculture production in the past half century: shifted hot spots and nutrient imbalance, Earth Syst. Sci. Data, 9, 181–192, https://doi.org/10.5194/essd-9-181-2017, 2017.
Ludemann, C. I., Wanner, N., Chivenge, P., Dobermann, A., Einarsson, R., Grassini, P., Gruere, A., Jackson, K., Lassaletta, L., Maggi, F., Obli-Laryea, G., van Ittersum, M. K., Vishwakarma, S., Zhang, X., and Tubiello, F. N.: A global FAOSTAT reference database of cropland nutrient budgets and nutrient use efficiency (1961–2020): nitrogen, phosphorus and potassium, Earth Syst. Sci. Data, 16, 525–541, https://doi.org/10.5194/essd-16-525-2024, 2024.
Lun, F., Liu, J., Ciais, P., Nesme, T., Chang, J., Wang, R., Goll, D., Sardans, J., Peñuelas, J., and Obersteiner, M.: Global and regional phosphorus budgets in agricultural systems and their implications for phosphorus-use efficiency, Earth Syst. Sci. Data, 10, 1–18, https://doi.org/10.5194/essd-10-1-2018, 2018.
Ma, J., Shi, H., Zhu, Y., Li, R., Wang, S., Lu, N., Yao, Y., Bian, Z., and Huang, K.: The Evolution of Global Surface Ammonia Concentrations during 2001–2019: Magnitudes, Patterns, and Drivers, Environ. Sci. Technol., 59, 5066–5079, https://doi.org/10.1021/acs.est.4c14020, 2025.
Malone, B. P., McBratney, A. B., Minasny, B., and Wheeler, I.: A general method for downscaling earth resource information, Comput. Geosci., 41, 119–125, https://doi.org/10.1016/j.cageo.2011.08.021, 2012.
Meng, J., Martin, R. V., Ginoux, P., Hammer, M., Sulprizio, M. P., Ridley, D. A., and van Donkelaar, A.: Grid-independent high-resolution dust emissions (v1.0) for chemical transport models: application to GEOS-Chem (12.5.0), Geosci. Model Dev., 14, 4249–4260, https://doi.org/10.5194/gmd-14-4249-2021, 2021.
Mueller, N. D., Gerber, J. S., Johnston, M., Ray, D. K., Ramankutty, N., and Foley, J. A.: Closing yield gaps through nutrient and water management, Nature, 490, 254–257, https://doi.org/10.1038/nature11420, 2012.
Muñoz-Sabater, J., Dutra, E., Agustí-Panareda, A., Albergel, C., Arduini, G., Balsamo, G., Boussetta, S., Choulga, M., Harrigan, S., Hersbach, H., Martens, B., Miralles, D. G., Piles, M., Rodríguez-Fernández, N. J., Zsoter, E., Buontempo, C., and Thépaut, J.-N.: ERA5-Land: a state-of-the-art global reanalysis dataset for land applications, Earth Syst. Sci. Data, 13, 4349–4383, https://doi.org/10.5194/essd-13-4349-2021, 2021.
Myriokefalitakis, S., Nenes, A., Baker, A. R., Mihalopoulos, N., and Kanakidou, M.: Bioavailable atmospheric phosphorous supply to the global ocean: a 3-D global modeling study, Biogeosciences, 13, 6519–6543, https://doi.org/10.5194/bg-13-6519-2016, 2016.
Nguyen, T. H., Tang, F. H. M., Conchedda, G., Casse, L., Obli-Laryea, G., Tubiello, F. N., and Maggi, F.: NPKGRIDS: a global georeferenced dataset of N, P2O5, and K2O fertilizer application rates for 173 crops, Sci. Data, 11, 1179, https://doi.org/10.1038/s41597-024-04030-4, 2024.
Randerson, J. T., Van Der Werf, G. R., Giglio, L., Collatz, G. J., and Kasibhatla, P. S.: Global Fire Emissions Database, Version 4.1 (GFEDv4), ORNL DAAC [data set], https://doi.org/10.3334/ORNLDAAC/1293, 2015.
Randles, C. A., da Silva, A. M., Buchard, V., Colarco, P. R., Darmenov, A., Govindaraju, R., Smirnov, A., Holben, B., Ferrare, R., Hair, J., Shinozuka, Y., and Flynn, C. J.: The MERRA-2 Aerosol Reanalysis, 1980 Onward. Part I: System Description and Data Assimilation Evaluation, J. Climate, 30, 6823–6850, https://doi.org/10.1175/JCLI-D-16-0609.1, 2017.
Ringeval, B., Augusto, L., Monod, H., van Apeldoorn, D., Bouwman, L., Yang, X., Achat, D. L., Chini, L. P., Van Oost, K., Guenet, B., Wang, R., Decharme, B., Nesme, T., and Pellerin, S.: Phosphorus in agricultural soils: drivers of its distribution at the global scale, Global Change Biol., 23, 3418–3432, https://doi.org/10.1111/gcb.13618, 2017.
Ringeval, B., Demay, J., Goll, D. S., He, X., Wang, Y.-P., Hou, E., Matej, S., Erb, K.-H., Wang, R., Augusto, L., Lun, F., Nesme, T., Borrelli, P., Helfenstein, J., McDowell, R. W., Pletnyakov, P., and Pellerin, S.: A global dataset on phosphorus in agricultural soils, Sci. Data, 11, 17, https://doi.org/10.1038/s41597-023-02751-6, 2024.
Roudier, P., Malone, B. P., Hedley, C. B., Minasny, B., and McBratney, A. B.: Comparison of regression methods for spatial downscaling of soil organic carbon stocks maps, Comput. Electron. Agric., 142, 91–100, https://doi.org/10.1016/j.compag.2017.08.021, 2017.
Sattari, S. Z., Bouwman, A. F., Giller, K. E., and van Ittersum, M. K.: Residual soil phosphorus as the missing piece in the global phosphorus crisis puzzle, P. Natl. Acad. Sci. USA, 109, 6348–6353, https://doi.org/10.1073/pnas.1113675109, 2012.
Sattari, S. Z., Bouwman, A. F., Martinez Rodríguez, R., Beusen, A. H. W., and van Ittersum, M. K.: Negative global phosphorus budgets challenge sustainable intensification of grasslands, Nat. Commun., 7, 10696, https://doi.org/10.1038/ncomms10696, 2016.
Stackpoole, S. M., Stets, E. G., and Sprague, L. A.: Variable impacts of contemporary versus legacy agricultural phosphorus on US river water quality, P. Natl. Acad. Sci. USA, 116, 20562–20567, https://doi.org/10.1073/pnas.1903226116, 2019.
Steffen, W., Richardson, K., Rockstrom, J., Cornell, S. E., Fetzer, I., Bennett, E. M., Biggs, R., Carpenter, S. R., de Vries, W., de Wit, C. A., Folke, C., Gerten, D., Heinke, J., Mace, G. M., Persson, L. M., Ramanathan, V., Reyers, B., and Sorlin, S.: Planetary boundaries: Guiding human development on a changing planet, Science, 347, 1259855, https://doi.org/10.1126/science.1259855, 2015.
Tian, H., Chen, G., Zhang, C., Melillo, J. M., and Hall, C. A. S.: Pattern and variation of C : N : P ratios in China's soils: a synthesis of observational data, Biogeochemistry, 98, 139–151, https://doi.org/10.1007/s10533-009-9382-0, 2010.
Tian, H., Bian, Z., Shi, H., Qin, X., Pan, N., Lu, C., Pan, S., Tubiello, F. N., Chang, J., Conchedda, G., Liu, J., Mueller, N., Nishina, K., Xu, R., Yang, J., You, L., and Zhang, B.: History of anthropogenic Nitrogen inputs (HaNi) to the terrestrial biosphere: a 5 arcmin resolution annual dataset from 1860 to 2019, Earth Syst. Sci. Data, 14, 4551–4568, https://doi.org/10.5194/essd-14-4551-2022, 2022.
Tian, H., Pan, N., Thompson, R. L., Canadell, J. G., Suntharalingam, P., Regnier, P., Davidson, E. A., Prather, M., Ciais, P., Muntean, M., Pan, S., Winiwarter, W., Zaehle, S., Zhou, F., Jackson, R. B., Bange, H. W., Berthet, S., Bian, Z., Bianchi, D., Bouwman, A. F., Buitenhuis, E. T., Dutton, G., Hu, M., Ito, A., Jain, A. K., Jeltsch-Thömmes, A., Joos, F., Kou-Giesbrecht, S., Krummel, P. B., Lan, X., Landolfi, A., Lauerwald, R., Li, Y., Lu, C., Maavara, T., Manizza, M., Millet, D. B., Mühle, J., Patra, P. K., Peters, G. P., Qin, X., Raymond, P., Resplandy, L., Rosentreter, J. A., Shi, H., Sun, Q., Tonina, D., Tubiello, F. N., van der Werf, G. R., Vuichard, N., Wang, J., Wells, K. C., Western, L. M., Wilson, C., Yang, J., Yao, Y., You, Y., and Zhu, Q.: Global nitrous oxide budget (1980–2020), Earth Syst. Sci. Data, 16, 2543–2604, https://doi.org/10.5194/essd-16-2543-2024, 2024.
Tubiello, F. N., Conchedda, G., Wanner, N., Federici, S., Rossi, S., and Grassi, G.: Carbon emissions and removals from forests: new estimates, 1990–2020, Earth Syst. Sci. Data, 13, 1681–1691, https://doi.org/10.5194/essd-13-1681-2021, 2021.
Weng, H., Lin, J., Martin, R., Millet, D. B., Jaeglé, L., Ridley, D., Keller, C., Li, C., Du, M., and Meng, J.: Global high-resolution emissions of soil NOx, sea salt aerosols, and biogenic volatile organic compounds, Sci. Data, 7, 148, https://doi.org/10.1038/s41597-020-0488-5, 2020.
Xu, R., Pan, S. F., Chen, J., Chen, G. S., Yang, J., Dangal, S. R. S., Shepard, J. P., and Tian, H. Q.: Half‐century ammonia emissions from agricultural systems in Southern Asia: Magnitude, spatiotemporal patterns, and implications for human health, GeoHealth, 2, 40–53, 2018.
You, S., Ma, J., Zheng, H., Liu, X., Tian, H., Wu, Y., Zaehle, S., Wang, Y., Shi, H., Li, R., and Shi, H.: Human Activities Dominate Global Trends in Terrestrial Phosphorus Deposition, Environ. Sci. Technol., 60, 10850–10860, https://doi.org/10.1021/acs.est.5c16208, 2026.
Yu, Q., You, L., Wood-Sichra, U., Ru, Y., Joglekar, A. K. B., Fritz, S., Xiong, W., Lu, M., Wu, W., and Yang, P.: A cultivated planet in 2010 – Part 2: The global gridded agricultural-production maps, Earth Syst. Sci. Data, 12, 3545–3572, https://doi.org/10.5194/essd-12-3545-2020, 2020.
Yuan, Z., Jiang, S., Sheng, H., Liu, X., Hua, H., Liu, X., and Zhang, Y.: Human Perturbation of the Global Phosphorus Cycle: Changes and Consequences, Environ. Sci. Technol., 52, 2438–2450, https://doi.org/10.1021/acs.est.7b03910, 2018.
Zhang, B., Tian, H., Lu, C., Dangal, S. R. S., Yang, J., and Pan, S.: Global manure nitrogen production and application in cropland during 1860–2014: a 5 arcmin gridded global dataset for Earth system modeling, Earth Syst. Sci. Data, 9, 667–678, https://doi.org/10.5194/essd-9-667-2017, 2017a.
Zhang, C., Tian, H., Liu, J., Wang, S., Liu, M., Pan, S., and Shi, X.: Pools and distributions of soil phosphorus in China, Global Biogeochem. Cy., 19, https://doi.org/10.1029/2004GB002296, 2005.
Zhang, J., Beusen, A. H. W., Van Apeldoorn, D. F., Mogollón, J. M., Yu, C., and Bouwman, A. F.: Spatiotemporal dynamics of soil phosphorus and crop uptake in global cropland during the 20th century, Biogeosciences, 14, 2055–2068, https://doi.org/10.5194/bg-14-2055-2017, 2017b.
Zou, T., Zhang, X., and Davidson, E. A.: Global trends of cropland phosphorus use and sustainability challenges, Nature, 611, 81–87, https://doi.org/10.1038/s41586-022-05220-z, 2022.