the Creative Commons Attribution 4.0 License.
the Creative Commons Attribution 4.0 License.
 | 18 Oct 2022
History of anthropogenic Nitrogen inputs (HaNi) to the terrestrial biosphere: a 5 arcmin resolution annual dataset from 1860 to 2019
Hanqin Tian
Xiaoyu Qin
Naiqing Pan
Chaoqun Lu
Shufen Pan
Francesco N. Tubiello
Jinfeng Chang
Giulia Conchedda
Junguo Liu
Nathaniel Mueller
Kazuya Nishina
Rongting Xu
Jia Yang
Liangzhi You
Bowen Zhang
Excessive anthropogenic nitrogen (N) inputs to the biosphere have disrupted the global nitrogen cycle. To better quantify the spatial and temporal patterns of anthropogenic N inputs, assess their impacts on the biogeochemical cycles of the planet and the living organisms, and improve nitrogen use efficiency (NUE) for sustainable development, we have developed a comprehensive and synthetic dataset for reconstructing the History of anthropogenic Nitrogen inputs (HaNi) to the terrestrial biosphere. The HaNi dataset takes advantage of different data sources in a spatiotemporally consistent way to generate a set of high-resolution gridded N input products from the preindustrial period to the present (1860–2019). The HaNi dataset includes annual rates of synthetic N fertilizer, manure application/deposition, and atmospheric N deposition on cropland, pasture, and rangeland at a spatial resolution of 5 arcmin × 5 arcmin. Specifically, the N inputs are categorized, according to the N forms and land uses, into 10 types: (1) -N fertilizer applied to cropland, (2) NO-N fertilizer applied to cropland, (3) -N fertilizer applied to pasture, (4) NO-N fertilizer applied to pasture, (5) manure N application on cropland, (6) manure N application on pasture, (7) manure N deposition on pasture, (8) manure N deposition on rangeland, (9) NHx-N deposition, and (10) NOy-N deposition. The total anthropogenic N (TN) inputs to global terrestrial ecosystems increased from 29.05 Tg N yr−1 in the 1860s to 267.23 Tg N yr−1 in the 2010s, with the dominant N source changing from atmospheric N deposition (before the 1900s) to manure N (in the 1910s–2000s) and then to synthetic fertilizer in the 2010s. The proportion of synthetic -N in fertilizer input increased from 64 % in the 1960s to 90 % in the 2010s, while synthetic NO-N fertilizer decreased from 36 % in the 1960s to 10 % in the 2010s. Hotspots of TN inputs shifted from Europe and North America to East and South Asia during the 1960s–2010s. Such spatial and temporal dynamics captured by the HaNi dataset are expected to facilitate a comprehensive assessment of the coupled human–Earth system and address a variety of social welfare issues, such as the climate–biosphere feedback, air pollution, water quality, and biodiversity. The data are available at https://doi.org/10.1594/PANGAEA.942069 (Tian et al., 2022).
- Article
(10640 KB) - Full-text XML
-
Supplement
(873 KB) - BibTeX
- EndNote


Nitrogen (N) is an essential element for the survival of all living organisms as is required by various biological molecules, for instance nucleic acids, proteins, and chlorophyll (Galloway et al., 2021; Schlesinger and Bernhardt, 2013). Most N on the Earth is not readily available for organisms, as it either exists in the form of inert N2 gas or is stored in crust and sediments (Ward, 2012). Driven by the human demand for food and energy, a spectrum of approaches has been developed to produce biologically available N (Sutton et al., 2013; Lassaletta et al., 2016), ranging from traditional methods, such as legume crop cultivation and manure application, to modern techniques, such as industrial compost and the Haber–Bosch process that produce organic fertilizer mixture and chemical fertilizer, respectively. Increasing anthropogenic N inputs have significantly boosted crop yield and improved food security (Stewart and Roberts, 2012); however, this N enhancement has also resulted in an over 2-fold increase in terrestrial reactive N (Galloway and Cowling, 2002; Fowler et al., 2013; Melillo, 2021), and these inputs are expected to continually increase in the coming decades due to human demand for food (Kanter et al., 2020; Sutton et al., 2021).
The large amount of excessive reactive N in terrestrial ecosystems has led to multiple environmental issues, like water quality deterioration, air pollution, global warming, and biodiversity loss (Bouwman et al., 2005; Gruber and Galloway, 2008; Howarth, 2008; Pan et al., 2021; Tian et al., 2020a; Vitousek et al., 1997). The river export of various forms of nitrogen (e.g., ammonium, nitrate, and dissolved organic N) has largely increased (Schlesinger et al., 2006; Tian et al., 2020b), frequently causing large-scale hypoxia along coastal oceans – for example, in the northern Gulf of Mexico (Bargu et al., 2019; Dodds, 2006; Rabalais and Turner, 2019). The global emission of ammonia (NH3), a major precursor of aerosols contributing to air pollution, rapidly increased from 1.0 Tg N yr−1 in 1961 to 9.9 Tg yr−1 in 2010, mainly due to the wide use of N fertilizer (Xu et al., 2019a). The emissions of nitrous oxide (N2O), the third most important greenhouse gas, has increased by 30 % over the past 4 decades, which has mainly been attributed to N addition to croplands (Cui et al., 2021; Tian et al., 2020a; Wang et al., 2020). Moreover, the excessive usage of N over other nutrients (e.g., phosphorus) creates a nutrient imbalance that may induce significant alterations in the structure and function of ecosystems, resulting in losses of biodiversity (Galloway et al., 2003; Lun et al., 2018; Peñuelas and Sardans, 2022; Houlton et al., 2019).
In light of the critical impacts of N excess on the human–Earth system, numerous efforts have been conducted to generate distribution maps of N inputs for different sectors with varied temporal coverage and spatial resolution (Potter et al., 2010; Nishina et al., 2017; Bian et al., 2021; Liu et al., 2010). Country-level N fertilizer data from the Food and Agriculture Organization (FAO) of the United Nations and the International Fertilizer Association (IFA) have been widely used to assess global and national nitrogen budgets for crop production (Xiong et al., 2008; X. Zhang et al., 2021; Eickhout et al., 2006). However, spatial variations in N inputs within countries have been overlooked in country-level data, and detailed geospatial distributions of N inputs are required for many process-based modeling studies (Tian et al., 2019, 2018). Potter et al. (2010) and Mueller et al. (2012) both generated crop-specific spatially explicit N fertilizer data that represented the average fertilizer application patterns around 2000. Liu et al. (2010) developed an N balance model, and they made the first attempt to quantify six N inputs (e.g., mineral fertilizer, manure, atmospheric deposition, biological fixation, input from sedimentation, and input from recycled crop residue) and five N outputs (e.g., output to harvested crops, crop residues, leaching, gaseous losses, and soil erosion) on cropland for the year 2000 with a spatial resolution of 5 arcmin. Lu and Tian (2017) created an annual dataset of global N fertilizer application on cropland at a spatial resolution during the period from 1961 to 2013, and Nishina et al. (2017) further split synthetic N fertilizer application into and forms. Meanwhile, Zhang et al. (2017) reconstructed global manure N production and application rates on cropland, covering the period from 1860 to 2014 with a 5 arcmin resolution; using a similar methodology, Xu et al. (2019b) further developed three gridded datasets, i.e., rangeland manure deposition, pasture manure deposition, and pasture manure application, all of which had a resolution and spanned from 1860 to 2016. Although these datasets are valuable in addressing their respective objective issues, there is a barrier in taking advantage of them simultaneously due to the inconsistent temporal coverage, spatial resolution, data sources (e.g., N inputs statistics and land use), and spatial allocation algorithms. Therefore, the reconstruction for the History of anthropogenic Nitrogen inputs (HaNi) to the terrestrial biosphere dataset, with its rich spatial detail and long-term coverage, is essentially needed.
To address this issue, using sophisticated methodologies, we employed multiple statistical data, empirical estimates, atmospheric chemistry model outputs (Eyring et al., 2013), and high-resolution land use products to generate the HaNi dataset. This comprehensive dataset consists of N fertilizer/manure application to cropland, manure application/deposition to pasture, manure deposition to rangeland, and atmospheric N deposition on all agricultural land at a resolution of 5 arcmin for the period from 1860 to 2019. Additionally, we tried to investigate the impacts of social–economic forcing on N use across different regions. These efforts are anticipated to benefit understanding the spatial and temporal patterns of human-induced N enrichment, assessing impacts of excessive N on global and regional biogeochemical cycles, and providing data support for resource management. The HaNi dataset is also expected to serve as input data for Earth system models, biogeochemical models, and hydrological models in order to improve our understanding and assessment of the global consequences of anthropogenic nitrogen enrichment for climate change, air and water quality, ecosystems, and biodiversity (e.g., Tian et al., 2018).
2.1 Data sources of fertilizer/manure use
Multiple anthropogenic N input databases were integrated to generate the HaNi dataset (Table 1). For the period from 1961 to 2019, annual country-level statistics data were obtained from the FAOSTAT “Land, Inputs and Sustainability” domain (FAO, 2021); “N fertilizer applied to soil” data were obtained from the “Fertilizers by Nutrient” subsection; and “Manure applied to soil” and “Manure left on pasture” data were obtained from the “Livestock Manure” subsection. Before 1961, the time series of fertilizer and manure use from Holland et al. (2005) was adopted and corrected to be consistent with the FAO statistics. For countries (e.g., the former Soviet Union, the Socialist Federal Republic of Yugoslavia, Eritrea, Ethiopia, and the Czechoslovak Republic) that experienced political disintegration, we partitioned their pre-disintegration N fertilizer/manure use into each individual newly formed country using the ratios derived from the N uses of the newly formed countries in the first year after disintegration.
The FAOSTAT agricultural use of N fertilizer and manure referred to the N use for crops, livestock, forestry, fisheries, and aquaculture, excluding N use for animal feed. As the use of N fertilizers and manure for forestry, fisheries, and aquaculture was minor compared with that for crops and livestock, the former was assumed to be negligible. The partitioning ratio of N fertilizer application to cropland and pasture was adopted from Lassaletta et al. (2014). As the Lassaletta et al. (2014) ratio values only covered the period from 1961 to 2009, values in 2009 were used to calculate the N application partitioning after 2009. According to the FAO definition, manure applied to soil was equal to the difference between all treated manure and N loss during the storage and treatment processes. Therefore, we assumed that the total quantity of manure applied to soil was equal to the total quantity of manure applied to cropland and pasture. The fraction values for cropland were from Zhang et al. (2015), who assumed that the fraction value ranged between 0.5 and 0.87 for European countries, Canada, and the USA, whereas it was 0.9 for other countries.

2.2 Land use data
The HYDE3.2 dataset (Klein Goldewijk et al., 2017) provides historical spatial distributions of cropland, pasture, and rangeland at a 5 arcmin resolution and at an annual time step after 2000 but a decadal time step before the 1990s. In contrast, the LUH2 dataset (Hurtt et al., 2020), derived mainly from HYDE3.2, has an annual time step from 1860 to 2019 but at a relatively low spatial resolution of . To reconcile these two datasets, we first conducted a linear interpolation to HYDE3.2 before 1999 using the data from every 2 neighboring decades. Then the fraction of crop, pasture, or rangeland of a LUH2 grid was partitioned into all grid cells of HYDE3.2 that fell in the LUH2 grid, according to their shares in HYDE3.2. Using this routine, we obtained a land use dataset that both kept the spatial information of HYDE3.2 and was consistent with LUH2 with respect to the total area for each land use type.
2.3 Spatializing N fertilizer and manure application on cropland
The workflow of spatializing the country-level N fertilizer and manure use amount to gridded maps is shown in Fig. 1. First, the grid-level crop-specific N fertilizer and manure use rates per cropland area of 17 dominant crop types (wheat, maize, rice, barley, millet, sorghum, soybean, sunflower, potato, cassava, sugarcane, sugar beet, oil palm, rapeseed, groundnut, cotton, and rye), which were developed by Mueller et al. (2012) and West et al. (2014), were combined with the crop-specific harvested area (Monfreda et al., 2008) to generate baseline distribution maps circa 2000 of fertilizer and manure application on cropland. The crop-area-based average N fertilizer and manure rates in each grid cell (at a resolution of 5 arcmin) were calculated as follows:
where is the area-weighted average of N fertilizer or manure application rates (i.e., gridded baseline fertilizer or manure application rate in grams of nitrogen per square meter of cropland per year, g N m−2 cropland yr−1). and AHi are the crop-specific N fertilizer or manure application rate (g N m−2) and harvested area (m2), respectively, for crop type i.
Second, we used the annual country-level N fertilizer and manure application amounts from the FAO (1961–2019) and the annual cropland area to scale the baseline year 2000 maps of N fertilizer and manure application rates across time using the following equation:
where is the regulation ratio (unitless) in year y and country j, is the country-level total N fertilizer or manure use amount (g N yr−1) on cropland derived from FAOSTAT, and ACy,g is the area of cropland (m2) derived from the historical land use data in year y and grid g. The actual N fertilizer and manure application rates were then calculated using the following equation:
where is the “real” gridded N fertilizer or manure use rates (g N m−2 cropland yr−1) in year y.
We then extended the fertilizer data back to 1925 and the manure data back to 1860 using the global N flux change rates (Holland et al., 2005). As the industrial production of synthetic fertilizer was developed in the early 1910s, we further extend fertilizer data back by assuming that the fertilizer production linearly increased from 1910 to 1925. Finally, N fertilizer application on cropland was further divided into the form and the form based on the annual country-level application ratio in total N fertilizer provided by Nishina et al. (2017). These data were estimated based on the FAOSTAT consumption data by chemical fertilizer type, which considers the and content in each fertilizer type individually.
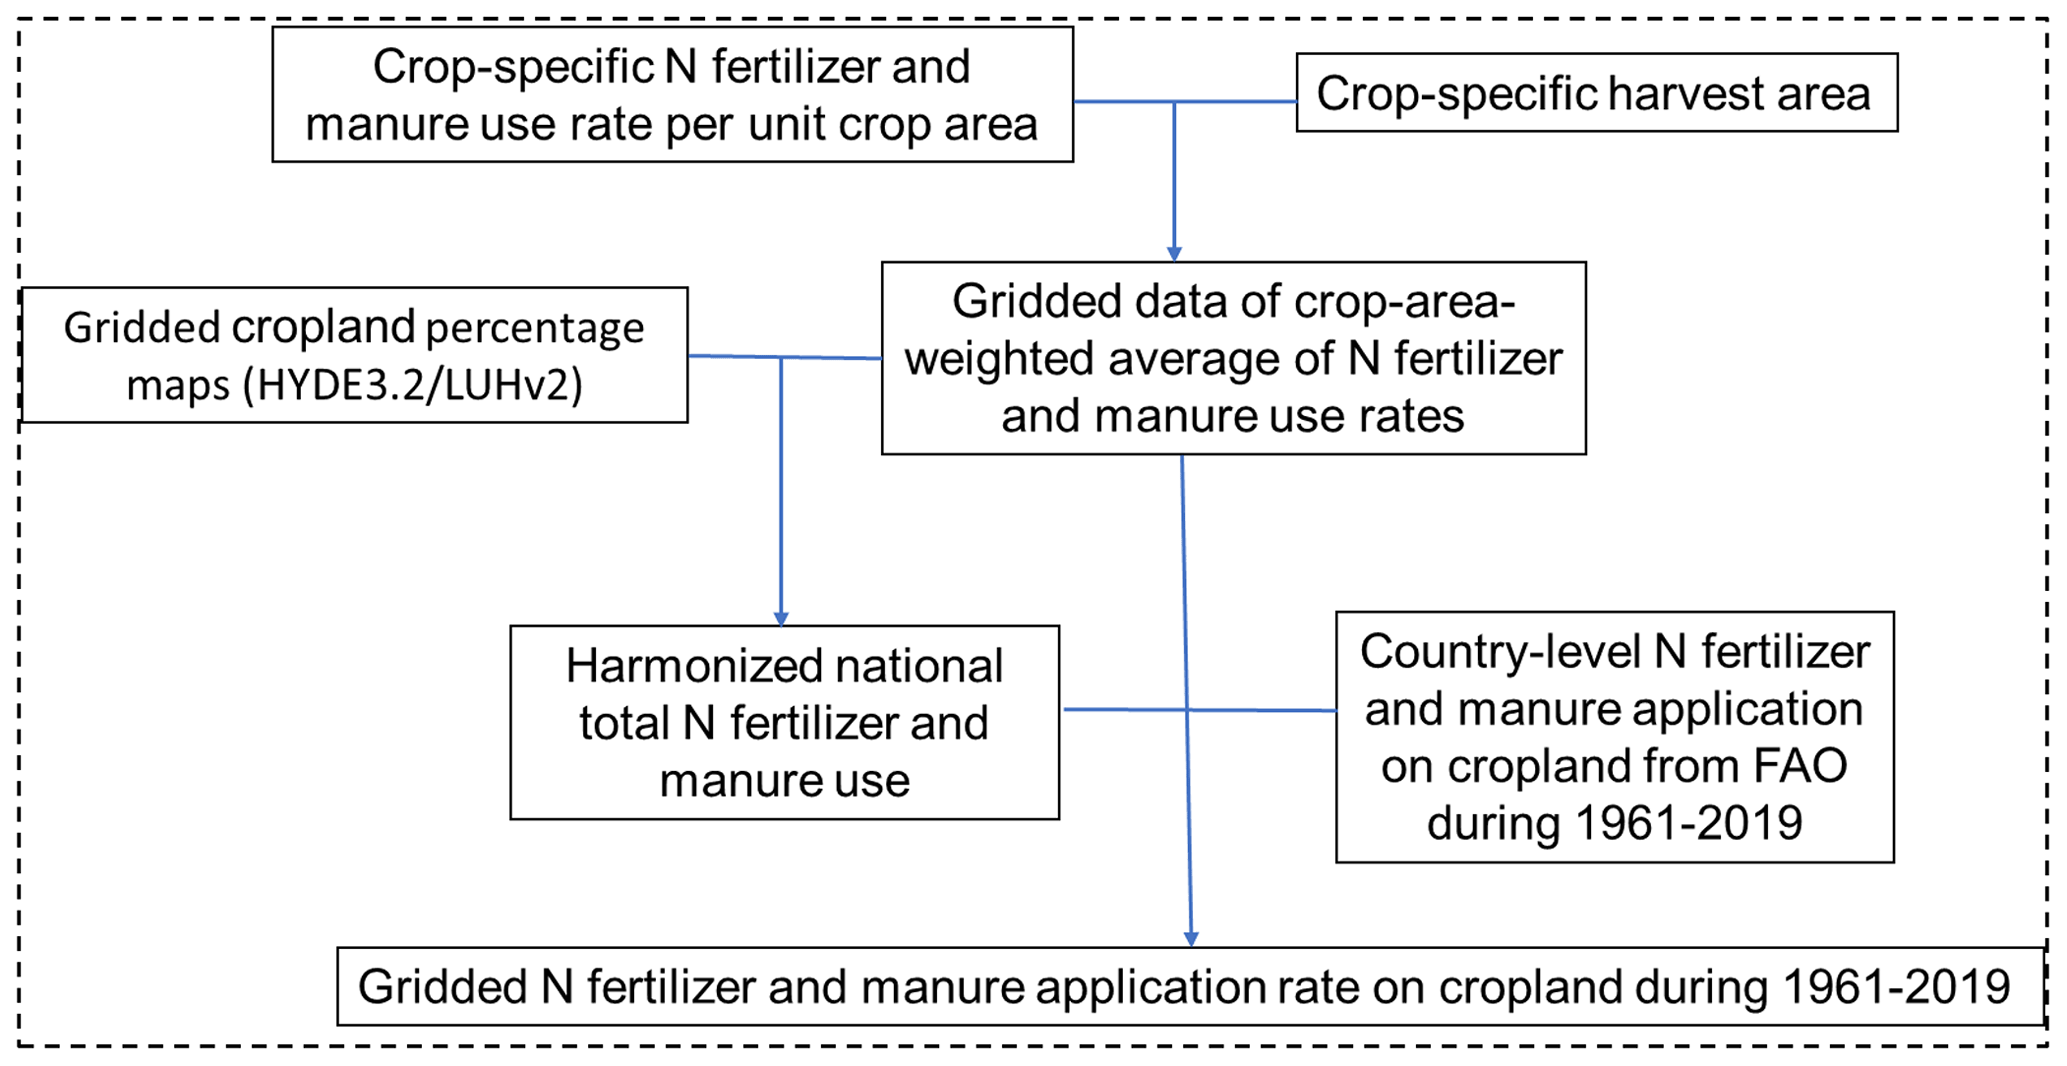
Figure 1The workflow for developing the dataset of global annual N fertilizer and manure application rates for the period from 1961 to 2019.
2.4 Spatializing the total fertilizer and manure N in pasture and rangeland
2.4.1 N fertilizer use in pasture
Due to the lack of grid-level spatial information on N fertilizer use in pasture, we assumed that pasture within each country has an even annual N fertilizer use rate. The fertilizer use in pasture per country was divided by the total pasture area of that country. This N fertilizer use rate per country was then assigned to all of the pasture grid cells in that country (Fig. 2). The detailed method was introduced in Xu et al. (2019b).
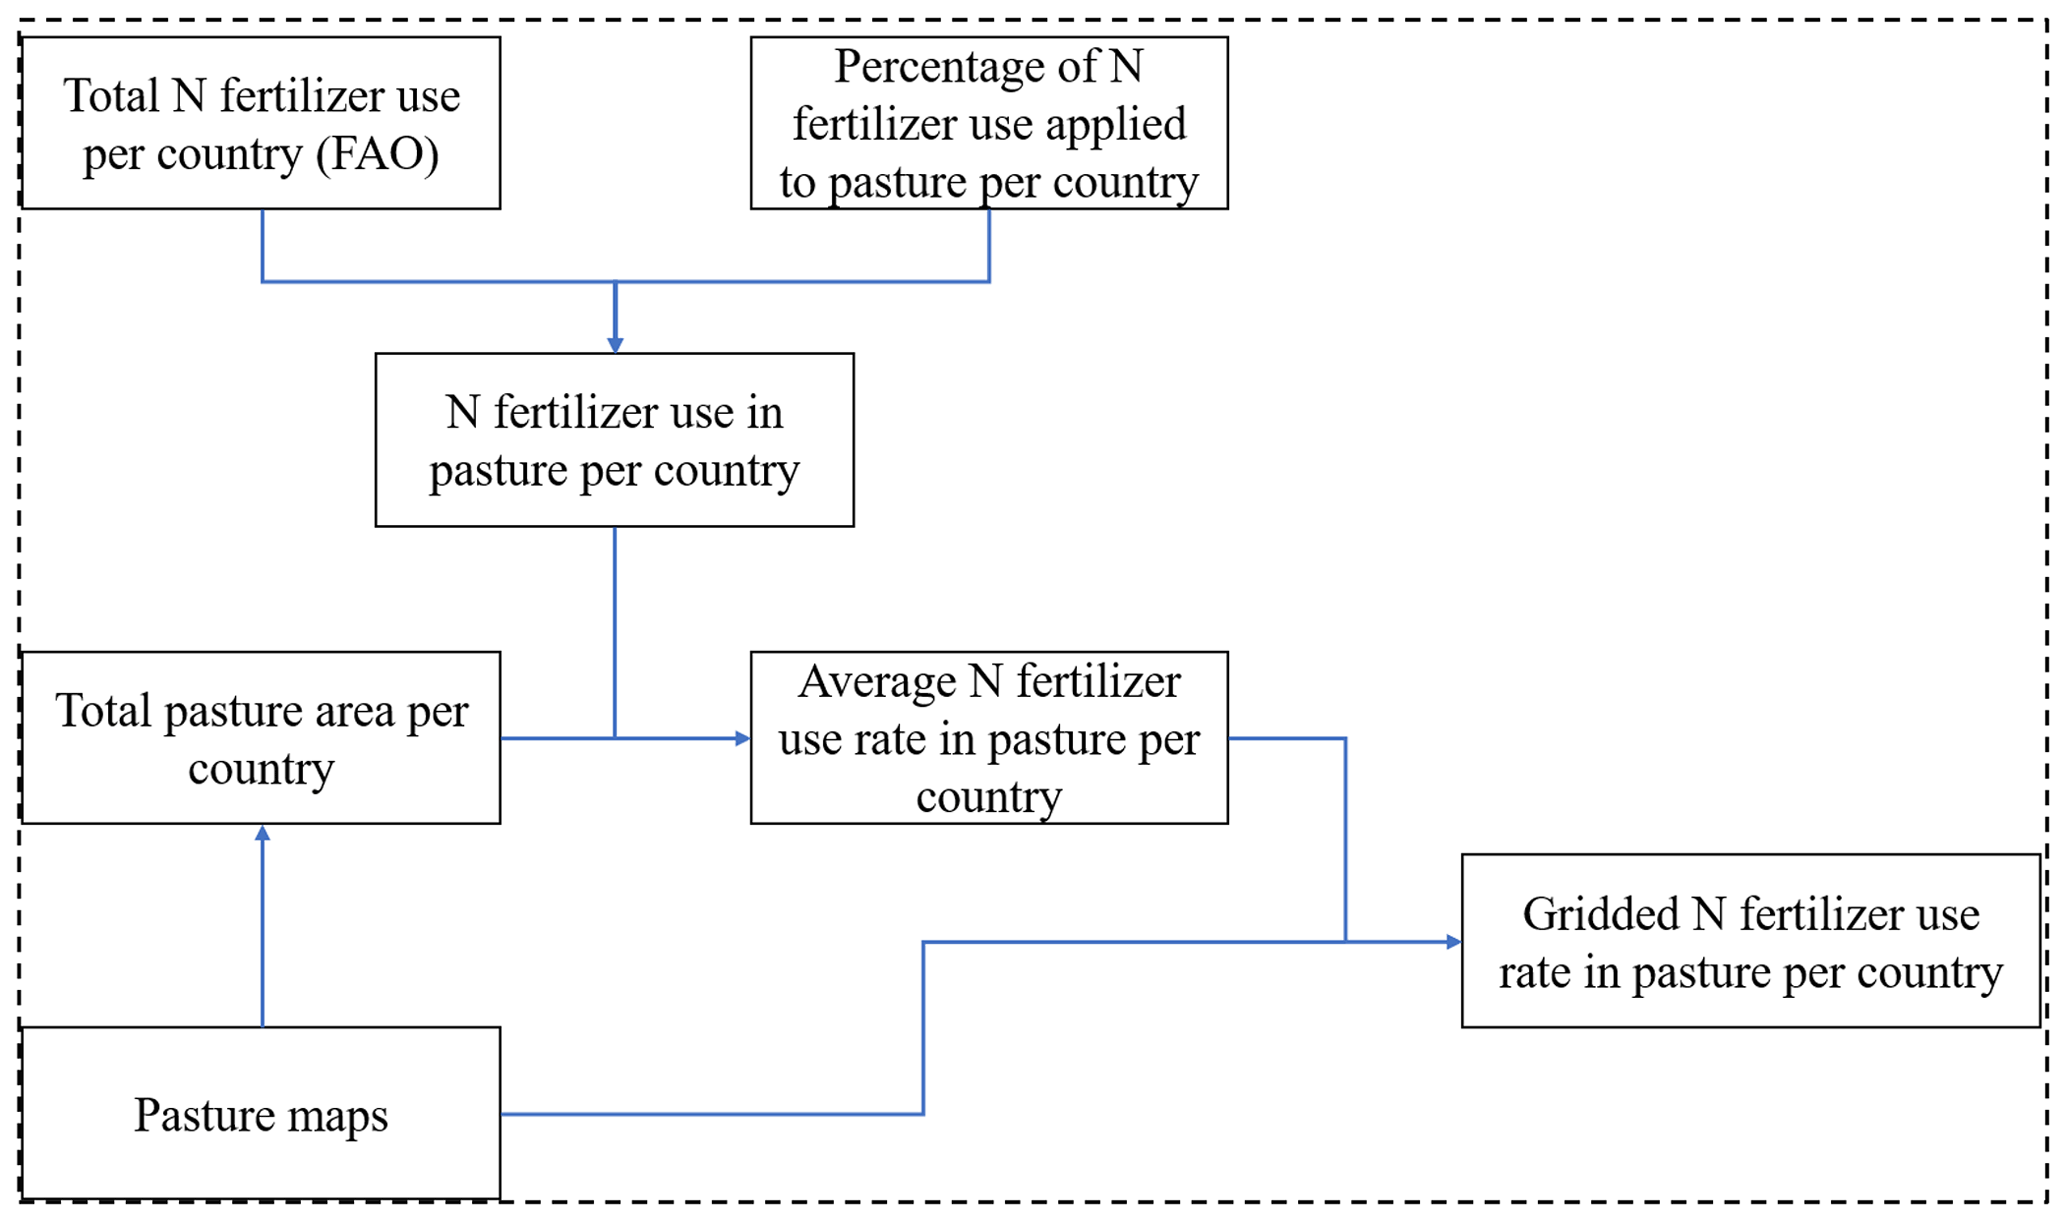
Figure 2The workflow for developing the global pasture fertilizer application rate data for the period from 1961 to 2019.
2.4.2 Spatializing manure application in pasture
To generate spatial patterns of manure application in pasture, we first calculated the spatial distribution of annual manure N production. The Global Livestock of the World 3 database (GLW3; Gilbert et al., 2018) was used as a reference map of livestock distribution, which provided spatial information on buffaloes, cattle, chickens, ducks, horses, goats, pigs, and sheep at a 0.083∘ spatial resolution for 2010. For the period from 1961 to 2019, the FAO statistics for the livestock population in a country in 1 year was compared with the sum of the GLW3 grid values within that country, and the ratio of the two values was used to scale all of the GLW3 grid values of the country to generate the spatial distribution of livestock in that year (Fig. 3). This routine can be represented as follows:
where indicates the FAO statistics of the population of the lth type of livestock in country c in year y, indicates the national population of the lth type of livestock in country c summarized from GLW3, is the spatial distribution corresponding to , and is the corresponding spatial distribution to . Applying the Intergovernmental Panel on Climate Change (IPCC) Tier 1 methodology for N excretion (Dong et al., 2006) to these derived spatial distribution maps of livestock, we can obtain the spatial maps of annual manure production during the period from 1961 to 2019. Specifically, the average daily N excretion rate was different for each livestock type and for each group of countries, which were classified by socioeconomic and geographic conditions. All manure production data were resampled to 5 arcmin to be consistent with the pasture land use data.
Manure application to pasture during the period from 1961 to 2019 is then estimated using manure production and pasture area (Fig. 3):
Here, is the ratio of the FAO statistics of manure application to pasture in country c in year y () over the estimated manure production in the same country and the same year, is the gridded manure production in country c in year y estimated based on the FAO statistics of livestock data, is the gridded pasture area in country c in year y from our land use data, and is the corresponding gridded manure application to pasture in country c in year y through masking the product raster of and by the raster. The manure application to pasture in year y during the period from 1860 to 1960 was estimated as the product of and (Fig. 3). As for the period from 1860 to 1960, the time series of manure application data were also generated according to the manure N change rates derived from Holland et al. (2005).
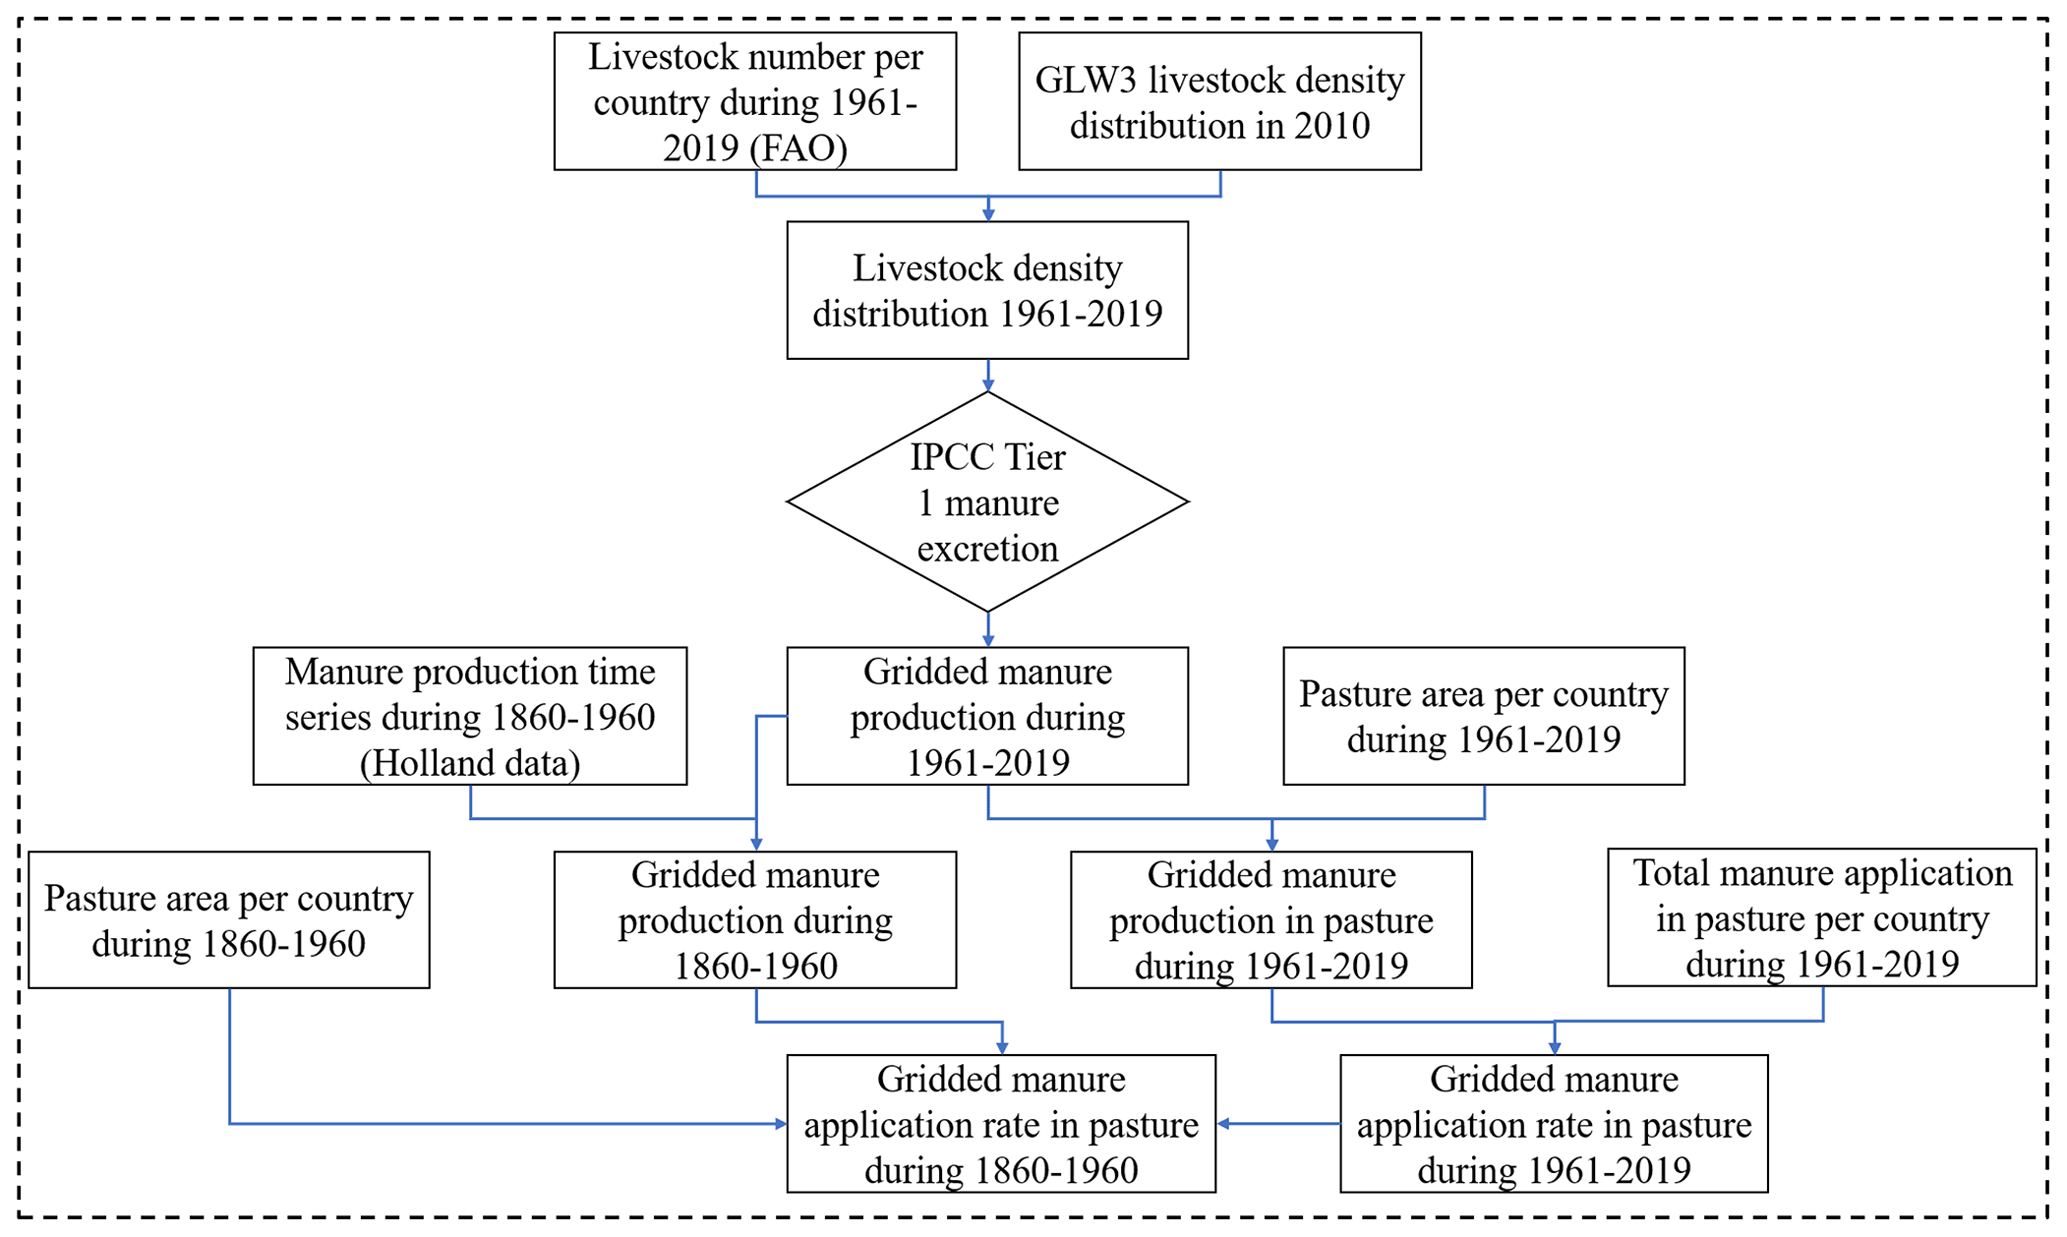
Figure 3The workflow for developing the global pasture manure application rate data for the period from 1860 to 2019.
2.4.3 Spatializing manure deposition in pasture and rangeland
The routine for spatializing the FAO statistics of manure deposition on pasture and rangeland was similar to the method for manure deposition to pasture in Xu et al. (2019b). The only difference is that the manure deposition intensity on pasture was assumed to be twice that on rangeland within a grid cell, according to previous research (Campbell and Stafford Smith, 2000). To avoid inconsistencies between total manure use and total manure production within a grid cell as well as unrealistic transport distances, the sum of manure application to cropland and pasture and manure deposition to pasture and rangeland was constrained to be less than or equal to manure production within a grid cell. In fact, cases in which the total manure use surpassed the total manure production in a grid cell were rare. If this did occur, the four components, namely the manure application to cropland and pasture and manure deposition to pasture or rangeland, were scaled by multiplying the ratio of their sum over the total manure production within a grid cell.
2.5 Atmospheric nitrogen deposition
Monthly atmospheric N depositions (NHx-N and NOy-N) during the period from 1850 to 2014 were obtained from the N deposition fields of model simulations in the International Global Atmospheric Chemistry (IGAC)/Stratospheric Processes and Their Role in Climate (SPARC) Chemistry–Climate Model Initiative (CCMI) (Morgenstern et al., 2017). For the period from 2015 to 2020, N deposition under SSP585 (the Shared Socioeconomic Pathway, SSP, scenario with the highest emissions) was used, consistent with dynamic global vegetation model simulations (TRENDY) for the global carbon budget (Friedlingstein et al., 2020). The CCMI models considered N emissions from multiple sources, including anthropogenic and biofuel sources, natural biogenic sources, biomass burning and lightning, and the transport of N gases and wet/dry N deposition (Eyring et al., 2013). The CCMI N deposition data were developed in support of Phase 6 of the Coupled Model Intercomparison Project (CMIP6) and used as the official products for CMIP6 models that lack interactive chemistry components. The nearest interpolation method was used to resample N deposition data to a spatial resolution of 5 arcmin.
2.6 Regional analysis
In order to compare anthropogenic N inputs across different regions, we divided the global land area into 18 regions according to national or continental boundaries (Tian et al., 2019): the USA (USA), Canada (CAN), Central America (CAM), northern South America (NSA), Brazil (BRA), southwestern South America (SSA), Europe (EU), Northern Africa (NAF), Equatorial Africa (EQAF), Southern Africa (SAF), Russia (RUS), Central Asia (CAS), the Middle East (MIDE), China (CHN), Korea and Japan (KAJ), South Asia (SAS), Southeast Asia (SEAS), and Oceania (OCE).
3.1 Temporal and spatial changes in total anthropogenic N inputs
The total anthropogenic N (TN) inputs to global terrestrial ecosystems increased from 29.05 Tg N yr−1 in the 1860s to 267.23 Tg N yr−1 in the 2010s (Fig. 4, Table 2). The most rapid increase in total N inputs was 3.53 Tg N yr−2 and occurred during the 1945–1990 period, driven by both elevated fertilizer application rates and cropland expansion. The TN inputs leveled off in the 1990s but increased again after 2001, although with a lower rate of increase. The TN inputs were dominated by atmospheric N deposition before the 1900s. Manure N maintained an increasing trend, accounting for more than half of the TN inputs from the 1910s to the 1960s. Thereafter, the proportion of N fertilizer in TN inputs substantially increased from 15 % in the 1960s to 39 % in the 2010s; meanwhile, the proportions of manure N and atmospheric N deposition decreased from 54 % and 31 % to 37 % and 24 %, respectively.
Table 2Decadal average N inputs to the terrestrial ecosystem (Tg N yr−1).
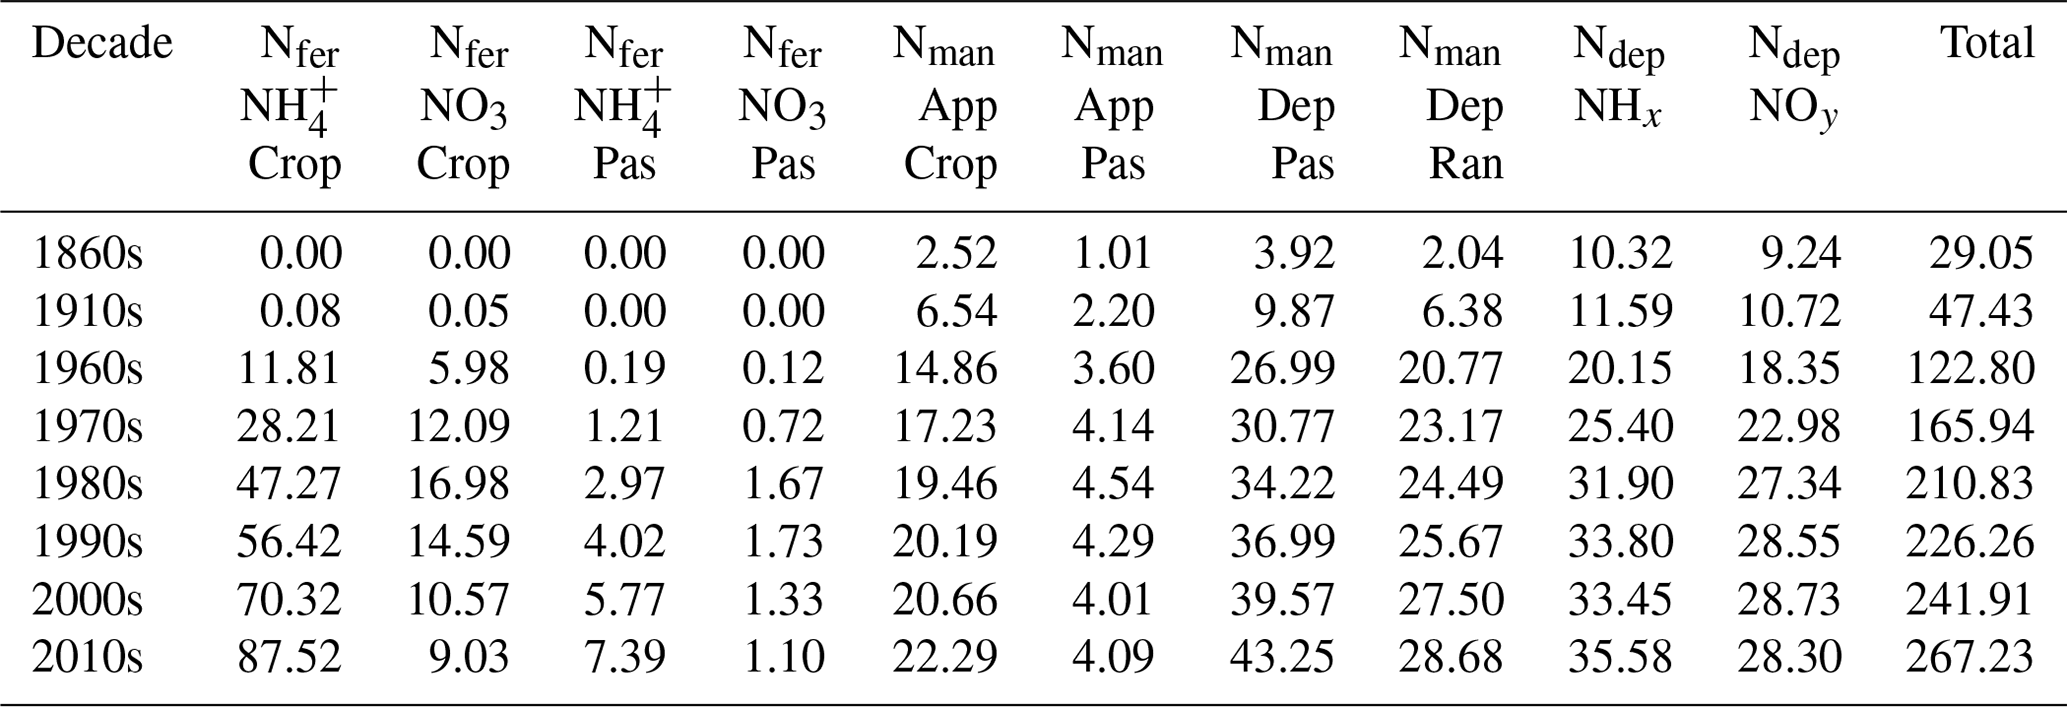
The following abbreviations are used in the table: Nfer – N fertilizer, Nman – manure N, Ndep – N deposition, Crop – Cropland, Pas – Pasture, Ran – Rangeland, App – Application, and Dep – Deposition.

Figure 4Long-term trends in anthropogenic nitrogen inputs to terrestrial ecosystems during the period from 1860 to 2019. N input to global terrestrial ecosystems stems from three major categories: N fertilizer, manure N, and N deposition. These categories are further divided into 10 specific types: NH-N fertilizer applied to cropland, NO-N fertilizer applied to cropland, NH-N fertilizer applied to pasture, NO-N fertilizer applied to pasture, manure N application on cropland, manure N application on pasture, manure N deposition on pasture, manure N deposition on rangeland, NHx-N deposition, and NOy-N deposition.
The TN inputs exhibited high spatial heterogeneity across the globe, associated with imbalances in regional economic development and population growth (Fig. 5). From the 1860s to the 1910s, the TN inputs mainly increased in the eastern USA, Europe, and India, driven by the increase in manure N application and deposition. In the 1960s, several TN input hotspots emerged in Europe (Fig. 5c) where synthetic fertilizer was first widely used. Meanwhile, TN inputs also intensified in many regions of developing countries, such as eastern China, southern Brazil, India, and countries in central Africa, mainly due to the increasing use of manure N (Fig. 5c). As access to synthetic N fertilizer became easier, TN inputs significantly increased across the globe from the 1960s to the 2010s, and the interregional imbalance in N inputs was also amplified, with regions displaying high N inputs concentrated in eastern and central China, India, Europe, the Midwestern USA, and southern Brazil (Fig. 5d).
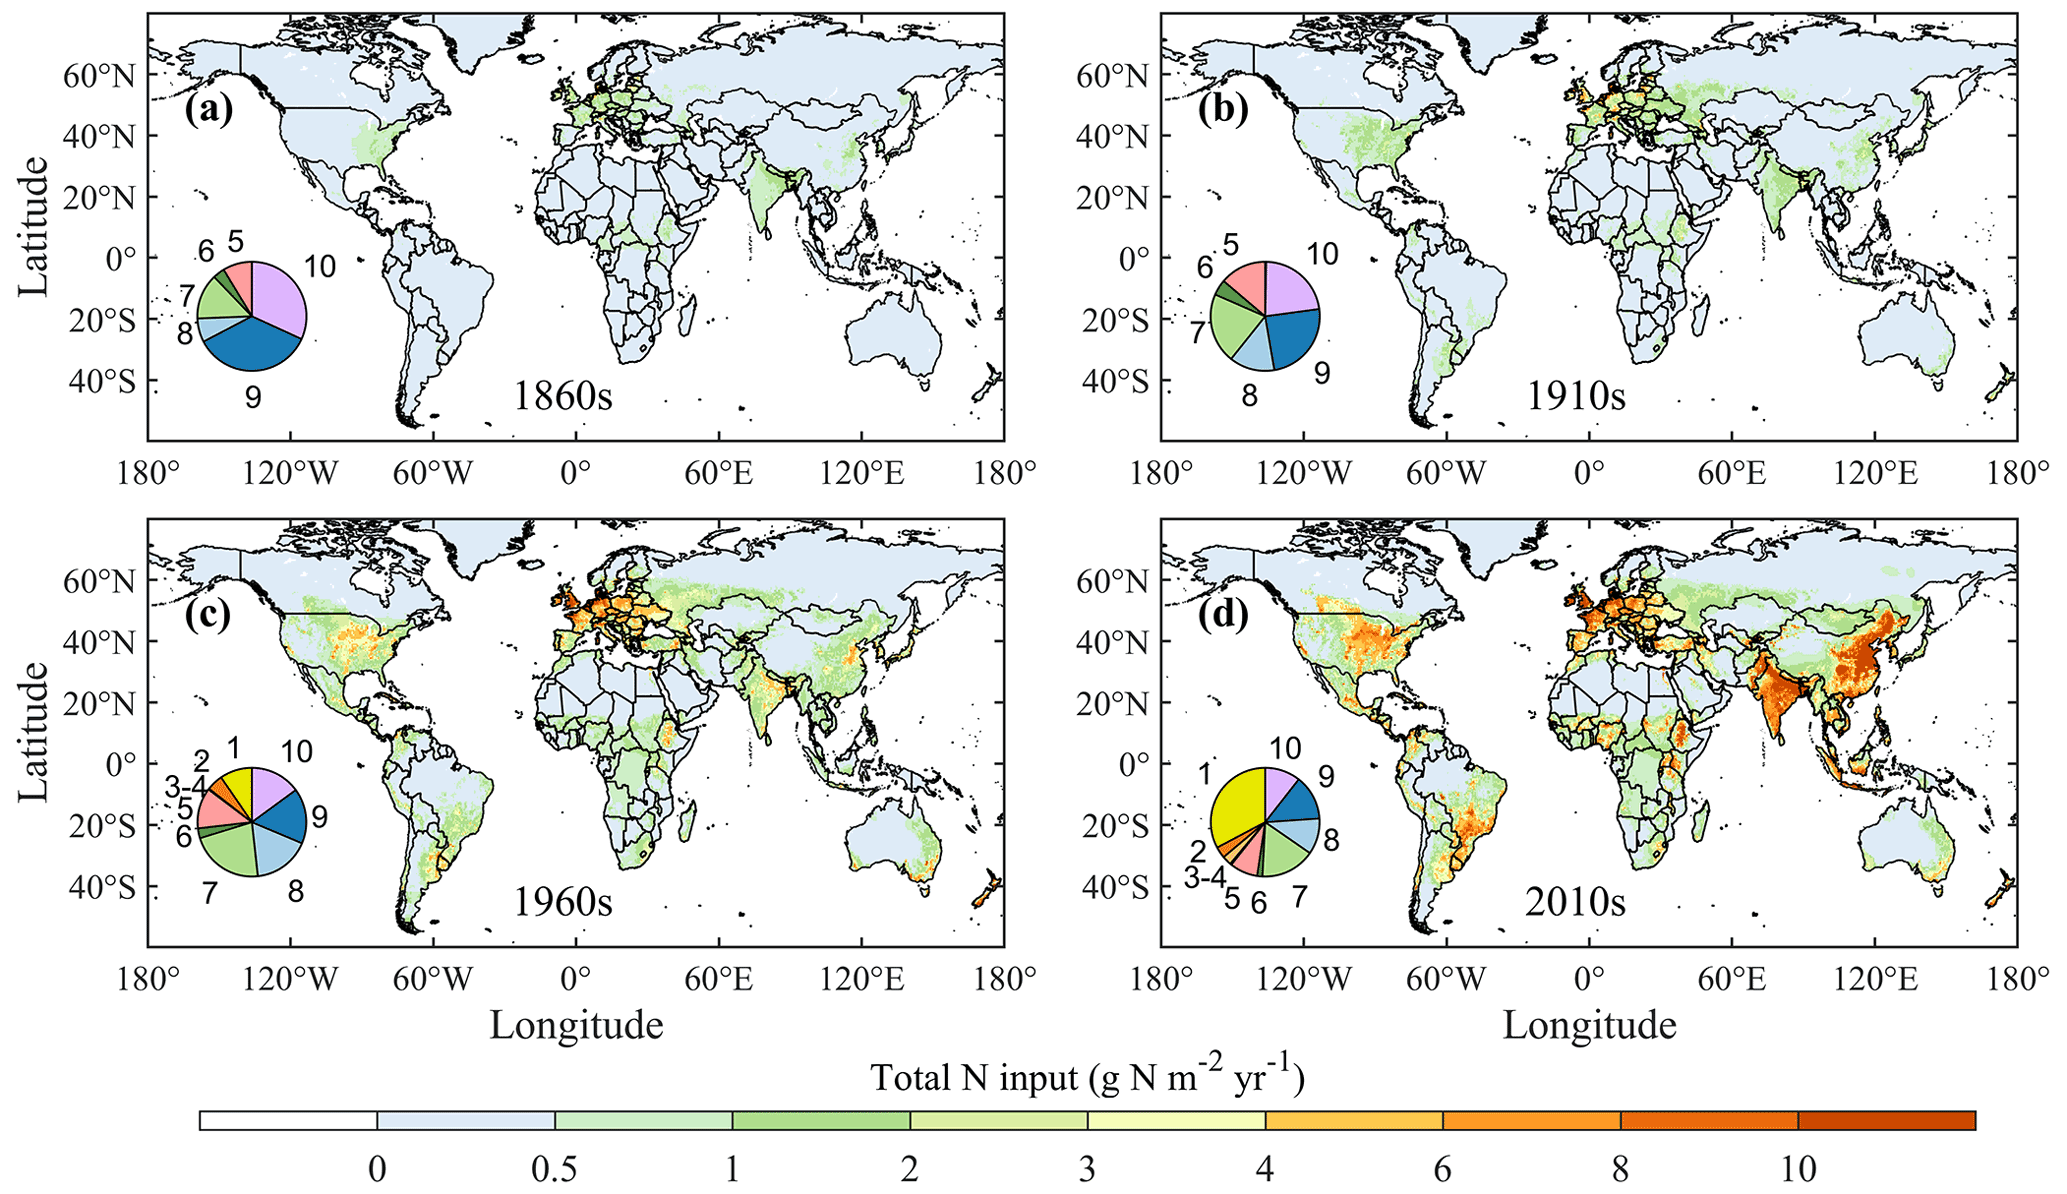
Figure 5Spatial patterns in total N input in the (a) 1860s, (b) 1910s, (c) 1960s, and (d) 2010s. For the inset pie charts, the numbers 1 to 10 represent the percentage of each respective component: 1 – NH-N fertilizer applied to cropland, 2 – NO-N fertilizer applied to cropland, 3 – NH-N fertilizer applied to pasture, 4 – NO-N fertilizer applied to pasture, 5 – manure application on cropland, 6 – manure application on pasture, 7 – manure deposition on pasture, 8 – manure deposition on rangeland, 9 – NHx-N deposition, and 10 – NOy-N deposition.
Among the 18 regions (Fig. 6), the top three regions with the highest TN inputs in 1960 were Europe (19.0 Tg N yr−1), the USA (11.8 Tg N yr−1), and South Asia (9.9 Tg N yr−1). From 1960 to 2019, the largest increases in TN inputs were found in China, South Asia, and Brazil, which accounted for 26 %, 18 %, and 9 % of the increase in the global N inputs, respectively. The increasing TN inputs in China and South Asia were mainly driven by the wide use of synthetic fertilizer, whereas those in Brazil were driven by the use of both livestock manure and synthetic fertilizer. The TN inputs in the USA have became relatively stable since 1980, whereas the TN inputs in Europe decreased by 32 % from 1988 to 2019, primarily due to the increase in crop N use efficiency and the reduction in synthetic fertilizer application (J. Zhang et al., 2021; Lassaletta et al., 2014). Although the TN inputs in China have experienced a rapid increase in recent decades, the country has started to show a decreasing trend since 2014. However, the TN inputs in South Asia and Brazil have maintained a strong growth trend. In 2019, China (49.1 Tg N yr−1) contributed the largest share (18 %) to global TN inputs, followed by South Asia (38.9 Tg N yr−1, 14 %) and Europe (26.2 Tg N yr−1, 10 %). The TN inputs in North America (USA and CAN), Europe (EU), and East and South Asia (CHN, KAJ, SAS, and SEAS) were dominated by synthetic fertilizer, whereas those in Central and South America (BRA, SSA, NSA, and CAM), Africa (NAF, EQAF, and SAF), Central and West Asia (CAS and MIDE), and Oceania (OCE) were dominated by manure. RUS was the only region where atmospheric N deposition was the major anthropogenic N source in 2019.
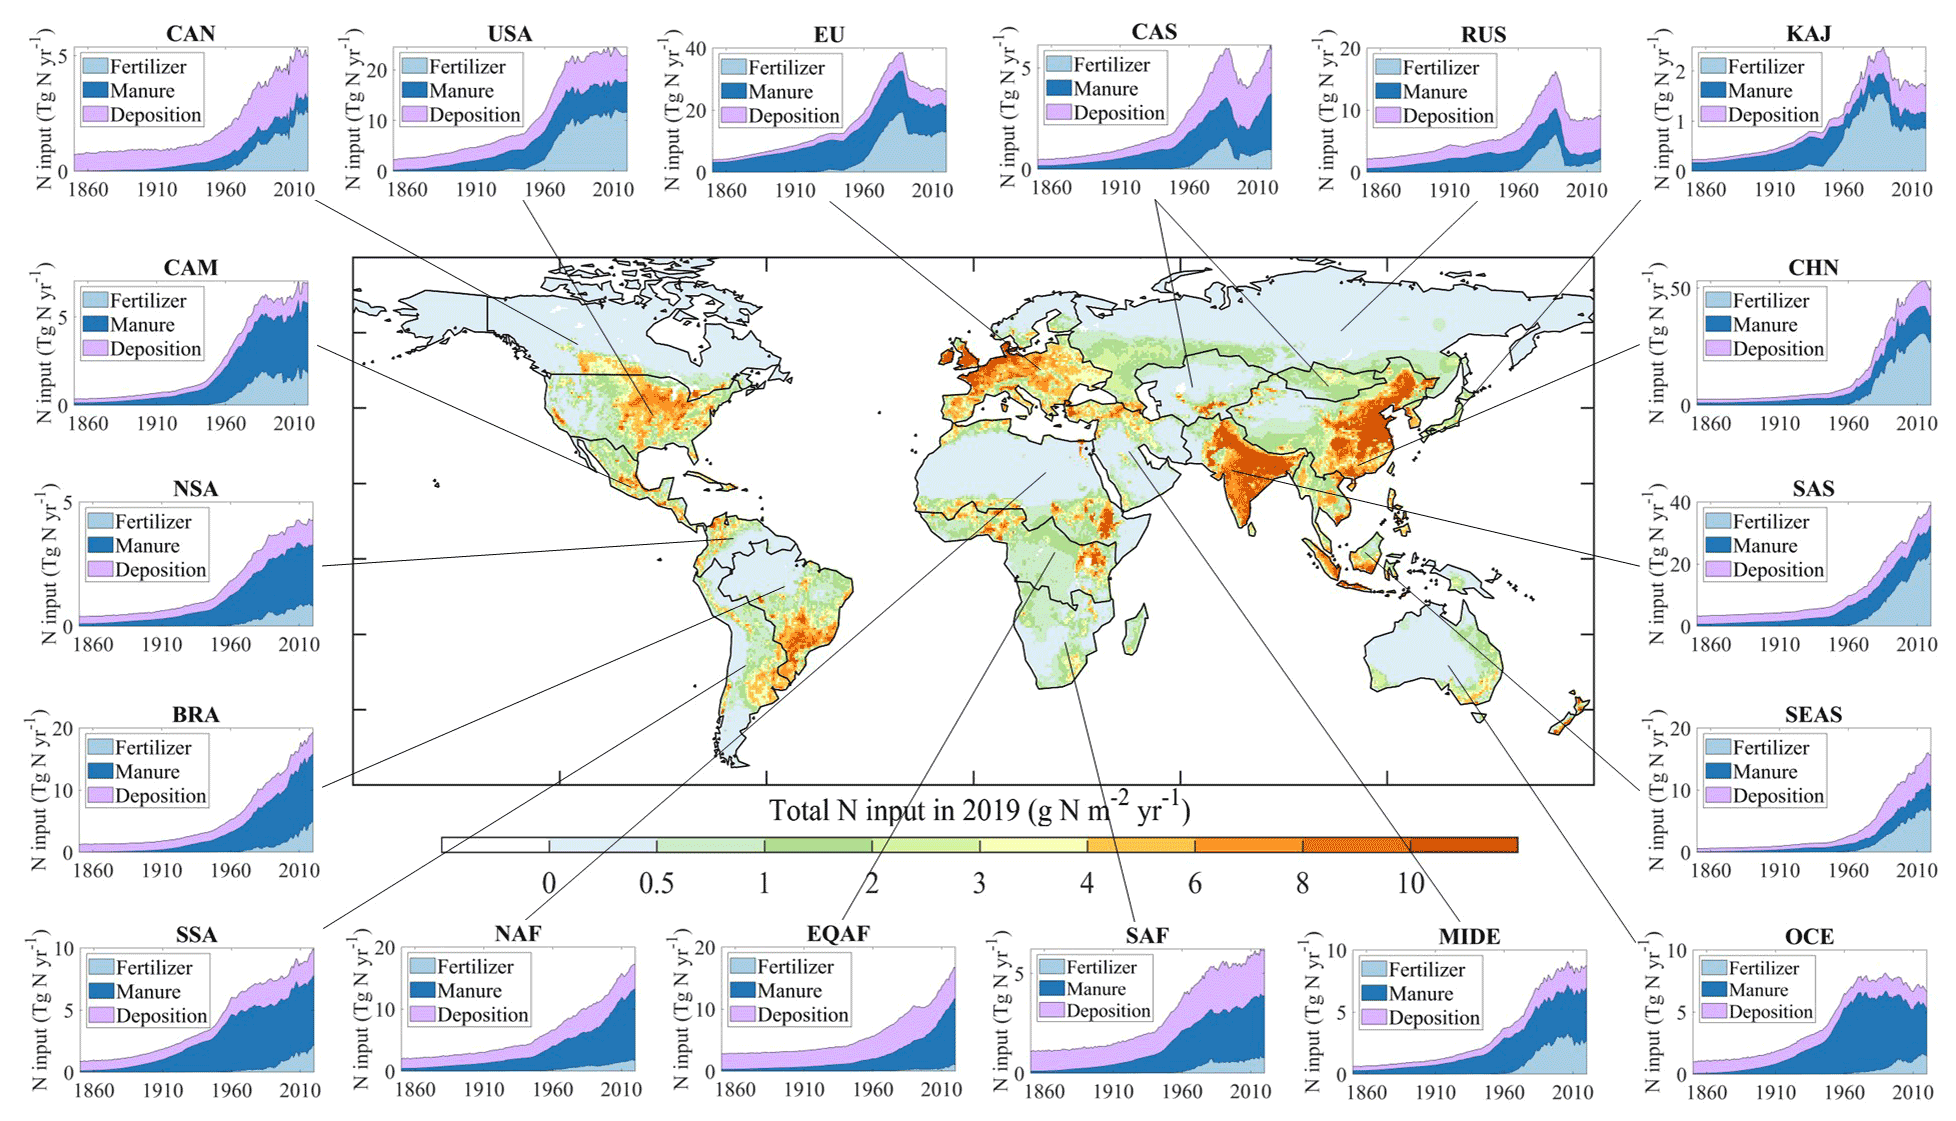
Figure 6Long-term trends and variations in regional N inputs (synthetic fertilizer, livestock manure, and atmospheric deposition) to terrestrial ecosystems during the period from 1860 to 2019. The 18 regions are the USA (USA), Canada (CAN), Central America (CAM), northern South America (NSA), Brazil (BRA), southwestern South America (SSA), Europe (EU), Northern Africa (NAF), Equatorial Africa (EQAF), Southern Africa (SAF), Russia (RUS), Central Asia (CAS), the Middle East (MIDE), China (CHN), Korea and Japan (KAJ), South Asia (SAS), Southeast Asia (SEAS), and Oceania (OCE).
3.2 N fertilizer inputs on cropland and pasture
From the 1960s to the 2010s, N fertilizer inputs on cropland and pasture increased from 18.1 to 105.0 Tg N yr−1. Specifically, N fertilizer inputs on cropland increased from 17.8 to 96.6 Tg N yr−1, and N fertilizer inputs on pasture increased from 0.3 to 8.5 Tg N yr−1 (Fig. 4, Table 2). The proportion of fertilizer in N fertilizer increased from 64 % in the 1960s to 90 % in the 2010s; in contrast, -N fertilizer decreased from 36 % in the 1960s to 10 % in the 2010s. At the regional level, Europe and the USA were the top two N-fertilizer-consuming regions in the 1960s, accounting for 38 % and 25 % of global N fertilizer application, while China (28 %) and South Asia (21 %) were the top two in the 2010s (Fig. 6). The fertilizer application rates in China and South Asia increased at a rate of 0.59 and 0.43 Tg N yr−2 (p<0.05) during the 1960–2019 period, respectively.
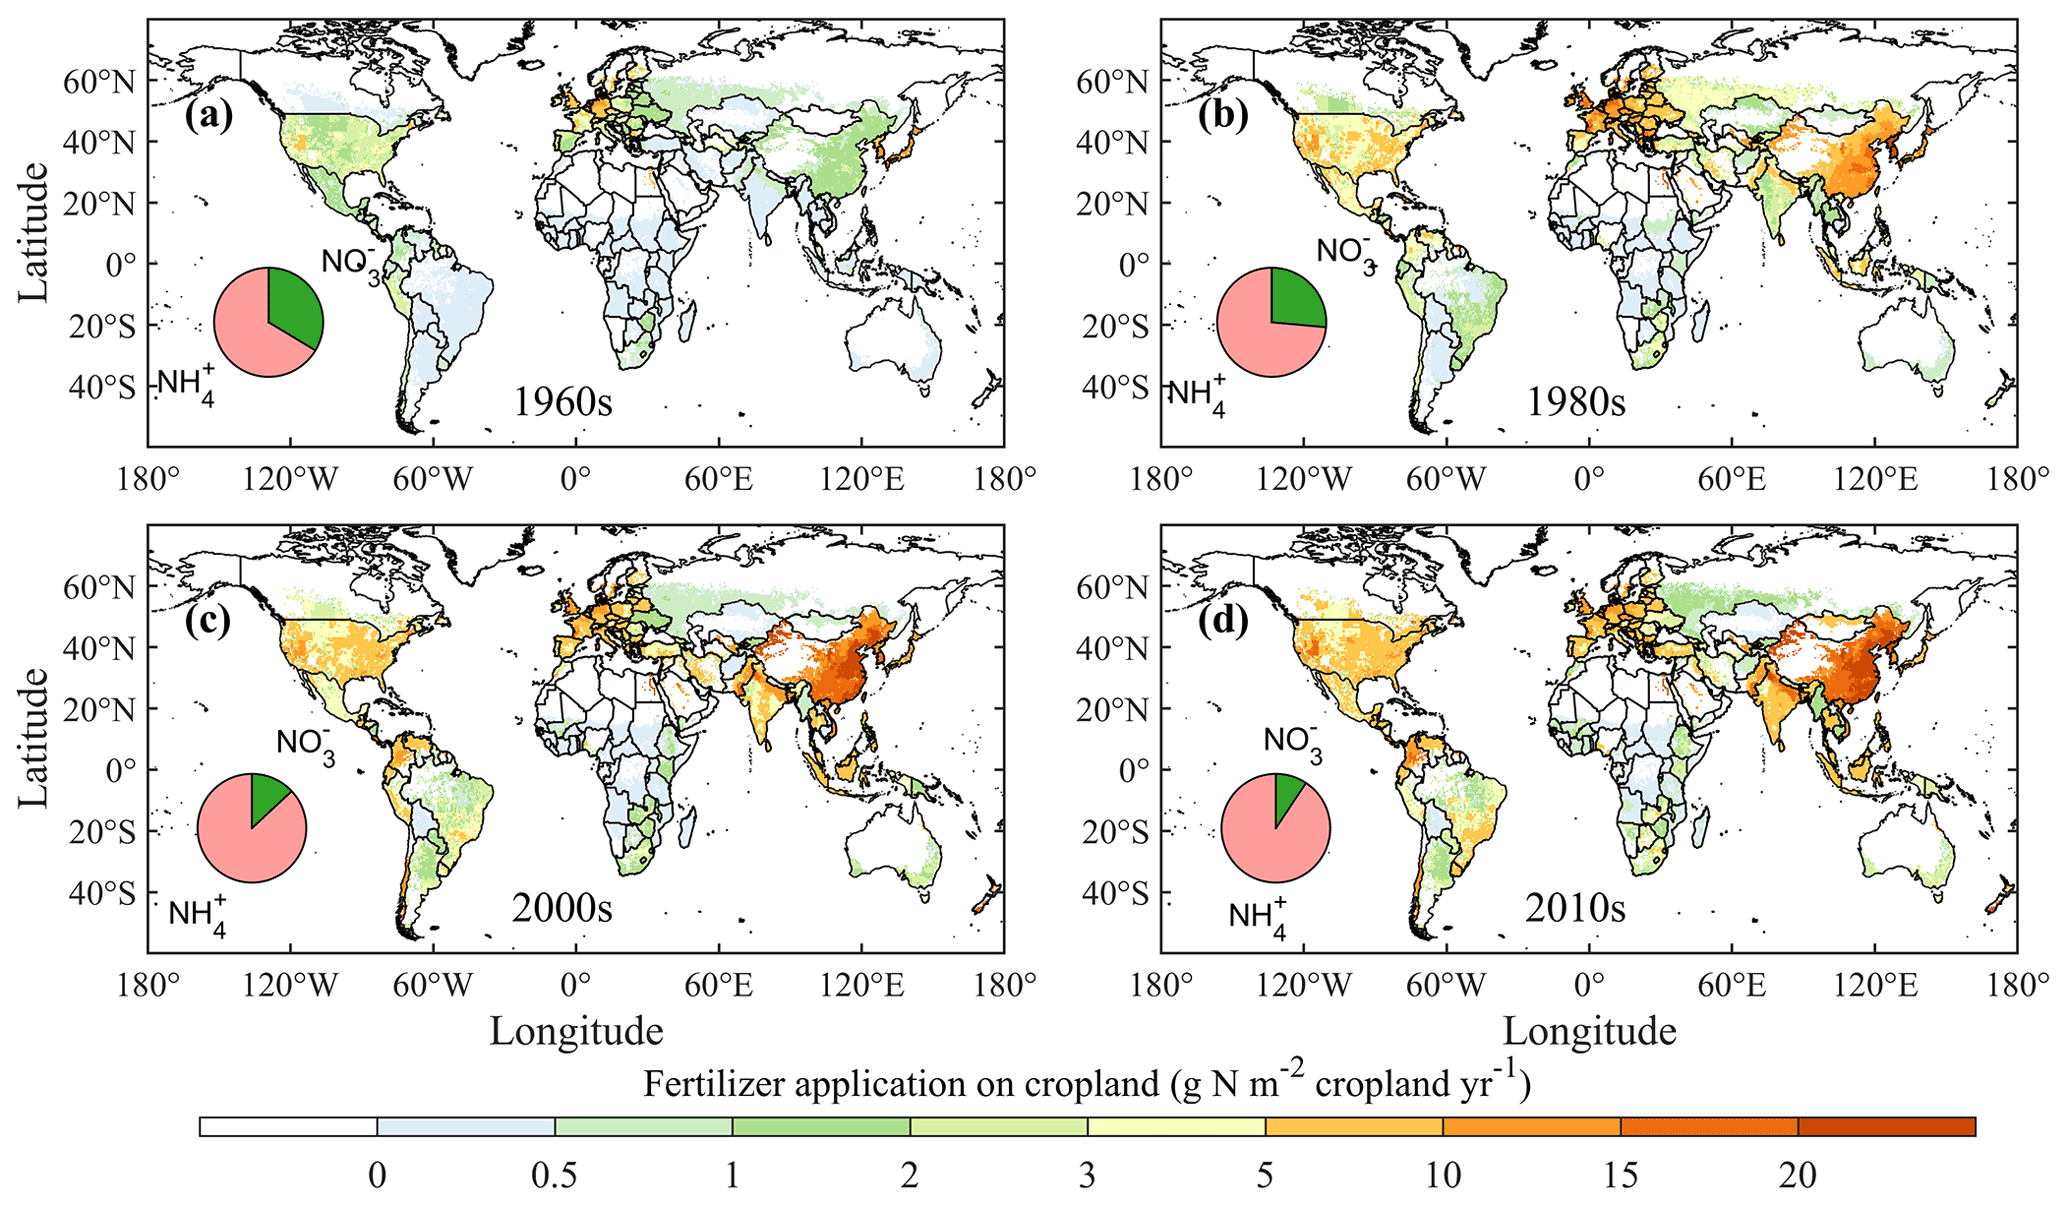
Figure 7Spatial patterns of N fertilizer application on cropland in the 1960s, 1980s, 2000s, and 2010s.
Fertilizer application rates on cropland in Europe reached the maximum in the 1980s, but fertilizer application rates in India, eastern Asia, and southern Brazil kept increasing continuously (Fig. 7). In the 2010s, extremely high N fertilizer inputs (>20.0 g N m−2 yr−1) mainly occurred in eastern and southeastern China. Croplands in northern India and western Europe also had high N fertilizer rates (>10.0 g N m−2 yr−1). N fertilizer application changed slowly in Africa, with most croplands receiving N fertilizer inputs of less than 2.0 g N m−2 yr−1. For pasture, Europe was the main N-fertilizer-consuming region, with N fertilizer application over 6.0 g N m−2 yr−1, before the 1980s (Fig. S1 in the Supplement). N fertilizer application on pasture in southern Canada and India increased significantly, with rates of over 8.0 g N m−2 yr−1, in the 2010s. Most other regions (e.g., China, the USA, Brazil, and Africa) received N fertilizer inputs of less than 3.0 g N m−2 yr−1.
3.3 Manure N inputs on cropland, pasture, and rangeland
The total manure N inputs to land increased from 9.48 Tg N yr−1 in the 1860s to 98.31 Tg N yr−1 in the 2010s, with a rate of increase of 0.6 Tg N yr−2 (Fig. 4, Table 2). The manure N application on cropland, manure application on pasture, manure deposition on pasture, and manure deposition on rangeland changed from 14.86 (22 % of total manure input), 3.60 (5 %), 26.99 (41 %), and 20.77 Tg N yr−1 (31 %) in the 1960s to 22.29 (23 %), 4.09 (4 %), 43.25 (44 %), and 28.68 Tg N yr−1 (29 %) in the 2010s, respectively. Europe was the largest contributor (39 %) to global manure N inputs in the 1860s, but its share decreased during the last century and became 9 % in the 2010s (Fig. 6). The manure N inputs in Brazil grew rapidly from 0.55 Tg N yr−1 (2 % of global manure N inputs) in the 1910s to 10.77 Tg N yr−1 (11 %) in the 2010s. Similarly, manure N inputs in Equatorial Africa and Northern Africa were only 2.22 (3 %) and 4.20 Tg N yr−1 (6 %) in the 1960s and increased dramatically to 9.40 (10 %) and 10.60 Tg N yr−1 (11 %) in the 2010s, respectively. China was the largest contributor (12 %) of global total manure N inputs in the 2010s, while it contributed 8 % in the 1960s and 12 % in the 1860s.
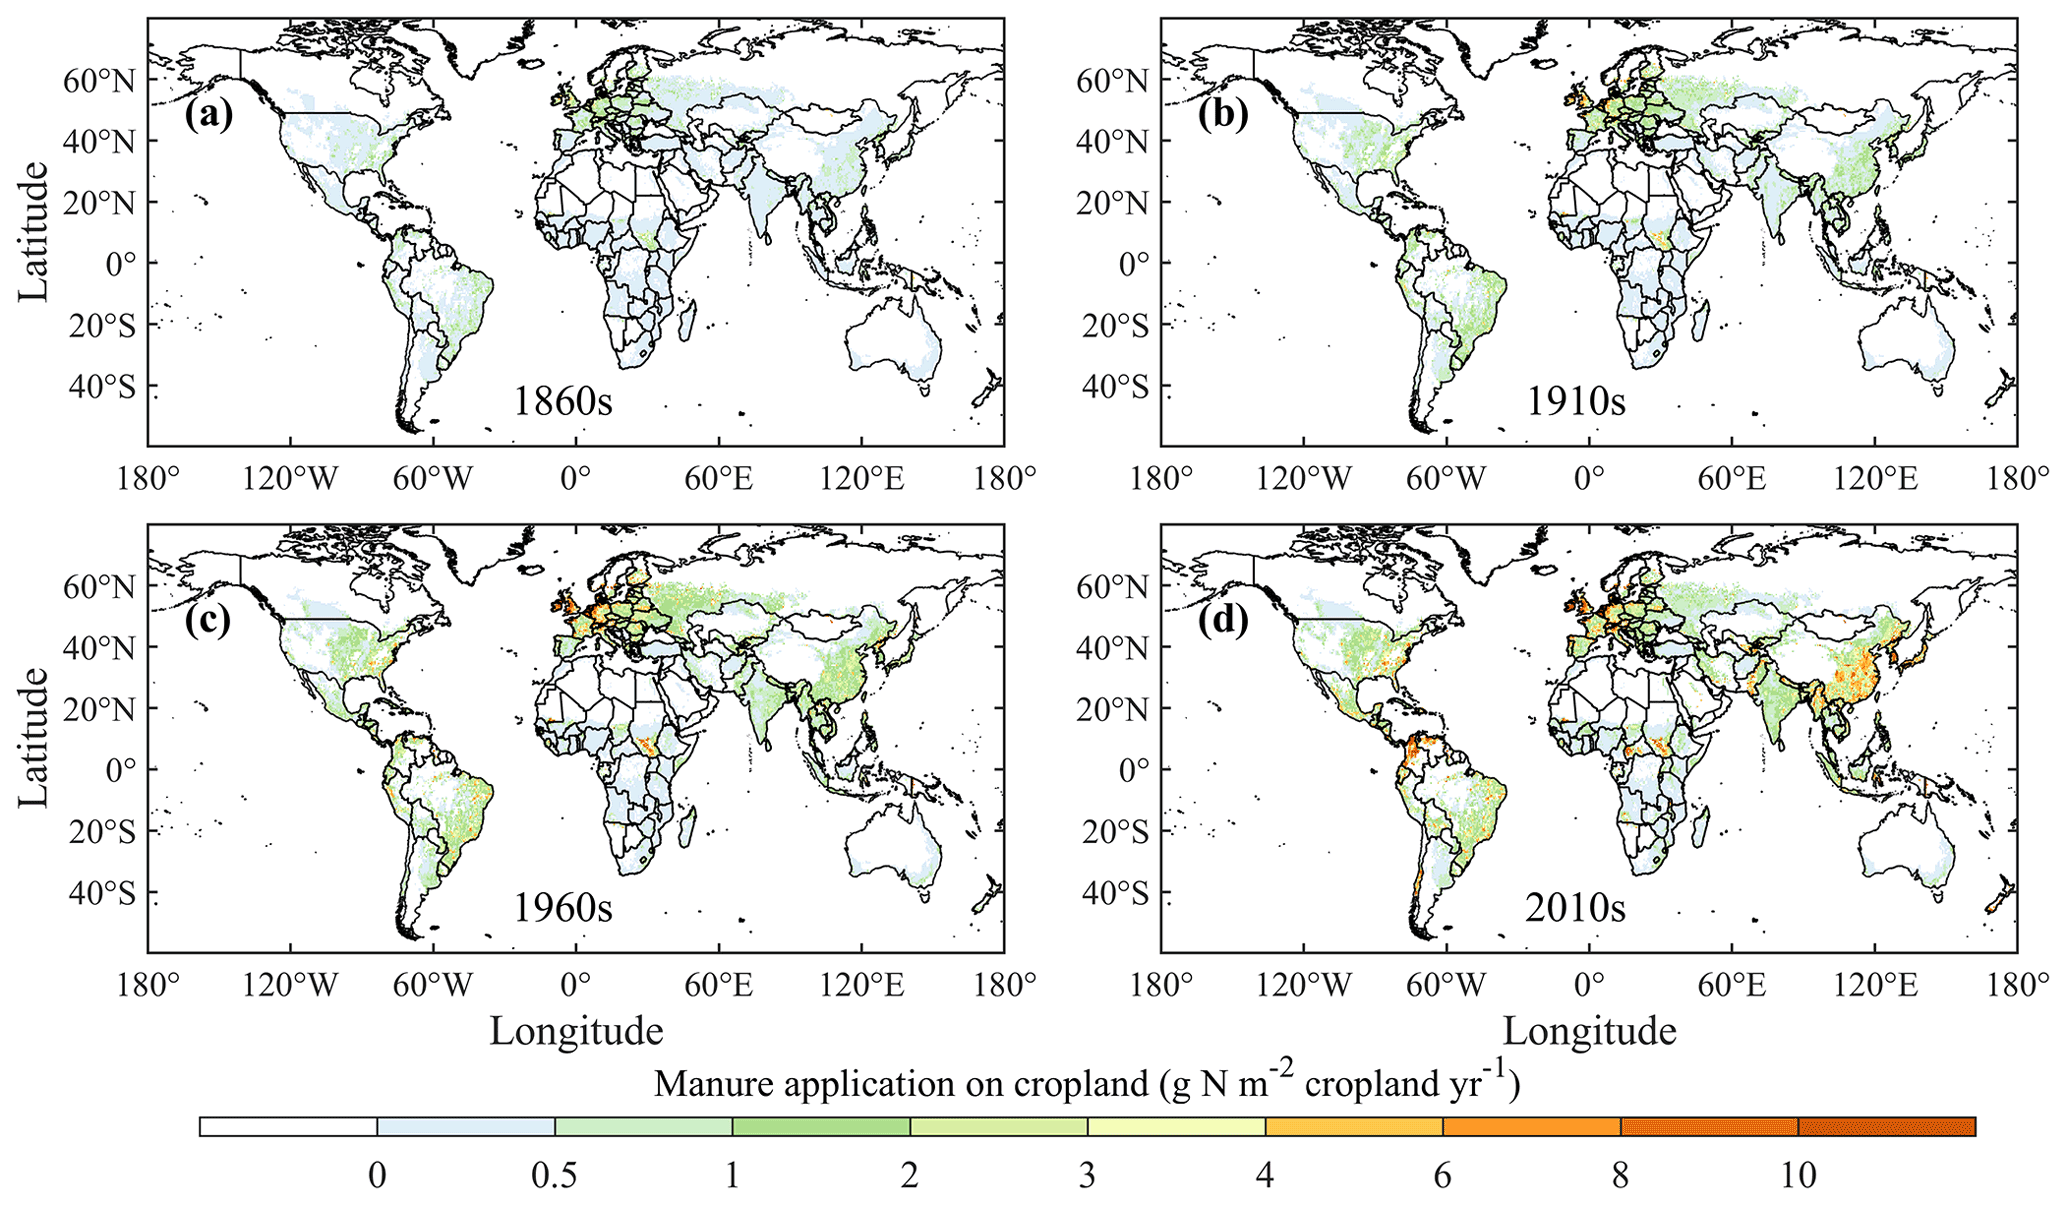
Figure 8Spatial patterns of manure N application on cropland in the 1860s, 1910s, 1960s, and 2010s.
Manure application rates on cropland have gradually intensified across the globe since the 1860s except in Australia and part of Africa (Fig. 8). Hotspots of manure application on cropland (>6.0 g N m−2 yr−1) first appeared in western Europe in the 1910s, and intensified manure application was then observed in eastern Asia and northern South America in the 2010s. Manure application and deposition on pasture had higher spatial variability than that on cropland (Fig. 9). Pasture in Europe and South Asia received higher manure N than that in other regions. Eastern South America, central Africa, and eastern Asia have also experienced a significant increase in manure N inputs on pasture since the 1910s. For manure deposition on rangeland, South Asia stood out over the study period, with several other hotspots having emerged in central Africa, northern China, Europe, and eastern South America since the 1910s (Fig. 10).
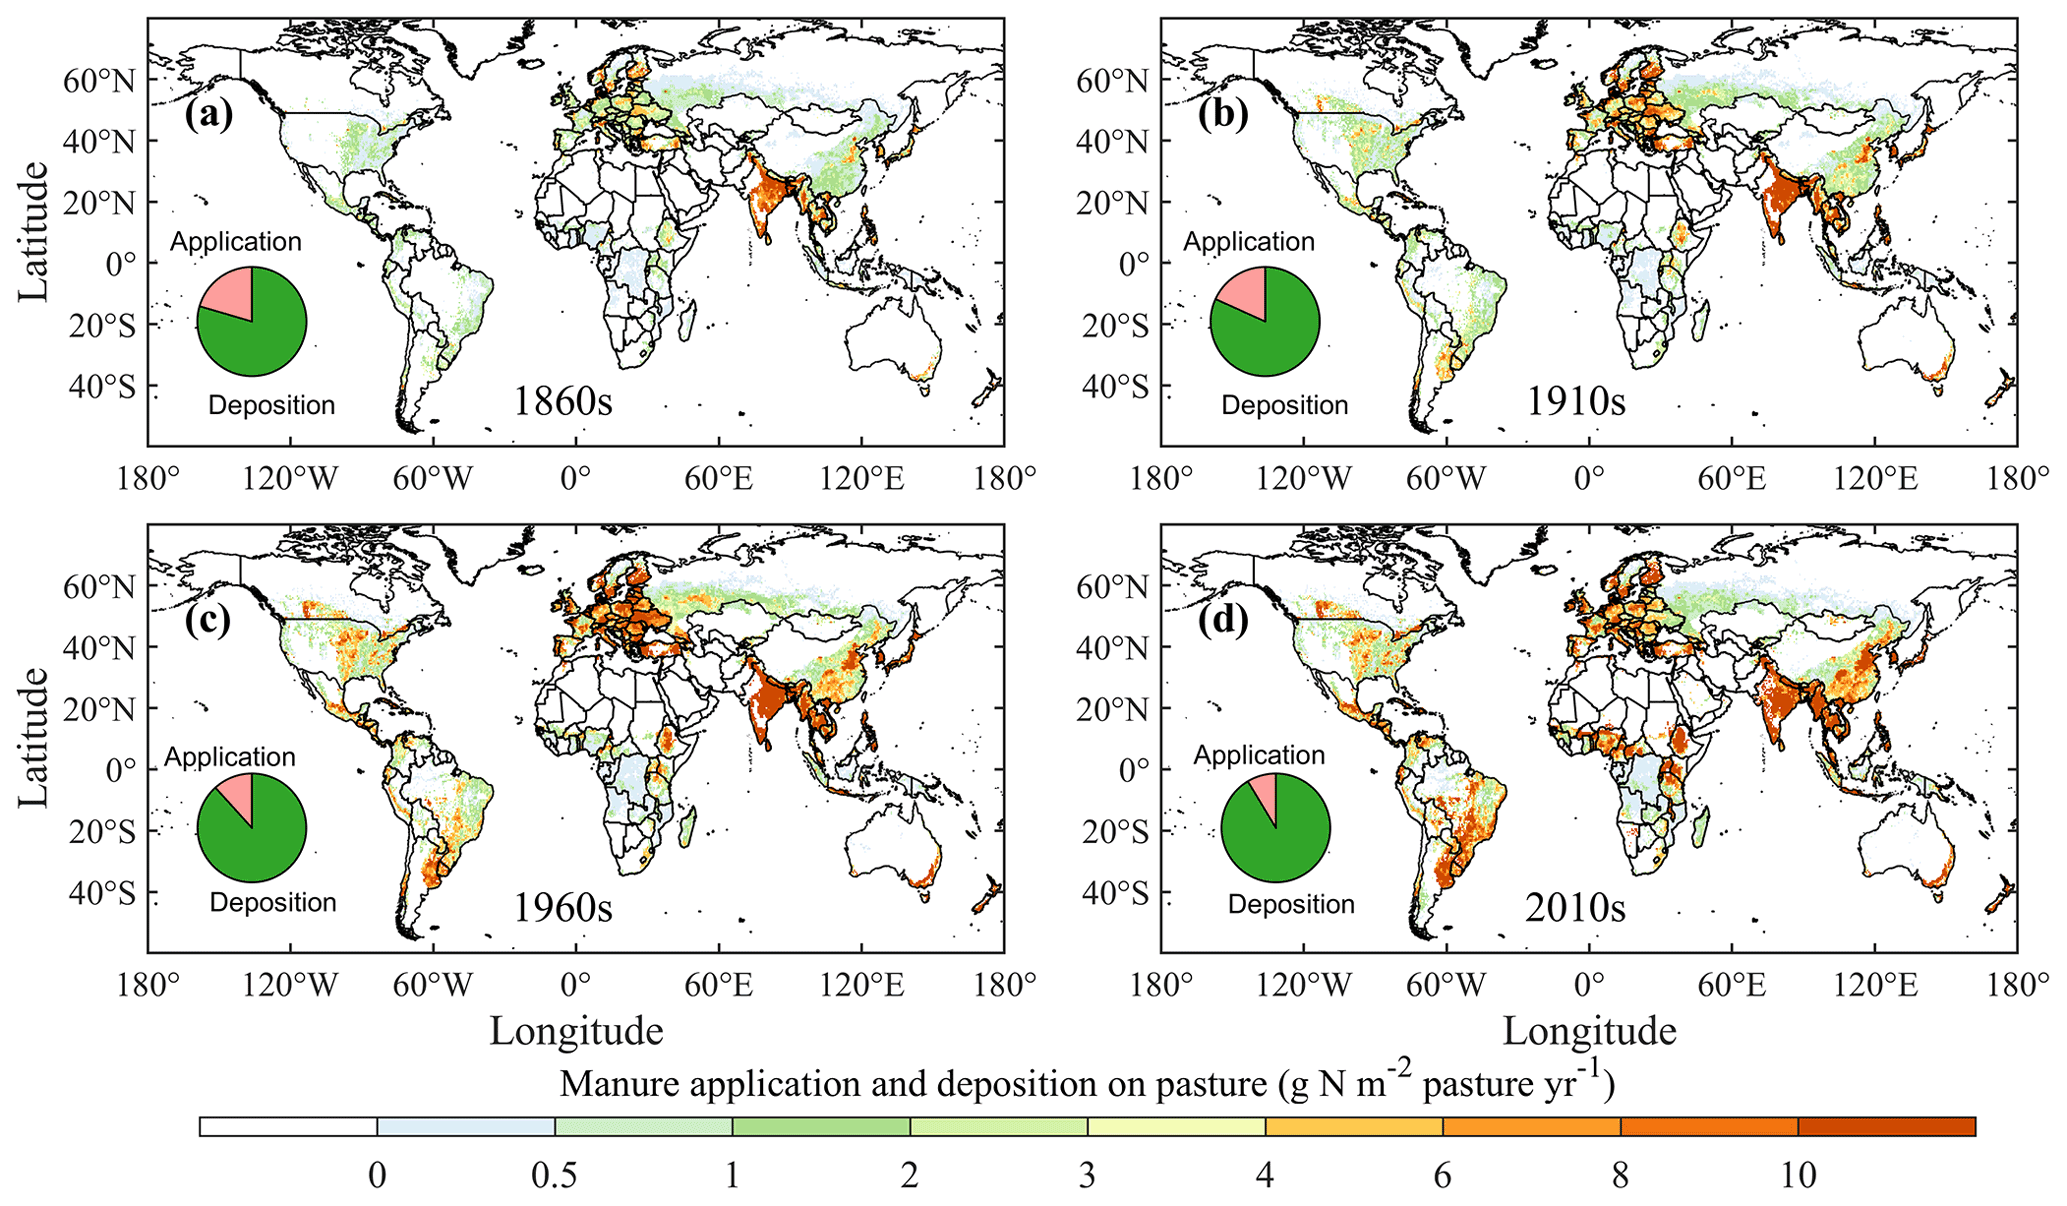
Figure 9Spatial patterns of manure N application and deposition on pasture in the 1860s, 1910s, 1960s, and 2010s.

Figure 10Spatial patterns of manure N deposition on rangeland in the 1860s, 1910s, 1960s, and 2010s.
3.4 Atmospheric N deposition on land
Atmospheric N deposition showed a 3-fold increase, from 19.06 to 60.87 Tg N yr−1, during the period from the 1850s to the 2010s, with NHx deposition increasing from 10.02 to 35.58 Tg N yr−1 and NOy deposition increasing from 9.04 to 28.30 Tg N yr−1 (Fig. 4, Table 2). The share of NHx in atmospheric N deposition started to increase after the 1970s, changing from 52 % to 56 % in the 2010s. At the regional scale, South Asia, Equatorial Africa, and the USA were the largest contributors in the 1860s, accounting for 13 %, 13 %, and 12 % of global atmospheric N deposition, respectively (Fig. 6). In the 2010s, China was the region with the largest atmospheric N deposition (10.66 Tg N yr−1, 17 % of global atmospheric N deposition), followed by South Asia (5.90 Tg N yr−1, 9 %) and the USA (5.69 Tg N yr−1, 9 %). Atmospheric N deposition peaked in the 1980s in Europe and Equatorial Africa, in the 1990s in the USA, and in the 2010s in South Asia and China. Spatially, atmospheric N deposition has intensified and increased dramatically across the globe since the 1910s (Fig. 11), and regions with high N deposition rates (>1.0 g N m−2 yr−1) have mainly been located in Europe, central Africa, southern Asia, the USA (since the 1960s), and eastern Asia (in the 2010s).
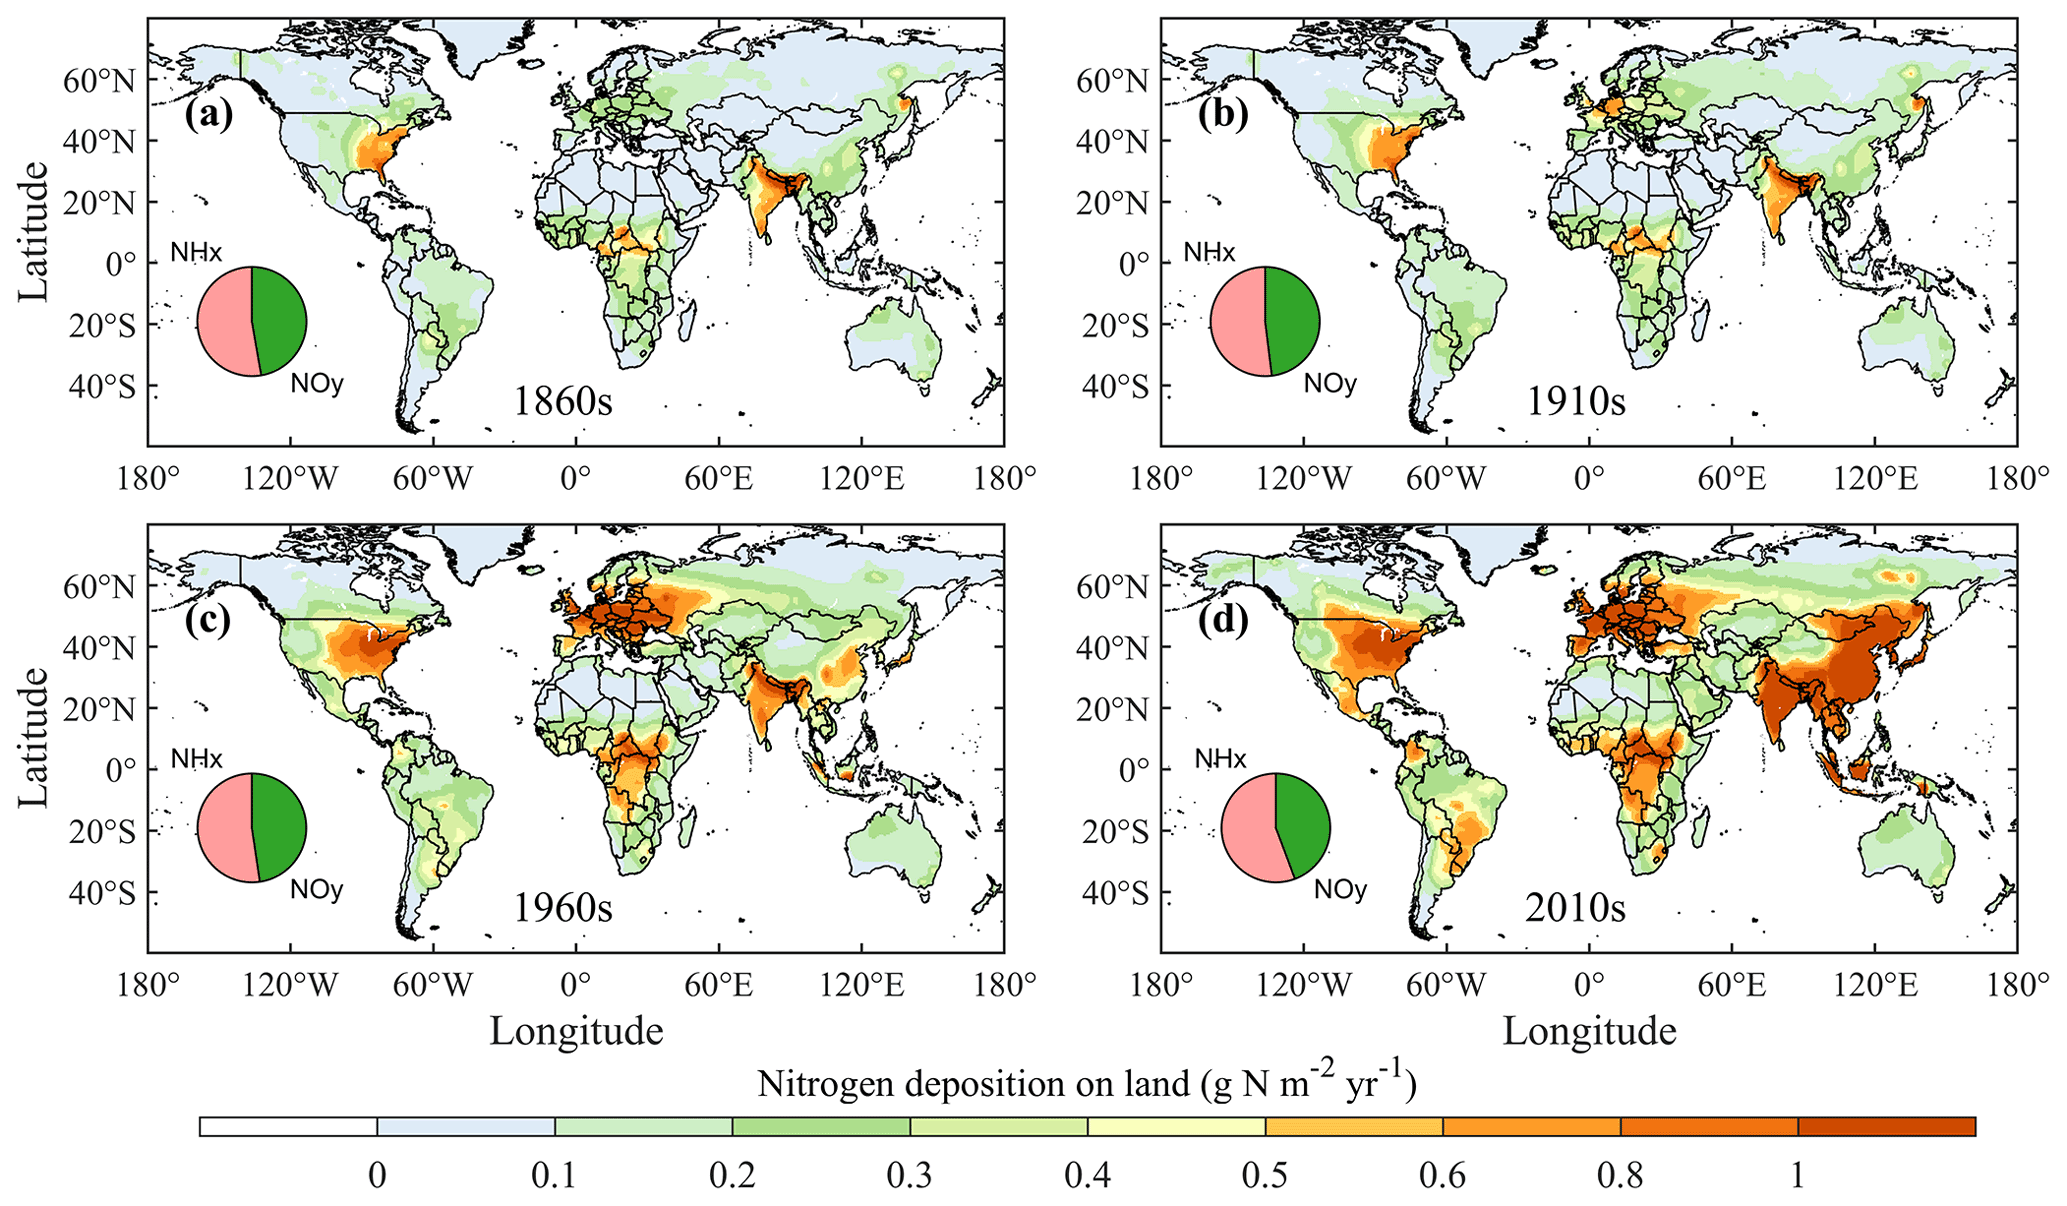
Figure 11Spatial patterns of atmospheric N deposition on land in the 1860s, 1910s, 1960s, and 2010s.
4.1 Socioeconomic forcing of N use
The total anthropogenic nitrogen inputs (excluding N deposition) showed a close relationship with gross domestic product (GDP) per capita in all of the three agricultural sectors of cropland, pasture, and rangeland (Fig. 12). These relationships could be generally categorized into three groups: a hump-shaped curve, a rapid increase curve, and an asymptote curve. The first was typically seen in regions like China and Europe. China, as the top N consumer, has successfully reduced its nitrogen use for crop production from the peak of 33.6 Tg yr−1 in 2014 to 30.0 Tg yr−1 in 2020. Crop production in China increased during the same period due to improvements in crop varieties, fertilizer management, and land use policies (Cui et al., 2018; Wu et al., 2018). The mandatory policies and directives for N use in Europe since the late 1980s have effectively curbed its N use to a stable level (Van Grinsven et al., 2014). The second could be seen in South Asia, Southeast Asia, and North Africa, among others. These regions are still in the developing stage and need to tackle the food demand of a rapidly growing population, which, in combination with low nitrogen use efficiency, results in a surge of nitrogen pollution (Chang et al., 2021). The third could be well represented by the USA and Canada. For the USA, crop nitrogen use efficiency has considerably improved since the 1990s, driven by technological and management improvements (Zhang et al., 2015). Despite the fact that cropland area in the USA has kept expanding recently, the total N input has remained stable (Lark et al., 2020). For the same curve type, obvious differences also existed. For example, the turning points for crop N inputs in Europe and China emerged at varied socioeconomic development levels. Meanwhile, it was difficult to predict when China's crop N inputs would decrease to their lowest level, as Europe's case had shown. For different sectors of one country or region, N inputs could also show asynchrony with GDP per capita increases. Using the USA as an example, its N inputs on cropland and pasture kept growing, whereas its N inputs on rangeland remained stable. The N input rate–GDP per capita relationships also generally fell into the three groups (Fig. 12). However, a notable phenomenon is that the N input rate in Korea and Japan was much higher than that in other regions in almost all of the three agricultural sectors (Fig. 12). This has also been reported by Lim et al. (2021), and they attributed it to a decrease in arable land area, high fertilizer input, and especially large manure inputs, although fertilizer input in Korea had been considerably reduced. Despite such a diversity in the N use changes under varied socioeconomic circumstances, the N use/N input rate–GDP per capita relationships and the related spatial patterns will be a valuable reference for any future projection of global anthropogenic N inputs.
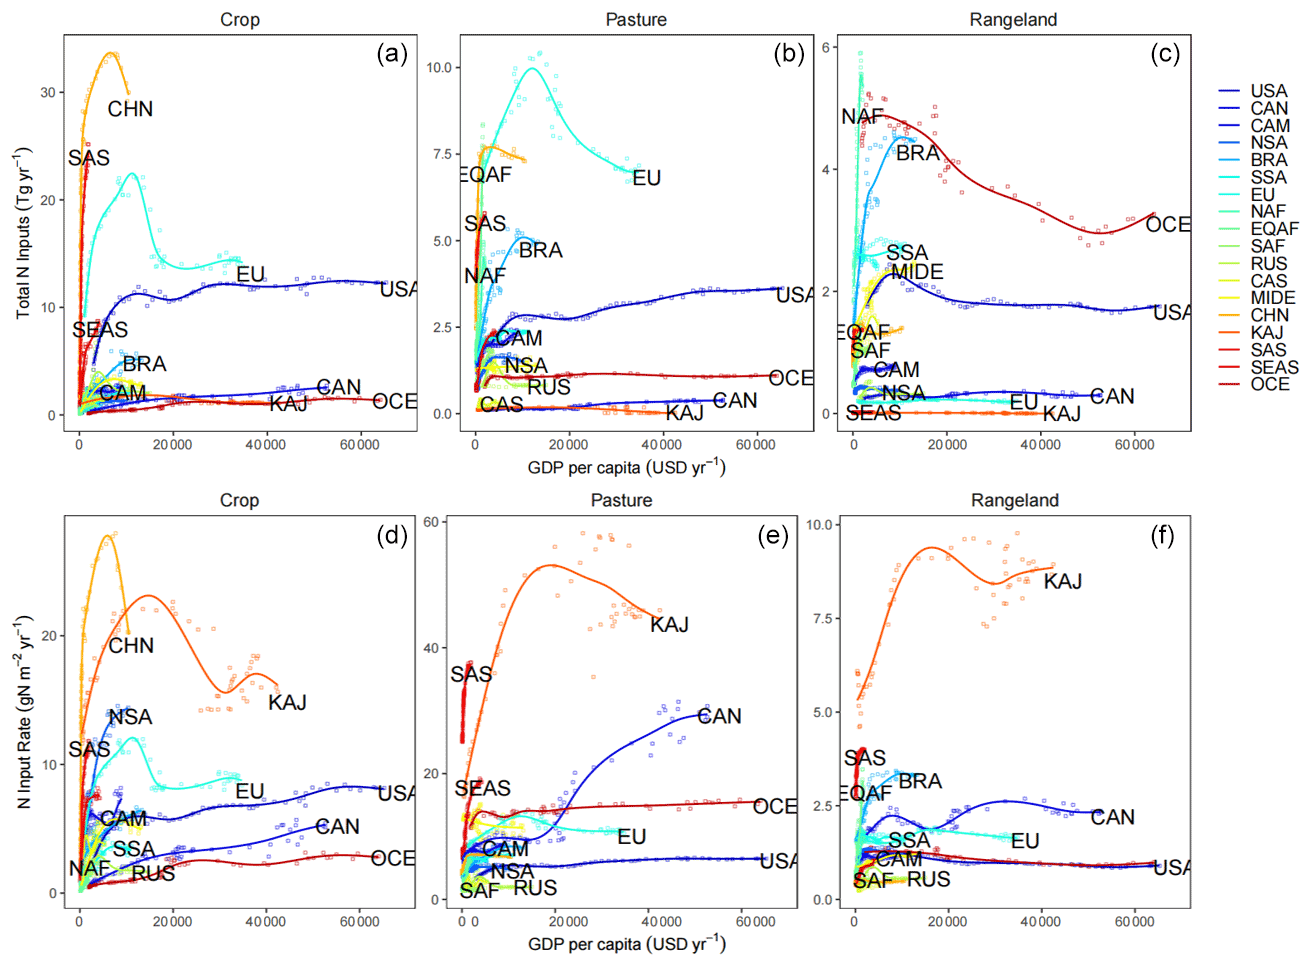
Figure 12Relationships between total N inputs (excluding N deposition; a–c) or the N input rate (d–f) and GDP per capita on cropland, pasture, and rangeland, respectively, within each of 18 regions during the period from 1961 to 2019. The lines were fitted using the generalized additive models. For visual clarity, not all region names are shown in each panel. The 18 regions are as follows: the USA (USA), Canada (CAN), Central America (CAM), northern South America (NSA), Brazil (BRA), southwestern South America (SSA), Europe (EU), Northern Africa (NAF), Equatorial Africa (EQAF), Southern Africa (SAF), Russia (RUS), Central Asia (CAS), the Middle East (MIDE), China (CHN), Korea and Japan (KAJ), South Asia (SAS), Southeast Asia (SEAS), and Oceania (OCE).
4.2 Implications for nitrogen use management
Excessive N use has induced a variety of environmental issues, due to the magnitude, trend, and the constitute forms. In regions or countries like Europe and the USA, although the N inputs have been stable (Fig. 12), the large magnitude of annual N inputs results in a considerable fraction of reactive N that is stored in soils. This N pool can cause strong legacy effects, of which the influence on water quality would last for decades (Meter et al., 2018). Therefore, maintaining the current levels of N may be not enough to reduce N-related environmental issues in these regions or countries (Liu et al., 2016). Instead, agricultural nitrogen inputs must be eliminated drastically; however, this seems rather difficult at the current technological level, even though social–economic conditions are improving (Fig. 12). Nevertheless, for regions or countries like South Asia and Southeast Asia, where N inputs have been increasing rapidly, the management options or activities that are successful in Europe or the USA can be promoted to inhibit the further increase in anthropogenic N inputs and local N-induced pollution. This requires wide international collaboration and efficient coordination between developing countries and developed countries. As for the changes in N input forms, a signal worth noting is the increasing fraction of -N in the global total N inputs (Figs. 7, 11, S1). The high -N fraction has contributed significantly to N-induced air pollution (Li et al., 2016), and the change in the ratio of -N over -N may affect biodiversity (van den Berg et al., 2016) and plant growth (Zhu et al., 2020; Yan et al., 2019). Improved use of -N will benefit both human society and ecosystems.
4.3 Limitations in data development and knowledge gaps
The uncertainties and limitations of this global N input dataset are mainly derived from the following aspects:
-
Fixed manure excretion rate. The IPCC Tier 1 method adopts a fixed manure excretion rate for each animal and each country, which can bias the manure production estimate. Although the IPCC Tier 2 method is more realistic in reflecting the dynamic energy intake of livestock (Zhang et al., 2022), its parametrization is more difficult. Meanwhile, to be consistent with manure production estimates by Holland et al. (2005), the IPCC Tier 1 method was adopted in this study.
-
Land use maps. Cropland, pasture, and rangeland distribution maps are critical for the spatialization of N fertilizer and manure application. In the data development process, we constrain the N input amount of this dataset with the country-level fertilizer/manure consumption from the FAO to ensure that the total input is consistent, but the fertilizer use rate per unit cropland area could be significantly biased if the global data differ a lot from the country-specific data. For example, in the USA, the higher cropland acreage in the HYDE/LUH2 database, compared with the United States Department of Agriculture (USDA) census, is likely to dilute the fertilizer input rate, which could affect the impact assessment of N inputs (Yu and Lu, 2018).
-
Spatial patterns of fertilizer and manure application and deposition rate. The baseline of crop-specific fertilizer and manure use rates is fixed and has been used to determine the spatial patterns of fertilizer and manure inputs over the study period. This conflicts with the reality of inter- and intra-annual dynamics of crop rotation, annual changes in crop harvested area, and changes in crop-specific fertilizer use rate over time. An ideal spatially explicit fertilizer input dataset, in the future, ought to consider the dynamics of crop rotation, individual crop area changes, and crop-specific fertilizer use rate over space and time. In addition, the spatial distribution of livestock has greatly changed with industrialization, which would probably lead to changing spatial distributions of total manure over time, given that manure is not usually transported over large distances.
-
Country-level survey data. The country-level fertilizer and manure data from the FAO do not separate N application to cropland and pasture. In this study, we separated fertilizer and manure application to cropland and pasture simply based on constant ratios generated by Lassaletta et al. (2014) and Zhang et al. (2015), which ignored either the temporal or the spatial changes in the allocation of fertilizer and manure application to cropland and pasture.
-
Pre-1961 N inputs. As the country-level fertilizer and manure data are only available after 1961, we assumed the change rates of global manure and fertilizer inputs before 1961 followed the change rates of annual global data reported by Holland et al. (2005).
-
Other N sources to terrestrial ecosystems. In this study, the “anthropogenic N inputs” actually do not exclude the natural source of atmospheric N deposition nor do they include legume crop biological N fixation (BNF). Leguminous BNF was the most common nitrogen-containing soil fertility maintenance cropping practice before the widespread use of synthetic fertilizer, and it is also used in current organic farming practices (Cherr et al., 2006). According to Herridge et al. (2008), the global legume crop BNF was around 21.5 Tg N yr−1 in 2005. As the HaNi dataset was developed to serve as inputs for terrestrial biosphere models, N components like BNF, which are simulated using different mechanisms by models, were not included. Nevertheless, a related agricultural BNF database will be very meaningful for deepening our understanding of global N cycling and serving as a benchmark for ecosystem models. To accomplish this, in the future, more efforts are required in developing long-term spatial and temporal distribution maps of various crops such as cover crops and legume crops, which are currently, to our knowledge, not available at the global scale.
For future data improvements, we call for advanced N management survey/reporting mechanism to develop fine-scale N consumption or use rate data. For example, the commonly used survey data for the global fertilizer database is country-level consumption amount or crop-specific fertilizer input from the IFA and FAO, which smoothed large variations in fertilizer application rate at farm-level and subnational scales. A continuous survey of crop-specific fertilizer and manure use at subnational scale, development of dynamic global land use data, and crop rotation maps with more precise regional patterns are important for improving the resolution and accuracy of geospatial fertilizer and manure data. Additionally, considering fertilizer and manure application timing in the data is also important for agricultural nutrient management, which relies on the efforts and investigations regarding the fertilizer and manure application behavior at multiple spatial scales.
The History of anthropogenic Nitrogen inputs (HaNi) dataset is available at https://doi.org/10.1594/PANGAEA.942069 (Tian et al., 2022).
In this work, we developed a global annual anthropogenic N input dataset at 5 arcmin resolution for the period from 1860 to 2019 by integrating multiple available databases into a uniform framework. This dataset characterizes the History of anthropogenic Nitrogen inputs (HaNi), including major pathways and species of anthropogenic N input to the terrestrial biosphere, such as synthetic fertilizer N use on cropland and pasture, manure N application on cropland and pasture, manure N deposition in pasture and rangeland, and atmospheric N deposition. The TN input to global terrestrial ecosystems has increased rapidly since the 1940s due to the widespread usage of synthetic N fertilizer, although this increase started to slow down after 2010. The hotspots of TN inputs shifted from Europe and North America to eastern and southern Asia. The TN inputs in North America, Europe, and East and South Asia were dominated by synthetic fertilizer, whereas those in Central and South America, Africa, Central and West Asia, and Oceania were dominated by livestock manure. The N usage varied significantly under different socioeconomic circumstances, but the N use–GDP relationships could still provide a valuable reference for the future projection of global anthropogenic N inputs. The HaNi dataset can serve as input data for a wide variety of modeling studies regarding the Earth system and its components (land, water, atmosphere, and ocean), providing detailed information for the assessment of anthropogenic N enrichment impacts on global N cycling and cascading effects on the climate, ecosystem, and air and water quality. These data will keep being updated in the future.
The supplement related to this article is available online at: https://doi.org/10.5194/essd-14-4551-2022-supplement.
HT designed this work. ZB, HS, and XQ performed the study and developed the datasets. NP plotted all figures. FNT and GC provided the FAO dataset. NM provided the crop-specific fertilizer and manure datasets. KN provided the fertilizer-type dataset. SP, CL, and RX proposed the methods for the study. All authors contributed to writing the paper.
At least one of the (co-)authors is a member of the editorial board of Earth System Science Data. The peer-review process was guided by an independent editor, and the authors also have no other competing interests to declare.
The views expressed in this publication are those of the author(s) and do not necessarily reflect the views or policies of FAO.
Publisher's note: Copernicus Publications remains neutral with regard to jurisdictional claims in published maps and institutional affiliations.
The authors wish to thank James Gerber for providing us with data on crop-specific nitrogen manure application. We also greatly appreciate the constructive comments and suggestions from Feng Zhou and Eduardo Aguilera.
This study has been partly supported by National Science Foundation (grant nos. 1903722 and 1922687) and the Andrew Carnegie Fellows program (grant no. G-F-19-56910). Junguo Liu received support from the National Natural Science Foundation of China (grant no. 41625001). Hao Shi and Xiaoyu Qin received support from the National Key R&D Program of China (grant no. 2017YFA0604702) and the National Natural Science Foundation of China (grant no. 41961124006). Francesco N. Tubiello has been supported by funding from the FAO regular program. Kazuya Nishina has been supported by a project (JPNP18016) commissioned by the New Energy and Industrial Technology Development Organization (NEDO) and a JSPS KAKENHI grant (grant no. JP18K11672). Jinfeng Chang has been supported by the Fundamental Research Funds for the Central Universities (grant no. 2021QNA6005).
This paper was edited by Giuseppe M.R. Manzella and reviewed by Feng Zhou and Eduardo Aguilera.
Bargu, S., Justic, D., White, J. R., Lane, R., Day, J., Paerl, H., and Raynie, R.: Mississippi River diversions and phytoplankton dynamics in deltaic Gulf of Mexico estuaries: A review, Estuar. Coast. Shelf Sci., 221, 39–52, https://doi.org/10.1016/j.ecss.2019.02.020, 2019.
Bian, Z., Tian, H., Yang, Q., Xu, R., Pan, S., and Zhang, B.: Production and application of manure nitrogen and phosphorus in the United States since 1860, Earth Syst. Sci. Data, 13, 515–527, https://doi.org/10.5194/essd-13-515-2021, 2021.
Bouwman, A., Drecht, G., and Van der Hoek, K.: Surface N balances and reactive N loss to the environment from global intensive agricultural production systems for the period 1970–2030, Sci. China Ser. Life Sci., 48, 767–79, https://doi.org/10.1007/BF03187117, 2005.
Campbell, B. D. and Stafford Smith, D. M.: A synthesis of recent global change research on pasture and rangeland production: reduced uncertainties and their management implications, Agr. Ecosyst. Environ., 82, 39–55, https://doi.org/10.1016/S0167-8809(00)00215-2, 2000.
Chang, J., Havlík, P., Leclère, D., de Vries, W., Valin, H., Deppermann, A., Hasegawa, T., and Obersteiner, M.: Reconciling regional nitrogen boundaries with global food security, Nat. Food, 2, 700–711, 2021.
Cherr, C. M., Scholberg, J. M. S., and McSorley, R.: Green manure approaches to crop production: A synthesis, Agron. J., 98, 302–319, 2006.
Cui, X., Zhou, F., Ciais, P., Davidson, E. A., Tubiello, F. N., Niu, X., Ju, X., Canadell, J. G., Bouwman, A. F., Jackson, R. B., Mueller, N. D., Zheng, X., Kanter, D. R., Tian, H., Adalibieke, W., Bo, Y., Wang, Q., Zhan, X., and Zhu, D.: Global mapping of crop-specific emission factors highlights hotspots of nitrous oxide mitigation, Nat. Food, 2, 886–893, https://doi.org/10.1038/s43016-021-00384-9, 2021.
Cui, Z., Zhang, H., Chen, X., Zhang, C., Ma, W., Huang, C., Zhang, W., Mi, G., Miao, Y., and Li, X.: Pursuing sustainable productivity with millions of smallholder farmers, Nature, 555, 363–366, 2018.
Dodds, W. K.: Nutrients and the “dead zone”: the link between nutrient ratios and dissolved oxygen in the northern Gulf of Mexico, Front. Ecol. Environ., 4, 211–217, https://doi.org/10.1890/1540-9295(2006)004[0211:NATDZT]2.0.CO;2, 2006.
Dong, H., Mangino, J., McAllister, T., Hatfield, J. L., Johnson, D. E., Lassey, K. R., Aparecida de Lima, M., and Romanovskaya, A.: Emissions from livestock and manure management, in: Intergovernmental Panel on Climate Change, 2006 IPCC guidelines for national greenhouse gas inventories, edited by: Eggleston, S., et al., Vol. 4., Agriculture, forestry and other land use, http://www.ipcc-nggip.iges.or.jp/public/2006gl/vol4.html (last access: 5 March 2008), 2006.
Eickhout, B., Bouwman, A. F., and van Zeijts, H.: The role of nitrogen in world food production and environmental sustainability, Agr. Ecosyst. Environ., 116, 4–14, https://doi.org/10.1016/j.agee.2006.03.009, 2006.
Eyring, V., Lamarque, J.-F., Hess, P., Arfeuille, F., Bowman, K., Chipperfiel, M. P., Duncan, B., Fiore, A., Gettelman, A., and Giorgetta, M. A.: Overview of IGAC/SPARC Chemistry-Climate Model Initiative (CCMI) community simulations in support of upcoming ozone and climate assessments, SPARC Newsl., 40, 48–66, 2013.
FAOSTAT (Food and Agriculture Organization Corporate Statistical Database): FAO online database, http://www.fao.org/faostat/en/#data, last access: July 2021.
Fowler, D., Coyle, M., Skiba, U., Sutton, M. A., Cape, J. N., Reis, S., Sheppard, L. J., Jenkins, A., Grizzetti, B., Galloway, J. N., Vitousek, P., Leach, A., Bouwman, A. F., Butterbach-Bahl, K., Dentener, F., Stevenson, D., Amann, M., and Voss, M.: The global nitrogen cycle in the twenty-first century, Philos. T. R. Soc. B, 368, 20130164, https://doi.org/10.1098/rstb.2013.0164, 2013.
Friedlingstein, P., O'Sullivan, M., Jones, M. W., Andrew, R. M., Hauck, J., Olsen, A., Peters, G. P., Peters, W., Pongratz, J., Sitch, S., Le Quéré, C., Canadell, J. G., Ciais, P., Jackson, R. B., Alin, S., Aragão, L. E. O. C., Arneth, A., Arora, V., Bates, N. R., Becker, M., Benoit-Cattin, A., Bittig, H. C., Bopp, L., Bultan, S., Chandra, N., Chevallier, F., Chini, L. P., Evans, W., Florentie, L., Forster, P. M., Gasser, T., Gehlen, M., Gilfillan, D., Gkritzalis, T., Gregor, L., Gruber, N., Harris, I., Hartung, K., Haverd, V., Houghton, R. A., Ilyina, T., Jain, A. K., Joetzjer, E., Kadono, K., Kato, E., Kitidis, V., Korsbakken, J. I., Landschützer, P., Lefèvre, N., Lenton, A., Lienert, S., Liu, Z., Lombardozzi, D., Marland, G., Metzl, N., Munro, D. R., Nabel, J. E. M. S., Nakaoka, S.-I., Niwa, Y., O'Brien, K., Ono, T., Palmer, P. I., Pierrot, D., Poulter, B., Resplandy, L., Robertson, E., Rödenbeck, C., Schwinger, J., Séférian, R., Skjelvan, I., Smith, A. J. P., Sutton, A. J., Tanhua, T., Tans, P. P., Tian, H., Tilbrook, B., van der Werf, G., Vuichard, N., Walker, A. P., Wanninkhof, R., Watson, A. J., Willis, D., Wiltshire, A. J., Yuan, W., Yue, X., and Zaehle, S.: Global Carbon Budget 2020, Earth Syst. Sci. Data, 12, 3269–3340, https://doi.org/10.5194/essd-12-3269-2020, 2020.
Galloway, J. N. and Cowling, E. B.: Reactive Nitrogen and The World: 200 Years of Change, AMBIO J. Hum. Environ., 31, 64–71, https://doi.org/10.1579/0044-7447-31.2.64, 2002.
Galloway, J. N., Aber, J. D., Erisman, J. W., Seitzinger, S. P., Howarth, R. W., Cowling, E. B., and Cosby, B. J.: The nitrogen cascade, Bioscience, 53, 341–356, 2003.
Galloway, J. N., Bleeker, A., and Erisman, J. W.: The Human Creation and Use of Reactive Nitrogen: A Global and Regional Perspective, Annu. Rev. Environ. Resour., 46, 255–288, https://doi.org/10.1146/annurev-environ-012420-045120, 2021.
Gilbert, M., Nicolas, G., Cinardi, G., Van Boeckel, T. P., Vanwambeke, S. O., Wint, G. W., and Robinson, T. P.: Global distribution data for cattle, buffaloes, horses, sheep, goats, pigs, chickens and ducks in 2010, Sci. Data, 5, 1–11, 2018.
Gruber, N. and Galloway, J. N.: An Earth-system perspective of the global nitrogen cycle, Nature, 451, 293–296, https://doi.org/10.1038/nature06592, 2008.
Herridge, D. F., Peoples, M. B., and Boddey, R. M.: Global inputs of biological nitrogen fixation in agricultural systems, Plant Soil, 311, 1–18, https://doi.org/10.1007/s11104-008-9668-3, 2008.
Holland, E. A., Lee-Taylor, J., Nevison, C., and Sulzman, J. M.: Global N Cycle: Fluxes and N2O Mixing Ratios Originating from Human Activity. ORNL DAAC, Oak Ridge, Tennessee, USA, https://doi.org/10.3334/ORNLDAAC/797, 2005.
Houlton, B. Z., Almaraz, M., Aneja, V., Austin, A. T., Bai, E., Cassman, K. G., Compton, J. E., Davidson, E. A., Erisman, J. W., Galloway, J. N., Gu, B., Yao, G., Martinelli, L. A., Scow, K., Schlesinger, W. H., Tomich, T. P., Wang, C., and Zhang, X.: A World of Cobenefits: Solving the Global Nitrogen Challenge, Earths Future, 7, 865–872, https://doi.org/10.1029/2019EF001222, 2019.
Howarth, R. W.: Coastal nitrogen pollution: A review of sources and trends globally and regionally, Harmful Algae, 8, 14–20, https://doi.org/10.1016/j.hal.2008.08.015, 2008.
Hurtt, G. C., Chini, L., Sahajpal, R., Frolking, S., Bodirsky, B. L., Calvin, K., Doelman, J. C., Fisk, J., Fujimori, S., Klein Goldewijk, K., Hasegawa, T., Havlik, P., Heinimann, A., Humpenöder, F., Jungclaus, J., Kaplan, J. O., Kennedy, J., Krisztin, T., Lawrence, D., Lawrence, P., Ma, L., Mertz, O., Pongratz, J., Popp, A., Poulter, B., Riahi, K., Shevliakova, E., Stehfest, E., Thornton, P., Tubiello, F. N., van Vuuren, D. P., and Zhang, X.: Harmonization of global land use change and management for the period 850–2100 (LUH2) for CMIP6, Geosci. Model Dev., 13, 5425–5464, https://doi.org/10.5194/gmd-13-5425-2020, 2020.
Kanter, D. R., Bartolini, F., Kugelberg, S., Leip, A., Oenema, O., and Uwizeye, A.: Nitrogen pollution policy beyond the farm, Nat. Food, 1, 27–32, https://doi.org/10.1038/s43016-019-0001-5, 2020.
Klein Goldewijk, K., Beusen, A., Doelman, J., and Stehfest, E.: Anthropogenic land use estimates for the Holocene – HYDE 3.2, Earth Syst. Sci. Data, 9, 927–953, https://doi.org/10.5194/essd-9-927-2017, 2017.
Lark, T. J., Spawn, S. A., Bougie, M., and Gibbs, H. K.: Cropland expansion in the United States produces marginal yields at high costs to wildlife, Nat. Commun., 11, 1–11, 2020.
Lassaletta, L., Billen, G., Grizzetti, B., Anglade, J., and Garnier, J.: 50 year trends in nitrogen use efficiency of world cropping systems: the relationship between yield and nitrogen input to cropland, Environ. Res. Lett., 9, 105011, https://doi.org/10.1088/1748-9326/9/10/105011, 2014.
Lassaletta, L., Billen, G., Garnier, J., Bouwman, L., Velazquez, E., Mueller, N. D., and Gerber, J. S.: Nitrogen use in the global food system: past trends and future trajectories of agronomic performance, pollution, trade, and dietary demand, Environ. Res. Lett., 11, 095007, https://doi.org/10.1088/1748-9326/11/9/095007, 2016.
Li, Y., Schichtel, B. A., Walker, J. T., Schwede, D. B., Chen, X., Lehmann, C. M., Puchalski, M. A., Gay, D. A., and Collett, J. L.: Increasing importance of deposition of reduced nitrogen in the United States, P. Natl. Acad. Sci. USA, 113, 5874–5879, 2016.
Lim, J. Y., Bhuiyan, M. S. I., Lee, S. B., Lee, J. G., and Kim, P. J.: Agricultural nitrogen and phosphorus balances of Korea and Japan: Highest nutrient surplus among OECD member countries, Environ. Pollut., 286, 117353, 2021.
Liu, J., You, L., Amini, M., Obersteiner, M., Herrero, M., Zehnder, A. J. B., and Yang, H.: A high-resolution assessment on global nitrogen flows in cropland, P. Natl. Acad. Sci. USA, 107, 8035–8040, https://doi.org/10.1073/pnas.0913658107, 2010.
Liu, J., Ma, K., Ciais, P., and Polasky, S.: Reducing human nitrogen use for food production, Sci. Rep., 6, 30104, https://doi.org/10.1038/srep30104, 2016.
Lu, C. and Tian, H.: Global nitrogen and phosphorus fertilizer use for agriculture production in the past half century: shifted hot spots and nutrient imbalance, Earth Syst. Sci. Data, 9, 181–192, https://doi.org/10.5194/essd-9-181-2017, 2017.
Lun, F., Liu, J., Ciais, P., Nesme, T., Chang, J., Wang, R., Goll, D., Sardans, J., Peñuelas, J., and Obersteiner, M.: Global and regional phosphorus budgets in agricultural systems and their implications for phosphorus-use efficiency, Earth Syst. Sci. Data, 10, 1–18, https://doi.org/10.5194/essd-10-1-2018, 2018.
Melillo, J. M.: Disruption of the global nitrogen cycle: A grand challenge for the twenty-first century, Ambio, 50, 759–763, https://doi.org/10.1007/s13280-020-01429-2, 2021.
Meter, K. J. V., Cappellen, P. V., and Basu, N. B.: Legacy nitrogen may prevent achievement of water quality goals in the Gulf of Mexico, Science, 360, 427–430, https://doi.org/10.1126/science.aar4462, 2018.
Monfreda, C., Ramankutty, N., and Foley, J. A.: Farming the planet: 2. Geographic distribution of crop areas, yields, physiological types, and net primary production in the year 2000, Global Biogeochem. Cy., 22, GB1022, https://doi.org/10.1029/2007GB002947, 2008.
Morgenstern, O., Hegglin, M. I., Rozanov, E., O'Connor, F. M., Abraham, N. L., Akiyoshi, H., Archibald, A. T., Bekki, S., Butchart, N., Chipperfield, M. P., Deushi, M., Dhomse, S. S., Garcia, R. R., Hardiman, S. C., Horowitz, L. W., Jöckel, P., Josse, B., Kinnison, D., Lin, M., Mancini, E., Manyin, M. E., Marchand, M., Marécal, V., Michou, M., Oman, L. D., Pitari, G., Plummer, D. A., Revell, L. E., Saint-Martin, D., Schofield, R., Stenke, A., Stone, K., Sudo, K., Tanaka, T. Y., Tilmes, S., Yamashita, Y., Yoshida, K., and Zeng, G.: Review of the global models used within phase 1 of the Chemistry–Climate Model Initiative (CCMI), Geosci. Model Dev., 10, 639–671, https://doi.org/10.5194/gmd-10-639-2017, 2017.
Mueller, N. D., Gerber, J. S., Johnston, M., Ray, D. K., Ramankutty, N., and Foley, J. A.: Closing yield gaps through nutrient and water management, Nature, 490, 254–257, https://doi.org/10.1038/nature11420, 2012.
Nishina, K., Ito, A., Hanasaki, N., and Hayashi, S.: Reconstruction of spatially detailed global map of and application in synthetic nitrogen fertilizer, Earth Syst. Sci. Data, 9, 149–162, https://doi.org/10.5194/essd-9-149-2017, 2017.
Pan, S., Bian, Z., Tian, H., Yao, Y., Najjar, R. G., Friedrichs, M. A. M., Hofmann, E. E., Xu, R., and Zhang, B.: Impacts of Multiple Environmental Changes on Long-Term Nitrogen Loading From the Chesapeake Bay Watershed, J. Geophys. Res.-Biogeo., 126, e2020JG005826, https://doi.org/10.1029/2020JG005826, 2021.
Peñuelas, J. and Sardans, J.: The global nitrogen-phosphorus imbalance, Science, 375, 266–267, https://doi.org/10.1126/science.abl4827, 2022.
Potter, P., Ramankutty, N., Bennett, E. M., and Donner, S. D.: Characterizing the Spatial Patterns of Global Fertilizer Application and Manure Production, Earth Interact., 14, 1–22, https://doi.org/10.1175/2009EI288.1, 2010.
Rabalais, N. N. and Turner, R. E.: Gulf of Mexico Hypoxia: Past, Present, and Future, Limnol. Oceanogr., 28, 117–124, https://doi.org/10.1002/lob.10351, 2019.
Schlesinger, W. H. and Bernhardt, E. S.: Biogeochemistry: An Analysis of Global Change, Academic Press, San Diego, USA, 2013.
Schlesinger, W. H., Reckhow, K. H., and Bernhardt, E. S.: Global change: The nitrogen cycle and rivers, Water Resour. Res., 42, W03S06, https://doi.org/10.1029/2005WR004300, 2006.
Stewart, W. M. and Roberts, T. L.: Food Security and the Role of Fertilizer in Supporting it, Procedia Eng., 46, 76–82, https://doi.org/10.1016/j.proeng.2012.09.448, 2012.
Sutton, M. A., Bleeker, A., Howard, C. M., Erisman, J. W., Abrol, Y. P., Bekunda, M., Datta, A., Davidson, E., De Vries, W., and Oenema, O.: Our nutrient world: the challenge to produce more food and energy with less pollution Global Overview of Nutrient Management, Centre for Ecology and Hydrology, Edinburgh, UK, https://library.wur.nl/WebQuery/wurpubs/reports/434951 (last access: 18 November 2021), 2013.
Sutton, M. A., Howard, C. M., Kanter, D. R., Lassaletta, L., Móring, A., Raghuram, N., and Read, N.: The nitrogen decade: mobilizing global action on nitrogen to 2030 and beyond, One Earth, 4, 10–14, https://doi.org/10.1016/j.oneear.2020.12.016, 2021.
Tian, H., Yang, J., Lu, C., Xu, R., Canadell, J. G., Jackson, R. B., Arneth, A., Chang, J., Chen, G., Ciais, P., Gerber, S., Ito, A., Huang, Y., Joos, F., Lienert, S., Messina, P., Olin, S., Pan, S., Peng, C., Saikawa, E., Thompson, R. L., Vuichard, N., Winiwarter, W., Zaehle, S., Zhang, B., Zhang, K., and Zhu, Q.: The Global N2O Model Intercomparison Project, B. Am. Meteorol. Soc., 99, 1231–1251, https://doi.org/10.1175/BAMS-D-17-0212.1, 2018.
Tian, H., Yang, J., Xu, R., Lu, C., Canadell, J. G., Davidson, E. A., Jackson, R. B., Arneth, A., Chang, J., Ciais, P., Gerber, S., Ito, A., Joos, F., Lienert, S., Messina, P., Olin, S., Pan, S., Peng, C., Saikawa, E., Thompson, R. L., Vuichard, N., Winiwarter, W., Zaehle, S., and Zhang, B.: Global soil nitrous oxide emissions since the preindustrial era estimated by an ensemble of terrestrial biosphere models: Magnitude, attribution, and uncertainty, Glob. Change Biol., 25, 640–659, https://doi.org/10.1111/gcb.14514, 2019.
Tian, H., Xu, R., Canadell, J. G., Thompson, R. L., Winiwarter, W., Suntharalingam, P., Davidson, E. A., Ciais, P., Jackson, R. B., Janssens-Maenhout, G., Prather, M. J., Regnier, P., Pan, N., Pan, S., Peters, G. P., Shi, H., Tubiello, F. N., Zaehle, S., Zhou, F., Arneth, A., Battaglia, G., Berthet, S., Bopp, L., Bouwman, A. F., Buitenhuis, E. T., Chang, J., Chipperfield, M. P., Dangal, S. R. S., Dlugokencky, E., Elkins, J. W., Eyre, B. D., Fu, B., Hall, B., Ito, A., Joos, F., Krummel, P. B., Landolfi, A., Laruelle, G. G., Lauerwald, R., Li, W., Lienert, S., Maavara, T., MacLeod, M., Millet, D. B., Olin, S., Patra, P. K., Prinn, R. G., Raymond, P. A., Ruiz, D. J., van der Werf, G. R., Vuichard, N., Wang, J., Weiss, R. F., Wells, K. C., Wilson, C., Yang, J., and Yao, Y.: A comprehensive quantification of global nitrous oxide sources and sinks, Nature, 586, 248–256, https://doi.org/10.1038/s41586-020-2780-0, 2020a.
Tian, H., Xu, R., Pan, S., Yao, Y., Bian, Z., Cai, W.-J., Hopkinson, C. S., Justic, D., Lohrenz, S., Lu, C., Ren, W., and Yang, J.: Long-Term Trajectory of Nitrogen Loading and Delivery From Mississippi River Basin to the Gulf of Mexico, Global Biogeochem. Cy., 34, e2019GB006475, https://doi.org/10.1029/2019GB006475, 2020b.
Tian, H., Bian, Z., Shi, H., Qin, X., Pan, N., Lu, C., Pan, S., Tubiello, F. N., Chang, J., Conchedda, G., Liu, J., Mueller, N., Nishina, K., Xu, R., Yang, J., You, L., and Zhang, B.: HaNi: A Historical dataset of Anthropogenic Nitrogen Inputs to the terrestrial biosphere (1860–2019), PANGAEA, https://doi.org/10.1594/PANGAEA.942069, 2022.
van den Berg, L. J., Jones, L., Sheppard, L. J., Smart, S. M., Bobbink, R., Dise, N. B., and Ashmore, M. R.: Evidence for differential effects of reduced and oxidised nitrogen deposition on vegetation independent of nitrogen load, Environ. Pollut., 208, 890–897, 2016.
Van Grinsven, H. J. M., Spiertz, J. H. J., Westhoek, H. J., Bouwman, A. F., and Erisman, J. W.: Nitrogen use and food production in European regions from a global perspective, J. Agr. Sci., 152, 9–19, 2014.
Vitousek, P. M., Aber, J. D., Howarth, R. W., Likens, G. E., Matson, P. A., Schindler, D. W., Schlesinger, W. H., and Tilman, D. G.: Human Alteration of the Global Nitrogen Cycle: Sources and Consequences, Ecol. Appl., 7, 737–750, https://doi.org/10.1890/1051-0761(1997)007[0737:HAOTGN]2.0.CO;2, 1997.
Wang, Q., Zhou, F., Shang, Z., Ciais, P., Winiwarter, W., Jackson, R. B., Tubiello, F. N., Janssens-Maenhout, G., Tian, H., Cui, X., Canadell, J. G., Piao, S., and Tao, S.: Data-driven estimates of global nitrous oxide emissions from croplands, Natl. Sci. Rev., 7, 441–452, https://doi.org/10.1093/nsr/nwz087, 2020.
Ward, B.: The Global Nitrogen Cycle, in: Fundamentals of Geobiology, edited by: Knoll, A. H., Canfield, D. E., and Konhauser, K. O., John Wiley & Sons, Ltd, Chichester, UK, 36–48, https://doi.org/10.1002/9781118280874.ch4, 2012.
West, P. C., Gerber, J. S., Engstrom, P. M., Mueller, N. D., Brauman, K. A., Carlson, K. M., Cassidy, E. S., Johnston, M., MacDonald, G. K., Ray, D. K., and Siebert, S.: Leverage points for improving global food security and the environment, Science, 345, 325–328, https://doi.org/10.1126/science.1246067, 2014.
Wu, Y., Xi, X., Tang, X., Luo, D., Gu, B., Lam, S. K., Vitousek, P. M., and Chen, D.: Policy distortions, farm size, and the overuse of agricultural chemicals in China, P. Natl. Acad. Sci. USA, 115, 7010–7015, 2018.
Xiong, Z. Q., Freney, J. R., Mosier, A. R., Zhu, Z. L., Lee, Y., and Yagi, K.: Impacts of population growth, changing food preferences and agricultural practices on the nitrogen cycle in East Asia, Nutr. Cycl. Agroecosys., 80, 189–198, 2008.
Xu, R., Tian, H., Pan, S., Prior, S. A., Feng, Y., Batchelor, W. D., Chen, J., and Yang, J.: Global ammonia emissions from synthetic nitrogen fertilizer applications in agricultural systems: Empirical and process-based estimates and uncertainty, Glob. Change Biol., 25, 314–326, https://doi.org/10.1111/gcb.14499, 2019a.
Xu, R., Tian, H., Pan, S., Dangal, S. R. S., Chen, J., Chang, J., Lu, Y., Skiba, U. M., Tubiello, F. N., and Zhang, B.: Increased nitrogen enrichment and shifted patterns in the world's grassland: 1860–2016, Earth Syst. Sci. Data, 11, 175–187, https://doi.org/10.5194/essd-11-175-2019, 2019b.
Yan, L., Xu, X., and Xia, J.: Different impacts of external ammonium and nitrate addition on plant growth in terrestrial ecosystems: A meta-analysis, Sci. Total Environ., 686, 1010–1018, 2019.
Yu, Z. and Lu, C.: Historical cropland expansion and abandonment in the continental U.S. during 1850 to 2016, Glob. Ecol. Biogeogr., 27, 322–333, https://doi.org/10.1111/geb.12697, 2018.
Zhang, B., Tian, H., Lu, C., Dangal, S. R. S., Yang, J., and Pan, S.: Global manure nitrogen production and application in cropland during 1860–2014: a 5 arcmin gridded global dataset for Earth system modeling, Earth Syst. Sci. Data, 9, 667–678, https://doi.org/10.5194/essd-9-667-2017, 2017.
Zhang, J., Cao, P., and Lu, C.: Half-Century History of Crop Nitrogen Budget in the Conterminous United States: Variations Over Time, Space and Crop Types, Global Biogeochem. Cy., 35, e2020GB006876, https://doi.org/10.1029/2020GB006876, 2021.
Zhang, L., Tian, H., Shi, H., Pan, S., Chang, J., Dangal, S. R. S., Qin, X., Wang, S., Tubiello, F. N., Canadell, J. G., and Jackson, R. B.: A 130-year global inventory of methane emissions from livestock: Trends, patterns, and drivers, Glob. Change Biol., 28, 5142–5158, https://doi.org/10.1111/gcb.16280, 2022.
Zhang, X., Davidson, E. A., Mauzerall, D. L., Searchinger, T. D., Dumas, P., and Shen, Y.: Managing nitrogen for sustainable development, Nature, 528, 51–59, https://doi.org/10.1038/nature15743, 2015.
Zhang, X., Zou, T., Lassaletta, L., Mueller, N. D., Tubiello, F. N., Lisk, M. D., Lu, C., Conant, R. T., Dorich, C. D., Gerber, J., Tian, H., Bruulsema, T., Maaz, T. M., Nishina, K., Bodirsky, B. L., Popp, A., Bouwman, L., Beusen, A., Chang, J., Havlík, P., Leclère, D., Canadell, J. G., Jackson, R. B., Heffer, P., Wanner, N., Zhang, W., and Davidson, E. A.: Quantification of global and national nitrogen budgets for crop production, Nat. Food, 2, 529–540, https://doi.org/10.1038/s43016-021-00318-5, 2021.
Zhu, X., Yang, R., Han, Y., Hao, J., Liu, C., and Fan, S.: Effects of different NO:NH ratios on the photosynthesis and ultrastructure of lettuce seedlings, Hortic. Environ. Biotechnol., 61, 459–472, 2020.