the Creative Commons Attribution 4.0 License.
the Creative Commons Attribution 4.0 License.
 | 28 Jan 2026
QUADICA v2: extending the large-sample data set for water QUAlity, DIscharge and Catchment Attributes in Germany
Alexander Hubig
Alexander Wachholz
Ulrike Scharfenberger
Sarah Haug
Tam Nguyen
Fanny Sarrazin
Masooma Batool
Andreas Musolff
Rohini Kumar
The QUADICA version 2 dataset significantly expands upon the first version of QUADICA (water QUAlity, DIscharge and Catchment Attributes for large-sample studies in Germany), by incorporating more recent data, additional water quality and driver variables, and more stations with concurrent water quantity data. Specifically, QUADICA v2 extends the water quality time series of the first version up to 2020 and introduces new variables, including water temperature, oxygen, and chlorophyll a concentrations, as well as concentrations of ammonium, sulfate, and geogenic solutes like calcium. These additions enable a more comprehensive understanding of ecological impacts, including eutrophication effects, and water quality dynamics across catchments. Furthermore, the number of stations with both water quality and quantity data has effectively doubled – now covering 637 out of the total 1386 stations – by integrating QUADICA with the CAMELS-DE and Caravan-DE datasets. The inclusion of time series on point and diffuse sources of both nitrogen and phosphorus allows for more thorough investigations of driver-response relationships and nutrient export from catchments. To facilitate visualization and exploration of QUADICA, we provide a user-friendly, interactive R application alongside the online data repository, as well as a browser-based web app for inspecting the dataset. This makes QUADICA v2 a comprehensive dataset that spans from driver to impact variables, offering a valuable resource for researchers and practitioners. QUADICA v2 is available at https://doi.org/10.4211/hs.c2866cd416b94ca386deb5758834311f (Ebeling et al., 2025).
- Article
(10466 KB) - Full-text XML
- BibTeX
- EndNote


High water quality is critical for the health of aquatic ecosystems and humans. Understanding the spatial and temporal variability in water quality variables is essential for effective management and conservation of water resources. Observational data are the key to propelling our understanding of hydrological and biogeochemical processes and complex interactions. Large-sample hydrology (LSH) addresses the “need to balance depth and breadth” (Gupta et al., 2014) and has thus become a cornerstone to understand the generality of patterns and processes across diverse landscape and climate settings.
LSH data sets that combine stream observations with contextual data on catchment attributes and driving forces have gained momentum in recent years. For water quantity, the CAMELS data sets available in several countries (Addor et al., 2017; Alvarez-Garreton et al., 2018; Coxon et al., 2020; Chagas et al., 2020; Fowler et al., 2021; Loritz et al., 2024) and the globally consistent data set Caravan (Kratzert et al., 2023) are prominent examples. For water quality, such comprehensive data sets have been less common, but momentum is increasing with QUADICA (Ebeling et al., 2022) and the recently published CAMELS-Chem datasets from the US (Sterle et al., 2024) and from Switzerland (Do Nascimento et al., 2025), which include not only hydroclimatic drivers but also the temporal evolution of pollution sources (e.g., atmospheric nitrogen deposition and nitrogen surplus as diffuse sources). In parallel, a number of data sets now provide large samples of quality-controlled water quality time series (Zarei et al., 2025; Virro et al., 2021), further complemented by catchment or stream network characteristics (Fernandez et al., 2025; Minaudo et al., 2025).
Comprehensive LSH datasets have various applications. They support data-driven top-down approaches to identify trends and patterns in water quantity and quality time series, and when combined with contextual data help advance our understanding of underlying processes and hierarchies. They also provide forcing, calibration, and validation data for hydrological and water quality models (Nguyen et al., 2022; Van Meter and Basu, 2015). The increased availability of LSH datasets also propelled data-driven machine learning (ML) models using them for training, testing, and validation and improving their performance and generalization ability both in time and space (e.g. ungauged basins). ML models are widely applied and improved for discharge predictions (e.g., Kratzert et al., 2018; Heudorfer et al., 2025) but also increasingly used for water quality parameters (Zhi et al., 2023; Zhi et al., 2021; Saha et al., 2023).
Here, we present the second version of QUADICA (water QUAlity, DIscharge and Catchment Attributes), a significant update to the original dataset (Ebeling et al., 2022). The first version of QUADICA has supported a wide variety of water quality studies, including the characterisation of catchments based on nutrient export processes across different spatial and temporal scales (Ebeling et al., 2021b, a; Ehrhardt et al., 2021), effects of hydroclimatic extreme events on the catchments' nitrate export (droughts, Saavedra et al., 2024; floods, Saavedra et al., 2022), for nutrient stoichiometric characterisation (Wachholz et al., 2023), as well as for disentangling catchment processes using a process-based water quality model (e.g., Nguyen et al., 2022). A particular focus has been the linkage of observed instream water quality responses to drivers, enabled through the provided catchment attributes and driving forces in the form of diffuse nitrogen sources.
Recent shifts in environmental conditions, particularly hydrological extremes such as droughts, have substantial impacts on water quality (Saavedra et al., 2024; Winter et al., 2023; Dupas et al., 2025). This highlights the critical need to extend the QUADICA dataset to include more recent years covering extreme drought years and additional water quality and driver variables, thereby enhancing our ability to understand and address the evolving relationship between environmental change and water quality. Specifically, the update encompasses (1) longer time series up to 2020, capturing recent extreme events such as the 2018–2020 multi-year drought (e.g., Rakovec et al., 2022) with expected effects on solute export (e.g., Winter et al., 2023), (2) additional hydroecological time series such as oxygen and chlorophyll a concentrations, enabling to move from water quantity and quality to ecological impact studies, (3) additional time series of driving forces including point sources and phosphorus inputs, allowing more comprehensive views on input-output (driver-response) relationships, useful e.g. for the quantification of nutrient legacies or model input data, and (4) larger amount of stations with joint water quantity and quality by linking to the recently published and widely known CAMELS-DE (Loritz et al., 2024) and Caravan-DE (Dolich et al., 2024) data sets. With this updated version, we aim to enhance the breadth of the large-sample water quality dataset QUADICA with additional depth, enabling us to address more research questions and ultimately support water quality management.
The 1386 stations and corresponding delineated catchments from the original QUADICA data set (Ebeling et al., 2022) are retained in version 2. Although all stations lie within Germany, 17.9 % of the catchments are transboundary with part of their area in a neighbouring country. Figure 1 shows the study area with updated information on the data availability. As for version 1, water quality and quantity data for QUADICA v2 were assembled from the German federal state authorities and merged with the data from QUADICA v1. This allowed us to extend the time series length as well as add new variables of water quality.
Similar to version 1, we assessed the data availability after quality control of the water quality time series data. After homogenization of variable names, units and formats across all federal states, the preprocessing steps included: (1) removal of duplicates and implausible values (i.e. zero and negative concentrations), (2) removal of outliers within each time series using a mean plus 4 standard deviations threshold (> 99.99 % confidence) in logarithmic space for concentrations and normal space for oxygen concentrations (O2) and water temperature (T), (3) substitution of left-censored values using half of the detection limit, where applicable (i.e. nutrient and mineral concentrations). We additionally removed total organic carbon (TOC) concentrations > 1000 mg L−1, as we identified implausible plateaus of such high values in three stations, for which the outlier test failed.
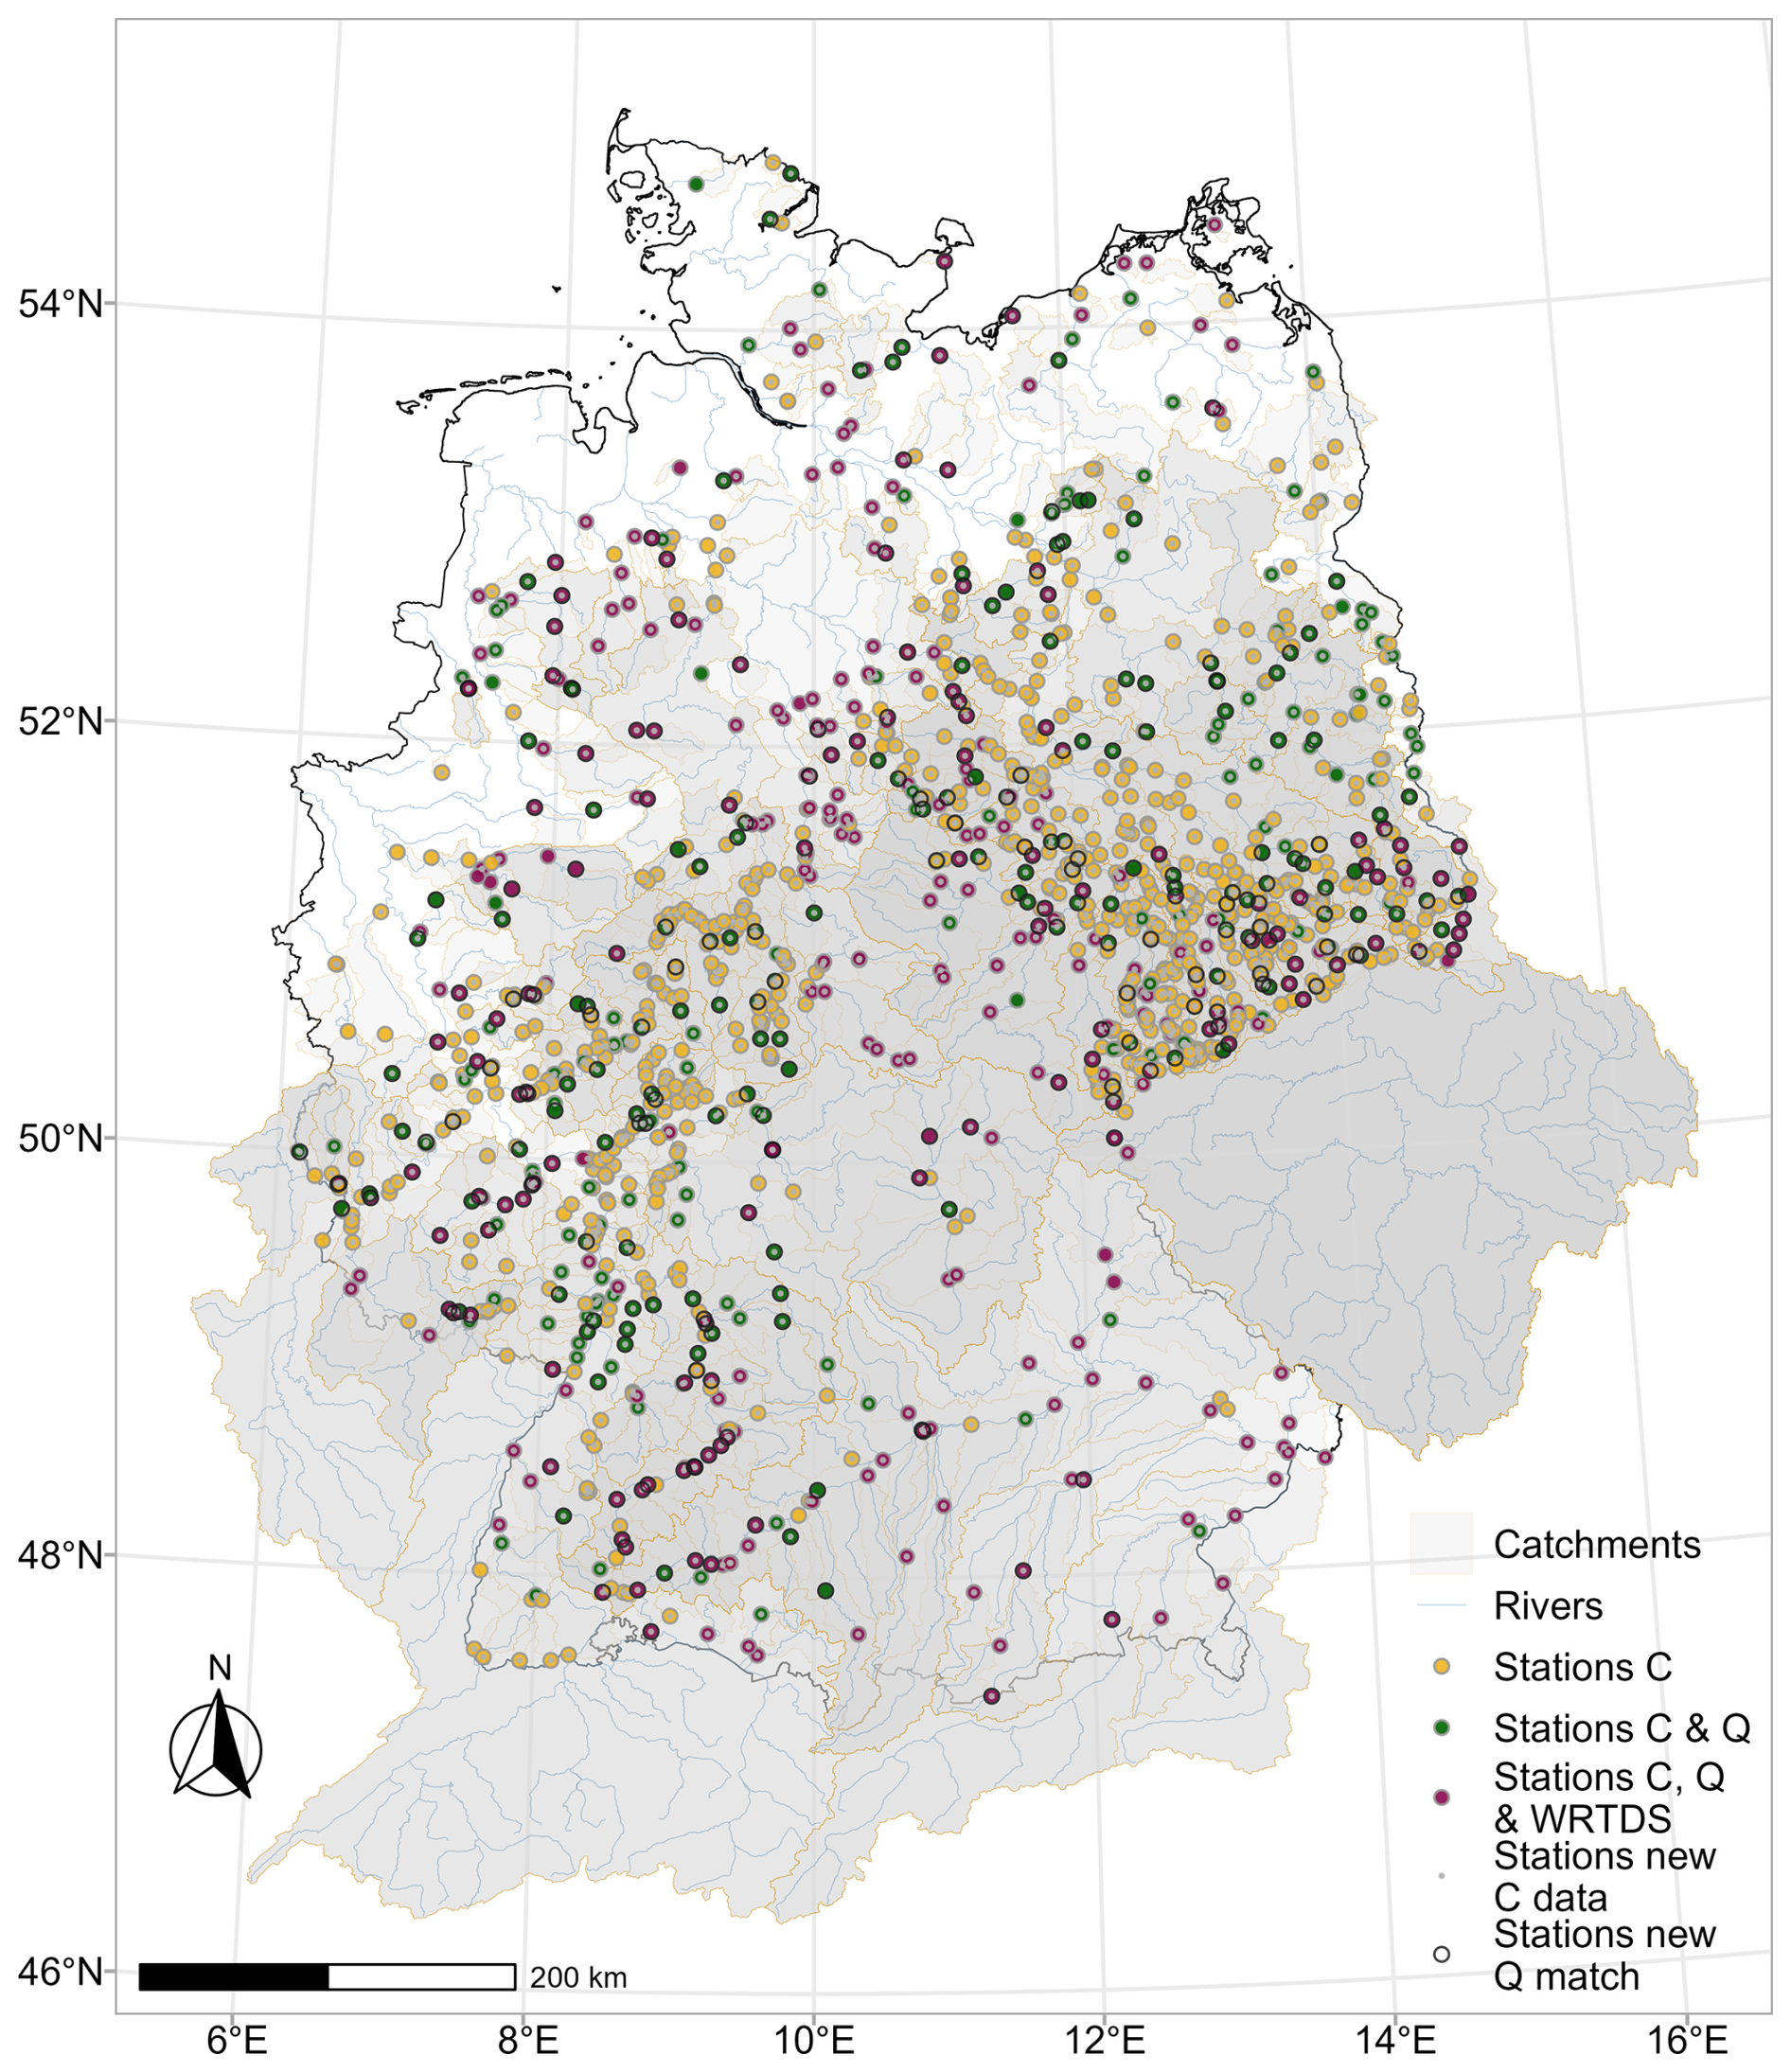
Figure 1Stations and delineated catchments in relation to Germany (black line). Stations are colored according to their data availability, with C – concentration (water quality), Q – discharge (water quantity), and WRTDS – Weighted Regression on Time, Discharge and Season. Stations with extended water quality data (new C data) in version 2 are highlighted as well as stations with newly added continuous discharge data (new Q match) from matching with CAMELS-DE (Loritz et al., 2024) and Caravan-DE (Dolich et al., 2024) data sets (for details, refer to Sect. 3.2). The rivers displayed are taken from De Jager and Vogt (2007). WRTDS is available for stations with high data availability (see Sect. 3.1.2).
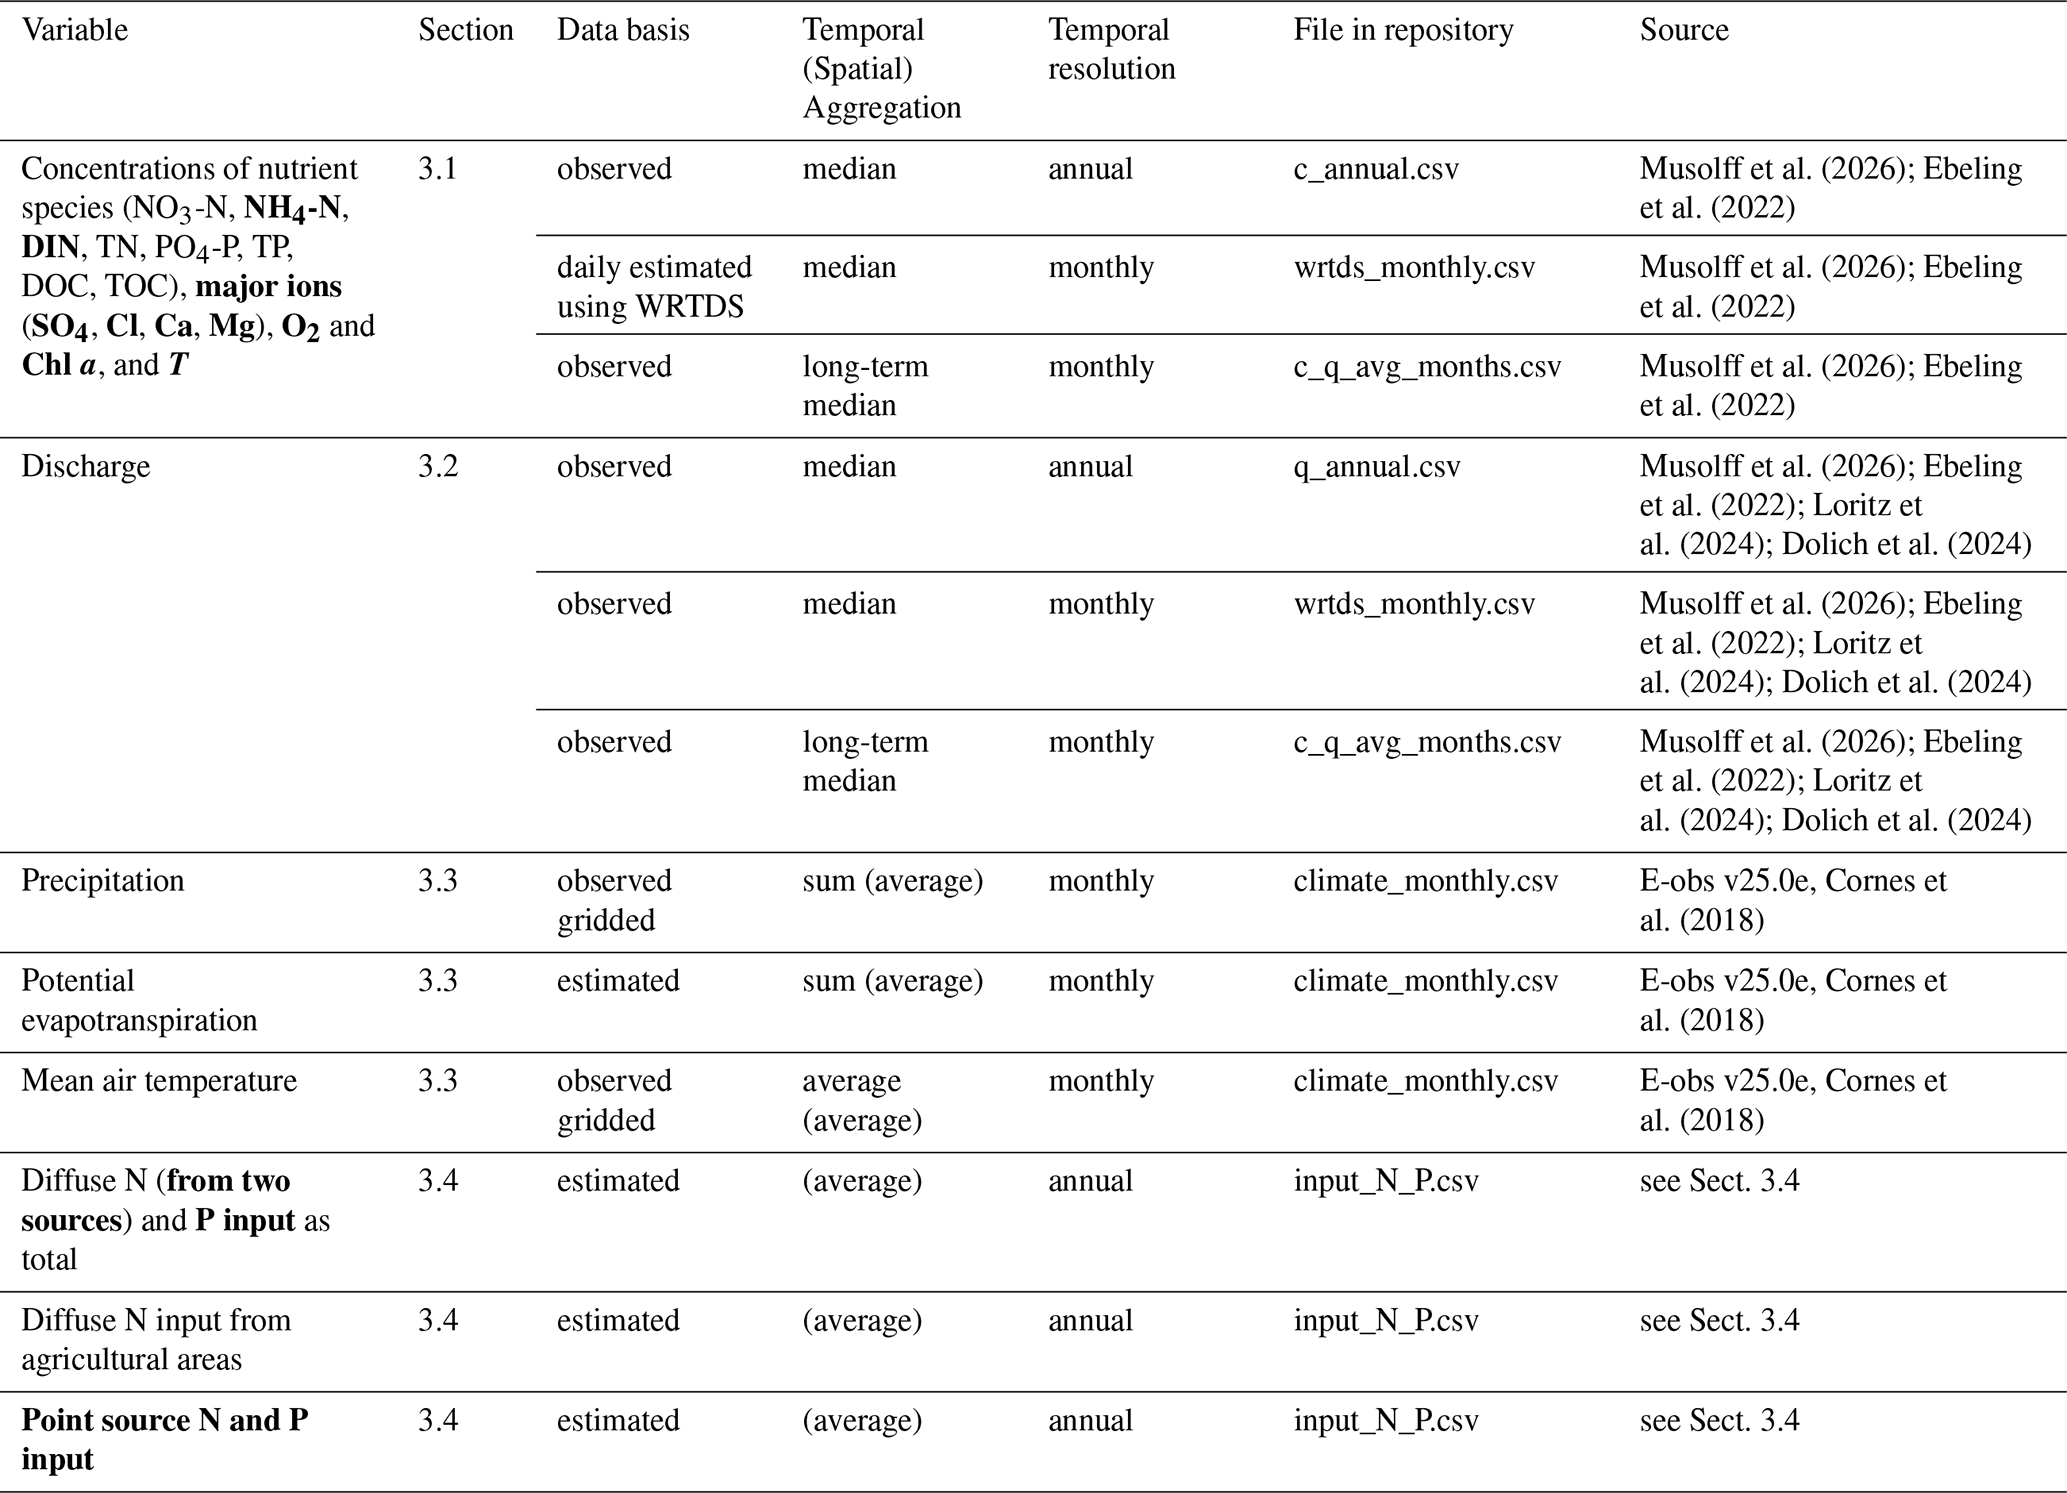
Time series data are provided for 1386 catchments (as in QUADICA v1) for water quality variables (Sect. 3.1) and water quantity (Sect. 3.2), and forcing variables both from meteorological drivers (Sect. 3.3) and nutrient (N and P) inputs from diffuse and point sources (Sect. 3.4). An overview of the provided (and newly added) variables is given in the following and in Table 1, while details are described in the following sections. Appendix B1 provides an overview of data files and respective metadata tables provided in the data repository. Note that due to limited data availability, not all water quality and quantity variables can be provided for all stations.
For water quality, QUADICA version 2 increases the number of variables by adding ammonium (NH-N) to the previously provided nutrient concentrations (NO-N, TN, PO-P, TP, DOC, TOC), major ion concentrations (SO, Cl−, Ca2+, Mg2+), concentrations of O2 and Chlorophyll a (Chl a), and water temperature (T). In version 2, dissolved inorganic nitrogen (DIN) was calculated as the sum of the preprocessed time series of inorganic nitrogen forms NO-N and NH-N, and, if available, NO-N. Note that, for simplicity, the charges are not always written in the following text. For water quantity, the number of stations with discharge data from daily observations was increased from 324 in version 1 to 637 in version 2. For nutrient inputs, time series of catchment-wise diffuse P inputs and point source inputs of N and P were added, while diffuse N sources were both updated as well as extracted from a European data source provided consistently with P.
Table 1Provided time series data, their basis (observed or estimated), aggregation type, temporal resolution and source of original data, which was used to calculate the aggregated data provided here. Bold font indicates the newly added variables in version 2 of the QUADICA data set. WRTDS – Weighted Regression on Time, Discharge and Season. Note that detailed metadata are provided for each data file in the repository, for an overview see Table B1.
3.1 Water quality time series
After quality control of the time series data, different temporal aggregation schemes were implemented to provide consistent data sets. In QUADICA version 2, we provide the time series of annual medians (Sect. 3.1.1), monthly medians for stations with high data availability (Sect. 3.1.2), and long-term monthly averages (Sect. 3.1.3).
3.1.1 Annual median water quality variables
Annual median concentrations are provided based on the preprocessed time series (Sect. 2) for all station-compound combinations. Along with the median concentrations, the number of samples considered for the given value is provided as a control variable for users of the data set, allowing to subset the data based on data availability.
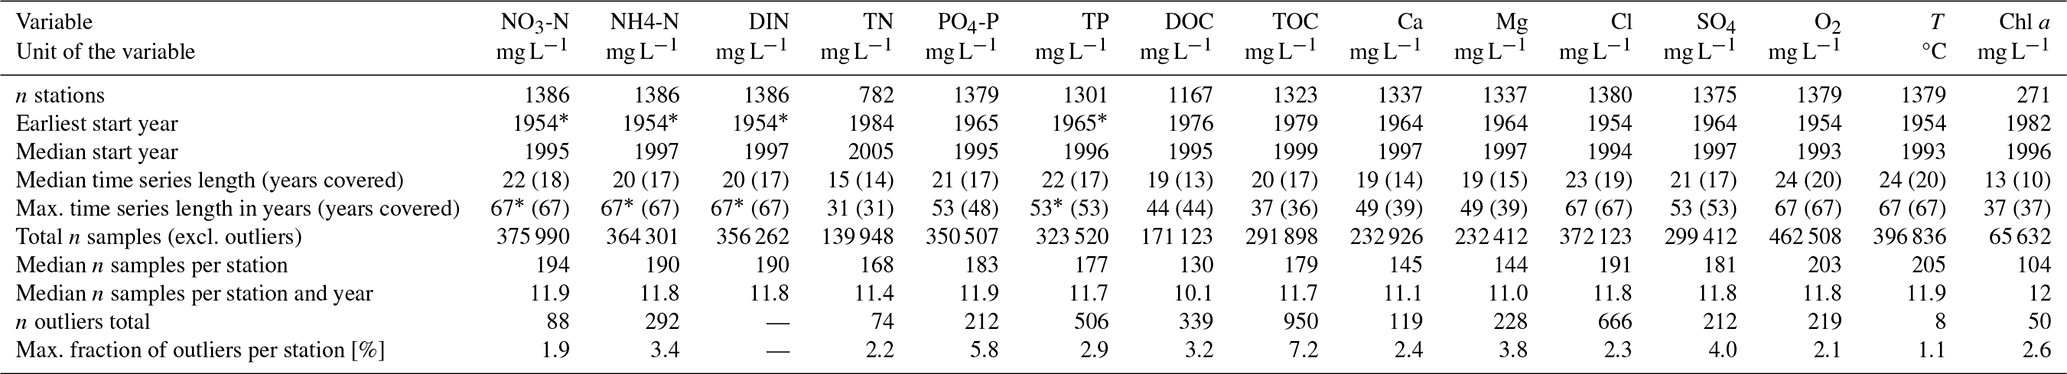
The time series of annual median concentrations are visualized in Figs. A1 and A2, while the corresponding data density is shown in Fig. 2 over the years as well as for the number of years covered per station. A summary of data availability across all variables is provided in Table 2. The highest data availability with more than 1370 stations covered is presented for the inorganic nitrogen (NO3-N, NH4-N, DIN) and phosphorus (PO4-P) compounds, as well as for chloride (Cl), sulfate (SO4), oxygen (O2) and water temperature (T). The highest temporal coverage stretches from the mid-2000s to the mid-2010s. Overall, the median time series lengths vary between 13 (for Chl a) and 24 (O2, T) years. The median number of samples per station varies between 104 (for Chl a) and 205 (for T), while the median average number of samples per year ranges from 10.1 (for DOC) to 11.9 (for NO3-N, PO4-P, and T) and 12.0 (for Chl a), i.e. corresponding to a monthly sampling frequency on average.
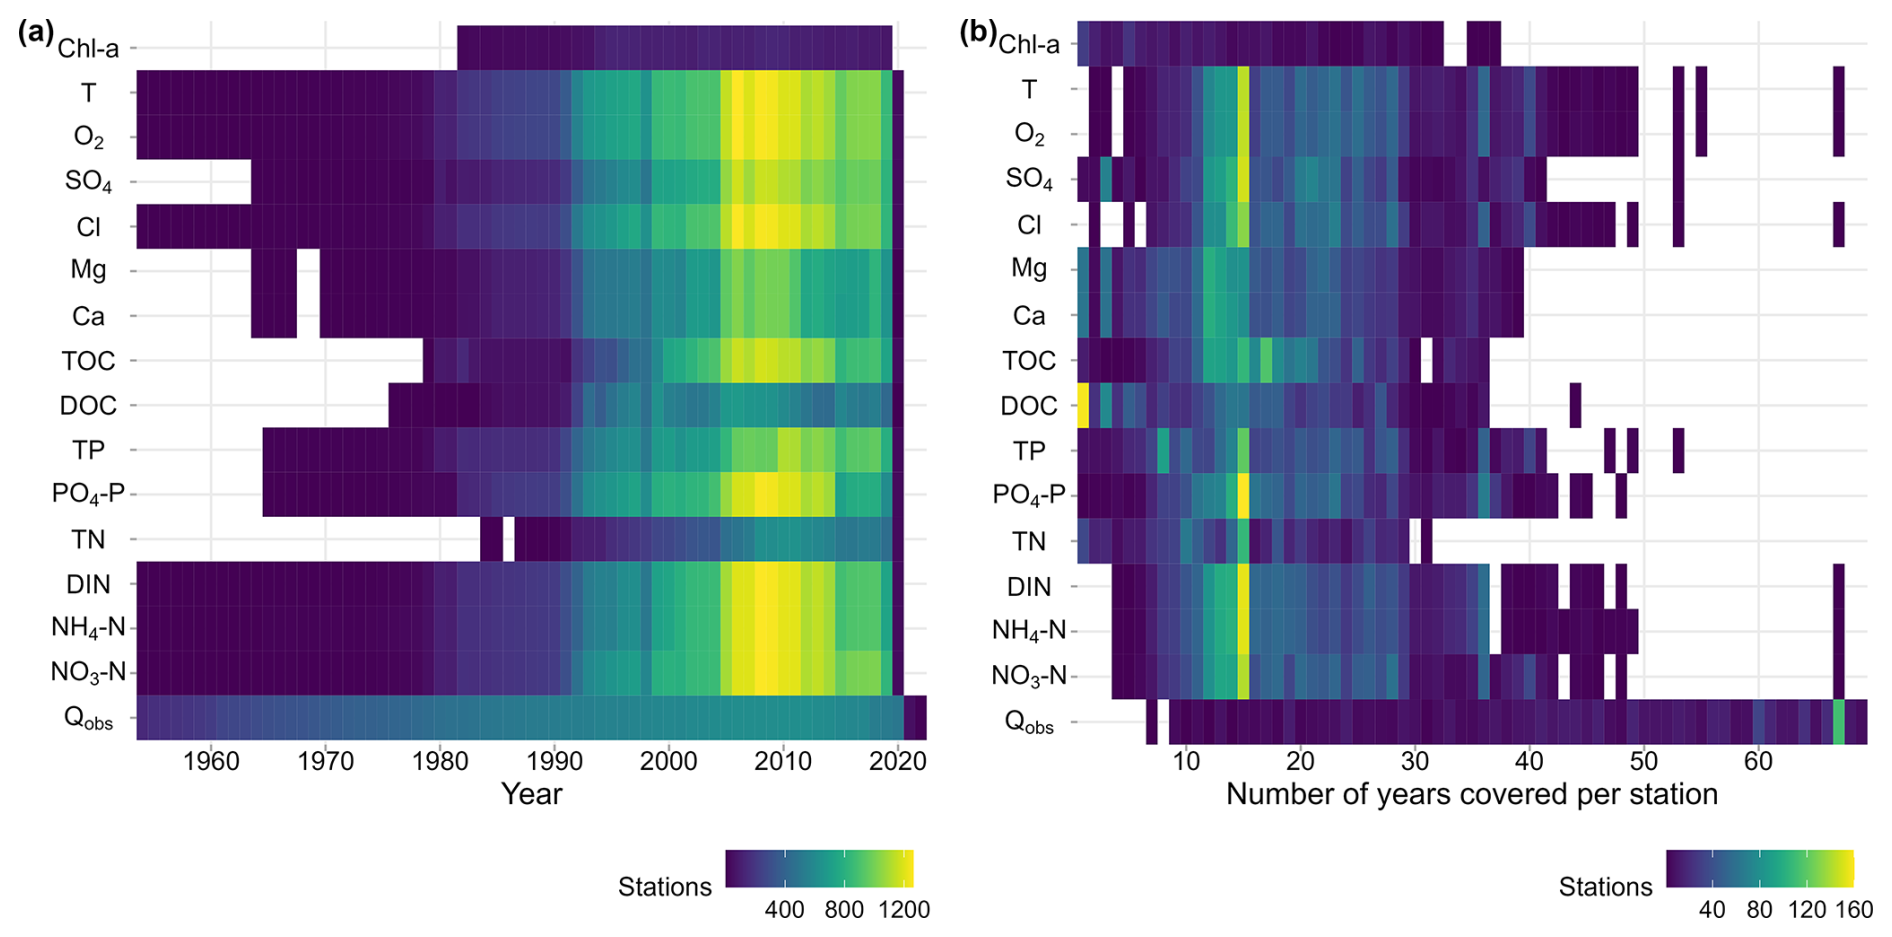
Figure 2Temporal coverage of water quality and quantity time series data per compound: (a) number of stations with available annual medians per year and compound and (b) the number of years covered by each station per compound. For visualization purposes in (a) station counts from 1950 are shown, omitting one sample before 1954.
Table 2Summary of stations and data availability for each water quality compound. The table provides the number of stations with the respective compound reported, the earliest and median start year of time series, median and maximum time series length in years across stations as well as the number of covered years (i.e. years with available data, with values provided in parenthesis), total number of grab samples (i.e. data points) for each compound, median number of grab samples per stations and median samples per year and station, number of outliers removed as the sum across all stations, and maximum fraction of outliers removed at one station. n – number, max. – maximum, * omitting one sample from 1900.
3.1.2 Monthly median concentrations and mean fluxes for stations with high data availability
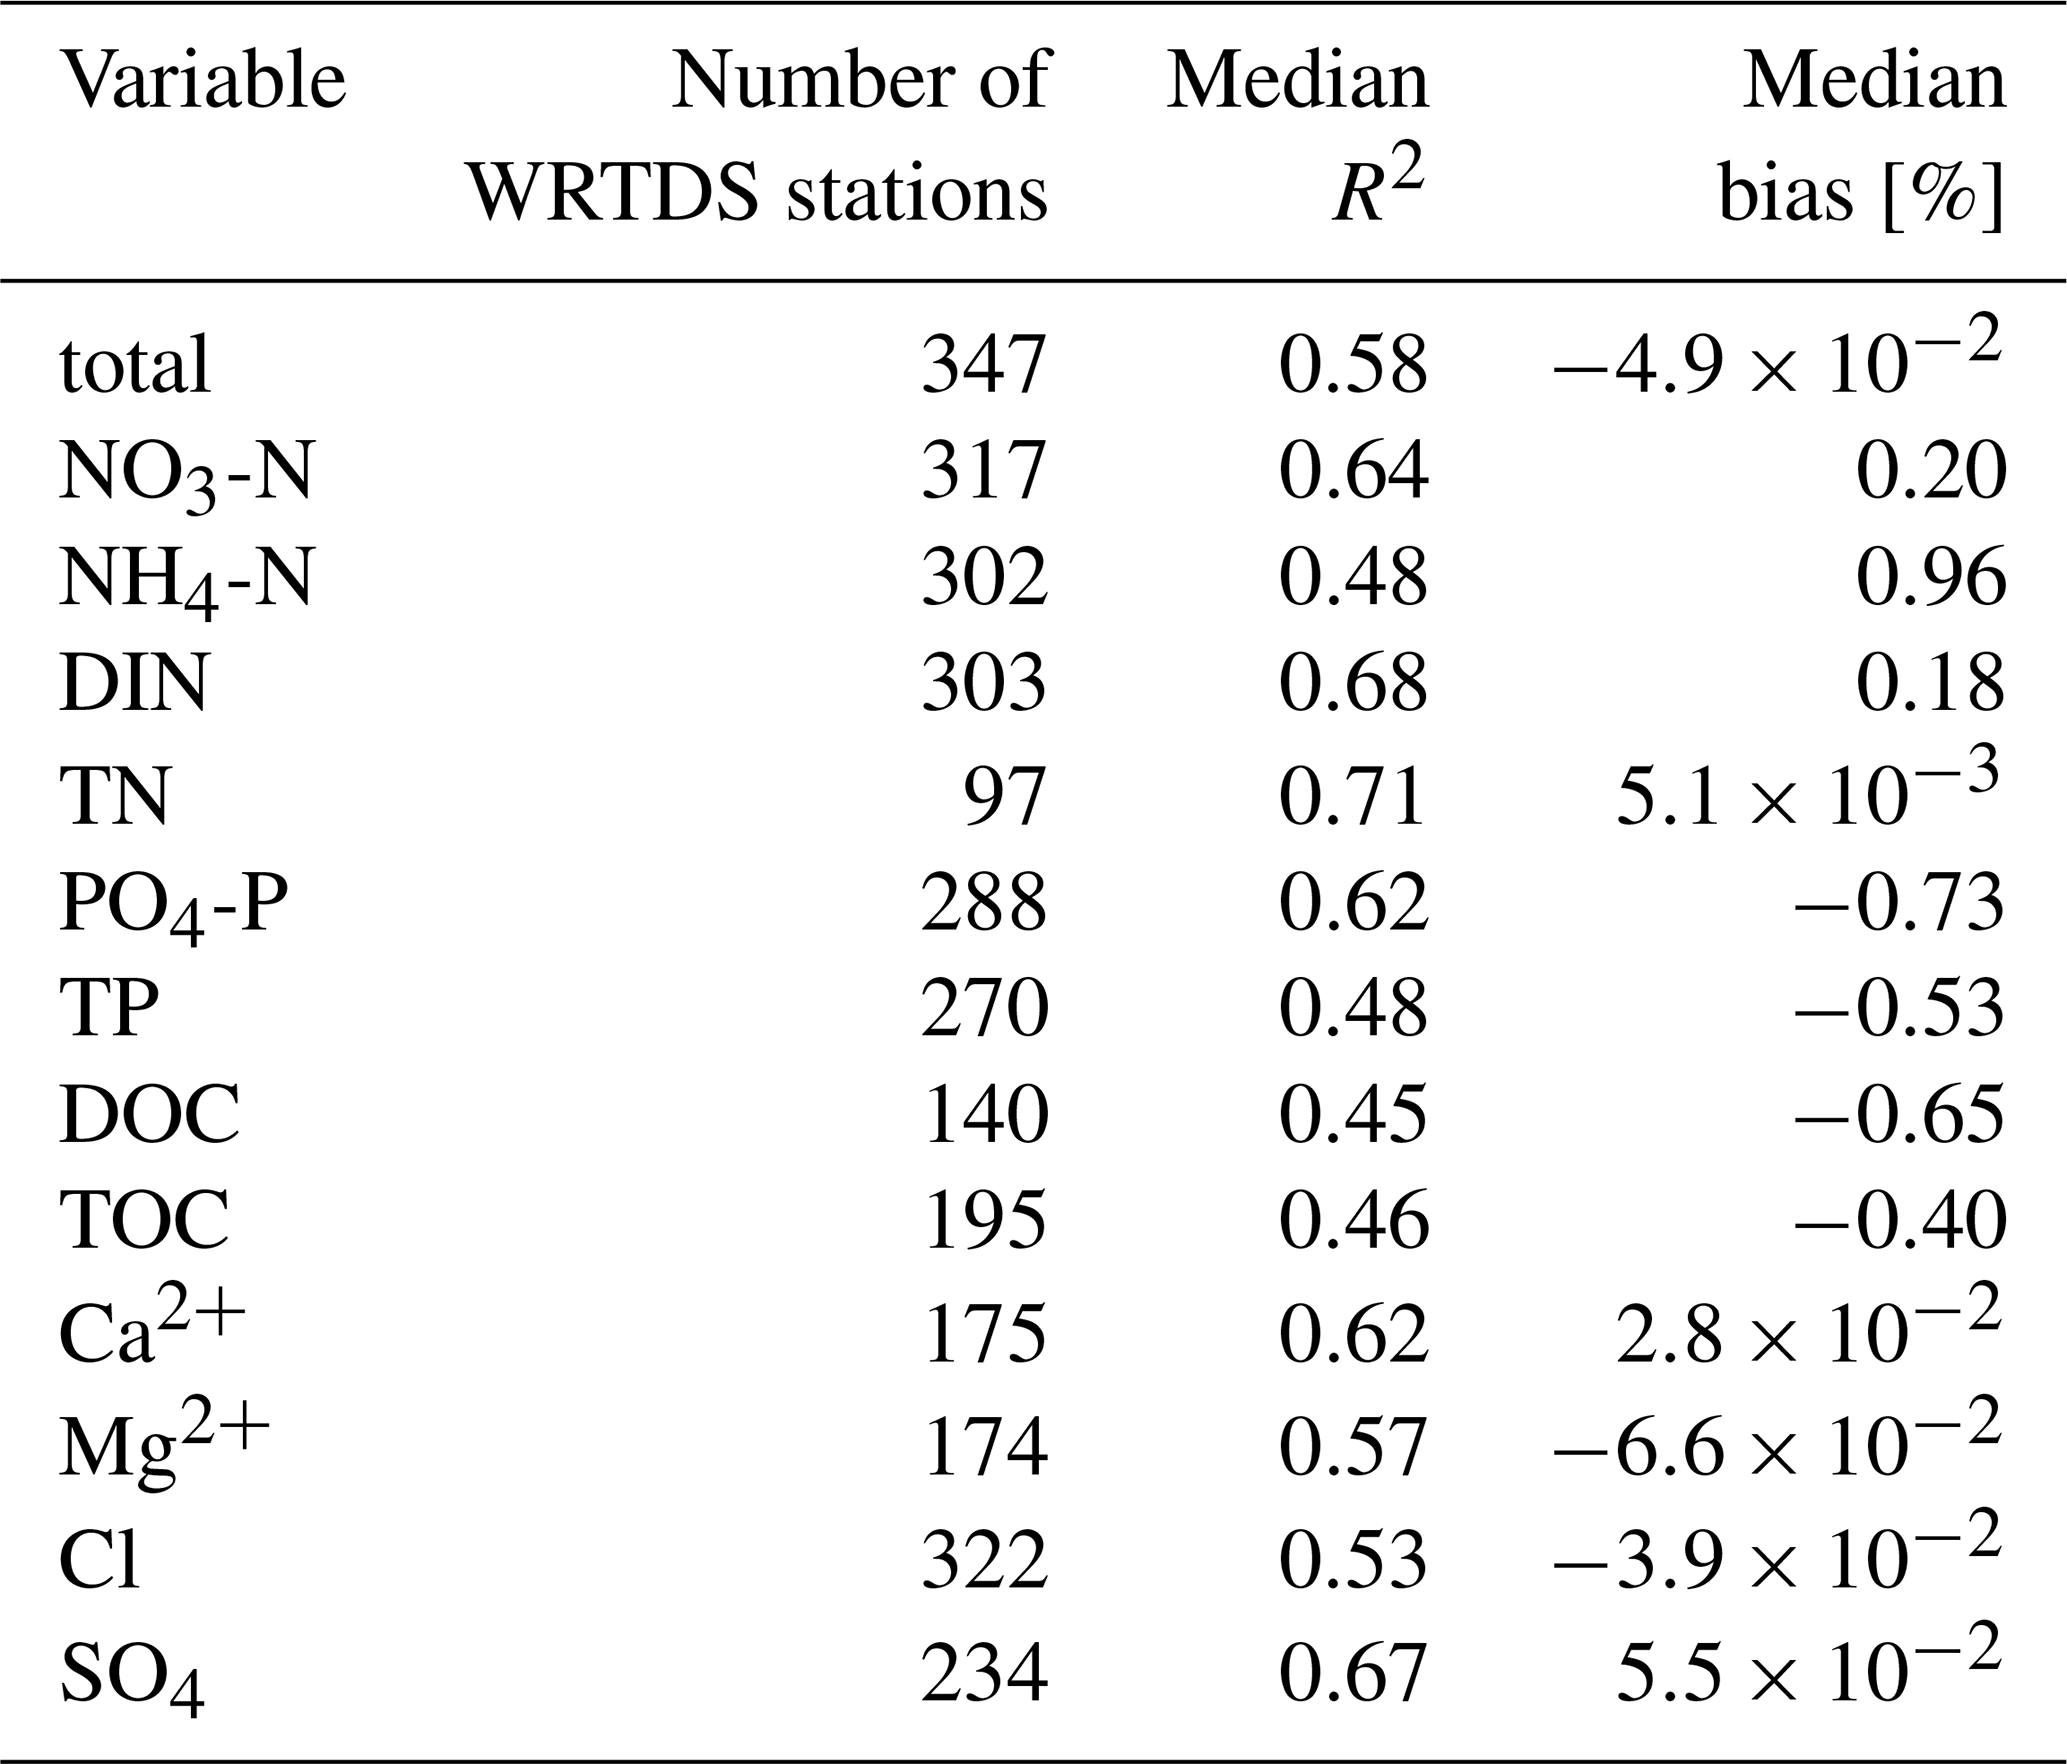
As in version 1 of QUADICA, we provide monthly and annually aggregated water quality data for the subset of stations with high data availability based on Weighted Regression on Time, Discharge and Season (WRTDS; Hirsch et al., 2010), referred to as “WRTDS stations”. To fit WRTDS, we used the R package EGRET (version 3.0.9; Hirsch and De Cicco, 2015). WRTDS considers long-term trends, seasonal components and discharge-dependent variability to estimate daily concentrations from low-frequency observations, e.g., from monthly grab samples (Hirsch et al., 2010). We included station and compound combinations using the same quality criteria as in QUADICA v1 on the preprocessed concentration data (Sect. 2). Accordingly, water quality time series had to cover at least 20 years, at least 150 samples, and no data gaps larger than 20 % of the total time series length. Discharge time series with daily temporal resolution are required to run WRTDS, but in contrast to version 1 of QUADICA, gaps in discharge were allowed with the consequence that no concentration estimate is provided for that day. The number of WRTDS stations varies between 97 for TN and 322 for Cl (Table 3), while the fraction of stations with high data availability varies between 12.0 % for TOC and 23.3 % for Cl.
As in QUADICA v1, monthly and annual values were only provided if 80 % of the days of the respective period were covered. The provided water quality time series contain median concentrations, flow-normalized concentration, and mean flux estimates from WRTDS models. We now also added discharge-weighted mean concentrations. Discharge corresponds to the median observed, as WRTDS takes discharge as input and does not modify it (Sect. 3.2.2).
The model performance of WRTDS varies across water quality variables and stations with 64.1 % of the station and compound combinations with R2>0.5 and 58.2 % with a percent bias < 1 % and 92.7 % below < 5 %. Average performances per compound are given in Table 3, while the distribution of performance values is provided in Fig. A3, as well as all individual values provided in the repository. The performance metrics should allow the users to select suitable catchments and compounds for reliable analysis.
Table 3Number of stations with high data availability (WRTDS stations) for each compound and median coefficient of determination of WRTDS models. The unit of all variables is mg L−1.
3.1.3 Monthly long-term median concentrations
To be consistent with QUADICA v1, we provide monthly long-term medians, and 25th and 75th percentiles (i.e. interquartile range), providing information on the average seasonality patterns of each respective time series. Figure 3 shows the scaled medians indicating the variability of seasonal timing across stations for each compound. For example, water temperature and oxygen show very similar seasonality in terms of timing with summer maxima and summer minima, respectively, in contrast to, e.g., Ca2+, Mg2+, DOC and TOC, for which seasonal timing varies strongly across stations. The nitrogen and phosphorus species show dominant seasonal patterns, but still more variability across stations.
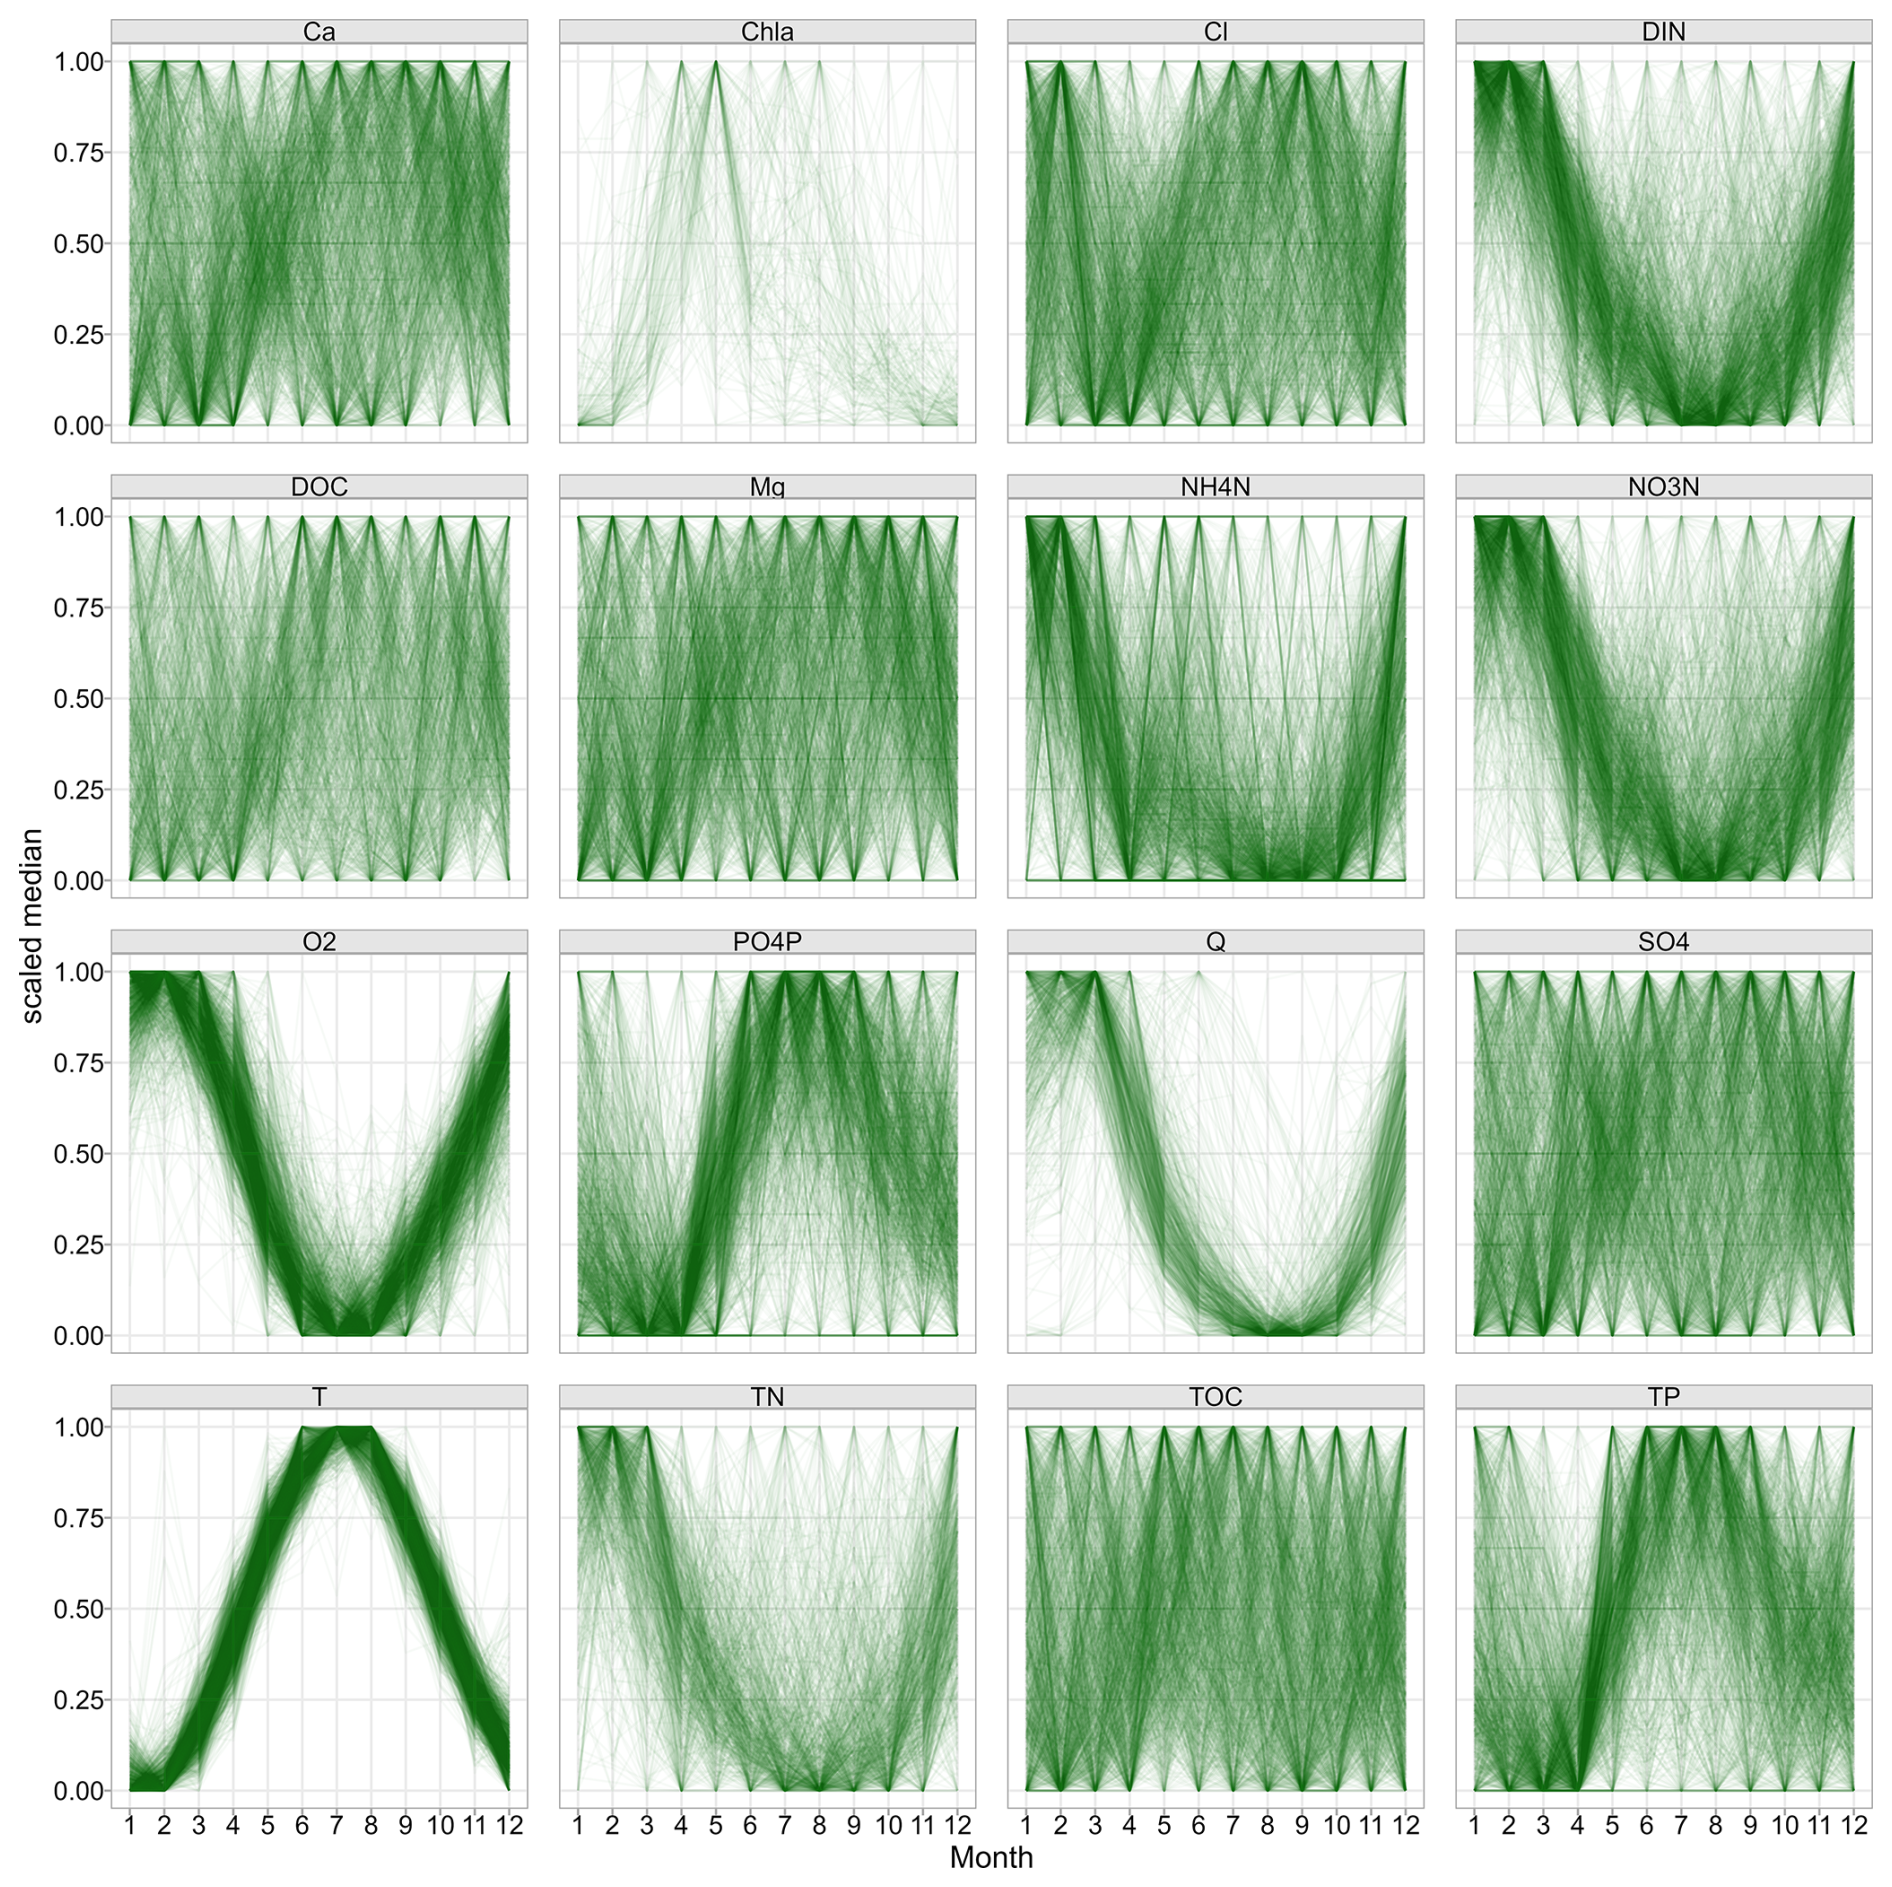
Figure 3Median monthly water quality observations inform about seasonal variability. Medians at each station are scaled to a range between 0 and 1. Note that only time series covering all 12 months are displayed.
3.2 Water quantity time series
In total, discharge was provided for 637 stations, taking all data sources together. The earliest time series starts in 1893, the maximum number of stations with 620 stations with available discharge data was in 2011 and the longest time series extends until 2022.
From the QUADICA v1, we updated the discharge time series of 284 out of the 324 stations with daily data provided from our request to the authorities (232) and from GRDC (52) based on the matches identified in QUADICA v1. For the remaining stations, no updated data was provided.
In addition, we complemented the QUADICA discharge data from the CAMELS-DE (Loritz et al., 2024) and Caravan-DE (Dolich et al., 2024) data sets. We found 554 matches (449 from CAMELS, 105 from Caravan), out of which 313 stations had no matching discharge values in QUADICA yet, while 241 overlapped. We matched stations based on location and by manually checking if they lie on the same river. We differentiate cases between (1) close stations within a maximum distance of 1 km (n=305) and (2) discharge stations that are further away. In the latter case, discharge stations could be located either (2i) upstream (n=202) or (2ii) downstream (n=47) of the water quality station. For (2), we accepted matches only if the relative difference between the intersected area of the CAMELS/Caravan and QUADICA catchments and the area of the QUADICA catchment was ≤ 30 %. For downstream discharge stations (2ii), in addition, we accepted matches only if the CAMELS area was larger than the QUADICA area. We additionally checked the correlations between QUADICA and CAMELS/Caravan time series with a median correlation coefficient of r > 0.9999 and only 5 out of the 241 overlapping stations with r < 0.95. We then used the discharge time series of the matched stations to fill up the QUADICA data. To account for differences in the locations (and thus catchments' area) of water quantity and water quality stations, we scaled the discharge of upstream discharge stations (i.e. case 2i) with the ratio between the QUADICA catchment area to the intersected area and of downstream stations (i.e. case 2ii) with the ratio between the QUADICA to CAMELS/Caravan catchment area. In case of several potential matches (because of identical station locations within CAMELS, n=24), we manually checked the time series to decide for the more complete one or merged them with priority on the more recent time series (n=2).
3.2.1 Annual median discharge
Similar to version 1, annual median discharge is aggregated from available observed discharge data. As described above (Sect. 3.2), daily Q data is available for 637 water quality stations. The data density distribution is visualised in Fig. 2.
3.2.2 Monthly median discharge
Similar to version 1, monthly median discharge is provided for WRTDS stations. Note that we did not gap-fill the daily discharge time series for the WRTDS models, but instead provide median values only if at least 80 % of the days are covered. This criterion refers both to the monthly and annual discharge data provided with the WRTDS data tables (as described in Sect. 3.1.2).
3.2.3 Monthly long-term median discharge
Similar to version 1 of QUADICA and the water quality variables (Sect. 3.1.3), long-term monthly median discharge, 25th and 75th percentiles, as well as the corresponding number of samples are provided. These values can be an indicator of average discharge seasonality across solutes and catchments in the long term.
3.3 Meteorological time series
As in QUADICA v1, meteorological time series (precipitation, potential evapotranspiration and average air temperature) are provided as spatial catchment averages on monthly resolution from 1950 to 2020. To obtain these, we followed the same approach on a newer version from the European Climate Assessment and Dataset project (E-obs v25.0e, Cornes et al., 2018) for the daily gridded data of climate variables.
Moreover, for the stations for which we identified matches from the CAMELS-DE/Caravan-DE datasets the users can access daily time series of several hydrometeorological variables and different products therein (Dolich et al., 2024; Loritz et al., 2024). However, note that the water quality stations are not always located at the exact same location, please refer to Sect. 3.2 and the details provided in the data repository and data tables about the matches.
3.4 N and P input time series
3.4.1 Net N and P input from diffuse sources
Time series of catchment-scale N and P surplus (kg yr−1 ha−1) from diffuse sources as shown in Fig. 4 are provided (file: input_N_P.csv). The catchment-scale surplus corresponds to a soil surface budget and equals the balance between nutrient inputs minus the output on agricultural and non-agricultural areas at an annual resolution normalized to the catchment area. Inputs include mineral fertilizer, manure, other organic fertilizers (in the German N surplus dataset only; such as sewage sludge, compost and biogas digestate), atmospheric deposition, biological fixation (N surplus only), weathering (P surplus only) and seeds and planting material (in the German N surplus dataset only). Outputs correspond to crop and pasture removal.
For N surplus, two different data sets were used: (1) A Germany-wide county-scale data set as described in depth in QUADICA v1 (Ebeling et al., 2022; Behrendt et al., 2003; Häußermann et al., 2020), and (2) A European gridded data set (Batool et al., 2022).
For the first source of N surplus, the N surplus time series on agricultural areas were updated with the German data provided by Häußermann et al. (2020) for the period 1995–2021, following Ebeling et al. (2022). However, we refined the methodology to account for temporarily variant agricultural areas, following Sarrazin et al. (2022). The data now ranges from 1950–2021 (1950–2015 in the previous version). We extended the N surplus from non-agricultural areas until 2021 by calculating the sum of atmospheric deposition and biological N fixation as described in QUADICA v1. Note that the values for transnational catchments have higher uncertainties as they were calculated for the area within Germany only (for the corresponding fraction, see f_areaGer).
For the second source of N surplus, N surplus time series were extracted from a gridded, European-scale dataset (Batool et al., 2022) providing annual estimates of N surplus from 1850 to 2019 at 5 arcmin (∼ 10 km at the equator) resolution. It covers both agricultural and non-agricultural soils. The N surplus time series across catchments from both sources are compared in Fig. 4c, while a comparison of the datasets can be found in Batool et al. (2022). Overall, there is a correlation with r=0.72 across all catchments, which increases to r=0.76 when considering only the catchments with at least 70 %, 95 % or a 100 % of their catchment area within Germany. Additionally, differences can arise from methodological and scale differences as well as uncertainties in general.
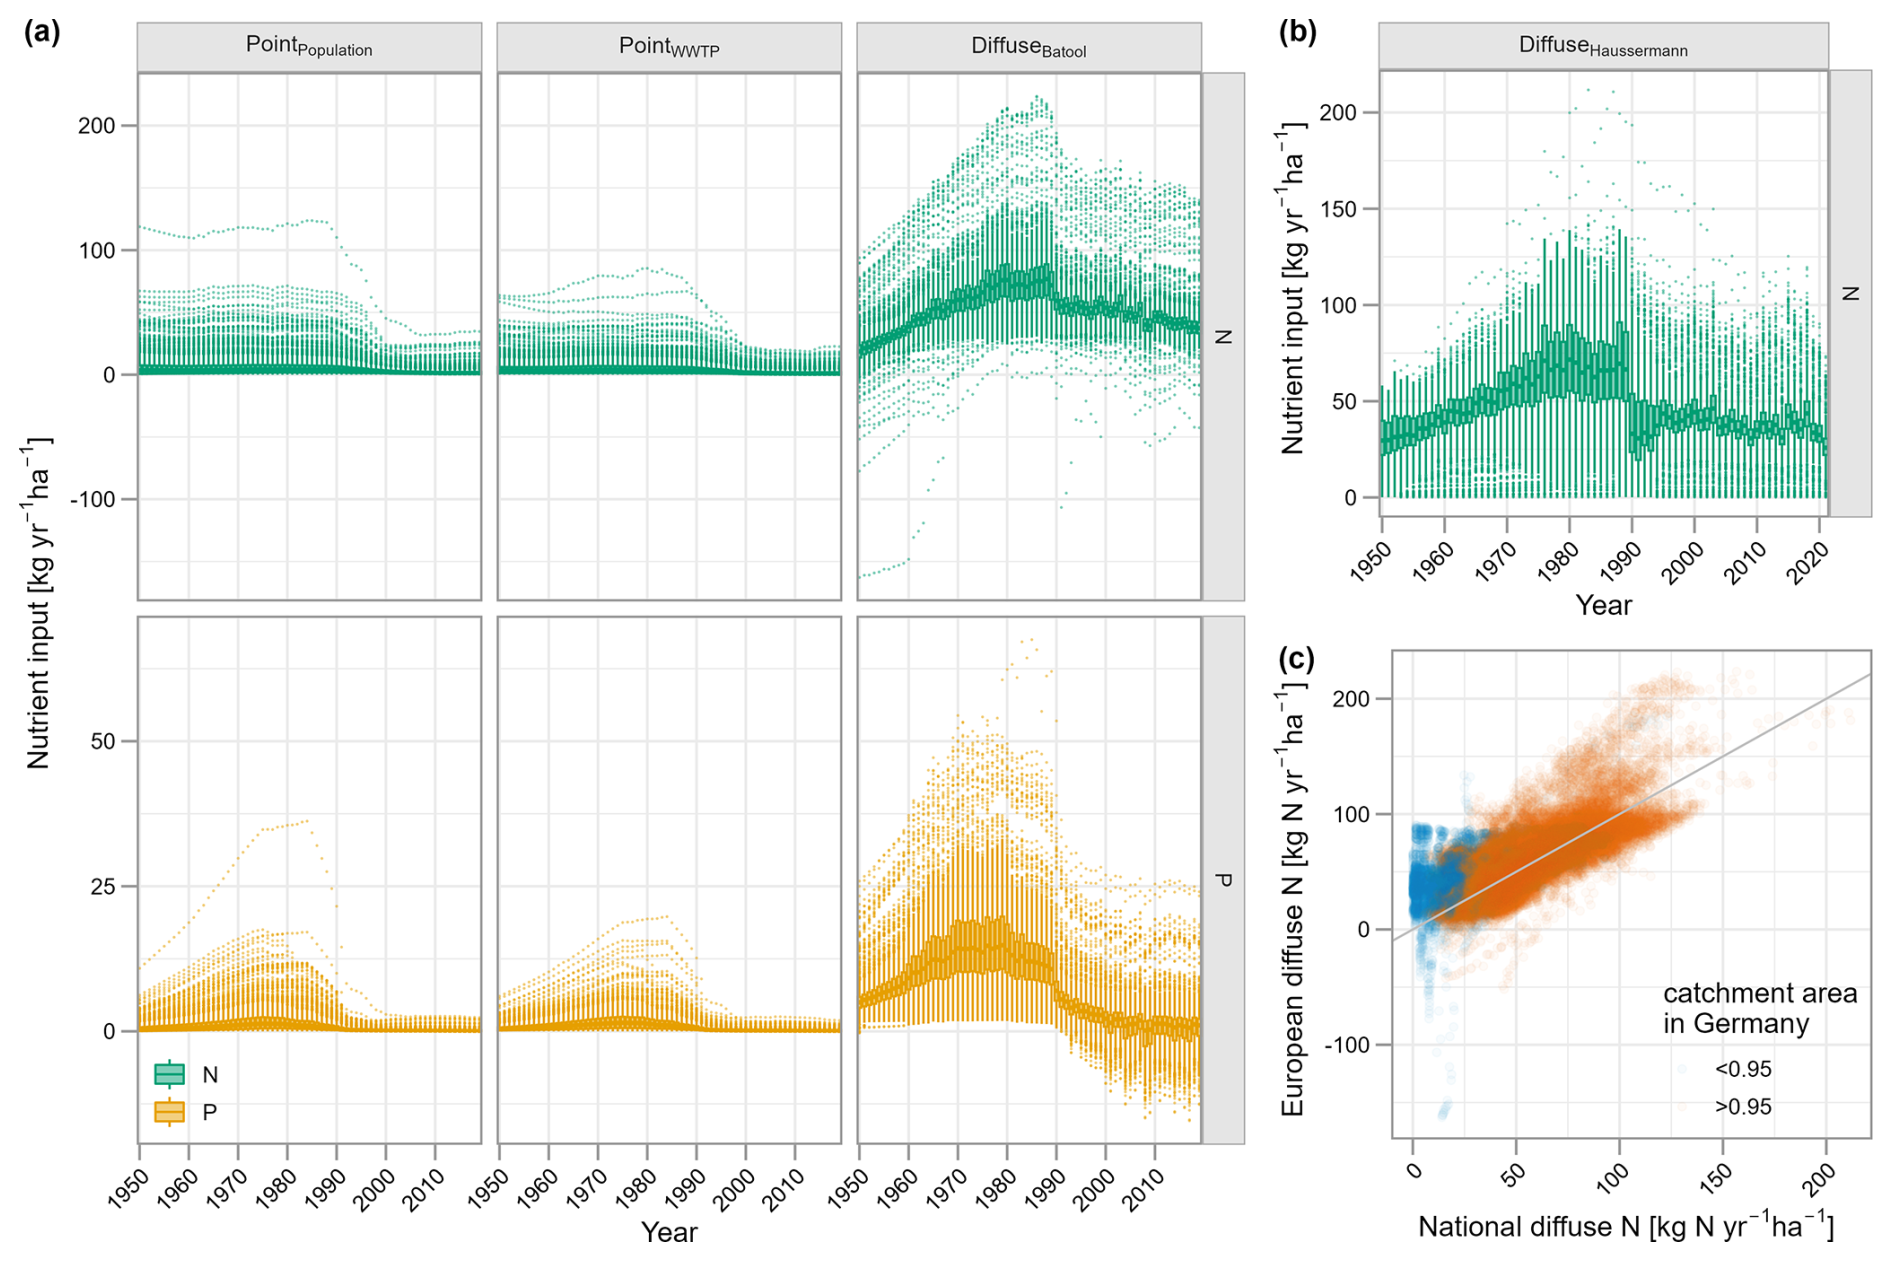
Figure 4Nitrogen and phosphorus input time series from different sources shown as distributions across all catchments. In (a) point sources data comes from Sarrazin et al. (2024) corresponds to the ensemble mean from two different spatial disaggregation approaches based on population density (PointPopulation) and WWTP data (PointWWTP) (Sect. 3.4.2) and the ensemble mean of diffuse sources input of N from Batool et al. (2022) and of P from Batool et al. (2025) (DiffuseBatool). In (b) diffuse source of N from Häußermann et al. (2020) is shown, while in (c) the diffuse N input values for each year and each catchment of the two data sets (from the German and European data basis) are compared, with the color indicating the fraction of catchment area within German boundaries (orange – ≥ 0.95, blue – < 0.95). Note that: The boxes of the boxplots show the median, the 25th and 75th percentiles, while the whiskers extend up to 1.5 × interquartile ranges with outliers beyond this range; y axis scale is different for N and P.
For P surplus, we used the European-scale dataset (Batool et al., 2025) constructed with the same spatial and temporal resolution and a similar methodology as the one of N surplus. Both European datasets quantify uncertainties in key components such as fertilizer use, manure allocation, and crop removal. For QUADICA, we extracted the ensemble mean of the total N and P surplus estimates to assess diffuse nutrient inputs relevant at the catchment scale. For further details on the data uncertainty, please refer to Batool et al. (2022, 2025).
3.4.2 N and P input from point sources from wastewater
While in QUADICA v1, point source data are available for only one year (around 2016), QUADICA v2 provides time series of N and P point source inputs from wastewater for each catchment for the period 1950–2019. The data come from the gridded dataset of Sarrazin et al. (2024) for Germany. This data set provides estimates of N and P point sources, accounting for wastewater emissions that are treated in urban Wastewater Treatment Plants (WWTPs), including domestic and industrial (indirect) emissions, as well as untreated domestic emissions collected in the sewer system. These treated and untreated N and P emissions result from human excreta, with additional emissions for P due to the use of detergents. The data were constructed combining a modelling approach and observational data of WWTP N and P emissions. Sarrazin et al. (2024) provides ensemble runs from two methods to spatially disaggregate the data to grid resolution, that is, one based on population density and the other one based on recent WWTP outgoing N and P emissions. QUADICA v2 includes, for each catchment, two point source time series corresponding to the respective ensemble means of the two disaggregation approaches. For further details including time-dependent uncertainty of the two methods due to the shift in information detail and corresponding representativeness, please refer to Sarrazin et al. (2024).
The catchment attributes describe the topography, land cover, nutrient sources, lithology, and soils, and hydroclimate of the catchments. The attributes provided in QUADICA v1 were partly updated and complemented. New attributes include the Strahler order, updated land cover fractions from the CORINE Land cover dataset for 2018, the mean monthly Leaf Area Index (LAI), the soil pH in water and in CaCl2-solution as well as updated average nutrient source and hydroclimatic characteristics. Here, we describe only updated and complemented characteristics; for a detailed description of the previous characteristics, please refer to QUADICA v1 (Ebeling et al., 2022). The metadata table of all characteristics in QUADICA v2 is provided in Appendix B2 and Table S10 in the metadata of the data repository, while the attributes data can be found in the file attributes.csv (see Appendix B1).
4.1 River network position
In the version 2 of QUADICA, we add the attribute of stream Strahler order, derived from the EU Hydro data set (EEA, 2020). For each catchment, the largest Strahler order of streams intersecting the catchment was selected and manually checked. The Strahler order provides context of the size and position of the streams with headwater streams starting with Strahler order 1, going up to the order 8 for the downstream part of the Elbe river. Most streams classify as order 3 (n=417) and 2 (n=321), i.e. small to medium sized rivers.
To further support network analyses, we link each station to its next downstream station in the river network and count the number of upstream stations, enabling spatially consistent analyses and modelling of water quality patterns and network connectivity. More than half of the stations (731) have no station further upstream, while 95 have no further downstream station.
4.2 Land cover
The fractions of land cover classes were calculated from the CORINE Land cover map (as in QUADICA v1) but with the newer data set for 2018 (version 2020_20u1; EEA, 2019a). We both provide level 1 (artificial, agricultural, forested land, wetland, and surface water cover) as well as level 2 data with refined classes, as described in Appendix B.
For each catchment, the mean monthly LAI across the period 2003–2020 was extracted from high-quality reprocessed MODIS LAI data (Yan et al., 2024). Generally, the LAI is defined as the ratio of green leaf area to unit ground surface area, which can be estimated from spectral remote sensing data. The LAI serves as an indicator for e.g. photosynthesis, evapotranspiration and rainfall interception capabilities of vegetated areas.
4.3 Nutrient sources
Average inputs of nitrogen and phosphorus from diffuse and point sources for each catchment are provided based on the respective annual time series described in Sect. 3.4. We calculated the mean values starting from 1991 (i.e. 1991–2021 in case of Häußermann and 1991–2019 in case of Batool and Sarrazin), representing long-term average historic inputs since the year the Nitrate Directive was amended (EC, 1991). In addition, we calculated mean values over the last decade starting in 2010, representing current nutrient pollution pressures. We also renewed the measure of N source apportionment considering the data sets covering the same spatial scale for Germany, i.e. using the updated data product of the German-wide N surplus data and the newly added N point source data set for both the long-term period and the recent decade.
In addition, we provide catchment-averages of soil P budget data from the European data set provided by Panagos et al. (2022). The data set provides maps for P available for crops and P total in agricultural topsoil (0–20 cm) based on the Land Use and Cover Area frame Survey (LUCAS) as raster data with 500 m resolution, as well as the soil P input and output budget components over the period 2011–2019. The input components inorganic fertilizers and manure are provided as vector data at NUTS (Nomenclature of Territorial Units for Statistics) 2 level, whereas the atmospheric deposition and chemical weathering data are in raster format. The extracted output components include the output through crop harvesting and removal of crop residues, both provided at NUTS2 level. Based on that we calculated the P surplus as a balance component at the soil level. For raster data we calculated the mean across each catchment, providing available and total P on agricultural soils, and scaled it to the catchment area by the fraction of agriculture based on CORINE land cover data (EEA, 2016). To estimate the catchment-scale values from the data sets at NUTS2 level, we first intersected them with the catchments, second calculated the fraction of agriculture to scale the input and output components, and finally calculated area-weighted means for each catchment.
4.4 Soil properties
In addition to average total soil nutrient content in the topsoil (0–20 cm), we added data on average soil pH. The topsoil pH in water and CaCl2 0.01 M solution was derived from the European soil chemistry map, which is based on the LUCAS database (Ballabio et al., 2019). Historically, soil pH was often only measured in water. However, soil pH measured in a salt solution of CaCl2 or KCl is now preferred, as it is less affected by electrolyte concentrations in the soil and thus provides a more consistent measurement of fluctuating salt content (Minasny et al., 2011). For comparability, the mean topsoil pH from both methods was extracted for each catchment.
4.5 Hydroclimatic characteristics
The hydrologic characteristics such as mean discharge and metrics of discharge variability were calculated from the updated observed daily discharge data for 637 stations (Sect. 3.2). We calculated long-term time series characteristics starting in November 1990 (hydrological year of 1991) until October 2020, i.e. covering 30 years if available. The exact starting and ending dates used for calculation are provided along with the characteristics, as well as information on missing values. For a list of characteristics, refer to Appendix B and the data repository. For those stations matching with CAMELS-DE/Caravan-DE (Dolich et al., 2024; Loritz et al., 2024), further hydrometeorological characteristics can be accessed directly from these datasets.
Although some of the previously discussed limitations have been addressed, other limitations and uncertainties remain present in QUADICA v2.
We significantly increased the number of stations with discharge from daily time series and thus the number of stations with high data availability (WRTDS-stations) more than doubled to now 347 in total. Still, co-located water quantity and quality stations remain limited with less than half of the stations covered (637 out of 1386 stations).
Unfortunately, one of the main drawbacks related to data policies remains. More specifically, data handed over by federal state agencies cannot generally be handed over to third parties, so raw data of water quality and quantity cannot be provided here. We thus adhere to the provision of ready-to-use aggregated data, which can still serve various purposes, e.g. trend analysis (Ehrhardt et al., 2021) and long-term water quality modelling (Nguyen et al., 2022).
Uncertainties related to transboundary catchments (beyond the German borders) were reduced for the diffuse nutrient input time series by integrating the European data sets that have become available. However, the uncertainty for the point source time series, which only includes German territory, remains high and such stations may be excluded for certain analysis. For the diffuse N inputs, both time series from German as well as European data bases are provided enabling direct comparison to assess reliability and uncertainty related to the input time series.
The data set can be accessed in the data repository under https://doi.org/10.4211/hs.c2866cd416b94ca386deb5758834311f (Ebeling et al., 2025). It includes all time series, catchment attributes and summary data as well as detailed data description files. Alongside with the repository, we provide an interactive R Shiny application that allows users to check data coverage and visualise selected time series. In addition, a browser-based web app is available for exploring the data set through the institutional UFZ GeoData Infrastructure, accessible at https://web.app.ufz.de/gdi/wq-monitor/en (Ebeling et al., 2026). Due to license agreements, the raw data itself cannot be published but are deposited in a long-term institutional repository (https://www.ufz.de/record/dmp/archive/16457, Musolff et al., 2026).
This paper aims to provide an updated and extended version of the QUADICA data set for Germany (Ebeling et al., 2022) to enhance both the breadth and the depth (Gupta et al., 2014). Therefore, we focused on describing the new additions in more detail. The main novelties are:
-
Extension of water quality and quantity time series for four years up to 2020, covering severe drought years and generally longer time series (Sect. 3.1 and 3.2)
-
New water quality parameters were added including those relevant for ecological impact studies such as oxygen, water temperature and chlorophyll a concentrations (Sect. 3.1)
-
Linkage to recently published large-sample water quantity data sets for Germany (CAMELS-DE by Loritz et al., 2024 and Caravan-DE by Dolich et al., 2024) almost doubled the number of water quality stations with conjunctive continuous discharge data from 324 (version 1) to 637 (version 2), allowing for more comprehensive studies of water quantity and quality (Sect. 3.2)
-
The increase in stations with daily discharge data has also increased the number of stations with high data availability (version 2: 347, before: 140) with monthly concentration time series derived from WRTDS models (Sect. 3.1.2)
-
Addition of diffuse phosphorus input and nitrogen and phosphorus point source input time series for German catchments (Sect. 3.4)
-
Addition and update of catchment characteristics including network position (Sect. 4)
These additions allow for further comprehensive investigations from drivers of nutrient pollution to water quality responses in streams, including ecological implications, and conjunctive water quality and quantity assessment.
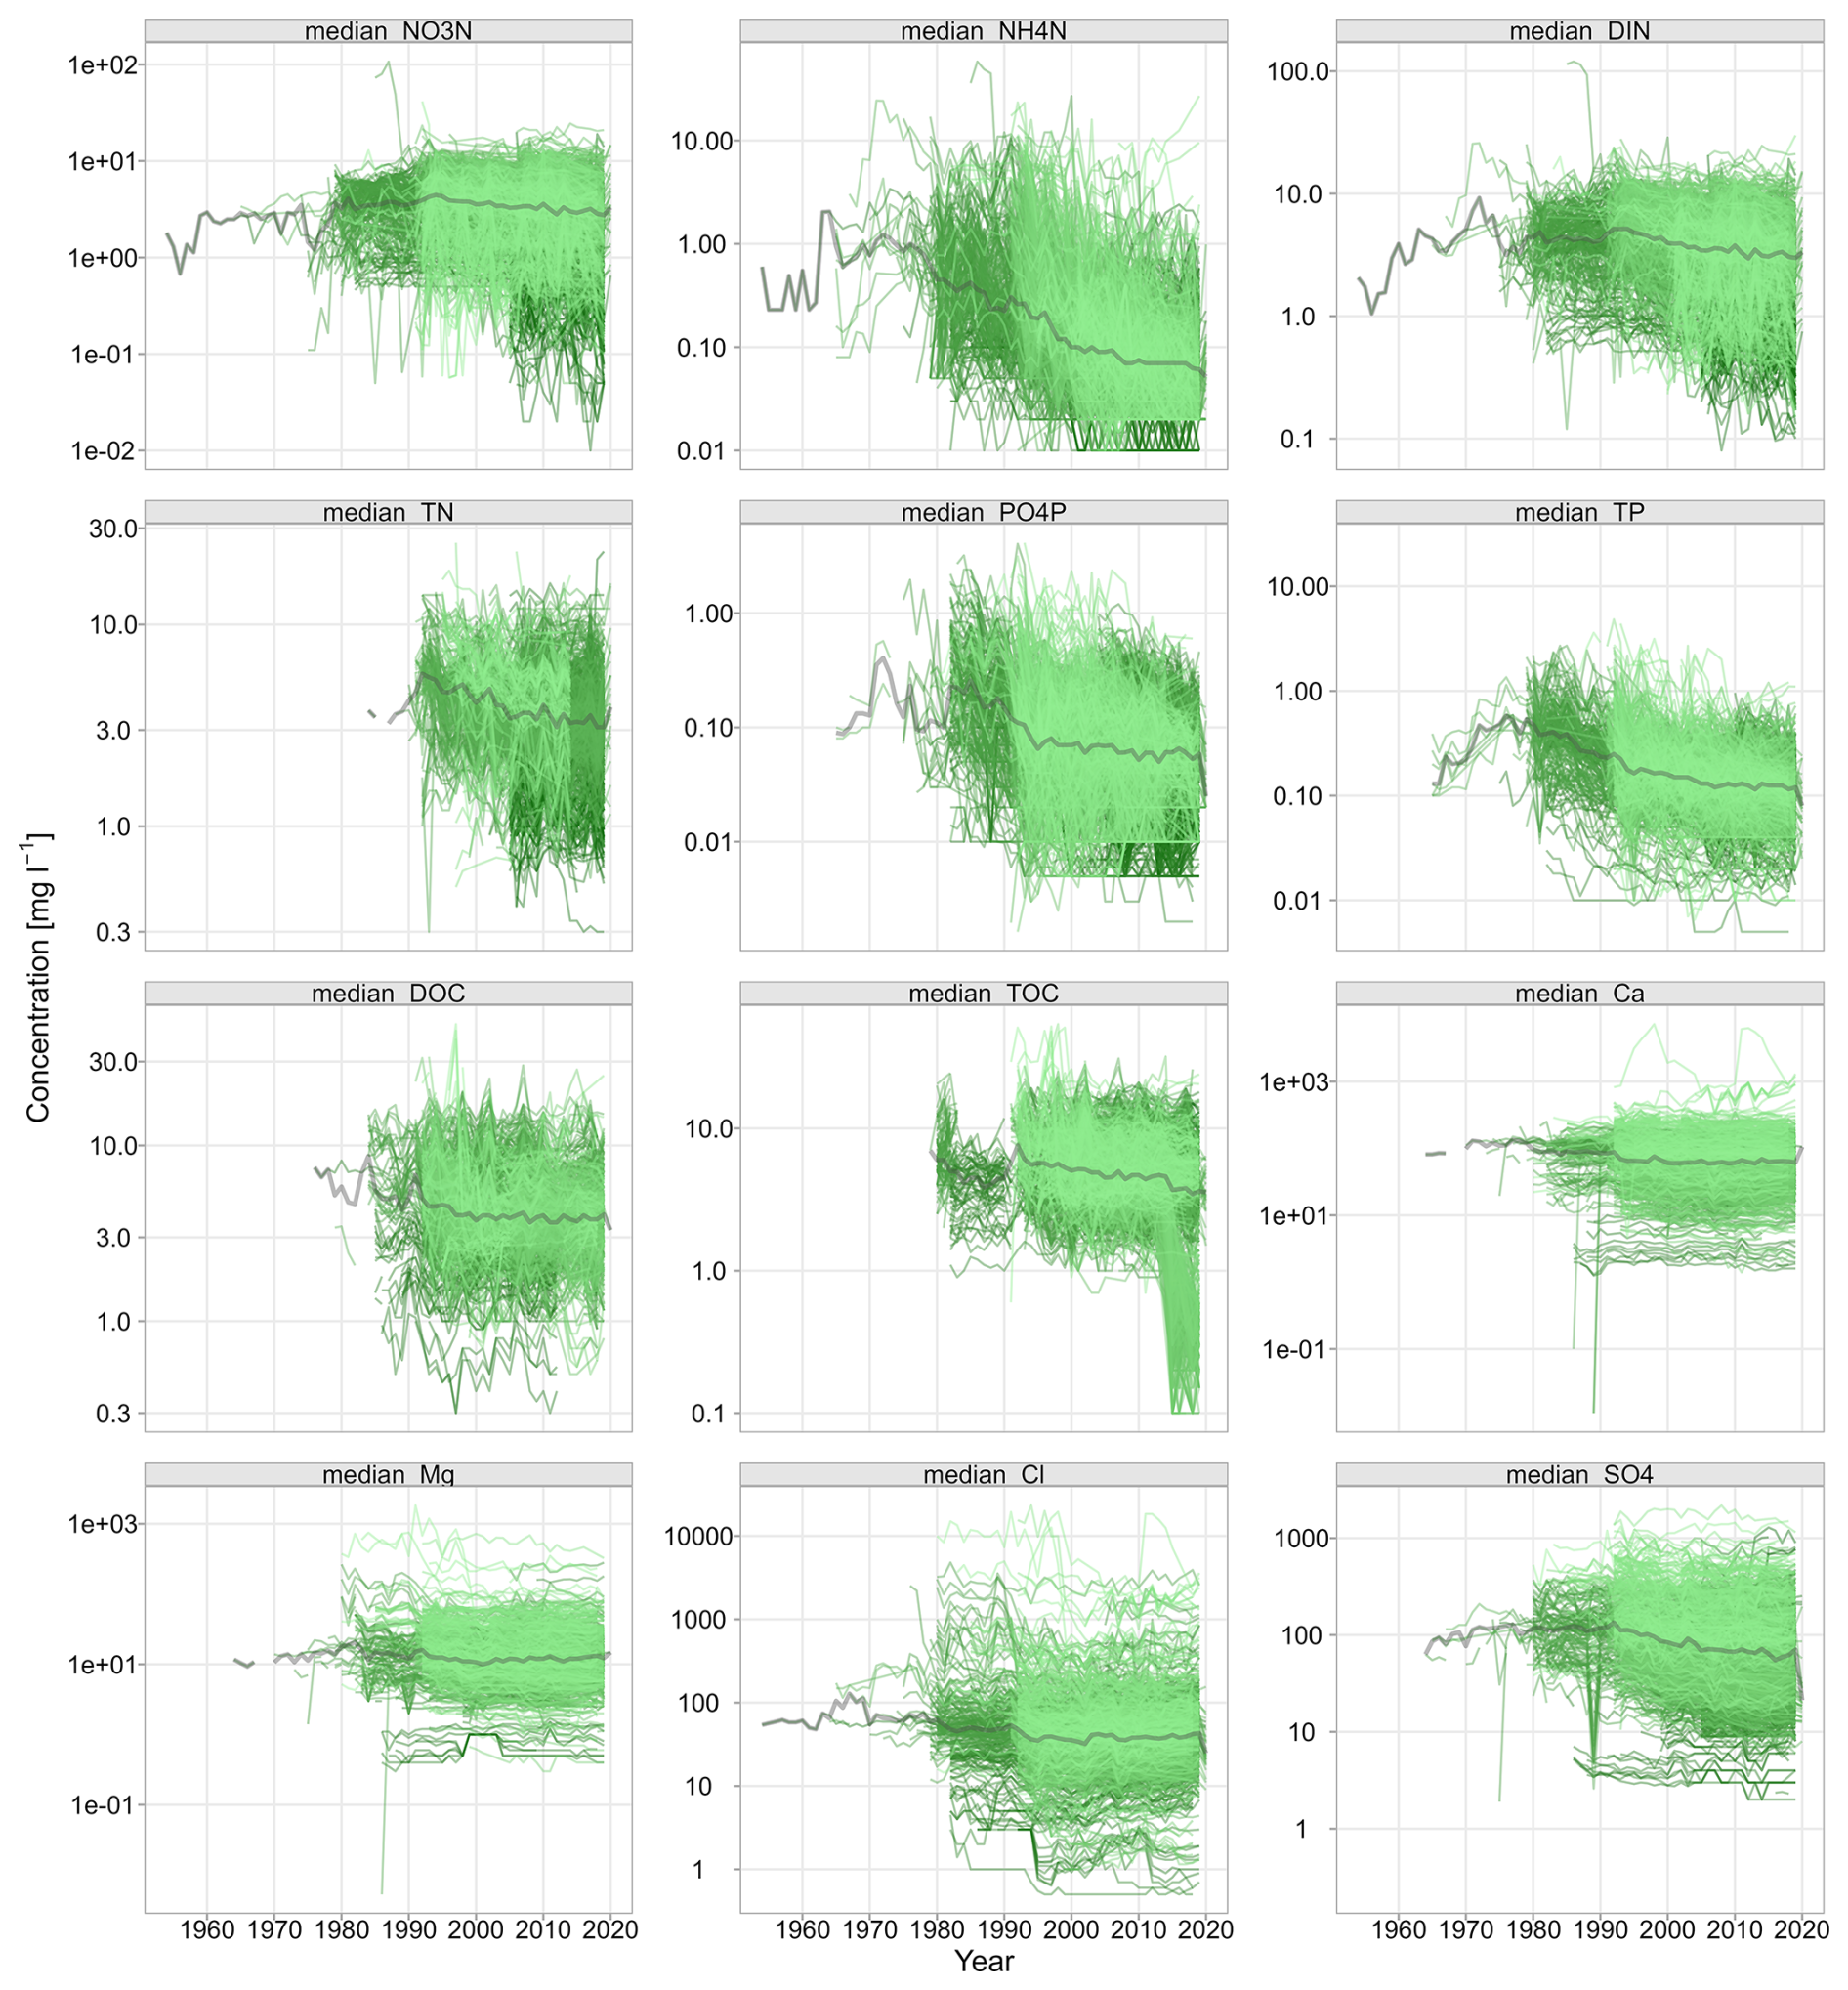
Figure A1Annual median concentrations observed at the 1386 water quality stations (described in Table 1, Fig. 1 and Sect. 3.1). The colors are gradual from light to dark corresponding to the OBJECTID numbers, the grey line shows the median concentration across all annual medians.
Figure A2Annual median O2 concentrations, water temperature, and chlorophyll a concentration observed at the 1386 water quality stations (described in Table 1, Fig. 1 and described in Sect. 3.1). The colors are gradual from light to dark corresponding to the OBJECTID numbers.
Figure A3WRTDS-model performances for each compound: (a) coefficient of determination R2 and (b) bias. Boxes highlight the median and quartiles of each distribution. In (a) the number of time series is given on top for each compound. Colors according to the substance group, i.e. nitrogen, phosphorus, organic carbon and major ions. Note that in (a) values of R2<0 were omitted, accounting seven catchments for NH4-N, five for PO4-P, and one for Cl; in (b) values of bias were omitted, accounting five values of NH4-N and one value for Cl. The users can define their quality criteria to subset the provided time series.
Table B1Overview of files and metadata tables in the description file (Metadata_QUADICA_v2.pdf) of the data repository.
Table B2Catchment attributes, associated methods and original data sources used for calculating the attributes. It contains both attributes from QUADICA v1 and the newly added and updated attributes. For more details see Sect. 4, data file: attributes.csv.
The study was conceptualized by PE, AM, and RK. PE played a key role in data management, ensuring the quality, homogenization, and preprocessing of the data, as well as developing the methodology for matching and merging CAMELS/Caravan discharge data. PE also prepared the results, created visualizations, wrote the first draft of the manuscript and revised the manuscript. AW, US collected the water quality and quantity data from federal authorities and together with AH contributed to data quality control. SH, TN contributed to matching and merging QUADICA-CAMELS and Caravan stations, SH additionally extracted some new catchment attributes. Additionally, TN developed a Shiny App to facilitate data exploration in the data repository, with additions from PE. MB, FS, RK provided the catchment N and P input data. RK also contributed the climate and LAI data.
The contact author has declared that none of the authors has any competing interests.
Publisher's note: Copernicus Publications remains neutral with regard to jurisdictional claims made in the text, published maps, institutional affiliations, or any other geographical representation in this paper. The authors bear the ultimate responsibility for providing appropriate place names. Views expressed in the text are those of the authors and do not necessarily reflect the views of the publisher.
We gratefully thank all data collectors, processors and providers including the federal state environmental agencies and all other contributors to this data set. We thank Nils Turner for his contributions to water quality data control, José Ledesma for discussions on the quality of discharge data, Sabine Attinger and Jan H. Fleckenstein for their initial input to QUADICA v1, Linus Schauer for providing the Strahler order as catchment descriptor, and Nicoletta Leitgeb for providing up- and downstream stations. We gratefully acknowledge Martin Bach and Uwe Häußermann, Justus-Liebig-University of Giessen, for the provision of the two data sets on the agricultural N surplus data for Germany. We acknowledge the E-OBS data set from the EU-FP6 project UERRA (http://www.uerra.eu, last access: 15 January 2026) and the Copernicus Climate Change Service, and the data providers in the ECAandD project (https://www.ecad.eu, last access: 15 January 2026). The authors additionally acknowledge several organizations for the data products used here, including the BfG, BGR, SGD, EEA, FAO, IIASA, ISRIC, ISSCAS, and JRC. Large Language Models (LLM), in particular Llama3 405 embedded in the Helmholtz AI Jülich service Blablador, have been used to increase readability of parts of the text – we thank the providers.
The article processing charges for this open-access publication were covered by the Helmholtz Centre for Environmental Research – UFZ.
This paper was edited by Lukas Gudmundsson and reviewed by two anonymous referees.
Addor, N., Newman, A. J., Mizukami, N., and Clark, M. P.: The CAMELS data set: catchment attributes and meteorology for large-sample studies, Hydrol. Earth Syst. Sci., 21, 5293–5313, https://doi.org/10.5194/hess-21-5293-2017, 2017.
Alvarez-Garreton, C., Mendoza, P. A., Boisier, J. P., Addor, N., Galleguillos, M., Zambrano-Bigiarini, M., Lara, A., Puelma, C., Cortes, G., Garreaud, R., McPhee, J., and Ayala, A.: The CAMELS-CL dataset: catchment attributes and meteorology for large sample studies – Chile dataset, Hydrol. Earth Syst. Sci., 22, 5817–5846, https://doi.org/10.5194/hess-22-5817-2018, 2018.
Bach, M., Breuer, L., Frede, H. G., Huisman, J. A., Otte, A., and Waldhardt, R.: Accuracy and congruency of three different digital land-use maps, Landscape Urban Plan., 78, 289–299, https://doi.org/10.1016/j.landurbplan.2005.09.004, 2006.
Bach, M. and Frede, H.-G.: Agricultural nitrogen, phosphorus and potassium balances in Germany – Methodology and trends 1970 to 1995, Z. Pflanz. Bodenkunde, 161, 385–393, https://doi.org/10.1002/jpln.1998.3581610406, 1998.
Ballabio, C., Lugato, E., Fernández-Ugalde, O., Orgiazzi, A., Jones, A., Borrelli, P., Montanarella, L., and Panagos, P.: Mapping LUCAS topsoil chemical properties at European scale using Gaussian process regression, Geoderma, 355, 113912, https://doi.org/10.1016/j.geoderma.2019.113912, 2019.
Bartnicki, J. and Benedictow, A.: Atmospheric Deposition of Nitrogen to OSPAR Convention waters in the period 1995–2014, EMEP/MSC-W Technical Report, 1/2007, Meteorological Synthesizing Centre-West (MSC-W), Norwegian Meteorological Institute, Oslo, https://emep.int/publ/reports/2017/MSCW_technical_1_2017.pdf (last access: 11 August 2022), 2017.
Bartnicki, J. and Fagerli, H.: Atmospheric Nitrogen in the OSPAR Convention Area in the Period 1990–2004. Summary Report for the OSPAR Convention, EMEP/MSC-W Technical Report, 4/2006, Meteorological Synthesizing Centre-West (MSC-W) of EMEP, Oslo, https://www.ospar.org/documents?v=7064 (last access: 12 August 2022), 2006.
Batool, M., Sarrazin, F. J., Attinger, S., Basu, N. B., Van Meter, K., and Kumar, R.: Long-term annual soil nitrogen surplus across Europe (1850–2019), Scientific Data, 9, 612, https://doi.org/10.1038/s41597-022-01693-9, 2022.
Batool, M., Sarrazin, F. J., and Kumar, R.: Century-long reconstruction of gridded phosphorus surplus across Europe (1850–2019), Earth Syst. Sci. Data, 17, 881–916, https://doi.org/10.5194/essd-17-881-2025, 2025.
Behrendt, H., Huber, P., Opitz, D., Schmoll, O., Scholz, G., and Uebe, R.: Nutrient emissions into river basins of Germany, UBA-Texte, 75/99, https://www.umweltbundesamt.de/en/publikationen/naehrstoffbilanzierung-flussgebiete-deutschlands (last access: 8 August 2022), 1999.
Behrendt, H., Bach, M., Kunkel, R., Opitz, D., Pagenkopf, W.-G., Scholz, G., and Wendland, F.: Nutrient Emissions into River Basins of Germany on the Basis of a Harmonized Procedure UBA-Texte, 82/03, https://www.umweltbundesamt.de/en/publikationen/nutrient-emissions-into-river-basins-of-germany-on (last access: 9 August 2022), 2003.
Beven, K. J. and Kirkby, M. J.: A physically based, variable contributing area model of basin hydrology/Un modèle à base physique de zone d’appel variable de l’hydrologie du bassin versant, Hydrol. Sci. B., 24, 43–69, https://doi.org/10.1080/02626667909491834, 1979.
BGR: Bodenübersichtskarte der Bundesrepublik Deutschland 1:250.000 (BUEK250). Soil map of Germany 1:250,000, Federal Institute for Geosciences and Natural Resources (BGR) [data set], https://produktcenter.bgr.de/terraCatalog/Start.do (last access: 9 August 2022), 2018.
BGR and UNESCO (Eds.): International Hydrogeological Map of Europe 1:1 500 000 (IHME1500), Digital map data v1.1 [data set], http://www.bgr.bund.de/ihme1500/ (last access: 9 August 2022), 2014.
BMU (Bundesministerium Für Umwelt) (Ed.): Hydrologischer Atlas von Deutschland, Datenquelle: Hydrologischer Atlas von Deutschland/BfG, 2000, Bonn, Berlin, https://geoportal.bafg.de/mapapps/resources/apps/HAD/index.html (last access: 9 August 2022), 2000.
Center for International Earth Science Information Network – CIESIN – Columbia University: Gridded Population of the World, Version 4 (GPWv4): Population Density, Revision 10, NASA Socioeconomic Data and Applications Center (SEDAC) [data set], https://doi.org/10.7927/H4DZ068D, 2017.
Chagas, V. B. P., Chaffe, P. L. B., Addor, N., Fan, F. M., Fleischmann, A. S., Paiva, R. C. D., and Siqueira, V. A.: CAMELS-BR: hydrometeorological time series and landscape attributes for 897 catchments in Brazil, Earth Syst. Sci. Data, 12, 2075–2096, https://doi.org/10.5194/essd-12-2075-2020, 2020.
Cleveland, C. C., Townsend, A. R., Schimel, D. S., Fisher, H., Howarth, R. W., Hedin, L. O., Perakis, S. S., Latty, E. F., Von Fischer, J. C., Elseroad, A., and Wasson, M. F.: Global patterns of terrestrial biological nitrogen (N2) fixation in natural ecosystems, Global Biogeochem. Cy., 13, 623–645, https://doi.org/10.1029/1999GB900014, 1999.
Cornes, R. C., van der Schrier, G., van den Besselaar, E. J. M., and Jones, P. D.: An Ensemble Version of the E-OBS Temperature and Precipitation Data Sets, J. Geophys. Res.-Atmos., 123, 9391–9409, https://doi.org/10.1029/2017jd028200, 2018.
Coxon, G., Addor, N., Bloomfield, J. P., Freer, J., Fry, M., Hannaford, J., Howden, N. J. K., Lane, R., Lewis, M., Robinson, E. L., Wagener, T., and Woods, R.: CAMELS-GB: hydrometeorological time series and landscape attributes for 671 catchments in Great Britain, Earth Syst. Sci. Data, 12, 2459–2483, https://doi.org/10.5194/essd-12-2459-2020, 2020.
De Jager, A. and Vogt, J.: Rivers and Catchments of Europe – Catchment Characterisation Model (CCM) (2.1), European Commission, Joint Research Centre (JRC) [data set], http://data.europa.eu/89h/fe1878e8-7541-4c66-8453-afdae7469221 (last access: 9 August 2022), 2007.
Dolich, A., Maharjan, A., Mälicke, M., Manoj, J. A., and Loritz, R.: Caravan-DE: Caravan extension Germany – German dataset for large-sample hydrology (v1.0.1), Zenodo [data set], https://doi.org/10.5281/zenodo.13983616, 2024.
Do Nascimento, T. V. M., Höge, M., Schönenberger, U., Pool, S., Siber, R., Kauzlaric, M., Staudinger, M., Horton, P., Floriancic, M. G., Storck, F. R., Rinta, P., Seibert, J., and Fenicia, F.: Swiss data quality: augmenting CAMELS-CH with isotopes, water quality, agricultural and atmospheric data, Scientific Data, 12, 1283, https://doi.org/10.1038/s41597-025-05625-1, 2025.
Dupas, R., Lintern, A., Musolff, A., Winter, C., Fovet, O., and Durand, P.: Water quality responses to hydrological droughts can be predicted from long-term concentration–discharge relationships, Environmental Research: Water, 1, https://doi.org/10.1088/3033-4942/adb906, 2025.
Ebeling, P., Kumar, R., Weber, M., Knoll, L., Fleckenstein, J. H., and Musolff, A.: Archetypes and Controls of Riverine Nutrient Export Across German Catchments, Water Resour. Res., 57, e2020WR028134, https://doi.org/10.1029/2020WR028134, 2021a.
Ebeling, P., Dupas, R., Abbott, B., Kumar, R., Ehrhardt, S., Fleckenstein, J. H., and Musolff, A.: Long-Term Nitrate Trajectories Vary by Season in Western European Catchments, Global Biogeochem. Cy., 35, e2021GB007050, https://doi.org/10.1029/2021GB007050, 2021b.
Ebeling, P., Kumar, R., Lutz, S. R., Nguyen, T., Sarrazin, F., Weber, M., Büttner, O., Attinger, S., and Musolff, A.: QUADICA: water QUAlity, DIscharge and Catchment Attributes for large-sample studies in Germany, Earth Syst. Sci. Data, 14, 3715–3741, https://doi.org/10.5194/essd-14-3715-2022, 2022.
Ebeling, P., Kumar, R., Musolff, A., Nguyen, T., Hubig, A., Haug, S., Scharfenberger, U., Batool, M., Wachholz, A., and Sarrazin, F.: QUADICA v2 – water quality, discharge and catchment attributes for large-sample studies in Germany, HydroShare [data set], https://doi.org/10.4211/hs.c2866cd416b94ca386deb5758834311f, 2025.
Ebeling, P., Van Nguyen, T., Kumar, R., Musolff, A., Schulz, C., Lange, R., and Bumberger, J.: Water Quality Monitor, https://web.app.ufz.de/gdi/wq-monitor/en, last access: 16 January 2026.
EC: Council Directive 91/676/EEC of 12 December 1991 concerning the protection of waters against pollution caused by nitrates from agricultural sources, Official Journal of the European Communities, http://data.europa.eu/eli/dir/1991/676/oj (last access: 9 August 2022), 1991.
EEA: DEM over Europe from the GMES RDA project (EUDEM, resolution 25 m) – version 1, European Environment Agency [data set], https://www.eea.europa.eu/data-and-maps/data/eu-dem (last access: 9 August 2022), 2013.
EEA: CORINE Land Cover 2012 v18.5, European Environment Agency [data set], https://land.copernicus.eu/pan-european/corine-land-cover/clc-2012 (last access: 11 August 2022), 2016.
EEA: Waterbase – UWWTD: Urban Waste Water Treatment Directive – reported data (v5), European Environment Agency [data set], https://www.eea.europa.eu/data-and-maps/data/waterbase-uwwtd-urban-waste-water-treatment-directive-5 (last access: 9 August 2022), 2017.
EEA: CORINE Land Cover 2018 (raster 100 m), Europe, 6-yearly – version 2020_20u1, May 2020 European Environment Agency [data set], https://doi.org/10.2909/960998c1-1870-4e82-8051-6485205ebbac, 2019a.
EEA: EU-Hydro – River Network Database (v1), European Environment Agency (EEA) [data set], https://doi.org/10.2909/393359a7-7ebd-4a52-80ac-1a18d5f3db9c, 2019b.
EEA: EU-Hydro River Network Database 2006–2012 (vector), Europe – version 1.3 (version 1.3), European Environment Agency (EEA), Copernicus Land Monitoring Service [data set], https://doi.org/10.2909/393359a7-7ebd-4a52-80ac-1a18d5f3db9c, 2020.
Ehrhardt, S., Ebeling, P., Dupas, R., Kumar, R., Fleckenstein, J. H., and Musolff, A.: Nitrate Transport and Retention in Western European Catchments Are Shaped by Hydroclimate and Subsurface Properties, Water Resour. Res., 57, e2020WR029469, https://doi.org/10.1029/2020WR029469, 2021.
FAO/IIASA/ISRIC/ISSCAS/JRC: Harmonized World Soil Database (version 1.2), FAO, Rome, Italy and IIASA, Laxenburg, Austria [data set], https://webarchive.iiasa.ac.at/Research/LUC/External-World-soil-database/HTML/ (last access: 11 August 2022), 2012.
Fernandez, N., Cohen, M. J., and Jawitz, J. W.: ChemLotUS: A Benchmark Data Set of Lotic Chemistry Across US River Networks, Water Resour. Res., 61, e2024WR039355, https://doi.org/10.1029/2024WR039355, 2025.
Fowler, K. J. A., Acharya, S. C., Addor, N., Chou, C., and Peel, M. C.: CAMELS-AUS: hydrometeorological time series and landscape attributes for 222 catchments in Australia, Earth Syst. Sci. Data, 13, 3847–3867, https://doi.org/10.5194/essd-13-3847-2021, 2021.
Gupta, H. V., Perrin, C., Blöschl, G., Montanari, A., Kumar, R., Clark, M., and Andréassian, V.: Large-sample hydrology: a need to balance depth with breadth, Hydrol. Earth Syst. Sci., 18, 463–477, https://doi.org/10.5194/hess-18-463-2014, 2014.
Häußermann, U., Klement, L., Breuer, L., Ullrich, A., Wechsung, G., and Bach, M.: Nitrogen soil surface budgets for districts in Germany 1995 to 2017, Environmental Sciences Europe, 32, 109, https://doi.org/10.1186/s12302-020-00382-x, 2020.
Heudorfer, B., Gupta, H. V., and Loritz, R.: Are Deep Learning Models in Hydrology Entity Aware?, Geophysical Research Letters, 52, https://doi.org/10.1029/2024gl113036, 2025.
Hirsch, R. M. and De Cicco, L. A.: User Guide to Exploration and Graphics for RivEr Trends (EGRET) and dataRetrieval: R Packages for Hydrologic Data, U.S. Geological Survey Techniques and Methods book 4, chap. A10, 93, https://doi.org/10.3133/tm4A10, 2015.
Hirsch, R. M., Moyer, D. L., and Archfield, S. A.: Weighted Regressions on Time, Discharge, and Season (WRTDS), with an Application to Chesapeake Bay River Inputs, JAWRA Journal of the American Water Resources Association, 46, 857–880, https://doi.org/10.1111/j.1752-1688.2010.00482.x, 2010.
Knoll, L., Breuer, L., and Bach, M.: Nation-wide estimation of groundwater redox conditions and nitrate concentrations through machine learning, Environ. Res. Lett., 15, 064004, https://doi.org/10.1088/1748-9326/ab7d5c, 2020.
Kratzert, F., Klotz, D., Brenner, C., Schulz, K., and Herrnegger, M.: Rainfall–runoff modelling using Long Short-Term Memory (LSTM) networks, Hydrol. Earth Syst. Sci., 22, 6005–6022, https://doi.org/10.5194/hess-22-6005-2018, 2018.
Kratzert, F., Nearing, G., Addor, N., Erickson, T., Gauch, M., Gilon, O., Gudmundsson, L., Hassidim, A., Klotz, D., Nevo, S., Shalev, G., and Matias, Y.: Caravan – A global community dataset for large-sample hydrology, Scientific Data, 10, 61, https://doi.org/10.1038/s41597-023-01975-w, 2023.
Livneh, B., Kumar, R., and Samaniego, L.: Influence of soil textural properties on hydrologic fluxes in the Mississippi river basin, Hydrol. Process., 29, 4638–4655, https://doi.org/10.1002/hyp.10601, 2015.
Loritz, R., Dolich, A., Acuña Espinoza, E., Ebeling, P., Guse, B., Götte, J., Hassler, S. K., Hauffe, C., Heidbüchel, I., Kiesel, J., Mälicke, M., Müller-Thomy, H., Stölzle, M., and Tarasova, L.: CAMELS-DE: hydro-meteorological time series and attributes for 1582 catchments in Germany, Earth Syst. Sci. Data, 16, 5625–5642, https://doi.org/10.5194/essd-16-5625-2024, 2024.
Minasny, B., McBratney, A. B., Brough, D. M., and Jacquier, D.: Models relating soil pH measurements in water and calcium chloride that incorporate electrolyte concentration, European Journal of Soil Science, 62, 728–732, https://doi.org/10.1111/j.1365-2389.2011.01386.x, 2011.
Minaudo, C., Abonyi, A., Alcaraz, C., Diamond, J., Howden, N. J. K., Rode, M., Romero, E., Thieu, V., Worrall, F., Zhang, Q., and Benito, X.: OLIGOTREND, a global database of multi-decadal chlorophyll a and water quality time series for rivers, lakes, and estuaries, Earth Syst. Sci. Data, 17, 3411–3430, https://doi.org/10.5194/essd-17-3411-2025, 2025.
Musolff, A.: WQQDB – water quality and quantity data base Germany: metadata, HydroShare [data set], https://doi.org/10.4211/hs.a42addcbd59a466a9aa56472dfef8721, 2020.
Musolff, A., Fleckenstein, J. H., Opitz, M., Büttner, O., Kumar, R., and Tittel, J.: Spatio-temporal controls of dissolved organic carbon stream water concentrations, J. Hydrol., 566, 205–215, https://doi.org/10.1016/j.jhydrol.2018.09.011, 2018.
Musolff, A., Ebeling, P., Wachholz, A., Hubig, A., and Scharfenberger, U.: WQQDB2: water quality and quantity data base Germany version 2, Helmholtz-Zentrum für Umweltforschung [data set], https://www.ufz.de/record/dmp/archive/16457/ (last access: 16 January 2026), 2026.
Nguyen, T. V., Sarrazin, F. J., Ebeling, P., Musolff, A., Fleckenstein, J. H., and Kumar, R.: Toward Understanding of Long-Term Nitrogen Transport and Retention Dynamics Across German Catchments, Geophysical Research Letters, 49, e2022GL100278, https://doi.org/10.1029/2022GL100278, 2022.
Panagos, P., Köningner, J., Ballabio, C., Liakos, L., Muntwyler, A., Borrelli, P., and Lugato, E.: Improving the phosphorus budget of European agricultural soils, Science of The Total Environment, 853, 158706, https://doi.org/10.1016/j.scitotenv.2022.158706, 2022.
Pflugmacher, D., Rabe, A., Peters, M., and Hostert, P.: Pan-European land cover map of 2015 based on Landsat and LUCAS data, PANGAEA [data set], https://doi.org/10.1594/PANGAEA.896282, 2018.
Rakovec, O., Samaniego, L., Hari, V., Markonis, Y., Moravec, V., Thober, S., Hanel, M., and Kumar, R.: The 2018–2020 Multi-Year Drought Sets a New Benchmark in Europe, Earth's Future, 10, e2021EF002394, https://doi.org/10.1029/2021EF002394, 2022.
Saavedra, F. A., Musolff, A., von Freyberg, J., Merz, R., Basso, S., and Tarasova, L.: Disentangling scatter in long-term concentration–discharge relationships: the role of event types, Hydrol. Earth Syst. Sci., 26, 6227–6245, https://doi.org/10.5194/hess-26-6227-2022, 2022.
Saavedra, F., Musolff, A., Von Freyberg, J., Merz, R., Knöller, K., Müller, C., Brunner, M., and Tarasova, L.: Winter post-droughts amplify extreme nitrate concentrations in German rivers, Environmental Research Letters, 19, 024007, https://doi.org/10.1088/1748-9326/ad19ed, 2024.
Saha, G. K., Rahmani, F., Shen, C., Li, L., and Cibin, R.: A deep learning-based novel approach to generate continuous daily stream nitrate concentration for nitrate data-sparse watersheds, Sci. Total Environ., 878, 162930, https://doi.org/10.1016/j.scitotenv.2023.162930, 2023.
Samaniego, L., Kumar, R., and Attinger, S.: Multiscale parameter regionalization of a grid-based hydrologic model at the mesoscale, Water Resour. Res., 46, W05523, https://doi.org/10.1029/2008WR007327, 2010.
Sarrazin, F. J., Kumar, R., Basu, N. B., Musolff, A., Weber, M., Van Meter, K. J., and Attinger, S.: Characterizing Catchment-Scale Nitrogen Legacies and Constraining Their Uncertainties, Water Resour. Res., 58, e2021WR031587, https://doi.org/10.1029/2021WR031587, 2022.
Sarrazin, F. J., Attinger, S., and Kumar, R.: Gridded dataset of nitrogen and phosphorus point sources from wastewater in Germany (1950–2019), Earth Syst. Sci. Data, 16, 4673–4708, https://doi.org/10.5194/essd-16-4673-2024, 2024.
Shangguan, W., Hengl, T., Mendes de Jesus, J., Yuan, H., and Dai, Y.: Mapping the global depth to bedrock for land surface modeling, J. Adv. Model. Earth Sy., 9, 65–88, https://doi.org/10.1002/2016ms000686, 2017.
Sterle, G., Perdrial, J., Kincaid, D. W., Underwood, K. L., Rizzo, D. M., Haq, I. U., Li, L., Lee, B. S., Adler, T., Wen, H., Middleton, H., and Harpold, A. A.: CAMELS-Chem: augmenting CAMELS (Catchment Attributes and Meteorology for Large-sample Studies) with atmospheric and stream water chemistry data, Hydrol. Earth Syst. Sci., 28, 611–630, https://doi.org/10.5194/hess-28-611-2024, 2024.
Van Meter, K. J. and Basu, N. B.: Catchment legacies and time lags: a parsimonious watershed model to predict the effects of legacy storage on nitrogen export, PLoS One, 10, e0125971, https://doi.org/10.1371/journal.pone.0125971, 2015.
Van Meter, K. J., Basu, N. B., and Van Cappellen, P.: Two centuries of nitrogen dynamics: Legacy sources and sinks in the Mississippi and Susquehanna River Basins, Global Biogeochem. Cy., 31, 2–23, https://doi.org/10.1002/2016GB005498, 2017.
Vigiak, O., Grizzetti, B., Zanni, M., Aloe, A., Dorati, C., Bouraoui, F., and Pistocchi, A.: Domestic waste emissions to European freshwaters in the 2010s (v. 1.0), European Commission, Joint Research Centre (JRC) [data set], https://data.jrc.ec.europa.eu/dataset/0ae64ac2-64da-4c5e-8bab-ce928897c1fb (last access: 9 August 2022), 2019.
Vigiak, O., Grizzetti, B., Zanni, M., Aloe, A., Dorati, C., Bouraoui, F., and Pistocchi, A.: Domestic waste emissions to European waters in the 2010s, Sci. Data, 7, 33, https://doi.org/10.1038/s41597-020-0367-0, 2020.
Virro, H., Amatulli, G., Kmoch, A., Shen, L., and Uuemaa, E.: GRQA: Global River Water Quality Archive, Earth Syst. Sci. Data, 13, 5483–5507, https://doi.org/10.5194/essd-13-5483-2021, 2021.
Wachholz, A., Dehaspe, J., Ebeling, P., Kumar, R., Musolff, A., Saavedra, F., Winter, C., Yang, S., and Graeber, D.: Stoichiometry on the edge – Humans induce strong imbalances of reactive ratios in streams, Environmental Research Letters, 18, 044016, https://doi.org/10.1088/1748-9326/acc3b1, 2023.
WMO: Manual on Low-flow Estimation and Prediction, Operational Hydrology Report (OHR), Volume No. 50, Series Volume No. 1029, World Meteorological Organization, ISBN 978-92-63-11029-9, https://library.wmo.int/doc_num.php?explnum_id=7699 (last access: 9 August 2022), 2008.
Winter, C., Nguyen, T. V., Musolff, A., Lutz, S. R., Rode, M., Kumar, R., and Fleckenstein, J. H.: Droughts can reduce the nitrogen retention capacity of catchments, Hydrol. Earth Syst. Sci., 27, 303–318, https://doi.org/10.5194/hess-27-303-2023, 2023.
Yan, K., Wang, J., Peng, R., Yang, K., Chen, X., Yin, G., Dong, J., Weiss, M., Pu, J., and Myneni, R. B.: HiQ-LAI: a high-quality reprocessed MODIS leaf area index dataset with better spatiotemporal consistency from 2000 to 2022, Earth Syst. Sci. Data, 16, 1601–1622, https://doi.org/10.5194/essd-16-1601-2024, 2024.
Zarei, E., Noori, R., Jun, C., Bateni, S. M., Kianmehr, P., and Zhu, S.: A Comprehensive Water Chemistry Dataset for Iranian Rivers, Scientific Data, 12, 1646, https://doi.org/10.1038/s41597-025-05932-7, 2025.
Zhi, W., Feng, D., Tsai, W.-P., Sterle, G., Harpold, A., Shen, C., and Li, L.: From Hydrometeorology to River Water Quality: Can a Deep Learning Model Predict Dissolved Oxygen at the Continental Scale?, Environmental Science and Technology, 55, 2357–2368, https://doi.org/10.1021/acs.est.0c06783, 2021.
Zhi, W., Ouyang, W., Shen, C., and Li, L.: Temperature outweighs light and flow as the predominant driver of dissolved oxygen in US rivers, Nature Water, 1, 249–260, https://doi.org/10.1038/s44221-023-00038-z, 2023.
Zink, M., Kumar, R., Cuntz, M., and Samaniego, L.: A high resolution dataset of water fluxes and states for Germany accounting for parametric uncertainty, Hydrol. Earth Syst. Sci., 21, 1769–1790, https://doi.org/10.5194/hess-21-1769-2017, 2017.