the Creative Commons Attribution 4.0 License.
the Creative Commons Attribution 4.0 License.
 | 09 Sep 2026
Satellite-based inversion of global methane fluxes: capabilities and implications of GOSAT-2 measurements

Yosuke Niwa
Yukio Yoshida
Hiroshi Suto
Kei Shiomi
Akihide Kamei
Fumie Kataoka
Isamu Morino
Hibiki M. Noda
Hirofumi Ohyama
Tazu Saeki
Yu Someya
Hisashi Yashiro
Tsuneo Matsunaga
Methane (CH4) is a key greenhouse gas with a strong climate impact and a relatively short atmospheric lifetime, making accurate monitoring essential for mitigation strategies. Satellite observations provide global coverage and independent constraints on CH4 emission estimates, and GOSAT-2, launched in 2018 as the successor to GOSAT, was designed to improve retrieval accuracy and enhance flux estimation. This study presents an evaluation of the GOSAT-2 Level 4 (G2L4) CH4 flux product, supported by analysis of the underlying Level 2 (L2) XCH4 retrievals, and summarizes key findings on global and regional CH4 budgets. Using an atmospheric inversion framework, we generated G2L4 posterior CH4 fluxes and assessed their consistency by comparing them with inversions constrained by alternative observational datasets, including GOSAT L2 retrievals and ground-based and aircraft measurements. GOSAT-2 achieved substantial improvements in observational coverage and data density compared to its predecessor, particularly in tropical and high-latitude regions. Posterior flux estimates derived from G2L4 are broadly consistent with global CH4 budgets reported in synthesis studies, while prior-to-posterior differences reveal positive corrections in tropical regions and negative adjustments in several mid-latitude industrial areas. A preliminary sector-focused assessment further demonstrates the potential of GOSAT-2 to inform anthropogenic CH4 emission evaluations in regions where such sources dominate. These findings highlight the value of GOSAT-2 observations for improving regional and global CH4 emission estimates and underscore priorities for future improvements in retrieval algorithms, observation strategies, and integration with complementary datasets. The analysis-ready subsets of the GOSAT and GOSAT-2 data used in this study are available from Zenodo (https://doi.org/10.5281/zenodo.18883060, Saito, 2026).
- Article
(9352 KB) - Full-text XML
- BibTeX
- EndNote


Methane (CH4) is one of the most important greenhouse gases and a major contributor to anthropogenic climate forcing, the atmospheric amount of which has increased to more than 2.5 times its pre-industrial level. This rapid increase has made CH4 a major contributor to climate change, ranking just behind carbon dioxide (CO2) in terms of radiative forcing (Shindell et al., 2021). Its concentration is now increasing faster than at any time since the 1980s (Nisbet et al., 2019). CH4 is a short-lived climate forcer with an atmospheric lifetime of roughly a decade, which means that taking action now can quickly reduce atmospheric concentrations and lead to similarly rapid reductions in climate forcing. Moreover, CH4 contributes to the formation of ground-level ozone, so mitigation would also help decrease ozone-related air pollution. A better understanding of the CH4 budget at various scales from local to global is essential to constrain atmospheric concentrations and to design effective mitigation strategies that limit global warming to 1.5 °C this century.
However, efforts to understand the CH4 budgets remain challenging because atmospheric variability reflects a complex interplay of anthropogenic sources, natural emissions such as wetlands, and chemical sinks. For instance, the renewed increase in the global CH4 burden since 2007, accompanied by a significant shift toward more depleted 13C in atmospheric CH4, has yet to be fully explained, with multiple contributing factors still under debate (e.g., Worden et al., 2017; Nisbet et al., 2019; Li et al., 2022). These uncertainties highlight the need for comprehensive observations. However, existing ground-based and aircraft observations are unevenly distributed and provide limited coverage in regions where CH4 emissions are large or highly variable. Capturing the full spatial and temporal variability of CH4 therefore requires observational systems that can deliver consistent measurements at the global scale. Consequently, satellite measurements potentially provide a unique opportunity to deliver global coverage and independent constraints on CH4 emissions.
Instruments aboard Earth-observing satellites retrieve CH4 concentrations by measuring solar radiation reflected from the Earth's surface and attenuated by gas absorption at specific wavelengths. Instruments are designed to target absorption bands of CO2 and CH4 in the shortwave infrared (SWIR) region, which provides sensitivity to variations in column abundance, including contributions from the lower troposphere that are relevant for surface flux estimation. To reduce uncertainties caused by scattering from clouds and aerosols, absorption bands of oxygen (O2), whose atmospheric abundance is nearly constant, are also observed to correct for variations in optical path length. Satellite-based CH4 monitoring began with the SCIAMACHY (SCanning Imaging Absorption spectroMeter for Atmospheric CHartographY) instrument aboard ENVISAT, which was launched in 2002 and provided the first global measurements of greenhouse gases from space (Frankenberg et al., 2006). This was followed by the launch of GOSAT (Greenhouse gases Observing SATellite) in 2009, the world's first dedicated greenhouse gas observation satellite, which delivered high-precision column-averaged dry-air mole fraction of CO2 and CH4 (XCO2 and XCH4) and enabled robust global CH4 budget assessments (Yokota et al., 2009). Subsequent missions, such as the TROPOMI (TROPOspheric Monitoring Instrument) instrument aboard Sentinel-5P offering wide coverage and frequent observations, have further advanced CH4 monitoring (Lorente et al., 2021).
These satellite-based CH4 observations have significantly advanced our understanding of CH4 sources and sinks. Early studies demonstrated that XCO2 and XCH4 data can be retrieved with high precision from SWIR measurements (Yoshida et al., 2013), and validation frameworks using ground truth provided by TCCON (Total Carbon Column Observing Network) were established to ensure data accuracy (Wunch et al., 2011). Building on these capabilities, atmospheric inversion ensembles incorporating satellite observations have contributed to constraining both natural and anthropogenic CH4 emissions, particularly in regions with sparse ground-based coverage such as developing countries (Deng et al., 2025). Satellite data have also provided essential measurements that support the quantification of regional and sectoral contributions to the global CH4 budget (Zhang et al., 2021) and evaluation of national emissions from anthropogenic activities (Chen et al., 2022). Beyond large-scale assessments, satellite observations have revealed critical events and natural source dynamics, including extreme CH4 leakage from a natural gas well blowout (Pandey et al., 2019) and the spatial and temporal distribution of global wetland emissions (Chen et al., 2025). These advances underscore the pivotal role of satellite measurements in improving CH4 emission inventories and guiding mitigation strategies.
Motivated by the successful achievements of space-based XCH4 measurements and the need for continuous long-term monitoring of greenhouse gases, GOSAT-2 was launched in 2018 as the successor to GOSAT (Imasu et al., 2023). The mission was designed to improve the accuracy of greenhouse gas flux estimates and to enable more robust assessments of anthropogenic emissions, including those from large urban areas. To meet these objectives, GOSAT-2 introduced several enhancements: improved signal-to-noise ratio (SNR) for higher retrieval precision, an expansion of the spectral coverage to include absorption by carbon monoxide (CO) to better characterize fossil fuel emissions, and expanded target observation strategies to increase the number of quality-screened measurements for national-scale emission estimates. Following its initial public release, the GOSAT-2 XCH4 data product has been continuously improved through updates to spectral radiance data and retrieval algorithms. These continuous enhancements and the growing long-term record enable the use of GOSAT-2 XCH4 data for estimating CH4 sources and sinks at both regional and global scales.
This study focuses on two key GOSAT-2 data products. The Level 2 SWIR XCH4 product (version V02.10) provides an updated long-term record of satellite-based CH4 columns with improved retrieval performance and substantially expanded spatial coverage compared to GOSAT. In addition, we present the first public release of the GOSAT-2 Level 4 CH4 flux product, which delivers monthly CH4 surface fluxes at 1° resolution derived exclusively from GOSAT-2 observations. Together, these datasets offer a new basis for evaluating global and regional CH4 budgets using the enhanced capabilities of the GOSAT-2 mission.
Building on these datasets, this paper provides an overview of the GOSAT-2 mission and evaluates its XCH4 data product and CH4 flux estimates. Section 2 describes the sensor specifications of GOSAT-2 as well as the data and modeling system used in this study, while Sect. 3 presents key findings on the global distribution of XCH4 and CH4 budgets. Finally, we discuss the implications of these results for regional source and sink estimates and for assessments of anthropogenic emissions.
2.1 GOSAT-2 satellite system and instruments
2.1.1 Satellite bus design
The GOSAT-2 satellite bus system follows the basic design of the first mission, GOSAT, with several modifications introduced based on operational experience. Key enhancements include an enlarged solar array and increased power generation capacity, enabling stable full-operation even under partial system failure. The sensor was repositioned to reduce stray light from the solar array, and the overall bus configuration was adjusted accordingly to maintain thermal stability and instrument performance. These design updates contribute to the broader observational coverage provided by GOSAT-2 compared with its predecessor.
2.1.2 Orbital configuration
A major change from the GOSAT mission is the adoption of a six-day repeat cycle for GOSAT-2, compared with the three-day cycle of GOSAT. This configuration reduces the spacing between adjacent ground tracks at the equator, providing denser spatial sampling along the orbit. The improved sampling supports more uniform global coverage for SWIR observations of CH4, especially in low-latitude regions where cloudiness often limits data availability. The repeat cycle is determined by the satellite's altitude and inclination, and for GOSAT-2 the orbit was set to 613 km, corresponding to 89 revolutions in six days. The local solar time at the descending node is maintained at 13:00 ± 15 min. In addition, the orbit was designed to pass directly over the Lamont TCCON site to enable regular cross-validation under frequent clear-sky conditions.
2.1.3 Primary instruments
GOSAT-2 is equipped with two primary instruments:
-
TANSO-FTS-2 (Thermal And Near infrared Sensor for carbon Observation-Fourier Transform Spectrometer-2)
-
TANSO-CAI-2 (Cloud and Aerosol Imager-2)
Similar to the TANSO-FTS instrument onboard GOSAT, TANSO-FTS-2 performs spectroscopic measurements using a Fourier Transform Spectrometer (FTS). It is equipped with five detector bands covering wavelengths from SWIR to thermal infrared (TIR), enabling the observation of atmospheric concentrations of CO2, CH4, water vapor (H2O), O2, ozone (O3), and CO. A detailed summary of the wavelength coverage for each band is provided in Table 1.
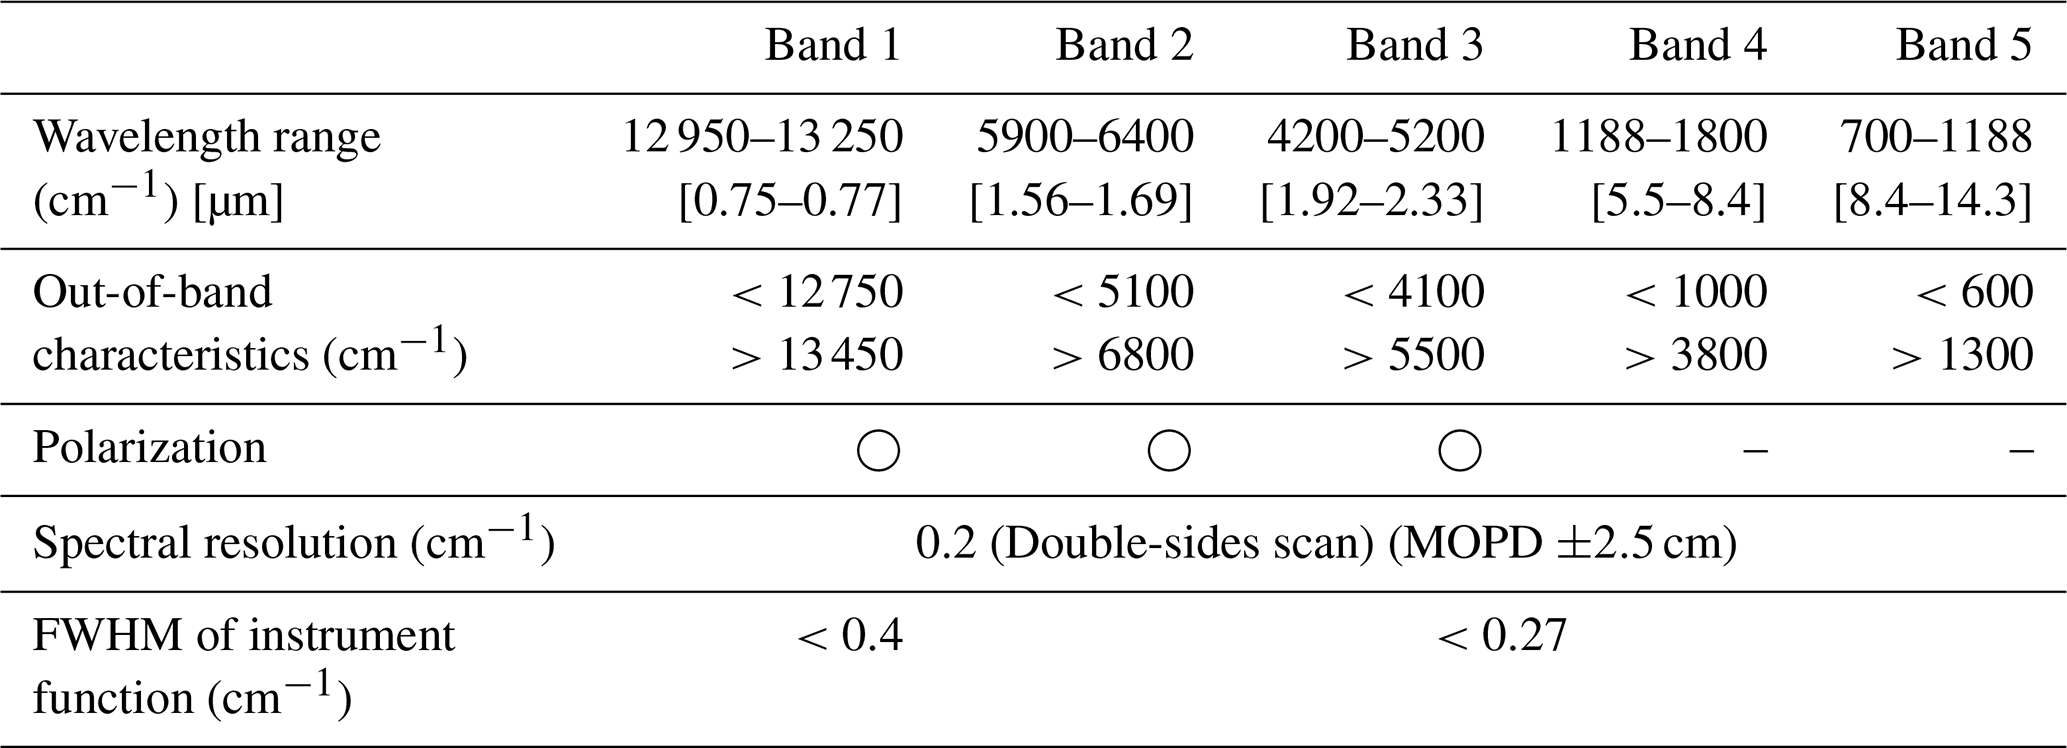
TANSO-FTS-2 employs a double-pendulum interferometer. In this configuration, the intersection of the flexure blades serves as the rotation axis, and the scanner arm moves in either the clockwise (forward) or counterclockwise (backward) direction. Each forward or backward movement constitutes one scan, during which a single observation dataset is acquired. Because the instrument characteristics differ between forward and backward scans, the data processing algorithm identifies the scan direction and handles the data accordingly. In addition, the forward/backward viewing geometry is used in coordination with TANSO-CAI-2 to avoid sun-glint over the ocean and to improve cloud discrimination, contributing to increased numbers of usable ocean observations.
2.1.4 Observation geometry and Intelligent Pointing
The detector employs a circular point sensor, producing a footprint with a diameter of 9.7 km at nadir. This field of view can be steered using mirrors within ±40° in the along-track (AT) direction and ±35° in the cross-track (CT) direction using a two-axis pointing mirror.
To increase the number of successful observations, TANSO-FTS-2 incorporates an “Intelligent Pointing” function that uses an onboard field-of-view camera to capture visible images of the area surrounding the planned observation points. When clouds are detected at the nominal footprint, the system automatically searches for nearby cloud-free locations within the camera's imaging area and adjusts the pointing direction toward these clear-sky targets. If a clear-sky target cannot be identified, the instrument observes the center of the scene.
Observations are conducted at 1246 discrete points along each orbit, with 4.024 s allocated for interferogram acquisition and approximately 0.65 s for the turnaround phase during which the pointing mirror is reoriented toward the next observation target.
2.1.5 Performance improvement
TANSO-FTS-2 performs routine on-orbit calibration operations, including solar irradiance, blackbody, nighttime, deep-space, instrument-function, lunar, and electrical calibration. Vicarious calibration using actual observation data is also applied (Kuze et al., 2010).
To fully utilize the available dynamic range and suppress quantization noise, TANSO-FTS-2 employs an adaptive gain-control system that adjusts detector gain according to signal intensity and observational conditions. This mechanism ensures appropriate sensitivity across diverse surface types, including bright desert regions and sun-glint areas. Detailed description of the gain-control architecture and its operational configurations are provided in Suto et al. (2021, 2022).
2.1.6 Data downlink and processing
Data acquired in orbit are downlinked to a ground station located in the Svalbard Islands. The downlinked data are then transmitted to the Japan Aerospace Exploration Agency (JAXA) Tsukuba Space Center, where Level 0 and Level 1 processing are performed.
-
Level 0 processing: involves unpacking the data packets received from the satellite and arranging them in sequence.
-
Level 1A: conversion of Level 0 data into interferograms.
-
Level 1B: inverse Fourier transformation to generate radiance spectra, followed by radiometric corrections and related adjustments.
The Level 1B product is then transmitted to the National Institute for Environmental Studies (NIES), where higher-level processing, including Level 2 and beyond, is performed.
2.1.7 Level 1B product release and updates
The Level 1B product was first made publicly available in 2019 and has since undergone multiple updates to its calibration and processing algorithms. For details on the instrument characteristics and operational aspects of GOSAT-2, see Suto et al. (2021, 2022).
2.2 SWIR Column-averaged dry air mole fraction product
2.2.1 Input data and lookup tables
The XCH4 retrieval in this study is based on the GOSAT-2 Level 1B radiance product, supplemented by auxiliary information required for the full-physics forward model. These inputs include instrument characterization data, the optical depth of the reference spectrum, solar irradiance, and lookup tables (LUTs) describing gas absorption and aerosol optical properties. Gas absorption cross-sections, aerosol parameters, and solar Fraunhofer lines follow the datasets described in the G2L2 Algorithm Theoretical Basis Document (G2L2ATBD; Yoshida and Oshio, 2025), with aerosol information based on the Spectral Radiation-Transport Model for Aerosol Species (SPRINTARS; Takemura et al., 2003) and solar spectral data following Toon (2015).
Although the G2L2 retrieval algorithm is capable of accounting for cirrus cloud scattering, the V02.XX product applies a pre-screening procedure that retains only cloud-free observations. As a result, clouds are not treated explicitly in the radiative transfer calculations for the version used in this study.
2.2.2 Preprocessing of radiance spectra
As part of the preprocessing, radiance correction, wavenumber-interval correction, and polarization synthesis are applied to the Level 1B spectra. Radiance correction accounts for sensitivity variations derived from on-orbit solar, lunar, and vicarious calibration data. The wavenumber axis is adjusted to correct for small variations in the spectral sampling interval contained in the Level 1B product. Polarization synthesis is used to derive the total incident radiance on TANSO-FTS-2 from the two polarized components of the observed spectra.
2.2.3 Retrieval approach: Full physics method
The GOSAT-2 TANSO-FTS-2 SWIR Level 2 column-averaged dry-air mole fraction product (hereinafter referred to as G2L2 product) is retrieved using a full-physics approach in which multiple spectral bands are fitted simultaneously while accounting for scattering by aerosols and surface reflection. Observations are first screened prior to the retrieval to remove soundings with instrumental quality issues or indications of cloud and aerosol contamination. After the retrieval, an additional quality screening based on convergence diagnostics and retrieval quality criteria is applied, and only successful retrievals are included in the final product.
The retrieval is formulated as a maximum a posteriori (MAP) optimization (Rodgers, 2000), in which the state vector includes concentrations of CO2, CH4, H2O, and CO in 15 vertical layers, aerosol profile parameters, surface pressure, temperature-profile adjustment, surface albedo, and chlorophyll fluorescence. Instrument-related parameters include radiometric offsets and instrument line-shape scaling factors.
The forward model combines a radiative-transfer module and an instrument-response module. The radiative-transfer module computes monochromatic radiances using a fast non-polarized radiative-transfer scheme; although the algorithm is capable of treating polarization, polarization is not considered in the operational retrieval. The instrument-response module applies the TANSO-FTS-2 spectral response to generate simulated spectra and Jacobians consistent with the Level 1B product.
Further methodological and numerical details of the LUT construction, preprocessing steps, and the full-physics retrieval formulation are documented comprehensively in the G2L2ATBD.
2.2.4 G2L2 product release and updates
The G2L2 product was first released as a preliminary version (V01.01) for research announcement users in November 2019, followed by a general release (V01.04) in November 2020. A major update, including improvements to both the retrieval algorithm and input data, was implemented in July 2022 (V02.00). Subsequently, a minor update (V02.10) addressing a bug in the a priori aerosol optical thickness setting and revising post-screening criteria was released in February 2025. This version uses Level 1B product V220.220 as input data. The update from V02.00 to V02.10 significantly improved spatial distribution, particularly over desert regions; therefore, this study employs V02.10 for global surface CH4 flux estimation. Since then, the product has been updated to V02.21 due to changes in Level 1B inputs, but no further modifications to the processing algorithm have been made since V02.10.
2.3 Global surface CH4 flux estimates
2.3.1 Overview of GOSAT-2 Level 4 CH4 flux estimation
The GOSAT project has provided global surface CO2 and CH4 flux estimates as Level 4 (G1L4) products since 2012. GOSAT Level 4 products were generated on a sub-continental scale using the NIES atmospheric tracer transport model (NIES-TM) together with a fixed-lag Kalman smoother (Maksyutov et al., 2013). While this framework improved flux accuracy, it relied heavily on in situ observations and could not fully isolate the contribution of satellite data. The GOSAT-2 Level 4 CH4 flux product (G2L4) was developed to address these limitations. G2L4 differs from G1L4 in two fundamental aspects: (1) it uses the Non-hydrostatic Icosahedral Atmospheric Model (NICAM)-based inversion system described in Niwa et al. (2025), which provides higher spatial resolution and fully mass-conservative transport, and (2) it assimilates only the G2L2 product, allowing a satellite-only assessment of global and regional CH4 budgets. Except for these differences in observational constraints and prior specifications, the inversion framework used in this study follows Niwa et al. (2025). The key components of the inversion framework are summarized below, and further details are provided in the following subsections.
In this study, global surface CH4 fluxes are estimated using an atmospheric inversion framework based on a Bayesian approach, in which prior information on surface fluxes is optimized by assimilating atmospheric CH4 observations. The inversion is formulated within a four-dimensional variational (4D-Var) framework, in which the optimal flux vector is obtained by minimizing a cost function that accounts for both prior flux constraints and observation-model mismatch. The cost function J is defined as:
where , with x and xpri denoting vectors of modeled and a priori source/sink strengths, respectively. M is the linear forward transport operator that maps flux perturbations to concentration changes at observation locations. where with y is the vector of observed concentrations. B and R are the error covariance matrices for the a priori flux estimates and the observation-model misfit, respectively. The superscript T denotes the transpose.
The control variables consist of adjustments to prior CH4 fluxes, including anthropogenic emissions, biomass burning, terrestrial biosphere fluxes, and other natural sources. The global surface CH4 fluxes are estimated on a 1° grid with monthly temporal resolution.
2.3.2 Model system: NISMON-CH4
The inversion system used to generate the G2L4 product is based on the NICAM-based Inverse Simulation for Monitoring CH4 (NISMON-CH4; Niwa et al., 2025). NISMON-CH4 integrates the NICAM-TM transport model with a 4D-Var inversion system, providing mass-conservative global transport and high-resolution flux estimates on a 1° grid.
Because the present study focuses on evaluating the impact of GOSAT-2 observations, only the modifications specific to G2L4 – such as the use of G2L2 as the sole observational constraint and updates to prior fluxes – are summarized in the following sections.
2.3.3 Prior fluxes
The prior CH4 fluxes used in the G2L4 inversion largely follow the framework of Niwa et al. (2025), with updates specific to this study. Anthropogenic emissions are taken from the Emissions Database for Global Atmospheric Research (EDGAR version 6.0; Crippa et al., 2021; Ferrario et al., 2021) and prescribed as annual totals for five source sectors: coal mining, oil and gas, landfill and waste, biofuel use, and enteric fermentation and manure management.
Monthly biogenic flux components-rice paddies, wetlands, and soil oxidation-are derived from a prognostic biosphere model, the Vegetation Integrative Simulator for Trace gases (VISIT; Ito and Inatomi, 2012), using the Cao et al. (1996) scheme for wetland and rice-paddy CH4 production. Biomass-burning emissions are taken from the Global Biomass Burning Emissions Inventory (GBEI version “2022a”; Shiraishi et al., 2021; Saito et al., 2022) and aggregated to a 1° grid.
Natural fluxes include oceanic, termite, and geological emissions, following Weber et al. (2019), Ito (2023), and Etiope et al. (2019). Geological emissions are scaled to a global total of 23 Tg CH4 yr−1 after Canadell et al. (2021), as in Niwa et al. (2025). The global surface CH4 fluxes are estimated at a spatial resolution of 1.0° and a monthly time step.
As in Niwa et al. (2025), EDGAR v6.0 anthropogenic emissions and VISIT-derived biospheric fluxes were available only through their final release years. For subsequent years, the fluxes from the final available year were used. Consequently, prior fluxes other than biomass-burning emissions do not contain interannual variability during the study period, and interannual variations in posterior flux estimates are primarily driven by observational constraints.
The control vector consists of scaling factors and flux adjustments applied to the prior CH4 flux components. Different optimization approaches are applied depending on the source category. Anthropogenic emissions, biomass-burning emissions, and other natural emissions are optimized using multiplicative scaling factors that preserve their prescribed spatial patterns. In contrast, rice-paddy, wetland, and soil-oxidation fluxes are optimized using additive flux adjustments, allowing both the magnitude and spatial distribution of these biosphere-related fluxes to vary. This treatment reflects the larger uncertainty in the spatial distribution of biospheric CH4 fluxes and provides greater flexibility for the inversion to adjust these sources in response to atmospheric observations.
2.3.4 Observational and error settings
In the G2L4 inversion, the observation-model mismatch error for each GOSAT-2 XCH4 retrieval is set to 20 ppb, corresponding to the square root of the diagonal elements of the observation-error covariance matrix, following the configuration used in Niwa et al. (2025). This value is comparable to the uncertainty estimated from validation against TCCON observations. For G2L2, comparisons with TCCON typically show standard deviations of approximately 10–20 ppb depending on site, surface type, and collocation criteria (Yoshida et al., 2023; NIES GOSAT-2 Project, 2025). The use of a uniform value provides a consistent weighting of observations across regions and facilitates direct assessment of the influence of satellite observations on the inversion results. Only G2L2 retrievals that pass all internal pre- and post-screening criteria are assimilated, and an additional selection is applied based on the quality criteria provided in the G2L2 product. Thus, all analyses use XCH4 data that satisfy both the retrieval-level filters and the product-level quality flags.
Prior flux uncertainties follow the sector-dependent settings of Niwa et al. (2025): anthropogenic emissions are assigned 50 % uncertainty, and biomass burning and natural emissions 100 %. For rice paddies, wetlands, and soil oxidation, prior covariances are derived from a 120-year ensemble using the VISIT terrestrial biosphere model, with spatial localization applied to suppress unrealistic long-range correlations.
2.3.5 Optimization framework
The optimization of surface CH4 fluxes follows the 4D-Var scheme implemented in NISMON-CH4 (Niwa et al., 2025). The inversion is solved using the Preconditioned Optimizing Utility for Large-dimensional analyses (POpULar) quasi-Newton method (Fujii, 2005; Niwa et al., 2017), which iteratively updates flux adjustments through forward and adjoint model integrations.
2.3.6 Model implementation details
The G2L4 system adopts the standard implementation of NISMON-CH4 described by Niwa et al. (2025). The inversion is conducted on the native NICAM icosahedral grid, while posterior fluxes are provided on a regular 1° latitude-longitude grid using the grid-conversion scheme described by Niwa et al. (2022).
To ensure consistency between simulated and retrieved atmospheric CH4 concentrations, the averaging kernels and a priori profiles distributed with the G2L2 product are applied in the observation operator. In addition, the penalty formulation following Niwa et al. (2022) is incorporated to suppress physically unrealistic negative flux estimates during the optimization.
Further methodological and numerical details, including covariance construction, adjoint implementation, grid conversion procedures, and penalty function settings, are documented in Niwa et al. (2025) and the G2L4 Algorithm Theoretical Basis Document (G2L4ATBD; Saito and Niwa, 2025).
2.4 Additional data
For comparison with the G2L2 product, we used the GOSAT TANSO-FTS SWIR Level 2 CH4 column-amount product (version V03.05; hereinafter G1L2). The V03 series provides XCO2 and XCH4 retrieved from GOSAT Level 1B spectra using the full-physics method (Someya et al., 2023). Version V03.05 corresponds to the bias-corrected product validated against TCCON measurements, and only data meeting the product quality criteria were used in this study.
This section presents the results of the G2L4 CH4 flux estimates, which constitute the primary objective of this study. To provide the necessary context for interpreting the inversion results, we first summarize key characteristics of the G2L2 XCH4 product and briefly compare it with the G1L2 product. The flux estimates are evaluated for the period from May 2019 to October 2022, using G2L2 version V02.10 covering March 2019 to December 2022.
3.1 Observation coverage and spatial distribution of G2L2 product
Following the launch of GOSAT-2 in October 2018 and completion of its initial calibration phase, the G2L2 product has been available since March 2019. Several short interruptions in TANSO-FTS-2 operations occurred during the period, with the full list provided by the EORC-JAXA archive.
Monthly variations in the number of quality-screened XCH4 observations are shown in Fig. 1. To ensure comparability between TANSO-FTS and TANSO-FTS-2, repeated soundings over the same location within short time intervals were counted only once per day. Such repeated soundings mainly arise from targeted observation operations, in which the same location may be observed multiple times to increase the likelihood of obtaining cloud-free retrievals. After this adjustment, TANSO-FTS-2 still yielded roughly 2–3 times more valid observations than TANSO-FTS over both land and ocean, reflecting improvements in sensor performance, pointing strategy, and observational coverage.

Figure 1Monthly count of XCH4 observations meeting the quality criteria for (a) TANSO-FTS and (b) TANSO-FTS-2 in March 2019 and December 2022. Blue and green bars represent observations over ocean and land, respectively.
Figure 2 shows the spatial distribution of G2L2 observations. TANSO-FTS-2 achieved substantially enhanced global coverage, particularly over the oceans, where nearly all 2.5° grid cells contain valid retrievals. Over land, the Intelligent Pointing system increased the sampling of cloud-free scenes relative to TANSO-FTS, although persistent cloudiness in the deep tropics remains a limiting factor. These improvements reduce spatial sampling gaps and provide a more uniform global dataset, forming a stronger observational basis for the CH4 flux estimation presented in later sections.

Figure 2Spatial distribution of XCH4 observations meeting the quality criteria, aggregated on a 2.5° grid, and their latitudinal totals for (a, b) TANSO-FTS and (c, d) TANSO-FTS-2 in March 2019 and December 2022. Blue and green lines in panels (b) and (d) indicate observations over ocean and land, respectively.
The retrieval counts shown here represent only successful observations included in the GOSAT and GOSAT-2 Level 2 products and therefore reflect the combined effects of orbital sampling, observing strategy, cloud screening, and retrieval performance.
3.2 Validation of G2L2 product
Uncertainties in GOSAT-2 XCH4 retrievals arise from surface reflectance, aerosol and cirrus properties, instrument characteristics, and limitations in the forward-model representation. Validation of the G2L2 retrievals has been reported previously. Yoshida et al. (2023) evaluated version V02.00 through comparisons with TCCON and the G1L2 product, while the NIES GOSAT-2 Project (2025) provides validation results for the version used in this study, V02.10.
According to the NIES GOSAT-2 Project (2025), validation of the G2L2 V02.10 product against TCCON shows small negative biases over both land and ocean, with larger biases over ocean sites. Typical mean differences fall within a few ppb for land and around −5 to −8 ppb for ocean, with standard deviations of approximately 10–15 ppb depending on the site and collocation criteria. These results indicate that G2L2 V02.10 generally underestimates XCH4 relative to TCCON, particularly over ocean scenes. No bias correction is applied in this study; therefore, the flux estimates presented below reflect the original characteristics and remaining retrieval biases of the G2L2 V02.10 product.
3.3 Comparison between G1L2 and G2L2 products
The comparison of G1L2 and G2L2 products is subject to inherent limitations. First, the observation locations of TANSO-FTS and TANSO-FTS-2 do not perfectly coincide, making a direct one-to-one comparisons challenging. Second, differences in their retrieval algorithms can produce systematic variations in retrieved XCH4 even when the measurements are taken at nearly the same time and location.
Figure 3 presents two-dimensional histograms comparing XCH4 retrieved from TANSO-FTS (x-axis) and TANSO-FTS-2 (y-axis). Matchups were selected when the fields of view were within 20 km and the observation times were within 30 min. Repeated soundings at the same location within consecutive time intervals were averaged, and only the closest matchup pair was retained.

Figure 3Two-dimensional histograms of XCH4 concentrations (ppb) retrieved from TANSO-FTS and TANSO-FTS-2 for (a) land and (b) ocean, based on matchup data only.
Over land, the mean difference (G2L2–G1L2) is −2.66 ppb with a standard deviation of 11.53 ppb (N=12 799), whereas over ocean the mean difference is −6.84 ppb with a standard deviation of 10.74 ppb (N=3614). Correlation coefficients exceed 0.93 for both surface types, indicating that the two products show high consistency in XCH4 variability. Combined with the TCCON validation results in Sect. 3.2, these comparisons confirm that G2L2 XCH4 is generally slightly lower than G1L2 and TCCON, with the negative bias being more pronounced over the ocean.
Figure 4 shows the spatial distributions of G1L2 and G2L2 XCH4 on a 2.5° grid, averaged over four consecutive three-month periods from December 2021 to November 2022. G2L2 provides significantly improved coverage, particularly over oceans, high latitudes, and tropical regions where cloud contamination often limits the number of valid GOSAT retrievals. A notable exception is the central-eastern region of South America, where the spatial coverage of G2L2 is degraded. Although the cause has not yet been fully identified, reduced radiance levels in Band 1 have been observed in this region, and a possible influence of the South Atlantic Anomaly has been suggested.

Figure 4Three-month averaged XCH4 distributions for G1L2 (left) and G2L2 (center) from December 2021 to November 2022, and their differences (G2L2–G1L2) (right). Color scales represent XCH4 concentrations (ppb) for G1L2 and G2L2, and differences in ppb for the bottom panels. The rightmost panels additionally show latitudinal mean differences (ppb), with blue and green lines indicating ocean and land regions, respectively.
The seasonal distributions are broadly consistent between G1L2 and G2L2, showing higher XCH4 values during boreal fall and lower values from spring to early summer, which is likely influenced by the seasonality of Northern Hemisphere wetland emissions (East et al., 2024). Regions of enhanced XCH4 include South and East Asia, the Arabian Peninsula, central Africa, and parts of the Americas, and these patterns are largely reproduced across both products.
Mean spatial differences (G2L2–G1L2) averaged over three-month periods range from −2.6 to −5.4 ppb over land and from −5.2 to −10.8 ppb over ocean, with standard deviations of 12–14 ppb across both surface types. A systematic latitudinal pattern is also evident: negative differences are larger in low-latitude regions and diminish toward higher latitudes, implying a reduced north-south contrast within each hemisphere in G2L2 relative to G1L2. To investigate the influence of bias correction, the same analysis was repeated using G1L2 without bias correction (V03.00). In this case, the latitudinal trend largely disappears, suggesting that the G1L2 bias-correction scheme is a major contributor. Therefore, part of the spatial differences between G1L2 and G2L2 may reflect differences in the bias-correction strategy rather than differences in the underlying satellite observations themselves. Accordingly, caution is required when interpreting the spatial differences between the two products. Because assessing this correction is beyond the scope of this study, no further analysis is conducted, but users should be aware that the presence or absence of bias correction can introduce substantial spatial differences in XCH4.
3.4 Regional and global CH4 flux estimates by G2L4 product
The global CH4 budget synthesized by the Global Carbon Project (GCP; Saunois et al., 2025) provides the most authoritative benchmark for evaluating top-down CH4 flux estimates. Against this benchmark, our satellite-only inversion using G2L2 retrievals reproduces the global budget with remarkable accuracy. The posterior global totals are 582.9 and 589.5 Tg CH4 yr−1 for 2020 and 2021, respectively. The 2020 estimate lies within the range reported by the Global Methane Budget top-down assessment (608 Tg CH4 yr−1, range 581–627 Tg CH4 yr−1; Saunois et al., 2025). This high level of agreement suggests that GOSAT-2 SWIR observations are capable of reproducing the global-scale CH4 budget, despite inherent retrieval uncertainties in satellite-based measurements (e.g., O'Dell et al., 2018). However, agreement at the global scale does not necessarily imply uniformly strong observational constraints at regional scales, where the influence of prior assumptions and observational coverage may vary substantially.
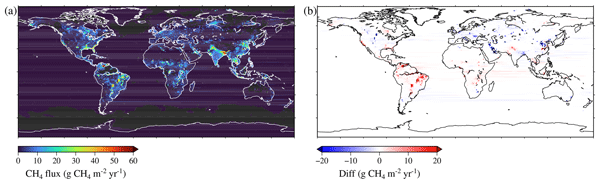
Figure 5a shows the spatial distribution of posterior CH4 fluxes for 2021. Large emissions appear across regions where elevated XCH4 was identified in Fig. 4, including South and East Asia, the Arabian Peninsula, central Africa, and the Americas. These hotspots reflect contributions from both natural wetlands and anthropogenic activities such as fossil-fuel extraction and waste management. The G2L4 flux distributions broadly align with established global CH4 source patterns.

Figure 5Spatial distribution of (a) annual posterior CH4 fluxes for 2021 and (b) posterior-minus-prior differences (g CH4 m−2 yr−1).
Figure 5b displays posterior-prior differences, highlighting regions where the G2L2 product induces substantial adjustments. Positive corrections occur mainly in tropical and subtropical regions – South Asia, central Africa, and northern to central South America – where prior estimates are typically uncertain and where ground-based observations are sparse. Negative adjustments, in contrast, appear over parts of China, the Persian Gulf region, Europe, and central North America. It is important to note that large posterior adjustments do not necessarily indicate strong observational constraints. Substantial corrections may arise either from (i) strong satellite constraints correcting prior biases, or (ii) weak observational constraints in regions with persistent cloud cover or limited viewing opportunities, where the inversion becomes more sensitive to residual retrieval biases or prior uncertainties. The degraded G2L2 coverage over central-eastern South America is one such example.
Overall, regions with large adjustments generally coincide with areas where prior uncertainties are large and observational coverage is limited, indicating where GOSAT-2 observations have the potential to provide valuable additional information beyond the prior estimates. These results emphasize both the value of G2L2 for improving flux estimates and the need for continued satellite observations to strengthen constraints in regions where current observational coverage remains limited.
Figure 6 presents monthly CH4 flux variations for six latitude bands between 70° N and 50° S for the period May 2019–October 2022. Prior fluxes show only weak seasonal variability across all latitude bands, whereas posterior fluxes exhibit pronounced seasonal cycles, particularly north of 10° N. In the high northern latitudes (70°–50° N), posterior fluxes increase from around 2 Tg CH4 month−1 during winter to more than 10 Tg CH4 month−1 in July–August, reflecting well-known wetland-driven seasonality. Similar enhancements in seasonal amplitude are found in the 50°–30° N band and in the tropics (10° N–10° S), where prior fluxes show only limited variability.

Figure 6Monthly CH4 flux variations (Tg CH4 month−1) for six latitude bands between 70° N and 50° S, estimated from prior (broken line) and posterior (solid line) fluxes for May 2019–October 2022.
A notable feature in Fig. 6 is the clear phase shift in the 30° N–10° N latitude band, where the posterior flux peak moves from May–June in the prior to July–August. This change is consistent with independent studies showing that CH4 emissions from wetlands and rice paddies in South and East Asia tend to peak during the boreal summer monsoon (e.g., Zhang et al., 2020; East et al., 2024). Although satellite sampling in this region decreases during the monsoon season due to persistent cloud cover, the available G2L2 retrievals still exhibit enhanced XCH4 in July–August, suggesting that the inversion adjusts the seasonal phase to align more closely with observational signals and to compensate for known biases in the prior. At the same time, the limited sampling also implies that part of the adjustment may reflect prior uncertainties rather than strong observational constraints. The posterior phase shift therefore likely results from a combination of satellite-derived information and structural uncertainties in the prior representation of wetland and rice-paddy emissions.
Overall, posterior fluxes peak in tropical and subtropical regions (30° N–10° S), whereas prior fluxes show maximum emissions in the mid-latitude to tropical Northern Hemisphere. Averaged over 2020 and 2021, posterior fluxes increase by roughly 20–40 Tg CH4 yr−1 in the tropics and subtropics relative to the prior, while high-latitude Northern Hemisphere fluxes remain broadly similar. The stronger seasonality and spatial redistribution evident in the posterior estimates suggest that GOSAT-2 observations contribute useful information for adjusting flux patterns in regions where prior constraints are relatively weak, particularly in tropical regions dominated by wetlands and agricultural activity.
4.1 Comparison with CH4 flux estimates derived from other observations
To evaluate the impact of the G2L2 product, we compared CH4 flux estimates derived from inversions using the same model system as G2L4 but based on different observational datasets. Two datasets were employed: (1) fluxes estimated using only the G1L2 V03.05 satellite product, as in the Results section, and (2) fluxes from Niwa et al. (2025), which were derived from ground-based and aircraft (SURF+AIR) observations. The ground-based data include ObsPack GLOBALVIEWplus version 6.0 (Schuldt et al., 2023) and measurements from NIES and collaborative networks (Tohjima et al., 2002, 2014; Sasakawa et al., 2010, 2017; Terao et al., 2011; Nara et al., 2017; Nomura et al., 2017, 2021; Okamoto et al., 2018; Umezawa et al., 2025). Aircraft data consist of flask samples collected through the CONTRAIL program (Machida et al., 2008; Matsueda et al., 2015; Sawa et al., 2015; Umezawa et al., 2012) and Tohoku University campaigns (Umezawa et al., 2014). Although Niwa et al. (2025) used the same inversion framework as this study, the prior biomass burning emissions differ between the two approaches. The Niwa et al. (2025) dataset provides a benchmark based on dense in situ measurements, offering a complementary perspective to satellite-driven inversions and enabling assessment of consistency and potential biases in regional and seasonal CH4 flux estimates.
We first compared the global annual CH4 budgets among the three inversions. The G1L2-based inversion yielded 594.3 and 599.2 Tg CH4 yr−1, and SURF+AIR-based inversion produced 593.2 and 595.4 Tg CH4 yr−1 for 2020 and 2021, respectively. Differences across datasets remain within ∼10 Tg CH4 yr−1, indicating that the choice of observational constraint does not materially change the global CH4 budget in this inversion framework. This cross-dataset convergence provides confidence that the regional analyses below primarily reflect the characteristics of the observational constraints rather than structural instabilities of the inversion system itself.
Seasonal patterns of CH4 fluxes are broadly consistent across the three inversions (Fig. A2), as noted in previous studies (e.g., Saunois et al., 2020; Niwa et al., 2025). Comparisons between G2L4 and G1L2-based inversions show small mean differences across latitude bands (−0.12 to 0.58 Tg CH4 month−1) and high correlations (r= 0.83–0.99), indicating similar seasonal cycles. Variance ratios (posterior-to-reference standard deviations; values >1 indicate stronger seasonal amplitude) range from 1.05 to 1.99 – largest in 10° N–10° S – reflecting the combined influence of (i) differences in retrieval algorithms and product post-processing (including G1L2 bias-correction), (ii) differences in sampling and viewing geometry between missions (targeting strategies, off-nadir angles, cloud screening), and (iii) mission-dependent L1B radiance characteristics. In contrast, differences relative to the SURF+AIR-based inversion are more pronounced: the mean difference reaches −2.03 Tg CH4 month−1 in the tropics, root-mean-square difference exceeds 2.38 Tg CH4 month−1, and variance ratios rise to 4.36, indicating changes in both amplitude and phase. Correlations drop south of 10° S (r= 0.55–0.31), consistent with sparse in-situ coverage there.
Next, we extend our analysis to the regional scale using the 42 land regions defined in the GOSAT Level 4 product (Fig. A3). This framework enables a systematic comparison of CH4 flux estimates derived from different observational datasets and helps identify where observational constraints most strongly affect inversion outcomes. At the regional scale (Fig. 7), the three inversions show broadly consistent spatial patterns, with all methods identifying similar high-emission regions and capturing the major continental-scale features of the CH4 budget. This overall agreement indicates that G2L4, G1L2-based, and SURF+AIR-based inversions share a common large-scale structure and that the differences among them reflect regional observational characteristics rather than fundamental inconsistencies. Within this general consistency, regional differences become apparent. For example, in Southern Central Asia (CAS, RGN 30), the annual mean flux from G2L4 (50.5 Tg CH4 yr−1) is ∼20 % lower than the SURF+AIR-based estimate (60.2 Tg CH4 yr−1). Similar gaps (4–11 Tg CH4 yr−1) appear in Northeastern Siberia (SIB-NE, RGN 28) and the Arabian Peninsula-Western Middle East (WME, RGN 29). While these differences broadly correspond to sparse in-situ observational coverage, we cannot rule out contributions from region-dependent retrieval challenges-such as high aerosol loading, low surface albedo, or large solar zenith angles-that may influence satellite column retrievals. Thus, both observational distribution and potential retrieval systematics likely contribute to the regional spread.

Figure 7Mean annual CH4 fluxes (Tg CH4 yr−1) for 2020 and 2021 across 42 land regions, estimated from prior (purple), G2L4 (orange), G1L2-based inversions (green), and ground-based inversions (blue). The geographical definitions and abbreviations of the regions are provided in Fig. A3.
Beyond differences in regional observational coverage, mission-specific observation strategies and retrieval characteristics also contribute to divergences among inversions. Both the GOSAT and GOSAT-2 missions allocate a considerable fraction of their observations to developed regions in order to target large emission sources such as megacities and power plants (Kuze et al., 2020). While this targeting strategy enhances the ability to capture urban greenhouse-gas enhancements (Ohyama et al., 2024), it can introduce a sampling bias toward high-concentration areas and may reduce the representativeness of regional fluxes. In addition, the two missions do not necessarily observe identical footprints, leading to differences in spatial sampling even within the same region. The case of Eastern Asia (RGN 32) illustrates this complexity. Although multiple TCCON sites are available in the region (Ohyama et al., 2020) and are used in the bias correction of G1L2, its flux estimates still differ substantially from those derived from the SURF+AIR-based inversion. This divergence arises despite both inversions being strongly constrained by extensive observational data. The differences likely reflect the fundamentally distinct nature of the observational datasets-satellite column retrievals versus in-situ and aircraft measurements-as well as differences in coverage, bias-correction approaches, data-selection criteria, and the spatial representativeness of observation sites. These factors can lead to meaningful discrepancies in regional flux estimates even when the overall inversion frameworks are robust. Rather than indicating inconsistencies among the inversions, these results underscore the importance of considering observation-system characteristics when interpreting regional CH4 budgets. They also highlight the need for a balanced combination of satellite, ground, and aircraft observations to improve representativeness and reduce structural uncertainties in future CH4 monitoring systems.
Figure 8 also highlights where the three inversion systems show noticeable differences in their regional estimates. While G1L2-based inversions generally show amplitudes and correlations closer to those of G2L4, the SURF+AIR-based inversions display larger differences in regions where observational coverage is limited or where surface networks do not sufficiently capture the dominant emission regimes. This pattern is consistent with previous studies reporting that the performance of ground-based-driven inversions is strongly dependent on the spatial density and placement of in-situ sites (e.g., Stavert et al., 2022; Deng et al., 2025). Our results reflect this behavior across several regions, including Pampas (PAM, RGN 14), Central South America (SAM-, RGN 15), Northwestern Northern Africa (AFR-NNW, RGN 19), Maritime Southeast Asia (SEA-MAR, RGN 33), and Southeastern Australia (AUS-SE, RGN 36), where correlations with G2L4 are comparatively low. Amplitude differences also emerge in high-latitude regions such as Southwestern Siberia (SIB-SW, RGN 25) and Northeastern Siberia (SIB-NE, RGN 28), as well as in well-monitored areas like the Nordic Region (NOR, RGN 41) and mid-latitude North America (NAM-SW and NAM-NE; RGNs 5 and 8). These discrepancies do not undermine the overall consistency among the inversions; rather, they show how regional flux estimates respond differently to the distinct observational constraints available in each system. These regions illustrate where satellite observations offer broader spatial sampling that complements limited in-situ coverage. Looking ahead, integrating GOSAT-2 with complementary satellite missions-together with targeted in-situ deployments where feasible-will help reduce regional uncertainty and support the development of a more balanced, globally consistent CH4-monitoring framework.

Figure 8Correlation coefficients versus ratio of standard deviations for seasonal CH4 flux variations across 42 land regions. Ratios are computed as the standard deviation of G1L2-based or ground-based (SURF+AIR) inversion divided by that of G2L4, and correlations are calculated between G2L4 and each of other two inversions.
4.2 Insights into anthropogenic-dominated regions from satellite observations
Recent studies have demonstrated the capability of satellite observations to quantify national-scale CH4 emissions using atmospheric inversion frameworks and to compare these estimates with national inventories (e.g., Shen et al., 2023; Janardanan et al., 2024; Deng et al., 2025). Inversion-based estimates, however, are generally sensitive to the total atmospheric CH4 field, which integrates contributions from multiple source sectors, CH4 sinks, and atmospheric transport processes. This property is not unique to satellite measurements; it is inherent to all top-down inversion systems. As a result, satellite-based inversions primarily optimize the net surface flux and cannot directly isolate sector-specific emissions. To gain insight into sectoral contributions despite this limitation, previous studies have adopted an indirect approach: in regions where the net prior flux is strongly dominated by a limited number of anthropogenic sectors, the direction and magnitude of posterior adjustments can help infer whether emissions from those dominant sectors are likely over- or underestimated. While this approach does not fully resolve sector-specific budgets, it can provide useful qualitative information on sectoral patterns. Building on this concept, we assess whether the G2L4 product offers meaningful constraints on sector-dominated regions. We focus on regions where aggregated anthropogenic emissions account for more than 80 % of prior total net surface flux, allowing us to examine whether posterior adjustments inferred from satellite observations align with expected sectoral contributions. Here, anthropogenic emissions refer to the sum of coal mining, oil and gas, landfill and waste, biofuel, enteric fermentation, manure management, and rice paddy fluxes.
Figure 9 illustrates that the G2L4 product provides useful observational information for anthropogenic-dominated regions, offering new insight into regional CH4 flux patterns. In East Asia (EAS), where anthropogenic emissions constitute the majority of the prior total flux, the G2L4 posterior suggests a reduction of 12.3 Tg CH4 yr−1 relative to the prior. Although this posterior estimate (34.4 Tg CH4 yr−1) is lower than values reported in previous satellite-based studies such as Chen et al. (2022) and Deng et al. (2025), those studies also emphasize that East Asia exhibits large variability across inversion systems due to differences in observational datasets, retrieval configurations, and bias correction methods. The spread among inversion estimates therefore likely reflects this region's well-known sensitivity to differences in observational data sources, rather than any inconsistency among the inversion systems themselves. In this context, the G2L4 result contributes an independent satellite-based constraint that is useful for assessing the plausible range of anthropogenic emissions in East Asia.

Figure 9Anthropogenic CH4 emissions (Tg CH4 yr−1) for nine regions – NAM-SW, AFR-NNW, AFR-NNE, WME, CAS, CAN, EAS, SEA-MAIN, and EUR-C – where anthropogenic sources in the a priori estimates account for more than 80 % of prior fluxes. Bars show prior (blue) and posterior (orange) estimates derived from GOSAT-2 Level 4 product for 2020–2021.
In the Western Middle East (WME), where emissions are dominated by oil and gas production, the G2L4 posterior (18.2 Tg CH4 yr−1) falls within the range of previous estimates, including the Persian Gulf fossil emissions inferred by Deng et al. (2025). This consistency-combined with the region's frequent clear-sky conditions, which enable dense satellite sampling-demonstrates that GOSAT-2 observations provide useful observational information for fossil-fuel-dominated regions. At the same time, the strong influence of dust aerosols on SWIR retrievals (e.g., Yoshida et al., 2011) highlights the importance of continued refinement of aerosol correction methods to fully leverage the strengths of satellite data. Overall, the G2L4 results in EAS and WME illustrate how satellite-based inversions can provide valuable and region-specific insight into sectoral emissions, while also identifying observational and algorithmic factors that should be prioritized to further enhance the robustness of future CH4 flux assessments.
Beyond East Asia and the Western Middle East, several other regions-such as Northern Africa and Central Asia-show only modest differences between prior and posterior estimates. Importantly, small posterior adjustments in these regions should not be interpreted as evidence that prior inventories are highly accurate. Rather, these areas are characterized by sparse ground-based observations and limited socioeconomic activity data, making the underlying inventories inherently uncertain (e.g., Ehret et al., 2022; Tibrewal et al., 2024). In such contexts, even small satellite-driven adjustments provide independent and valuable constraints that would otherwise be difficult to obtain. These regions also underscore a broader challenge: observational gaps persist in many parts of the world where establishing and maintaining surface networks is logistically difficult and financially costly (e.g., Velazco et al., 2017; Morino et al., 2018). Satellite observations offer spatial coverage that complements limited in-situ measurements and helps identify where additional observations would most improve regional constraints. Looking ahead, expanding the use of multi-satellite datasets-along with targeted deployments of ground-based sensors where feasible-offers a promising pathway for improving the sectoral attribution of CH4 emissions in regions that have historically been under-constrained.
4.3 Limitations and interpretation of the G2L4 product
The G2L4 product provides monthly global CH4 flux estimates derived from a satellite-only atmospheric inversion system. While the results presented in this study suggests that GOSAT-2 observations can improve the spatial and temporal distribution of CH4 flux estimates, several limitations should be considered when interpreting the data product.
First, the current G2L4 release does not include formal posterior uncertainty estimates, posterior covariance matrices, inversion averaging kernels, or degrees-of-freedom-for-signal (DFS) diagnostics (Rodgers, 2000). The inversion is performed using a global high-dimensional 4D-Var framework based on NISMON-CH4 (Niwa et al., 2017, 2025), and explicit estimation of posterior covariance matrices would require additional covariance calculations or large ensemble-based experiments that are not included in the operational G2L4 processing system. Consequently, quantitative estimates of uncertainty reduction and observation impact are not presently provided as part of the G2L4 product.
Second, it is important to distinguish between retrieval-level and inversion-level diagnostics. Averaging kernels and a priori profiles distributed with the G2L2 product are incorporated into the observation operator in order to account for retrieval smoothing effects and to ensure consistency between modeled and retrieved XCH4 (Rodgers, 2000). However, these retrieval averaging kernels should not be interpreted as inversion averaging kernels, nor do they provide information on posterior uncertainty reduction within the flux inversion framework.
Therefore, posterior-minus-prior flux differences presented in this study should primarily be interpreted as inversion adjustments rather than direct quantitative measures of observational constraint or uncertainty reduction. Interpretation of regional flux estimates should also take into account variations in observational coverage, prior uncertainty, retrieval characteristics, and the prescribed inversion error statistics.
Despite these limitations, comparisons with independent inversion systems indicate that the G2L4 product reproduces the large-scale characteristics of the global CH4 budget and provides useful observational information in many regions where conventional surface observations remain sparse. Future developments of the G2L4 framework will investigate practical approaches for characterizing posterior uncertainty and information content while maintaining computational feasibility for global high-resolution inversions.
The NIES GOSAT-2 products, including the FTS-2 SWIR Level 2 Column-averaged Dry-air Mole Fraction Product and the Level 4A Global CH4 Flux Product, are available from the NIES GOSAT-2 Product Archive (https://prdct.gosat-2.nies.go.jp/index.html.en, NIES GOSAT-2 Project, 2026).
A detailed description of the variables, units, dimensions, missing-value conventions, and products included in the G2L4 dataset is provided in Appendix (Tables A1–A3).
The NIES FTS SWIR Level 2 Column-averaged Dry-air Mole Fraction Product from GOSAT is available from the GOSAT Data Archive Service (https://data2.gosat.nies.go.jp/index_en.html, NIES GOSAT Project, 2026).
EORC-JAXA Current Status: GOSAT-2 Operation Status is available at https://www.eorc.jaxa.jp/GOSAT/GOSAT-2/gosat2_operationStatus.html (EORC-JAXA, 2026).
As the official GOSAT and GOSAT-2 archives do not assign persistent digital object identifiers (DOIs), the analysis-ready subsets of the data used in this study have been independently archived in a public research data repository. These subsets are openly available through Zenodo at https://doi.org/10.5281/zenodo.18883060 (Saito, 2026).
This secondary archiving ensures long-term accessibility, reproducibility, and citability of the exact datasets used to generate the results presented in this study.
This study provides an overview of the GOSAT-2 mission and evaluates its XCH4 data product, retrieved using absorption bands in the SWIR region, as well as Level 4 CH4 flux estimates. Now that GOSAT-2 has been operating for more than seven years, the accumulated data volume enables a series of updates and improvements that were not previously possible.
The TANSO-FTS-2 instrument aboard GOSAT-2 incorporates several enhancements, including improved signal-to-noise ratio (SNR) and the Intelligent Pointing function. These improvements have led to a substantial increase in observational coverage and the volume of valid data acquisitions compared to the GOSAT mission. In particular, TANSO-FTS-2 has achieved significant progress in regions where observations were previously challenging, such as tropical areas and high-latitude zones. This expanded coverage and higher data density provide an improved observational basis for estimating national and regional CH4 emissions through atmospheric inversion frameworks.
Using the G2L2 product, we estimated global CH4 sources and sinks at a spatial resolution of 1.0° and a monthly time step. The global CH4 budget derived from the posterior estimates is broadly consistent with annual budgets reported by the Global Carbon Project, confirming the reliability of the inversion framework. Compared to the prior estimates, the largest adjustments occur in regions with sparse ground-based coverage: positive corrections in tropical and subtropical areas and negative adjustments in parts of East Asia, the Middle East, and mid-latitude industrial regions. Posterior fluxes also exhibit pronounced seasonal cycles, particularly north of 10° S, reflecting improved representation of surface processes. These results highlight the capability of GOSAT-2 to refine global and regional CH4 budgets.
To evaluate the G2L4 product, we compared posterior flux estimates with inversion results generated using the same model framework but constrained by different observational datasets: G1L2 product and a combination of ground-based and aircraft measurements. At the global and latitudinal scales, these comparisons show broad consistency, indicating that the accuracy of the G2L2 product is well supported. Regional assessments reveal that most areas exhibit good agreement among inversions, although some regions display noticeable differences in annual budgets depending on the observational constraints applied. In addition, we conducted a preliminary evaluation of anthropogenic CH4 emissions at the regional scale. While this analysis demonstrates the potential of G2L2 for sectoral assessments, it also highlights regions where further investigation and methodological refinement are required.
The differences identified among inversion systems in this study indicate several directions for future improvement that directly follow from our regional analyses. First, the large spread observed in East Asia-where posterior estimates are particularly sensitive to the choice of satellite product and bias-correction approach-highlights the need for greater consistency among retrieval algorithms and for systematic cross-validation using independent datasets. Second, the strong agreement across inversions in the Western Middle East suggests that satellite observations can provide useful observational information for fossil-fuel-dominated regions when clear-sky conditions allow dense sampling, while also emphasizing the importance of refining aerosol-related radiance corrections to maximize the utility of SWIR measurements. Third, regions such as Northern Africa, Southeast Asia, and parts of South America, where inventories remain poorly constrained due to sparse ground-based observations, benefit substantially from the spatial coverage of satellite data. Coordinated use of multiple satellite missions, together with targeted in-situ deployments where feasible, would help reduce structural uncertainty in these under-observed areas. Overall, the results presented here highlight the value of GOSAT-2 observations for improving regional and sector-dominated CH4 flux estimates and identify key areas where methodological harmonization and expanded observational coverage would further enhance confidence in future CH4 assessments and satellite mission planning.
To facilitate reuse of the G2L4 dataset, this appendix summarizes the principal variables included in the product, the associated data conventions, and information that is not currently provided in the operational release.
Table A1Principal variables included in the GOSAT-2 Level 4 CH4 flux product.
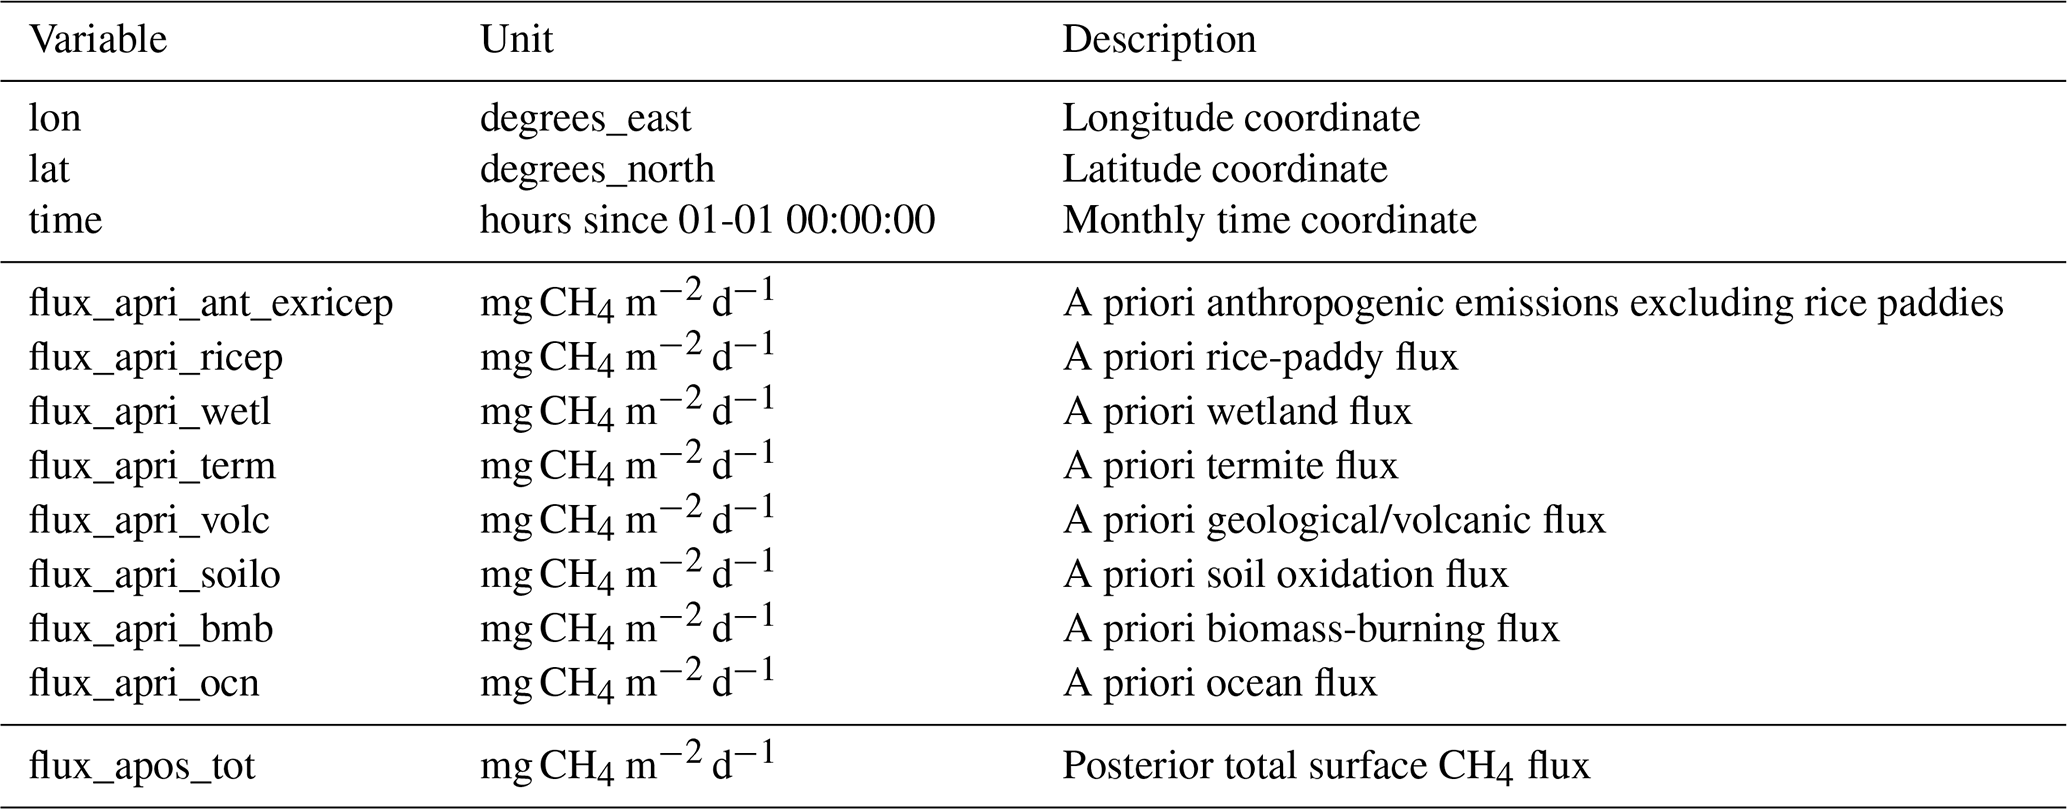


Figure A1Global map of GOSAT-2 orbital path.
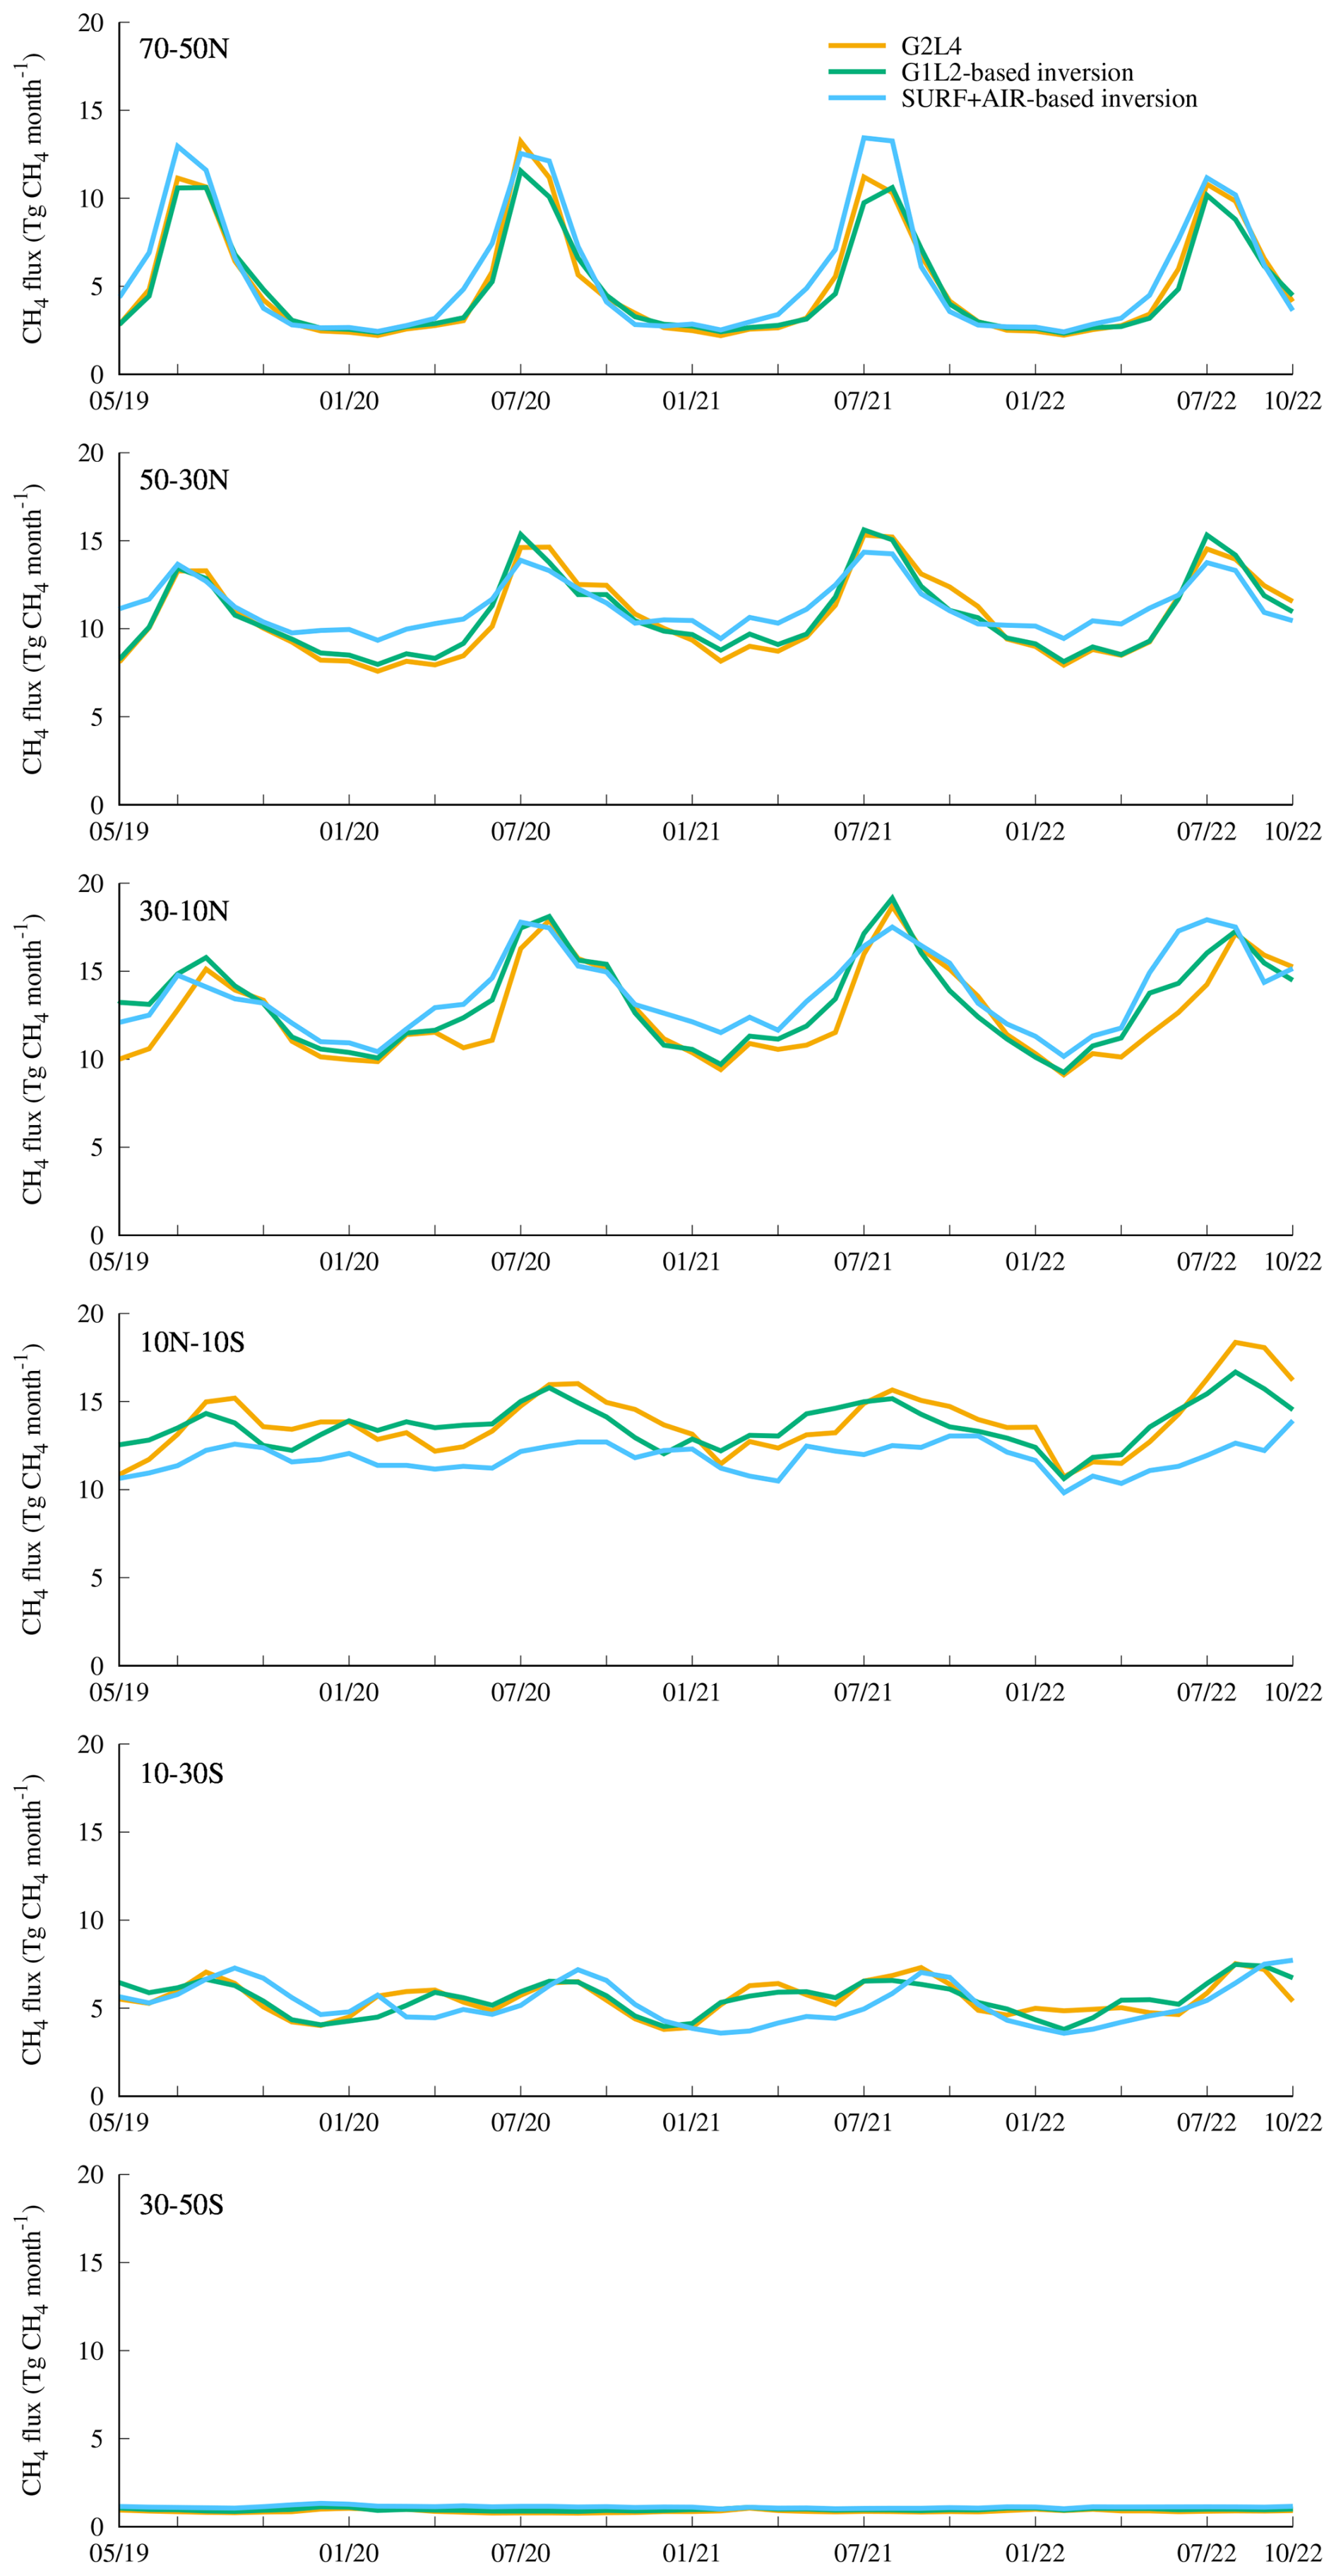
Figure A2Same as Fig. 6, but showing monthly CH4 flux variations (Tg CH4 month−1) estimated from G2L4 (orange), G1L2-based inversions (green), and ground-based inversions (blue).
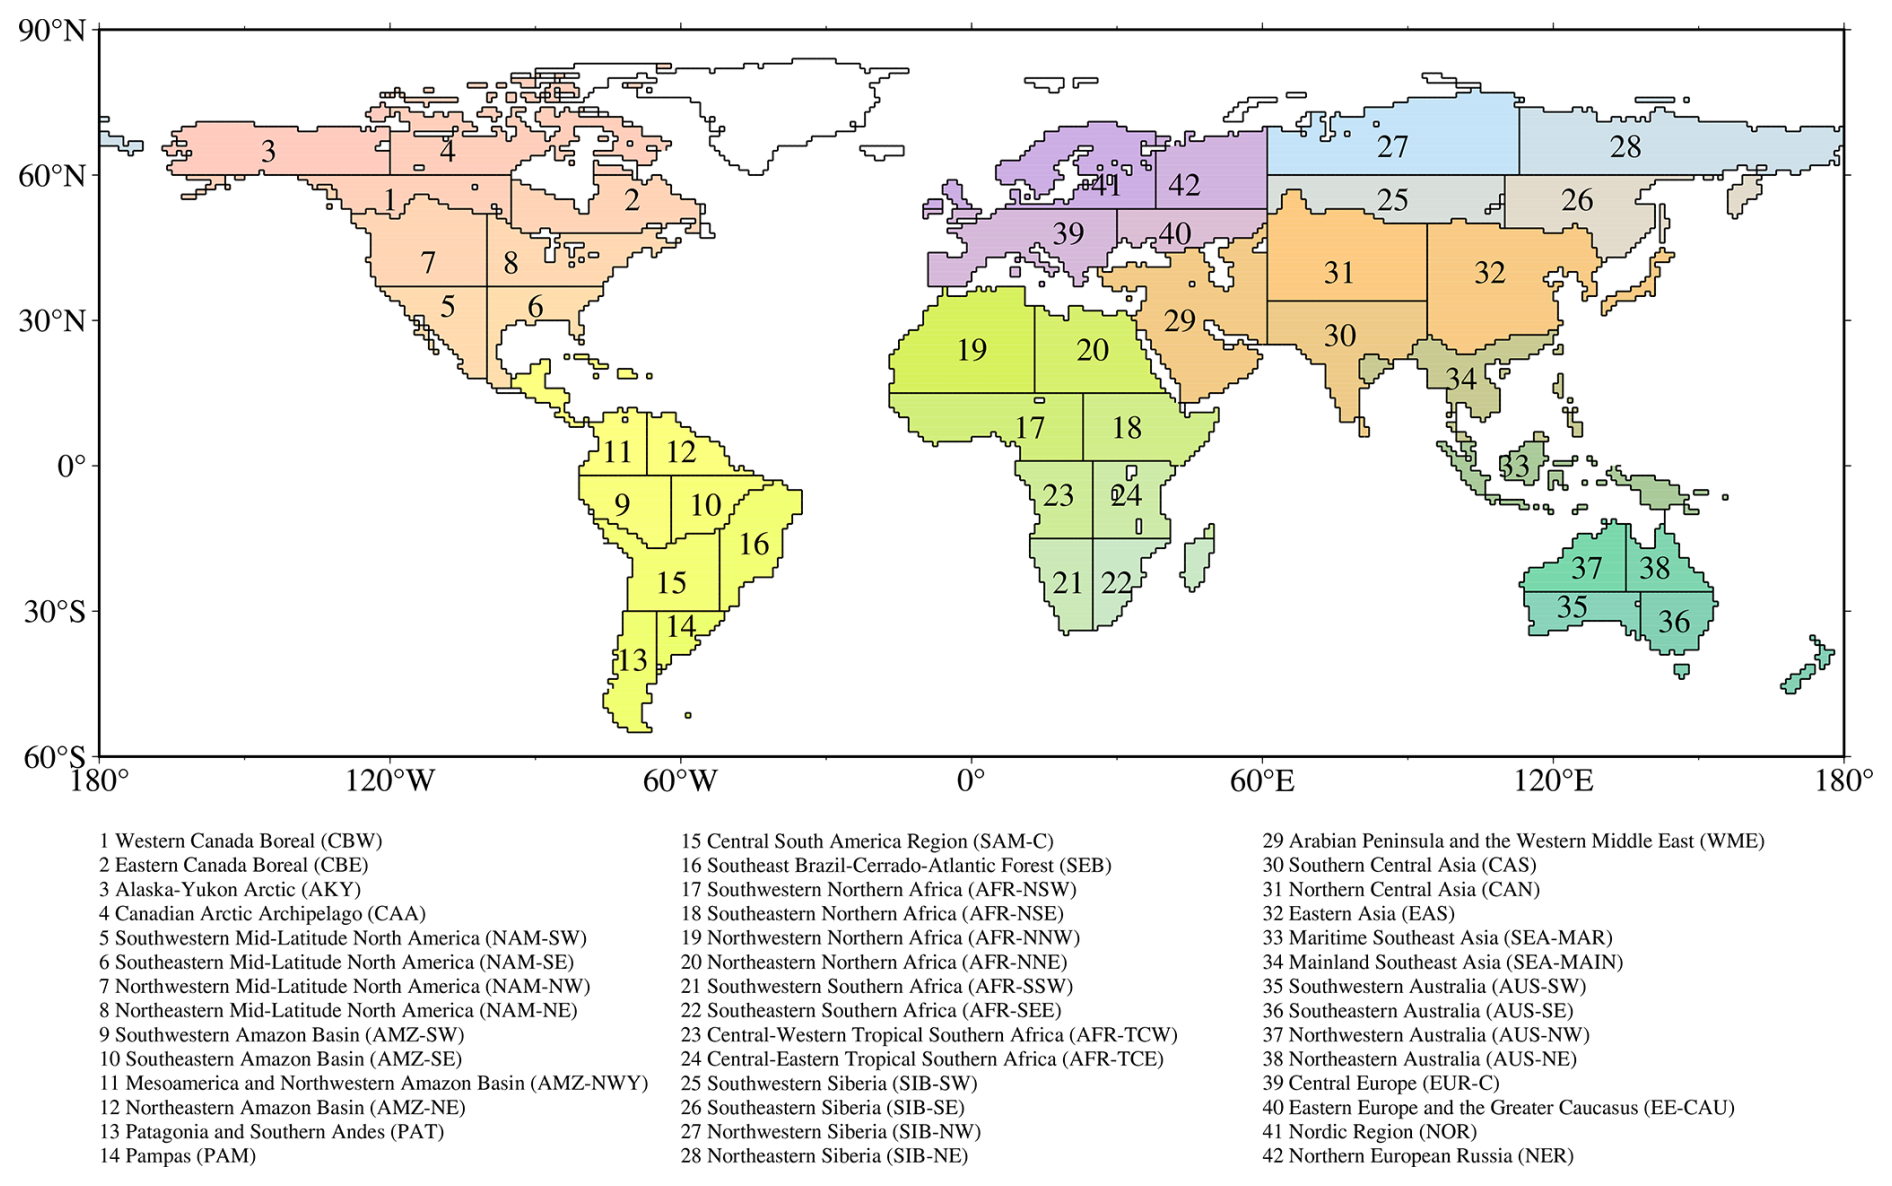
Figure A3Global land regions used in this study. The land surface is subdivided into 42 spatial units based on geographic location and broad climatic-biogeographic characteristics, following the regional classification adopted in the GOSAT Level 4 product.
MS conceptualized the study and performed the formal analysis. TM acquired funding. YN provided the model system. YY developed the G2L2 retrieval algorithm. Satellite operations and data acquisition were supported by HS, KS, and FK. The GOSAT-2 mission activities at NIES were supported by MS, YY, AK, IM, HN, HO, TS, YS, HY, and TM. MS wrote the initial draft of the manuscript. All authors contributed to reviewing and editing the final version of the manuscript.
The contact author has declared that none of the authors has any competing interests.
Publisher's note: Copernicus Publications remains neutral with regard to jurisdictional claims made in the text, published maps, institutional affiliations, or any other geographical representation in this paper. The authors bear the ultimate responsibility for providing appropriate place names. Views expressed in the text are those of the authors and do not necessarily reflect the views of the publisher.
This research has been supported by the GOSAT-2 project of NIES. The model simulations were completed using the NIES supercomputer.
This paper was edited by Bastiaan van Diedenhoven and reviewed by two anonymous referees.
Canadell, J. G., Monteiro, P. M., Costa, M. H., Da Cunha, L. C., Cox, P. M., Eliseev, A. V., Henson, S., Ishii, M., Jaccard, S., Koven, C., Lohila, A., Patra, P. K., Piao, S., Rogeli, J., Syampungani, S., Zaehle, S., and Zickfeld, K.: Global carbon and other biogeochemical cycles and feedbacks, IPCC AR6 WGI, final government distribution, 673–816, https://doi.org/10.1017/9781009157896.007, 2021. a
Cao, M., Marshall, S., and Gregson, K.: Global carbon exchange and methane emissions from natural wetlands: Application of a process-based model, J. Geophys. Res.-Atmos., 101, 14399–14414, 1996. a
Chen, A., Zhang, Z., Poulter, B., Feng, L., Liu, H., Murray, L. T., Yu, X., Huang, Z., Gaeta, D. C., Morgan, K. L., Zhu, Q., and Miller, S. M.: Spatial and temporal distribution of global wetland methane emissions during 2019–2020 estimated from satellite observations, J. Geophys. Res.-Atmos., 130, e2025JD044354, https://doi.org/10.1029/2025JD044354, 2025. a
Chen, Z., Jacob, D. J., Nesser, H., Sulprizio, M. P., Lorente, A., Varon, D. J., Lu, X., Shen, L., Qu, Z., Penn, E., and Yu, X.: Methane emissions from China: a high-resolution inversion of TROPOMI satellite observations, Atmos. Chem. Phys., 22, 10809–10826, https://doi.org/10.5194/acp-22-10809-2022, 2022. a, b
Crippa, M., Guizzardi, D., Solazzo, E., Muntean, M., Schaaf, E., Monforti-Ferrario, F., Banja, M., Olivier, J., Grassi, G., Rossi, S., and Vignati, E.: GHG emissions of all world – 2021 report, Publications Office of the European Union, https://doi.org/10.2760/173513, 2021. a
Deng, Z., Ciais, P., Hu, L., Martinez, A., Saunois, M., Thompson, R. L., Tibrewal, K., Peters, W., Byrne, B., Grassi, G., Palmer, P. I., Luijkx, I. T., Liu, Z., Liu, J., Fang, X., Wang, T., Tian, H., Tanaka, K., Bastos, A., Sitch, S., Poulter, B., Albergel, C., Tsuruta, A., Maksyutov, S., Janardanan, R., Niwa, Y., Zheng, B., Thanwerdas, J., Belikov, D., Segers, A., and Chevallier, F.: Global greenhouse gas reconciliation 2022, Earth Syst. Sci. Data, 17, 1121–1152, https://doi.org/10.5194/essd-17-1121-2025, 2025. a, b, c, d, e
East, J. D., Jacob, D. J., Balasus, N., Bloom, A. A., Bruhwiler, L., Chen, Z., Kaplan, J. O., Mickley, L. J., Mooring, T. A., Penn, E., Poulter, B., Sulprizio, M. P., Worden, J. R., Yantosca, R. M., and Zhang, Z.: Interpreting the seasonality of atmospheric methane, Geophys. Res. Lett., 51, e2024GL108494, https://doi.org/10.1029/2024GL108494, 2024. a, b
Ehret, T., De Truchis, A., Mazzolini, M., Morel, J.-M., D’aspremont, A., Lauvaux, T., Duren, R., Cusworth, D., and Facciolo, G.: Global tracking and quantification of oil and gas methane emissions from recurrent sentinel-2 imagery, Environ. Sci. Technol., 56, 10517–10529, 2022. a
EORC-JAXA: Current Status: GOSAT-2 Operation Status, https://www.eorc.jaxa.jp/GOSAT/GOSAT-2/gosat2_operationStatus.html (last access: 7 September 2026), 2026. a
Etiope, G., Ciotoli, G., Schwietzke, S., and Schoell, M.: Gridded maps of geological methane emissions and their isotopic signature, Earth Syst. Sci. Data, 11, 1–22, https://doi.org/10.5194/essd-11-1-2019, 2019. a
Ferrario, F. M., Crippa, M., Guizzardi, D., Muntean, M., Schaaf, E., Lo Vullo, E., Solazzo, E., Olivier, J., and Vignati, E.: EDGAR v6.0 Greenhouse Gas Emissions, European Commision, Joint Research Centre (JRC) [data set], http://data.europa.eu/89h/97a67d67-c62e-4826-b873-9d972c4f670b (last access: 13 July 2022), 2021. a
Frankenberg, C., Meirink, J. F., Bergamaschi, P., Goede, A. P. H., Heimann, M., Körner, S., Platt, U., van Weele, M., and Wagner, T.: Satellite chartography of atmospheric methane from SCIAMACHY on board ENVISAT: Analysis of the years 2003 and 2004, J. Geophys. Res.-Atmos., 111, https://doi.org/10.1029/2005JD006235, 2006. a
Fujii, Y.: Preconditioned optimizing utility for large-dimensional analyses (POpULar), J. Oceanogr., 61, 167–181, 2005. a
Imasu, R., Matsunaga, T., Nakajima, M., Yoshida, Y., Shiomi, K., Morino, I., Saitoh, N., Niwa, Y., Someya, Y., Oishi, Y., Hashimoto, M., Noda, H., Hikosaka, K., Uchino, O., Maksyutov, S., Takagi, H., Ishida, H., Nakajima, T. Y., Nakajima, T., and Shi, C.: Greenhouse gases Observing SATellite 2 (GOSAT-2): mission overview, Prog. Earth Planet. Sci., 10, 33, https://doi.org/10.1186/s40645-023-00562-2, 2023. a
Ito, A.: Global termite methane emissions have been affected by climate and land-use changes, Sci. Rep., 13, 17195, https://doi.org/10.1038/s41598-023-44529-1, 2023. a
Ito, A. and Inatomi, M.: Use of a process-based model for assessing the methane budgets of global terrestrial ecosystems and evaluation of uncertainty, Biogeosciences, 9, 759–773, https://doi.org/10.5194/bg-9-759-2012, 2012. a
Janardanan, R., Maksyutov, S., Wang, F., Nayagam, L., Sahu, S. K., Mangaraj, P., Saunois, M., Lan, X., and Matsunaga, T.: Country-level methane emissions and their sectoral trends during 2009–2020 estimated by high-resolution inversion of GOSAT and surface observations, Environ. Res. Lett., 19, 034007, https://doi.org/10.1088/1748-9326/ad2436, 2024. a
Kuze, A., O'Brien, D. M., Taylor, T. E., Day, J. O., O'Dell, C. W., Kataoka, F., Yoshida, M., Mitomi, Y., Bruegge, C. J., Pollock, H., Basilio, R., Helmlinger, M., Matsunaga, T., Kawakami, S., Shiomi, K., Urabe, T., and Suto, H.: Vicarious calibration of the GOSAT sensors using the Railroad Valley desert playa, IEEE T. Geosci. Remote, 49, 1781–1795, 2010. a
Kuze, A., Kikuchi, N., Kataoka, F., Suto, H., Shiomi, K., and Kondo, Y.: Detection of methane emission from a local source using GOSAT target observations, Remote Sens., 12, 267, https://doi.org/10.3390/rs12020267, 2020. a
Li, Q., Fernandez, R. P., Hossaini, R., Iglesias-Suarez, F., Cuevas, C. A., Apel, E. C., Kinnison, D. E., Lamarque, J.-F., and Saiz-Lopez, A.: Reactive halogens increase the global methane lifetime and radiative forcing in the 21st century, Nat. Comm., 13, 2768, https://doi.org/10.1038/s41467-022-30456-8, 2022. a
Lorente, A., Borsdorff, T., Butz, A., Hasekamp, O., aan de Brugh, J., Schneider, A., Wu, L., Hase, F., Kivi, R., Wunch, D., Pollard, D. F., Shiomi, K., Deutscher, N. M., Velazco, V. A., Roehl, C. M., Wennberg, P. O., Warneke, T., and Landgraf, J.: Methane retrieved from TROPOMI: improvement of the data product and validation of the first 2 years of measurements, Atmos. Meas. Tech., 14, 665–684, https://doi.org/10.5194/amt-14-665-2021, 2021. a
Machida, T., Matsueda, H., Sawa, Y., Nakagawa, Y., Hirotani, K., Kondo, N., Goto, K., Nakazawa, T., Ishikawa, K., and Ogawa, T.: Worldwide measurements of atmospheric CO2 and other trace gas species using commercial airlines, J. Atmos. Ocean. Tech., 25, 1744–1754, 2008. a
Maksyutov, S., Takagi, H., Valsala, V. K., Saito, M., Oda, T., Saeki, T., Belikov, D. A., Saito, R., Ito, A., Yoshida, Y., Morino, I., Uchino, O., Andres, R. J., and Yokota, T.: Regional CO2 flux estimates for 2009–2010 based on GOSAT and ground-based CO2 observations, Atmos. Chem. Phys., 13, 9351–9373, https://doi.org/10.5194/acp-13-9351-2013, 2013. a
Matsueda, H., Machida, T., Sawa, Y., and Niwa, Y.: Long-term change of CO2 latitudinal distribution in the upper troposphere, Geophys. Res. Lett., 42, 2508–2514, https://doi.org/10.1002/2014GL062768, 2015. a
Morino, I., Velazco, V. A., Hori, A., Uchino, O., Ohyama, H., Sakai, T., Izumi, T., Nagai, T., Bagtasa, G., Yoshida, Y., Kiel, M., Bukosa, B., Deutscher, N. M., Fisher, J. A., and Griffith, D. W. T.: Philippines TCCON Project: One-year Measurement Results and Future, in: Light, Energy and the Environment 2018 (E2, FTS, HISE, SOLAR, SSL), p. FW5A.3, Optica Publishing Group, https://doi.org/10.1364/FTS.2018.FW5A.3, 2018. a
Nara, H., Tanimoto, H., Tohjima, Y., Mukai, H., Nojiri, Y., and Machida, T.: Emission factors of CO2, CO and CH4 from Sumatran peatland fires in 2013 based on shipboard measurements, Tellus B, 69, 1399047, https://doi.org/10.1080/16000889.2017.1399047, 2017. a
NIES GOSAT Project: GOSAT Data Archive Service (GDAS), https://data2.gosat.nies.go.jp/index_en.html (last access: 7 September 2026), 2026. a
NIES GOSAT-2 Project: Summary of the validation on GOSAT-2 TANSO-FTS-2 SWIR L2 Column-averaged Dry-air Mole Fraction Product (Ver. 02.10), https://prdct.gosat-2.nies.go.jp/documents/pdf/ValidationResult_FTS-2_L2_SWPR_ver0210_en_00.pdf (last access: 7 September 2026), 2025. a, b, c
NIES GOSAT-2 Project: GOSAT-2 Product Archive, https://prdct.gosat-2.nies.go.jp/index.html.en (last access: 7 September 2026), 2026. a
Nisbet, E. G., Manning, M. R., Dlugokencky, E. J., Fisher, R. E., Lowry, D., Michel, S. E., Myhre, C. L., Platt, S. M., Allen, G., Bousquet, P., Brownlow, R., Cain, M., France, J. L., Hermansen, O., Hossaini, R., Jones, A. E., Levin, I., Manning, A. C., Myhre, G., Pyle, J. A., Vaughn, B. H., Warwick, N. J., and White, J. W. C.: Very strong atmospheric methane growth in the 4 years 2014–2017: Implications for the Paris Agreement, Global Biogeochem. Cy., 33, 318–342, 2019. a, b
Niwa, Y., Fujii, Y., Sawa, Y., Iida, Y., Ito, A., Satoh, M., Imasu, R., Tsuboi, K., Matsueda, H., and Saigusa, N.: A 4D-Var inversion system based on the icosahedral grid model (NICAM-TM 4D-Var v1.0) – Part 2: Optimization scheme and identical twin experiment of atmospheric CO2 inversion, Geosci. Model Dev., 10, 2201–2219, https://doi.org/10.5194/gmd-10-2201-2017, 2017. a, b
Niwa, Y., Ishijima, K., Ito, A., and Iida, Y.: Toward a long-term atmospheric CO2 inversion for elucidating natural carbon fluxes: technical notes of NISMON-CO2 v2021.1, Prog. Earth Planet. Sci., 9, 42, https://doi.org/10.1186/s40645-022-00502-6, 2022. a, b
Niwa, Y., Tohjima, Y., Terao, Y., Saeki, T., Ito, A., Umezawa, T., Yamada, K., Sasakawa, M., Machida, T., Nakaoka, S.-I., Nara, H., Tanimoto, H., Mukai, H., Yoshida, Y., Morimoto, S., Takatsuji, S., Tsuboi, K., Sawa, Y., Matsueda, H., Ishijima, K., Fujita, R., Goto, D., Lan, X., Schuldt, K., Heliasz, M., Biermann, T., Chmura, L., Necki, J., Xueref-Remy, I., and Sferlazzo, D.: Multi-observational estimation of regional and sectoral emission contributions to the persistent high growth rate of atmospheric CH4 for 2020–2022, Atmos. Chem. Phys., 25, 6757–6785, https://doi.org/10.5194/acp-25-6757-2025, 2025. a, b, c, d, e, f, g, h, i, j, k, l, m, n, o, p
Nomura, S., Mukai, H., Terao, Y., Machida, T., and Nojiri, Y.: Six years of atmospheric CO2 observations at Mt. Fuji recorded with a battery-powered measurement system, Atmos. Meas. Tech., 10, 667–680, https://doi.org/10.5194/amt-10-667-2017, 2017. a
Nomura, S., Naja, M., Ahmed, M. K., Mukai, H., Terao, Y., Machida, T., Sasakawa, M., and Patra, P. K.: Measurement report: Regional characteristics of seasonal and long-term variations in greenhouse gases at Nainital, India, and Comilla, Bangladesh, Atmos. Chem. Phys., 21, 16427–16452, https://doi.org/10.5194/acp-21-16427-2021, 2021. a
O'Dell, C. W., Eldering, A., Wennberg, P. O., Crisp, D., Gunson, M. R., Fisher, B., Frankenberg, C., Kiel, M., Lindqvist, H., Mandrake, L., Merrelli, A., Natraj, V., Nelson, R. R., Osterman, G. B., Payne, V. H., Taylor, T. E., Wunch, D., Drouin, B. J., Oyafuso, F., Chang, A., McDuffie, J., Smyth, M., Baker, D. F., Basu, S., Chevallier, F., Crowell, S. M. R., Feng, L., Palmer, P. I., Dubey, M., García, O. E., Griffith, D. W. T., Hase, F., Iraci, L. T., Kivi, R., Morino, I., Notholt, J., Ohyama, H., Petri, C., Roehl, C. M., Sha, M. K., Strong, K., Sussmann, R., Te, Y., Uchino, O., and Velazco, V. A.: Improved retrievals of carbon dioxide from Orbiting Carbon Observatory-2 with the version 8 ACOS algorithm, Atmos. Meas. Tech., 11, 6539–6576, https://doi.org/10.5194/amt-11-6539-2018, 2018. a
Ohyama, H., Morino, I., Velazco, V. A., Klausner, T., Bagtasa, G., Kiel, M., Frey, M., Hori, A., Uchino, O., Matsunaga, T., Deutscher, N. M., DiGangi, J. P., Choi, Y., Diskin, G. S., Pusede, S. E., Fiehn, A., Roiger, A., Lichtenstern, M., Schlager, H., Wang, P. K., Chou, C. C.-K., Andrés-Hernández, M. D., and Burrows, J. P.: Validation of XCO2 and XCH4 retrieved from a portable Fourier transform spectrometer with those from in situ profiles from aircraft-borne instruments, Atmos. Meas. Tech., 13, 5149–5163, https://doi.org/10.5194/amt-13-5149-2020, 2020. a
Ohyama, H., Yoshida, Y., and Matsunaga, T.: CH4 and CO emission estimates for megacities: deriving enhancement ratios of CO2, CH4, and CO from GOSAT-2 observations, Environ. Res. Lett., 19, 124025, https://doi.org/10.1088/1748-9326/ad89e0, 2024. a
Okamoto, S., Tanimoto, H., Hirota, N., Ikeda, K., and Akimoto, H.: Decadal Shifts in Wind Patterns Reduced Continental Outflow and Suppressed Ozone Trend in the 2010s in the Lower Troposphere Over Japan, J. Geophys. Res.-Atmos., 123, 12980–12993, https://doi.org/10.1029/2018JD029266, 2018. a
Pandey, S., Gautam, R., Houweling, S., Van Der Gon, H. D., Sadavarte, P., Borsdorff, T., Hasekamp, O., Landgraf, J., Tol, P., Van Kempen, T., Hoogeveena, R., van Heesa, R., Hamburgc, S. P., Maasakkersa, J. D., and Aben, I.: Satellite observations reveal extreme methane leakage from a natural gas well blowout, P. Natl. Acad. Sci., 116, 26376–26381, 2019. a
Rodgers, C. D.: Inverse methods for atmospheric sounding: theory and practice, World Scientific, Singapore, ISBN 9789810227401, 2000. a, b, c
Saito, M.: Analysis-ready subsets of GOSAT and GOSAT-2 methane products used in “Satellite-based inversion of global methane fluxes: Capabilities and implications of GOSAT-2 measurements”, Zenodo [data set], https://doi.org/10.5281/zenodo.18883060, 2026. a, b
Saito, M. and Niwa, Y.: GOSAT-2 Level 4 CH4 Algorithm Theoretical Basis Document, https://prdct.gosat-2.nies.go.jp/documents/pdf/ATBD_L4_CH4_en_00.pdf (last access: 7 September 2026), 2025. a
Saito, M., Shiraishi, T., Hirata, R., Niwa, Y., Saito, K., Steinbacher, M., Worthy, D., and Matsunaga, T.: Sensitivity of biomass burning emissions estimates to land surface information, Biogeosciences, 19, 2059–2078, https://doi.org/10.5194/bg-19-2059-2022, 2022. a
Sasakawa, M., Shimoyama, K., Machida, T., Tsuda, N., Suto, H., Arshinov, M., Davydov, D., Fofonov, A., Krasnov, O., Saeki, T., Koyama, Y., and Maksyutov, S.: Continuous measurements of methane from a tower network over Siberia, Tellus B, 62, 403–416, 2010. a
Sasakawa, M., Machida, T., Ishijima, K., Arshinov, M., Patra, P. K., Ito, A., Aoki, S., and Petrov, V.: Temporal Characteristics of CH4 Vertical Profiles Observed in the West Siberian Lowland Over Surgut From 1993 to 2015 and Novosibirsk From 1997 to 2015, J. Geophys. Res.-Atmos., 122, 11261–11273, https://doi.org/10.1002/2017JD026836, 2017. a
Saunois, M., Stavert, A. R., Poulter, B., Bousquet, P., Canadell, J. G., Jackson, R. B., Raymond, P. A., Dlugokencky, E. J., Houweling, S., Patra, P. K., Ciais, P., Arora, V. K., Bastviken, D., Bergamaschi, P., Blake, D. R., Brailsford, G., Bruhwiler, L., Carlson, K. M., Carrol, M., Castaldi, S., Chandra, N., Crevoisier, C., Crill, P. M., Covey, K., Curry, C. L., Etiope, G., Frankenberg, C., Gedney, N., Hegglin, M. I., Höglund-Isaksson, L., Hugelius, G., Ishizawa, M., Ito, A., Janssens-Maenhout, G., Jensen, K. M., Joos, F., Kleinen, T., Krummel, P. B., Langenfelds, R. L., Laruelle, G. G., Liu, L., Machida, T., Maksyutov, S., McDonald, K. C., McNorton, J., Miller, P. A., Melton, J. R., Morino, I., Müller, J., Murguia-Flores, F., Naik, V., Niwa, Y., Noce, S., O'Doherty, S., Parker, R. J., Peng, C., Peng, S., Peters, G. P., Prigent, C., Prinn, R., Ramonet, M., Regnier, P., Riley, W. J., Rosentreter, J. A., Segers, A., Simpson, I. J., Shi, H., Smith, S. J., Steele, L. P., Thornton, B. F., Tian, H., Tohjima, Y., Tubiello, F. N., Tsuruta, A., Viovy, N., Voulgarakis, A., Weber, T. S., van Weele, M., van der Werf, G. R., Weiss, R. F., Worthy, D., Wunch, D., Yin, Y., Yoshida, Y., Zhang, W., Zhang, Z., Zhao, Y., Zheng, B., Zhu, Q., Zhu, Q., and Zhuang, Q.: The Global Methane Budget 2000–2017, Earth Syst. Sci. Data, 12, 1561–1623, https://doi.org/10.5194/essd-12-1561-2020, 2020. a
Saunois, M., Martinez, A., Poulter, B., Zhang, Z., Raymond, P. A., Regnier, P., Canadell, J. G., Jackson, R. B., Patra, P. K., Bousquet, P., Ciais, P., Dlugokencky, E. J., Lan, X., Allen, G. H., Bastviken, D., Beerling, D. J., Belikov, D. A., Blake, D. R., Castaldi, S., Crippa, M., Deemer, B. R., Dennison, F., Etiope, G., Gedney, N., Höglund-Isaksson, L., Holgerson, M. A., Hopcroft, P. O., Hugelius, G., Ito, A., Jain, A. K., Janardanan, R., Johnson, M. S., Kleinen, T., Krummel, P. B., Lauerwald, R., Li, T., Liu, X., McDonald, K. C., Melton, J. R., Mühle, J., Müller, J., Murguia-Flores, F., Niwa, Y., Noce, S., Pan, S., Parker, R. J., Peng, C., Ramonet, M., Riley, W. J., Rocher-Ros, G., Rosentreter, J. A., Sasakawa, M., Segers, A., Smith, S. J., Stanley, E. H., Thanwerdas, J., Tian, H., Tsuruta, A., Tubiello, F. N., Weber, T. S., van der Werf, G. R., Worthy, D. E. J., Xi, Y., Yoshida, Y., Zhang, W., Zheng, B., Zhu, Q., Zhu, Q., and Zhuang, Q.: Global Methane Budget 2000–2020, Earth Syst. Sci. Data, 17, 1873–1958, https://doi.org/10.5194/essd-17-1873-2025, 2025. a, b
Sawa, Y., Machida, T., Matsueda, H., Niwa, Y., Tsuboi, K., Murayama, S., Morimoto, S., and Aoki, S.: Seasonal changes of CO2, CH4, N2O, and SF6 in the upper troposphere/lower stratosphere over the Eurasian continent observed by commercial airliner, Geophys. Res. Lett., 42, 2001–2008, https://doi.org/10.1002/2014GL062734, 2015. a
Schuldt, K. N., Mund, J., Aalto, T., Andrews, A., Apadula, F., Arduini, J., Arnold, S., Baier, B., Bäni, L., Bartyzel, J., Bergamaschi, P., Biermann, T., Biraud, S. C., Blanc, P. E., Boenisch, H., Brailsford, G., Brand, W. A., Brunner, D., Bui, T. P. V., Van Den Bulk, P., Calzolari, F., Chang, C. S., Chen, H., Chmura, L., St. Clair, J. M., Sites Climadat, Coletta, J. D., Colomb, A., Condori, L., Conen, F., Conil, S., Couret, C., Cristofanelli, P., Cuevas, E., Curcoll, R., Daube, B., Davis, K. J., Dean-Day, J. M., Delmotte, M., Desai, A., DiGangi, E., DiGangi, J. P., Van Dinther, D., Elkins, J. W., Elsasser, M., Emmenegger, L., Fischer, M. L., Forster, G., Frumau, A., Fuente-Lastra, M., Galkowski, M., Gatti, L. V., Gehrlein, T., Gerbig, C., Gheusi, F., Gloor, E., Goto, D., Hammer, S., Hanisco, T. F., Haszpra, L., Hatakka, J., Heimann, M., Heimann, M., Heliasz, M., Heltai, D., Henne, S., Hensen, A., Hermans, C., Hermansen, O., Hintsa, E., Hoheisel, A., Holst, J., Di Iorio, T., Iraci, L. T., Ivakhov, V., Jaffe, D. A., Jordan, A., Joubert, W., Kang, H.-Y., Karion, A., Kazan, V., Keeling, R. F., Keronen, P., Kers, B., Kim, J., Klausen, J., Kneuer, T., Ko, M.-Y., Kolari, P., Kominkova, K., Kort, E., Kozlova, E., Krummel, P. B., Kubistin, D., Kulawik, S. S., Kumps, N., Labuschagne, C., Lan, X., Langenfelds, R. L., Lanza, A., Laurent, O., Laurila, T., Lauvaux, T., Lavric, J., Lee, C.-H., Lee, H., Lee, J., Lehner, I., Lehtinen, K., Leppert, R., Leskinen, A., Leuenberger, M., Levin, I., Levula, J., Lindauer, M., Lindroth, A., Loh, Z. M., Lopez, M., Lowry, D., Lunder, C. R., Machida, T., Mammarella, I., Manca, G., Manning, A., Marek, M. V., Marklund, P., Marrero, J. E., Martin, D., Martin, M. Y., Martins, G. A., Matsueda, H., McKain, K., Meinhardt, F., Menoud, M., Metzger, J.-M., Miles, N. L., Miller, C. E., Miller, J. B., Monteiro, V., Montzka, S., Moore, F., Moossen, H., Morgan, E., Morgui, J.-A., Morimoto, S., Munro, D., Mutuku, M., Myhre, C. L., Mölder, M., Necki, J., Nichol, S., Nisbet, E., Niwa, Y., Njiru, D. M., Noe, S. M., O'Doherty, S., Obersteiner, F., Parworth, C. L., Peltola, O., Peters, W., Philippon, C., Piacentino, S., Pichon, J. M., Pickers, P., Pitt, J., Pittman, J., Plass-Dülmer, C., Platt, S. M., Popa, M. E., Prinzivalli, S., Ramonet, M., Richardson, S. J., Rigouleau, L.-J., Rivas, P. P., Röckmann, T., Rothe, M., Roulet, Y.-A., Ryoo, J.-M., Santoni, G., Di Sarra, A. G., Sasakawa, M., Scheeren, B., Schmidt, M., Schuck, T., Schumacher, M., Seifert, T., Sha, M. K., Shepson, P., Sloop, C. D., Smith, P. D., Sørensen, L. L., De Souza, R. A. F., Spain, G., Steger, D., Steinbacher, M., Stephens, B., Sweeney, C., Taipale, R., Takatsuji, S., Thoning, K., Timas, H., Torn, M., Trisolino, P., Turnbull, J., Van Der Veen, C., Vermeulen, A., Vimont, I., Viner, B., Vitkova, G., De Vries, M., Watson, A., Weiss, R., Weyrauch, D., Wofsy, S. C., Worsey, J., Worthy, D., Xueref-Remy, I., Yates, E. L., Young, D., Yver-Kwok, C., Zaehle, S., Zahn, A., Zazzeri, G., Zellweger, C., and Zimnoch, M.: Multi-laboratory compilation of atmospheric carbon dioxide data for the period 1983–2022; obspack_ch4_1_GLOBALVIEWplus_v6.0_2023-12-01, Global Monitoring Laboratory [data set], https://doi.org/10.25925/20231001, 2023. a
Shen, L., Jacob, D. J., Gautam, R., Omara, M., Scarpelli, T. R., Lorente, A., Zavala-Araiza, D., Lu, X., Chen, Z., and Lin, J.: National quantifications of methane emissions from fuel exploitation using high resolution inversions of satellite observations, Nat. Comm., 14, 4948, https://doi.org/10.1038/s41467-023-40671-6, 2023. a
Shindell, D., Ravishankara, A., Kuylenstierna, J. C., Michalopoulou, E., Höglund-Isaksson, L., Zhang, Y., Seltzer, K., Ru, M., Castelino, R., Faluvegi, G., Naik, V., Horowitz, L., He, J., Lamarque, J.-F., Sudo, K., Collins, J. W., Malley, C., Harmsen, M., Stark, K., Junkin, J., Li, G., Glick, A., and Borgford-Parnall, N.: Global methane assessment: Benefits and costs of mitigating methane emissions, Tech. rep., United Nations Environment Programme, ISBN 978-92-807-3854-4, 2021. a
Shiraishi, T., Hirata, R., and Hirano, T.: New inventories of global carbon dioxide emissions through biomass burning in 2001–2020, Remote Sens., 13, https://doi.org/10.3390/rs13101914, 2021. a
Someya, Y., Yoshida, Y., Ohyama, H., Nomura, S., Kamei, A., Morino, I., Mukai, H., Matsunaga, T., Laughner, J. L., Velazco, V. A., Herkommer, B., Té, Y., Sha, M. K., Kivi, R., Zhou, M., Oh, Y. S., Deutscher, N. M., and Griffith, D. W. T.: Update on the GOSAT TANSO–FTS SWIR Level 2 retrieval algorithm, Atmos. Meas. Tech., 16, 1477–1501, https://doi.org/10.5194/amt-16-1477-2023, 2023. a
Stavert, A. R., Saunois, M., Canadell, J. G., Poulter, B., Jackson, R. B., Regnier, P., Lauerwald, R., Raymond, P. A., Allen, G. H., Patra, P. K., Bergamaschi, P., Bousquet, P., Chandra, N., Ciais, P., Gustafson, A., Ishizawa, M., Ito, A., Kleinen, T., Maksyutov, S., McNorton, J., Melton, J. R., Müller, J., Niwa, Y., Peng, S., Riley, W. J., Segers, A., Tian, H., Tsuruta, A., Yin, Y., Zhang, Z., Zheng, B., and Zhuang, Q.: Regional trends and drivers of the global methane budget, Glob. Change Biol., 28, 182–200, https://doi.org/10.1111/gcb.15901, 2022. a
Suto, H., Kataoka, F., Kikuchi, N., Knuteson, R. O., Butz, A., Haun, M., Buijs, H., Shiomi, K., Imai, H., and Kuze, A.: Thermal and near-infrared sensor for carbon observation Fourier transform spectrometer-2 (TANSO-FTS-2) on the Greenhouse gases Observing SATellite-2 (GOSAT-2) during its first year in orbit, Atmos. Meas. Tech., 14, 2013–2039, https://doi.org/10.5194/amt-14-2013-2021, 2021. a, b
Suto, H., Kataoka, F., Knuteson, R. O., Shiomi, K., Kikuchi, N., and Kuze, A.: Updated spectral radiance calibration on TIR bands for TANSO-FTS-2 onboard GOSAT-2, Atmos. Meas. Tech., 15, 5399–5413, https://doi.org/10.5194/amt-15-5399-2022, 2022. a, b
Takemura, T., Nakajima, T., Higurashi, A., Ohta, S., and Sugimoto, N.: Aerosol distributions and radiative forcing over the Asian Pacific region simulated by Spectral Radiation-Transport Model for Aerosol Species (SPRINTARS), J. Geophys. Res.-Atmos., 108, https://doi.org/10.1029/2002JD003210, 2003. a
Terao, Y., Mukai, H., Nojiri, Y., Machida, T., Tohjima, Y., Saeki, T., and Maksyutov, S.: Interannual variability and trends in atmospheric methane over the western Pacific from 1994 to 2010, J. Geophys. Res.-Atmos., 116, https://doi.org/10.1029/2010JD015467, 2011. a
Tibrewal, K., Ciais, P., Saunois, M., Martinez, A., Lin, X., Thanwerdas, J., Deng, Z., Chevallier, F., Giron, C., Albergel, C., Tanaka, K., Patra, P., Tsuruta, A., Zheng, B., Belikov, D., Niwa, Y., Janardanan, R., Maksyutov, S., Segers, A., Tzompa-Sosa, Z. A., Bousquet, P., and Sciare, J.: Assessment of methane emissions from oil, gas and coal sectors across inventories and atmospheric inversions, Commun. Earth Environ., 5, 26, https://doi.org/10.1038/s43247-023-01190-w, 2024. a
Tohjima, Y., Machida, T., Utiyama, M., Katsumoto, M., Fujinuma, Y., and Maksyutov, S.: Analysis and presentation of in situ atmospheric methane measurements from Cape Ochi-ishi and Hateruma Island, J. Geophys. Res.-Atmos., 107, ACH 8–1–ACH 8–11, https://doi.org/10.1029/2001JD001003, 2002. a
Tohjima, Y., Kubo, M., Minejima, C., Mukai, H., Tanimoto, H., Ganshin, A., Maksyutov, S., Katsumata, K., Machida, T., and Kita, K.: Temporal changes in the emissions of CH4 and CO from China estimated from CH4 / CO2 and CO / CO2 correlations observed at Hateruma Island, Atmos. Chem. Phys., 14, 1663–1677, https://doi.org/10.5194/acp-14-1663-2014, 2014. a
Toon, G. C.: Solar Line List for the TCCON 2014 Data Release, CaltechDATA [data set], https://doi.org/10.14291/TCCON.GGG2014.SOLAR.R0/1221658, 2015. a
Umezawa, T., Machida, T., Ishijima, K., Matsueda, H., Sawa, Y., Patra, P. K., Aoki, S., and Nakazawa, T.: Carbon and hydrogen isotopic ratios of atmospheric methane in the upper troposphere over the Western Pacific, Atmos. Chem. Phys., 12, 8095–8113, https://doi.org/10.5194/acp-12-8095-2012, 2012. a
Umezawa, T., Goto, D., Aoki, S., Ishijima, K., Patra, P. K., Sugawara, S., Morimoto, S., and Nakazawa, T.: Variations of tropospheric methane over Japan during 1988–2010, Tellus B, 66, 23837, https://doi.org/10.3402/tellusb.v66.23837, 2014. a
Umezawa, T., Tohjima, Y., Terao, Y., Sasakawa, M., Müller, A., Saeki, T., Machida, T., Nakaoka, S.-I., Nara, H., Nomura, S., Nishihashi, M., Mukai, H., Frey, M. M., Morino, I., Ohyama, H., Yoshida, Y., Zeng, J., Noda, H., Saito, M., Matsunaga, T., Sugita, T., Tanimoto, H., Niwa, Y., Ito, A., Yamashita, Y., Shirai, T., Ishizawa, M., Ishijima, K., Tsuboi, K., Sawa, Y., and Matsueda, H.: Long-term and interannual variations of atmospheric methane observed by the NIES and collaborative observation networks, Prog. Earth Planet. Sci., 12, 39, https://doi.org/10.1186/s40645-025-00711-9, 2025. a
Velazco, V. A., Morino, I., Uchino, O., Hori, A., Kiel, M., Bukosa, B., Deutscher, N. M., Sakai, T., Nagai, T., Bagtasa, G., Izumi, T., Yoshida, Y., and Griffith, D. W. T.: TCCON Philippines: First Measurement Results, Satellite Data and Model Comparisons in Southeast Asia, Remote Sens., 9, https://doi.org/10.3390/rs9121228, 2017. a
Weber, T., Wiseman, N. A., and Kock, A.: Global ocean methane emissions dominated by shallow coastal waters, Nat. Comm., 10, 4584, https://doi.org/10.1038/s41467-019-12541-7, 2019. a
Worden, J. R., Bloom, A. A., Pandey, S., Jiang, Z., Worden, H. M., Walker, T. W., Houweling, S., and Röckmann, T.: Reduced biomass burning emissions reconcile conflicting estimates of the post-2006 atmospheric methane budget, Nat. Comm., 8, 2227, https://doi.org/10.1038/s41467-017-02246-0, 2017. a
Wunch, D., Toon, G. C., Blavier, J.-F. L., Washenfelder, R. A., Notholt, J., Connor, B. J., Griffith, D. W. T., Sherlock, V., and Wennberg, P. O.: The total carbon column observing network, Philos. T. R. Soc. A, 369, 2087–2112, 2011. a
Yokota, T., Yoshida, Y., Eguchi, N., Ota, Y., Tanaka, T., Watanabe, H., and Maksyutov, S.: Global concentrations of CO2 and CH4 retrieved from GOSAT: first preliminary results, SOLA, 5, 160–163, 2009. a
Yoshida, Y. and Oshio, H.: GOSAT-2 TANSO-FTS-2 SWIR L2 Retrieval Algorithm Theoretical Basis Document, National Institute for Environmental Studies, https://prdct.gosat-2.nies.go.jp/documents/pdf/ATBD_FTS-2_L2_SWL2_en_03.pdf (last access: 7 September 2026), 2025. a
Yoshida, Y., Ota, Y., Eguchi, N., Kikuchi, N., Nobuta, K., Tran, H., Morino, I., and Yokota, T.: Retrieval algorithm for CO2 and CH4 column abundances from short-wavelength infrared spectral observations by the Greenhouse gases observing satellite, Atmos. Meas. Tech., 4, 717–734, https://doi.org/10.5194/amt-4-717-2011, 2011. a
Yoshida, Y., Kikuchi, N., Morino, I., Uchino, O., Oshchepkov, S., Bril, A., Saeki, T., Schutgens, N., Toon, G. C., Wunch, D., Roehl, C. M., Wennberg, P. O., Griffith, D. W. T., Deutscher, N. M., Warneke, T., Notholt, J., Robinson, J., Sherlock, V., Connor, B., Rettinger, M., Sussmann, R., Ahonen, P., Heikkinen, P., Kyrö, E., Mendonca, J., Strong, K., Hase, F., Dohe, S., and Yokota, T.: Improvement of the retrieval algorithm for GOSAT SWIR XCO2 and XCH4 and their validation using TCCON data, Atmos. Meas. Tech., 6, 1533–1547, https://doi.org/10.5194/amt-6-1533-2013, 2013. a
Yoshida, Y., Someya, Y., Ohyama, H., Morino, I., Matsunaga, T., Deutscher, N. M., Griffith, D. W. T., Hase, F., Iraci, L. T., Kivi, R., Notholt, J., Pollard, D. F., Té, Y., Velazco, V. A., and Wunch, D.: Quality Evaluation of the Column-Averaged Dry Air Mole Fractions of Carbon Dioxide and Methane Observed by GOSAT and GOSAT-2, SOLA, 19, 173–184, https://doi.org/10.2151/sola.2023-023, 2023. a, b
Zhang, G., Xiao, X., Dong, J., Xin, F., Zhang, Y., Qin, Y., Doughty, R. B., and Moore III, B.: Fingerprint of rice paddies in spatial–temporal dynamics of atmospheric methane concentration in monsoon Asia, Nat. Comm., 11, 554, https://doi.org/10.1038/s41467-019-14155-5, 2020. a
Zhang, Y., Jacob, D. J., Lu, X., Maasakkers, J. D., Scarpelli, T. R., Sheng, J.-X., Shen, L., Qu, Z., Sulprizio, M. P., Chang, J., Bloom, A. A., Ma, S., Worden, J., Parker, R. J., and Boesch, H.: Attribution of the accelerating increase in atmospheric methane during 2010–2018 by inverse analysis of GOSAT observations, Atmos. Chem. Phys., 21, 3643–3666, https://doi.org/10.5194/acp-21-3643-2021, 2021. a