the Creative Commons Attribution 4.0 License.
the Creative Commons Attribution 4.0 License.
 | 26 Jan 2026
Spatiotemporal mapping of invasive yellow sweetclover blooms using Sentinel-2 and high-resolution drone imagery
Sakshi Saraf
Ranjeet John
Venkatesh Kolluru
Khushboo Jain
Geoffrey M. Henebry
Jiquan Chen
Raffaele Lafortezza
Yellow sweetclover (Melilotus officinalis (L.) Lam.; MEOF) is an invasive forb pervasive across the Northern Great Plains in the United States, often linked to traits such as wide adaptability, strong stress tolerance, and high productivity. Despite MEOF's prevalent ecological-economic impacts and importance, knowledge of its spatial distribution and temporal evolution is extremely limited. Here, we aim to develop a spatial database of annual MEOF abundance (2016–2023) across western South Dakota (SD) at 10 m spatial resolution by applying a generalized prediction model on Sentinel-2 imagery. We collected in situ quadrat-based total vegetation cover with MEOF percent cover estimates across western SD from 2021 through 2023 and synthesized with other available percent cover estimates (2016–2022) of several federal, state, and non-governmental sources. We conducted drone overflights at 14 sites across Butte County, SD in 2023 to develop very high spatial resolution (4–6 cm) and accurate MEOF cover maps by applying a random forest (RF) classification model. The field-measured and uncrewed aerial system (UAS) derived MEOF percent cover estimates were used to train, test, and validate a RF regression model. The predicted MEOF percent cover dataset was validated with UAS-derived percent cover in 2023 across four sites (out of 14 sites). We found that the variation in the Normalized Difference Moisture Index and Distance to roads were among the top predicting variables in predicting MEOF abundance. Our predictive model yielded greater accuracies with an R2 of 0.76, RMSE of 15.11 %, MAE of 10.95 %, and MAPE of 1.06 %. We further validated our 2023 predicted maps using the 3 m resolution PlanetScope imagery for regions where field samples could not be collected in 2023. The database of MEOF abundance showed consecutive years of average or above-average precipitation yielded a higher MEOF abundance across the study region. The database could assist local land managers and government officials pinpoint locations requiring timely land management to control the rapid spread of MEOF in the Northern Great Plains. The developed invasive MEOF percent cover datasets are freely available at the figshare repository (https://doi.org/10.6084/m9.figshare.29270759.v1, Saraf et al., 2025).
- Article
(15018 KB) - Full-text XML
-
Supplement
(1818 KB) - BibTeX
- EndNote


Invasive plant species pose severe threat on ecosystem structure and functions (Rai and Singh, 2020). In particular, the Northern Great Plains (NGP) grasslands in the United States are being threatened by long-established and newly arrived invasive plant species and loss of diversity (Hendrickson et al., 2019). These invasive species compete against native species, diminishing ecological goods and services and degrade vulnerable grassland ecosystems (Gaskin et al., 2021). Furthermore, the ecosystem responses of grasslands in general including NGP are becoming increasingly variable in space and time due to the myriad influences from climate change (Bernath-Plaisted et al., 2023; Cleland et al., 2013; Zhang et al., 2022). These conditions accelerate and contribute to the difficult to predict dynamics of invasive plant species that often are spread unintentionally (Spiess et al., 2020). The NGP comprises public, tribal, and private lands, resulting in a patchwork of management goals and invasive plant control strategies (Langholz, 2010). Ecological studies that operate within restricted spatial boundaries or plot-based datasets are advantageous in providing comprehensive insights into local invasion scenarios (Martins et al., 2016). However, previous studies often lack important spatiotemporal data on invasion dynamics, such as changes in species cover, spread rates, and environmental drivers, making it difficult to fully understand invasion processes that unfold continuously across space and time (Larson et al., 2020). Developing timely updates of the spatial and temporal spread of invasive plant species therefore have been increasingly urged to effectively and efficiently address the challenges posed by invasive species in changing habitats is an urgent need (Van Rees et al., 2022).
In general, understanding the spatio-temporal patterns of a biennial plant species that are either ephemeral in nature or bloom in specific years is challenging due to their phenological cycle. Yellow sweetclover (Melilotus officinalis (L.) Lam., MEOF), a common invasive legume in the NGP, exemplifies this biennial phenology. There has been little to no literature on mapping blooms of such plant species until the 2010s. In recent years, MEOF has attracted attention from land managers in South Dakota (SD) as it is becoming a prominent invasive species in the NGP region. We refer to years with MEOF super blooms (Preston et al., 2023) in the Dakota region as “sweetclover years”. MEOF is a nitrogen-fixing, biennial legume forb native to Eurasia (Luo et al., 2016). It has noticeable pea-like, strongly scented yellow flowers arranged in a narrow raceme, which can grow more than 4 cm long (Varner, 2022). The ability of MEOF to establish and grow in a wide range of temperature, precipitation, and soil conditions has naturalized its presence in the NGP region (Kan et al., 2023). It is often one of the first plants to appear in disturbed or open sites, including pastures, agricultural fields, roadsides, rangelands, and open slopes in badlands, prairies, or floodplains (Wolf et al., 2003).
Invasive forbs such as MEOF develop yellow inflorescences that are prominent during flowering time and can be detected using 10 m resolution Sentinel-2 derived reflectance and quantitative indices, provided the plants meet the optimal size or developmental stage for detection (Saraf et al., 2023). Previous studies have shown that multi-temporal analysis using remote sensing data can be a powerful tool for addressing challenges in monitoring invasive species dynamics (Bradley, 2014; Mouta et al., 2023). For example, Sentinel-2 imagery with 10 m spatial resolution has sufficed for mapping a range of invasive plant species (Kattenborn et al., 2019). In addition, the high temporal resolution of the Sentinel-2 can help capture phenological characteristics and identify species with pronounced flowering periods. However, there have been relatively very few efforts to map MEOF in the NGP due, in part, to its unreliable annual aboveground establishment resulting in low to moderate abundance during drier years complicating attempts to map its distribution. Moreover, its yellow flowers can be easily mistaken in remote sensing imagery for other yellow-flowered forbs such as yellow salsify, black eyed susan, western wallflower, annual sunflower or leafy spurge. MEOF tends to grow in dense patches and invade vast areas with the capability of growing up to 2 m tall when ample moisture is available during its growth period. In the recent wet year of 2019, MEOF thrived across the NGP, resulting in minimal spatial overlaps with other yellow flowered plants and enabling researchers to map its spatial distribution. Specific years with an enhanced bloom of MEOF, such as 2019 and 2023, were easily distinguished in image time series due to their extensive spread, tall canopy, and prolific yellow flowers during summer (Preston et al., 2023). Such climate conditions create an opportunity to collect more ground samples to increase accurate mapping of MEOF distribution.
In traditional remote sensing, in situ reference data are required to detect and validate complex patterns and ecologically relevant processes (Mayr et al., 2019). The reference data collection is usually labor-intensive, time-consuming, and logistically difficult across large spatial areas. Uncrewed Aerial Systems (UAS), combined with high-resolution multispectral or hyperspectral cameras, offer a promising, user-friendly, and low-cost alternative data source to in situ data collection (Horstrand et al., 2019; Li and Tsai, 2017; Rakotoarivony et al., 2023). Despite the limited spatial extent of each swatch, UAS still enables the acquisition of spatially continuous information on species cover with ultra-high spatial resolution (e.g., ground sampling distance of < 10 cm) and temporal flexibility (Turner and Wallace, 2013). Numerous studies have demonstrated the potentials of UAS data as an alternative source to supplement or even replace the traditional sampling methods of detecting species presence in the field (Alvarez-Taboada et al., 2017; Baena et al., 2017; Kattenborn et al., 2019). UAS data can be used to train models that employ fine-to-medium spatial resolution data, such as Sentinel-2 imagery, to map invasives at regional scales (Preston et al., 2023), despite a small survey extent (Colomina and Molina, 2014).
Previously, we lacked sufficient statistical power and comprehensive spatial coverage due to small sample size to conduct regional scale mapping for the 2019 MEOF blooms (Saraf et al., 2023). Preston et al. (2023) used an ensemble of MaxEnt models to map MEOF fractional cover for 2019 using UAS data at 16 sites across three counties in SD and Montana using satellite imagery trained from regional UAS imageries. Our team also examined the contribution of various biophysical factors to MEOF and tested different machine learning algorithms to determine the best algorithm to map the MEOF for 2019 (Saraf et al., 2023). We found that the random forest (RF) algorithm (Breiman et al., 1984) outperformed other machine learning algorithms in mapping the distribution of invasive MEOF cover. However, our results also indicated a significant underestimation of the percent cover due to the limited sample size. We, therefore, aimed to increase the sampling size by collecting quadrat-based percent cover and UAS imagery over MEOF blooms and synthesizing estimates from various state and federal sources to overcome uncertainties and the limitation of underestimation.
We endeavored to optimize the utilization of UAS and Sentinel-2 data to create a reference percent cover dataset, which was then used as a training and validation inputs for a RF modeling framework. This approach helped develop an annual time-series percent cover database for the invasive MEOF. Developing a generalized model that can be applied across space and time allows for efficient mapping of irruptive invasive plant species, which often bloom episodically and occur in clustered patches. Such distributions are often underrepresented in conventional field survey datasets, including our ground reference data, because random sampling rarely captures them adequately. Effective management of plant invasives such as MEOF will require spatially continuous, multitemporal maps of species occurrence and cover as its first step. Building such a database for invasive MEOF can help to comprehend the spatial and temporal dynamics of its invasion patterns (Müllerová et al., 2017). Therefore, our objectives are threefold: (1) to develop a generalized prediction model using field-collected and UAS-derived percent cover samples along with Sentinel 2 imagery to map the fractional cover of invasive MEOF across western SD; (2) to compare and validate our model-derived percent cover estimates against the drone-derived estimates; and (3) to further validate the predicted yellow sweetclover maps using PlanetScope imagery, which provides higher temporal resolution and independent data for cross-sensor validation, and to assess MEOF cover in regions lacking UAS coverage. We ask two research questions. First, what are the spatiotemporal distributions of invasive MEOF across western SD? Second, are the spatiotemporal distributions of MEOF explained by precipitation in bloom years? For land managers, it is crucial to both understand the current distribution of MEOF in recent years and appreciate its invasion dynamics, to curb further spread of MEOF into previously unaffected areas. The developed invasive species cover database would therefore help to design mitigation strategies effectively and promote the proactive conservation of grassland ecosystems.
2.1 Study Area
Western SD is located within the Upper Missouri River Basin and is a part of the NGP, characterized by the Black Hills along with prairie at the southwestern corner, along with high buttes, canyons, and wide expanses of nearly level tablelands (Fig. 1). This region experiences a semi-arid climate with high interannual variability in precipitation, averaging around 300–400 mm (Agnew et al., 1986). About three-fourths of the precipitation occurs during summer, and snowfall ranges from 650 to 5000 mm throughout western SD (Paul et al., 2016). Despite the substantial conversions of rangeland to cultivated lands in the US Midwest, most of the central and western SD landscapes are still dominated by rangelands. The landscape of western SD is a mosaic of mixed-grass prairie interspersed with cultivated lands. The mixed grass prairie shifts into shortgrass and sagebrush grassland in the extreme western portion of the state. The dominant grasses include western wheatgrass (Pascopyrum smithii (Rydb.) Á. Löve), needle and thread (Hesperostipa comata (Trin. & Rupr.) Barkworth), little bluestem (Schizachyrium scoparium (Michx.) Nash), prairie sandreed (Calamovilfa longifolia (Hook.) Scribn), green needlegrass (Nassella viridula (Trin.) Barkworth), blue grama (Bouteloua gracilis (Willd. ex Kunth.) Lag. ex Griffiths) and threadleaf sedge (Carex filifolia Nutt.). Dryland sedges (Carex spp. L.), prairie threeawn (Aristida oligantha Michx.), and fringed sagewort (Artemisia frigida Willd.) increase with disturbance (Owensby and Launchbaugh, 1977; Reinhart et al., 2019; Sanderson et al., 2015). Several perennial forbs such as western wallflower (Erysimum asperum (Nutt.) DC.), Canada thistle (Cirsium arvense (L.) Scop.)), leafy spurge (Euphorbia esula L.), purple prairie clover (Dalea purpurea Vent. var. purpurea) and shrubs such as big sagebrush (Artemisia tridentata Nutt.), broom snakeweed (Gutuerrezia sorothrae Pursh) and leadplant (Amorpha canescens Pursh) are prevalent. The most common invasive grasses include Kentucky bluegrass (Poa pratensis L.), smooth brome (Bromus inermis Leyss.), cheatgrass (Bromus tectorum L.), and curlycup gumweed (Grindelia squarrosa (Pursh) Dunal). Yellow salsify (Tragopogon dubius Scop.) and yellow sweetclover (Melilotus officinalis (L.) Lam.) are common invasive annual-biennial forbs in this region (Johnson and Larson, 1999).
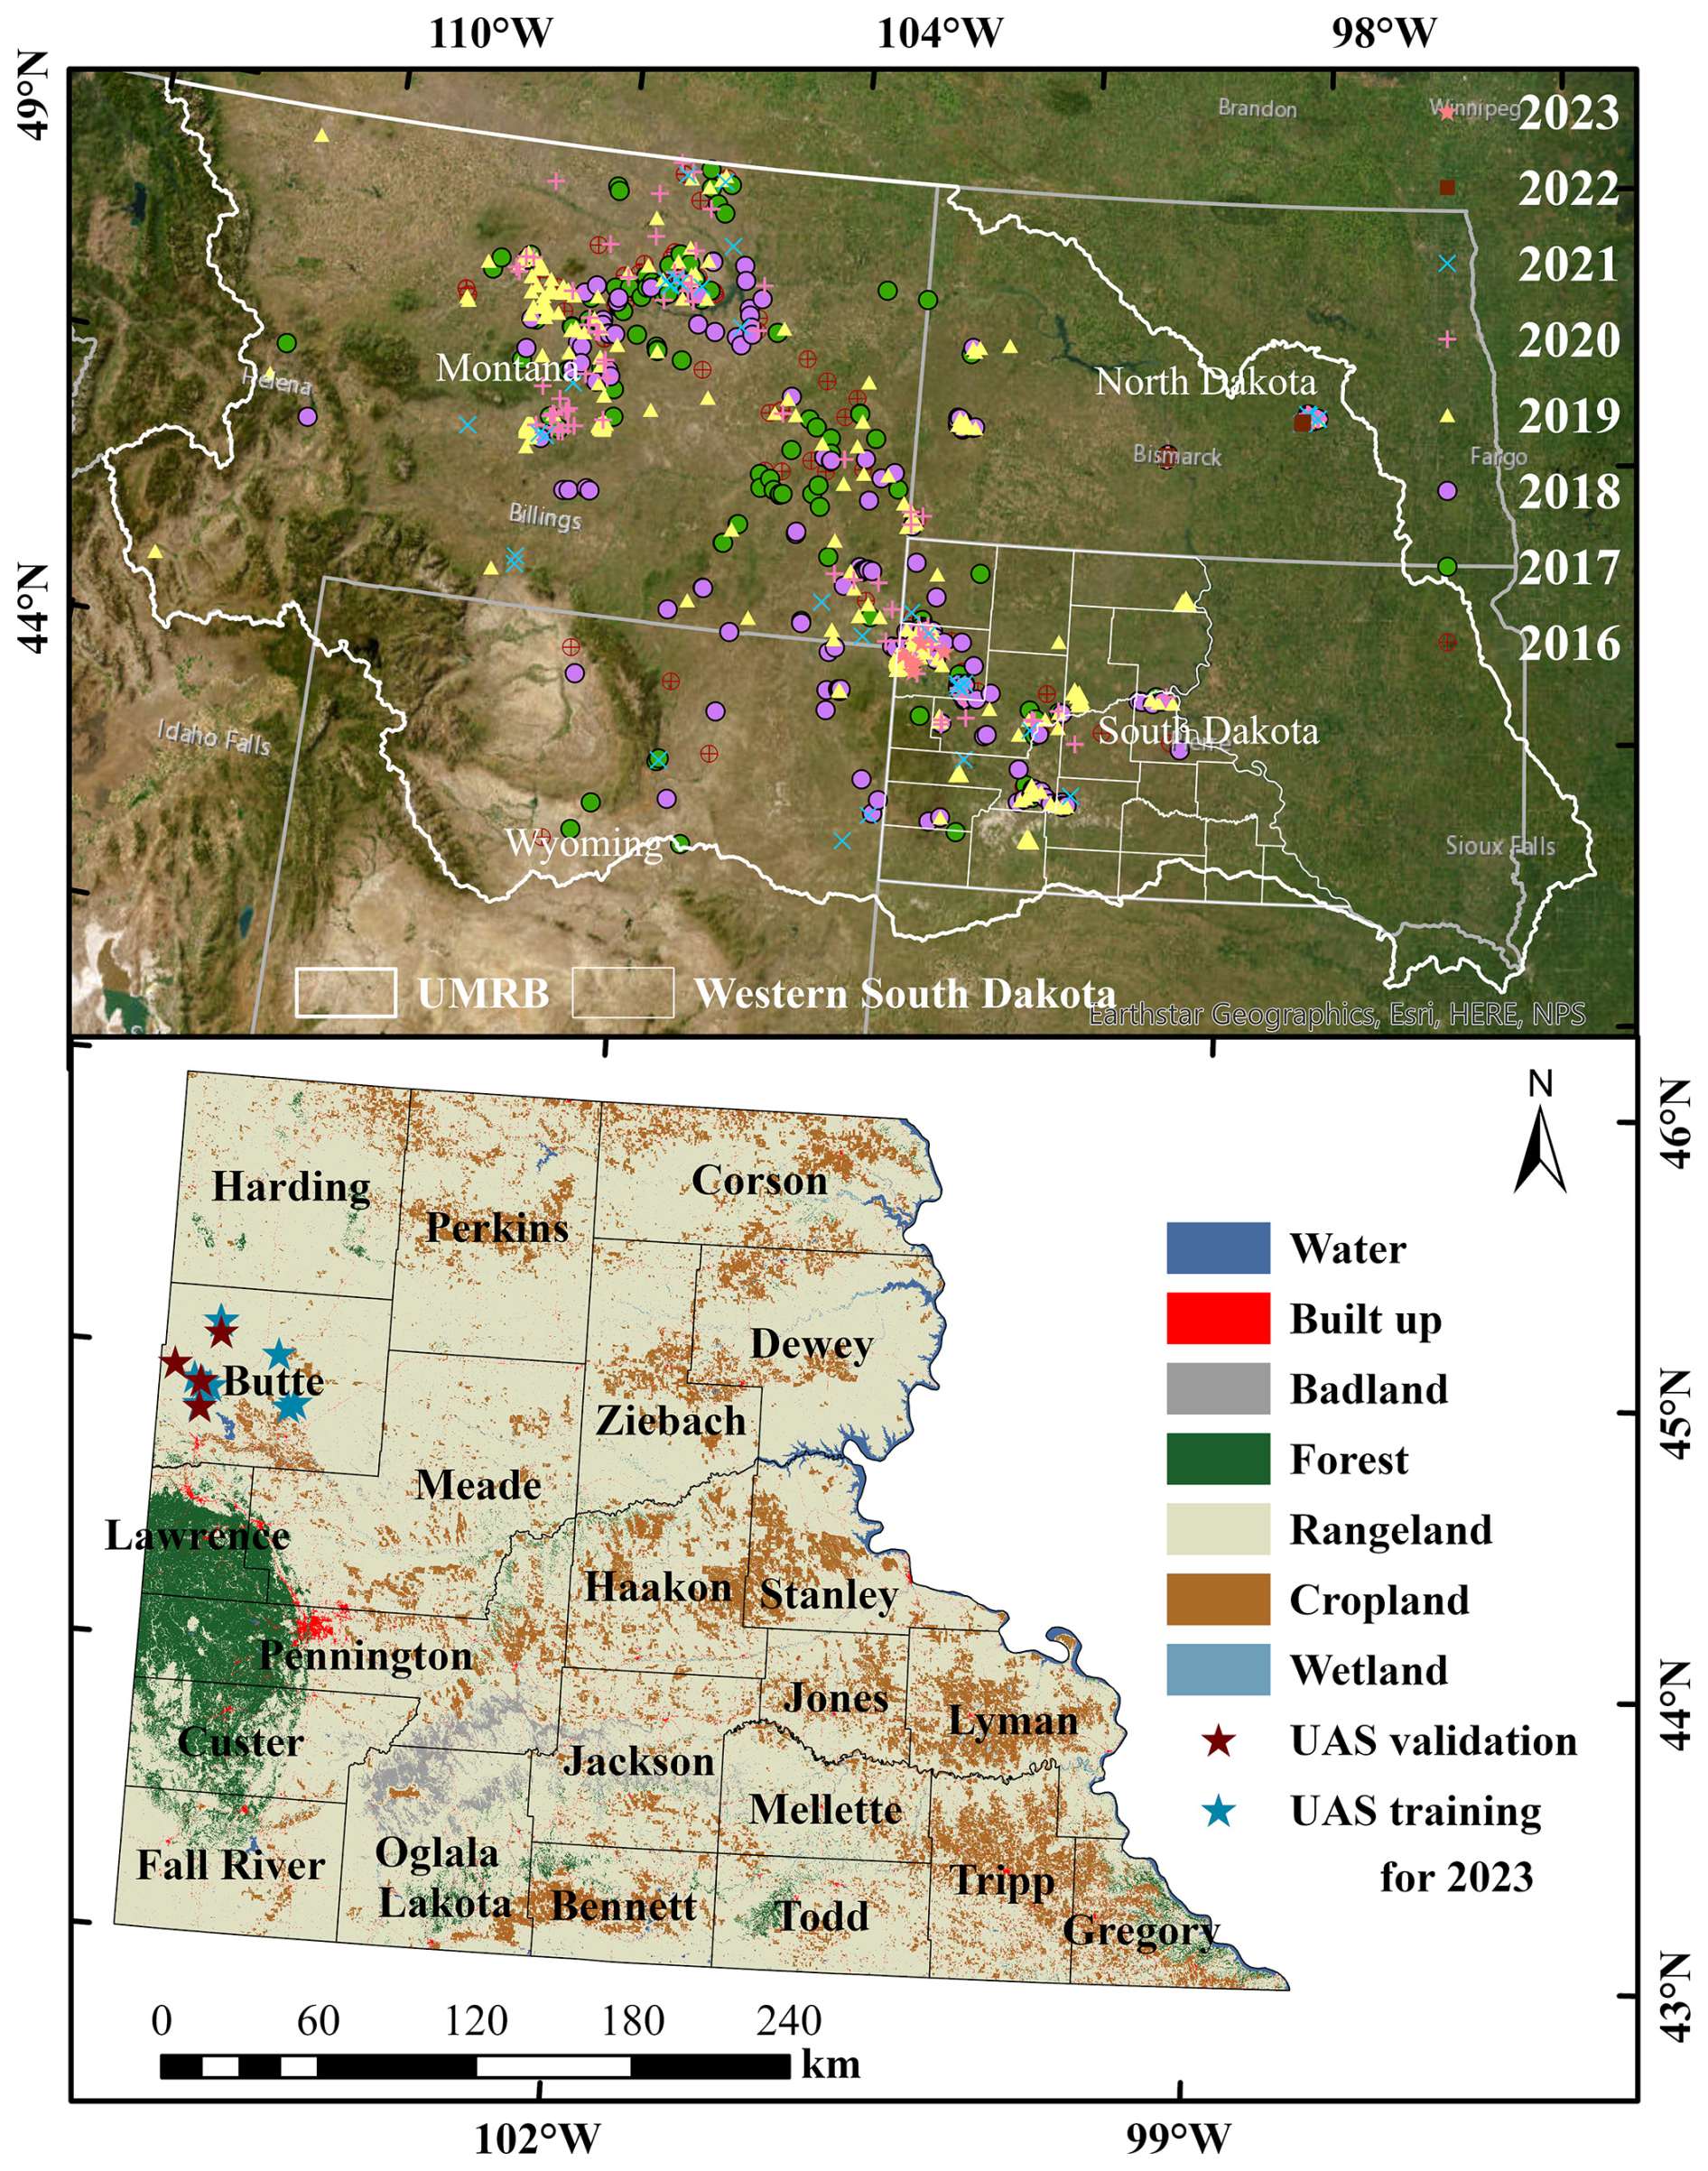
Figure 1The top panel shows field observations used in this study (n= 22 972) collected from 2016 to 2023 across the Northern Great Plains, including our own surveys as well as publicly available datasets such as BLM AIM and NEON (© Esri, Maxar, Earthstar Geographics, and the GIS User Community). The bottom panel shows the UAS training and validation sites overlaid on the National Land Cover Database (NLCD, 2019) land cover map with county boundaries of western South Dakota.
2.2 UAS Survey
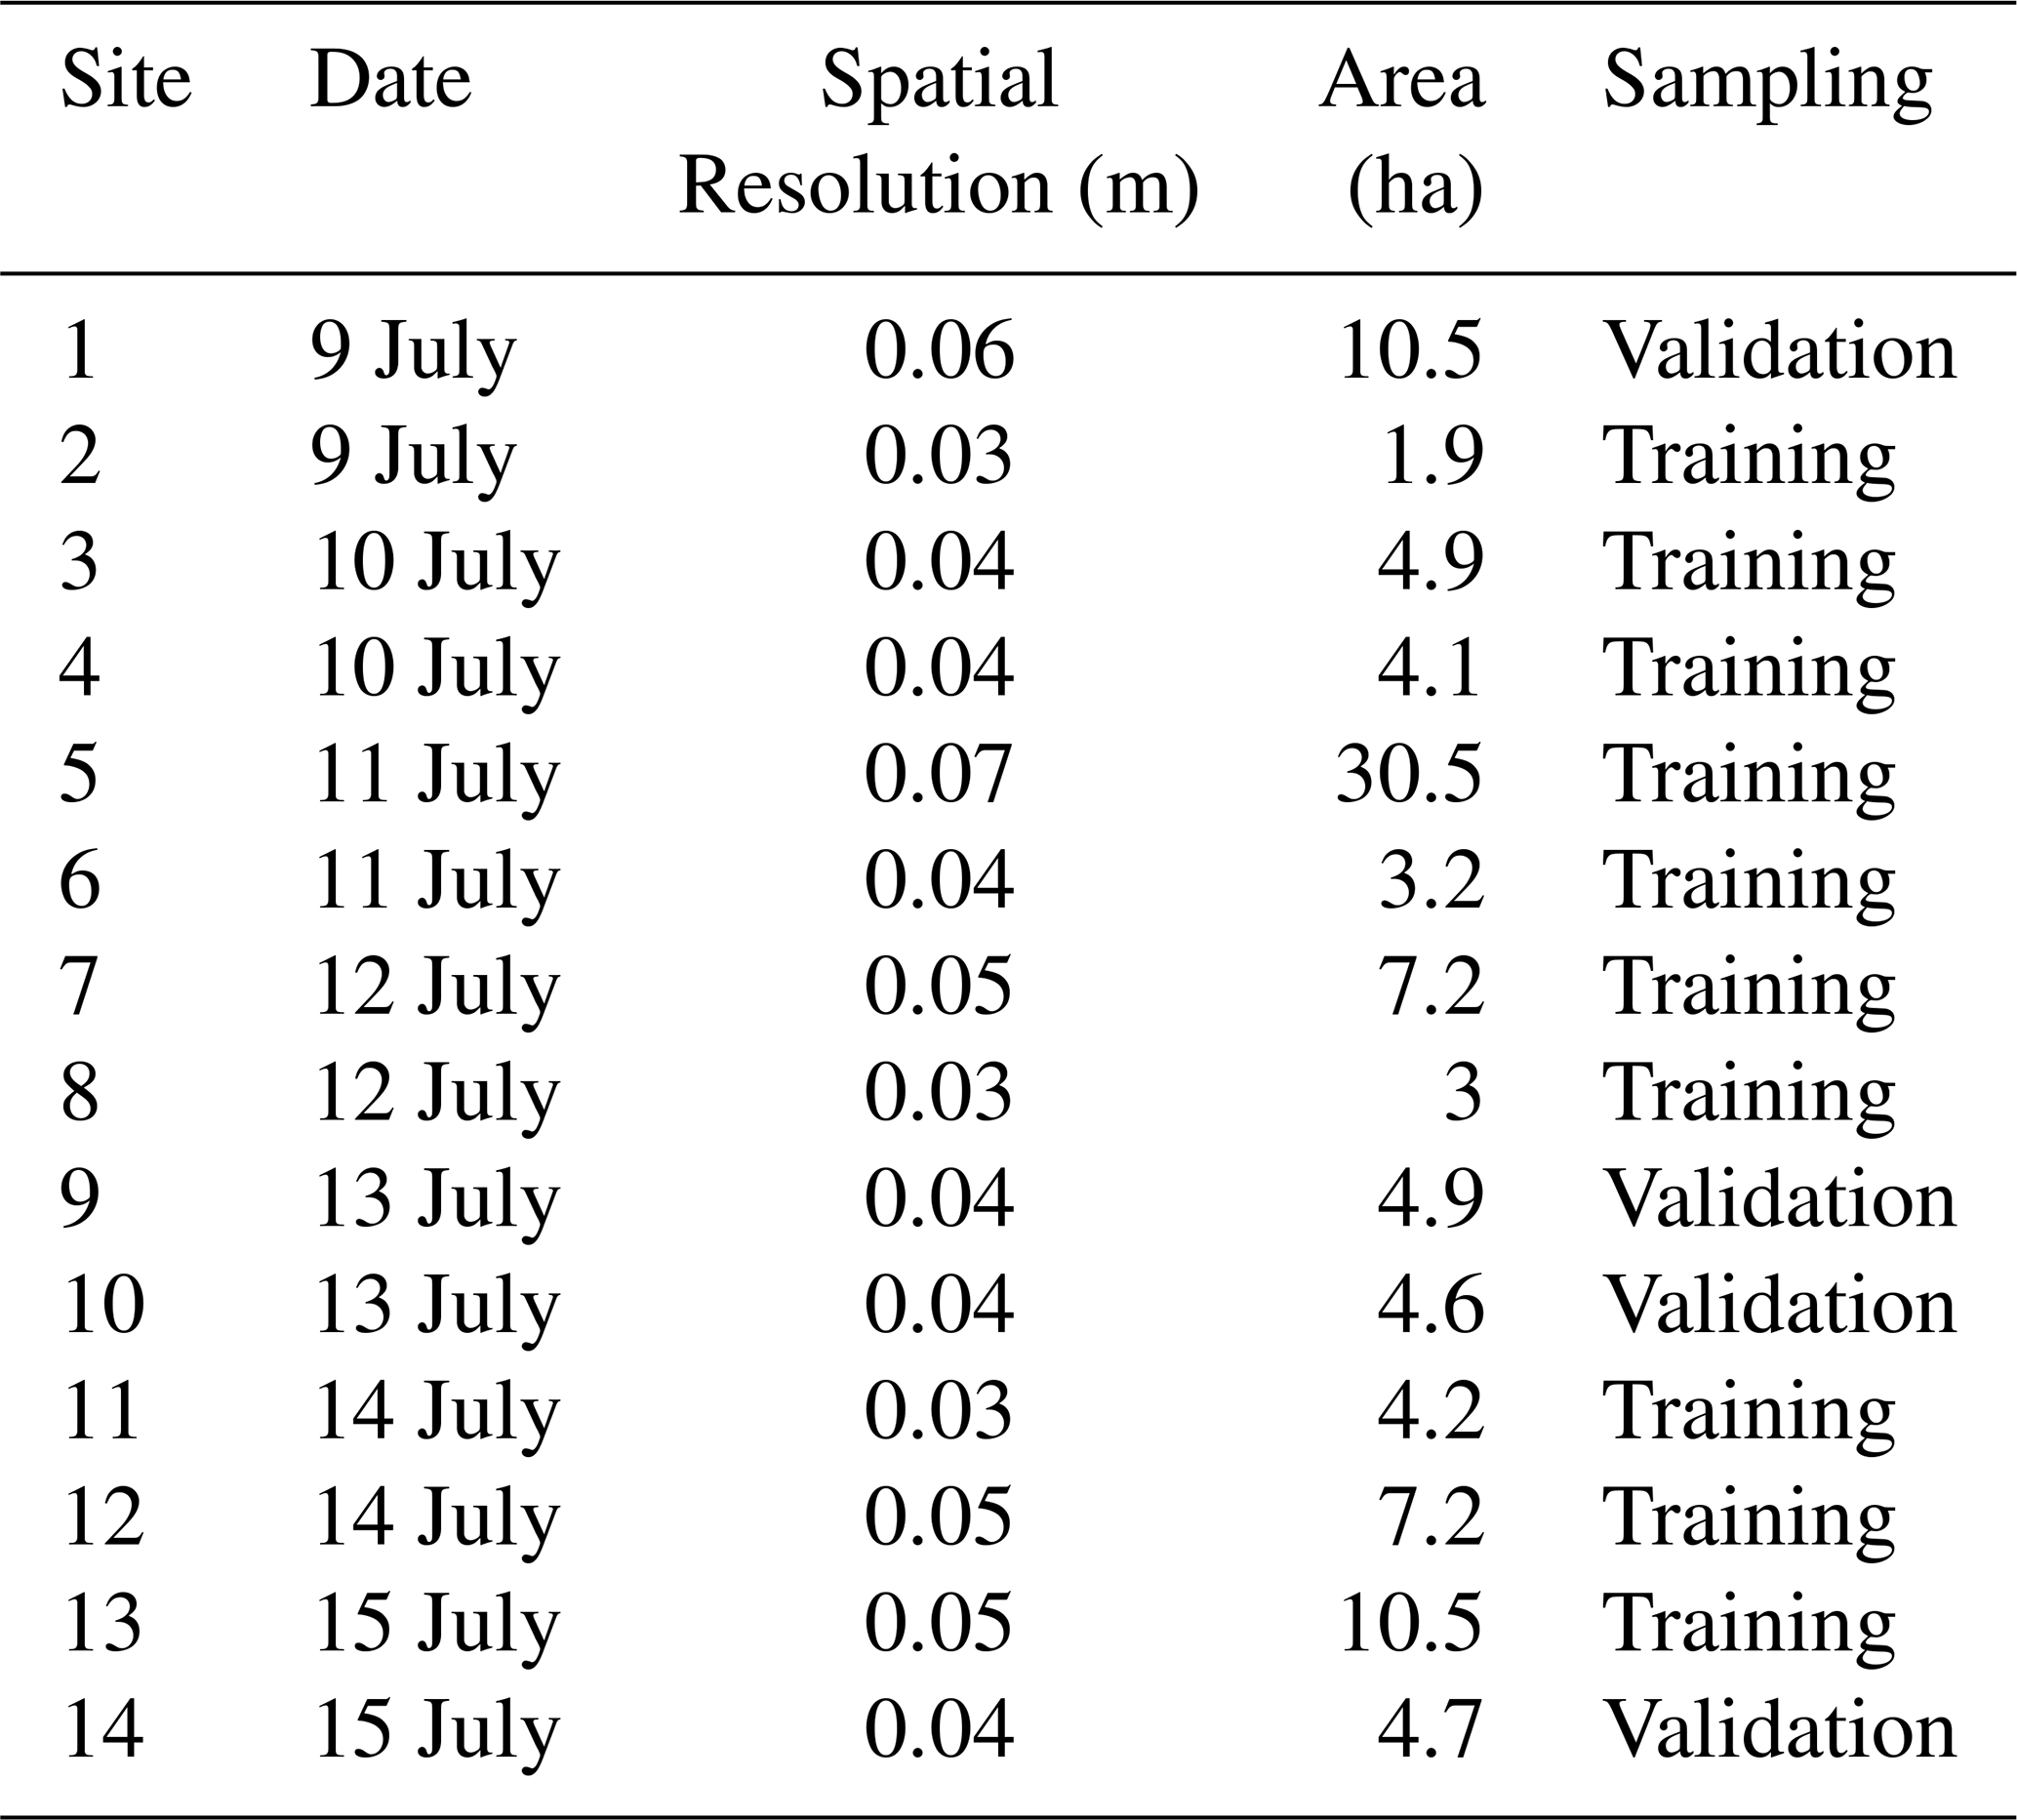
Ultra-high spatial resolution UAS imagery were acquired for 14 sites during a field campaign from 9 to 15 July 2023. The flight locations were randomly selected across Butte County in western South Dakota to capture large, continuous patches of MEOF, ensuring that the imagery encompassed the full range of percent cover within each site, including areas without MEOF. We collected multispectral (Visible, RedEdge, and Near InfraRed) imagery using a MicaSense RedEdge-MX (MicaSense Inc., 2015) camera deployed on a DJI Matrice 200 UAS platform. The radiometric calibration of the sensor was implemented by converting the digital values of the orthomosaic to the values of surface spectral reflectance by Micasense calibration panel. The area covered for each flight ranged between 1 and 10 ha, depending on the patch size of the MEOF invasion (Table S7). The imagery was captured with at least 80 % forward and 75 % side overlap (Table 1). We flew the flight at an average altitude of 30–60 m above ground, ensuring a spatial resolution of at least 3 cm. We used the recorded inertial measuring unit (IMU) and Global Navigation Satellite System (GNSS) module of the UAS along with Real-Time Kinematic (RTK) positioning (∼ 1 cm accuracy) to guide the drone by placing four Ground Control Points (GCPs) at each site to ensure the geometric accuracy of the images taken by the drone matched the Sentinel-2 imagery. Several studies have demonstrated that using GCPs can lead to higher accuracies in the processed orthoimages than direct georeferencing (Jurjević et al., 2020; Padró et al., 2019). Moreover, GCPs help advance the upscaling of UAS to Sentinel-2 imagery with the best alignment and minimum shift (Gränzig et al., 2021). Therefore, we processed the UAS images in Pix4D mapper (Pix4D S.A., 2022), and georeferenced the orthomosaics using the GPS coordinates of plot center and corner targets collected with Trimble Catalyst DA2 GNSS receiver kit (Trimble Inc., 2025) with a precision level of 1 cm accuracy. All 14 sites captured the observed range of MEOF percent cover, but they differed in total area covered by MEOF presence and the number of samples derived from each site. To ensure a balanced split, the 10 smaller sites were randomly selected for training the RF model, while the remaining four larger sites were reserved for validation. This approach ensured that both the training and validation sets contained approximately equal numbers of samples, providing an unbiased assessment of model performance.
Table 1Details of the drone flights covered in sample collection for summer 2023.
2.3 Field measurements and sample collection
We used a total of 22 972 MEOF percent cover samples collected across western South Dakota rangelands and surrounding regions during 2016–2023 (Table S1 in the Supplement). This included 5283 samples derived from UAS imagery collected during the peak blooming months (June–August) in 2023 (details in Sect. 2.2 and 2.4) across western South Dakota rangelands. In addition, 17 689 MEOF cover samples were retrieved and synthesized from multiple federal, state, and non-governmental sources for 2016–2022 across four states: South Dakota, North Dakota, Montana, and Wyoming (Fig. 1a; Table S1). Although the historical samples were obtained using different field protocols, they were integrated with our field-collected data to increase spatial and temporal coverage. These sources included RCMAP data from the USGS Center for Earth Resources Observation & Science, USGS Northern Rocky Mountain Science Center (Montana), the Bureau of Land Management (BLM) database, the Northern Great Plains Inventory & Monitoring Network, the National Ecological Observatory Network (NEON), and the Montana Natural Heritage Program. The source, year-wise distribution, and frequency of the samples are summarized in Tables S2 and S3. At the 10 m mapping scale, this compilation provided a suitable reference for model training and validation. Our field-collected surveys recorded the plant species composition, including dominant species and percent cover of all species present, using the conventional plot-based quadrat method. Within each 30 m × 30 m plot, a minimum of three 0.5 m × 0.5 m quadrats were sampled. Percent cover for each plot was calculated as the average of the quadrat measurements, with each quadrat considered representative of its portion of the plot. Within each quadrat, we estimated percent cover of MEOF by averaging the grids it occupied, allowing fine-resolution observations to be scaled up to the plot level while capturing spatial variability (John et al., 2018). We recorded flowering and non-flowering MEOF individuals separately. The separation was done to document phenological variability and population structure, which can be useful for understanding interannual flowering dynamics in future analyses. However, only the flowering MEOF percent cover was used for remote sensing–based mapping, as flowering individuals exhibit a distinct spectral signal that can be consistently detected in aerial and satellite imagery. This approach ensured that the satellite-derived cover estimates corresponded specifically to the detectable, flowering component of MEOF. For 2023, the GPS locations of the field-collected quadrat samples were utilized as the ground control points for enhancing the processing of drone imagery to derive percent cover samples.
2.4 UAS derived yellow sweetclover cover
MEOF is prominently visible in orthomosaics using a combination of green, green, and blue bands. This prominence occurs because yellow flowers of MEOF increase reflectance of green while slightly decreasing reflectance of blue color (Sulik and Long, 2016). We first visually delineated several polygons of MEOF on the georeferenced orthomosaics using these band combinations. We then used 3000 absence and 3000 presence samples derived from these polygons to train a machine learning classification model and classify MEOF presence pixels from other land cover pixels. We used five spectral bands (Blue, Green, Red, RedEdge, and NIR) and the Normalized Difference Yellowness Index (NDYI) to classify the yellow-flowered blooms in the imagery. The equation for NDYI is provided in Table S4. We implemented an RF classification model on randomly split 80:20 ratio samples to segregate MEOF pixels from other pixels. We tuned the RF hyperparameters (mtry = 4, ntrees = 1500) to optimize model predictive performance, specifically by minimizing the Root Mean Square Error (RMSE) using 10-fold, 5-repeat cross-validation. We assessed model efficiency both visually, using green–green–blue false color composites, and quantitatively, by calculating Overall Accuracy and the Kappa coefficient (Landis and Koch, 1977). We converted the continuous RF predictions to binary presence/absence using a threshold of 0.5, assigning pixels with predicted probability ≥ 0.5 as MEOF presence (assigned as 1) and pixels < 0.5 as absence (assigned as 0) (Josso et al., 2023; Steen et al., 2021). We calculated the area-based weighted average of MEOF classified pixels from the total number of pixels within a 10m pixel to derive MEOF percent cover at 10 m resolution. The percent cover of MEOF within each 10 m resolution pixel was calculated as the proportion of classified MEOF pixels within that 10 m area.
We collected and averaged minimum of three field samples per 30 m × 30 m plot at each drone site in 2023. Overall, we had 30 observed percent cover samples collected across 14 drone sites. We employed a jackknife resampling procedure using leave-one-out cross-validation to calibrate RF classification-derived percent cover estimates of MEOF against field-observed percent cover values. For each iteration, one observation was excluded from the dataset, and a linear regression model was fitted using the remaining field samples. The excluded field observation was then predicted using the fitted model, based solely on its derived cover value. This process was repeated for all observations, resulting in a set of cross-validated predictions for the entire dataset. Calibration accuracy was assessed by comparing predicted and observed values using root mean square error (RMSE) and the correlation coefficient of determination (R2). We used linear regression to calibrate RF-derived percent cover estimates because it provides a simple and transparent way to correct systematic biases. To ensure unbiased predictions and minimize overfitting, we applied a leave-one-out jackknife procedure, where each observation was predicted independently of the data used to fit the model (Wolter, 2007). We then combined field and UAS-derived samples from 2016–2023, resulting in a total of 22 972 MEOF percent cover samples for the regional-scale regression analysis described in Sect. 2.6 and shown in Fig. 2.
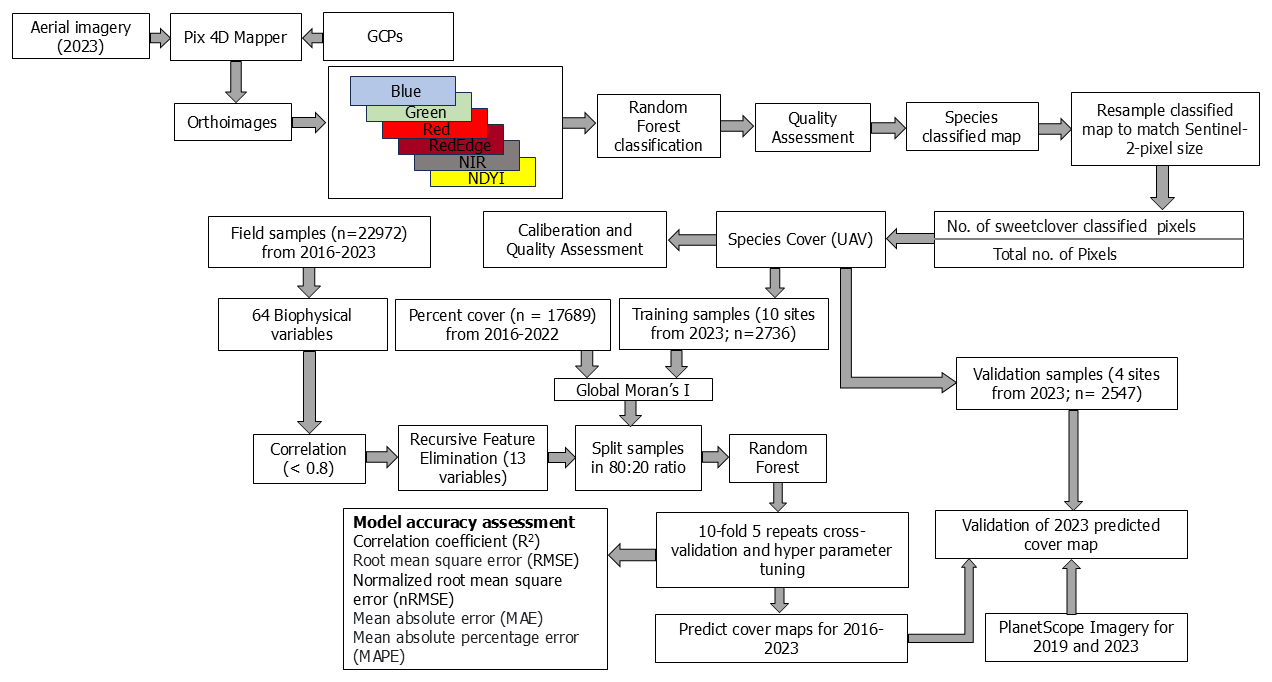
Figure 2Workflow to predict invasive yellow sweetclover percent cover at 10 m resolution using UAS and ancillary data for 2016–2023.
2.5 Satellite-derived predictor variables
We obtained 64 predictor variables with spatial resolutions ranging between 10 m and 1 km. We derived maximum value composites of various indices and tasseled caps for the peak summer months with a maximum of 10 % cloud cover to enhance the spectral information of the Sentinel 2A imagery (Table S4) (Gascon et al., 2017). We also derived the coefficient of variation (standard deviation/mean) composites to represent the variability of the indices or the tasseled cap components across the summer months. For variables affected by high cloud cover or limited image availability in the seasonal composites, we used the standard deviation as an alternative to the coefficient of variation.
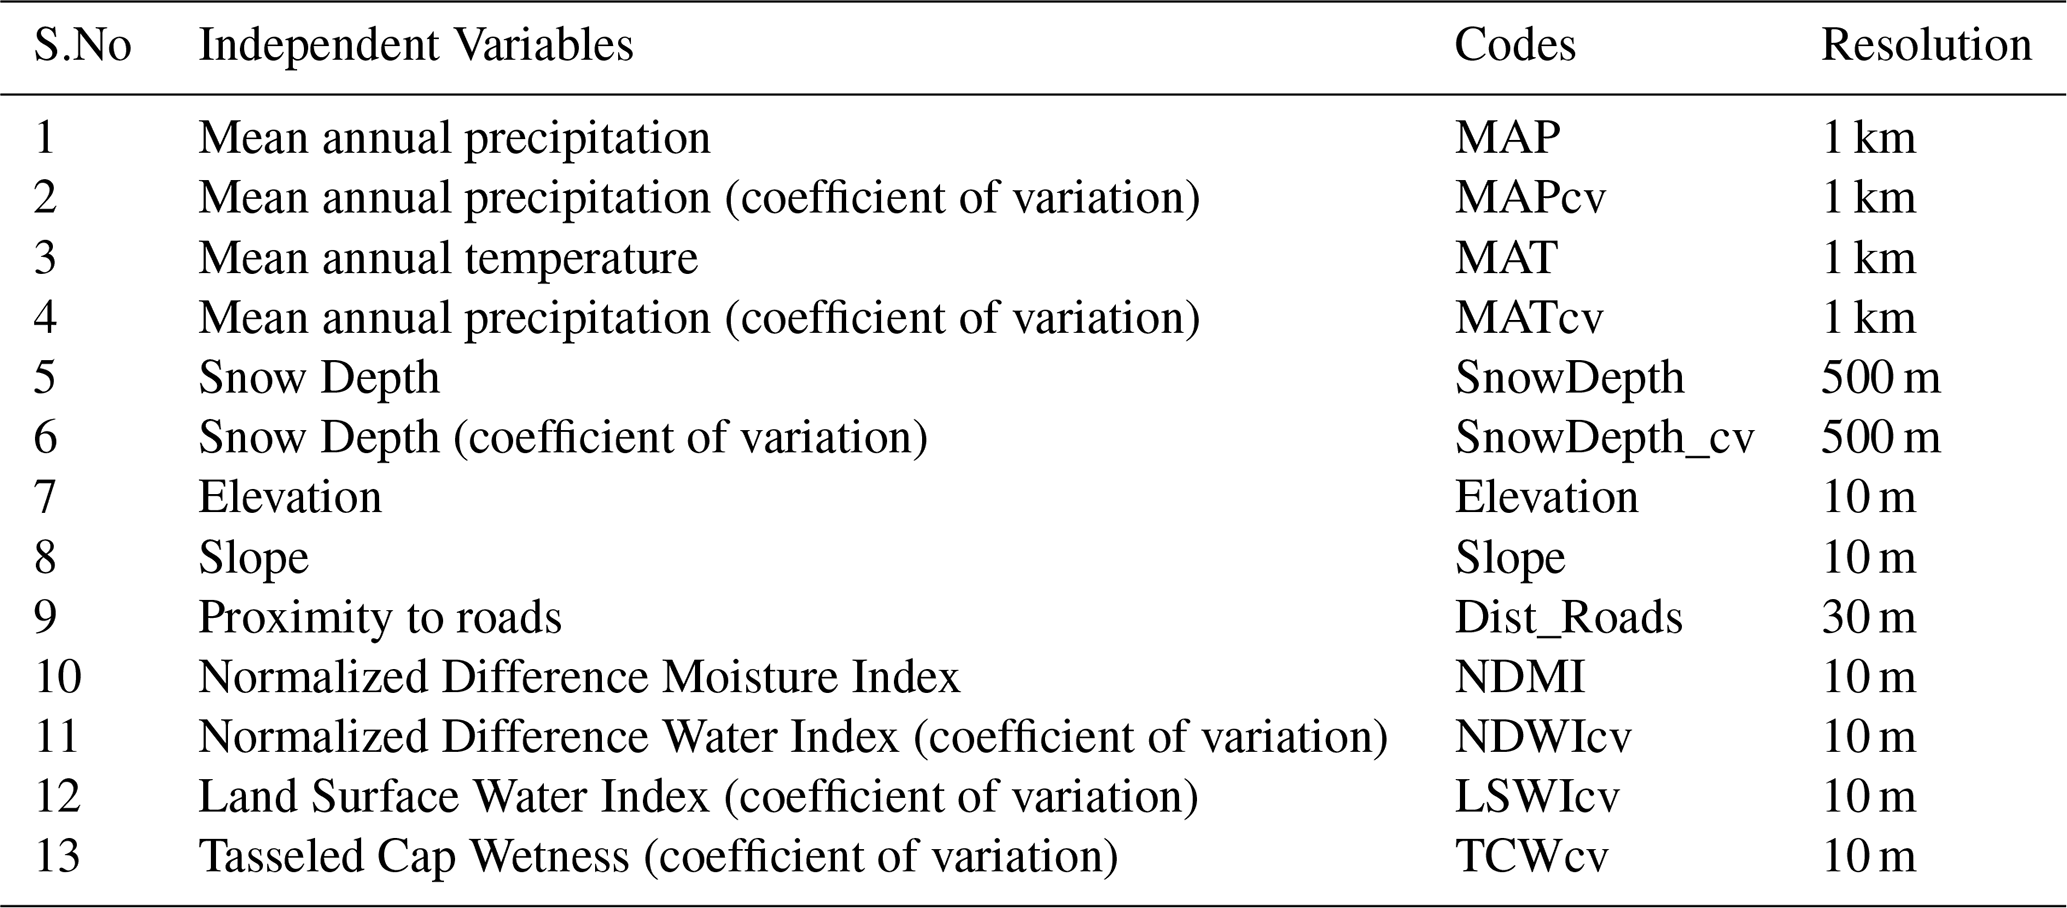
For climate predictors, we utilized the Daymet monthly and annual dataset (Version 4R1) available at 1 km spatial resolution (Thornton et al., 2022). From the monthly data, we calculated mean annual precipitation (MAP) as the sum of monthly precipitation values and mean annual temperature (MAT) as the average of the monthly mean temperatures for each year corresponding to the MEOF cover samples. To account for potential biennial effects, we also calculated biennial precipitation (MAP2) and biennial temperature (MAT2) by combining the values from the sample year with those of the preceding year (e.g., total precipitation across both years and average temperature across both years). We also computed seasonal composites of precipitation and mean temperature for each year separately corresponding to the MEOF cover samples, including spring (March–May; P_MAM and T_MAM) and summer (June–August; P_JJA and T_JJA).We acquired percent snow cover at 500m resolution from the MODerate resolution Imaging Spectroradiometer (MODIS) MOD10A1 V6.1 snow cover product (Hall et al., 2015). Snow depth and snow water equivalent were acquired at 1 km spatial resolution from NOAA National Weather Service's SNOw Data Assimilation System (SNODAS) (Barrett, 2004). We computed mean composites for all snow variables during the winter (Dec-Feb).
For soil properties, we obtained soil pH, texture (sand, silt, clay, and bulk density), volumetric water content, saturated water content, and soil organic matter from the Polaris database (Chaney et al., 2019) available at 30 m resolution. We used the National Elevation Dataset from the NASA Earthdata portal available at 10 m resolution to derive elevation, slope, aspect, hillshade, terrain wetness index, and terrain roughness index. We used a land cover/use map to mask out non-rangeland areas before implementing the regression model to emphasize the habitat of MEOF in the western SD rangelands. The land cover/use data were derived at 30 m resolution from the 2019 National Land Cover Database (NLCD 2019, Dewitz, 2021). We also derived the distance to developed/urban areas, including non-primary roads as a proxy for proximity to roads. Lastly, the distance to stream product was derived from the national hydrography dataset developed by the U.S. Geological Survey National Geospatial Program. All the variables were acquired from the Google Earth Engine (GEE) platform and processed in ArcMap 10.8.1. All variables were resampled to 10 m resolution and projected in Albers Equal Area projection and WGS 84 datum. We used bilinear interpolation for predictor variables to preserve data integrity during resampling. A detailed summary of all the independent variables utilized in this study is provided in Table S5. The method workflow for predicting the invasive yellow sweetclover percent cover for 2016–2023 is illustrated in Fig. 2.
2.6 Regional MEOF cover regression model
We compiled a total of 22 972 MEOF percent cover samples for the regional-scale regression analysis. After removing duplicate records (samples from different sources falling within the same pixel and year), 20 275 unique samples remained. Most machine learning models such as RFs work on the assumption that the samples are independent and randomly distributed. If this assumption is violated due to spatial autocorrelation, model performance metrics (like accuracy, R2) can be overestimated (Liu et al., 2022). To deal with this issue, we calculated Global Moran's I with a minimum distance of 50 m on the MEOF percent cover samples to test for spatial autocorrelation between the samples within each year (Moran, 1950). We implemented permutation test for the samples to generate the null distribution and assess the significance of the Moran's I. A 50 m threshold is equivalent to five pixels which helps in mitigating the influence of immediate neighbors, which often exhibit strong spatial autocorrelation due to their proximity. By setting this distance, we aimed at reducing local clustering while ensuring a degree of spatial independence among samples, which is critical for robust estimation of global spatial autocorrelation. Similar buffer distances have been used in previous ecological studies to distinguish between fine-scale spatial dependence and broader spatial patterns, particularly in heterogeneous landscapes where plant cover could be spatially clustered at short ranges (Baumann et al., 2025). We removed the spatially correlated samples and later used 11 235 observed samples to develop a generalized percent cover regression model using the RF algorithm. We constructed a predictor variable database by extracting observed sample points from the satellite-derived predictor variables (rasters) for training the RF model. We implemented a spearman correlation coefficient (r) threshold of 0.8 to remove highly correlated predictor variables (Dubuis et al., 2011; Stohlgren et al., 2010; Zar, 2005). We then implemented a Recursive Feature Elimination (RFE) method with 5-repeat, 10-fold cross-validation to determine the top predicting variables (Breiman, 1984; Guyon et al., 2002). The observation samples were split in an 80:20 ratio for training and testing sets using the bootstrap method with replacement. All the variables were scaled and centered before the development of the prediction model. We implemented hyperparameter tuning (mtry and ntrees) and used the mean absolute error (MAE), mean absolute percentage error (MAPE), root mean square error (RMSE), and the coefficient of determination (R2) metrics to evaluate the model performance during the testing phase. The MEOF percent cover was predicted using the best generalized model and the best statistical metrics. We used the reference of the habitat suitability map from Saraf et al., (2023) to mask out the low probability of occurrence regions and to develop final MEOF prediction maps. All the analyses were performed using the “caret” package in the RStudio environment (Kuhn, 2015).
3.1 Yellow sweetclover cover from UAS imagery
We used 6000 training points to train and test an RF classification model by splitting them to an 80:20 ratio, obtaining 4795 training and 1205 testing samples. The developed RF classification model exhibited an overall accuracy of 98.76 % and kappa coefficient of 0.97 in distinguishing flowering MEOF pixels. The confusion matrix for the classification model is provided in Table S6. The RF classification accuracies can be visually validated in three representative UAS sites with MEOF blooms (Fig. 3). The estimated area covered with the classified MEOF presence pixels derived from the RF classification model can be found in Table S7. We generated 5283 percent cover samples from UAS, which were divided into 2736 samples for training sites and the remaining 2547 samples for validating the RF regression model. The samples were segregated based on ten training and four validation locations. We implemented the jackknifing to calibrate the derived MEOF cover. The cross-validated predictions showed good agreement with the field observed samples with the R2 of 0.68 and RMSE of 6.24 %, suggesting relatively low average prediction error.
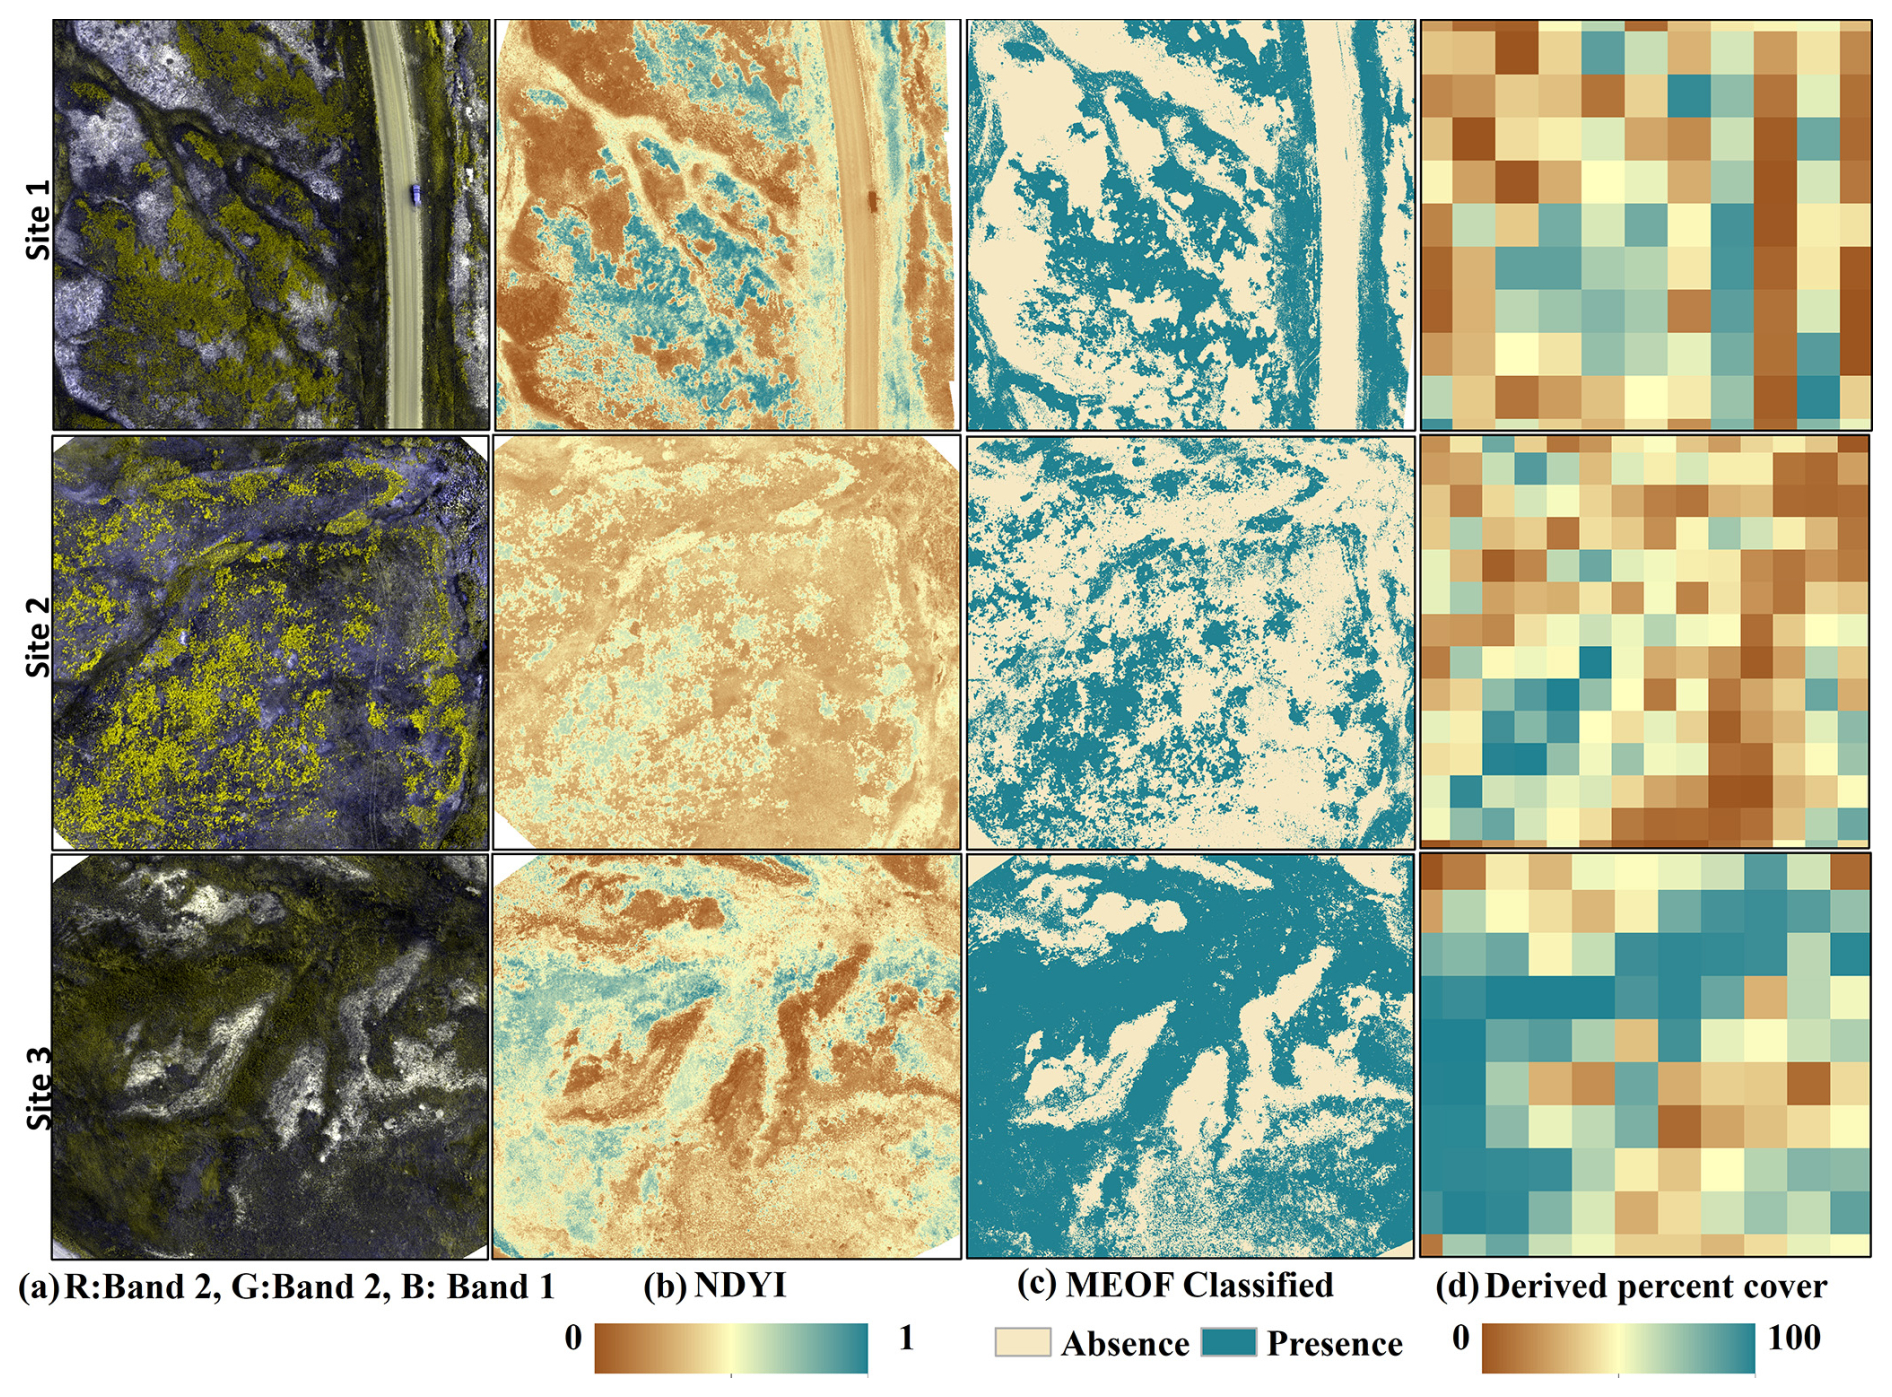
Figure 3Representative figures for three Unmanned Aerial Systems (UAS) sites with yellow sweetclover (MEOF) blooms (a) UAS orthoimages in green, green and blue band combination (b) Normalized Difference Yellowness Index (c) Random Forest classified image showing yellow sweetclover presence and absence (d) yellow sweetclover cover derived at 10 m pixel size.
3.2 Regional-scale Random Forest predictions of MEOF cover
We used the spearman correlation test (r) on all 64 independent variables with a threshold of 0.8 and selected 25 predictor variables (Fig. S1). We later implemented a recursive feature selection on the 25 predictor variables and selected the 13 top predictor variables. The top 13 predictor variables included climatic variables – mean annual precipitation (MAP), coefficient of variation of MAP (MAPcv), mean annual temperature (MAT), coefficient of variation of MAT (MATcv), snow depth (SnowDepth), and coefficient of variation of snow depth (SnowDepth_cv); topographic variables – elevation (Elevation) and slope (Slope); proximity to roads (Dist_Roads); and remote sensing indices capturing moisture and vegetation properties – Normalized Difference Moisture Index (NDMI), coefficient of variation of Normalized Difference Water Index (NDWIcv), coefficient of variation of Land Surface Water Index (LSWIcv), and coefficient of variation of Tasseled Cap Wetness (TCWcv; Table 2).We took the threshold of 0.3 for Moran's I to reduce the positive spatial autocorrelation among the samples. We used sampling with replacement to calculate the significance of the Moran's I. We found that all the years except 2019 and 2023 showed very low spatial autocorrelation with Moran's I of < 0.2 (Table S8). We reduced the spatially autocorrelated samples for 2019 and 2023 by selecting samples beyond a minimum distance of 50 m. Overall, we used a total of 11 235 training samples to develop an RF model to predict invasive MEOF cover across western SD. We used 80 % of these samples (9006 total) for training and 20 % (2229 total) for testing the model, with 3 mtry and 1500 ntrees as the optimized hyperparameters for the regression model. We noticed that the reduction in sample size had little-to-no effect on the model statistics and metrices. The developed RF model exhibited an R2 of 0.76, RMSE of 15.11, MAE of 10.95, and MAPE of 1.06 %. The predicted cover maps for 2019 and 2023 showed a relatively higher percent cover range than those for other years (Fig. S2). The temporal maps showed a higher cover of MEOF in the western counties compared to the eastern counties of western SD (Fig. 4). We also found that the western section of the study region, including Butte, Harding, Pennington, Custer, and Fall River counties, were the major hotspots for MEOF cover and showed persistent higher percent cover particularly in 2018, 2019 and 2023. This region tends to have a wider spread of high-density cover over the years. The hotspots were more evident in wet years especially along the floodplains of the Missouri River tributaries, as we move along the west-to-east gradient across western SD. Variable importance showed Normalized Difference Moisture Index (NDMI), proximity to roads (Dist_roads), variability in Normalized Difference Water Index (NDWIcv), and Elevation were the top contributing variables for predicting MEOF cover (Fig. S3).
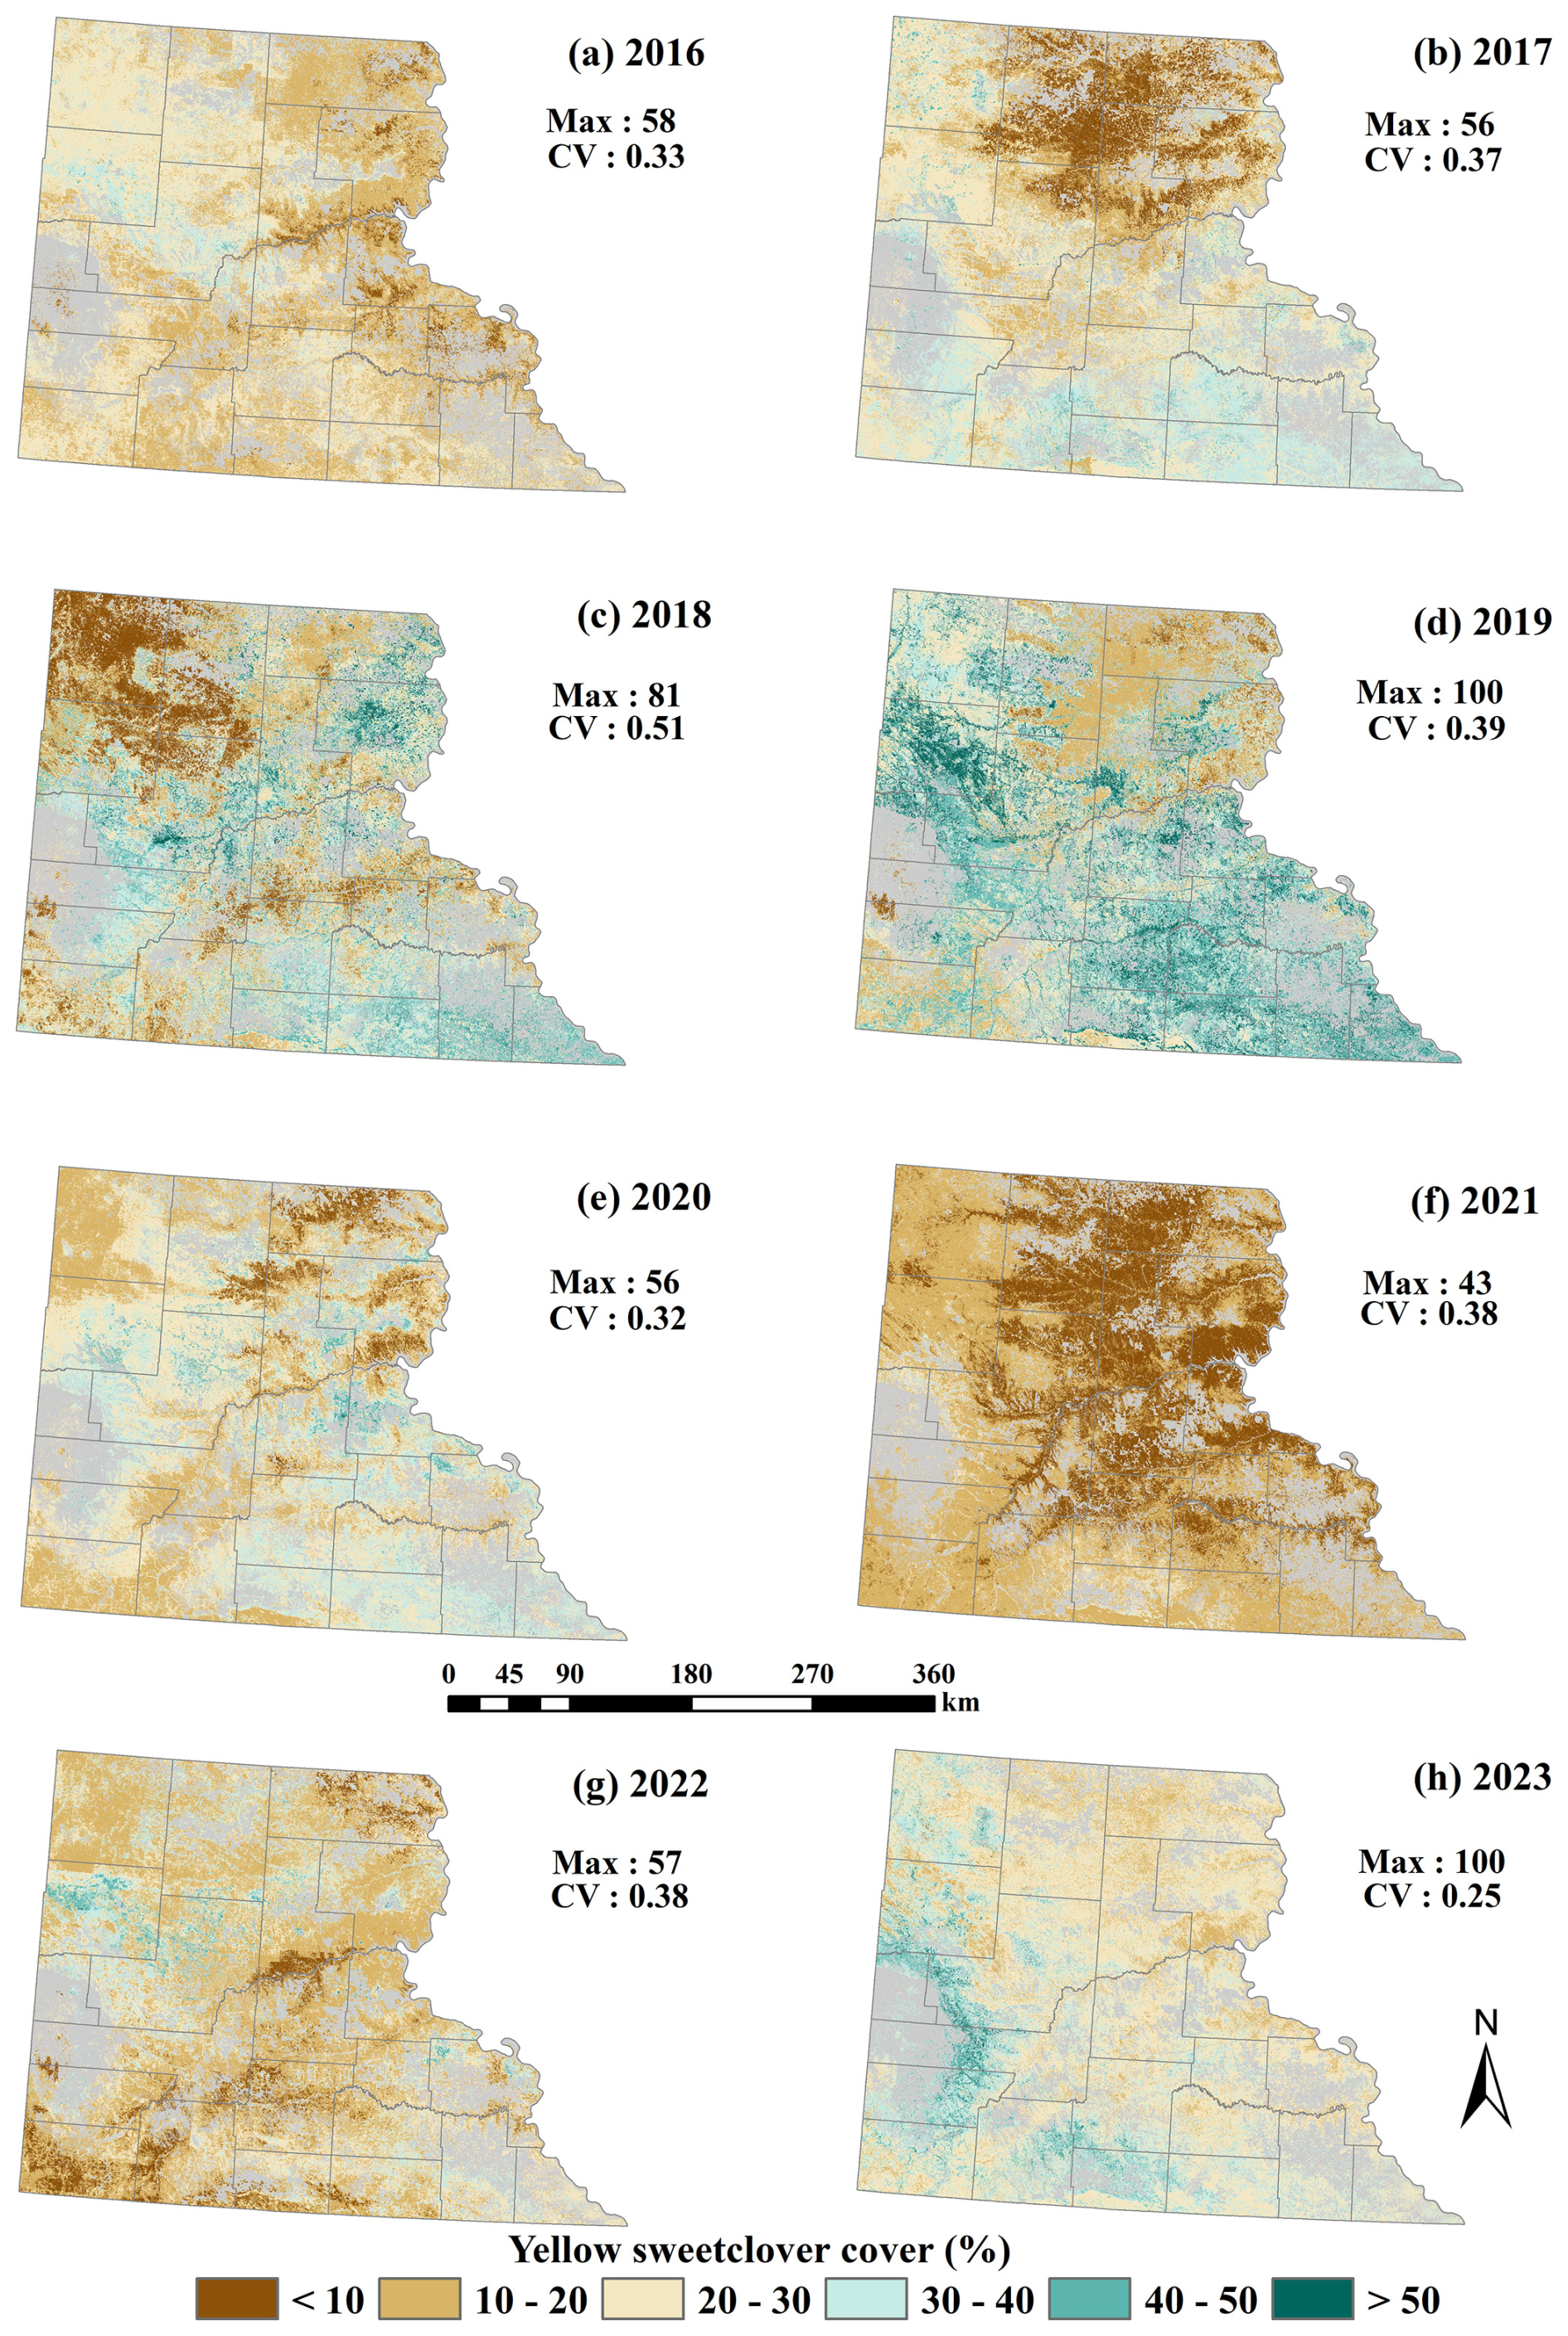
Figure 4Predicted yellow sweetclover distribution using a generalized Random Forest (RF) regression model for 2016–2023.
Table 2Description of 13 independent variables selected for estimating the yellow sweetclover cover (%).
We created a MEOF percent cover map series for 2016–2023 and compared it with precipitation anomaly maps to assess the potential relationship between MEOF cover and interannual climatic variability. These precipitation anomaly maps showed that the western SD witnessed above-average precipitation in a few regions for 2018 and 2023 and most of the western SD for 2019 (Fig. S4). The central and eastern counties in 2019 and the central and southern counties in 2023 showed a greater range of MEOF covers showing a consistent pattern of MEOF resurgence with the return of wet conditions. Despite 2016 being a relatively normal or slightly dry year, sweetclover cover remained moderate with less spatial variability, indicating less widespread establishment. The widespread establishment of MEOF could be seen increasing in 2018, with a high Coefficient of Variation (CV) of 0.5 and the percent cover reached a peak in the subsequent year of 2019. For the years 2020, 2021 and 2022, most regions experienced average to below-average rainfall conditions. During these years, the MEOF percent cover reached up to 50 %, with a sharp drop in percent cover in 2021, where the maximum cover was only 43 %. This showed drought conditions likely limit growth and establishment. The year 2020 and 2022 acted as transitional years, possibly due to lagged ecological response. For dry years, the majority of western SD predicted less than 50 % cover.
Overall, we found a high percent cover range in the western counties of western SD including Butte, Meade, Pennington, Custer, Fall River, Jackson, Bennet and Oglala Lakota counties. Central South Dakota counties showed fluctuating trends, with moderate to high coverage in some years (e.g., 2018, 2019, 2023) and relatively low coverage in other years (e.g., 2020, 2021), whereas the eastern counties (i.e., Corson, Dewey, and Stanley) consistently exhibited relatively low percent cover (< 20 %) for the majority of years. In the eastern region, MEOF appeared to be more scattered and patchier with fewer patches of higher percent cover near floodplains, which are situated at lower elevations and benefit from high moisture availability especially in the years 2018 and 2019. During the summer fieldwork of 2022, we observed MEOF predominantly in the first year of its life cycle. In the following year, we observed ample coverage of MEOF blooms in Butte County, SD forming patches substantial enough to be captured by the drones. This temporal pattern arises from the biennial growth period of MEOF. Additionally, we predicted MEOF percent cover estimates for the year 2024 using our trained model (Fig. S5). This 2024 prediction has been validated with the Planet imagery and is yet to be validated with the field samples. Validation of model performance for 2024 and subsequent years with PlanetScope imagery remains a key focus for future work.
Year-wise evaluation of model performance revealed considerable variation in normalized RMSE (nRMSE), which ranged from 0.12 in 2022 to 0.65 in 2023 (Table S9). The year-wise sample distribution of observed MEOF cover could be a partial reason for these differences. In 2018, the observed cover exhibited the greatest variability (CV = 0.51) and reached a maximum cover of 81 %. However, the nRMSE remained low (0.19), indicating that the model effectively captured patterns in years with a broader range of values. Conversely, 2023 exhibited the highest error (nRMSE = 0.657) despite having the 100 % maximum cover and the lowest variability (CV = 0.25). This high error occurred despite a relatively large sample size, likely due to spatial clustering and the reduced ability of the model to predict extreme cover values. Consequently, the model's capacity to generalize to high-cover conditions was restricted. Similarly, 2020 had a moderate maximum cover (56 %) but relatively high error (nRMSE = 0.55), which may reflect imbalances in sample distribution across cover classes. In contrast, the most optimal overall performance was achieved in 2022 (max = 57%, CV = 0.38) (nRMSE = 0.124), which implies that predictive accuracy is enhanced by balanced sampling across cover ranges. These results emphasize that the distribution and variability of cover values across years have a significant impact on predictive performance, although increasing the sample size improves model stability.
4.1 Significance of mapping MEOF superblooms
Our study offers a workflow for different plant species of annuals, biennials, or geophytes that share dominance during the bloom events, exhibiting huge blooms in specific years with differences of 4 to 10 weeks in their length and peak of the flowering period (Vidiella et al., 1999). These blooms cause a sudden increase in annual net primary production, triggering relevant changes in the ecosystem such as increases in soil nitrogen content due to N-fixation, temporary plant composition modifications, attraction of predators, etc. (Jaksic, 2001), as well as changes in the local climate: an increase in evapotranspiration and a decrease in albedo (He et al., 2017). Various bloom events in arid and semi-arid regions, such as rare blooms in the arid Atacama Desert or superblooms of wildflowers in California's southeastern deserts, have fascinated many researchers and media sources recently (Chávez et al., 2019; Martínez-Harms et al., 2022; Winkler and Brooks, 2020). Our workflow could be useful for detecting and monitoring such events, as well as for managing invasive plant species in grassland ecosystems. Effective management strategies can help mitigate the impact of these invasive species, promoting the health and resilience of grassland ecosystems.
The occurrence of sweetclover years is predominantly associated with wetter conditions, suggesting that precipitation plays a key role in the resurgence of MEOF (Gucker, 2009). Despite this, climate variables such as annual precipitation or snow depth, did not rank among the top predicting variables. This may be due to MEOF's biennial life cycle, where precipitation from the previous year can influence current-year cover (Klebesadel, 1992; Van Riper and Larson, 2009). We tested this by including biennial precipitation (MAP2). However, due to its high correlation with annual precipitation (MAP) and the higher relative importance of MAP, neither variable alone, at the coarser 1 km resolution, adequately captured the biennial dynamics. This unexpected result may be due to the large disparity in spatial resolution between Sentinel-derived variables at 10 m and the 1 km climate variables, which likely contributed to an underestimation of precipitation's importance in the model (Latimer et al., 2006). There is a possibility that MEOF blooms could be influenced not just by precipitation but also by local groundwater availability or soil moisture, particularly in areas near floodplains. While we observed some higher cover near floodplain regions in certain years, the pattern was not consistent across all years. Future analyses focusing on watersheds and hydrological variables could help clarify the environmental drivers of bloom events. Overall, our findings suggest that climate contributes to interannual variation in MEOF cover, while previous studies suggest that spatial heterogeneity and local environmental conditions further modulate vegetation dynamics across the Northern Great Plains (Fore, 2024).
Despite experiencing ample moisture in some areas in 2016 or 2018, the “sweetclover year” super blooms were limited only to 2019. This phenomenon may be attributed to MEOF's biennial life cycle, which plays a significant role and acts as a lag effect provided average or above average conditions persist (Van Riper and Larson, 2009). A distinct drop in coverage is seen in the years of 2020 and 2021 across the south, with a recovery in 2022–2023. Moreover, MEOF with > 40 % percent cover was found in mostly regions that received above-average precipitation during both dry and wet years, highlighting the importance of moisture in regulating dominance. This aligns with previous studies showing that sweetclover cover can fluctuate substantially from year to year, driven by its biennial growth habit and strong germination response in years with high precipitation (Turkington et al., 1978). Although the RF model did not identify precipitation as the top predictor, our predicted MEOF cover maps showed that years of high cover (e.g., 2018 and 2019) coincided with favorable moisture conditions, whereas lower cover in 2020–2021 corresponded with drier years. This pattern supports the hypothesis that `sweetclover years' of high MEOF abundance occur when favorable moisture conditions are maintained, allowing successful establishment and dominance despite losses from evapotranspiration. These favorable moisture conditions likely facilitate the successful establishment and dominance of MEOF across the Northern Great Plains rangelands, consistent with broader patterns observed for invasive species in semi-arid rangelands (Brooks et al., 2004; D'Antonio and Vitousek, 1992). Similar patterns have been observed for exotic annual grasses such as Cheatgrass (Bromus tectorum L.), Red brome (Bromus rubens L.) or Medusahead (Taeniatherum caput-medusae (L.) Nevski), which often increase under periods of favorable precipitation (Chen and Weber, 2014; Dahal et al., 2023).
The comprehensive database developed for the invasive MEOF provides a critical foundation for understanding its spatial-temporal invasion dynamics across western SD. The database facilitates detailed analyses of spread dynamics, invasion pathways, and distributional hotspots, thereby improving the ability to model present distribution patterns and project future range expansions under diverse environmental conditions. It also offers a valuable resource for long-term ecological monitoring and adaptive management of MEOF. Furthermore, the database supports investigation of the ecological consequences of MEOF invasion. For example, MEOF's nitrogen-fixing ability may alter soil nutrient dynamics, potentially facilitate its own dominance while affect native plant communities. Increased MEOF cover could lead to declines in native species richness, shifts in plant community composition, and changes in ecosystem processes such as nutrient cycling and primary productivity, particularly in nitrogen-limited prairie ecosystems. Understanding these impacts is critical for predicting long-term vegetation changes and developing targeted management strategies. Beyond immediate applications, this database contributes to a broader understanding of community-level vegetation changes driven by nitrogen-fixing invasive species in grassland environments.
4.2 Significance of predictor variables
The variable importance results for MEOF reveals that NDMI is the most influential predictor, indicating that soil and vegetation moisture play a crucial role in supporting its invasion and growth (Fig. S2). NDMI characterizes the water stress level in plants (Gao, 1996), which has been used to monitor drought stress and vegetation moisture content (Strashok et al., 2022). Proximity to roads (Dist_roads) emerged as the second most important predictor, explaining the higher cover of MEOF near the roads and its dispersion through road corridors, as MEOF was previously planted along roadsides for soil stabilization (Gucker, 2009). These findings align well with those of Wurtz et al. (2010) who showed that MEOF might have spread onto floodplains from roads, mines, and agricultural fields. This pattern is also consistent with our field survey plots, where a higher percent cover of MEOF was observed closer to roads compared to the interior of plots. Nevertheless, the importance of road proximity should be interpreted cautiously, as greater sampling accessibility near roads may have partially inflated its role in the model. We also found variability in Normalized Difference Water Index (NDWIcv) indicating areas with fluctuating surface water availability may create favourable conditions for MEOF establishment. Furthermore, most climatic variables, such as snow depth, variability in snow depth, mean annual precipitation and Temperature (MAP and MAT), and variability in mean annual precipitation (MAPcv), were found to be of relatively low importance, likely because of their coarser spatial resolutions (500 m and 1 km). Overall, our results suggest that local moisture dynamics, captured by NDMI and NDWIcv, and human disturbances, reflected by proximity to roads, are stronger determinants of MEOF distribution at fine spatial scales than coarser-resolution climatic variables (snow depth, MAP, MAT, and their variability). Although climate may establish broad-scale suitability, our data indicate that MEOF invasion patterns in western South Dakota are primarily influenced by local hydrological conditions and human-mediated dispersal.
4.3 MEOF cover in 2019
It is important to note that reducing the sample size from 22 972 to 11 235 due to high spatial correlation did not substantially affect model performance. However, in comparison to Saraf et al., (2023), a much larger overall sample size was required to improve predictive accuracy. We developed a single generalized RF model across all years (2016–2023) and applied it to predict MEOF cover annually. Thus, while temporal imbalance in samples (e.g., more samples from bloom years such as 2019 and 2023) influenced the overall distribution of training data, spatial balance and adequate coverage across the full percent cover range were the most critical factors for model accuracy. We found that increasing the sample size and ensuring a more balanced distribution significantly improved model performance, raising R2 from 0.55 (Saraf et al., 2023) to 0.76. RMSE increased from 7 % to 15 %, reflecting the inclusion of a wider range of percent cover values rather than insufficient sample size or overall imbalance. Saraf et al., (2023) reported that their model underestimated high percent cover due to a limited sample size (n = 1612). In contrast, our model utilized a larger and more evenly distributed sample (n= 11 235) across years, improving predictive accuracy and the representation of extreme cover values. These findings suggest that balanced sample sizes enhance both the predictive range and accuracy of RF models, although temporal imbalance in certain years may still influence RMSE and require further investigation. Moreover, it is noteworthy to highlight that it is difficult to fully stratify samples temporally for a biennial species like MEOF, which remains dormant during certain seasons and blooms only under specific environmental conditions.
Both predicted maps exhibited similar spatial patterns, with higher MEOF cover observed in the western SD counties, such as Butte and Pennington. However, our model predicted a full range of 0 %–100 % cover for 2019, in contrast to the limited range observed in Saraf et al., (2023). This difference is particularly evident in the high MEOF probability areas of western SD rangelands, as shown in Fig. 5.
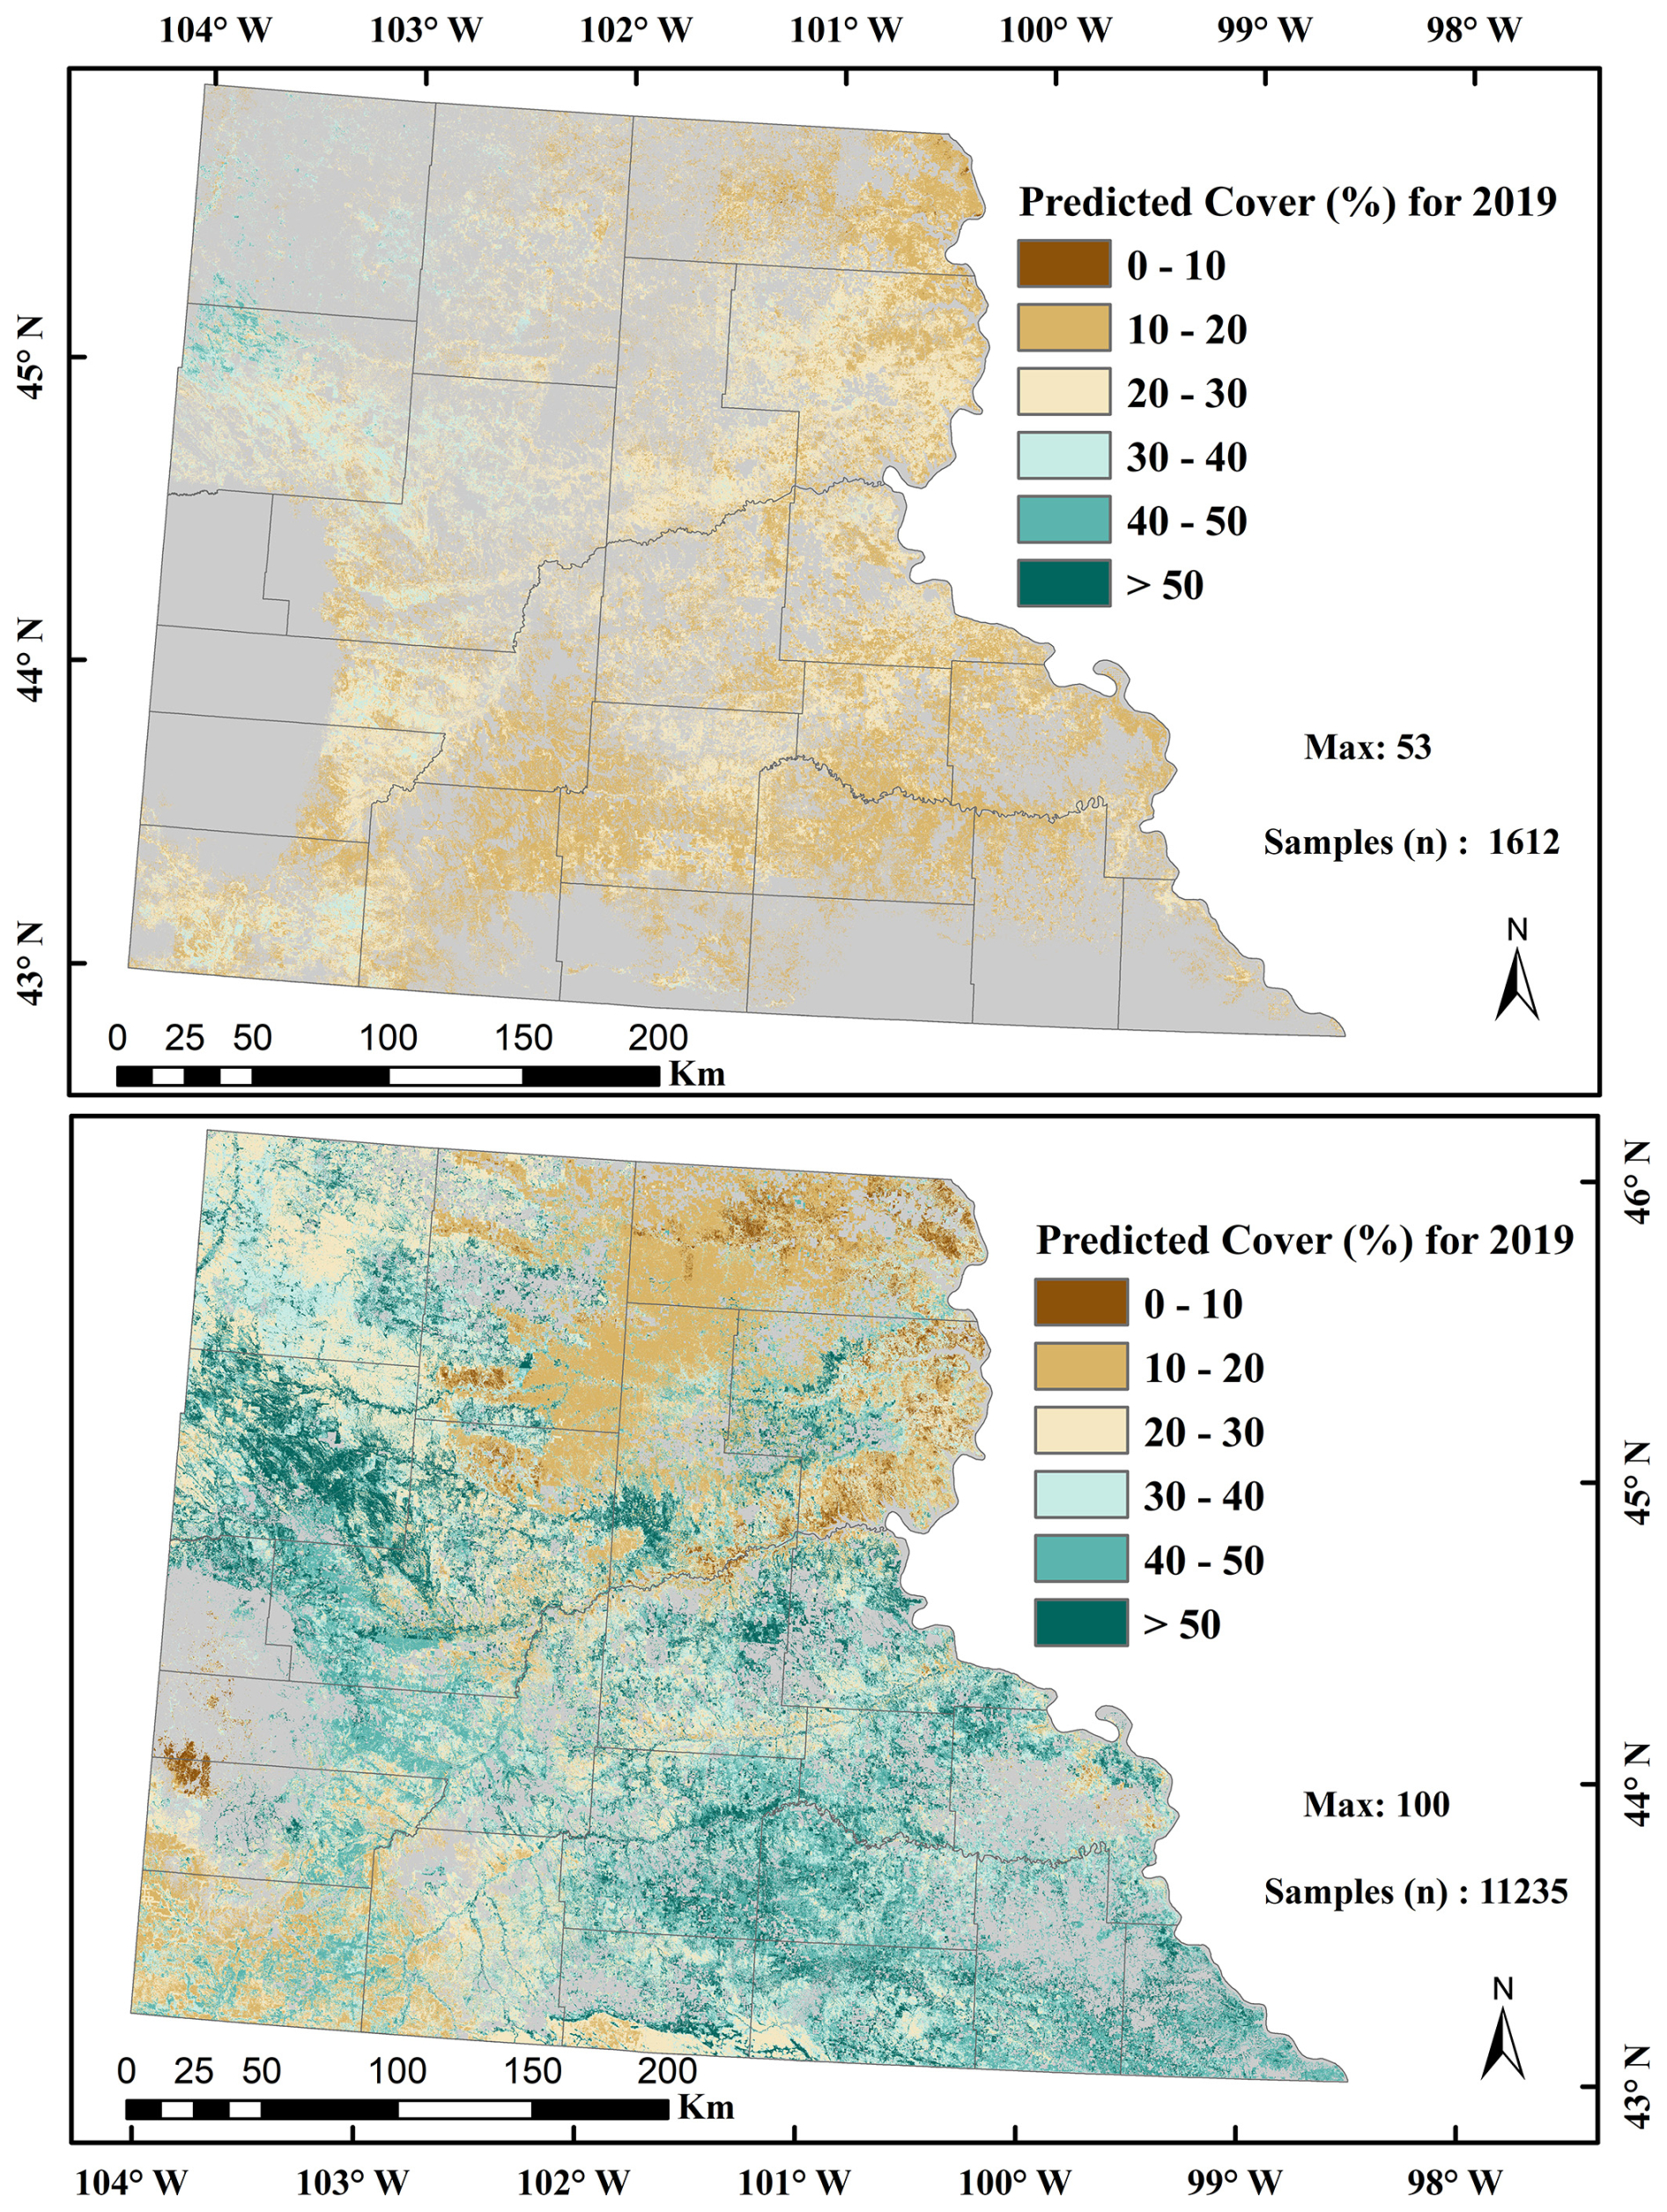
Figure 5Comparison of yellow sweetclover (Melilotus officinalis) cover in western South Dakota rangelands for 2019. (a) Percent cover estimates from Saraf et al. (2023) based on 1612 samples, showing areas with high probability of yellow sweetclover occurrence. (b) Predicted percent cover from the current study using 11 235 samples, highlighting the updated yellow sweetclover cover estimates compared with Saraf et al. (2023).
We conclude that Saraf et al. (2023) significantly underestimated the extent of high percent cover, reporting that areas with > 50 % MEOF cover constituted only about 0.76 % of SD's total rangelands. In contrast, our updated prediction model estimated that ∼ 12.6 % (10 256 km2) of the total rangeland area (81 442 km2) had > 50 % MEOF cover in 2019. The increase in sample size improved the model ability to predict a wider range of percent cover, providing a more accurate representation of the massive MEOF blooms across western SD in 2019.
4.4 Uncertainties
We manually delineated MEOF presence and absence polygons on the UAS imagery, which were used to train and validate the RF classification model. The resulting classified image was then used to derive continuous, wall-to-wall fractional cover estimates across the UAV sites. We used these model-derived continuous MEOF cover values, rather than the manual polygons, for regression analyses in order to generate numerous spatially explicit cover samples and to capture gradients of invasion across the landscape. The UAS orthomosaics in a green-blue-blue band false color combination helped to delineate training polygons. This approach highlighted the potential of multi-spectral bands to easily detect MEOF patches. Furthermore, we randomly sampled 6000 pixels at 4–6 cm resolution corresponding to the presence and absence of the invasive MEOF. We anticipated that errors might occur during the manual delineation, although the RGB imagery employed in the study displayed the MEOF's characteristic features, such as color, canopy shape, and flowers. The reliability of visual delineation could be compromised in shaded areas. However, the RF classification could accurately distinguish most MEOF pixels from non-MEOF pixels with 98.6 %. Visual inspections revealed no discrepancies between the derived percent cover maps at 10 m resolution and submeter resolution MEOF classified maps. This result suggests that any alignment errors were likely minimal and did not significantly affect model accuracy at 10 m resolution especially after calibration of the derived percent cover. While these results are specific to our study area in the Northern Great Plains, the approach has broader implications. We also produced a predictive map for the year 2024 (Fig. S5) using the trained model. Assessing the accuracy of the 2024 predictions and extending validation to upcoming future years constitutes an important direction for continued research. Our workflow combined with high-resolution UAS imagery and machine learning can be adapted to other regions with similar vegetation structure and invasion dynamics, offering a scalable and efficient tool for detecting and mapping invasive biennials like MEOF across diverse rangeland ecosystems. Our approach of scaling UAS-derived observations to develop percent cover estimates at broader spatial scales is conceptually similar to Rigge et al. (2020), who demonstrated the utility of integrating high-resolution reference data to improve landscape-scale predictions of rangeland vegetation cover.
4.5 Validation for 2023 estimates
We validated the predicted MEOF cover maps using four independent UAS-validation sites. Predictions showed strong correlation with observed MEOF cover derived from UAS imagery, with an R2 of 0.71, RMSE of 17.81 %, MAE of 13.17 %, and MAPE of 4.89 % (Figs. 6, S6). The visual comparison of the predicted maps with UAS imagery at the four validation sites showed that the model generally captured the spatial patterns of MEOF cover. We found that the prediction model underestimated the high percent cover range and overestimated the low to no percent cover regions. In 2023, only 0.76 % (621.4 km2) of the total rangeland area (81 442 km2) showed cover exceeding 50 %, supporting field observations of widespread MEOF blooms in specific regions. The prominent yellow blooms of MEOF are readily visible in UAS and satellite imagery when found in adequately big clusters, hence supporting the reliability of the model predictions.
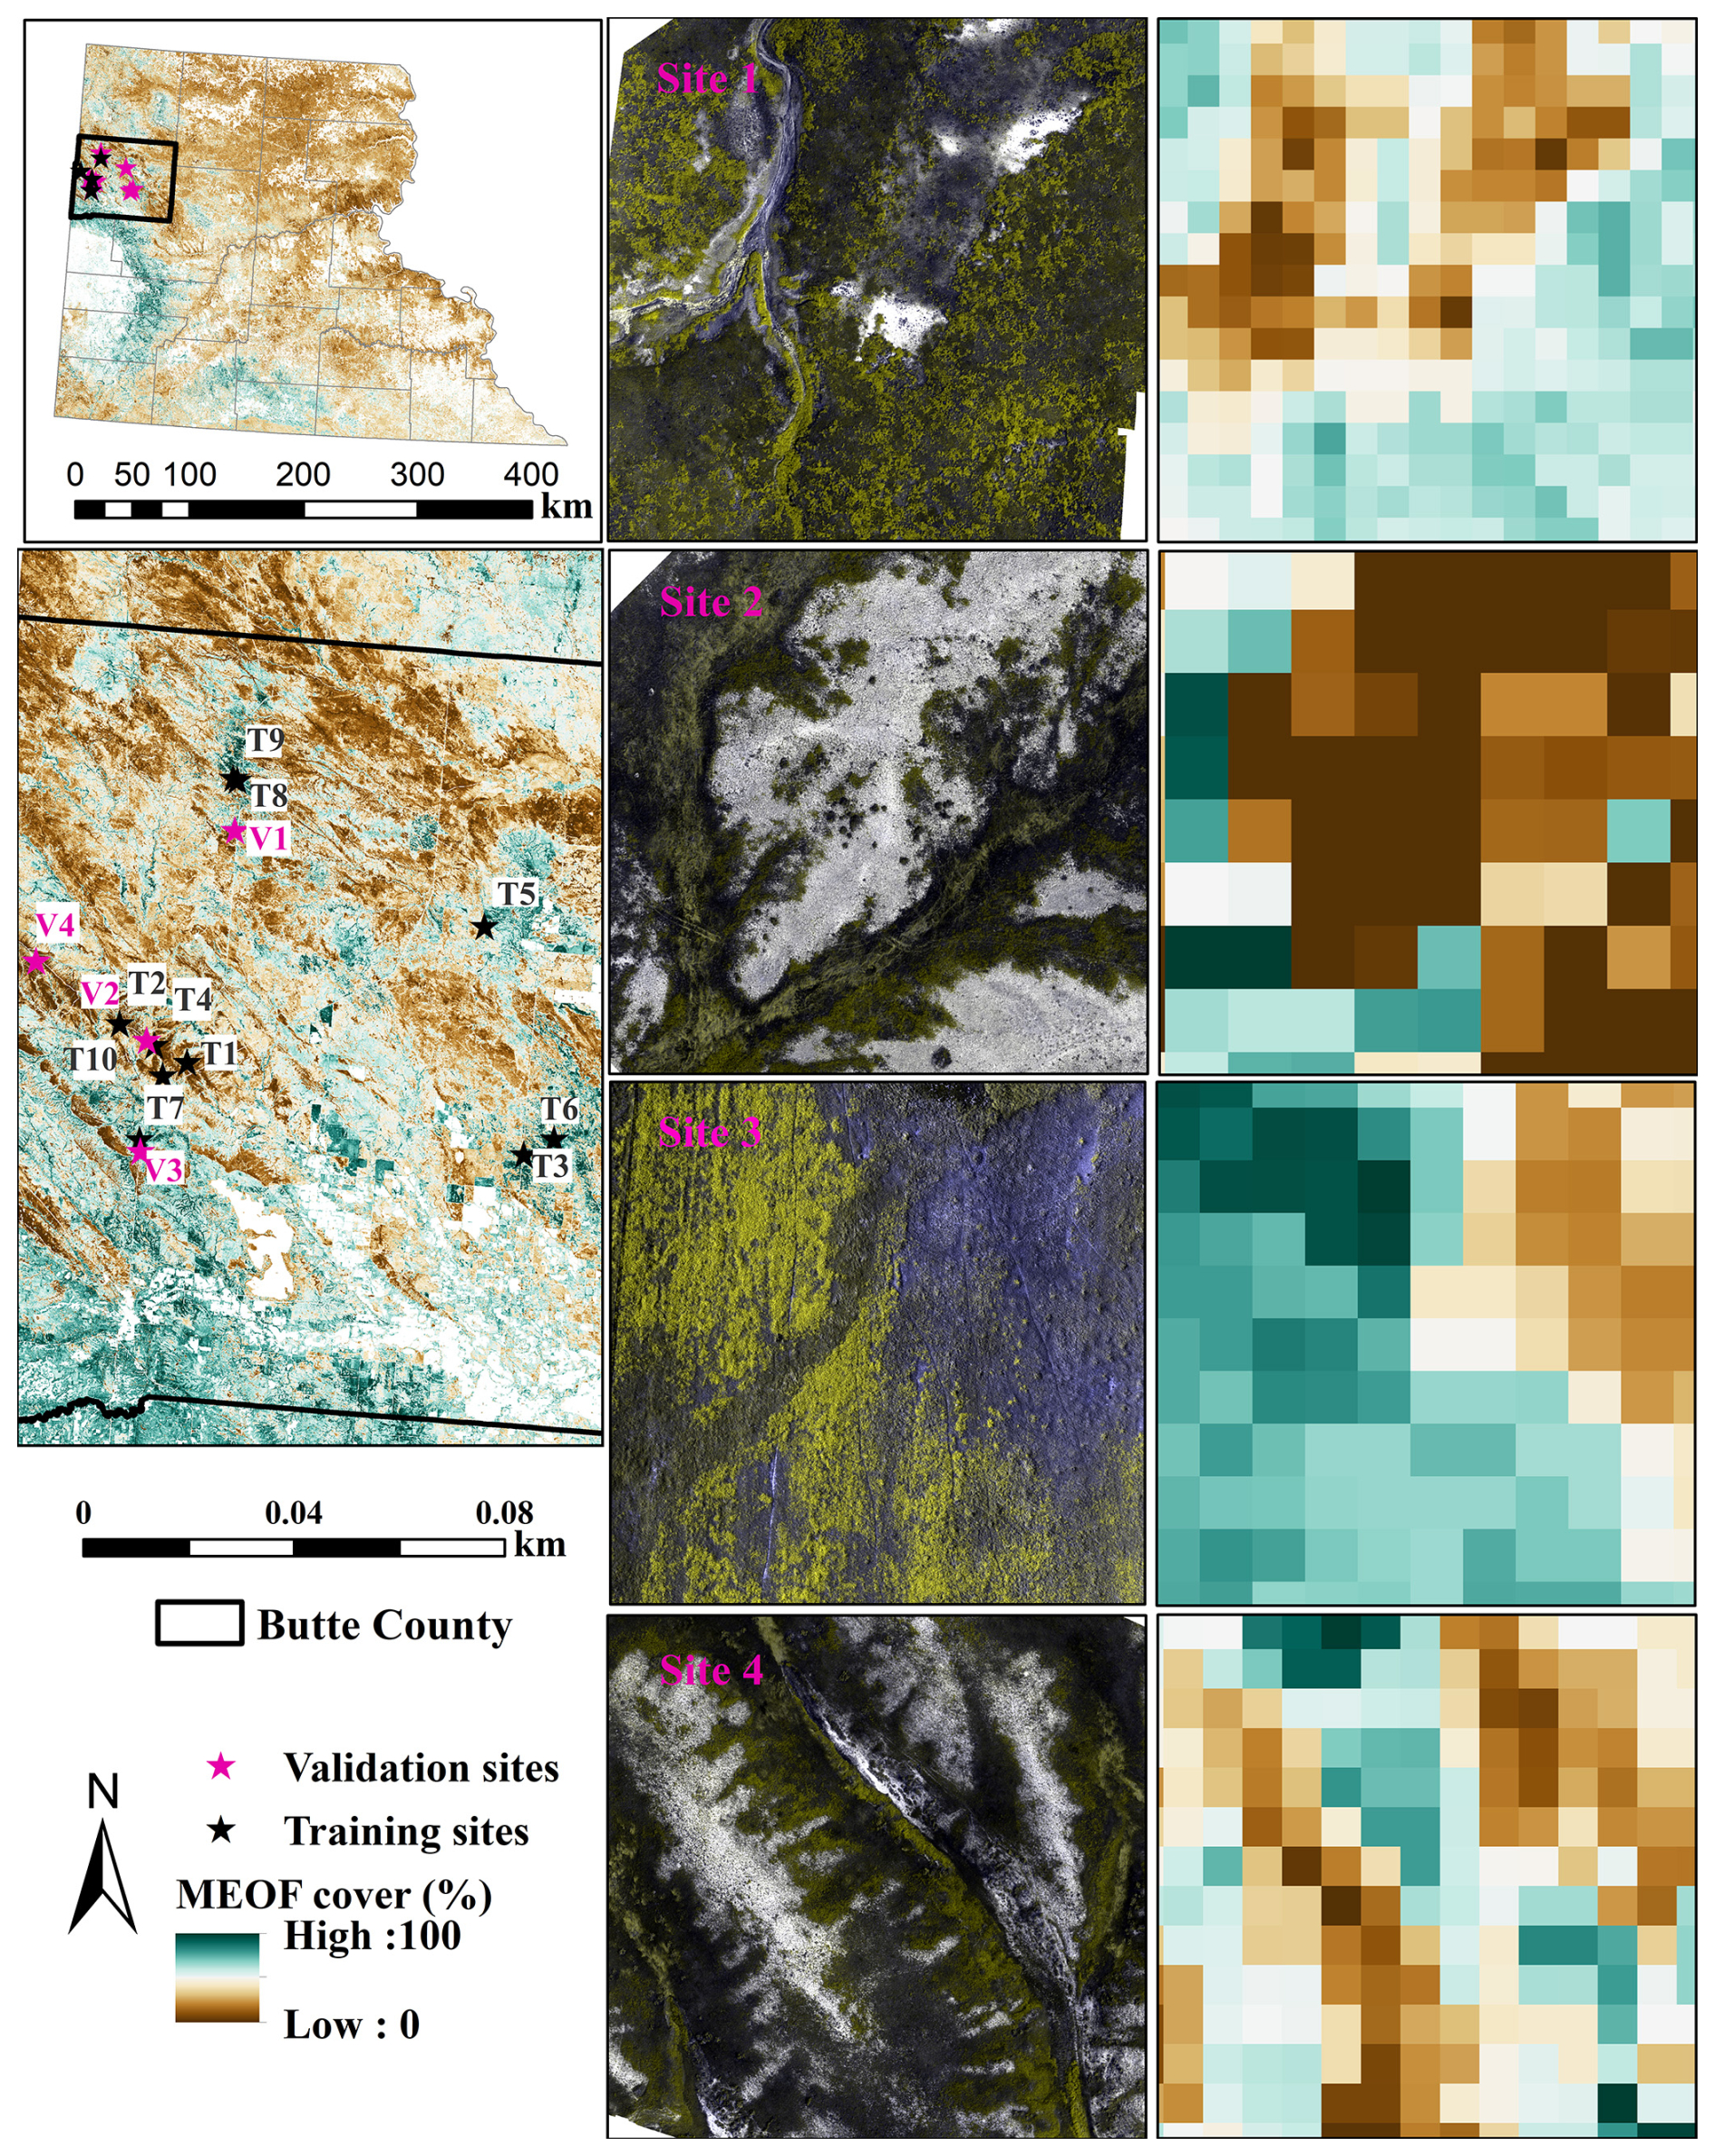
Figure 6Percent cover estimates for invasive yellow sweetclover for four independent UAS validation sites shown in green-green-blue false color combination to highlight yellow sweetclover blooms.
In addition to UAS validation, we used four-band (visible and near-infrared), 3 m resolution Dove Classic and SuperDove PlanetScope (PS) imagery for 2019 and 2023 through the NASA CSDA program (Planet Labs PBC, 2023) to further assess model predictions (Fig. 7). PS scenes were selected for locations with predicted high MEOF cover, and false-color combinations (green-green-blue) were applied to enhance visualization of MEOF blooms. These imagery data offered an independent and freely available means to complement the UAS-based validation by visually verifying the spatial patterns of predicted MEOF cover across sites where field data were unavailable. In general, the validation results indicate that the RF model effectively depicts spatial variation in MEOF cover throughout the study area, thereby providing a reliable foundation for evaluating invasion intensity on a landscape scale.
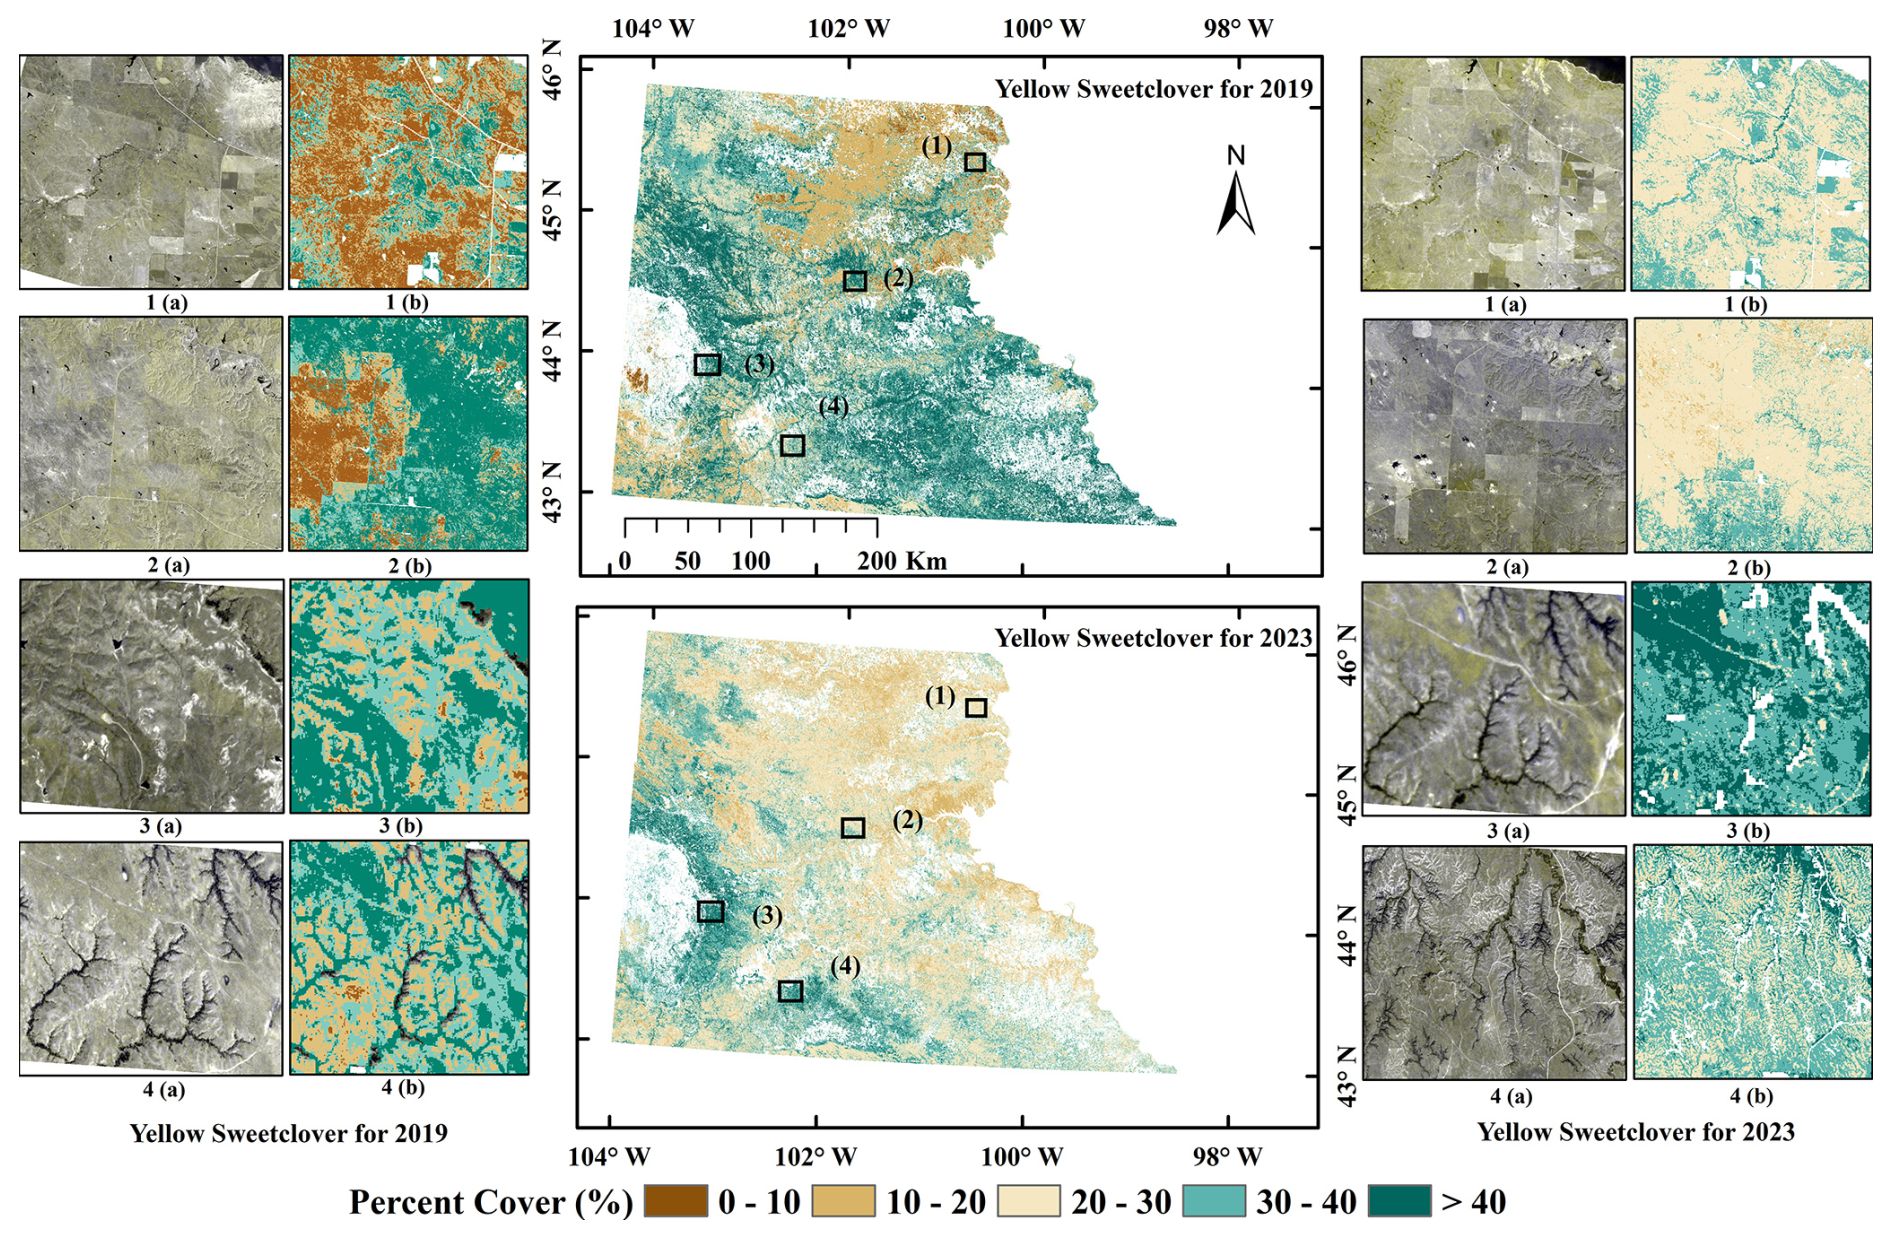
Figure 7Predicted percent cover estimates for invasive yellow sweetclover (MEOF) at four different sites represented with numbers for 2019 (left) and 2023 (right). In each site, (a) 3 m resolution PlanetScope imagery shown in green, green, and blue band combination to highlight yellow sweetclover blooms, and (b) fractional cover of MEOF. (PlanetScope imagery © Planet Labs PBC).
4.6 Limitations
Our model does not explicitly incorporate the biennial life cycle of MEOF; rather, we capture this variation indirectly by generating annual time-series maps (2016–2023) that reflect differences in cover between bloom and non-bloom years. Most of the observed MEOF cover samples were collected during the second year of its life cycle to enable capture of its flowering stage. The yellow sweetclover cover peaked during the wetter years (2019 and 2023) as shown in Fig. S3, and most of the sampling strength was obtained during these years (Table S1). We used the coefficient of variation to capture the temporal variation of the independent variables during summer (JJA). However, cloud cover of > 10 % in the region remained the major limitation of this study. Sentinel-2 data provides high temporal resolution, fast data provisioning, and computing infrastructure, making it easier for land managers to track invasive species in real-time. Our model demonstrated high variable importance of high-resolution variables performed better than climate variables due to their coarser resolution. This underperformance of coarser variables suggests the need for higher spatial resolution datasets in mapping invasive plant species. High-resolution mapping, even at Sentinel-2 (10 m) or PlanetScope (3 m) resolution, is complicated by the uneven spatial resolution of independent variables, making it more difficult to understand their relative roles in characterizing the niche of invasive species. Mapping at very high resolution, such as 3 m PlanetScope imagery, has its own limitations, including fewer spectral bands, lower radiometric calibration, and higher noise levels in vegetation indices, which can affect the accuracy of species-specific detection.
The developed invasive MEOF percent cover datasets are freely available at the figshare repository (Saraf et al., 2025) (https://doi.org/10.6084/m9.figshare.29270759.v1). The repository has two folders: the first folder named “resampled predicted cover maps” contains predicted percent cover maps of invasive yellow sweetclover resampled at 20 m resolution due to size limitations. We can provide the original 10 m resolution images upon request. Each file is saved in GeoTiff format in the Albers Conic Equal Area projection. Each file is saved with an acronym of `m' for MEOF followed by an underscore and a year. Missing data are represented by “No data”. The other folder named “sample_code_and_data” contains the R code and an exemplary sample data to predict the MEOF percent cover.
The codes used to produce the multitemporal MEOF maps are publicly available on figshare repository (Saraf et al., 2025) (https://doi.org/10.6084/m9.figshare.29270759.v1).
Our integrated approach combining high-resolution UAS imagery, RF classification and regression models, and multi-year satellite and climatic data enabled the effective mapping and monitoring of MEOF cover across western South Dakota. The models demonstrated strong performance with high accuracy in both classification and regression tasks, validating the use of drone-derived percent cover for landscape-scale predictions. The findings highlight the critical role of local moisture availability, proximity to roads, and surface water variability in driving MEOF invasion, while broader climatic variables played a comparatively limited role due to their coarser resolution. Temporal maps revealed that MEOF expansion is closely linked to wetter years, aligning with its biennial life cycle and reinforcing the concept of “sweetclover years”. The updated 2019 cover map was significantly improved from the previous estimates, capturing a broader percent cover range and representing invasion hotspots. Validation using 2023 UAS sites and PlanetScope imagery further confirmed the model's reliability. PlanetScope imagery provided an independent means to visually assess predicted MEOF cover in areas where drone data are unavailable and served as a complementary source of validation. Our study proposes a workflow of a generalized model that could be applicable to various plant species annuals, biennials, and geophytes that exhibit episodic dominance during bloom events. Our database on MEOF enables analysis of its invasion dynamics, supports predictive modeling of current and future distributions, and informs long-term monitoring and management. It also provides a foundation for assessing ecological impacts on native species and community composition in nitrogen-poor grasslands. Our study also provides a valuable tool for detecting and monitoring superbloom events and can support the management of invasive plant species such as MEOF in grassland ecosystems. Effective management strategies informed by these insights may help mitigate the ecological impacts of invasive species, thereby enhancing the health and resilience of grassland environments.
The supplement related to this article is available online at https://doi.org/10.5194/essd-18-655-2026-supplement.
SS – Conceptualization, Data Curation, Formal Analysis, Methodology, Software, Validation, Visualization, and Writing – original draft, review and editing. RJ – Funding acquisition, Project administration, Resources, Supervision, Conceptualization and Writing – review & editing. VK – Data Curation, Visualization, Software, Writing – review and editing. KJ – Data Curation. GH – Visualization, Writing – review and editing. JC – Writing – review and editing. RL - Writing – review and editing.
The contact author has declared that none of the authors has any competing interests.
Publisher's note: Copernicus Publications remains neutral with regard to jurisdictional claims made in the text, published maps, institutional affiliations, or any other geographical representation in this paper. While Copernicus Publications makes every effort to include appropriate place names, the final responsibility lies with the authors. Views expressed in the text are those of the authors and do not necessarily reflect the views of the publisher.
We thank all the institutes, organizations, and developers of the various datasets for making their products freely available. Our appreciation also goes to NASA Commercial SmallSat Data Acquisition (CSDA) program for providing us access with PlanetScope Imagery. We would also like to thank Michele Thornton for providing us Daymet data for 2024 way ahead of its release for us to predict MEOF percent cover for 2024. We acknowledge various funding sources including NSF EPSCoR RII: EPSCoR Research Fellows, SDBOR Competitive Research Grant, and the Cable Grant Fellowship, Department of Biology, University of South Dakota. We sincerely thank both anonymous referees for their constructive comments and suggestions, which greatly helped improve the quality of this manuscript.
This research has been supported by the Office of Integrative Activities (grant no. NSF RII Track 4: NSF222974), the National Aeronautics and Space Administration (grant no. 80NSSC20K0410), and the Established Program to Stimulate Competitive Research (grant no. NSF RII Track-2 FEC1632810).
This paper was edited by Christine I. B. Wallis and reviewed by two anonymous referees.
Agnew, W., Uresk, D. W., and Hansen, R. M.: Flora and Fauna Associated with Prairie Dog Colonies and Adjacent Ungrazed Mixed-grass Prairie in Western South Dakota, Journal of Range Management, 39, 135–139, https://doi.org/10.2307/3899285, 1986.
Alvarez-Taboada, F., Araújo-Paredes, C., and Julián-Pelaz, J.: Mapping of the Invasive Species Hakea sericea Using Unmanned Aerial Vehicle (UAV) and WorldView-2 Imagery and an Object-Oriented Approach, Remote Sens., 9, 913, https://doi.org/10.3390/rs9090913, 2017.
Baena, S., Moat, J., Whaley, O., and Boyd, D.: Identifying species from the air: UAVs and the very high resolution challenge for plant conservation, PLoS One, 12, e0188714, https://doi.org/10.1371/journal.pone.0188714, 2017.
Barrett, B.: Snow Data Assimilation System (SNODAS) Data Products at NSIDC, Version 1, Center, Natl. Oper. Hydrol. Remote Sens., https://doi.org/10.7265/N5TB14TC, 2004.
Baumann, E., Beierkuhnlein, C., Preitauer, A., Schmid, K., and Rudner, M.: Evaluating remote sensing data as a tool to minimize spatial autocorrelation in in-situ vegetation sampling, Erdkunde, 79, 25–40, https://doi.org/10.3112/erdkunde.2025.01.02, 2025.
Bernath-Plaisted, J. S., Ribic, C. A., Hills, W. B., Townsend, P. A., and Zuckerberg, B.: Microclimate complexity in temperate grasslands: implications for conservation and management under climate change, Environ. Res. Lett., 18, https://doi.org/10.1088/1748-9326/acd4d3, 2023.
Bradley, B. A.: Remote detection of invasive plants: a review of spectral, textural and phenological approaches, Biol. Invasions, 16, 1411–1425, https://doi.org/10.1007/s10530-013-0578-9, 2014.
Breiman, L., Friedman, J. H., Olshen, R. A., and Stone, C.: Classification And Regression Trees, Wadsworth International Group, Belmont, CA, USA, https://doi.org/10.1201/9781315139470, 1984.
Brooks, M. L., D'Antonio, C. M., Richardson, D. M., Grace, J. B., Keeley, J. E., DiTomaso, J. M., Hobbs, R. J., Pellant, M., and Pyke, D.: Effects of invasive alien plants on fire regimes, Bioscience, 54, 677–688, https://doi.org/10.1641/0006-3568(2004)054[0677:EOIAPO]2.0.CO;2, 2004.
Chaney, N. W., Minasny, B., Herman, J. D., Nauman, T. W., Brungard, C. W., Morgan, C. L. S., McBratney, A. B., Wood, E. F., and Yimam, Y.: POLARIS Soil Properties: 30-m Probabilistic Maps of Soil Properties Over the Contiguous United States, Water Resour. Res., 55, 2916–2938, https://doi.org/10.1029/2018WR022797, 2019.
Chávez, R. O., Moreira-Muñoz, A., Galleguillos, M., Olea, M., Aguayo, J., Latín, A., Aguilera-Betti, I., Muñoz, A. A., and Manríquez, H.: GIMMS NDVI time series reveal the extent, duration, and intensity of “blooming desert” events in the hyper-arid Atacama Desert, Northern Chile, Int. J. Appl. Earth Obs. Geoinf., 76, 193–203, https://doi.org/10.1016/j.jag.2018.11.013, 2019.
Chen, F. and Weber, K. T.: Assessing the impact of seasonal precipitation and temperature on vegetation in a grass-dominated rangeland, Rangel. J., 36, 185–190, 2014.
Cleland, E. E., Collins, S. L., Dickson, T. L., Farrer, E. C., Gross, K. L., Gherardi, L. A., Hallett, L. M., Hobbs, R. J., Hsu, J. S., Turnbull, L., and Suding, K. N.: Sensitivity of grassland plant community composition to spatial vs. temporal variation in precipitation, Ecology, 94, 1687–1696, https://doi.org/10.1890/12-1006.1, 2013.
Colomina, I. and Molina, P.: Unmanned aerial systems for photogrammetry and remote sensing: A review, ISPRS J. Photogramm. Remote Sens., 92, 79–97, https://doi.org/10.1016/j.isprsjprs.2014.02.013, 2014.
D'Antonio, C. M. and Vitousek, P. M.: Biological Invasions by Exotic Grasses, the Grass/Fire Cycle, and Global Change, Annu. Rev. Ecol. Syst., 23, 63–87, 1992.
Dahal, D., Boyte, S. P., and Oimoen, M. J.: Predicting Exotic Annual Grass Abundance in Rangelands of the Western United States Using Various Precipitation Scenarios, Rangel. Ecol. Manag., 90, 221–230, https://doi.org/10.1016/j.rama.2023.04.011, 2023.
Dewitz, J.: National Land Cover Database (NLCD) 2019 Products, US Geol. Surv. Sioux Falls, SD, USA, https://doi.org/10.5066/P9KZCM54, 2021.
Dubuis, A., Pottier, J., Rion, V., Pellissier, L., Theurillat, J. P., and Guisan, A.: Predicting spatial patterns of plant species richness: A comparison of direct macroecological and species stacking modelling approaches, Divers. Distrib., 17, 1122–1131, https://doi.org/10.1111/j.1472-4642.2011.00792.x, 2011.
Fore, S. R.: The Impact of Land Use and Land Cover Change on Vegetation, Ecosystem Dynamics, and Conservation in the Northern Great Plains, The University of North Dakota PP – United States – North Dakota, United States – North Dakota, 493 pp., https://commons.und.edu/theses/ (last access: 3 December 2024), 2024.
Gao, B.: NDWI – A normalized difference water index for remote sensing of vegetation liquid water from space, Remote Sens. Environ., 58, 257–266, https://doi.org/10.1016/S0034-4257(96)00067-3, 1996.
Gascon, F., Bouzinac, C., Thépaut, O., Jung, M., Francesconi, B., Louis, J., Lonjou, V., Lafrance, B., Massera, S., Gaudel-Vacaresse, A., Languille, F., Alhammoud, B., Viallefont, F., Pflug, B., Bieniarz, J., Clerc, S., Pessiot, L., Trémas, T., Cadau, E., De Bonis, R., Isola, C., Martimort, P., and Fernandez, V.: Copernicus Sentinel-2A calibration and products validation status, Remote Sens., 9, https://doi.org/10.3390/rs9060584, 2017.
Gaskin, J. F., Espeland, E., Johnson, C. D., Larson, D. L., Mangold, J. M., McGee, R. A., Milner, C., Paudel, S., Pearson, D. E., Perkins, L. B., Prosser, C. W., Runyon, J. B., Sing, S. E., Sylvain, Z. A., Symstad, A. J., and Tekiela, D. R.: Managing invasive plants on Great Plains grasslands: A discussion of current challenges, Rangel. Ecol. Manag., 78, 235–249, https://doi.org/10.1016/j.rama.2020.04.003, 2021.
Gränzig, T., Fassnacht, F. E., Kleinschmit, B., and Förster, M.: Mapping the fractional coverage of the invasive shrub Ulex europaeus with multi-temporal Sentinel-2 imagery utilizing UAV orthoimages and a new spatial optimization approach, Int. J. Appl. Earth Obs. Geoinf., 96, https://doi.org/10.1016/j.jag.2020.102281, 2021.
Gucker, C. L.: Melilotus alba, M. officinalis, U.S. Dep. Agric. For. Serv. Rocky Mt. Res. Station. Fire Sci. Lab., https://www.fs.usda.gov/database/feis/plants/forb/melspp/all.html (last access: 3 January 2026), 2009.
Guyon, I., Weston, J., Barnhill, S., and Vapnik, V.: Gene Selection for Cancer Classification using Support Vector Machines, Mach. Learn., 46, 389–422, https://doi.org/10.1023/A:1012487302797, 2002.
Hall, D. K., Riggs, G. A., and Román, M. O: MODIS snow products collection 6 user guide, National Snow and Ice Data Center (NSIDC), Boulder, CO, USA, 66 pp., https://nsidc.org/data/mod10a1/versions/6 (last access: 3 January 2026), 2015.
He, B., Huang, L., Liu, J., Wang, H., Lű, A., Jiang, W., and Chen, Z.: The observed cooling effect of desert blooms based on high-resolution Moderate Resolution Imaging Spectroradiometer products, Earth Sp. Sci., 4, 247–256, https://doi.org/10.1002/2016EA000238, 2017.
Hendrickson, J. R., Sedivec, K. K., Toledo, D., and Printz, J.: Challenges Facing Grasslands inthe Northern Great Plains and North Central Region, Rangelands, 41, 23–29, https://doi.org/10.1016/j.rala.2018.11.002, 2019.
Horstrand, P., Guerra, R., Rodríguez, A., Díaz, M., López, S., and López, J. F.: A UAV Platform Based on a Hyperspectral Sensor for Image Capturing and On-Board Processing, IEEE Access, 7, 66919–66938, https://doi.org/10.1109/ACCESS.2019.2913957, 2019.
Jaksic, F. M.: Ecological effects of El Niño in terrestrial ecosystems of western South America, Ecography (Cop.), 24, 241–250, https://doi.org/10.1111/j.1600-0587.2001.tb00196.x, 2001.
John, R., Chen, J., Giannico, V., Park, H., Xiao, J., Shirkey, G., Ouyang, Z., Shao, C., Lafortezza, R., and Qi, J.: Grassland canopy cover and aboveground biomass in Mongolia and Inner Mongolia: Spatiotemporal estimates and controlling factors, Remote Sens. Environ., 213, 34–48, https://doi.org/10.1016/j.rse.2018.05.002, 2018.
Johnson, J. R. and Larson, G. E.: Grassland plants of South Dakota and the Northern Great Plains, Research Bulletin 764, South Dakota Agricultural Experiment Station, South Dakota State University, Brookings, SD, USA, 764 pp., https://openprairie.sdstate.edu/agexperimentsta_bulletins/764/ (last access: 3 January 2026), 1999.
Josso, P., Hall, A., Williams, C., Le Bas, T., Lusty, P., and Murton, B.: Application of random-forest machine learning algorithm for mineral predictive mapping of Fe-Mn crusts in the World Ocean, Ore Geol. Rev., 162, 105671, https://doi.org/10.1016/j.oregeorev.2023.105671, 2023.
Jurjević, L., Gašparović, M., Milas, A. S., and Balenović, I.: Impact of UAS Image Orientation on Accuracy of Forest Inventory Attributes, Remote Sens., 12, https://doi.org/10.3390/rs12030404, 2020.
Kan, H., Teng, W., Chen, C., Zhang, G., and Pang, Z.: Establishment of alien invasive plant, yellow sweet clover (Melilotus officinalis) at a complex ecosystem distributed with farmlands and wasted lands, Research Square [preprint], https://doi.org/10.21203/rs.3.rs-2933552/v1, 2023.
Kattenborn, T., Lopatin, J., Förster, M., Braun, A. C., and Fassnacht, F. E.: UAV data as alternative to field sampling to map woody invasive species based on combined Sentinel-1 and Sentinel-2 data, Remote Sens. Environ., 227, 61–73, https://doi.org/10.1016/j.rse.2019.03.025, 2019.
Klebesadel, L. J.: Extreme Northern Acclimatization in Biennial Yellow Sweetclover (Melilotus officinalis) at the Arctic Circle, School of Agriculture and Land Resources Management, Agricultural and Forestry Experiment Station Bulletin, School of Agriculture and Land Resources Management, University of Alaska Fairbanks, Fairbanks, AK, USA, https://scholarworks.alaska.edu/handle/11122/7819 (last access: 3 January 2026), 1992.
Kuhn, M.: A Short Introduction to the caret Package, R Found. Stat. Comput., https://cran.r-project.org/web/packages/caret/vignettes/caret.html (last access: 3 January 2026), 2015.
Landis, J. R. and Koch, G. G.: The Measurement of Observer Agreement for Categorical Data, Biometrics, 33, 159, https://doi.org/10.2307/2529310, 1977.
Langholz, J.: Global Trends in Private Protected Areas and their Implications for the Northern Great Plains Source: Great Plains, Gt. Plains Res., 20, 9–16, 2010.
Larson, E. R., Graham, B. M., Achury, R., Coon, J. J., Daniels, M. K., Gambrell, D. K., Jonasen, K. L., King, G. D., LaRacuente, N., Perrin-Stowe, T. I. N., Reed, E. M., Rice, C. J., Ruzi, S. A., Thairu, M. W., Wilson, J. C., and Suarez, A. V: From eDNA to citizen science: emerging tools for the early detection of invasive species, Front. Ecol. Environ., 18, 194–202, https://doi.org/10.1002/fee.2162, 2020.
Latimer, A. M., Wu, S., Gelfand, A. E., and Silander Jr., J. A.: Building Statistical Models To Analyze Species Distributions, Ecol. Appl., 16, 33–50, https://doi.org/10.1890/04-0609, 2006.
Li, L.-Y. and Tsai, C.-C.: Accessing online learning material: Quantitative behavior patterns and their effects on motivation and learning performance, Comput. Educ., 114, https://doi.org/10.1016/j.compedu.2017.07.007, 2017.
Liu, X., Kounadi, O., and Zurita-Milla, R.: Incorporating Spatial Autocorrelation in Machine Learning Models Using Spatial Lag and Eigenvector Spatial Filtering Features, Journal of Geo-Information, 11, 242, https://doi.org/10.3390/ijgi11040242, 2022.
Luo, K., Jahufer, M. Z. Z., Wu, F., Di, H., Zhang, D., Meng, X., Zhang, J., and Wang, Y.: Genotypie variation in a breeding population of yellow sweet clover (Melilotus officinalis), Front. Plant Sci., 7, 1–10, https://doi.org/10.3389/fpls.2016.00972, 2016.
Martínez-Harms, J., Guerrero, P., Martinez-Harms, M., Poblete, N., González, K., Stavenga, D., and Vorobyev, M.: Mechanisms of flower coloring and eco-evolutionary implications of massive blooming events in the Atacama Desert, Front. Ecol. Evol., 10, https://doi.org/10.3389/fevo.2022.957318, 2022.
Martins, J., Richardson, D. M., Henriques, R., Marchante, E., Marchante, H., Alves, P., Gaertner, M., Honrado, J. P., and Vicente, J. R.: A multi-scale modelling framework to guide management of plant invasions in a transboundary context, For. Ecosyst., 3, https://doi.org/10.1186/s40663-016-0073-8, 2016.
Mayr, S., Kuenzer, C., Gessner, U., Klein, I., and Rutzinger, M.: Validation of Earth Observation Time-Series: A Review for Large-Area and Temporally Dense Land Surface Products, Remote Sens., 11, 2616, https://doi.org/10.3390/rs11222616, 2019.
MicaSense Inc.: RedEdge-MX Multispectral Camera, https://micasense.com/rededge-mx/ (last access: 15 August 2025), 2015.
Moran, P. A. P.: Notes on Continuous Stochastic Phenomena, Biometrika, 37, 17–29, 1950.
Mouta, N., Silva, R., Pinto, E. M., Vaz, A. S., Alonso, J. M., Gonçalves, J. F., Honrado, J., and Vicente, J. R.: Sentinel-2 Time Series and Classifier Fusion to Map an Aquatic Invasive Plant Species along a River – The Case of Water-Hyacinth, Remote Sens., 15, https://doi.org/10.3390/rs15133248, 2023.
Müllerová, J., Brůna, J., Bartaloš, T., Dvořák, P., Vítková, M., and Pyšek, P.: Timing Is Important: Unmanned Aircraft vs. Satellite Imagery in Plant Invasion Monitoring, Front. Plant Sci., 8, 1–13, https://doi.org/10.3389/fpls.2017.00887, 2017.
Owensby, C. E. and Launchbaugh, J. L.: Controlling prairie threeawn (Aristida oligantha Michx.) in central and eastern Kansas with fall burning, J. Range Manag., 30, 337–339, 1977.
Padró, J.-C., Muñoz, F.-J., Planas, J., and Pons, X.: Comparison of four UAV georeferencing methods for environmental monitoring purposes focusing on the combined use with airborne and satellite remote sensing platforms, Int. J. Appl. Earth Obs. Geoinf., 75, 130–140, https://doi.org/10.1016/j.jag.2018.10.018, 2019.
Paul, M., Rajib, A., and Ahiablame, L.: Spatial and Temporal Evaluation of Hydrological Response to Climate and Land Use Change in Three South Dakota Watersheds, JAWRA J. Am. Water Resour. Assoc., 53, https://doi.org/10.1111/1752-1688.12483, 2016.
Pix4D S.A.: Pix4Dmapper, Version 4.8, https://www.pix4d.com (last access: 3 January 2026), 2022.
Preston, T. M., Johnston, A. N., Ebenhoch, K. G., and Diehl, R. H.: Beyond presence mapping: predicting fractional cover of non-native vegetation in Sentinel-2 imagery using an ensemble of MaxEnt models, Remote Sens. Ecol. Conserv., 9, 512–526, https://doi.org/10.1002/rse2.325, 2023.
Rai, P. and Singh, J. S.: Invasive alien plant species: Their impact on environment, ecosystem services and human health, Ecol. Indic., 20 pp., https://doi.org/10.1016/j.ecolind.2019.106020, 2020.
Rakotoarivony, M. N. A., Gholizadeh, H., Hammond, W. M., Hassani, K., Joshi, O., Hamilton, R. G., Fuhlendorf, S. D., Trowbridge, A. M., and Adams, H. D.: Detecting the invasive Lespedeza cuneata in grasslands using commercial small satellite imagery, Int. J. Remote Sens., 44, 6802–6824, https://doi.org/10.1080/01431161.2023.2275321, 2023.
Reinhart, K. O., Rinella, M. J., Waterman, R. C., Petersen, M. K., and Vermeire, L. T.: Testing rangeland health theory in the Northern Great Plains, J. Appl. Ecol., 56, 319–329, 2019.
Rigge, M., Homer, C., Cleeves, L., Meyer, D. K., Bunde, B., Shi, H., Xian, G., Schell, S., and Bobo, M.: Quantifying Western U.S. Rangelands as Fractional Components with Multi-Resolution Remote Sensing and In Situ Data, Remote Sensing, 12, 412, https://doi.org/10.3390/rs12030412, 2020.
Sanderson, M., Liebig, M., Hendrickson, J. R., Kronberg, S., Toledo, D., Derner, J., and Reeves, J.: Long-term agroecosystem research on northern Great Plains mixed grass prairie near Mandan, North Dakota, Can. J. Plant Sci., 95, 150810114732003, https://doi.org/10.4141/CJPS-2015-117, 2015.
Saraf, S., John, R., Goljani Amirkhiz, R., Kolluru, V., Jain, K., Rigge, M., Giannico, V., Boyte, S., Chen, J., Henebry, G., Jarchow, M., and Lafortezza, R.: Biophysical drivers for predicting the distribution and abundance of invasive yellow sweetclover in the Northern Great Plains, Landsc. Ecol., 38, 1463–1479, https://doi.org/10.1007/s10980-023-01613-1, 2023.
Saraf, S., John, R., Kolluru, V., Jain, K., Henebry, G., Chen, J., and Lafortezza, R.: Spatiotemporal mapping of invasive yellow sweetclover blooms using Sentinel-2 and high-resolution drone imagery, figshare [code and data set], https://doi.org/10.6084/m9.figshare.29270759.v1, 2025.
Spiess, J., McGranahan, D., Geaumont, B., Sedivec, K., Lakey, M., Berti, M., Hovick, T., and Limb, R.: Patch-Burning Buffers Forage Resources and Livestock Performance to Mitigate Drought in the Northern Great Plains, Rangel. Ecol. Manag., 73, https://doi.org/10.1016/j.rama.2020.03.003, 2020.
Steen, V. A., Tingley, M. W., Paton, P. W. C., and Elphick, C. S.: Spatial thinning and class balancing: Key choices lead to variation in the performance of species distribution models with citizen science data, Methods Ecol. Evol., 12, 216–226, https://doi.org/10.1111/2041-210X.13525, 2021.
Stohlgren, T. J., Ma, P., Kumar, S., Rocca, M., Morisette, J. T., Jarnevich, C. S., and Benson, N.: Ensemble habitat mapping of invasive plant species, Risk Anal., 30, 224–235, https://doi.org/10.1111/j.1539-6924.2009.01343.x, 2010.
Strashok, O., Ziemiańska, M., and Strashok, V.: Evaluation and Correlation of Sentinel-2 NDVI and NDMI in Kyiv (2017–2021), J. Ecol. Eng., 23, 212–218, https://doi.org/10.12911/22998993/151884, 2022.
Sulik, J. J. and Long, D. S.: Spectral considerations for modeling yield of canola, Remote Sens. Environ., 184, 161–174, https://doi.org/10.1016/j.rse.2016.06.016, 2016.
Thornton, M. M., Shrestha, R., Wei, Y., Thornton, P. E., and Kao, S.-C.: Daymet: Monthly Climate Summaries on a 1-km Grid for North America, Version 4 R1, ORNL DAAC [data set], https://doi.org/10.3334/ORNLDAAC/2131, 2022.
Trimble Inc.: Trimble Catalyst DA2 GNSS receiver kit, Trimble Inc., Sunnyvale, CA, USA, https://geospatial.trimble.com/products-and-solutions/trimble-catalyst (last access: 23 August 2025), 2025.
Turkington, R. A., Cavers, P. B., and Rempel, E.: The Biology of Canadian Weeds.: 29. Melilotus alba Desr. and M. officinalis (L.) Lam., Can. J. Plant Sci., 58, 523–537, https://doi.org/10.4141/cjps78-078, 1978.
Turner, D. and Wallace, L.: Direct Georeferencing of Ultrahigh-Resolution UAV Imagery, IEEE Trans. Geosci. Remote Sens., 52, https://doi.org/10.1109/TGRS.2013.2265295, 2013.
Van Rees, C. B., Hand, B. K., Carter, S. C., Bargeron, C., Cline, T. J., Daniel, W., Ferrante, J. A., Gaddis, K., Hunter, M. E., Jarnevich, C. S., McGeoch, M. A., Morisette, J. T., Neilson, M. E., Roy, H. E., Rozance, M. A., Sepulveda, A., Wallace, R. D., Whited, D., Wilcox, T., Kimball, J. S., and Luikart, G.: A framework to integrate innovations in invasion science for proactive management, Biol. Rev., 97, 1712–1735, https://doi.org/10.1111/brv.12859, 2022.
Van Riper, L. C. and Larson, D. L.: Role of invasive Melilotus officinalis in two native plant communities, Plant Ecol., 200, 129–139, https://doi.org/10.1007/s11258-008-9438-6, 2009.
Varner, C.: Invasive Flora of the West Coast: British Columbia and the Pacific Northwest, University of Washington Press, Seattle, WA, USA, 224 pp., ISBN 13 978-0295750996, 2022.
Vidiella, P. E., Armesto, J. J., and Gutiérrez, J. R.: Vegetation changes and sequential flowering after rain in the southern Atacama Desert, J. Arid Environ., 43, 449–458, https://doi.org/10.1006/jare.1999.0565, 1999.
Winkler, D. E. and Brooks, E.: Tracing Extremes across Iconic Desert Landscapes: Socio-Ecological and Cultural Responses to Climate Change, Water Scarcity, and Wildflower Superblooms, Hum. Ecol., 48, 211–223, https://doi.org/10.1007/s10745-020-00145-5, 2020.
Wolf, J. J., Beatty, S. W., and Carey, G.: Invasion by Sweet Clover (Melilotus) in Montane Grasslands, Rocky Mountain National Park, Ann. Assoc. Am. Geogr., 93, 531–543, https://doi.org/10.1111/1467-8306.9303001, 2003.
Wolter, K. M.: The Jackknife Method BT – Introduction to Variance Estimation, edited by: Wolter, K. M., Springer, New York, New York, NY, 151–193, https://doi.org/10.1007/978-0-387-35099-8_4, 2007.
Wurtz, T. L., Macander, M. J., and Spellman, B. T.: Spread of Invasive Plants From Roads to River Systems in Alaska: A Network Model, U S For. Serv. Pacific Northwest Res. Stn. Gen. Tech. Rep. PNW-GTR, 699–708, https://www.fs.usda.gov/treesearch/pubs/37046 (last access: 3 January 2026), 2010.
Zar, J. H.: Spearman rank correlation, Encyclopedia of Biostatistics, edited by: Armitage, P. and Colton, T., Wiley, https://doi.org/10.1002/0470011815.b2a15075, 2005
Zhang, Z., Bao, T., Hautier, Y., Yang, J., Liu, Z., and Qing, H.: Microclimate complexity in temperate grasslands: implications for conservation and management under climate change, Ecol. Evol., 12, e9385, https://doi.org/10.1002/ece3.9385, 2022.