the Creative Commons Attribution 4.0 License.
the Creative Commons Attribution 4.0 License.
 | 04 Sep 2026
GloPINE dataset: model-ready measurements of INP concentrations using PINE instruments

Larissa Lacher
Alexander Böhmländer
Mark D. Tarn
Antoine Canzi
Aidan Pantoya
Evelyn Freney
Kristina Höhler
Pia Bogert
Céline Planche
Ping Tian
Michael Adams
Sarah Barr
David Brus
Nicole Büttner
Martin Daily
Konstantinos Doulgeris
Konstantinos Eleftheriadis
Grant Forster
Romy Fösig
Dimitrios G. Georgakopoulos
Maria I. Gini
A. Gannet Hallar
Radovan Krejci
Elke Ludewig
Mauro Mazzola
Ian B. McCubbin
Athanasios Nenes
Tuukka Petäjä
Joseph Robinson
Franziska Vogel
Paul Zieger
Stephen Arnold
Kenneth S. Carslaw
Naruki Hiranuma
Ottmar Möhler
Benjamin J. Murray
Ice-nucleating particles (INPs) are a subset of aerosol particles that facilitate the freezing of supercooled cloud droplets heterogeneously and influence the radiative properties of supercooled clouds. The role of INPs in the Earth system remains unquantified in part due to poorly constrained representations of their spatial distributions and properties in global and regional models. In this study, we present a quality controlled dataset (https://doi.org/10.5281/zenodo.16745514, Herbert et al., 2026), called GloPINE, comprising 70 000 h of INP concentrations measured using Portable Ice Nucleation Experiment (PINE) instruments that use an expansion chamber to make automated long-term (months to years) and high temporal resolution (<10 min). We collate measurements from 20 recent ground-based PINE field campaigns in the Northern Hemisphere conducted between January 2018 and December 2023, totaling more than 400 000 expansions, sampling over 800 m3 of ambient air, and performed under conditions relevant for mixed-phase clouds. In the GloPINE dataset, we subset and average the PINE measurements across synoptically relevant time intervals of 6 h and 2 K temperature bins, providing 36 000 INP measurements. Combining PINE expansions over these intervals enhances counting statistics at higher freezing temperatures, decreases the lower limit of measurable INP concentrations, and provides an INP dataset readily applicable to model simulation data and meteorological reanalysis products. Together with complementary INP datasets, GloPINE provides a valuable resource for advancing model evaluation, improving INP source attribution, and informing parameterizations across the full temperature range over which aerosols influence ice formation in clouds.
- Article
(2786 KB) - Full-text XML
- BibTeX
- EndNote


Aerosol particles play an important role in the Earth System. On relatively short timescales, they influence fluxes of radiation directly via aerosol extinction and indirectly via modification to cloud radiative properties (Carslaw, 2022). Aerosol particles can directly influence cloud properties by acting as cloud condensation nuclei (CCN), thus influencing the cloud droplet size distribution (e.g., Fanourgakis et al., 2019), and/or ice-nucleating particles (INPs), which induce primary ice production at supercooled temperatures (e.g., Murray et al., 2012). Anthropogenic activity has changed the concentrations and spatial distribution of aerosols, thereby modifying the properties of clouds and fluxes of radiation (Szopa et al., 2021). The radiative forcing associated with anthropogenic aerosols over the industrial era is estimated to be negative on the global scale (thus partially counteracting the warming due to greenhouse gases), but there is considerable uncertainty. The latest Intergovernmental Panel on Climate Change (IPCC) assessment report (Forster et al., 2021, AR6) estimates an effective radiative forcing of −1.3 W m−2 due to aerosol changes with an uncertainty range between −2.0 and −0.6 W m−2; Bellouin et al. (2020) estimate a similar range between −2.0 and −0.4 W m−2 (for the same confidence interval). The uncertainty range increases when viewed on regional scales (Szopa et al., 2021).
An important source of this uncertainty is associated with the physiochemical properties of each aerosol species that define its ability to act as a CCN or INP. INPs are a relatively rare subset of aerosols in the atmosphere (Murray et al., 2012; Kanji et al., 2017), yet they can have substantial impacts on cloud radiative properties over widespread regions (e.g., Murray et al., 2021; Vergara-Temprado et al., 2018; Hawker et al., 2021; Liu et al., 2012; Shi and Liu, 2019; Huang et al., 2025). Our current understanding from laboratory and modelling studies demonstrates that there are likely key aerosol species that drive the global distribution of INP availability. This includes mineral dust, organically enriched sea spray aerosol, primary biological aerosol particles (PBAPs; including pollen, fungal spores and bacteria), volcanic ash, and carbonaceous aerosol (Murray et al., 2012; Kanji et al., 2017; Hoose and Möhler, 2012). Due to the short-lived nature of these aerosol species and spatially and temporally variable emission fluxes, it is necessary to use global climate models to quantify the role of aerosols and INPs in the climate.
In situ INP observations are vital for testing the representation of INPs in global models. These are used to evaluate the model and identify biases in aerosol distributions and/or their ice-nucleating activity. For example, Chatziparaschos et al. (2025) used the BACCHUS (Impact of Biogenic versus Anthropogenic emissions on Clouds and Climate: towards a Holistic Under Standing) global INP observational dataset to evaluate their INP model and found evidence that PBAPs may play a more important role than previously thought. Herbert et al. (2025) used an alternative collection of observations to evaluate their INP model and identified a potential missing INP source from biogenic material associated with dust.
These datasets provide unequivocally important observational constraints, but have associated limitations. INP measurements have been made using a wide variety of instruments and methods, each with their own uncertainties and biases. This is well demonstrated by intercomparison studies for ambient air samples (DeMott et al., 2025; Lacher et al., 2024) and in laboratory based studies (DeMott et al., 2018; Wex et al., 2015; Hiranuma et al., 2015, 2019) that regularly report a variation of around an order of magnitude (or more) in measured INP concentrations. Field campaigns are also often restricted in the duration and temporal resolution of INP measurements, either due to methodological constraints (e.g., filter samples taken on daily timescales) or physical constraints (e.g., 2 h time series taken during a daytime research flight). In addition, in many campaigns, the duration of the deployment is typically on the order of days to weeks. This restricts model evaluation to daily or monthly mean comparisons, which is likely an inadequate test for a variable that can vary by several orders of magnitude during a single diurnal cycle in certain conditions (e.g., Canzi et al., 2025, Fig. 5a).
Recently, instruments for automated and continuous operation have been developed, including the Continuous Flow Diffusion Chamber – Ice Activation Spectrometer (CFDC-IAS; Bi et al., 2019), the automated Horizontal Ice Nucleation Chamber (HINC-Auto; Brunner and Kanji, 2021), and the Portable Ice Nucleation Experiment chamber (PINE; Möhler et al., 2021). These build upon previous instruments designed to make online in-situ measurements (e.g., Rogers et al., 2001; Kanji and Abbatt, 2009; Stetzer et al., 2008) with the additional capability of operating autonomously on long time scales (months to years) at relatively high temporal resolution (<15 min).
In this study, we present a new INP measurement dataset designed for model evaluation using one of these new instruments. We collate ground-based INP measurements made using PINE instruments that reproduce mixed-phase cloud conditions from 20 recent field campaigns, providing over 400 000 individual measurements sampled over 70 000 h. We subset and average these PINE measurements into regular 6 h time intervals (consistent with synoptic scale changes in meteorology) and 2 K temperature bins to provide a model-ready dataset, which we name the GloPINE INP dataset. The new dataset includes around 36 000 INP measurements above the lower limit of measurable concentration (non-zero) from across the Northern Hemisphere, with a mean campaign duration of 172 d (ranging from 16 to 804 d). The interval-averaged measurements span a range of concentrations from less than 0.01 L−1 to more than 1000 L−1 and temperatures between 240 and 263 K. In Sect. 2, we provide a brief description of the PINE instrument and relevant information for each of the 20 field campaigns. In Sect. 3, we describe and demonstrate the methodology for subsetting and averaging each time series. In Sect. 4, we introduce the GloPINE INP dataset and provide an outline of the data format and public access, and in Sect. 5, we conclude the study.
2.1 The PINE instrument
The mobile PINE cloud simulation chamber, described in full by Möhler et al. (2021), was designed to reproduce the conditions of an ascending air parcel cooling adiabatically. This is achieved through expansion cooling of a chamber using a mechanical pump thus reducing pressure, reducing temperature, and increasing relative humidity. The temperature of the walls of the chamber is controlled by a cooling system that is used to set the starting temperature of the chamber walls and thus the air temperature within the chamber (to a minimum of about 213 K) prior to expansion. Each PINE run includes three stages or modes: flush, expansion, and refill. In the flush mode, ambient air is drawn through the vessel at a flow rate around 2 L min−1. In the expansion mode, the inlet valve to the chamber is closed, whilst the outlet flow of air exiting the chamber is pumped at a rate of 3 to 4 L min−1, causing the air within the chamber to expand. Note that all flows and concentrations reported are at standard temperature and pressure. The expansion flow acts to reduce the temperature inside the chamber and increase relative humidity and continues to a predefined minimum pressure. The instrument is capable of reproducing conditions appropriate for homogeneous freezing and heterogeneous freezing through immersion, pore-condensation, and deposition modes. In this dataset, we focus on freezing via the immersion mode, which is the dominant pathway for primary ice production in mixed-phase clouds (Murray et al., 2012; de Boer et al., 2010; Westbrook and Illingworth, 2013). The humidity of the air being drawn into the chamber is controlled by two Nafion membrane diffusion dryers in parallel, which are set to keep the relative humidity high enough for cloud droplet formation to occur and low enough to avoid frost formation on the chamber walls. If excessive frost does form on the chamber walls, frost particles can become dislodged and counted as ice crystals by the optical particle counter (OPC). Regular zero checks are performed where HEPA filtered air is passed through the chamber (see Möhler et al., 2021, for details); the buildup of ice on the chamber walls is also avoided by regularly warming the chamber to remove any ice. The frequency with which the chamber is warmed varies between campaigns, depending on factors such as the humidity of ambient air and the flow rate through the dryers. Aerosols in the chamber can activate to cloud droplets once water saturation is exceeded, after which the droplets may freeze heterogeneously upon INPs present in the chamber. The hydrometeor size distribution (both liquid and ice) is measured with an OPC positioned downstream of the chamber in the pump line establishing the expansion flow; interstitial aerosols are too small to be counted as ice crystals. The PINE-01-A instrument uses a Palas GmbH welas 2500 OPC sensor, whilst all other instruments use a Palas GmbH fidas-pine OPC (see Table 1 for a list of instruments used in each campaign). Ice crystals are optically larger than cloud droplets and are distinguished using a size threshold that is determined by post-processing software (see Sect. 2.3). In the refill mode, the chamber is re-pressurized to the starting pressure at a controlled rate. The total time for each run is around 5 to 15 min and primarily determined by the time for the flush mode. The cumulative number of ice crystals (nice) measured by the OPC in the course of the expansion is used to calculate the cumulative concentration of INPs (NINP) per liter of sampled air by dividing nice by the total volume of air passing through the OPC detection volume. For the welas sensor (on PINE-01-A), this volume is 10 % of the total volume passing the OPC, whilst for the fidas-pine sensor (on all other PINEs), this volume is equal to the total volume passing the OPC. For additional details on the design and operating procedure of PINE see Möhler et al. (2021) and Büttner et al. (2026); typical output for a PINE expansion can be seen in Möhler et al. (2021, Fig. 3).
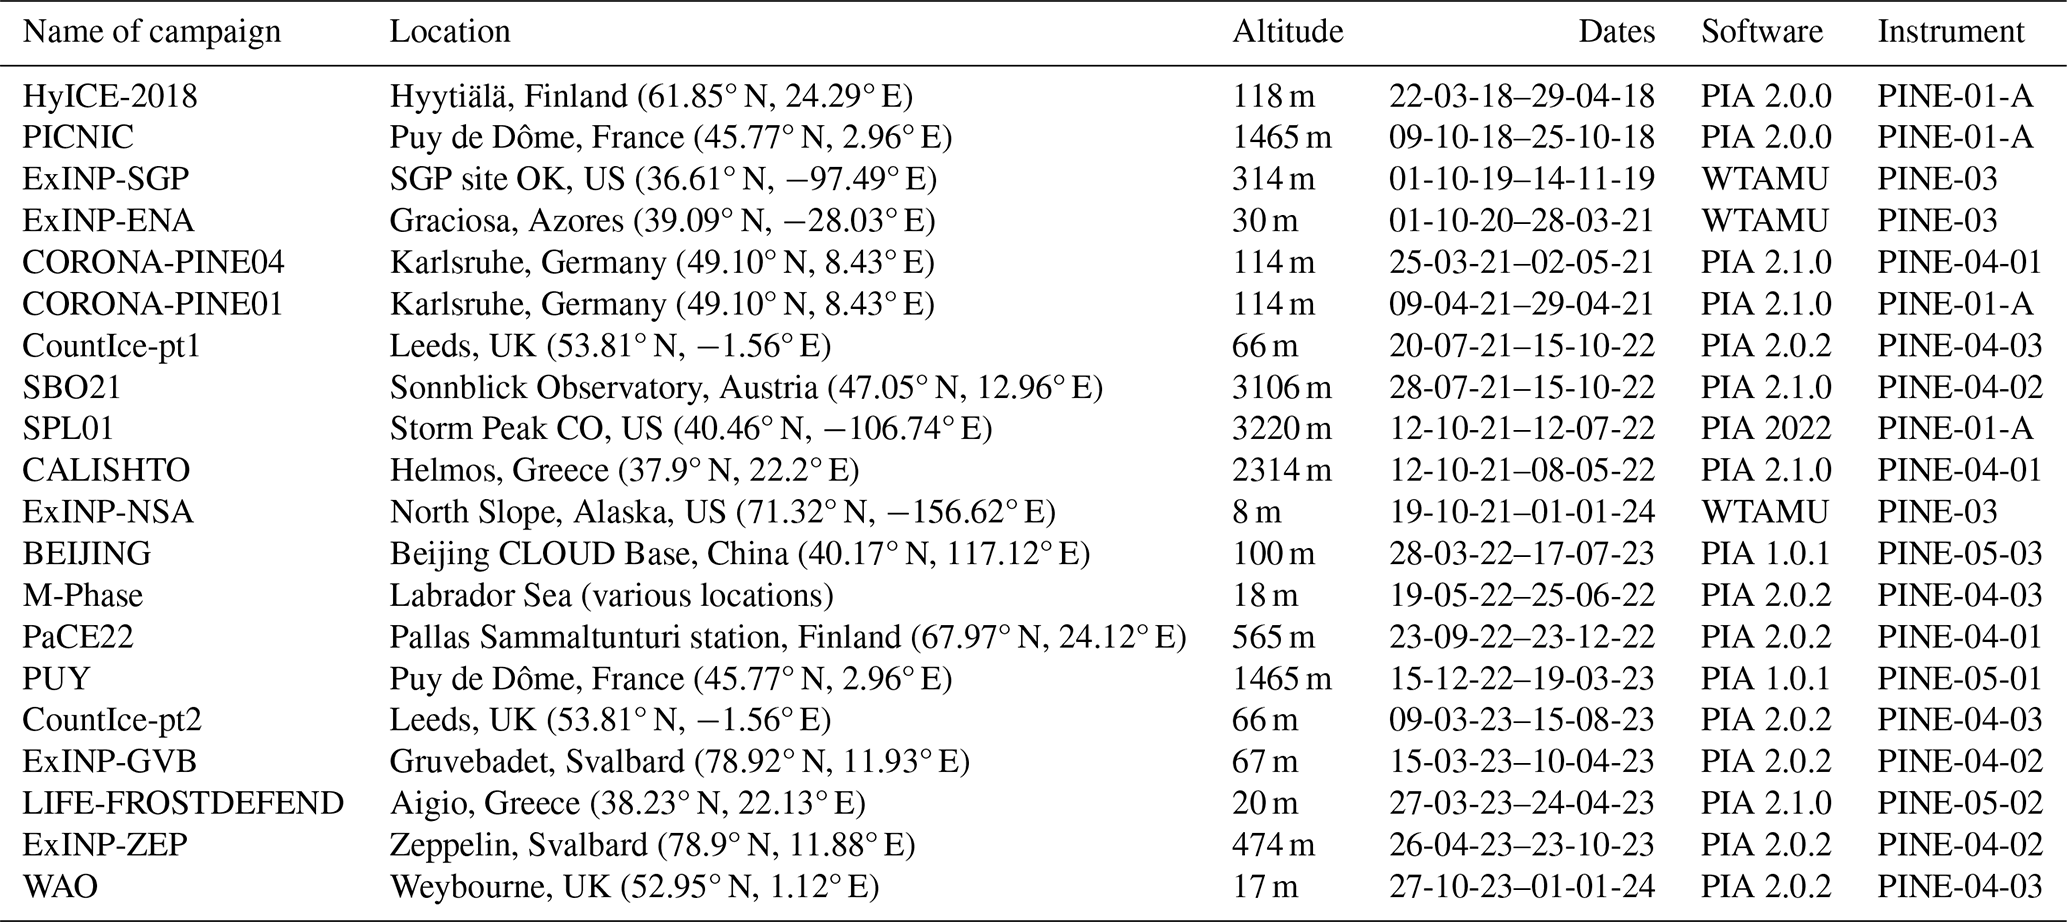
Table 1Details of PINE measurement campaigns collated in this dataset. The location is provided in decimal degrees, altitude in m above sea level, and dates in the format dd-mm-yy.
The temperature dependence of NINP is measured by changing the wall temperature of PINE, controlled by the cooling system. In this study, typical temperature scans are performed between 240 and 263 K. Post-processing software is used to extract NINP and associated temperatures during each run and is discussed further in Sect. 2.3. Möhler et al. (2021) estimate a temperature uncertainty of ±1 K, primarily due to the inhomogeneous temperature distribution within the chamber. The uncertainty in nice is dependent on the OPC. For the PINE-01-A instrument using the welas OPC, Möhler et al. (2021) estimate a conservative value of ±20 %; for all other instruments that use the fidas-pine OPC, Böhmländer et al. (2025a) estimate a conservative value of ±10 %. In our dataset, we use counting statistics that can be used to flag the most uncertain data; this is discussed further in Sect. 3. Möhler et al. (2021) assessed the aerosol loss rate between air inlet and introduction to the PINE chamber and reported a loss of less than 20 % of particles with diameter D<2 µm and about 50 % for D=4 µm. Knopf et al. (2021) and Wilbourn et al. (2024) also evaluated the loss rate in PINE during two field campaigns and report losses of 50 % at D=9.4 µm and D=8.0 µm. Adams (2020, Fig. 24) assessed the transmission efficiency of size-resolved ambient air samples during the HyICE-2018 campaign (Vogel et al., 2024; Brasseur et al., 2022) and reports a drop in efficiency for D>5 µm. This upper size limit will not greatly affect the measured NINP but will have implications for reproducing the INP measurements from modelling studies. Following Adams (2020), we recommend that the upper size limit of D=5 µm is applied to simulated aerosol size distributions when comparing to the measured NINP. We plan to assess the impact of this upper limit on modelled NINP in a follow-up study.
2.2 Campaigns
In this dataset, we collate NINP measurements made with PINE instruments from 20 campaigns that took place between 2018 and 2024. The locations and durations of the campaigns are shown in Fig. 1 and details of the campaigns and instruments are presented in Table 1. The campaigns include locations in the Arctic, Europe, North America, the North Atlantic Ocean, and East Asia. These locations are influenced by a range of important INP sources including arid environments (Central Africa, the Middle East, and Central Asia), marine environments, remote regions (the Arctic), and biologically rich environments (Europe and North America). The collated datasets provide NINP on monthly, seasonal, and annual timescales. The shortest campaign duration is 16 d, the longest is 804 d, and the mean is 172 d. A brief characterization of each campaign is provided below and includes the mean volume sampled per expansion during each campaign. The volume sampled is calculated as the inverse of the minimum measurable value of NINP (per liter of sampled air per expansion) during the campaign, which is consistent with a measurement of one ice crystal (per expansion); see Sect. 3 for more details.
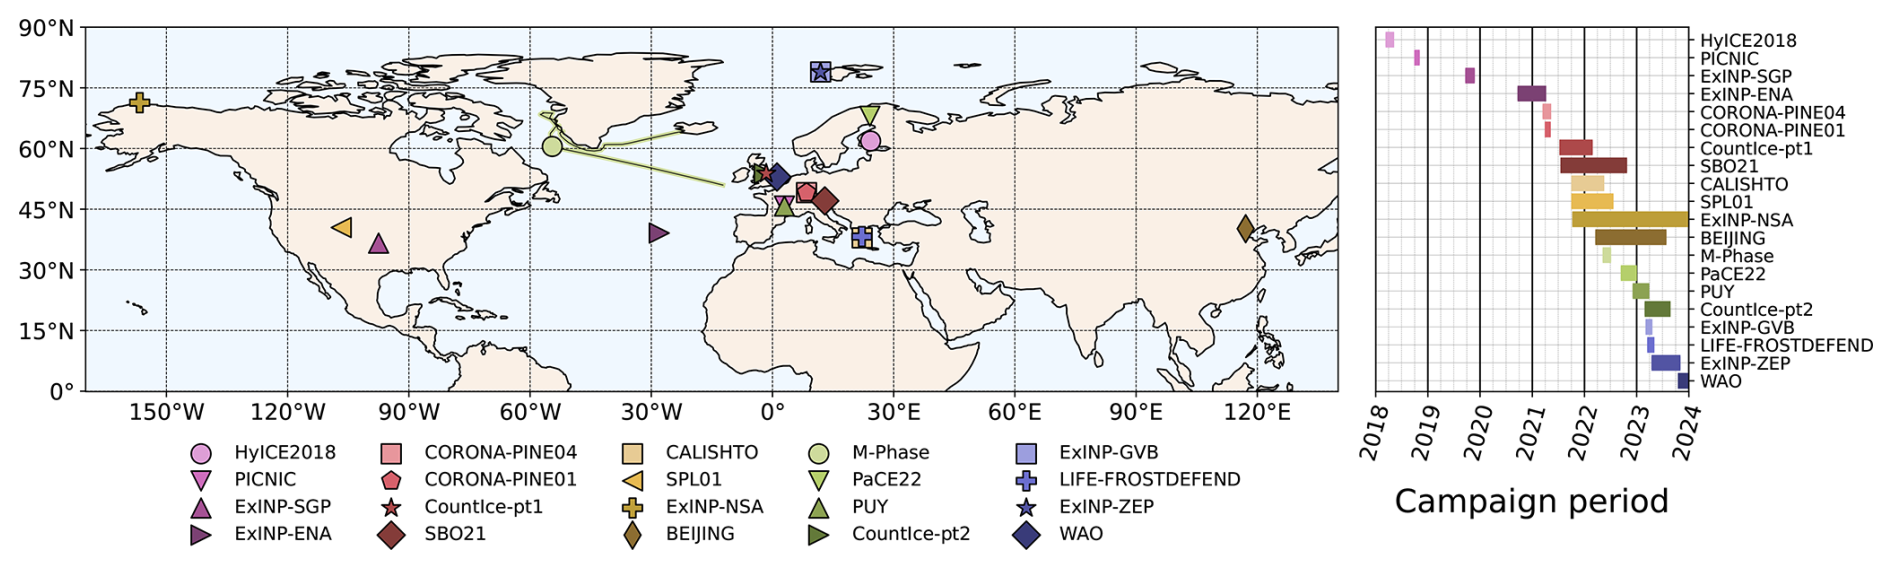
Figure 1Location and duration of the PINE campaigns included in this dataset. All campaigns remained at the same location for the duration except for M-Phase, which was onboard a research ship. The ship trajectory (green line in the North Atlantic) is shown for the period when PINE measurements were being made.
HyICE-2018: INP measurements were conducted at the SMEAR II (Station for Measuring Ecosystem-Atmosphere Relations) station (Hari and Kulmala, 2005) located in the boreal forest in Hyytiälä, Finland. Aerosols were sampled through a heated total aerosol inlet 6 m above ground level. PINE was set to the following operation parameters: (1) Flush at 3 L min−1 for 4 min, (2) expansion at 4 L min−1 to 700 mbar, (3) refill at 3 L min−1. The mean volume of air sampled during a single expansion was m3. More details on the campaign can be found in Brasseur et al. (2022) and Vogel et al. (2024).
PICNIC: INP measurements were conducted at the Site d’Observations Atmosphériques Puy de Dôme, a mountain-top site in France. It is an observational facility of the ACTRIS (Aerosol, Clouds, and Trace Gases Research Infrastructure) and the Global Atmosphere Watch (GAW) measurement programs. Sampling was performed via a heated whole-air inlet situated 2 m above the laboratory roof. PINE measurements were conducted with the following program: (1) Flush for 5 min at 2 L min−1, (2) expansion at 3 L min−1 to 650 mbar (ambient pressure 850 mbar), (3) refill at 2 L min−1. The mean volume of air sampled during a single expansion was m3. More details on the campaign can be found in Lacher et al. (2024).
ExINP-SGP: PINE measurements were made at the US Department of Energy (DOE) Southern Great Plains (SGP) Atmospheric Radiation Measurement (ARM) site in Oklahoma, US. The site is surrounded by farmland. The PINE instrument was housed within the Guest User Facility, with ambient air sampled through a 0.15 m diameter quasi-laminar sampling inlet with a total suspended particulate (TSP) sampling head at 5.5 m above the ground. The measurement program was the following: (1) Flush for 5 min at 2 L min−1, (2) expansion at 3 L min−1 to 750 mbar, (3) refill at 2 L min−1 to ambient pressure. The mean volume of air sampled during a single expansion was m3. More details on this campaign can be found in Wilbourn et al. (2024).
ExINP-ENA: PINE measurements were made at the US DOE Eastern North Atlantic (ENA) ARM site on Graciosa Island, Azores. The PINE instrument was housed in an air-conditioned container on the site, with ambient air sampled through a 0.1 m diameter quasi-laminar sampling inlet with a TSP sampling head at 5.5 m above the ground. The measurement program was the following: (1) Flush for 10 min at 2 L min−1, (2) expansion at 3 L min−1 to 800 mbar, (3) refill at 2 L min−1 to ambient pressure. The mean volume of air sampled during a single expansion was m3. More details on this campaign can be found in Wilbourn et al. (2024).
CORONA-PINE04 and CORONA-PINE01: The CORONA campaign was conducted at the AIDA (Aerosol Interaction and Dynamics in the Atmosphere) facility at the Karlsruhe Institute of Technology (KIT), Campus North in Germany. PINE was installed at a PM10 non-heated aerosol inlet, as icing during winter was not expected. The inlet was installed 1 m above the laboratory roof and 9 m above ground. INP measurements were alternately conducted with the PINE models PINE-01-A and PINE-04-01. The measurement program was the following: (1) Flush for 3 min (PINE-01-A) or 4 min (PINE-04-01) at 2 L min−1, (2) expansion at 3 L min−1 to 820 mbar, (3) refill at 2 L min−1. The mean volume of air sampled during a single expansion was m3 (PINE-1A) or m3 (PINE-04); the different volumes sampled per expansion reflect chamber volume in each instrument ( m3 for PINE-01-A and m3 for PINE-04-01). The datasets are published (Lacher, 2025a; Vogel, 2025a), but no accompanying papers are currently available.
CountIce-pt1 and CountIce-pt2: PINE measurements were made within the Leeds IcePod mobile laboratory (O’Sullivan et al., 2018) located on the University of Leeds campus, UK. The site was characterized as an urban environment with low-rise buildings. Ambient air was sampled through a heated TSP sampling head (DTSP03/00/16, Digitel, Switzerland) on a 2 m sampling tube. A flow splitter was used to direct part of the air flow into PINE. Each expansion was operated with the following program: (1) Flush for 5 min at 2 L min−1, (2) expansion at 3 L min−1 down to 840 mbar, (3) refill at 2 L min−1. A year gap between the two campaigns occurred due to the deployment of the PINE instrument on the M-Phase campaign. The mean volume of air sampled during a single expansion was m3 for both campaign periods. The datasets are published (Tarn and Murray, 2025a, b), but no accompanying papers are currently available.
SBO21: PINE measurements were made at the Sonnblick Observatory (SBO), which is located in Austria on the summit of the mount “Hoher Sonnblick”. Ambient air was sampled through a heated total aerosol inlet designed according to GAW guidelines, with an upper cut-off size of 20 µm at a wind speed of 20 m s−1. The inlet was located at the rooftop of the station. Each expansion in PINE was operated with the following program: (1) Flush for 4 min at 1.5 L min−1, (2) expansion at 3 L min−1 down to 575–600 mbar, (3) refill at 1.5 L min−1. The mean volume of air sampled during a single expansion was m3. More information can be found in Bogert (2024).
SPL01: PINE measured INP concentrations at Storm Peak Laboratory, a mountain-top site in the Rocky Mountains (Hallar et al., 2025), US. The site is operated by the University of Utah and supported by the National Science Foundation (NSF). The instrument was connected to one of the facility’s heated inlets, (Petersen et al., 2019) with the following measurement program: (1) Flush for 5 min at 1 L min−1, (2) expansion at 3 L min−1 to 530 mbar (ambient pressure 685 mbar), (3) refill at 1 L min−1. The mean volume of air sampled during a single expansion was m3. The dataset is published (Lacher, 2025b), but no accompanying paper is currently available.
CALISHTO: INP measurements were performed at the (HAC)2 (Helmos Hellenic Atmospheric Aerosol and Climate Change) station at the top of Mount Helmos, Greece. Sampling was performed through an omnidirectional total inlet installed on the rooftop of the observatory. PINE was operated with the following program: (1) Flush for 5 min at 1 L min−1, (2) expansion at 3 L min−1 to 650 mbar, (3) refill at 1 L min−1. The mean volume of air sampled during a single expansion was m3. Information on the measurement campaign can be found in Gao et al. (2025).
ExINP-NSA: PINE measurements were made at the Barrow Atmospheric Baseline Observatory, next to the US DOE North Slope of Alaska (NSA) ARM site, located close to the town of Utqiaġvik, Alaska. The PINE instrument was located inside the observatory and sampled ambient air through stainless steel sampling pickup inlets (19 mm diameter) connected to a polyvinyl chloride vertical sampling stack (0.1 m diameter) 12 m above the ground. A 9.5 mm conductive tube bridged the pickup port to the instruments in the observatory. The measurement program was the following: (1) Flush for 10 min at 2 L min−1, (2) expansion at 3 L min−1 to 800 mbar, (3) refill at 2 L min−1 to ambient pressure. The mean volume of air sampled during a single expansion was m3. More information can be found in Pantoya et al. (2025).
BEIJING. INP measurements were made at the Beijing Cloud Laboratory and Observational Utilities Deployment Base (CLOUD Base, CB). The site is located in Pinggu District, Beijing, China, and is situated on a plain surrounded by farmland and low-rise buildings. The instrument was installed at a PM1 non-heated aerosol inlet as icing was not expected during winter. The inlet was installed 1 m above the laboratory roof and 12 m above ground. The measurement program was the following: (1) Flush for 3 min at 1.5 L min−1, (2) expansion at 3 L min−1 to 850 mbar, (3) refill at 1.5 L min−1. Note that measurements below the lower limit of measurable concentration (see Sect. 3) were not included in the Level 1 data for this campaign; therefore, we omit all data above a temperature threshold of 252.15 K. This removes expansions within a temperature regime where we would expect to encounter low concentrations with poor counting statistics (see Fig. 5). The mean volume of air sampled during a single expansion was m3. The dataset is published (Herbert et al., 2026), but no accompanying paper is currently available.
M-Phase: PINE measurements were made within the Leeds IcePod mobile laboratory (O’Sullivan et al., 2018) onboard the RRS Discovery during the joint M-Phase/SEANA research cruise in the Labrador Sea. The IcePod was located on the foredeck, forward of the ship stack. Ambient air was sampled through a heated TSP sampling head (DTSP03/00/16, Digitel, Switzerland) on a 2 m sampling tube. A flow splitter was used to direct part of the air flow into PINE. Each expansion was operated with the following program: (1) Flush for 5 min at 2 L min−1, (2) expansion at 3 L min−1 down to 840 mbar, (3) refill at 2 L min−1. The mean volume of air sampled during a single expansion was m3. The dataset is published (Tarn et al., 2025), but no accompanying paper is currently available.
PaCE22: PINE measurements were conducted at the Pallas Sammaltunturi station in northern Finland around 170 km north of the Arctic Circle, representing sub-Arctic conditions. The site is within the Pallas-Yllästunturi National Park on top of a hill above the boreal forest tree line. PINE was connected to the heated whole air inlet of the station. Each expansion was operated with the following program: (1) Flush for 4 min at 1 L min−1, (2) expansion at 3 L min−1 from around 950 to 800 mbar, (3) refill at 1 L min−1. The mean volume of air sampled during a single expansion was m3. An overview of the PaCE22 (Pallas Cloud Experiment 2022) campaign can be found in Brus et al. (2025), Böhmländer et al. (2025b), and Gratzl et al. (2025), whilst more information on the PINE measurements can be found in Böhmländer et al. (2025a).
PUY: PINE measurements were made at the Puy de Dôme station, located at the highest point of the Chaîne des Puys, a volcanic mountain range in central France. PINE was connected to the whole air inlet of the station (50 % loss of particles at 30 µm). Ambient aerosol particles sampled through the inlet are passively dried to approximately 40 % relative humidity with respect to water (RHw) before being sampled by the instrument. Each expansion was operated with the following program: (1) Flush for 7.5 min at 2 L min−1, (2) expansion at 3 L min−1 from around 850 to 700 mbar, (3) refill at 2 L min−1. The mean volume of air sampled during a single expansion was m3. More information on this campaign can be found in Canzi et al. (2025).
ExINP-GVB: INP concentration measurements during this campaign were performed at Gruvebadet Atmosphere Laboratory in the high Arctic, in close proximity of the Ny-Alesund Research Station (Lupi et al., 2016) on Svalbard. PINE was attached to the heated whole air inlet and the following measurement program was used: (1) Flush for 5 min at 2 L min−1, (2) expansion at 3 L min−1 from around 1000 to 850 mbar, (3) refill at 2 L min−1. The mean volume of air sampled during a single expansion was m3. The dataset is published (Böhmländer, 2023), but no accompanying paper is currently available.
LIFE-FROSTDEFEND: INP measurements during the LIFE-FROSTDEFEND campaign were conducted in a mobile container, placed in a lemon orchard near Aigio, Greece. Aerosol sampling was performed via a PM10 inlet, about 1 m above the container roof. PINE was operated with the following program: (1) Flush for 4 min a 1 L min−1, (2) expansion with 3 L min−1 to 880 mbar, (3) refill at 1 L min−1. The mean volume of air sampled during a single expansion was m3. The dataset is published (Vogel, 2025b), but no accompanying paper is currently available.
ExINP-ZEP: PINE measurements were performed at the Zeppelin observatory at Mt. Zeppelin (Platt et al., 2022), located in the high Arctic on Svalbard. The station is located south of Ny-Alesund Research Station, however, due to frequent temperature inversions the site is typically shielded from anthropogenic emission from the village. PINE was connected to a ground-based counterflow virtual impactor for measurements of cloud residuals, and a heated whole air inlet (see Karlsson et al., 2021, for more details). In this study we only present measurements from the whole air inlet. The following program was used: (1) Flush for 5 min at 2 L min−1, (2) expansion at 3 L min−1 from around 930 to 790 mbar, (3) refill at 2 L min−1. The mean volume of air sampled during a single expansion was m3. The dataset is published (Böhmländer, 2025), but no accompanying paper is currently available.
WAO: PINE measurements were made within the Leeds IcePod mobile laboratory (O’Sullivan et al., 2018) located at the Weybourne Atmospheric Observatory (WAO), a GAW Regional station on the Norfolk coast of the UK. Ambient air was sampled through a heated TSP sampling head (DTSP03/00/16, Digitel, Switzerland) on a 2 m sampling tube. A flow splitter was used to direct part of the air flow into PINE. Each expansion was operated with the following program: (1) Flush for 5 min at 2 L min−1, (2) expansion at 3 L min−1 down to 840 mbar, (3) refill at 2 L min−1. The mean volume of air sampled during a single expansion was m3. The dataset is published (Herbert et al., 2026), but no accompanying paper is currently available.
2.3 PINE analysis software
Post-processing software is used to convert the raw Level 0 data from each PINE run into relevant Level 1 data; a full description and evaluation can be found in Büttner et al. (2026). The key information taken from the Level 0 data includes the minimum temperature during the expansion and the hydrometeor size distribution measured by the OPC between the start and end of the expansion, which the software uses to establish a size threshold for each expansion. This threshold, typically on the order of 10 µm (Möhler et al., 2021), is used to separate the smaller liquid droplets from the larger ice particles, thus determining nice; NINP can then be calculated following the process described in Sect. 2.1. The key Level 1 variables that are relevant for this dataset are the expansion time (UTC), the minimum temperature (Tmin), and the number concentration of activated INPs per liter of sampled air under standard conditions (273.15 K and 1013.25 hPa). Seventeen of the campaign datasets (Table 1) use the publicly available PINE INP Analysis software (PIA Büttner and Fösig, 2025), described by Büttner et al. (2026) and developed at KIT, and three use a variation developed by WTAMU, which differs in how the size threshold is determined. In the PIA software, the threshold is determined for each PINE expansion (see Büttner et al., 2026, for an evaluation of this method), and in the WTAMU software, a single threshold is determined over an “operation period” which may include anywhere between one run and more than 100 runs (Wilbourn et al., 2024, Sect. S8). Both software packages include automatic quality control to flag the data, which is used by each campaign team to remove poor quality data. A comparison of the two methods for the ExINP-ENA Level 1 data yields an r-squared value of 0.97, demonstrating good consistency between the methods. For some campaigns, upper or lower temperature ranges were used to manually flag data from temperature regimes that are deemed uncertain. In this dataset, we have removed all Level 1 flagged data.
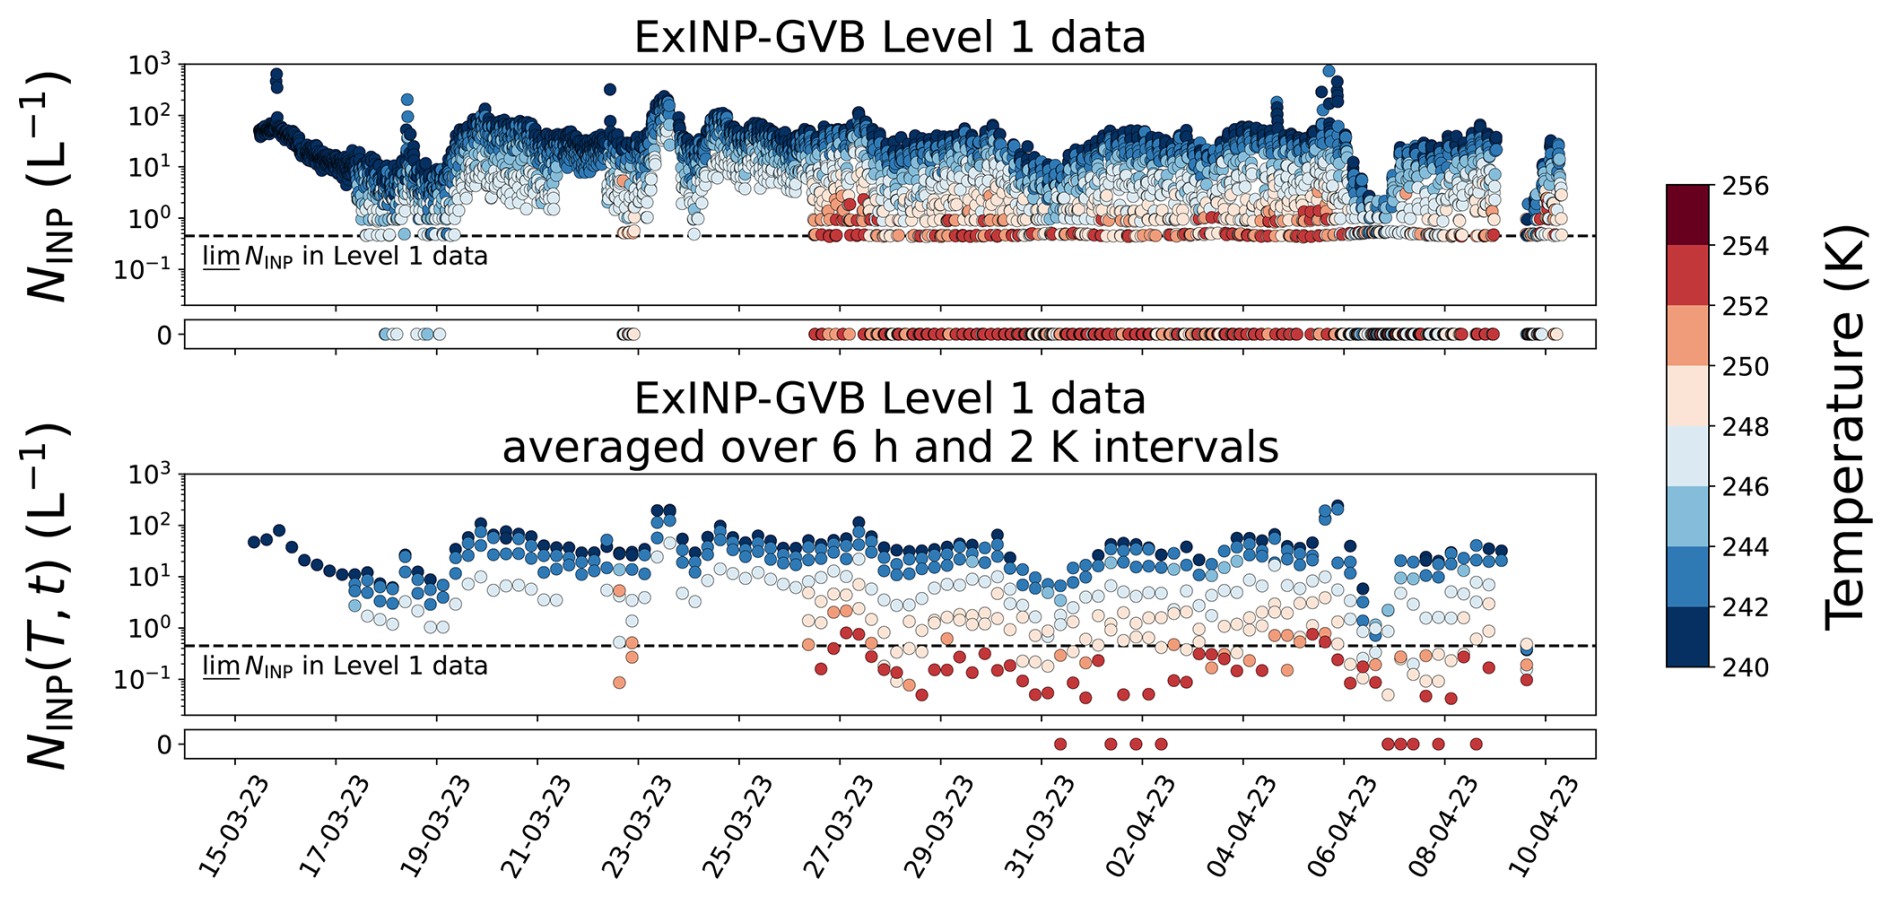
Figure 2Time series of INP measurements from the ExINP-GVB campaign demonstrating the subsetting method. Panel (a) shows the Level 1 NINP time series as a function of temperature (colors), with each marker showing the measurements from a single PINE expansion. Concentrations are per standard liter of measured air at 273.15 K and 1013.25 hPa. Expansions where NINP is below (shown as the grey dashed line) are shown at the bottom of the panel. Panel (b) shows NINP(T,t) averaged over intervals of 6 h and 2 K and includes from the Level 1 data. Intervals where are shown at the bottom of the panel. Error bars due to the uncertainty in the OPC (see Sect. 2.1) are included on all data points but are too small to distinguish from the symbol.
In our dataset, we subset the time series Level 1 data from each campaign (e.g., Fig. 2a) into regular 6 h intervals (daily 00:00, 06:00, 12:00, 18:00, 24:00 UTC) and 2 K temperature bins (e.g., Fig. 2b). We provide time series of the mean measured INP concentration from the intervals (NINP(T,t), where T and t denote the temperature and time interval) and the associated mean minimum temperature measured during the subset of PINE expansions (Tmin(T,t)). We averaged the data for two reasons. The lowest measurable nice in PINE is implicitly one ice crystal (nice=1) per sampled volume; this corresponds to a lower limit of the measurable INP concentration () that is a function of the instrument configuration and ambient conditions. In order to improve counting statistics and reduce , we use data collected from multiple expansions to increase the total volume of air that is considered and the statistical likelihood of measuring at least one ice crystal in this volume. This likelihood is inversely scaled with the number of expansions (and therefore total sample volume) that are included in the interval, as demonstrated in Fig. 2. In this example, the Level 1 data for the ExINP-GVB campaign has a lower measurable concentration of L−1 (Fig. 2a) and includes many expansions below this value (shown as zero counts), whilst the lowest concentration from the subset data, (Fig. 2b), is now regularly lower than the Level 1 limit, providing additional data primarily at higher freezing temperatures where INPs are rarer. The number of zero counts has been reduced from 639 in the Level 1 data to 10 in the subset data, which demonstrates how the zero counts from individual expansions can still provide useful information. Subsetting into regular time intervals also makes the dataset easy to apply to simulation studies, meteorological reanalysis products, and back-trajectory analyses. Global simulation studies generally restrict the frequency of output to synoptic timescales, which will range from hours to days. Similarly, reanalysis products such as ERA5 (Hersbach et al., 2020) and MERRA2 (Gelaro et al., 2017) are available at regular intervals. Back-trajectory analysis packages, such as HYSPLIT (Stein et al., 2015) and FLEXPART (Bakels et al., 2024) can be driven by reanalysis products. A time period of 6 h was chosen to maximize the number of expansions within the interval, whilst maintaining a time scale that is appropriate for synoptic scale meteorology and the applications discussed above. The subsetting method applied to the Level 1 data from the 20 campaigns takes NINP measurements from 423 678 expansions (367 487 at or above ) and results in 35 960 non-zero NINP(T,t) measurements in the dataset.
Some portions of the data sets suffer from poor counting statistics; hence, for each collection of subset data, we determine an associated error based on counting statistics, which we calculate as the relative standard deviation (RSD) of the data within each interval using the equation , where σ and μ are the standard deviation and mean of nice(T,t), the total number of ice crystals measured in the interval. RSD(T,t) is a statistical measure of how robust the data point is, given the total number of events (ice crystals in our case) that have been measured. The ice crystal detections will follow a Poisson distribution; therefore, the equation can be rewritten as and is expressed as a percentage. nice(T,t) is calculated by summing nice from all expansions within the interval, which can be calculated with the assumption that from the Level 1 data is the concentration that corresponds to nice=1 being measured in a single PINE expansion; dividing NINP by this value results in nice. is a function of the PINE instrument setup and ambient conditions and may vary during the campaign duration (note the small variations around the mean in Fig. 2a); therefore, a 3 d moving time window is applied to the Level 1 data to allow small variations throughout the time series of each campaign. The value of RSD(T,t) can be used along with a threshold value to statistically remove uncertain data. Figure 3 demonstrates the sensitivity of the threshold on the percentage of subset data that would be removed from each campaign. The value of this threshold is left to the user of GloPINE.
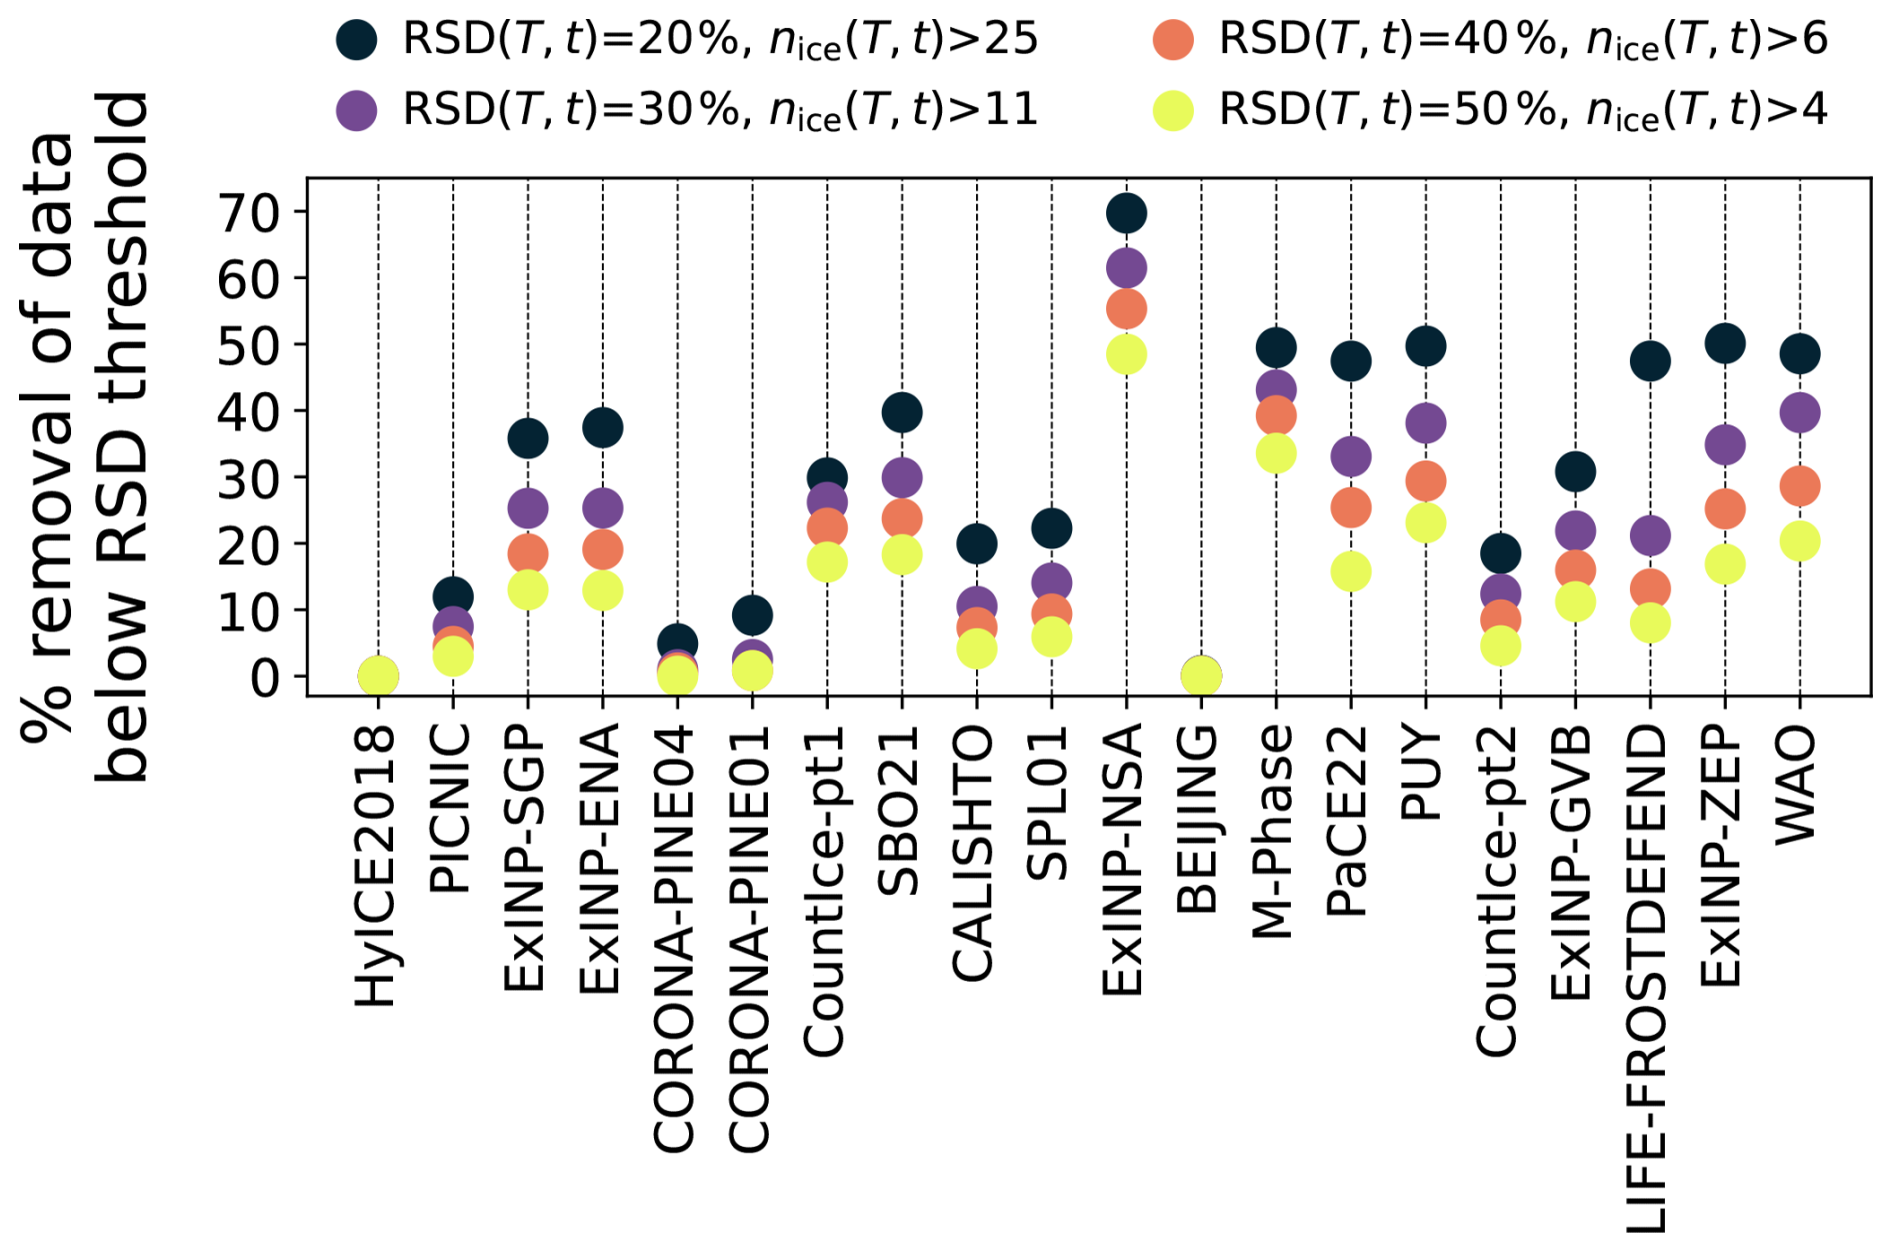
Figure 3Figure demonstrating the application of different threshold RSD(T,t) values (20 %, 30 %, 40 %, and 50 %) to the subset NINP(T,t) measurements in each campaign. Each threshold RSD(T,t) value has a corresponding threshold of nice(T,t) shown in the legend.
In this section, we present an overview of the new GloPINE INP dataset (without application of a RSD(T,t) threshold). Figure 4 shows the distributions of Tmin(T,t) for each PINE campaign in the dataset. There is good coverage of freezing temperatures, ranging from 240 to 263 K. Some campaigns, such as BEIJING and ExINP-SGP, have a consistent and wide-ranging distribution of Tmin(T,t), while others, such as M-Phase and CALISHTO, have measurements weighted towards a smaller range of Tmin(T,t). This reflects the sampling method chosen by each team. Keeping the temperature relatively constant (see the initial period in Fig. 2a) provides a higher number of expansions to combine in the time interval, which increases the sensitivity of the measurements (see Sect. 3). This is a good method for measuring NINP close to . However, cycling through different temperatures (see the latter period in Fig. 2a) provides a more complete picture of the INP spectrum, although without the increase in sensitivity. This method may be particularly advantageous when INP sources or concentrations are likely to vary on short timescales, such as in dust or biomass burning plumes. Figure 4 also shows the number of NINP(T,t) measurements from each campaign within the INP dataset, which totals 35 960 non-zero measurements. For comparison, Herbert et al. (2025) and Chatziparaschos et al. (2025) recently evaluated their global INP models with datasets that include 1000s of immersion-mode INP measurements.

Figure 4Normalized frequency distribution of temperatures from the 6 h subset data for each campaign. The number of non-zero NINP(T,t) measurements from each campaign in the dataset (n(T,t)) is shown in the top right corner of each plot. All campaigns use the same range on the x-axis except for HyICE2018.
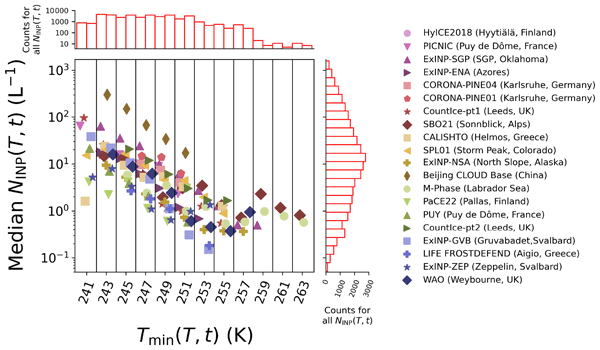
Figure 5 shows the distributions and medians of non-zero NINP(T,t) as a function of temperature and campaign. NINP(T,t) measurements span a range from less than 0.01 L−1 to over 1000 L−1 over a temperature range from 240 to 263 K. Higher concentrations are observed at lower temperatures for all campaigns, and there is considerable variability between each location, with medians spanning two orders of magnitude at most temperatures. The highest NINP(T,t) measurements were observed in the BEIJING campaign, and the lowest are commonly observed in high-latitude environments, such as PaCE22 (northern Finland) and ExINP-ZEP (Svalbard). The PINE INP dataset provides a diverse range of NINP(T,t) measurements and is consistent with the spatial variability of INP sources and concentrations within the Northern Hemisphere (e.g., Kanji et al., 2017).

Figure 5Distribution of non-zero NINP(T,t) measurements as a function of Tmin(T,t) from the 6 h subset data for each campaign in the GloPINE dataset. Concentrations are per standard liter of sampled air at 273.15 K and 1013.25 hPa. The distributions are presented as box plots: the black line shows the median, the bar shows the inter-quartile range, and the whiskers extend to the farthest data point lying within 150 % of the inter-quartile range. The integers in red shown below each box plot are the percentage of GloPINE data where . The larger plot on the right shows the median values of NINP(T,t) as a function of Tmin(T,t). The different colored symbols correspond to each campaign; symbols are offset in each temperature bin for clarity.
4.1 GloPINE dataset format
The GloPINE dataset (Herbert et al., 2026) is provided as individual NetCDF4 (.nc) files corresponding to each campaign. This permits the addition of further campaigns in the future. The file attributes are the campaign name, the PINE instrument used to make the measurements, and the duration of the campaign. Each variable is suffixed with “6h” or “6h2K” to denote the subsetting interval in time or time/temperature. The variables included in each file are:
-
latitude_6h: mean latitude(s) of campaign (° N)
-
longitude_6h: mean longitude(s) of campaign (° E)
-
altitude_6h: mean altitude(s) of PINE inlet (m above sea level)
-
time_6h: mean time of INP measurements in interval (fractional days since 1900-01-01)
-
INP_6h2K: mean INP concentration in interval (m−3)
-
INP_uncertainty_6h2K: mean INP concentration uncertainty in interval (± m−3)
-
temperature_6h2K: mean PINE minimum temperature in interval (K)
-
Vtot_6h2K: total volume of ambient air sampled in interval (m3)
-
RSD_6h2K: relative standard deviation of nice in interval, expressed as a percentage (%)
Note that concentrations of NINP(T,t) are converted from units of L−1 and provided in SI units of m−3. Missing values are set to a value of −999 and represent binning intervals that did not include any PINE expansions. Values of zero in the variables INP_6h2K and RSD_6h2K represent intervals when at least one PINE expansion was performed but the sum of measured ice crystals was zero; we keep these in for consistency with the Level 1 datasets. All campaigns have geospatial variables (latitude_6h, longitude_6h, and altitude_6h) in dimensions of time. This permits a consistent format for campaigns that were either in a fixed location (e.g., ExINP-NSA) or a variable location (e.g., the M-Phase cruise campaign). For campaigns in a fixed location, the values are constant throughout the timeseries. For application of the GloPINE dataset with simulated data or reanalysis products, we recommend that the user collocates their data with the latitude, longitude, time, and altitude of each individual GloPINE data point. When calculating INP concentrations, we recommend applying the interval-mean temperature and, for consistency with the measurement technique, only using the portion of the aerosol size distribution below D=5 µm (see Sect. 2.1).
Brasseur et al. (2024)Lacher (2025c)Hiranuma (2019)Hiranuma (2020)Vogel (2025a)Lacher (2025a)Tarn and Murray (2025a)Bogert (2025a, b)Lacher (2025b)Vogel (2025c, d)Hiranuma (2021)Herbert et al. (2026)Tarn et al. (2025)Böhmländer et al. (2024)Canzi et al. (2024)Tarn and Murray (2025b)Böhmländer (2023)Vogel (2025b)Böhmländer (2025)Herbert et al. (2026)Table 2Location of Level 1 data from each PINE measurement campaign collated in this dataset.
The code used to take Level 1 data and subset into the Level 2 data is provided as a python script in the dataset repository https://doi.org/10.5281/zenodo.16745514 (Herbert et al., 2026). We also include a python script that provides examples of how to extract and use the Level 2 data.
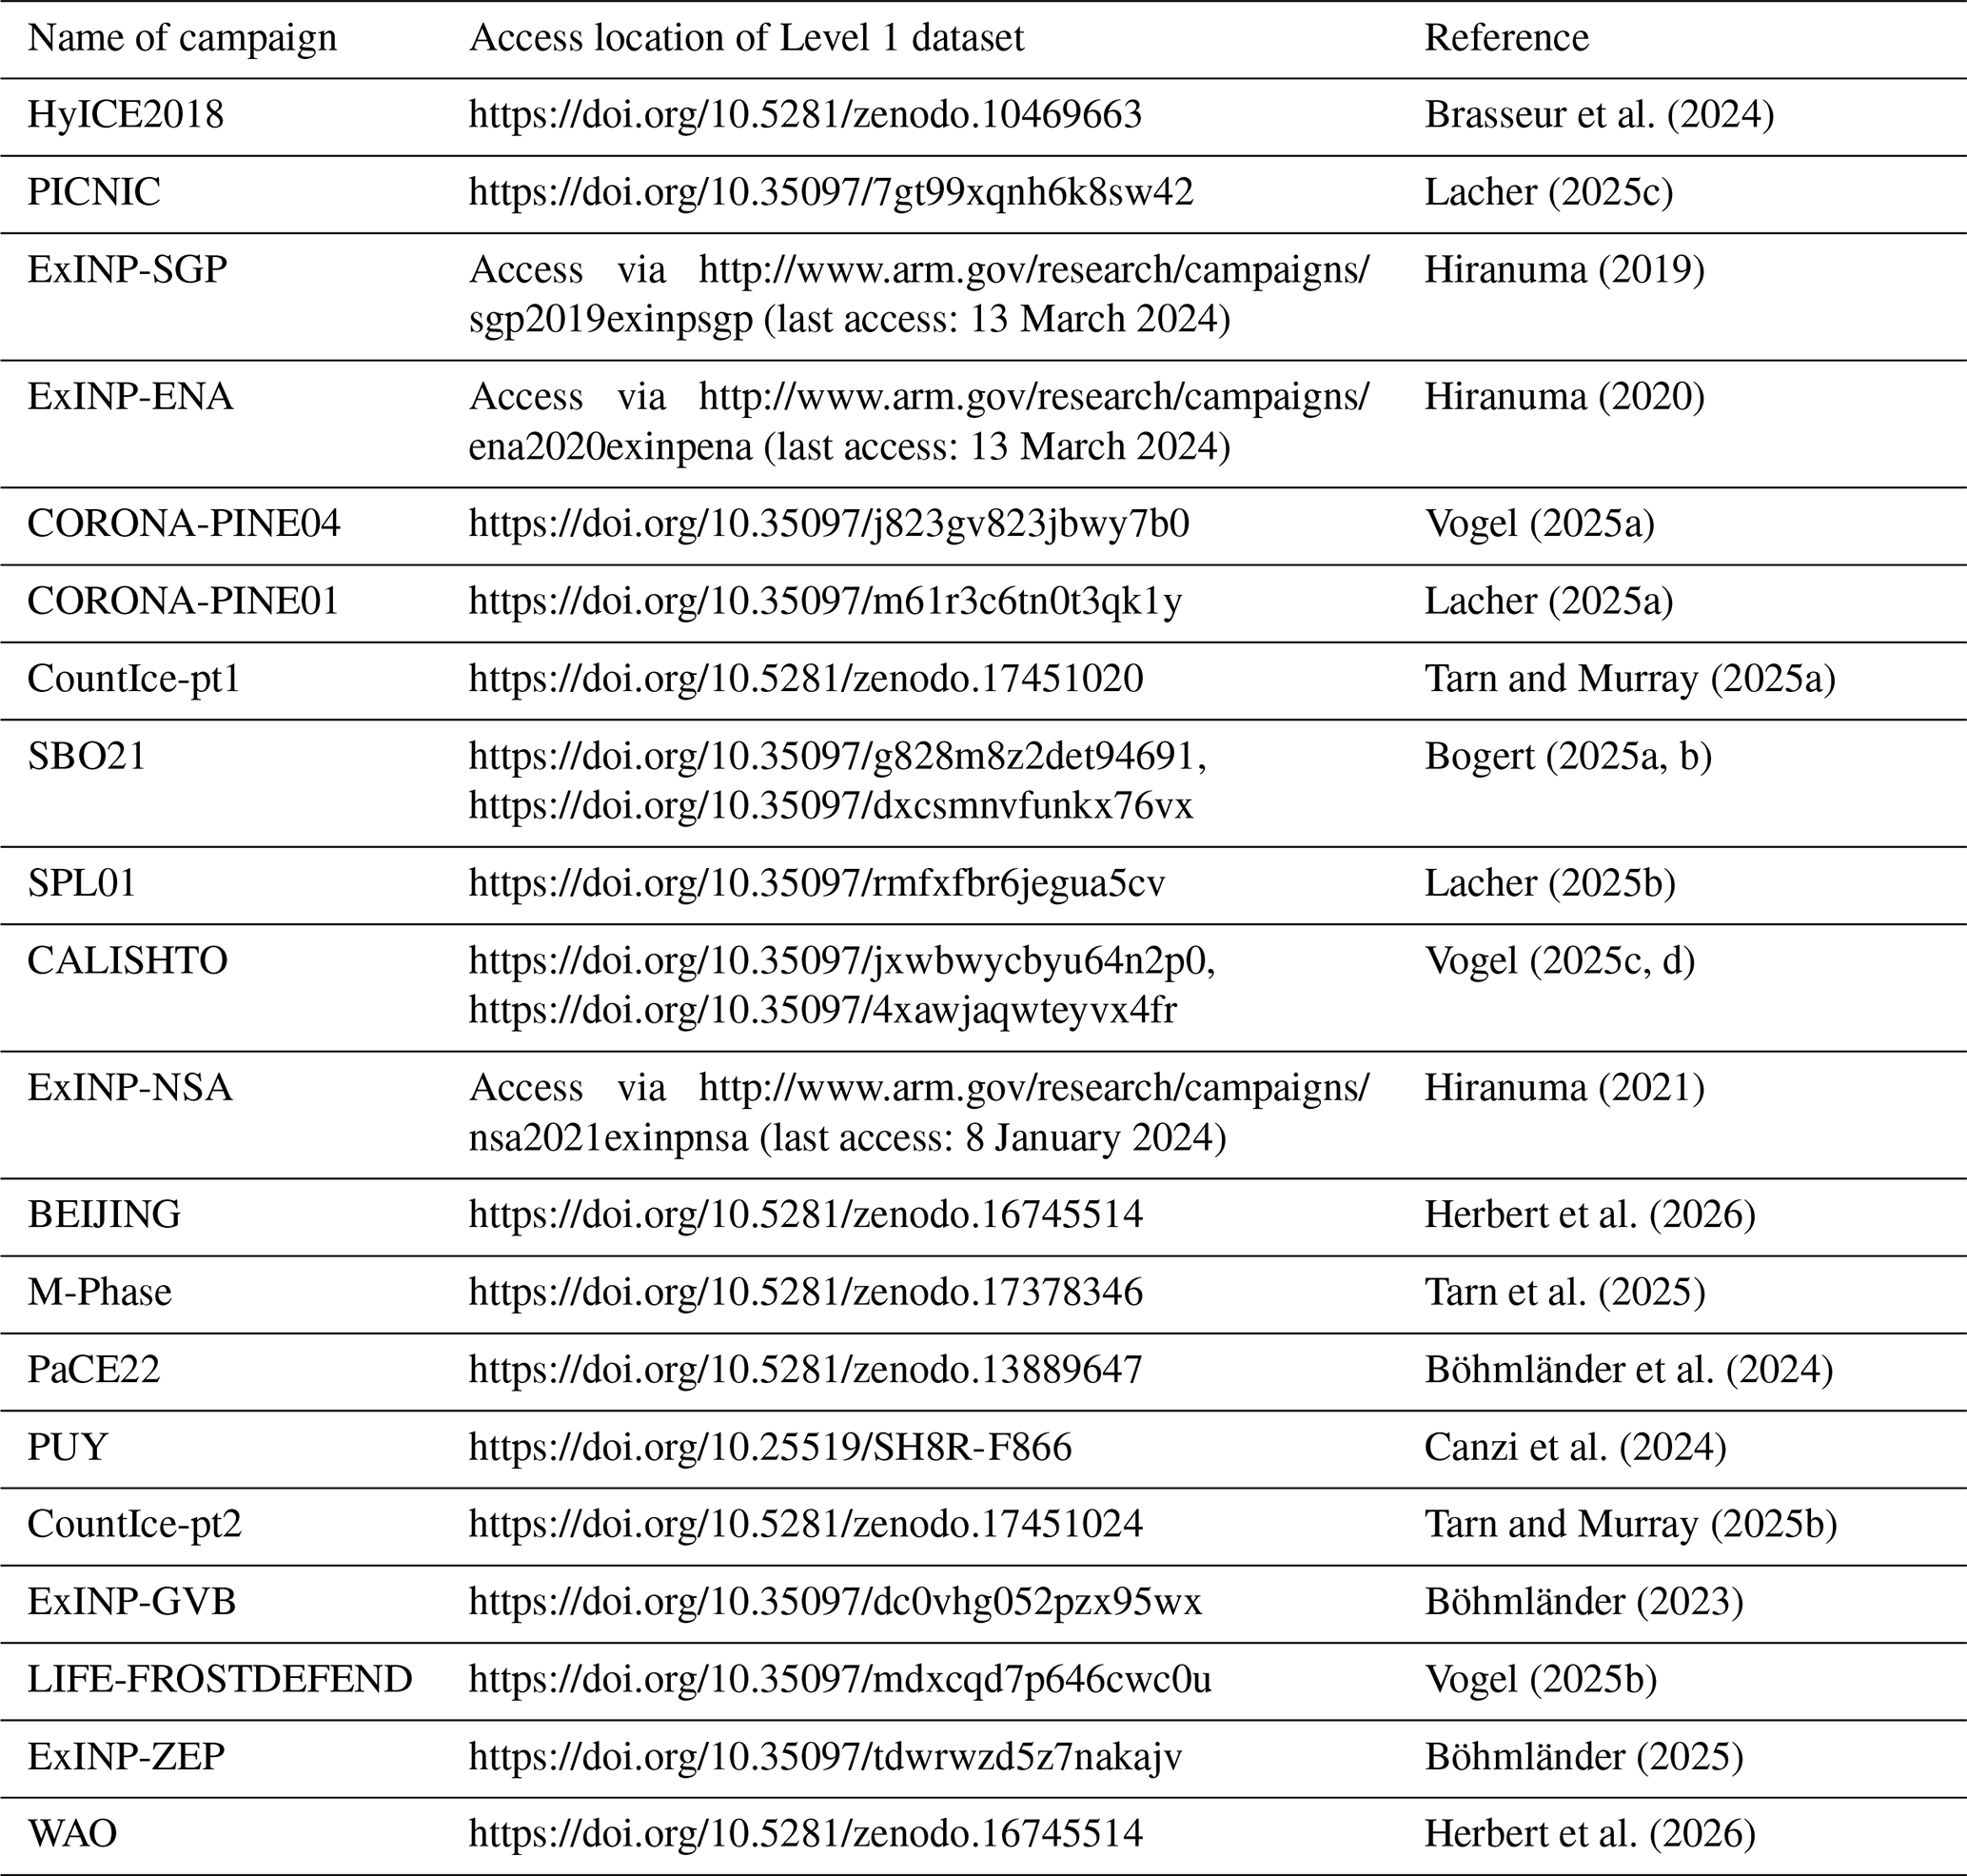
The GloPINE INP dataset is publicly available at Zenodo under https://doi.org/10.5281/zenodo.16745514 (Herbert et al., 2026). The repository contains the data as described in Sect. 4.1 with a summary overview of the dataset. We plan to continue building on this dataset by including new PINE measurement datasets when they become available. Table 2 provides access details to the Level 1 datasets collated in this study.
Aerosols can influence the properties and evolution of mixed phase clouds by acting as INPs that facilitate the freezing of cloud droplets at supercooled temperatures as low as ∼235 K (−38 °C). INP measurements made under ambient conditions are necessary to constrain the representation of INPs and primary ice production in models and quantify the role of INPs in the climate system.
In this paper, we present GloPINE, a new INP measurement dataset that includes measurements made during 20 campaigns in the Northern Hemisphere, with plans to incorporate Southern Hemisphere campaigns in the future. All campaigns used PINE instruments to autonomously sample ambient air every 5 to 15 min over long periods of time (months to years) and over a wide range of temperatures (239 to 259 K). The collated PINE Level 1 data include measurements from ∼400 000 expansions sampled over ∼70 000 h of operation. In the GloPINE dataset, we average the Level 1 PINE data into 6 h time intervals and 2 K temperature intervals, resulting in ∼36 000 INP measurements sampled from over 800 m3 of ambient air. Combining expansions within the intervals enhances the counting statistics and decreases the lower limit of measurable INP concentrations, primarily enhancing the number of non-zero INP measurements at relatively high freezing temperatures. All measurements include a the relative standard deviation (RSD) of the data within each interval, based on counting statistics, which describes the associated uncertainty of the INP concentration. The GloPINE INP dataset is designed to be easily applied to modeling studies and other research that requires measurements made at regular time intervals, providing a means to robustly evaluate and constrain global models on a scale that has not previously been possible.
A particular strength of this method is the use of a single instrument design and methodology, which removes the uncertainty that is usually introduced when combining measurements from different instruments and techniques. However, we note that there is inherent variability in the instrument versions (Sect. 2.1), the operation method for each campaign (Sect. 2.2), and the post-processing software used to produce the Level 1 data. Nonetheless, this is very likely to introduce considerably less uncertainty than between distinct instruments and methods. An important caveat to this rationale is that the dataset presented here is sensitive to instrument deficiencies associated with PINE that may introduce systematic biases. Schrod and Bingemer (2025) have recently shown that small temperature uncertainties can result in large discrepancies in the reported NINP(T) values. The authors identified the inhomogeneous distribution of temperature within the PINE chamber during expansion as a potentially important source of uncertainty. We aim to continue to build the PINE campaign database, and as such there is the possibility of updating previous entries in-line with new understanding or changes to the PIA software that act to reduce biases that may be discovered.
The GloPINE dataset is complementary to other INPs datasets, and together they will be important for fully characterizing the role of aerosols as INPs across the entire temperature spectrum. Alternative INP measurement techniques, such as those using offline filter-based sampling methods (e.g., Creamean et al., 2025), often report INP concentration measurements at higher temperatures (typically above 255 K) than the bulk of the GloPINE data in its current iteration. This is achieved through sampling over longer time periods (typically several hours to days), resulting in a relatively coarse temporal-resolution that may fail to capture diurnal cycles in INP availability. Filter samples also provide an opportunity to assess aerosol composition, size distributions, and source attribution using additional analytical techniques. Current technical developments aim to couple PINE with aerosol characterization instruments, thereby complementing online INP measurements with simultaneous, high temporal-resolution information on the sampled aerosol (Lacher et al., 2026). In summary, we recommend combining the GloPINE dataset with other INP datasets to enable robust model evaluation, improve source attribution, and inform parameterizations across the wider temperature range over which aerosols influence primary ice production.
RJH, BJM, OM, NH, LL, AB, MDT, AC, AP, EF, KH, PB, CP and PT came up with the conceptual design of this dataset. LL, AB, MDT, AC, AP, EF, KH, PB, CP, PT, MA, SB, DB, NB, MD, KD, KE, GF, RF, DGG, MIG, AGH, RK, EL, MM, IBM, AN, TK, JR, FV, PZ, NH, OM and BJM were involved in facilitating, obtaining, or analyzing the PINE data. RJH collated the datasets, wrote the code to subset the PINE data, and produced the GloPINE INP dataset. RJH prepared the original draft of the manuscript. All co-authors were involved in reviewing and editing the manuscript.
The contact author has declared that none of the authors has any competing interests.
Publisher's note: Copernicus Publications remains neutral with regard to jurisdictional claims made in the text, published maps, institutional affiliations, or any other geographical representation in this paper. The authors bear the ultimate responsibility for providing appropriate place names. Views expressed in the text are those of the authors and do not necessarily reflect the views of the publisher.
RJH acknowledges JASMIN (http://jasmin.ac.uk/, last access: 7 August 2025), the UK collaborative data analysis facility. The PUY authors wish to acknowledge CNRS-INSU for supporting measurements performed at the SI-COPDD, and those within the long-term monitoring aerosol program SNO-CLAP, both of which are components of the ACTRIS French Research Infrastructure, and whose data is hosted at the AERIS data center (https://www.aeris-data.fr/, last access: 1 September 2026). NH acknowledges support by the US Department of Energy, Office of Science, Office of Biological and Environmental Research (grant no. DE-SC-0018979). The PUY campaign was supported by the National Research Agency under the JCJC program “ANR-21-CE01-0003”, and under the France 2030 program (Obs4Clim) “ANR-21-ESRE-0013”. AC is funded by the ACME project (ANR-21-CE01-0003). PaCE22 was supported by ACTRIS-Finland funding through the Ministry of Transport and Communications, the Atmosphere and Climate Competence Center Flagship funding by the Research Council of Finland (Grant 337552). This project has also received funding from the European Union, H2020 research and innovation program (ACTRIS-IMP, the European Research Infrastructure for the observation of Aerosol, Clouds, and Trace gases, Grant 871115). KE, MIG and DGG acknowledge grant LIFE20 CCA/GR/001747 for supporting the LIFE-FROSTDEFEND project. OM acknowledges financial support through the KIT Technology Transfer project PINE (project number N059). LL acknowledges the Postdoctoral Researchers International Mobility Experience (PRIME) program funded by the German Academic Exchange Service (DAAD) with funds from the German Federal Ministry of Education and Research (BMBF) under project number 57572852. The SPL01 campaign and AGH acknowledge the support of Daniel Cziczo and the United States National Science Foundation, Directorate for Geosciences (grants 1749851 and 2054847). NH and MM thank the National Research Council of Italy and the staff of the Arctic Station Dirigibile Italia for their assistance during the ExINP-GVB campaigns. M-Phase acknowledges the National Oceanography Center (NOC), the captain and crew of the RRS Discovery, and funding support under the NERC grants NE/T00648X/1 (M-Phase) and NE/S00579X/1 (SEANA, that funded the ship time). TP acknowledges support of Zoe Brasseur, Jonathan Duplissy and the SMEAR II staff during HyICE2018. TP also acknowledges support of Research Council of Finland through Atmosphere and Climate Competence Center (ACCC) and financial support of University of Helsinki (ACTRIS-HY). The HyICE2018 campaign was supported via transnational access project through ACTRIS-2. WAO acknowledges funding support under the NERC grant NE/T006420/1 (DCMEX) and would like to acknowledge the Atmospheric Measurement and Observation Facility (AMOF), a Natural Environment Research Council (UKRI-NERC) funded facility (NE/Y005376/1), for providing access to the WAO station (AMOF_20230725172925). COUNTICE-pt1 and COUNTICE-pt2 acknowledge funding support from the European Research Council (862565) and financial support from the University of Leeds International Strategy Fund. The deployment of PINE during the ExINP-ZEP campaign was supported by Stockholm University program financed by Swedish Environmental Protection Agency and ACTRIS-Sweden. KE and MIG acknowledge partial support by the project “PANhellenic infrastructure for Atmospheric Composition and climatE change” (MIS 5021516) co-financed by Greece and the European Union (European Regional Development Fund) in relation to the CALISHTO campaign.
This research has been supported by the Natural Environment Research Council (grant nos. NE/T00648X/1, NE/S00579X/1, NE/T006420/1, and NE/Y005376/1), the Biological and Environmental Research (grant no. DE-SC-0018979), the Agence Nationale de la Recherche (grant nos. ANR-21-CE01-0003, ANR-21-ESRE-0013, and ANR-21-CE01-0003), the Research Council of Finland (grant no. 337552), the H2020 European Research Council (grant nos. 871115 and 862565), the LIFE programme (grant no. CCA/GR/001747), the Directorate for Geosciences (grant nos. 1749851 and 2054847), the German Federal Ministry of Education and Research (BMBF, project number 57572852), and “PANhellenic infrastructure for Atmospheric Composition and climatE change” (MIS 5021516) co-financed by Greece and the European Union (European Regional Development Fund).
This paper was edited by Montserrat Costa Surós and reviewed by two anonymous referees.
Adams, M. P.: Measurement and characterisation of atmospheric ice-nucleating particles, Ph.D. thesis, University of Leeds, https://etheses.whiterose.ac.uk/id/eprint/28908/ (last access: 1 September 2026), 2020. a, b
Bakels, L., Tatsii, D., Tipka, A., Thompson, R., Dütsch, M., Blaschek, M., Seibert, P., Baier, K., Bucci, S., Cassiani, M., Eckhardt, S., Groot Zwaaftink, C., Henne, S., Kaufmann, P., Lechner, V., Maurer, C., Mulder, M. D., Pisso, I., Plach, A., Subramanian, R., Vojta, M., and Stohl, A.: FLEXPART version 11: improved accuracy, efficiency, and flexibility, Geosci. Model Dev., 17, 7595–7627, https://doi.org/10.5194/gmd-17-7595-2024, 2024. a
Bellouin, N., Quaas, J., Gryspeerdt, E., Kinne, S., Stier, P., Watson-Parris, D., Boucher, O., Carslaw, K. S., Christensen, M., Daniau, A.-L., Dufresne, J.-L., Feingold, G., Fiedler, S., Forster, P., Gettelman, A., Haywood, J. M., Lohmann, U., Malavelle, F., Mauritsen, T., McCoy, D. T., Myhre, G., Mülmenstädt, J., Neubauer, D., Possner, A., Rugenstein, M., Sato, Y., Schulz, M., Schwartz, S. E., Sourdeval, O., Storelvmo, T., Toll, V., Winker, D., and Stevens, B.: Bounding Global Aerosol Radiative Forcing of Climate Change, Rev. Geophys., 58, e2019RG000660, https://doi.org/10.1029/2019RG000660, 2020. a
Bi, K., McMeeking, G. R., Ding, D. P., Levin, E. J. T., DeMott, P. J., Zhao, D. L., Wang, F., Liu, Q., Tian, P., Ma, X. C., Chen, Y. B., Huang, M. Y., Zhang, H. L., Gordon, T. D., and Chen, P.: Measurements of Ice Nucleating Particles in Beijing, China, J. Geophys. Res.-Atmos., 124, 8065–8075, https://doi.org/10.1029/2019JD030609, 2019. a
Bogert, P.: Ice-nucleating particles in the free troposphere: long-term observation and first measurements at cirrus formation temperatures using the novel Portable Ice Nucleation Experiment PINEair, Ph.D. thesis, Karlsruher Institut für Technologie (KIT), https://doi.org/10.5445/IR/1000174265, 2024. a
Bogert, P.: PINE-04-02 SBO21 2021, Karlsruhe Institute of Technology [data set], https://doi.org/10.35097/g828m8z2det94691, 2025a. a
Bogert, P.: PINE-04-02 SBO21_new 2021–2022, Karlsruhe Institute of Technology [data set], https://doi.org/10.35097/dxcsmnvfunkx76vx, 2025b. a
Böhmländer, A.: PINE-04-02 ExINP_GVB 2023, Karlsruhe Institute of Technology [data set], https://doi.org/10.35097/dc0vhg052pzx95wx, 2023. a, b
Böhmländer, A.: PINE-04-02 ExINP_ZEP 2023-2024, Karlsruhe Institute of Technology [data set], https://doi.org/10.35097/tdwrwzd5z7nakajv, 2025. a, b
Böhmländer, A., Lacher, L., and Möhler, O.: Data from Portable Ice Nucleation Experiment during the Pallas Cloud Experiment 2022, Zenodo [data set], https://doi.org/10.5281/zenodo.13889647, 2024. a
Böhmländer, A., Lacher, L., Fösig, R., Büttner, N., Nadolny, J., Brus, D., Doulgeris, K.-M., and Möhler, O.: Measurement of the ice-nucleating particle concentration with the Portable Ice Nucleation Experiment during the Pallas Cloud Experiment 2022, Earth Syst. Sci. Data, 17, 6165–6171, https://doi.org/10.5194/essd-17-6165-2025, 2025a. a, b
Böhmländer, A., Lacher, L., Höhler, K., Brus, D., Doulgeris, K.-M., Girdwood, J., Leisner, T., and Möhler, O.: Measurement of the ice-nucleating particle concentration using a mobile filter-based sampler on-board of a fixed-wing uncrewed aerial vehicle during the Pallas Cloud Experiment 2022, Earth Syst. Sci. Data, 17, 6157–6164, https://doi.org/10.5194/essd-17-6157-2025, 2025b. a
Brasseur, Z., Castarède, D., Thomson, E. S., Adams, M. P., Drossaart van Dusseldorp, S., Heikkilä, P., Korhonen, K., Lampilahti, J., Paramonov, M., Schneider, J., Vogel, F., Wu, Y., Abbatt, J. P. D., Atanasova, N. S., Bamford, D. H., Bertozzi, B., Boyer, M., Brus, D., Daily, M. I., Fösig, R., Gute, E., Harrison, A. D., Hietala, P., Höhler, K., Kanji, Z. A., Keskinen, J., Lacher, L., Lampimäki, M., Levula, J., Manninen, A., Nadolny, J., Peltola, M., Porter, G. C. E., Poutanen, P., Proske, U., Schorr, T., Silas Umo, N., Stenszky, J., Virtanen, A., Moisseev, D., Kulmala, M., Murray, B. J., Petäjä, T., Möhler, O., and Duplissy, J.: Measurement report: Introduction to the HyICE-2018 campaign for measurements of ice-nucleating particles and instrument inter-comparison in the Hyytiälä boreal forest, Atmos. Chem. Phys., 22, 5117–5145, https://doi.org/10.5194/acp-22-5117-2022, 2022. a, b
Brasseur, Z., Castarède, D., Thomson, E. S., Adams, M. P., Drossaart van Dusseldorp, S., Heikkilä, P., Korhonen, K., Lampilahti, J., Paramonov, M., Schneider, J., Vogel, F., Wu, Y., Abbatt, J. P. D., Atanasova, N. S., Bamford, D. H., Bertozzi, B., Boyer, M., Brus, D., Daily, M. I., Duplissy, J., et al.: Datasets to: Measurement report: Introduction to the HyICE-2018 campaign for the measurements of ice nucleating particles in the boreal forest of Hyytiälä, Zenodo [data set], https://doi.org/10.5281/zenodo.10469663, 2024. a
Brunner, C. and Kanji, Z. A.: Continuous online monitoring of ice-nucleating particles: development of the automated Horizontal Ice Nucleation Chamber (HINC-Auto), Atmos. Meas. Tech., 14, 269–293, https://doi.org/10.5194/amt-14-269-2021, 2021. a
Brus, D., Le, V., Kuula, J., and Doulgeris, K.: Data collected by a drone backpack for air quality and atmospheric state measurements during Pallas Cloud Experiment 2022 (PaCE2022), Earth Syst. Sci. Data, 17, 5209–5219, https://doi.org/10.5194/essd-17-5209-2025, 2025. a
Büttner, N. and Fösig, R.: PIA Software (v3.1.0), https://doi.org/10.5281/zenodo.15592431, Zenodo [software], 2025. a
Büttner, N., Fösig, R., Böhmländer, A., Lacher, L., Vogel, F., Tarn, M., Bogert, P., Nadolny, J., Murray, B., and Möhler, O.: Automated analysis and quality assurance of ice-nucleating particle data: the PINE INP Analysis software PIA, Atmos. Meas. Tech., 19, 5007–5026, https://doi.org/10.5194/amt-19-5007-2026, 2026. a, b, c, d
Canzi, A., Freney, E., Grzegorczyk, P., Baray, J. L., and Planche, C.: Characterization and Parameterization of INP Concentration Variability Regarding the Source Emissions Origin, Observatoire de Physique du Globe de Clermond-Ferrand [data set], https://doi.org/10.25519/SH8R-F866, 2024. a
Canzi, A., Freney, E., Grzegorczyk, P., Baray, J. L., Lacher, L., and Planche, C.: Unraveling Ice Nucleating Particle Concentration Variability: Insights Into Source Emissions Origin and Parameterizations, J. Geophys. Res.-Atmos., 130, e2024JD041258, https://doi.org/10.1029/2024JD041258, 2025. a, b
Carslaw, K. S.: Aerosols and Climate, Elsevier, https://doi.org/10.1016/C2019-0-00121-5, 2022. a
Chatziparaschos, M., Myriokefalitakis, S., Kalivitis, N., Daskalakis, N., Nenes, A., Gonçalves Ageitos, M., Costa-Surós, M., Pérez García-Pando, C., Vrekoussis, M., and Kanakidou, M.: Assessing the global contribution of marine aerosols, terrestrial bioaerosols, and desert dust to ice-nucleating particle concentrations, Atmos. Chem. Phys., 25, 9085–9111, https://doi.org/10.5194/acp-25-9085-2025, 2025. a, b
Creamean, J. M., Hume, C. C., Vazquez, M., and Theisen, A.: Long-term measurements of ice nucleating particles at Atmospheric Radiation Measurement (ARM) sites worldwide, Earth Syst. Sci. Data, 17, 6943–6963, https://doi.org/10.5194/essd-17-6943-2025, 2025. a
de Boer, G., Hashino, T., and Tripoli, G. J.: Ice nucleation through immersion freezing in mixed-phase stratiform clouds: Theory and numerical simulations, 15th International Conference on Clouds and Precipitation, Atmos. Res., 96, 315–324, https://doi.org/10.1016/j.atmosres.2009.09.012, 2010. a
DeMott, P. J., Möhler, O., Cziczo, D. J., Hiranuma, N., Petters, M. D., Petters, S. S., Belosi, F., Bingemer, H. G., Brooks, S. D., Budke, C., Burkert-Kohn, M., Collier, K. N., Danielczok, A., Eppers, O., Felgitsch, L., Garimella, S., Grothe, H., Herenz, P., Hill, T. C. J., Höhler, K., Kanji, Z. A., Kiselev, A., Koop, T., Kristensen, T. B., Krüger, K., Kulkarni, G., Levin, E. J. T., Murray, B. J., Nicosia, A., O'Sullivan, D., Peckhaus, A., Polen, M. J., Price, H. C., Reicher, N., Rothenberg, D. A., Rudich, Y., Santachiara, G., Schiebel, T., Schrod, J., Seifried, T. M., Stratmann, F., Sullivan, R. C., Suski, K. J., Szakáll, M., Taylor, H. P., Ullrich, R., Vergara-Temprado, J., Wagner, R., Whale, T. F., Weber, D., Welti, A., Wilson, T. W., Wolf, M. J., and Zenker, J.: The Fifth International Workshop on Ice Nucleation phase 2 (FIN-02): laboratory intercomparison of ice nucleation measurements, Atmos. Meas. Tech., 11, 6231–6257, https://doi.org/10.5194/amt-11-6231-2018, 2018. a
DeMott, P. J., Mirrielees, J. A., Petters, S. S., Cziczo, D. J., Petters, M. D., Bingemer, H. G., Hill, T. C. J., Froyd, K., Garimella, S., Hallar, A. G., Levin, E. J. T., McCubbin, I. B., Perring, A. E., Rapp, C. N., Schiebel, T., Schrod, J., Suski, K. J., Weber, D., Wolf, M. J., Zawadowicz, M., Zenker, J., Möhler, O., and Brooks, S. D.: Field intercomparison of ice nucleation measurements: the Fifth International Workshop on Ice Nucleation Phase 3 (FIN-03), Atmos. Meas. Tech., 18, 639–672, https://doi.org/10.5194/amt-18-639-2025, 2025. a
Fanourgakis, G. S., Kanakidou, M., Nenes, A., Bauer, S. E., Bergman, T., Carslaw, K. S., Grini, A., Hamilton, D. S., Johnson, J. S., Karydis, V. A., Kirkevåg, A., Kodros, J. K., Lohmann, U., Luo, G., Makkonen, R., Matsui, H., Neubauer, D., Pierce, J. R., Schmale, J., Stier, P., Tsigaridis, K., van Noije, T., Wang, H., Watson-Parris, D., Westervelt, D. M., Yang, Y., Yoshioka, M., Daskalakis, N., Decesari, S., Gysel-Beer, M., Kalivitis, N., Liu, X., Mahowald, N. M., Myriokefalitakis, S., Schrödner, R., Sfakianaki, M., Tsimpidi, A. P., Wu, M., and Yu, F.: Evaluation of global simulations of aerosol particle and cloud condensation nuclei number, with implications for cloud droplet formation, Atmos. Chem. Phys., 19, 8591–8617, https://doi.org/10.5194/acp-19-8591-2019, 2019. a
Forster, P., Storelvmo, T., Armour, K., Collins, W., Dufresne, J. L., Frame, D., Lunt, D. J., Mauritsen, T., Palmer, M. D., Watanabe, M., Wild, M., and Zhang, H.: The Earth’s Energy Budget, Climate Feedbacks, and Climate Sensitivity, in: Climate Change 2021: The Physical Science Basis. Contribution of Working Group I to the Sixth Assessment Report of the Intergovernmental Panel on Climate Change, edited by: Masson-Delmotte, V., Zhai, P., Pirani, A., Connors, S. L., Péan, C., Berger, S., Caud, N., Chen, Y., Goldfarb, L., Gomis, M. I., Huang, M., Leitzell, K., Lonnoy, E., Matthews, J. B. R., Maycock, T. K., Waterfield, T., Yelekçi, O., Yu, R., and Zhou, B., Cambridge University Press, Cambridge, United Kingdom and New York, NY, USA, https://doi.org/10.1017/9781009157896.009, 2021. a
Gao, K., Vogel, F., Foskinis, R., Vratolis, S., Gini, M. I., Granakis, K., Zografou, O., Fetfatzis, P., Papayannis, A., Möhler, O., Eleftheriadis, K., and Nenes, A.: On the drivers of ice nucleating particle diurnal variability in Eastern Mediterranean clouds, npj Clim. Atmos. Sci., 8, 160, https://doi.org/10.1038/s41612-024-00817-9, 2025. a
Gelaro, R., McCarty, W., Suárez, M. J., Todling, R., Molod, A., Takacs, L., Randles, C. A., Darmenov, A., Bosilovich, M. G., Reichle, R., Wargan, K., Coy, L., Cullather, R., Draper, C., Akella, S., Buchard, V., Conaty, A., da Silva, A. M., Gu, W., Kim, G.-K., Koster, R., Lucchesi, R., Merkova, D., Nielsen, J. E., Partyka, G., Pawson, S., Putman, W., Rienecker, M., Schubert, S. D., Sienkiewicz, M., and Zhao, B.: The Modern-Era Retrospective Analysis for Research and Applications, Version 2 (MERRA-2), J. Clim., 30, 5419–5454, https://doi.org/10.1175/JCLI-D-16-0758.1, 2017. a
Gratzl, J., Brus, D., Doulgeris, K., Böhmländer, A., Möhler, O., and Grothe, H.: Fluorescent aerosol particles in the Finnish sub-Arctic during the Pallas Cloud Experiment 2022 campaign, Earth Syst. Sci. Data, 17, 3975–3985, https://doi.org/10.5194/essd-17-3975-2025, 2025. a
Hallar, A. G., McCubbin, I. B., Borys, R., Lowenthal, D. H., Wetzel, M., Hindman, E., Brooks, S. D., Steenburgh, W. J., Gratz, L., Hoch, S., Stephens, B., Horel, J. D., Molotch, N. P., Mace, G. G., Bailey, A., Pettersen, C., Andrews, E., Cziczo, D. J., and Garcia, M.: Storm Peak Laboratory: A Research and Training Facility for the Atmospheric Sciences, B. Am. Meteorol. Soc., 106, E1130–E1148, https://doi.org/10.1175/BAMS-D-24-0043.1, 2025. a
Hari, P. and Kulmala, M.: Station for Measuring Ecosystem-Atmosphere Relations (SMEAR II), Boreal Environ. Res., 10, 315–322, https://www.borenv.net/BER/archive/pdfs/ber10/ber10-315.pdf (last access: 1 September 2026), 2005. a
Hawker, R. E., Miltenberger, A. K., Wilkinson, J. M., Hill, A. A., Shipway, B. J., Cui, Z., Cotton, R. J., Carslaw, K. S., Field, P. R., and Murray, B. J.: The temperature dependence of ice-nucleating particle concentrations affects the radiative properties of tropical convective cloud systems, Atmos. Chem. Phys., 21, 5439–5461, https://doi.org/10.5194/acp-21-5439-2021, 2021. a
Herbert, R. J., Sanchez-Marroquin, A., Grosvenor, D. P., Pringle, K. J., Arnold, S. R., Murray, B. J., and Carslaw, K. S.: Gaps in our understanding of ice-nucleating particle sources exposed by global simulation of the UK Earth System Model, Atmos. Chem. Phys., 25, 291–325, https://doi.org/10.5194/acp-25-291-2025, 2025. a, b
Herbert, R. J., Lacher, L., Böhmländer, A., Tarn, M. D., Canzi, A., Pantoya, A., Freney, E., Höhler, K., Bogert, P., Planche, C., Tian, P., Adams, M., Barr, S., Brus, D., Büttner, N., Daily, M., Doulgeris, K., Eleftheridadis, K., Forster, G., Fösig, R., Georgakopoulos, D., Gini, M., Hallar, A. G., Krejci, R., Ludewig, E., Mazzola, M., McCubbin, I. B., Petäjä, T., Robinson, J., Vogel, F., Zieger, P., Arnold, S. R., Carslaw, K. S., Hiranuma, N., Möhler, O., and Murray, B. J.: GloPINE dataset: model-ready measurements of INP concentrations using PINE instruments, Zenodo [data set], https://doi.org/10.5281/zenodo.16745514, 2026. a, b, c, d, e, f, g, h
Hersbach, H., Bell, B., Berrisford, P., Hirahara, S., Horányi, A., Muñoz-Sabater, J., Nicolas, J., Peubey, C., Radu, R., Schepers, D., Simmons, A., Soci, C., Abdalla, S., Abellan, X., Balsamo, G., Bechtold, P., Biavati, G., Bidlot, J., Bonavita, M., De Chiara, G., Dahlgren, P., Dee, D., Diamantakis, M., Dragani, R., Flemming, J., Forbes, R., Fuentes, M., Geer, A., Haimberger, L., Healy, S., Hogan, R. J., Hólm, E., Janisková, M., Keeley, S., Laloyaux, P., Lopez, P., Lupu, C., Radnoti, G., de Rosnay, P., Rozum, I., Vamborg, F., Villaume, S., and Thépaut, J.-N.: The ERA5 global reanalysis, Q. J. Roy. Meteor. Soc., 146, 1999–2049, https://doi.org/10.1002/qj.3803, 2020. a
Hiranuma, N.: Examining the Ice-Nucleating Particles from SGP, Atmospheric Radiation Measurement (ARM), US Department of Energy [data set], https://www.arm.gov/research/campaigns/sgp2019exinpsgp (last access: 13 March 2024), 2019. a
Hiranuma, N.: Examining the Ice-Nucleating Particles from ENA, Atmospheric Radiation Measurement (ARM), US Department of Energy [data set], https://www.arm.gov/research/campaigns/ena2020exinpena (last access: 13 March 2024), 2020. a
Hiranuma, N.: Examining the Ice-Nucleating Particles from NSA, Atmospheric Radiation Measurement (ARM), US Department of Energy [data set], https://www.arm.gov/research/campaigns/nsa2021exinpnsa (last access: 8 January 2024), 2021. a
Hiranuma, N., Augustin-Bauditz, S., Bingemer, H., Budke, C., Curtius, J., Danielczok, A., Diehl, K., Dreischmeier, K., Ebert, M., Frank, F., Hoffmann, N., Kandler, K., Kiselev, A., Koop, T., Leisner, T., Möhler, O., Nillius, B., Peckhaus, A., Rose, D., Weinbruch, S., Wex, H., Boose, Y., DeMott, P. J., Hader, J. D., Hill, T. C. J., Kanji, Z. A., Kulkarni, G., Levin, E. J. T., McCluskey, C. S., Murakami, M., Murray, B. J., Niedermeier, D., Petters, M. D., O'Sullivan, D., Saito, A., Schill, G. P., Tajiri, T., Tolbert, M. A., Welti, A., Whale, T. F., Wright, T. P., and Yamashita, K.: A comprehensive laboratory study on the immersion freezing behavior of illite NX particles: a comparison of 17 ice nucleation measurement techniques, Atmos. Chem. Phys., 15, 2489–2518, https://doi.org/10.5194/acp-15-2489-2015, 2015. a
Hiranuma, N., Adachi, K., Bell, D. M., Belosi, F., Beydoun, H., Bhaduri, B., Bingemer, H., Budke, C., Clemen, H.-C., Conen, F., Cory, K. M., Curtius, J., DeMott, P. J., Eppers, O., Grawe, S., Hartmann, S., Hoffmann, N., Höhler, K., Jantsch, E., Kiselev, A., Koop, T., Kulkarni, G., Mayer, A., Murakami, M., Murray, B. J., Nicosia, A., Petters, M. D., Piazza, M., Polen, M., Reicher, N., Rudich, Y., Saito, A., Santachiara, G., Schiebel, T., Schill, G. P., Schneider, J., Segev, L., Stopelli, E., Sullivan, R. C., Suski, K., Szakáll, M., Tajiri, T., Taylor, H., Tobo, Y., Ullrich, R., Weber, D., Wex, H., Whale, T. F., Whiteside, C. L., Yamashita, K., Zelenyuk, A., and Möhler, O.: A comprehensive characterization of ice nucleation by three different types of cellulose particles immersed in water, Atmos. Chem. Phys., 19, 4823–4849, https://doi.org/10.5194/acp-19-4823-2019, 2019. a
Hoose, C. and Möhler, O.: Heterogeneous ice nucleation on atmospheric aerosols: a review of results from laboratory experiments, Atmos. Chem. Phys., 12, 9817–9854, https://doi.org/10.5194/acp-12-9817-2012, 2012. a
Huang, X., Field, P. R., Murray, B. J., Grosvenor, D. P., van den Heuvel, F., and Carslaw, K. S.: Different responses of cold-air outbreak clouds to aerosol and ice production depending on cloud temperature, Atmos. Chem. Phys., 25, 11363–11406, https://doi.org/10.5194/acp-25-11363-2025, 2025. a
Kanji, Z. A. and Abbatt, J. P. D.: The University of Toronto Continuous Flow Diffusion Chamber (UT-CFDC): A Simple Design for Ice Nucleation Studies, Aerosol Sci. Tech., 43, 730–738, https://doi.org/10.1080/02786820902889861, 2009. a
Kanji, Z. A., Ladino, L. A., Wex, H., Boose, Y., Burkert-Kohn, M., Cziczo, D. J., and Krämer, M.: Overview of Ice Nucleating Particles, Meteor. Mon., 58, 1.1–1.33, https://doi.org/10.1175/AMSMONOGRAPHS-D-16-0006.1, 2017. a, b, c
Karlsson, L., Krejci, R., Koike, M., Ebell, K., and Zieger, P.: A long-term study of cloud residuals from low-level Arctic clouds, Atmos. Chem. Phys., 21, 8933–8959, https://doi.org/10.5194/acp-21-8933-2021, 2021. a
Knopf, D. A., Barry, K. R., Brubaker, T. A., Jahl, L. G., Jankowski, K. A., Li, J., Lu, Y., Monroe, L. W., Moore, K. A., Rivera-Adorno, F. A., Sauceda, K. A., Shi, Y., Tomlin, J. M., Vepuri, H. S. K., Wang, P., Lata, N. N., Levin, E. J. T., Creamean, J. M., Hill, T. C. J., China, S., Alpert, P. A., Moffet, R. C., Hiranuma, N., Sullivan, R. C., Fridlind, A. M., West, M., Riemer, N., Laskin, A., DeMott, P. J., and Liu, X.: Aerosol–Ice Formation Closure: A Southern Great Plains Field Campaign, B. Am. Meteorol. Soc., 102, E1952–E1971, https://doi.org/10.1175/BAMS-D-20-0151.1, 2021. a
Lacher, L.: PINE-01-A CORONA 2021, Karlsruhe Institute of Technology [data set], https://doi.org/10.35097/m61r3c6tn0t3qk1y, 2025a. a, b
Lacher, L.: PINE-01-A SPL01 2021-2022, Karlsruhe Institute of Technology [data set], https://doi.org/10.35097/rmfxfbr6jegua5cv, 2025b. a, b
Lacher, L.: PINE-01-A PICNIC 2018, Karlsruhe Institute of Technology [data set], https://doi.org/10.35097/7gt99xqnh6k8sw42, 2025c. a
Lacher, L., Adams, M. P., Barry, K., Bertozzi, B., Bingemer, H., Boffo, C., Bras, Y., Büttner, N., Castarede, D., Cziczo, D. J., DeMott, P. J., Fösig, R., Goodell, M., Höhler, K., Hill, T. C. J., Jentzsch, C., Ladino, L. A., Levin, E. J. T., Mertes, S., Möhler, O., Moore, K. A., Murray, B. J., Nadolny, J., Pfeuffer, T., Picard, D., Ramírez-Romero, C., Ribeiro, M., Richter, S., Schrod, J., Sellegri, K., Stratmann, F., Swanson, B. E., Thomson, E. S., Wex, H., Wolf, M. J., and Freney, E.: The Puy de Dôme ICe Nucleation Intercomparison Campaign (PICNIC): comparison between online and offline methods in ambient air, Atmos. Chem. Phys., 24, 2651–2678, https://doi.org/10.5194/acp-24-2651-2024, 2024. a, b
Lacher, L., Hallar, A. G., McCubbin, I. B., Bail, J., Froyd, K. D., Jacquot, J., Shen, X., Rapp, C., Möhler, O., and Cziczo, D.: Strong springtime increase of ice-nucleating particle concentration in the Rocky Mountains, Atmos. Chem. Phys., 26, 6703–6726, https://doi.org/10.5194/acp-26-6703-2026, 2026. a
Liu, X., Shi, X., Zhang, K., Jensen, E. J., Gettelman, A., Barahona, D., Nenes, A., and Lawson, P.: Sensitivity studies of dust ice nuclei effect on cirrus clouds with the Community Atmosphere Model CAM5, Atmos. Chem. Phys., 12, 12061–12079, https://doi.org/10.5194/acp-12-12061-2012, 2012. a
Lupi, A., Busetto, M., Becagli, S., Giardi, F., Lanconelli, C., Mazzola, M., Udisti, R., Hansson, H.-C., Henning, T., Petkov, B., Ström, J., Krejci, R., Tunved, P., Viola, A. P., and Vitale, V.: Multi-seasonal ultrafine aerosol particle number concentration measurements at the Gruvebadet observatory, Ny-Ålesund, Svalbard Islands, Environmental Changes in Arctic, 27, 59–71, https://doi.org/10.1007/s12210-016-0532-8, 2016. a
Möhler, O., Adams, M., Lacher, L., Vogel, F., Nadolny, J., Ullrich, R., Boffo, C., Pfeuffer, T., Hobl, A., Weiß, M., Vepuri, H. S. K., Hiranuma, N., and Murray, B. J.: The Portable Ice Nucleation Experiment (PINE): a new online instrument for laboratory studies and automated long-term field observations of ice-nucleating particles, Atmos. Meas. Tech., 14, 1143–1166, https://doi.org/10.5194/amt-14-1143-2021, 2021. a, b, c, d, e, f, g, h, i
Murray, B. J., O'Sullivan, D., Atkinson, J. D., and Webb, M. E.: Ice nucleation by particles immersed in supercooled cloud droplets, Chem. Soc. Rev., 41, 6519–6554, https://doi.org/10.1039/C2CS35200A, 2012. a, b, c, d
Murray, B. J., Carslaw, K. S., and Field, P. R.: Opinion: Cloud-phase climate feedback and the importance of ice-nucleating particles, Atmos. Chem. Phys., 21, 665–679, https://doi.org/10.5194/acp-21-665-2021, 2021. a
O’Sullivan, D., Adams, M. P., Tarn, M. D., Harrison, A. D., Vergara-Temprado, J., Porter, G. C. E., Holden, M. A., Sanchez-Marroquin, A., Carotenuto, F., Whale, T. F., McQuaid, J. B., Walshaw, R., Hedges, D. H. P., Burke, I. T., Cui, Z., and Murray, B. J.: Contributions of biogenic material to the atmospheric ice-nucleating particle population in North Western Europe, Sci. Rep., 8, https://doi.org/10.1038/s41598-018-31981-7, 2018. a, b, c
Pantoya, A. D., Simonsen, S. R., Andrews, E., Burgener, R., Cox, C. J., de Boer, G., Thomas, B. D., and Hiranuma, N.: Multi-seasonal measurements of the ground-level atmospheric ice-nucleating particle abundance on the North Slope of Alaska, Aerosol Res., 3, 253–270, https://doi.org/10.5194/ar-3-253-2025, 2025. a
Petersen, R. C., Hallar, A. G., McCubbin, I. B., Ogren, J. A., Andrews, E., Lowenthal, D., Gorder, R., Purcell, R., Sleeth, D., and Novosselov, I.: Numerical, wind-tunnel, and atmospheric evaluation of a turbulent ground-based inlet sampling system, Aerosol Sci. Tech., 53, 712–727, https://doi.org/10.1080/02786826.2019.1602718, 2019. a
Platt, S. M., Hov, Ø., Berg, T., Breivik, K., Eckhardt, S., Eleftheriadis, K., Evangeliou, N., Fiebig, M., Fisher, R., Hansen, G., Hansson, H.-C., Heintzenberg, J., Hermansen, O., Heslin-Rees, D., Holmén, K., Hudson, S., Kallenborn, R., Krejci, R., Krognes, T., Larssen, S., Lowry, D., Lund Myhre, C., Lunder, C., Nisbet, E., Nizzetto, P. B., Park, K.-T., Pedersen, C. A., Aspmo Pfaffhuber, K., Röckmann, T., Schmidbauer, N., Solberg, S., Stohl, A., Ström, J., Svendby, T., Tunved, P., Tørnkvist, K., van der Veen, C., Vratolis, S., Yoon, Y. J., Yttri, K. E., Zieger, P., Aas, W., and Tørseth, K.: Atmospheric composition in the European Arctic and 30 years of the Zeppelin Observatory, Ny-Ålesund, Atmos. Chem. Phys., 22, 3321–3369, https://doi.org/10.5194/acp-22-3321-2022, 2022. a
Rogers, D. C., DeMott, P. J., Kreidenweis, S. M., and Chen, Y.: A Continuous-Flow Diffusion Chamber for Airborne Measurements of Ice Nuclei, J. Atmos. Ocean. Tech., 18, 725–741, https://doi.org/10.1175/1520-0426(2001)018<0725:ACFDCF>2.0.CO;2, 2001. a
Schrod, J. and Bingemer, H. G.: A view on recent ice-nucleating particle intercomparison studies: why the uncertainty of the activation temperature matters, Atmos. Meas. Tech., 18, 2591–2605, https://doi.org/10.5194/amt-18-2591-2025, 2025. a
Shi, Y. and Liu, X.: Dust Radiative Effects on Climate by Glaciating Mixed-Phase Clouds, Geophys. Res. Lett., 46, 6128–6137, https://doi.org/10.1029/2019GL082504, 2019. a
Stein, A. F., Draxler, R. R., Rolph, G. D., Stunder, B. J. B., Cohen, M. D., and Ngan, F.: NOAA’s HYSPLIT Atmospheric Transport and Dispersion Modeling System, B. Am. Meteorol. Soc., 96, 2059–2077, https://doi.org/10.1175/BAMS-D-14-00110.1, 2015. a
Stetzer, O., Baschek, B., Lüönd, F., and Lohmann, U.: The Zurich Ice Nucleation Chamber (ZINC) – A New Instrument to Investigate Atmospheric Ice Formation, Aerosol Sci. Tech., 42, 64–74, https://doi.org/10.1080/02786820701787944, 2008. a
Szopa, S., Naik, V., Adhikary, B., Artaxo, P., Berntsen, T., Collins, W. D., Fuzzi, S., Gallardo, L., Kiendler-Scharr, A., Klimont, Z., Liao, H., Unger, N., and Zanis, P.: The Earth’s Energy Budget, Climate Feedbacks, and Climate Sensitivity, in: Climate Change 2021: The Physical Science Basis. Contribution of Working Group I to the Sixth Assessment Report of the Intergovernmental Panel on Climate Change, edited by: Masson-Delmotte, V., Zhai, P., Pirani, A., Connors, S. L., Péan, C., Berger, S., Caud, N., Chen, Y., Goldfarb, L., Gomis, M. I., Huang, M., Leitzell, K., Lonnoy, E., Matthews, J. B. R., Maycock, T. K., Waterfield, T., Yelekçi, O., Yu, R., and Zhou, B., Cambridge University Press, Cambridge, United Kingdom and New York, NY, USA, https://doi.org/10.1017/9781009157896.009, 2021. a, b
Tarn, M. and Murray, B.: Data from the Portable Ice Nucleation Experiment (PINE) during the CountIce (part 1) 2021–2022 campaign, Zenodo [data set], https://doi.org/10.5281/zenodo.17451020, 2025a. a, b
Tarn, M. and Murray, B.: Data from the Portable Ice Nucleation Experiment (PINE) during the CountIce (part 2) 2023 campaign, Zenodo [data set], https://doi.org/10.5281/zenodo.17451024, 2025b. a, b
Tarn, M., Barr, S., and Murray, B.: Data from the Portable Ice Nucleation Experiment (PINE) during the M-Phase 2022 research cruise, Zenodo [data set], https://doi.org/10.5281/zenodo.17378346, 2025. a, b
Vergara-Temprado, J., Miltenberger, A. K., Furtado, K., Grosvenor, D. P., Shipway, B. J., Hill, A. A., Wilkinson, J. M., Field, P. R., Murray, B. J., and Carslaw, K. S.: Strong control of Southern Ocean cloud reflectivity by ice-nucleating particles, P. Natl. Acad. Sci., 115, 2687–2692, https://doi.org/10.1073/pnas.1721627115, 2018. a
Vogel, F.: PINE-04-01 CORONA 2021, Karlsruhe Institute of Technology [data set], https://doi.org/10.35097/j823gv823jbwy7b0, 2025a. a, b
Vogel, F.: PINE-05-02 FROSTDEFEND_23 2023, Karlsruhe Institute of Technology [data set], https://doi.org/10.35097/mdxcqd7p646cwc0u, 2025b. a, b
Vogel, F.: PINE-04-01 CALISTHO21 2021, Karlsruhe Institute of Technology [data set], https://doi.org/10.35097/jxwbwycbyu64n2p0, 2025c. a
Vogel, F.: PINE-04-01 CALISTHO21_new 2021, Karlsruhe Institute of Technology [data set], https://doi.org/10.35097/4xawjaqwteyvx4fr, 2025d. a
Vogel, F., Adams, M. P., Lacher, L., Foster, P. B., Porter, G. C. E., Bertozzi, B., Höhler, K., Schneider, J., Schorr, T., Umo, N. S., Nadolny, J., Brasseur, Z., Heikkilä, P., Thomson, E. S., Büttner, N., Daily, M. I., Fösig, R., Harrison, A. D., Keskinen, J., Proske, U., Duplissy, J., Kulmala, M., Petäjä, T., Möhler, O., and Murray, B. J.: Ice-nucleating particles active below −24 °C in a Finnish boreal forest and their relationship to bioaerosols, Atmos. Chem. Phys., 24, 11737–11757, https://doi.org/10.5194/acp-24-11737-2024, 2024. a, b
Westbrook, C. D. and Illingworth, A. J.: The formation of ice in a long-lived supercooled layer cloud, Q. J. Roy. Meteor. Soc., 139, 2209–2221, https://doi.org/10.1002/qj.2096, 2013. a
Wex, H., Augustin-Bauditz, S., Boose, Y., Budke, C., Curtius, J., Diehl, K., Dreyer, A., Frank, F., Hartmann, S., Hiranuma, N., Jantsch, E., Kanji, Z. A., Kiselev, A., Koop, T., Möhler, O., Niedermeier, D., Nillius, B., Rösch, M., Rose, D., Schmidt, C., Steinke, I., and Stratmann, F.: Intercomparing different devices for the investigation of ice nucleating particles using Snomax® as test substance, Atmos. Chem. Phys., 15, 1463–1485, https://doi.org/10.5194/acp-15-1463-2015, 2015. a
Wilbourn, E. K., Lacher, L., Guerrero, C., Vepuri, H. S. K., Höhler, K., Nadolny, J., Pantoya, A. D., Möhler, O., and Hiranuma, N.: Measurement report: A comparison of ground-level ice-nucleating-particle abundance and aerosol properties during autumn at contrasting marine and terrestrial locations, Atmos. Chem. Phys., 24, 5433–5456, https://doi.org/10.5194/acp-24-5433-2024, 2024. a, b, c, d