the Creative Commons Attribution 4.0 License.
the Creative Commons Attribution 4.0 License.
 | 03 Sep 2026
A high-resolution air-sea synoptic observation dataset from drifting buoys in the Bay of Bengal
Wei Huang
Guihua Wang

Changlin Chen
Gengxin Chen
Weiqiang Wang
Mass and heat exchanges at the air-sea interface fundamentally drive global weather and climate systems. However, acquiring long-term, high-frequency, synchronous in-situ observations of both atmospheric and oceanic variables remain highly challenging, especially during extreme weather. This paper presents a high-resolution dataset from five air-sea drifting buoys deployed in the Bay of Bengal (BoB) in 2020 and 2022. These buoys captured precise, synchronous measurements of key meteorological parameters (air temperature, sea-level pressure, wind speed and direction, and relative humidity) alongside sea surface temperature. The dataset is typically sampled hourly; however, the sampling was increased to 5 min intervals during tropical cyclones Nivar, Burevi, Four and Asani. This high-frequency dataset offers invaluable in-situ records for studying diurnal variations and fine-scale processes in the BoB. Furthermore, it provides critical observational data to advance our understanding of air-sea coupling, validate high-frequency satellite products, and improve parameterizations in regional numerical weather prediction models under extreme conditions. The dataset is freely available at https://doi.org/10.5281/zenodo.21294873 (Huang et al., 2026).
- Article
(4194 KB) - Full-text XML
- BibTeX
- EndNote


The air-sea interface is a critical boundary for mass, heat, and momentum exchange, directly driving the global climate and regional weather systems (Cronin et al., 2019). However, acquiring long-term, high-frequency, synchronous in-situ observations of both atmospheric and oceanic variables remains a major challenge (Bourassa et al., 2013). Widely deployed drifting buoy arrays (e.g., Surface Velocity Program (SVP) buoys in the Global Drifter Program) offer extensive spatial coverage but typically measure only sea surface temperature (SST) and surface currents, lacking synchronous atmospheric observations (Lumpkin and Pazos, 2007; Centurioni, 2018). Conversely, moored buoys provide multi-variable time series but lack spatial mobility, limiting their ability to fully capture meso- and submesoscale air-sea processes over large regions. Consequently, datasets from advanced air-sea drifting buoys capable of high-frequency, synchronous multi-variable observations remain exceedingly scarce.
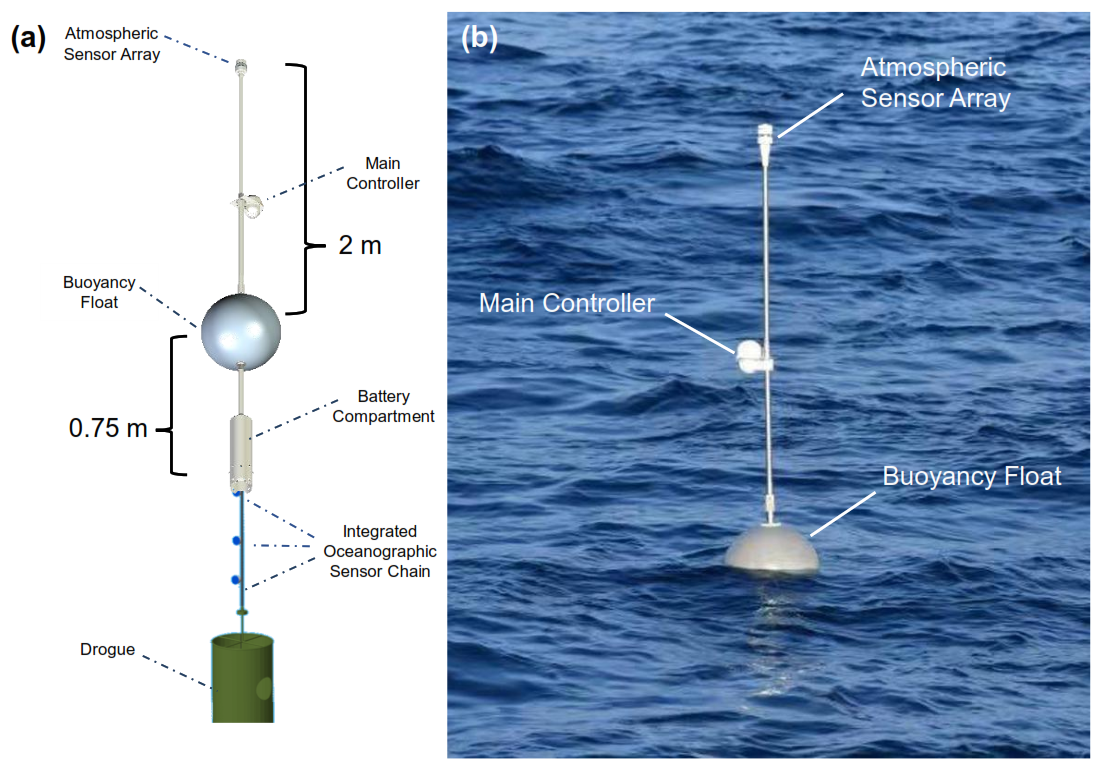
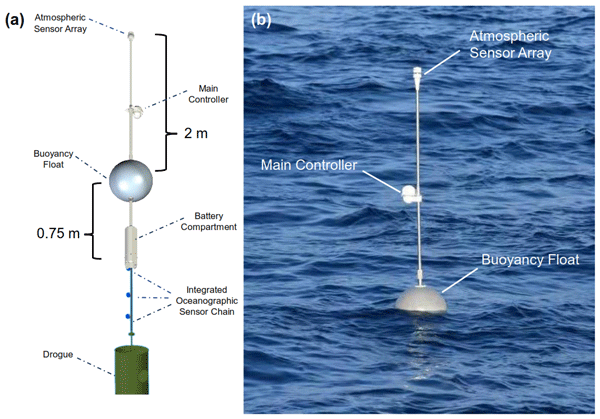
Figure 1Overview of the drifting buoy system. (a) Structural diagram; (b) in-situ photograph of the buoy deployed at sea. The system consists of a main body, a sensor chain, and a drogue. Atmospheric sensors are mounted 2 m above the sea surface, with a satellite transceiver housed in the middle section for data transmission. The underwater sensor chain attaches to the bottom of the battery compartment, while the suspended drogue ensures Lagrangian (flow-following) capability.
The Bay of Bengal (BoB) serves as an ideal natural laboratory for studying multi-scale air-sea interactions (Mahadevan et al., 2016). This region is heavily influenced by monsoons, driving complete reversals in surface circulation and intense eddy activity (Shankar et al., 2002). Furthermore, intense precipitation and substantial river runoff create a strong near-surface freshwater “barrier layer”. This stratification reduces the vertical mixing of cooler subsurface waters, maintaining post-monsoon SSTs typically above 30 °C (Weller et al., 2016). This profoundly modulates upper-ocean diurnal variations and creates a unique thermodynamic environment that not only fuels the genesis and rapid intensification of tropical cyclones (TCs) (Singh and Roxy, 2022), but also contributes to the high frequency of cyclonic events in this basin (Bhardwaj and Singh, 2020).
Given the BoB's extreme dynamical complexity and frequent severe weather, high-resolution in-situ observations are essential. While existing moored networks (e.g., RAMA, McPhaden et al., 2009; OMNI, Venkatesan et al., 2013) provide essential baseline climatological data, they face severe survivability challenges during TC-induced extreme sea states. To address this gap, this study releases a dataset from five high-resolution air-sea drifting buoys deployed in the BoB in 2020 and 2022. A key strength of this dataset is its dual capacity for long-term baseline monitoring and high-frequency extreme event capture. Under typical conditions, the buoys recorded stable hourly measurements; during severe TCs (Nivar, November 2020; Burevi, November 2020; Asani, May 2022 and Four, August 2022), the sampling frequency was manually increased to 5–30 min intervals as needed, when an approaching tropical cyclone was identified from forecasts. Spanning typical diurnal cycles to extreme wind forcing, this high-resolution dataset is vital for uncovering fine-scale BoB Ocean dynamics and serves as a valuable benchmark for improving air-sea flux parameterizations in numerical weather prediction models under extreme conditions.
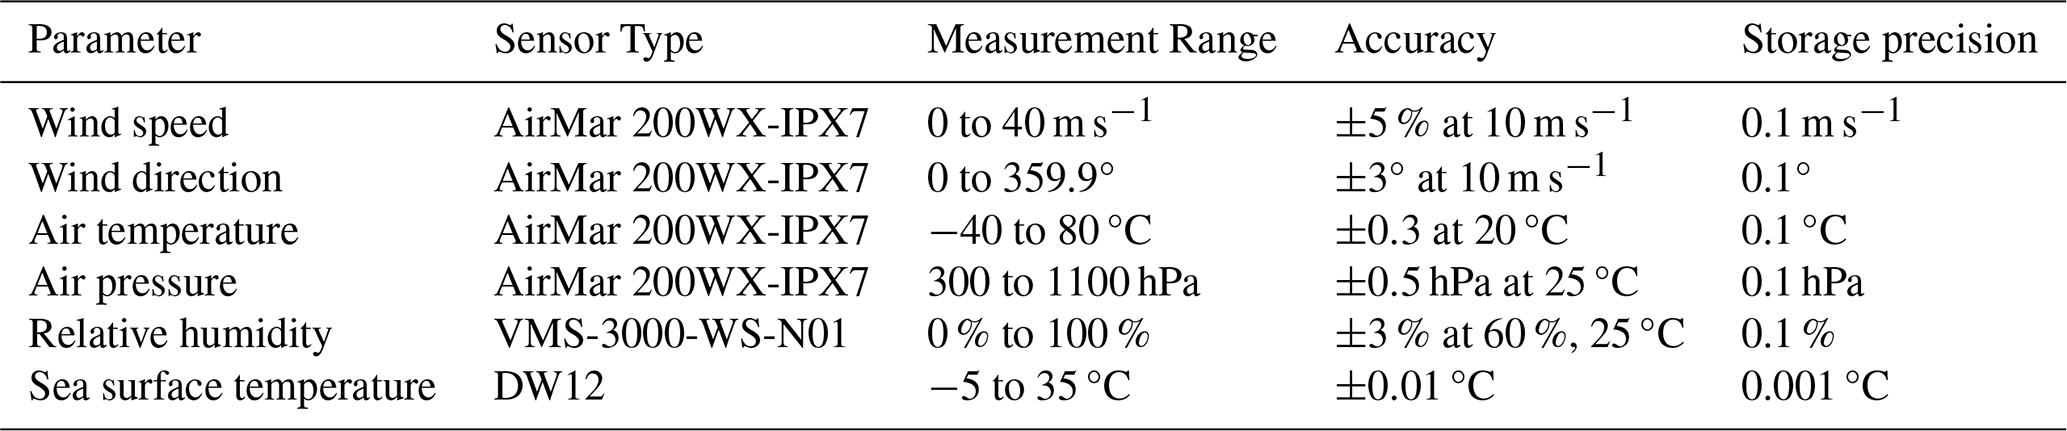
The drifting buoy system used in this dataset, developed by the Department of Atmospheric and Oceanic Sciences, Fudan University, integrates atmospheric and oceanic sensors (Fig. 1). Utilizing the BeiDou Navigation Satellite System (BDS) for real-time positioning and data transmission, it provides continuous Lagrangian observations (from the ocean perspective) of key parameters: wind speed and direction, air temperature, relative humidity, sea-level pressure, and SST. The atmospheric module is mounted at 2 m above the sea surface, while the temperature sensor is positioned at 0.75 m below the waterline. To capture high-frequency air-sea interactions, the core sensors feature high precision (e.g., 0.1 hPa for air pressure, 0.1 °C for air temperature and 0.001 °C for SST). Table 1 summarizes the detailed technical specifications for all sensors. The system defaults to hourly sampling, which can be intensified to 5, 10, or 30 min via satellite command during extreme events like TCs.
Table 1Specifications of the sensors equipped on the drifting air-sea interface buoys.
The five buoys were deployed in the BoB in two batches (Fig. 2). The first batch was deployed in November 2020 at (87° E, 15° N) and (87° E, 9.8° N) for buoys 20097 and 20098, respectively. Drifting through a mesoscale eddy and the southward-flowing western boundary current during autumn and winter (Mukherjee et al., 2014), these buoys captured continuous observations during TCs Nivar and Burevi. They averaged 68 operational days and yielded 12 355 valid records. The second batch was deployed in April 2022 around 87° E, 10.1° N for the three buoys of 200D4, 200D8, and 200DA. Notably, two of these buoys (200D4 and 200DA) drifted in close parallel for an extended period, providing rare data on meso- and submesoscale spatial correlations. This batch recorded the air-sea responses to TCs Asani and Four, averaging 80 operational days (ranging from 28 to 150 d) and accumulating 127 199 valid records.
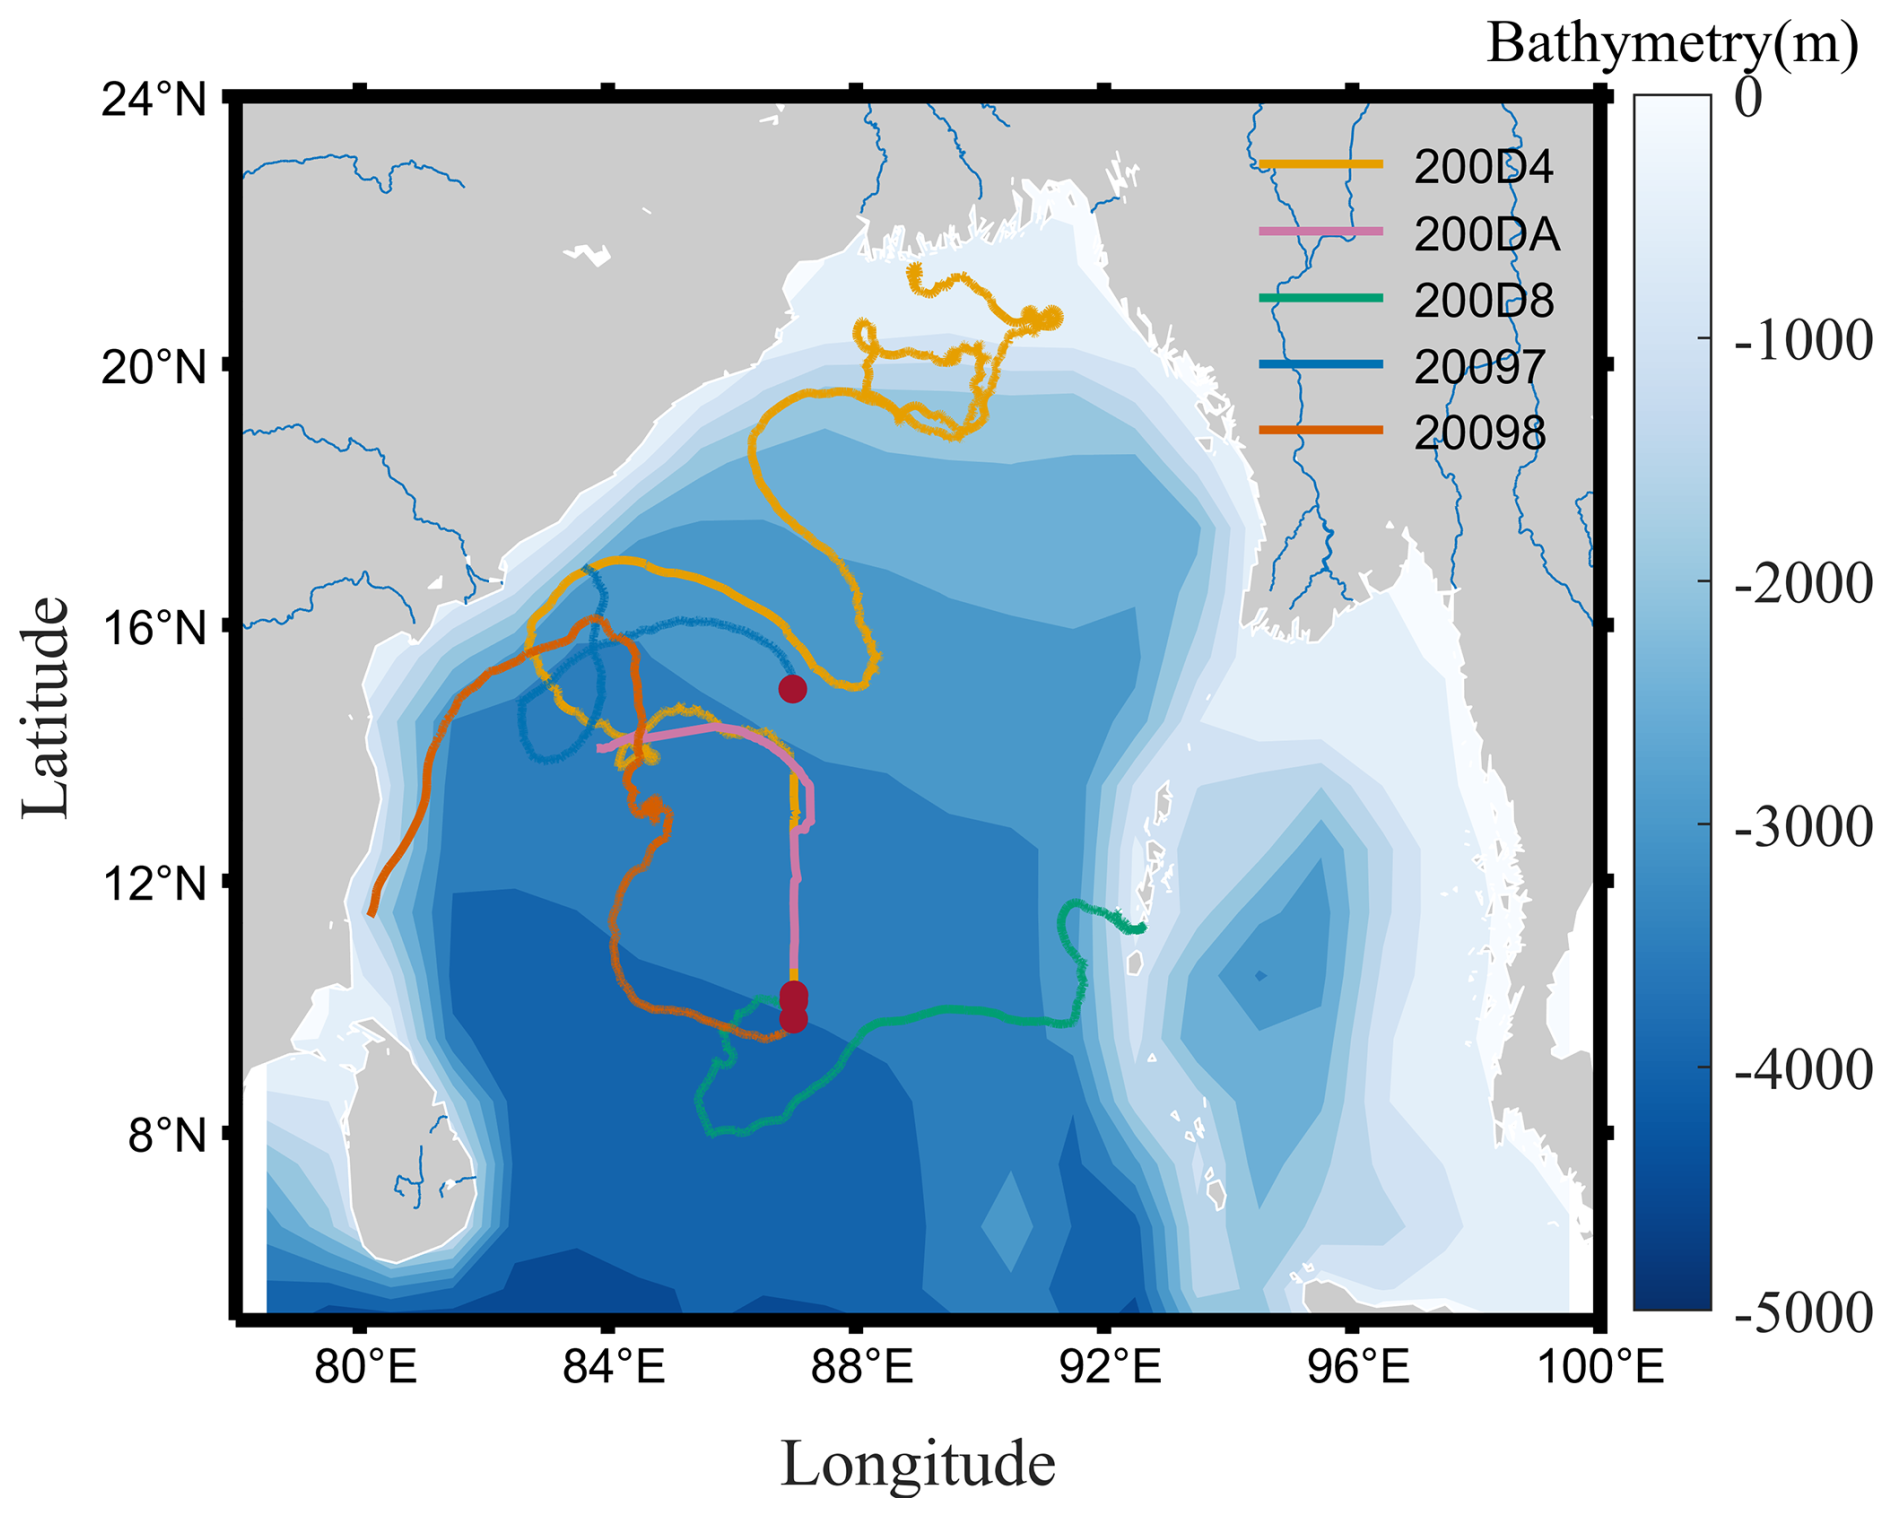
Figure 2Trajectories of the five drifting buoys in the BoB. Solid red dots indicate the initial deployment positions, and background shading represents bathymetry. Colored lines denote the drift paths of individual buoys: 200D4 (yellow), 200DA (pink), 200D8 (green), 20097 (blue), and 20098 (orange).
3.1 Data Preprocessing and Quality Control
To ensure data reliability, all raw observations underwent a standardized quality control (QC) workflow. First, the time series were uniformly standardized to Coordinated Universal Time (UTC) to maintain temporal consistency. Second, a rigorous two-step QC procedure – comprising outlier removal and ERA5 reanalysis validation – was applied to address sensor noise and environmental unpredictability.
-
Outlier Removal: Raw data inevitably contain anomalous spikes. We employed a two-step cleaning method. First, a physical range check removed values exceeding climatological norms or instrument limits (e.g., unrealistic wind speed spikes). Next, we applied a three-sigma (3σ) criterion based on a 24-point moving window to filter any remaining anomalies: values deviating from the mean by more than three standard deviations were flagged as outliers and encoded the reason for each flag (e.g., 0 = passed; 1 = outside instrument range; 2 = outside climatological bounds; 3 = exceeds the 3σ criterion). Per buoy, the flagged fractions are 0.08 % (20097), 0.19 % (20098), 0.20 % (200D4), 0.38 % (200D8), and 0.77 % (200DA). The final dataset retains the raw observations while providing the corresponding quality flags for any identified anomalies.
-
ERA5 Validation: We compared our data against the ECMWF ERA5 reanalysis dataset (Hersbach et al., 2020). Buoy measurements were temporally synchronized with ERA5's hourly data. Overall, the buoy observations show high consistency with ERA5 in low-frequency trends. Specifically, sea-level pressure (Fig. 3b) and SST (Fig. 3c) align closely, accurately reflecting synoptic weather passages and thermal background evolution. However, for dynamically volatile parameters like zonal and meridional wind components (Fig. 3d) and air-sea heat fluxes (Fig. 3e), the in-situ measurements exhibit clear advantages. Constrained by spatial-smoothing and lower temporal resolution, ERA5 tends to underestimate transient extremes during severe weather, such as TCs. For buoy 20098 during TCs Nivar and Burevi, ERA5 underestimates the observed peak sensible heat flux by up to ∼44–67 % and the peak latent heat flux by ∼12–25 %.
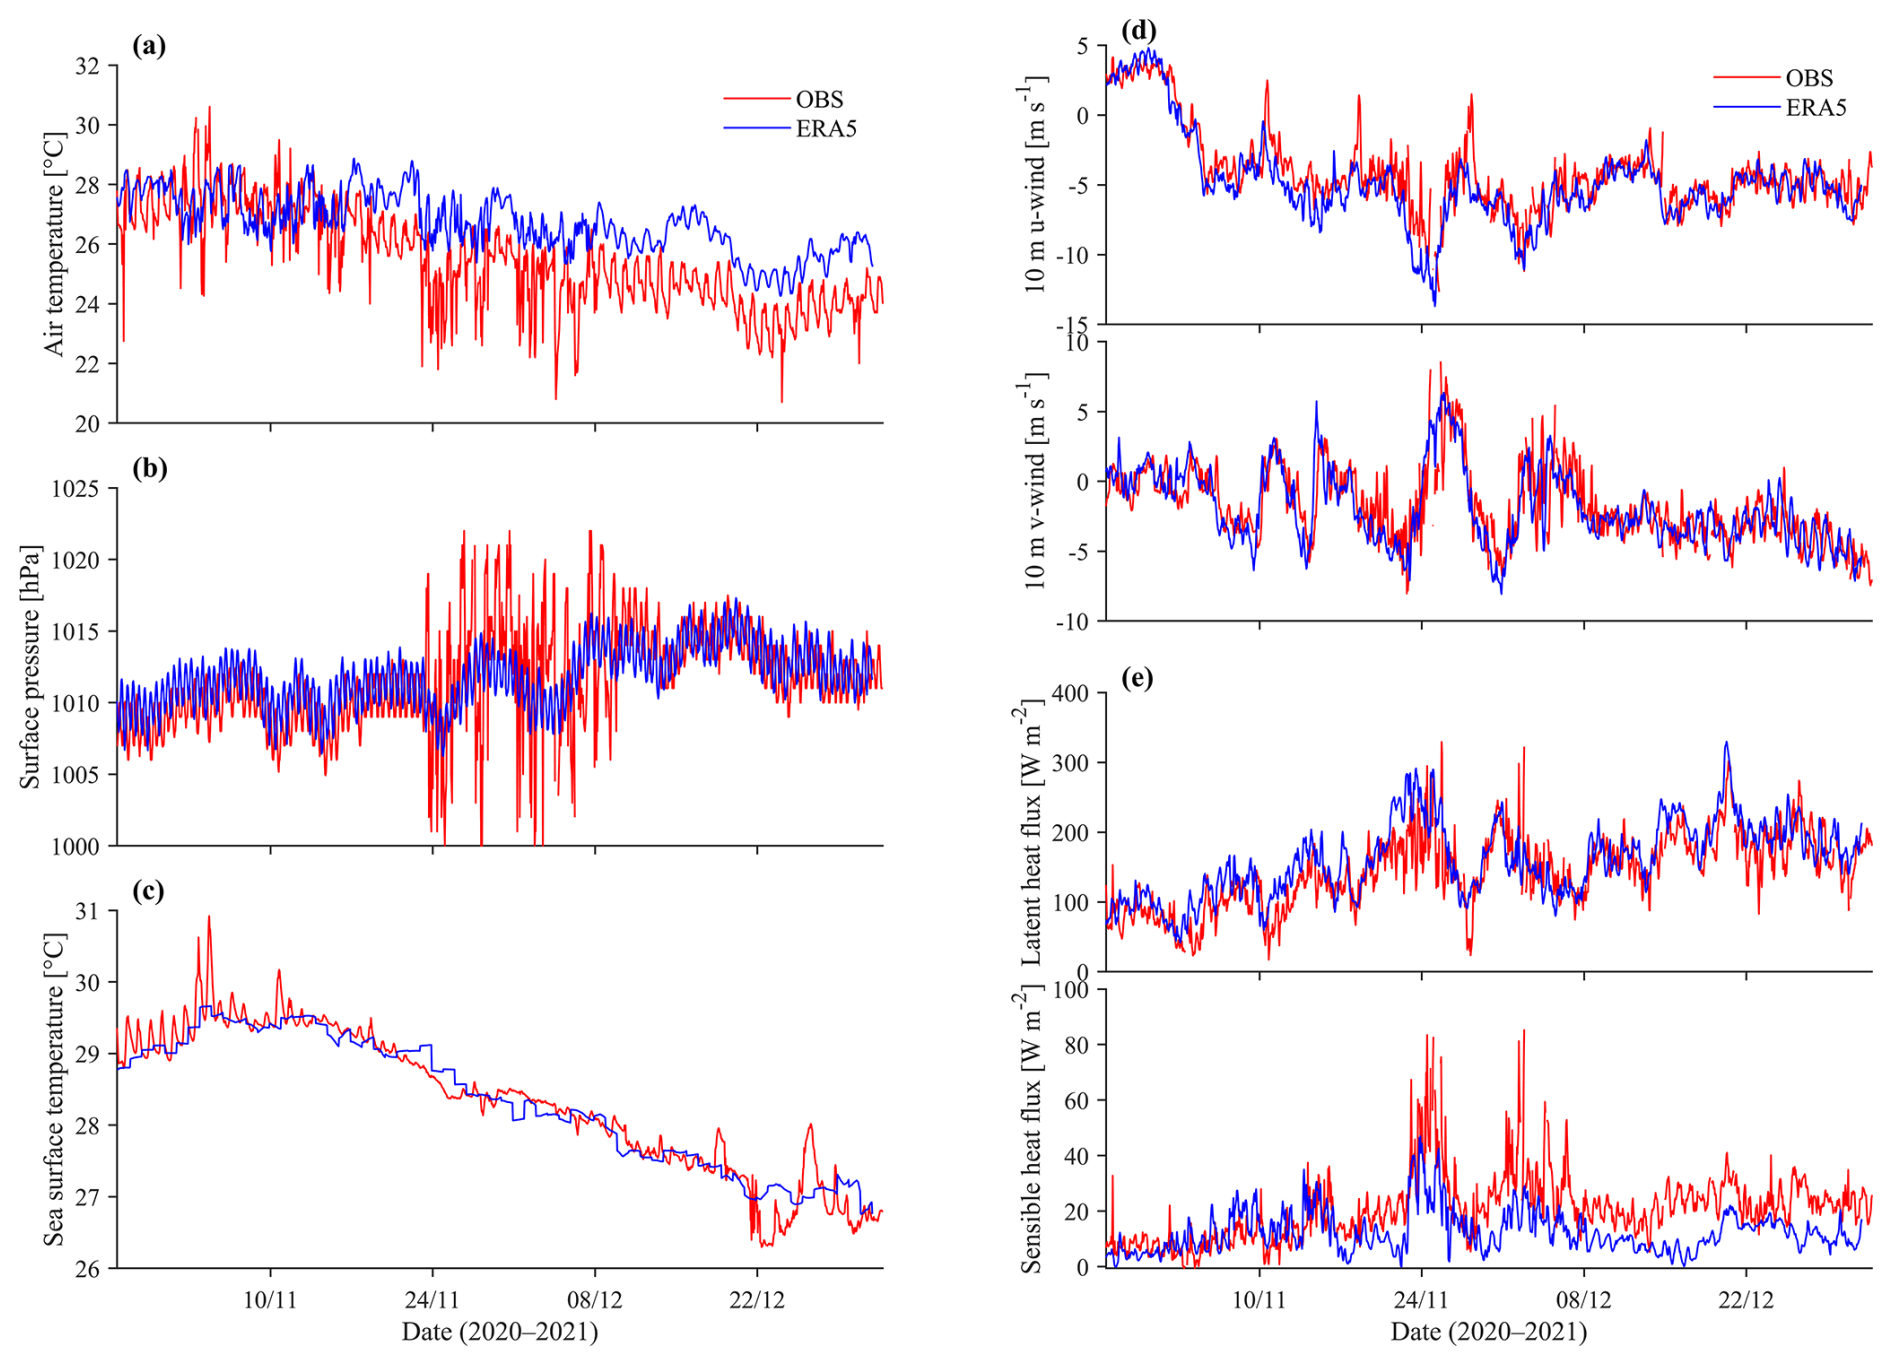
Figure 3Time-series comparison of Buoy 20098 observations (red lines) and ERA5 reanalysis data (blue lines). The 10 m wind speed was calculated from the 2 m wind observations with the COARE 3.0 algorithm via Monin–Obukhov similarity theory, and the buoy measurements were averaged to hourly intervals for temporal synchronization with ERA5. Panels show: (a) air temperature, (b) sea-level pressure, (c) SST, (d) u- and v- wind speed components, and (e) latent and sensible heat fluxes.
3.2 Current Velocity and Direction
Since surface ocean currents primarily drive the motions of the buoys, their high-precision positioning and time-series data were used to derive surface velocity and direction. The surface current was decomposed into a zonal component (u, positive eastward) and a meridional component (v, positive northward), measured in m s−1. The calculation formulas are as follows:
where lon1, lon0 and lat1, lat0 are the longitudes and latitudes (in °) at adjacent observation times t1 and t0; is the interval between consecutive position fixes (in seconds), i.e., equal to the raw sampling interval at that time and R is the mean radius of the Earth (6.371 ×10⁶ m).
3.3 Air-Sea Heat Fluxes
Air-sea interactions are fundamentally governed by interfacial momentum and heat exchanges. The multi-variable buoy observations (air temperature, SST, relative humidity, and wind speed) provide essential in-situ data for estimating these fluxes (Zhang et al., 2025). We employed the Coupled Ocean-Atmosphere Response Experiment (COARE) bulk parameterization algorithm (version 3.0) to calculate sensible heat (SH) and latent heat (LH) fluxes (Fairall et al., 2003).
The core equations are as follows:
where ρ is the density of air (kg m−3), diagnosed from the observed pressure, air temperature, and humidity via the ideal gas law; CPa=1004.67 J kg−1 K−1 is the specific heat capacity of air at constant pressure (prescribed constant); LE is the latent heat of vaporization (J kg−1), parameterized as (Fairall et al., 1996); U is the near-surface wind speed (m s−1) , observed at 2 m; SST is the sea surface temperature (°C), observed at 0.75 m depth and treated as the bulk temperature with the cool-skin correction of COARE 3.0; Ta is the air temperature (°C), observed at 2 m; qs and qa are the specific humidities (kg kg−1) at the sea surface and in the near-surface air, respectively, with (the factor 0.98 accounting for salinity) and qa diagnosed from the observed relative humidity, air temperature, and pressure; CH and CE are the dimensionless sensible and latent heat transfer coefficients, which are not prescribed constants but are computed iteratively by the COARE 3.0 algorithm as functions of wind speed, atmospheric stability, and sea state via Monin–Obukhov similarity theory (Fairall et al., 2003). The COARE 3.0 algorithm accepts the 2 m observations directly as inputs with their measurement heights specified, and outputs the 10 m wind speed via Monin–Obukhov similarity theory (Fairall et al., 2003); the latter is used for comparison with ERA5 10 m wind in Fig. 3 and is provided in the released dataset (variable WSPD10) alongside the original observations at 2 m.
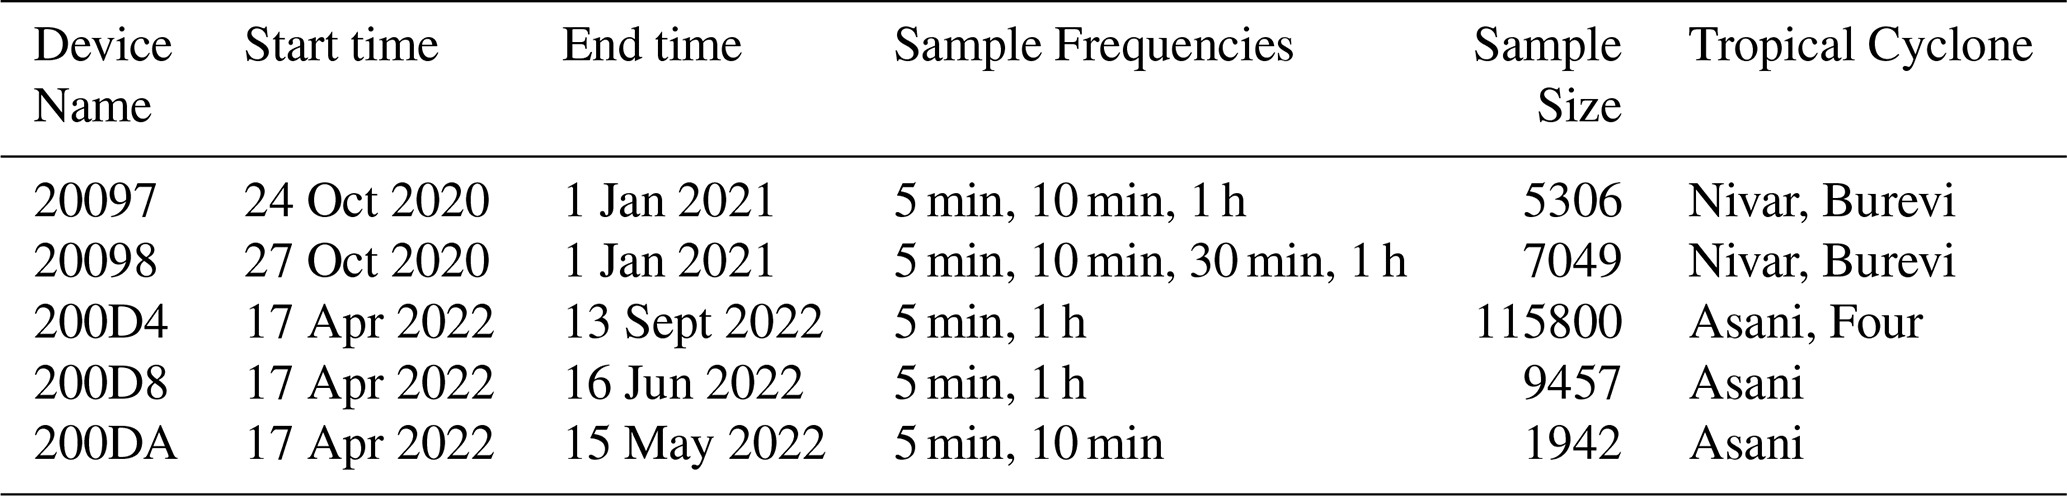
Figure 2 illustrates the complete trajectories of the five drifting buoys in the BoB. Despite initial deployments near the 87° E transect, their drift paths diverged significantly, encountering multiple extreme weather events, including TCs (Table 2), and recording highly variable air-sea conditions. Driven by cyclonic circulation (Shetye et al., 1996; Shankar et al., 2002), the winter 2020 buoys (20097, 20098) followed complex spiral trajectories in the central BoB, capturing the signatures of mesoscale eddies, the southward-flowing western boundary current, and TCs Nivar and Burevi. Conversely, the summer 2022 buoys (200D4, 200D8, 200DA) exhibited more coherent trajectories across a broader area, recording the passages of Tropical Cyclone Asani and Four. Together, these datasets provide essential in-situ support for investigating monsoon transitions and air-sea interactions in the BoB.
Time series of the observed meteorological and oceanic parameters are shown in Fig. 4. Under typical conditions, air temperature (21–35 °C) and SST exhibited clear diurnal cycles confirmed by spectral analysis (not show), with SST generally exceeding air temperature. While the high-frequency amplitude of SST was smaller: the mean diurnal range of air temperature is 2.4–2.9 °C across the five buoys, versus 0.3–0.5 °C for SST, it displayed distinct seasonal warming and cooling trends. Outside TC periods, wind speeds were moderate with 90 % of values below 6.5 m s−1 and 99 % below 8.2 m s−1 but sharply increased during TC encounters. For example, during TC Asani, wind speeds exceeded 20 m s−1, driving dramatic environmental changes at the air-sea interface. Sea-level pressure exhibited a signature plunge (Fig. 4h), accompanied by abrupt responses in SST (Fig. 4l), air temperature (Fig. 4g), and relative humidity (Fig. 4i). Notably, extreme wind forcing from TCs triggered a surge in air-sea heat fluxes (Fig. 5e, f), accompanied by a discernible increase in the surface current speed of buoy 200D4 (Fig. 5d). The instantaneous peak of LH flux reached 843.9 W m−2, far exceeding the non-TC baseline mean of 111.6 W m−2. These high-frequency records provide robust in-situ evidence for quantifying momentum and heat exchanges under extreme TC forcing.
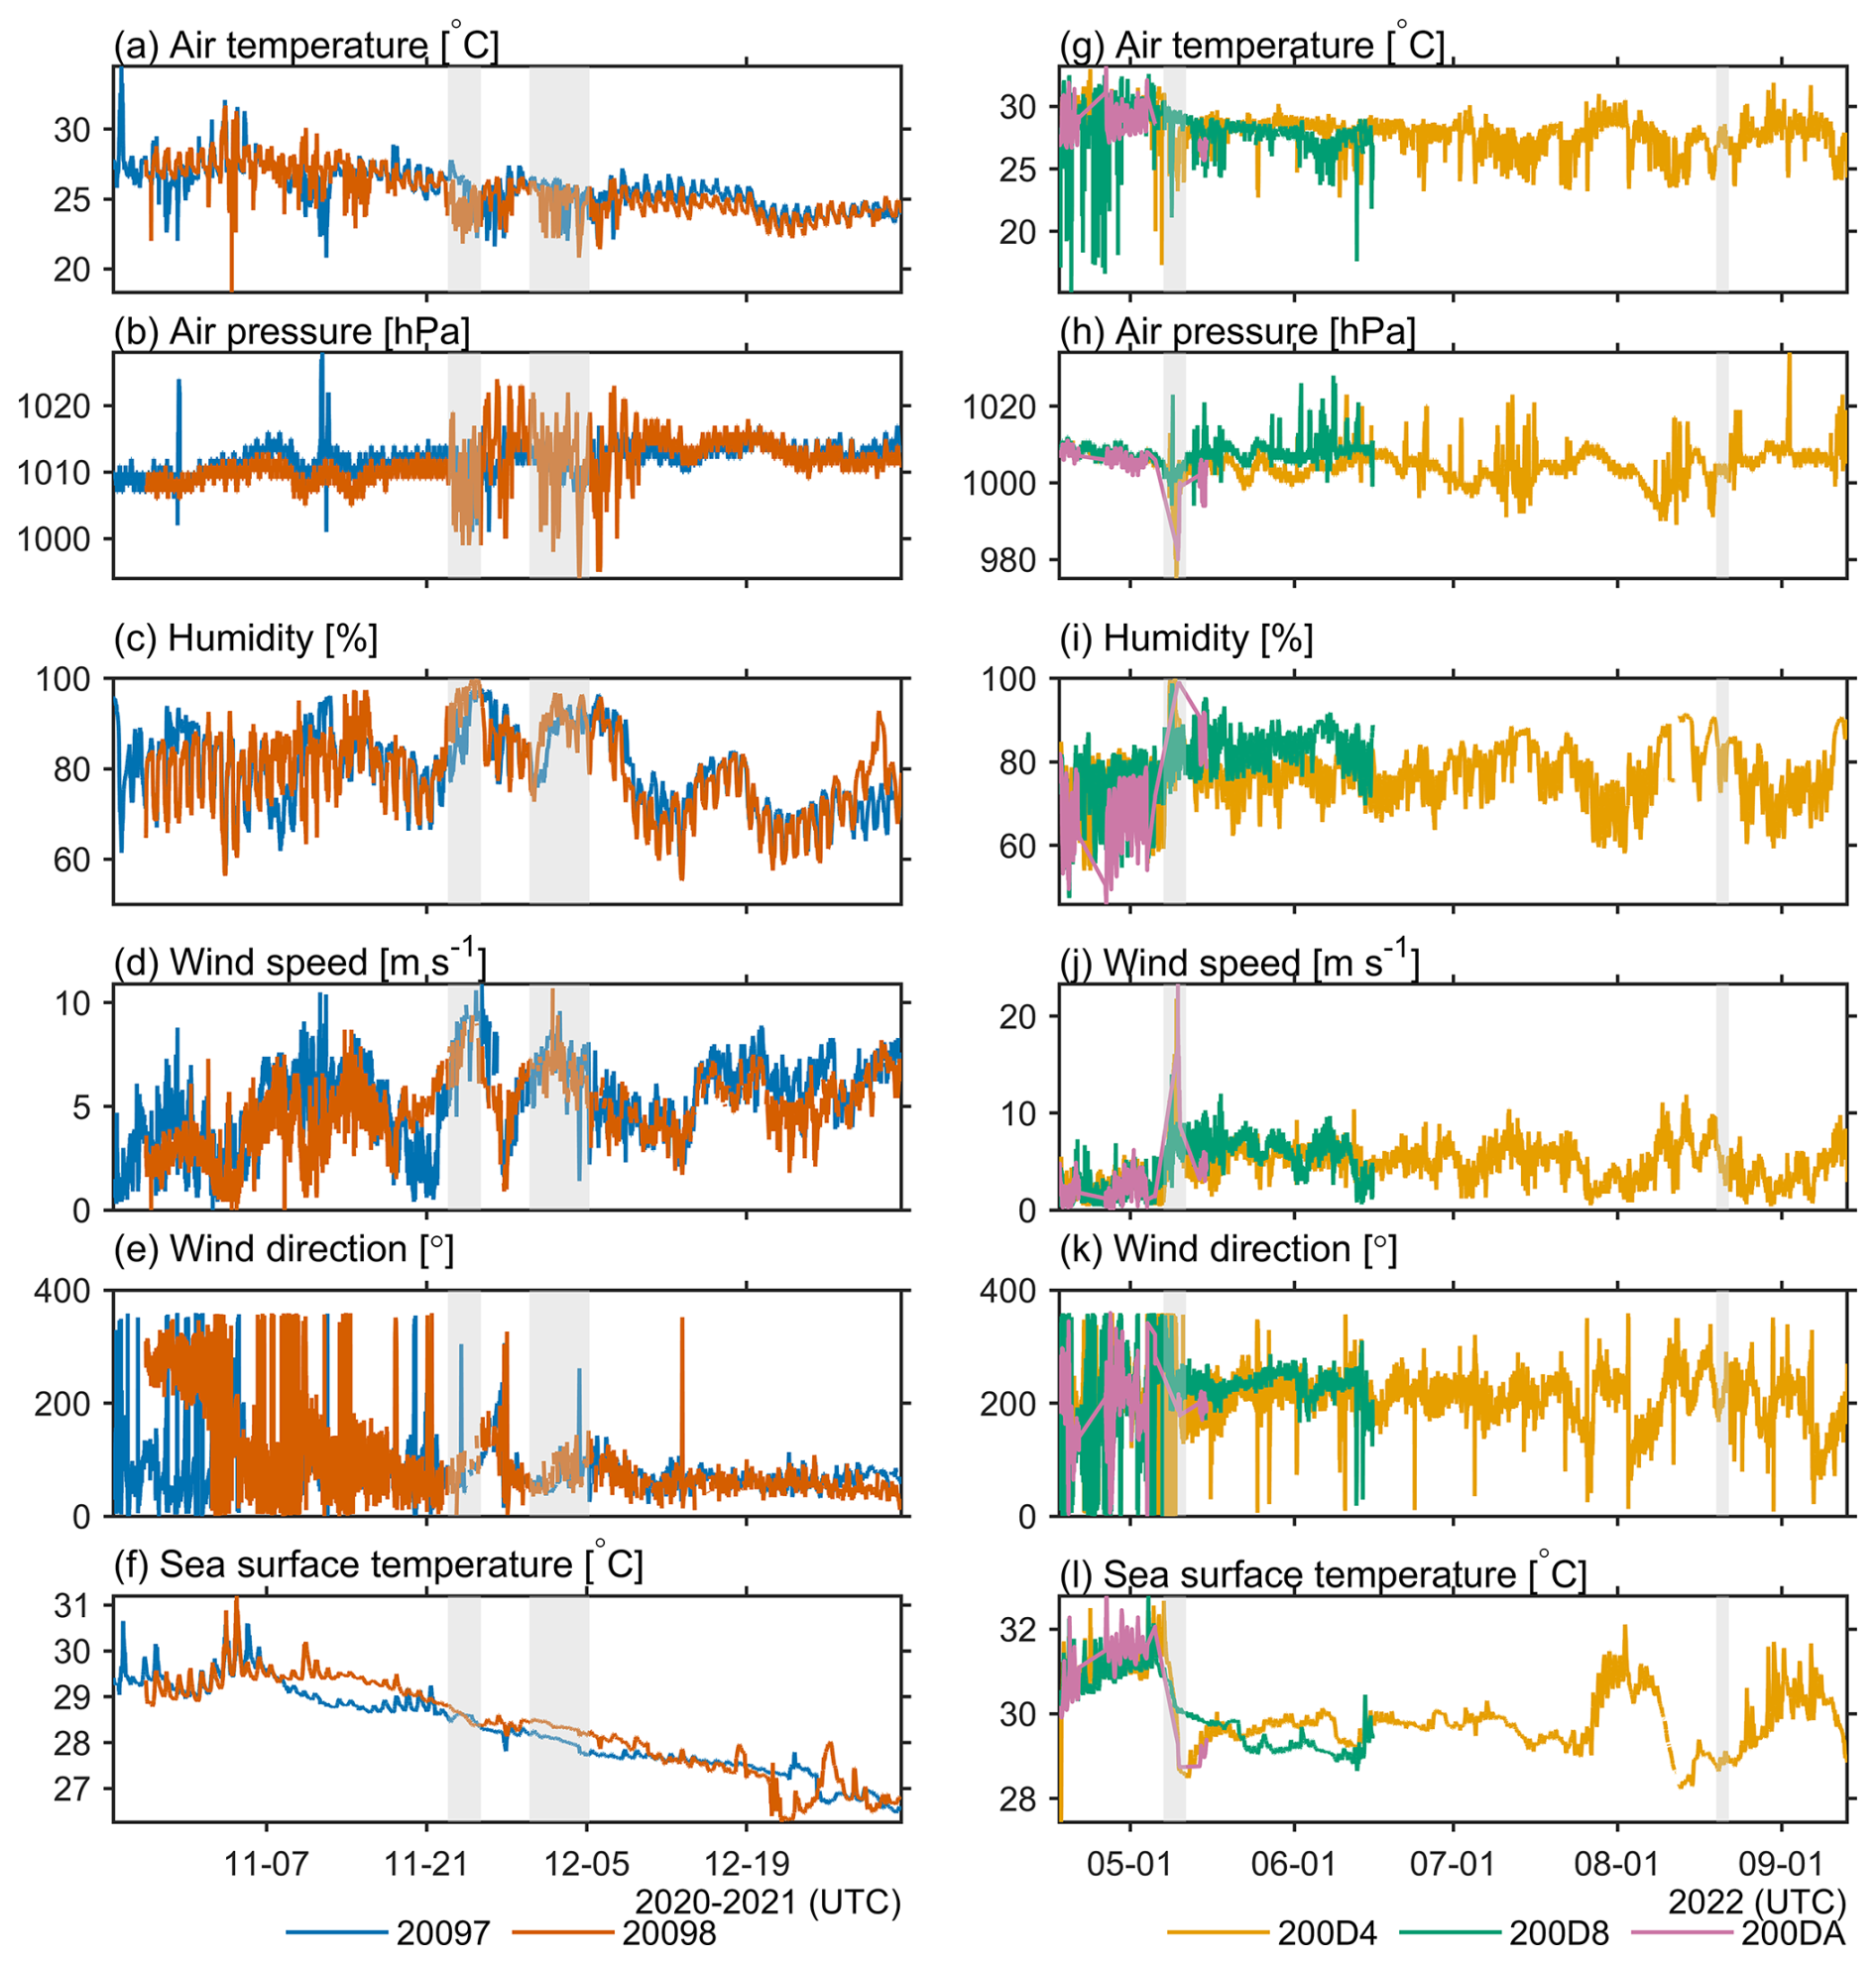
Figure 4Time series of observed meteorological and oceanic parameters. “Left-column panels show data for buoys 20097 (blue) and 20098 (orange); right-column panels show buoys 200D4 (yellow), 200D8 (green), and 200DA (pink). Gray-shaded areas indicate TC passages: Nivar and Burevi (left), and Cyclonic Storm Asani and Tropical Depression Four (right) in chronological order from left to right. Panels show: (a, g) air temperature, (b, h) sea-level pressure, (c, i) relative humidity, (d, j) wind speed, (e, k) wind direction, and (f, l) SST.
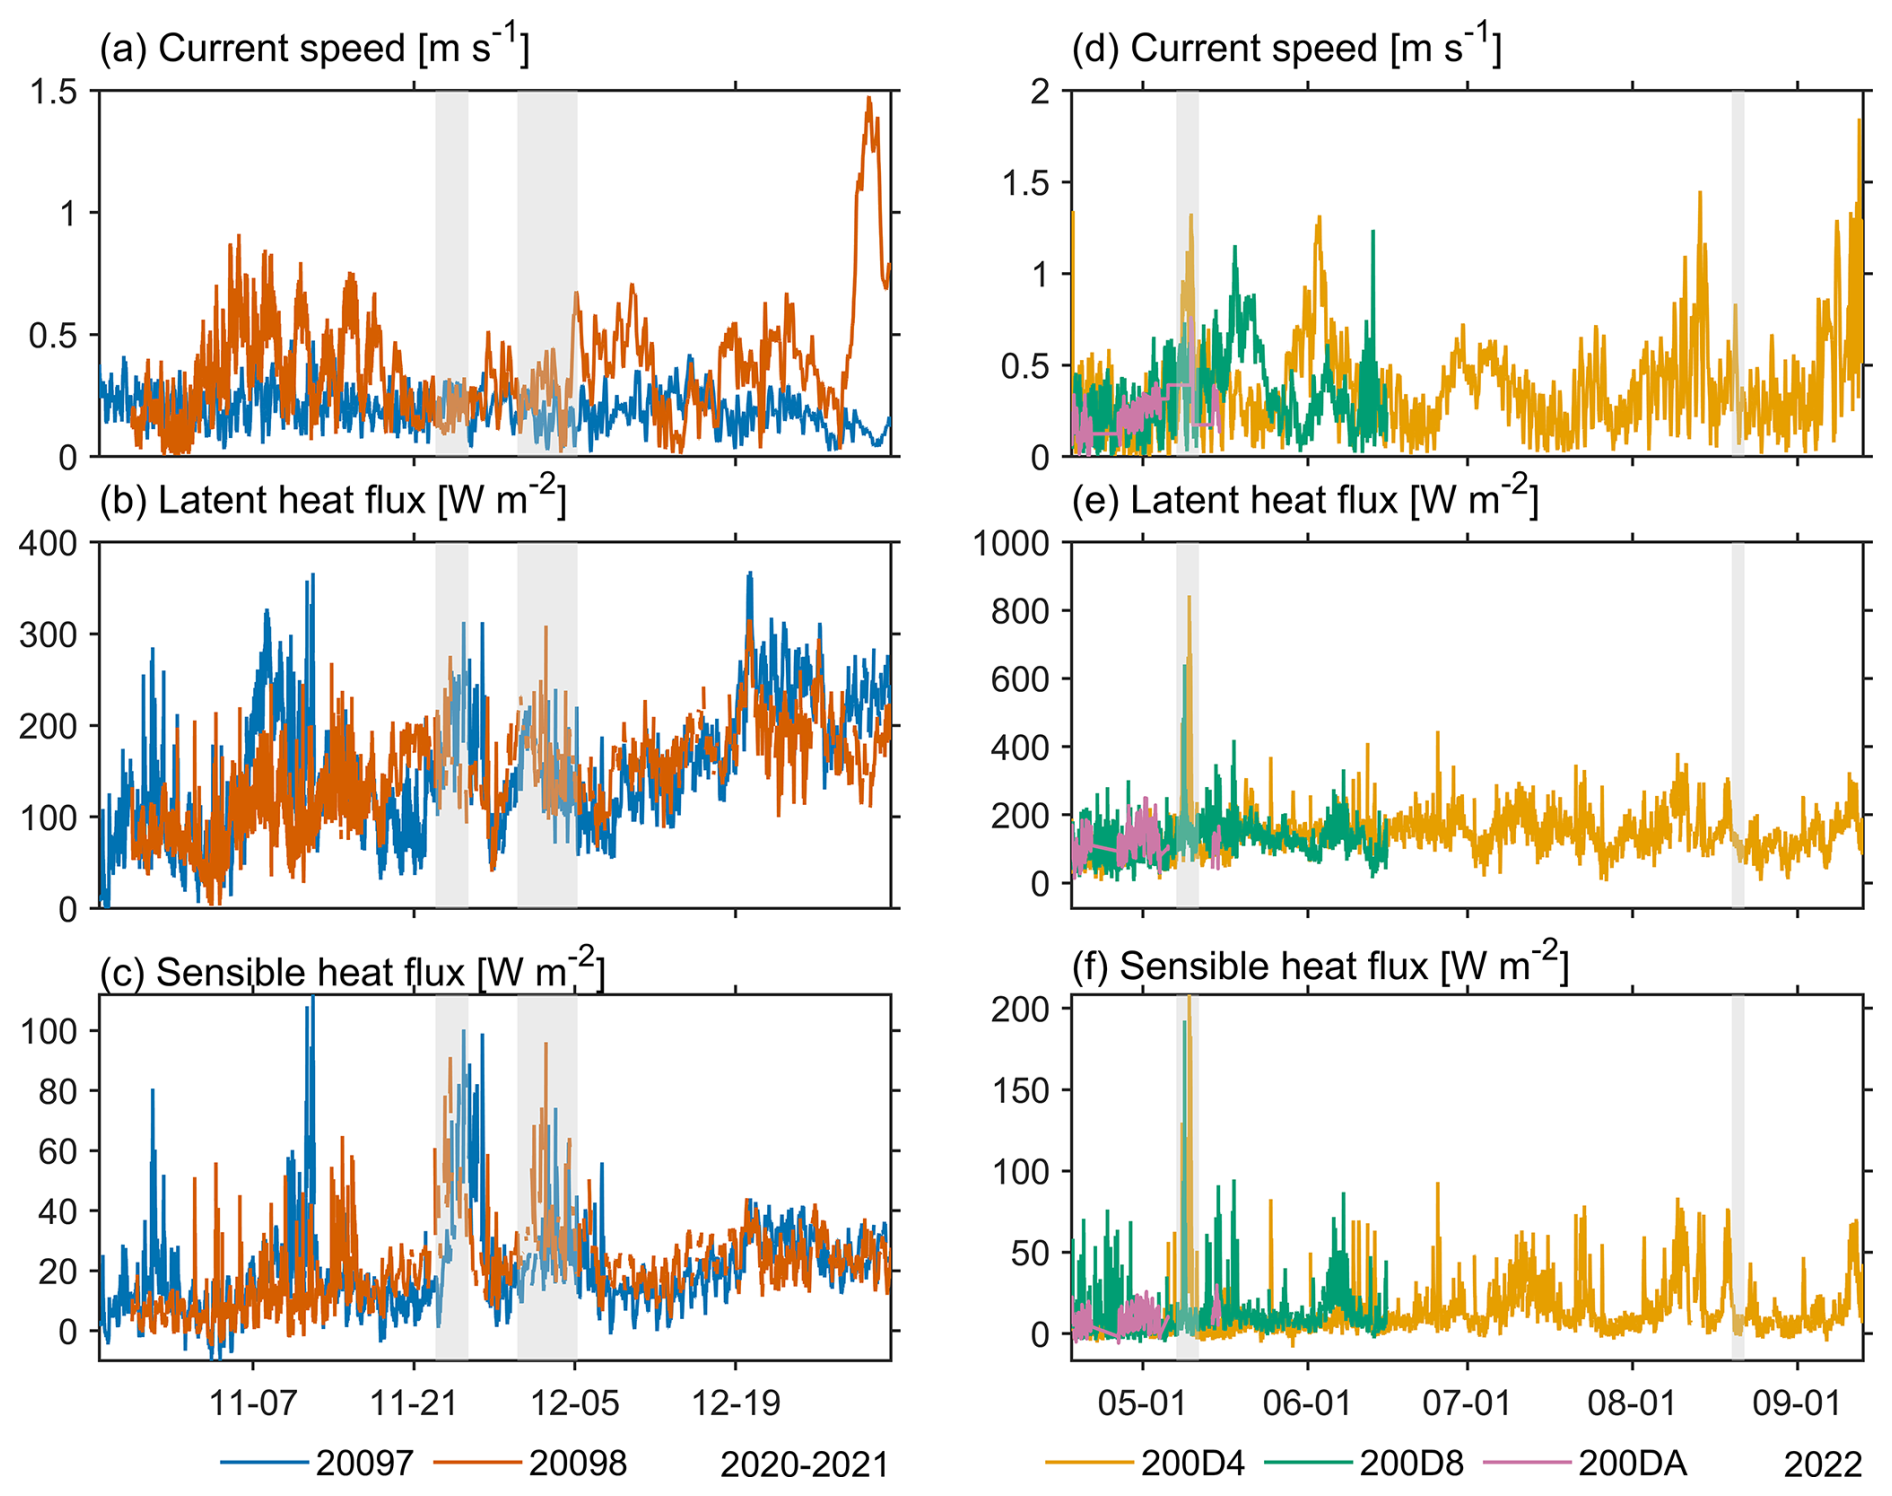
Figure 5Time series of surface current speed and air–sea heat fluxes. Left-column panels show buoys 20097 (blue) and 20098 (vermillion); right-column panels show buoys 200D4 (orange), 200D8 (bluish green), and 200DA (reddish purple). Gray-shaded areas indicate TC passages: Nivar and Burevi (left), and Cyclonic Storm Asani and Tropical Depression Four (right). Panels show: (a, d) surface current speed derived from the buoy trajectories (Sect. 3.2), (b, e) latent heat flux (LH), and (c, f) sensible heat flux (SH), both computed with the COARE 3.0 algorithm.
The high-resolution air-sea interface drifting buoy dataset in the Bay of Bengal described in this study is publicly available in the Zenodo repository and can be freely accessed via the following DOI: https://doi.org/10.5281/zenodo.21294873 (Huang et al., 2026). The background bathymetry data (water depth) used for Fig. 2 was derived from the ETOPO2 (2 min resolution) global relief model (NOAA National Geophysical Data Center, 2006), provided by the National Oceanic and Atmospheric Administration (NOAA) National Centers for Environmental Information (NCEI).
This study presents a high-frequency observational dataset from five air-sea drifting buoys deployed in the BoB during the winter 2020 and summer 2022 cruises. Rigorous quality control effectively identified and flagged anomalous noise from the raw observations. Comparisons with the ERA5 reanalysis not only confirm the dataset's overall reliability but also demonstrate its capability to capture fine-scale transient signals during extreme sea states. Beyond fundamental meteorological variables, this standardized product includes derived surface ocean current velocities and COARE 3.0-estimated air-sea heat fluxes (Fairall et al., 2003), offering substantial scientific value.
Characterized by high-frequency, synchronous multi-variable observations, this dataset holds significant potential for multi-scale oceanographic and meteorological research. Direct flux-related measurements at sea remain sparse, and the resulting uncertainties in bulk-derived flux products are a leading obstacle to closing the ocean-surface energy budget (Yu, 2019); observing strategies therefore call for flux-related measurements at sub-daily – ideally hourly – resolution (Bourassa et al., 2013; Cronin et al., 2019). High-frequency sampling matters quantitatively: neglecting diurnal SST variability alone biases climatological air-sea heat fluxes by several W m−2 regionally (Clayson and Bogdanoff, 2013), and the diurnal warm layers of the post-monsoon BoB make such variability locally pronounced (Weller et al., 2016). By resolving the diurnal cycle and sub-hourly transients (Sect. 4), these records provide scarce in-situ data for investigating fine-scale boundary layer dynamics and rapid air-sea flux responses. Notably, the data captured during TCs offer vital empirical evidence for understanding strong air-sea coupling mechanisms under extreme forcing (Singh and Roxy, 2022). Furthermore, these continuous, high-precision observations can validate high-frequency satellite products (e.g., microwave radiometers and scatterometers), evaluate reanalysis datasets, and optimize flux parameterizations in regional numerical models (Cronin et al., 2019). Despite the rigorous quality control applied, we must acknowledge the inherent limitations of the data. Under extreme sea states, severe wave breaking and sea spray may occasionally introduce transient noise into the measurements – e.g., wave breaking and sea spray wetting the atmospheric sensors, and sensor motion/tilt, which can produce short-lived spurious spikes. Nevertheless, our systematic processing workflow effectively identifies these anomalies, maximizing the rigor and reliability of this published dataset.
In summary, this high-resolution dataset integrates atmospheric and oceanic variables, heat fluxes, and surface current data. By capturing continuous observations across diverse spatiotemporal scales and extreme weather conditions, it offers essential empirical support for analyzing meso- and submesoscale processes, ocean fronts, fine-scale air-sea interactions (Mahadevan et al., 2016), and monsoon dynamics, while also aiding the improvement of extreme weather forecasting models.
Table A1Tropical cyclone information.
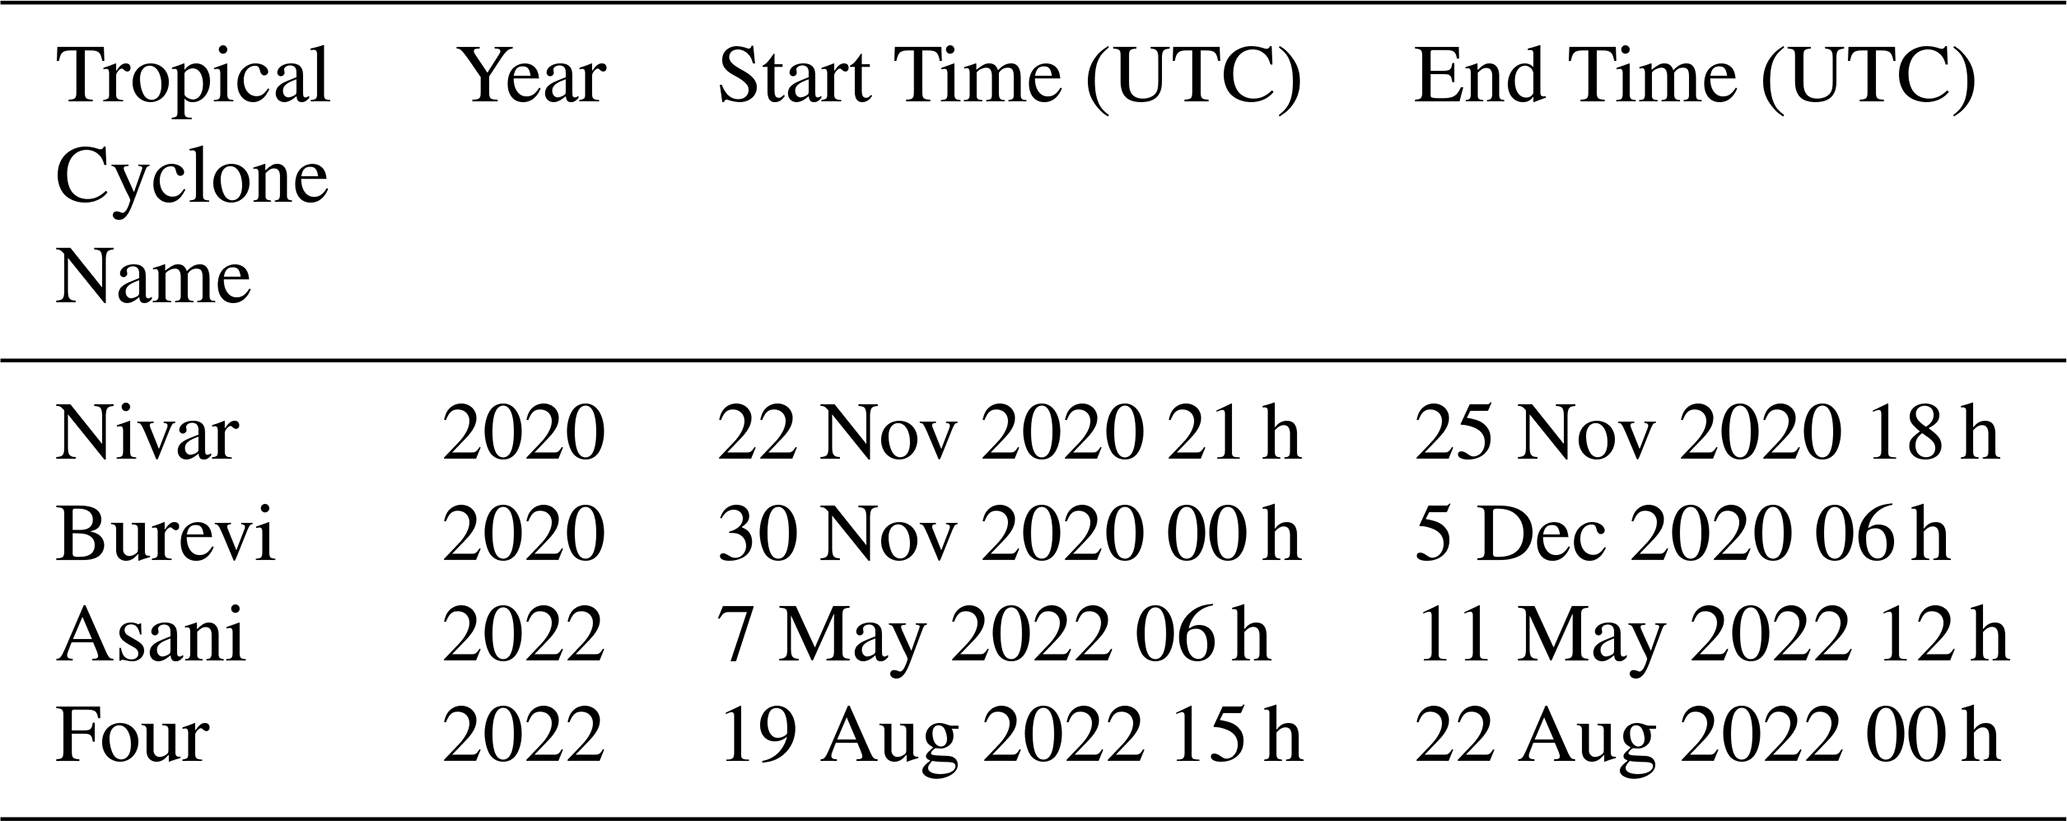
TC information was obtained from the India Meteorological Department website (https://rsmcnewdelhi.imd.gov.in/report.php?internal_menu=MzM=, last access: 15 August 2026).
WH curated and analysed the data, prepared the visualizations, and wrote the original draft. GW conceptualized the study, acquired funding, administered the project, supervised the work, and reviewed and edited the manuscript. CC contributed to the methodology, data validation, and review and editing of the manuscript. GC and WW contributed to the investigation, resources, and review and editing of the manuscript. All authors discussed the results and approved the final version of the manuscript.
The contact author has declared that none of the authors has any competing interests.
Publisher's note: Copernicus Publications remains neutral with regard to jurisdictional claims made in the text, published maps, institutional affiliations, or any other geographical representation in this paper. The authors bear the ultimate responsibility for providing appropriate place names. Views expressed in the text are those of the authors and do not necessarily reflect the views of the publisher.
This work was supported by the National Natural Science Foundation of China (NSFC, grant no. 42288101), the Science and Technology Commission of Shanghai Municipality (grant no. 25DZ3102200), and the Guidance Project for Industrial Technology Development and Application Plan of Fujian Province (grant no. 2024Y0075). The first batch was deployed by the open research cruise NORC2020-10, supported by the NSFC Shiptime Sharing Project (grant no. 41949910), and the second batch was deployed by the open research cruise NORC2022-10, supported by the NSFC Shiptime Sharing Project (grant no. 42149910). Both deployment cruises were implemented by the SCSIO R/V SHIYAN 6.
This research has been supported by the National Natural Science Foundation of China (grant nos. 42288101, 41949910, and 42149910), the Science and Technology Commission of Shanghai Municipality (grant no. 25DZ3102200), and the Guidance Project for Industrial Technology Development and Application Plan of Fujian Province (grant no. 2024Y0075).
This paper was edited by François G. Schmitt and reviewed by two anonymous referees.
Bhardwaj, P. and Singh, O.: Climatological characteristics of Bay of Bengal tropical cyclones: 1972–2017, Theor. Appl. Climatol., 139, 615–629, https://doi.org/10.1007/s00704-019-02989-4, 2020.
Bourassa, M. A., Gille, S. T., Bitz, C., Carlson, D., Cerovecki, I., Clayson, C. A., Cronin, M. F., Drennan, W. M., Fairall, C. W., Hoffman, R. N., Magnusdottir, G., Pinker, R. T., Renfrew, I. A., Serreze, M., Speer, K., Talley, L. D., and Wick, G. A.: High-latitude ocean and sea ice surface fluxes: Challenges and opportunities, B. Am. Meteorol. Soc., 94, 403–430, https://doi.org/10.1175/BAMS-D-11-00244.1, 2013.
Centurioni, L. R.: Drifter technology and impacts for sea surface temperature, sea-level pressure, and ocean circulation studies, in: Observing the Oceans in Real Time, edited by: Venkatesan, R., Tandon, A., D'Asaro, E., and Atmanand, M. A., Springer, Cham, 37–57, https://doi.org/10.1007/978-3-319-66493-4_3, 2018.
Clayson, C. A. and Bogdanoff, A. S.: The effect of diurnal sea surface temperature warming on climatological air-sea fluxes, J. Climate, 26, 2546–2556, https://doi.org/10.1175/JCLI-D-12-00062.1, 2013.
Cronin, M. F., Gentemann, C. L., Edson, J., Ueki, I., Bourassa, M., Brown, S., Clayson, C. A., Fairall, C. W., Farrar, J. T., Gille, S. T., Gulev, S., Josey, S. A., Kato, S., Katsumata, M., Kent, E., Roemmich, D., Weller, R. A., Wick, G. A., Williams, I., and Yu, L.: Air-sea fluxes with a focus on heat and momentum, Frontiers in Marine Science, 6, 430, https://doi.org/10.3389/fmars.2019.00430, 2019.
Fairall, C. W., Bradley, E. F., Rogers, D. P., Edson, J. B., and Young, G. S.: Bulk parameterization of air-sea fluxes for Tropical Ocean-Global Atmosphere Coupled-Ocean Atmosphere Response Experiment, J. Geophys. Res.-Oceans, 101, 3747–3764, https://doi.org/10.1029/95JC03205, 1996.
Fairall, C. W., Bradley, E. F., Hare, J. E., Grachev, A. A., and Edson, J. B.: Bulk parameterization of air-sea fluxes: Updates and verification for the COARE algorithm, J. Climate, 16, 571–591, https://doi.org/10.1175/1520-0442(2003)016<0571:BPOASF>2.0.CO;2, 2003.
Hersbach, H., Bell, B., Berrisford, P., Hirahara, S., Horányi, A., Muñoz-Sabater, J., Nicolas, J., Peubey, C., Radu, R., Schepers, D., Simmons, A., Soci, C., Abdalla, S., Abellan, X., Balsamo, G., Bechtold, P., Biavati, G., Bidlot, J., Bonavita, M., De Chiara, G., Dahlgren, P., Dee, D., Diamantakis, M., Dragani, R., Flemming, J., Forbes, R., Fuentes, M., Geer, A., Haimberger, L., Healy, S., Hogan, R. J., Hólm, E., Janisková, M., Keeley, S., Laloyaux, P., Lopez, P., Lupu, C., Radnoti, G., de Rosnay, P., Rozum, I., Vamborg, F., Villaume, S., and Thépaut, J.-N.: The ERA5 global reanalysis, Q. J. Roy. Meteor. Soc., 146, 1999–2049, https://doi.org/10.1002/qj.3803, 2020.
Huang, W., Wang, G., Chen, C., Chen, G., and Wang, W.: A High-resolution Air-Sea Synoptic Observation Dataset from Drifting Buoys in the Bay of Bengal, Zenodo [data set], https://doi.org/10.5281/zenodo.21294873, 2026.
Lumpkin, R. and Pazos, M.: Measuring surface currents with Surface Velocity Program drifters: the instrument, its data, and some recent results, in: Lagrangian Analysis and Prediction of Coastal and Ocean Dynamics, edited by: Griffa, A., Kirwan, A. D., Mariano, A. J., Özgökmen, T., and Rossby, T., Cambridge University Press, 39–67, https://doi.org/10.1017/CBO9780511535901.003, 2007.
Mahadevan, A., Paluszkiewicz, T., Ravichandran, M., Sengupta, D., and Tandon, A.: Bay of Bengal: From monsoons to mixing, Oceanography, 29, 14–17, https://doi.org/10.5670/oceanog.2016.34, 2016.
McPhaden, M. J., Meyers, G., Ando, K., Masumoto, Y., Murty, V. S. N., Ravichandran, M., Syamsudin, F., Vialard, J., Yu, L., and Qiu, W.: RAMA: The Research Moored Array for African–Asian–Australian Monsoon Analysis and Prediction, B. Am. Meteorol. Soc., 90, 459–480, https://doi.org/10.1175/2008BAMS2608.1, 2009.
Mukherjee, A., Shankar, D., Fernando, V., Amol, P., Aparna, S. G., Fernandes, R., Michael, G. S., Khalap, S. T., Satelkar, N. P., Agarvadekar, Y., Gaonkar, M. G., Tari, A. P., Kankonkar, A., and Vernekar, S.: Observed seasonal and intraseasonal variability of the East India Coastal Current on the continental slope, J. Earth Syst. Sci., 123, 1197–1232, https://doi.org/10.1007/s12040-014-0471-7, 2014.
NOAA National Geophysical Data Center: 2-minute Gridded Global Relief Data (ETOPO2) v2, NOAA National Centers for Environmental Information [data set], https://doi.org/10.7289/V5J1012Q, 2006.
Shankar, D., Vinayachandran, P. N., and Unnikrishnan, A. S.: The monsoon currents in the north Indian Ocean, Prog. Oceanogr., 52, 63–120, https://doi.org/10.1016/S0079-6611(02)00024-1, 2002.
Shetye, S. R., Gouveia, A. D., Shankar, D., Shenoi, S. S. C., Vinayachandran, P. N., Sundar, D., Michael, G. S., and Nampoothiri, G.: Hydrography and circulation in the western Bay of Bengal during the northeast monsoon, J. Geophys. Res.-Oceans, 101, 14011–14025, https://doi.org/10.1029/95JC03307, 1996.
Singh, V. K. and Roxy, M. K.: A review of ocean-atmosphere interactions during tropical cyclones in the north Indian Ocean, Earth-Sci. Rev., 226, 103967, https://doi.org/10.1016/j.earscirev.2022.103967, 2022.
Venkatesan, R., Shamji, V. R., Latha, G., Mathew, S., Rao, R. R., Sengupta, D., and Arul Muthiah, M. A.: In situ ocean subsurface time-series measurements from OMNI buoy network in the Bay of Bengal, Curr. Sci., 104, 1166–1177, 2013.
Weller, R. A., Farrar, J. T., Buckley, J., Mathew, S., Venkatesan, R., Sreejith, J., Surya Prakash, M., and Suresh Kumar, N.: Air-sea interaction in the Bay of Bengal, Oceanography, 29, 28–37, https://doi.org/10.5670/oceanog.2016.36, 2016.
Yu, L.: Global air-sea fluxes of heat, fresh water, and momentum: energy budget closure and unanswered questions, Annu. Rev. Mar. Sci., 11, 227–248, https://doi.org/10.1146/annurev-marine-010816-060704, 2019.
Zhang, Y., Wang, B., Chen, Z., Song, X., Dang, C., Sun, D., Li, Y., Ma, X., and Wu, L.: Drifting Air-Sea Interface Buoy (DrIB): A Practical Platform for Global Air-Sea Observations, J. Atmos. Ocean. Tech., 42, 1457–1468, https://doi.org/10.1175/JTECH-D-24-0080.1, 2025.