the Creative Commons Attribution 4.0 License.
the Creative Commons Attribution 4.0 License.
 | 14 Aug 2026
A global high-resolution dataset of snowmelt runoff onset timing from Sentinel-1 SAR, 2015–2024
David Shean
Scott Henderson
Snowmelt runoff onset timing represents a critical hydrological parameter, particularly in mountainous regions where seasonal snow serves as a natural reservoir for downstream water resources. Despite this importance, high-resolution observations of snowmelt runoff onset across complex terrain are limited, due to challenges from sparse in situ monitoring networks, intermittent optical remote sensing data, and coarse passive microwave remote sensing data. To address this gap, we prepared a global snowmelt runoff onset timing dataset (https://doi.org/10.5281/zenodo.16953614, Gagliano et al., 2026) for the 10-year period spanning 2015–2024, with 80 m spatial resolution and 9.5 d average temporal resolution. We created this dataset by identifying backscatter minima empirically associated with runoff onset in a time series of Sentinel-1 C-band SAR images, with detection constrained by a custom MODIS-derived snow phenology dataset. We evaluated our dataset using in situ snow pillow estimates of runoff onset from 1116 automated weather stations across the Western United States, British Columbia, Norway, and Nepal, finding a median timing difference of −2.0 d and a median absolute deviation of 10.0 d. The local agreement between our runoff onset estimates and snow pillow runoff onset estimates varies with site-specific variables like forest cover fraction, SWE, and dataset temporal resolution. We characterized these dependencies to provide empirically-derived thresholds for quality filtering as well as guidance for interpretation and use of our products. The dataset includes global annual runoff onset products for each water year, annual local temporal resolution products for each water year, and 10-year composites of median runoff onset, median absolute deviation, and local temporal resolution. This unique combination of high spatial resolution, global coverage, and decade-long temporal coverage provides unprecedented detail for the study of snowmelt runoff onset across snow-covered regions. Our snowmelt runoff onset dataset enables an improved understanding of mountain hydrological processes and informs water resource management in snow-dominated watersheds.
- Article
(23625 KB) - Full-text XML
- BibTeX
- EndNote


Snow plays a crucial role in the global water cycle and climate system, and more than one-sixth of the world's population relies on meltwater from seasonal snow and glaciers (Barnett et al., 2005). This dependence is particularly pronounced in mountainous regions, where seasonal snowpack acts as a natural reservoir, storing water as snow in the winter and gradually releasing it during spring and summer months. Critically, snowmelt runoff onset marks the beginning of increased water availability, initiating the annual hydrologic pulse that sustains downstream ecosystems and human water needs during the warmer months (Dingman, 2015). This snowpack-scale process is distinct from basin-scale streamflow generation – the streamflow response at basin outlets typically follows snowmelt runoff onset by days to weeks depending on basin characteristics such as topography, vegetation, bedrock permeability, groundwater storage capacity, soil moisture conditions, and hillslope and groundwater travel times (Brooks et al., 2025; Lowry et al., 2010).
Beyond its hydrological significance, snowmelt timing also serves as a key indicator of regional climate change, potentially manifesting before other environmental indicators (Dudley et al., 2017). Because snowmelt timing is highly sensitive to temperature and precipitation variability, shifts in the spatial distribution of snowmelt over time provide tangible evidence of changing climate conditions, with heterogeneous trends observed across climatic and geographic settings worldwide (Ismail et al., 2023; Royer et al., 2021; Yang et al., 2022). These changes have far-reaching consequences for water security, agricultural productivity, and ecosystem health in snow-dominated regions and beyond (Qin et al., 2022).
Traditional snowmelt monitoring methods, such as snow courses and snow pillows (Cowherd et al., 2024; Lundquist et al., 2004), provide valuable point observations but are labor-intensive and too sparse for regional and global analysis. While snow pillows can be used to relate decreases in SWE to melt occurrence, they do not directly measure the liquid water content of the snowpack. Optical remote sensing data from platforms like Landsat, Sentinel-2, and MODIS can provide observations of fractional snow-covered area with broad spatial coverage, but these approaches only indirectly indicate melt occurrence through decreases in snow cover over time, with additional challenges due to persistent cloud cover during critical melt periods (Awasthi and Varade, 2021). Passive microwave sensors have been used for large-scale snowmelt detection (Mioduszewski et al., 2015; Zheng et al., 2022), but their coarse spatial resolution, typically 25 km, fails to capture snowmelt variability in the characteristically complex mountain terrain of snow-dominated regions.
Synthetic Aperture Radar (SAR) overcomes many of these limitations due to its all-weather imaging capability, high spatial resolution, and sensitivity to liquid water content in snowpack (Rott and Nagler, 1995; Tsai et al., 2019). The European Space Agency's Sentinel-1 C-band SAR mission is particularly useful for snowmelt monitoring due to its global coverage and frequent (often 6 or 12 d) exact repeat interval. When snow is dry, C-band radar can penetrate through the entire snowpack (up to ∼20 m), with backscatter dominated by the snow-ground interface (Mätzler, 1987; Nagler et al., 2016). However, the presence of liquid water dramatically alters the dielectric properties of snow, causing greater absorption of C-band radiation, resulting in shallow penetration depth (∼5–10 cm), and consequently, a significant decrease in backscatter (Lund et al., 2020; Nagler, 1996).
Studies of C-band SAR backscatter time series have established that the minimum backscatter amplitude coincides with the transition from the ripening phase to the runoff phase of snowmelt (Darychuk et al., 2023, 2025; Gagliano et al., 2023; Lund et al., 2022; Marin et al., 2020). Carletti et al. (2025) established a physical basis for this relationship using high-resolution field measurements and radiative transfer modeling, showing that backscatter decreases to the characteristic minimum as rising liquid water content absorbs the C-band signal, and then recovers as snow surface roughness evolves during the runoff phase. Importantly, Carletti et al. (2025) emphasized that the backscatter minimum does not directly detect the initiation of runoff, but instead emerges from the combined effects of liquid water absorption and surface roughness once the snowpack is already isothermal and likely releasing water. Despite these complexities at the process scale, the relationship between the timing of the backscatter minimum and runoff onset has been validated in diverse mountain environments against various reference measurements, including snow pillows at automated weather stations (Darychuk et al., 2023, 2025; Gagliano et al., 2023; Gao and Ma, 2024; Marin et al., 2020), soil moisture pulses at automated weather stations (Detre et al., 2025), snow pit measurements (Lund et al., 2022; Rickenbaugh et al., 2026), a C-band SAR tower-based study (Brangers et al., 2024), and streamflow observations (Gagliano et al., 2023; Lund et al., 2022; Rickenbaugh et al., 2026; Torralbo et al., 2023). We therefore treat the timing of backscatter minimum as an empirically validated indicator of runoff onset rather than a direct measurement of meltwater outflow.
These process-scale complexities motivate methodological approaches that can robustly detect runoff onset across diverse environmental conditions. In Gagliano et al. (2023), we developed such an approach by integrating all available Sentinel-1 relative orbits (the distinct, regularly repeating ground tracks from which Sentinel-1 images a given location, each with a fixed viewing geometry and acquisition time). We demonstrated that this approach provides enhanced temporal resolution and improved runoff onset estimate agreement with snow pillow reference measurements across 10 stratovolcanoes in the Pacific Northwest of the United States (Gagliano et al., 2023). Here, we refine and scale this multi-orbit methodology globally, combining its multiple independent viewing geometries and acquisition times with a custom MODIS-derived snow phenology dataset that constrains the temporal search window for runoff onset estimation. This integrated approach addresses several key challenges in runoff onset detection, including many of those identified by Carletti et al. (2025): coarse temporal resolution of individual relative orbits, sensitivity to viewing geometry, false detection from isolated melt episodes, and false detection in locations or time periods where no seasonal snow exists.
Using this refined methodology, we present a global dataset of snowmelt runoff onset timing for 2015–2024. We document the data processing workflow, describe the dataset structure, evaluate the dataset against a network of automated weather stations, establish empirically-derived usage recommendations, and discuss key characteristics and limitations.
2.1 Input data sources
2.1.1 Sentinel-1 SAR backscatter
We used the entire archive of Sentinel-1 C-band SAR Interferometric Wide mode data, available as radiometrically terrain-corrected (RTC) products hosted on Microsoft Planetary Computer as a collection of Cloud-Optimized GeoTIFF files (Microsoft Open Source et al., 2022; Microsoft Planetary Computer, 2022). For each water year from 2015–2024, we selected all available VV-polarized scenes. We used VV polarization based on recent studies showing that VV-only estimates of runoff onset are more accurate than VH-only estimates (Darychuk et al., 2023, 2025; Rickenbaugh et al., 2026), and that improvements from combining VV and VH are not statistically significant (Darychuk et al., 2025). Although the RTC images are available at 10 m resolution, we used the pre-computed 80 m overview embedded in the Cloud-Optimized GeoTIFF files in order to balance computation costs, accuracy, and spatial resolution. The area-variance analysis of Manickam and Barros (2020) showed that the spatial variance of snow backscatter is minimized at characteristic scales of ∼100–250 m over barren terrain and grassland, increasing to >1 km in forested and cropland areas. An 80 m pixel is smaller than these characteristic spatial scales, ensuring that our products resolve melt-related spatial structure without mixing spatially distinct snowmelt behavior that coarser pixel sizes would miss. Further, aggregation to a coarser pixel size reduces radar speckle, stabilizing the backscatter values for more accurate time series analysis (Darychuk et al., 2025; Lievens et al., 2022).
2.1.2 MODIS snow cover
We used the 500 m resolution MODIS MOD10A2 8 d maximum snow extent product (Hall and Riggs, 2021) distributed by the NASA National Snow and Ice Data Center Distributed Active Archive Center to prepare a custom snow phenology dataset. This product accounts for cloud cover by reporting the maximum snow extent from up to eight daily observations, recording snow presence if detected on at least one cloud-free day within each eight-day period.
2.1.3 Automated weather station network
For in situ estimation of snowmelt runoff onset, we compiled daily snow pillow measurements from four networks: the SNOTEL network in the Western U.S. (Fleming et al., 2023; USDA Natural Resources Conservation Service, 1977), the California Cooperative Snow Surveys program network (California Department of Water Resources, 2025), the British Columbia Snow Survey network (BC Ministry of Environment, 2024), and the Norwegian Water Resources and Energy Directorate network (Stranden and Saloranta, 2021), which includes a few affiliate stations in the Nepalese Himalaya. Though the snow pillow data are often available with an hourly interval, we used daily values because they are quality-controlled and reduce measurement noise (Fleming et al., 2023).
2.1.4 Forest cover fraction
We used the forest cover fraction layer from the Copernicus Global Land Service PROBA-V land cover dataset (Buchhorn et al., 2020) to characterize how forest cover influences runoff onset detection. This global product is derived from PROBA-V satellite observations and ancillary datasets, and includes fractional land cover layers representing the percentage ground cover of 10 different land cover classes at 100 m resolution.
2.2 Dataset creation methodology
We developed a workflow that integrates two complementary remote sensing datasets to detect snowmelt runoff onset reliably at a global scale (Fig. 1). First, we created a custom MODIS-derived snow phenology dataset to identify where and when seasonal snow exists. Within these constraints, we analyze Sentinel-1 SAR backscatter time series to detect characteristic minima that indicate runoff onset. This approach leverages the individual strengths of both sensors: MODIS provides reliable snow cover detection and timing constraints that Sentinel-1 cannot achieve alone, while Sentinel-1 offers superior spatial resolution, weather-independent observations, and sensitivity to liquid water content changes during snowmelt. To create the global snowmelt runoff onset dataset, we scaled this methodology using a distributed computing architecture that processed over 100 TB of Sentinel-1 data acquired between 1 October 2014 and 31 March 2025.
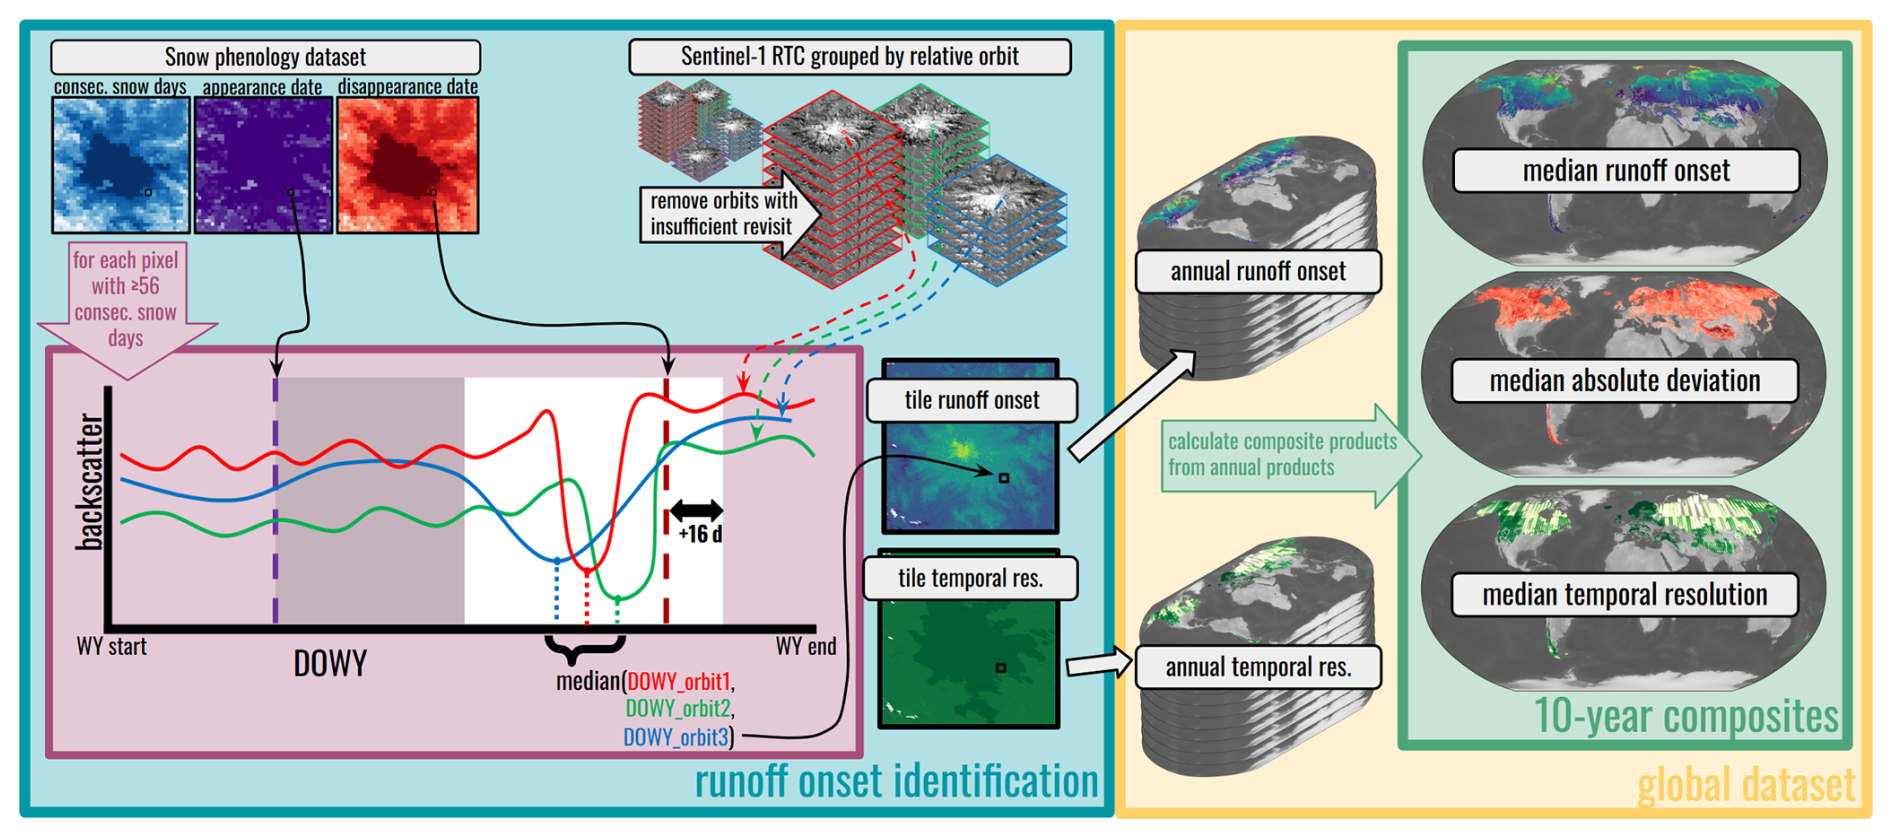
Figure 1Graphical representation of the workflow used to create the global snowmelt runoff onset dataset. To calculate runoff onset for a single water year, Sentinel-1 data are first grouped by relative orbit and filtered to ensure sufficient revisit interval. For every pixel with ≥56 consecutive snow days in the snow phenology dataset, the backscatter minimum within the temporal search window (spanning from the midpoint of the snow-covered period through 16 d after the snow disappearance date, illustrated as a white background) is identified across multiple relative orbits and the median date becomes the runoff onset estimate. The resulting products for the tile are mosaicked to create global annual products, and global composite products are created from the stack of annual products.
2.2.1 Snow phenology dataset
Central to our methodology was the development of a custom MODIS-derived snow phenology dataset (Gagliano, 2026a) generated from the MODIS MOD10A2 8 d maximum snow extent product using the MODIS_snow_phenology software library (Gagliano, 2026b). Snow phenology refers to the seasonal timing of snow cover events, including snow appearance, persistence, and disappearance patterns (Tang et al., 2022). This snow phenology dataset provides the foundational spatial and temporal constraints for the runoff onset workflow by defining where (using the snow cover product) and when (using the snow appearance and snow disappearance date products) to search for runoff onset signals in the Sentinel-1 data for each water year.
The MOD10A2 8 d maximum snow extent product represents the maximum snow extent observed over each 8 d MODIS compositing period, which reduces cloud contamination compared to daily observations, yet still contains substantial data gaps due to clouds and polar darkness that obscure snow presence during critical transition periods. We applied an enhanced cloud-filling algorithm that builds on the methodology of Wrzesien et al. (2019), which assumes that snow-covered observations bracketing cloudy periods indicate continuous snow presence – an assumption that is particularly useful during the persistent cloud cover that coincides with the spring snowmelt season. For polar regions above ∼70° latitude, we implemented additional filtering to remove false “no snow” classifications during polar night periods, when the ∼ 10:30 a.m. local MODIS observations are unreliable due to darkness.
We extracted three key variables for each pixel and water year from these cloud-filled time series: the number of continuous snow cover days, snow appearance date (first date of continuous snow cover), and snow disappearance date (first day after the last date of continuous snow cover). For pixels with multiple snow-covered periods within a single water year, we selected the longest continuous period. Because of the 8 d compositing of the underlying MOD10A2 8 d maximum snow extent product, the final reported snow appearance dates and snow disappearance dates could potentially be biased up to 7 d early or late, respectively (Hall and Riggs, 2021). This inherent limitation effectively widens rather than clips the temporal window used in the search for Sentinel-1 backscatter minima. These snow phenology variables were computed on the native 500 m MODIS sinusoidal grid and bilinearly resampled to match the 80 m global processing grid. We chose bilinear resampling because the snow phenology variables – continuous snow cover (days) and snow appearance and disappearance dates (DOWY) – are continuous quantities where averaging is meaningful.
These variables constitute valuable snow phenology data for the broader scientific community – beyond serving as a fundamental input dataset for our runoff onset methodology, this 10-year global snow phenology dataset offers globally consistent characterization of high-priority observables (snow cover, snow appearance date, and snow disappearance date) that can inform water resource management, ecological studies, and climate change research (Gagliano, 2026a).
2.2.2 Snowmelt runoff onset identification
We limited identification of snowmelt runoff onset to pixels identified with seasonal snow cover for the respective water year in our snow phenology dataset. Specifically, we analyzed pixels with at least 56 d of continuous snow presence, a criterion that, following Wrzesien et al. (2019) for MOD10A2 data, approximates the 60 d threshold between ephemeral and seasonal snow (Petersky and Harpold, 2018; Sturm et al., 1995) based on the 8 d temporal resolution of our phenology product. This threshold serves two purposes: it excludes ephemeral snow events with minimal hydrological impact, and it ensures sufficient time for complete snowmelt phase progression (warming, ripening, and runoff), which is necessary for reliable detection of the characteristic backscatter minimum associated with runoff onset (Carletti et al., 2025).
For pixels meeting this seasonal snow presence criterion, we analyzed the temporal evolution of Sentinel-1 VV-polarized backscatter to identify snowmelt runoff onset. Our preprocessing workflow removed all VV backscatter values below −30 dB. This single threshold removes both physically unrealistic backscatter values and residual Sentinel-1 border noise artifacts, the latter of which appear along scene edges as anomalously low-intensity values introduced during product generation (Ali et al., 2018).
We processed each Sentinel-1 relative orbit independently to account for systematic backscatter differences between viewing geometries caused by varying incidence angle and azimuth orientation (Darychuk et al., 2025; Gagliano et al., 2023). Each relative orbit maintains consistent viewing geometry while providing regular temporal sampling of the same location, typically every 6 or 12 d, with overpass times in the early morning for descending relative orbits (∼06:00 a.m. local) and early evening for ascending relative orbits (∼06:00 p.m. local). We excluded relative orbits with any temporal gap exceeding 30 d (i.e., two or more missed acquisitions for a 12 d repeat orbit) within the snow-covered period to reduce the risk of missing the backscatter minimum (Torralbo et al., 2023).
For each valid relative orbit, we identified the timing of minimum backscatter for a given pixel, searching from the midpoint of the snow-covered period through 16 d after the snow disappearance date (two additional 8 d MODIS snow cover periods). We used this constrained temporal search window to reduce the likelihood of false detections from early-season diurnal melt-refreeze cycles and rain-on-snow episodes, which can create temporary backscatter minima unrelated to sustained runoff onset. We extended the temporal search window 16 d beyond the MODIS snow disappearance date to reconcile the spatial scale difference between MODIS (500 m) and Sentinel-1 (80 m) data, as residual patches of snow cover within the coarser MODIS pixel may persist for weeks beyond the apparent snow disappearance date from MODIS, especially in regions with heterogeneous topography and vegetation (Boudreau, 2025; Crumley et al., 2020; Pflug et al., 2024). This search window approach is consistent with the findings of Darychuk et al. (2025), which showed that constraining backscatter minima detection with MODIS-derived snow presence data reduced Sentinel-1 snowmelt runoff onset estimation errors by more than 50 % relative to unconstrained approaches.
For each pixel, we calculated the median date across all valid minimum backscatter estimates for available relative orbits to produce a single robust estimate for that pixel and water year. This multi-orbit aggregation approach serves dual purposes: (1) mitigating differences due to viewing geometry and orbit-specific artifacts, and (2) effectively increasing the temporal resolution by combining observations from multiple relative orbits (Gagliano et al., 2023). The resulting annual runoff onset products represent our primary data products within the global snowmelt runoff onset dataset, providing pixel-wise runoff onset timing estimates with global coverage for water years 2015–2024. We also estimated the annual average temporal resolution for all pixels with runoff onset timing estimates, calculated by dividing the length of the valid observation window in days by the number of Sentinel-1 observations contained within that period. This metric represents the effective local sampling interval across all combined relative orbits rather than the revisit interval of any single relative orbit, and is therefore typically finer than the 6 or 12 d exact repeat of an individual relative orbit.
We report all runoff onset dates as day of water year (DOWY), with the water year starting on 1 October of the previous year in the Northern Hemisphere and 1 April of the current year in the Southern Hemisphere (Aguayo et al., 2021; Cortés and Margulis, 2017).
2.2.3 Processing and scaling
The global scope of this analysis, spanning 10 water years across all seasonal snow on Earth, necessitated the development of a scalable, distributed computing approach capable of efficiently processing >100 TB of Sentinel-1 data. We implemented an open-source, cloud-based processing architecture to ensure computational feasibility, data integrity, and reproducibility.
We partitioned the global domain into 23 520 seamless tiles, each covering 2048 pixels×2048 pixels (°, or km at the equator). We then pre-allocated a global Zarr data store (Abernathey, 2024) with this global array structure and optimized chunking in order to support parallel processing, where each worker could independently process individual tiles and write results directly to the final data structure without conflicts. This “embarrassingly parallel” approach allowed us to seamlessly scale from small regional processing to full global coverage.
Of the 23 520 total tiles, we limited processing to the 4453 tiles that contained both seasonal snow and the relevant Sentinel-1 RTC data. Our processing workflow leveraged the Dask computing library, utilizing Dask's lazy evaluation and distributed computing capabilities to coordinate parallel processing across Coiled cloud computing infrastructure (Dask Development Team, 2016). We implemented a multi-stage chunking strategy to optimize memory-bandwidth tradeoffs across distributed workers, applying spatial chunking for I/O-heavy operations to maximize throughput, and temporal chunking for computationally intensive time-series calculations.
We deployed and monitored computing resources in the Microsoft Azure West Europe region, co-located with the relevant Planetary Computer datasets. We predominantly processed tiles in batches of 10, with 60 workers per batch (32 GB memory, 4 cores each), requiring a median of ∼4.7 CPU core-hours per tile, totaling ∼24 300 CPU core-hours for all tiles.
2.2.4 Generation of 10-year composite products
We created three additional composite products for pixels with at least three years of valid annual data to aid the interpretation of the annual snowmelt runoff onset products. We calculated the median snowmelt runoff onset date across all available years, creating a 10-year median snowmelt runoff onset composite product. We then created a 10-year snowmelt runoff onset median absolute deviation composite product to estimate interannual variability. Finally, we created a 10-year local median temporal resolution composite product to capture the temporal resolution of these composites. These complementary products can be used for detailed study of the characteristic snowmelt runoff onset date and variability for any given pixel in the dataset, providing a better understanding of the influence of fixed geographic controls (i.e., elevation, aspect, latitude) and environmental forcing (i.e., temperature and precipitation) on observed snowmelt runoff onset variability (Gagliano, 2025).
2.3 Dataset evaluation methodology
We employed a two-stage evaluation approach, comparing our snowmelt runoff onset estimates against independent runoff onset estimates from a distributed network of in situ snow water equivalent (SWE) measurements acquired by snow pillows at 1210 automated weather stations across the Western U.S. (including Alaska), British Columbia, Norway, and Nepal. Throughout this paper, we characterize seasonal snowpack magnitude around the time of runoff onset using the water year maximum SWE – the highest daily value recorded at each station within that water year. For our dataset evaluation, we first characterized how forest cover fraction, SWE, and temporal resolution affect agreement between our runoff onset estimates and snow pillow runoff onset estimates using pixel-level residuals aggregated across all stations and water years, and then used these insights to apply appropriate quality filters for station-level evaluation.
For snow pillow runoff onset estimates, we first applied quality filters to daily SWE time series at each station, removing observations with negative SWE values and physically unrealistic apparent daily change (>20 cm d−1, Dawson et al., 2016). Further, we excluded water years with less than 10 cm SWE, less than 60 d of continuous snow cover, or data gaps exceeding 10 d, resulting in a total of 9570 water-year observations of snow pillow time series across 1210 stations. Using the filtered time series, we calculated snow pillow runoff onset as the day when SWE decreased below 95 % of the water year maximum (or the day of the last occurrence for seasons with multiple SWE decreases below the 95 % threshold). This timing builds on established work linking runoff onset to the departure from maximum snow pillow SWE (Darychuk et al., 2023, 2025; Dingman, 2015; Fassnacht et al., 2014; Gao and Ma, 2024; Marin et al., 2020), while also including a 5 % tolerance to account for SWE decreases due to wind redistribution and/or sublimation, as well as to mitigate issues in scenarios where maximum SWE occurs early in a season, but significant melt does not occur until later in the season (Darychuk et al., 2025). Figure A1 illustrates the snow pillow runoff onset determination and the SAR backscatter minimum determination for two representative water years at a SNOTEL station, showing how both estimates are obtained under favorable high-SWE conditions and more ambiguous low-SWE conditions.
To characterize how forest cover fraction, SWE, and temporal resolution affect agreement between the runoff onset estimates, we computed pixel-wise residuals between our annual runoff onset products and snow pillow estimates within a 1000 m radius of each station for each of the 10 years in our dataset. We then binned all pixel-wise residuals across all stations and water years by each pixel's respective forest cover fraction (bilinearly resampled from the native 100 m grid to the 80 m grid of our runoff onset product), water year maximum SWE (maximum SWE recorded at the respective snow pillow for that water year), and temporal resolution (the pixel-wise temporal resolution for that water year as recorded in the annual temporal resolution product). We calculated the median of each bin to quantify bias, as well as the median absolute deviation of each bin to quantify the spread of the residuals.
For station-level evaluation, we applied quality filters derived from this analysis (forest cover fraction <0.5, >20 cm water year maximum SWE, temporal resolution <14 d; see Sect. 4.1) in order to extract a representative and robust runoff onset estimate for each station and water year. Specifically, for each station and water year, we extracted the median runoff onset date of valid pixels (forest cover fraction <0.5, temporal resolution <14 d) within the 1000 m radius of each station, and excluded water years with <10 % valid pixel coverage or where water year maximum SWE did not exceed 20 cm. This resulted in a total of 7294 water-year observations with valid runoff onset estimates, spanning 1116 of the 1210 stations (stations were excluded only when no water years passed the filters).
For these water years and stations, we computed the timing difference between this representative runoff onset estimate from our annual runoff onset products and the snow pillow runoff onset estimate. We quantified the bias and spread of the timing differences for each water year across all stations by computing the median and the median absolute deviation of the residuals.
3.1 Dataset overview
The global snowmelt runoff onset dataset contains five groups of products organized in a cloud-optimized Zarr store designed for efficient distributed access, processing, and analysis. The dataset spans the global domain from 180° W–180° E longitude and 60° S–81.1° N latitude, encompassing almost all seasonal snow on Earth. All products are provided in geographic coordinates (decimal degrees), using the WGS84 ellipsoid as the horizontal coordinate reference system (EPSG:4326). Pixel spacing is approximately degree, corresponding to 80 m at the equator. Although longitudinal ground distance per pixel decreases at higher latitudes (e.g., ∼40 m at 60° N), the effective spatial resolution of the dataset remains 80 m across all latitudes because the 80 m Sentinel-1 RTC overviews were used as input (Sect. 2.1.1). All products share spatial dimensions (latitude: 195 970, longitude: 499 998), but only the annual products add a leading water_year dimension spanning the 10 water years from 2015–2024. Though the original values are integer or floating point numbers, all values are stored as signed 16-bit integers with relevant scaling and offset parameters stored in the metadata, with no-data values of −9999.
3.2 Dataset variables
3.2.1 Annual runoff onset products
The “runoff_onset” variable contains integer day of water year (DOWY) representing runoff onset date estimates for each individual water year from 2015–2024, stored as a 3-dimensional array with dimensions (water_year, latitude, longitude). All DOWY dates are relative to their respective hemispheres' start of water year, discussed further in Sect. 2.2.2. Valid DOWY values range from 1–366.
3.2.2 Annual local temporal resolution products
The dataset also includes an accompanying “temporal_resolution” variable to document the average local temporal resolution of the dataset at each pixel for each individual water year (water_year, latitude, longitude). These “temporal_resolution” values are in units of decimal days, rounded to the nearest 0.1 d.
3.2.3 10-year composite products
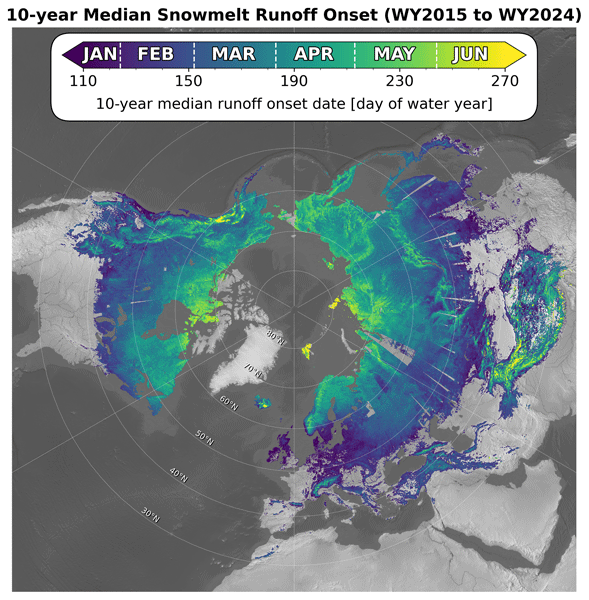
The “runoff_onset_median” variable stores the 10-year median runoff onset composite values as integer DOWY, useful for understanding typical runoff onset timing (Figs. 2a and 3). The “runoff_onset_mad” variable stores the 10-year median absolute deviation composite values as decimal days (rounded to the nearest 0.1 d), providing a measure of interannual variability in runoff onset timing (Fig. 2b). More specifically, this composite quantifies the dispersion of valid annual runoff onset timing estimates at each pixel and should not be considered a proxy for retrieval uncertainty. The “temporal_resolution_median” variable stores the 10-year local median temporal resolution composite values as decimal days (rounded to the nearest 0.1 d), summarizing typical local observation frequency during the study period (Fig. 2c). These 2-dimensional (latitude, longitude) composite products are only calculated at pixels that have 3 or more water years of valid data, as described in Sect. 2.2.4.
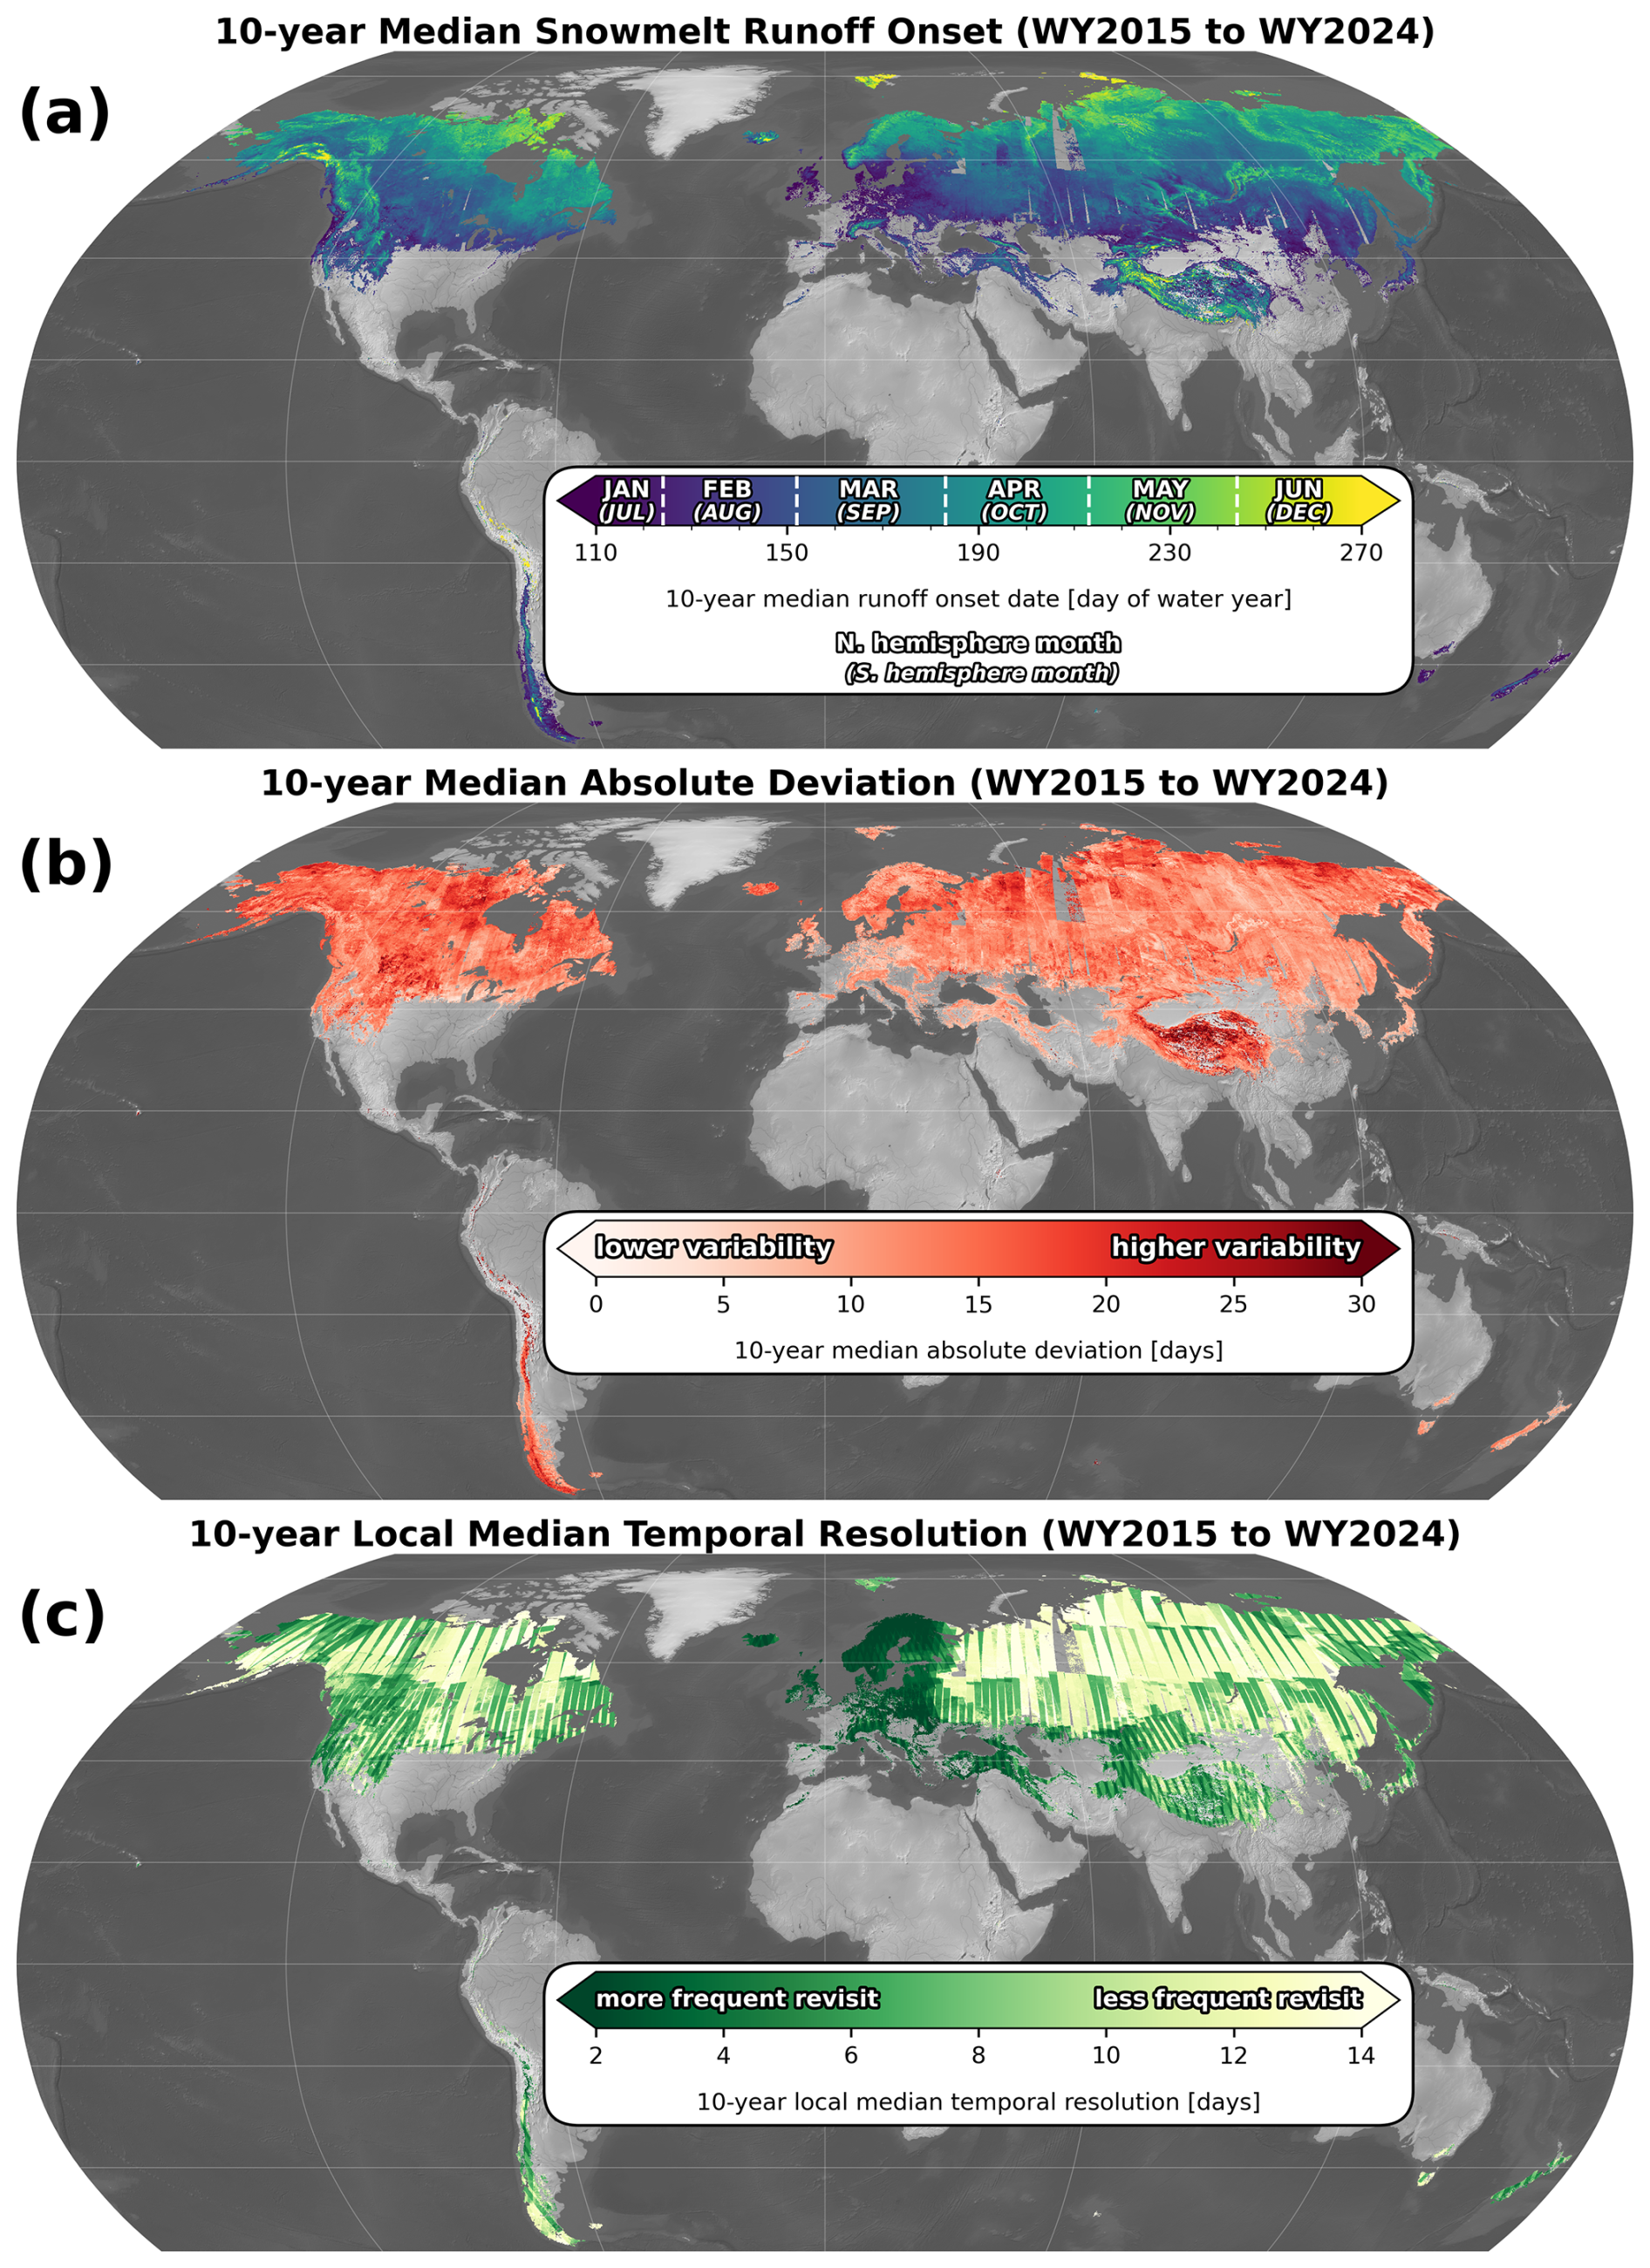
Figure 2Global snowmelt runoff onset composite products. (a) 10-year median snowmelt runoff onset, (b) 10-year median absolute deviation, and (c) 10-year local median temporal resolution.
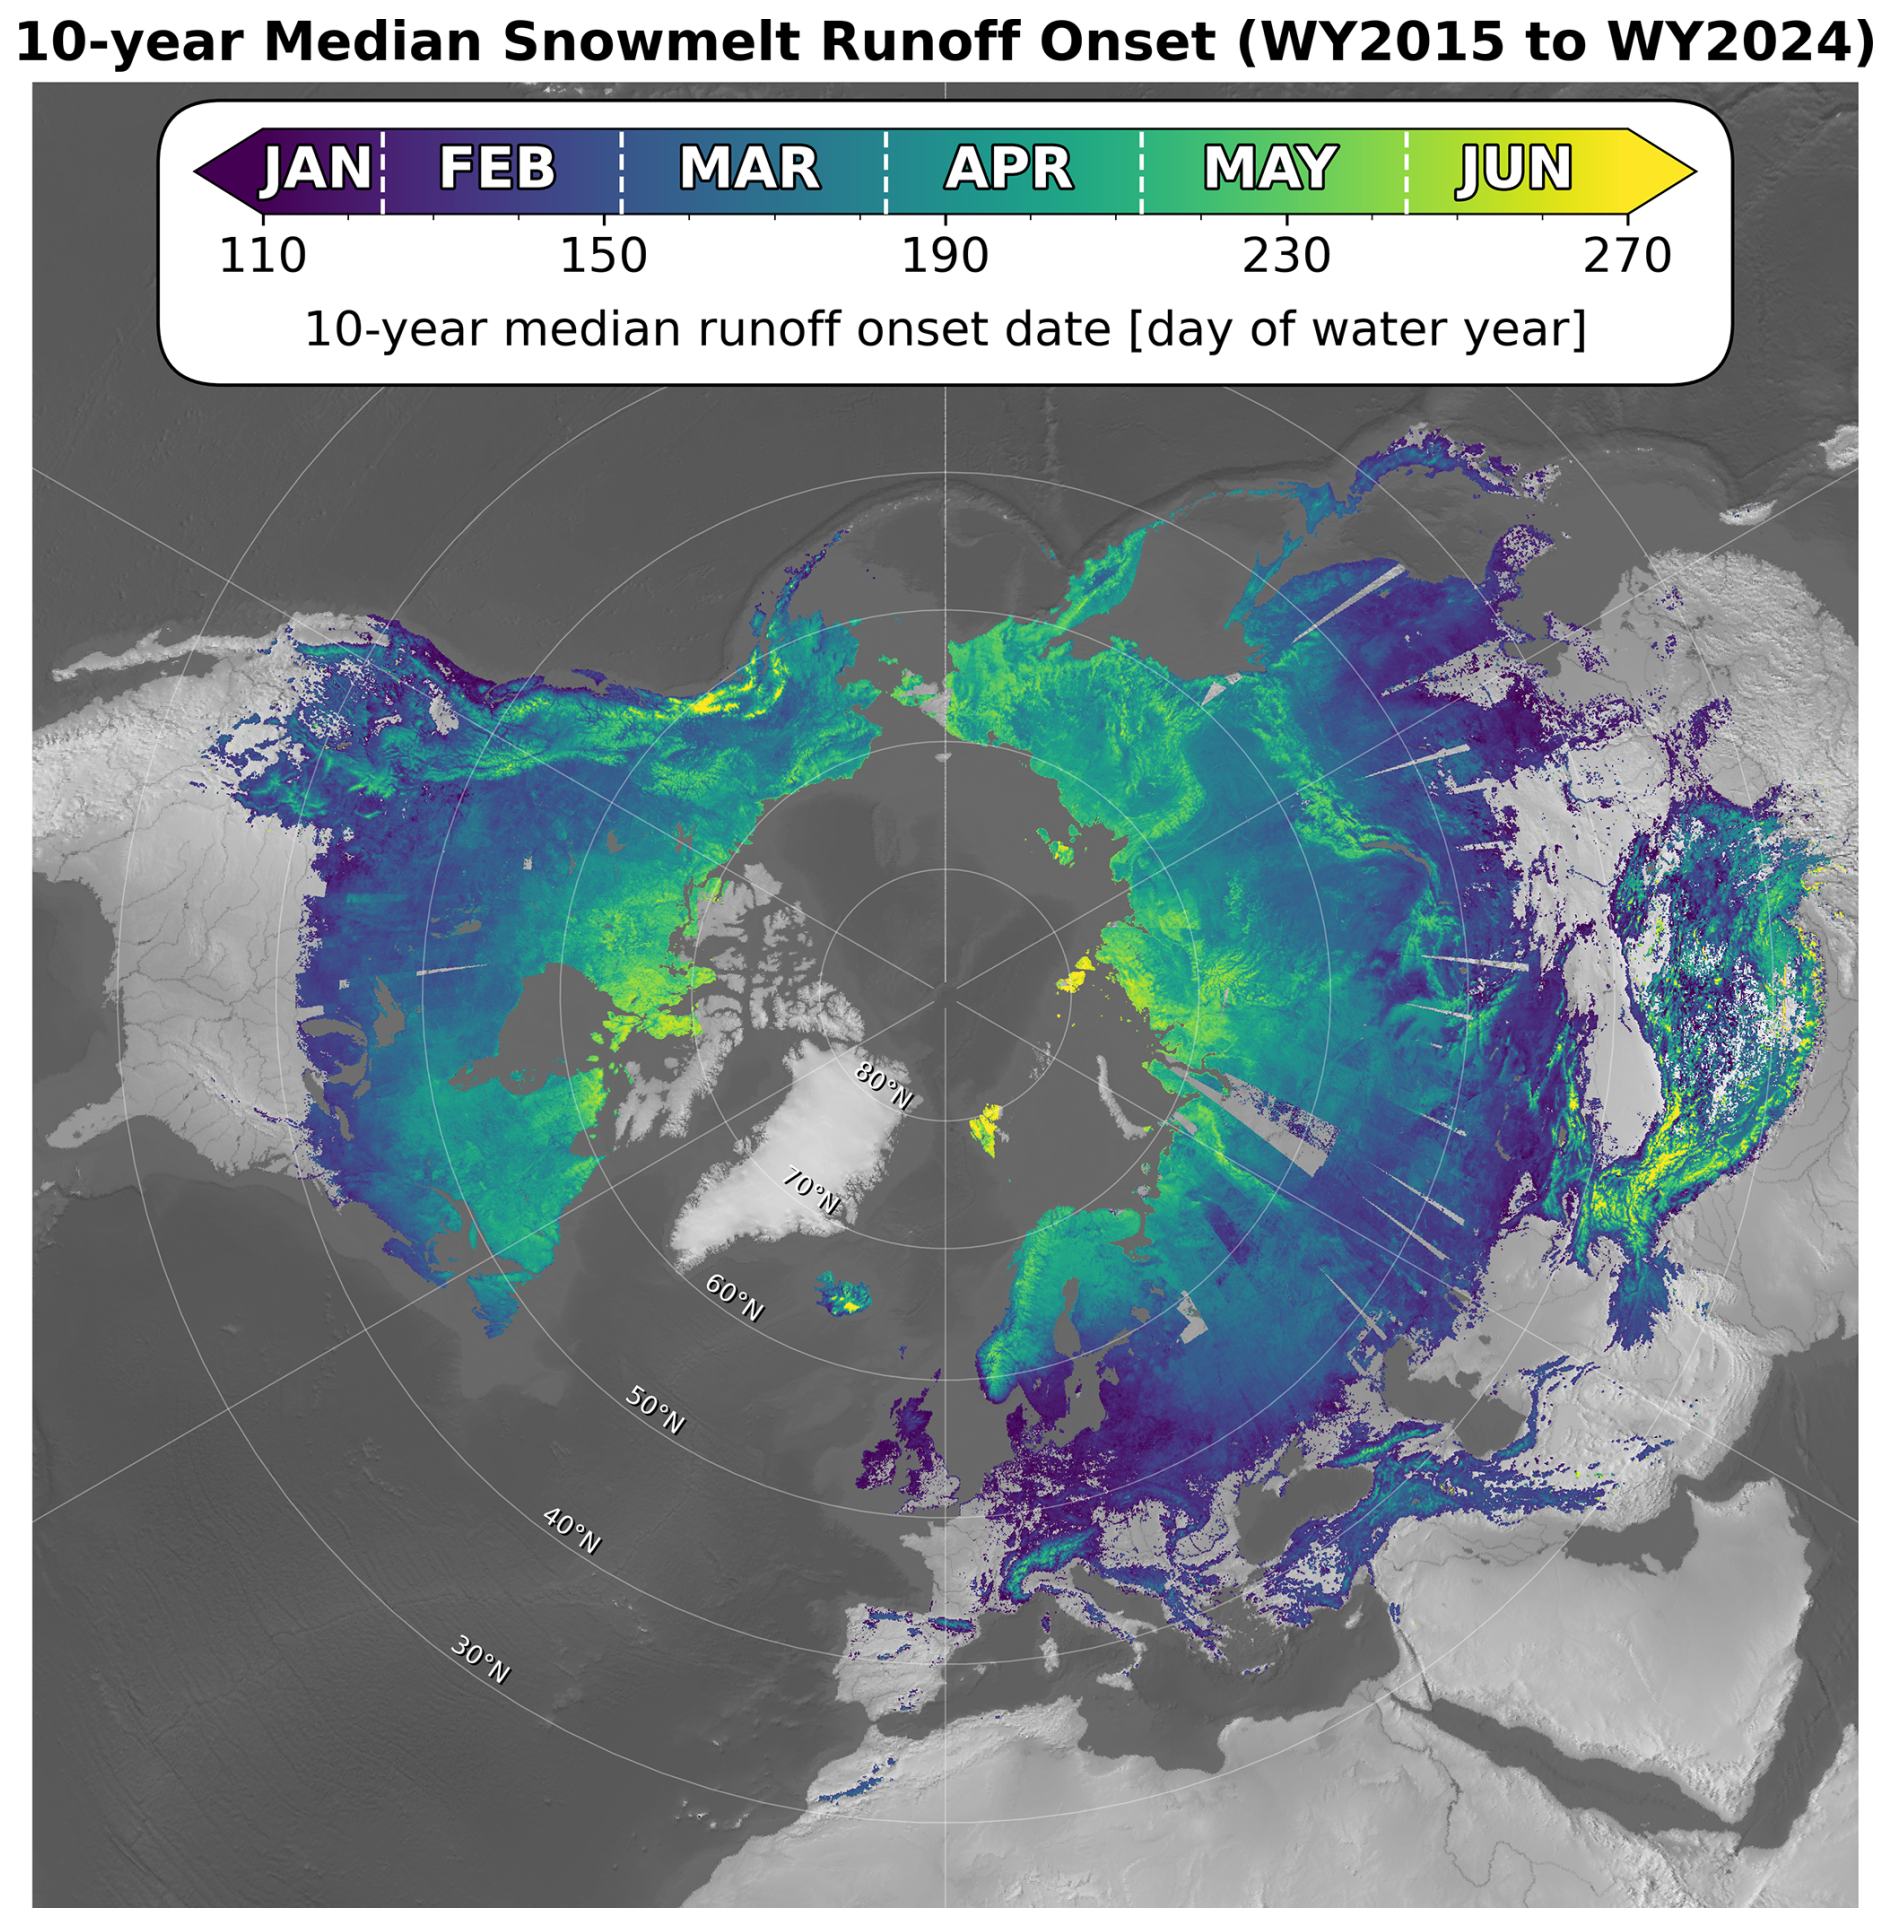
Figure 3Polar stereographic projection of 10-year median snowmelt runoff onset date for the Northern Hemisphere. See Fig. A2 for polar stereographic maps of all three composite products.
3.3 Spatial coverage and temporal resolution
The spatial coverage of our global snowmelt runoff onset dataset is constrained by the availability of Sentinel-1 Interferometric Wide mode data with VV polarization. Under the Sentinel-1 observation plan, Antarctica and much of the High Arctic are acquired in Extra Wide mode or in Interferometric Wide mode with HH+HV polarization, neither of which are usable by our VV-based approach. Our dataset therefore does not include km2 of seasonal snow over the ice-free areas of Antarctica, Greenland, the Canadian Arctic Archipelago, and the Russian Arctic Islands (Brooks et al., 2019; Liston and Sturm, 2021).
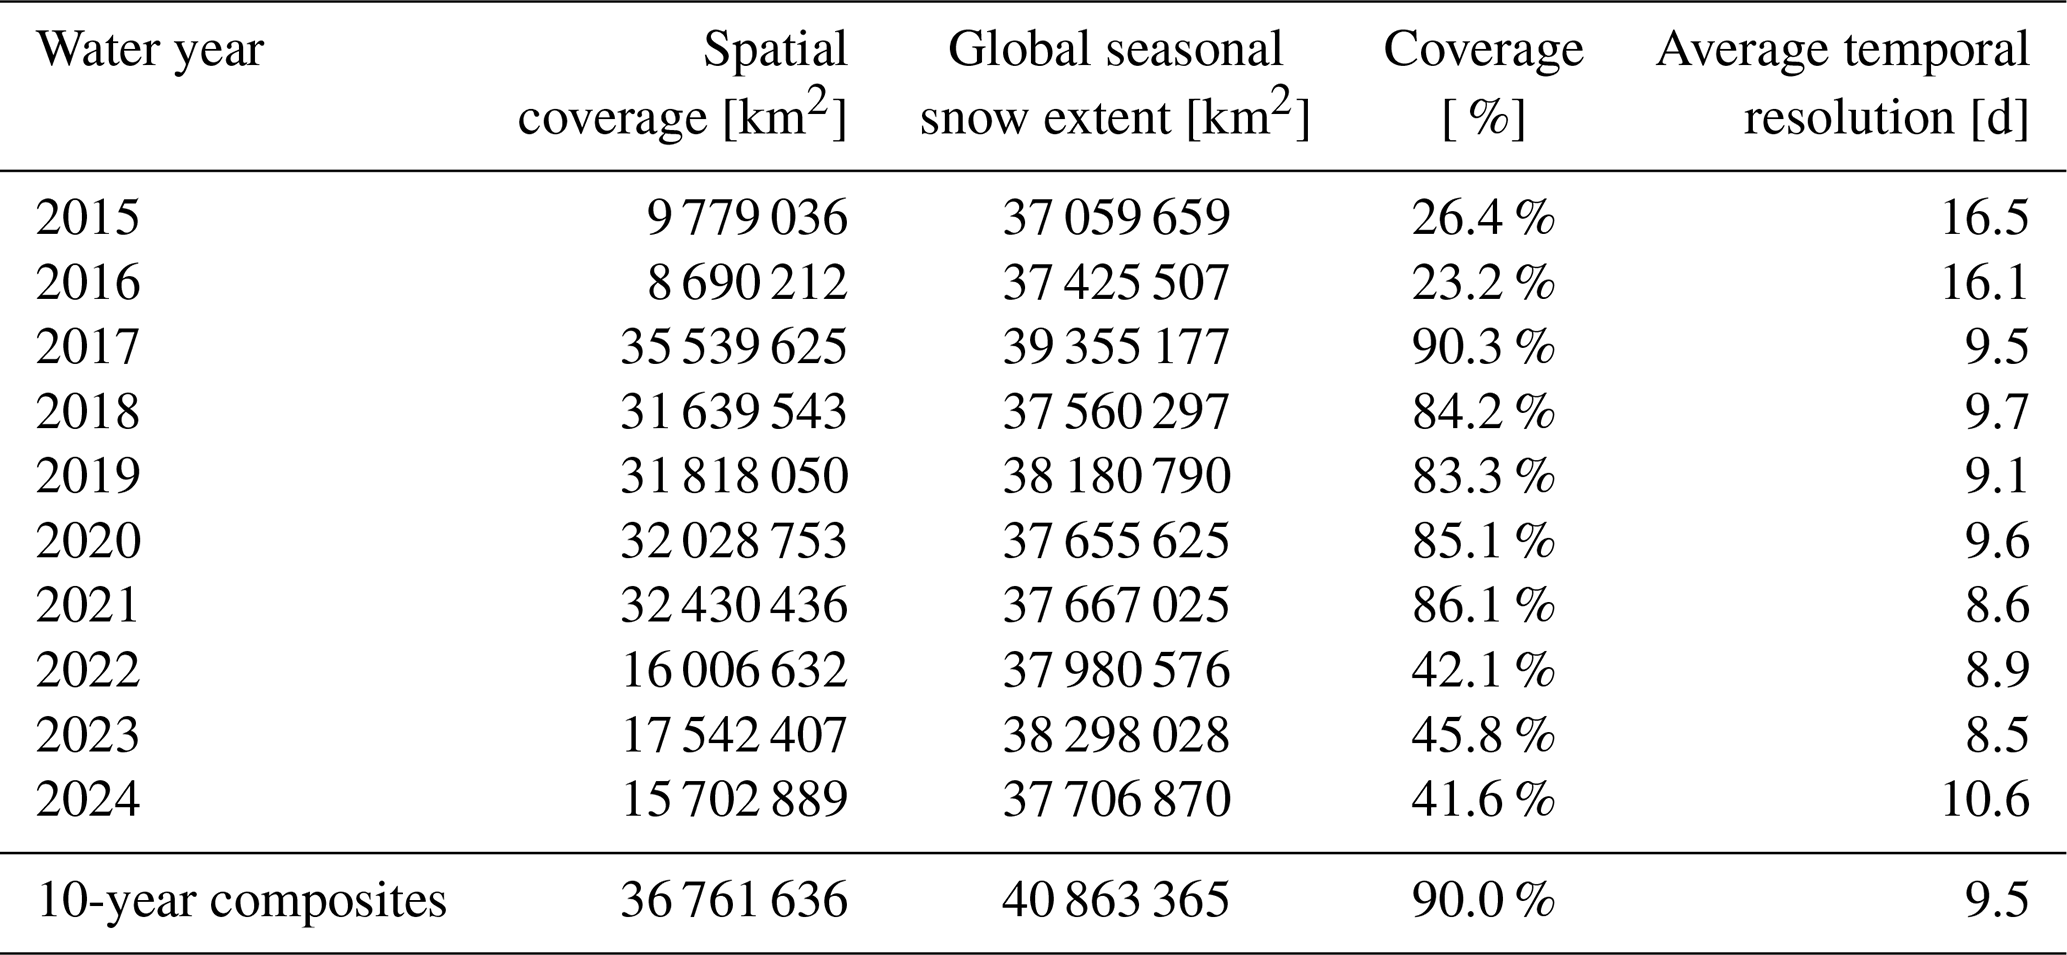
The spatial coverage and temporal resolution of our dataset vary by region and water year (Table 1, Figs. A3 and A4). There are three distinct phases of temporal resolution, largely controlled by the number of active satellites in the Sentinel-1 constellation. Water years 2015 and 2016 have the smallest spatial coverage (8.7–9.8×10⁶ km2, 23 %–26 % of global seasonal snow extent) and coarsest average temporal resolution (16.1–16.5 d). Water years 2017–2021 have expanded spatial coverage (31.6–35.5×10⁶ km2, 83 %–90 % of global seasonal snow extent) and improved temporal resolution (8.6–9.7 d). Water years 2022–2024 have intermediate spatial coverage (15.7–17.5×10⁶ km2, 41 %–46 % of global seasonal snow extent) and temporal resolution comparable to water years 2017–2021 (8.5–10.6 d).
Across all water years, the overall area-averaged global temporal resolution was 9.5 d, with the 10-year median runoff onset composite covering 36.8×10⁶ km2 (90 % of global seasonal snow extent). Figure A4 shows the number of water years with valid runoff onset estimates used to prepare the 10-year composites.
Table 1Global snowmelt runoff onset dataset spatial coverage, global seasonal snow extent, percent coverage of global seasonal snow extent, and average temporal resolution for each water year and the 10-year composites. Spatial coverage represents the total area with valid runoff onset estimates. Global seasonal snow extent is the annual seasonal snow extent from the MODIS-derived snow phenology dataset, including regions without VV-polarized Sentinel-1 Interferometric Wide mode coverage (i.e., ice-free areas of Antarctica, Greenland, the Canadian Arctic Archipelago, and Russian Arctic Islands). See Fig. A3 for annual maps of coverage and temporal resolution.
Regional variations in temporal resolution are pronounced across the global domain (Fig. 2c). The finest 10-year median temporal resolution was observed over mainland Europe, with median temporal resolution of 4 d or finer, improving to 2 d or finer in northern Europe. In contrast, the coarsest temporal resolution is observed in northwest North America and northern Asia, with 10-year median temporal resolution of around 12 d. Most other regions fall between these extremes, with 10-year median temporal resolution typically ranging from 6–10 d (Fig. 2c). The temporal resolution varies not only by region, but also locally within regions, reflecting both Sentinel-1 data availability and our pixel-wise processing methodology.
In addition to the 10-year median temporal resolution (Fig. 2c), it is important to consider the spatial variability in the total number of years with valid observations (Fig. A4). Despite coarser temporal resolution, northwest North America has 10 years of valid runoff onset observations, which is similar to northern Europe, while large swaths of northern Asia only have 3–4 years of valid observations. In these regions with fewer years of valid observations, the 10-year composite products are less robust.
4.1 Effects of forest cover fraction, SWE, and temporal resolution
The pixel-wise analysis reveals that forest cover fraction, SWE, and temporal resolution systematically affect the bias (median) and spread (median absolute deviation) between runoff onset estimates from our annual products and the in situ snow pillow sensors computed using the full, unfiltered set of residuals across the complete range of each variable (Fig. 4).
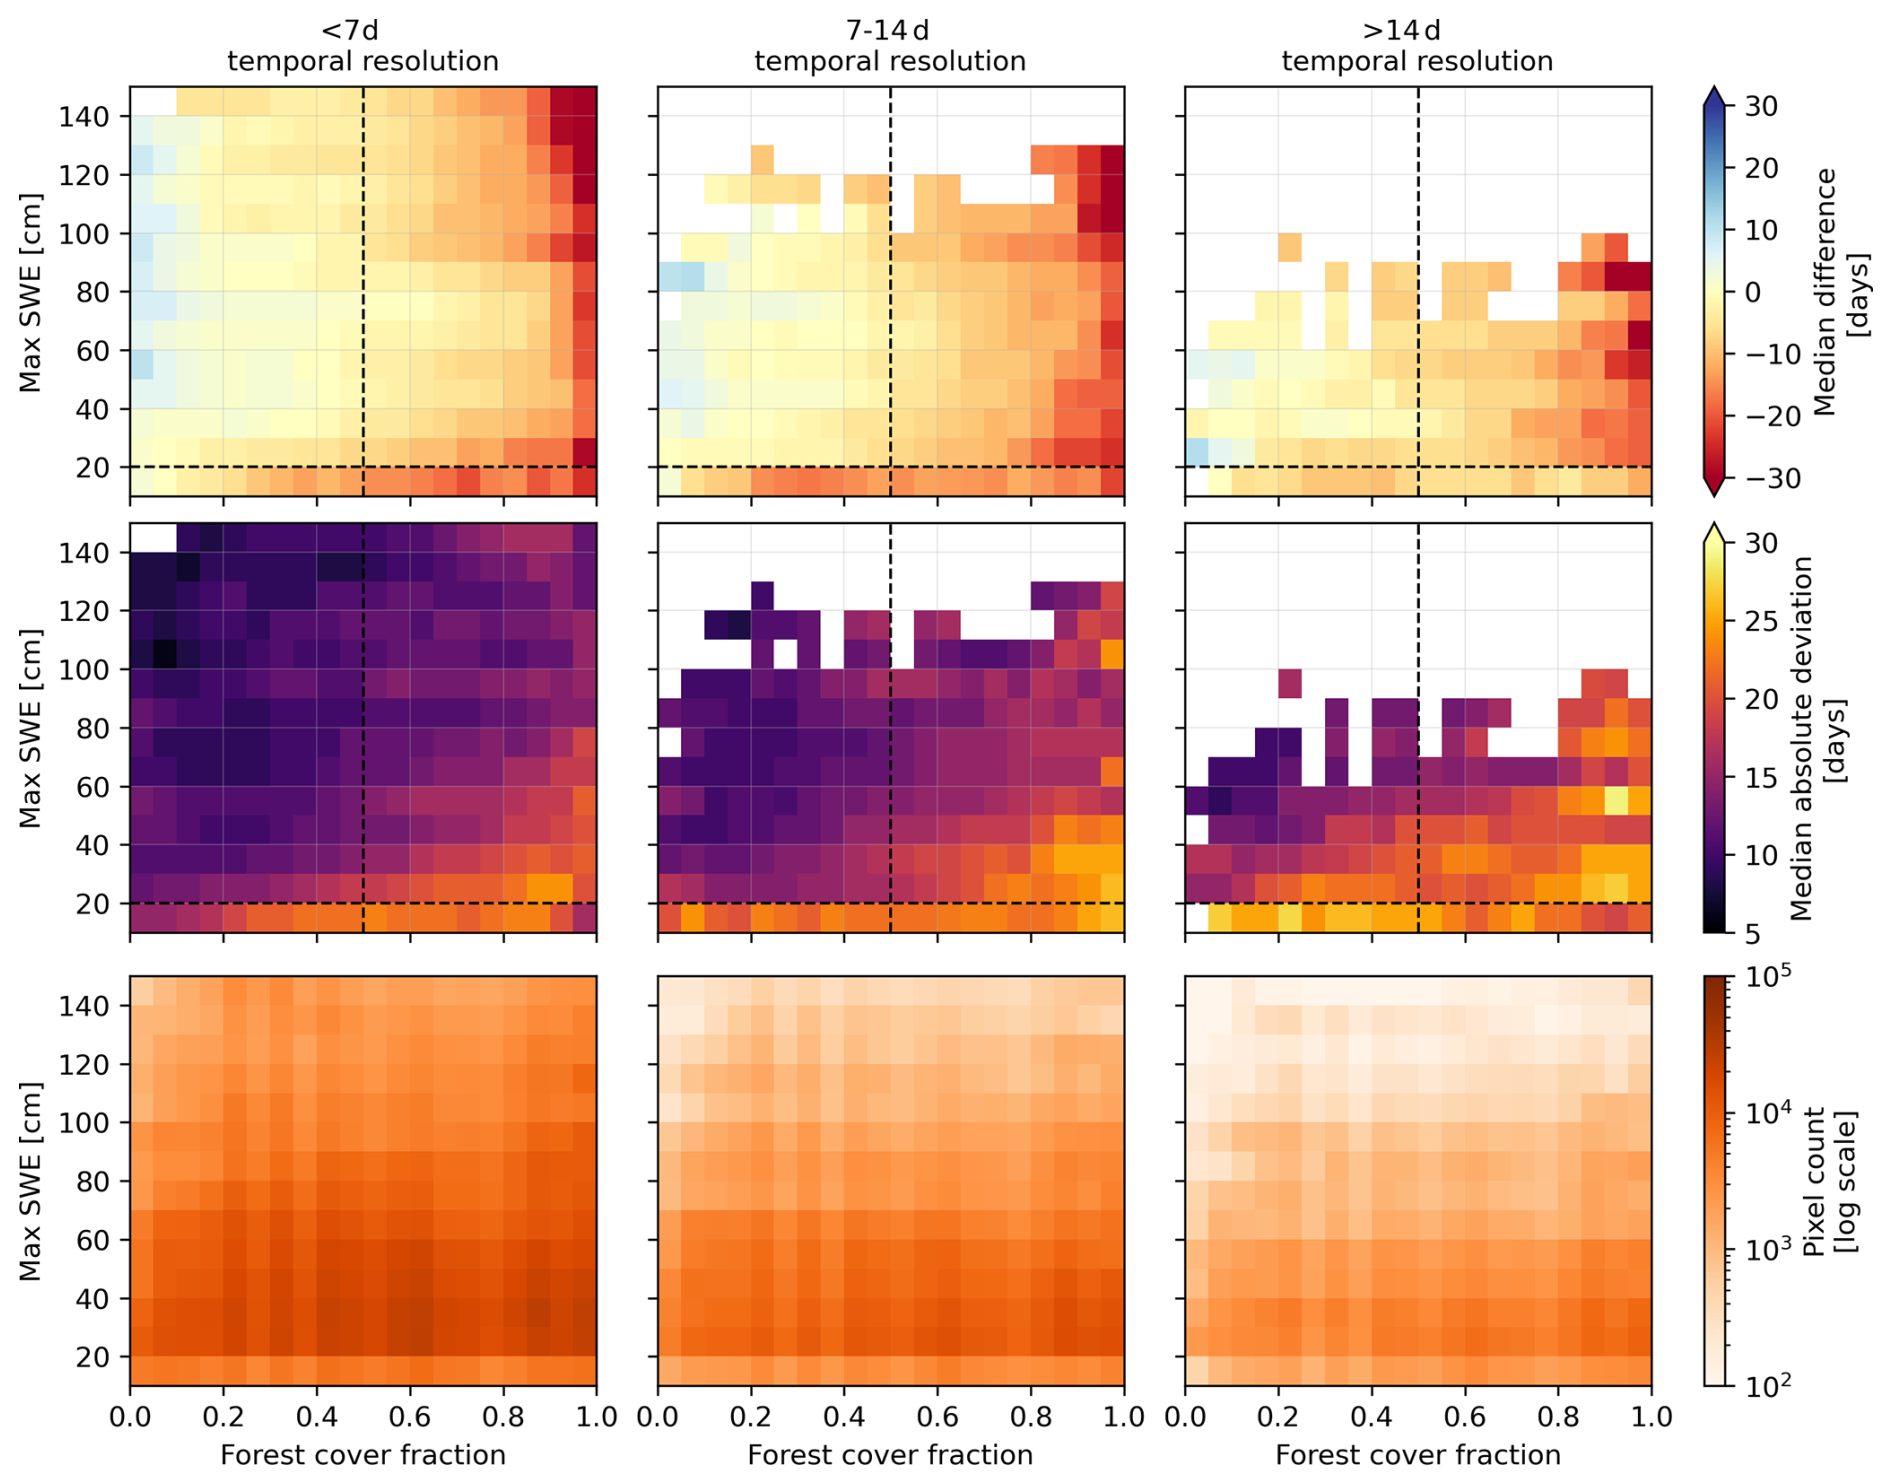
Figure 4Agreement between our runoff onset estimates and snow pillow runoff onset estimates as a function of forest cover fraction, SWE, and temporal resolution. Top row shows the median of residuals (our product minus snow pillow, used to assess bias), middle row shows median absolute deviation of residuals (used to assess spread), and bottom row shows pixel counts per bin. Metrics are binned for different combinations of forest cover fraction (x-axis), water year maximum SWE (y-axis), and temporal resolution (columns: <7, 7–14, >14 d). Note increase in the median and median absolute deviation values for forest cover fraction values above 0.5 (vertical dashed lines), water year maximum SWE values less than 20 cm (horizontal dashed lines), and temporal resolution coarser than 14 d (third column).
Forest cover fraction emerges as the dominant control on the bias and spread of residuals. Bias increases with increasing forest cover fraction; for areas with forest cover fraction greater than 0.5, our products generally show runoff onset occurs 5–25 d earlier than corresponding snow pillow estimates, compared to bias of less than 5 d in areas with forest cover fraction less than 0.5. The spread of residuals is higher (10–25 d) for forest cover fraction greater than 0.5, compared to 5–15 d for forest cover fraction below 0.5.
SWE also influences the bias and spread of residuals, with better agreement in areas with higher observed water year maximum SWE. Bias and spread decrease markedly above approximately 20–30 cm SWE for forest cover fraction below 0.5, with this apparent SWE threshold increasing with forest cover fraction. For forest cover fraction below 0.5 and SWE between 10 and 20 cm, bias approaches 15 d with a spread of up to 25 d, while for SWE between 30 and 40 cm, bias decreases to near 0 and spread is reduced to less than 5 d. Generally, above ∼20 cm SWE, bias and spread continue to decrease with increasing SWE, but with diminishing magnitude.
Increased temporal resolution, evaluated at fixed values of forest cover fraction and SWE, shows moderate but consistent effects, with both the bias and spread decreasing with improving temporal resolution. This effect is most pronounced between forest cover fraction of 0.4 and 0.7, with spread improving from 20–25 d for pixels with >14 d temporal resolution, to 10–15 d for pixels with 7–14 d temporal resolution. This relationship holds for forest cover fraction below 0.4, albeit weaker in strength.
Based on these empirical results, we applied quality filters for the station-level analysis that follows, restricting analysis to pixels with a forest cover fraction below 0.5 and temporal resolution below 14 d, and, at the station level, water years with a maximum SWE greater than 20 cm.
4.2 Automated weather station evaluation results
After applying the quality filters identified in Sect. 4.1, the evaluation of runoff onset estimates from our annual products and the in situ snow pillow sensors revealed generally good agreement with notable temporal and spatial patterns across the evaluation network (Fig. 5). Across all water years, the bias, represented by the median residual (our product minus snow pillow), was −2.0 d and the spread, represented by the median absolute deviation of residuals, was 10.0 d. In other words, 50 % of the runoff onset residuals were within 10 d of the median, which is similar to the dataset temporal resolution for Western North America, where the majority of our evaluation network resides (Fig. 2c).
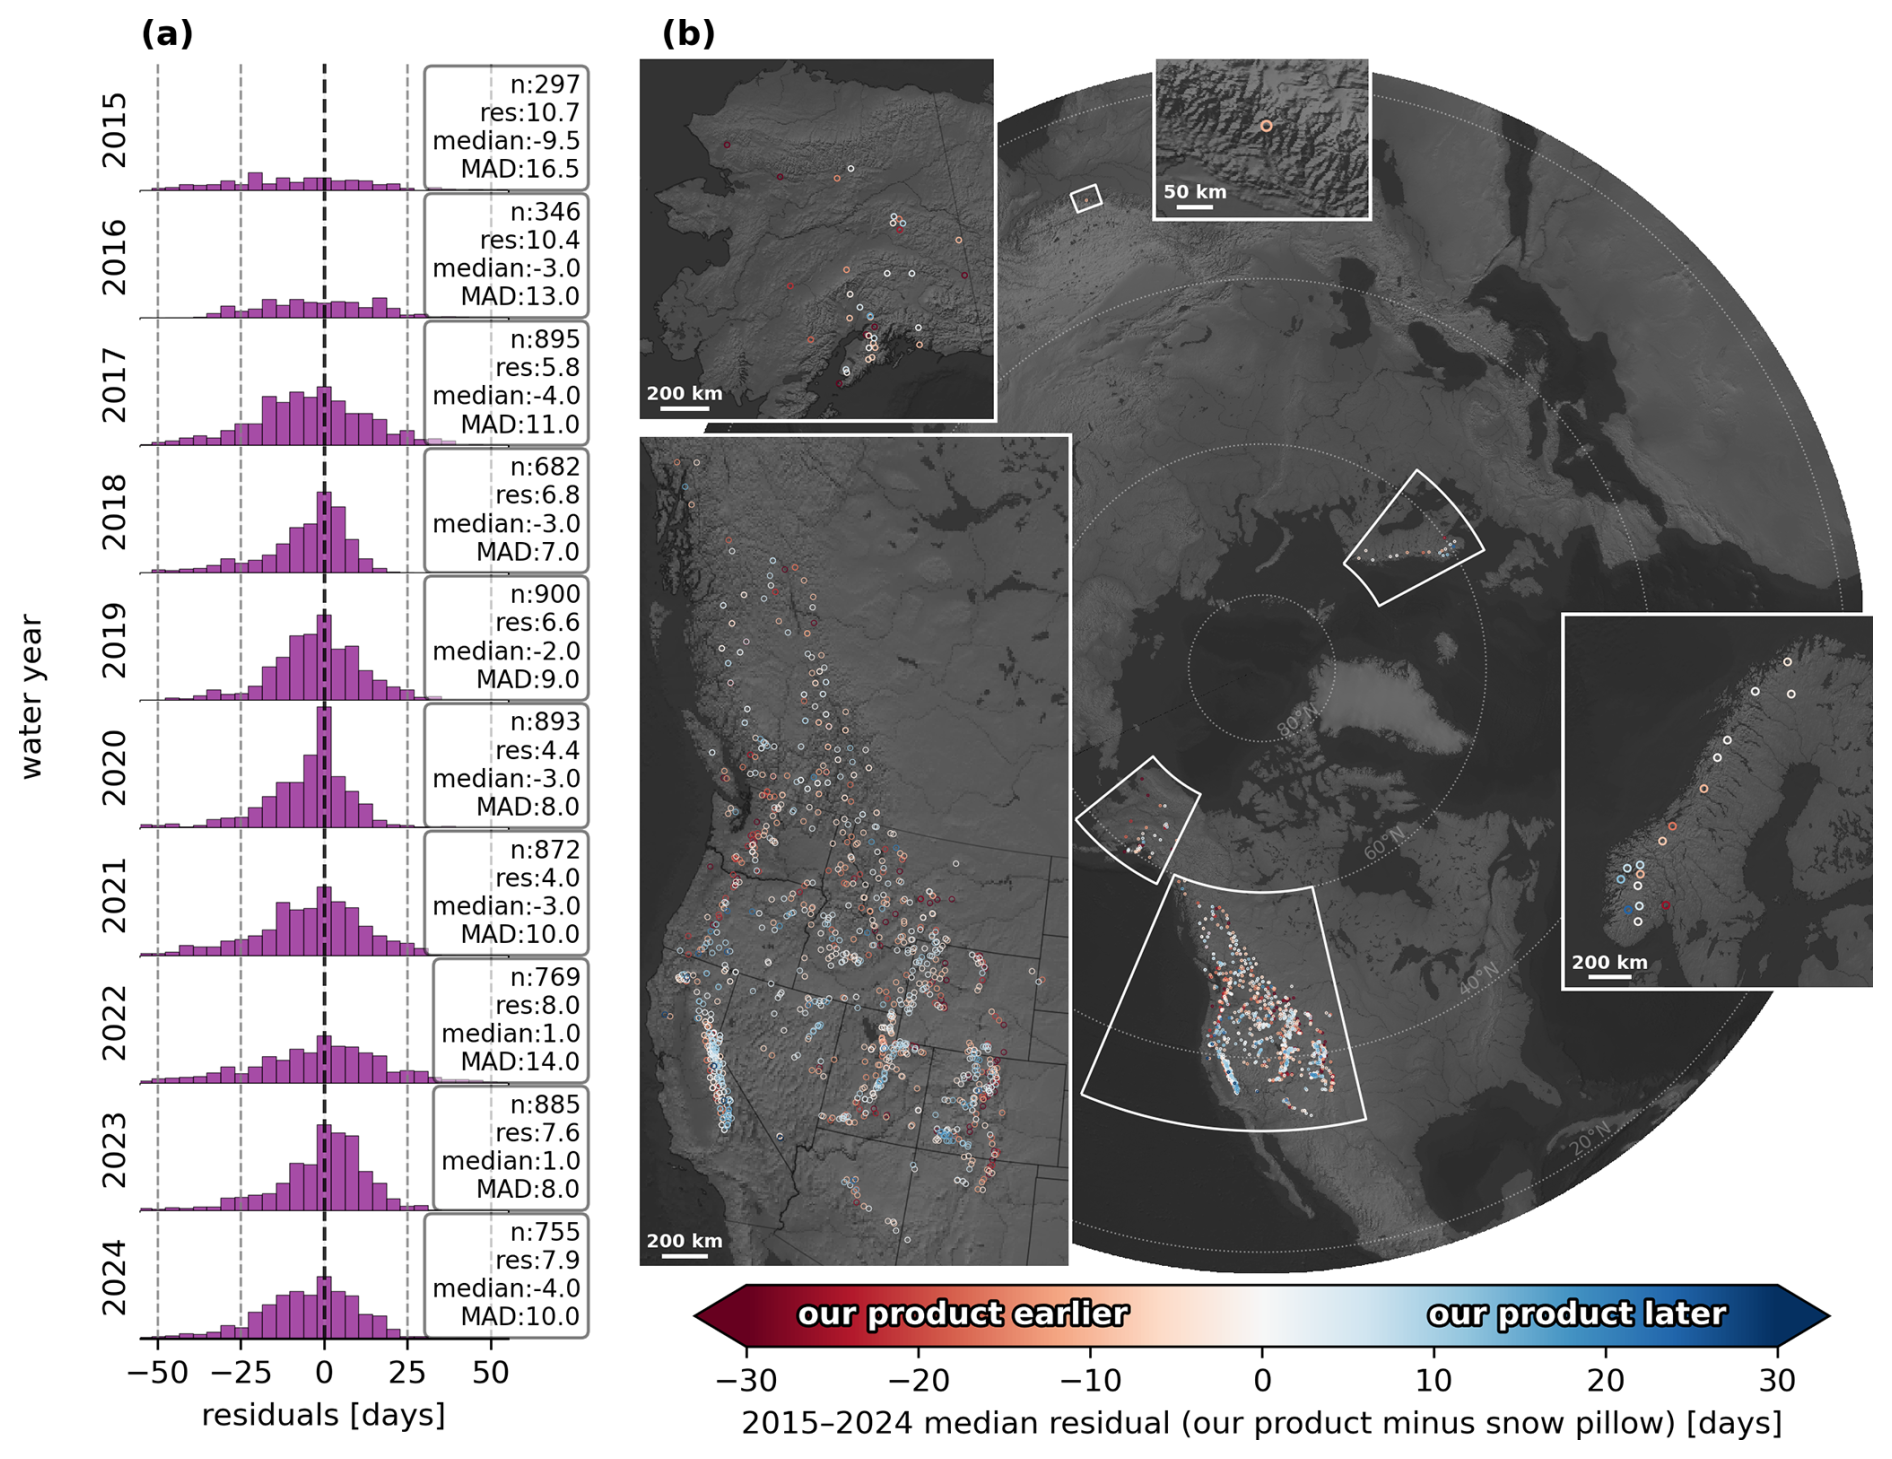
Figure 5Evaluation of runoff onset estimates from our annual products and 1116 automated weather station snow pillow observations for the 10-year period spanning 2015–2024. (a) Distribution of residuals (our product minus snow pillow) for each water year. Text annotations show residual statistics: number of stations (n), average temporal resolution of our annual runoff onset products across evaluated stations (res), median of the residuals (median), and median absolute deviation (MAD) of the residuals. (b) Median of 2015–2024 residuals (our product minus snow pillow) for each station. At each station, positive values (blue) indicate that the runoff onset estimate from our products usually occurs after the snow pillow estimate, and negative values (red) indicate the runoff onset estimate from our products usually occurs before the snow pillow estimate.
The spread of residuals varied over the study period (Fig. 5a), though bias remained relatively low in all years except the sparsely sampled 2015 (n=297). Early years (2015 and 2016) with coarser temporal resolution (10.4–10.7 d for the evaluated stations, compared to the ∼16.5 d global average in Table 1) exhibited a larger spread in residuals (MAD in Fig. 5a). With finer temporal resolution (4.0–6.8 d) through water years 2017–2021, the spread of residuals decreased. From water year 2022 onward, the average temporal resolution at the stations was 7.6–8.0 d, with a similar spread of residuals.
The spatial distribution of residual bias revealed distinct regional patterns (Fig. 5b). Stations with the largest bias, where runoff onset estimates from our annual products occurred up to 30 d earlier than the snow pillow estimates, were concentrated in the southern Rocky Mountains east of the North American continental divide, where greater forest cover fraction coincides with lower SWE. Conversely, stations with smaller bias (<10 d) were located in regions with lower forest cover fraction and higher SWE, such as the Sierra Nevada, Colorado Plateau, and the southern Rockies west of the North American continental divide.
5.1 Variations in spatial and temporal coverage
This global high-resolution snowmelt runoff onset dataset represents a significant advancement in snow hydrology monitoring, providing finer spatial detail and broader geographic coverage than existing snowmelt datasets. With 80 m resolution, it bridges a critical observation gap between coarse passive microwave products (typically ∼25 km) and sparse, point-scale in situ networks (1 station per ∼1200 km2 in mountain regions of the Western U.S.), while offering a consistent, reproducible methodology applied globally over a decade-long record. This resolution improvement is illustrated in Fig. 6, which compares our annual runoff onset product to the enhanced resolution (6.25 km) passive microwave melt onset product from Pan et al. (2021) over the Alaska Range for water year 2020. Our annual runoff onset products resolve fine-scale snowmelt variability across complex terrain that is not captured by the passive microwave results, even with enhanced resolution.
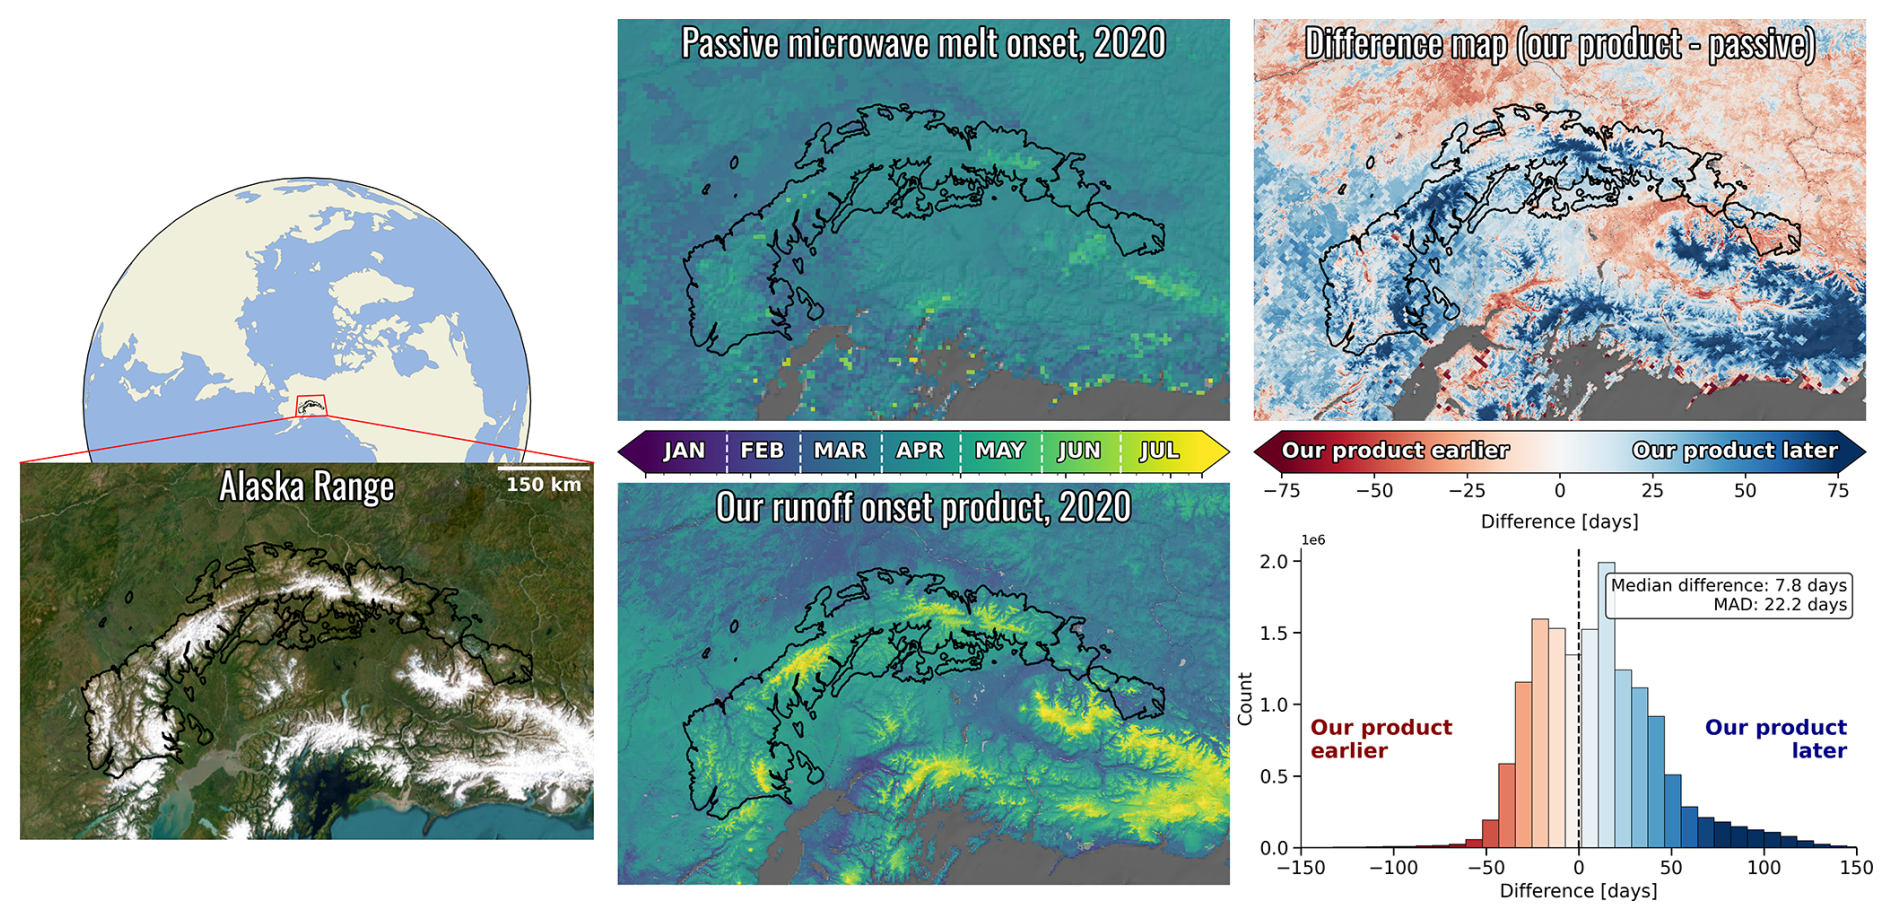
Figure 6Comparison of snowmelt timing over the Alaska Range for water year 2020 between the ABoVE: Passive Microwave-derived Annual Snowpack Main Melt Onset Date products (Pan et al., 2021) at 6.25 km resolution (top center) and our Sentinel-1 SAR-based annual runoff onset product at 80 m resolution (bottom center). The difference map (top right) and histogram (bottom right) show a median difference of 7.8 d (our product minus passive microwave), with a median absolute deviation of 22.2 d. Despite similar median timing, our runoff onset product reveals spatial heterogeneity that is unresolvable at the passive microwave scale, particularly across complex terrain. Data attribution: ABoVE melt onset data © NASA. Basemap: Esri World Imagery (Sources: Esri, DigitalGlobe, GeoEye, i-cubed, USDA FSA, USGS, AEX, Getmapping, Aerogrid, IGN, IGP, swisstopo, and the GIS User Community|Powered by Esri).
Though a comprehensive scientific analysis of our global runoff onset dataset is presented in a complementary study, preliminary examination of the annual products reveals coherent geographic patterns consistent with theoretical expectations of snowmelt across diverse snow environments. Across all continents and latitudes, we observe relatively smooth elevation gradients in snowmelt runoff onset timing – the earliest runoff onset occurs at lower elevations, with runoff onset occurring progressively later at higher elevations.
However, dataset spatial coverage and temporal resolution vary systematically across space and time due to the evolving Sentinel-1 constellation and observation plan. The 10-year median temporal resolution composite (Fig. 2c) shows how typical temporal resolution varies from the most frequently observed regions (2–4 d in mainland Europe) to the least frequently observed regions (12+ d in northwest North America and northern Asia). Similarly, dataset spatial coverage and temporal resolution vary by water year, with three distinct temporal phases reflecting the evolving constellation configuration. Water years 2015–2016 represent the early single-satellite period with Sentinel-1A alone, resulting in limited global coverage and coarse temporal resolution. Water years 2017–2021 coincide with the two-satellite constellation following Sentinel-1B's launch in April 2016, enabling more frequent observations that substantially improved spatial coverage and temporal resolution. Water years 2022–2024 reflect single-satellite observations after Sentinel-1B's failure in December 2021, though spatial coverage and temporal resolution remain significantly better than the initial period due to modifications to the Sentinel-1A observation plan (Potin et al., 2022). As we will detail in the following sections, these variations in temporal resolution introduce spatial variability in the agreement between our runoff onset estimates and snow pillow runoff onset estimates.
5.2 Controls on runoff onset estimate agreement
The three factors identified earlier – forest cover fraction, SWE, and temporal resolution – collectively influence the agreement between our runoff onset estimates and snow pillow runoff onset estimates. Forest cover fraction was the dominant control. Where pixels contain mixed land cover, backscatter change may be dominated by non-snow scatterers, and in forested regions C-band SAR represents an integrated response from the forest canopy, underlying snowpack, and ground surface (Bonnell et al., 2024; Gao and Ma, 2024). Accordingly, runoff onset estimate agreement degrades with increasing forest cover fraction, with an approximate inflection point around forest cover fraction values of 0.5 (Fig. 4), below which residuals show minimal bias and spread, and above which both bias and spread increase markedly. This systematic degradation in agreement arises because dense forest canopies fundamentally limit C-band SAR penetration to the underlying snowpack, causing backscatter changes to instead reflect canopy-driven processes including forest disturbance and canopy structural change (Kurum, 2015), tree sway (Raleigh et al., 2022), tree temperature (Bonnell et al., 2024; Lemmetyinen et al., 2022), tree water content (Steele-Dunne et al., 2012), and potentially intercepted snow melting in the canopy (Bonner et al., 2022). Additionally, densely forested areas with warmer winters tend to have frequent winter melt, further complicating runoff onset identification (Lundquist et al., 2013). Other SAR-based analyses of snow, such as ΔSWE estimation from L-band InSAR (Bonnell et al., 2024) and snow depth estimation from C-band volume scattering (Hoppinen et al., 2024), also observe a degradation in algorithm performance around forest cover fraction of 0.5, suggesting that this value may represent a fundamental physical threshold for SAR penetration through forest canopies to underlying snowpack at ∼5–25 cm wavelengths. Forest cover fraction is therefore a useful but coarse predictor, capturing the first-order canopy effect, but not time-varying canopy properties such as canopy structure, disturbance, species composition, branch density, and vertical heterogeneity, which govern how the SAR signal actually interacts with the canopy and underlying snowpack.
SWE also represented an important control on runoff onset estimate agreement, with a critical threshold near 20 cm, below which snowmelt runoff onset could not be reliably detected (Sect. 4.1). While snow pillow accuracy and precision may themselves degrade below ∼20 cm of SWE when no longer thermally insulated by overlying snowpack (Johnson and Schaefer, 2002), the observed degradation in runoff onset estimate agreement primarily reflects the physical limits of C-band SAR detection.
Fundamentally, detection of runoff onset is a signal-to-noise problem: the characteristic backscatter minimum can only be identified when the backscatter drop at runoff onset exceeds the background dry-snow backscatter variability. The underlying ground surface properties, particularly soil moisture and surface roughness, serve as the primary backscatter source when a snowpack is dry (Mätzler, 1987; Nagler et al., 2016). Stronger ground surface backscatter during dry-snow conditions results in a more pronounced backscatter minimum when the snowpack transitions to runoff onset, as signal absorption due to meltwater presence reduces the penetration depth, eliminating the backscatter contribution of the ground surface. Deeper snowpacks with greater SWE contribute additional dry-snow backscatter through enhanced volume scattering (Brangers et al., 2024), further increasing the backscatter contrast at runoff onset, while shallower snowpacks have less cold content and experience more frequent melt-refreeze events that complicate identification of runoff onset. Interestingly, limited C-band penetration depth in wet snow suggests that snow beneath the top ∼5–10 cm of the snowpack should not directly influence the backscatter response once the surface is wet (Lund et al., 2020; Nagler, 1996). Yet deeper snowpacks consistently show improved snowmelt runoff onset detection (e.g., Fig. A1), indicating that SWE likely serves as a useful proxy for the environmental conditions that influence the identification of the characteristic backscatter minimum. Finally, the observed dependence of the SWE threshold on forest cover fraction also supports this signal-to-noise interpretation: dense forest canopies introduce additional background backscatter variability, requiring progressively more dramatic backscatter decreases during runoff onset to produce a backscatter minimum detectable above background backscatter variability.
Temporal resolution showed moderate but consistent effects, with bias and spread decreasing as observation frequency improved, suggesting that low observation frequency may fail to capture the characteristic backscatter minimum, especially during rapid snowmelt transitions. This effect was most pronounced at forest cover fraction between 0.4 and 0.7, where canopy-driven backscatter variability makes observation frequency more critical. Beyond observation frequency alone, pixels with finer temporal resolution typically combine multiple independent relative orbits, and thus multiple viewing geometries, some of which may achieve better canopy penetration. This aggregation likely explains the reduced spread of residuals observed even in the most densely forested areas (forest cover fraction exceeding 0.7) when temporal resolution is finer than 7 d.
Areas with a combination of high forest cover fraction, low SWE, and coarse temporal resolution represent the most challenging conditions for reliable snowmelt runoff onset detection, often resulting in bias and spread of up to 30 d. Conversely, in areas with forest cover fraction <0.5, >20 cm SWE, and temporal resolution <14 d, bias approaches 0 and spread approaches the temporal resolution of the underlying observations. Importantly, even when one of these factors is sub-optimal – such as moderately high forest cover but adequate SWE and finer temporal resolution, or coarse temporal resolution but sparse forest cover and adequate SWE – the runoff onset estimates typically display acceptable agreement with snow pillow estimates with bias of up to 10 d and spread of 5–20 d. Finally, the controls examined here are not exhaustive, and other factors likely affect runoff onset estimate agreement, such as terrain complexity, snow grain size evolution, land cover type and change, soil moisture and roughness, and local meteorological conditions.
5.3 Evaluation and comparison challenges
Our evaluation using 1116 automated weather stations across the Western U.S., British Columbia, Norway, and Nepal demonstrates strong agreement between runoff onset estimates from our annual products and in situ snow pillows, with an overall median difference of −2.0 d and a median absolute deviation of 10.0 d – minimal systematic bias and a spread that approaches the temporal resolution of the original Sentinel-1 observations. This evaluation network samples all major classes of the global seasonal snow classification of Sturm and Liston (2021), though sampling density is highest in the Montane Forest class and lowest in the Tundra and Prairie snow classes (Fig. A5). Therefore, the aggregate station-level statistics reported here are weighted towards Montane Forest conditions and should not be read as equally representative of every snow class. The spatial distribution of station-level bias (Fig. 5b) follows the controls identified in Sect. 4.1: early bias where dense forest cover coincides with low SWE, and minimal bias elsewhere, confirming that our empirically-derived thresholds provide effective guidance for optimal usage of our dataset.
It is important to emphasize that both our product and snow pillow estimates of runoff onset detect snowpack-scale processes – when water drains from the snowpack – rather than basin-scale streamflow response. The timing that we report represents meltwater availability for subsurface infiltration and eventually streamflow contribution, not the arrival of water at stream gauges, which can lag by days to weeks depending on basin characteristics (Frisbee et al., 2011; Lowry et al., 2010).
Furthermore, the two approaches detect different physical processes related to runoff onset, introducing natural timing offsets that complicate direct comparison. Snow pillows measure mass change and can register SWE reductions from processes that precede or follow actual meltwater outflow, while our SAR methodology aims to identify a characteristic backscatter minimum associated with changes to liquid water content and snow surface roughness that accompany the transition to the runoff phase. For example, sublimation and wind redistribution can modify SWE without changing the liquid water content in a snowpack, potentially leading to earlier snow pillow estimates. Conversely, diurnal melt-freeze cycles, rain-on-snow events, and isolated warm periods may temporarily increase liquid water content and alter snow surface roughness before continuous runoff begins, potentially leading to earlier estimates from our product (Carletti et al., 2025; Darychuk et al., 2025). Though our methodology attempts to minimize these early false positive runoff onset estimates by restricting the temporal search window to begin at the midpoint of the snow-covered period (Sect. 2.2.2), we cannot guarantee the removal of false positive runoff onset estimates later in the season. Figure A1 illustrates how these challenges are compounded in shallow snowpack conditions, where snow pillow runoff onset timing becomes highly sensitive to small SWE fluctuations near the 95 % maximum SWE threshold, and the signal-to-noise ratio of the SAR backscatter minimum is reduced, leading to larger timing offsets between the two methods. These challenges are further complicated by the episodic nature of snowmelt itself – snowpacks often cycle repeatedly between melt phases, potentially leading to multiple discrete instances of runoff onset in a single season (Dingman, 2015; Lund et al., 2022). Despite such dynamic melt seasons, our median aggregation of runoff onset estimates across multiple individual relative orbits provides robustness against such variability. Accordingly, the reported runoff onset dates from our annual runoff onset products are best understood as a robust characterization of the seasonal transition to sustained meltwater release rather than a precise timestamp of a single discrete event.
Beyond these fundamental measurement differences, several methodological constraints introduce additional uncertainty into the evaluation itself. First, the two methods have different temporal sampling: the snow pillow measurements have daily intervals, while the SAR observations occur at intervals ranging from 6–24 d depending on the Sentinel-1 observation plan. Second, snow pillow measurement errors, such as meltwater pooling on the instrument surface, can distort the timing of SWE reduction (Webb et al., 2017). Finally, snow pillow and SAR geolocation uncertainty, as well as scale differences between point-based snow pillow measurements and the 80 m SAR pixels within the 1000 m station radius, contribute additional timing differences between the methods. Local spatial variability in SWE and snowmelt timing around these stations can be substantial over short distances, introducing uncertainty in representativeness (Meromy et al., 2013). However, statistical aggregation over the 7294 water-year observations across 1116 stations ensures that these local effects do not compromise the overall conclusions of the evaluation.
Despite these challenges, the overall agreement between our runoff onset estimates and snow pillow estimates confirms that our methodology can reliably detect snowmelt runoff onset across diverse landscapes, and the temporal evolution (Fig. 5a) suggests that agreement is primarily constrained by observation frequency rather than fundamental methodological issues.
5.4 Recommendations for dataset users
Though we discuss the physical underpinnings and compound effects of forest cover fraction, SWE, and temporal resolution in Sect. 5.2, here we provide more direct recommendations for users of our dataset.
For optimal usage of our annual runoff onset products, users should limit analysis to areas with forest cover fraction below 0.5, SWE above ∼20 cm, and temporal resolution less than 14 d. Under these combined conditions, users can expect near-zero systematic bias and spread approaching the temporal resolution of the underlying observations. When only one factor is sub-optimal, the products typically remain useful, though users should avoid using the products in areas where multiple challenging conditions coincide. These thresholds are best interpreted as approximate guidelines, as the underlying relationships are complex, and conditions just outside the recommended ranges may still yield useful estimates. To estimate expected retrieval quality for a given study area, users with independent SWE measurements (or gridded SWE estimates from reanalysis or operational snow products) can use local forest cover fraction together with the annual temporal resolution product to identify the expected bias and spread from the relationships shown in Fig. 4. These relationships provide practical quality guidance, particularly in snow regimes well-represented by the evaluation network, but because they summarize residual distributions aggregated across many pixels, stations, and water years, they should not be interpreted as formal per-pixel uncertainty estimates.
Additionally, in extreme high-elevation regions above 5000 m (∼5 % of the global seasonal snow area covered by our dataset), particularly in the tropical Andes and parts of High Mountain Asia, sublimation can often surpass snowmelt as the primary snow ablation mechanism (Ayala et al., 2023; Gascoin et al., 2013; Réveillet et al., 2020). The physical interpretation of backscatter minima in sublimation-dominated environments remains poorly understood, so we caution against the use of our snowmelt runoff onset dataset in such locations if site-specific validation is not possible.
Finally, our snow phenology dataset inherits known MODIS snow product limitations, including false positive snow presence identification in a small number of geographic settings – near turbid water bodies (e.g., on the Tibetan Plateau), over salt flats (e.g., in the Atacama Desert), and in regions with near-permanent cloud cover where cloud-snow misclassification is common (primarily the eastern slopes of the tropical Andes) (Hall and Riggs, 2021; Saavedra et al., 2017). These inherited false positive snow presence values can cause our algorithm to search for runoff onset where no snowpack existed, resulting in spurious estimates in the annual runoff onset products. Users with study areas in these specific settings – adjacent to turbid water bodies, over salt flats, or on the eastern slopes of the tropical Andes – are therefore encouraged to consult ancillary land cover data or independent snow cover data to verify snow presence in suspect pixels.
5.5 Applications and future work
This global snowmelt runoff onset dataset enables diverse applications across multiple disciplines. The annual runoff onset timing products can provide critical retrospective information on the location and timing of snowmelt for hydrological applications. This information can enable the study of the relationship between the spatial distribution of snowpack properties (e.g., snow depth and SWE) and downstream runoff timing and runoff volume. These insights could ultimately inform streamflow forecasting, especially in snow-dominated watersheds and watersheds lacking in situ observations.
We demonstrate the scientific potential of this dataset in a complementary study that examines systematic relationships between geographic, topographic, and climatic factors governing snowmelt timing across diverse mountain environments, providing insights into the fundamental drivers of global snowmelt variability (Gagliano, 2025). We also consider the global population exposure to snowmelt timing variability through basin-scale evaluation of observed runoff onset timing anomalies across snow-dependent watersheds, revealing potential population vulnerability to interannual variability in runoff onset timing (Gagliano, 2025).
Our dataset also offers broader insights into the spatial and temporal variability in snowmelt timing, which represents a sensitive indicator of climate change impacts in mountain environments. As the satellite record continues, researchers can analyze longer-term trends in snowmelt timing, as well as the relationships between snowmelt patterns and improved climate forcing data, potentially revealing teleconnections between large-scale atmospheric patterns and regional snowmelt dynamics. The capability of this dataset to detect anomalously early or late melt timing makes it particularly valuable for examining snowmelt responses to climate anomalies.
More specialized scientific applications include investigating the coupled snow-fire system, where early snowmelt promotes more severe wildfire (Balik et al., 2026), and wildfire in turn modifies subsequent snowmelt timing (MacDonald et al., 2022; Rickenbaugh et al., 2026). Other scientific applications include examining the influence of light-absorbing particles and radiative forcing on spatial patterns of snowmelt timing (Skiles et al., 2018), quantifying the effect of forest properties on snowmelt timing (Lundquist et al., 2013), investigating the effects of forest management on snowmelt timing (Christopher-Moody, 2025), and examining the phenological responses to snowmelt across complex mountain terrain (John et al., 2020; Matias et al., 2024). Beyond these scientific applications, our dataset could enhance snowpack and hydrological model performance in data assimilation systems (Mirza et al., 2025), and can also help define the optimal spatial and temporal windows for reliable snow property retrievals from complementary remote sensing approaches – including Sentinel-1 volume scattering methods for snow depth estimation (Hoppinen et al., 2024; Lievens et al., 2022), and L-band InSAR ΔSWE estimation relevant to the recently launched NISAR mission (Alabi et al., 2025; Bonnell et al., 2021; Kaur et al., 2026; Palomaki and Sproles, 2023; Tarricone et al., 2023).
Recent and future improvements in the temporal and spatial coverage of satellite SAR measurements could enhance the quality and coverage of future datasets created using our methodology. With the launch of Sentinel-1C (December 2024) and Sentinel-1D (November 2025), and the conclusion of Sentinel-1A's operational mission in June 2026, the Sentinel-1 constellation now operates in a two-satellite configuration, ensuring long-term data continuity. For global snowmelt runoff onset applications, a sustained two-satellite configuration offers a favorable balance of broad spatial coverage, fine temporal resolution, and strong runoff onset estimate agreement with snow pillows, as demonstrated by the 2017–2021 period in this dataset. The NISAR L-band SAR mission offers potential to extend snowmelt detection beneath dense forest canopies due to greater penetration through vegetation than the C-band Sentinel-1 data. Though limited by proprietary data policies and spatial coverage, rapidly expanding commercial SAR constellations offer sub-daily revisit capabilities and very high spatial resolution, which could enable even more precise estimation of snowmelt timing. These advances in satellite SAR, combined with continued algorithm refinements and expanded evaluation efforts across different geographic regions and climate zones, will enhance future dataset versions and broaden their applicability across an even wider range of scientific and applied contexts.
The global snowmelt runoff onset dataset is available at https://doi.org/10.5281/zenodo.16953614 (Version 1.1.0, Gagliano et al., 2026), and the software used to generate it is available at https://github.com/egagli/global_snowmelt_runoff_onset (last access: 12 August 2026) and https://doi.org/10.5281/zenodo.21910383 (Gagliano, 2026c). The MODIS-derived snow phenology dataset is available at https://doi.org/10.5281/zenodo.21783366 (Gagliano, 2026a), and the software used to generate it is available at https://github.com/egagli/MODIS_snow_phenology (last access: 12 August 2026) (Gagliano, 2026b).
This global snowmelt runoff onset dataset provides the first comprehensive high-resolution characterization of snowmelt timing across Earth's seasonal snow-covered regions. By combining multiple orbital geometries of Sentinel-1 C-band SAR with a custom MODIS-derived snow phenology dataset, we developed a robust methodology for detecting the characteristic backscatter minimum associated with snowmelt runoff onset, producing a global 80 m snowmelt runoff onset record spanning water years 2015–2024.
A comprehensive evaluation of our dataset using 1116 automated weather stations across the Western U.S., British Columbia, Norway, and Nepal over a 10-year period confirmed the reliability of our methodology, with a median difference of −2.0 d and a median absolute deviation of 10.0 d compared to in situ snow pillow measurements. We performed a systematic analysis to understand the effects of forest cover fraction, SWE, and temporal resolution on runoff onset estimate agreement with snow pillow estimates. Forest cover fraction emerged as the dominant control, with strong agreement below forest cover fraction of 0.5. We identified a critical threshold of ∼20 cm of SWE, below which snowmelt runoff onset could not be reliably detected. Finally, we observed improved agreement with finer temporal resolution.
This open dataset and associated open-source tools can support a wide range of applications in hydrology, climate science, ecology, and water resource management. The methodological framework and empirically-derived usage recommendations provide guidance for appropriate dataset application and may inform future SAR satellite mission requirements for snow observations. Together, this dataset and methodology add to the growing body of observations needed to better understand and monitor global snowmelt in the coming decades.
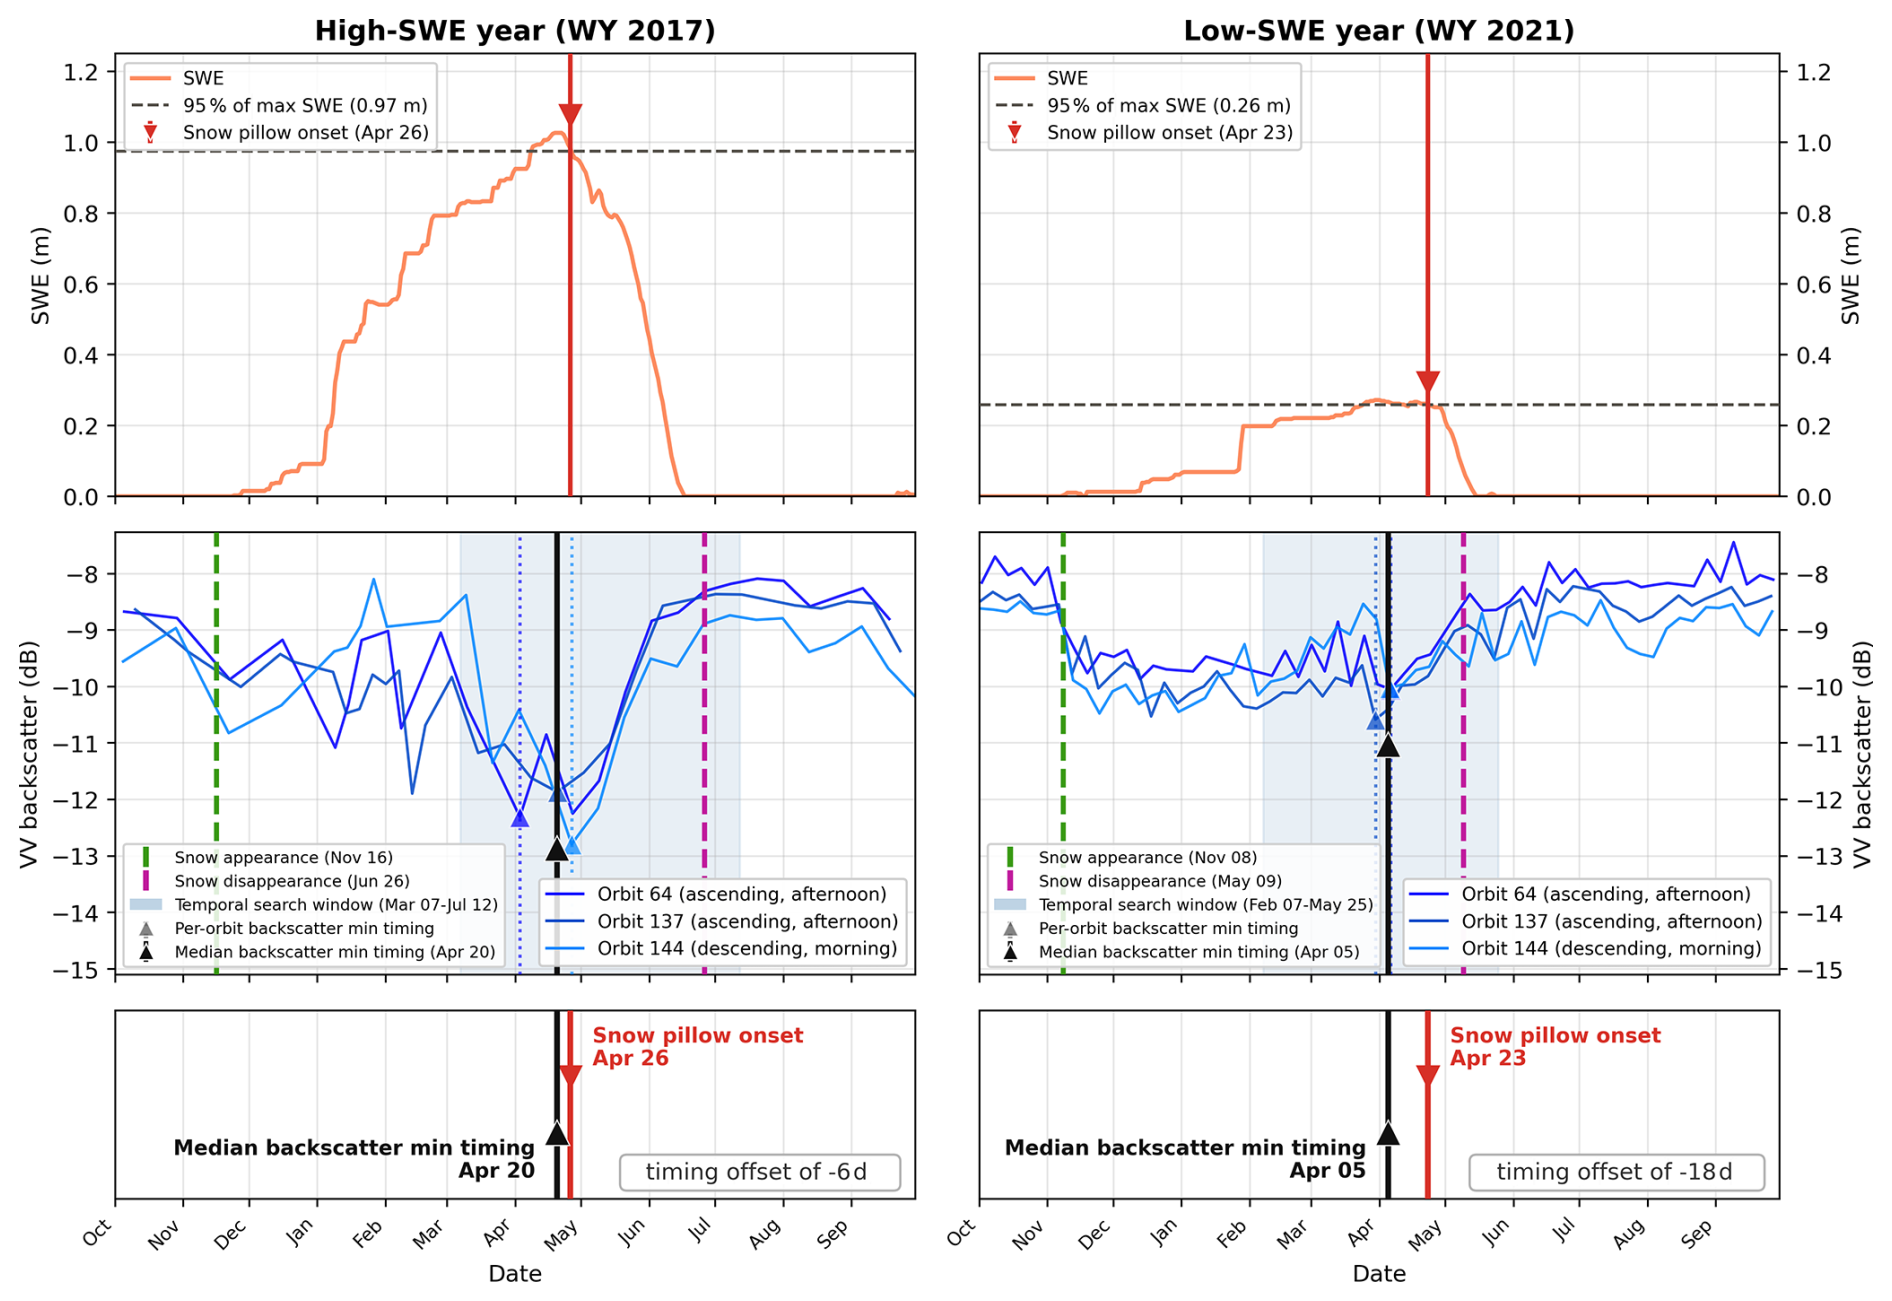
Figure A1Snow pillow runoff onset and Sentinel-1 SAR backscatter minimum timing at Virginia Lakes Ridge SNOTEL station in California (846_CA_SNTL) for a high-SWE water year (WY 2017, left column) and a low-SWE water year (WY 2021, right column). Top panels show daily in situ snow pillow SWE measurements, horizontal dashed line marks 95 % of maximum measured SWE for the water year, and red vertical line with triangle indicates the snow pillow runoff onset date – the day when SWE decreased below the 95 % threshold (Sect. 2.3). Middle panels show Sentinel-1 backscatter time series for each relative orbit (blue solid lines). Green and purple dashed vertical lines indicate snow appearance and disappearance dates, respectively, from the MODIS-derived snow phenology dataset. The shaded blue region denotes the temporal search window for the backscatter minima determination (Sect. 2.2.2), dotted vertical lines with colored triangles show the per-orbit timing of backscatter minima, and the bold black vertical line with triangle shows the median timing of the per-orbit backscatter minima – the SAR-derived runoff onset date used for the water year. Bottom panels summarize the signed timing difference between the two runoff onset estimates (SAR minus snow pillow). In the high-SWE year, a well-defined SWE maximum and a pronounced, unambiguous backscatter minimum yield close agreement between methods (−6 d). However, in the low-SWE year, a shallower snowpack leads to a less distinct melt onset signal in both records: SWE near the 95 % threshold persists over a broad period, and the backscatter minimum is less pronounced, together introducing ambiguity into both runoff onset estimates and resulting in a larger offset between the two methods (−18 d).
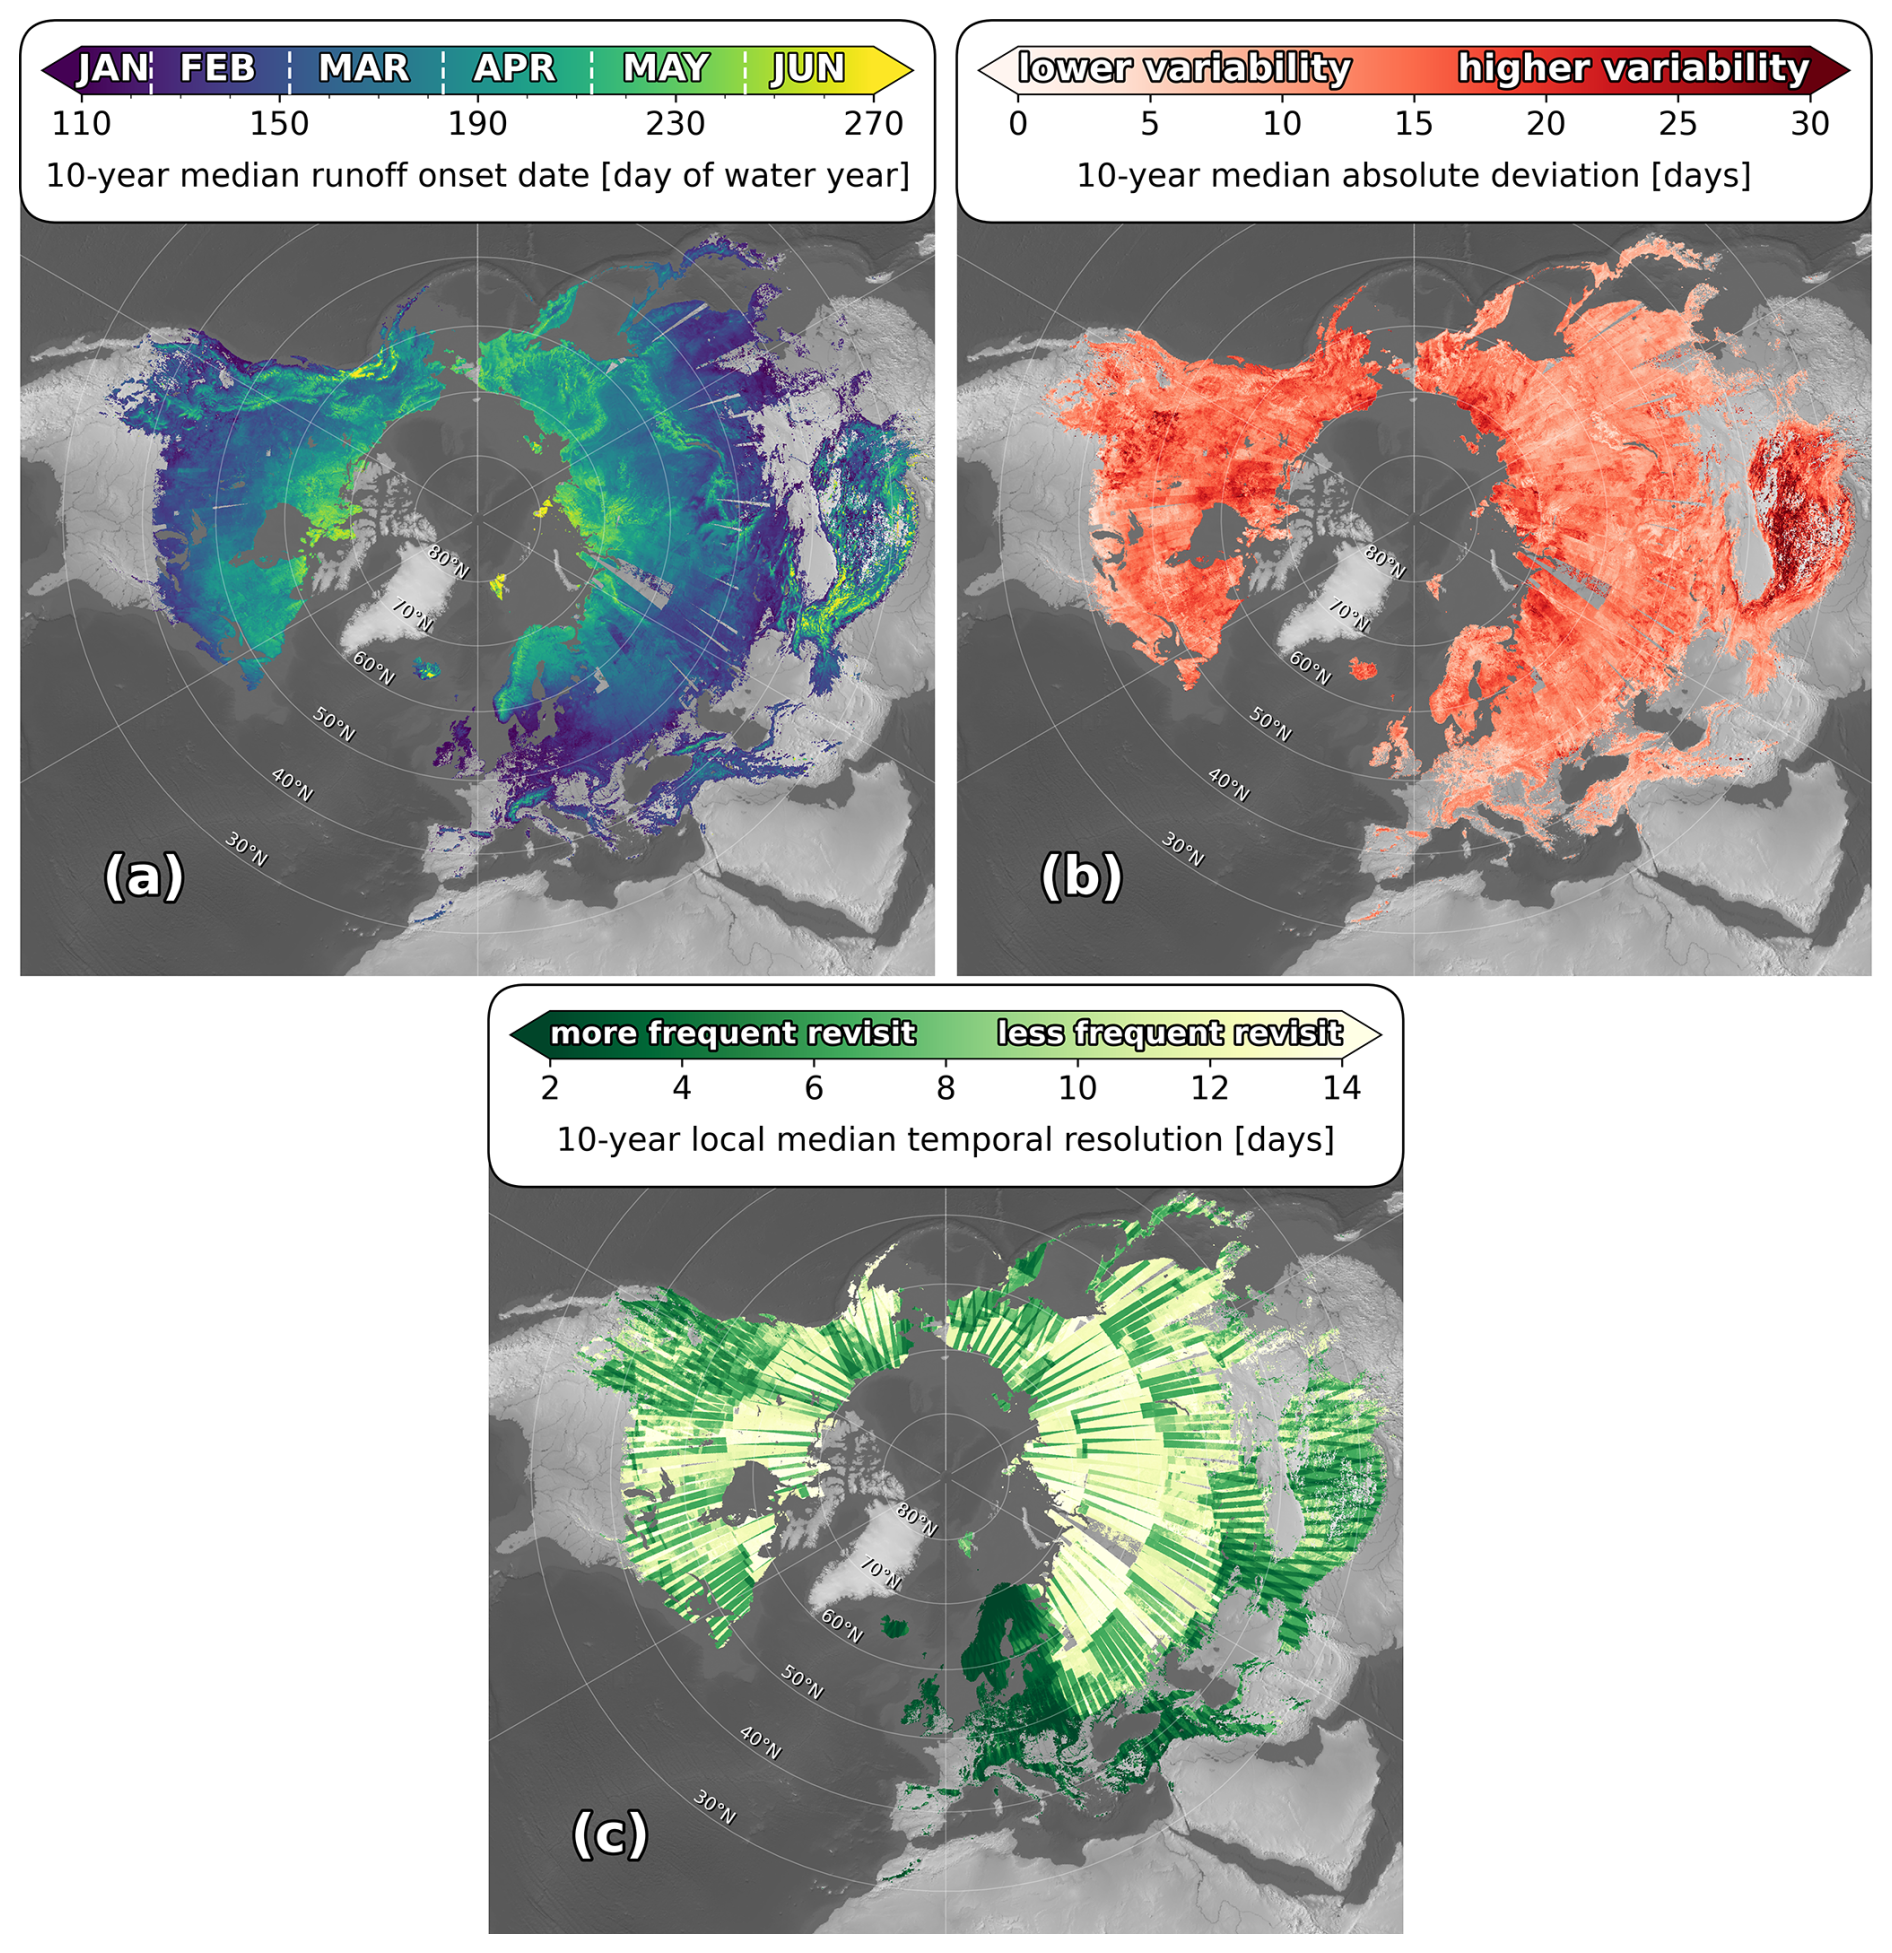
Figure A2Global snowmelt runoff onset composite products with polar stereographic projection for the Northern Hemisphere. (a) 10-year median snowmelt runoff onset, (b) 10-year median absolute deviation, and (c) 10-year local median temporal resolution composite product.
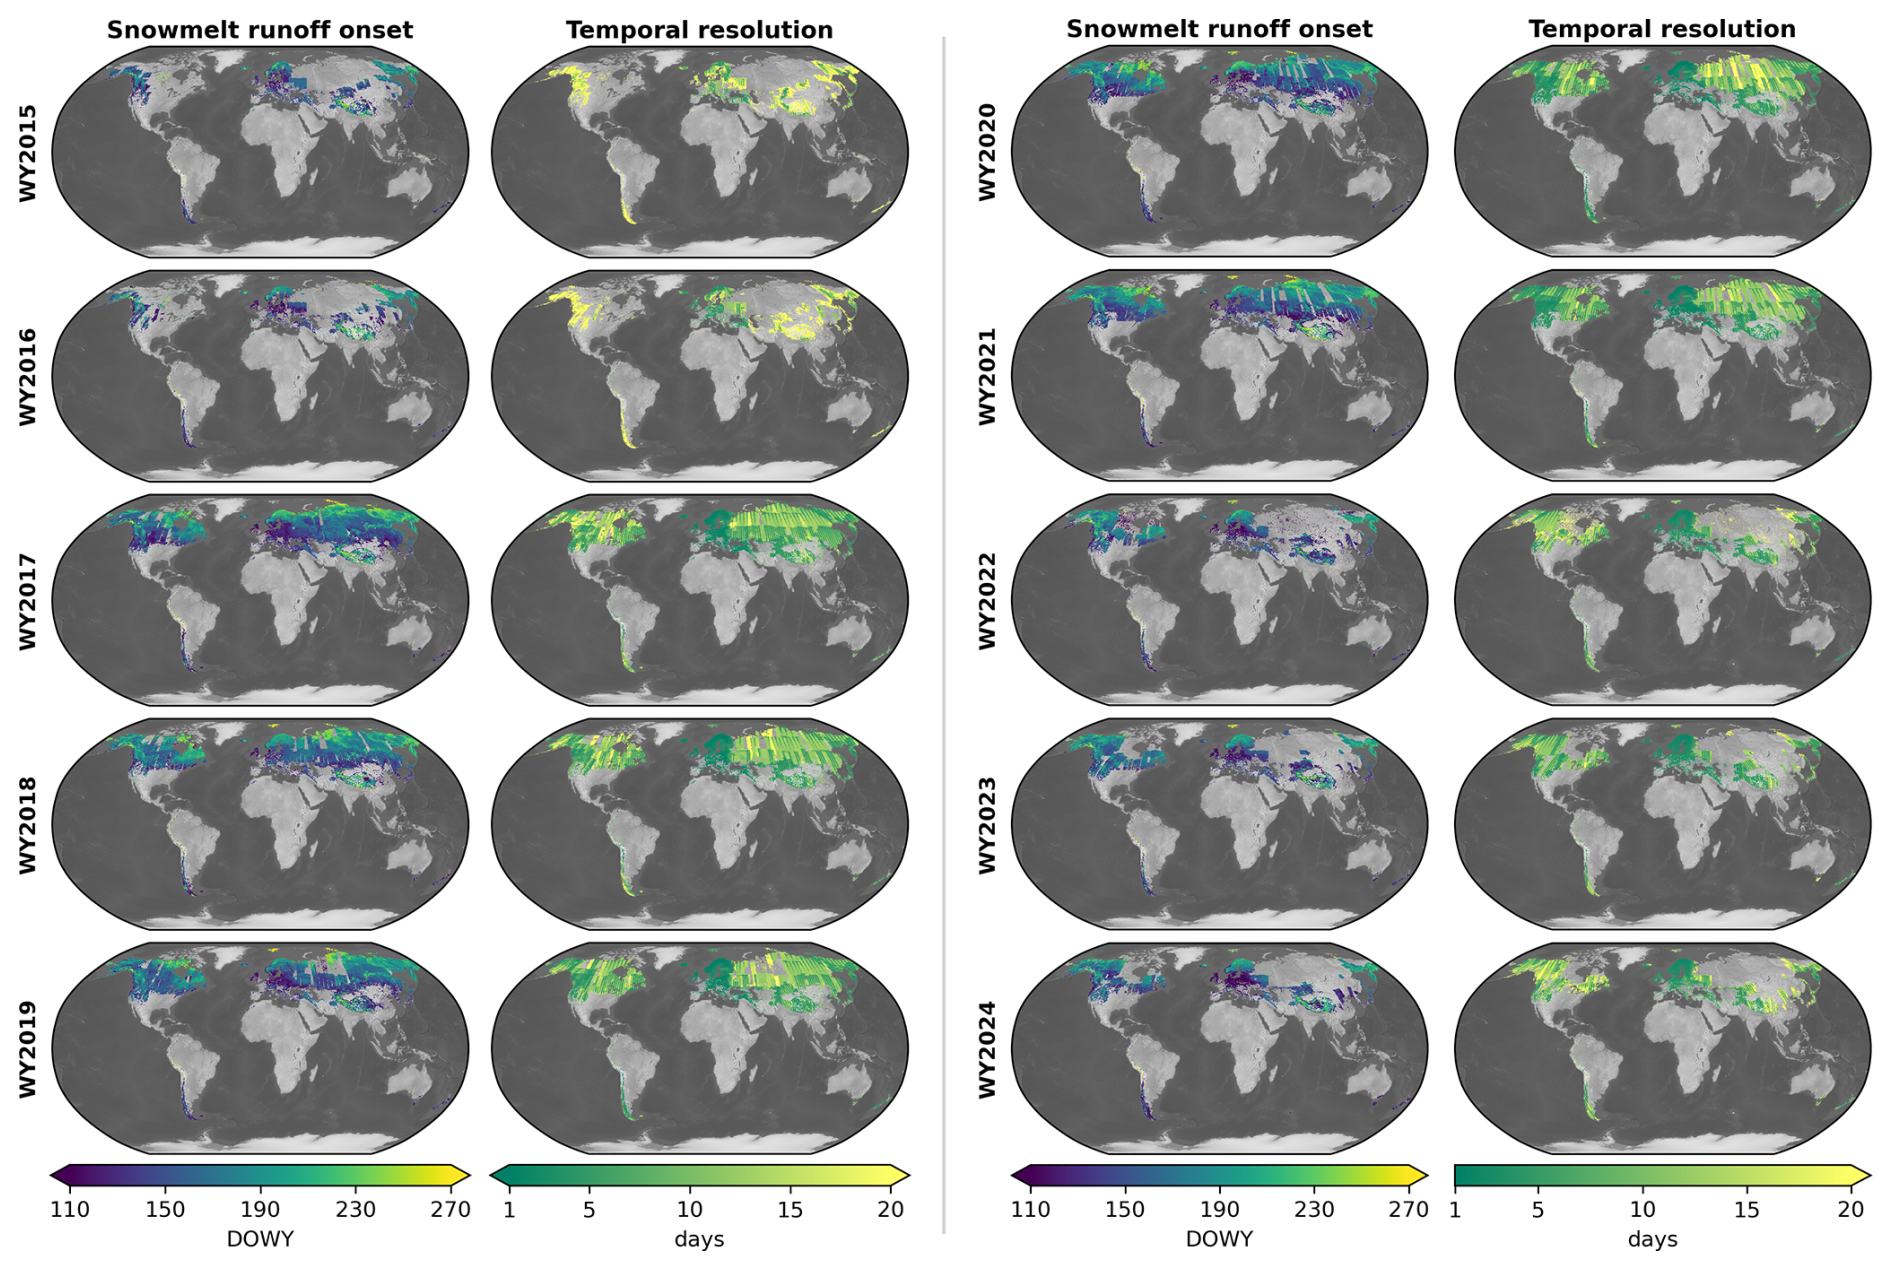
Figure A3Snowmelt runoff onset (day of water year) and temporal resolution (days) for each water year.
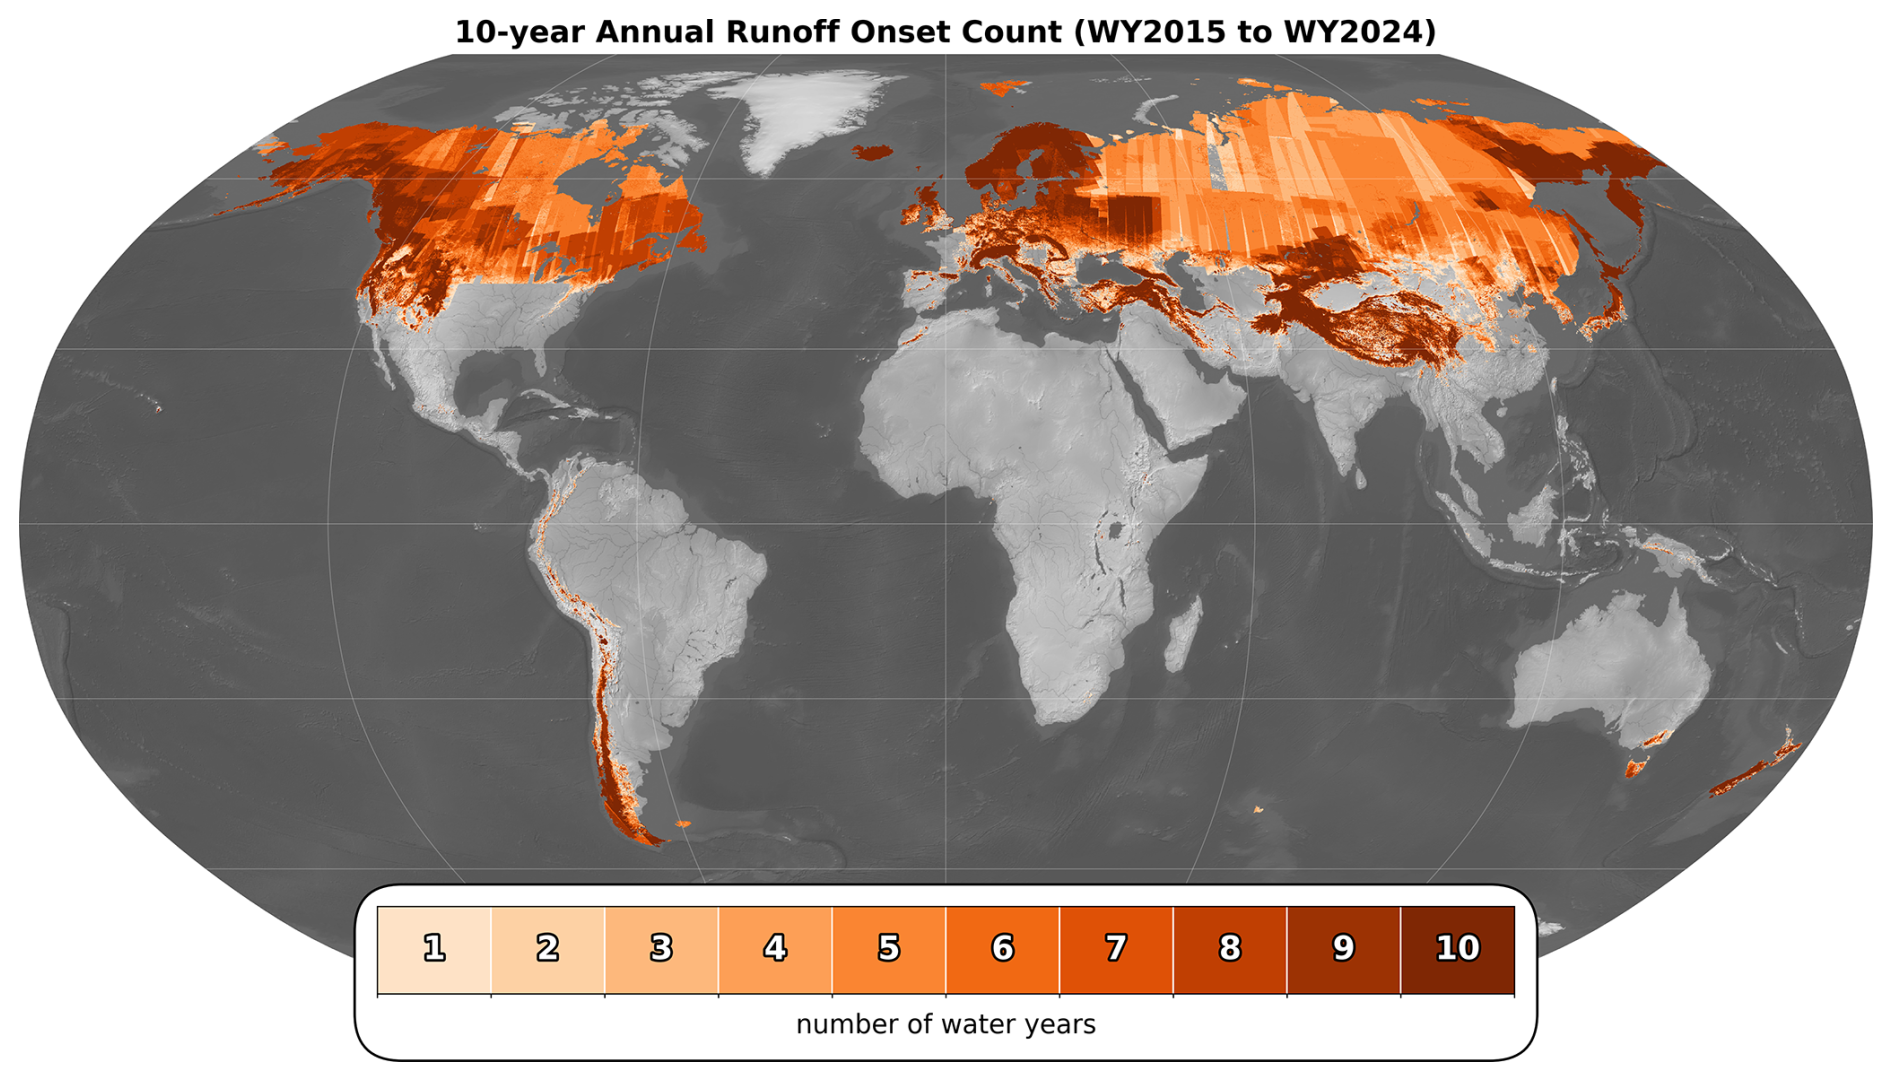
Figure A4Per-pixel count of water years with valid annual snowmelt runoff onset estimates. The variable density of temporal coverage is largely determined by the number of operational satellites in the Sentinel-1 constellation and data acquisition plans.
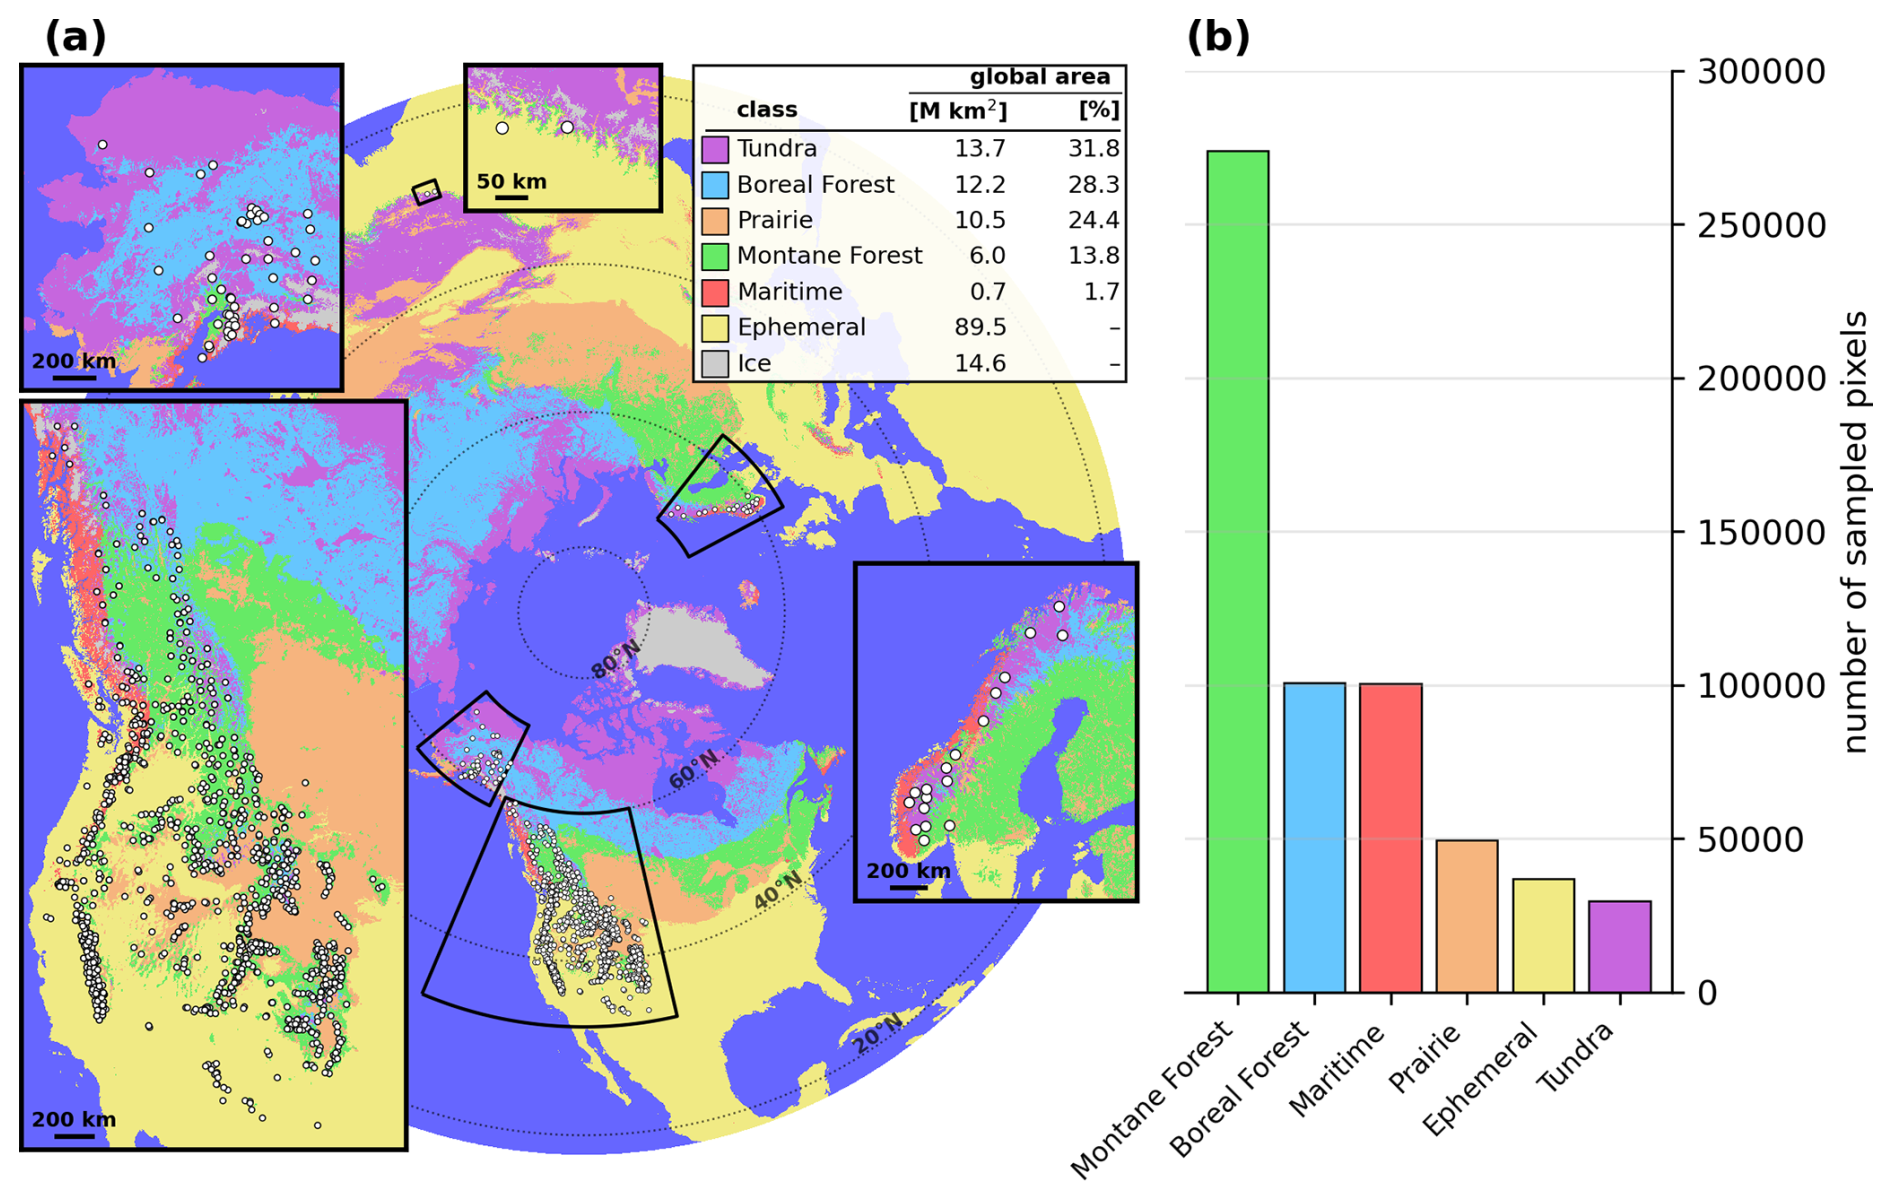
Figure A5Evaluation network representativeness. (a) Locations of the evaluation stations overlaid on the global seasonal snow classification of Sturm and Liston (2021). (b) Number of 80 m sampled pixels within 1000 m radius of evaluation stations used in our pixel-wise analysis (Sect. 4.1, Fig. 4) by seasonal snow class.
EG – conceptualization, methodology, data curation, formal analysis, software, manuscript drafting, manuscript review and editing.
DS – supervision, project administration, funding acquisition, conceptualization, methodology, resources, manuscript review and editing.
SH – project administration, methodology, software, resources, manuscript review and editing.
The contact author has declared that none of the authors has any competing interests.
Publisher's note: Copernicus Publications remains neutral with regard to jurisdictional claims made in the text, published maps, institutional affiliations, or any other geographical representation in this paper. The authors bear the ultimate responsibility for providing appropriate place names. Views expressed in the text are those of the authors and do not necessarily reflect the views of the publisher.
We would like to thank Lila Rickenbaugh, Mira Khadka, Bareera Mirza, Ally Detre, Preetika Kaur, Marin MacDonald, Kyla Christopher-Moody, and Ross Mower for their feedback on this dataset. We would also like to thank Jessica Lundquist, H. P. Marshall, and Mia Bennett for their insightful comments and subsequent discussions which improved this manuscript. Finally, we thank the two anonymous reviewers for their thoughtful and constructive reviews, and Sara Darychuk for the helpful community comment.
This research was supported by the U.S. Bureau of Reclamation (grant no. R21AC10446), NASA (grant no. 80NSSC24K1669), and the National Science Foundation Graduate Research Fellowship Program (grant no. DGE-1762114).
This paper was edited by Alexander Fraser and reviewed by two anonymous referees.
Abernathey, R.: A Serverless Approach to Building Planetary-Scale EO Datacubes in Zarr, Earthmover, https://earthmover.io/blog/serverless-datacube-pipeline (last access: 12 August 2026), 2024.
Aguayo, R., León-Muñoz, J., Garreaud, R., and Montecinos, A.: Hydrological droughts in the southern Andes (40–45° S) from an ensemble experiment using CMIP5 and CMIP6 models, Sci. Rep.-UK, 11, 5530, https://doi.org/10.1038/s41598-021-84807-4, 2021.
Alabi, I. O., Marshall, H.-P., Mead, J., and Trujillo, E.: Advancing terrestrial snow depth monitoring with machine learning and L-band InSAR data: a case study using NASA's SnowEx 2017 data, Front. Remote Sens., 5, 1481848, https://doi.org/10.3389/frsen.2024.1481848, 2025.
Ali, I., Cao, S., Naeimi, V., Paulik, C., and Wagner, W.: Methods to Remove the Border Noise From Sentinel-1 Synthetic Aperture Radar Data: Implications and Importance For Time-Series Analysis, IEEE J. Sel. Top. Appl., 11, 777–786, https://doi.org/10.1109/JSTARS.2017.2787650, 2018.
Awasthi, S. and Varade, D.: Recent advances in the remote sensing of alpine snow: a review, GISci. Remote Sens., 58, 852–888, https://doi.org/10.1080/15481603.2021.1946938, 2021.
Ayala, Á., Schauwecker, S., and MacDonell, S.: Spatial distribution and controls of snowmelt runoff in a sublimation-dominated environment in the semiarid Andes of Chile, Hydrol. Earth Syst. Sci., 27, 3463–3484, https://doi.org/10.5194/hess-27-3463-2023, 2023.
Balik, J., Coop, J., and Parks, S. A.: Snowpack decline kindles more severe fire in the western United States, Environ. Res. Lett., https://doi.org/10.1088/1748-9326/ae4e4a, 2026.
Barnett, T. P., Adam, J. C., and Lettenmaier, D. P.: Potential impacts of a warming climate on water availability in snow-dominated regions, Nature, 438, 303–309, https://doi.org/10.1038/nature04141, 2005.
BC Ministry of Environment: Snow survey data – Province of British Columbia, https://www2.gov.bc.ca/gov/content/environment/air-land-water/water/water-science-data/water-data-tools/snow-survey-data (last access: 12 August 2026), 2024.
Bonnell, R., McGrath, D., Williams, K., Webb, R., Fassnacht, S. R., and Marshall, H.-P.: Spatiotemporal Variations in Liquid Water Content in a Seasonal Snowpack: Implications for Radar Remote Sensing, Remote Sens.-Basel, 13, 4223, https://doi.org/10.3390/rs13214223, 2021.
Bonnell, R., Elder, K., McGrath, D., Marshall, H. P., Starr, B., Adebisi, N., Palomaki, R. T., and Hoppinen, Z.: L-Band InSAR Snow Water Equivalent Retrieval Uncertainty Increases With Forest Cover Fraction, Geophys. Res. Lett., 51, e2024GL111708, https://doi.org/10.1029/2024GL111708, 2024.
Bonner, H. M., Raleigh, M. S., and Small, E. E.: Isolating forest process effects on modelled snowpack density and snow water equivalent, Hydrol. Process., 36, e14475, https://doi.org/10.1002/hyp.14475, 2022.
Boudreau, E. T.: Mapping snow cover at fine resolution in complex and forested terrain, MS thesis, University of Washington, https://hdl.handle.net/1773/53953 (last access: 12 August 2026), 2025.
Brangers, I., Marshall, H.-P., De Lannoy, G., Dunmire, D., Mätzler, C., and Lievens, H.: Tower-based C-band radar measurements of an alpine snowpack, The Cryosphere, 18, 3177–3193, https://doi.org/10.5194/tc-18-3177-2024, 2024.
Brooks, P. D., Solomon, D. K., Kampf, S., Warix, S., Bern, C., Barnard, D., Barnard, H. R., Carling, G. T., Carroll, R. W. H., Chorover, J., Harpold, A., Lohse, K., Meza, F., McIntosh, J., Neilson, B., Sears, M., and Wolf, M.: Groundwater dominates snowmelt runoff and controls streamflow efficiency in the western United States, Commun. Earth Environ., 6, 1–8, https://doi.org/10.1038/s43247-025-02303-3, 2025.
Brooks, S. T., Jabour, J., van den Hoff, J., and Bergstrom, D. M.: Our footprint on Antarctica competes with nature for rare ice-free land, Nat. Sustain., 2, 185–190, https://doi.org/10.1038/s41893-019-0237-y, 2019.
Buchhorn, M., Smets, B., Bertels, L., Roo, B. D., Lesiv, M., Tsendbazar, N.-E., Herold, M., and Fritz, S.: Copernicus Global Land Service: Land Cover 100 m: collection 3: epoch 2019: Globe, Zenodo [data set], https://doi.org/10.5281/zenodo.3939050, 2020.
California Department of Water Resources: California Cooperative Snow Surveys (CCSS), https://cdec.water.ca.gov/snow/ (last access: 12 August 2026), 2025.
Carletti, F., Marin, C., Ghielmini, C., Bavay, M., and Lehning, M.: Multitemporal analysis of Sentinel-1 backscatter during snowmelt using high-resolution field measurements and radiative transfer modelling, The Cryosphere, 19, 5579–5612, https://doi.org/10.5194/tc-19-5579-2025, 2025.
Christopher-Moody, K. E.: Effects of Forest Management on Snow Accumulation and Ablation in a Montane Watershed, MS thesis, Montana State University, Bozeman, College of Letters & Science, https://scholarworks.montana.edu/handle/1/19430 (last access: 12 August 2026), 2025.
Cortés, G. and Margulis, S.: Impacts of El Niño and La Niña on interannual snow accumulation in the Andes: Results from a high-resolution 31 year reanalysis, Geophys. Res. Lett., 44, 6859–6867, https://doi.org/10.1002/2017GL073826, 2017.
Cowherd, M., Mital, U., Rahimi, S., Girotto, M., Schwartz, A., and Feldman, D.: Climate change-resilient snowpack estimation in the Western United States, Commun. Earth Environ., 5, 1–10, https://doi.org/10.1038/s43247-024-01496-3, 2024.
Crumley, R. L., Palomaki, R. T., Nolin, A. W., Sproles, E. A., and Mar, E. J.: SnowCloudMetrics: Snow Information for Everyone, Remote Sens.-Basel, 12, 3341, https://doi.org/10.3390/rs12203341, 2020.
Darychuk, S. E., Shea, J. M., Menounos, B., Chesnokova, A., Jost, G., and Weber, F.: Snowmelt characterization from optical and synthetic-aperture radar observations in the La Joie Basin, British Columbia, The Cryosphere, 17, 1457–1473, https://doi.org/10.5194/tc-17-1457-2023, 2023.
Darychuk, S. E., Shea, J. M., and Derksen, C.: Comparison of snowmelt timing estimates from Sentinel-1 SAR and surface observations in British Columbia, Canada, Remote Sens. Environ., 328, 114863, https://doi.org/10.1016/j.rse.2025.114863, 2025.
Dask Development Team: Dask: Library for dynamic task scheduling, http://dask.pydata.org (last access: 12 August 2026), 2016.
Dawson, N., Broxton, P., Zeng, X., Leuthold, M., Barlage, M., and Holbrook, P.: An Evaluation of Snow Initializations in NCEP Global and Regional Forecasting Models, J. Hydrometeorol., 17, 1885–1901, https://doi.org/10.1175/JHM-D-15-0227.1, 2016.
Detre, A., McGrath, D., Gagliano, E., Bonnell, R., Webb, R., Marshall, H.-P., and Shean, D.: Sentinel-1 SAR Estimates of Snowmelt Onset Coincide With SNOTEL Soil Moisture Pulses Across the Western United States, Hydrol. Process., 39, e70341, https://doi.org/10.1002/hyp.70341, 2025.
Dingman, S. L.: Physical Hydrology, 3rd Edn., Waveland Press, 657 pp., ISBN 13:978-1-4786-1118-9, 2015.
Dudley, R. W., Hodgkins, G. A., McHale, M. R., Kolian, M. J., and Renard, B.: Trends in snowmelt-related streamflow timing in the conterminous United States, J. Hydrol., 547, 208–221, https://doi.org/10.1016/j.jhydrol.2017.01.051, 2017.
Fassnacht, S. R., Deitemeyer, D. C., and Venable, N. B. H.: Capitalizing on the daily time step of snow telemetry data to model the snowmelt components of the hydrograph for small watersheds, Hydrol. Process., 28, 4654–4668, https://doi.org/10.1002/hyp.10260, 2014.
Fleming, S. W., Zukiewicz, L., Strobel, M. L., Hofman, H., and Goodbody, A. G.: SNOTEL, the Soil Climate Analysis Network, and water supply forecasting at the Natural Resources Conservation Service: Past, present, and future, J. Am. Water Resour. As., https://doi.org/10.1111/1752-1688.13104, 2023.
Frisbee, M. D., Phillips, F. M., Campbell, A. R., Liu, F., and Sanchez, S. A.: Streamflow generation in a large, alpine watershed in the southern Rocky Mountains of Colorado: Is streamflow generation simply the aggregation of hillslope runoff responses?, Water Resour. Res., 47, https://doi.org/10.1029/2010WR009391, 2011.
Gagliano, E.: From Peak to Planet: Advancing Multi-Scale Detection of Snowmelt Timing with Satellite Radar, PhD thesis, University of Washington, United States, Washington, 187 pp., https://hdl.handle.net/1773/55173 (last access: 12 August 2026), 2025.
Gagliano, E.: Global MODIS snow phenology: snow appearance date, snow disappearance date, and maximum consecutive snow days, water years 2015–2025, Zenodo [data set], https://doi.org/10.5281/zenodo.21783366, 2026a.
Gagliano, E.: Global MODIS snow phenology, water years 2015–2025, Zenodo [code], https://doi.org/10.5281/zenodo.21783174, 2026b.
Gagliano, E.: Global snowmelt runoff onset from Sentinel-1 SAR (v1.0), Zenodo [code], https://doi.org/10.5281/zenodo.21910383, 2026c.
Gagliano, E., Shean, D., Henderson, S., and Vanderwilt, S.: Capturing the Onset of Mountain Snowmelt Runoff Using Satellite Synthetic Aperture Radar, Geophys. Res. Lett., 50, e2023GL105303, https://doi.org/10.1029/2023GL105303, 2023.
Gagliano, E., Shean, D., and Henderson, S.: A global high-resolution dataset of snowmelt runoff onset timing from Sentinel-1 SAR, 2015–2024 (1.1.0), Zenodo [data set], https://doi.org/10.5281/zenodo.16953614, 2026.
Gao, B. and Ma, W.: Capturing Snowmelt Runoff Onset Date under Different Land Cover Types Using Synthetic Aperture Radar: Case Study of Sierra Nevada Mountains, USA, Appl. Sci., 14, 6844, https://doi.org/10.3390/app14156844, 2024.
Gascoin, S., Lhermitte, S., Kinnard, C., Bortels, K., and Liston, G. E.: Wind effects on snow cover in Pascua-Lama, Dry Andes of Chile, Adv. Water Resour., 55, 25–39, https://doi.org/10.1016/j.advwatres.2012.11.013, 2013.
Hall, D. and Riggs, G.: MODIS/Terra Snow Cover 8-Day L3 Global 500 m SIN Grid, Version 61, NASA National Snow and Ice Data Center Distributed Active Archive Center [data set], https://doi.org/10.5067/MODIS/MOD10A2.061, 2021.
Hoppinen, Z., Palomaki, R. T., Brencher, G., Dunmire, D., Gagliano, E., Marziliano, A., Tarricone, J., and Marshall, H.-P.: Evaluating snow depth retrievals from Sentinel-1 volume scattering over NASA SnowEx sites, The Cryosphere, 18, 5407–5430, https://doi.org/10.5194/tc-18-5407-2024, 2024.
Ismail, M. F., Bogacki, W., Disse, M., Schäfer, M., and Kirschbauer, L.: Estimating degree-day factors of snow based on energy flux components, The Cryosphere, 17, 211–231, https://doi.org/10.5194/tc-17-211-2023, 2023.
John, A., Ong, J., Theobald, E. J., Olden, J. D., Tan, A., and HilleRisLambers, J.: Detecting Montane Flowering Phenology with CubeSat Imagery, Remote Sens.-Basel, 12, 2894, https://doi.org/10.3390/rs12182894, 2020.
Johnson, J. B. and Schaefer, G. L.: The influence of thermal, hydrologic, and snow deformation mechanisms on snow water equivalent pressure sensor accuracy, Hydrol. Process., 16, 3529–3542, https://doi.org/10.1002/hyp.1236, 2002.
Kaur, P., Webb, R., Tarricone, J., Rittger, K., McGrath, D., Gagliano, E., Palomaki, R., Bonnell, R., Forster, R., and Marshall, H.-P.: Feasibility Mapping of L-Band InSAR for SWE Retrievals Across the Western United States, Geophys. Res. Lett., 53, e2025GL120162, https://doi.org/10.1029/2025GL120162, 2026.
Kurum, M.: C-Band SAR Backscatter Evaluation of 2008 Gallipoli Forest Fire, IEEE Geosci. Remote S., 12, 1091–1095, https://doi.org/10.1109/LGRS.2014.2382716, 2015.
Lemmetyinen, J., Ruiz, J. J., Cohen, J., Haapamaa, J., Kontu, A., Pulliainen, J., and Praks, J.: Attenuation of Radar Signal by a Boreal Forest Canopy in Winter, IEEE Geosci. Remote S., 19, 1–5, https://doi.org/10.1109/LGRS.2022.3187295, 2022.
Lievens, H., Brangers, I., Marshall, H.-P., Jonas, T., Olefs, M., and De Lannoy, G.: Sentinel-1 snow depth retrieval at sub-kilometer resolution over the European Alps, The Cryosphere, 16, 159–177, https://doi.org/10.5194/tc-16-159-2022, 2022.
Liston, G. and Sturm, M.: Global Seasonal-Snow Classification, Version 1, NASA [data set], https://doi.org/10.5067/99FTCYYYLAQ0, 2021.
Lowry, C. S., Deems, J. S., Loheide II, S. P., and Lundquist, J. D.: Linking snowmelt-derived fluxes and groundwater flow in a high elevation meadow system, Sierra Nevada Mountains, California, Hydrol. Process., 24, 2821–2833, https://doi.org/10.1002/hyp.7714, 2010.
Lund, J., Forster, R. R., Rupper, S. B., Deeb, E. J., Marshall, H. P., Hashmi, M. Z., and Burgess, E.: Mapping Snowmelt Progression in the Upper Indus Basin With Synthetic Aperture Radar, Front. Earth Sci., 7, https://doi.org/10.3389/feart.2019.00318, 2020.
Lund, J., Forster, R. R., Deeb, E. J., Liston, G. E., Skiles, S. M., and Marshall, H.-P.: Interpreting Sentinel-1 SAR Backscatter Signals of Snowpack Surface Melt/Freeze, Warming, and Ripening, through Field Measurements and Physically-Based SnowModel, Remote Sens.-Basel, 14, 4002, https://doi.org/10.3390/rs14164002, 2022.
Lundquist, J. D., Cayan, D. R., and Dettinger, M. D.: Spring Onset in the Sierra Nevada: When Is Snowmelt Independent of Elevation?, J. Hydrometeorol., 5, 327–342, https://doi.org/10.1175/1525-7541(2004)005<0327:SOITSN>2.0.CO;2, 2004.
Lundquist, J. D., Dickerson-Lange, S. E., Lutz, J. A., and Cristea, N. C.: Lower forest density enhances snow retention in regions with warmer winters: A global framework developed from plot-scale observations and modeling, Water Resour. Res., 49, 6356–6370, https://doi.org/10.1002/wrcr.20504, 2013.
MacDonald, M., Fassnacht, S. R., and Tedesche, M. E.: High Elevation Post-Fire Landscapes on Snow Melt Trends in Seasonal and Transitional Snow Zones, AGU Fall Meeting Abstracts, ADS Bibcode: 2022AGUFMGC53B..08M, GC53B-08, 2022.
Manickam, S. and Barros, A.: Parsing Synthetic Aperture Radar Measurements of Snow in Complex Terrain: Scaling Behaviour and Sensitivity to Snow Wetness and Landcover, Remote Sens.-Basel, 12, 483, https://doi.org/10.3390/rs12030483, 2020.
Marin, C., Bertoldi, G., Premier, V., Callegari, M., Brida, C., Hürkamp, K., Tschiersch, J., Zebisch, M., and Notarnicola, C.: Use of Sentinel-1 radar observations to evaluate snowmelt dynamics in alpine regions, The Cryosphere, 14, 935–956, https://doi.org/10.5194/tc-14-935-2020, 2020.
Matias, M. T., Ramage, J. M., Gurarie, E., and Brodzik, M. J.: Snowmelt Onset and Caribou (Rangifer tarandus) Spring Migration, Remote Sens.-Basel, 16, 2391, https://doi.org/10.3390/rs16132391, 2024.
Mätzler, C.: Applications of the interaction of microwaves with the natural snow cover, Remote Sens. Rev., 2, 259–387, https://doi.org/10.1080/02757258709532086, 1987.
Meromy, L., Molotch, N. P., Link, T. E., Fassnacht, S. R., and Rice, R.: Subgrid variability of snow water equivalent at operational snow stations in the western USA, Hydrol. Process., 27, 2383–2400, https://doi.org/10.1002/hyp.9355, 2013.
Microsoft Open Source, McFarland, M., Emanuele, R., Morris, D., and Augspurger, T.: microsoft/PlanetaryComputer: October 2022, Zenodo [code], https://doi.org/10.5281/zenodo.7261897, 2022.
Microsoft Planetary Computer: Sentinel 1 Radiometrically Terrain Corrected (RTC), https://planetarycomputer.microsoft.com/dataset/sentinel-1-rtc (last access: 12 August 2026), 2022.
Mioduszewski, J. R., Rennermalm, A. K., Robinson, D. A., and Wang, L.: Controls on Spatial and Temporal Variability in Northern Hemisphere Terrestrial Snow Melt Timing, 1979–2012, J. Climate, 28, 2136–2153, https://doi.org/10.1175/JCLI-D-14-00558.1, 2015.
Mirza, B. N., Small, E. E., and Raleigh, M. S.: Evaluating the utility of Sentinel-1 in a Data Assimilation System for estimating snow depth in a mountainous basin, The Cryosphere, 19, 6691–6709, https://doi.org/10.5194/tc-19-6691-2025, 2025.
Nagler, T.: Methods and analysis of synthetic aperture radar data from ERS-1 and X-SAR for snow and glacier applications, PhD thesis, Leopold-Franzens-Universität Innsbruck, 1996.
Nagler, T., Rott, H., Ripper, E., Bippus, G., and Hetzenecker, M.: Advancements for Snowmelt Monitoring by Means of Sentinel-1 SAR, Remote Sens.-Basel, 8, 348, https://doi.org/10.3390/rs8040348, 2016.
Palomaki, R. T. and Sproles, E. A.: Assessment of L-band InSAR snow estimation techniques over a shallow, heterogeneous prairie snowpack, Remote Sens. Environ., 296, 113744, https://doi.org/10.1016/j.rse.2023.113744, 2023.
Pan, C. G., Kirchner, P. B., Kimball, J. S., and Du, J.: ABoVE: Passive Microwave-derived Annual Snowpack Main Melt Onset Date Maps, 1988–2023 (1.0), ORNL Distributed Active Archive Center [data set], https://doi.org/10.3334/ORNLDAAC/1841, 2021.
Petersky, R. and Harpold, A.: Now you see it, now you don't: a case study of ephemeral snowpacks and soil moisture response in the Great Basin, USA, Hydrol. Earth Syst. Sci., 22, 4891–4906, https://doi.org/10.5194/hess-22-4891-2018, 2018.
Pflug, J. M., Yang, K., Cristea, N., Boudreau, E. T., Vuyovich, C. M., and Kumar, S. V.: Using Commercial Satellite Imagery to Reconstruct 3 m and Daily Spring Snow Water Equivalent, Water Resour. Res., 60, e2024WR037983, https://doi.org/10.1029/2024WR037983, 2024.
Potin, P., Colin, O., Pinheiro, M., Rosich, B., O'Connell, A., Ormston, T., Gratadour, J.-B., and Torres, R.: Status And Evolution Of The Sentinel-1 Mission, in: IGARSS 2022 – 2022 IEEE International Geoscience and Remote Sensing Symposium, 4707–4710, https://doi.org/10.1109/IGARSS46834.2022.9884753, 2022.
Qin, Y., Hong, C., Zhao, H., Siebert, S., Abatzoglou, J. T., Huning, L. S., Sloat, L. L., Park, S., Li, S., Munroe, D. K., Zhu, T., Davis, S. J., and Mueller, N. D.: Snowmelt risk telecouplings for irrigated agriculture, Nat. Clim. Change, 12, 1007–1015, https://doi.org/10.1038/s41558-022-01509-z, 2022.
Raleigh, M. S., Gutmann, E. D., Van Stan II, J. T., Burns, S. P., Blanken, P. D., and Small, E. E.: Challenges and Capabilities in Estimating Snow Mass Intercepted in Conifer Canopies With Tree Sway Monitoring, Water Resour. Res., 58, e2021WR030972, https://doi.org/10.1029/2021WR030972, 2022.
Réveillet, M., MacDonell, S., Gascoin, S., Kinnard, C., Lhermitte, S., and Schaffer, N.: Impact of forcing on sublimation simulations for a high mountain catchment in the semiarid Andes, The Cryosphere, 14, 147–163, https://doi.org/10.5194/tc-14-147-2020, 2020.
Rickenbaugh, L., Sproles, E., Gagliano, E., Covino, T., Tuholske, C., and Carroll, R. W. H.: When and where does water originate? Leveraging stable water isotopes and Synthetic Aperture Radar to assess the hydrology of a snow-dominated watershed in Southwestern Montana, Remote Sens. Appl. Soc. Environ., 101887, https://doi.org/10.1016/j.rsase.2026.101887, 2026.
Rott, H. and Nagler, T.: Monitoring temporal dynamics of snowmelt with ERS-1 SAR, in: 1995 International Geoscience and Remote Sensing Symposium, IGARSS '95, Quantitative Remote Sensing for Science and Applications, 1747–1749, https://doi.org/10.1109/IGARSS.1995.524014, 1995.
Royer, A., Picard, G., Vargel, C., Langlois, A., Gouttevin, I., and Dumont, M.: Improved Simulation of Arctic Circumpolar Land Area Snow Properties and Soil Temperatures, Front. Earth Sci., 9, https://doi.org/10.3389/feart.2021.685140, 2021.
Saavedra, F. A., Kampf, S. K., Fassnacht, S. R., and Sibold, J. S.: A snow climatology of the Andes Mountains from MODIS snow cover data, Int. J. Climatol., 37, 1526–1539, https://doi.org/10.1002/joc.4795, 2017.
Skiles, S. M., Flanner, M., Cook, J. M., Dumont, M., and Painter, T. H.: Radiative forcing by light-absorbing particles in snow, Nat. Clim. Change, 8, 964–971, https://doi.org/10.1038/s41558-018-0296-5, 2018.
Steele-Dunne, S. C., Friesen, J., and van de Giesen, N.: Using Diurnal Variation in Backscatter to Detect Vegetation Water Stress, IEEE T. Geosci. Remote, 50, 2618–2629, https://doi.org/10.1109/TGRS.2012.2194156, 2012.
Stranden, H. and Saloranta, T.: NVE's snow reference datasets for climate change studies, 6 pp., last updated December 2021, https://www.nve.no/media/13163/nve_snow_reference_datasets_2021.pdf (last access: 12 August 2026), 2021.
Sturm, M. and Liston, G. E.: Revisiting the Global Seasonal Snow Classification: An Updated Dataset for Earth System Applications, J. Hydrometeorol., 22, 2917–2938, https://doi.org/10.1175/JHM-D-21-0070.1, 2021.
Sturm, M., Holmgren, J., and Liston, G. E.: A Seasonal Snow Cover Classification System for Local to Global Applications, J. Climate, 8, 1261–1283, https://doi.org/10.1175/1520-0442(1995)008<1261:ASSCCS>2.0.CO;2, 1995.
Tang, Z., Deng, G., Hu, G., Zhang, H., Pan, H., and Sang, G.: Satellite observed spatiotemporal variability of snow cover and snow phenology over high mountain Asia from 2002 to 2021, J. Hydrol., 613, 128438, https://doi.org/10.1016/j.jhydrol.2022.128438, 2022.
Tarricone, J., Webb, R. W., Marshall, H.-P., Nolin, A. W., and Meyer, F. J.: Estimating snow accumulation and ablation with L-band interferometric synthetic aperture radar (InSAR), The Cryosphere, 17, 1997–2019, https://doi.org/10.5194/tc-17-1997-2023, 2023.
Torralbo, P., Pimentel, R., Polo, M. J., and Notarnicola, C.: Characterizing Snow Dynamics in Semi-Arid Mountain Regions with Multitemporal Sentinel-1 Imagery: A Case Study in the Sierra Nevada, Spain, Remote Sens.-Basel, 15, 5365, https://doi.org/10.3390/rs15225365, 2023.
Tsai, Y.-L. S., Dietz, A., Oppelt, N., and Kuenzer, C.: Remote Sensing of Snow Cover Using Spaceborne SAR: A Review, Remote Sens.-Basel, 11, 1456, https://doi.org/10.3390/rs11121456, 2019.
USDA Natural Resources Conservation Service: SNOwpack TELemetry Network (SNOTEL), https://hdl.handle.net/10113/AF29410634 (last access: 12 August 2026), 1977.
Webb, R. W., Fassnacht, S. R., and Gooseff, M. N.: Defining the Diurnal Pattern of Snowmelt Using a Beta Distribution Function, J. Am. Water Resour. As., 53, 684–696, https://doi.org/10.1111/1752-1688.12522, 2017.
Wrzesien, M. L., Pavelsky, T. M., Durand, M. T., Dozier, J., and Lundquist, J. D.: Characterizing Biases in Mountain Snow Accumulation From Global Data Sets, Water Resour. Res., 55, 9873–9891, https://doi.org/10.1029/2019WR025350, 2019.
Yang, T., Li, Q., Zou, Q., Hamdi, R., Cui, F., and Li, L.: Impact of Snowpack on the Land Surface Phenology in the Tianshan Mountains, Central Asia, Remote Sens.-Basel, 14, 3462, https://doi.org/10.3390/rs14143462, 2022.
Zheng, L., Cheng, X., Chen, Z., Wang, S., Liang, Q., and Wang, K.: Global Snowmelt Onset Reflects Climate Variability: Insights from Spaceborne Radiometer Observations, J. Climate, 35, 2945–2959, https://doi.org/10.1175/JCLI-D-21-0265.1, 2022.