the Creative Commons Attribution 4.0 License.
the Creative Commons Attribution 4.0 License.
 | 03 Aug 2026
GLBD-FED: a global first-hand in-situ daily temperature dataset preferentially with a 00:00–24:00 UTC 24 h window (1981–2024)
Panmao Zhai
Xuebin Zhang
Hui Jiang
Fang Yuan
Zijiang Zhou
Large amounts of sub-daily temperature data are shared globally through the Global Telecommunication System (GTS) in near-real time and through international data exchanges. However, converting these data into a global daily temperature dataset with a uniform definition – especially for daily maximum (Tmax) and minimum (Tmin) temperatures – has proven challenging due to the independent observation schedules across the world. To address this issue, we developed a new method that decomposes sub-daily Tmax and Tmin records from the Integrated Surface Database (ISD) into finer intervals, subsequently reaggregating them into daily Tmax and Tmin based on a prospective 00:00–24:00 UTC dateline. This new method increased the global daily Tmax and Tmin data counts by 64 % and 45 %, respectively, compared to the original method, which relied on either two consecutive Tmax/Tmin records over 12 h or a single Tmax/Tmin record over 24 h. The Global Land Base Dataset-First Estimate Daily Data (GLBD-FED) was established for the period from 1981 to 2024, following corrections for misrecorded Tmax and Tmin and quality control. GLBD-FED includes daily maximum (Tmax), average (Tave), and minimum temperature (Tmin) from approximately 17 000 global sites, with daily data amounts reaching about 10 000 entries per day in the current decade. When compared to the Global Summary of the Day (GSOD) dataset, GLBD-FED exhibits less extreme daily values over the last 40 years, showing a slightly lower daily Tmax (around −0.3 °C) and a higher daily Tmin (around +0.3 °C), with a nearly identical daily Tave (approximately +0.1 °C). These systematic differences arise from multiple sources, including: (1) UTC-boundary double-counting artifacts in GSOD (which alone introduced an average bias of +0.28 °C in Tmax and −0.85 °C in Tmin across ∼18 million and ∼11 million duplicated records, respectively); (2) differing sub-daily data source preferences (Synoptic vs. METAR reports); and (3) divergent date boundary treatment methods. The database and associated data can be found at https://doi.org/10.5281/zenodo.17895292 (Yang et al., 2025).
- Article
(11682 KB) - Full-text XML
- BibTeX
- EndNote


Near-surface air temperature is one of the most fundamental and core observational elements for reflecting global climate change (IPCC, 2021). In the context of global warming, obtaining long-term, high-spatial-coverage, and quality-controlled global daily instrumental surface temperature data (primarily including daily maximum, minimum, and mean temperatures) plays an irreplaceable role in climate change detection, attribution analysis, and the evaluation of weather and climate models (Alexander et al., 2006). Such high-temporal-resolution observational data not only reflects the mean state characteristics of the climate system but also serves as the cornerstone for characterizing high-frequency weather fluctuations and climate variability.
In operational practices and scientific research, daily temperature data (especially daily maximum and minimum temperatures) are an absolute prerequisite for monitoring and assessing extreme weather and climate events. For instance, a series of core extreme climate indices defined by the WMO Expert Team on Climate Change Detection and Indices (ETCCDI) – such as the Warm Spell Duration Indicator (WSDI), Frost Days (FD0), and Extreme Maximum Temperature (TXx) – must be calculated based on continuous, high-quality daily temperature data (Alexander et al., 2006; Donat et al., 2013; Dunn et al., 2020; Zhang et al., 2011). These derivative indices not only provide indispensable observational evidence for successive assessment reports by the Intergovernmental Panel on Climate Change (IPCC) but are also widely applied in the real-time monitoring of severe weather and early warning systems (IPCC, 2021).
While numerous global observational datasets exist to support climate research, there is a pronounced scarcity of daily global temperature datasets based purely on in situ station data. Historically, the development of global observational products has been exceptionally robust for precipitation, flourishing through both dense in situ gauge-based gridded analyses (e.g., GPCC; Becker et al., 2013) and multi-source merged products incorporating satellite estimates (e.g., MSWEP; Beck et al., 2019). In contrast, the available landscape for global daily temperature is much narrower. Existing prominent temperature datasets, such as GHCN-Daily (Menne et al., 2012), Berkeley Earth (BEST; Rohde et al., 2013), and HadGHCND (Caesar et al., 2006), are primarily designed either as retrospectively homogenized benchmark networks or as spatially interpolated gridded products optimized for long-term climate trend analysis. This scarcity leaves a critical gap for a purely station-based, high-fidelity daily temperature dataset that can leverage the improved global accessibility of sub-daily observations.
High-quality daily temperature datasets generally fall into two distinct operational tiers: homogenized benchmark datasets (such as GHCNd) designed for long-term climate change detection, and near-real-time, first-hand datasets designed for rapid synoptic monitoring and immediate extreme weather assessment. While benchmark datasets are essential for climatology, they often involve significant latency. Conversely, legacy near-real-time datasets (such as GSOD) often suffer from severe temporal aggregation artifacts – such as misallocating sub-daily extremes to incorrect calendar days due to strict UTC boundary constraints (the specific mechanisms and quantitative impacts of these challenges are discussed in detail in Sect. 5.3). These algorithmic characteristics introduce artificial noise that affects rapid extreme weather analysis. Furthermore, a critical gap remains: strict temporal and methodological uniformity. National and regional benchmark datasets frequently employ diverse definitions of a “daily” period and utilize disparate temporal aggregation algorithms. This lack of standardization introduces well-documented Time of Observation Biases (TOB; Karl et al., 1986). When researchers attempt to combine these localized high-quality datasets for global monitoring, these methodological differences inevitably create artificial discontinuities (“seams”) across national borders.
The core scientific significance of GLBD-FED lies in its ability to eliminate these methodological borders. By applying a single, unified algorithmic framework directly to first-hand sub-daily synoptic reports across all global regions simultaneously, GLBD-FED enforces a universal physical 24 h window (00:00 to 24:00 UTC). This strict temporal alignment is irreplaceable for advanced meteorological applications, particularly in the verification of global Numerical Weather Prediction (NWP) model outputs. Modern NWP models output daily forecast summaries based on standardized UTC cycles; validating these outputs against heterogeneous regional datasets introduces severe temporal mismatch errors (Haiden et al., 2018). By aligning with the World Meteorological Organization's standard for synoptic uniformity (WMO, 2017), GLBD-FED provides a seamless, time-aligned “first estimate” ground truth. Therefore, the primary focus of GLBD-FED is to serve as a high-fidelity, global, near-real-time, first-hand daily dataset that supports reliable, large-scale extreme event monitoring and serves as temporally consistent raw material for future benchmark homogenization.
Accordingly, this study aims to produce GLBD-FED, a global first-hand daily temperature dataset (1981–2024) that preferentially aligns maximum, minimum, and average temperatures to a unified 00:00–24:00 UTC 24 h window. To achieve this, we developed new temporal reconstruction algorithms designed to optimally utilize irregularly timed sub-daily measurements from the ISD. By harmonizing these records under a strict temporal framework, our methodology effectively mitigates Time of Observation Biases (TOB) and artificial geopolitical border effects. The data sources and methodology – including automated error correction and sliding-window fallback mechanisms – are detailed in Sects. 3 and 4. This is followed in Sect. 5 by a comparative evaluation against a legacy dataset (GSOD), which quantitatively highlights the resolution of systematic temporal attribution biases. Finally, conclusions are presented in Sect. 6.
2.1 Near-real-time sub-daily meteorological measurements
Hourly surface temperature observations spanning 1981–2024 were compiled through the Integrated Surface Database (ISD), a global database that consists of hourly and synoptic surface observations compiled from numerous sources into a single common ASCII format and common data model (Smith et al., 2011). It is important to note that NOAA formally terminated updates to the ISD in 2025, transitioning to the new Global Historical Climatology Network hourly (GHCNh) framework. However, our evaluation indicates that GHCNh currently lacks several critical meteorological elements present in the legacy ISD – specifically the 12 and 24 h temperature extremes. Given that these explicitly reported extremes are essential for our algorithm, the historical ISD remains the only viable source for reconstructing the high-fidelity 1981–2024 baseline presented in this dataset.
The ISD-derived temperature parameters encompass five specific temporal components: discrete sub-daily instantaneous temperatures (which are utilized to derive the daily mean temperature, denoted as Tave), 24 h explicitly reported maxima and minima (Tmax-24 h and Tmin-24 h), and 12 h explicitly reported maxima and minima (Tmax-12 h and Tmin-12 h).
Figure 1 visualizes the global distribution of sub-daily temperature data volumes across the 24 h UTC cycle spanning the period from 1981 to 2024. The analysis reveals striking temporal discrepancies among different temperature parameters. For the discrete hourly temperature observations (utilized to derive Tave), the data volume is continuously distributed across all hours, characterized by a highly robust multi-peak pattern. The primary peaks align perfectly with the standard 6-hourly synoptic times (00:00, 06:00, 12:00, and 18:00 UTC), complemented by secondary peaks at the intermediate 3-hourly intervals (03:00, 09:00, 15:00, and 21:00 UTC). This dense and temporally consistent distribution provides a solid foundation for calculating highly representative daily mean temperatures. Analysis of the discrete sub-daily reporting frequency reveals that the global network primarily operates on a combination of 3-hourly and 6-hourly cadences, manifesting as two dominant 6-hourly regimes offset by 3 h: 00:00/06:00/12:00/18:00 UTC and 03:00/09:00/15:00/21:00 UTC.
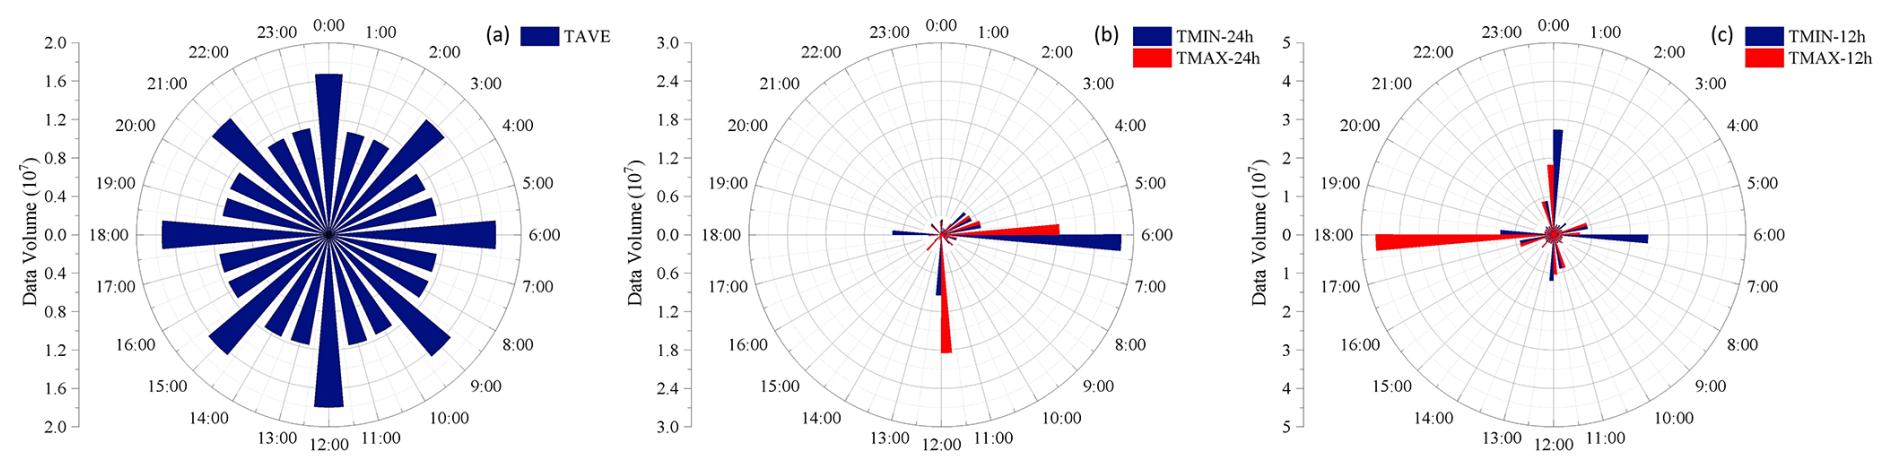
Figure 1The distribution of sub-daily temperature data amounts at each o'clock during 1981–2024. (Note: In panels b and c, the red and blue bars are purposefully offset slightly for visual clarity to prevent overlap, though they represent records reported at the exact same synoptic hours.)
In stark contrast, the explicitly reported extreme temperatures (Tmax and Tmin) exhibit extreme temporal concentration. The 24 h extremes (Tmax-24 h and Tmin-24 h) are overwhelmingly anchored at just two specific reporting times: 06:00 and 18:00 UTC. Similarly, the 12 h extremes present a highly asymmetric, diurnal-driven reporting pattern. Specifically, Tmin-12 h reaches its absolute volumetric peak at 06:00 UTC, capturing the nighttime cooling, whereas Tmax-12 h overwhelmingly peaks at 18:00 UTC, corresponding to daytime warming. It should be noted that the overwhelming concentration of explicit 24 h extreme reports at specific hours (e.g., 06:00 and 18:00 UTC) is primarily an artifact of international data exchange standards, rather than a reflection of the longitudinal/geographic distribution of stations. WMO synoptic reporting protocols require member states to aggregate and submit extreme records at standardized global synoptic hours (WMO, 2015). Consequently, the ISD archive structurally “anchors” the vast majority of explicit global extreme reports to these specific UTC timestamps. These distinct structural characteristics explicitly demonstrate that while hourly observations offer continuous sub-daily coverage, explicit extreme reports are highly sparse outside of a few specific synoptic hours. This temporal fragmentation structurally mandates and quantitatively justifies the necessity of our secondary fallback strategy, which utilizes the high-frequency hourly observations to robustly reconstruct daily extremes when explicit records are absent.
The multi-panel maps in Figs. 2 to 6 illustrate the spatiotemporal evolution of sub-daily temperature data volumes from 1981 to 2024. The analysis reveals a striking contrast in data availability: while discrete hourly temperatures exhibit continuous and stable growth in spatial coverage and reporting frequency over the four decades, explicitly reported extremes (12 and 24 h Tmax/Tmin) suffer from severe geographic fragmentation and decadal volatility, notably experiencing a pronounced global decline between 1990 and 2010. These stark spatiotemporal discrepancies visually highlight the limitations of relying exclusively on explicitly reported extremes and quantitatively justify the necessity of utilizing high-density hourly data as a secondary fallback strategy.
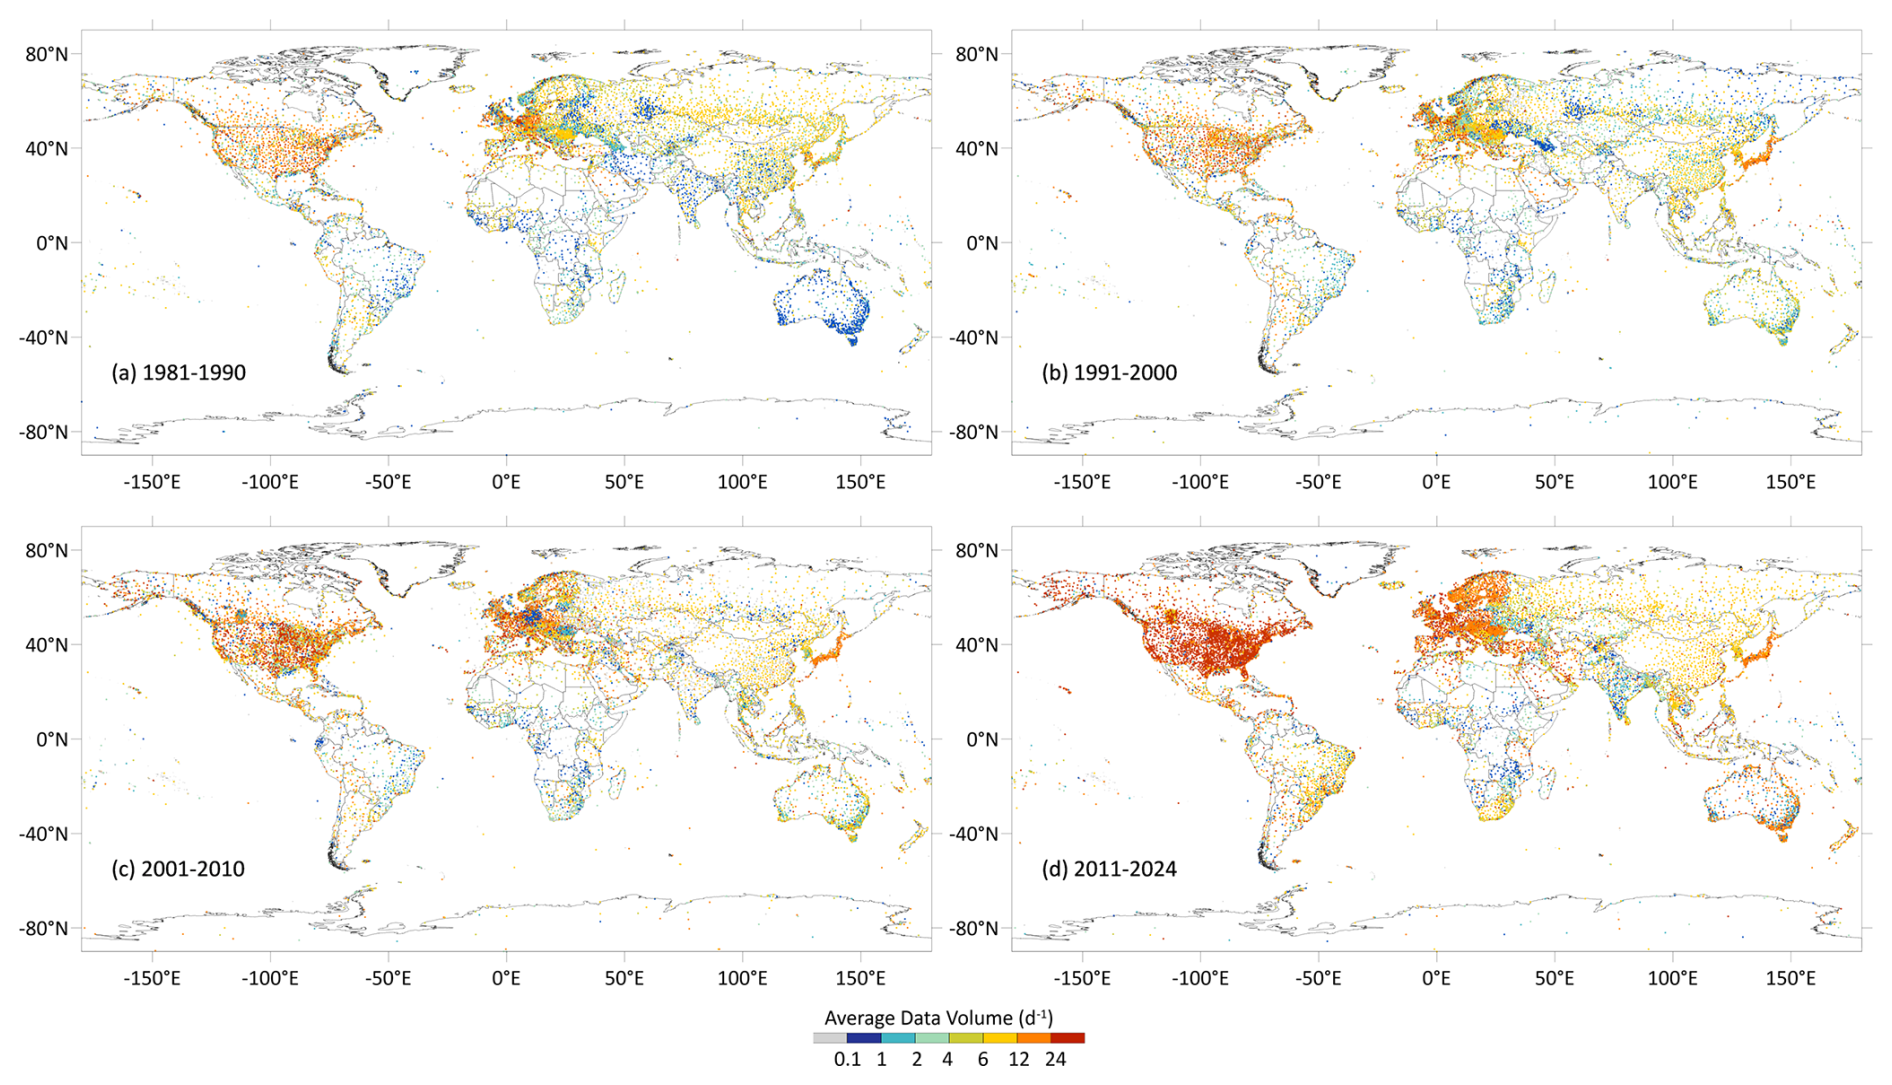
Figure 2Spatial distributions of Hourly average data volume per day for hourly Tave from ISD. Panel (a), (b), (c), (d) stand for the results 1981–1990, 1991–2000, 2001–2010, 2011–2024. Spatial distributions of hourly average data volume per day for hourly Tave from ISD. Panels (a), (b), (c), (d) represent 1981–1990, 1991–2000, 2001–2010, 2011–2024.
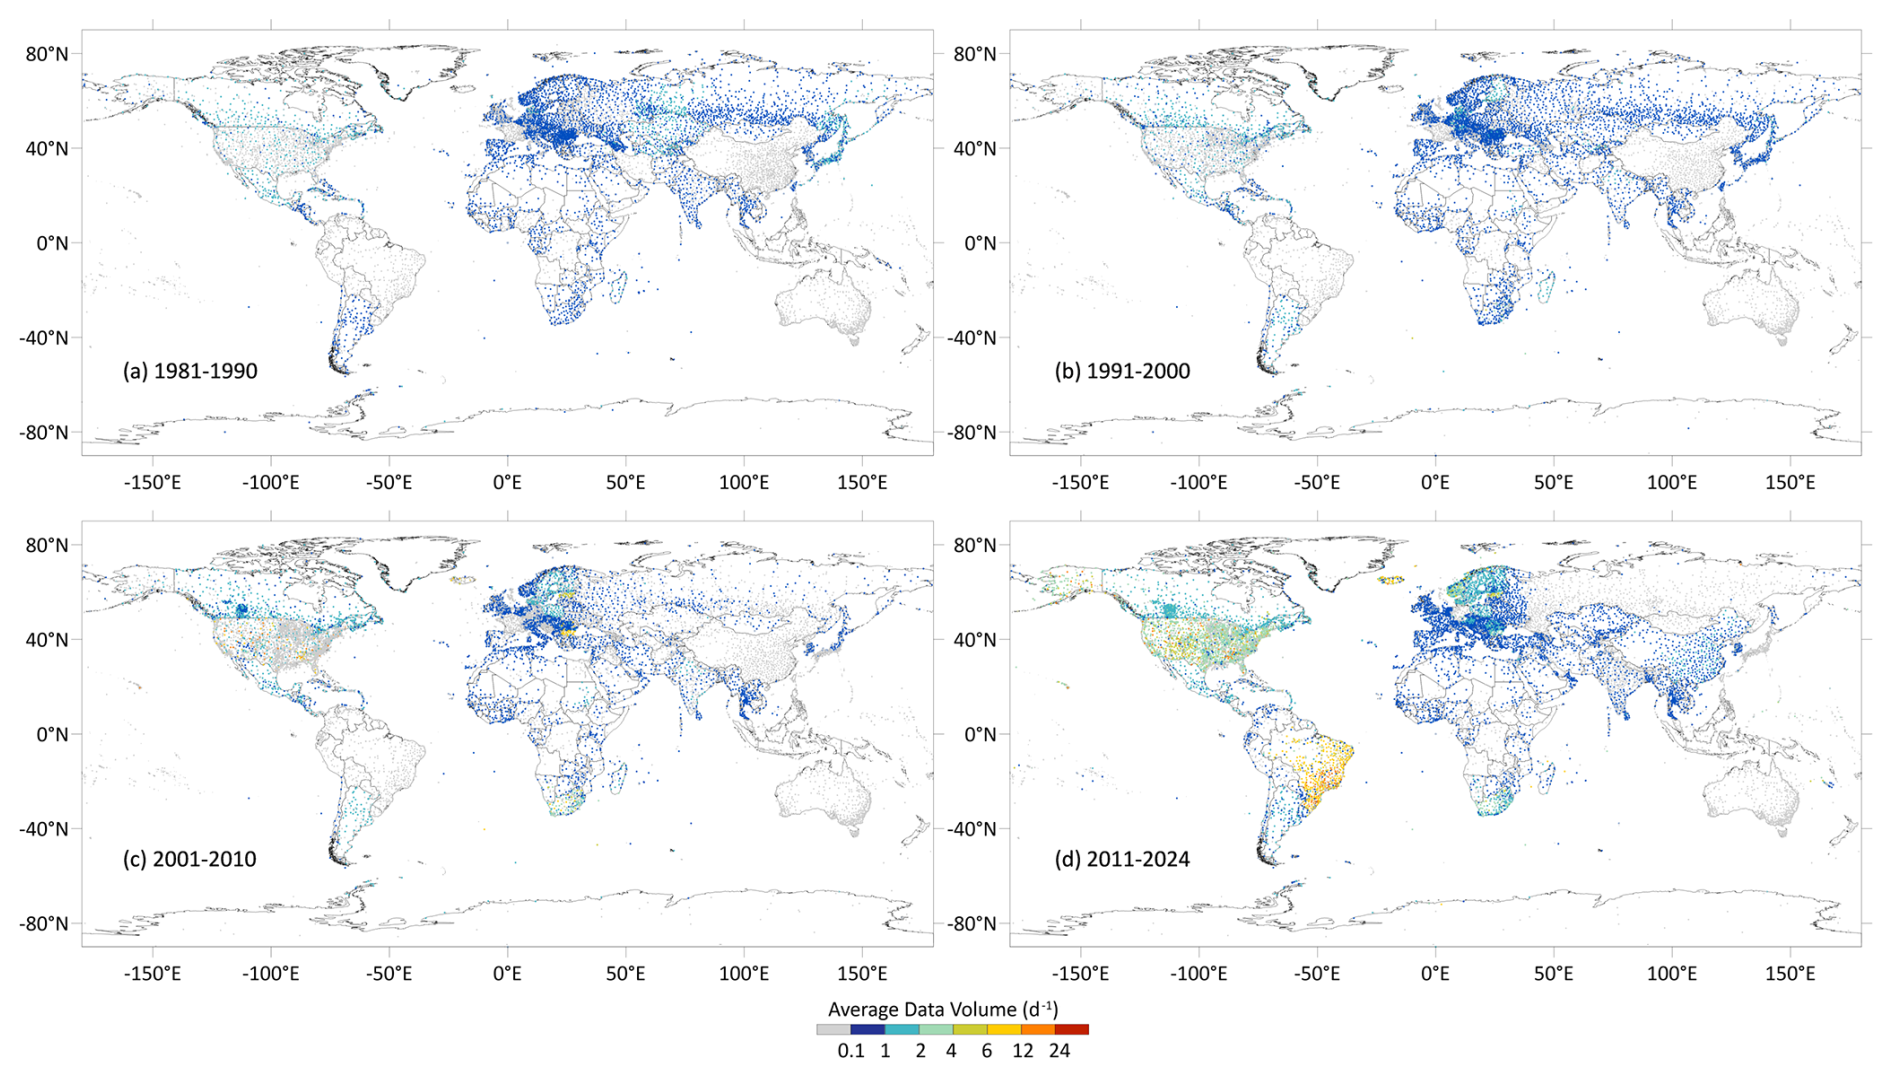
Figure 3Similar to Fig. 2, but for Tmax-12 h.
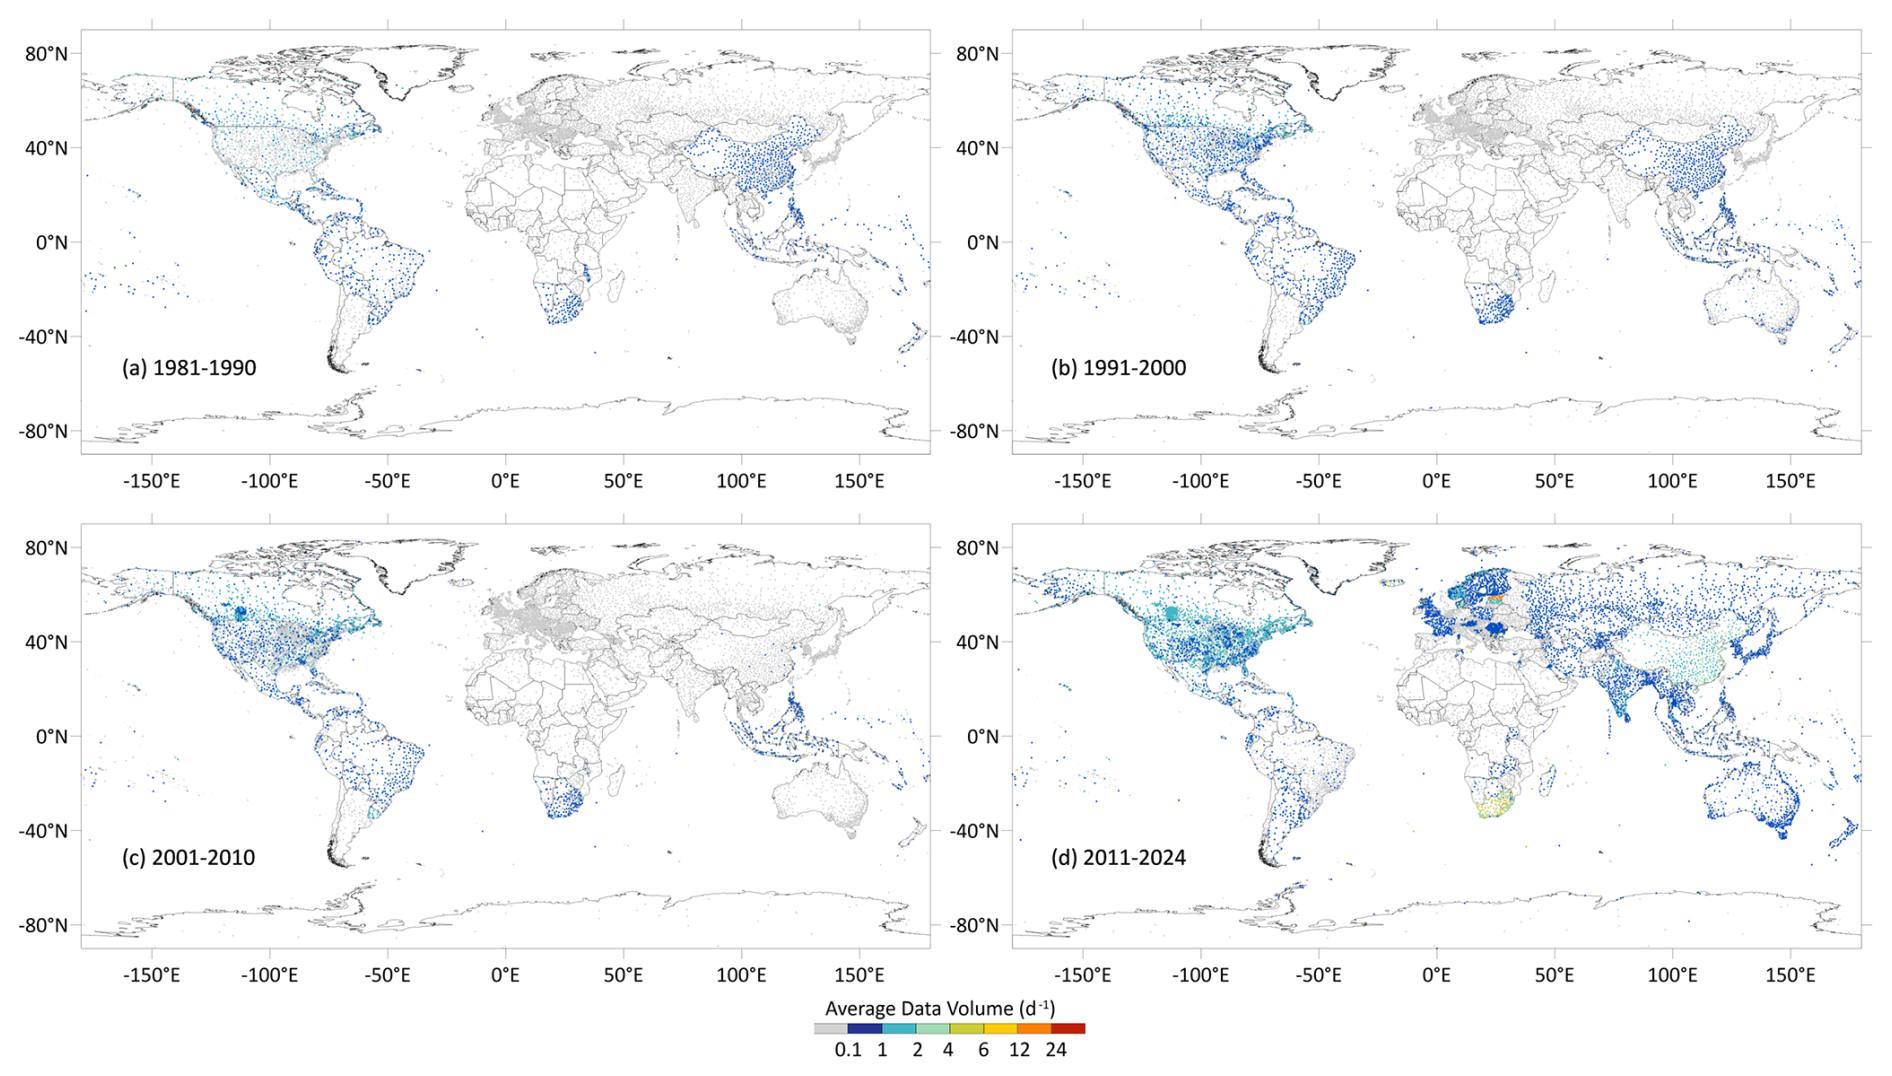
Figure 4Similar to Fig. 2, but for Tmax-24 h.
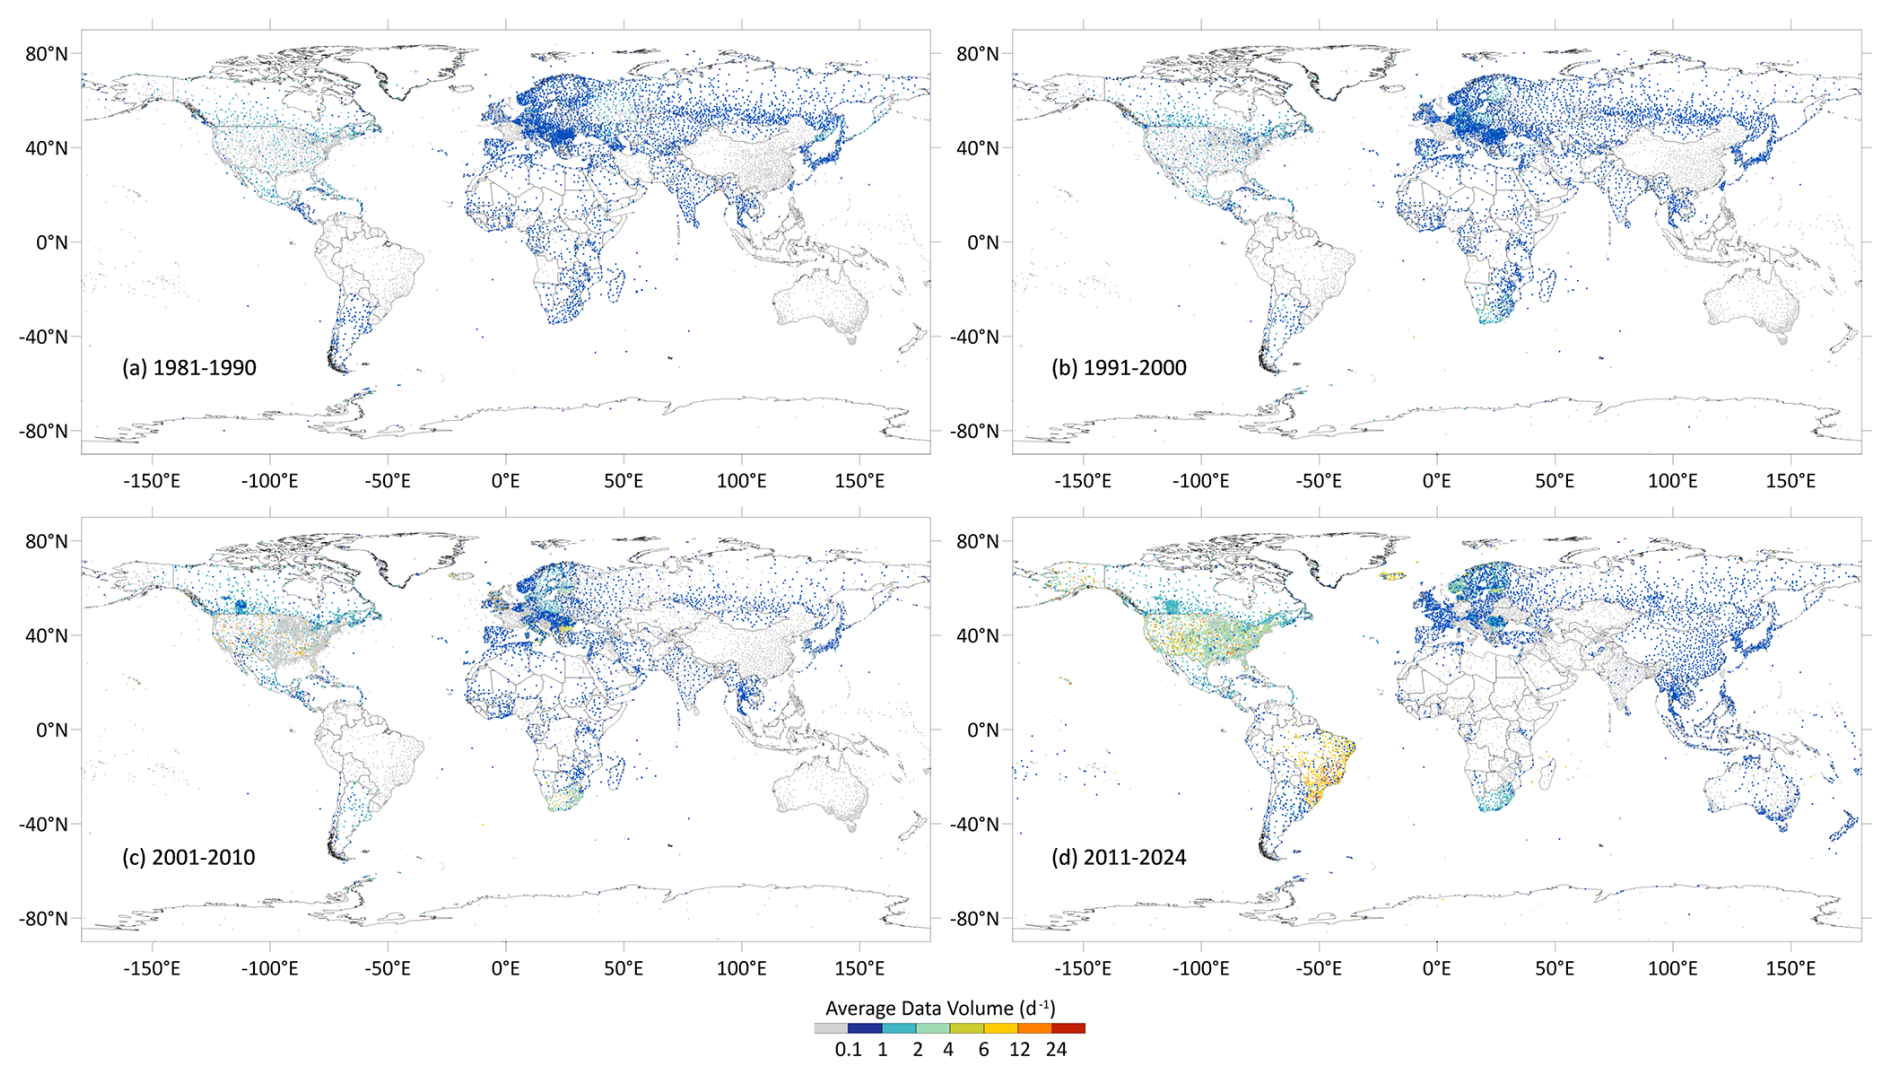
Figure 5Similar to Fig. 2, but for Tmin-12 h.
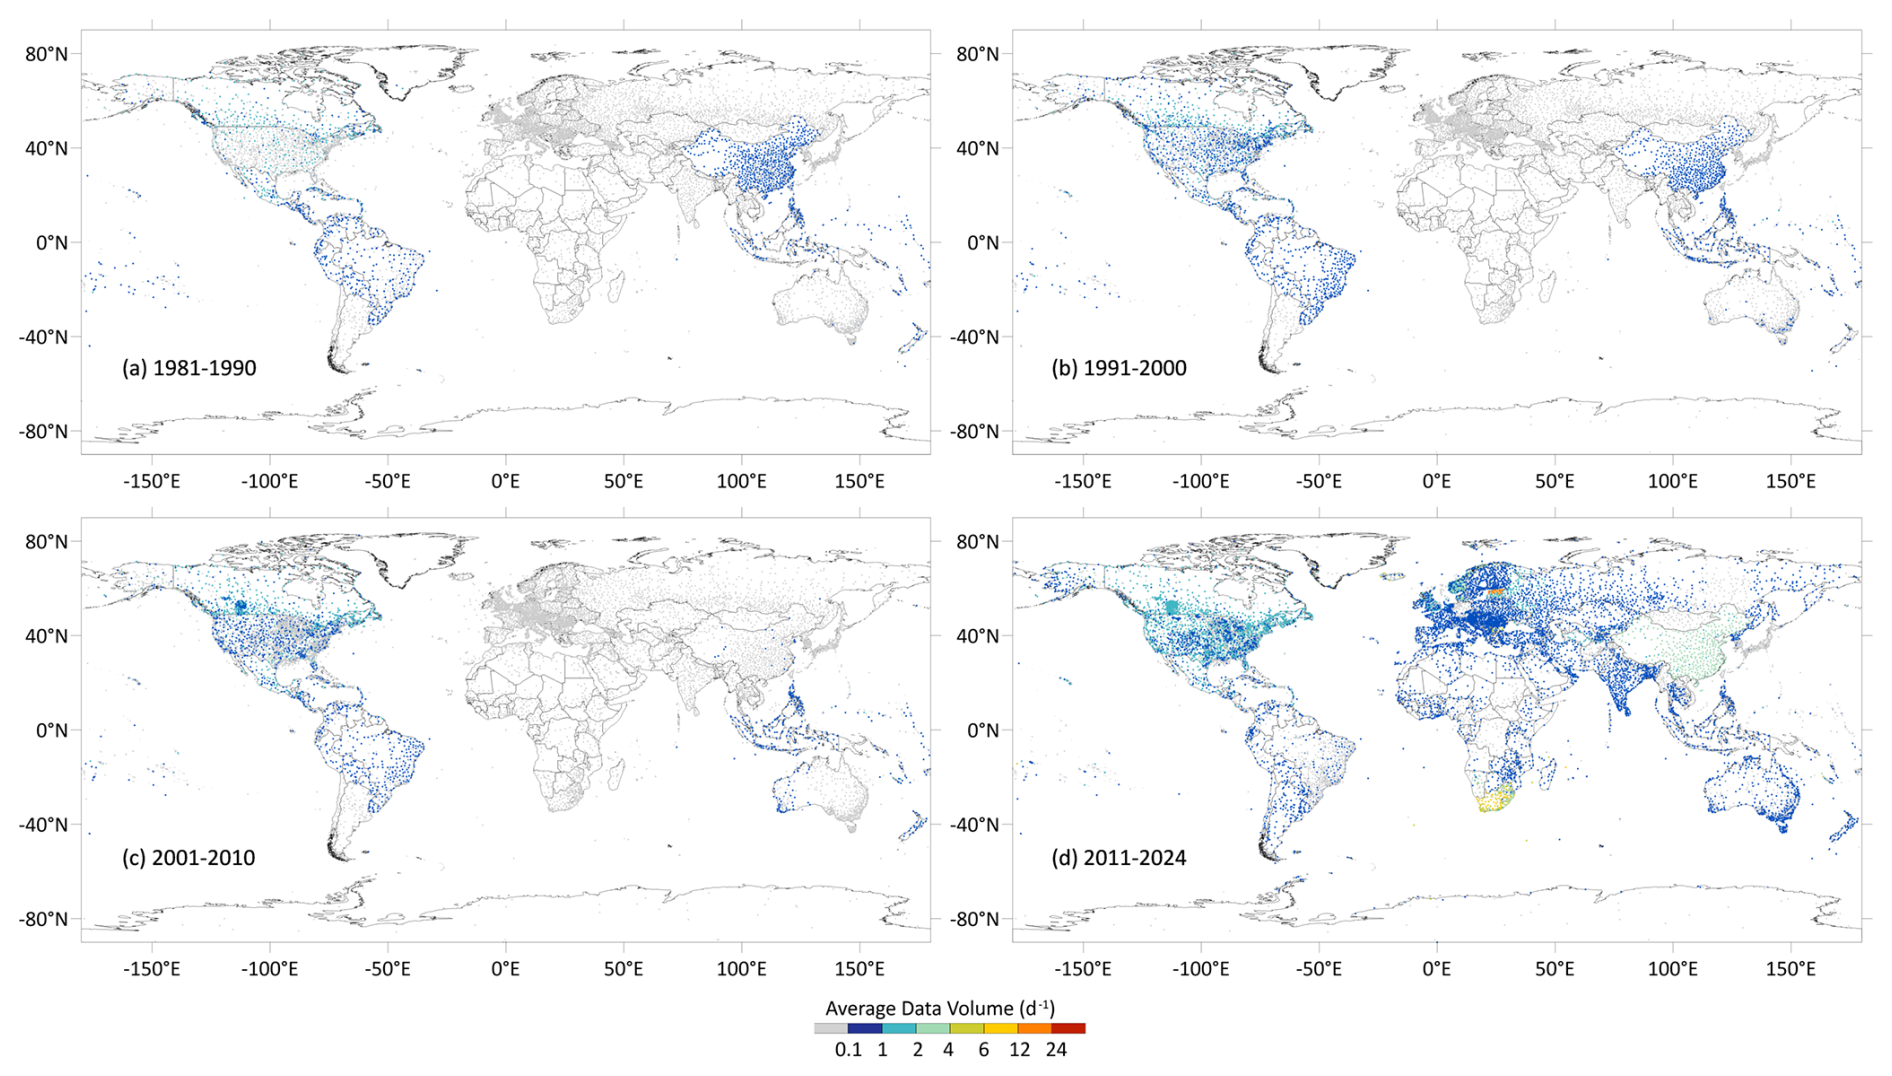
Figure 6Similar to Fig. 2, but for Tmin-24 h.
In summary, sub-daily observations exhibit irregular observation intervals compared to Tave. Moreover, Tmax and Tmin do not always appear in pairs as expected, indicating that date shifts and inhomogeneities may not only exist between regions but also between the raw Tmax and Tmin records themselves.
2.2 GSOD in-situ daily data
The legacy GSOD dataset evaluated herein was accessed on 2025-03-01, reflecting the version that relied exclusively on the ISD as its input. The Global Surface Summary of the Day (GSOD, NOAA NCEI, 1999), maintained by the U.S. National Centers for Environmental Information (NCEI), generates daily meteorological summaries from over 9000 global weather stations. Derived through systematic processing of the ISD, this product provides continuous records spanning 1929 to present, with post-1973 data exhibiting optimal completeness. Readers should be aware that with the retirement of the ISD, the legacy GSOD is slated for replacement by a new product, the Surface Summary of the Day (SSOD). Because the SSOD has not yet been officially released, a direct comparison with the true successor to GSOD is not currently possible. Furthermore, because GHCNh does not currently support our methodological requirements, real-time operationalization of GLBD-FED is temporarily paused.
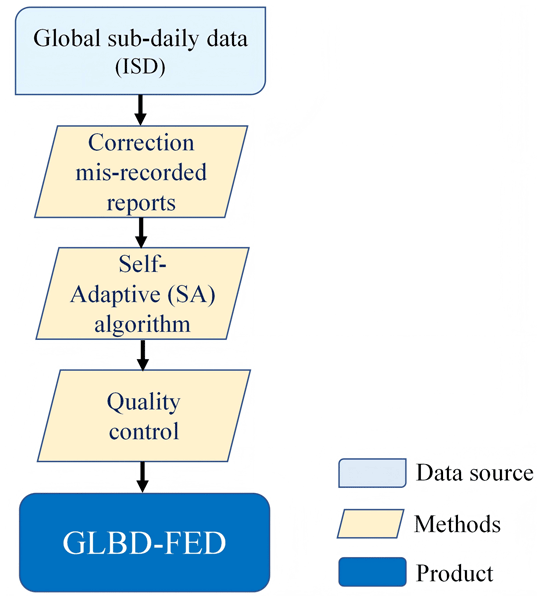
Figure 7 illustrates the main procedures involved in the production of the Global Base Dataset-First Estimate Daily Data (GLBD-FED). The Integrated Surface Database (ISD) served as the data source, from which daily Tmax, Tave, and Tmin were derived using new methods after correcting for misrecorded data.
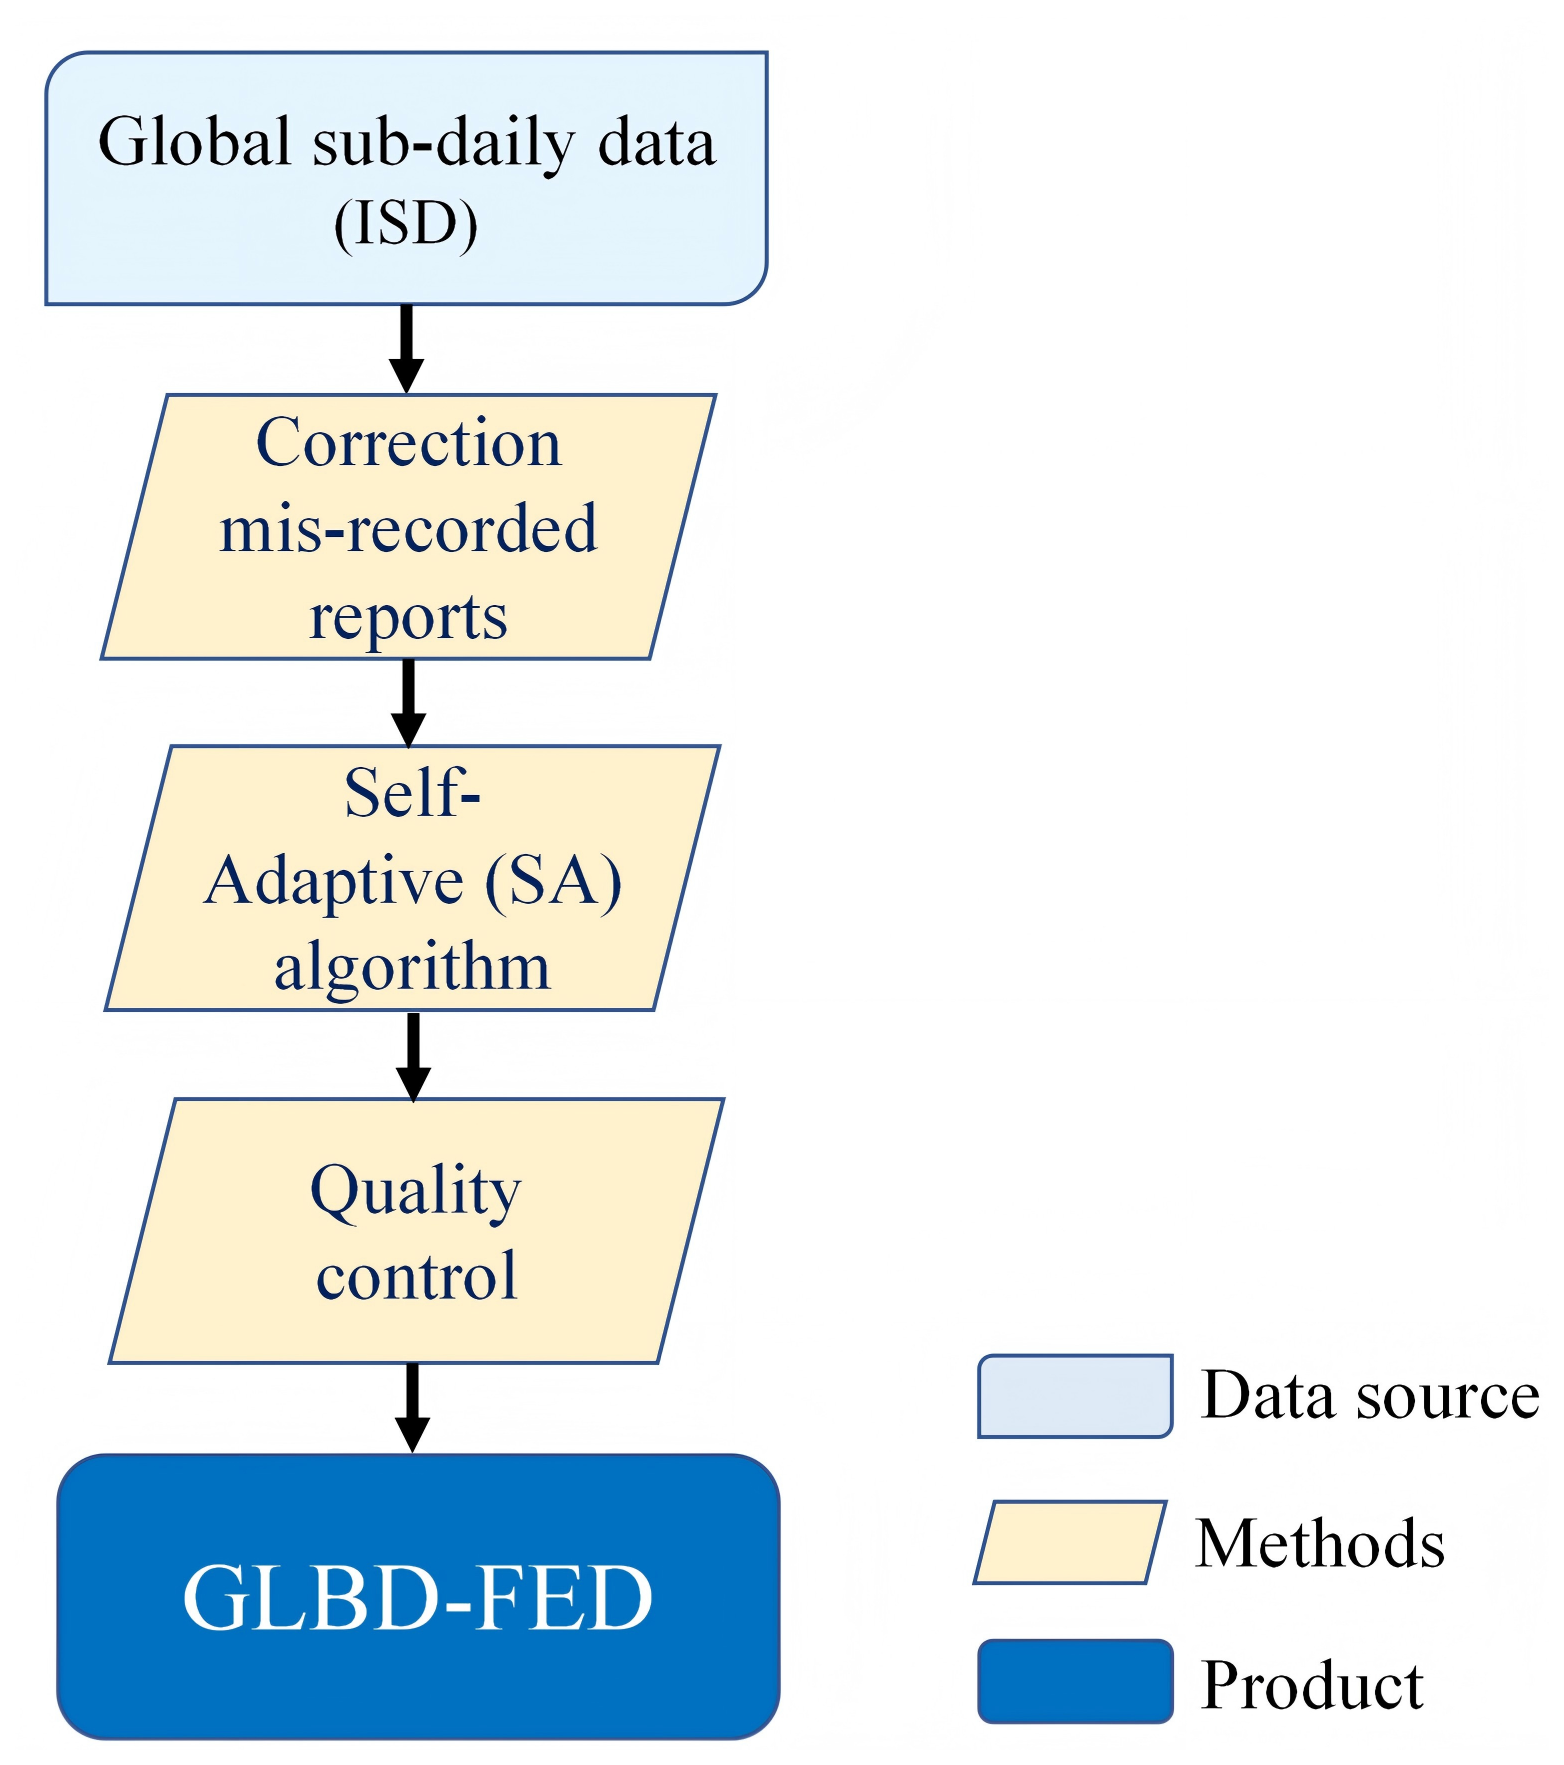
All daily data underwent rigorous quality control and were assigned specific quality and date boundary codes (detailed procedures are provided in the Appendix).
3.1 Correction for Mis-recorded sub-daily Tmax/Tmin in data source
The quality of the data source is one of the most critical factors influencing the final data product. Notably, there were numerous misrecorded values for Tmax and Tmin over 12 and 24 h periods in the global hourly data, particularly in South America.
Figure 8 presents a case study from San Antonio Oeste, Argentina (877840-99999), covering 5 January to 12 January 2023. The red and blue lines represent the derived upper limits of temperature from Tmax-12 h and Tmax-24 h, respectively, while the black circles indicate hourly Tave. Panel (a) displays results from the raw data, revealing that San Antonio Oeste tends to record Tmax-24 h at 12:00 UTC and Tmax-12 h at 00:00 and 12:00 UTC. The blue lines (derived from Tmax-24 h) are consistently lower than the hourly Tave, suggesting that these Tmax-24 h values are likely erroneous due to incorrect recording.
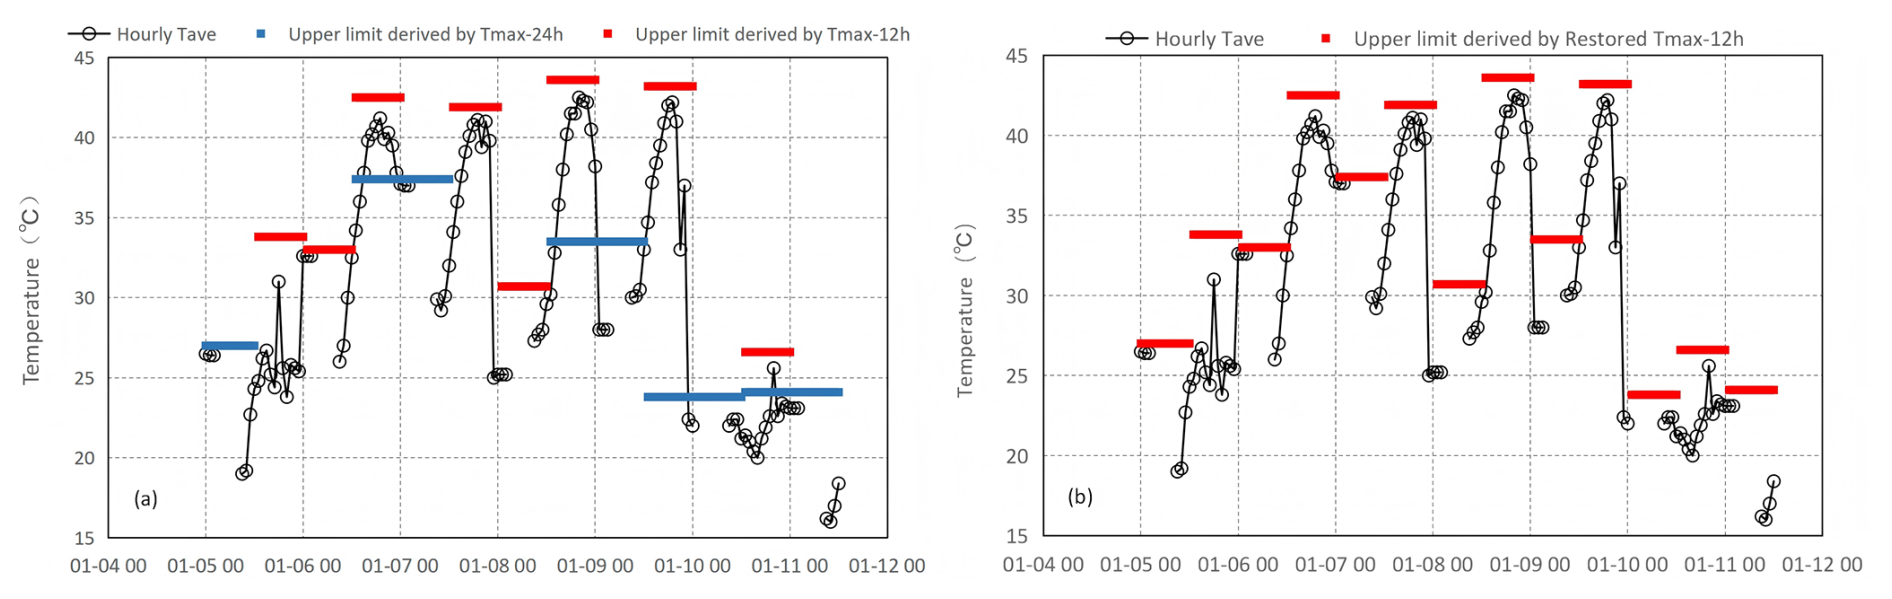
Figure 8The discrete hourly observations and the derived upper limit of temperature deduced from Tmax-12 h/24 h during 5 January to 12 January 2023 at San Antonio Oeste, Argentina. Panels (a) and (b) represent the results from the raw and restored data, respectively. The misrecorded Tmax-24 h (blue lines in panel a) are restored as Tmax-12 h (red lines in panel b).
The case study at San Antonio Oeste is highly representative of a systematic structural artifact within the legacy archive. A comprehensive global assessment of this specific mis-recording error from 1981 to 2024 reveals that it affected numerous stations worldwide, with concentrated occurrences in Western Europe, Russia, China, Canada, and South Africa. The primary driver of this anomaly is the misclassification of high-frequency sub-daily reports (e.g., 1 h summaries) as 24 h extremes. The spatial distribution and frequency of the stations affected are detailed in the Appendix (Fig. A1). To ensure high-throughput scalability across the global network, these corrections were coded as automated conditional rules integrated directly into our processing pipeline. The specific programmatic procedures are as follows:
-
Tmax-24 h records at hh:00 were compared with the highest hourly Tave from the previous 12 h (Tave-12 h high) and 24 h (Tave-24 h high). If Tmax-24 h <Tave-24 h high − 0.5 °C and Tmax-24 h ≥ Tave-12 h high, it indicates that the Tmax-12 h at hh:00 was incorrectly recorded as Tmax-24 h and should be corrected.
-
Tmax-12 h records at hh:00 were similarly compared. If Tmax-12 h > Tave-12 h high + 0.5 °C and Tmax-12 h ≤ Tave-24 h high, it suggests that the Tmax-24 h at hh:00 was inaccurately recorded as Tmax-12 h and should also be corrected.
-
The corrections for Tmin-24 h and Tmin-12 h followed a similar approach, but comparisons were made with the lowest hourly Tave from the previous 12 and 24 h.
Figure 8b displays the corrected results. The misrecorded Tmax-24 h values were restored to Tmax-12 h, and the derived hourly upper limit temperatures now align closely with the hourly Tave.
3.2 New algorithms for in-situ daily temperature calculation
Aiming to obtain a set of global daily temperature data standing for the air temperature status under a prospective dateline, new algorithms were developed.
3.2.1 Time window management for daily data calculation
The standard 24 h window for calculating daily variables (Tmax, Tave, and Tmin) is strictly defined as 00:00 to 24:00 UTC. However, to maximize global data retention, we implemented a sliding-window fallback mechanism. If sub-daily observations are insufficient to calculate a valid daily value within the standard UTC day, the 24 h calculation window is systematically shifted by 1 h increments (up to ±12 h) until a complete 24 h data block is found. To ensure complete transparency and traceability, the specific start and end times utilized for each adjusted daily calculation are explicitly recorded in the dataset metadata.
3.2.2 Equidistant sampling for daily Tave calculation
The most analyzed variable in climate studies is mean annual or monthly temperature, historically often defined using either fixed-hour observations or the simple average of daily maximum and minimum temperatures (Trewin, 2010). However, as discussed regarding spatiotemporal data volume (Sect. 3.1), explicit Tmax and Tmin reports do not always appear in pairs, exhibit lower geographic continuity than hourly observations, and are highly susceptible to Time of Observation Biases (TOB). This implies that deriving the daily Tave directly from the arithmetic mean of discrete, evenly distributed hourly records within the strict 00:00–24:00 UTC window is significantly more robust and globally uniform relative to deriving it from legacy extreme summaries. The daily average temperature is calculated as the following formula:
In this context, Tave represents the average temperature, with the subscript “daily” indicating the daily aggregation and “hh” denoting the specific starting hour. The value of hh is strictly one of the hours from 00:00 to 05:00 UTC (i.e., hh ∈ {00:00, 01:00, ..., 05:00}). In cases where higher-frequency sub-daily data provide multiple valid combinations, we apply a sequential priority rule: the algorithm selects the first available 6-hourly sequence by sequentially scanning the starting hours from 00:00 UTC. To mitigate temporal sampling biases introduced by missing or irregular hourly observations, the daily average temperature (Tave) is only computed when there are at least 4 valid hourly observations relatively evenly distributed across the 24 h period. Days failing to meet this data completeness threshold are recorded as missing.
3.2.3 Reaggregation for daily Tmax and Tmin calculation
Sub-daily Tmax and Tmin records were temporally decomposed into finer intervals, following the precipitation data processing protocols established by Yang et al. (2020). This approach facilitated probabilistic recombination into daily Tmax and Tmin values under a prospective dateline. Figure 9 illustrates a case of daily Tmin calculation using the reaggregation algorithm at False Pass, US (700638-99999) on 11 October 2024.
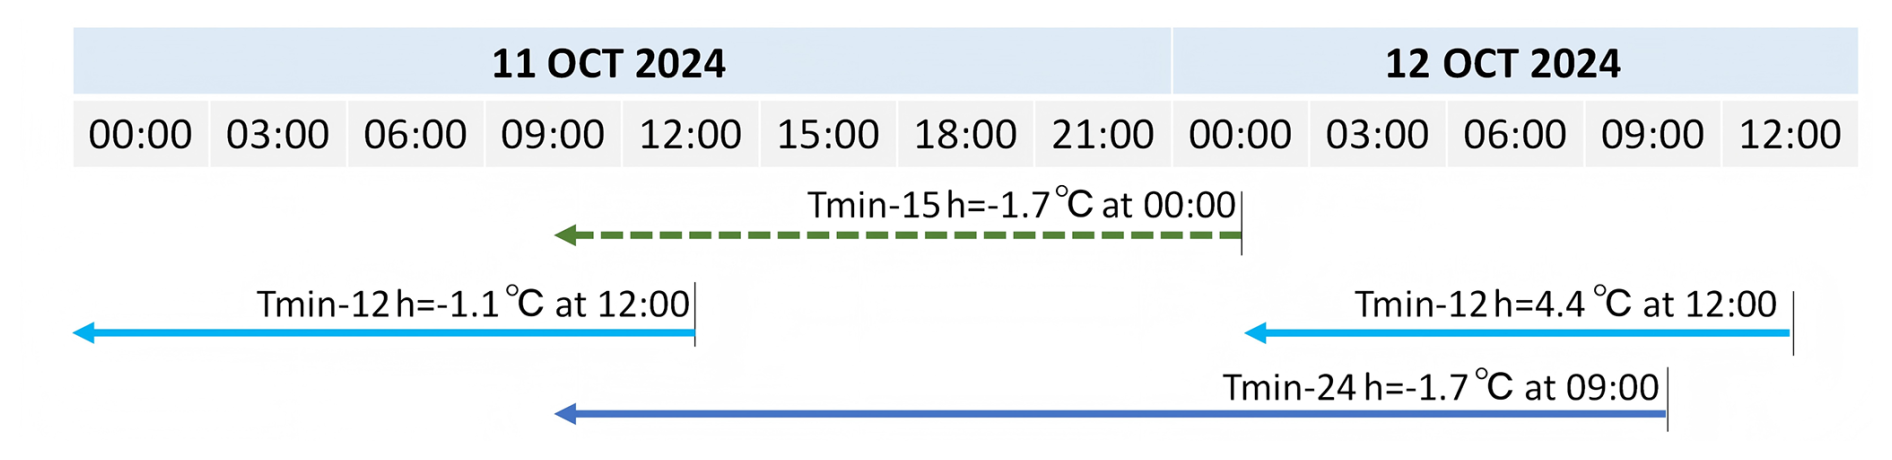
Figure 9Application of the reaggregation algorithm for the daily Tmin value at False Pass, US (700638-99999) on 11 October 2024. The solid light and deep blue arrows represent the explicitly measured Tmin-12 h and Tmin-24 h records, respectively. The dashed green arrow represents the Tmin-15 h implicitly deduced from these measured records.
During the period from 11 October to 12 October, False Pass recorded Tmin-12 h at 12:00 UTC and Tmin-24 h at 09:00 UTC. Initially, an implicitly deduced Tmin-15 h at 00:00 UTC on 12 October (−1.7 °C, indicated by the dashed green arrow) was derived from the overlapping Tmin-24 h at 09:00 UTC (4.4 °C, solid deep blue arrow) and Tmin-12 h at 12:00 UTC on 12 October (−1.7 °C, solid light blue arrow). It is important to note that this temporal decomposition algorithm strictly requires perfect boundary alignment between the input records; if the boundaries do not perfectly align, the deduction becomes mathematically invalid and cannot be performed. This value was then combined with the Tmin-12 h at 12:00 UTC on 11 October (−1.1 °C) to produce the daily Tmin value for 11 October (−1.7 °C), which was the minimum recorded during that day. In comparison to the original method (which used either two consecutive Tmax/Tmin records over 12 h or one Tmax/Tmin record over 24 h), the reaggregation algorithm demonstrates a significant improvement. Figure 10 illustrates the average data volume of global daily Tmax and Tmin obtained by the two methods in 2023. The volume of daily Tmax data increased by 64 %, rising from approximately 3400 to 5600 entries per day, while the volume of daily Tmin data grew by 45 %, increasing from 4100 to 5900 entries per day.
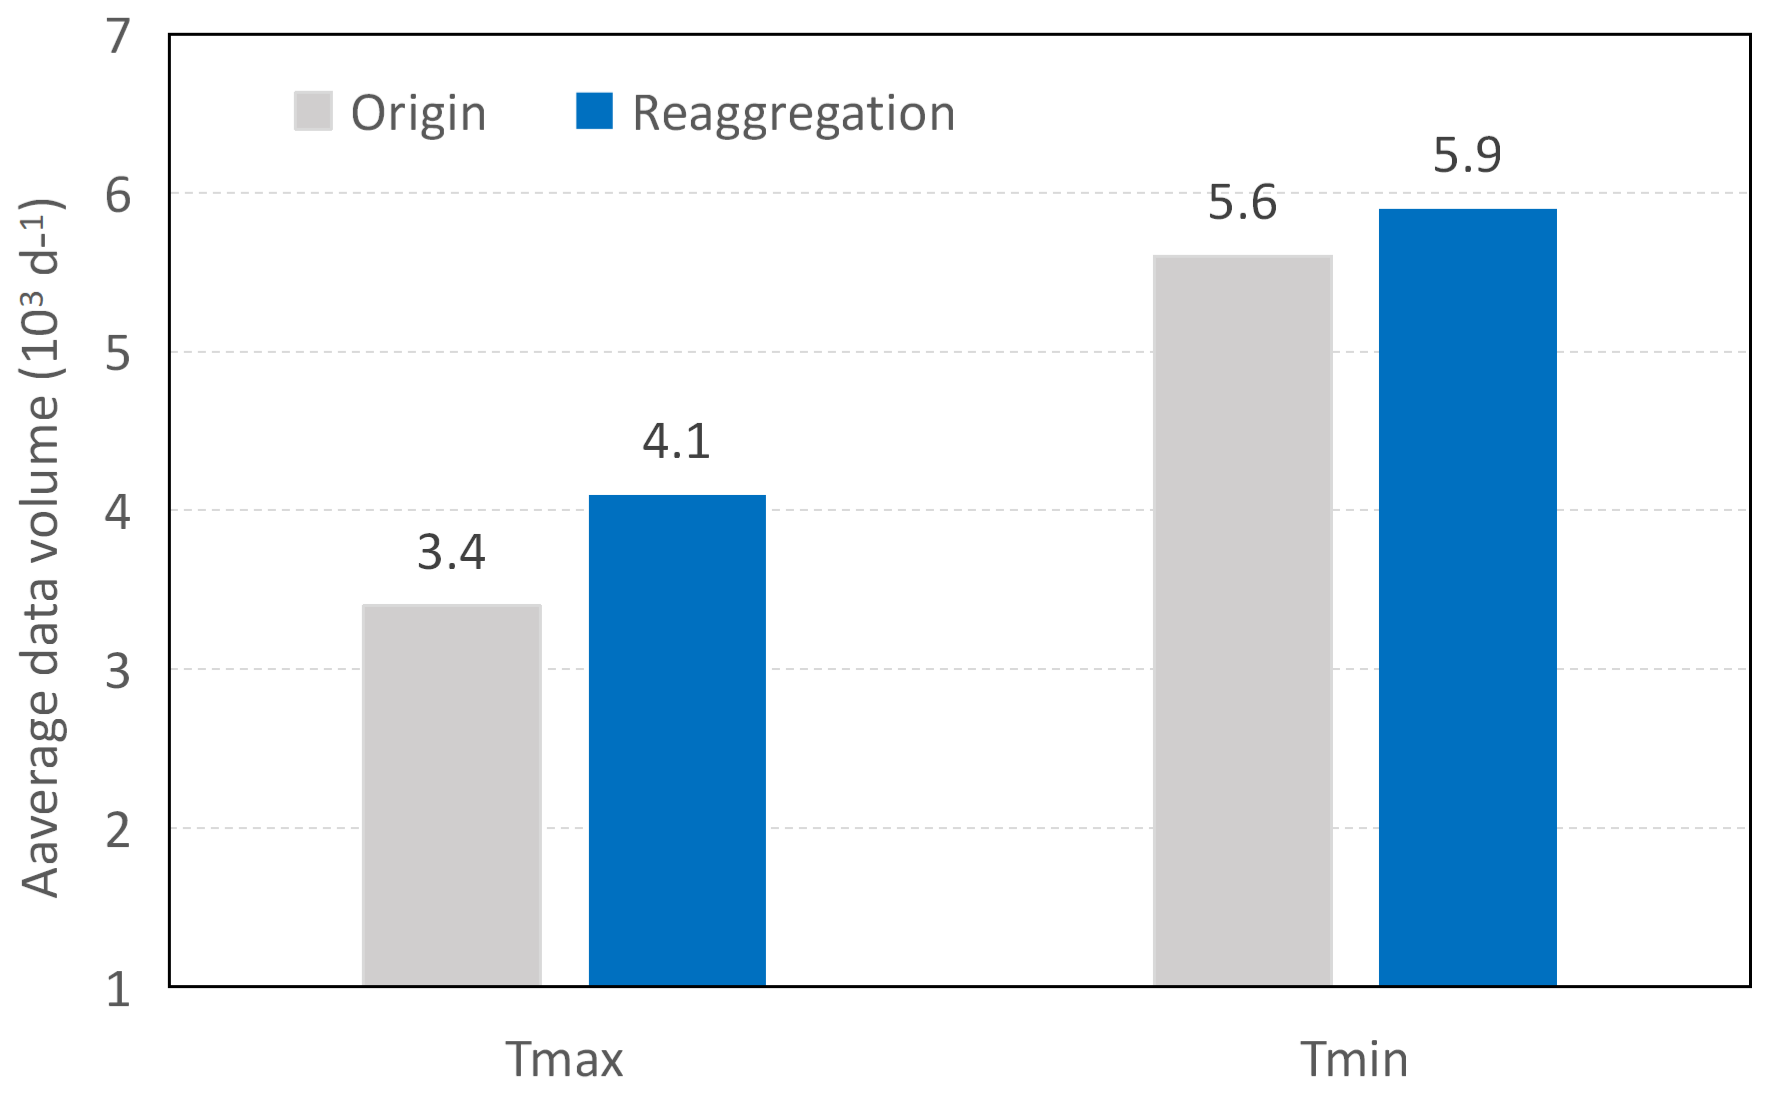
Figure 10Average data volume of global daily Tmax and Tmin in 2023. The gray and blue bars represent the data calculated by origin and reaggregated methods, respectively.
Figure 11 illustrates the spatial distribution of the additional data recovered by our temporal reconstruction algorithm. At the national level, several countries exhibit particularly large increases. For instance, Canada, Brazil, Finland, Denmark, Poland, Romania, Australia, New Zealand, Thailand, Indonesia, and the Philippines show notable increases in retrieved daily Tmax records. Similarly, regions including Canada, Brazil, Finland, Denmark, Poland, Romania, and Kazakhstan display significant growth in daily Tmin. Overall, the recovery of Tmax exhibits a wider geographic spread. This broader spatial rise is largely attributable to our algorithm successfully resolving severe baseline scarcities caused by national reporting times clashing with rigid UTC boundaries across networks in Australia and New Zealand. Notably, the distribution reveals pronounced geopolitical border effects. These sharp spatial contrasts at national boundaries directly reflect the differing sub-daily reporting protocols and data exchange policies enforced by individual National Meteorological and Hydrological Services (NMHSs). Because the temporal reconstruction algorithm capitalizes on specific sub-daily reporting cadences, its enhancement effect naturally maps onto these nation-specific administrative practices.
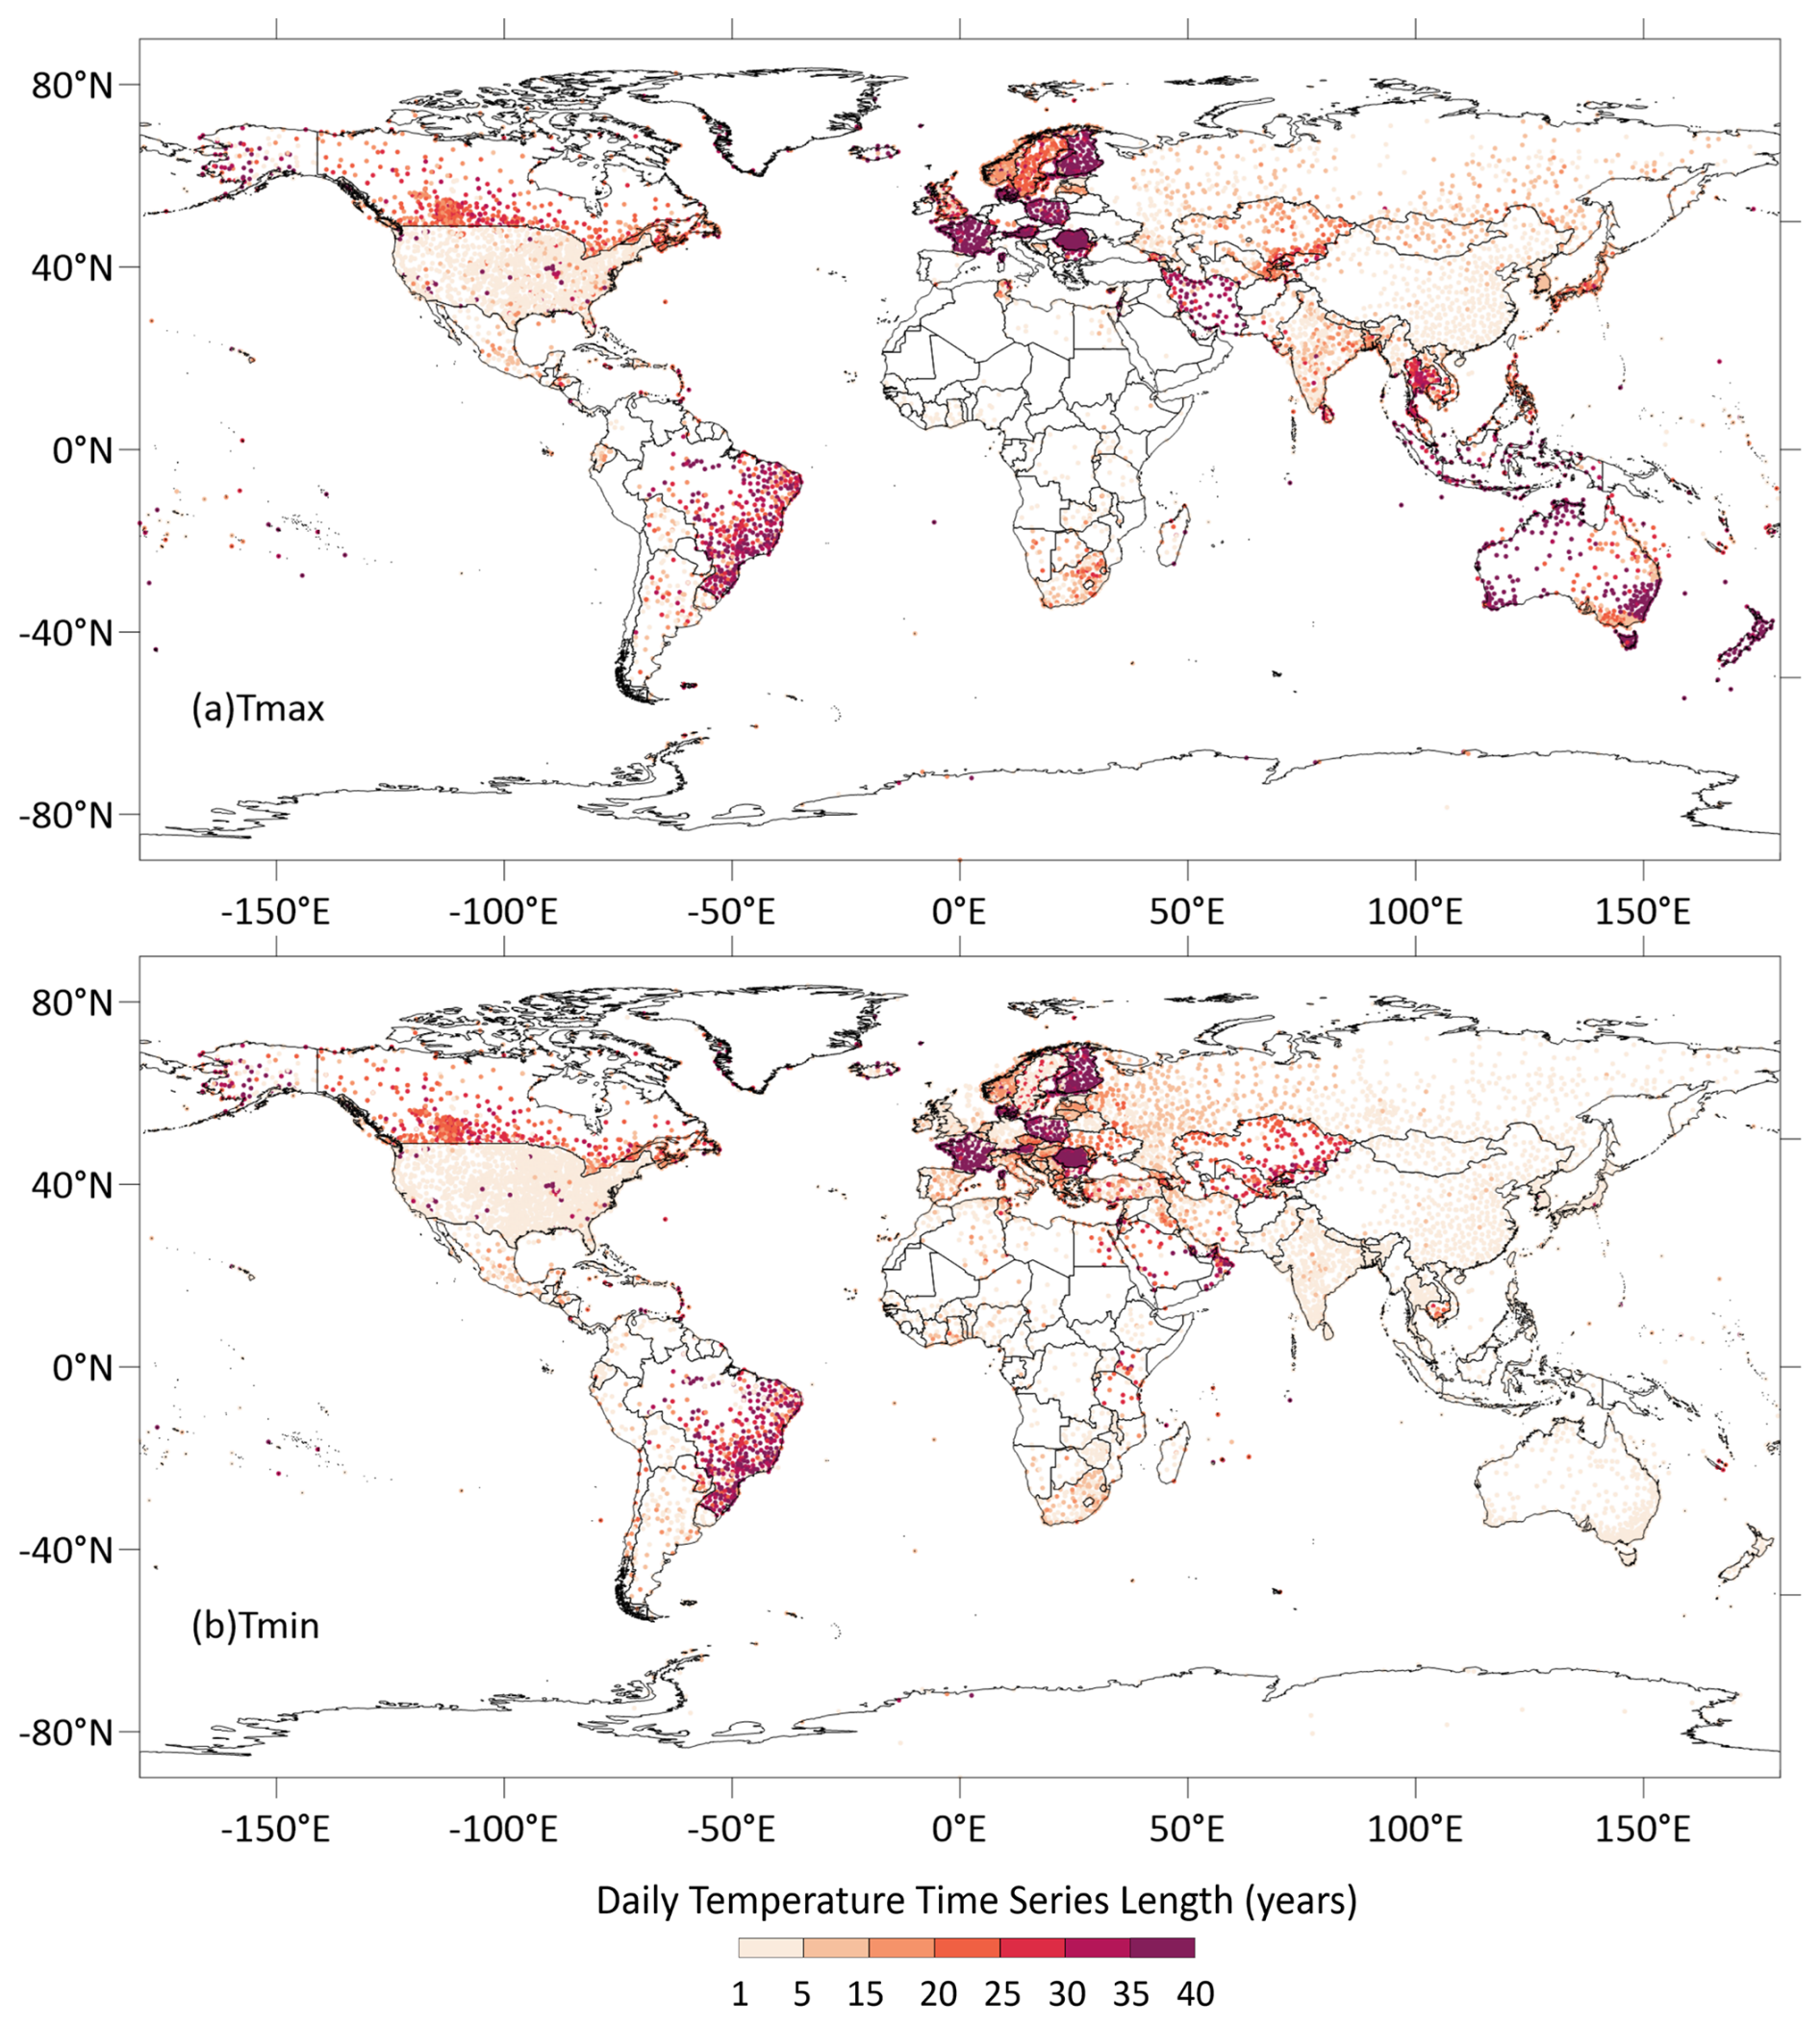
Figure 11The spatial distribution of the increasing Tmax (a) and Tmin (b) data improved by the reaggregation algorithm in 2023. The color represents the increasing data volume.
If the standard reaggregation algorithm fails or cannot be applied due to non-standard reporting times, a fallback strategy is implemented. First, the Tmax/Tmin-24 h records that cover the greatest number of hours within the target day are used as the daily values, provided they overlap for at least 12 h. Otherwise, the absolute maximum and minimum values derived from the discrete hourly temperature observations are employed as supplementary estimates for Tmax and Tmin, respectively, given that at least 21 valid hourly observations are available for that day. It is important to acknowledge that deriving daily extremes from discrete hourly temperature samples is subject to inherent sampling biases. Because true temperature extremes rarely occur exactly at the “top” of the hour, estimates derived from quasi-instantaneous hourly observations tend to be slightly lower for Tmax and higher for Tmin than the true absolute values. Nevertheless, in the absence of explicit extreme reports, utilizing high-frequency hourly observations remains the only practical approach to maintain global temporal continuity.
3.3 Data quality controls
Given the massive volume of the global dataset and our objective to provide a rapid, scalable “first estimate” baseline, the entire quality control procedure is fully automated. Quality controls were implemented for both the input hourly data and the produced daily data. Global hourly temperature data quality tests include a spike value test, a stuck value test (which identifies prolonged sequences of the same value in the data series), and an inner consistency test (assessing the relationships between Tmax, Tave, and Tmin). The daily data underwent these same tests, along with additional temporal and spatial consistency tests. Specifically, the temporal consistency test identifies values that deviate excessively from the station's long-term historical distribution, while the spatial consistency test compares a station's record with simultaneous observations from neighboring stations within a 100 km radius to detect localized anomalies. This specific suite of quality control tests was selected because it represents the established international standard, strictly adhering to WMO guidelines (WMO, 2011, 2018) and the comprehensive automated quality assurance protocols developed for major global datasets such as GHCN-Daily (Durre et al., 2010; Menne et al., 2012) and the ISD (Lott, 2004). Details of these tests for daily data are provided in the Appendix.
Throughout the processing pipeline, data quality results are evaluated via programmed conditional checks at each step and automatically flagged into three distinct categories: credible, suspicious, and erroneous. The quality test results at each stage are compiled into a final assessment of data quality levels for each individual data point (i.e., specifically for each individual daily record). A final quality level for a given observation is flagged as credible if there is no more than one suspicious test result and no erroneous test results across all applied tests. Conversely, a value is flagged as erroneous if more than one erroneous test result is found; otherwise, the final quality level is classified as suspicious.
In this section, we first present the temporal changes and spatial coverage of the global in-situ daily temperature data volume of GLBD-FED. This is followed by comparisons of data values between GLBD-FED and GSOD, along with further discussions.
4.1 Dataset Positioning and Current Status
It is important to emphasize that GLBD-FED is fundamentally designed as a near-real-time, first-hand operational product rather than a retrospectively homogenized benchmark dataset. Its primary utility lies in rapid, temporally accurate evaluations of regional synoptic weather events and validating numerical weather prediction models. Caution should be exercised if applying it directly to long-term decadal climate trend detection without further statistical homogenization.
Furthermore, while the GLBD-FED processing framework was built for continuous near-real-time updates, its current operationalization is constrained by upstream data source transitions. Following the recent retirement of the ISD archive, we evaluated its successor, NOAA's GHCN-Hourly (GHCNh). Our assessment revealed that the meteorological elements contained in GHCNh have been significantly reduced, lacking the specific sub-daily extreme reports necessary to robustly support our daily Tmax and Tmin reconstruction methodology. Therefore, while real-time streaming is currently paused, the completed 1981–2024 GLBD-FED archive stands as a highly valuable, temporally aligned 44-year historical first-hand baseline for the global meteorological community.
4.2 In-situ Data Volume and Spatial Coverage
Figure 12 presents the spatial distribution (panels a1, a2, and a3) and temporal changes (panels b1, b2, and b3) of global daily Tmax, Tave, and Tmin data from 1981 to 2024. The colorful dots in panel (a) indicate the duration of daily data at each site, while the gray and black curves represent the daily data volume and the 15-point smoothing results, respectively.
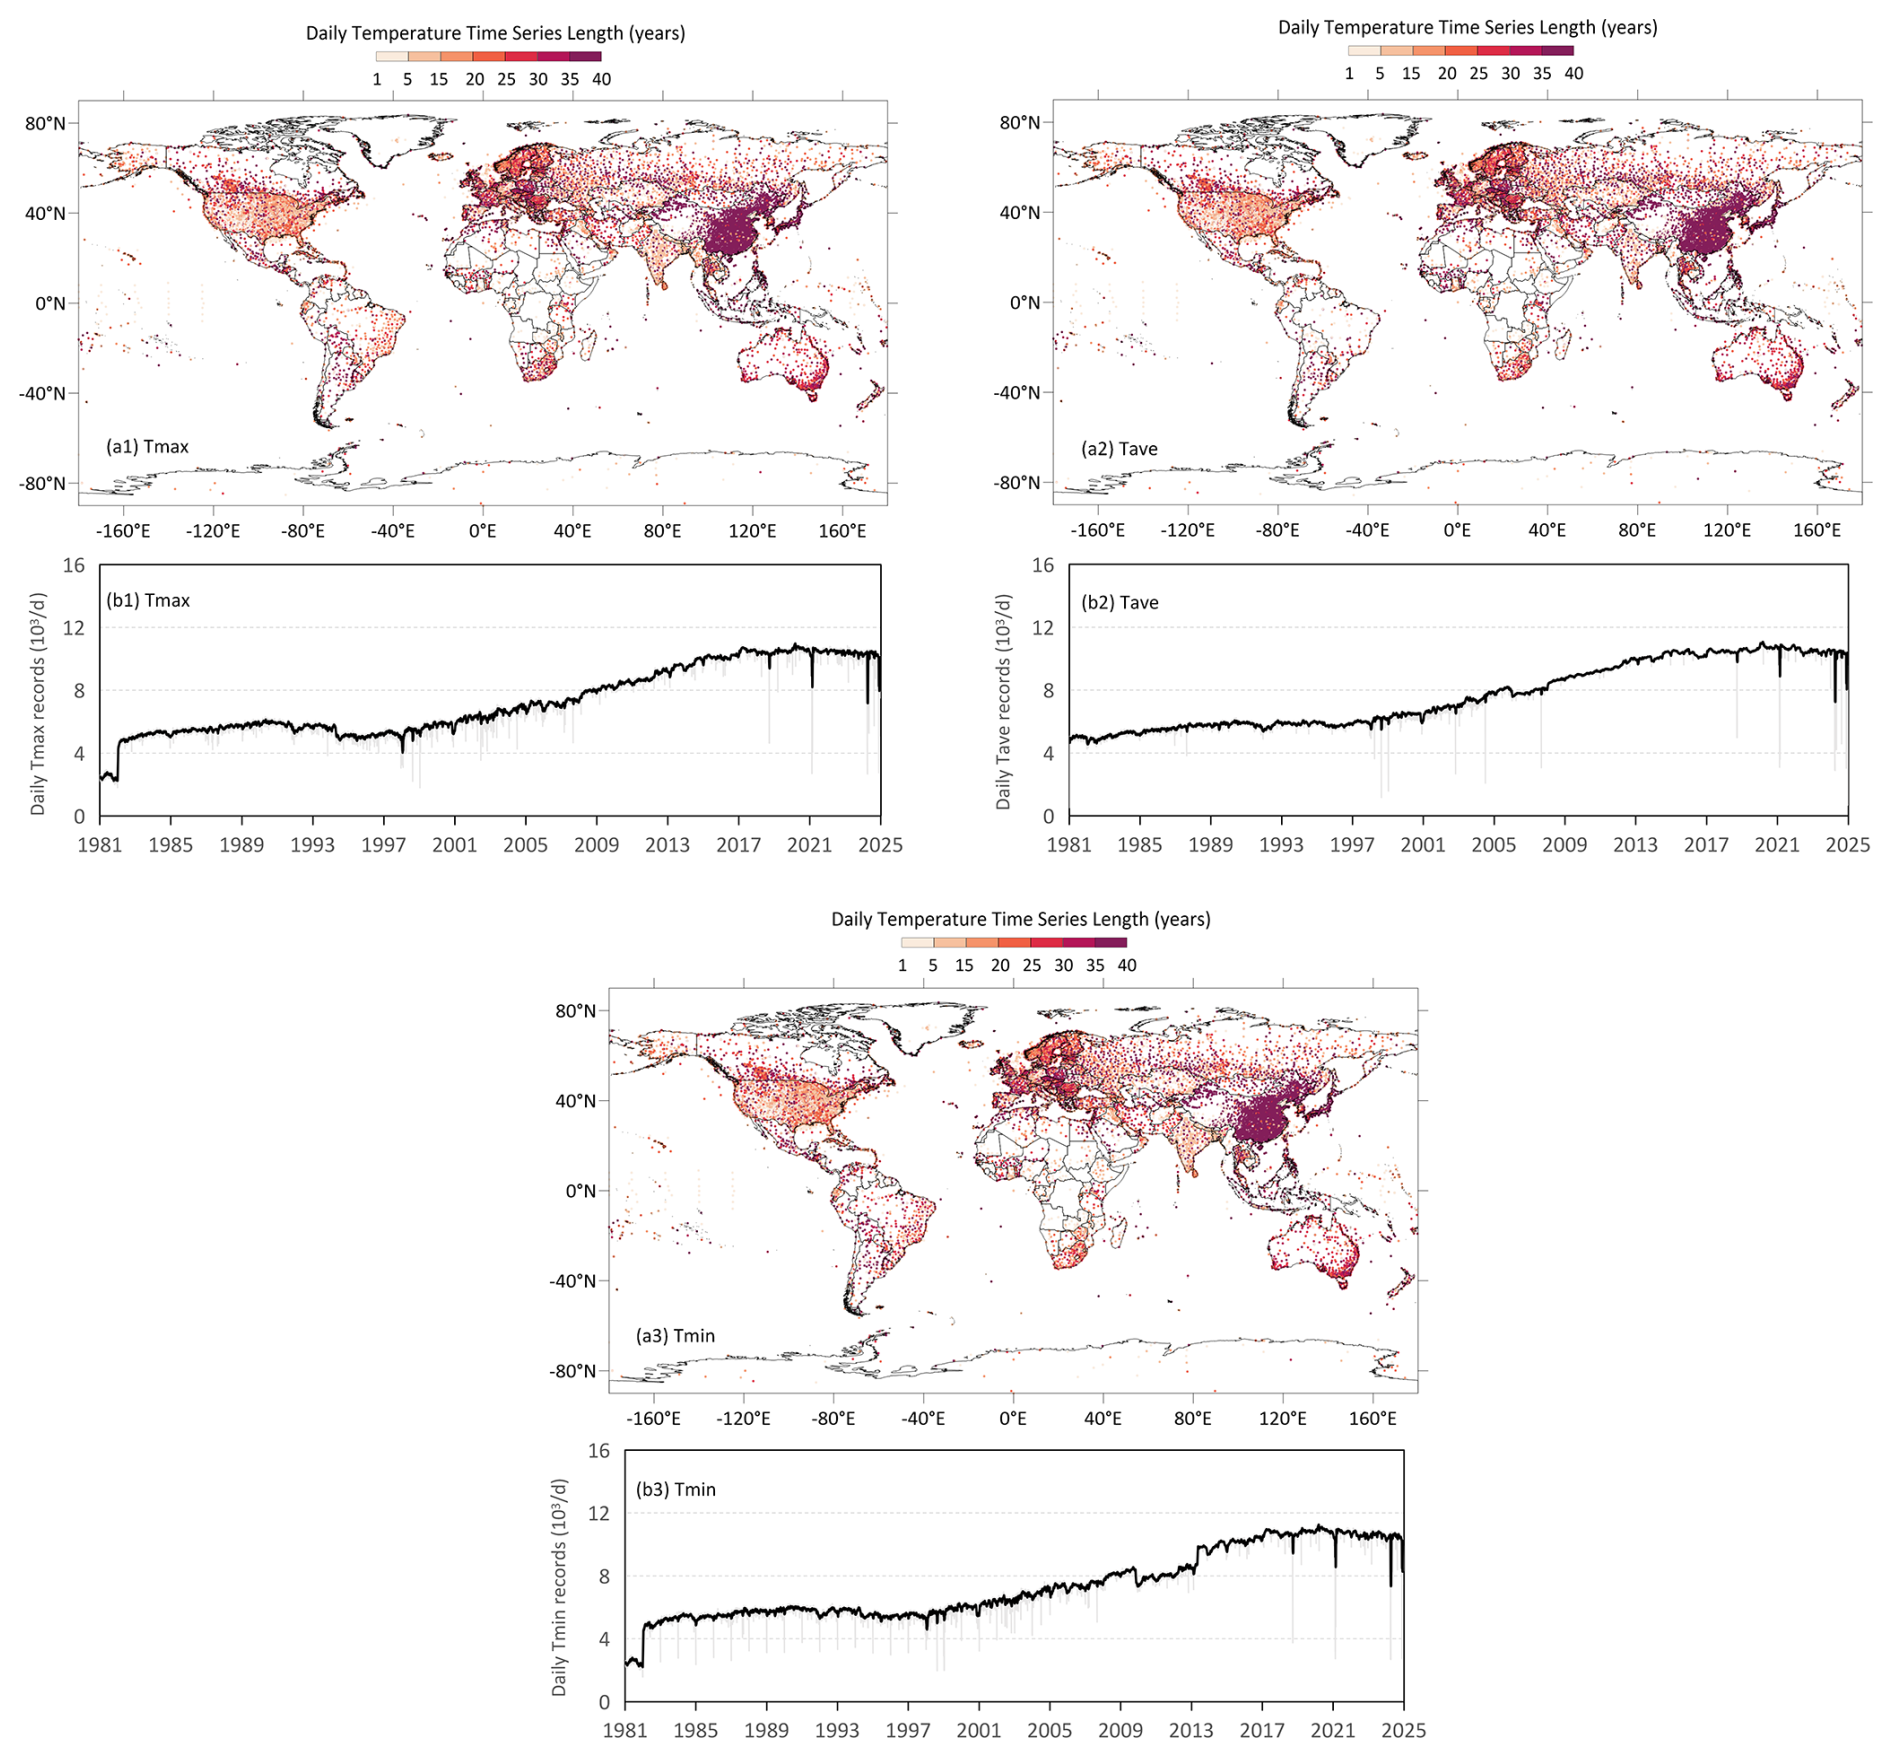
Figure 12The spatial distribution (a1, a2, a3) and temporal changes (b1, b2, b3) of global daily temperature data during 1981–2024. Panels (a1)/(b1) represent Tmax, (a2)/(b2) represent Tave, (a3)/(b3) represent Tmin. The colorful dots in panel (a) represent the length of daily data at sites (sequential “rocket” color scale); the gray and black curves stand for the daily data volume and 15-point smoothing result.
Tmax, Tave, and Tmin exhibit very similar spatial distributions and temporal changes over the last four decades. Panels (a1), (a2), and (a3) show approximately 17 000 sites with at least one year of daily Tmax data. Sites in China, Japan, and central Europe have extensive time series of daily Tmax (≥30 years, indicated by red dots). Western Europe and the US demonstrate a high spatial density of daily Tmax data.
Notably, the apparent abundance of short time series in the U.S. (indicated by green and blue dots, <20 years of records) is largely an artifact of the legacy ISD station identification system. Under this older system, minor station relocations or administrative updates frequently resulted in the assignment of new station IDs, artificially fragmenting what are physically continuous observations. As recent advancements have shown, processing these records through the unified identifier framework of the newer GHCNh dataset (e.g., merging closely located fragments under a single USW-prefix station ID) effectively resolves these artificial breaks and restores the long-term continuity of the time series. Conversely, countries like China tend to retain a consistent ID across relocations to preserve long-term continuity, which necessitates more rigorous homogenization attention in subsequent applications. Brazil also displays a high spatial density of data, with most stations beginning temperature observations in the last decade. Substantial sites with at least 20 years of daily temperature data can be found in southern Canada, coastal Australia, Russia, and southern Asia. Although the Antarctic and Arctic regions are among the most challenging for meteorological observation globally, dozens of sites have commenced measurements in the current century.
The global daily data volume for Tmax, Tave, and Tmin has increased significantly over the last four decades. As shown in panels (b1), (b2), and (b3), the global daily data volume rose from approximately 3000 entries per day in the 1980s to around 10 000 entries per day in recent years.
It should be noted that the occasional sharp drops observed in the time series are real features of the raw data stream, corresponding to specific periods of severe disruption in global data transmission caused by operational instabilities (e.g., telecommunication outages) within the WMO Global Telecommunication System (GTS) and national exchange networks.
Furthermore, the quasi-periodic fluctuations (dips) observed in the early Tmin record (Fig. 7, panel b3) are artifacts of historical data scarcity in the underlying ISD archive. Our reaggregation algorithm is designed to primarily utilize explicitly reported extremes (Tmin-12 h/24 h), relying on high-frequency hourly observations as a secondary fallback. During these earlier years, the raw archive occasionally lacked both explicit extreme reports and sufficient sub-daily observations. When neither data source meets the necessary computational thresholds, valid daily Tmin values cannot be reconstructed, leading to temporary drops in the aggregated data volume.
4.3 Comparison of daily temperature with GSOD
Figure 13 presents the multi-decadal time series (1981–2024) of global daily temperature differences between GSOD and GLBD-FED. Calculated as the arithmetic mean across the strictly limited spatiotemporal intersection of the two datasets (i.e., only matched records present in both GSOD and GLBD-FED were included), the results demonstrate that GSOD exhibits a warmer daily Tmax (around +0.3 °C), a colder Tmin (around −0.3 °C), and nearly the same daily Tave (around +0.1 °C) relative to GLBD-FED throughout the entire period. This means that rapid, near-real-time extreme weather assessments and operational synoptic evaluations relying on legacy datasets like GSOD would systematically misrepresent the magnitude of extreme events – overestimating warm extremes and underestimating cold extremes – compared to methodologically uniform evaluations based on GLBD-FED.
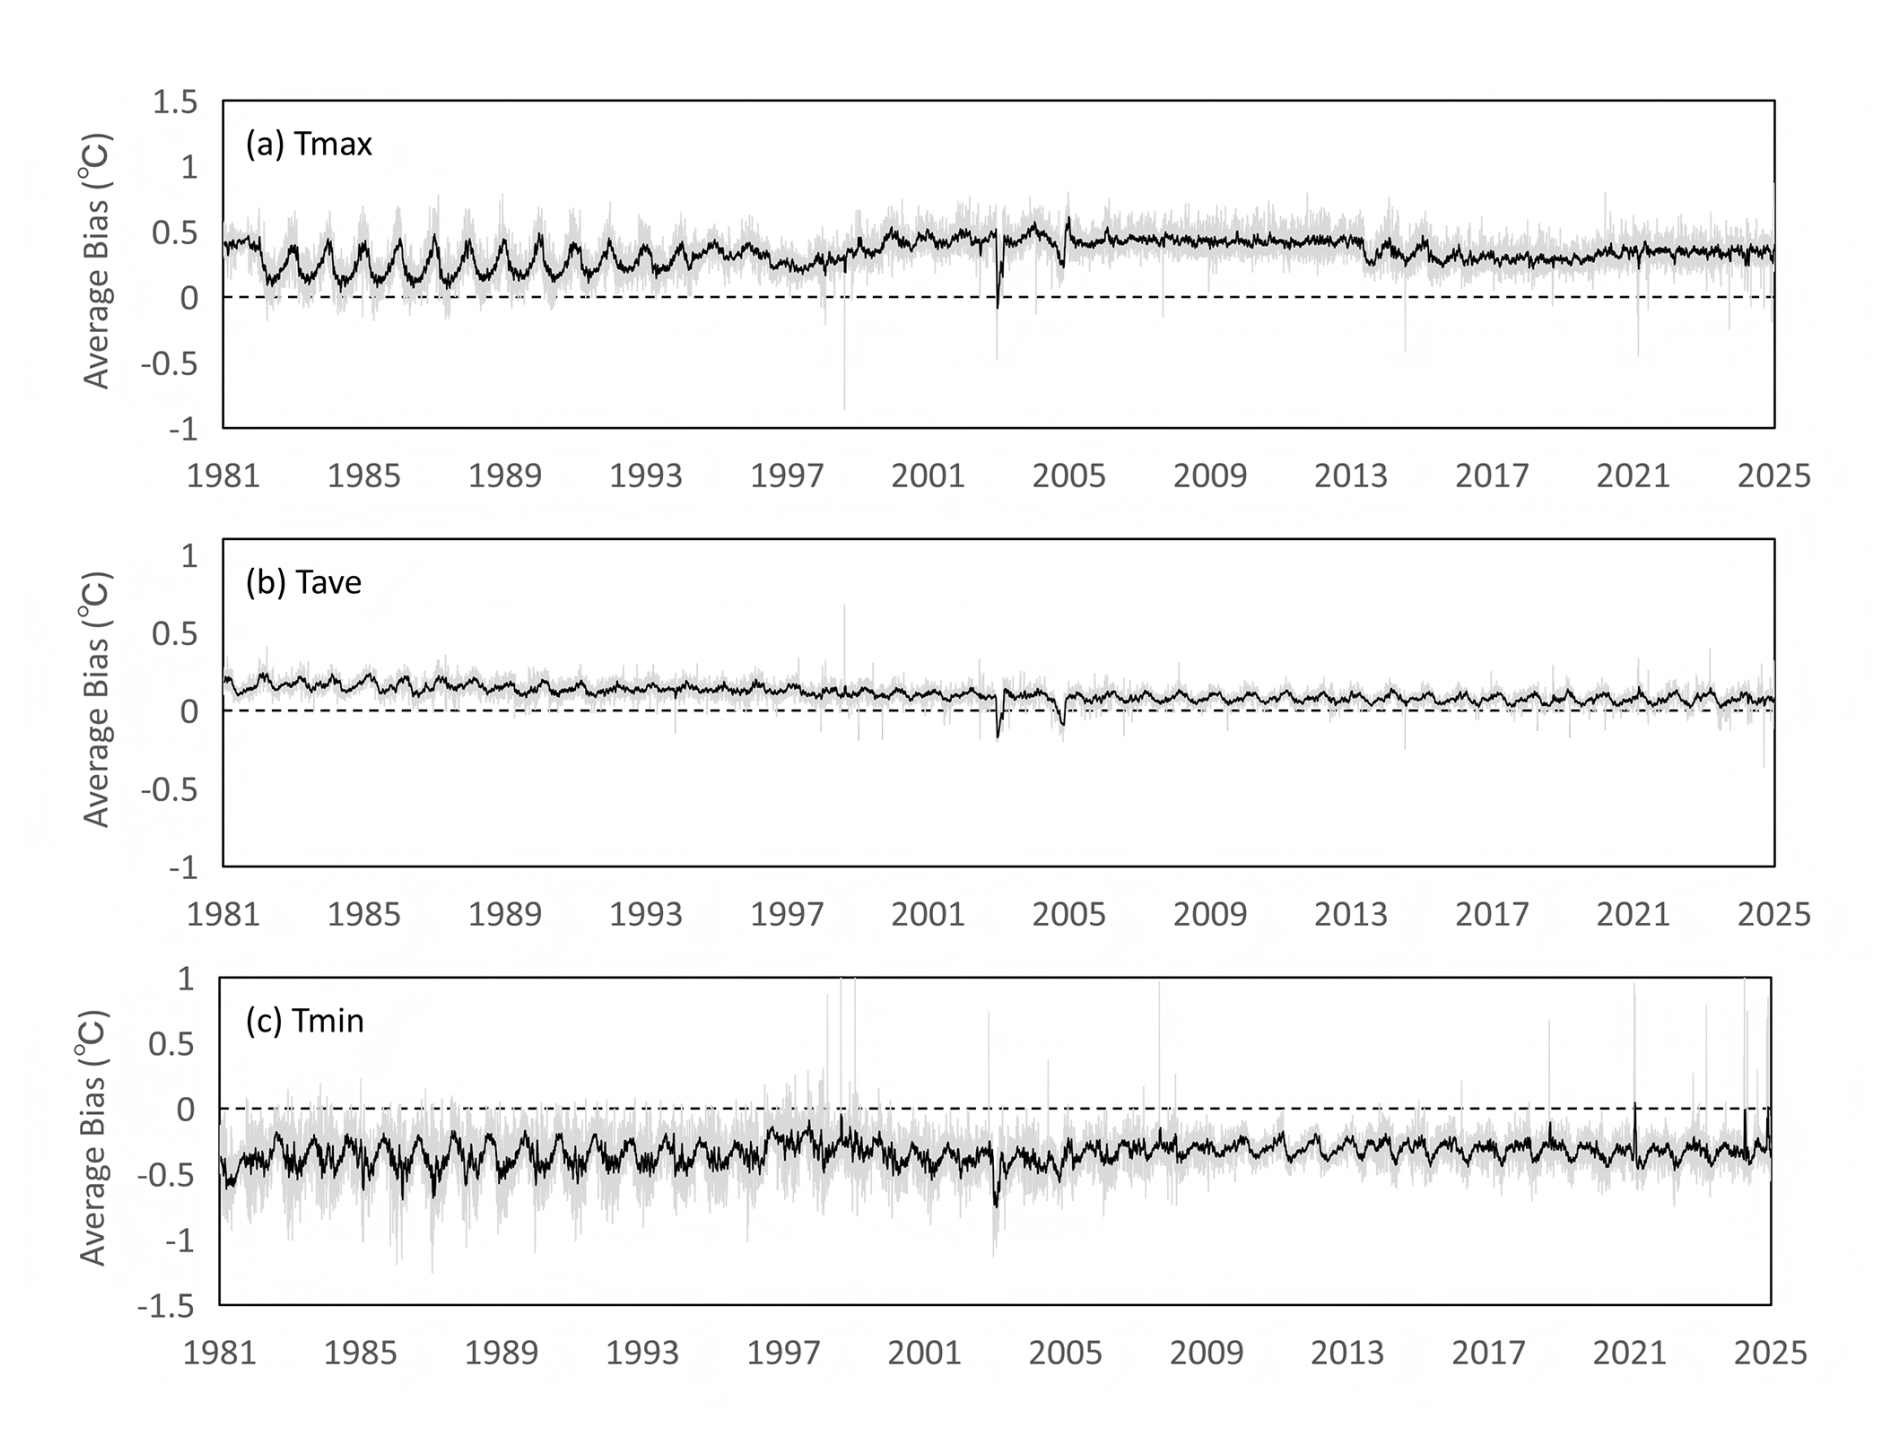
Figure 13The daily time series of average difference in global in-situ daily temperature between GLBD-FED and GSOD (1981–2024) (GSOD minus GLBD-FED). The gray and black lines are the daily and 15 points-smoothing results, respectively. Panel (a), (b), and (c) stand for the results of Tmax, Tave and Tmin, respectively.
A detailed examination of the multi-decadal time series (Fig. 8) reveals two notable temporal features: a pronounced seasonal cycle in the biases prior to 1990, and a long-term downward trend in the daily average temperature (Tave) bias (decreasing from approximately +0.25 °C in the 1980s to roughly +0.10 °C in the recent decade). Both features are intrinsically linked to historical data quality artifacts and algorithmic characteristics. In the early era, the seasonal cycle in the Tmax bias was largely driven by GSOD's processing of cold-season data from high-latitude regions. During boreal winters, raw observations in these environments were prone to anomalous positive spikes (unrealistic short-term jumps). GSOD's fallback extraction strategy misclassified these anomalous spikes as valid daily maximums, artificially inflating the winter Tmax and subsequently skewing the overall Tave upward. Simultaneously, the Tmin seasonality was driven by periodic variations in the volume of duplicated records within the GSOD archive. The long-term decreasing trend in the Tave bias reflects the progressive modernization of the global observing network. As automated weather stations and enhanced transmission protocols were widely deployed, the frequency of raw sensor noise dropped significantly. In contrast, GLBD-FED demonstrates higher stability throughout the 44-year period, as its rigorous temporal consistency checks successfully filtered out these anomalous spikes even during the early, noisier era.
Figure 14 illustrates the spatiotemporal heterogeneity of daily temperature discrepancies between GSOD and GLBD-FED from 1981 to 2024. The sites in GSOD with higher daily Tmax (≥0.5 °C) relative to GLBD-FED are primarily located in Southern Africa, Brazil, Argentina, Canada, and the western United States (panel a1), accounting for 21.4 % of all sites (approximately 17 000) (panel a2).
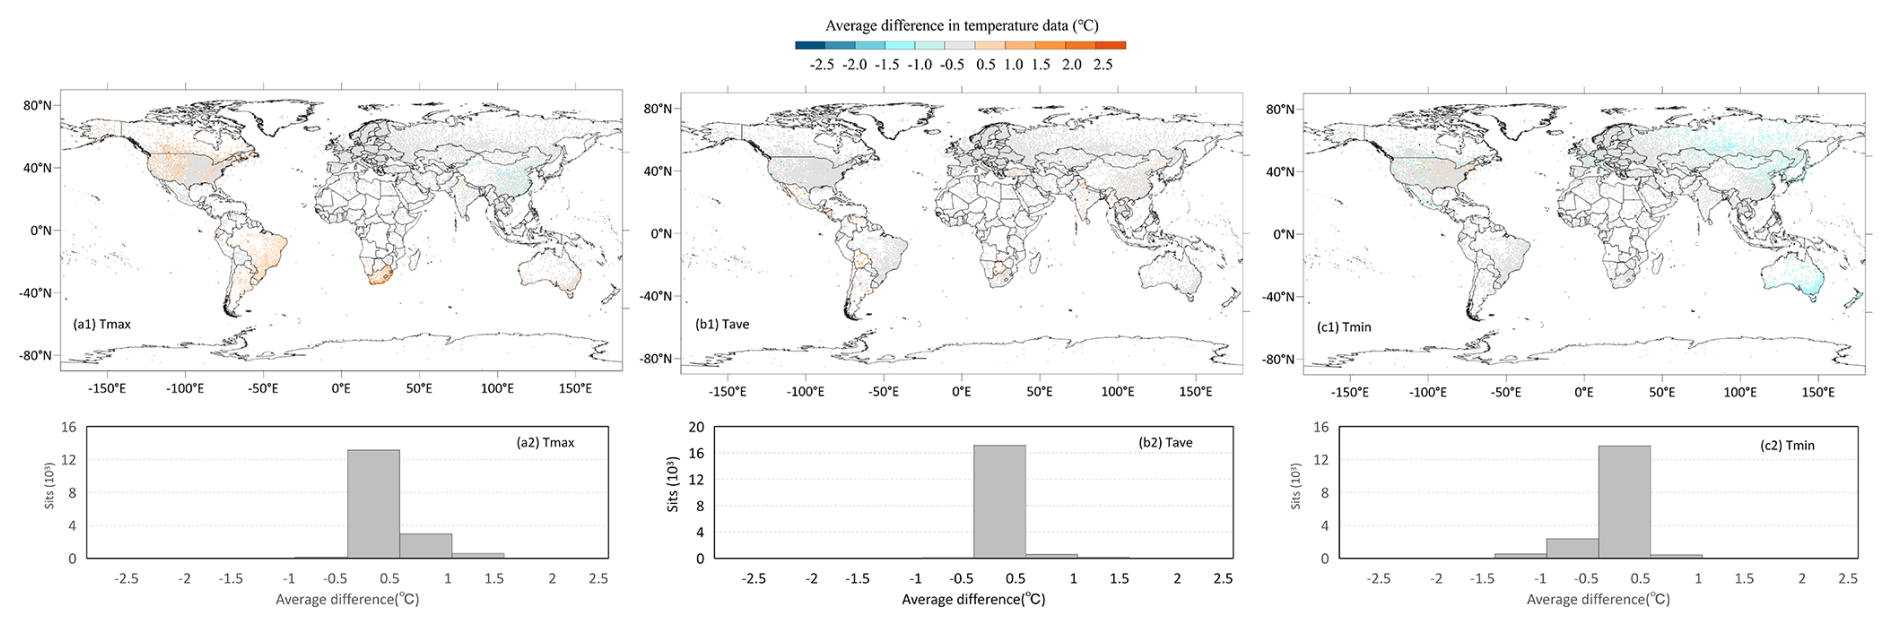
Figure 14Spatial distribution of the difference in in-situ daily temperature data between GLBD-FED and GSOD during 1981–2024 (GSOD minus GLBD-FED). Panels (a1), (b1), (c1) show the difference in Tmax, Tave and Tmin at each site. Panels (a2), (b2), (c2) represent the site number distribution with diversities.
Interestingly, GSOD shows lower Tmax values in China compared to GLBD-FED. This discrepancy arises from several types of reports labeled with the same ID in the ISD. The Metar and Synoptic reports in China are independent and measured at different sites. Metar temperature reports tend to be lower than Synoptic temperature reports since the latter are mostly recorded in urban areas. GSOD prioritized Metar reports as data sources, while GLBD-FED optimized Synoptic reports, leading to the observed negative bias in China.
Meanwhile, sites in GSOD with a lower daily Tmin ( °C) compared to GLBD-FED are predominantly concentrated in Australia, Russia, and Northeast Asia (panel c1), accounting for 17.4 % of all evaluated sites. For eastern Australia in particular, this regional bias is highly likely attributable to structural discrepancies between national reporting practices and global transmission standards. Specifically, the standard national observation time for Tmin in eastern Australia is 22:00 or 23:00 UTC (depending on the season), whereas international synoptic reports sometimes stamp these observations at 00:00 UTC. This temporal misalignment leads to Time of Observation Bias (TOB) causing double-counting or the shifting of minimum temperatures across the 00:00 UTC boundary in the legacy GSOD dataset. Daily Tave from GSOD and GLBD-FED exhibits much greater consistency compared to Tmax and Tmin (panel b1), with 95.3 % of sites maintaining differences within ±0.5 °C (panel b2).
4.4 The causes for the discrepancy in daily temperature data
GLBD-FED and GSOD employ different algorithms to produce daily temperature data, resulting in discrepancies in data properties and biases between the two datasets, particularly for Tmax and Tmin. Table 1 outlines three main differences in the key processes of daily Tmax and Tmin data production between GLBD-FED and GSOD.
Table 1The comparison of the key processes in daily Tmax/Tmin calculation between GBLD-FED and GSOD.
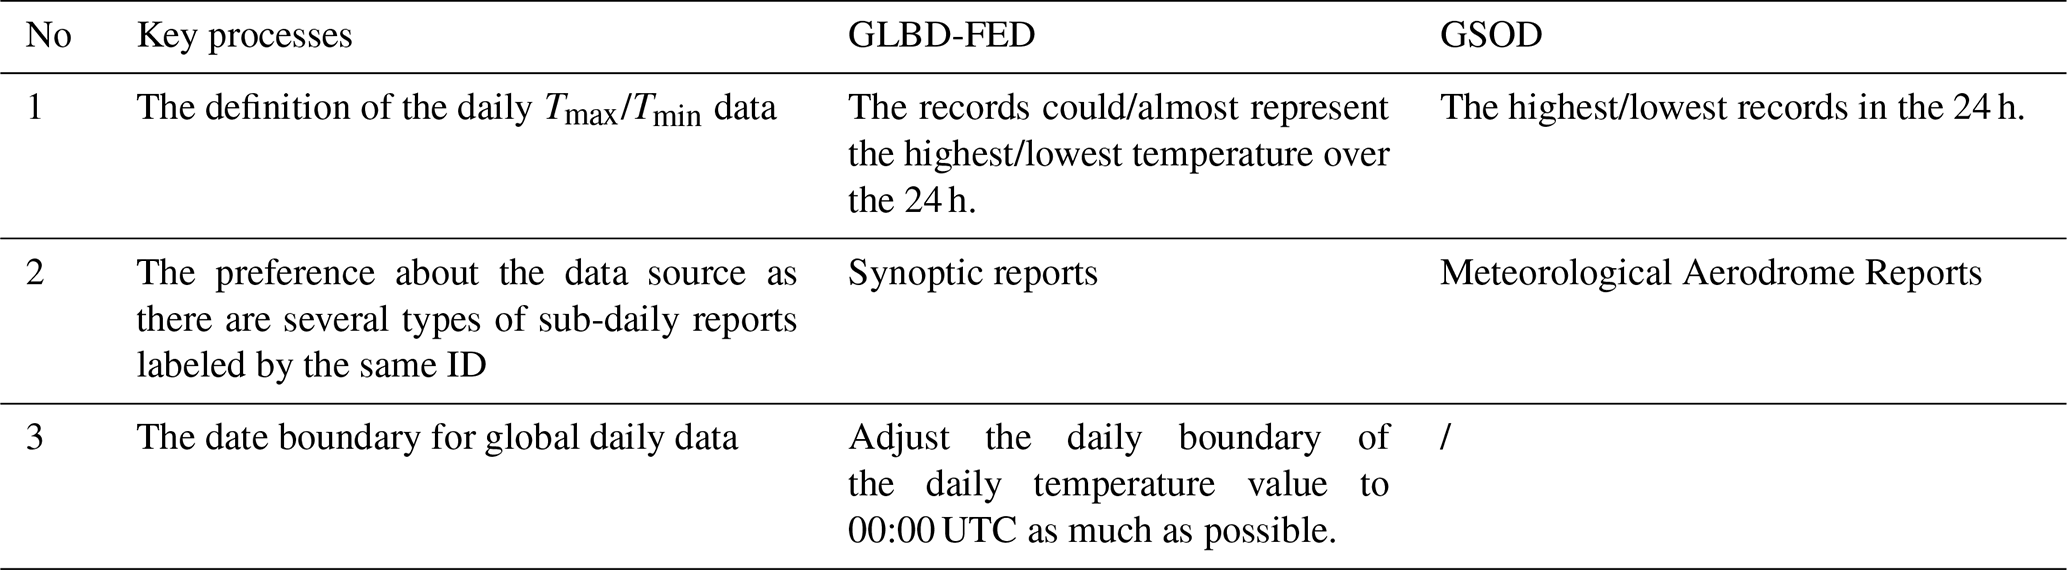
First, GLBD-FED and GSOD have distinct definitions for daily Tmax and Tmin data. GLBD-FED considers records that could or almost represent the highest or lowest temperature in a 24 h period as daily Tmax and Tmin, while GSOD selects the highest and lowest records within the 24 h.
Second, although both GLBD-FED and GSOD utilize sub-daily data shared globally through the Global Telecommunication System (GTS) as their data source, they apply this data differently. GLBD-FED prefers Synoptic reports over Meteorological Aerodrome (Metar) and other reports when multiple types of sub-daily reports share the same ID, whereas GSOD does the opposite.
Third, GLBD-FED makes efforts to adjust the daily temperature boundary to 00:00 UTC whenever possible, while GSOD retains the highest and lowest values as they appear within the 24 h period.
4.4.1 The influence of the daily data definition
GLBD-FED and GSOD employ different methodologies for identifying daily Tmax and Tmin values. GLBD-FED calculates daily extremes by realigning sub-daily records to their physical 24 h occurrence windows. In contrast, GSOD derives daily extremes using a hierarchical extraction approach – first selecting explicitly reported summaries, then falling back to discrete hourly observations – but attributes them based strictly on their UTC timestamps within the calendar day. This objective methodological difference is the primary driver of the systematic discrepancies observed between the two datasets. Consequently, in GSOD, a 24 h extreme report that physically summarizes the previous day (e.g., a Tmax-24 h reported at 03:00 UTC) is erroneously treated as the daily extreme for the current day simply because of its timestamp. Furthermore, the theoretical sampling bias of hourly data provides an important context: since deriving extremes from hourly data inherently underestimates Tmax, the fact that GSOD still exhibits a significant global warm bias relative to GLBD-FED proves that GSOD's overestimation is overwhelmingly driven by its methodological characteristics (UTC-boundary double-counting and inclusion of anomalous data spikes), rather than sampling limitations.
Figure 15 displays the variations in air temperature at the SINPO station (470460) in North Korea from 20 May to 23 May 2014. The hollow black dots represent hourly average air temperatures recorded at fixed observation times, while the red and yellow dots indicate the Tmin-12 h and Tmin-24 h values recorded at 00:00 and 21:00 UTC, respectively. The light blue curve in panel (a) and the dark blue curve in panel (b) denote the lower limits derived by GSOD and GLBD-FED data, respectively.
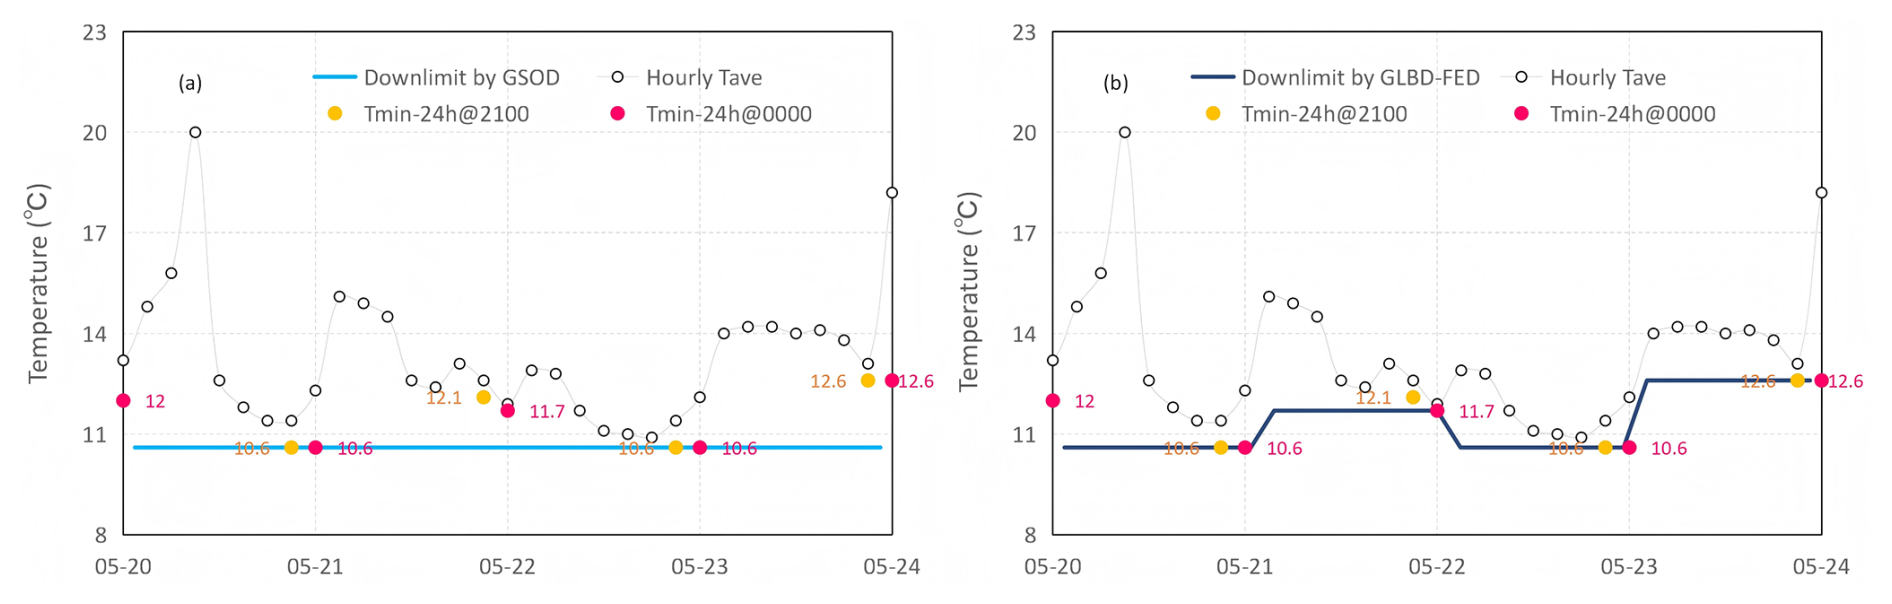
Figure 15The lower-bound estimate of air temperature derived from the daily Tmin values based on GSOD (light blue, panel a) and GLBD-FED (dark blue, panel b) at the SINPO station (470460), North Korea, 20–23 May 2014.
In the GSOD dataset (panel a), the daily Tmin value for the SINPO station was recorded as 10.6 °C for four consecutive days. This occurred because the Tmin-24 h recorded at 00:00 UTC on 21 May, which was the lowest value during the period from 21 May to 22 May, was treated as the daily Tmin for both 21 May and 22 May. As a result, the derived daily Tmin values for 21 May and 23 May are evidently underestimated and duplicated.
Figure 16 presents a comparison of daily Tmax values at the Plettenberg Bay station in South Africa (689310-99999). The abscissa and ordinate represent the daily values from the GLBD-FED and GSOD datasets, respectively. The mean difference between the two sets of daily Tmax values is 1.3 °C, indicating a mathematically higher overall daily Tmax in GSOD relative to GLBD-FED at this site. To thoroughly investigate the underlying cause, we categorized the data points into two groups based on the presence of consecutive identical values in GSOD (Fig. 16). The black points (non-repeated values) predominantly fall along the 1:1 line, indicating zero or negligible difference on days without double-counting. However, approximately one-third of the Tmax daily values from GSOD this year were potential duplicated records (86 points, red dots), showing a positive mean difference of about 3.2 °C relative to GLBD-FED. For context, an analysis of the GLBD-FED dataset for the same station and period reveals only 2 instances of consecutive identical values. Excluding the red points results in a roughly 70 % reduction in the overall mean bias, decreasing it to 0.4 °C. It is important to note that some repeated GSOD values (red points) lie exactly on the 1:1 line; these represent physically plausible weather conditions where the actual maximum temperature remained identical across consecutive days. Additionally, there are scattered points where GLBD-FED reports higher Tmax values than GSOD, typically when GLBD-FED's physical 24 h window captures an extreme temperature event that is otherwise split across the UTC boundary in GSOD.
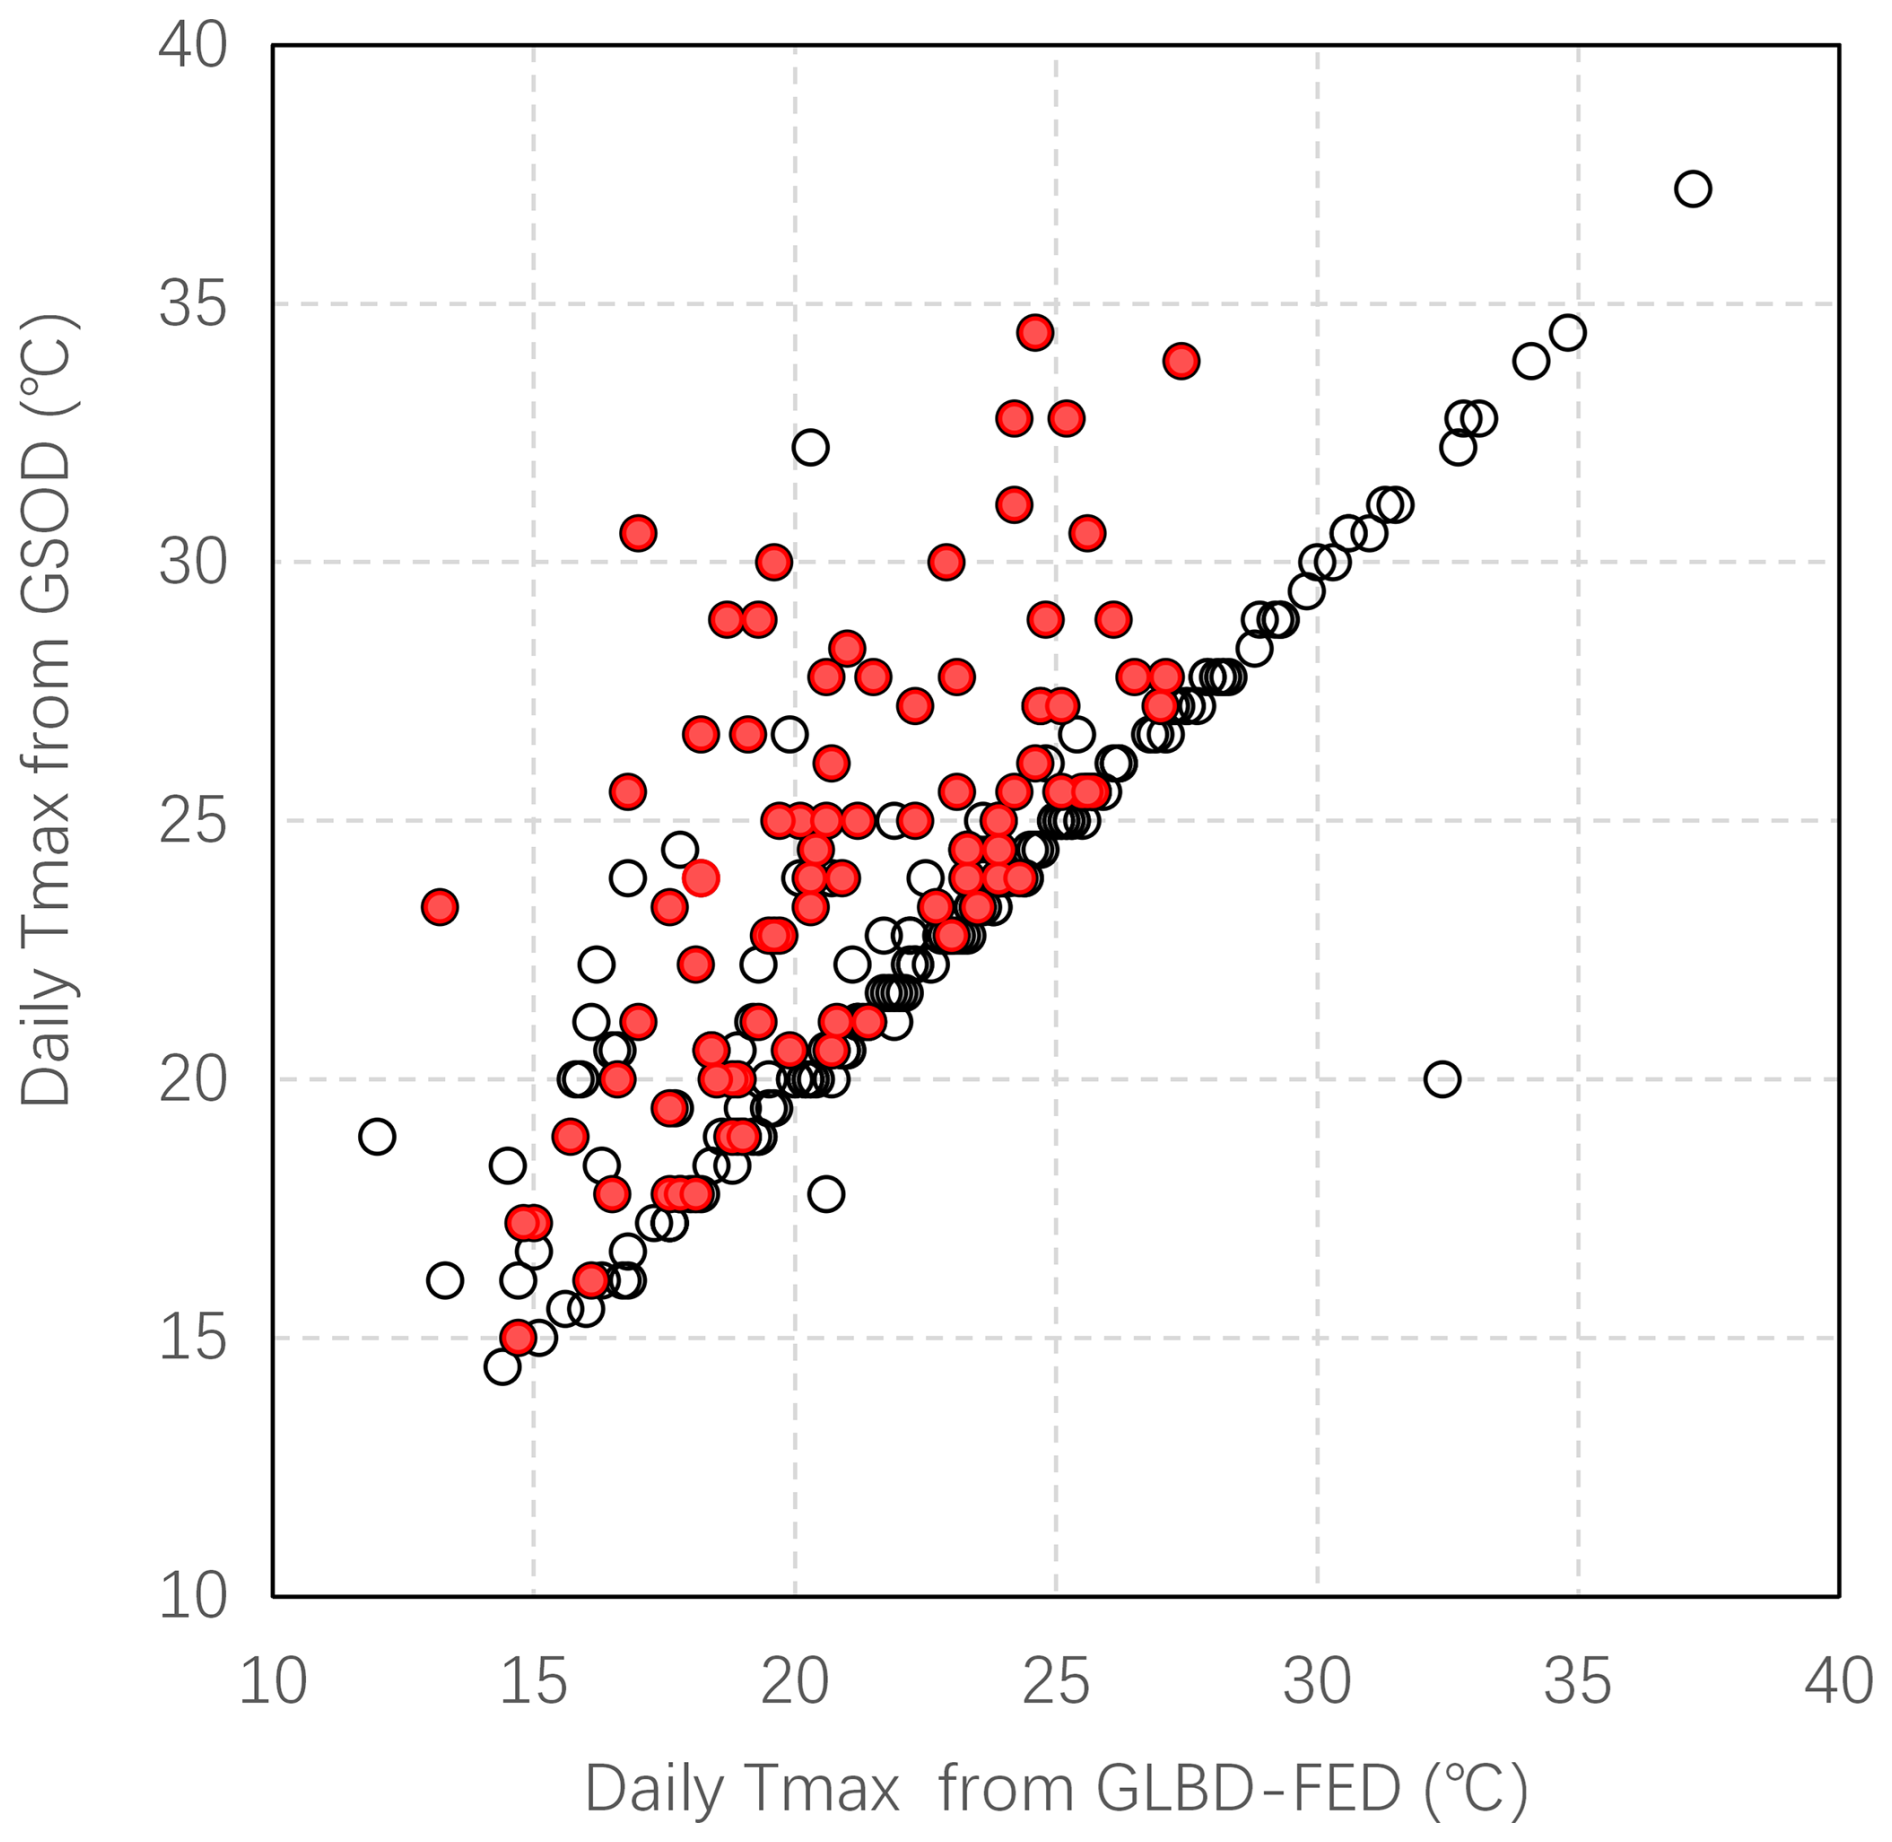
Figure 16A comparison of daily Tmax values at the Plettenberg Bay station (689310-99999), South Africa, for the year 2024. The abscissa and ordinate represent the daily values from the GLBD-FED and GSOD datasets, respectively. The red solid dots indicate the data that are repeated with their previous ones (86 points), while the black hollow dots represent non-repeating values (172 points).
Furthermore, we investigated the extent of likely duplicated daily Tmax and Tmin records in the GSOD dataset from 1981 to 2024 (identified as identical values derived using the same calculation method on two consecutive days). Our analysis identified approximately 18 million cases (averaging ∼1100 occurrences per day) of likely duplicated Tmax records and 11 million cases (∼670 occurrences per day) of likely duplicated Tmin records. When compared against the GLBD-FED, these potential duplicates introduced an average bias of 0.28 and −0.85 °C, respectively. This indicates that the double-counting issue in legacy datasets systematically results in artificially warmer maximum temperatures and colder minimum temperatures.
4.4.2 The influence of the choice of data source
There are several types of sub-daily reports labeled with the same ID in the ISD, and these reports are not always measured at the same location. Both GLBD-FED and GSOD treat these reports independently based on their types, but they have different preferences. GLBD-FED prioritizes synoptic reports over Metar reports as data sources, whereas GSOD does the opposite. This prioritization in GLBD-FED is driven by the goal of maximizing global dataset uniformity. Synoptic observations are strictly coordinated by the WMO and adhere to standardized global reporting protocols designed specifically for meteorological purposes. In contrast, while METAR (aviation) reports are abundant in specific regions such as the United States, their global distribution is highly uneven. Therefore, for a universal global dataset, prioritizing WMO-standardized Synoptic reports ensures greater spatial and temporal homogeneity across different countries than relying on aviation-focused METAR data.
Table 2 presents a case study for Ulan Bator, Mongolia, where two types of sub-daily reports labeled as 442920-99999 originate from different sites in the ISD. Figure 17 provides a targeted sensitivity analysis for Ulan Bator. Panel (a) displays the standard GLBD-FED daily Tmin calculated using our default preference for Synoptic reports, while panel (b) shows the results when the algorithm is specifically forced to utilize only METAR reports from the same station ID. GSOD shows significantly lower daily Tmin values for Ulan Bator compared to GLBD-FED (Synoptic reports), with an average bias of −4.5 °C. The results in panel (b) nearly overlap with the GSOD data, indicating that the direct aggregation of airport-based METAR reports is a primary contributor to the significantly lower daily Tmin values recorded in GSOD for this identical station identifier.

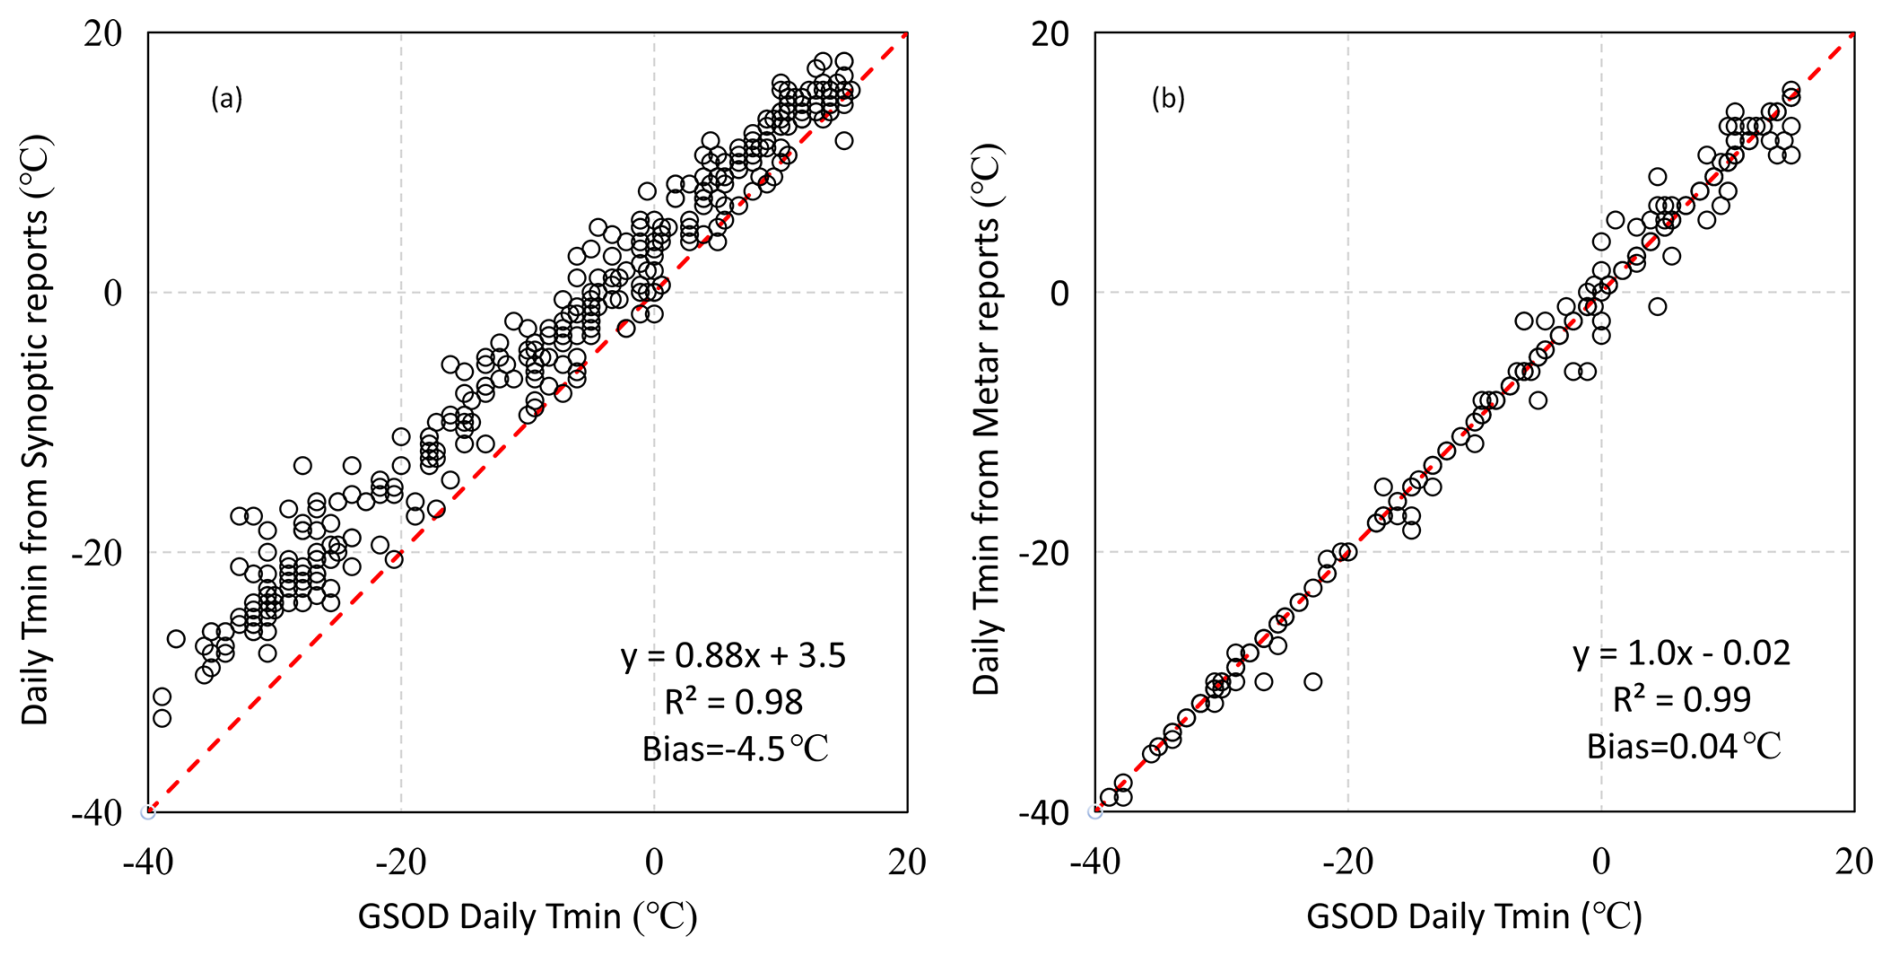
Figure 17Comparison of daily Tmin at Ulan Bator, Mongolia (442920-99999) between GLBD-FED and GSOD in 2024. Panel (a) compares the default GLBD-FED output (prioritizing Synoptic reports) with GSOD, while panel (b) shows a special comparison using GLBD-FED results derived exclusively from METAR reports.
4.4.3 The influence of the date boundary treatment
The systematic discrepancies identified in Fig. 8 originate from methodological divergences between GLBD-FED and GSOD, specifically in their temporal alignment frameworks. Figure 18a illustrates this mechanism through a case study at the Villa Reynolds station in Argentina (873280-99999; 31.96° S, 65.13° W), where GSOD exhibits a systematic Tmax warm bias of +1.6 °C relative to GLBD-FED. This deviation occurs because GSOD attributes maximum temperatures to calendar days using the 12:00 UTC Tmax-24 h (09:00 local time), in contrast to GLBD-FED's UTC-aligned approach, which reconstructs diurnal extremes by integrating next-day 12:00 UTC observations with contemporaneous measurements. Temporal recalibration experiments (Fig. 18b) effectively mitigate this discrepancy, achieving inter-dataset convergence at 0.1 °C with improved correlation (R2=0.99 compared to the original R2=0.87).
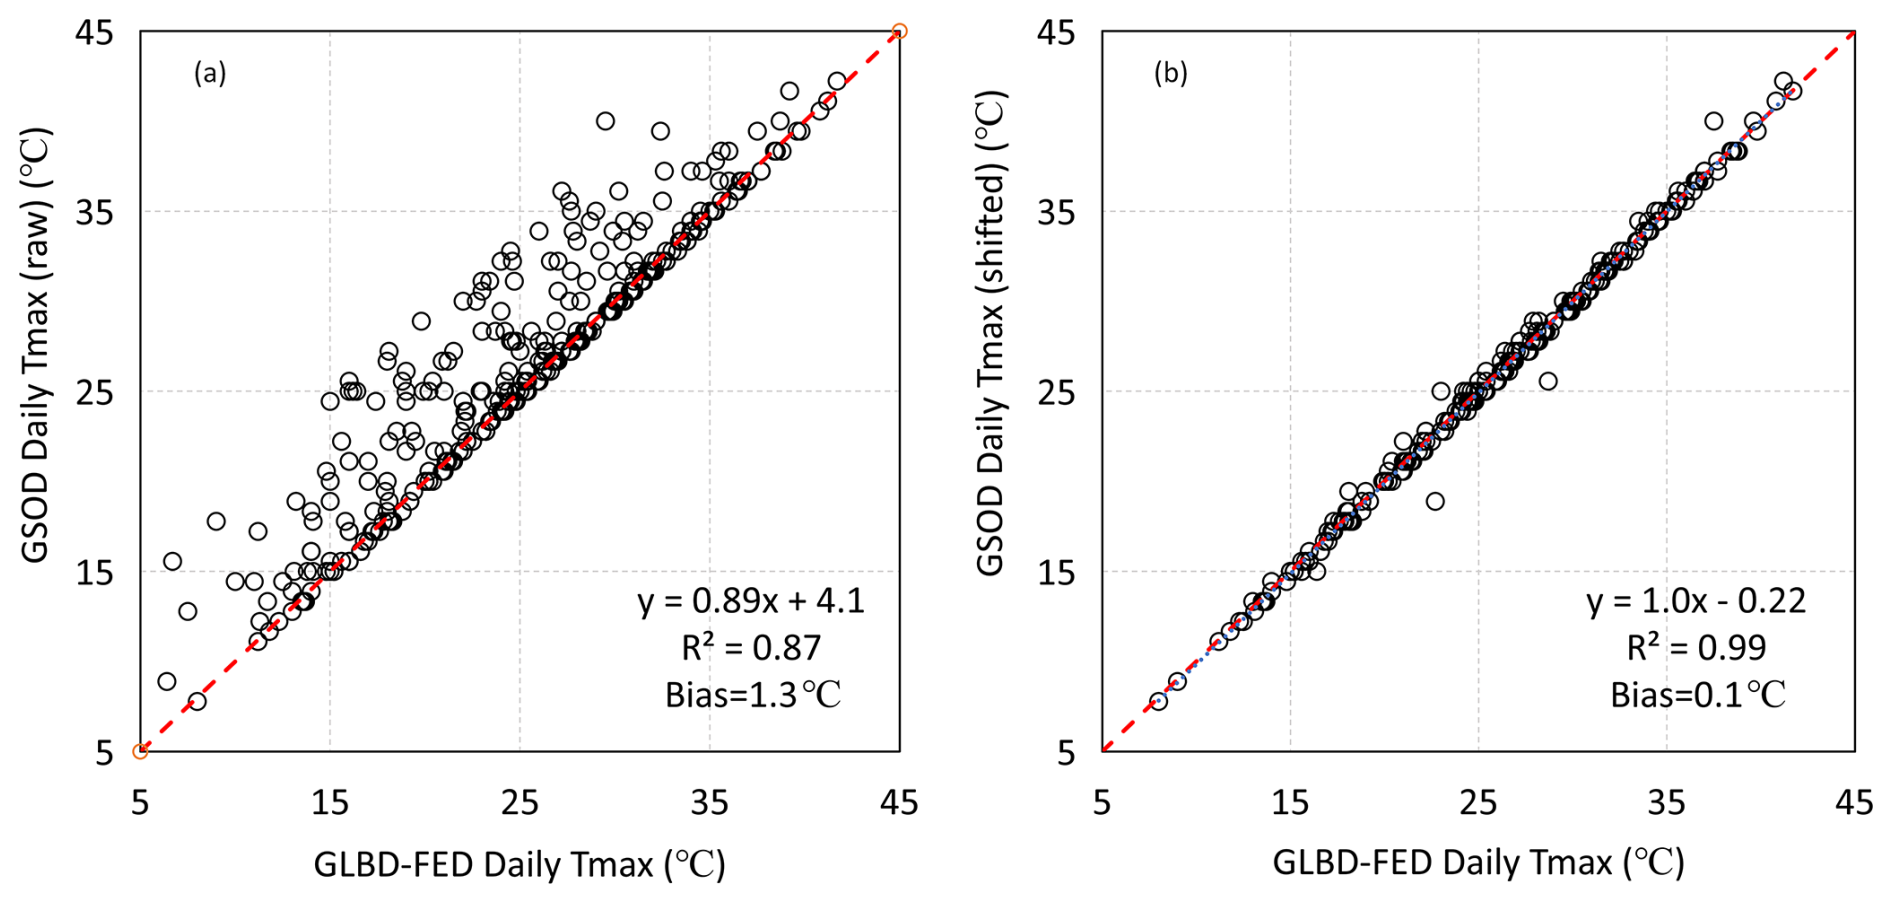
Figure 18The comparison of daily Tmax at Villa Reynolds Argentina (873280-99999) between GLBD-FED and GSOD in 2022. Panel (a) is the comparison between GLBD-FED and original GSOD data, while panel (b) is the comparison between GLBD-FED and date shifted (forward moving) GSOD data.
The global in-situ temperature daily data are publicly available at https://zenodo.org/records/17895292 (Yang et al., 2025).
This study develops GLBD-FED, a global in situ daily temperature dataset encompassing maximum (Tmax), average (Tave), and minimum (Tmin) temperatures, constructed using quasi-real-time sub-daily observations from ISD. The main results of this study show that:
-
To produce a global daily dataset representing maximum, minimum, and average temperatures over a rigorously defined 24 h period (i.e., the standard 00:00–24:00 UTC day), we developed a new algorithm that decomposes sub-daily Tmax and Tmin records into finer intervals and then reaggregates them into daily extremes under physical 24 h calculation windows. Compared to the conventional calculation method (which relied on either two consecutive Tmax/Tmin records over 12 h or one Tmax/Tmin record over 24 h), the new algorithm significantly increased the data counts of valid daily Tmax and Tmin records by 64 % and 45 %, respectively. A correction for misrecorded Tmax and Tmin records was also implemented.
-
GLBD-FED includes Tmax, Tave, and Tmin data from approximately 17 000 global sites covering the period from 1981 to 2024. The daily temperature volume of GLBD-FED increased from 3000 records per day in the 1980s to 10 000 records per day in the 2020s. America and Asia show high spatial densities of daily temperature data, especially in recent years. In comparison to GSOD, Tmax and Tmin from GLBD-FED exhibit less extreme daily values, with slightly lower daily Tmax (approximately −0.30 °C) and higher daily Tmin (approximately +0.30 °C), resulting in nearly the same daily Tave (around +0.10 °C). These differences are primarily attributed to multiple sources, including the diversity in daily data definitions, the choice of data sources, and date boundary treatment methods.
A1 The spatial distribution of percentage of mis-recording Tmax and Tmin data
Figure A1 illustrates the spatial distribution of the percentage of mis-recorded Tmax and Tmin data from 1981 to 2024 (mentioned in Sect. 4.1). These anomalies are distributed across multiple regions globally, with notable concentrations in Western Europe and South Africa. The primary cause of these errors is the frequent misclassification of high-frequency Tmax reports (e.g., 1 h interval summaries) as 24 h extreme values, an artifact that is particularly prevalent across Europe.
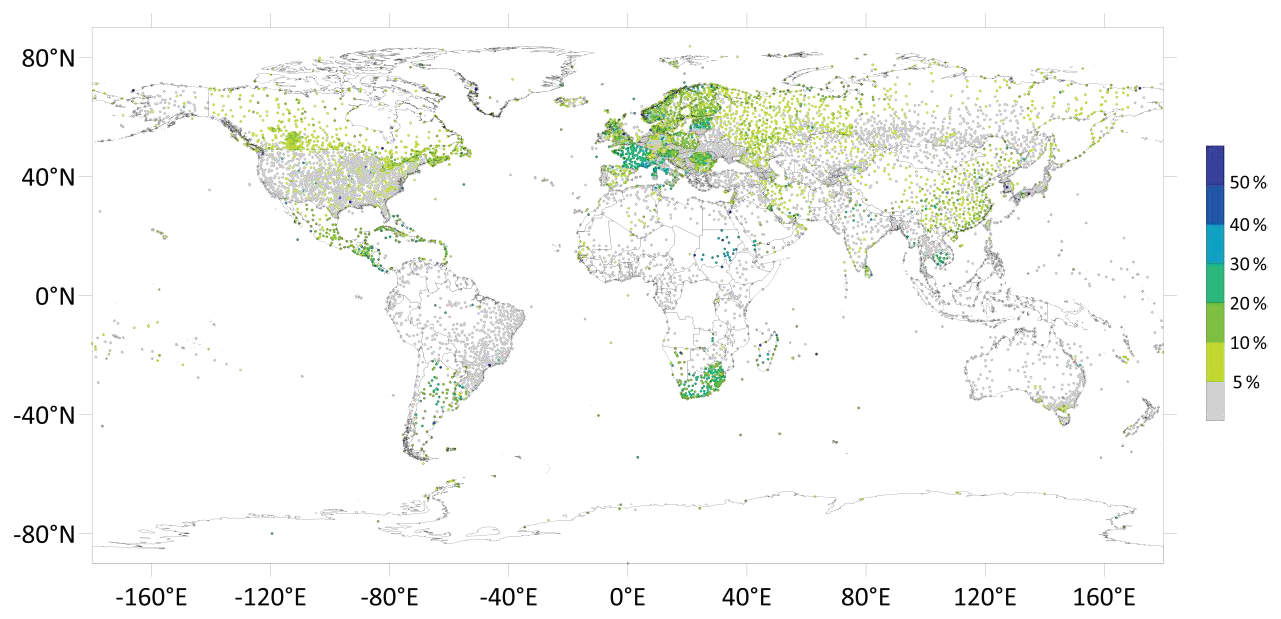
Figure A1The spatial distribution of percentage of mis-recording Tmax and Tmin data from 1981 to 2024.
A2 Formulae used for Daily Data Quality Data Quality Tests
Spike test
This test identifies anomalous daily temperature values that exceed predefined absolute physical boundaries or historical climatological limits for a specific station. Where the subscript i stands for the measurement on the ith day; xupper limit/xlower limit is the upper/lower threshold value for the record and is the smaller/higher value between , where represents the subset of the historic measurements in the month (January, February,…,December) which removes the smallest and largest 1 % of values.
Inner consistency test
This test verifies the basic logical relationship among the three daily temperature variables. It ensures that the daily maximum temperature is greater than or equal to the daily average temperature, which in turn must be greater than or equal to the daily minimum temperature. Where Tmax, Tave, Tmin stand for the daily Tmax, Tave, Tmin data.
Temporal consistency test
This test detects daily records that deviate excessively from the historical statistical distribution of a given station, evaluated using the median and standard deviation. Where the μ and σ are the median value and standard deviation of , respectively.
Spatial consistency test
This test identifies records that exhibit significant discrepancies when compared to concurrent observations from neighboring stations within the same region. Where the subscript j stands for the jth neighbouring site (within the 100 km radius around the candidate site) and n is the total number of neighbouring sites.
Repeat test
This test identifies instances where identical temperature values are recorded consecutively over a specified number of days. Where Ts and Ta are the standard deviation and smoothing average of 3 d measurements, respectively.
where σ and μ are the standard deviation and smoothing average of 3 d measurements, respectively.
SY designed and carried out the study, performed the analyses, and drafted the manuscript. PMZ and XBZ contributed to the development of the manuscript framework, provided scientific guidance throughout the research process, and critically reviewed and revised the manuscript. HJ and FY contributed to the preprocessing of the data source and the automated data production processes, respectively. ZJZ reviewed and edited the manuscript.
The contact author has declared that none of the authors has any competing interests.
Publisher's note: Copernicus Publications remains neutral with regard to jurisdictional claims made in the text, published maps, institutional affiliations, or any other geographical representation in this paper. The authors bear the ultimate responsibility for providing appropriate place names. Views expressed in the text are those of the authors and do not necessarily reflect the views of the publisher.
We extend our sincere gratitude to the NOAA National Centers for Environmental Information (NCEI) for their long-term dedication to compiling and publicly sharing the legacy Integrated Surface Database (ISD), as well as their ongoing efforts in developing its successor, the Global Historical Climatology Network hourly (GHCNh) framework, which provided the foundational data making this research possible. The authors also would like to express their sincere gratitude to the three reviewers for their highly constructive comments and rigorous evaluation, which significantly improved the quality and clarity of this manuscript. We also extend our deep appreciation to the Topic Editor and the Chief Editor of Earth SystemScience Data for their efficient handling of the manuscript and their valuable guidance throughout the peer-review process.
This work is supported by the National Natural Science Foundation of China (grant no. 42475152), the Joint Research Project for Meteorological Capacity Improvement (grant no. 24NLTSZ005) and the Innovation and Development Project of China Meteorological Administration (grant no. CXFZ2026QA11).
This paper was edited by Martin Wild and reviewed by Robert Dunn and two anonymous referees.
Alexander, L. V., Zhang, X., Peterson, T. C., Caesar, J., Gleason, B., Klein Tank, A. M. G., Haylock, M., Collins, D., Trewin, B., Rahimzadeh, F., Tagipour, A., Rupa Kumar, K., Revadekar, J., Griffiths, G., Vincent, L., Stephenson, D. B., Burn, J., Aguilar, E., Brunet, M., Taylor, M., New, M., Zhai, P., Rusticucci, M., and Vazquez-Aguirre, J. L.: Global observed changes in daily climate extremes of temperature and precipitation, J. Geophys. Res.-Atmos., 111, D05109, https://doi.org/10.1029/2005JD006290, 2006.
Beck, H. E., Wood, E. F., Pan, M., Fisher, C. K., Miralles, D. G., van Dijk, A. I. J. M., McVicar, T. R., and Adler, R. F.: MSWEP V2 global 3-hourly 0.1° precipitation: Methodology and quantitative assessment, Bull. Am. Meteorol. Soc., 100, 473–500, https://doi.org/10.1175/BAMS-D-17-0138.1, 2019.
Becker, A., Finger, P., Meyer-Christoffer, A., Rudolf, B., Schamm, K., Schneider, U., and Ziese, M.: A description of the global land-surface precipitation data products of the Global Precipitation Climatology Centre with sample applications including centennial (trend) analysis from 1901–present, Earth Syst. Sci. Data, 5, 71–99, https://doi.org/10.5194/essd-5-71-2013, 2013.
Caesar, J., Alexander, L., and Vose, R.: Large-scale changes in observed daily maximum and minimum temperatures: Creation and analysis of a new gridded data set, J. Geophys. Res.-Atmos., 111, D05101, https://doi.org/10.1029/2005JD006280, 2006.
Donat, M. G., Alexander, L. V., Yang, H., Durre, I., Vose, R. S., Dunn, R. J. H., Willett, K. M., Aguilar, E., Brunet, M., Caesar, J., Hewitt, B., Klein Tank, A. M. G., Kruger, A. C., Marengo, J., Peterson, T. C., Renom, M., Oria Rojas, C., Rusticucci, M., Salinger, J., Elrayah, A. S., Sekele, S. S., Srivastava, A. K., Trewin, B., Villarroel, C., Vincent, L. A., Zhai, P., Zhang, X., and Kitching, S.: Updated analyses of temperature and precipitation extreme indices since the beginning of the twentieth century: The HadEX2 dataset, J. Geophys. Res.-Atmos., 118, 2098–2118, https://doi.org/10.1002/jgrd.50150, 2013.
Dunn, R. J. H., Alexander, L. V., Donat, M. G., Zhang, X., Bador, M., Herold, N., Lippmann, T., Allan, R., Aguilar, E., Barry, A. A., Brunet, M., Caesar, J., Chagnaud, G., Cheng, V., Cui, G., Enola, A. K., Gerst, B., Hasan, J., Huai, T., Ibadullah, V. R., Iqbal, W., Jones, P. D., Karlsson, E., Kitching, S., Kruger, A. C., Lester, E., Mhando, L. Z., McGree, S., Morice, C. P., Nying'uro, P. A., Oria Rojas, C., Rennie, J., Rusticucci, M., Salinger, J., Sanley, L., Silva, A., Srivastava, A. K., Trewin, B., Viale, M., Villarroel, C., Vincent, L. A., Wei, L., and Yin, H.: Development of an updated global land in situ-based data set of temperature and precipitation extremes: HadEX3, J. Geophys. Res.-Atmos., 125, e2019JD032263, https://doi.org/10.1029/2019JD032263, 2020.
Durre, I., Menne, M. J., Gleason, C. E., Houston, T. G., and Vose, R. S.: Comprehensive automated quality assurance of daily surface observations, J. Appl. Meteorol. Climatol., 49, 1615–1633, https://doi.org/10.1175/2010JAMC2375.1, 2010.
Haiden, T., Janousek, M., Bidlot, J., Buizza, R., Ferranti, L., Prates, F., and Vitart, F.: Evaluation of ECMWF forecasts, including the 2018 upgrade, ECMWF Technical Memorandum No. 831, ECMWF, Reading, UK, https://doi.org/10.21957/b8g71b69, 2018.
IPCC: Climate Change 2021: The Physical Science Basis. Contribution of Working Group I to the Sixth Assessment Report of the Intergovernmental Panel on Climate Change, edited by: Masson-Delmotte, V., Zhai, P., Pirani, A., Connors, S. L., Péan, C., Berger, S., Caud, N., Chen, Y., Goldfarb, L., Gomis, M. I., Huang, M., Leitzell, K., Lonnoy, E., Matthews, J. B. R., Maycock, T. K., Waterfield, T., Yelekçi, O., Yu, R., and Zhou, B., Cambridge University Press, Cambridge, United Kingdom and New York, NY, USA, 2391 pp., https://doi.org/10.1017/9781009157896, 2021.
Karl, T. R., Williams Jr, C. N., Young, P. J., and Wendland, W. M.: A model to estimate the time of observation bias associated with monthly mean maximum, minimum and mean temperatures for the United States, J. Clim. Appl. Meteorol., 25, 145–160, https://doi.org/10.1175/1520-0450(1986)025<0145:AMTETT>2.0.CO;2, 1986.
Lott, N.: The quality control of the Integrated Surface Database (ISD), in: Preprints, 84th AMS Annual Meeting, American Meteorological Society, Seattle, WA, USA, 1–7, https://ams.confex.com/ams/84Annual/webprogram/Paper71929.html (last access: 30 July 2026), 2004.
Menne, M. J., Durre, I., Vose, R. S., Gleason, B. E., and Houston, T. G.: An overview of the Global Historical Climatology Network-Daily Database, J. Atmos. Ocean. Technol., 29, 897–910, https://doi.org/10.1175/JTECH-D-11-00103.1, 2012.
NOAA NCEI: Global Surface Summary of the Day – GSOD, Version 1.0, NOAA National Centers for Environmental Information [data set], https://www.ncei.noaa.gov/access/metadata/landing-page/bin/iso?id=gov.noaa.ncdc:C00516 (last access: 30 July 2026), 1999.
Rohde, R., Muller, R. A., Jacobsen, R., Muller, E., Perlmutter, S., Rosenfeld, A., Wurtele, J., Groom, D., and Wickham, C.: A new estimate of the average Earth surface land temperature spanning 1753 to 2011, Geoinfor. Geostat. An Overview, 1, 1000101, https://doi.org/10.4172/2327-4581.1000101, 2013.
Smith, A., Lott, N., and Vose, R.: The Integrated Surface Database: Recent developments and partnerships, Bull. Am. Meteorol. Soc., 92, 704–708, https://doi.org/10.1175/2011BAMS3015.1, 2011.
Trewin, B.: Exposure, instrumentation, and observing practice effects on land temperature measurements, Wiley Interdiscip. Rev.: Clim. Change, 1, 490–506, https://doi.org/10.1002/wcc.46, 2010.
World Meteorological Organization (WMO): Guide to Climatological Practices, WMO-No. 100, World Meteorological Organization, Geneva, Switzerland, https://library.wmo.int/idurl/4/60113 (last access: 30 July 2026), 2011.
World Meteorological Organization (WMO): Manual on Codes – International Codes, Volume I.1, Part A – Alphanumeric Codes, WMO-No. 306, World Meteorological Organization, Geneva, Switzerland, https://library.wmo.int/idurl/4/35713 (last access: 30 July 2026), 2015.
World Meteorological Organization (WMO): Manual on the Global Observing System, WMO-No. 544, World Meteorological Organization, Geneva, Switzerland, https://library.wmo.int/idurl/4/58672 (last access: 30 July 2026), 2017.
World Meteorological Organization (WMO): Guide to Instruments and Methods of Observation, WMO-No. 8, World Meteorological Organization, Geneva, Switzerland, https://library.wmo.int/idurl/4/68695 (last access: 30 July 2026), 2018.
Yang, S., Jones, P. D., Jiang, H., and Zhou, Z.: Development of a near-real-time global in situ daily precipitation dataset for 0000–0000 UTC, Int. J. Climatol., 40, 2795–2810, https://doi.org/10.1002/joc.6367, 2020.
Yang, S., Zhai, P., Zhang, X., and Zhou, Z.: Development of a global in-situ daily temperature dataset preferentially for 0000–2400 UTC from 1981–2024, Zenodo [data set], https://doi.org/10.5281/zenodo.17895292, 2025.
Zhang, X., Alexander, L., Hegerl, G. C., Jones, P., Klein Tank, A. M. G., Peterson, T. C., Trewin, B., and Zwiers, F. W.: Indices for monitoring changes in extremes based on daily temperature and precipitation data, Wiley Interdiscip. Rev.: Clim. Change, 2, 851–870, https://doi.org/10.1002/wcc.147, 2011.