the Creative Commons Attribution 4.0 License.
the Creative Commons Attribution 4.0 License.
 | 31 Jul 2026
Atmospheric and cryospheric observations in the high-altitude Zarafshon River Basin and the Hydrographic Party Glacier (GGP), Tajikistan, 2018–2025
Jonas Svensson
Ramazon Rakhmonov
Kamoliddin Nazirzoda
Abdusamad Hojiev
Tamlikho Jurabekov
Amirsho Hiyoev
Davlatjon Rahimzoda
Hizbullo Kholzoda
Muzaffar Shodmonov
David Brus
Krista Luoma
Adriano Lemos
Germán Perez Fogwill
Meri M. Ruppel
Outi Meinander
Johan Ström
Eija Asmi
Antti Hyvärinen
Central Asia is a region with high-altitude mountains, hosting numerous glaciers and widespread seasonal snow cover, both of which play an integral role in the regional hydrological cycle. Despite their importance, observations of cryospheric and atmospheric variables are scarce in this area but are essential to assess the temporal and spatial changes induced by climate change. To address this gap, we present a diverse data set of cryospheric and atmospheric variables from the Zarafshon River Basin and the Hydrographic Party Glacier (GGP) in Tajikistan, spanning 2018–2025. The dataset includes glacier terminus positions and snow conditions, glacier ablation, high resolution aerial photography, meteorological variables, surface reflectance combined with snow chemistry, and atmospheric aerosol concentrations. These observations provide a valuable basis for research on glacier dynamics, snow processes, and atmosphere-cryosphere interactions in a region where monitoring has been sparse. The data are available at the Finnish Meteorological Institute data repository METIS: https://doi.org/10.57707/fmi-b2share.t4vwg-gf542 (Svensson et al., 2026).
- Article
(6258 KB) - Full-text XML
-
Supplement
(851 KB) - BibTeX
- EndNote


Central Asia (CA) is an area characterized by mountainous terrain, forming the northwestern periphery of high-mountain Asia (HMA). The major mountain ranges of Tian Shan and Pamir host numerous glaciers and have extensive seasonal snow cover, both of which play an important role in the regional hydrological cycle (e.g., Chen et al., 2016). The runoff from snow- and glacier melt is critical for downstream rivers, with the glacier melt being particularly important during periods of drought, since it continuously produces runoff unlike seasonally fluctuating snowmelt (Pohl et al., 2017). While snow and ice melt input to river discharge is expected to increase in the future, runoff is projected to diminish in the long-term, reinforcing the regional water stress levels (Pritchard, 2019). Our understanding of the changing cryosphere of CA, both spatially and temporally, is currently limited due to a lack of observations. The absence of observations hampers identification of the meteorological and morphological drivers of glacier change for the Tian Shan and Pamir regions (Barandun and Pohl, 2023).
The net change in glacier mass balance, and its consequent environmental impacts, is governed by processes operating across a wide range of spatial scales, from microscale processes within the snowpack to synoptic-scale precipitation systems and the long-range transport of particles deposited onto the snow surface. Consequently, observations must encompass multiple spatial scales and variables. Precipitation is a key variable for determining the mass balance although it is notoriously difficult to measure in cold and mountainous regions where it can be underestimated by 50 %–100 % (e.g., Beck et al., 2020; Pritchard, 2021), and precipitation amounts are poorly quantified throughout CA and the greater HMA region (Chen et al., 2016). In addition, nearly all long-term observations of precipitation are typically from weather stations that are below 3000 m. In CA precipitation, however, there is a strong spatial variation, with the general pattern of higher precipitation in the west and more arid conditions towards the east (e.g., Aizen et al., 1995). Absorption of solar radiation and ambient temperatures are the key drivers for ablation and atmospheric warming in HMA, with temperature increase that is proceeding at a rate that is twice as fast as the global average (e.g., You et al., 2021). Ablation is also strongly modulated by trends in the albedo (Marks and Dozier, 1992). Across HMA, glacier albedo has declined over recent decades, with important implications for enhanced melt rates, particularly on the Tibetan Plateau and in adjacent regions (Zhang et al., 2021). Untangling the albedo reduction requires a characterization of snow and ice properties at the microscopic scale, including the characterization of so-called light-absorbing particles and snow chemistry, while monitoring the combined effect using remote sensing.
During the Soviet era, monitoring environmental variables in CA was relatively extensive (e.g., Aizen et al., 1995), but most observations came to an abrupt halt following the collapse of the Soviet Union in the mid 1990's. Since then, great efforts have been made during the 2010s to re-establish observations in the area. Glacier monitoring has been restarted on some glaciers in Uzbekistan and Kyrgyzstan (Hoelzle et al., 2017), as well as some additional glacier observations and other cryospheric variables outlined in Barandun et al. (2020). Remotely operated hydrometeorological stations (n=18) are now operating in CA (Zech et al., 2021), although they are mostly situated at lower elevation. Thus, cryospheric and atmospheric measurements remain acutely scarce throughout the CA region, especially at higher altitudes.
To meet the observational gap, the Finnish Meteorological Institute (FMI) and the Agency for Hydrometeorology of Tajikistan (Hydromet) began a joint effort to reinstate observations of variables that are potential contributors to glacier recession in Tajikistan at the Hydrographic Party Glacier (hereafter referred to as GGP) located in the Zarafshon River Basin. This site was first surveyed in 1968, and some key observations from those years indicated that GGP was 1.4 km in length, in a steady state, and had a volume of 0.0270 km3 (Vladimirova et al., 1976). In the subsequent years of visits (between 1972 and 1974) stationary observations were carried out on the glacier, in a program that included glaciological, snow measurement, meteorological, hydrological, and actinometric observations. In 2018, Hydromet and FMI initiated annual scientific research and fieldwork at GGP glacier (Fig. 1a–c). GGP is a small, north-facing, temperate cirque-valley glacier with mainly winter accumulation. It spans an elevation range of 3600–3800 m a.s.l. The closest major city is the capital of Tajikistan, Dushanbe, at about an aerial distance of 60 km south-east. Thus, the investigation area is readily accessible. Vehicle transportation from Dushanbe via the Iskanderkul lake to a nearby drop off point is available within a few hours, after which an expedition base camp can be reached within a day on foot (∼10 km). Here, in this paper, we focus on describing the more recent data that has been collected cooperatively based on six field expeditions that took place in August or September of 2018, 2019, 2021, 2023, 2024, and 2025. In addition, some standalone instruments (in particular, the automatic weather sensors) measured continuously outside of the expedition periods. In this paper we first present our used methodologies (Sect. 2), then present some of the data results along with some initial context of the data, as well as a subchapter summarizing the limitation of the datasets (Sect. 3) and lastly summarize our work.
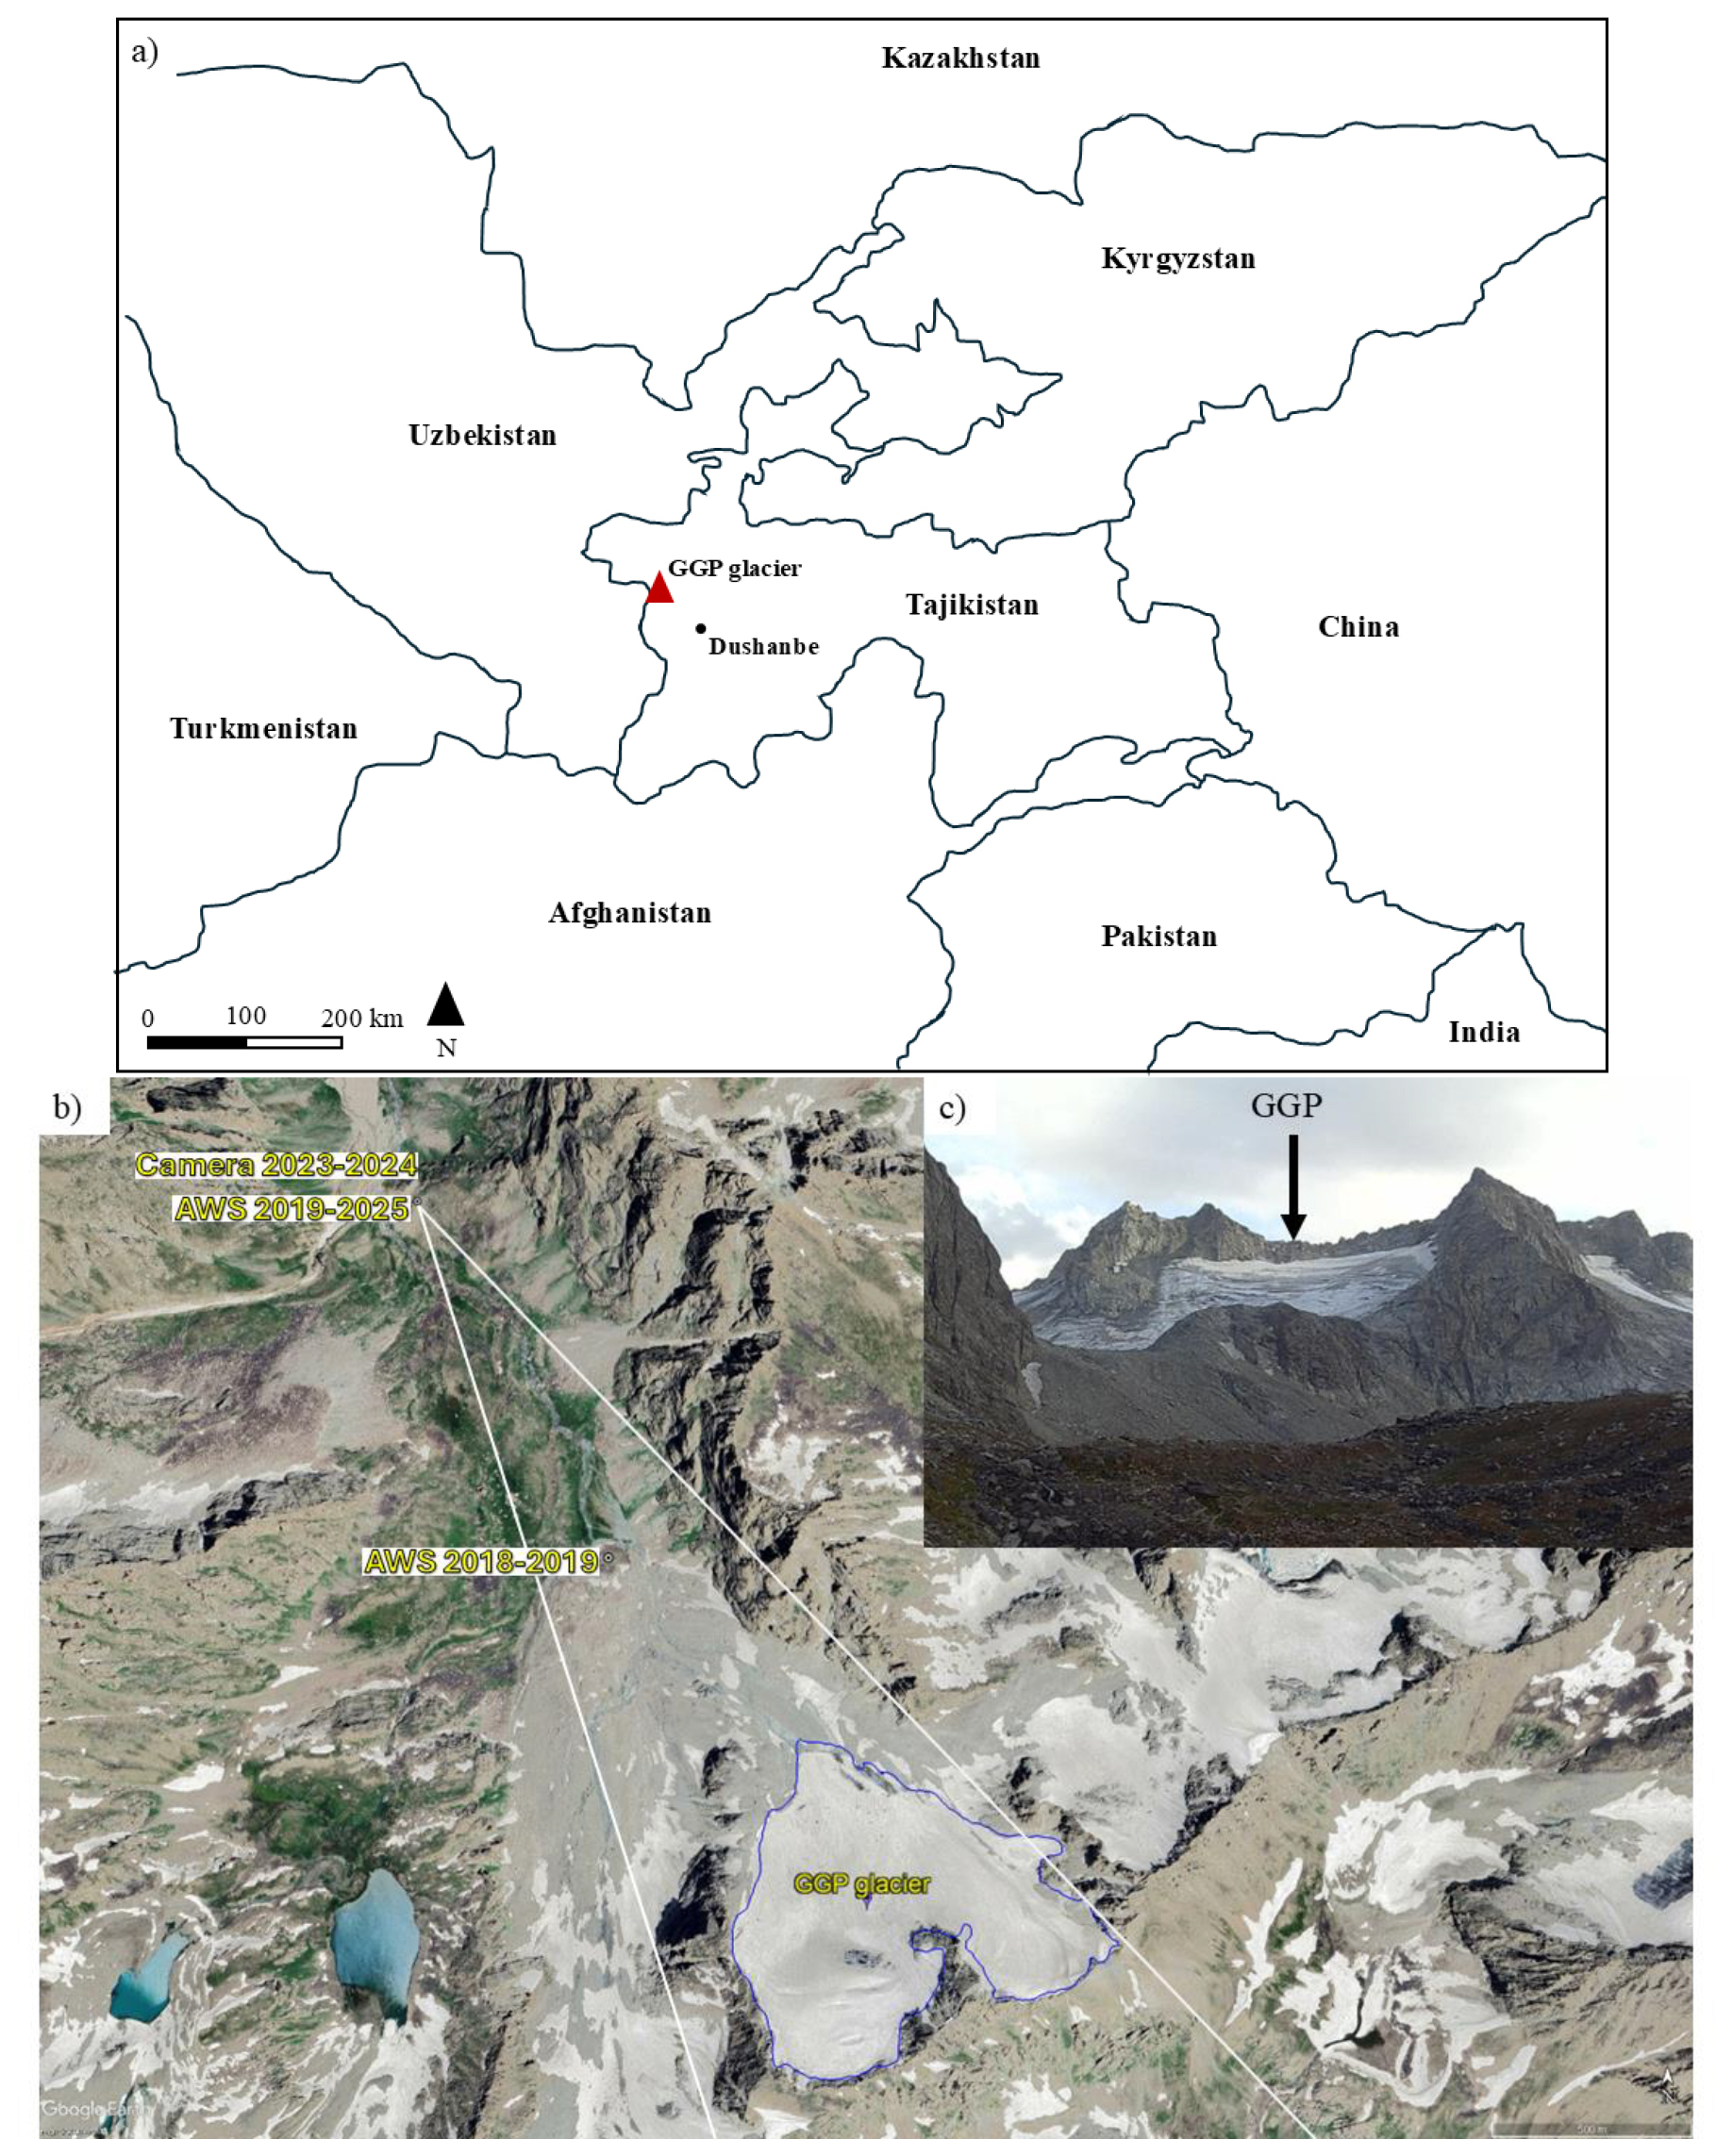
Figure 1(a) Map of Central Asia and Tajikistan with the location of GGP indicated by red triangle. (b) Satellite imagery of the study area. The outline of GGP is from 2024. AWS stands for automatic weather station. Field of view of the camera installed in 2023 is indicated with white lines. (c) Inserted image of GGP (top right) as seen from the weather station camera on 4 September 2023. Maps data: © Google Earth 2026; images © Airbus 2026.
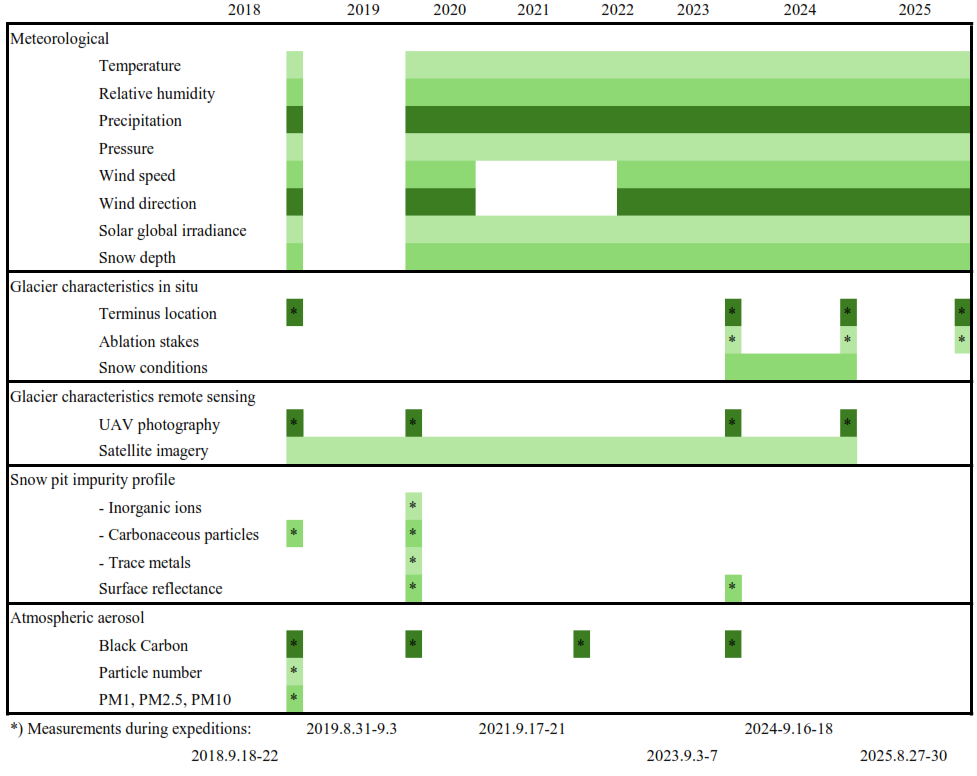
Data collected during the different expeditions, as well as the continuous measurements, is presented in Table 1. The subsequent subchapters (Sect. 2.1–2.9) further describe each methodology and data in more detail.
2.1 Mapping of GGP terminus
Glacier images were manually selected using Landsat-5, Landsat-7, Landsat-8, and Sentinel-2 satellites (Table 2). Landsat-5 carried the Thematic Mapper, collecting data across seven bands. Landsat-7 used the Enhanced Thematic Mapper Plus, and Landsat-8 further advanced the series with two instruments, using the Operational Land Imager and the Thermal Infrared Sensor (Crawford et al., 2023). All Landsat products used in this study have spatial resolutions of 30 m. Sentinel-2 satellites carry the multi-spectral instrument, acquiring images within 13 different spectral bands at spatial resolutions ranging from 10 to 60 m (Drusch et al., 2012). All images were processed and exported from the Google Earth Engine (GEE) platform, which is an open-source and extensive up-to-date archive of images. All the selected images are from September, ranging from 1989 to 2024. The month of September was chosen since it is typically the end of the melting season, and it corresponded to the general timeframe when fieldwork campaigns were conducted. The 13 cloud-free images here are posted as RGB composites (red, green, blue – Fig. S1 in the Supplement).
Table 2Satellite imagery used to delineate ice front locations and the glacier extent.

* Glacier area extent also estimated.
In addition, an outline of GGP from 1973 was completed to extend the time series. This was achieved by manually digitizing an archived map constructed by the Tajikhydromet (Vladimirova et al., 1976; see “Data availability”). The map contains one ground control point with known coordinates, as well as other known features in the landscape for reference. This reconstructed areal outline is compared to an estimated area from the 2024 imagery.
The ice front variation of GGP for the 1973 image and the time interval 1989–2024 (Table 2) was determined based on the methodology in Moon and Joughin (2008). First, an open-ended box was delineated, covering the glacier and taking the base of the opened box as a reference line (Fig. S2). Then, each ice front was manually digitized from the satellite images. The mean retreat or advance of the glacier is determined by the area change divided by the width of the box. This methodology is more suitable for accounting for uneven changes at the ice front, rather than using only a single reference line (Moon and Joughin, 2008).
2.2 Aerial photography of GGP
During the expeditions in 2018, 2019, 2023, and 2024, aerial photography was used to collect high resolution images (Table 3). The quadcopter DJI Phantom 4 Pro (including upgraded V2) was used, and it has an all-up weight of 1375 g and is equipped with a 1 in. (2.54 cm) sensor which has resolution of 20 million effective pixels (5472×3648 pixels). Using rechargeable 5870 mAh Lithium polymer (LiPo) battery, the drone is capable of a manufacturer-stated maximum flight time of 30 min and a signal transmission distance of 7 km. In practice, the drone was able to fly for about 20 min at about 4 km altitude above sea level with occasional transmission problems. One drone was lost during the study period due to unresolved transmission issues.
Table 3Summary of the project assembly from the Pix4D software, as well as localization accuracy per ground check points (GCPs), control points (CPs), manual tie points (MTPs), ground sampling distance (GSD), and mean errors in the three coordinate directions and average projection error in pixels.
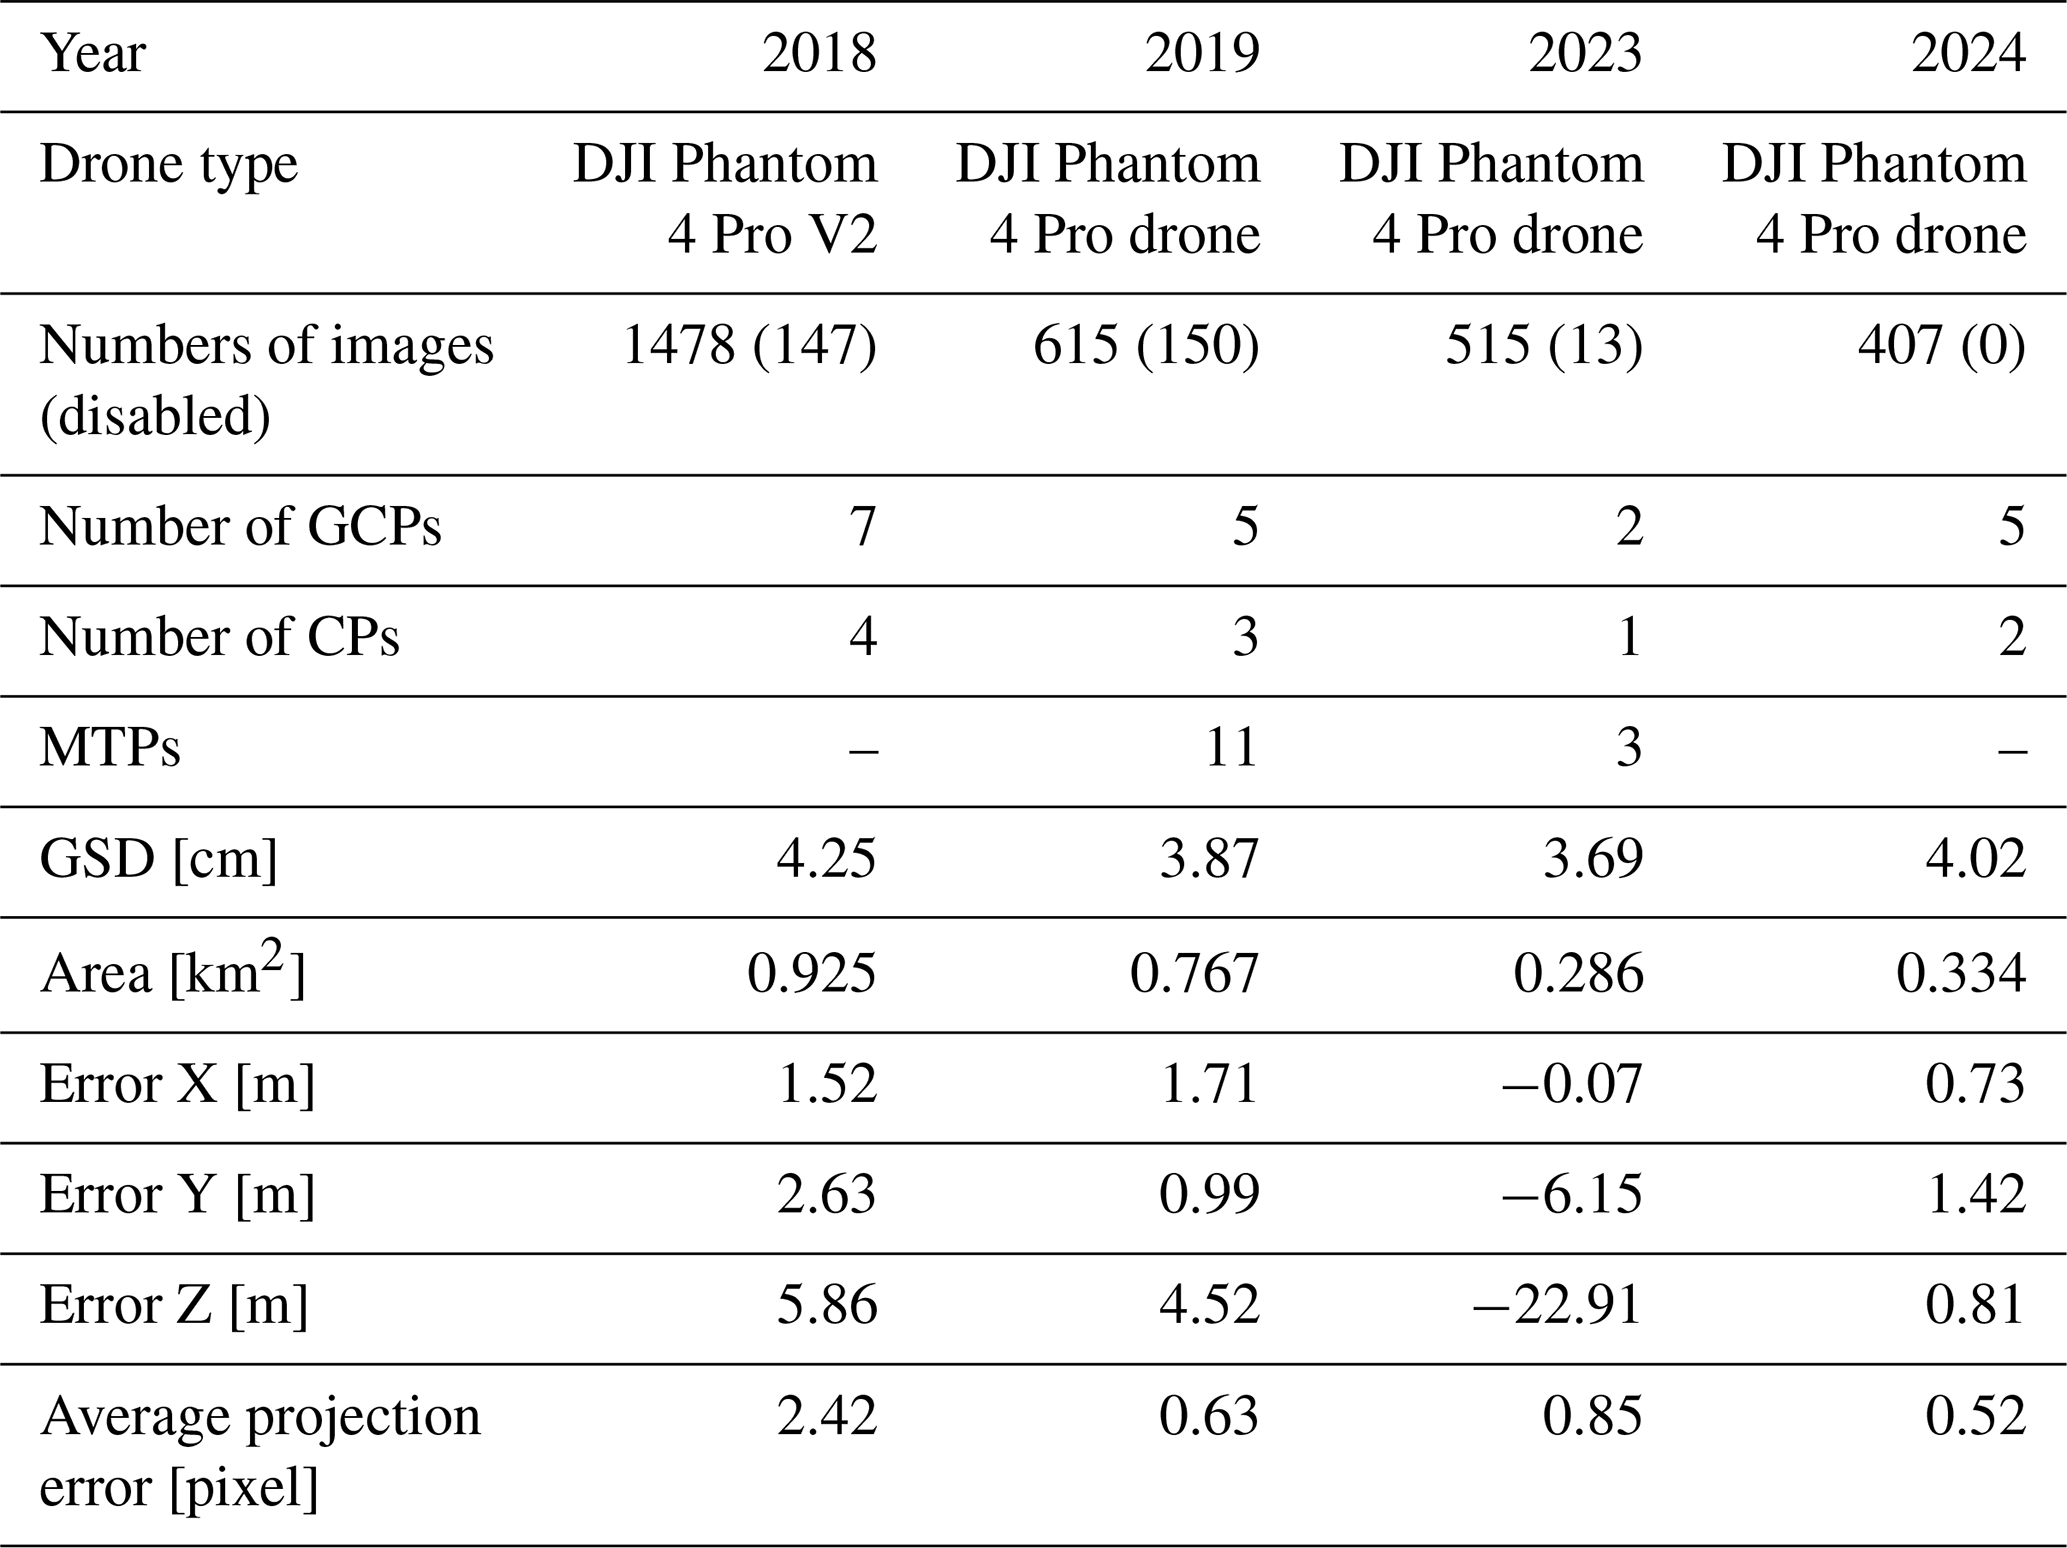
To process the collected images the stand-alone version of Pix4Dmapper software version 4.9.0 was used with the hardware: CPU: Intel(R) Core (TM) i7-8750H CPU at 2.20 GHz; RAM: 64 GB; GPU: Intel(R) UHD Graphics 630, NVIDIA Quadro P1000; and operating system: Windows 10 Pro, 64-bit. The drone cameras were calibrated automatically as part of the internal Pix4D mapper software structure from motion (SfM) process. During our expeditions' aerial photography missions, no ground control points (GCPs) were used in 2018 and 2019 due to various logistical and weather issues. To address this limitation, Google Earth was used to create GCPs artificially by using significant natural check points (CPs) such as large boulders or parts of bedrock outcrops that are spread around the glacier. During 2023 and 2024 the drilled ablation stakes positions were marked with red crosses with spray paint of about 2 m arm length, but not all of them were found on acquired images. Specifically, for 2023 only one out of four recorded red cross marks on stakes' position were found on images, and three manual tie points (MTPs; recognizable physical feature that can be identified and clicked on across multiple overlapping images). In 2024, only seven out of 25 red cross marks on stakes' position were found on images.
The UAV imagery was processed to generate georeferenced orthomosaics and digital surface models (DSMs) in GeoTIFF format. In addition, Google Maps tile layers were produced only as a user-friendly visualization format to facilitate online browsing of the datasets. The WGS84/UTM zone 42N (EGM 96 Geoid) coordinate system was used. Additional processing settings used are listed in the supplement. The average ground sampling distances of the photogrammetric products were 4.25 cm in 2018, 3.87 cm in 2019, 3.69 cm in 2023, and 4.02 cm in 2024 (Table 3). Notably, for all years (except 2024) some number of images had to be disabled. This was mostly due to not having enough automatic tie points found on images because of suboptimal camera orientation. The comparatively larger error values in 2023 are likely related to the limited ground-control configuration for that survey. Only two 3D GCPs and one independent check point were available, making the accuracy assessment sensitive to the residuals of a single validation point. Therefore, the 2023 errors should be interpreted with caution and mainly reflect the limited number and distribution of GCPs/check points rather than the overall image matching quality. Thus, future surveys would benefit from ensuring that well-distributed ground control points or check points are marked and surveyed before UAV data acquisition. Additional improvements could include using more clearly visible and stable targets, increasing the number and spatial distribution of ground control points, and applying consistent post-processing co-registration procedures between annual datasets. These steps would help reduce interannual spatial offsets and improve the comparability of DSMs and orthomosaics.
2.3 GPS survey of GGP terminus
The glacier terminus location was mapped during the expeditions in 2018, 2023, 2024, and 2025 with a GPS (Garmin SPS 72H and Garmin inReach Mini2) device, by traversing the terminus and recording the borders, or by taking several individual coordinate readings along the terminus transect. This resulted in about 30 to 60 location data points from these surveys. The approximate positional accuracy of the GPS measurement is within 5 to 10 m under normal conditions, as provided by the GPS manufacturer.
2.4 Time-lapse photography of GGP
An automatic camera (Hunter Basic Trail Camera) was installed during the 2023 expedition in conjunction with the automatic weather station (AWS; 38.96491° N, 68.26330° E, 3275 m a.s.l.) to record the prevailing environmental conditions at the AWS site and at GGP. The camera operates with 12 AA-batteries and automatically takes one image per day (at ∼ 09:00 UTC+5), which are stored on an internal SD-card. The data set encompasses one year of observations (2023 expedition to following year's field campaign).
2.5 Ablation stake survey
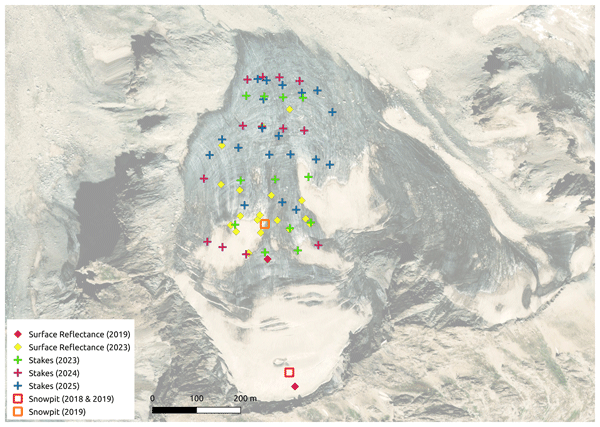
Glacier ablation was measured with the conventional glaciological method (e.g., Cogley et al., 2011), with stakes being drilled into the ice across the glacier ablation zone. The spatial distribution of the different point scale measurements, including the ablation stakes, from the glacier are highlighted in Fig. 2. Measurements of height change are transformed into ice ablation by an assumed ice density of 900 kg m−3 (Cogley et al., 2011). Stakes with a height of 4 m (consisting of two 2 m individual stakes connected) were typically fully inserted into holes that were drilled with a handheld electronic drill connected to an ice auger with connectable auger flights (Kovacs Ice Drilling Equipment). The position parameters of the stakes were recorded with a GPS (same as terminus mapping) to observe any possible movement of the stakes. During the following years' expeditions, the stakes height (from ice surface to the top of the stake) and movement were measured. When stakes were broken replacement stakes were installed in the ice. The first set of ablation stakes were installed in 2023, and the subsequent number of stake height recordings ranges from 9 to 13, depending on if the stake was found the following year or not. In some instances, some stakes were completely melted-out and found at a different location than the original installation place. These are marked accordingly in the data set file.
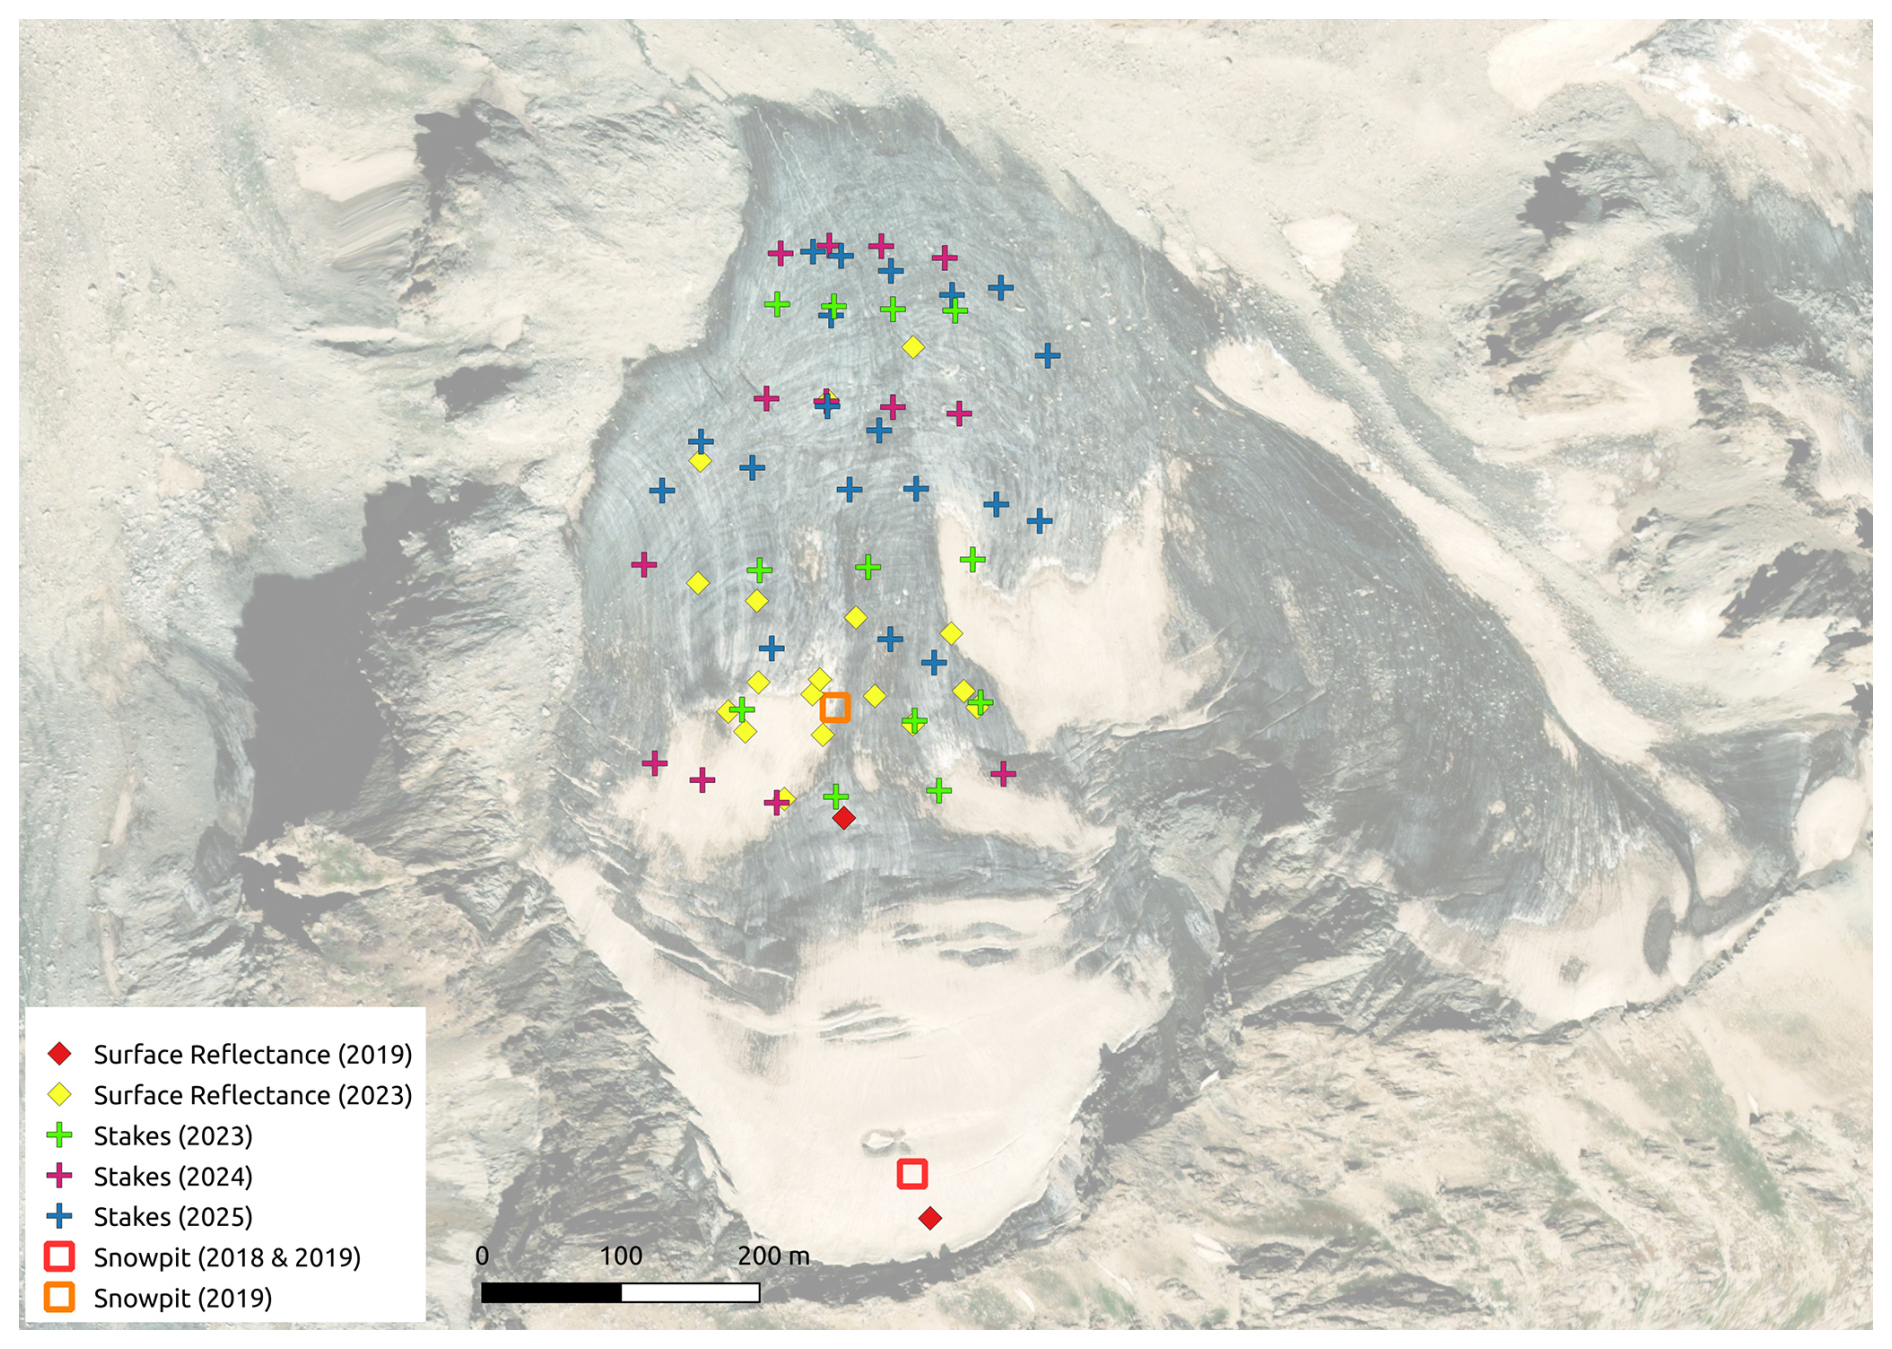
Figure 2Location of surface reflectance, ablation stakes, and snow pits point measurements conducted at GGP. Image source Bing Maps (© Microsoft) and imagery data © 2025 Maxar.
2.6 Meteorological measurements
An AWS (Vaisala MAWS 201) was installed in 2018 near the glacier terminus (38.95541° N, 68.27000° E, 3390 m a.s.l.) for long-term continuous observations of the meteorological parameters. Due to high snow accumulation during the first winter at this location, with both the solar panels and some of the sensors being covered with snow, resulting in a loss of power to the AWS, the position was changed in September of 2019. The second location is about 2 km from the glacier terminus (38.96491° N, 68.26330° E, 3275 m a.s.l.), and the reported meteorological data is therefore from two different locations (see Fig. 1b). The AWS measures temperature (T), relative humidity (RH), precipitation (P), pressure (p), wind speed (WS), wind direction (WD), solar global irradiance (GI), and snow depth (SD). The AWS operates with a 37 W solar panel, three 7 Ah, 12 V batteries. The measured parameters together with sensors used are described in Table 4, while the AWS is visualized in Fig. 3. The precipitation gauge is not heated; thus, the precipitation record is limited to recording liquid. It may, therefore, possibly include melt from accumulated snow also. The AWS data logger reports data in 10 min averages that have been manually downloaded during field expeditions. The data reported here are hourly averaged values (unless otherwise indicated). The data points flagged as invalid by the sensors themselves were omitted from the data set. The AWS record contains two major gaps. The first consists of the period when the AWS was buried in snow at the first location (losing data at 31 December 2018 but then resumed automatically on 19 June 2019). The second major data gap took place between 13 September 2021 (starting only a few days after completion of the 2021 expedition) and the 2023 expedition, when the main power switch to the AWS was found to be switched to the OFF-position due to an unknown reason. Measurements were resumed on 19 September 2023. An additional data gap is present in the wind sensor data (WS and WD) during periods 13 September 2019–6 November 2019 and 8 October 2020–31 September 2021 due to bad data quality (data gaps and noisy measurements). The SD data during the period 26 June 2019–3 September 2019 were omitted due to an unknown technical issue that caused unrealistic values. The reported P data do not include any wind undercatch corrections and is the cumulative precipitation for each hour, while the reported SD and maximum WS are the maximum values for each hour. The WD data is the circular mean. The AWS had the T, p, RH sensors changed to new calibrated ones in 18 September 2024, while the wind sensor (including WS and WD) was changed to a new one in 6 September 2023.
Table 4Sensor specifications installed on the automatic weather station.
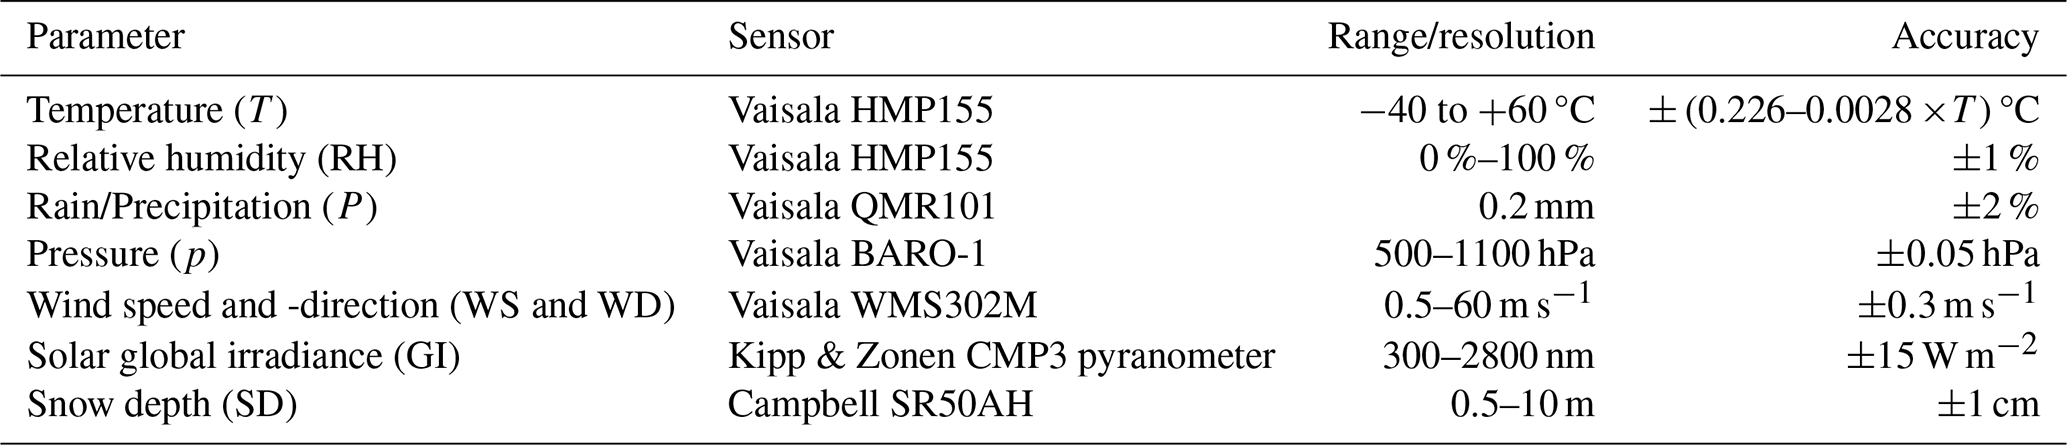
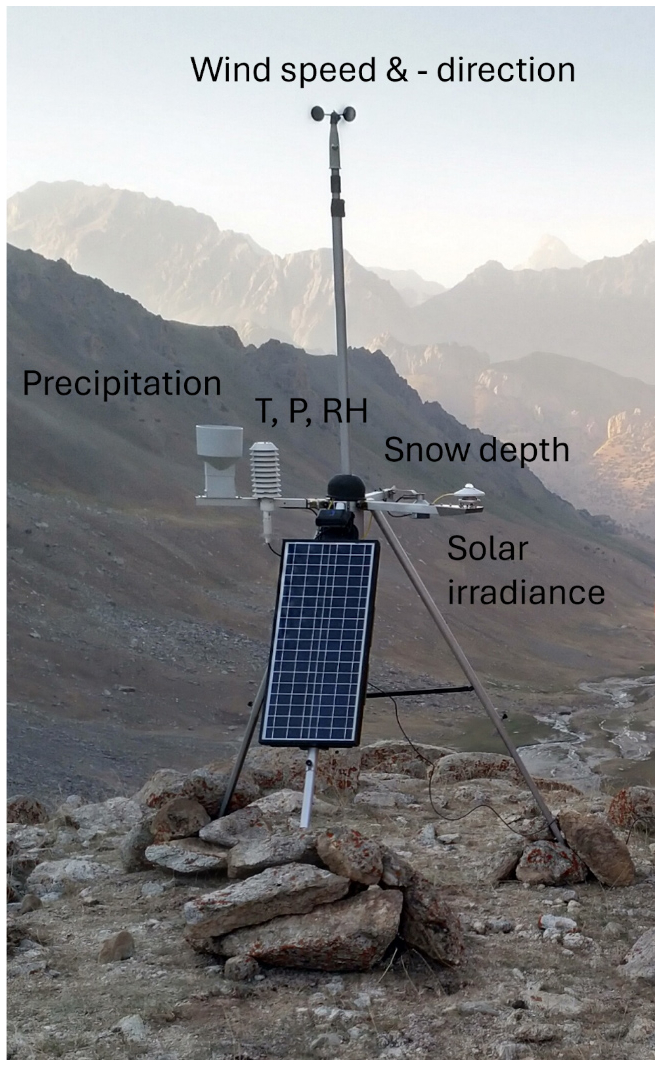
Figure 3Photograph of AWS with the different sensors indicated (T= temperature, P= pressure, RH = relative humidity). Photography by Antti Hyvärinen (18 September 2021).
2.7 Glacier snow chemistry
To study snow impurities at GGP different types of snow samples were collected in the expeditions of 2018 and 2019 via surface snow collection and excavation of snow pits. The sampling in 2019 was conducted together with the surface reflectance measurements (Sect. 2.8).
During the other expedition years most of the glacier snow had been ablated, and no snow samples could be collected. In general, the August–September campaigns were not an optimal time of the year for snow sampling, but this period for the field work was dictated, for instance, by measurements of the seasonal end of glacier ablation and accessibility to GGP. In 2018, one snow pit (38.94393° N, 68.27794° E, 3812 m a.s.l, see Fig. 2) was dug to a depth of 100 cm, from which 21 snow samples were collected in depth intervals from 3 to 10 cm. Snow samples were melted and filtered onto 47 mm micro-quartz fiber filters in the field following the principles of Svensson et al. (2018). In the laboratory a filter punch was analyzed for carbonaceous particles, i.e. elemental- and organic carbon content, with a thermal-optical analyzer (Sunset Laboratory Inc., Birch and Cary, 1996) utilizing the EUSAAR-2 protocol (Cavalli et al., 2010).
In 2019, two snow pits were excavated, with the first one located in the higher section of the glacier (essentially same place as the 2018 snow pit, see Fig. 2), while the second snow pit was in a lower section (38.94695° N, 68.27727° E, 3666 m a.s.l, see Fig. 2) of the glacier. The first 2019 snow pit (referred to as pit 1 in 2019 data) was 280 cm deep, while the second snow pit was 210 cm deep (referred to as pit 2 in 2019 data). In both pits ten samples were collected at different intervals slabs. After collection the snow pit samples followed the same in-field procedure as in 2018. The filter substrate then had one punch analyzed for carbonaceous particle (same as 2018), but also had a second filter punch further analyzed for trace metals (Aluminum, Arsenic, Cadmium, Cobalt, Chromium, Copper, Iron, Manganese, Nickel, Lead, Vanadium, Zinc) with an inductively coupled plasma mass spectroscopy (ICP-MS, Thermo iCAP Q). Prior to analysis, this filter punch was digested microwave-assisted (utilizing Milestone Ultrawave 3) in acid solution (Nitric acid + Hydrogen peroxide) according to the standard SFS-EN 14902. The combustion temperature of 250 °C deviates from the standard's 220 °C but was used in order to maximize the yield of less soluble analytes (Aluminum, Chromium, Vanadium). Internal standards (Scandium, Gallium, Rhodium, Iridium) were added to the samples before combustion.
For some of the reported snow pit samples (both 2018 and 2019) the filter substrates ended up becoming too particle loaded while filtering to obtain reliable carbonaceous quantification with the used analytical procedure. These samples are marked with NaN in the snow chemistry data files.
Surface snow samples (n=9, referred to as 2019 surface samples) were collected in two locations of GGP in 2019 a few meters away from the pits where visually different appearing particulates were present on the glacier surface (which were part of the reflectance measurements). In proximity to pit 1, snow samples were collected from snow surfaces appearing black-pink, brownish, and black-grey (with the corresponding sample IDs of 13, 11, 7, respectively). For the surface snow samples collected in the vicinity of pit 2, the different sampling spots are illustrated in Fig. 4. The corresponding sampling IDs are 21–22, 23–24, 25–26 for the brown, black, and red-pink spots, respectively.
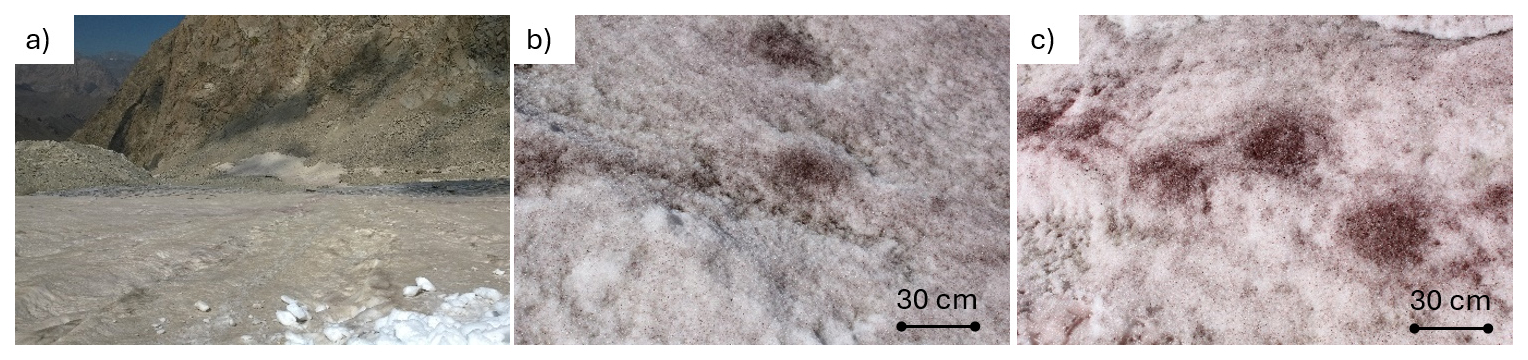
Figure 4Surface snow characteristics observed in 2019 expedition that were sampled and measured (in the vicinity of pit 2): typical brownish deposits (a), blackish deposits (b) and red-pink deposits (c).
The surface snow samples were collected in 20 mL glass vials and were packed in a light-protected state for transport to Helsinki. During transport it was not possible to have the samples remain frozen. In the laboratory in Helsinki, the melted surface snow samples were filtered (Accrodisc pore size 0.45 µm) and analyzed for inorganic ions (Sodium, Ammonium, Potassium, Magnesium, Calcium, Chloride, Nitrate, Sulfate) with two ion chromatographs (Waters ™).
2.8 Glacier surface reflectance
The surface reflectance of GGP was measured with a handheld spectroradiometer, ASD FieldSpec HandHeld 2 (Malvern Panalytical Ltd; spectral range 325–1075 nm) during the 2019 and 2023 campaigns. Different areas from the glacier surface that appeared to be representative of the specific years' expedition were selected for measurements. In practice, this meant that in the upper section of the glacier (next to pit 1) during 2019, three different surface types were measured, while in the midsection of GGP, three additional measurements focused on impurity-rich areas commonly found across the snow surface (which are visualized in Fig. 4). During the 2023 campaign, the snow on the glacier surface was mostly ablated. Eighteen reflectance measurements were carried out laterally across the glacier within the 3600–3680 m a.s.l. elevation range.
Time periods of stable lighting conditions, i.e., avoiding changing cloudiness or partially cloudy circumstances, were utilized for these measurements. To minimize the impact of solar zenith angle of the reflectance, the measurements at different locations were performed at similar times of the day. The measurements were conducted by first taking a white reference measurement (Spectralon Labsphere Inc.), followed by measurements of the targeted glacier surface (three spectra, which were averaged for the results), and finally followed by another white reference measurement. This allowed minimizing the effects of instrument response to changes of the field brightening conditions. The reflectance curves shown here are based on nadir observations; therefore, angular dependence should be considered when comparing these data to remote sensing measurements taken at off-nadir angles.
2.9 Atmospheric aerosol
During our field expeditions to GGP in 2018, 2019, 2021, and 2023, measurements of atmospheric aerosols were performed with portable instrumentation at a height of 1.5 m above the ground surface. The measurements included aerosol absorption, from which black carbon can be derived based on the absorption at wavelength 880 nm, particle number concentration, and particle size distribution at the size range from 0.3 to 10 µm. The absorption was measured with a Microaethalometer AE51 (at 880 nm; AethLabs) in the 2018 and 2019 campaigns, and with the Microaethalometer MA350 (at 880, 625, 528, 470 and 375 nm; AethLabs) in the 2021 and 2023 campaigns. Particle total number concentration >10 nm was measured with a condensation particle counter (TSI model 3007) and the particle size distribution with an optical particle counter, both measured during the 2018 campaign only (yielding 5.5 h of data). These are reported as PM1, PM2.5 and PM10 mass concentrations assuming unit density.
The aerosol data was measured at either 1 min or 5 min time resolution and processed to 1 h average values. In the reported data, we compare data only measured at the expedition base camp or while at the GGP glacier. Aerosol instruments were primarily operated during daytime hours due to issues of weather sensitivity and battery lifetime. However, in 2023, a continuous measurement of black carbon concentrations was conducted over a period of 43 h to obtain an indication of diurnal variability at the site.
3.1 Mapping of GGP terminus
The retreat of the GGP ice front over the last 50 years (1973–2024) is approximately 200 m (Fig. 5). In terms of surface area, GGP was estimated to be 0.55 km2 in 1973 (Vladimirova et al., 1976), while in 2024 it was 0.41 km2. This represents an area decrease of approximately 25 % over this period, is visualized in Fig. S3. The yearly appearance of GGP in the month of September, which generally corresponds to the month with minimum snow cover in the area, is highlighted in Fig. S1. From this satellite imagery, it can be observed that the snow cover at GGP has been less extensive in recent years.
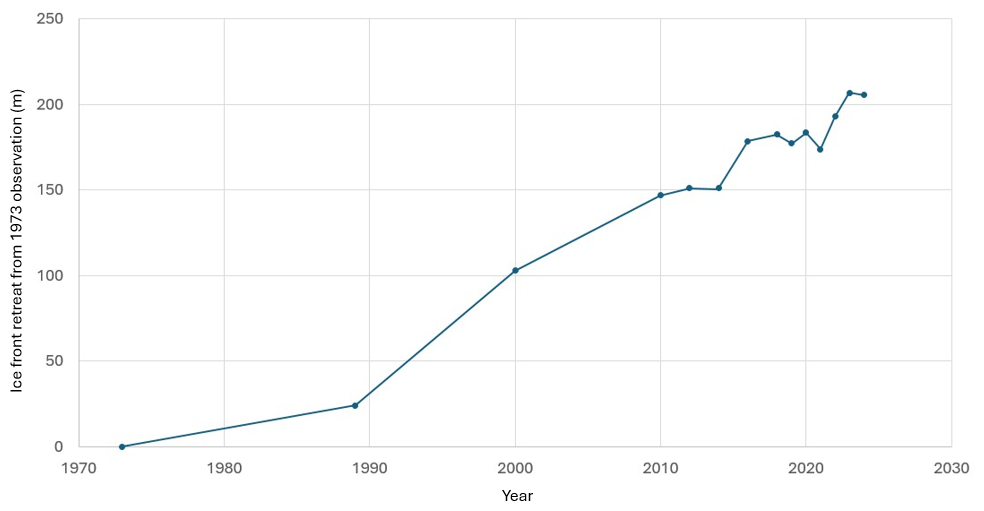
Figure 5Retreat of GGP terminus from 1973 outline (Vladimirova et al., 1976) to variations determined 1989–2024.
3.2 Aerial photography of GGP
The DSM and orthomosaics are shown in Fig. 6 with different spatial coverage from the different UAV survey years. The DSM and orthomosaics, nevertheless, highlight the high-resolution glacier surface characteristics occurring during these respective years.
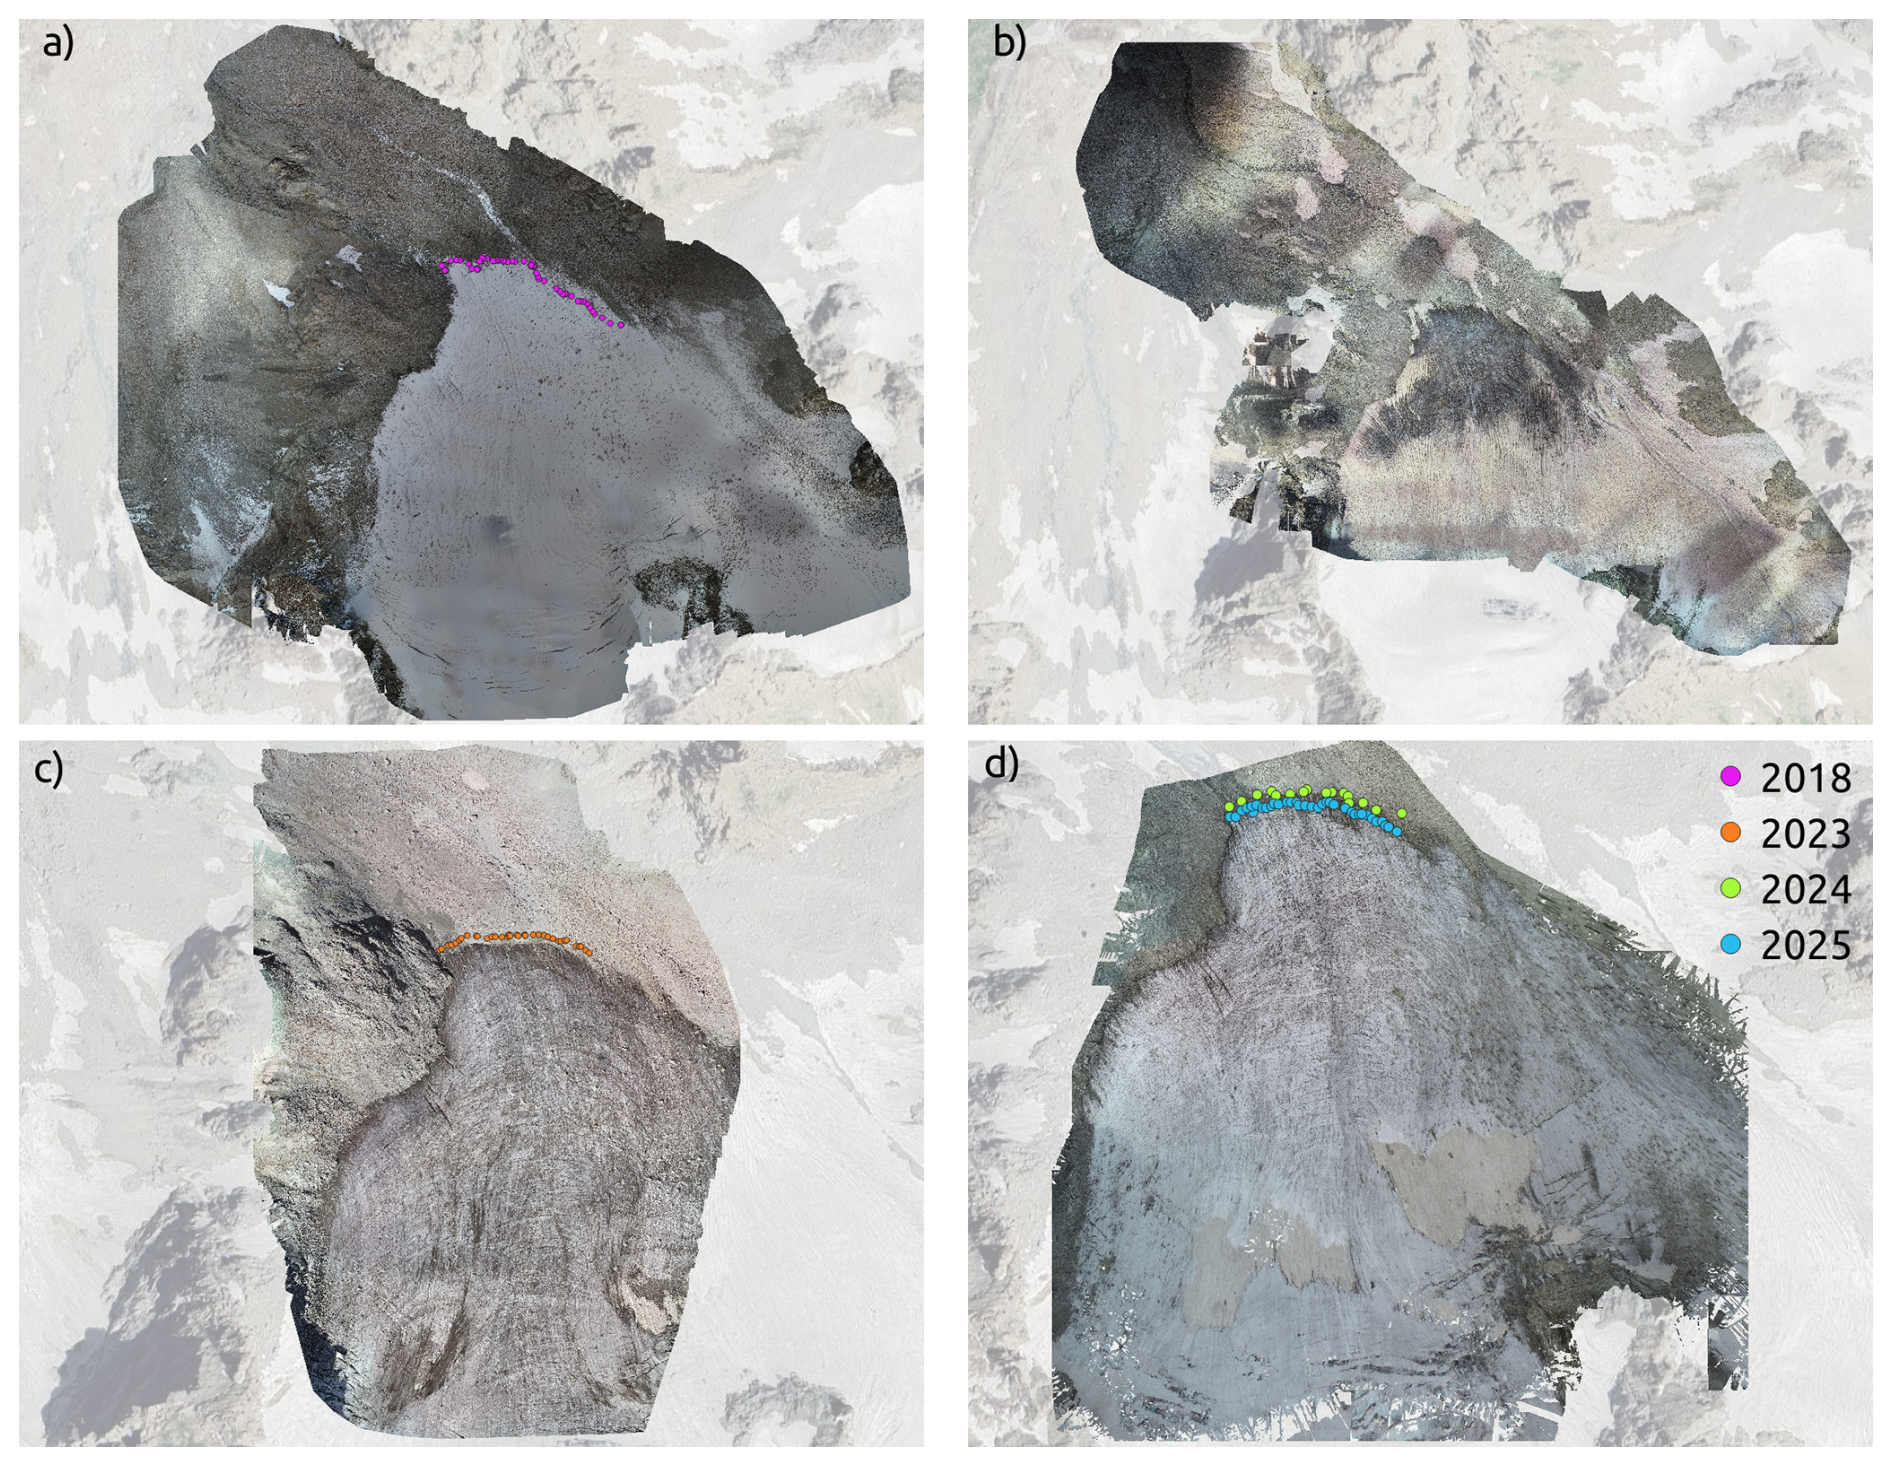
Figure 6Orthomosaic overlays of GGP generated by Pix4D software for each year: (a) 2018, (b) 2019, (c) 2023 and (d) 2024. Ice front locations collected with GPS-surveys from different expedition years. Background image available though OpenStreetMap.
3.3 GPS survey of GGP terminus
For the years when the GGP terminus was surveyed with GPS (2018, 2023, 2024, and 2025), the collected data points are visualized in the orthomosaics. Note, that the 2024 and 2025 data points are both visualized in the orthomosaic from 2024 (since no orthomosaic was generated for 2025).
3.4 Time-lapse photography of GGP
In 2024 the maximum snow extent was observed to occur at the end of March (Fig. 7a), while the minimum snow conditions occurred in the middle of August for this year (Fig. 7b), when snow was visually observed only at the upper sections of GGP. From the images it is visible that more snow had ablated in 2023 compared to 2024, as shown in the yearly comparison pictures (Fig. 7c–d) taken in the beginning of September of 2023 and 2024.
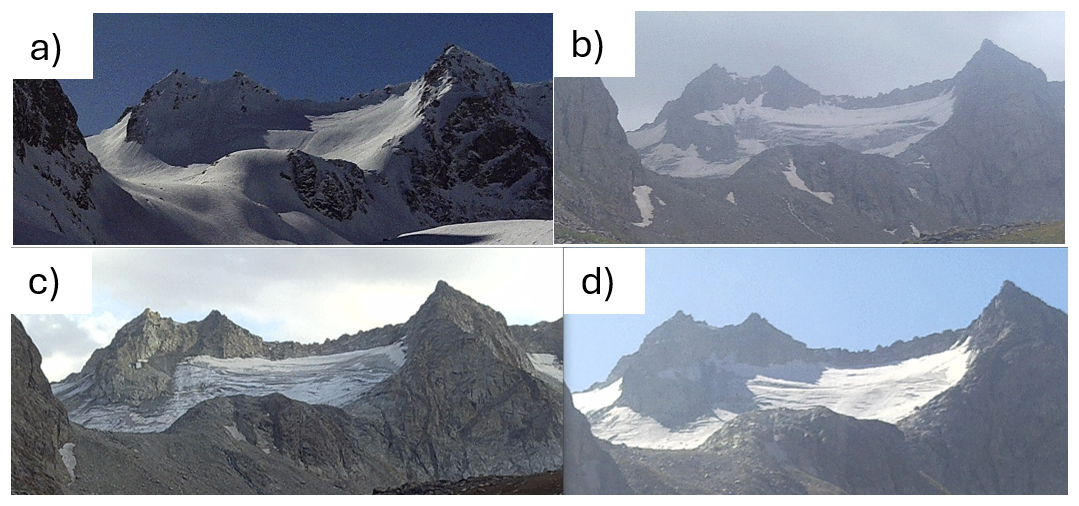
Figure 7Snow conditions at GGP on (a) 31 March 2024 (maximum snow conditions), (b) 18 August 2024 (minimum snow conditions), (c) 4 September 2023, and (d) 4 September 2024.
3.5 Ablation stake survey
The ablation varied considerably between the stakes, although indicating relatively uniform ablation across the stake network. Noteworthy was the movement of the stakes from the 2023 to 2024 expedition, with a lateral perpendicular movement to the center line of the glacier of −4 to 11.5 m, with the longest distance in the steep section at the mid-section of GGP (at around 3680 m a.s.l.). Near the bottom of the glacier, the shift was smaller (and thus, within the uncertainty of the GPS receiver, which as stated above, is on the order of 5–10 m), showing that there is very little lateral glacier flow, rather only vertical melting.
3.6 Meteorological measurements
A time series of all the AWS measurement parameters are presented in Fig. 8. Monthly averages of the meteorological parameters are reported in Table 5 separately for the first and second location. The monthly averages were calculated only if there were more than 14 d of valid data. AWS measurements at the second location provided sufficient data for observation of seasonal variations. The monthly mean T varied from −9 to 11 °C, with the lowest mean values recorded in January and highest in July. The minimum and maximum daily mean T were −19 and 20 °C. SD varied greatly, but on average it peaked during March. A subtle seasonal variation was observed for p, varying from 682 to 689 hPa with minimum in February and maximum in September. No clear seasonal variation has been observed for RH, WS, nor WD, being 55 %, 10 m s−1, and 120°, respectively, on average. The maximum hourly mean of WS was 27 m s−1, the maximum P was 57 mm d−1, and the highest SD was 46 cm.
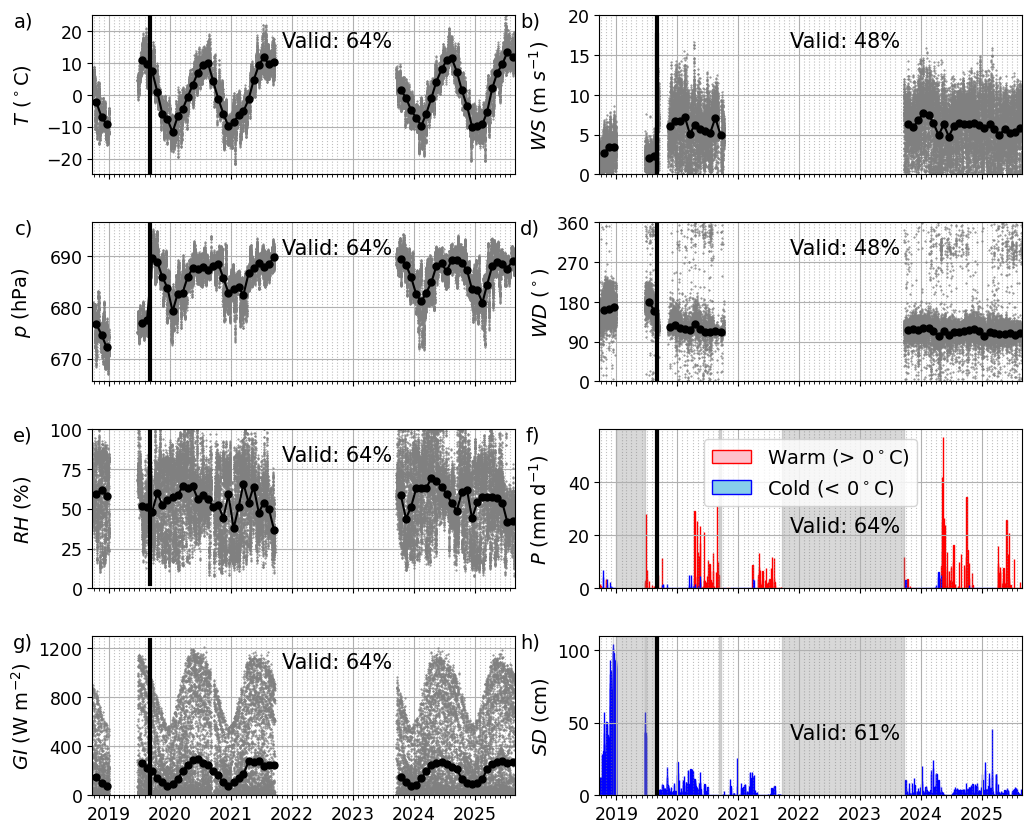
Figure 8The time series of (a) temperature (T), (b) wind speed (WS), (c) pressure (p), (d) wind direction (WD), (e) relative humidity (RH), (f) daily precipitation (P), (g) global irradiance (GI), (h) snow depth (SD) measured at GGP. The grey dots are the hourly data and the black line is the monthly mean (required 14 d of data). The black vertical line marks the day when the AWS was moved to another location. Precipitation is classified as “warm” or “cold” depending on whether the mean temperature of the day was over of below 0 °C. The P is reported as the cumulative precipitation for each day and the SD is the maximum measured that day.
Table 5Monthly means for each parameter measured by the AWS in the second location. The monthly averages in the first location are marked with an asterix (*). The averages are calculated from hourly data, but for P the averages were calculated from cumulated daily precipitation and SD from the daily maximum values. At least 14 d of valid data were required to derive averages.
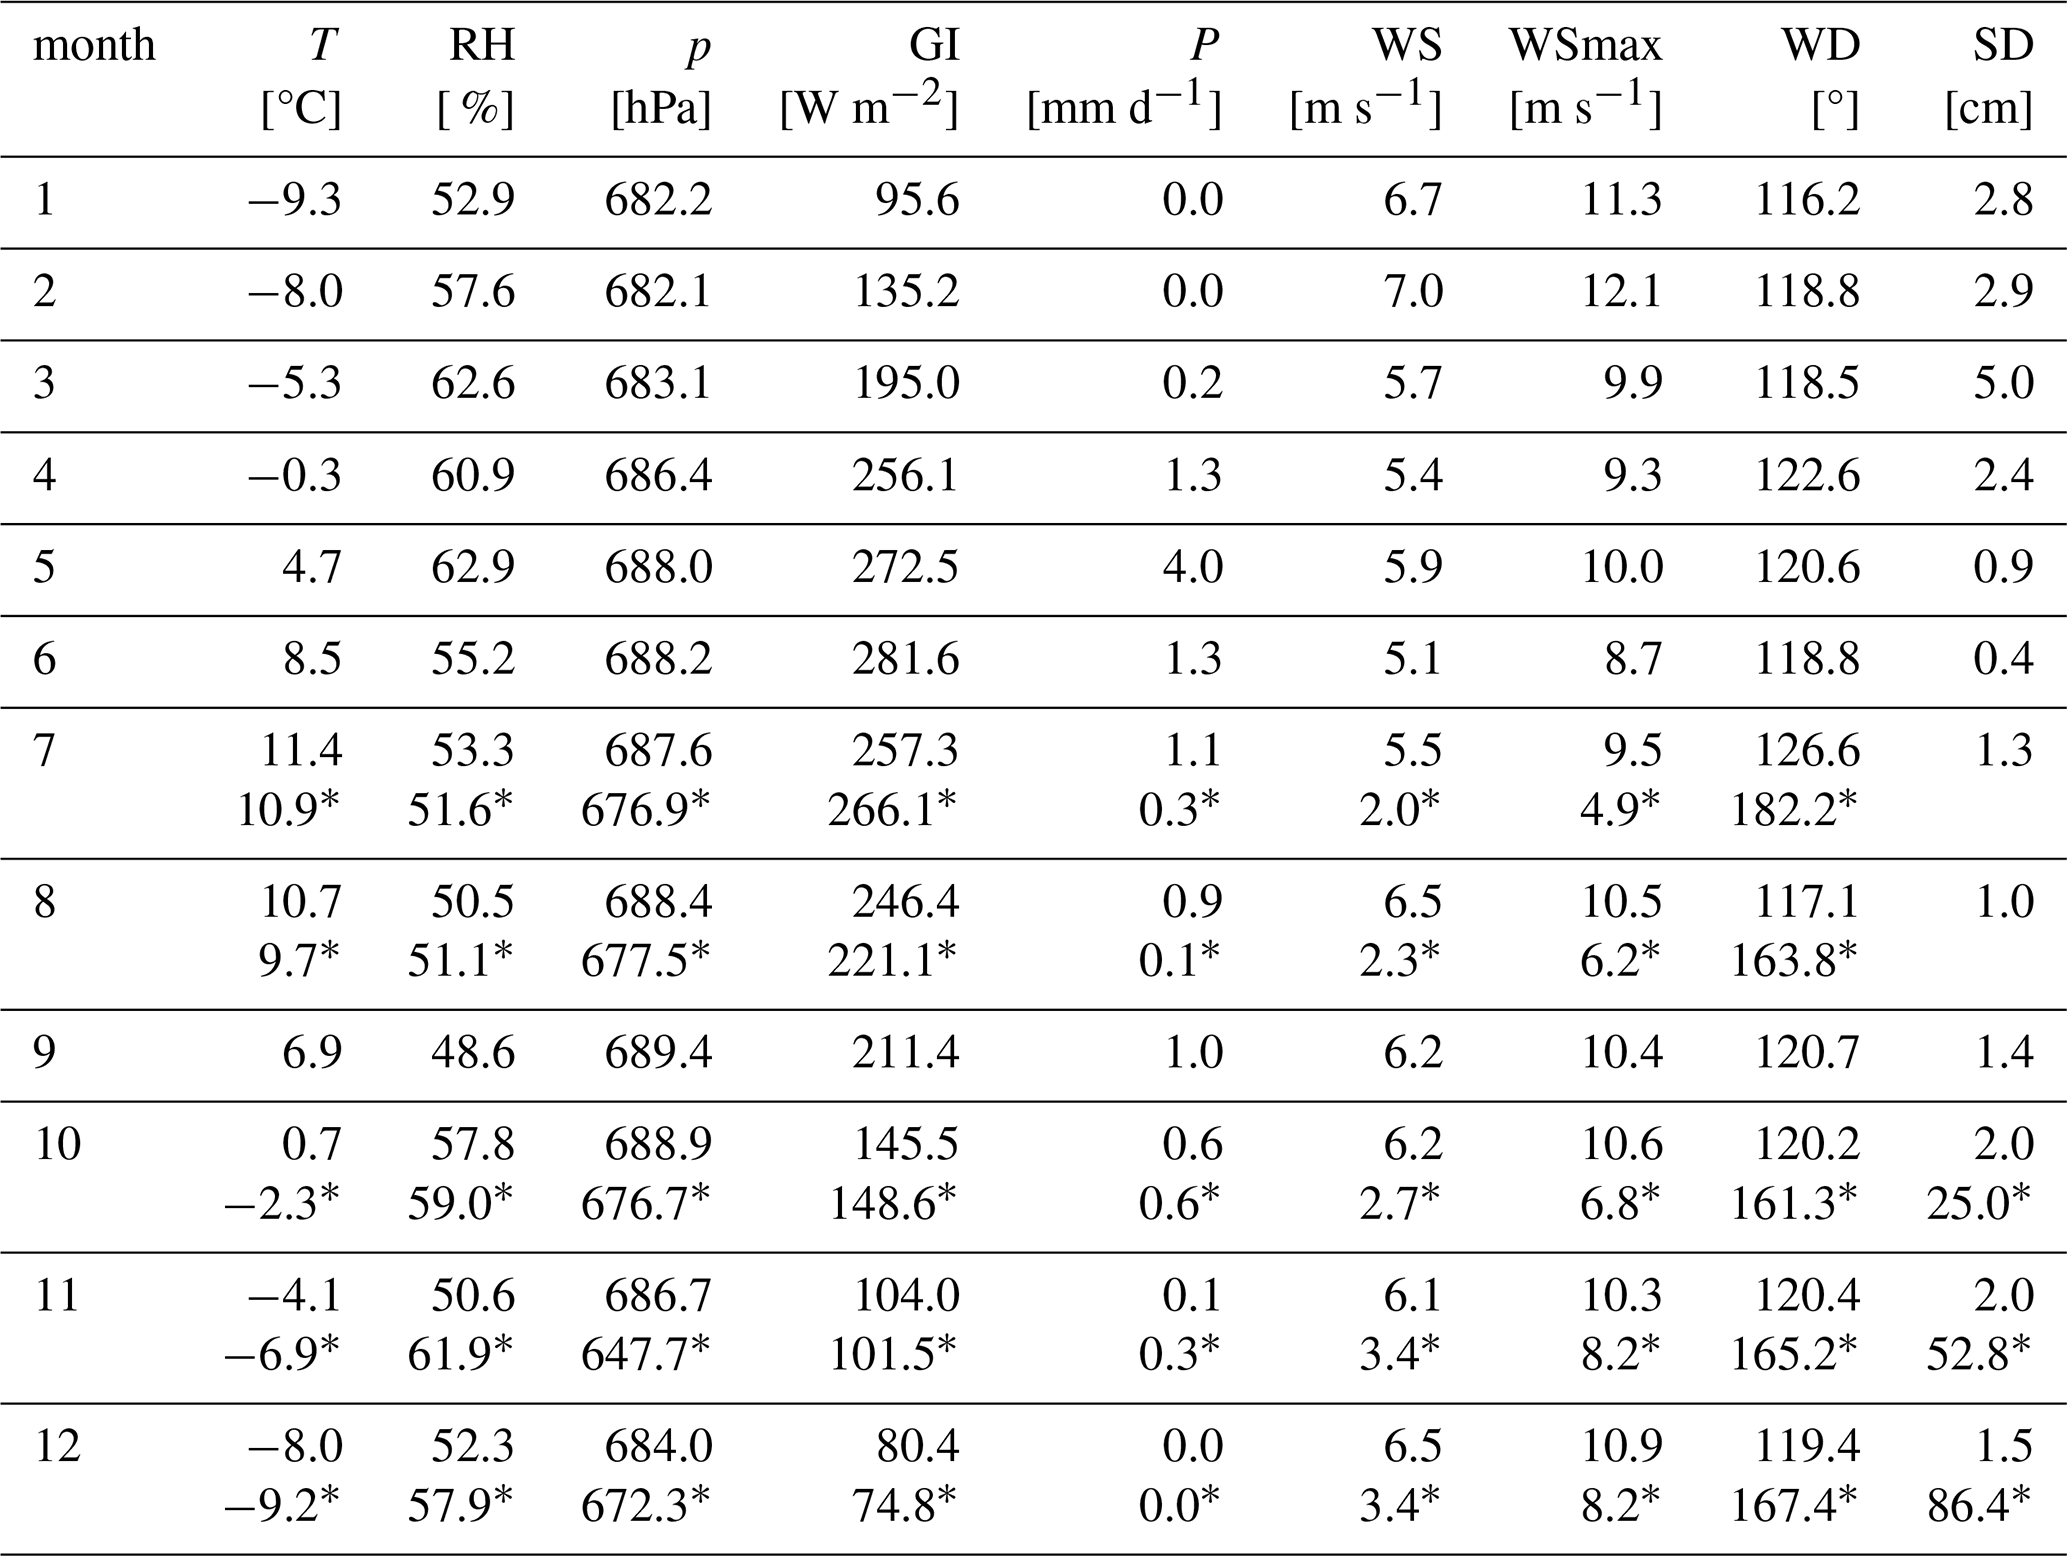
At the first location, AWS data exists only for July–August and October–December, whereas for the second location at a lower altitude, there are data for longer periods and extending over all the months. When the station was moved to the new location, the altitude of the AWS decreased about 115 m. Due to the lower altitude, and the expected lapse rate, the temperature increased. This was observed in a shift of about 2 °C. Surrounding landforms and surfaces (e.g., longer lasting snow cover) may also potentially affect the T. The average p in the lower location was about 12 hPa higher. A probable reason for increased precipitation (about 0.3 mm d−1) is that the precipitation gauge typically only detects liquid precipitation, which is more probable to occur more often at lower altitude with increased temperatures. On the opposite, the SD was considerably lower (about 53 cm between October–December) at the new location. Similarly, the prevailing wind moved from south-south-east to east-south-east in the new location, and the WS was about 3.5 m s−1 higher, which is probably due to the surrounding topography since the AWS was moved onto some elevated relief which is more wind exposed. The higher WS most likely also affects the SD as at higher WS snow drift redistributes snow effectively. Although this comparison was conducted only from five months of valid measurements in the first location, it still highlights the spatial variation of AWS parameters in the GGP valley basin.
3.7 Glacier snow chemistry
The highest snow impurity content was measured in the surface of pit 1 in 2019, with elevated carbonaceous particles and trace elements, which were dominated by aluminum and iron at 18.1 and 12.0 µg ml−1, respectively.
A secondary elevated impurity layer was observed at the bottom of the pit, and this layer can indicate the previous year's surface layer with the higher concentration being due to melt amplification, commonly observed in glacier snow pits (Doherty et al., 2013). Between these layers, the impurity concentrations remained relatively low, about 10 % of those in the surface layer. A similar pattern for snow impurities was observed in pit 2.
3.8 Glacier surface reflectance
Examples of measured reflectance are presented in Fig. 9a–c. In 2019, the highest reflectance values were recorded in the upper section, ranging from about 0.70 at wavelengths below 400 nm to 0.95 near 700 nm. The midsection showed similar spectral shapes but lower values (0.25–0.55). Both zones were associated with visually brownish impurities which had similar chemical compound signatures. The black and red impurity spots in the midsection had even lower reflectance (Fig. 9b), which had coinciding chemical compositions, with elevated ammonium amounts. The dip in the spectral curve at around 680 nm is likely related to chlorophyll absorption, which would arise from glacier algae being present.
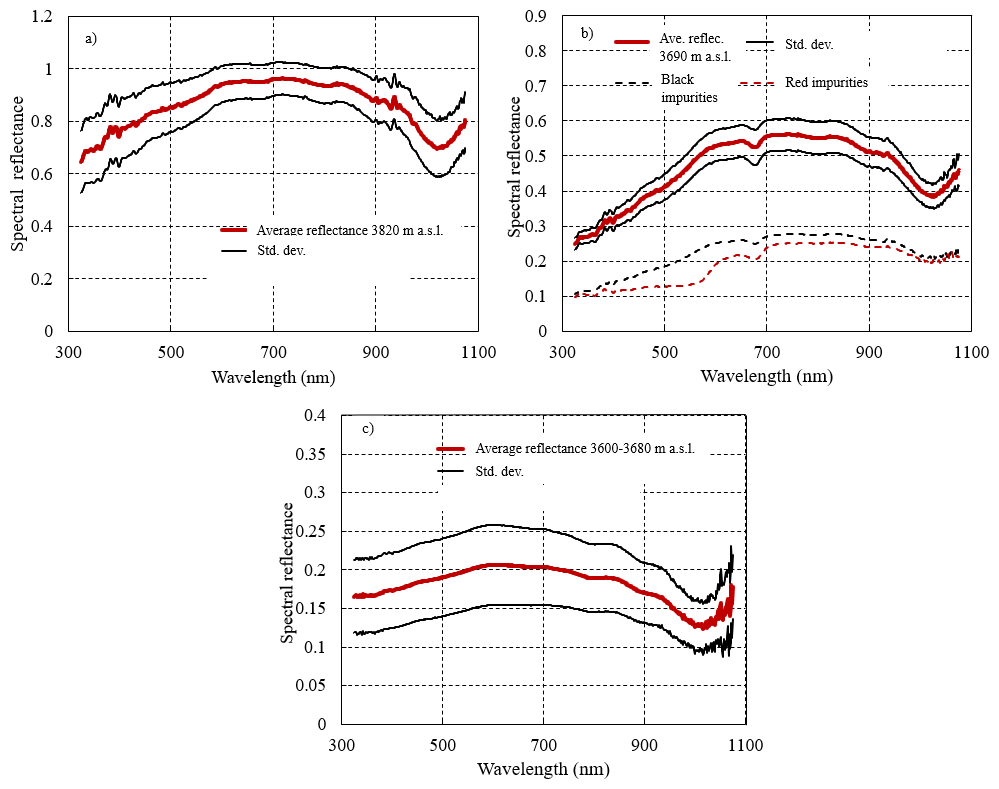
Figure 9Average reflectance and standard deviation of reflectance measurements of the glacier surface with black, brownish and red impurities. (a) Higher section of GGP 2019. (b) Mid-section of GGP in 2019. (c) Ablation zone in 2023.
For the 2023 reflectance measurements, the curves were consistently low, remaining close to 0.20 across all wavelengths (Fig. 9c), highlighting the lack of glacier snow, but rather, the lower reflectance of glacier ice.
3.9 Atmospheric aerosol
Black carbon concentrations ranged from 200 ng m−3 (25th percentile) up to 930 ng m−3 (75th percentile) during individual expeditions with average campaign concentrations varying between 400 and 550 ng m−3 (Fig. 10). The observed particle number concentration was 1850±810 cm−3, while the particulate mass concentrations for PM1, PM2.5 and PM10 were 5.6±0.3, 7.5±1.1 and 14.6±6.4 µg m−3, respectively.
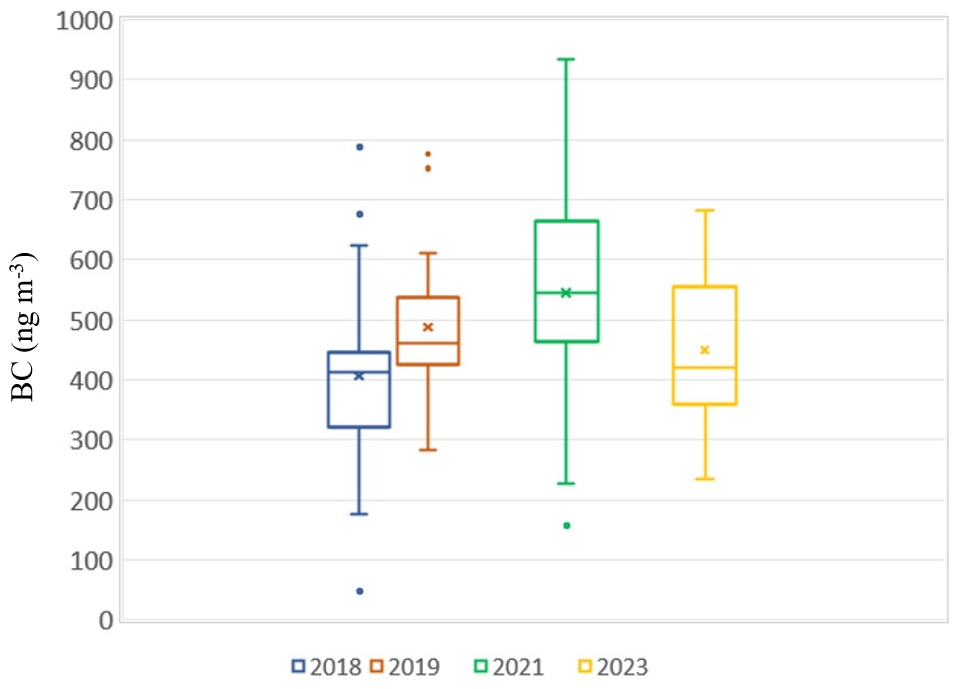
Figure 10Black carbon (BC) concentration distributions during expedition periods in 2018–2023, with the boxes representing 25th and 75th percentiles and the line and cross inside the box are the median and mean, respectively. The outer lines represent the 10th and 90th percentiles.
The black carbon concentrations were relatively high for a remote location, comparable to those encountered in European background locations (e.g., Savadkoohi et al., 2023). The average absorption Ångström exponent derived from the wavelength dependence of the absorption coefficient was 1.45 during the 2023 campaign, indicating based on the “Aethalometer model” (Sandradewi et al., 2008) that 58 % of the absorption was caused by fossil fuel burning sources, and 42 % by biomass burning sources. Although the particle number- and particulate mass concentrations were measured only for a brief period in 2018, and the values may not be representative of the prevailing atmospheric conditions, they are reported here as these are the very first data of its kind from the region. The observed particle number concentration is comparable to levels measured in European rural areas (Rose et al., 2021). The PM2.5 concentration was 50 % of the World Health Organization (2021) 24 h guideline value of 15 µg m−3 and 32 % of the 24 h PM10 guideline value of 45 µg m−3.
3.10 Limitations of the datasets
In this work we used freely available historical satellite images in our analysis, with their relatively coarse spatial resolution, limiting the suitability of the remote sensing data to be compared with the in-situ measurements (e.g. ice terminus location using handheld GPS). Considering the size of GGP (being a small valley glacier), future work should consider using commercial images at a higher spatial resolution (<1 m). The spatial offsets in the UAV data limits the comparability of the DSMs and orthomosaics interannually currently. In order to reduce these offsets, future work should increase the quantity and quality of the GCPs and CPs (also outlined in Sect. 2.2). The year-round operation of the automated AWS station suffered from the harsh environmental conditions which at times affected the data availability. In addition, the in-situ atmospheric aerosol measurements are limited in coverage, while it remains a topic for future studies to discover their wider regional or seasonal representativeness.
The data sets are freely available at the public FMI data repository METIS, https://doi.org/10.57707/fmi-b2share.t4vwg-gf542 (Svensson et al., 2026; last access: 16 June 2026). Satellite imagery used in this manuscript can be freely acquired in google earth engine. The data report (which includes map) from 1973 expedition is available upon request from the Tajikhydromet (Vladimirova et al., 1976).
This paper presents cryospheric and atmospheric data sets that have been collected from the Zarafshon River Basin and GGP glacier in Tajikistan (Svensson et al., 2026). Starting in 2018, with the installation of an AWS during the first field campaign, data have been collected in annual field expeditions until 2025 (except in 2020 and 2022). The in situ glaciological observations have been made over different spatial resolutions, and include terminus location, ablation stakes, snow conditions, as well as characterizing the glacier with UAV aerial photography. Complementary satellite imagery, with intermittent temporal resolution dating back to 1989, as well as a digitized archived map of the glacier outline dating back to 1973 (Vladimirova et al., 1976), were processed for this work to further compare and characterize GGP. The surface conditions of the glacier were determined during field campaigns with synchronized surface reflectance measurements and snow sample chemical analysis. In addition, atmospheric aerosols were characterized at selected times.
Meteorological parameters from the AWS have been continuously measured since the installation in 2018 and have over 60 % data coverage until 2025. The dataset presented here consists of a diverse range of parameters, that can be used as model inputs or for model validation, as well as ground truthing for remote sensing. More specifically, the overall glacier changes over long time periods or the high precision orthomosaics offer the possibility to study both fine and coarse scale processes occurring at the glacier. The combination of ground-based spectral reflectance and concurrent snow chemistry data for glacier surfaces are rare, yet most valuable for verifying model results or remote sensing observations on glacier surface. This is especially true coupled to the darkening of the glacier surface, by snow impurities. The spectral data presented for this particular natural environment is invaluable since they are measured for different snow impurities. Combined with the snow chemistry data set, the surface radiative budget of the glacier can be further studied.
The general results of the GGP front display significant retreat of the terminus along with low snow cover during the last years (2021–2024). These findings are consistent with other recent reports, which are describing unprecedent loss of glaciers and snow mass in different environments globally (e.g., Hassan et al., 2024; Menounos et al., 2025). Hence, it is of great interest for the community to have access to observational data in situ, especially in regions where data is scarce.
The supplement related to this article is available online at https://doi.org/10.5194/essd-18-5697-2026-supplement.
The preparation and execution of field expeditions were made by JSv., RR, AH, MS, TJ, AH, DR, HK, DB, VL, KL, AL, GPF, EA, and AH. Data processing was conducted or assisted by JSv, RR, KN, AH, MS, DB, VL, KL, AL, GPF, MR, OM, JSt, EA, AH. The paper was written by JSv and AH with input from co-authors. All authors have agreed on the submitted version of this manuscript.
The contact author has declared that none of the authors has any competing interests.
Publisher's note: Copernicus Publications remains neutral with regard to jurisdictional claims made in the text, published maps, institutional affiliations, or any other geographical representation in this paper. The authors bear the ultimate responsibility for providing appropriate place names. Views expressed in the text are those of the authors and do not necessarily reflect the views of the publisher.
The authors wish to thank the support and hard work by numerous people throughout the different expeditions. JSv acknowledges the support from the Otto Malm foundation.
This work has been supported by the ministry of foreign affairs of Finland through the projects FINTAJ II and III. This work has also been supported by the Atmosphere and Climate Competence Center (ACCC) of the Research Council of Finland (projects 337552, 357904, 359342), and by the Black and Brown Carbon in the Atmosphere and the Cryosphere (BBrCAC project no. 341271).
This paper was edited by Baptiste Vandecrux and reviewed by Signe Hillerup Larsen and one anonymous referee.
Aizen, V., Aizen, E., and Melack, J.: Climate, snow cover, glaciers, and runoff in the Tien Shan, Central Asia, Water Resour., 31, 1113–1129, 1995.
Barandun, M. and Pohl, E.: Central Asia's spatiotemporal glacier response ambiguity due to data inconsistencies and regional simplifications, The Cryosphere, 17, 1343–1371, https://doi.org/10.5194/tc-17-1343-2023, 2023.
Barandun, M., Fiddes, J., Scherler, M., Mathys, T., Saks, T., Petrakov, D., and Hoelzle, M.: The state and future of the cryosphere in Central Asia, Water Secur., 11, 100072, https://doi.org/10.1016/j.wasec.2020.100072, 2020.
Beck, H. E., Wood, E. F., McVicar, T. R., Zambrano-Bigiarini, M., Alvarez-Garreton, C., Baez-Villanueva O. M., McVicar, T. R., Sheffield, J., and Karger, D. N.: Bias Correction of Global High-Resolution Precipitation Climatologies Using Streamflow Observations from 9372 Catchments, J. Climate, 33, 1299–1315, https://doi.org/10.1175/JCLI-D-19-0332.1, 2020.
Birch, M. E. and Cary, R. A.: Elemental carbon-based method for monitoring occupational exposures, to particulate diesel exhaust, Aerosol Sci. Tech., 25, 221–241, https://doi.org/10.1080/02786829608965393, 1996.
Cavalli, F., Viana, M., Yttri, K. E., Genberg, J., and Putaud, J.-P.: Toward a standardised thermal-optical protocol for measuring atmospheric organic and elemental carbon: the EUSAAR protocol, Atmos. Meas. Tech., 3, 79–89, https://doi.org/10.5194/amt-3-79-2010, 2010.
Chen, Y., Li, W., Deng, H., Fang, G., and Li, Z.: Changes in Central Asia's Water Tower: Past, Present and Future, Sci., Rep., 6, 35458, https://doi.org/10.1038/srep35458, 2016.
Cogley, J. G., Hock, R., Rasmussen, L. A., Arendt, A. A., Bauder, A., Braithwaite, R. J., Jansson, P., Kaser, G., Möller, M., Nicholson, L., and Zemp, M.: Glossary of Glacier Mass Balance and Related Terms, IHP-VII Technical Documents in Hydrology No. 86, IACS Contribution No. 2, UNESCO-IHP, Paris, https://doi.org/10.5167/uzh-53475, 2011.
Crawford, C. J., Roy, D. P., Arab, S., Barnes, C., Vermote, É., Hulley, G., Gerace, A., Choate, M. J., Engebretson, C., Micijevic, E., Schmidt, G. L., Anderson, C., Anderson, M. C., Bouchard, M., Cook, B. D., Dittmeier, R., Howard, D. M., Jenkerson, C. B., Kim, M., Kleynhans, T., Maiersperger, T., Mueller, C., Neigh, C. S. R., Owen, L. R., Page, B. P., Pahlevan, N., Rengarajan, R., Roger, J. C., Sayler, K. L., Scaramuzza, P., Skakun, S., Yan, L., Zhang, H. K., Zhu, Z., and Zahn, S.: The 50-year Landsat collection 2 archive, Sci. Remote Sens., 8, 100103, https://doi.org/10.1016/j.srs.2023.100103, 2023.
Doherty, S. J., Grenfell, T. C., Forsstrom, S., Hegg, D. L., Brandt, R. E., and Warren, S. G.: Observed vertical redistribution of black carbon and other insoluble light-absorbing particles in melting snow, J. Geophys. Res.-Atmos., 118, 5553–5569, https://doi.org/10.1002/jgrd.50235, 2013.
Drusch, M., Del Bello, U., Carlier, S., Colin, O., Fernandez, V., Gascon, F., Hoersch, B., Isola, C., Laberinti, P., Martimort, P., Meygret, A., Spoto, F., Sy, O., Marchese, F., and Bargellini, P.: Sentinel-2: ESA's Optical High-Resolution Mission for GMES Operational Services, Remote Sens. Environ., 120, 25–36, https://doi.org/10.1016/j.rse.2011.11.026, 2012.
Hassan, W. U., Nayak M. A., Saharwardi, M. S., Dar, J. A., Dasari, H. P., Hoteit, I., and Abualnaja, Y.: Unveiling the devastating effect of the spring 2022 mega-heatwave on the South Asian snowpack, Commun. Earth Environ., 5, https://doi.org/10.1038/s43247-024-01857-y, 2024.
Hoelzle, M., Azisov, E., Barandun, M., Huss, M., Farinotti, D., Gafurov, A., Hagg, W., Kenzhebaev, R., Kronenberg, M., Machguth, H., Merkushkin, A., Moldobekov, B., Petrov, M., Saks, T., Salzmann, N., Schöne, T., Tarasov, Y., Usubaliev, R., Vorogushyn, S., Yakovlev, A., and Zemp, M.: Re-establishing glacier monitoring in Kyrgyzstan and Uzbekistan, Central Asia, Geosci. Instrum. Method. Data Syst., 6, 397–418, https://doi.org/10.5194/gi-6-397-2017, 2017.
Marks, D. and Dozier, J.: Climate and energy exchange at the snow surface in the alpine region of the Sierra Nevada 2, Snow cover energy balance, Water Resour. Res. 28, 3043–3054, https://doi.org/10.1029/92WR01483, 1992.
Menounos, B., Huss, M., Marshall, S., Ednie, M., Florentine, C., and Hartl, L.: Glaciers in Western Canada-conterminous US and Switzerland experience unprecedented mass loss over the last four years (2021–2024), Geophys. Res. Lett., https://doi.org/10.1029/2025GL115235, 2025.
Moon, T. and Joughin, I.: Changes in ice front position on Greenland's outlet glaciers from 1992 to 2007, J. Geophys. Res., 113, F02022, https://doi.org/10.1029/2007JF00092, 2008.
Pohl, E., Gloaguen, R., Andermann, C., and Knoche, M.: Glacier melt buffers river runoff in the Pamir Mountains, Water Resour. Res., 53, 2467–2489, 2017.
Pritchard, H. D.: Asia's shrinking glaciers protect large populations from drought stress, Nature, 569, 649–654, https://doi.org/10.1038/s41586-019-1240- 1, 2019.
Pritchard, H. D.: Global data gaps in our knowledge of the terrestrial cryosphere, Front. Clim., 3, 689823, https://doi.org/10.3389/fclim.2021.689823, 2021.
Rose, C., Collaud Coen, M., Andrews, E., Lin, Y., Bossert, I., Lund Myhre, C., Tuch, T., Wiedensohler, A., Fiebig, M., Aalto, P., Alastuey, A., Alonso-Blanco, E., Andrade, M., Artíñano, B., Arsov, T., Baltensperger, U., Bastian, S., Bath, O., Beukes, J. P., Brem, B. T., Bukowiecki, N., Casquero-Vera, J. A., Conil, S., Eleftheriadis, K., Favez, O., Flentje, H., Gini, M. I., Gómez-Moreno, F. J., Gysel-Beer, M., Hallar, A. G., Kalapov, I., Kalivitis, N., Kasper-Giebl, A., Keywood, M., Kim, J. E., Kim, S.-W., Kristensson, A., Kulmala, M., Lihavainen, H., Lin, N.-H., Lyamani, H., Marinoni, A., Martins Dos Santos, S., Mayol-Bracero, O. L., Meinhardt, F., Merkel, M., Metzger, J.-M., Mihalopoulos, N., Ondracek, J., Pandolfi, M., Pérez, N., Petäjä, T., Petit, J.-E., Picard, D., Pichon, J.-M., Pont, V., Putaud, J.-P., Reisen, F., Sellegri, K., Sharma, S., Schauer, G., Sheridan, P., Sherman, J. P., Schwerin, A., Sohmer, R., Sorribas, M., Sun, J., Tulet, P., Vakkari, V., van Zyl, P. G., Velarde, F., Villani, P., Vratolis, S., Wagner, Z., Wang, S.-H., Weinhold, K., Weller, R., Yela, M., Zdimal, V., and Laj, P.: Seasonality of the particle number concentration and size distribution: a global analysis retrieved from the network of Global Atmosphere Watch (GAW) near-surface observatories, Atmos. Chem. Phys., 21, 17185–17223, https://doi.org/10.5194/acp-21-17185-2021, 2021.
Sandradewi, J., Prévôt, A., Szidat, S., Perron, N., Alfarra, M., Lanz, V., Weingartner, E., and Baltensperger, U.: Using aerosol light absorption measurements for the quantitative determination of wood burning and traffic emission contributions to particulate matter, Environ. Sci. Technol., 42, 3316–3323, https://doi.org/10.1021/es702253m, 2008.
Savadkoohi, M., Pandolfi, M., Reche, C., Niemi, J. V., Mooibroek, D., Titos, G., Green, D. C., Tremper, A. H., Hueglin, C., Liakakou, E., Mihalopoulos, N., Stavroulas, I., Artiñano, B., Coz, E., Alados-Arboledas, L., Beddows, D., Riffault, V., De Brito, J. F., Bastian, S., Baudic, A., Colombi, C., Costabile, F., Chazeau, B., Marchand, N., Gómez-Amo, J. L., Estellés, V., Matos, V., van der Gaag, E., Gille, G., Luoma, K., Manninen, H. E., Norman, M., Silvergren, S., Petit, J.-E., Putaud, J.-P., Rattigan, O. V., Timonen, H., Tuch, T., Merkel, M., Weinhold, K., Vratolis, S., Vasilescu, J., Favez, O., Harrison, R. M., Laj, P., Wiedensohler, A., Hopke, P. K., Petäjä, T., Alastuey, A., and Querol, X.: The variability of mass concentrations and source apportionment analysis of equivalent black carbon across urban Europe, Environ. Int., 178, 108081, https://doi.org/10.1016/j.envint.2023.108081, 2023.
Svensson, J., Ström, J., Kivekäs, N., Dkhar, N. B., Tayal, S., Sharma, V. P., Jutila, A., Backman, J., Virkkula, A., Ruppel, M., Hyvärinen, A., Kontu, A., Hannula, H.-R., Leppäranta, M., Hooda, R. K., Korhola, A., Asmi, E., and Lihavainen, H.: Light-absorption of dust and elemental carbon in snow in the Indian Himalayas and the Finnish Arctic, Atmos. Meas. Tech., 11, 1403–1416, https://doi.org/10.5194/amt-11-1403-2018, 2018.
Svensson, J., Rakhmonov, R., Nazirzoda, K., Shodmonov, M., Brus, D., Le, V., Luoma, K., Lemos, A., Ruppel, M., Meinander, O., Ström, J., Asmi, E., Fogwill, G. P., Hojiev, A., Jurabekov, T., Hiyoev, A., Rahimzoda, D., Kholzoda, H., and Hyvärinen, A.-P.: Data for manuscript: “Atmospheric and cryospheric observations at the high-altitude Zarafshon River Basin and the hydrographic party glacier (GGP), Tajikistan”, Finnish Meteorological Institute [data set], https://doi.org/10.57707/fmi-b2share.t4vwg-gf542, 2026.
Vladimirova, V. N., Uskov, Y. S., Kuznetsov, N. A., Department of Hydrometeorology of the Tajik SSR: Technical report on glaciological work on the GGP ice cap, Main Department of Hydrometeorological Service of the USSR CM, Dushanbe, 1976.
World Health Organization: WHO global air quality guidelines: particulate matter (PM2.5 and PM10), ozone, nitrogen dioxide, sulfur dioxide and carbon monoxide, ISBN: 9789240034228, 2021.
You, Q., Cai, Z., Pepin, N., Chen, D., Ahrens, B., Jiang, Z., Wu, F., Kang, S., Zhang, R., Wu, T., Wang, P., Li, M., Zuo, Z., Gao, Y., Zhai, P., and Zhang, Y.: Warming amplification over the Arctic Pole and Third Pole: Trends, mechanisms and consequences, Earth Sci. Rev., 217, 103625, https://doi.org/10.1016/j.earscirev.2021.103625, 2021.
Zech, C., Schöne, T., Illigner, J., Stolarczuk, N., Queißer, T., Köppl, M., Thoss, H., Zubovich, A., Sharshebaev, A., Zakhidov, K., Toshpulatov, K., Tillayev, Y., Olimov, S., Paiman, Z., Unger-Shayesteh, K., Gafurov, A., and Moldobekov, B.: Hydrometeorological data from a Remotely Operated Multi-Parameter Station network in Central Asia, Earth Syst. Sci. Data, 13, 1289–1306, https://doi.org/10.5194/essd-13-1289-2021, 2021.
Zhang, Y., Kang, S., Gao, T., Kang, S., Shangguan, D., and Luo, X.: Albedo reduction as an important driver for glacier melting in Tibetan Plateau and its surrounding areas, Earth Sci. Rev., 220, 103735, https://doi.org/10.1016/j.earscirev.2021.103735, 2021.