the Creative Commons Attribution 4.0 License.
the Creative Commons Attribution 4.0 License.
 | 20 Jul 2026

The Greenland GNSS Network (GNET): geodetic grade GNSS measurements of Greenland's 3D bedrock displacement from 1995–2025
Finn Bo Madsen
Malte Winther-Dahl
Thomas Henry Nylen
Danjal Longfors Berg
Ole Bjerregaard
Javed Hassan
Per Knudsen
Michael Bevis
Shfaqat Abbas Khan
The Greenland GNSS Network (GNET) consists of 71 individual geodetic-grade Global Navigation Satellite Systems (GNSS) stations mounted directly in bedrock located along the perimeter of the Greenland Ice Sheet (GrIS). The first continuously running GNSS (cGNSS) station was set up in 1995 and has been running up to date. During the fourth International Polar Year (IPY) 2007–2008, GNET was established with the expansion of 49 stations. As of 2025, the network has expanded to include 19 town sites and 48 remote sites. Over time, the installations have undergone various updates, helping to stabilize and improve the return observations from the network. The original installations were done using Global Positioning System (GPS)-only receivers; these have, with time, been changed to receivers capable of tracking multiple constellations. Operating cGNSS stations in the remote high Arctic is troublesome, giving rise to data gaps and/or downtime for stations in the network. Here we present the most comprehensive dataset from 1995 to 2025, for which Receiver Independent Exchange Format (RINEX) v2 and/or v3 daily files are now available, see Table B1. Processed daily East-North-Up (ENU) time series for all sites is available at https://doi.org/10.11583/DTU.31397901 (Solgaard et al., 2026a), and extensive metadata logfiles documenting the entire lifespan of the specific stations can be found here (The Danish Agency for Climate Data (KDS), 2026b). Photos of the stations can be found on (https://go-gnet.org/, last access: 16 March 2026). Through a noise characterization analysis, we show that a fractional Gaussian noise profile is expected. Furthermore, we compare our processed ENU time series with already published subsets of the full dataset from independent processing centers. Here, we conclude that the DTU release is significantly more stable in the horizontal components compared to other publicly available products.
- Article
(11686 KB) - Full-text XML
- BibTeX
- EndNote


Understanding the response of the solid Earth to current and past changes in the Greenland Ice Sheet (GrIS) is fundamental for quantifying mass balance, constraining Glacial Isostatic Adjustment (GIA), and improving projections of sea-level change. Continuous Global Navigation Satellite System (cGNSS) measurements have become indispensable for detecting the elastic and viscoelastic deformation associated with ice-mass variability, e.g., Bevis et al. (2012), Khan et al. (2010a), and Simpson et al. (2011). To address the need for a high-precision geodetic observation system in this rapidly changing region, the Greenland GNSS Network (GNET) was established as a distributed array of continuously operating geodetic-grade GPS/GNSS stations along the perimeter of Greenland during the 4th International Polar Year (IPY) (2007–2008). Since its inception, GNET has provided critical constraints for studies of ice-mass changes (Khan et al., 2010b; Kjeldsen et al., 2013; Barletta et al., 2024), elastic displacement and loading signals (Liu et al., 2017; Nielsen et al., 2012), longer-term visco-elastic deformation (Khan et al., 2016; Berg et al., 2025, 2024), and the sensitivity of the ice sheet to atmospheric forcing (Bevis et al., 2019), along with other studies. See the full publication list using data from GNET at https://go-gnet.org/ (last access: 16 March 2026).
With close to two decades of continuous operation at most GNET sites, it is now possible to perform a comprehensive quality assessment of the network. The aim of this study is to evaluate the performance of each station in terms of daily data-return performance, noise characteristics, and overall stability. In addition, we compare the processed time series with previously published processed ENU time series from the Nevada Geodetic Laboratory (NGL), which performs high-volume processing of international GNSS networks currently on the order of 17 000 stations daily, which are prone to errors (Blewitt et al., 2018) as well as with time series processed by the Jet Propulsion Laboratory (JPL) (Heflin et al., 2020). The dataset published here provides one of the most complete geodetic records of Greenland’s crustal motion as measured by permanent GNSS stations mounted in bedrock. By consolidating all GNET observations within an open, versioned, findable, and citable repository, we aim to;
-
Enhance transparency and reproducibility.
-
Enable improved integration of GNSS observations with gravimetry, altimetry, and numerical modeling.
-
Support the development of refined GIA models, elastic loading, and mass-balance models for Greenland (Khan et al., 2016; Barletta et al., 2024).
This release establishes a robust geodetic reference frame for tracking long-term solid-Earth processes, including lithospheric displacement, regional tectonics, and sea-level-driven loading, in one of the fastest-evolving cryospheric environments on Earth (Greene et al., 2024).
With this publication, we present the most comprehensive release of the GNET data archive, which Includes: (1) Raw GPS/GNSS observations spanning the full operational history of the network, plus additional older stations predating GNET, provided in standardized RINEX format; (2) Processed ENU displacement time series, based upon the GypsyX processing methodology; (3) the complete metadata record, including equipment histories, monument details, site geology, data quality, and return statistics for each station.
In the following sections, we describe the history of GNSS monitoring in Greenland both prior and after the establishment of GNET, including the original and current configuration of GNET. We then detail the data acquisition and processing pipelines, evaluation of the framework stability for each GNSS site. Next, we provide metadata and availability for each site, a comparison with already published time series from other institutions. Finally, we outline the main structure of the released dataset.
1.1 History of GNSS monitoring in Greenland
The primary challenge for the International GPS Service for Geodynamics (IGS) in the mid 1990s was to improve the accuracy of the GPS satellite orbits by increasing the number and geographical distribution of the global tracking network. As an outcome of the IGS meeting in Pasadena 1994, the proposal for extension of the global network was suggested. Based on the suggested expansion of a global GNSS network from IGS in 1994, the first permanent GPS station was established at Thule Airbase (now Pituffik Space Base) in 1995.
During the mid/late 1990's national geodetic networks had to be re-measured with GNSS to meet the accuracy potential in GNSS as the global tracking network evolved and processing theory, techniques, and modelling of systematic errors were improved. First of all geodetic datums had to be changed from regional to global, and coordinates had to be realized in a Reference Frame where GPS-derived coordinates from the global tracking network contribute to orbit modelling. Establishment of permanent stations tracking GNSS signals serves two major purposes:
-
Support the international scientific community:
-
With data from IGS stations in Greenland to improve GNSS products like orbit and clocks, ionosphere and troposphere models, terrestrial reference frames, etc.
-
Reference for various scientific projects, e.g., airborne surveys of gravity, laser, radar, photo missions, etc.
-
-
Form the basic geometric infrastructure for:
-
GNSS-based measurements and definitions of national control networks and territorial base, e.g., Greenland Reference Frame 1996 (GRF96).
-
Topographical and nautical maps.
-
Positioning of critical infrastructure, e.g., airport runways, navigation instruments, etc.
-
In the 1990s the standard for national geodetic networks went from episodic GNSS campaign surveys between existing survey markers to a fundamental network of permanent GNSS stations monitoring station velocities rather than fixed coordinates. These permanent GNSS stations would then support episodic re-surveys of stations in the national networks, and repeated velocities derived from previous surveys can be compared to velocities from the permanent stations.
Before the GNET project, a general coverage of Greenland was planned with permanent sites in Thule, Upernavik, Kangerlussuaq, Qaqortoq, Kulusuk, Scoresbysund, Danmarkshavn and Station Nord. During the Reference Greenland Network campaign (1996–2001), this network was used to provide GNSS coordinates to about 100 existing survey markers with coordinates from episodic Transit Doppler or triangulation campaigns. When IGS was formally established in 1994 there were no firm standards for antenna monuments. Standards have developed over time, and early built monuments were, in some cases, replaced with new ones to match up with standards.
1.2 Permanent GNSS stations established prior to GNET (including replacement stations)
THU1: In May 1995, the first IGS station in Greenland was established at Thule Airbase in collaboration with Bob Thomas from NASA/Langley Research Center, who supplied hardware in the form of an Allan Osborne Dorne Margolin T antenna and Rogue SNR-12 receiver. Monumentation was a metal platform attached to the roof of a flattop building, which was founded on three feet active frozen soil layer. THU2: In 1998 a new 1.5 m concrete pillar monument (THU2 43001M002) was established on solid bedrock in Thule. The pillar was formed as a truncated pyramid with a taper smaller than the chookering antenna diameter. THU2 supported the IGS International GLONASS Experiment IGEX-98, followed by the International GLONASS Service (IGLOS). The antenna was a combined GPS/GLONASS antenna (ASH701073.1), and the receiver was a combined GPS/Glonass Ashtech Z-18. The original antenna was changed to a Leica multi-frequency GNSS antenna (LEIAR20 with a LEIM radome) in August 2025, as the old antenna started to fail. THU4: To maintain continuity in station velocities in the IGS time series, a new monument (THU4 43001M003) was established in 2010 to accommodate tracking of multi-frequency GNSS constellations rather than changing the antenna in THU2. The new monument was a 2.5 m concrete pillar shaped as a truncated pyramid. THU4 was built 7 m north of THU2, and the antenna is at the same height as the THU2 antenna. KELY: Kellyville KELY was built in July 1995 on a proposal from Professor John Wahr from the University of Colorado, who wanted to study GIA and viscoelastic solid Earth response from mass balance change of the GrIS. Absolute gravity was measured at regular intervals with the FG5 gravimeter. The project was funded by the National Science Foundation (NSF), and the station was hosted by Stanford Research Institute (SRI). KELY was collocated with a 32 m parabola radar antenna for ionospheric studies of the upper atmosphere. The monument is a 1.5 m concrete pillar about 0.5 m wide. During the radar's operation, the GPS receiver was disconnected due to conflicting signals in the L-band. In May 2018, the facility's operation ended, and KELY was out of operation until DTU Space, on behalf of the Agency for Climate Data, reinstalled KELY with autonomous power and broadband data transmission in August 2020. When the plans for ending operations at Kellyville became public, DTU Space built a replacement station on Black Ridge near Kangerlussuaq Airport. KLSQ: Kangerlussauq KLSQ was built in June 2014 as a replacement for KELY, which was announced as decommissioned. The monument is a 2.5 m concrete pillar shaped as a truncated pyramid. There are about 4 years of data from both stations to transfer time series. KULU: Kulusuk KULU was built in June 1996, also on a proposal from Professor John Wahr, to study GIA and viscoelastic solid Earth response to mass changes of the GrIS. In Kulusuk, especially the response from dynamic discharge from the large glaciers with margins in fjords (Helheim-, Fenris-, and Midgårdsgletscher). In Kulusuk, absolute gravity measurements were performed at regular intervals. The monument was an existing camera monument from a former stellar triangulation experiment in the early 1970s. From the beginning, data were collected on a local PC and sent by ordinary post on floppy discs. Data return was rather poor due to the local power supply and PC problems. In 2023, the receiver was moved to the basement of Hotel Kulusuk to mitigate numerous power outages. SCOB: Ittoqqortoormiit (Scoresbysuund) SCOB was established in August 1997. The monument was a modified 3 m steel lamppost with a Trimble 4000 SSi receiver and “TRM29659.00 DOME” antenna. DOME was a custom-made plexiglass semi-hemispherical radome. The operation stopped in 2005. SCOR: In 2004, a new 1.5 m concrete pillar monument (SCOR 43006M002) was established about 22 m from SCOR. The pillar was formed as a truncated pyramid. QAQ1: Qaqortoq QAQ1 was established in September 2001. The monument is a 2.5 m concrete pillar shaped as a truncated pyramid. The antenna has been changed 4 times with GPS-only antennas due to antenna failures. The last antenna change was in 2003. QEQE: At Qeqertarsuaq QEQE a 1.5 m concrete pillar was established on solid bedrock in 2005. The pillar was formed as a truncated pyramid. In 2013, the GPS-only antenna was changed to a multi-frequency GNSS antenna. ILUL: Ilulissat ILUL was established in 2005 by DTU on behalf of Professor Tonie van Dam from University of Luxembourg. The location was Ilulissat Airport, and only a low monument was allowed. The monument consisted of 3 threaded 12 mm rods drilled into the bedrock. The antenna was mounted on a stainless steel disc. When the station went online, the ownership was transferred to DTU. AASI: Aasiaat AASI was established in 2005 by DTU on behalf of Professor Tonie van Dam from the University of Luxembourg. The location was Aasiaat Airport, and only a low monument was allowed. The monument consisted of 3 threaded 12 mm rods drilled into the bedrock. The antenna was mounted on a stainless steel disc. When the station went online, the ownership was transferred to DTU. The operation was stopped in 2023. AAS2: Aasiaat AAS2 was established in 2022. The monument is a 1 m aluminium pipe drilled into the bedrock. This new station was established to take over from the original AASI station; the switch was performed to improve the station's stability with an updated monument. UPVK: Upernavik UPVK was established in early 2007 at Upernavik Airport. Monument is a 1 m aluminium pipe drilled into the bedrock. NORD: Station Nord. In 2006, a 1.5 m concrete pillar was established in permanently frozen soil that was found 1 m below the surface. A layer of 0.5 m frozen soil was removed, and the floor of the excavation was levelled with loose soil. A concrete baseplate (1 × 1 × 0.3 m) for the pillar was pre-cast in a garage, transported, and lowered onto the floor of the excavation by a backhoe. The baseplate pillar consists of a square part from the base plate to 0.3 m above the terrain. From here, the pillar was formed as a truncated pyramid. Finally, the terrain was elevated by 0.5 m around the construction. For further information, we suggest looking into the IGS style logbooks.
1.3 The Greenland GNSS Network (GNET)
GNET was established as part of the Polar Earth Observing System (POLENET) during the 4th IPY (Hawley and Brunt, 2019). The original goal for the project was to observe and improve the understanding of ice-mass changes of the Greenland ice sheet. The original 58 cGNSS stations were established during three field seasons from 2007–2009 as a collaboration between several groups. The Ohio State University (OSU), the National Science Foundation (NSF), NASA's JPL, UNAVCO (now Earthscope), the University of Luxembourg, and the Technical University of Denmark (DTU). From the initial establishment of the network to 2019 the maintenance and development were shared and coordinated between OSU, UNAVCO, and DTU. As of January 2019, NSF and the Danish agency for data supply and efficiency (SDFE) (now the Danish Agency for Climate Data (KDS)) signed an agreement handing over the ownership of GNET to the Danish government. Since then, the ongoing development and maintenance of the network has been carried out in collaboration between KDS and DTU SPACE (Hawley et al., 2017). Since 2019, the network has been expanded further from the original 58 cGNSS stations (including the prior-GNET stations) to a total of 71 stations spread over 67 unique locations, as some stations share the same antenna, see Fig. 1 and Table 1.
Table 1List of the GNET GNSS sites with coordinates, station IDs, location names, date of installation, last valid epoch by January 2026, and station type. For the receiver type and antenna, we refer to the logbooks https://dataforsyningen.dk/data/4804 (last access: 16 March 2026) (The Danish Agency for Climate Data (KDS), 2026b). If no “Last valid Epoch” is listed, then the station was operational by the time of publishing. The coordinates in the list match the coordinates in the IGS logs.
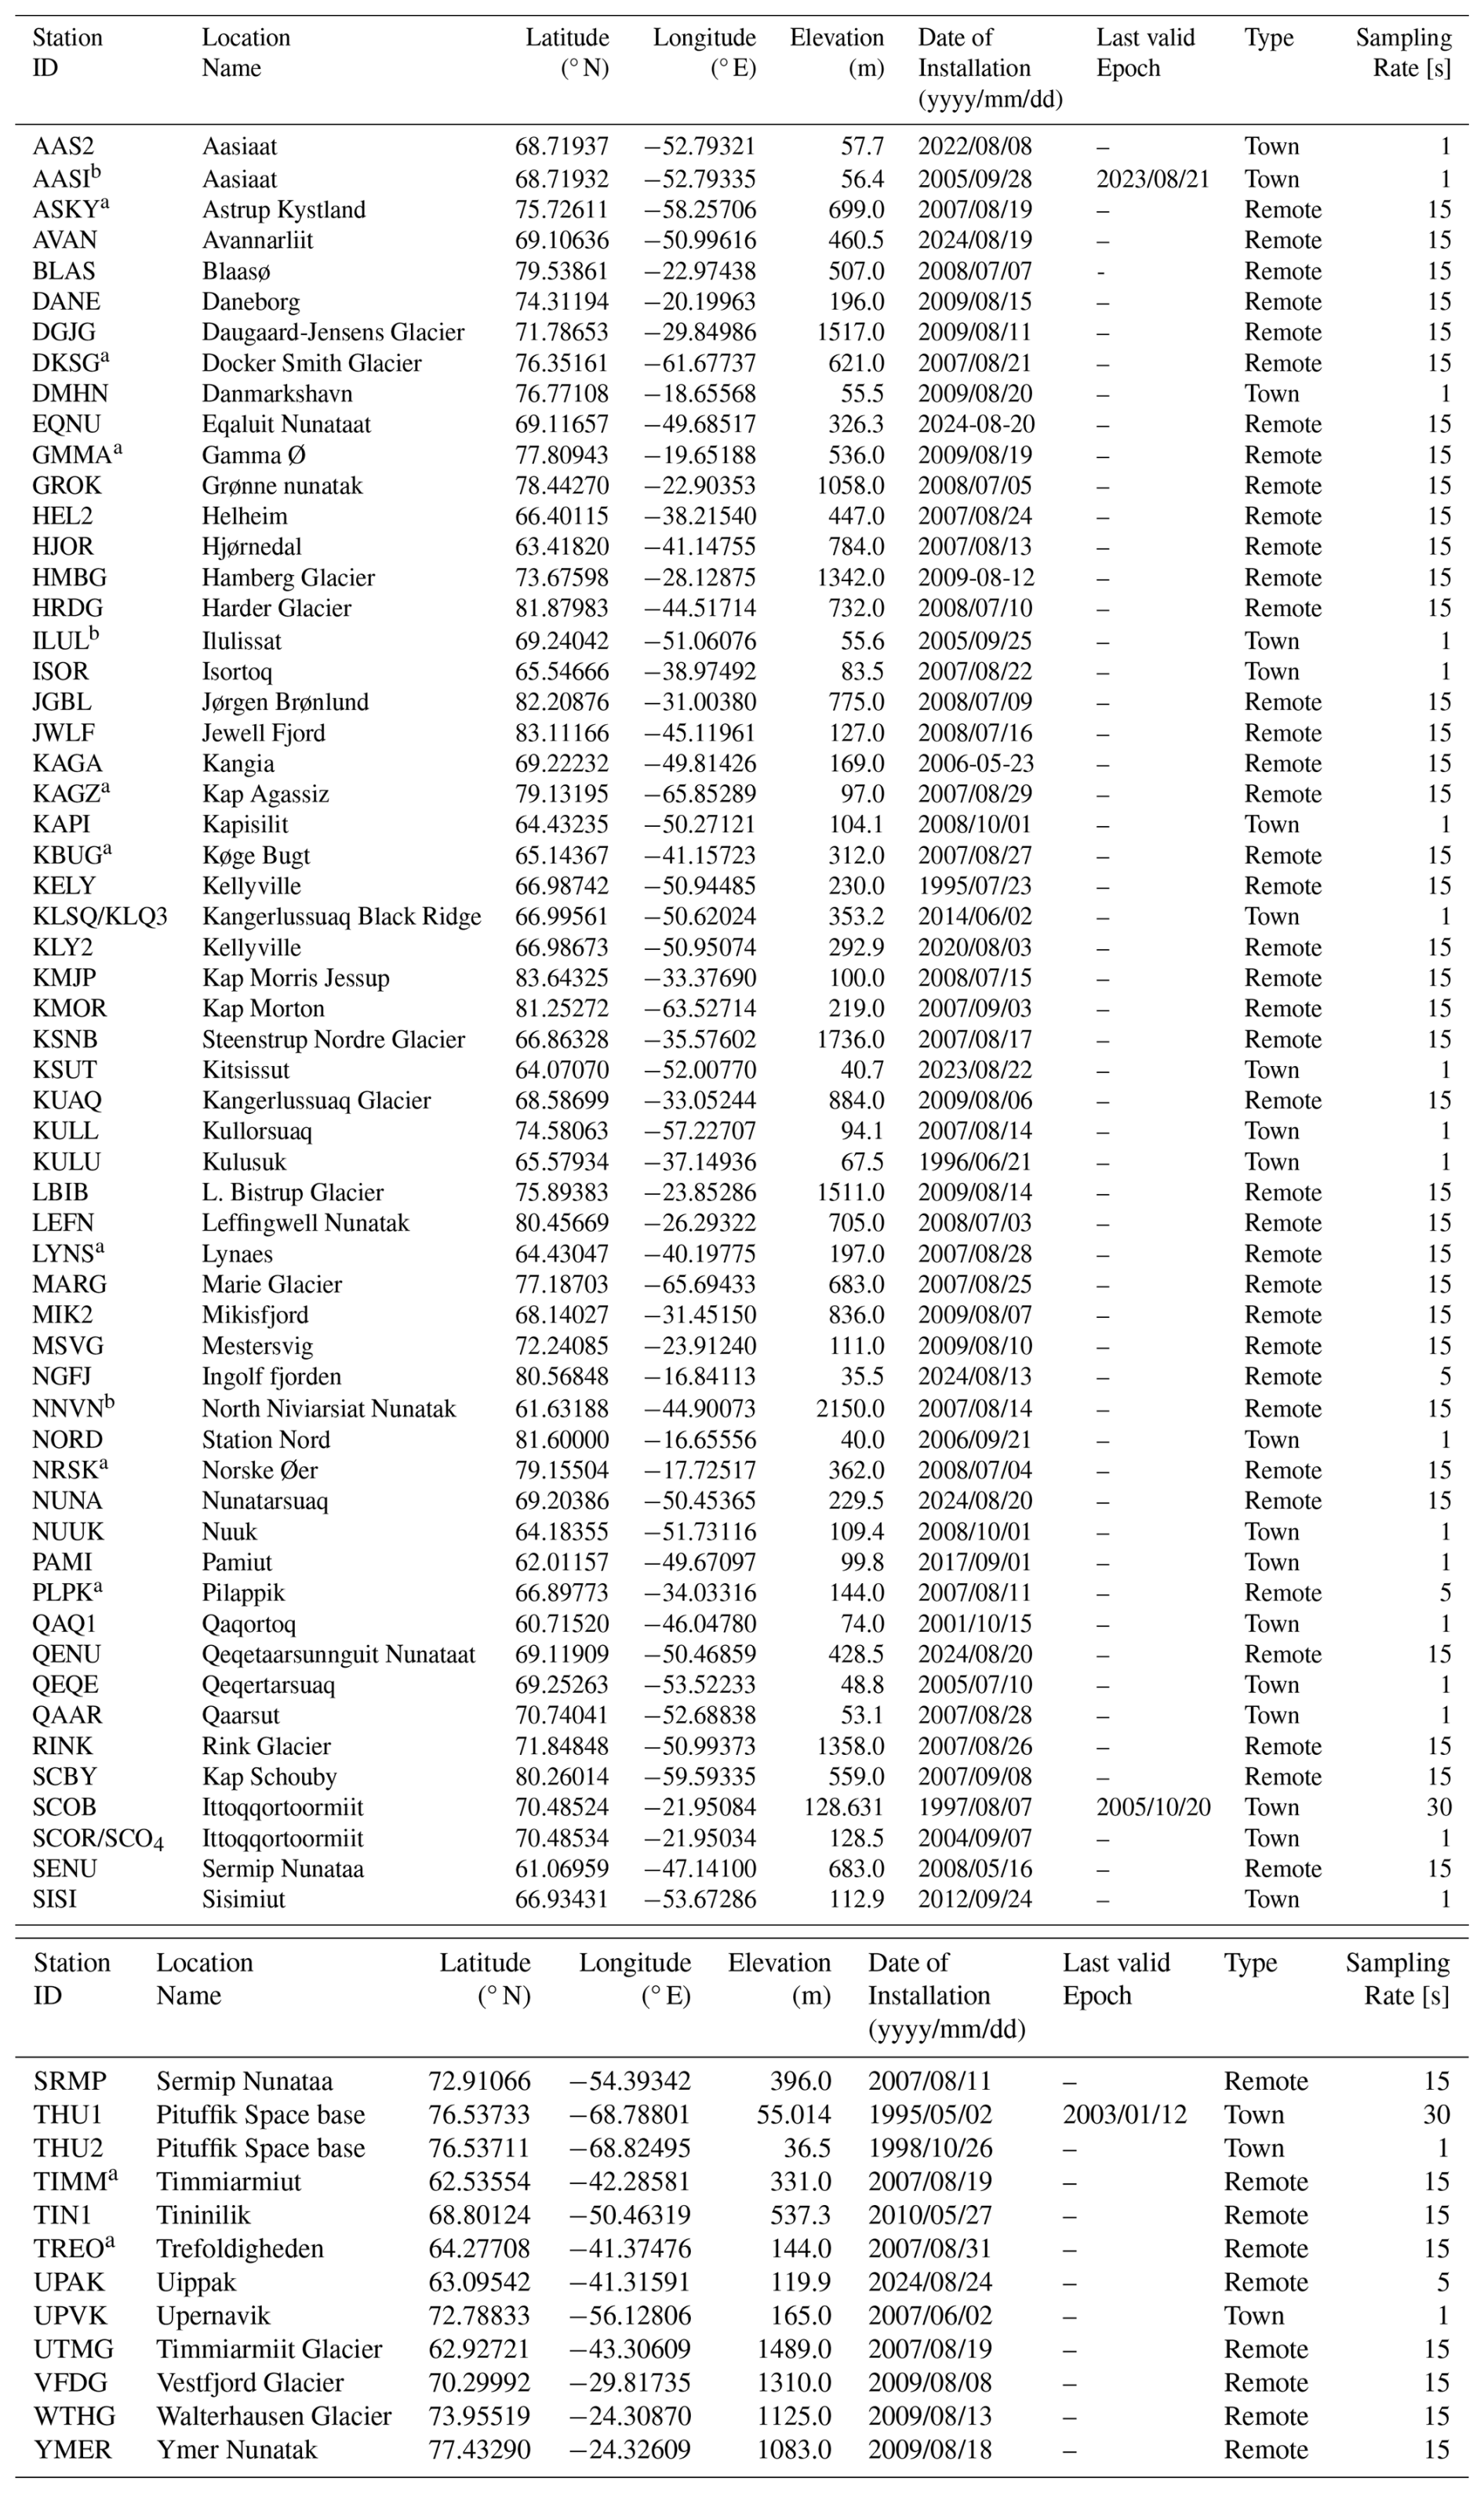
a denotes sites that the operational team, over the years, has identified as exposed to destructive wildlife encounters such as polar bears, foxes, wolves, etc. No record of the incident dates is available, we refer to Fig. 9 for data availability for each site. b denotes sites which, due to antenna monumentation or geographic location, have had problems with snow cover, see Sect. 2.3 for further information.
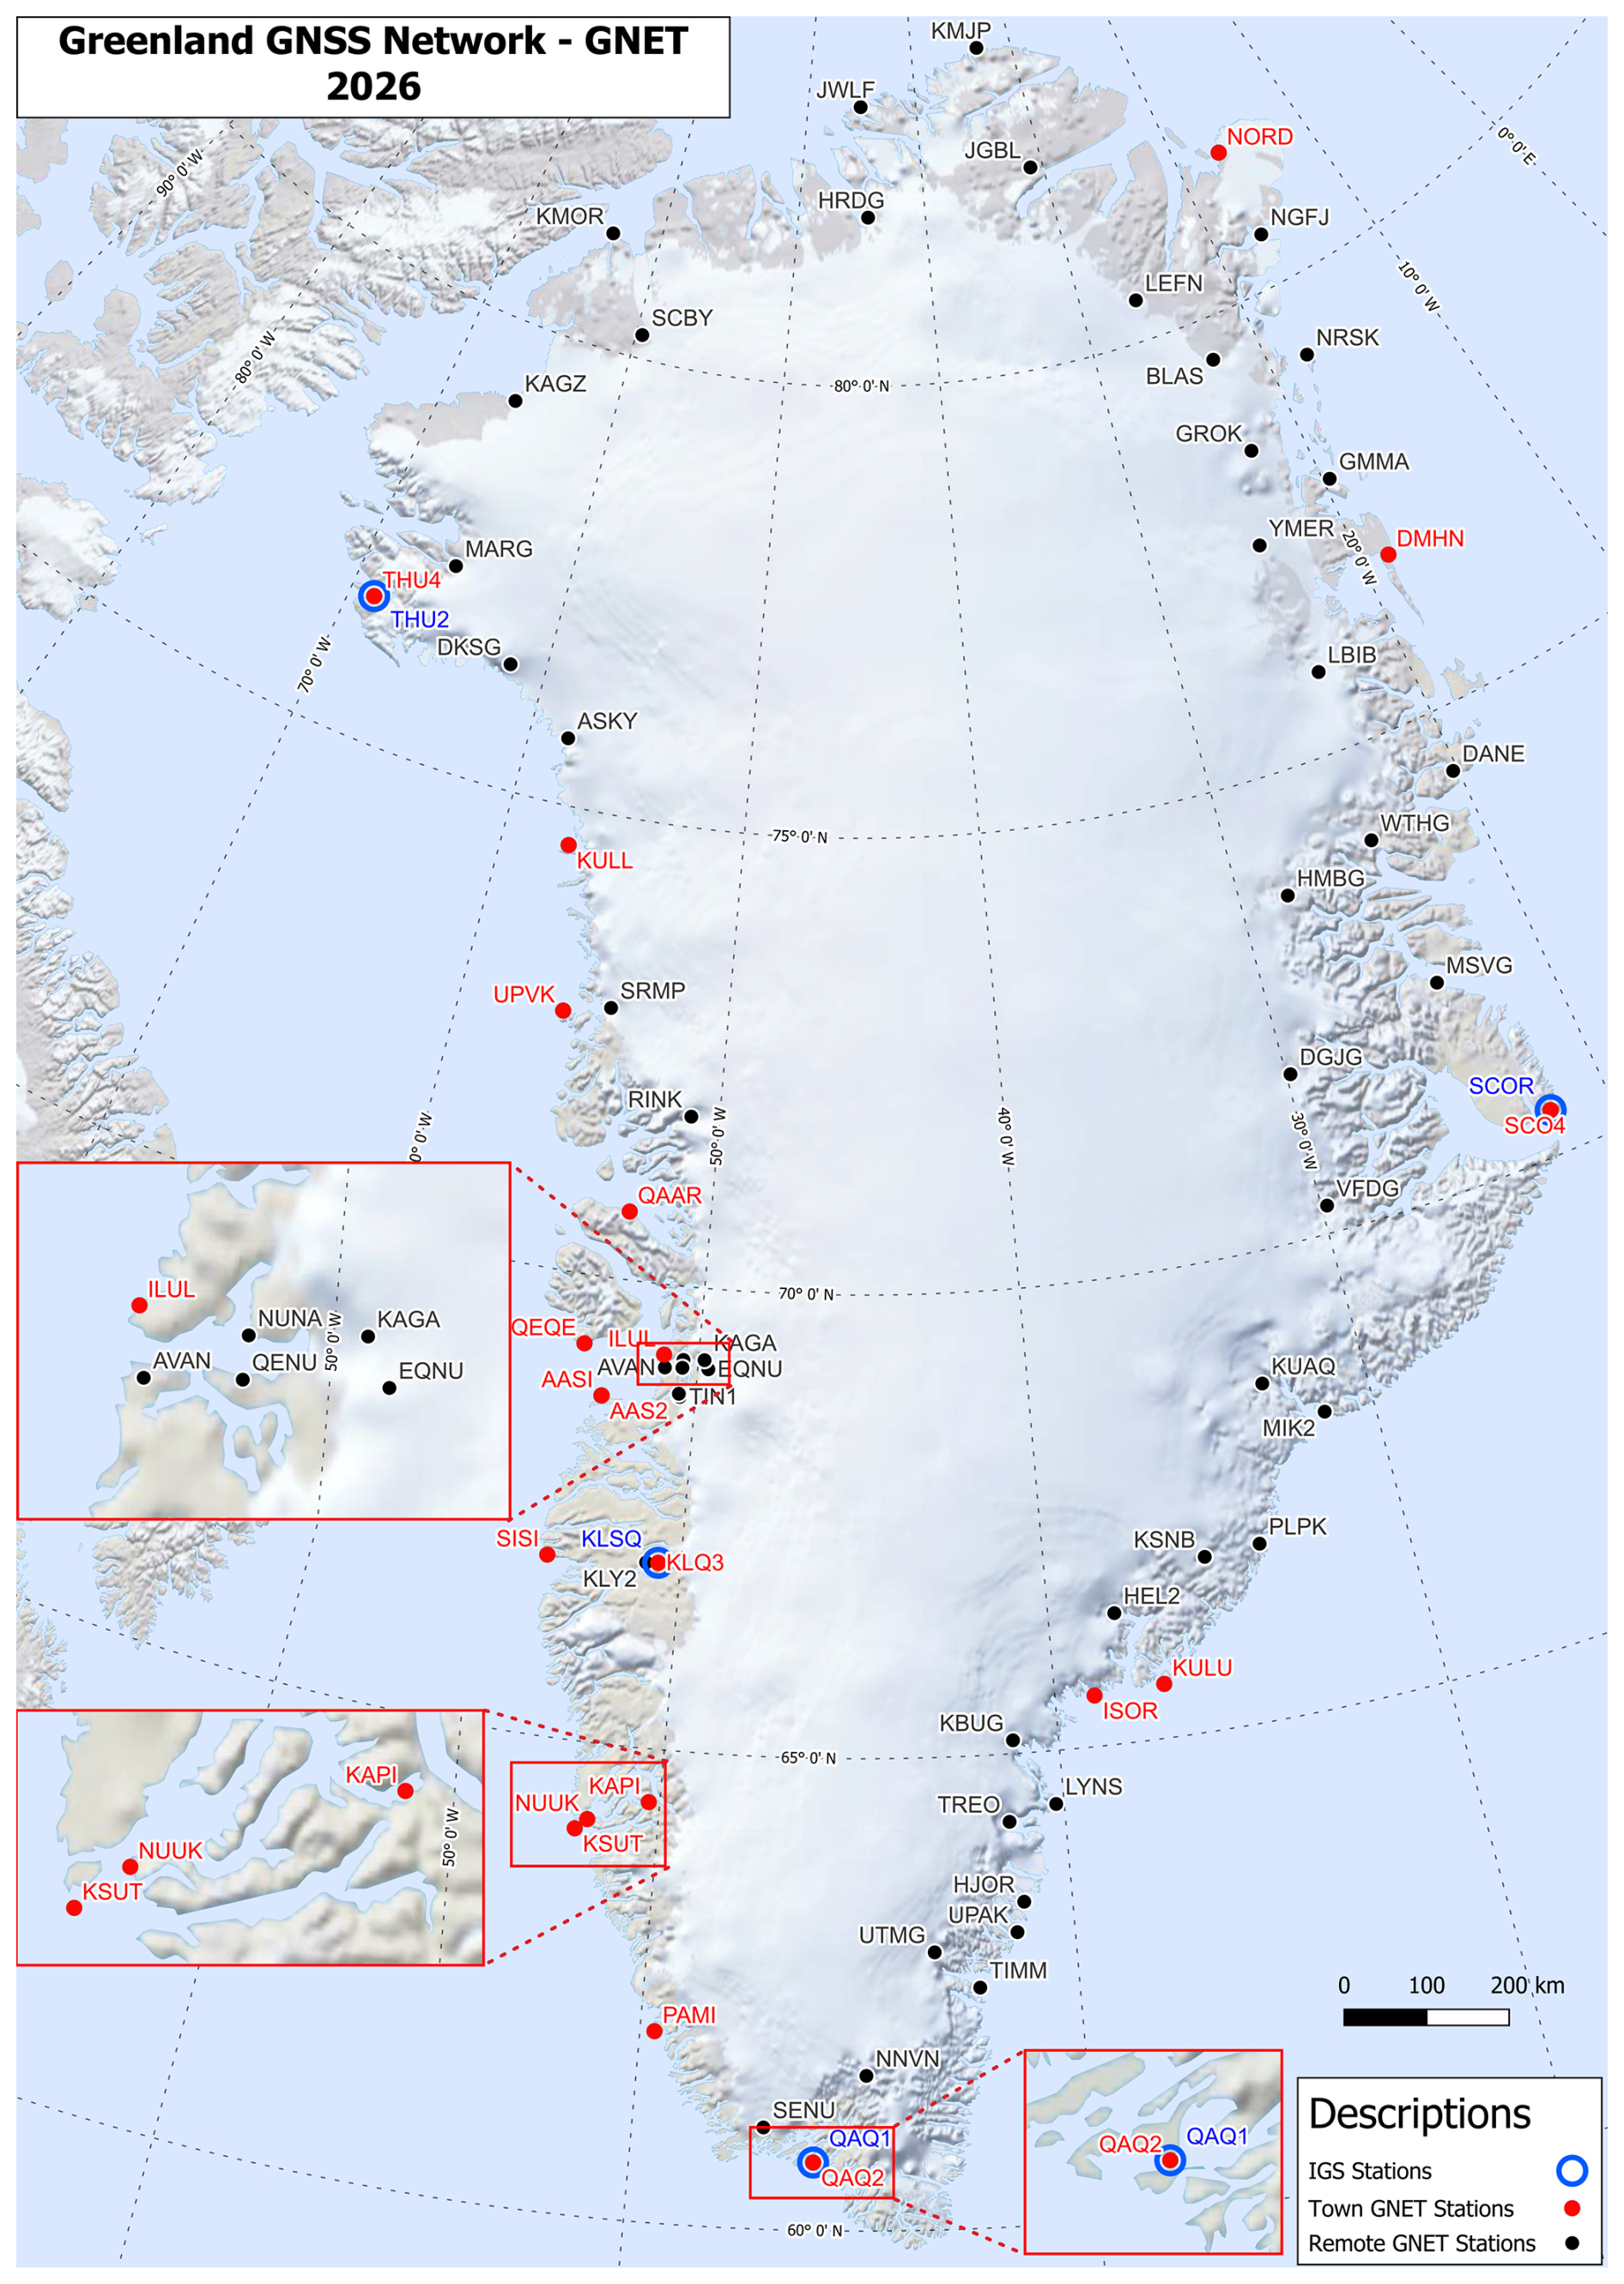
Figure 1Overview map of the current configuration of GNET. The map was produced using the QGreenland QGIS package (Fisher et al., 2023).
The current network consists of 19 unique town sites and 48 remote sites. Of the 19 town sites, 4 of them are classified as IGS GNSS stations (International GNSS Service, 2026). At some sites, multiple antennas are installed, like THU2 vs THU4, where THU2 is the original antenna, and THU4 is an upgraded version; only the THU2 time series is included here. The current configuration of stations is shown in Fig. 1. When the network was expanded in 2007–2009, the main aim was to recover the GIA at the major outlet glaciers (The Danish Agency for Climate Data (KDS), 2026a; Hawley et al., 2017). The stations are, where possible, located with an inland site and one further out towards the ocean, to analyze the same effect from multiple distances from the source (Grls).
2.1 General station description
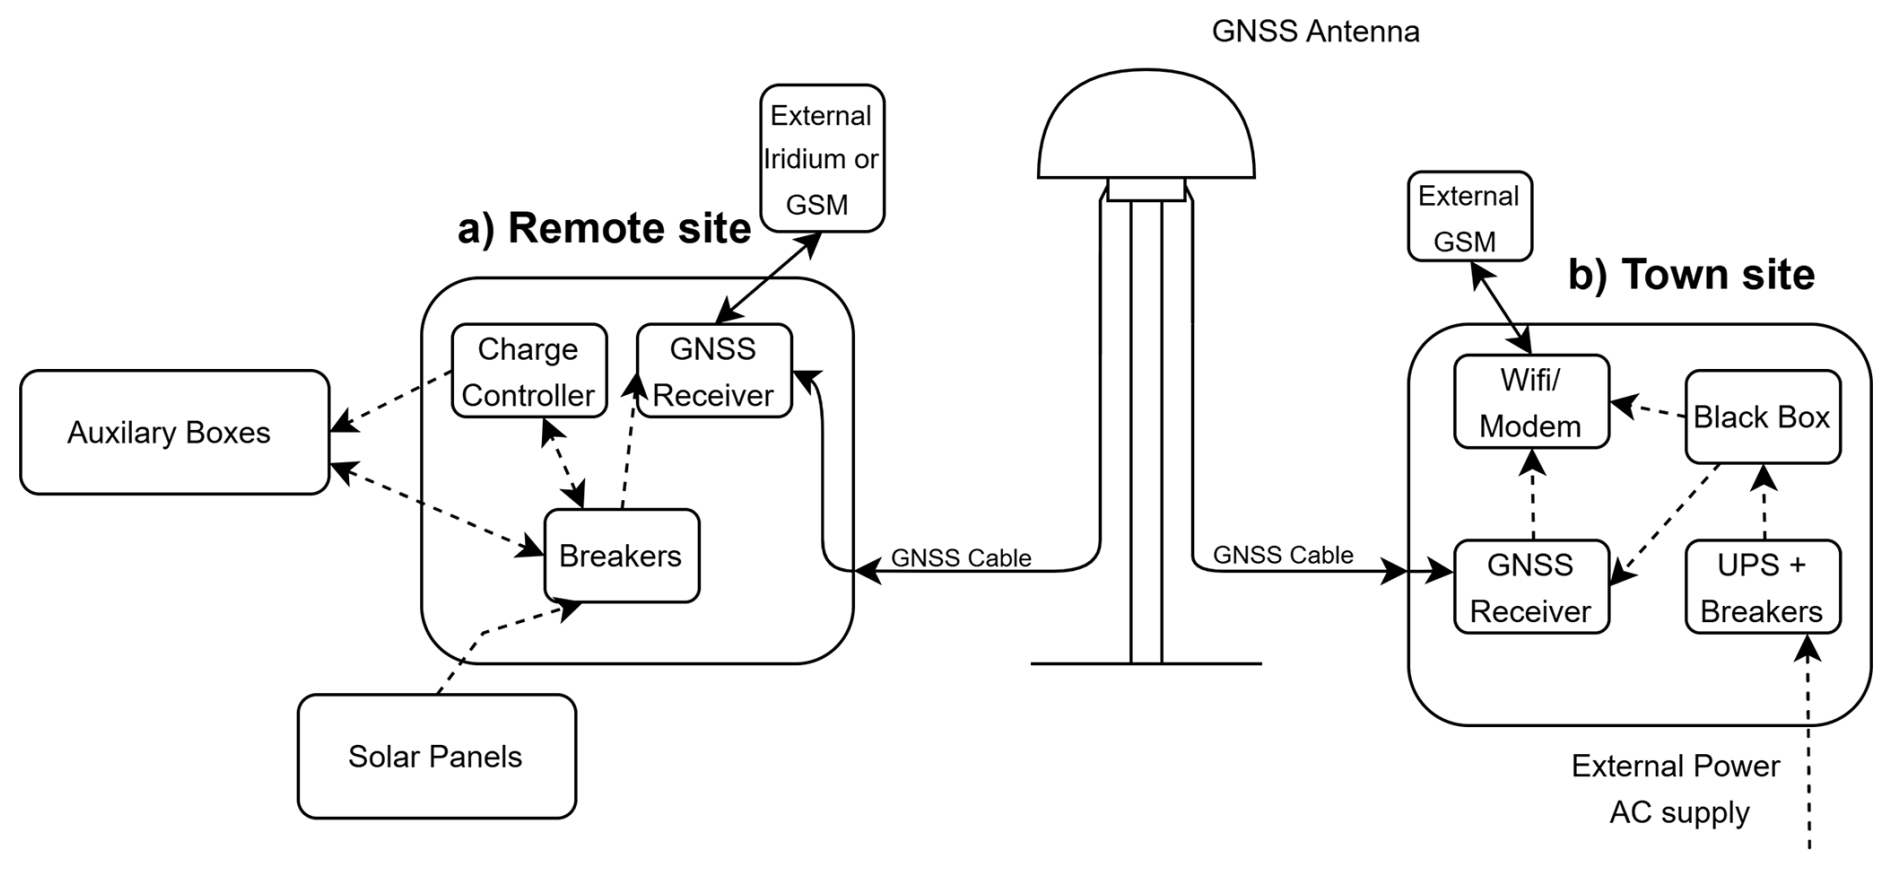
GNET is built around two main station designs: a town site and a remote site version. The remote sites are all located in hostile and hard-to-access areas of Greenland, with the sites shown in Fig. 1. The remote sites are therefore expected to run autonomously throughout the year. An example of the remote GNET station design is shown in Fig. 5b and drawn in a simple schematic in Fig. 2a. The station design is based upon the design provided by Earthscope (then UNAVCO) for GNSS network solutions all over the world (UNAVCO Inc., 2026). The current configuration of the remote sites includes at most sites a Leica AR20 GNSS antenna, an AlertGEO Resolute GNSS receiver (Xeos Technologies Inc., 2024) and various hardware for charging the up to 24 100 Ah lead-acid batteries using solar panels mounted on a frame. Communication to and from the remote sites is either through Iridium or, for stations in closer proximity to towns/settlements the local broadband connection. This constellation provides the operational team with the opportunity to retrieve state-of-health messages: battery voltage, internal temperatures, number of GNSS satellites tracked, etc. Used for determining the status of the stations throughout the year. The stations can also be updated or powered up/down remotely to avoid data loss or permanent damage to the battery pack, if the voltage starts dropping below the Low-Voltage-disconnect (LVD) threshold value of 11.3 V during the winter months. The antenna monument installations vary with minor deviations from site to site. Common for all sites is that the monument is bolted into, or cast in concrete on top of the stable bedrock.
The 19 town sites included in the network are built around a different framework. These sites are all connected to the main electrical grid, removing the need for a low-power system. As an example of a town site, QEQE is shown in Fig. 5 and shown schematically in Fig. 2. The current configuration consists of an enclosure, either a Pelicase-like box (QEQE and QAAR) or a metal enclosure made for installation inside a building. The enclosure holds all the electronics for the station: A Septentrio PolaRx5 GNSS receiver (Septentrio, 2025), a UPS system, a black box, and WiFi modem. This setup helps ensure a stable connection and time series from each site. Over the years, the town sites have shown to be more unstable than the remote sites. This is mainly due to a power or data connection loss. The main grid has not been shown to be as stable as the battery bank solution used at remote sites. For a detailed description of the instrumentation history for each site, we encourage the reader to read the IGS logbook for the specific site (The Danish Agency for Climate Data (KDS), 2026b).
2.2 Station design and maintenance
All stations are, on average, visited by a field crew from DTU Space and/or KDS once a year, with the remote sites being prioritized compared to the town sites. This maintenance round takes place in August every summer, in a helicopter-based operation. It has been the experience that the stations can run autonomously, but without checkups and updates, the harsh climate will destroy the equipment. In addition to the harsh Arctic climate, most of the remote stations have been visited by animals, mostly polar fox and polar bear (see Fig. 4). It is the operational team's experience that the smell of petroleum attracts the animals, which means that cables, antennas, boxes, and so on have been attacked over the years. In extreme cases, this has caused a loss of data due to a destroyed or missing antenna. Over the years, all the most affected sites have been protected with metal tubes, metal sheets, and rocks. The yearly maintenance for a remote station includes: checkup of the monument stability, the antenna stability, the frame stability, missing or destroyed solar panels, a checkup of the battery status for all individual batteries, cable test of the GNSS cable, and general firmware updates if needed. Along with this, pictures are taken and archived for each station for each year.
2.3 Antenna Monument Design
Across GNET, different designs of antenna monument are used. The design of the monument has changed over the years, from the first concrete monument types like KULU (see Fig. 3d) to the newest iteration (see Fig. 3b). The design of the monument is a critical factor in the geodetic quality assurance of a GNSS site, as the monument must be stable and mounted directly to the bedrock. This ensures that the motion of the GNSS antenna only reflects the movement of Earth's crust and minimizes the effect from non-lithospheric motions near the surface (International GNSS Service (IGS), 2023). Furthermore, the monument should ensure that the antenna is placed horizontally and can be adjusted to orientation towards true north. To minimize the effects of multipath error, the base of the monument should not be wider than the base of the chokering antenna, in addition, the monument should lift the antenna sufficiently above the surrounding topography, to reduce the changes of snow building up over the antenna. The sites KULU and KELY were establish before the monument requirement was implemented for the network. Four different monument designs are used for GNET, examples are shown in Fig. 3. The bedrock-bolted plate monument in Fig. 3a and the wide concrete monument in Fig. 3d are only used at three sites. For most remote GNET sites the bedrock-bolted mast shown in Fig. 3b or an older version based on the same design philosophy is used. The tall concrete monuments (Fig. 3c) are only used for town sites. For some town sites a 2 m tall bedrock-bolted mast type is used instead of the concrete monument. The concrete mast monument type, is the most stable option, but due to logistics it is not possible to setup in the field.
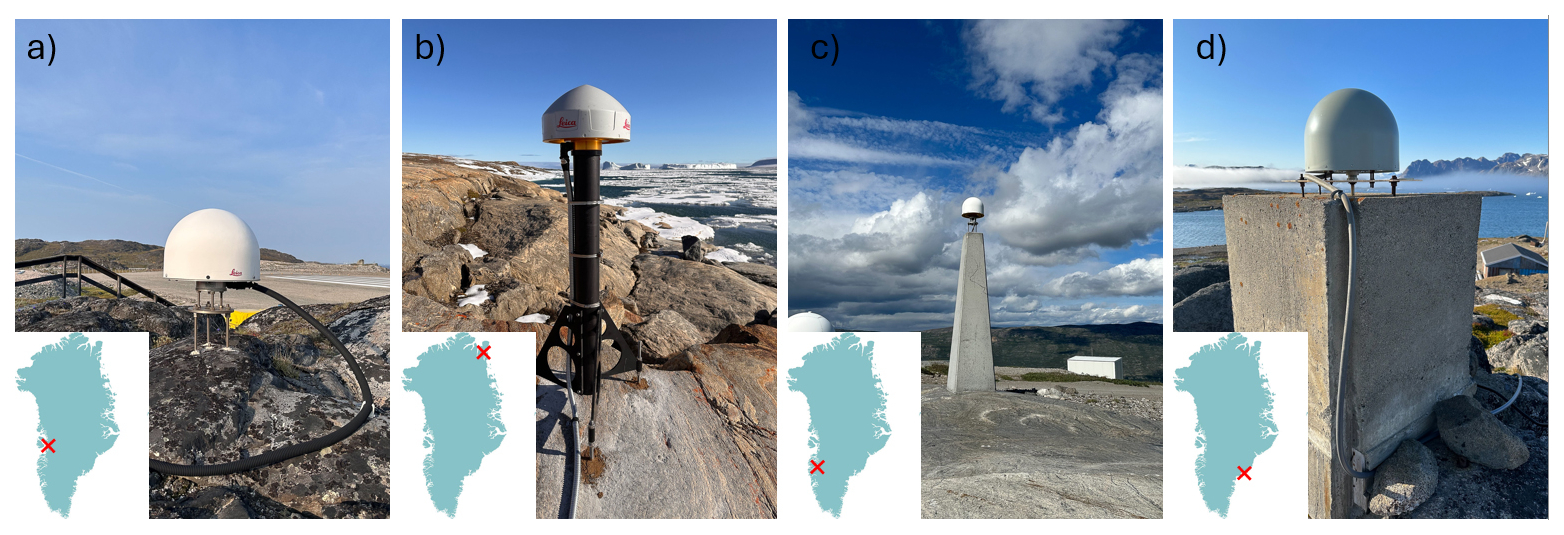
Figure 3Comparison of the most common antenna monuments used in GNET. (a) bedrock-bolted plate (ILUL). (b) bedrock-bolted mast (NGFJ). (c) concrete monument (KLSQ). (d) older version of the concrete monument (KULU). Pictures: Thomas H. Nylen and Christian Solgaard.
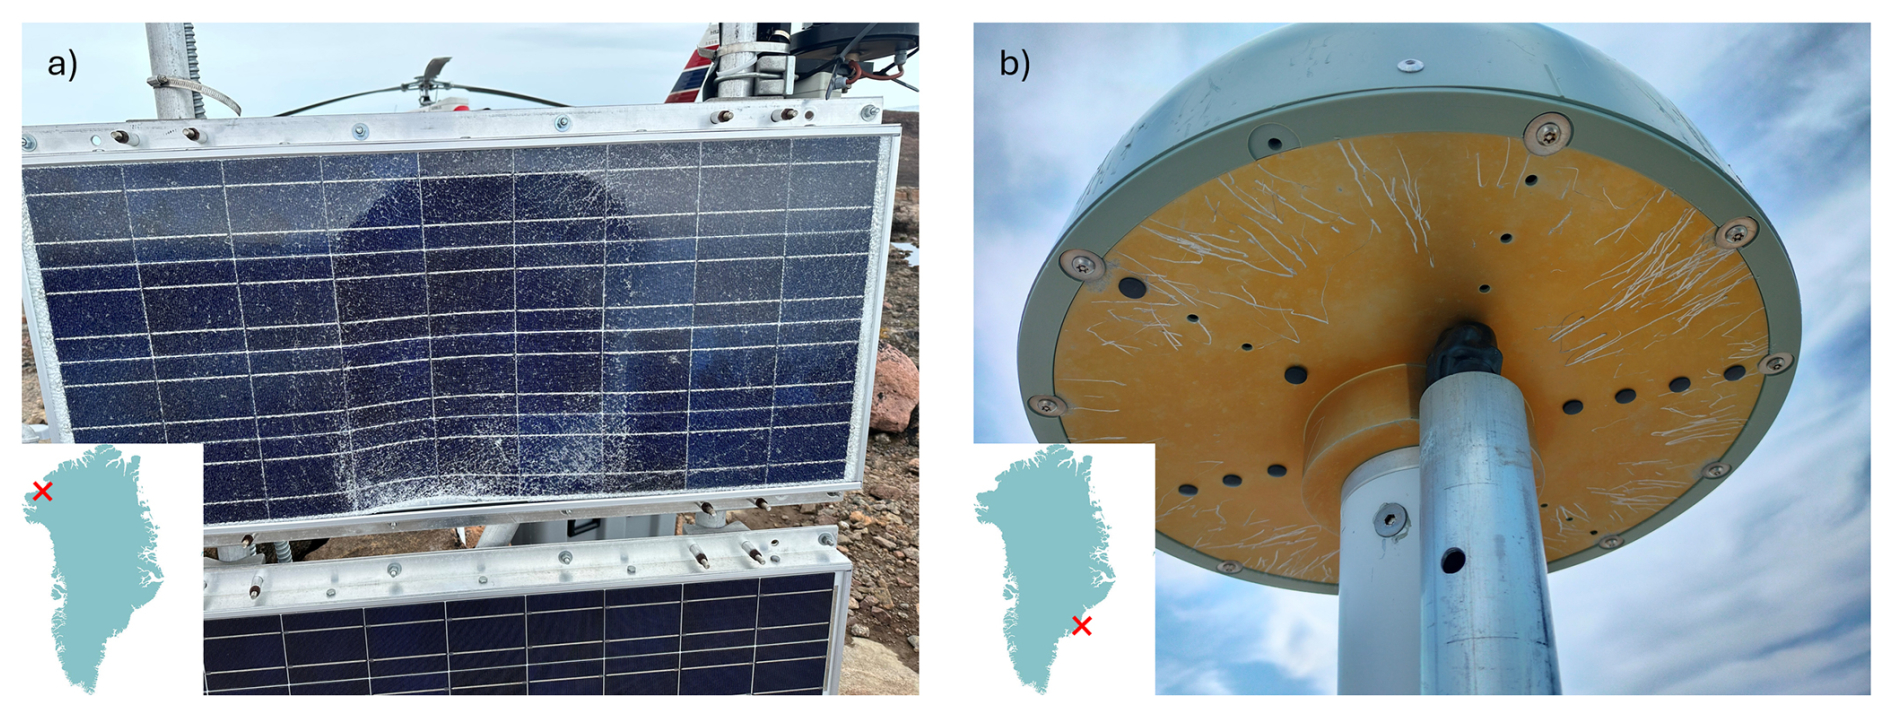
Figure 4Examples of damaged GNSS equipment after the encounter with a polar bear. (a) destroyed the solar panel at KAGZ. (b) bite marks of a polar bear on the underside of the GNSS antenna at PLPK, no extra multipath error has been observed since the incident. Pictures: Thomas Nylen and Christian Solgaard.
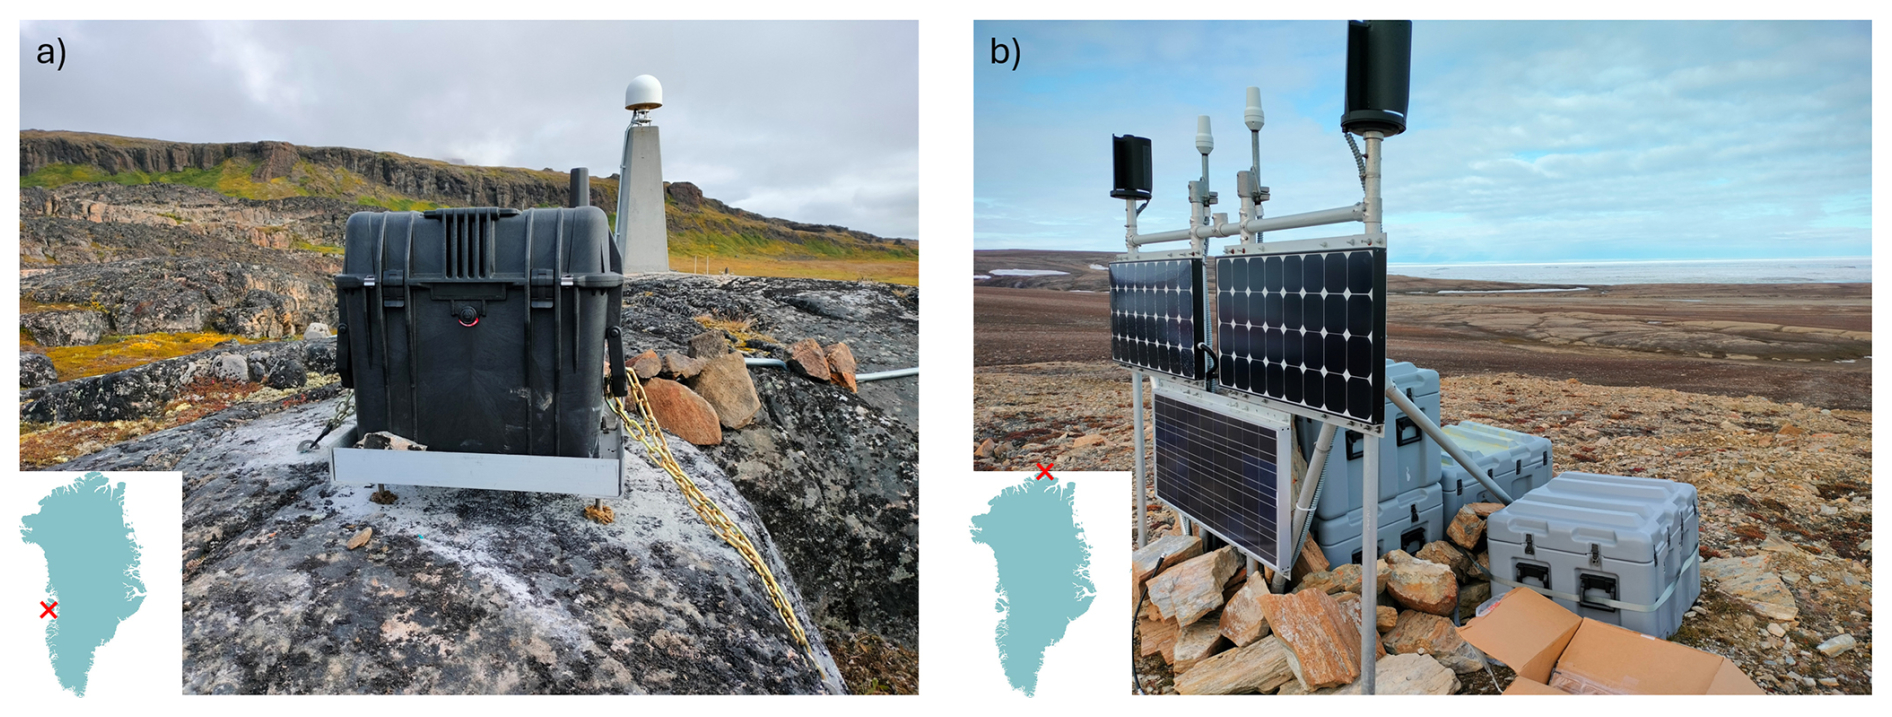
Figure 5(a) The town site QEQE just outside of Qeqertarsuaq on Disko Island in Vest Greenland. The enclosure is provided with power from the town grid, connection is through a GSM antenna placed on top of the pelicase, current receiver type across all town sites is the Septentrio PolaRx5 GNSS receiver (Septentrio, 2025). (b) The remote site KMJP at Kap Morris Jessup, North Greenland. The power is provided by up to four solar panels and a total of up to 24 100 Ah lead-acid batteries in the MM36 pelican cases, depending on latitude. Communication is through the Iridium network; the current receiver across all remote sites is the AlertGEO Resolute GNSS receiver (Xeos Technologies Inc., 2024). Pictures: Christian Solgaard.
The specific locations of GNET sites, are chosen to avoid heavy drift of snow and to reduce the amount of nearby topography 5° over the horizon line of the antenna.
2.4 GNSS Receivers
The current configuration of GNSS receivers is the Septentrio PolaRx5 (Septentrio, 2025) and the AlertGeo Resolute (Xeos Technologies Inc., 2024). Both receivers are multi-frequency GNSS reference receivers, built upon the same AsteRx-m2 OEM board. The PolaRx5's are used in town sites, and the Resolute's are used in remote sites. All the PolaRx5 receivers are set to track all constellations/signals except SBAS and log hourly 1 Hz SBF files. The Resolute receivers are set to track all signals from GPS and Galileo except for the E6. Due to limited power and file storage room, the logging for most remote sites is set at hourly 15 s SBF files. Some remote GNET sites are set to log hourly 5 s files; these stations are: PLPK, KAGZ, NGFJ, and UPAK. These stations are used and tested for potential use cases in GNSS-IR applications (Larson et al., 2013).
The GNET data are processed as a daily product using the GipsyX-2.4 software package (Bertiger et al., 2020). We use the final orbit products by JPL, which include satellite orbits, satellite clock parameters, and Earth orientation parameters. The orbit products take the satellite antenna phase center offsets into account. The atmospheric delay parameters are modeled using the Vienna Mapping Function 1 (VMF1) with VMF1grid nominals (Boehm et al., 2006). Corrections are applied to remove the solid Earth tide and ocean tidal loading. The amplitudes and phases of the main ocean tidal loading terms are calculated using the Automatic Loading Provider (https://barre.oso.chalmers.se/loading/l.php, last access: 10 February 2026) applied to the FES2014b ocean tide model (Carrére et al., 2016), including a correction for the center of mass motion of the Earth due to the ocean tides. The time series were processed in the IGS20 reference frame (Altamimi et al., 2023). We use the Precise Point Positioning (PPP) processing strategy. All coordinates are estimated in the center-of-mass frame and subsequently transformed to the center-of-figure (CF) frame by subtracting the geocenter motion. To reproduce the time series processed in this study using the GipsyX-2.4 software package and the gd2e.py code, we provide the input file ppp_0.txt, which corresponds to the default static PPP processing tree for GNSS data in gd2e.py.
The dataset we publish here includes the raw daily RINEX format files for all stations in the network and stations prior to the network establishment. The sampling rates differ between town-, remote-sites, and over time due to hardware and power limitations of the network instrumentation. In addition to the raw RINEX files, metadata in the form of IGS-style logfiles and horizon pictures are published. The processed time series are available as daily solutions with associated error estimates in ENU-transformed time series. The processed ENU time series has been reduced to a common reference epoch of 1 January 2010, 00:00 UTC+0. The reference geodetic coordinates for each station are listed in the associated sumfiles also published here. An example for the station SCBY (Kap Schouby), a remote GNET site in Northwest Greenland, can be seen in Fig. 6. Here, the ENU time series are displayed along with the associated processing error estimates and the daily return of expected observation. The corresponding IGS-style logfile is visualized in Fig. 10. Along with the processed position time series we provide the derived horizontal and vertical linear velocities with uncertainties. This dataset is visualized in Fig. 7, and summarized in Table A1. The absolute direction of the horizontal displacement shows a general northwest motion for all of Greenland.

Figure 6Time series of final processed ENU for station SCBY (Kap Scouby) in Northwest Greenland and the associated error estimates for each coordinate component. (a) north component, (b) east component, (c) up component, all represented in [mm], in reference to the starting coordinate as specified in the metadata for the station. Notice the different scales on the left- and right-hand y axes. The right y axis shows the error estimates of the PPP solution. The time series are provided as a daily product. (d) shows the % of expected observations for the site, normalized to a sampling rate of 15 s. The station results shown here correspond to the IGS logbook visualized in Fig. 10. (e–g) Short term variations for each component, derived by removing the linear trend from each component shown in (a)–(c).

Figure 7Derived horizontal and vertical linear motion from GNET measurements from 1995–2025. The uncertainty for the new stations (see Table 1) will be of a magnitude larger than the older installations, see Table A1. (a) Horizontal observed magnitude with absolute direction indicated as arrows, values provided in mm yr−1. (b) Vertical observed magnitude given in mm yr−1. For further information on the vertical and horizontal land motion of Greenland see Berg et al. (2024, 2025).
4.1 Data Coverage
Operating any kind of continuously running electronics in the Arctic, will at some point cause problems and downtime. Through iterative updating of the station framework, the downtime has been lowered to a minimum as shown in Fig. 8. Both the harsh Arctic climate with low temperatures and heavy snowfall, and potential damage by animals have resulted in data gaps during the 20+ years of the project. Typically, foxes and polar bears have been biting through external GNSS cables, iridium antennas, and destroying the solar panels, greatly reducing the performance of a remote site. The full data availability with description of tracked GNSS constellations is shown in Fig. 9.

Figure 8(a) Left y axis: Average data return [%] of expected observations per day, normalized to a sampling rate of 15 s over the full network. Right y axis: Total number of stations in the network, split into remote and town sites. The remote sites were first established during the establishment of GNET in the 2007–2009 summer seasons. Some town sites predate GNET back to 1995 (KULU). In 2024, the number of remote sites was expanded with 6 new sites: one in East Greenland (UPAK), one in North East Greenland (NGFJ), and four in the Icefjord area from Ilulissat towards Sermeq kujalleq (NUNA, AVAN, EQNU and QENU). (b) Length of the time series distributed over the number of stations in the network.

Figure 9Data availability and overview of the tracked GNSS constellations for each GNET site included in the dataset. Black bars indicate missing data from the processed time series. THU1, SCOB and AASI have all been decommissioned. + denotes sites that the operational team, over the years have identified as exposed to destructive wildlife encounters such as polar bears, foxes, wolfs etc. * denotes sites which due to antenna monumentation or geographic location have had problems with snow cover, see Sect. 2.3 for further information.
Figure 8a shows the average data return across the network throughout its lifetime. The data return average is normalized to match a 15 s sampling rate. With upgrades to the town site enclosures, including the introduction of Black Boxes and UPS systems, and the general receiver change across all sites to the more reliable Septentrio PolaRx5s, the data return has stabilized at around 95 %–99.9 % since 2021. The data return fluctuated substantially in the first years of the network; this is largely due to faulty equipment.
4.2 Meta Data
For each site in the network, an IGS log is prepared and updated continuously throughout the station's lifetime. Included in the site's logs is information regarding the station configuration over time, as represented in Fig. 10. The visualized logfile here is from the remote GNET site SCBY in Northwest Greenland. The logfile representation corresponds to the final time series product shown in Fig. 6. Notice here, the abrupt change in variability for the error estimations, before and after the receiver change from the Trimple NetRS to the AlertGEO Resolute in summer 2018. The rise in the uncertainty around 2019 corresponds well to the old Ashtech antenna (GPS only) failing and being replaced with the current Leica AR20 (GNSS) antenna. With the receiver change in 2018, it also became a possibility to track Galileo as well as GPS, also contributing to a more stable position solution. Along with the logfiles, images are taken of the stations during the summer maintenance campaign; these are not included in the dataset publication but can be forwarded on demand, upon contact with the corresponding author.

Figure 10Representation of the IGS sitelog of station SCBY. Information for receivers is “Firmware Version” | “Elevation Cutoff Angle” and the antenna information is “Antenna Model” | “Short Serial Number”, the station sitelog shown here corresponds to the final ENU time series shown in Fig. 6.
4.3 Dataset evaluation and known limitations
We have chosen to perform two different independent examinations/validations of the stability and quality assurance of the published time series. A stability analysis of the station infrastructure is performed, by estimating the noise characteristics based on a Lomb-Scargle periodogram-derived spectral index (Goudarzi et al., 2015). Secondly, we evaluate the published dataset by comparing it directly to already published subsets of the dataset provided by two independent processing centers.
4.3.1 Noise Profile Characteristics
To evaluate the performance of each cGNSS station in the network, a stability analysis is performed. The aim of the analysis is to compute the spectral indices for a power law process fitted to the residual time series for each coordinate component. The power law process is given by:
where f is the spatial or temporal frequency, P0 and f0 are normalized constants, and κ is the spectral index (Goudarzi et al., 2015). The spectral indices describe the type of overall noise model. The values of the spectral indices are expected to fall within where κ=0 defines Gaussian noise, defines flicker noise, and defines fractional to random walk noise. Indicies between are defined as fractional Gaussian; this is the range we would expect a geodetic grade cGNSS station to lie within (Goudarzi et al., 2015; Montillet and Bos Editors, 2020).
The residual ENU time series is computed by fitting and removing a deterministic trajectory model from each component. During the processing, the coordinate estimates are corrected for potential discontinuities due to hardware changes on the stations. A simple model based on a linear trend, annual and semi-annual signal terms are therefore used (Montillet and Bos Editors, 2020; Bevis and Brown, 2014)
where a0 is the y-intercept, a1 is the linear trend, nF goes to two, such that s1 and c1 represent the annual signal and s2 and c2 represent the semi-annual. ω is the period set to and , ϵ is the errors associated with the coordinate estimates, assumed to be Gaussian and uncorrelated. Then for all positions it should be true that:
where d is the data vector, G is the system design matrix, m are the model parameters, and ϵ are the associated data errors. The model parameters can then be estimated using the solution for the weighted linear least squares problem given by Aster et al. (2004); Buchta et al. (2025):
where C is the covariance matrix based on the associated error estimates C= diag[ϵ]. The deterministic trajectory model is then removed from the ENU time series, which yields a residual time series for each component. To ensure robust model fitting, stations with less than 10 years of observations are excluded from the analysis, as shorter time series may not adequately capture the long-term trend, and the annual and semi-annual variability. Figure 11 shows an example of the process, of the upward displacement for the station LEFN (Leffingwell Nunatak), in Northeast Greenland. The resulting Lomb-Scargle Periodogram yields a power law spectral index of κ= −0.67. The same analysis is carried out for all coordinate components for each station in the network. Figure 12 shows the final estimated spectral indices across all stations for each coordinate component. The analysis shows that the median spectral index for all components across the full network falls within the range of the fractional Gaussian noise profile.

Figure 11Example of fitting and removal of the deterministic trajectory model and evaluation of the Lomb-Scargle Periodogram. (a) Up component from station LEFN and fitted model. (b) Corresponding residual time series after the removal of the model. (c) Evaluated Lomb-Scargle Periodogram and the fitted power law model for estimation of the spectral index.

4.3.2 Comparison to the processed time series by NGL and JPL
A comparison with previously published independent GNSS time-series products is conducted to verify the stability and quality of the full dataset we publish here. We compare and validate the results from DTU with data products from NGL (Blewitt et al., 2018) and JPL (Heflin et al., 2020). This is done in order to investigate potential differences in longterm linear trends and/or differences in the seasonal signal. NGL's “living dataset” consists of Cartesian coordinate time series from around 17 000 GNSS stations worldwide, of which 10 000 are continuously updated on a weekly basis. The processing is performed using the GipsyX software (Bertiger et al., 2020), utilizing JPL orbit and clock parameters. The product is provided as a daily GPS-only-based Cartesian () coordinate time series. So, a conversion to the ENU format is performed before the comparison (Seeber, 2003). We refer to the web page (https://geodesy.unr.edu/, last access: 22 December 2025) for further information on the processing scheme from NGL.
The processed time series from JPL is part of their global archive of processed cGNSS time series (NASA Jet Propulsion Laboratory, 2018). JPL also uses the Precise Point Positioning (PPP) processing scheme implemented in GipsyX (Bertiger et al., 2020; Heflin et al., 2020). The processed time series are provided in both Cartesian and local reference frame ENU format.
To ensure consistency in the comparison, we restrict the analysis to stations common to all three datasets and where the time series are longer than 10 years, resulting in 39 of the 71 sites (54 %) presented in this study. The lengths of the time series provided by the three data centers are not equal; the processed time series from JPL are, in general, shorter than those for NGL and DTU, which could lead to a bias in the final conclusion. The comparison is performed by fitting the model given in Eq. (2) and extracting the model parameters for each coordinate component across all stations. From the model parameters we then compute the linear trend (a1), the annual amplitude and phase:
and the semi-annual amplitude and phase:
we then compare the consistency between the three datasets by fitting a linear model to pair-wise linear trend, annual/semi-annual amplitude and phase, giving us a total of 9 metrics for each parameter. If the trend of the fitted linear model is α=1, then we have a perfect fit and should have consistency across the two datasets for the given parameter. This analysis is shown in Fig. 13 for the annual amplitude of the seasonal signal, along with the fitted model (red line), which is a representation of a linear model with trend α=1 and an arbitrary starting point. The computed trends for all pair-wise comparisons with associated R2 values are presented in Table 2.

Figure 13Comparison of the computed annual amplitude of the periodic signal for all coordinate components across the three datasets. (a–c) north component (a: NGL vs. DTU, b: JPL vs. DTU, c: NGL vs. JPL). (d–f) east component (d: NGL vs. DTU, e: JPL vs. DTU, f: NGL vs. JPL). (g–i) up component (g: NGL vs. DTU, h: JPL vs. DTU, i: NGL vs. JPL). The sites are color-coded based upon the latitude of the station.
Table 2Combined overview of inter-metric comparison of modeled trends, annual, semi-annual amplitude, and phase for the 39 common found GNET stations in the processed ENU time series provided by the three processing centers (DTU, NGL, and JPL).
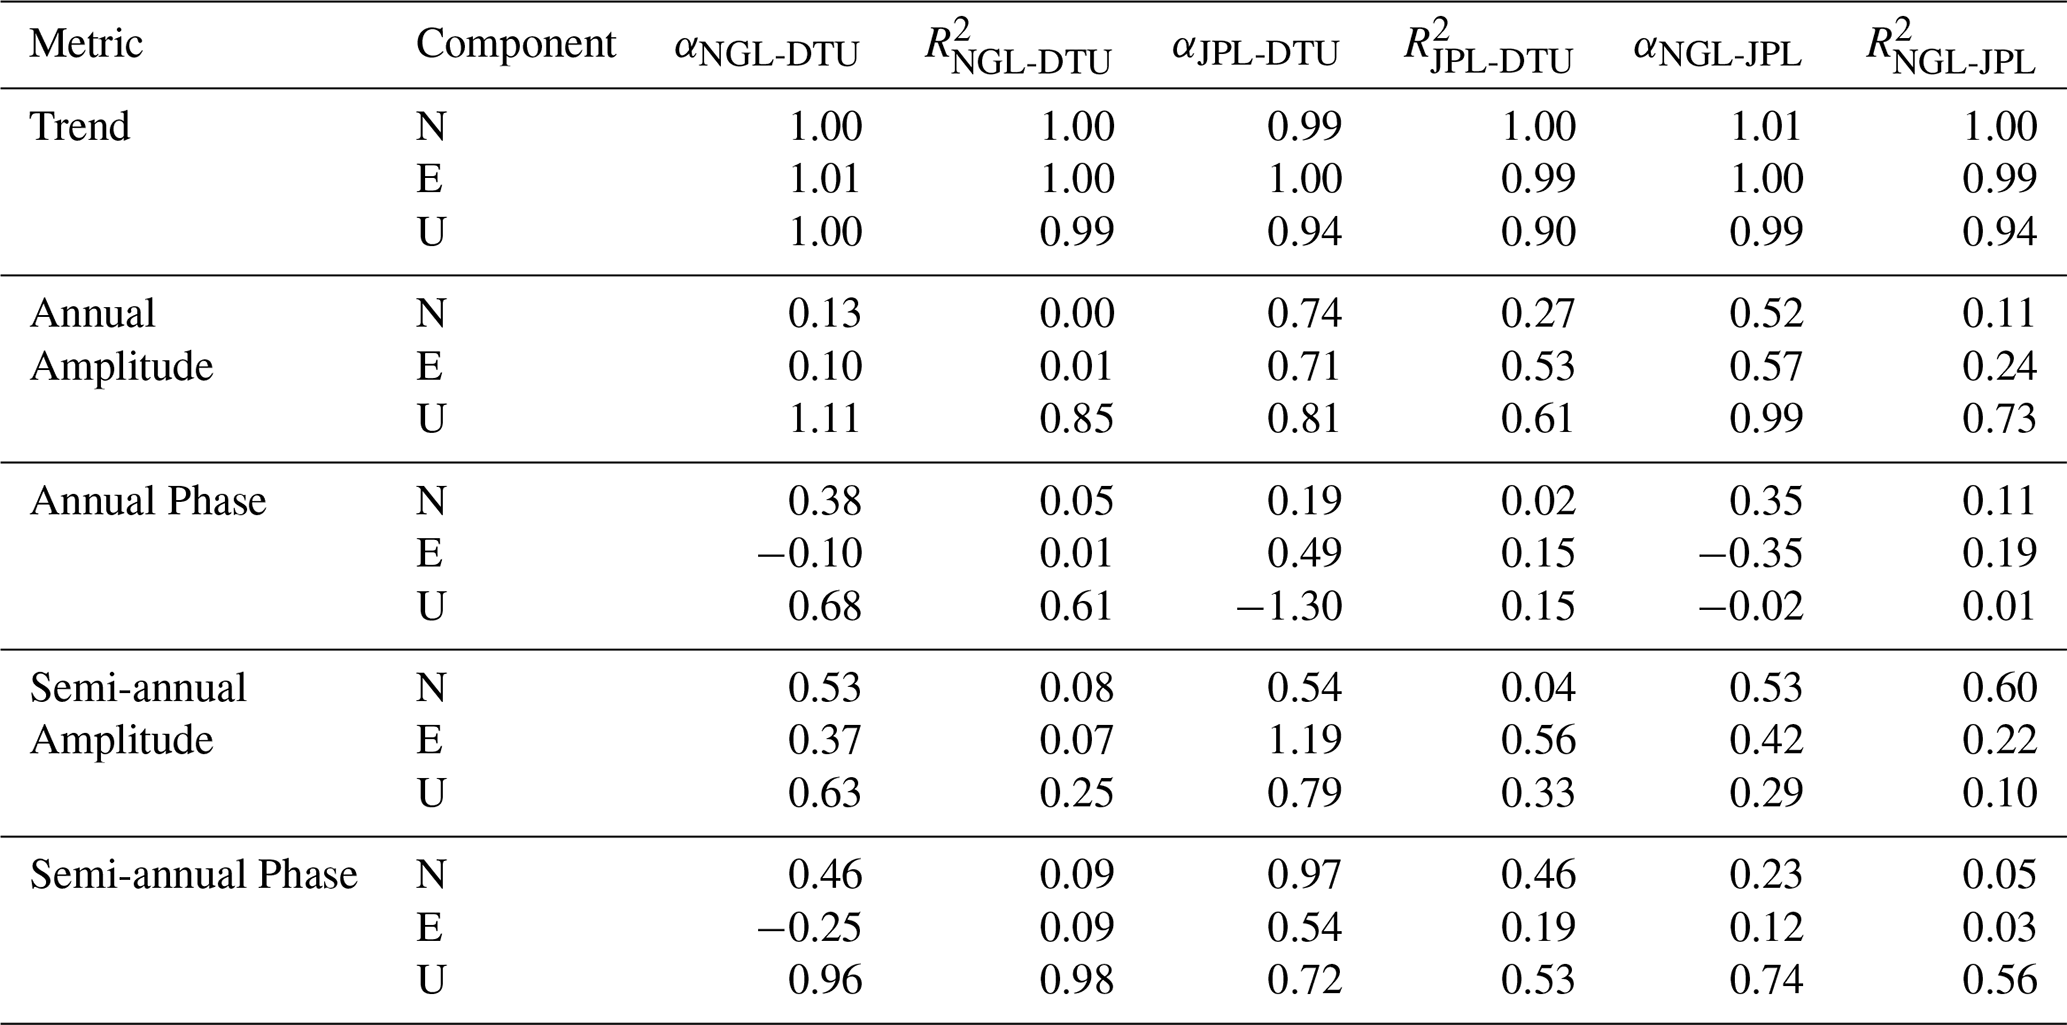
Comparison of the DTU-processed GNSS time series with products from NGL and JPL reveals good agreement in long-term linear trends across all three processing centers, with slopes near unity (α∼1) and R2≥0.99 for the north and east components. Vertical trends are slightly less consistent, particularly between DTU and JPL (α=0.94, R2=0.90), but this could be biased by the shorter time series provided by JPL.
For the seasonal signals, the amplitude and phase show contrasting results. The amplitude of the annual seasonal signal corresponds roughly in the up direction across the three data sets. However for the horizontal components, almost no correlation is to be found between DTU and NGL (αnorth=0.13 and αeast=0.10), while it is more consistent for DTU-JPL at (αnorth=0.74 and αeast=0.71). Both results combined with the annual phase and the semi-annual seasonal signals show a clear non-zero seasonality in the datasets provided by NGL and JPL which is not found in the data set from DTU. Seasonal displacements in crustal motions in Greenland are expected to be dominated by vertical motion, with only minor horizontal components (White et al., 2022; Bian et al., 2023; Materna et al., 2021). The correlation with DTU's product is weak (R2≲0.5) and the amplitude of the signals is very low, suggesting these signals are likely processing artifacts from the PPP processing choices, reference frame handling, or noise propagation. Consequently, while the vertical seasonal signals can be interpreted confidently, horizontal seasonal amplitudes and phases should be treated with caution when using time series from NGL or JPL.
4.3.3 Short vs. Long GNSS Time Series
In order to quantify the differences arising from the observational time span across the network, we fit Eq. (2) to subsets of the individual time series, starting at 2 years incrementing with 1 month until the full time series is included. Using this method, we can now assess how the uncertainty on the linear drift changes with the time series length. This is shown in Fig. 14. Here, it is seen that the uncertainty for the linear trend in all coordinate components converges when the time series is around 10 years long. This is to be expected as the uncertainty should converge with the number of data points if the errors can be assumed to be Gaussian distributed. Highlighted in Fig. 14 are the results from the KAGA station, which is located right next to the terminus of Sermeq Kujalleq (Jakobshavn Glacier). This station behaves differently compared to most of the network. In the upward direction, we see a colored noise behavior compared to the rest of the network, the reason for this behavior is still up for debate. For the trend estimations using the same method, we see two different main results. Some stations show a clear convergence after 10 years, and some stations do not converge. This could be a result of the elastic and visco-elastic response to present and past ice-mass changes. If the specific station is dominated by the visco-elastic response (GIA), it is expected that the long-term (+10 years) should be constant, whereas if the station is dominated by the elastic response to present-day ice-mass changes, then we would not expect a stable long-term trend.

Figure 14Trend uncertainty estimations as a function of time series length for all stations. Iteratively estimated trend uncertainty for the (a) East, (b) North, and (c) Up components. First estimate at time series length of 2 years, with each step adding 1 month to the time series.
As shown in Fig. 14, the quality of the coordinate time series is correlated with the time span of the observations for the individual stations. To further assess which stations in the network should be treated carefully, we estimate component-wise coordinate trends from daily PPP estimates, downsampled to monthly means and then to yearly means. The result of this is summarized in Fig. 15. The uncertainty of trend values for the daily product is listed in Table A1. It is observed that downsampling to monthly and yearly means increases uncertainty by up to an order of magnitude. Furthermore, by classifying stations with uncertainties under or above the 2.5 % and 97.5 % percentiles as outliers, and by comparing with Fig. 9, it is observed that all the stations with time series shorter than approximately 5 years are highlighted as clear outliers.
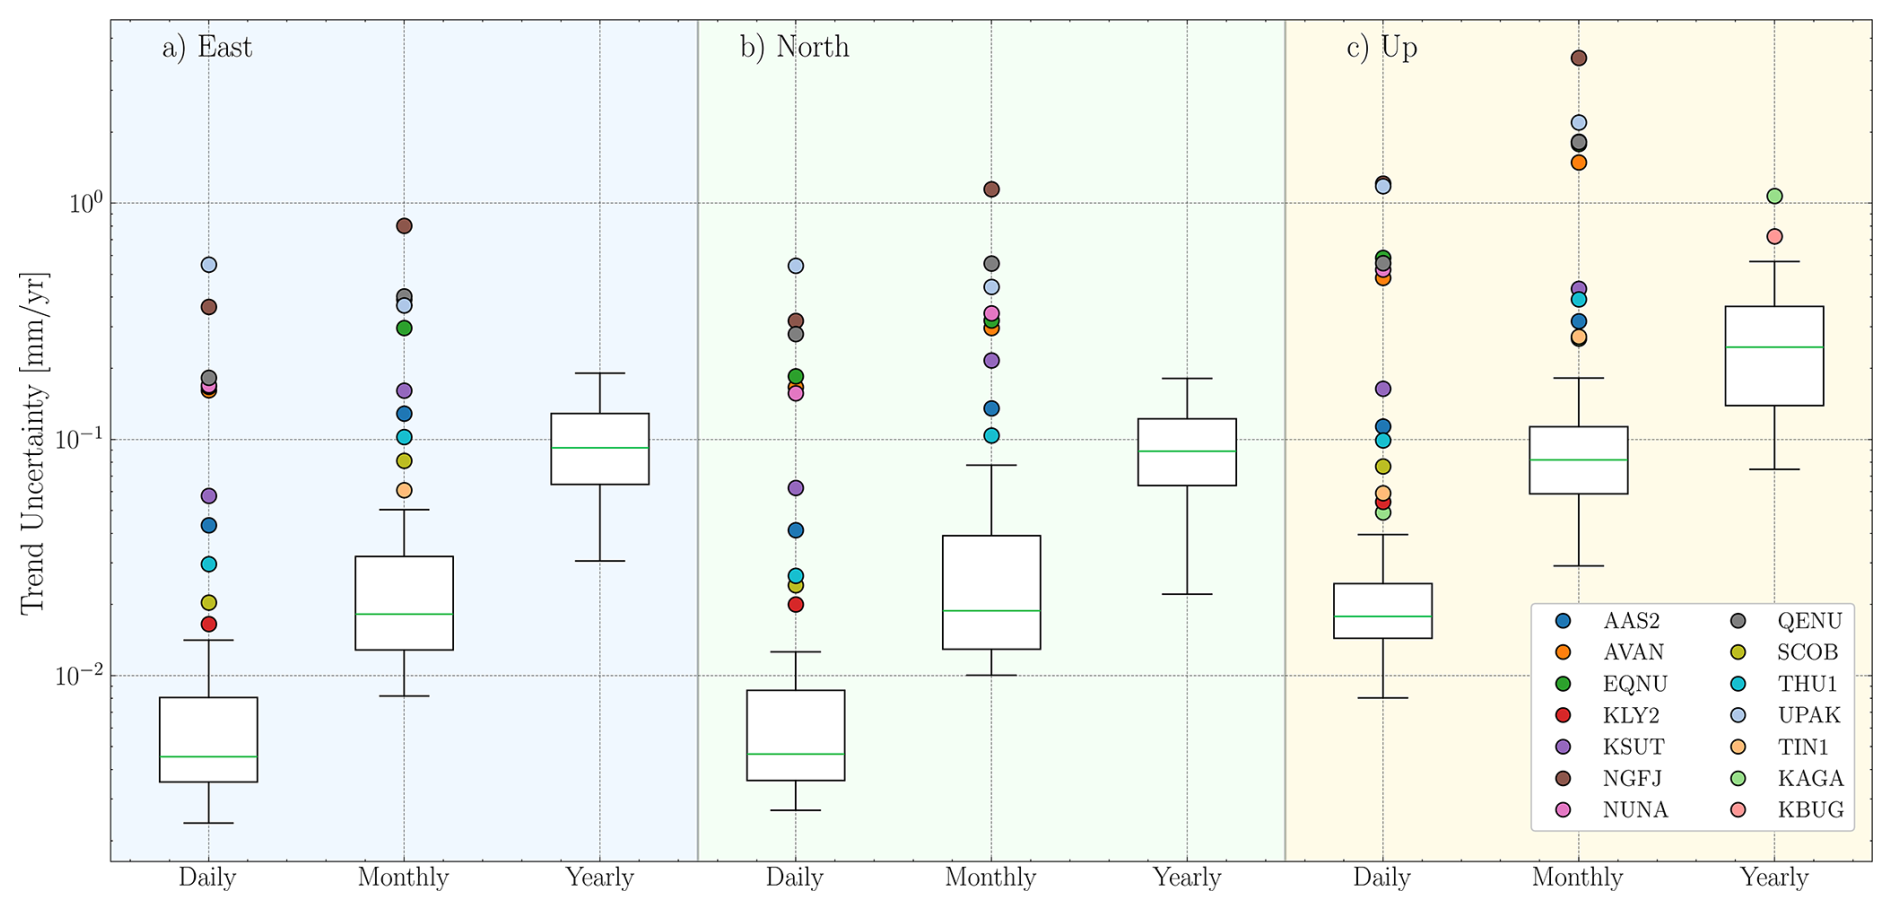
Figure 15Velocity error distributions for daily estimates, monthly means, and yearly means. (a) Error estimates for the east direction for all 71 stations. (b) same as (a), but for the north direction. (c) same as (a) and (b), but for the upward direction. Note that the y axis is logarithmic.
GNET forms the basis for the geodetic reference infrastructure in Greenland, and is sponsored directly by the Danish government (The Agency of Climate Data, KDS) through the financial act. For that reason, the network is expected to keep running continuously going forward in time. The network has slowly been expanded over the last few years, with 1 or 2 new GNET stations per year. Further expansion of the network depends highly on the funding and the future cost of downloading the raw data. The operational team developing and maintaining GNET plans to establish 2 new GNET sites in the summer of 2026, at Kap Beaupré (East Greenland) and at Kap Jefferson (Northwest Greenland). As of now, most stations are offline due to the rising cost of the Iridium network. However, with the introduction of satellite to cell connection from commercial entities, it is expected that the near-realtime download of the raw data from all stations can begin again in the near future. The extraction of the data until that point will continue as of now, as part of the maintenance trip in August every year.
Information on the GipsyX GNSS analysis software used to process the time series is available here (Bertiger et al., 2020). Along with the published dataset, we provide the processing methodology file ppp_0.txt, for reproduction of the processed time series, see Sect. 3. The full post-process noise and stability analysis was conducted in Python, and we refer to https://github.com/CSolgaard/GNET_data_paper_2026 (https://doi.org/10.5281/zenodo.21227009, Solgaard, 2026) for the source code.
6.1 Raw- and meta-data
The dataset showcased in this study comprises multiple parts. The processed ENU time series is available at https://doi.org/10.11583/DTU.31397901 (Solgaard et al., 2026a) along with the sum files from the processing, see Sect. 6 for further information on the data structure. We refer to Table B1 for a combined overview of the raw RINEX format files. The RINEX data are available as daily files, with sampling rates varying by station type and the year of download.
Solgaard et al. (2026a)The Danish Agency for Climate Data (KDS) (2026b)
6.2 Processed positional time series
The individual processed files for each station have been merged into a NetCDF file named GNET_2025.nc. Due to the GNET stations not being on a regular grid, each data variable for a time series has been assigned a timestamp and a station identifier. Each station has associated metadata including longitude, latitude, and height.
The NetCDF file contains the following structure:
-
Coordinates:
-
time. Timestamp of observations (datetime64). -
station. Unique station identifiers (string).
-
-
Data Variables:
-
decimalyear(station, time). Time in decimal year, -
east,north,up(station, time). Position components in millimeters, -
east_error,north_error,up_error(station, time). Position error estimates in millimeters, -
lat,lon(station). Station coordinates in degrees, -
height(station). Station height above the reference ellipsoid in meters.
-
We present the most extensive processed release of the Greenland GNSS Network (GNET) to date, including observations from pre-GNET cGNSS sites (1995–2007) in Greenland together with all GNET stations operating during the period 2007–2025. The dataset comprises position time series from 71 cGNSS stations distributed across the ice-free regions of Greenland.
To assess the quality of the processed time series, two independent evaluation approaches were applied. Noise analysis indicates that the station position time series are consistent with a fractional Gaussian noise behavior, as expected for geodetic-quality GNSS observations. In addition, cross-comparison with previously published subsets of the network produced by JPL and NGL demonstrates improved stability of the horizontal velocity estimates in the new DTU solution.
We show, through iterative fitting of a trajectory model to the coordinate component time series, that stations with an observational time span exceeding 10 years can be quantitatively compared across the network, as the uncertainty of the velocity estimates has converged. Furthermore, we show that stations younger than 5 years may introduce unwanted biases due to instability in the estimated solution when compared with older GNSS sites.
Alongside the position time series, we provide comprehensive station metadata documenting the evolution of hardware and firmware at each site. The metadata release also includes directional horizon photographs for all GNET antennas, supporting improved interpretation of site-specific environmental influences. The dataset presented here establishes a consistent and quality-controlled reference for studies within crustal deformation, GIA, and ice-mass change in Greenland. The data product will be regularly updated as additional observations become available and as the GNET network continues to expand.
Derived velocity estimates for the horizontal and vertical components resulting from the GipsyX-2.4 processing. The velocity estimates are found in the individual sumfiles provided here, summarized in Table A1 and visualized in Fig. 7. The sumfiles for each station contain the velocity in both the local ENU reference frame and the global Cartesian XYZ coordinates. The velocity is derived by fitting a trajectory model with a yearly linear trend and an annual seasonal signal, only the yearly trend is used.
Table A1List of the derived horizontal and vertical linear motion, for each GNET site in the published dataset. The velocity is given as mm yr−1 with an associated estimation error. As listed in Table 1, the newest stations only have sub-3-year time series, which induced an error estimate a magnitude or more larger than older stations. The trends and errors is estimated based of an trajectory model with an annual linear trend and a seasonal signal, fitted to the raw daily PPP time series. Along with processed time series we also provide the .sum files from the Gipsy processing, note the difference between the estimates given here and in the .sum files, the Gipsy trend estimates are usaully underestimated.
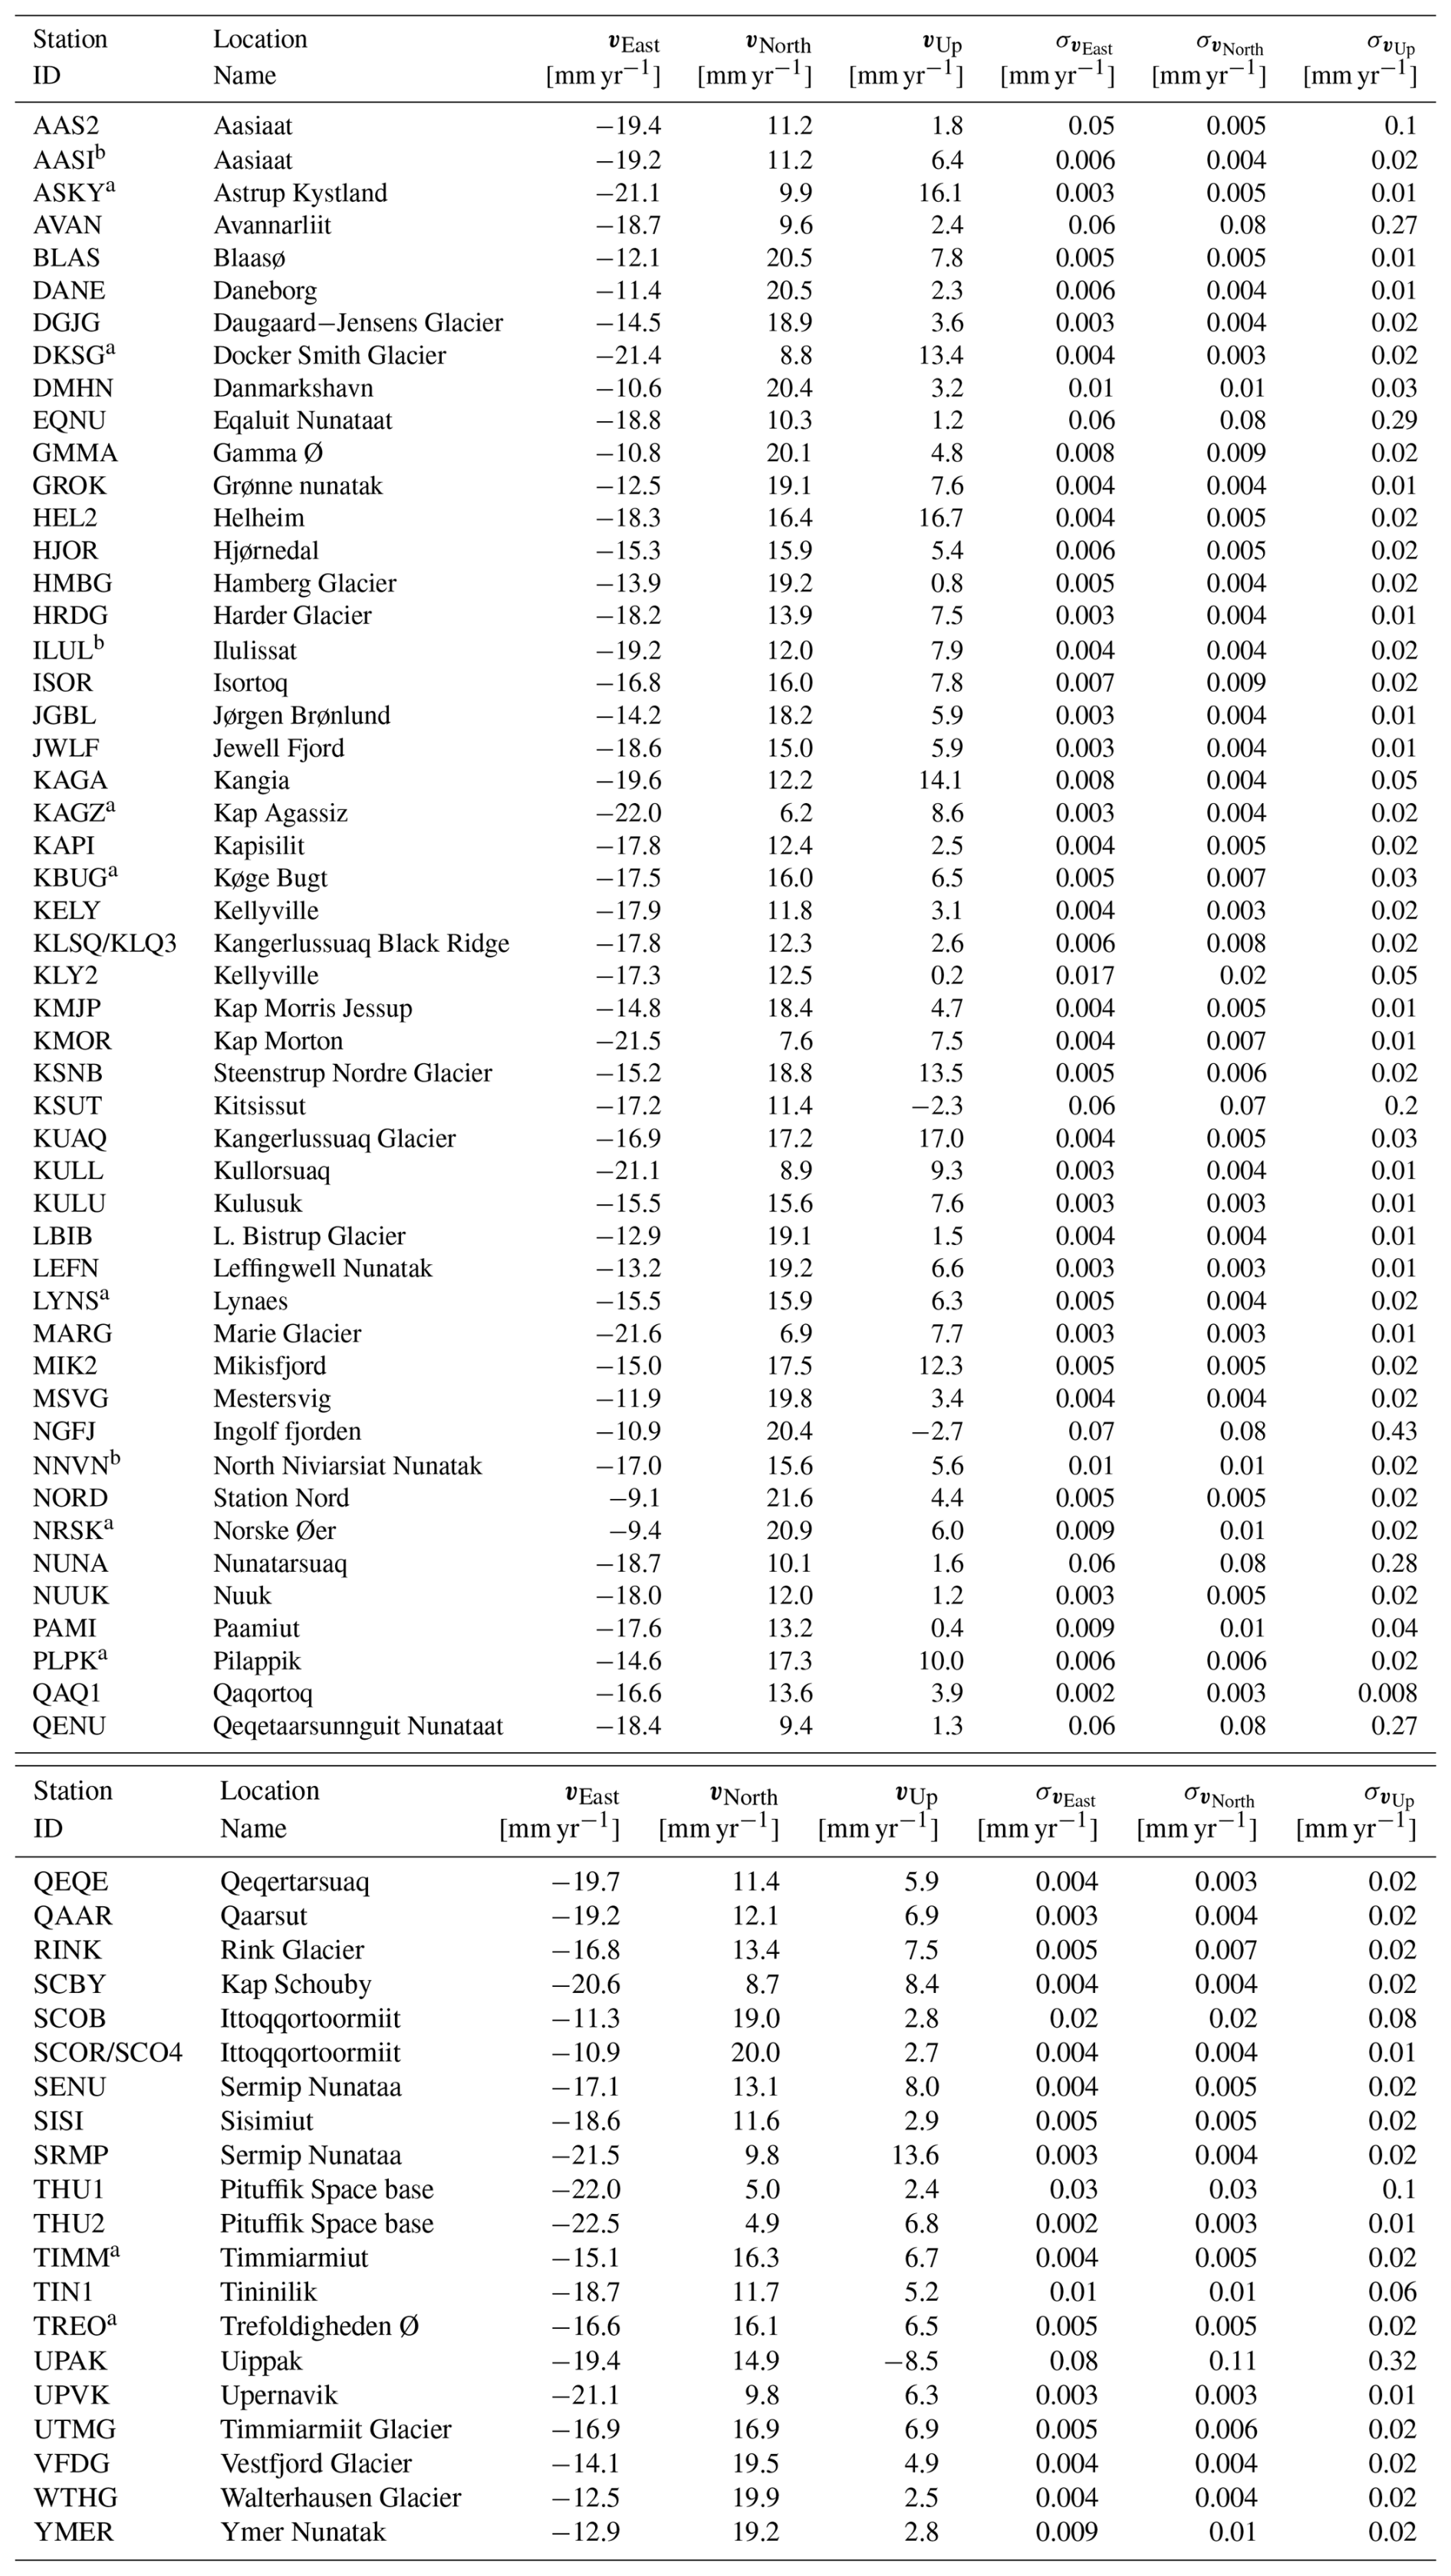
a denotes sites that the operational team, over the years have identified as exposed to destructive wildlife encounters such as polar bears, foxes, wolfs etc. No record of the incident dates are available, we refer to Fig. 9 for data availability for each site. b denotes sites which due to antenna monumentation or geographic location have had problems with snow cover, see Sec 2.3 for further information.
Table B1 shows the complete overview of all individual DOI's for RINEX format data from each GNET station. We have chosen to only include the overall DOI's for each station linking to the complete time series. Subset DOI's can be found under each, with the citation request listed specifically at the websites.
KDS (2026d)KDS (2026e)KDS et al. (2007a)KDS (2026f)KDS et al. (2008a)KDS et al. (2009a)KDS et al. (2009b)KDS et al. (2007b)KDS (2026g)KDS (2026h)KDS et al. (2009c)KDS et al. (2008b)KDS et al. (2007c)KDS et al. (2007d)KDS et al. (2009d)KDS et al. (2008c)KDS (2026i)KDS (2026j)KDS et al. (2008d)KDS et al. (2008e)KDS et al. (2006)KDS et al. (2007e)KDS (2026k)KDS et al. (2007f)KDS (2026l)DTU Space (2025a)KDS (2026m)KDS (2026n)KDS et al. (2008f)KDS et al. (2007g)KDS et al. (2007h)KDS (2026o)KDS et al. (2009e)KDS (2026a)KDS (2026b)KDS et al. (2009f)KDS et al. (2008g)KDS et al. (2007i)KDS et al. (2007j)KDS et al. (2009g)KDS et al. (2009h)KDS (2026p)KDS et al. (2007k)KDS (2026q)KDS et al. (2008h)KDS (2026r)KDS (2026s)KDS (2026t)KDS et al. (2007l)DTU Space (2025b)KDS (2026u)KDS (2026v)KDS (2026c)KDS et al. (2007m)KDS et al. (2007n)Solgaard et al. (2026b)KDS (2026w)DTU Space (2025c)KDS et al. (2008i)KDS (2026x)KDS et al. (2007o)Solgaard et al. (2026c)DTU Space (2025d)KDS et al. (2007p)KDS (2026y)KDS et al. (2007q)KDS (2026z)The Danish Agency for Climate Data (KDS) (2026c)KDS et al. (2007r)KDS et al. (2009i)KDS et al. (2009j)KDS et al. (2009k)Table B1Overview of DOIs and citations for all individual stations in the network.
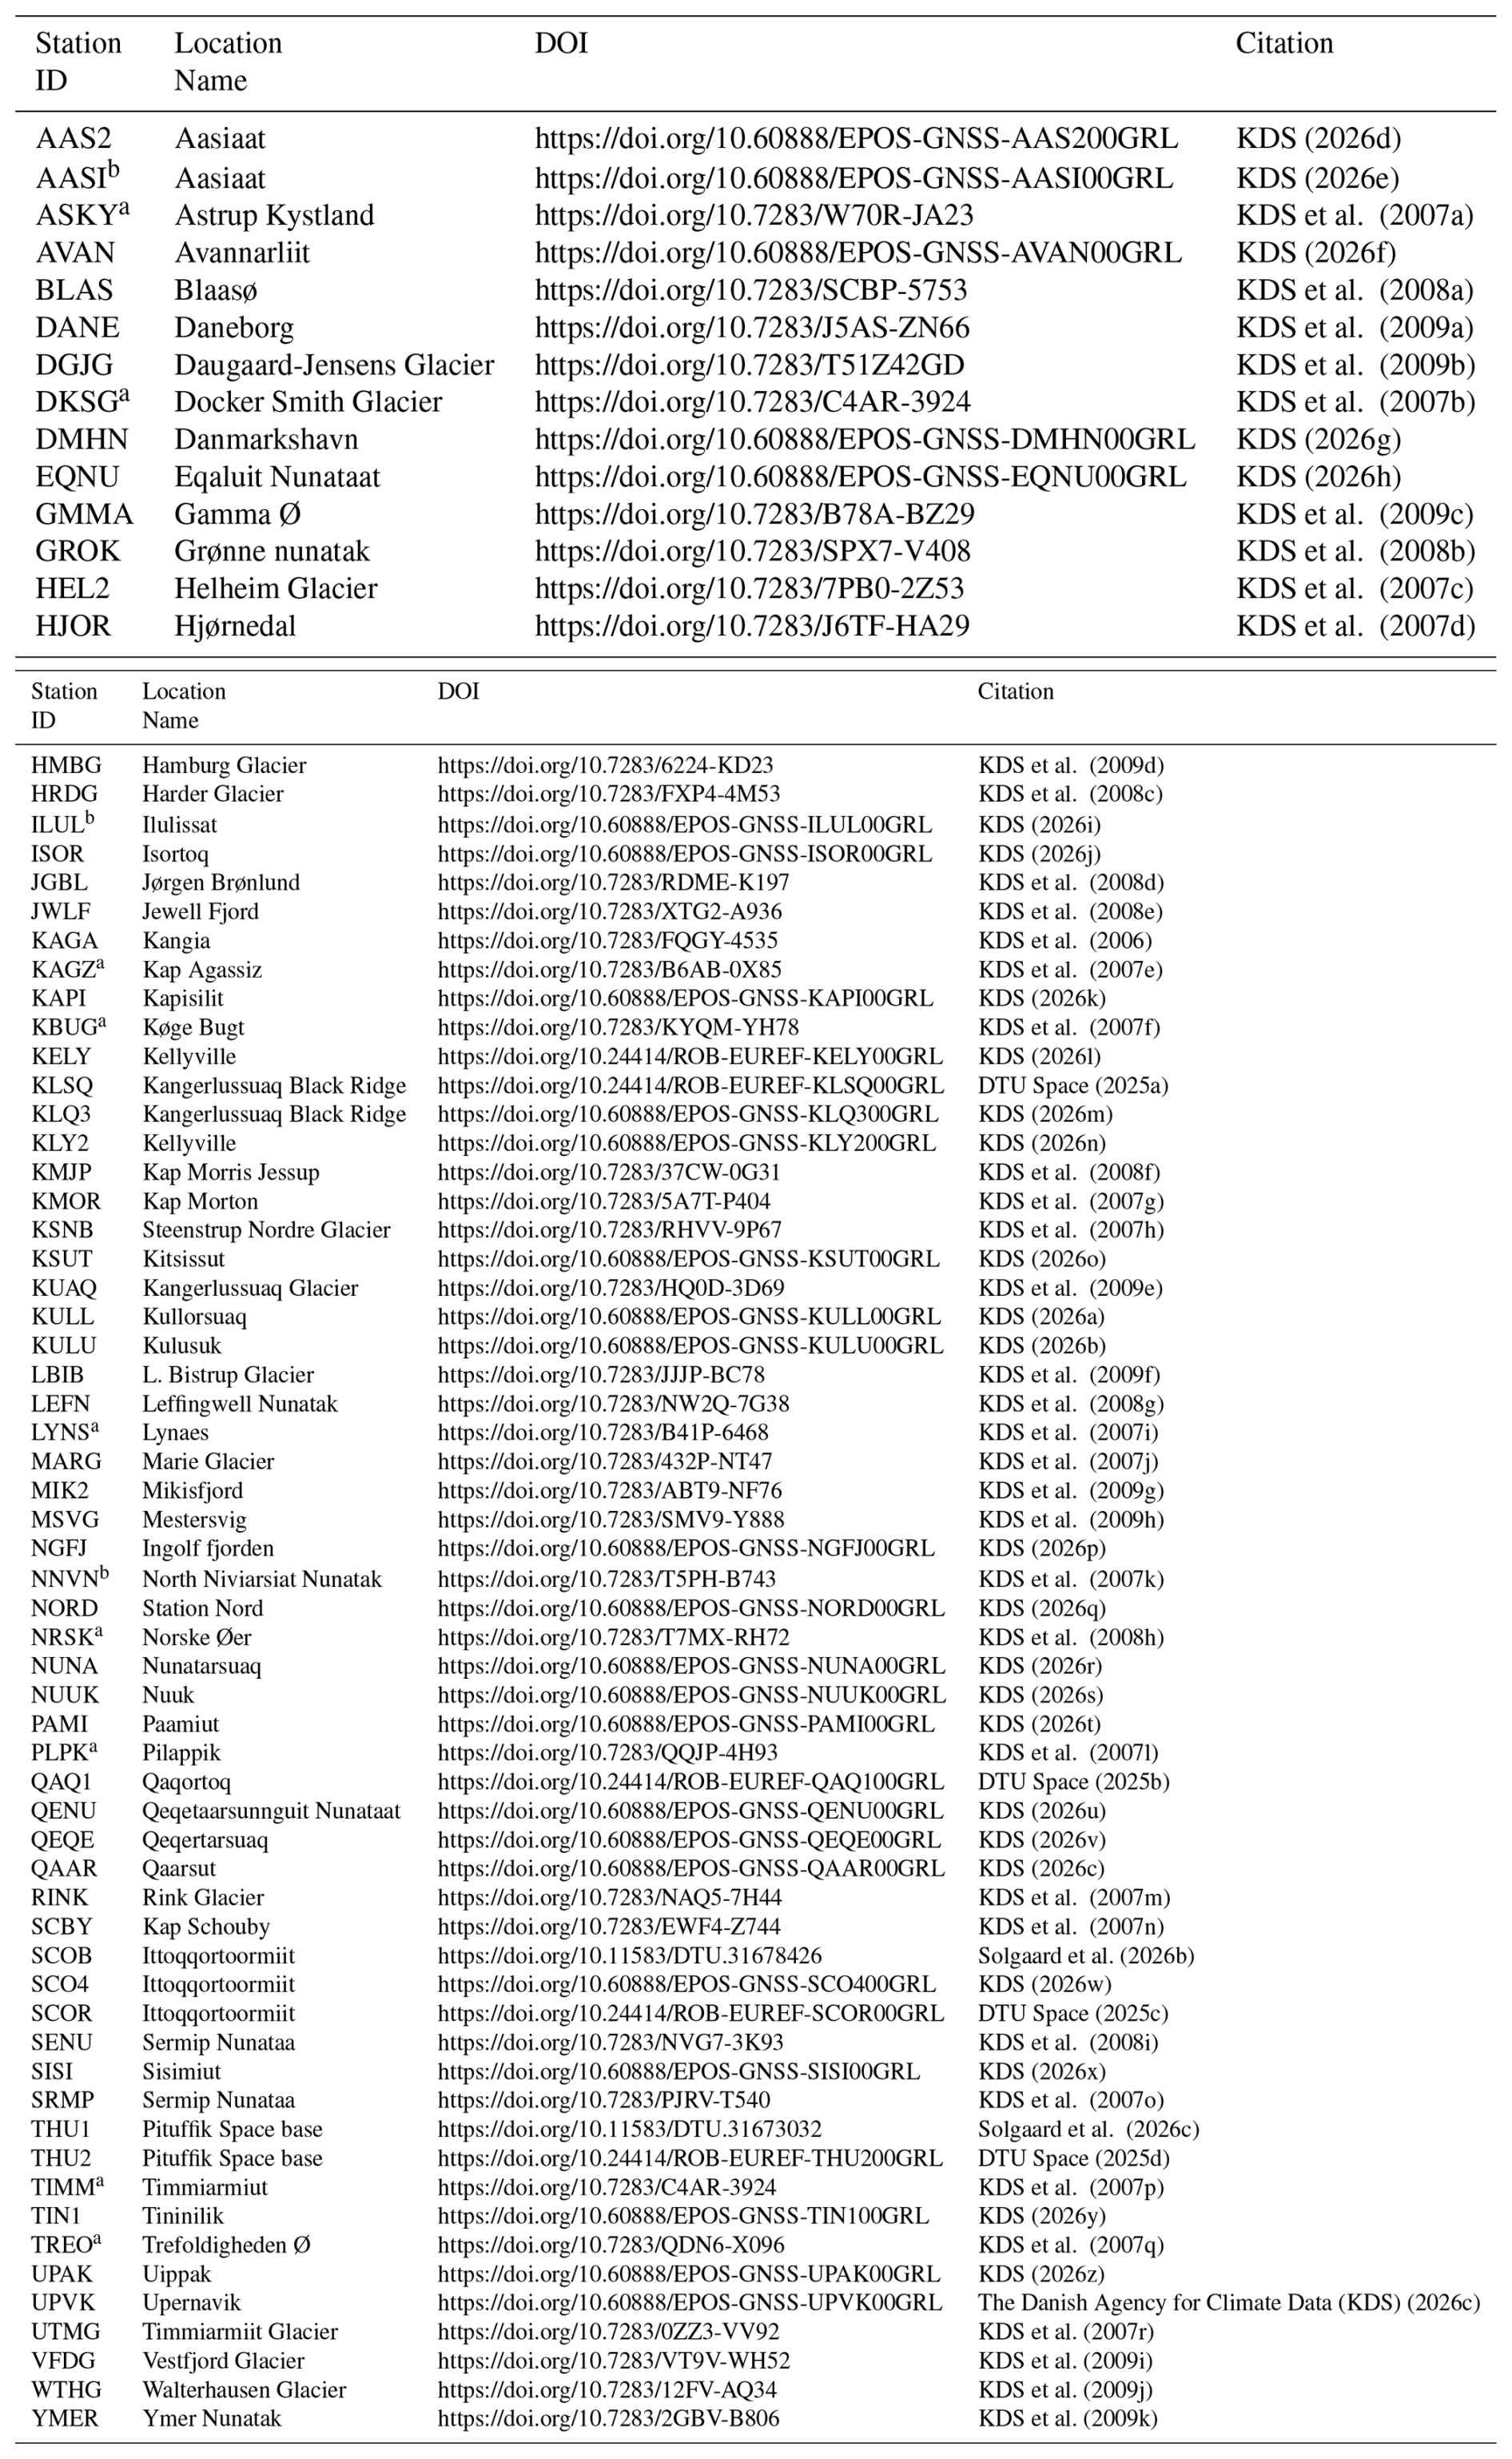
a denotes sites that the operational team, over the years have identified as exposed to destructive wildlife encounters such as polar bears, foxes, wolfs etc. No record of the incident dates are available, we refer to Fig. 9 for data availability for each site. b denotes sites which due to antenna monumentation or geographic location have had problems with snow cover, see Sect. 2.3 for further information.
CS conceptualized the study with inputs from SAK and DLB. FBM, THN, OB, SAK, MWD, and CS were involved in the collection of the observational data and the station metadata. SAK processed the position time series for all sites with DLB, compiling the processed NetCDF file. CS conducted the dataset validation process. CS wrote the majority of the paper, with SAB writing the processing section and FBM writing the historic GNSS station part. CS compiled most of the figures included, with DLB contributing one figure.
The contact author has declared that none of the authors has any competing interests.
Publisher's note: Copernicus Publications remains neutral with regard to jurisdictional claims made in the text, published maps, institutional affiliations, or any other geographical representation in this paper. The authors bear the ultimate responsibility for providing appropriate place names. Views expressed in the text are those of the authors and do not necessarily reflect the views of the publisher.
S. A. Khan acknowledges support from the Novo Nordisk Foundation under the Challenge Programme 2023 (grant no. NNF23OC00807040). We thank the Danish Agency for Climate Data for providing the GNET GNSS data. Lastly we want to acknowledge all former contributors and operators that have worked with the network, we extend our gratitude to: Eric Kendric, Dana Caccamise, Michael Willis, Jian Wang (Ohio State University, USA), Bjorn Johns, Seth White, Jeremy Miner (UNAVCO, USA), Arne V. Olesen, and Emil Nielsen (DTU SPACE, Denmark).
S. A. Khan has been supported by the Novo Nordisk Foundation under the Challenge Programme 2023 (grant no. NNF23OC00807040).
This paper was edited by Benjamin Männel and reviewed by Halfdan Pascal Kierulf and one anonymous referee.
Altamimi, Z., Rebischung, P., Collilieux, X., Métivier, L., and Chanard, K.: ITRF2020: an augmented reference frame refining the modeling of nonlinear station motions, J. Geodesy, 97, 47, https://doi.org/10.1007/s00190-023-01738-w, 2023. a
Aster, R. C., Borchers, B., and Thurber, C.: Parameter Estimation and Inverse Problems, Tech. rep., https://doi.org/10.1016/C2015-0-02458-3, 2004. a
Barletta, V. R., Bordoni, A., and Khan, S. A.: GNET Derived Mass Balance and Glacial Isostatic Adjustment Constraints for Greenland, Geophys. Res. Lett., 51, https://doi.org/10.1029/2023GL106891, 2024. a, b
Berg, D., Barletta, V. R., Hassan, J., Lippert, E. Y., Colgan, W., Bevis, M., Steffen, R., and Khan, S. A.: Vertical Land Motion Due To Present-Day Ice Loss From Greenland's and Canada's Peripheral Glaciers, Geophys. Res. Lett., 51, https://doi.org/10.1029/2023GL104851, 2024. a, b
Berg, D. L., Adhikari, S., Hassan, J., Steffen, R., Steffen, H., Willis, M., and Khan, S. A.: Estimation and Attribution of Horizontal Land Motion Measured by the Greenland GNSS Network, J. Geophys. Res.-Sol. Ea., 130, https://doi.org/10.1029/2024JB030847, 2025. a, b
Bertiger, W., Bar-Sever, Y., Dorsey, A., Haines, B., Harvey, N., Hemberger, D., Heflin, M., Lu, W., Miller, M., Moore, A. W., Murphy, D., Ries, P., Romans, L., Sibois, A., Sibthorpe, A., Szilagyi, B., Vallisneri, M., and Willis, P.: GipsyX/RTGx, a new tool set for space geodetic operations and research, Adv. Space Res., 66, 469–489, https://doi.org/10.1016/j.asr.2020.04.015, 2020. a, b, c, d
Bevis, M. and Brown, A.: Trajectory models and reference frames for crustal motion geodesy, J. Geodesy, 88, 283–311, https://doi.org/10.1007/s00190-013-0685-5, 2014. a
Bevis, M., Wahr, J., Khan, S. A., Bo Madsen, F., Brown, A., Willis, M., Kendrick, E., Knudsen, P., Box, J. E., van Dam, T., Caccamise II, D. J., Johns, B., Nylen, T., Abbott, R., White, S., Miner, J., Forsberg, R., Zhou, H., Wang, J., Wilson, T., Bromwich, D., and Francis, O.: Bedrock displacements in Greenland manifest ice mass variations, climate cycles and climate change, P. Ntl. Acad. Sci., 109, https://doi.org/10.1073/pnas.1204664109, 2012. a
Bevis, M., Harig, C., Khan, S. A., Brown, A., Simons, F. J., Willis, M., Fettweis, X., Van Den Broeke, M. R., Madsen, F. B., Kendrick, E., Caccamise, D. J., Van Dam, T., Knudsen, P., and Nylen, T.: Accelerating changes in ice mass within Greenland, and the ice sheet's sensitivity to atmospheric forcing, P. Natl. Acad. Sci. USA, 116, 1934–1939, https://doi.org/10.1073/pnas.1806562116, 2019. a
Bian, Y., Li, Z., Huang, Z., He, B., Shi, L., and Miao, S.: Combined GRACE and GPS to Analyze the Seasonal Variation of Surface Vertical Deformation in Greenland and Its Influence, Remote Sens., 15, https://doi.org/10.3390/rs15020511, 2023. a
Blewitt, G., Hammond, W. C., and Kreemer, C.: Harnessing the GPS Data Explosion for Interdisciplinary Science, Eos, 99, https://doi.org/10.1029/2018EO104623, 2018. a, b
Boehm, J., Niell, A., Tregoning, P., and Schuh, H.: Global Mapping Function (GMF): A new empirical mapping function based on numerical weather model data, Geophys. Res. Lett., 33, https://doi.org/10.1029/2005GL025546, 2006. a
Buchta, E., Scheinert, M., King, M. A., Wilson, T., Koulali, A., Clarke, P. J., Gómez, D., Kendrick, E., Knöfel, C., and Busch, P.: Advancing geodynamic research in Antarctica: reprocessing GNSS data to infer consistent coordinate time series (GIANT-REGAIN), Earth Syst. Sci. Data, 17, 1761–1780, https://doi.org/10.5194/essd-17-1761-2025, 2025. a
Carrére, L., Lyard, F., Cancet, M., Guillot, A., and Picot, N.: FES 2014, a new tidal model – validation results and perspectives for improvements, in: Proceedings of the ESA Living Planet Symposium, Prague, Czech Republic, 9–13, https://meetingorganizer.copernicus.org/EGU2015/EGU2015-5481-1.pdf (last access: 10 February 2026), 2016. a
DTU Space: GNSS data of KLSQ00GRL, Kangerlussuaq, Greenland, Royal Observatory of Belgium [data set], https://doi.org/10.24414/ROB-EUREF-KLSQ00GRL, 2025a. a
DTU Space: GNSS data of QAQ100GRL, Qaqortoq / Julianehaab, Greenland, Royal Observatory of Belgium (ROB) [data set], https://doi.org/10.24414/ROB-EUREF-QAQ100GRL, 2025b. a
DTU Space: GNSS data of SCOR00GRL, Scoresbysund/Ittoqqoormiit, Greenland, Royal Observatory of Belgium (ROB) [data set], https://doi.org/10.24414/ROB-EUREF-SCOR00GRL, 2025c. a
DTU Space: GNSS data of THU200GRL, Thule Airbase, Greenland, Royal Observatory of Belgium (ROB) [data set], https://doi.org/10.24414/ROB-EUREF-THU200GRL, 2025d. a
Fisher, M., Stafford, T., Moon, T., and Thurber, A.: QGreenland, Zenodo [code], https://doi.org/10.5281/zenodo.8326507, 2023. a
Goudarzi, M. A., Cocard, M., and Santerre, R.: Noise behavior in CGPS position time series: The Eastern North America case study, Journal of Geodetic Science, 5, 119–147, https://doi.org/10.1515/jogs-2015-0013, 2015. a, b, c
Greene, C. A., Gardner, A. S., Wood, M., and Cuzzone, J. K.: Ubiquitous acceleration in Greenland Ice Sheet calving from 1985 to 2022, Nature, 625, 523–528, https://doi.org/10.1038/s41586-023-06863-2, 2024. a
Hawley, R. and Brunt, K.: The Future Shape of the Greenland Geodetic Network (GNET), Arctic Research Consortium of the United States (ARCUS), https://www.arcus.org/witness-the-arctic/2019/12/highlight/1 (last access: 15 February 2026), 2019. a
Hawley, R., Ivins, E., Neumann, T., Adhikari, S., Andrews, L., Babonis, G., Bevis, M., Bromwich, D., Chew, C., Christensen, S., Crain, R., Csatho, B., Forsberg, R., Grapenthin, R., Khan, S. A., Kjeldsen, K. K., Knudsen, P., Larour, E., Bo Madsen, F., Mattiolli, G., Nylen, T., Dev Singh, K., van Dam, T., and Willis, M.: GNET 2017 Forward: The Future Shape of a Greenland GNSS Observation Network, Tech. rep., NASA Goddard Space Flight Center/National Science Foundation Workshop, https://go-gnet.org/Media/638059156160053022/GNETwhitepaper.pdf (last access: 1 March 2026), 2017. a, b
Heflin, M., Donnellan, A., Parker, J., Lyzenga, G., Moore, A., Ludwig, L. G., Rundle, J., Wang, J., and Pierce, M.: Automated Estimation and Tools to Extract Positions, Velocities, Breaks, and Seasonal Terms From Daily GNSS Measurements: Illuminating Nonlinear Salton Trough Deformation, Earth and Space Science, 7, https://doi.org/10.1029/2019EA000644, 2020. a, b, c
International GNSS Service: IGS Network, https://network.igs.org/, last access: 16 March 2026. a
International GNSS Service (IGS): Guidelines for Continuously Operating Reference Stations in the IGS, https://files.igs.org/pub/resource/guidelines/Procedure_for_Becoming_an_IGS_Station.pdf (last access: 6 July 2026), 2023. a
KDS: GNSS data of KULL00GRL, Kullorsuaq, Greenland, EPOS [data set], https://doi.org/10.60888/EPOS-GNSS-KULL00GRL, 2026a. a
KDS: GNSS data of KULU00GRL, Kulusuk, Greenland, EPOS [data set], https://doi.org/10.60888/EPOS-GNSS-KULU00GRL, 2026b. a
KDS: GNSS data of QAAR00GRL, Quaarsuut, Greenland, EPOS [data set], https://doi.org/10.60888/EPOS-GNSS-QAAR00GRL, 2026c. a
KDS: GNSS data of AASI00GRL, Aasiaat, Greenland, EPOS [data set], https://doi.org/10.60888/EPOS-GNSS-AASI00GRL, 2026d. a
KDS: GNSS data of AASI00GRL, Aasiaat, Greenland, EPOS [data set], https://doi.org/10.60888/EPOS-GNSS-AASI00GRL, 2026e. a
KDS: GNSS data of AVAN00GRL, Avannarliit, Greenland, EPOS [data set], https://doi.org/10.60888/EPOS-GNSS-AVAN00GRL, 2026f. a
KDS: GNSS data of DMHN00GRL, Danmarkshavn, Greenland, EPOS [data set], https://doi.org/10.60888/EPOS-GNSS-DMHN00GRL, 2026g. a
KDS: GNSS data of EQNU00GRL, Eqaluit Nunataat, Greenland, NSF GAGE Facility [data set], https://doi.org/10.60888/EPOS-GNSS-EQNU00GRL, 2026h. a
KDS: GNSS data of ILUL00GRL, Ilulissat, Greenland, EPOS [data set], https://doi.org/10.60888/EPOS-GNSS-ILUL00GRL, 2026i. a
KDS: GNSS data of ISOR00GRL, Isortoq, Greenland, EPOS [data set], https://doi.org/10.60888/EPOS-GNSS-ISOR00GRL, 2026j. a
KDS: GNSS data of KAPI00GRL, Kapisillit, Greenland, EPOS [data set], https://doi.org/10.60888/EPOS-GNSS-KAPI00GRL, 2026k. a
KDS: GNSS data of KELY00GRL, Kangerlussuaq, Greenland, Royal Observatory of Belgium [data set], https://doi.org/10.24414/ROB-EUREF-KELY00GRL, 2026l. a
KDS: GNSS data of KLQ300GRL, Kangerlussuaq, Greenland, EPOS [data set], https://doi.org/10.60888/EPOS-GNSS-KLQ300GRL, 2026m. a
KDS: GNSS data of KLY200GRL, Kellyville 2, Greenland, EPOS [data set], https://doi.org/10.60888/EPOS-GNSS-KLY200GRL, 2026n. a
KDS: GNSS data of KSUT00GRL, Nuuk, Greenland, EPOS [data set], https://doi.org/10.60888/EPOS-GNSS-KSUT00GRL, 2026o. a
KDS: GNSS data of NGFJ00GRL, Ingolf Fjord, Greenland, EPOS [data set], https://doi.org/10.60888/EPOS-GNSS-NGFJ00GRL, 2026p. a
KDS: GNSS data of NORD00GRL, Station Nord, Greenland, EPOS [data set], https://doi.org/10.60888/EPOS-GNSS-NORD00GRL, 2026q. a
KDS: GNSS data of NUNA00GRL, Nunatarsuaq, Greenland, EPOS [data set], https://doi.org/10.60888/EPOS-GNSS-NUNA00GRL, 2026r. a
KDS: GNSS data of NUUK00GRL, Nuuk, Greenland, EPOS [data set], https://doi.org/10.60888/EPOS-GNSS-NUUK00GRL, 2026s. a
KDS: GNSS data of PAMI00GRL, Paamiut, Greenland, EPOS [data set], https://doi.org/10.60888/EPOS-GNSS-PAMI00GRL, 2026t. a
KDS: GNSS data of QENU00GRL, Qeqetaarsunnguit Nunataat, Greenland, EPOS [data set], https://doi.org/10.60888/EPOS-GNSS-QENU00GRL, 2026u. a
KDS: GNSS data of QEQE00GRL, Qeqertarsuaq (Godhavn), Greenland, EPOS [data set], https://doi.org/10.60888/EPOS-GNSS-QEQE00GRL, 2026v. a
KDS: GNSS data of SCO400GRL, Scoresbysund/Ittoqqoormiit, Greenland, EPOS [data set], https://doi.org/10.60888/EPOS-GNSS-SCO400GRL, 2026w. a
KDS: GNSS data of SISI00GRL, Sisimiut, Greenland, EPOS [data set], https://doi.org/10.60888/EPOS-GNSS-SISI00GRL, 2026x. a
KDS: GNSS data of TIN100GRL, Tininnilik, Greenland, EPOS [data set], https://doi.org/10.60888/EPOS-GNSS-TIN100GRL, 2026y. a
KDS: GNSS data of UPAK00GRL, Uippak, Greenland, EPOS [data set], https://doi.org/10.60888/EPOS-GNSS-UPAK00GRL, 2026z. a
KDS, UNAVCO Community, Fahnestock, M., and Truffer, M.: Greenland GNSS Network – KAGA-Kangia North P.S. – GPS/GNSS Observations Dataset, NSF GAGE Facility [data set], https://doi.org/10.7283/FQGY-4535, 2006. a
KDS, UNAVCO Community, and Bevis, M.: Greenland GNSS Network – ASKY-Astrup Kystland P.S. – GPS/GNSS Observations Dataset, NSF GAGE Facility [data set], https://doi.org/10.7283/W70R-JA23, 2007a. a
KDS, UNAVCO Community, and Bevis, M.: Greenland GNSS Network – DKSG-Doecker Smith Gletscher P.S. – GPS/GNSS Observations Dataset, NSF GAGE Facility [data set], https://doi.org/10.7283/C4AR-3924, 2007b. a
KDS, UNAVCO Community, and Bevis, M.: Greenland GNSS Network – HEL2-Helheim Glacier P.S. – GPS/GNSS Observations Dataset, NSF GAGE Facility [data set], https://doi.org/10.7283/7PB0-2Z53, 2007c. a
KDS, UNAVCO Community, and Bevis, M.: Greenland GNSS Network – HJOR-Hjornefjeldet P.S. – GPS/GNSS Observations Dataset, NSF GAGE Facility [data set], https://doi.org/10.7283/J6TF-HA29, 2007d. a
KDS, UNAVCO Community, and Bevis, M.: Greenland GNSS Network – KAGZ-Kap Agassiz P.S. – GPS/GNSS Observations Dataset, NSF GAGE Facility [data set], https://doi.org/10.7283/B6AB-0X85, 2007e. a
KDS, UNAVCO Community, and Bevis, M.: Greenland GNSS Network – KBUG-Koge Bugt P.S. – GPS/GNSS Observations Dataset, NSF GAGE Facility [data set], https://doi.org/10.7283/KYQM-YH78, 2007f. a
KDS, UNAVCO Community, and Bevis, M.: Greenland GNSS Network – KMOR-Kap Morton P.S. – GPS/GNSS Observations Dataset, NSF GAGE Facility [data set], https://doi.org/10.7283/5A7T-P404, 2007g. a
KDS, UNAVCO Community, and Bevis, M.: Greenland GNSS Network – KSNB-Steenstrup Nordre Brae P.S. – GPS/GNSS Observations Dataset, NSF GAGE Facility [data set], https://doi.org/10.7283/RHVV-9P67, 2007h. a
KDS, UNAVCO Community, and Bevis, M.: Greenland GNSS Network – LYNS-Lynaes P.S. – GPS/GNSS Observations Dataset, NSF GAGE Facility [data set], https://doi.org/10.7283/B41P-6468, 2007i. a
KDS, UNAVCO Community, and Bevis, M.: Greenland GNSS Network – MARG-Marie Gletscher P.S. – GPS/GNSS Observations Dataset, NSF GAGE Facility [data set], https://doi.org/10.7283/432P-NT47, 2007j. a
KDS, UNAVCO Community, and Bevis, M.: Greenland GNSS Network – NNVN-North Niviarsiat Nunatak P.S. – GPS/GNSS Observations Dataset, NSF GAGE Facility [data set], https://doi.org/10.7283/T5PH-B743, 2007k. a
KDS, UNAVCO Community, and Bevis, M.: Greenland GNSS Network – PLPK-Pilappik P.S. – GPS/GNSS Observations Dataset, https://doi.org/10.7283/QQJP-4H93, 2007l. a
KDS, UNAVCO Community, and Bevis, M.: Greenland GNSS Network – RINK-Rinks Isbrae P.S. – GPS/GNSS Observations Dataset, NSF GAGE Facility [data set], https://doi.org/10.7283/NAQ5-7H44, 2007m. a
KDS, UNAVCO Community, and Bevis, M.: Greenland GNSS Network – SCBY-Kap Schoubye P.S. – GPS/GNSS Observations Dataset, NSF GAGE Facility [data set], https://doi.org/10.7283/EWF4-Z744, 2007n. a
KDS, UNAVCO Community, and Bevis, M.: Greenland GNSS Network – SRMP-Sermip Nuunataa P.S. – GPS/GNSS Observations Dataset, NSF GAGE Facility [data set], https://doi.org/10.7283/PJRV-T540, 2007o. a
KDS, UNAVCO Community, and Bevis, M.: Greenland GNSS Network – TIMM-Timmiarmiut P.S. – GPS/GNSS Observations Dataset, NSF GAGE Facility [data set], https://doi.org/10.7283/QDN6-X096, 2007p. a
KDS, UNAVCO Community, and Bevis, M.: Greenland GNSS Network – TREO-Trefoldighedens O P.S. – GPS/GNSS Observations Dataset, NSF GAGE Facility [data set], https://doi.org/10.7283/VH5H-PX24, 2007q. a
KDS, UNAVCO Community, and Bevis, M.: Greenland GNSS Network – UTMG-Upper Timmiarmiit Glacier P.S. – GPS/GNSS Observations Dataset, NSF GAGE Facility [data set], https://doi.org/10.7283/0ZZ3-VV92, 2007r. a
KDS, UNAVCO Community, and Bevis, M.: Greenland GNSS Network – BLAS-Blaasor P.S. – GPS/GNSS Observations Dataset, NSF GAGE Facility [data set], https://doi.org/10.7283/SCBP-5753, 2008a. a
KDS, UNAVCO Community, and Bevis, M.: Greenland GNSS Network – GROK-Gronne Nunatak P.S. – GPS/GNSS Observations Dataset, NSF GAGE Facility [data set], https://doi.org/10.7283/SPX7-V408, 2008b. a
KDS, UNAVCO Community, and Bevis, M.: Greenland GNSS Network – HRDG-Harder Gletscher P.S. – GPS/GNSS Observations Dataset, NSF GAGE Facility [data set], https://doi.org/10.7283/FXP4-4M53, 2008c. a
KDS, UNAVCO Community, and Bevis, M.: Greenland GNSS Network – JGBL-Jorgen Bronlund P.S. – GPS/GNSS Observations Dataset, NSF GAGE Facility [data set], https://doi.org/10.7283/RDME-K197, 2008d. a
KDS, UNAVCO Community, and Bevis, M.: Greenland GNSS Network – JWLF-Jewell Fjord P.S. – GPS/GNSS Observations Dataset, NSF GAGE Facility [data set], https://doi.org/10.7283/XTG2-A936, 2008e. a
KDS, UNAVCO Community, and Bevis, M.: Greenland GNSS Network – KMJP-Kap Morris Jessup P.S. – GPS/GNSS Observations Dataset, NSF GAGE Facility [data set], https://doi.org/10.7283/HR4C-EC55, 2008f. a
KDS, UNAVCO Community, and Bevis, M.: Greenland GNSS Network – LEFN-Leffingwell Nunatak P.S. – GPS/GNSS Observations Dataset, NSF GAGE Facility [data set], https://doi.org/10.7283/NW2Q-7G38, 2008g. a
KDS, UNAVCO Community, and Bevis, M.: Greenland GNSS Network – NRSK-Norske Oye P.S. – GPS/GNSS Observations Dataset, NSF GAGE Facility [data set], https://doi.org/10.7283/T7MX-RH72, 2008h. a
KDS, UNAVCO Community, and Bevis, M.: Greenland GNSS Network – SENU-Sermip Nunataa P.S. – GPS/GNSS Observations Dataset, NSF GAGE Facility [data set], https://doi.org/10.7283/NVG7-3K93, 2008i. a
KDS, UNAVCO Community, and Bevis, M.: Greenland GNSS Network – DANE-Daneborg P.S. – GPS/GNSS Observations Dataset, NSF GAGE Facility [data set], https://doi.org/10.7283/J5AS-ZN66, 2009a. a
KDS, UNAVCO Community, and Bevis, M.: Greenland GNSS Network – DGJG-Daugaard Jensen Gletshcer P.S. – GPS/GNSS Observations Dataset, NSF GAGE Facility [data set], https://doi.org/10.7283/T51Z42GD, 2009b. a
KDS, UNAVCO Community, and Bevis, M.: Greenland GNSS Network – GMMA-Gamma O P.S. – GPS/GNSS Observations Dataset, NSF GAGE Facility [data set], https://doi.org/10.7283/B78A-BZ29, 2009c. a
KDS, UNAVCO Community, and Bevis, M.: Greenland GNSS Network – HMBG-Hamburg Gletshcer P.S. – GPS/GNSS Observations Dataset, NSF GAGE Facility [data set], https://doi.org/10.7283/6224-KD23, 2009d. a
KDS, UNAVCO Community, and Bevis, M.: Greenland GNSS Network – KUAQ-Kangerdlussuaq Gletshcer P.S. – GPS/GNSS Observations Dataset, NSF GAGE Facility [data set], https://doi.org/10.7283/HQ0D-3D69, 2009e. a
KDS, UNAVCO Community, and Bevis, M.: Greenland GNSS Network – LBIB-L. Bistrup Is Brae P.S. – GPS/GNSS Observations Dataset, NSF GAGE Facility [data set], https://doi.org/10.7283/JJJP-BC78, 2009f. a
KDS, UNAVCO Community, and Bevis, M.: Greenland GNSS Network – MIK2-Mikis Fjord P.S. – GPS/GNSS Observations Dataset, NSF GAGE Facility [data set], https://doi.org/10.7283/ABT9-NF76, 2009g. a
KDS, UNAVCO Community, and Bevis, M.: Greenland GNSS Network – MSVG-Mestersvig P.S. – GPS/GNSS Observations Dataset, NSF GAGE Facility [data set], https://doi.org/10.7283/SMV9-Y888, 2009h. a
KDS, UNAVCO Community, and Bevis, M.: Greenland GNSS Network – VFDG-Vestfjord Gletscher P.S. – GPS/GNSS Observations Dataset, NSF GAGE Facility [data set], https://doi.org/10.7283/VT9V-WH52, 2009i. a
KDS, UNAVCO Community, and Bevis, M.: Greenland GNSS Network – WTHG-Walterhausen Gletshcer P.S. – GPS/GNSS Observations Dataset, NSF GAGE Facility [data set], https://doi.org/10.7283/12FV-AQ34, 2009j. a
KDS, UNAVCO Community, and Bevis, M.: Greenland GNSS Network – YMER-Ymer Nunatak P.S. – GPS/GNSS Observations Dataset, NSF GAGE Facility [data set], https://doi.org/10.7283/2GBV-B806, 2009k. a
Khan, S. A., Liu, L., Wahr, J., Howat, I., Joughin, I., Van Dam, T., and Fleming, K.: GPS measurements of crustal uplift near Jakobshavn Isbræ due to glacial ice mass loss, J. Geophys. Res.-Sol. Ea., 115, https://doi.org/10.1029/2010JB007490, 2010a. a
Khan, S. A., Wahr, J., Bevis, M., Velicogna, I., and Kendrick, E.: Spread of ice mass loss into northwest Greenland observed by GRACE and GPS, Geophys. Res. Lett., 37, https://doi.org/10.1029/2010GL042460, 2010b. a
Khan, S. A., Sasgen, I., Bevis, M., Van Dam, T., Bamber, J. L., Willis, M., Kjær, K. H., Wouters, B., Helm, V., Csatho, B., Fleming, K., Bjørk, A. A., Aschwanden, A., Knudsen, P., and Munneke, P. K.: Geodetic measurements reveal similarities between post–Last Glacial Maximum and present-day mass loss from the Greenland ice sheet, Science Advances, 2, https://doi.org/10.1126/sciadv.1600931, 2016. a, b
Kjeldsen, K. K., Khan, S. A., Wahr, J., Korsgaard, N. J., Kjær, K. H., Bjørk, A. A., Hurkmans, R., Van Den Broeke, M. R., Bamber, J. L., and Van Angelen, J. H.: Improved ice loss estimate of the northwestern Greenland ice sheet, J. Geophys. Res.-Sol. Ea., 118, 698–708, https://doi.org/10.1029/2012JB009684, 2013. a
Larson, K. M., Ray, R. D., Nievinski, F. G., and Freymueller, J. T.: The accidental tide gauge: A GPS reflection case study from kachemak bay, Alaska, IEEE Geosci. Remote S., 10, 1200–1204, https://doi.org/10.1109/LGRS.2012.2236075, 2013. a
Liu, L., Khan, S. A., van Dam, T., Ma, J. H. Y., and Bevis, M.: Annual variations in GPS-measured vertical displacements near Upernavik Isstrøm (Greenland) and contributions from surface mass loading, J. Geophys. Res.-Sol. Ea., 122, 677–691, https://doi.org/10.1002/2016JB013494, 2017. a
Materna, K., Feng, L., Lindsey, E. O., Hill, E. M., Ahsan, A., Alam, A. K., Oo, K. M., Than, O., Aung, T., Khaing, S. N., and Bürgmann, R.: GNSS characterization of hydrological loading in South and Southeast Asia, Geophys. J. Int., 224, 1742–1752, https://doi.org/10.1093/gji/ggaa500, 2021. a
Montillet, J.-P. and Bos, M. S.: Springer Geophysics Geodetic Time Series Analysis in Earth Sciences, Tech. rep., Springer Geophysics, ISBN 978-3-030-21717-4, http://www.springer.com/series/10173 (last access: 1 March 2026), 2020. a, b
NASA Jet Propulsion Laboratory: JPL GPS Time Series (repro2018a), https://sideshow.jpl.nasa.gov/pub/JPL_GPS_Timeseries/repro2018a/post/point/ (last access: 5 March 2026), 2018. a
Nielsen, K., Khan, S. A., Korsgaard, N. J., Kjær, K. H., Wahr, J., Bevis, M., Stearns, L. A., and Timm, L. H.: Crustal uplift due to ice mass variability on Upernavik Isstrøm, west Greenland, Earth Planet. Sc. Lett., 353–354, 182–189, https://doi.org/10.1016/j.epsl.2012.08.024, 2012. a
Seeber, G.: Seeber ⋅ Satellite Geodesy, de Gruyter, 2nd edn., ISBN 3-11-017569-5, 2003. a
Septentrio: PolaRx5: Multi-frequency, multi-constellation GNSS Reference Receiver, https://www.septentrio.com/en/products/gnss-receivers/gnss-reference-receivers/polarx-5, last access: 1 October 2025. a, b, c
Simpson, M. J., Wake, L., Milne, G. A., and Huybrechts, P.: The influence of decadal- to millennial-scale ice mass changes on present-day vertical land motion in Greenland: Implications for the interpretation of GPS observations, J. Geophys. Res.-Sol. Ea., 116, https://doi.org/10.1029/2010JB007776, 2011. a
Solgaard, C.: CSolgaard/GNET_data_paper_2026: ESSD GNET data paper 2026 (Solgaard et. al, 2026) (Version V1), Zenodo [code], https://doi.org/10.5281/zenodo.21227009, 2026. a
Solgaard, C., Nordmann Winther-Dahl, M., Nylen, T., Madsen, F. B., Hansen, O. B., Berg, D. L., Hassan, J., Knudsen, P., Bevis, M., and Khan, S. A.: Daily coordinate time series from the Greenland GNSS Network (GNET) from 1995–2025, DTU [data set], https://doi.org/10.11583/DTU.31397901, 2026a. a, b, c
Solgaard, C., Nordmann Winther-Dahl, M., Nylen, T., Madsen, F. B., Hansen, O. B., Berg, D. L., Hassan, J., Knudsen, P., Bevis, M., and Khan, S. A.: SCOB daily RINEX2 30s files from 1997–2005 [Dataset], https://doi.org/10.11583/DTU.31678426, 2026b. a
Solgaard, C., Nordmann Winther-Dahl, M., Nylen, T., Madsen, F. B., Hansen, O. B., Berg, D. L., Hassan, J., Knudsen, P., Bevis, M., and Khan, S. A.: THU1 daily RINEX2 30s files from 1995–2003 [Dataset], https://doi.org/10.11583/DTU.31673032, 2026c. a
The Danish Agency for Climate Data (Klimadatastyrelsen): GNET – Greenland GNSS Network, https://www.eng.klimadatastyrelsen.dk/green-transition-and-climate-adaptation/gnet (last access: 1 October 2025), 2026a. a
The Danish Agency for Climate Data (KDS): GNSS – Grønland, Dataforsyningen [data set], https://dataforsyningen.dk/data/4804 (last access: 16 March 2026), 2026b. a, b, c, d
The Danish Agency for Climate Data (KDS): GNSS data of UPVK00GRL, Upernavik, Greenland, EPOS [data set], https://doi.org/10.60888/EPOS-GNSS-UPVK00GRL, 2026c. a
UNAVCO Inc.: NSF GAGE – Measuring Our Changing Earth, https://www.unavco.org/, last access: 1 February 2026. a
White, A. M., Gardner, W. P., Borsa, A. A., Argus, D. F., and Martens, H. R.: A Review of GNSS/GPS in Hydrogeodesy: Hydrologic Loading Applications and Their Implications for Water Resource Research, Water Resour. Res., https://doi.org/10.1029/2022WR032078, 2022. a
Xeos Technologies Inc.: Resolute: All-in-one GNSS monitoring receiver, https://xeostech.com/resolute (last access: 1 October 2025), 2024. a, b, c
- Abstract
- Introduction
- Network description
- Data processing
- Dataset overview
- The Future of GNET and GNSS monitoring in Greenland
- Code and data availability
- Conclusion
- Appendix A: Velocity Estimates
- Appendix B: RINEX format data DOI's
- Author contributions
- Competing interests
- Disclaimer
- Acknowledgements
- Financial support
- Review statement
- References
- Abstract
- Introduction
- Network description
- Data processing
- Dataset overview
- The Future of GNET and GNSS monitoring in Greenland
- Code and data availability
- Conclusion
- Appendix A: Velocity Estimates
- Appendix B: RINEX format data DOI's
- Author contributions
- Competing interests
- Disclaimer
- Acknowledgements
- Financial support
- Review statement
- References