the Creative Commons Attribution 4.0 License.
the Creative Commons Attribution 4.0 License.
 | 21 Jan 2026
A global black carbon dataset of column concentration and microphysical information derived from MISR multi-band observations and Mie scattering simulations
Zhewen Liu
Jason B. Cohen
Pravash Tiwari
Luoyao Guan
Shuo Wang
Zhengqiang Li
Black carbon, a major absorbing component of atmospheric aerosols, plays an important role in climate regulation, air quality, and human health, yet its column concentration and microphysical properties at regional and global scales remains highly uncertain. In this study, we implement an integrated approach that combines multi-angle, multi-band observations from the Multi-angle Imaging SpectroRadiometer (MISR) with a Mie scattering framework to estimate black carbon column properties including size and mixing state globally on a daily basis. By constraining particle size distributions with absorption aerosol optical depth and single scattering albedo across all four bands, the method simultaneously retrieves number and mass concentrations. Long-term simulations from 2005 to 2020 reveal distinct spatial and temporal patterns, with particularly high levels over biomass burning regions in Africa and South America as well as industrial and urban centers in Asia. Comparisons with ground-based sun photometer measurements and reanalysis data confirm the robustness and accuracy of the estimates. The resulting dataset provides a consistent global record of black carbon column concentrations, offering valuable support for constraining climate models, improving assessments of aerosol radiative forcing, and informing targeted mitigation strategies. The dataset is publicly available at https://doi.org/10.6084/m9.figshare.30173917 (Liu et al., 2026).
- Article
(9789 KB) - Full-text XML
- BibTeX
- EndNote


Atmospheric aerosols, a mixture of fine solid and liquid particles widely distributed within the troposphere, play a pivotal role in climate systems, air quality, and human health due to their complex sources and heterogeneous distribution. Among these, black carbon (BC), characterized by its unique optical and physicochemical properties (Hodnebrog et al., 2014; Lund et al., 2018), has garnered increasing attention in atmospheric science (Jacobson, 2001; Li et al., 2016). BC's strong solar radiation absorption capacity makes it potentially among the most critical climate forcing agents after carbon dioxide. The exact magnitude of its radiative impact remains a subject of ongoing debate in recent assessments (e.g., IPCC AR6) as well as many papers not cited in the AR6 (including but not limited to Mann et al. (2010), Chen et al. (2022), Everett et al. (2022), Kelesidis et al. (2022), Sedlacek et al. (2022), Ramachandran et al. (2023). Major causes of these differences are due to complexities in terms of both microphysical representations of BC on a per-particle basis, as well as emissions and column loading of BC on an atmospheric basis, meaning that the discussion continues to have profound implications for global warming and regional climate change, as well as on the remote sensing retrieval community (Ramanathan and Carmichael, 2008; Li et al., 2022a). Predominantly generated through the incomplete combustion of carbonaceous materials (Bond et al., 2013; Xie et al., 2025), BC sources include natural events (Cohen, 2014), such as volcanic eruptions and wildfires, and anthropogenic activities (Szidat et al., 2006; Lin et al., 2020b; Wang et al., 2020), such as fossil fuel combustion, industrial sources, steel and other materials production, and vehicular emissions. Freshly emitted BC particles are typically independent entities (Tanaka et al., 2012), but aging processes in the atmosphere lead to interactions with other primary aerosols, secondary aerosol precursors, and atmospheric water vapor, forming a “core-shell” type of structure that is thermodynamically stable (Chen et al., 2013; Wang et al., 2021b). This aged aerosol is the dominant type found in the in-situ environment (Roberts and Jones, 2004; Mylläri et al., 2019) especially so in more heavily polluted areas (He et al., 2015). Such a configuration amplifies BC's light absorption capabilities (Hansen et al., 2007; Chung et al., 2012; Cappa et al., 2012; Tiwari et al., 2023), further intensifying its impact on radiative balance and atmospheric dynamics, especially regionally (Lund et al., 2017; Wang et al., 2019).
Additionally, BC deposition on snow and ice surfaces reduces albedo (Zhao and Garrett, 2015; Zhao et al., 2023), accelerating melt rates and exerting a significant influence on the climate (Xie et al., 2018), particularly in high-latitude and high-altitude regions. Beyond its climatic impacts (Rosenfeld et al., 2014; Ding et al., 2016; Ma et al., 2020), BC disrupts boundary layer structures, facilitates haze formation, and inhibits pollutant dispersion, thereby degrading air quality (Guo et al., 2019). Furthermore, BC particles carry toxic combustion byproducts, posing relatively more severe health risks than PM2.5 on average, including increased respiratory and cardiovascular disease incidences (Cassee et al., 2013; Yang et al., 2021), representing a significant public health concern. Therefore, enhancing BC monitoring and research is essential for quantifying its sources, evolution, and impacts, improving climate model predictions, and formulating targeted pollution mitigation and emission reduction strategies.
The column concentration of BC, an essential indicator of its total amount in the atmospheric column, has been widely used to evaluate BC's radiative effects and climate impact. Advances in ground-based observation, satellite remote sensing, and numerical simulations have significantly enriched the understanding of its spatiotemporal distribution and environmental consequences (Liu et al., 2024a, b; Tiwari et al., 2025). Ground-based measurements using instruments such as sun photometers, BC analyzers, and aerosol optical property devices provide high temporal resolution and measurement accuracy but are spatially confined to specific regions (Schwarz et al., 2008; Lee et al., 2016b). Seasonal variations in BC column concentrations are evident (Li et al., 2023; Yu et al., 2024), with studies in high-pollution areas indicating substantially higher levels during winter compared to summer, or during intense periods of industrial activity and/or local biomass burning. However, the limited spatial coverage of ground observations fails to comprehensively represent global BC column concentration distributions.
Satellite remote sensing has opened new avenues for monitoring BC column concentrations at regional and global scales (Yu et al., 2024). Traditional approaches have frequently used retrievals of aerosol optical depth from satellite observations to derive BC column mass concentrations using fixed and/or simplified microphysical properties of BC (Junghenn Noyes et al., 2020; Li et al., 2020, 2022b; Limbacher et al., 2022; Torres et al., 2020; Zhang et al., 2025). While sophisticated component-based retrieval frameworks (Li et al., 2019) have made advancements in this field including better use of polarization and improved representation of particle size, the use of multi-angle and multi-band observations from MISR provide a unique possibility to further constrain the microphysical variability of BC, such as high resolution particle size and mixing state variability, and non-homogenous computation of SSA, allowing both more realistic per-particle microphysical and total atmospheric column constraints on BC on a global scale. However, challenges in spatial resolution and data accuracy persist, especially in regions with complex terrain, severe pollution, where the sources of BC emissions are undergoing rapid changes, where different sources of pollutants mix with each other, or in other locations where retrieval reliability and uncertainty requires further improvement (Wang et al., 2021c; Lu et al., 2025). Numerical simulations have been proven invaluable in investigating the sources, transport, and deposition processes of BC column concentrations (Randles et al., 2017; Bousserez et al., 2020; Wang et al., 2021a). Atmospheric chemical transport models and climate models reveal that long-range BC transport contributes significantly to high concentrations in certain regions and exerts substantial downstream climatic and environmental impacts (Wang et al., 2017; Tegtmeier et al., 2022; Yang et al., 2022; Senf et al., 2023; Zhao et al., 2024; Chakraborty et al., 2025). Despite their spatial and temporal comprehensiveness, the accuracy of numerical simulations heavily depends on emission inventories in both space and time (Wang et al., 2025; Li et al., 2025), in addition to the understanding and parameterization of, as well as access to sufficient data to compute relevant physicochemical processes (Chen and Prinn, 2006; Kim et al., 2008).
This study proposes an innovative methodology for estimating BC column concentrations by integrating satellite remote sensing data, aiming to enhance calculation efficiency and accuracy through the effective utilization of multisource satellite datasets. Specifically, the method involves leveraging data from four spectral bands of the MISR satellite by reading and processing them on a daily basis to obtain critical parameters (Diner et al., 1998; Ahn et al., 2008; Lee et al., 2016a), including Absorption Aerosol Optical Depth (AAOD) and Single Scattering Albedo (SSA). These parameters are then input into the Mie scattering model (MIE model) for particulate size retrieval, followed by BC column concentration estimation. This estimation encompasses both mass and particle count data, providing a comprehensive basis for evaluating BC's environmental and climatic effects. Detailed sensitivity analyses of the data were conducted to ensure result reliability and stability. Furthermore, comparisons with AERONET optical properties and inter-comparisons with the MERRA-2 reanalysis serve to evaluate and demonstrate the method's consistency, realism over areas with limited, misplaced, or out of date a priori emissions data, and applicability to offering a new consistent product across global scales at daily resolution over decadal temporal scales. This integrated approach, combining satellite remote sensing and model computations, presents an innovative solution for BC column concentration estimation, improving data processing efficiency and mitigating the limitations of traditional single-source methods. By effectively leveraging multi-band satellite observations, this methodology holds promise for advancing aerosol monitoring and climate model validation, offering robust technical support for regional and global BC research.
2.1 MISR AOD/SSA/AAOD
The MISR, a key component of NASA's Earth Observing System (EOS), captures multi-angle reflected sunlight images to investigate Earth's ecosystems and climate change (Kalashnikova and Kahn, 2006). Launched aboard the Terra satellite in 1999 (Shi and Cressie, 2007), MISR consists of nine push-broom cameras that image Earth in four spectral bands (443, 555, 670, and 865 nm) and provide global coverage every nine days (Martonchik et al., 2004). Multi-angle observations mitigate the influence of vertical aerosol distribution heterogeneity on aerosol optical depth (AOD) retrievals and aid in distinguishing optical properties of various aerosol types based on their sphericity (Wang and Gordon, 1994; Kalashnikova and Kahn, 2008; Kalashnikova et al., 2013).
The product used in this study, MIL3DAEN_4, is MISR's Level 3 global aerosol product (CGAS), providing aerosol information on a global 0.5° × 0.5° latitude-longitude grid (NASA/LARC/SD/ASDC, 2008). These data are aggregated from higher-resolution (4.4 km × 4.4 km) MISR Level 2 aerosol retrievals and include daily, monthly, seasonal, and annual averages (Garay et al., 2017; Si et al., 2020). For each temporal product, the grid-cell value is computed by aggregating all screened Level-2 retrieval samples falling within the corresponding 0.5° × 0.5° cell during that reporting period. A key feature of the MIL3DAEN_4 product is its capacity for global-scale aerosol monitoring and multi-temporal data aggregation. By utilizing multi-angle imaging, it provides AOD and AAOD data, effectively capturing both scattering and absorbing properties of aerosols. In MIL3DAEN_4, the gridded data resolution is 0.5° × 0.5°, with each grid cell value averaged from higher-resolution Level 2 product samples, assigning equal weight without regard to sampling frequency. Specifically, all screened samples within a grid cell are used to compute the arithmetic mean, with equal weight assigned to each valid sample. To maintain data credibility, the MIL3DAEN_4 product only includes samples where the “Aerosol_Retrieval_Screening_Flags” are set to 0, thereby excluding samples failing the standard screening criteria and typically reducing coverage over persistently challenging surfaces (e.g., Greenland and Antarctica). The MIL3DAEN_4 product inherits a “Stage 3 Validated” maturity level, with reported uncertainties of approximately ±0.05 (or 20 % × AERONET) for AOD (Kahn et al., 2010; Garay et al., 2020), based on extensive global evaluations.
Moreover, MIL3DAEN_4 offers substantial temporal and spatial coverage, supporting analyses of aerosol temporal trends and spatial distributions. Accumulating long-term data, MIL3DAEN_4 facilitates examination of aerosols' long-term trends and their potential impacts on climate and ecosystems. Despite its relatively coarse spatial resolution, MIL3DAEN_4 provides unique insights into aerosols' role within the Earth's climate system on both global and regional scales. Compared with other aerosol remote sensing products, MISR's multi-angle approach enables improved retrieval accuracy of aerosol optical properties, particularly for specific regions and aerosol types.
In summary, the MIL3DAEN_4 product, as MISR's Level 3 aerosol product, aggregates aerosol optical and physical characteristics in a globally gridded format, offering multi-temporal data on aerosol variations with significant scientific value. MIL3DAEN_4 plays a critical role in studies of aerosol scattering and absorption characteristics. Although limited by its spatial resolution, its multi-angle and multi-spectral observational capability provides robust data for monitoring aerosols at varying spatial and temporal scales.
2.2 MIE model
The Mie model is a theoretical model used to calculate the interaction between electromagnetic waves and spherical particles and holds significant applications in aerosol optical property research (Bohren and Huffman, 1998). Named after the German physicist Gustav Mie (1908), the Mie scattering model is based on Maxwell's equations and addresses the scattering and absorption of incident electromagnetic waves by spherical particles to determine properties such as the intensity, phase, and polarization of scattered light. This model considers factors such as the wavelength of incident radiation, particle size (expressed through the size parameter x, where , with D as particle diameter and λ as wavelength), and the particle's complex refractive index (, where n is the real part and k is the imaginary part of the refractive index).
Using a “core-shell” aerosol structure, the Mie scattering optical model is applied to calculate radiative parameters for extinction aerosols (Kahnert et al., 2007; Wang et al., 2021b; Liu et al., 2024b). This model, based on Mie scattering theory, treats light waves as electron waves and solves Maxwell's equations for both internal and external regions of the particle under boundary conditions determined by particle shape and size. Mie scattering theory thus provides an exact solution for a homogeneous, spherical particle in the far-field under monochromatic plane wave illumination. Based on the particle's chemical composition, size parameter, and refractive index, the model calculates the scattering, extinction, and absorption efficiencies (Qsca, Qext, Qabs), which are then used to determine the optical properties of BC particles across MISR's four spectral bands. This methodological approach focuses on these core physical outputs and their application within the retrieval framework, while the detailed mathematical derivations using Bessel functions are extensively documented in established literature (Abramowitz and Stegun, 1965; Ladutenko et al., 2017).
2.3 Uncertainty Characterization of Comparison Datasets
To enhance the completeness of the analysis and provide a broader contextual framework, this study incorporates comparisons with ground-based AERONET observations and MERRA-2 reanalysis data. These reference datasets are utilized to situating the retrieval results within the context of established aerosol products rather than to serve as an absolute evaluation of accuracy. It is essential to acknowledge that both reference datasets possess inherent uncertainties and physical limitations that vary spatiotemporally, which must be considered when interpreting discrepancies.
The MERRA-2 monthly product provides a global spatial context for validation but should be interpreted as a model-driven estimate constrained by observations rather than direct observation. MERRA-2 assimilates total column AOD from satellites (MODIS, MISR) and ground stations (AERONET) but does not assimilate BC concentrations directly (Buchard et al., 2017; Randles et al., 2017). The apportionment of the assimilated total AOD into specific aerosol components (BC, dust, sulfate, etc.) is governed by the GOCART aerosol module's physics and the underlying emission inventories. Previous validation studies have indicated that MERRA-2 tends to underestimate BC surface concentrations in regions of high anthropogenic emissions, such as East Asia and South Asia, often by 20 %–50 % due to uncertainties in emission inventories (Song et al., 2018; Qin et al., 2019; Yan et al., 2022). Conversely, over remote oceans and in the stratosphere, MERRA-2 has been shown to potentially overestimate BC loading compared to aircraft observations (Buchard et al., 2017), while studies considering active aging of BC tend to not demonstrate a similar overestimation in these regions (Cohen et al., 2011).
The AERONET Version 3 (V3) Level 2.0 inversion products serve as the primary ground-based standard for validating aerosol optical properties (Sinyuk et al., 2020). While AOD is measured with high accuracy (with an uncertainty of +0.06 to −0.02) (Eck et al., 2001; Giles et al., 2019), the retrieval of absorption properties such as SSA and AAOD is subject to greater uncertainty, particularly under low aerosol loading conditions. Sinyuk et al. (2020) demonstrated that the uncertainty in AERONET SSA retrievals is approximately ±0.03 when AOD440 nm > 0.4. However, as aerosol loading decreases below this threshold, the sensitivity of sky radiance measurements to absorption diminishes, causing SSA uncertainties to increase to ±0.05 or higher when AOD440 nm < 0.2 (Dubovik et al., 2000; Schutgens et al., 2021; Zhang et al., 2025). Consequently, discrepancies between MISR retrievals and AERONET data in clean background regions (low AOD) may largely reflect the noise floor of the ground-based inversions rather than satellite retrieval errors. To align with these physical sensitivity constraints and mitigate the impact of potential noise floor issues in ground-based inversions, this study exclusively utilizes MISR data where the AOD at 443nm is greater than 0.25. This threshold ensures that the absorption signals analyzed are physically robust and that the comparisons remain scientifically meaningful even in regions with varying aerosol concentrations, at the cost of a reduction in overall spatial coverage.
Additionally, the inherent differences between MISR (which provides clear-sky, instantaneous overpasses) and MERRA-2 (which provides all-sky, diurnal averages) introduce temporal and spatial representativeness errors. Therefore, this inter-comparison is primarily intended to provide more possibilities for understanding the global spatiotemporal variability of BC. By integrating results from different observational and modeling platforms, this approach offers a more comprehensive perspective on the reliability and applicability of the proposed framework across diverse atmospheric environments.
2.4 Data Selection Strategy and Regional Partitioning
To provide comprehensive coverage over a long timeframe and minimize uncertainties associated with the integration of multiple data sources, this study utilizes multispectral remote sensing retrievals from MISR. Compared to other remote sensing sources, MISR offers an extensive observational record since 2000 and provides data across four spectral bands, which serves as an important foundation for accurately calculating BC-related parameters. The accuracy of MISR products has been established through extensive global validation against AERONET, providing a physical foundation for our retrieval. In terms of specific error budgets, AERONET reports uncertainties of 0.03 for SSA and +0.06 to −0.02 for AOD. In comparison, the MISR AOD uncertainty is established at +0.05 or 0.2 × AERONET AOD. Given these constraints, the MISR SSA uncertainty is estimated to be at least as large as the AERONET SSA uncertainty, translating to approximately 20 %–40 % under typical conditions where this process is successful, the SSA ranges from 0.80 to 0.95. To further ensure the robustness of our inputs, we performed a consistency check by comparing MISR-derived AAOD with AERONET observations (Fig. A1 in Appendix A and Table B4 in Appendix B). The resulting differences have Root Mean Square Error (RMSE) and Mean Absolute Error (MAE) statistics both falling within approximately ∼ 64 % (assuming an SSA of 0.92), which is the combined uncertainty range (propagated using 20 % AOD and 20 %–40 % SSA uncertainties). This alignment with ground-based benchmarks confirms that the input parameters provide a solid basis for reliable BC estimation. The multi-angle observation capability of MISR is highly effective for identifying aerosol optical properties, particularly in retrieving key parameters such as AAOD, where the multi-angle constraints significantly enhance estimation accuracy.
The criterion that AOD443 nm > 0.25 reflects findings from previous studies showing that when AOD is relatively high, AAOD measurements become more reliable, thereby reducing observational uncertainty (Mallet et al., 2017; Schutgens et al., 2021; Zhang et al., 2025). Consequently, only the subset of MISR pixels from October 2004 to December 2020 meeting this criterion were selected. This filtering method enables the acquisition of more reliable BC data for analyzing its global distribution and spatiotemporal variation trends. For consistency in annual statistics and interannual trend analysis, the year-by-year evaluation is restricted to complete calendar years (2005–2020). This approach ensures comparability across years and avoids biases associated with partial-year data in 2004, although all individual days of data are retained in the complete dataset.
To improve analytical efficiency and account for regional aerosol characteristics, this study adopted a global regional partitioning method based on Cohen and Wang (2014). As shown in Fig. 1, the globe is divided into nine major regions (North America, South America, Europe, Africa, East Asia, Southeast Asia, South Asia, North Asia, Oceania), addressing both the global-scale requirements and the need to adapt to the specific climate and geographic features. Additionally, adjustments were made to the regional boundaries for parts of Australia, Southeast Asia, and East Asia to better reflect the unique climate conditions and aerosol emission characteristics of these areas, ensuring more precise estimation of BC parameters in these critical regions.
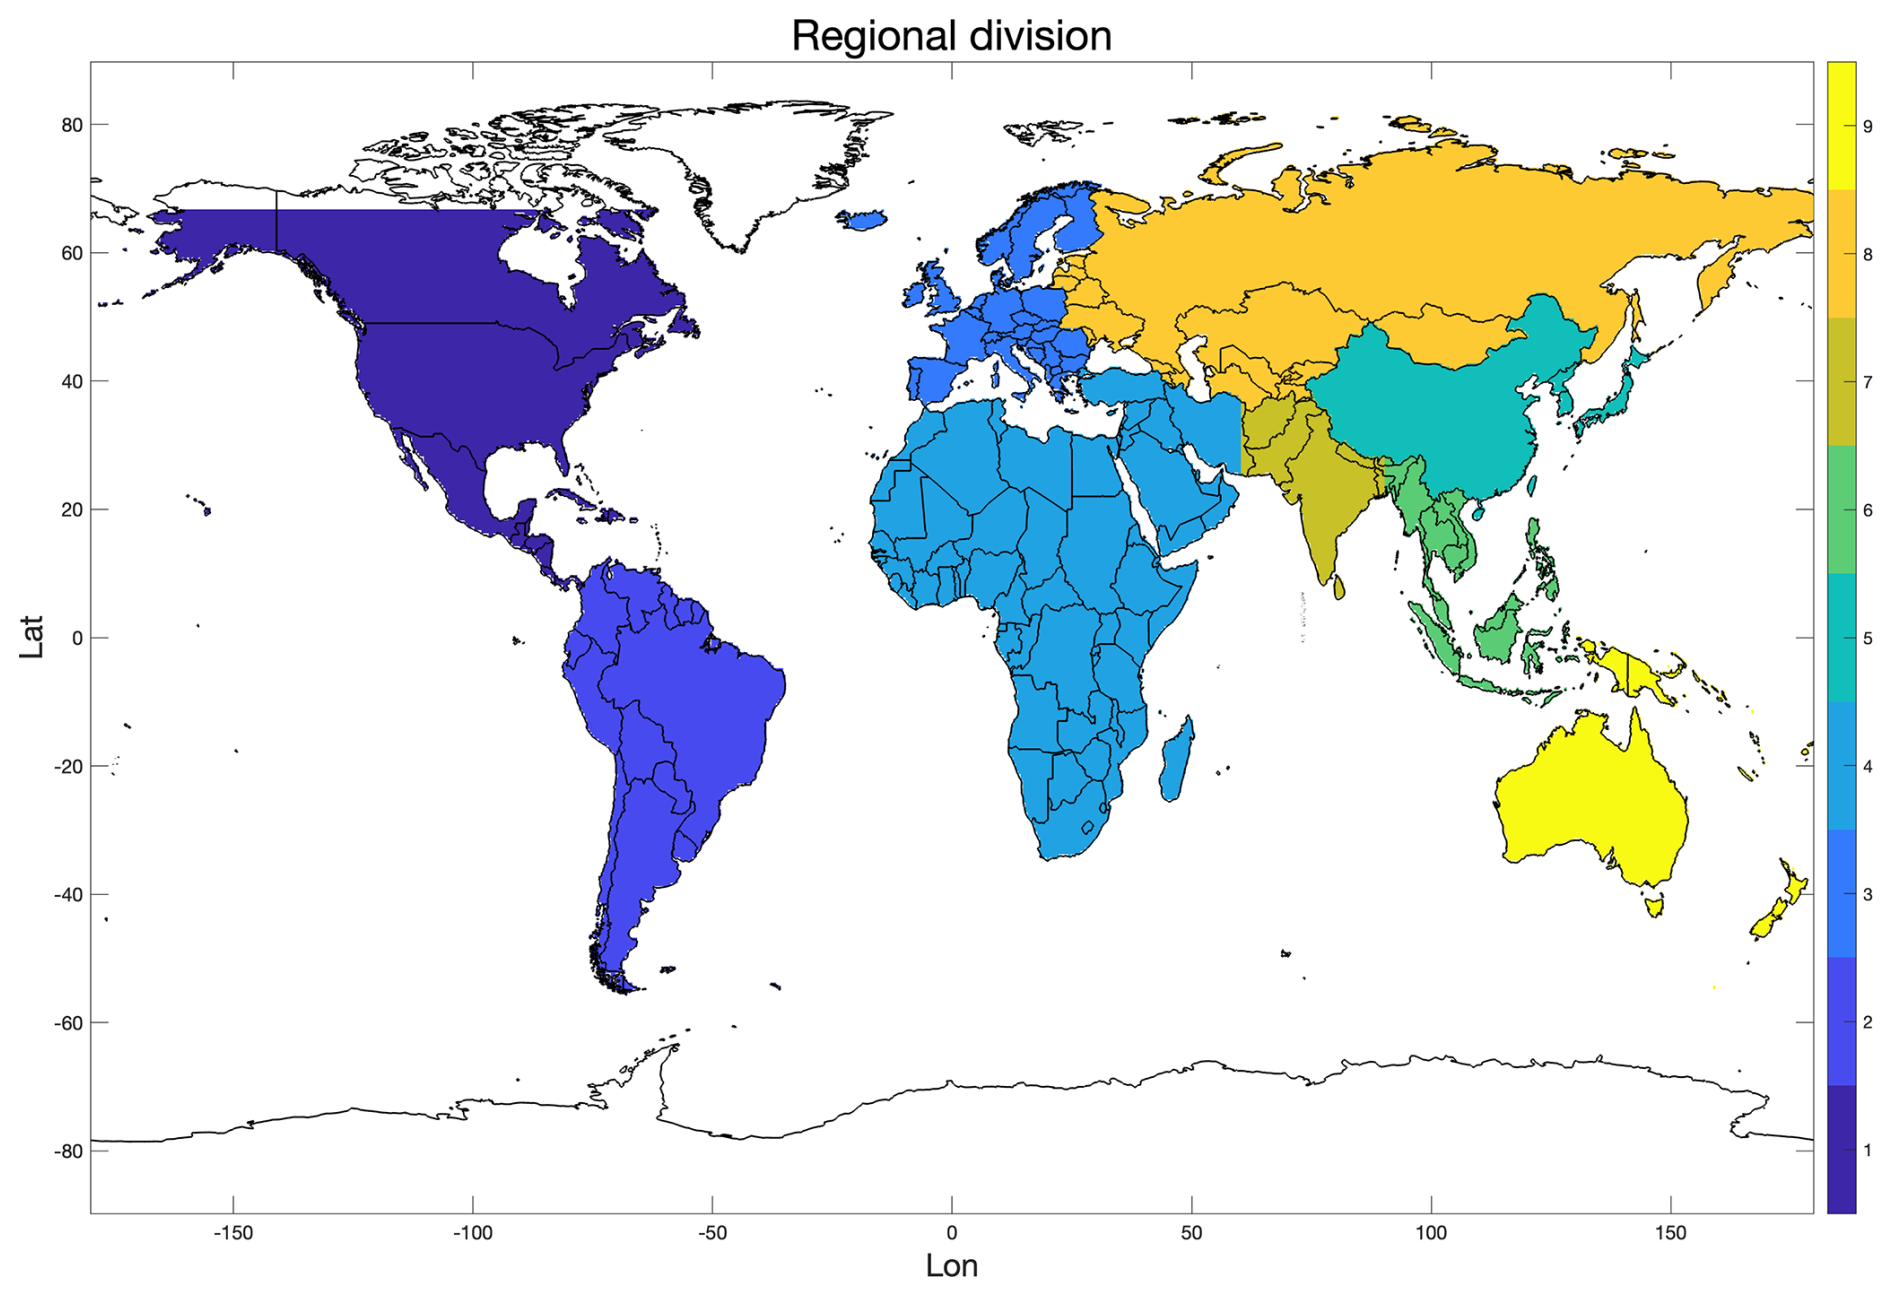
Figure 1The nine geographic spatial defined regions used in this study.
This systematic regional division strategy facilitates the optimal use of MISR's long-term observational record to analyze spatiotemporal distribution patterns of BC across diverse regimes, providing a solid scientific basis for further climate and environmental analysis.
2.5 Black Carbon Column Concentration Retrieval Framework
To accurately simulate the influence of aerosol microphysical structures on optical properties, this study implements an integrated retrieval framework based on a “core-shell” Mie model. This configuration accounts for the realistic atmospheric state where the absorptive BC core is frequently encapsulated by non-absorbing or scattering materials through aging and mixing processes. Within this framework, absorptive aerosols are assumed to consist of a BC core and a scattering coating (sulfate shell). The complex refractive index (CRI) of the BC core is prescribed as 2.0 ± 1.0 i (Schuster et al., 2005), and the CRI of the shell is assigned as 1.52 ± 5 × 10⁻⁴ i (Aouizerats et al., 2010). The simulation setup selects a “core” particle size range of 50–500 nm (in 10 nm increments) and a “shell” size range of 50–1000 nm (also in 10 nm increments). Utilizing this size range combination, a comprehensive database of simulated optical properties (including Qsca, Qext, Qabs) was generated across MISR's four spectral bands.
The SSA was used as the primary observational constraint to limit the range of microphysical solutions at each spatial grid point on a daily basis. SSA values derived from MISR's four bands were incorporated as wavelength-dependent boundary conditions in the simulations, enabling validation of the simulated optical properties and providing objective criteria for selecting the final, physically consistent solutions. Observed values from each band defined a possible solution space by considering the ±0.03 uncertainty of SSA observations (Torres et al., 2020; Tiwari et al., 2025), to account for inherent observational uncertainties and instrument noise. This uncertainty level represents a conservative physical limit aligned with the AERONET ground-based benchmark of ∼ 0.03, although we acknowledge that in fact it may be slightly larger. Under this framework, only grid points that met the range requirements across all four bands in tandem are retained. This multi-band constraint analysis method enhances the reliability of the simulation results and avoids biases that may arise from single-band analyses. Through this filtering process, we obtained a set of particle radii that meet the observation criteria, representing the plausible particle size ranges under specific conditions and laying a foundation for further analysis of aerosol scattering and absorption properties. This filtering process identifies the set of plausible particle radii (R) that are physically consistent with the observed atmospheric absorption signatures.
After the SSA-based screening, the remaining solutions define a physically plausible set of R for each grid cell and day. For these retained solutions, Mie calculations simultaneously provide Qabs across various particle size combinations. Using these calculated Qabs and applying Eq. (1), we further derive the overall absorption coefficient (σabs) for individual particles. This quantity describes the capacity of an individual particle to absorb incident radiation at a given wavelength and serves as the direct link between microphysical properties and column-integrated absorption.
With σabs determined, the MISR AAOD observations are then used to estimate the column number concentration (Ncol) by inverting the relationship between column absorption and single-particle absorption, as expressed in Eq. (2). Ncol represents the total number of particles within the atmospheric column and is a key metric for characterizing aerosol loading and its spatiotemporal variability.
Furthermore, the particle column mass concentration (Mcol) is derived from Ncol by applying Eqs. (3) and (4). Here, ρ denotes the particle density (prescribed as 1.8 g cm−3 (Bond and Bergstrom, 2006), and M represents the mass of a single BC particle. This procedure establishes the quantitative basis for transforming AAOD-constrained optical retrievals into physically interpretable BC mass loading.
Collectively, this workflow integrates the SSA-constrained microphysical solution space with particle absorption properties (Qabs and σabs), ultimately yielding column number and mass concentrations (Ncol and Mcol). By synthesizing particle size, absorption efficiency, and absorption cross-section into the resulting number/mass loadings, the framework provides a systematic and physically consistent pathway for retrieving the spatiotemporal distribution of BC and related absorptive aerosols, thereby supporting subsequent analyses of aerosol radiative effects and climate impacts.
2.6 Sensitivity Analysis and Inter-comparison Scheme
To evaluate the robustness of the retrieval framework across the prescribed Mie model parameter space, a statistical sensitivity analysis is performed for the 2005–2020 period. The procedure quantifies the variability of the retrieved BC column mass concentration (MASS), column number concentration (NUM), core particle size (BCsize), and shell size (Shellsize) by calculating the mean and specific percentiles (25th, 50th, and 75th) for each grid point. This statistical framework enables a systematic assessment of the retrieval stability across varying concentration regimes and particle size combinations, using probability density functions (PDFs) and time-series analysis to characterize the response of the retrieval to input parameter variations.
To facilitate a comprehensive evaluation of BC column mass concentrations derived from different data sources, this study implemented a rigorous matching and screening procedure between the MISR-derived products and MERRA-2 reanalysis data. Specifically, daily grid-level MISR retrievals first underwent a quality-filtering process to serve as the reference standard, and the corresponding MERRA-2 data were then spatially and temporally co-located within the same 0.5° × 0.5° geographic domain. This step ensures strict consistency in both spatial resolution and temporal scale across the two datasets. Based on this integrated matching framework, comparative analyses were stratified under different concentration regimes (e.g., low versus high levels) and particle size assumptions, ranging from small to large sizes. Such a daily grid-level matching strategy effectively minimizes systematic biases arising from differences in spatial and temporal aggregation methods, thereby ensuring that the comparisons between MISR and MERRA-2 are statistically representative and physically meaningful. Moreover, this approach provides a robust basis for systematically assessing the applicability and limitations of the two datasets across diverse regions, emission conditions, and climatic contexts.
2.7 Filtering Strategy for Representative Regional Analysis
Following the retrieval of BC column number and mass concentration products, a rigorous mass control and multi-dimensional filtering procedure was implemented to ensure the scientific robustness and reliability of subsequent analyses. This screening scheme is designed to identify representative spatial domains by introducing three primary physical constraints: the number of valid observational days, the BC column number concentration, and the AAOD ratio.
First, to maintain temporal stability, a minimum threshold was imposed on the number of valid observational days. This constraint ensures that regional-scale statistics are not biased by occasional or transient events, thereby enhancing the representativeness of the dataset (Chen and Prinn, 2006). Second, BC column number concentration serves as a direct indicator of atmospheric loading; however, its distribution may contain outliers from extreme or abnormal events. To prevent these lower-confidence results from distorting spatial averages or obscuring underlying atmospheric signals, appropriate thresholding was applied to exclude clearly unrealistic pollution cases.
Second, the BC column number concentration is utilized as a key criterion to delineate and focus on typical pollution hotspots. Rather than merely removing outliers, appropriate thresholding – such as percentile-based criteria – is applied to extract regions with significant and sustained BC loadings. This process ensures that the subsequent analysis focuses on geographically continuous areas that represent major atmospheric pollution regimes, thereby excluding low-concentration zones where the BC signal is too weak to provide regional explanatory power. By selecting these high-loading typical regions, the framework ensures that the derived spatiotemporal characteristics are both physically meaningful and representative of large-scale emission sources.
Finally, the AAOD ratio was incorporated as a spectral optical constraint to improve the specificity of the BC products (Bergstrom et al., 2007; Russell et al., 2010; Helin et al., 2021; Bigi et al., 2023). This ratio characterizes aerosol absorption across different wavebands and is particularly effective at identifying the presence of large, strongly absorbing non-BC aerosols, such as mineral dust. By filtering out grid points with abnormally high ratios, potential dust contamination was significantly reduced, ensuring that the retained data predominantly reflects the contribution of carbonaceous aerosols. Through the integration of these constraints, the reliability of the dataset was enhanced across temporal, concentration, and optical dimensions.
It is important to emphasize that regional differences in climatic backgrounds and emission structures necessitate the use of adaptive filtering strategies rather than a uniform global threshold. A uniform threshold across all regions may lead to excessive sample loss in some areas or insufficient removal of anomalous cases in others, potentially biasing the results. To address this, a region-specific approach was adopted, selecting appropriate percentile-based thresholds or quantile criteria according to local data distributions. This method not only maximizes data representativeness but also removes samples with limited explanatory power. By incorporating such regionally adaptive criteria, the dataset better reflects the true atmospheric processes and BC pollution characteristics across different environments. The complete methodological framework, including the retrieval process and the hierarchical logic of this filtering strategy, is illustrated in Fig. 2. After these mass control and filtering steps, the final sample set is both stable and credible, providing a solid basis for in-depth investigations into BC concentration levels, spatiotemporal.
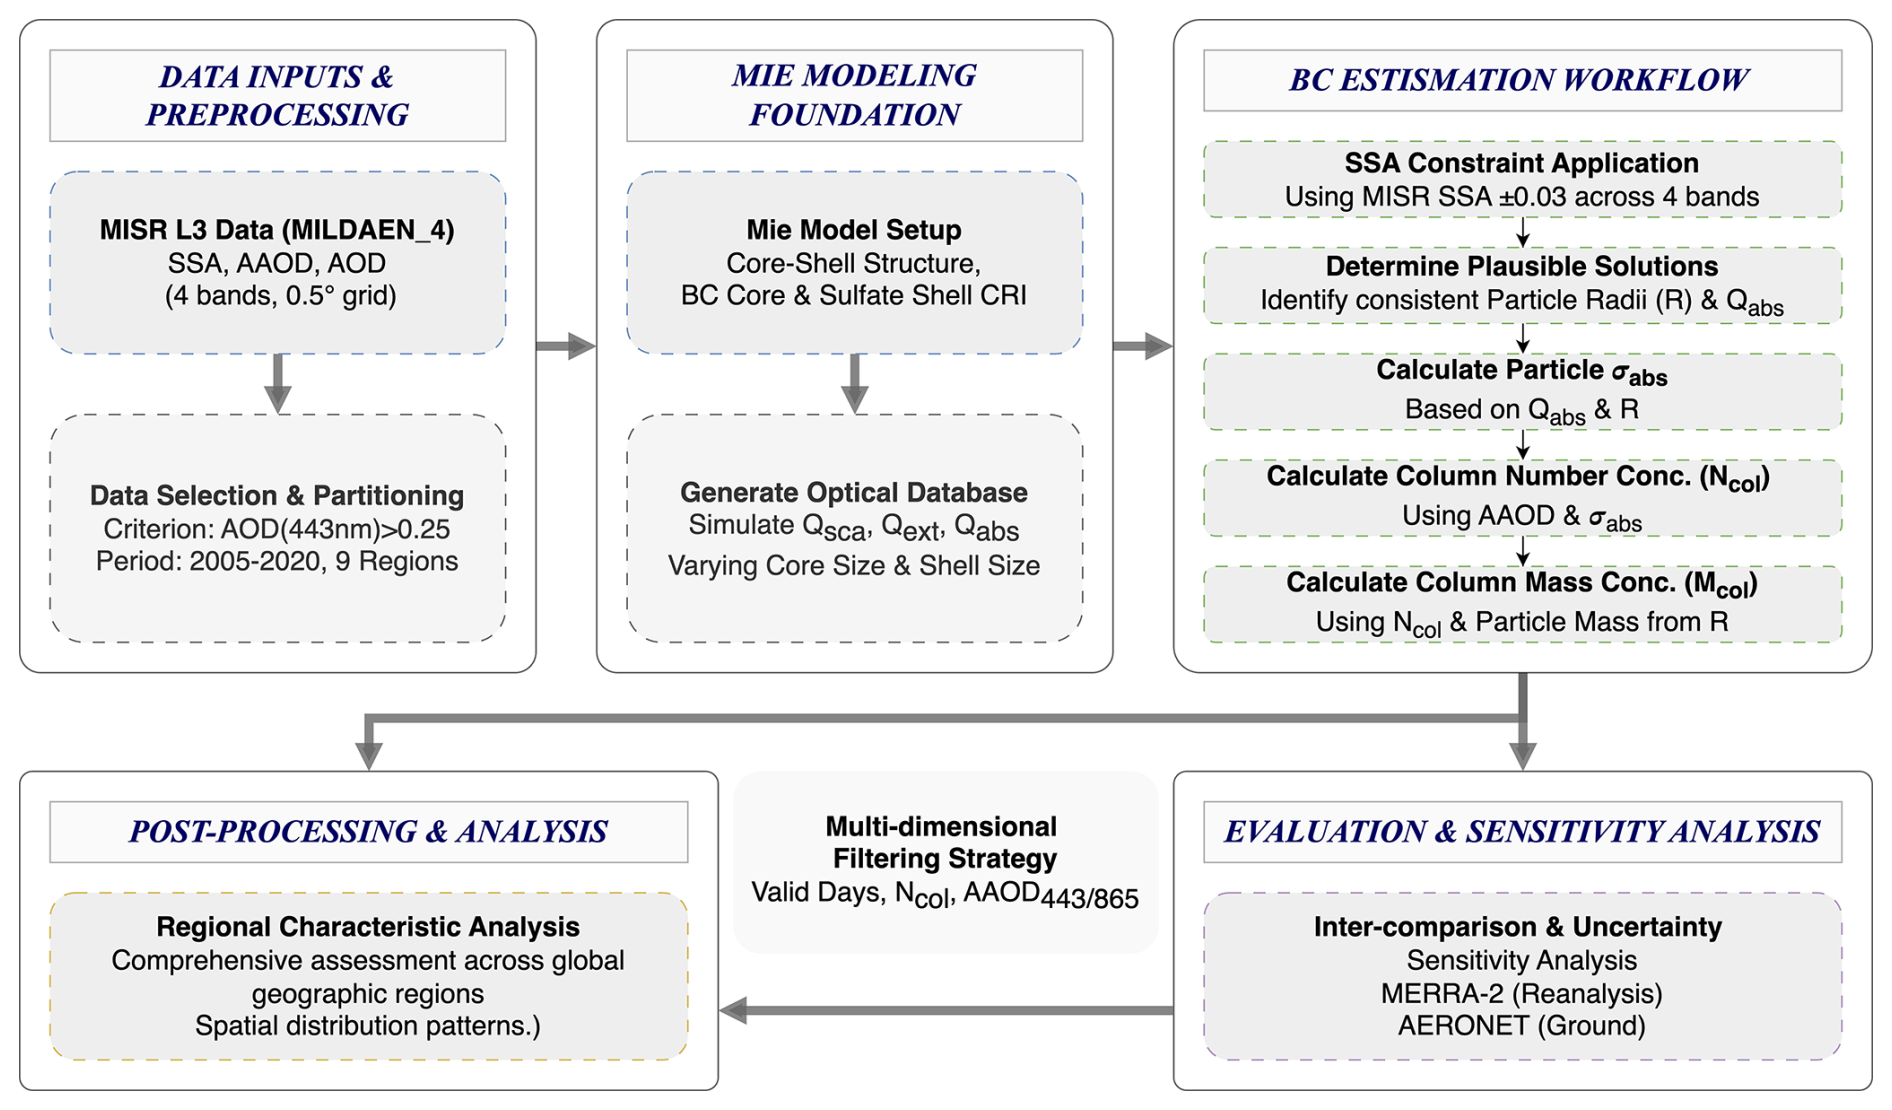
Figure 2Flowchart of the estimation of the global black carbon (BC) column concentration product based on MISR observations.
3.1 Simulation of Aerosol Optical Properties Using SSA Constraints and Particle Size Combinations
Figure 3a and b depict the global distribution of BC core diameters and their standard deviations during 2004–2020. Larger BC particle sizes (indicated in red, ranging from 155 to 165 nm) are observed in central and southern Africa, parts of South America, forested and densely populated regions of North America, core urban areas of Europe, and much of Asia. In central and southern Africa, the standard deviation of BC sizes remains relatively balanced (orange, between 30 and 35 nm). The relatively large particle size in these regions is likely linked to widespread biomass burning (e.g., agricultural residue burning and forest fires), where BC generation tends to be stable, less affected by human disturbances, and associated with relatively uniform pollution sources. By contrast, in Europe and large parts of Asia, the standard deviation of BC size is considerably higher (orange to red, 40–45 nm). In Europe, this is primarily attributed to industrial activities and traffic emissions related to high population density, whereas in Asia, in addition to industrial and demographic factors, biomass burning from agriculture, domestic activities, and wildfires also plays an important role. The pronounced variability in particle size in these regions reflects the destabilizing effects of anthropogenic production processes and the uncertainty of wildfire occurrence on BC formation. In North America, BC size variation is more irregular, highlighting the complexity of biomass burning emissions caused by sporadic forest fires, while urban areas exhibit patterns comparable to those in Europe. In South America, regions with larger BC particle sizes also display greater variability: urban centers correspond to anthropogenic sources, whereas in and around the Amazon rainforest, larger BC particles are sporadically observed, likely resulting from frequent deforestation and burning, with biomass burning showing a non-cyclical nature.
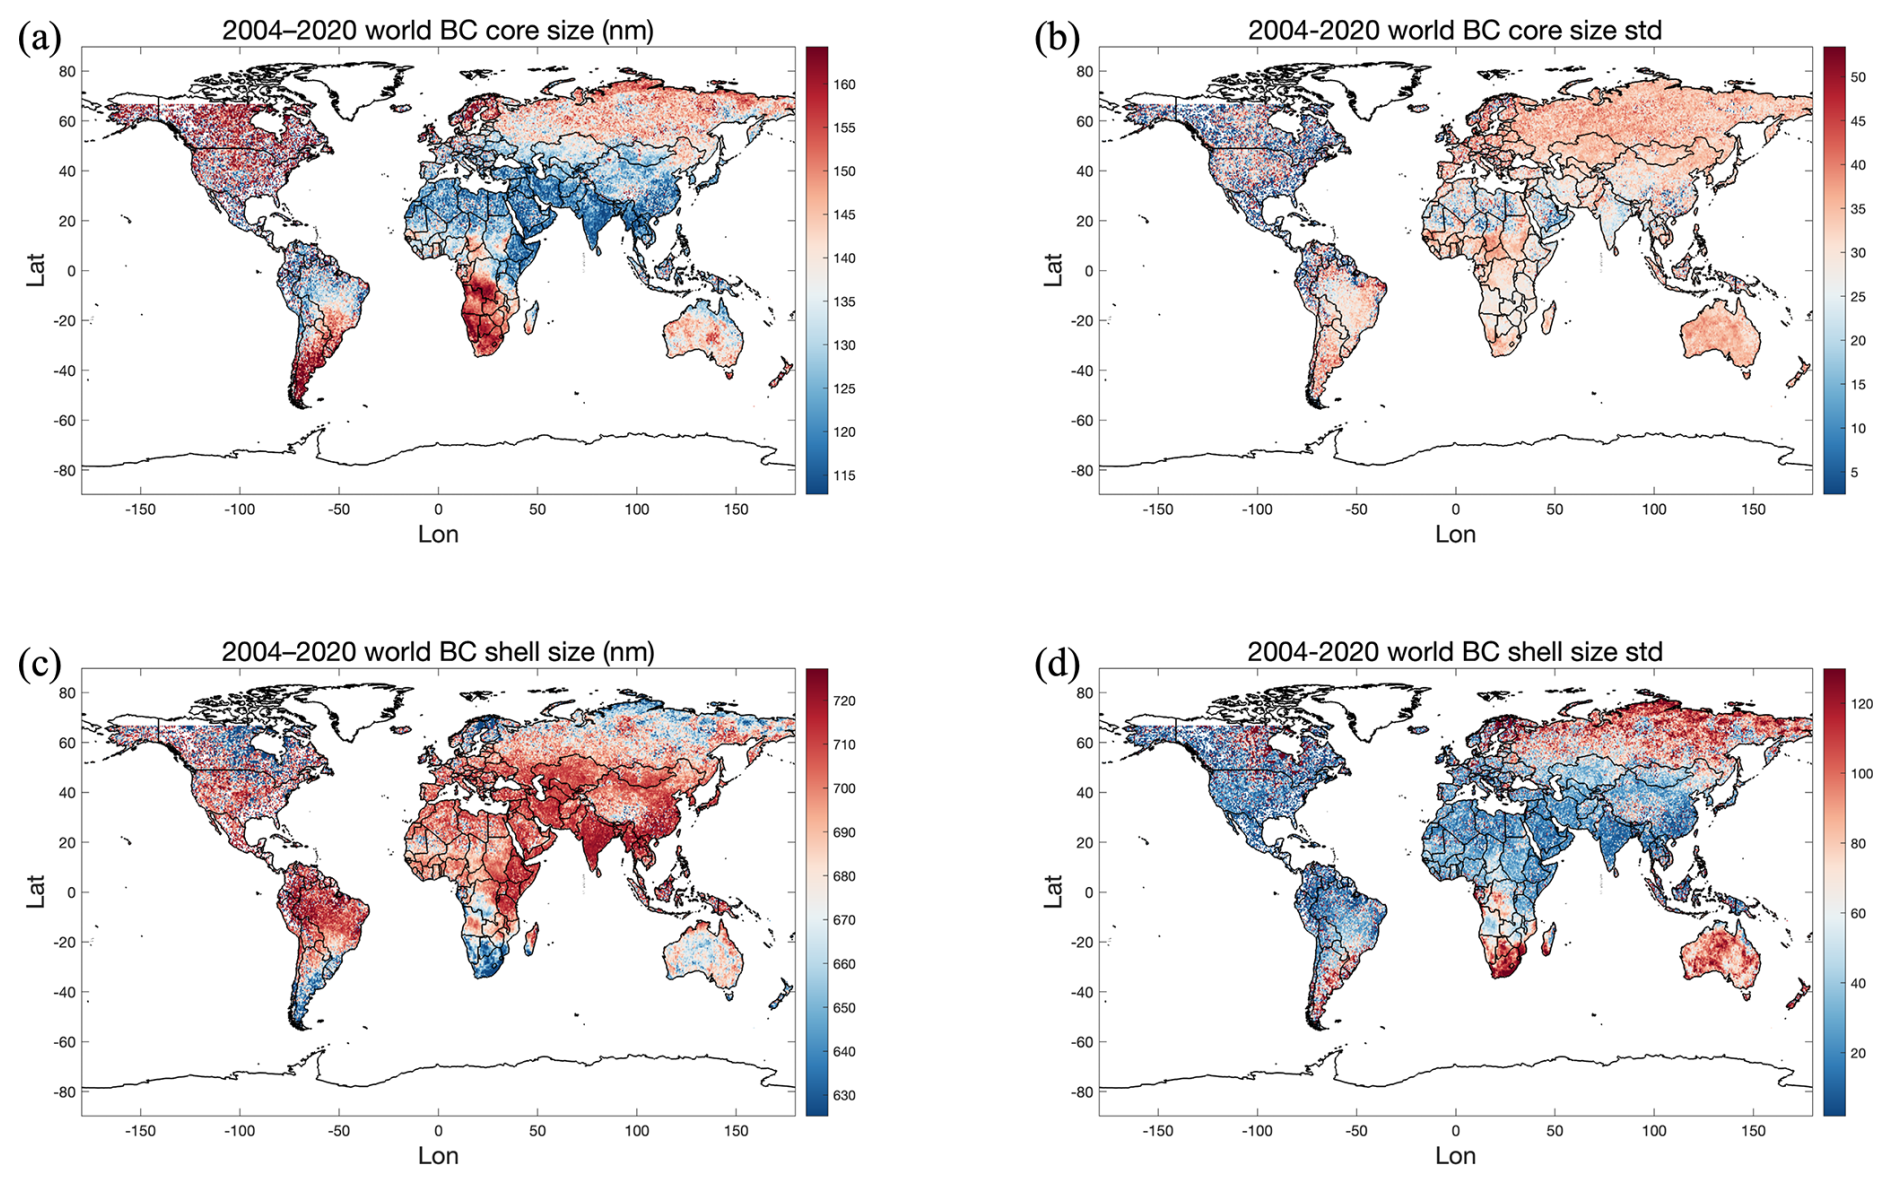
Figure 3Schematic diagram of global terrestrial products with BC core and shell particle sizes from 2004 to 2020. (a) Mean size of BC core. (b) BC core size standard deviation. (c) Mean size of BC shell. (d) Standard deviation of BC shell size.
The shell size of particles reflects the extent to which BC cores accumulate secondary substances in the atmosphere. As shown in Fig. 3c and d, relatively large shell sizes (red, exceeding 710 nm) are concentrated in southeastern Africa, northern South America, and across South, Southeast, and East Asia. The increase in shell size in these regions is likely associated with the mixing of BC with other aerosol species, particularly during biomass burning and agricultural waste processing. For instance, in northern Amazonia, shell sizes are substantial but exhibit little variability, suggesting persistent biomass burning as a long-term source with relatively low emission fluctuations. Similar patterns are also found in the central African grassland regions. In parts of Asia, such as China, India, and Southeast Asia, shell sizes generally exceed 690 nm. In Southeast Asia, although the distribution is patchy, the variability remains relatively modest. This can be attributed to frequent, stable biomass burning and intensive emissions from mining and industrial activities, which facilitate the adsorption of additional pollutants, leading to larger shells. The scattered higher variability in Southeast Asia may be linked to seasonal shifts in emissions, particularly differences in biomass burning activities between wet and dry seasons. By contrast, in northern Europe and urban areas of North America, shell sizes are relatively smaller (blue, below ∼ 650 nm) and exhibit low standard deviations (blue to green), indicating greater stability. This pattern likely reflects the effects of stricter environmental regulations and emission controls, which suppress shell growth, reduce the particles' capacity to adsorb additional material, and minimize fluctuations in pollutant emissions.
3.2 Global Analysis of Black Carbon Column Mass and Number Concentrations
Figure 4a and b illustrate the global distribution of BC column mass concentration and its standard deviation from 2004 to 2020. Pronounced BC mass concentrations, exceeding 8000 kg per grid per day, are observed over central and southern Africa, parts of North America, and central to southern South America. These elevated concentrations are primarily attributed to biomass burning. In contrast, regions such as the Amazon rainforest exhibit moderate BC concentrations, typically ranging between 6000 and 8000 kg per grid per day, which may be linked to agricultural activities and deforestation. Several densely populated areas of Asia, including China, Japan, and Southeast Asia, also show relatively high BC mass concentrations, reflecting the combined influence of industrial activity, transportation emissions, and agricultural practices. Conversely, most regions in Europe and Australia report comparatively low BC concentrations, generally below 6000 kg per grid per day, a pattern likely shaped by stringent air pollution controls that effectively limit BC emissions. Central and western Africa also stand out with both high emission intensity and substantial standard deviations (around 8000 kg per grid per day), indicating strong interannual variability associated with seasonal differences in biomass burning. Elevated variability is likewise observed in parts of East and Southeast Asia, as well as northern Australia, suggesting the combined influence of multiple pollution sources and fluctuating emission dynamics. By comparison, much of South America exhibits moderate standard deviations, pointing to relatively greater temporal variability, while regions such as southern Australia and much of Europe display lower variability, consistent with more stable emission conditions.
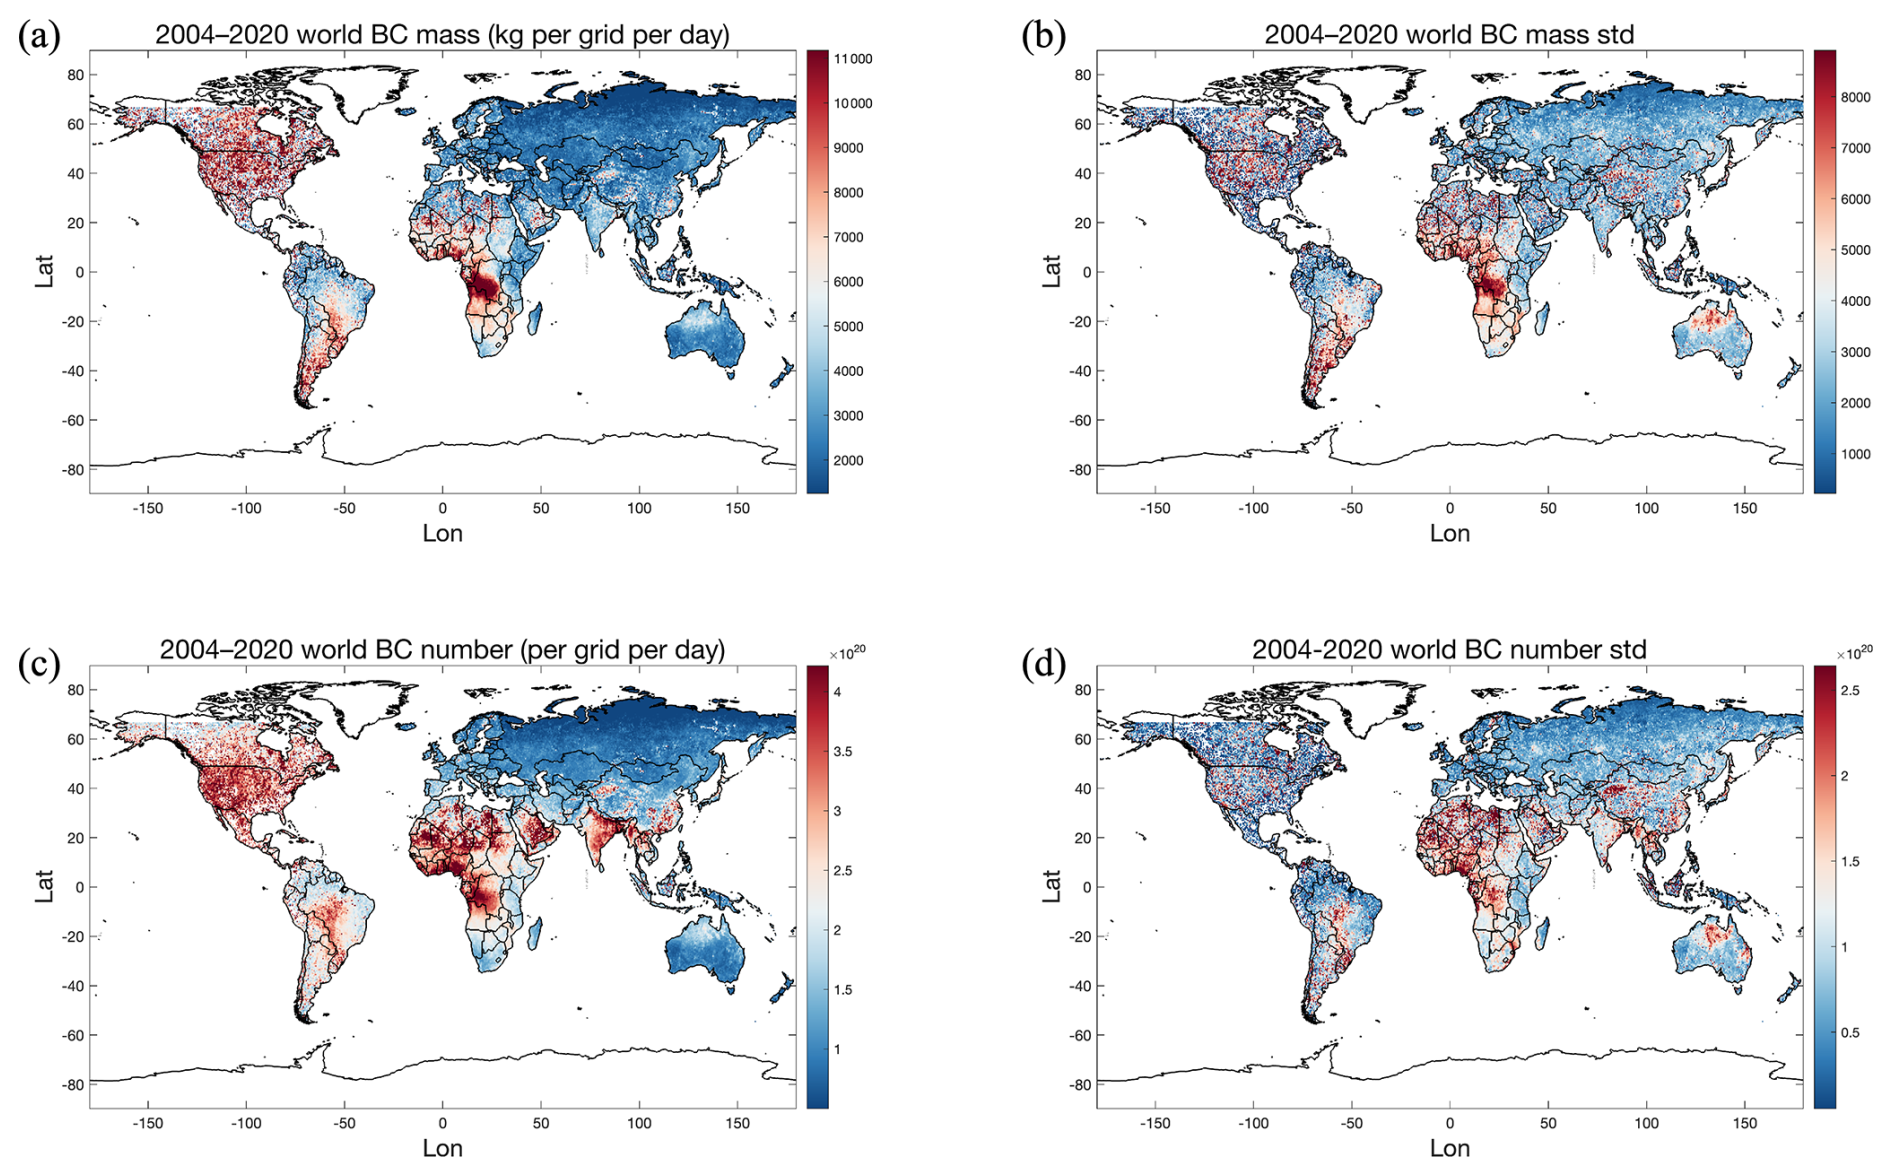
Figure 4Schematic diagram of global terrestrial products with BC column mass and number concentration from 2004 to 2020. (a) Mean mass concentration of BC column. (b) Standard deviation of BC column mass concentration. (c) Mean number concentration of BC columns. (d) Standard deviation of BC column number concentration.
Figure 4c and d present the global distribution of BC column number concentration and its standard deviation during the same period. Overall, the spatial distribution of number concentration broadly mirrors that of mass concentration, with notable differences in northwestern Africa, the Arabian Peninsula, and South Asia, where number concentrations appear relatively higher. This discrepancy likely reflects spatial heterogeneity in emission sources as well as differences in BC particle size distributions. In the northwestern African region, high population density and industrial activity are major contributors to the emission of smaller BC particles. In South America, areas characterized by high mass concentrations also exhibit similarly extensive coverage in number concentration, underscoring the role of biomass burning and agricultural activities in generating and dispersing large quantities of BC particles. Regarding variability, central and northwestern Africa exhibit pronounced fluctuations, indicating marked temporal inconsistency in emissions. In South America, variability in number concentration is largely confined to limited areas such as Brazil, São Paulo, and scattered southern regions, while the overall continent demonstrates relatively stable BC emissions.
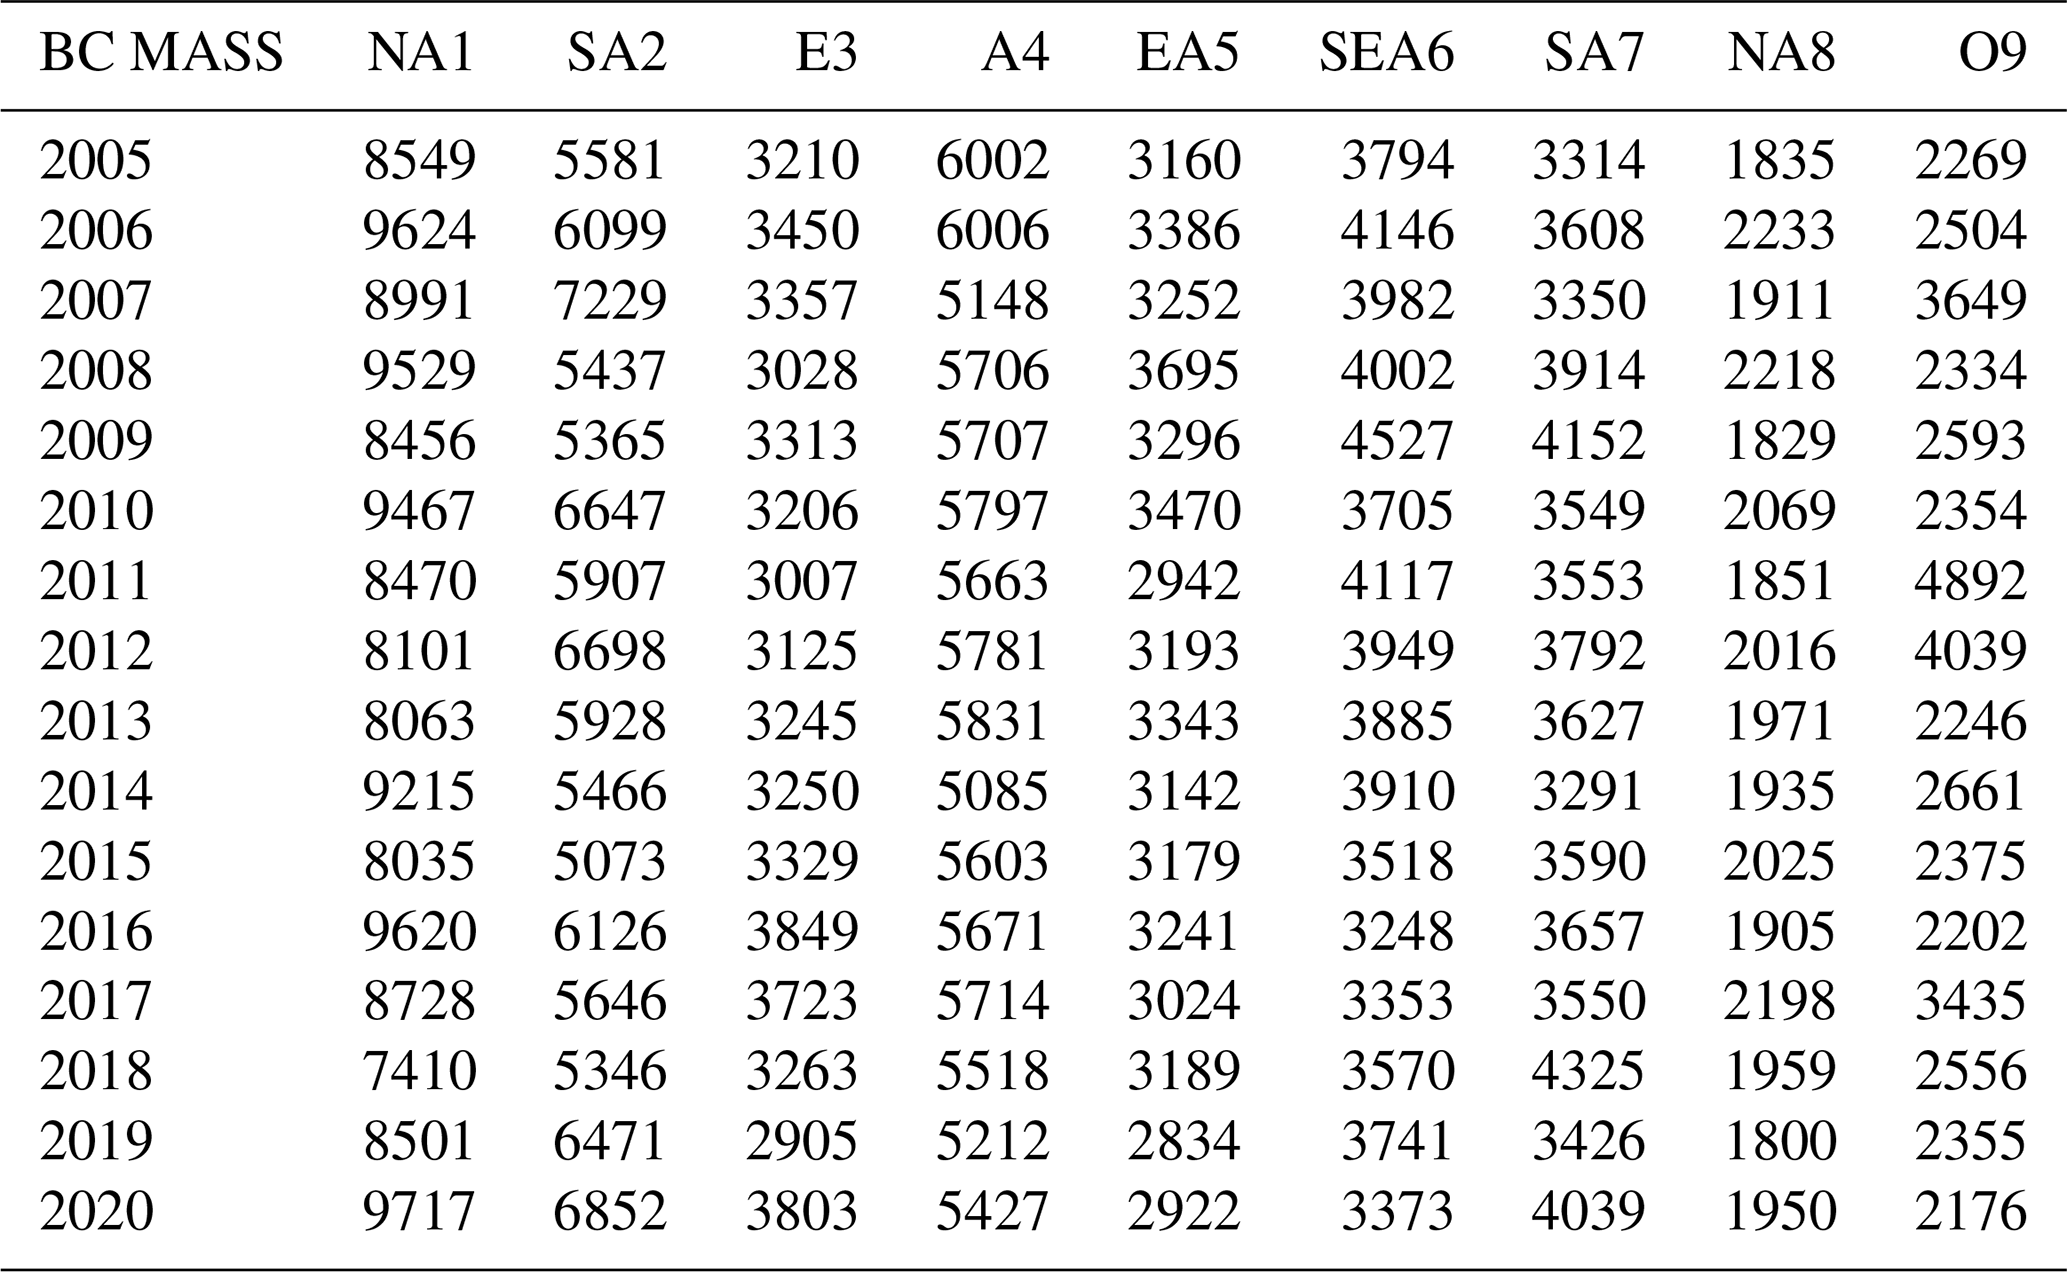
As shown in Table 1, the annual mean BC column mass concentrations are reported for nine regions, while the corresponding column number concentrations, core sizes, and shell sizes are provided in Tables B1, B2, B3. For North America, BC column mass concentrations increased during 2005–2007, declined slightly between 2008 and 2012, and thereafter exhibited a fluctuating upward trend, reaching a maximum in 2020. Column number concentrations remained relatively high with minor fluctuations, followed by a pronounced increase in 2020. Core size showed little variation (144–149 nm) and reached a minimum in 2018, while shell size exhibited pronounced fluctuations throughout the study period, hitting its lowest point in 2017. By contrast, South America experienced a rise in BC mass concentrations during 2005–2007, a decline in 2008–2009, and another increase in 2010, followed by sustained high but fluctuating levels. Number concentrations were elevated in 2005–2007, decreased between 2008 and 2012, and exhibited alternating downward and upward tendencies after 2013. Core size increased gradually from ∼ 134 nm in 2005 to above 144 nm by 2012, followed by a decline and a subsequent recovery. Shell size stayed elevated during 2005–2015, with slight growth, but exhibited a fluctuating downward trend after 2016. In Europe, BC mass concentrations remained relatively stable, fluctuating slightly between 3000 and 4000 kg per grid per day from 2005 to 2020. Number concentrations also stayed within a stable range with only minor variability. Core size peaked in 2016 (above 144 nm), while shell size fluctuated between ∼ 680 and 690 nm without a monotonic trend. A similar pattern is observed in Africa, where both BC mass and number concentrations decreased slightly during 2005–2007, rose again in 2008, and subsequently remained at relatively high levels with modest variability. Core size stayed within 133–137 nm, showing only minor declines, while shell size remained around 687–692 nm without a discernible long-term trend. In East Asia, BC mass concentrations rose from 2005 to 2008 and then declined overall, reaching their lowest level in 2019. Number concentrations were relatively stable during 2005–2012 but decreased thereafter. Core size fluctuated between 127 and 133 nm, with a slight downward tendency. Shell size remained consistently between 695 and 700 nm throughout the period. For Southeast Asia, BC mass concentrations increased during 2005–2009, then declined and stabilized at lower levels. Number concentrations followed a similar trajectory, peaking during 2005–2009 before declining after 2010. Core size remained within 124–128 nm, showing little variation. Shell size showed gradual downward trends during 2005–2014 and 2015–2020. In South Asia, BC mass concentrations increased during 2005–2009, fluctuated between 3500 and 4000 kg per grid per day thereafter, and showed a distinct peak in 2018. Number concentrations followed a similar pattern, remaining high after 2009 and peaking in 2018. Core size declined overall, while shell size fluctuated between 707 and 712 nm without a monotonic trend. For North Asia, BC mass and number concentrations remained low and stable, with no significant long-term trends. Core size peaked in 2008 and then declined, stabilizing between 135 and 141 nm. Shell size showed limited variability, with a slight decreasing tendency and a minimum in 2008. Finally, Oceania exhibited increasing BC mass concentrations during 2005–2007, a decline from 2008 to 2012, and subsequent fluctuations within 2000–3000 kg per grid per day, with notable peaks in 2011 and 2017. Number concentrations showed a similar temporal pattern. Core size was more variable, and shell size displayed even greater fluctuations, with marked decreases in 2011 and 2017.
Table 1Annual average of BC atmospheric column mass concentration in 9 regions from 2005 to 2020. Region codes are defined as follows: NA1 = North America, SA2 = South America, E3 = Europe, A4 = Africa, EA5 = East Asia, SEA6 = Southeast Asia, SA7 = South Asia, NA8 = North Asia, O9 = Oceania.
3.3 Sensitivity analysis under different mixed states
Figure 5a presents time series of BC properties derived from different percentiles. For both column mass and number concentrations, the 50th percentile and the mean show nearly identical temporal patterns, particularly during high-concentration seasons (e.g., spring and summer), where peaks and fluctuations align closely. This consistency indicates that both metrics effectively capture background concentration trends and are well suited for monitoring long-term variability, with limited sensitivity to particle size assumptions. By contrast, the 75th percentile exhibits stronger variability and higher peaks during pollution episodes, reflecting enhanced sensitivity to high-concentration events. This makes the 75th percentile more appropriate for identifying extreme pollution episodes and rapid concentration increases. The 25th percentile remains comparatively stable with lower values and smaller fluctuations, providing reliable information on background low-concentration conditions.
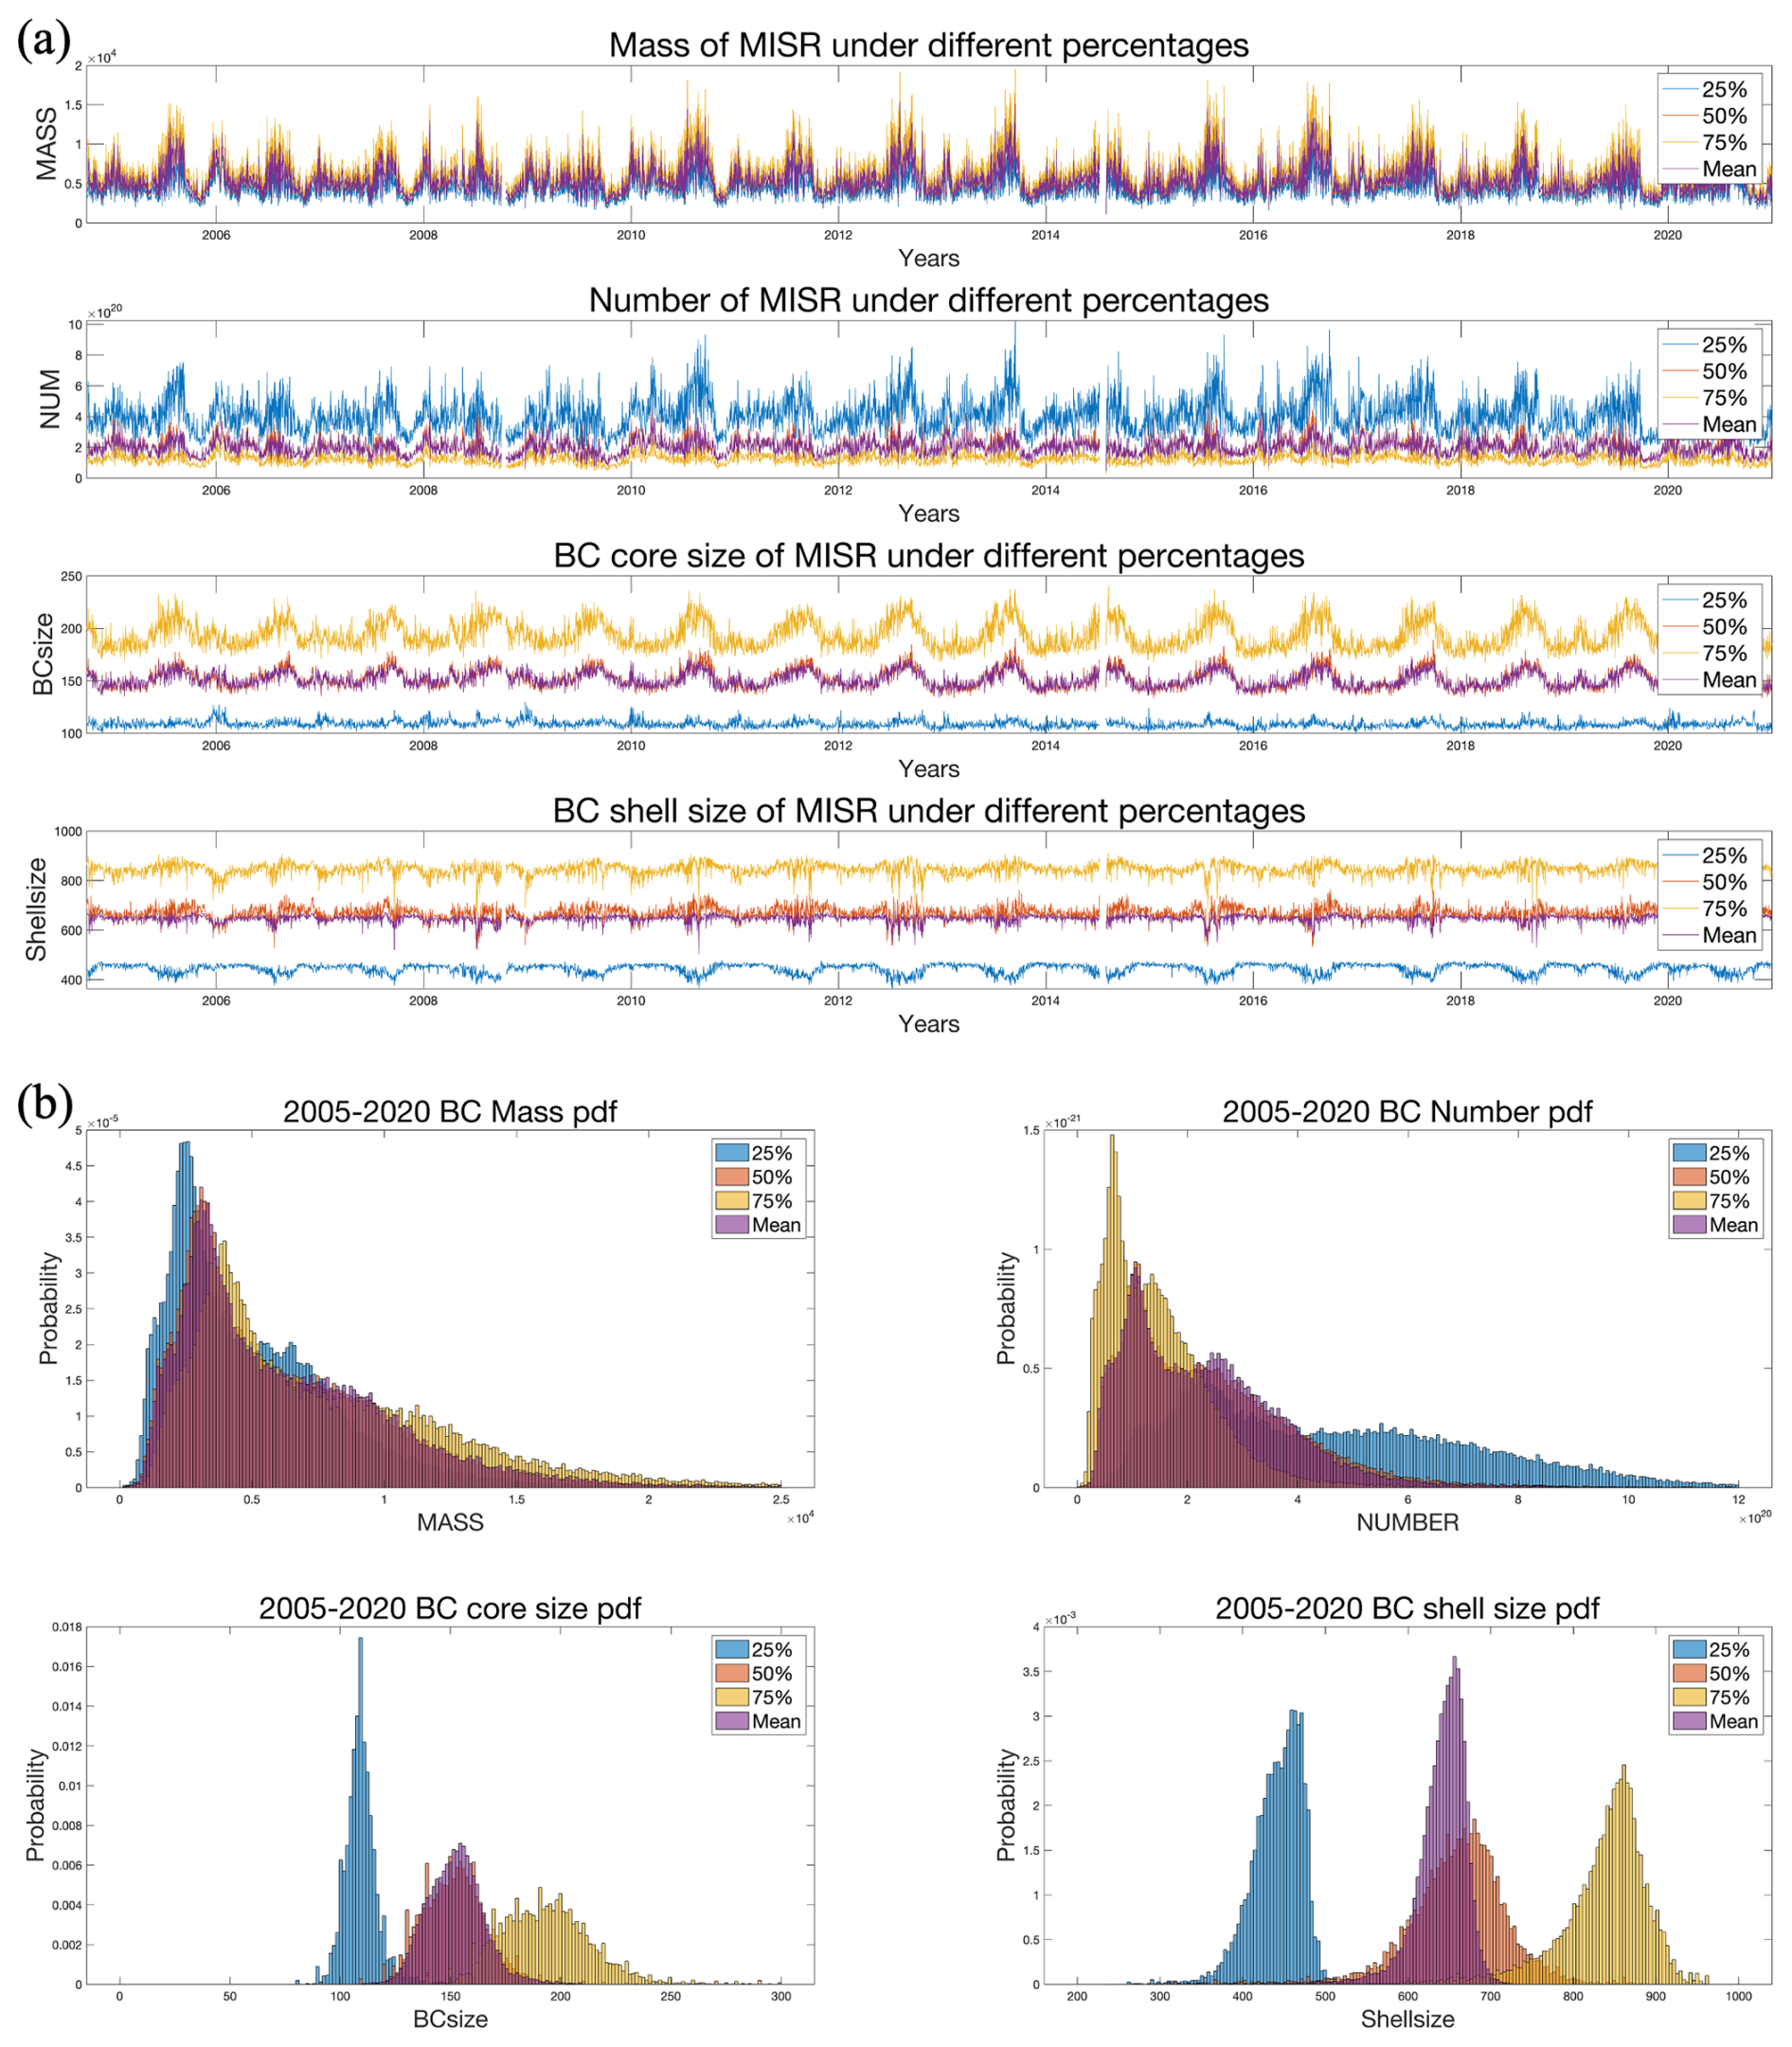
Figure 5Sensitivity analysis of various characteristics of BC under different percentages of core-shell sizes. (a) Time series analysis, from top to bottom, including BC column mass concentration, column number concentration, core size, and shell size. (b) PDF analysis of BC mass concentration, column number concentration, core size, and shell size.
For BC core and shell sizes, differences among percentiles are more pronounced. The 75th percentile consistently yields larger sizes than the 50th and 25th percentiles, particularly during periods of high concentration or large-particle events, with peaks notably higher than the mean. This demonstrates MISR's enhanced sensitivity to large BC particles when higher percentiles are applied, making the 75th percentile suitable for monitoring extreme conditions and large-size regimes. In contrast, the 50th percentile and the mean display smoother temporal variations and similar overall trends, representative of typical mid-size particle distributions. The mean is slightly lower than the 50th percentile, suggesting that it integrates a broader range of particle sizes, including larger ones, and is thus suitable for characterizing overall distributions. The 25th percentile remains lowest, with minimal variability, emphasizing its relevance for representing small-particle conditions in relatively clean environments.
The PDFs (Fig. 5b) further illustrate these percentile-dependent sensitivities. For column mass and number concentrations, the 50th percentile and the mean show largely overlapping distributions, with similar frequency patterns, underscoring their robustness in representing general conditions. The 75th percentile shifts toward higher concentration ranges, with elevated frequencies, highlighting MISR's responsiveness to extreme pollution. The 25th percentile is concentrated in the low-concentration range, confirming its suitability for background monitoring. For BC core and shell sizes, the distributions diverge more strongly. The 25th percentile peaks at smaller size ranges, characterizing small-particle populations. The 50th percentile has a slightly broader distribution than the mean, covering more of the large-size range and reinforcing its representativeness under both background and polluted conditions. The 75th percentile is skewed toward much larger sizes, with substantially higher frequencies, indicating strong sensitivity to large-particle BC and supporting its use in high-pollution, large-size analyses. The mean overlaps largely with the 50th percentile, capturing overall particle size information across most conditions.
Overall, the use of multiple percentiles provides a layered characterization of MISR sensitivity. The 50th percentile and mean are most effective for describing general BC concentrations and typical size distributions, while the 75th percentile highlights high-concentration and large-particle events, and the 25th percentile emphasizes low-concentration and small-particle conditions. Together, these metrics offer complementary perspectives for refined monitoring of BC under diverse atmospheric environments.
3.4 Comparative Analysis of Black Carbon Observations: Insights from MERRA and MISR Datasets Across Global Regions
Figure 6a and b illustrate that MISR and MERRA exhibit substantial discrepancies in the global distribution of BC column mass concentrations. MISR generally reports higher BC levels in Africa, South Asia, and East Asia, particularly over central-southern Africa, the Indian subcontinent, and both coastal and inland Chinese urban areas, whereas MERRA estimates are consistently lower. Only in limited regions, such as parts of Southeast Asia, does MERRA show relatively elevated signals, though it still tends to underestimate regional emissions overall. In South America, MISR detects enhanced concentrations over the Amazon basin and southern regions, while MERRA shows weaker signals, indicating lower sensitivity to localized emission sources. In Europe and North America, both datasets reveal generally lower BC concentrations; however, MISR captures more localized pollution signals associated with industrial activity and wildfires, whereas MERRA remains comparatively smoother. In Oceania, MISR reports relatively higher concentrations in the north, while MERRA indicates higher values in the west.
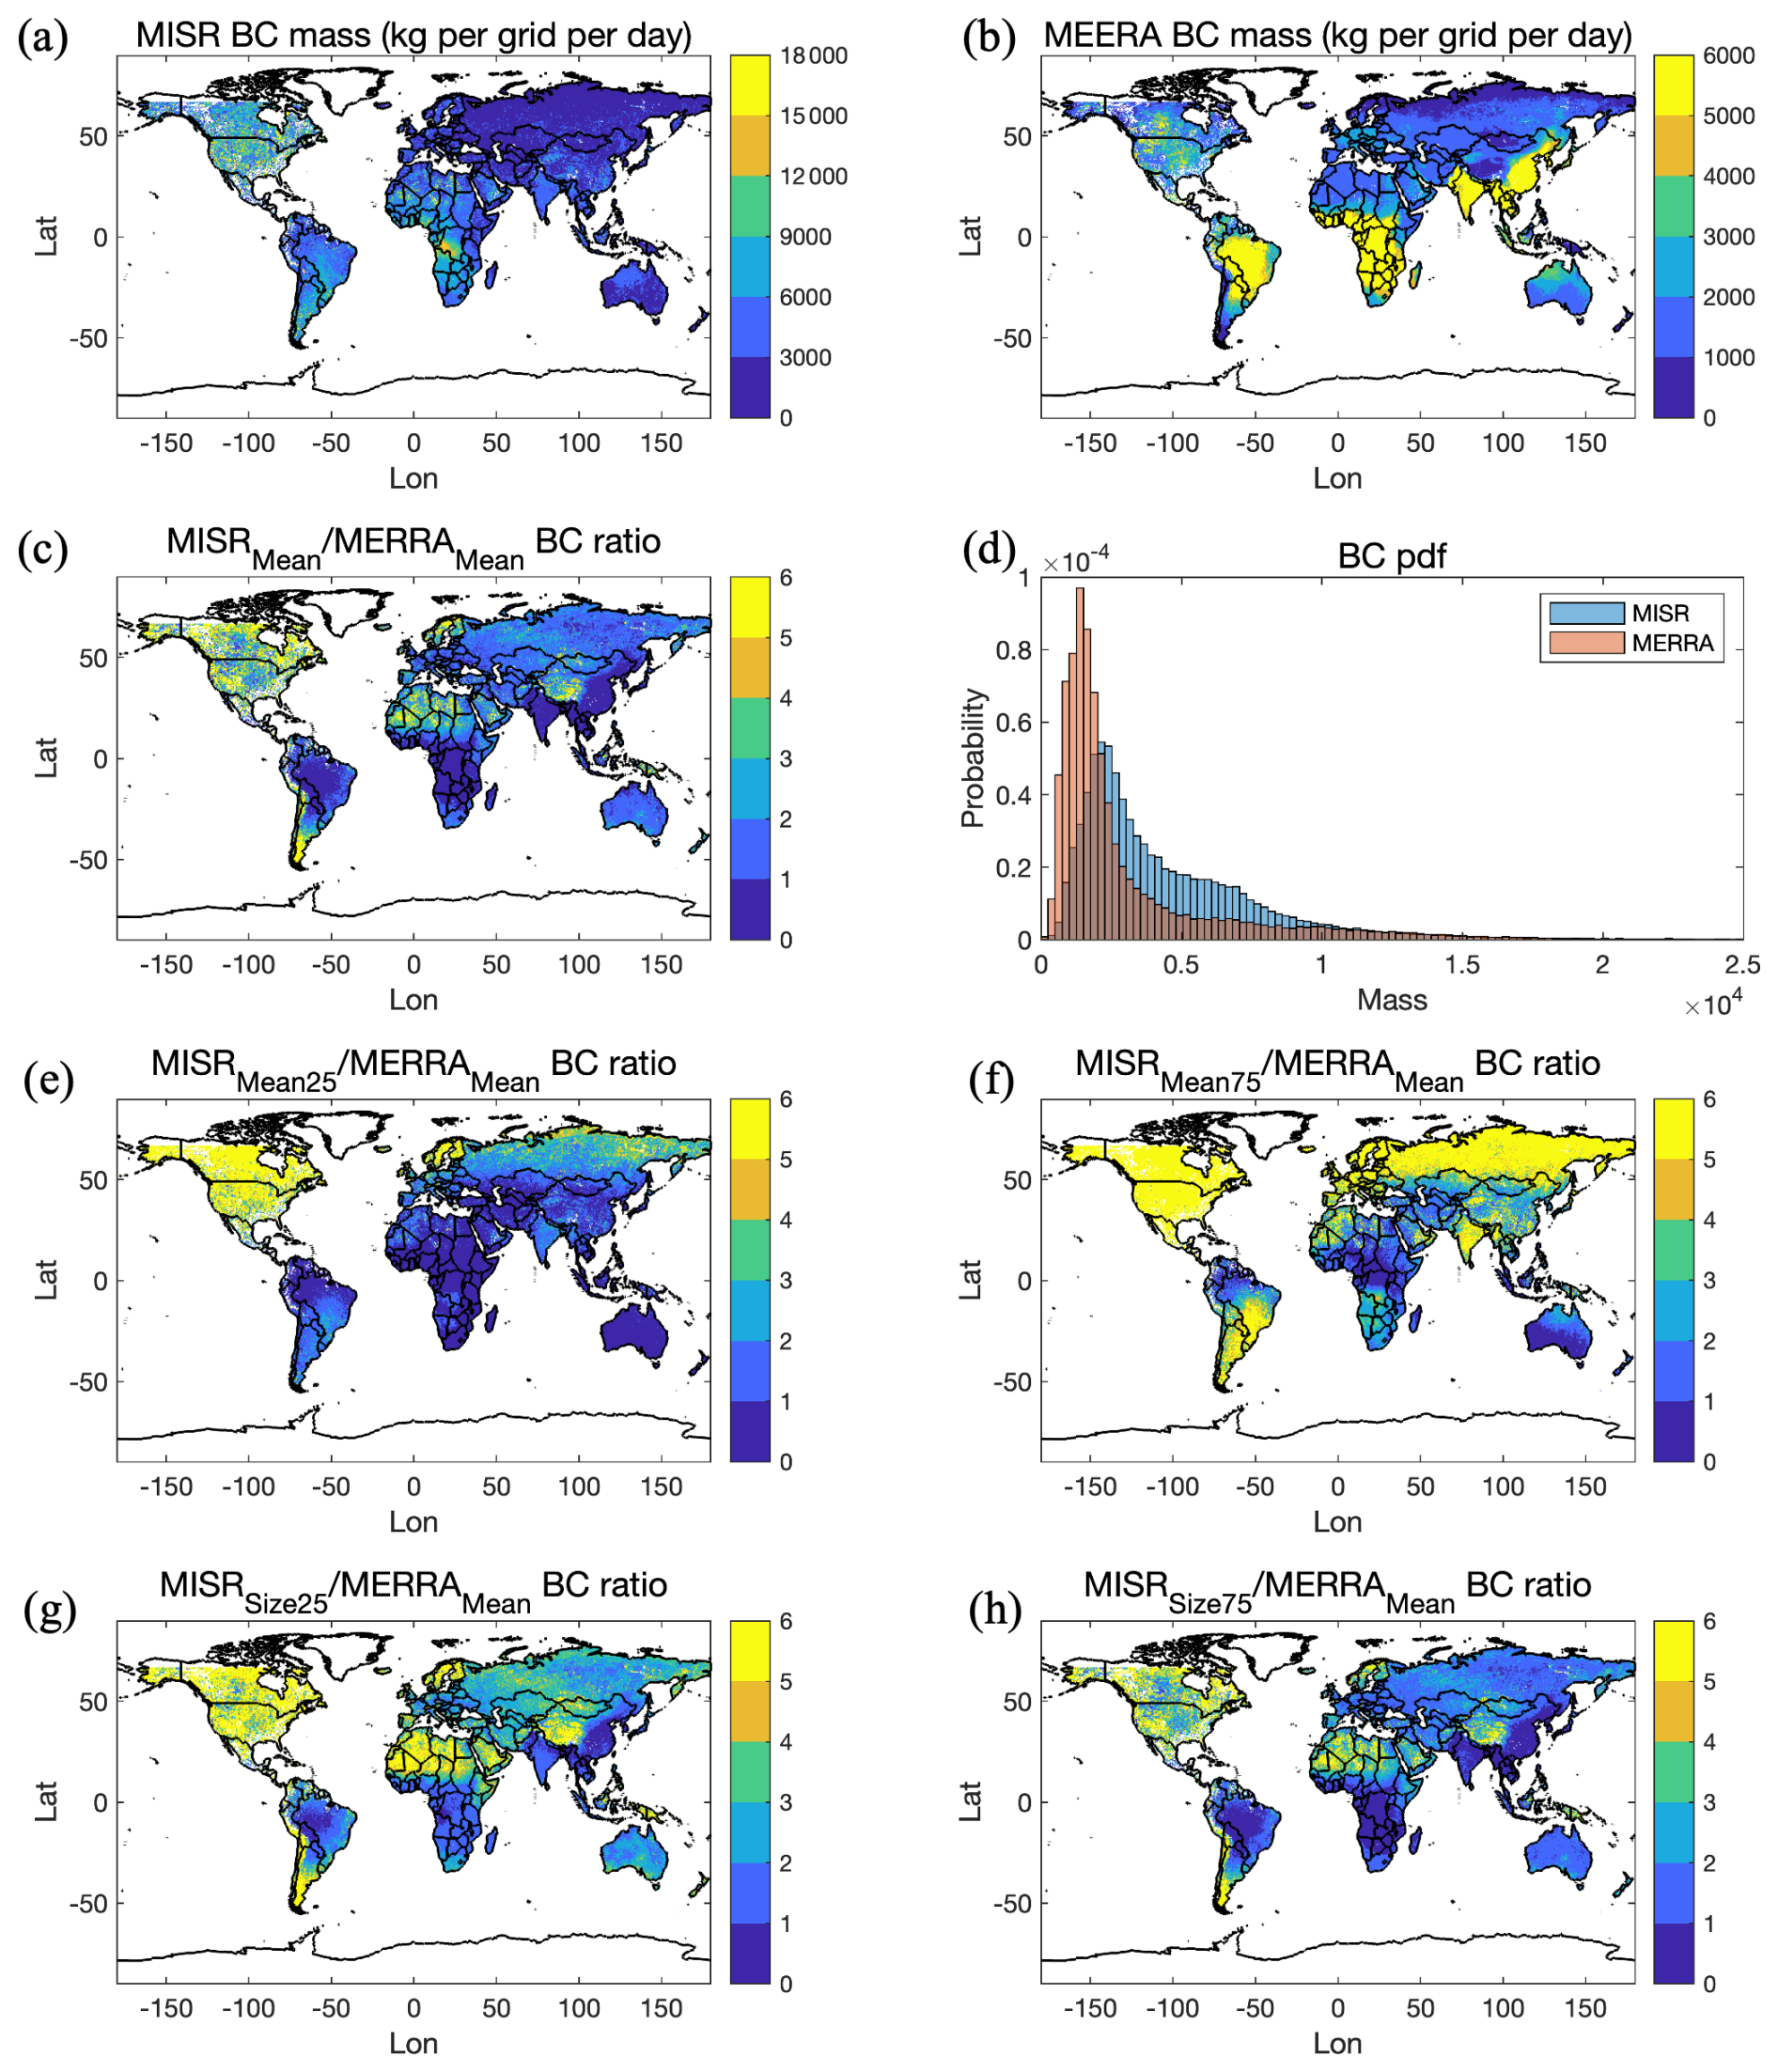
Figure 6Comparison between BC column concentration estimated based on MISR and MERRA data. (a) MISR BC column mass concentration. (b) MERRA BC column mass concentration. (c) Ratio of mean BC column mass concentration between MISR and MERRA. (d) PDF of mean BC column mass concentration between MISR and MERRA. (e) Ratio of BC column mass concentration between MISR (25 % of mean) and MERRA (mean). (f) Ratio of BC column mass concentration between MISR (75 % of mean) and MERRA (mean). (g) Ratio of BC column mass concentration between MISR (25 % of size) and MERRA (mean). (h) Ratio of BC column mass concentration between MISR (75 % of size) and MERRA (mean).
Figure 6c presents the MISR-to-MERRA ratio, highlighting spatial differences between the datasets. Ratios exceeding unity dominate across much of Africa, South Asia, East Asia, and most of China, reflecting substantially higher BC estimates from MISR and its stronger sensitivity to local emission sources. Conversely, ratios near or below unity occur in northern South America, southern and central Australia, and parts of central and western Africa, suggesting higher MERRA estimates in those regions. Overall, MISR yields substantially higher ratios in major emission hotspots, enabling clearer identification of localized pollution sources, whereas MERRA tends to emphasize background concentrations. In Europe, both datasets report relatively low BC, but their absolute values differ considerably: MISR captures greater spatial heterogeneity linked to industrial emissions and reports higher estimates overall. In North America, due to MISR's AOD >0.25 threshold constraint, significant BC is retrieved primarily over fire-affected regions and eastern urban centers, with MISR values far exceeding MERRA, indicating that MERRA strongly underestimates episodic events. Over Oceania, where overall BC concentrations are low, the two datasets show broadly consistent patterns across much of the central region; however, MERRA reports higher concentrations in the west (e.g., around Perth).
Figure 6d compares the PDFs of BC mass concentrations from the two datasets. MERRA exhibits a distribution concentrated in the low-concentration range, indicating its stronger capability in characterizing large-scale background conditions. By contrast, MISR shows higher frequencies in the elevated concentration range, highlighting its advantage in capturing localized high-pollution events, especially over South America, South Asia, and East Asia – consistent with the spatial ratio patterns shown in Fig. 6c.
Figure 6e shows the MISR-to-MERRA ratio distribution under relatively low concentration conditions (MISR Mean25 %). Compared with the mean ratio map, the overall ratios are closer to 1, indicating higher consistency between MISR and MERRA at lower MISR concentrations. However, in regions such as central–western Africa, southern Australia, and parts of South America, areas with ratios below 1 become more pronounced, suggesting that MISR estimates are lower than those of MERRA. Over most of China, the ratio differences remain relatively small (within a factor of 1–2), reflecting a certain degree of consistency. In northern Asia, the ratio declines, which may be related to MISR's detection sensitivity, the characteristics of local emission sources, and algorithmic uncertainties. Nevertheless, in northern Europe and South Asia, the MISR-to-MERRA ratios remain elevated, highlighting MISR's stronger sensitivity to localized pollution sources.
Figure 6f presents the ratio distribution under relatively high concentration conditions (MISR Mean75 %). Most regions exhibit ratios significantly greater than 1, especially southern Africa, the Indian subcontinent, and East Asia, where MISR estimates far exceed those of MERRA. This indicates that MISR responds more strongly to BC in high-concentration regions, enabling clearer identification of emission sources and their intensities. In southwestern Australia and certain parts of western and central Africa, the ratios fall below 1, though the differences are limited in both spatial extent and magnitude. In eastern China, India, and some high-emission areas of Southeast Asia, MISR values are particularly pronounced, reflecting the distinctive imprint of high-pollution events in its observations.
Figure 6g shows the ratio distribution based on the small-size assumption (MISR Size25 %). Its spatial pattern closely resembles that in Fig. 6c, underscoring the stronger sensitivity of small-size BC concentrations to localized emissions. Because smaller BC particles have longer atmospheric lifetimes and can be transported over broader regions, they produce stronger pollution signals in urban and industrial areas. Moreover, small-size BC is more responsive to meteorological conditions (e.g., temperature, humidity), resulting in more pronounced regional heterogeneity, particularly over parts of South America, Africa, and Asia.
Figure 6h presents the ratio distribution under the large-size assumption (MISR Size75 %). Similar to Fig. 6c, its spatial distribution appears smoother, with relatively uniform ratios. This reflects the properties of large-size BC, which settles more rapidly and has a shorter atmospheric lifetime, thus remaining concentrated near emission sources and producing more homogeneous large-scale distributions. Notably, the overall ratios in Fig. 6h are slightly lower than those in Fig. 6c, indicating that while MISR remains more responsive to local emissions than MERRA under the large-size assumption, the overall differences are smaller.
Taken together, Fig. 6e and f illustrate the differences between MISR and MERRA across concentration levels: MISR is more sensitive in high-concentration regions, while agreement with MERRA is higher under low concentrations. Figure 6g and h reveal contrasting behaviors under particle size assumptions: small-size BC better captures localized sources and transport features, whereas large-size BC is more spatially concentrated with smaller overall differences. These variations reflect the complexity of BC transport, deposition, and source impacts in the atmosphere. Overall, MISR demonstrates stronger sensitivity to high concentrations and localized sources, whereas MERRA more consistently reflects large-scale background distributions.
In terms of global BC column concentration patterns, the two datasets show distinct characteristics. MERRA, being a model-based reanalysis product, exhibits relatively continuous and smooth spatial gradients. Across global regions, MERRA generally captures broad-scale concentration trends, particularly over high-BC regions in Africa, South America, Australia, and Asia, but with limited representation of localized details. In contrast, MISR, based on multi-angle imaging, provides higher spatial resolution and stronger sensitivity to local variability, yielding richer spatial heterogeneity. The MISR-to-MERRA ratio maps highlight that MISR estimates are substantially higher over regions such as sub-Saharan Africa and eastern South America, underscoring its responsiveness to strong emission sources. MISR also reveals more pronounced spatial variability within regions, particularly in high-emission areas such as South Asia, East Asia, and southern South America. This variability likely reflects the advantages of MISR's multi-angle observational approach, which captures localized fluctuations and gradients in BC concentrations that MERRA tends to smooth over.
3.5 Distributional Patterns in Representative Regions
The spatial distribution and refinement process of BC products over South America are illustrated in Fig. 7. The primary filtered regions are concentrated in central and southern South America, specifically within the Pantanal wetlands and the surrounding fringes of the Amazon Basin. As shown in Fig. 7a, the temporal coverage criterion (valid observational days >80 %) retains the majority of these inland areas, ensuring the statistical representativeness of the annual cycle. Figure 7b displays the regions satisfying the BC column number concentration threshold (> 70th percentile), effectively identifying the primary loading centers. The optical constraint applied in Fig. 7c (AAOD, ratio < 8.0) further excludes potential dust-contaminated pixels, primarily along the arid fringes.
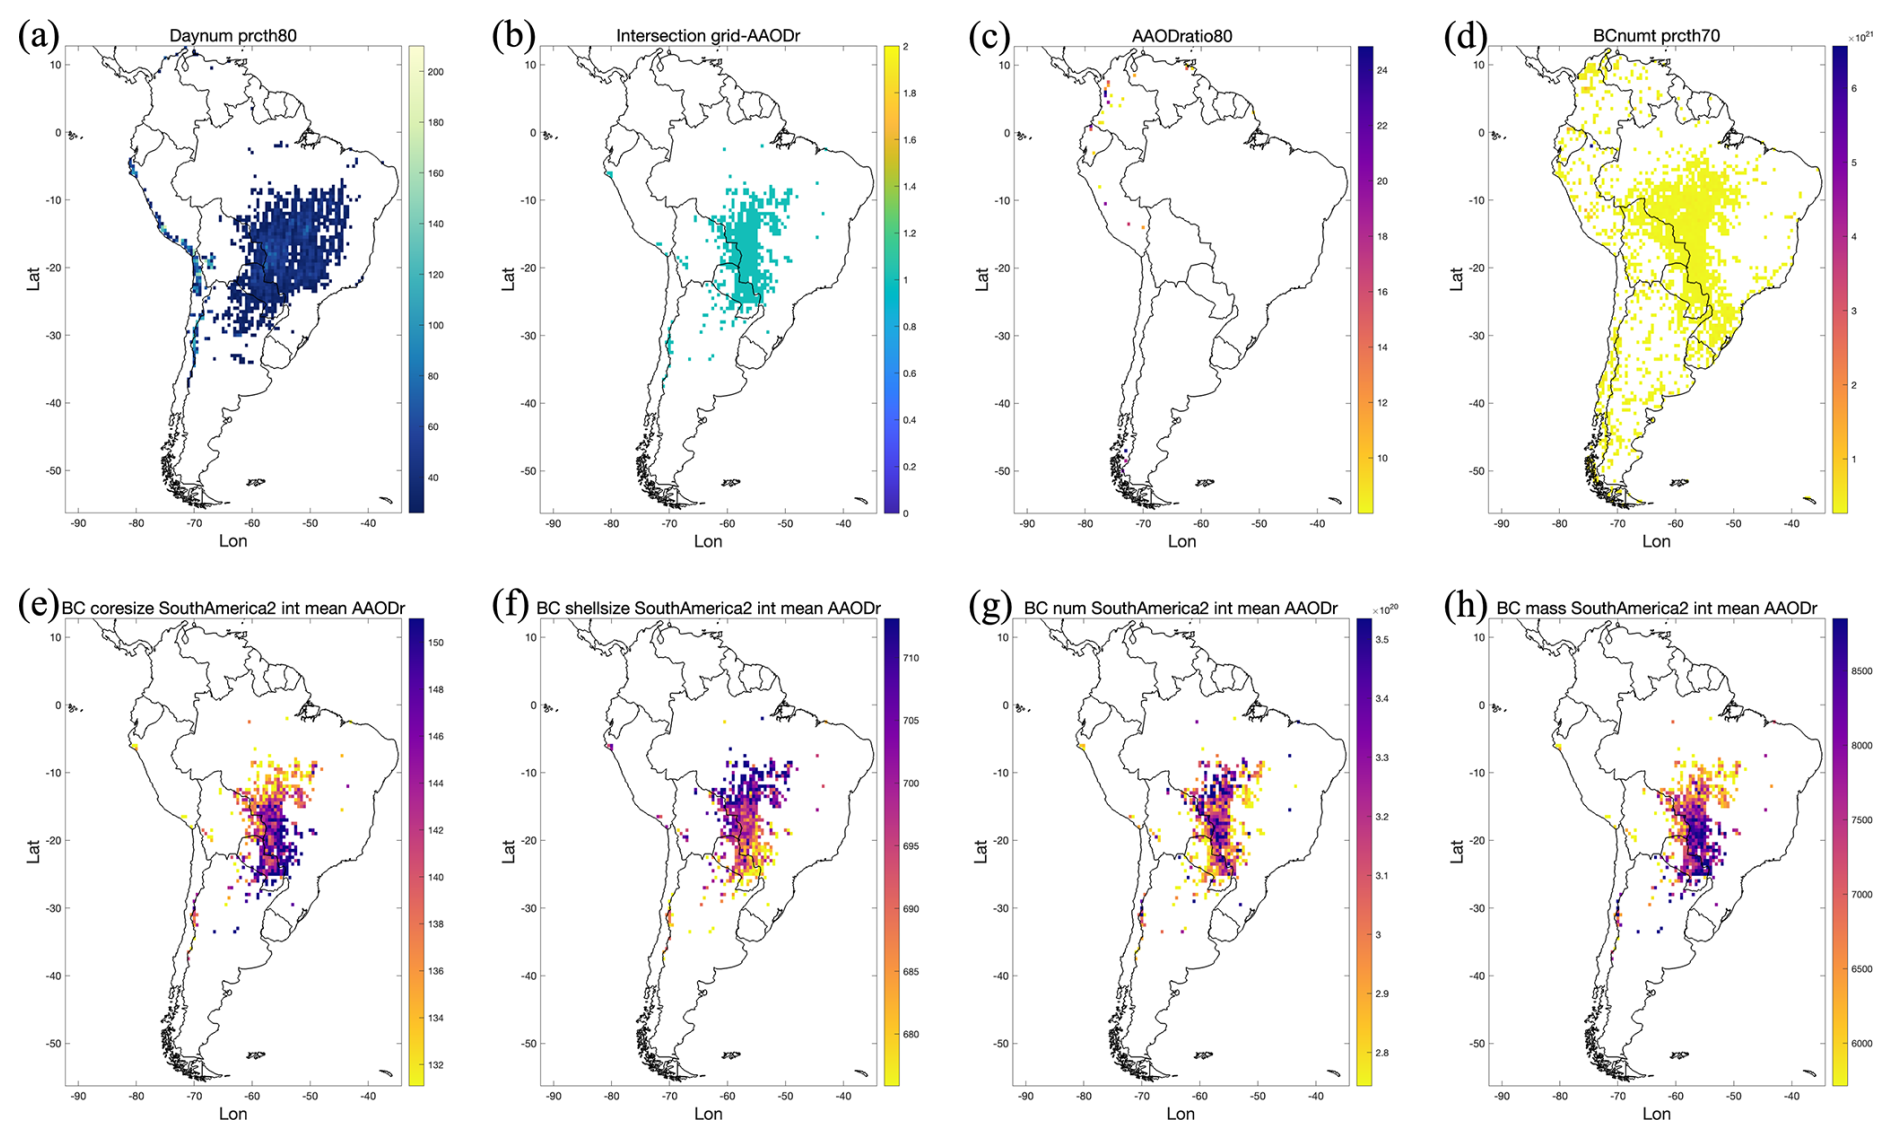
Figure 7Results of the analysis based on the BC column concentration product over South America. (a) Regions with more than 80 % valid observational days. (b) Regions with more than 70 % BC column number concentration. (c) Regions excluded due to AAOD values greater than 8.0. (d) Overlapping regions from (a) and (b) after excluding those regions identified in (c). (e) BC column number concentration in the filtered regions. (f) BC column mass concentration in the filtered regions. (g) BC particle size in the filtered regions. (h) BC Shell size in the filtered regions.
The overlapping result of these multiple constraints (Fig. 7d) yields a high-confidence sample set that captures the core of the South American biomass burning belt. Within these filtered regions, the BC column number concentration (Fig. 7e) and mass concentration (Fig. 7f) exhibit high spatial consistency, with elevated values corresponding to the intense fire activity zones identified in previous studies (Lin et al., 2020a; Wang et al., 2025). Furthermore, the retrieved microphysical properties provide additional detail, the BC particle size in these regions (Fig. 7g) and the corresponding shell thickness (Fig. 7h) demonstrate a clear spatial gradient from the fire source centers toward the downwind transport pathways. These filtered results capture high-mass samples characterized by significant inter-annual and intra-annual variations, reflecting the dynamic nature of biomass burning emissions in this region.
Figure 8 presents the filtered retrieval results over the Indian subcontinent, highlighting a different distribution regime. Unlike South America, the filtered regions in India are predominantly located in the southern and central states, specifically across Maharashtra, Tamil Nadu, and Karnataka (Fig. 8d). These regions are identified by simultaneously satisfying the temporal coverage (>70 % valid days, Fig. 8a) and BC loading (>50th percentile, Fig. 8b) criteria, after excluding dust-prone areas using the spectral ratio constraint (AAOD ratio <7.0, Fig. 8c).
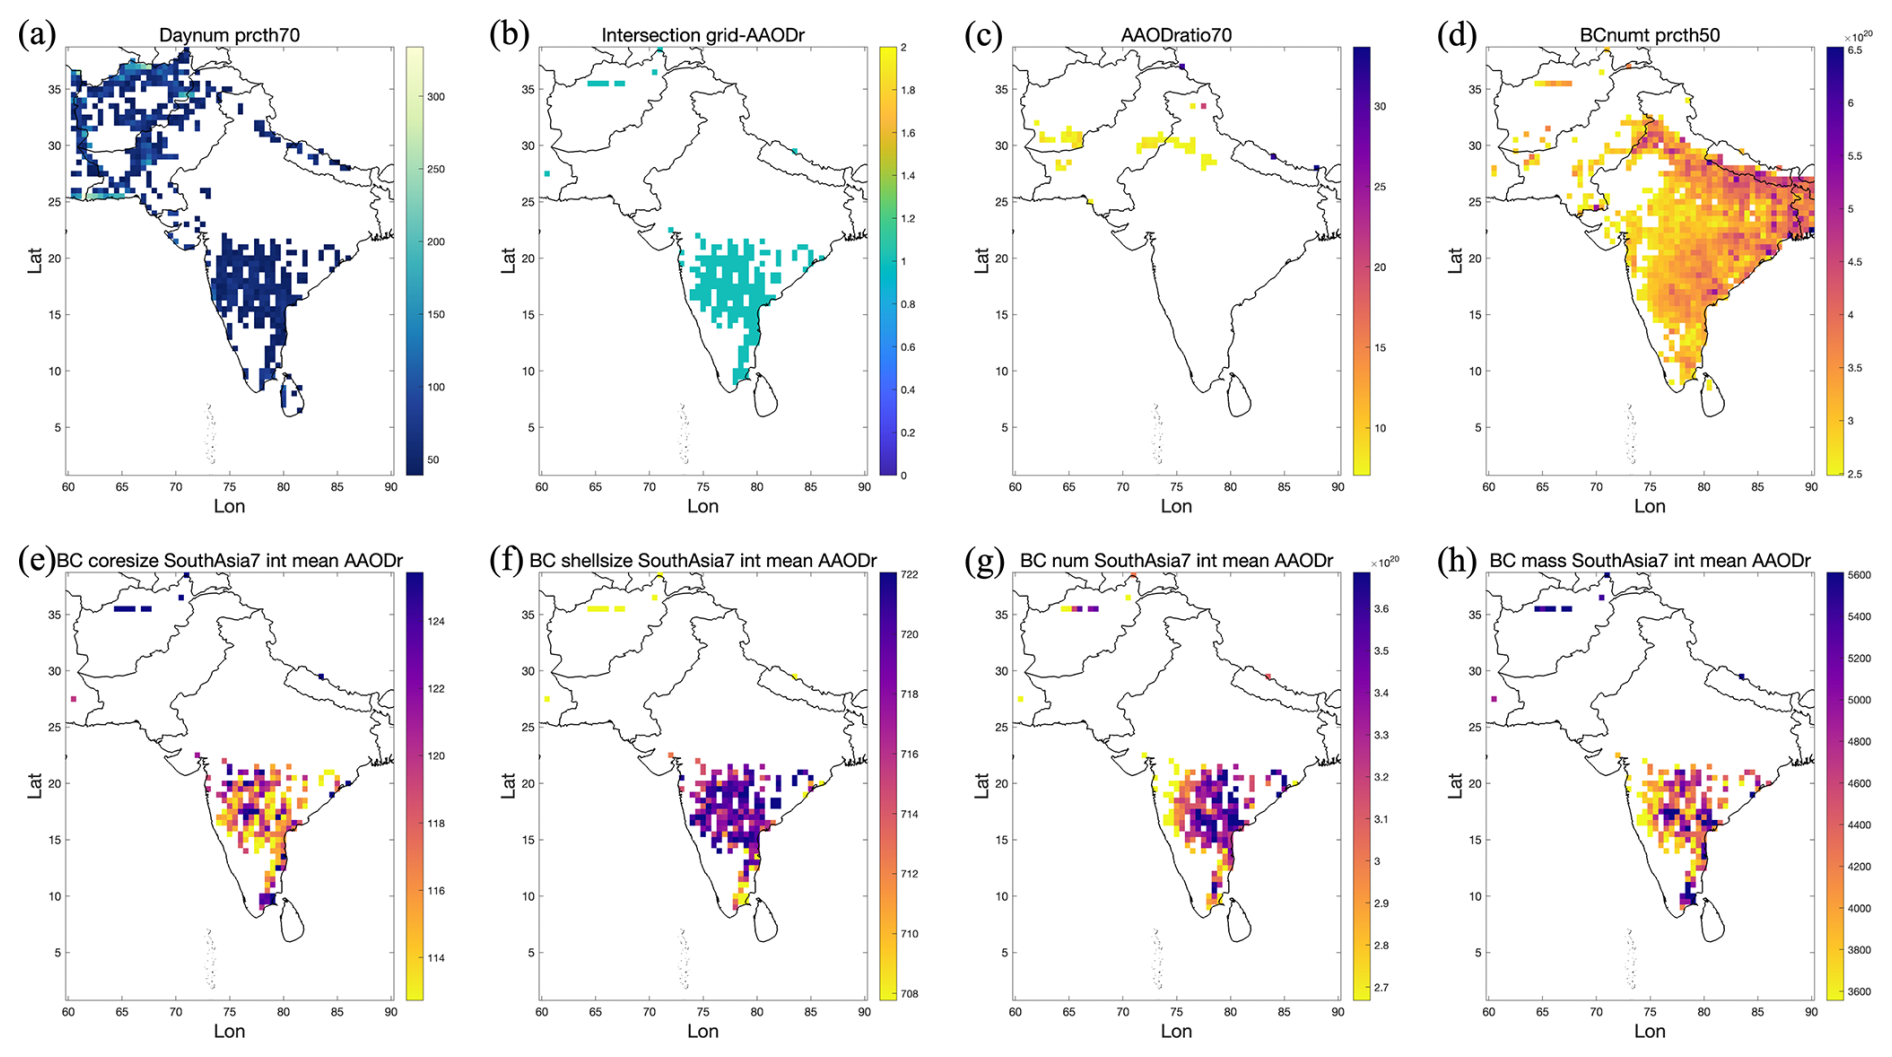
Figure 8Results of the analysis based on the BC column concentration product over India. (a) Regions with more than 70 % valid observational days. (b) Regions with more than 50 % BC column number concentration. (c) Regions excluded due to AAOD values greater than 7.0. (d) Overlapping regions from (a) and (b) after excluding those regions identified in (c). (e) BC column number concentration in the filtered regions. (f) BC column mass concentration in the filtered regions. (g) BC particle size in the filtered regions. (h) BC Shell size in the filtered regions.
A key observation in the raw retrieval is that while the Indo-Gangetic Plain (IGP) and the Delhi National Capital Region exhibit extremely high BC column concentrations, they are largely excluded from the filtered dataset due to insufficient temporal coverage (valid observational days). In contrast, the filtered regions in southern and central India provide a more stable and persistent representation of the BC distribution. As shown in Fig. 8e and f, BC number and mass concentrations in these states show strong spatial coherence. The retrieved microphysical parameters, including particle radii (Fig. 8g) and shell diameters (Fig. 8h), display signatures typical of mixed combustion sources. These microphysical traits are consistently observed across the identified hotspots, which align with areas characterized by high population density and diversified industrial activities. Although these regions exhibit lower peak concentrations compared to the seasonal extremes of the IGP, they represent long-term, sustained BC loadings that meet the rigorous data quality requirements of this study.
4.1 Physical Mechanisms and Climate Implications of Biomass Burning in South America
The spatial coherence of the filtered products over central and southern South America supports the interpretation that the applied constraints effectively capture a physically meaningful signal rather than scattered retrieval artifacts. The concentration of high BC mass loadings in the Pantanal wetlands and surrounding Amazon Basin coincides with regions where intense fire activity dominates during the dry season, reinforcing the role of biomass burning as a primary emission source (Krol et al., 2013). This consistency demonstrates that the retrieval framework accurately isolates fire-related signals (Freire et al., 2020), which remain robust even after AAOD-based screening to exclude mineral dust. Beyond the source areas, the influence of these emissions extends across vast spatial scales through the atmospheric processing of primary BC and co-emitted precursors. As smoke plumes are lofted and transported, they undergo in-situ aging, leading to the development of scattering coatings that enhance absorption via the lensing effect. These plumes can travel thousands of kilometers to reach densely populated urban centers in Southeast Brazil, where long-range transport events severely deteriorate air quality and impose significant health risks (Santos et al., 2024).
From a climatic perspective, the identification of these BC hotspots reveals a tight coupling between fire activity and regional radiative perturbations. BC aerosols emitted from biomass burning can influence the South American climate system through semi-direct effects, where the absorption of solar radiation warms the aerosol layer and modifies atmospheric stability. This process typically reduces cloud cover and alters regional precipitation patterns and energy balances (Thornhill et al., 2018). The physical credibility of these findings is further validated by the long-term correspondence between our filtered products and AERONET monthly peaks at the CUIABA-MIRANDA station (Fig. A1 and Table B4). Collectively, these results reproduce the canonical biomass-burning belts and emphasize the pivotal role of fire-climate feedbacks. Integrating such satellite-derived distributions with model simulations will be essential for future work to better quantify the long-term environmental impacts of biomass burning on the South American ecosystem.
4.2 Drivers of Persistent Anthropogenic Emissions in India
The filtered results over India reveal a distinct emission regime characterized by long-term stability rather than episodic extremes. While traditionally recognized hotspots like the IGP and Delhi exhibit high raw column concentrations, their exclusion due to insufficient temporal coverage suggests that the applied filtering approach favors capturing persistent emission patterns over isolated, high-value signals driven by sparse observations. The retained regions across Maharashtra, Tamil Nadu, and Karnataka represent leading industrial and economic states with high population densities and energy use (Shaban et al., 2022; Shanmugam and Odasseril, 2024; Ramachandran et al., 2025). In these southern filtered regions, the spatial agreement between BC concentrations and particle size metrics is consistent with domestic energy-use structures and industrial activities (Huang et al., 2023). In southern India, many households continue to rely heavily on traditional fuels such as firewood, crop residues, and dung cakes. Routine biomass burning in rural areas contributes to a sustained and stable source over these regions. These regions emissions are also strongly coupled with population distribution, leading to spatial BC patterns that align with population density. At the same time, industrial activity and urban emissions are also evident in these regions (Chathurangika et al., 2022). Particularly along industrial corridors and in the vicinity of large- and medium-sized cities, where the overlap of population-based combustion and coal-based industrial sources further amplifies local pollution levels. While the analysis in these regions is consistent with known conditions on the ground (Jaganathan et al., 2025; Kawano et al., 2025; Kunjir et al., 2025; Luo et al., 2025), these areas have generally been overlooked by global-scale emissions databases (Li et al., 2017; Kumar et al., 2023; Ren et al., 2025).
Importantly, this combined influence of biomass burning and industrial emissions in the filtered regions is not the result of singular extreme events but rather represents a persistent and widespread emission regime. Under the modulation of the monsoon system, such emissions are more easily transported and accumulated, thereby exerting prolonged and significant impacts on regional air mass when emissions are continuous (Wei et al., 2022). Unlike South America, where biomass burning is dominated by seasonal wildfires, BC emissions in central and southern India arise from a more complex combination of household energy consumption, agricultural residue burning, and industrial production. This diversity of sources leads to environmental impacts that are correspondingly more intricate and persistent, shaping long-term regional air quality and monsoon-related climate feedbacks.
4.3 Strengths, Limitations, and Recommended Use Cases of the Filtering Strategy
The filtering strategy applied in this study prioritizes the capture of representative distributional features to ensure that the resulting products are statistically robust and regionally meaningful. However, this approach inherently introduces limitations regarding regions with limited observational samples but potentially extreme values remain areas of concern. For instance, the IGP and the surroundings of Delhi have long been regarded as the most prominent BC emission centers in India. Despite significant short-term aerosol loadings and their associated environmental risks, these areas were excluded from the present analysis due to insufficient valid observational days, often coupled with a high frequency of clean-air days during other periods of the year. While this filtering approach effectively highlights stable long-term patterns, it inevitably underrepresents certain hotspots driven by transient extreme pollution events or significant observation gaps. Therefore, studies focusing on short-term extremes or localized high-concentration impacts should combine raw observations with targeted monitoring strategies.
In summary, the multi-step filtering method successfully identified canonical biomass-burning regions in South America, where the spatial distribution, BC concentrations, and particle-size characteristics align with independent satellite observations and documented fire events. This validates the methodological framework and reveals the far-reaching impacts of biomass burning on air mass, regional climate, and public health. In contrast, the high-value regions identified in India, by contrast, highlight the combined effects of agricultural burning, industrial activity, and household biomass use, reflecting the long-term contributions of multiple overlapping sources. These regions are not only major drivers of air mass deterioration in South Asia but also key actors in climate feedbacks and health risks. Additional regional details and supplementary results, provided in the supporting materials and full dataset, offer further opportunities for in-depth regional analysis and thematic studies to extend understanding of BC's environmental impacts.
The original input datasets used in this study, together with the derived BC column concentration products, and sample codes to access these datasets, are publicly available at Figshare with DOI: https://doi.org/10.6084/m9.figshare.30173917 (Liu et al., 2026). The dataset is primarily provided in MATLAB (.mat) format to preserve the multi-dimensional structure of the daily global and regional grids.
The data products are organized into two main categories, Global BC Products and Regional BC Products. The global products include gridded variables for column mass concentration (both per unit area and per grid point), column number concentration, BC core size, and shell size on a 0.5° × 0.5° resolution. The regional products provide high-resolution data for nine predefined regions, including specific masks, valid observational day statistics, and filtered results based on optical constraints.
While this section provides a general overview, a more comprehensive description of the file hierarchies and variable definitions is provided in the Figshare repository. To facilitate immediate use, the repository also includes example MATLAB scripts for data loading, variable extraction, and spatial visualization. External auxiliary datasets, including MISR aerosol products, AERONET CUIABA-MIRANDA field observations, and MERRA-2 reanalysis data, are also archived in the repository to ensure long-term accessibility and reproducibility.
This study developed an integrated methodology to estimate global BC column concentrations by combining MISR multi-band satellite retrievals with Mie scattering simulations under single scattering albedo constraints. Through a systematic framework, we retrieved particle size distributions, absorption efficiencies, and subsequently derived BC column number and mass concentrations as well as two microphysical properties at a daily time step and global scale. Comparisons with AERONET and MERRA-2 datasets demonstrated the robustness and reliability of this approach across diverse regions and time periods. The results reveal distinct regional and temporal patterns of BC, highlighting the strong influence of biomass burning, industrial activity, and anthropogenic emissions in shaping both the magnitude and variability of BC concentrations. The methodology significantly enhances the capacity to capture long-term and spatially extensive BC distributions, overcoming key limitations of traditional single-source observations. By providing a physically consistent and observation-driven dataset, this work offers valuable support for climate and air quality modeling, particularly in constraining radiative forcing estimates and assessing the environmental impacts of BC. Future applications of this approach can extend to other absorbing aerosols, improving predictive capability in Earth system models and informing targeted mitigation strategies at both regional and global scales.
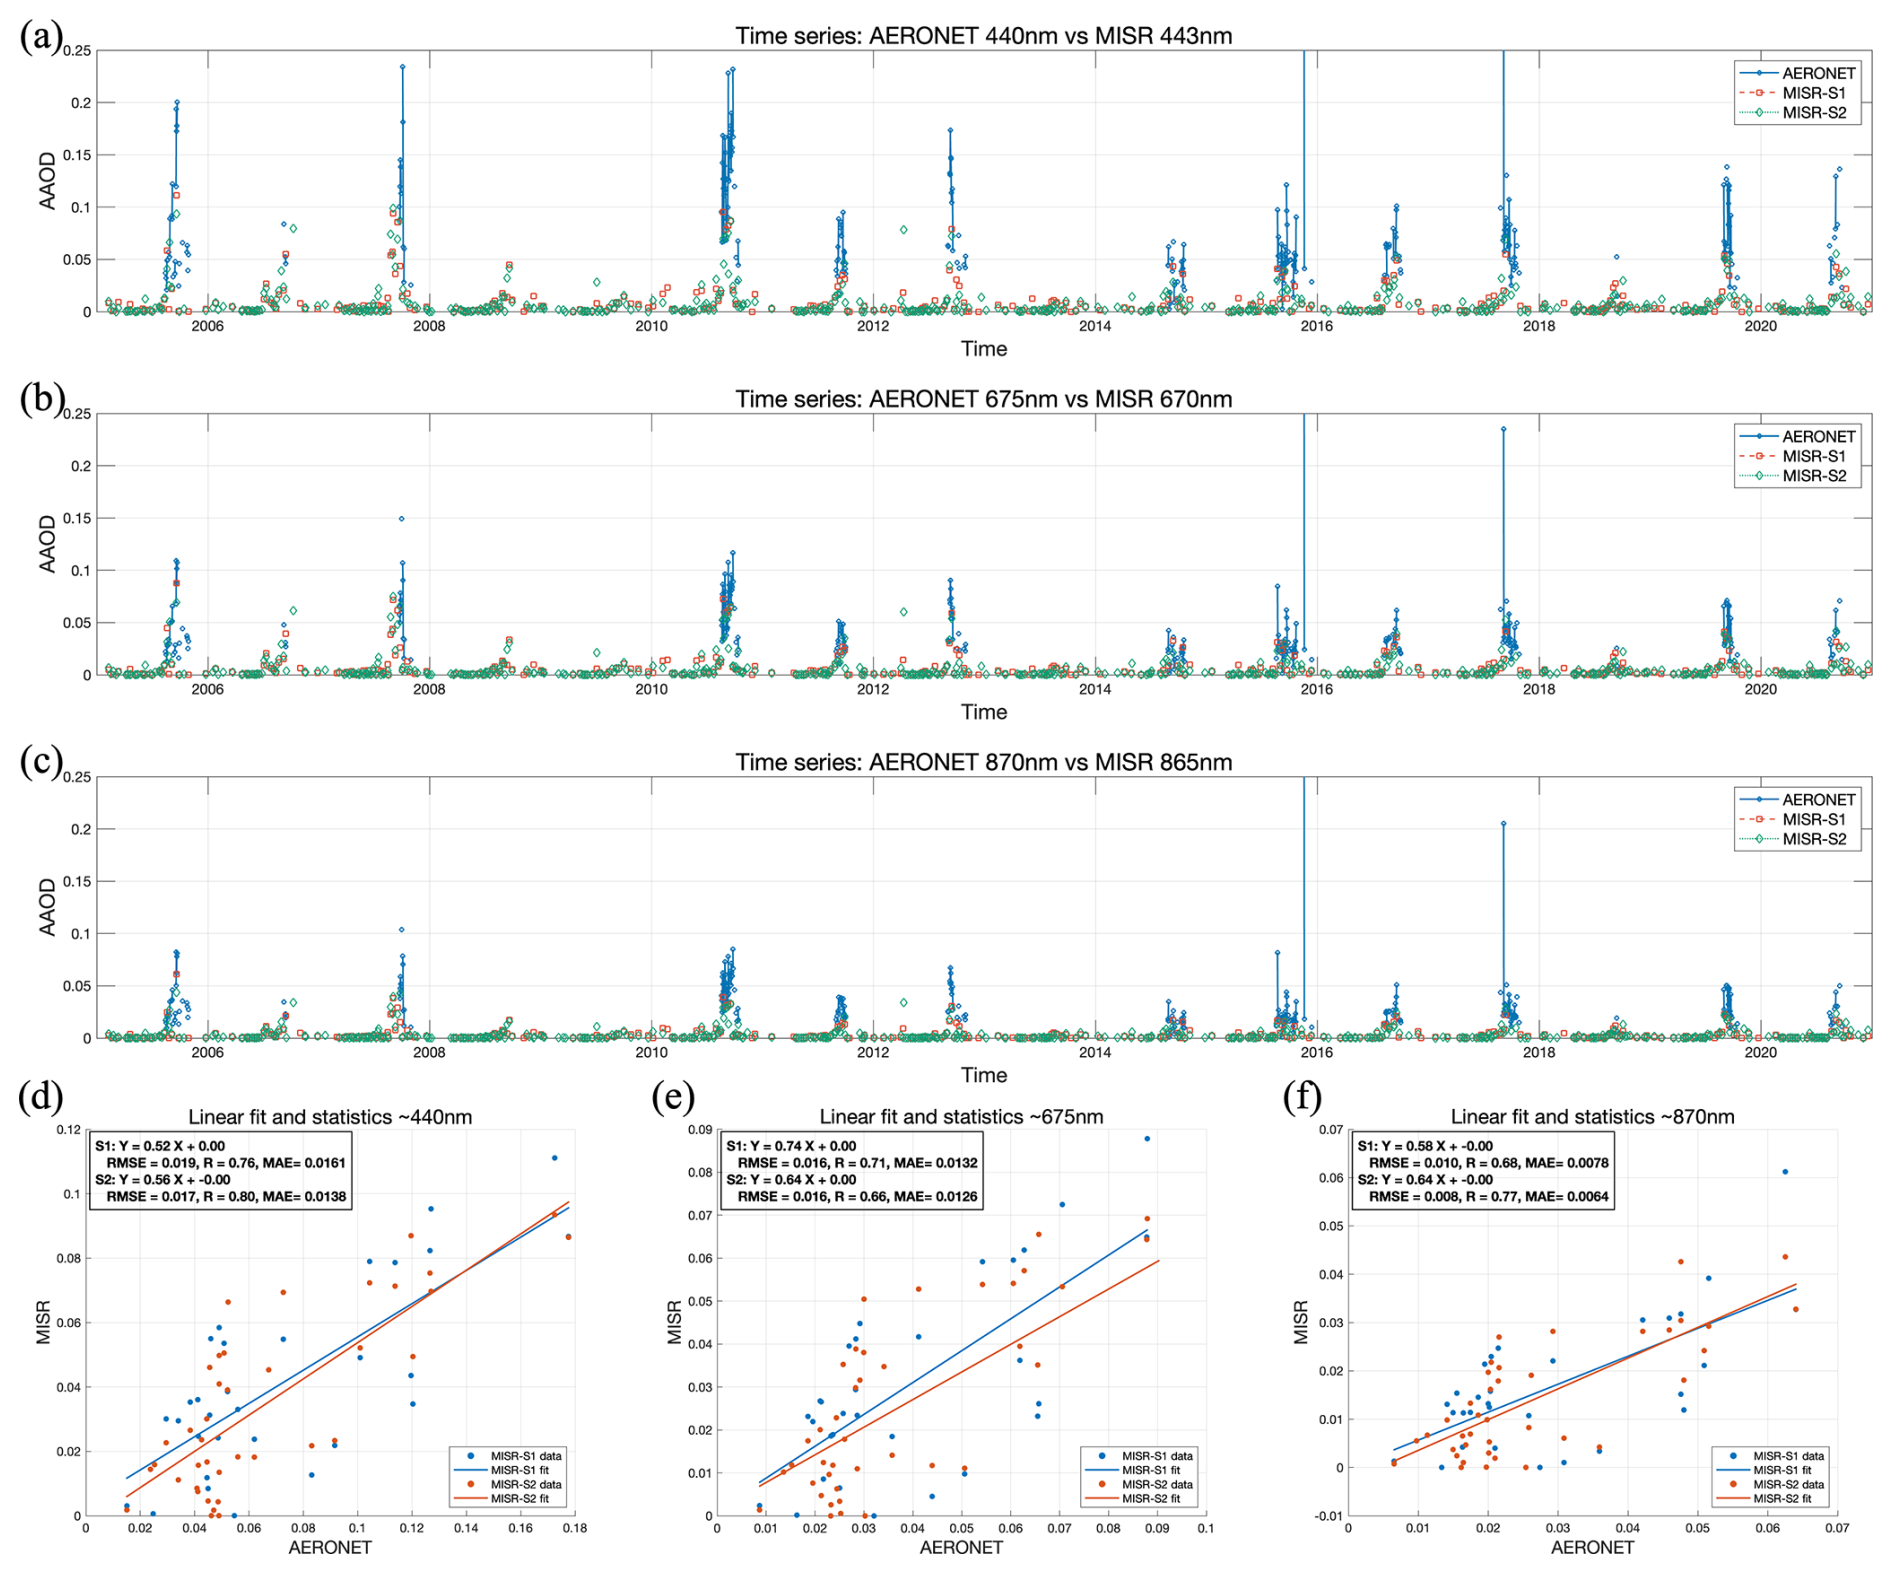
Figure A1Time series and correlation analysis of Absorption Aerosol Optical Depth (AAOD) comparing AERONET CUIABA-MIRANDA site observations (2005–2020) with two proximate MISR grid points (denoted as S1 and S2). (a) AAOD at ∼ 440 nm time series. (b) AAOD at ∼ 675 nm time series. (c) AAOD at ∼ 870 nm time series. (d) AAOD at ∼ 440 nm correlation analysis (outliers removed). (e) AAOD at ∼ 675 nm correlation analysis (outliers removed). (f) AAOD at ∼ 870 nm correlation analysis (outliers removed).
Table B1Annual average of BC atmospheric column num concentration in 9 regions from 2005 to 2020.
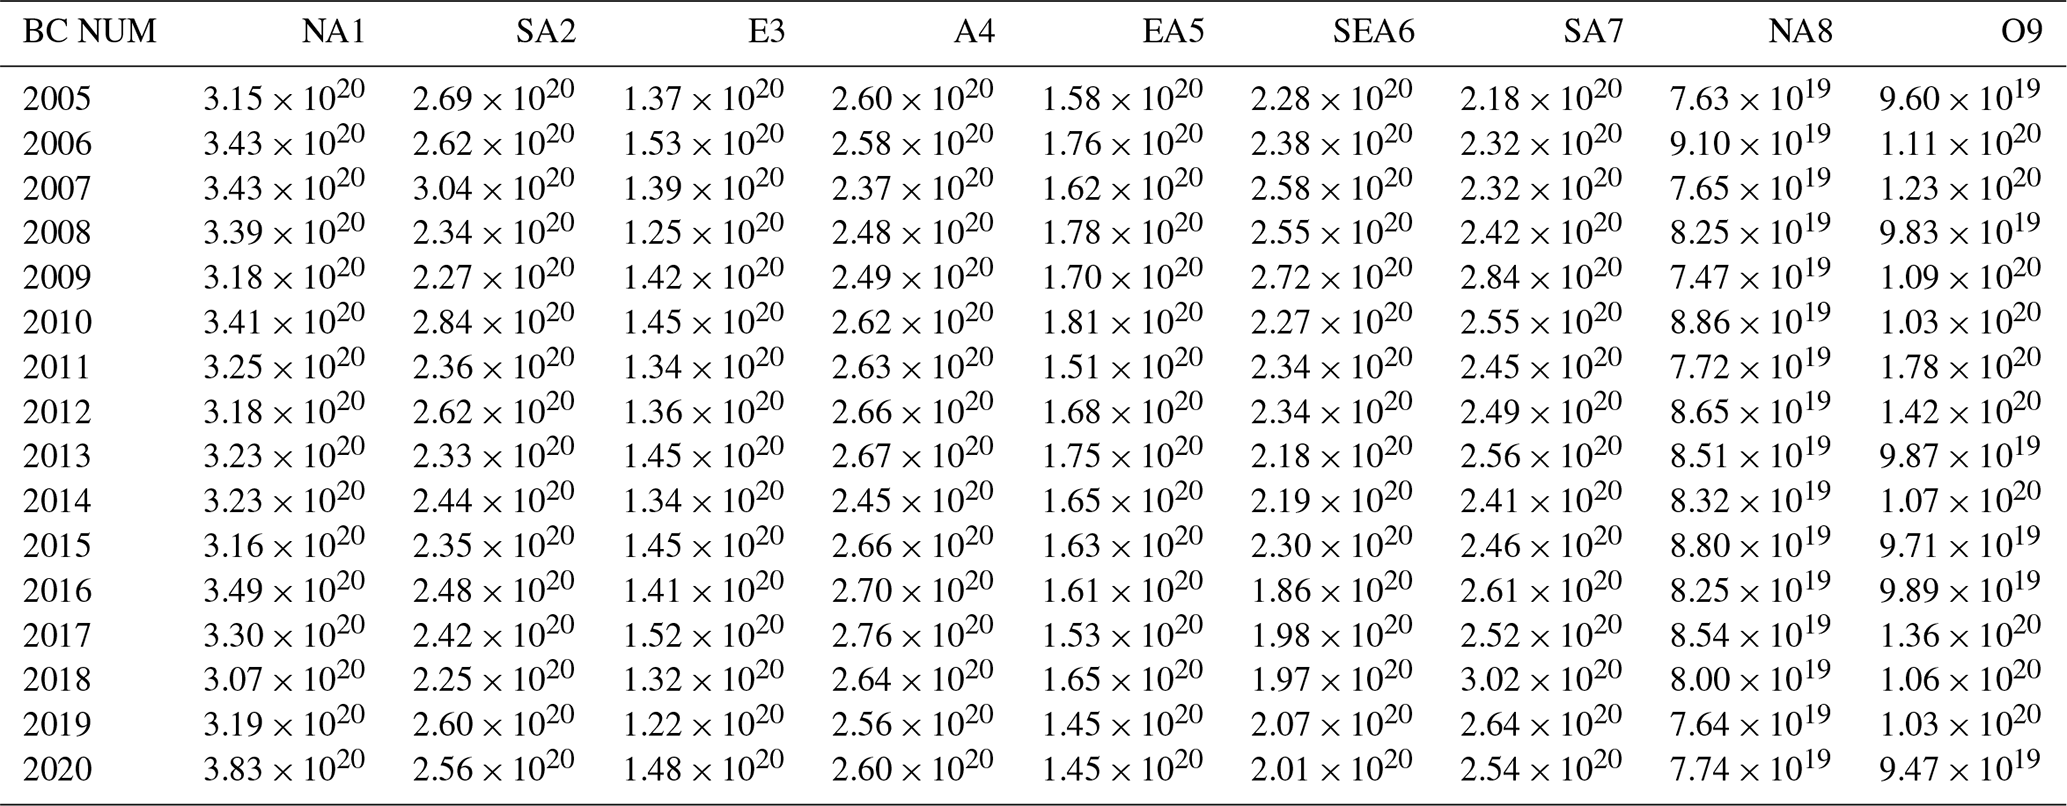
Table B2Annual average of BC core size in 9 regions from 2005 to 2020.
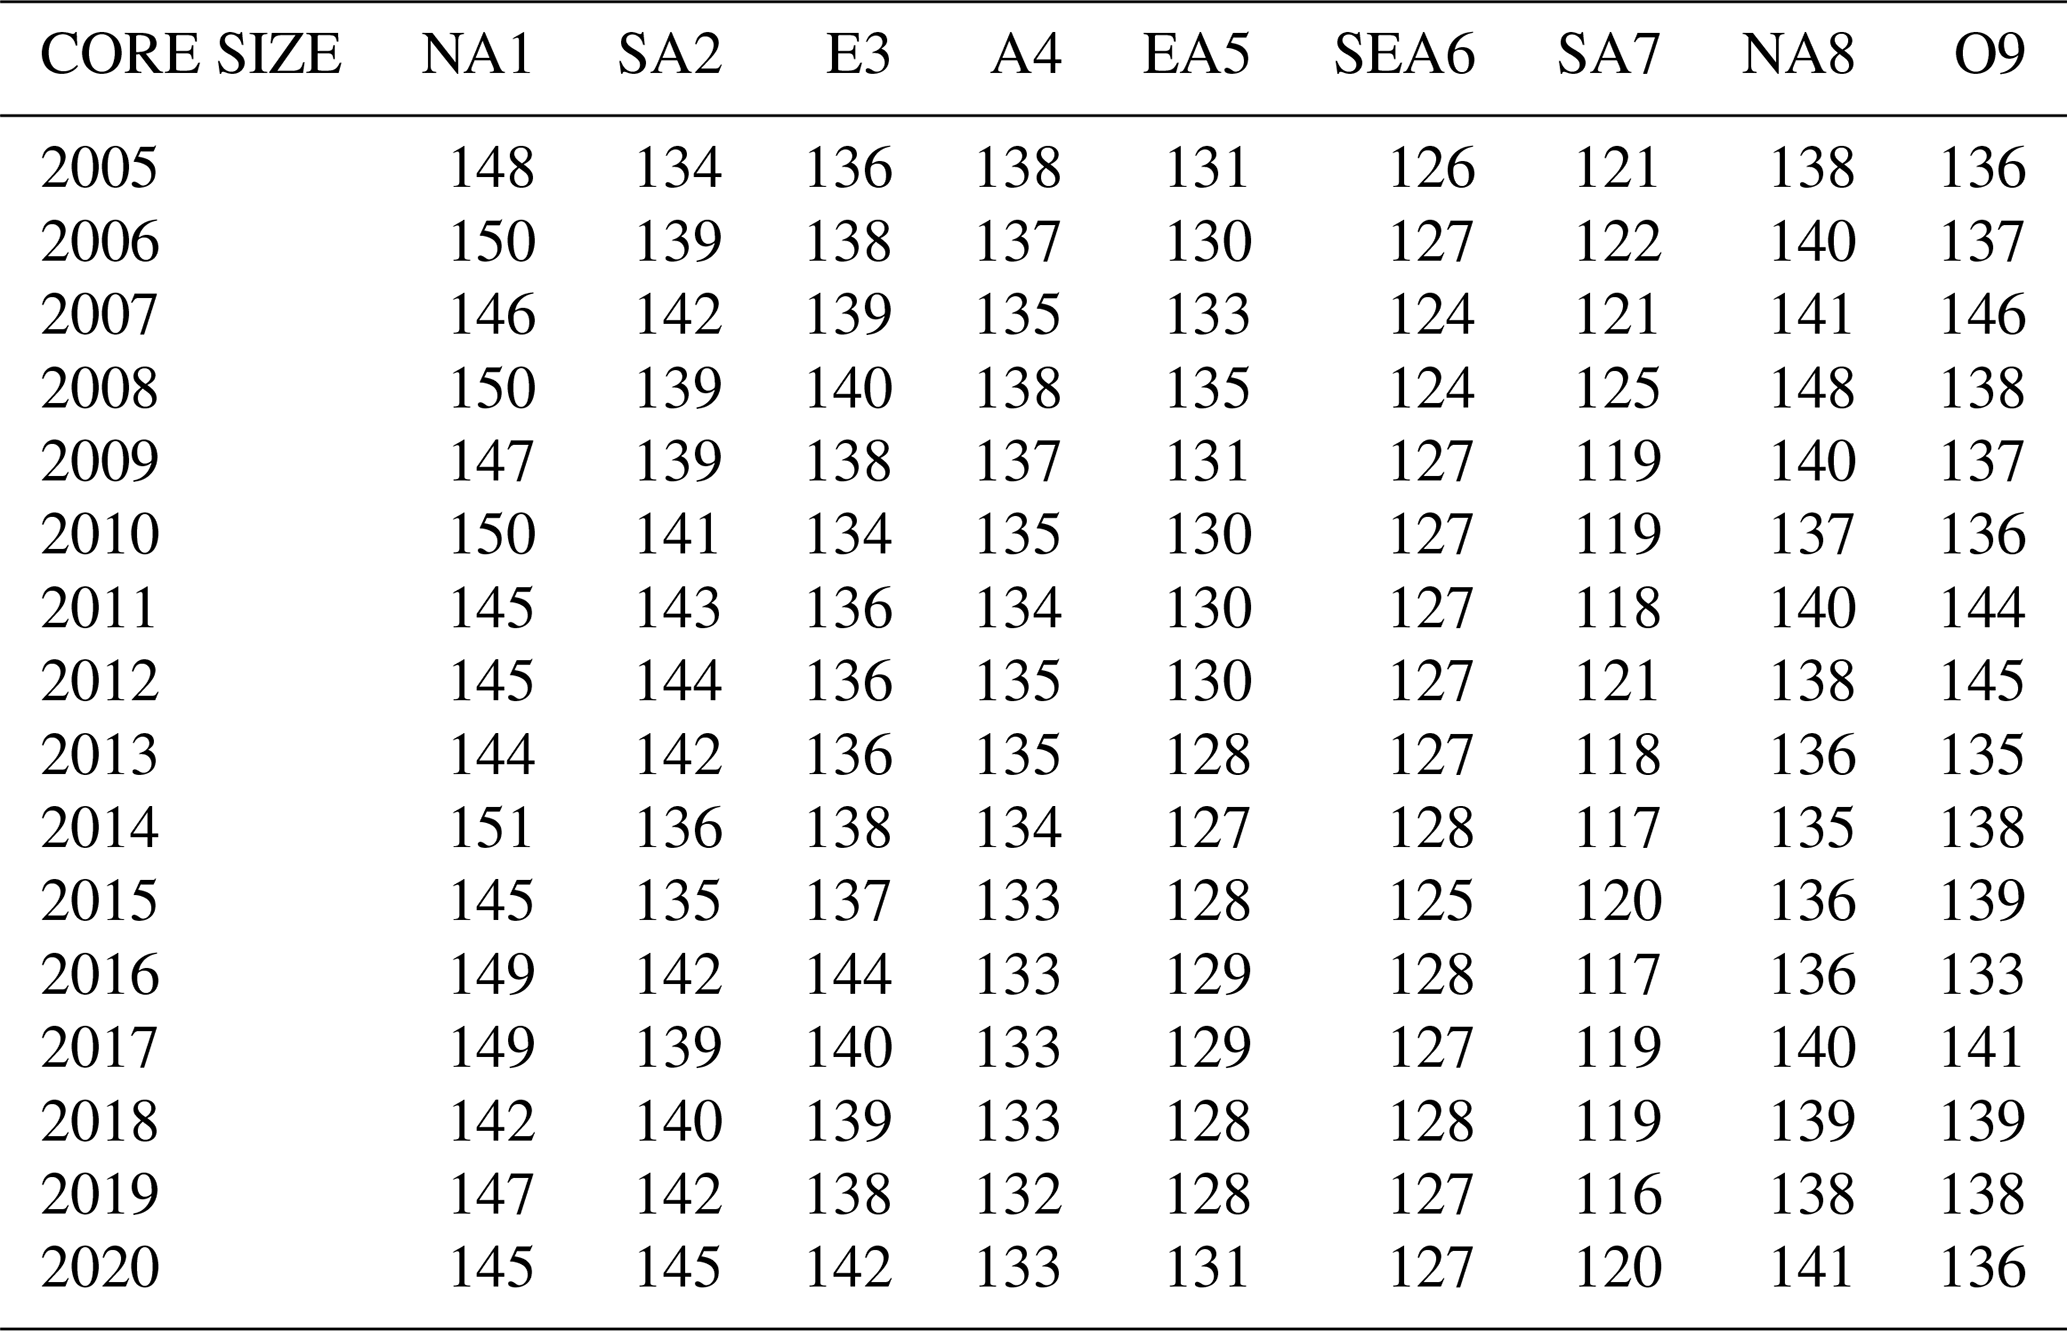
Table B3Annual average of BC shell size in 9 regions from 2005 to 2020.
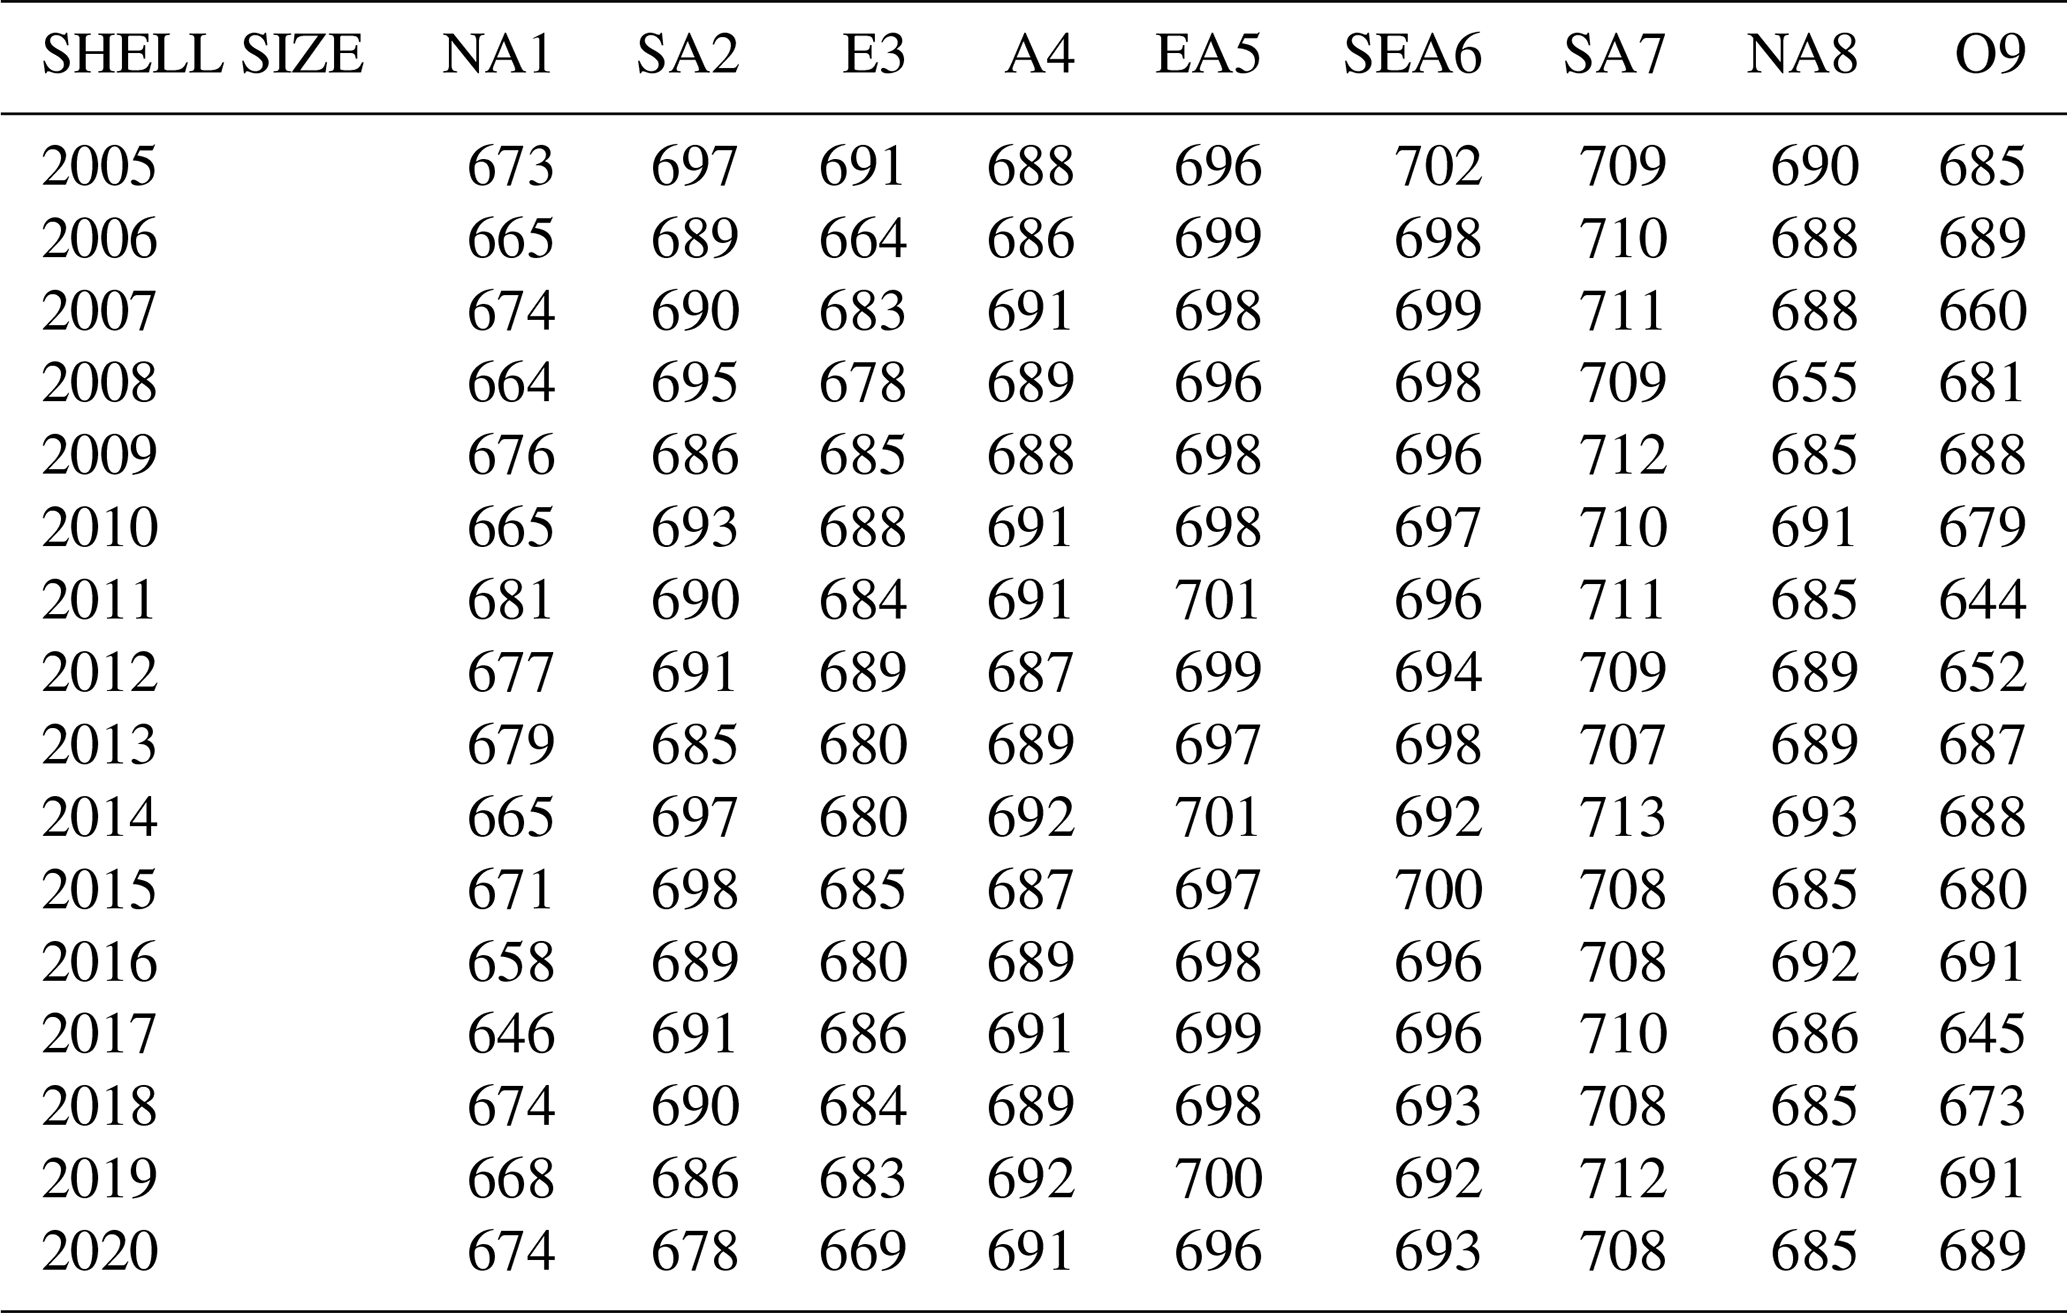
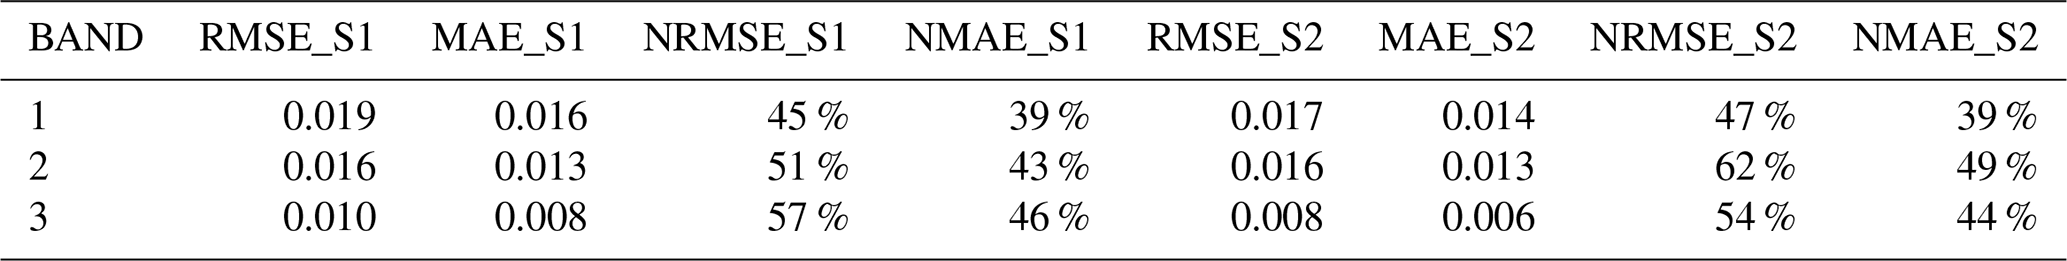
Table B4Statistical performance metrics of MISR-derived AAOD against AERONET observations at the CUIABA-MIRANDA site (2005–2020). nRMSE and nMAE denote RMSE (Root Mean Square Error) and MAE (Mean Absolute Error) normalized by the mean of AERONET observations, respectively.
JBC was responsible for conceptualization and funding acquisition, and also supervised the study. ZWL and JBC conducted the formal analysis and validation. ZWL and JBC, together with LYG and SW, developed the methodology. ZWL performed the software development, data processing, and visualization. ZWL and JBC carried out the investigation, with additional resources provided by SW, ZQL and ZWL. The original draft was prepared by ZWL, JBC, and PT, while JBC, ZWL, PT, and KQ contributed to review and editing.
The contact author has declared that none of the authors has any competing interests.
Publisher's note: Copernicus Publications remains neutral with regard to jurisdictional claims made in the text, published maps, institutional affiliations, or any other geographical representation in this paper. The authors bear the ultimate responsibility for providing appropriate place names. Views expressed in the text are those of the authors and do not necessarily reflect the views of the publisher.
We acknowledge the MISR cience team for providing the MISR products used in this study. We also acknowledge the AERONET principal investigator and staff at the CUIABA-MIRANDA site for maintaining and providing high-quality ground-based aerosol observations. In addition, we acknowledge the NASA Global Modeling and Assimilation Office (GMAO) for providing the MERRA-2 reanalysis data.
This work was supported by the Natural Science Foundation of Jiangsu Province (grant no. BZ2024060).
This paper was edited by Alexander Kokhanovsky and reviewed by two anonymous referees.
Abramowitz, M. and Stegun, I. A. (Eds.): Handbook of Mathematical Functions, Dover Publications, New York, ISBN 978-0-486-61272-0, 1965.
Ahn, C., Torres, O., and Bhartia, P. K.: Comparison of Ozone Monitoring Instrument UV Aerosol Products with Aqua/Moderate Resolution Imaging Spectroradiometer and Multiangle Imaging Spectroradiometer observations in 2006, J. Geophys. Res.-Atmos., 113, 2007JD008832, https://doi.org/10.1029/2007JD008832, 2008.
Aouizerats, B., Thouron, O., Tulet, P., Mallet, M., Gomes, L., and Henzing, J. S.: Development of an online radiative module for the computation of aerosol optical properties in 3-D atmospheric models: validation during the EUCAARI campaign, Geosci. Model Dev., 3, 553–564, https://doi.org/10.5194/gmd-3-553-2010, 2010.
Bergstrom, R. W., Pilewskie, P., Russell, P. B., Redemann, J., Bond, T. C., Quinn, P. K., and Sierau, B.: Spectral absorption properties of atmospheric aerosols, Atmos. Chem. Phys., 7, 5937–5943, https://doi.org/10.5194/acp-7-5937-2007, 2007.
Bigi, A., Veratti, G., Andrews, E., Collaud Coen, M., Guerrieri, L., Bernardoni, V., Massabò, D., Ferrero, L., Teggi, S., and Ghermandi, G.: Aerosol absorption using in situ filter-based photometers and ground-based sun photometry in the Po Valley urban atmosphere, Atmos. Chem. Phys., 23, 14841–14869, https://doi.org/10.5194/acp-23-14841-2023, 2023.
Bohren, C. F. and Huffman, D. R.: Absorption and Scattering of Light by Small Particles, 1st edn., Wiley, https://doi.org/10.1002/9783527618156, 1998.
Bond, T. C. and Bergstrom, R. W.: Light Absorption by Carbonaceous Particles: An Investigative Review, Aerosol Sci. Technol., 40, 27–67, https://doi.org/10.1080/02786820500421521, 2006.
Bond, T. C., Doherty, S. J., Fahey, D. W., Forster, P. M., Berntsen, T., DeAngelo, B. J., Flanner, M. G., Ghan, S., Kärcher, B., Koch, D., Kinne, S., Kondo, Y., Quinn, P. K., Sarofim, M. C., Schultz, M. G., Schulz, M., Venkataraman, C., Zhang, H., Zhang, S., Bellouin, N., Guttikunda, S. K., Hopke, P. K., Jacobson, M. Z., Kaiser, J. W., Klimont, Z., Lohmann, U., Schwarz, J. P., Shindell, D., Storelvmo, T., Warren, S. G., and Zender, C. S.: Bounding the role of black carbon in the climate system: A scientific assessment, J. Geophys. Res.-Atmos., 118, 5380–5552, https://doi.org/10.1002/jgrd.50171, 2013.
Bousserez, N., Guerrette, J. J., and Henze, D. K.: Enhanced parallelization of the incremental 4D-Var data assimilation algorithm using the Randomized Incremental Optimal Technique, Q. J. R. Meteorol. Soc., 146, 1351–1371, https://doi.org/10.1002/qj.3740, 2020.
Buchard, V., Randles, C. A., Da Silva, A. M., Darmenov, A., Colarco, P. R., Govindaraju, R., Ferrare, R., Hair, J., Beyersdorf, A. J., Ziemba, L. D., and Yu, H.: The MERRA-2 Aerosol Reanalysis, 1980 Onward. Part II: Evaluation and Case Studies, J. Clim., 30, 6851–6872, https://doi.org/10.1175/JCLI-D-16-0613.1, 2017.
Cappa, C. D., Onasch, T. B., Massoli, P., Worsnop, D. R., Bates, T. S., Cross, E. S., Davidovits, P., Hakala, J., Hayden, K. L., Jobson, B. T., Kolesar, K. R., Lack, D. A., Lerner, B. M., Li, S.-M., Mellon, D., Nuaaman, I., Olfert, J. S., Petäjä, T., Quinn, P. K., Song, C., Subramanian, R., Williams, E. J., and Zaveri, R. A.: Radiative Absorption Enhancements Due to the Mixing State of Atmospheric Black Carbon, Science, 337, 1078–1081, https://doi.org/10.1126/science.1223447, 2012.
Cassee, F. R., Héroux, M.-E., Gerlofs-Nijland, M. E., and Kelly, F. J.: Particulate matter beyond mass: recent health evidence on the role of fractions, chemical constituents and sources of emission, Inhal. Toxicol., 25, 802–812, https://doi.org/10.3109/08958378.2013.850127, 2013.
Chakraborty, S., Devnath, M. K., Jabeli, A., Kulkarni, C., Boteju, G., Wang, J., and Janeja, V. P.: Impact of increased anthropogenic Amazon wildfires on Antarctic Sea ice melt via albedo reduction, Environ. Data Sci., 4, e18, https://doi.org/10.1017/eds.2025.1, 2025.
Chathurangika, N. P. M., Haque, Md. M., Nyasulu, M., Khan, R., Ahmmad, N., Sheikh, M. A. A., Hossain, M. L., and Rahman, A. K. M. L.: Long-term trends in aerosol optical properties and their relationship with cloud properties over southern India and Sri Lanka, Intl. Journal of Climatology, 42, 9051–9071, https://doi.org/10.1002/joc.7799, 2022.
Chen, B., Andersson, A., Lee, M., Kirillova, E. N., Xiao, Q., Kruså, M., Shi, M., Hu, K., Lu, Z., Streets, D. G., Du, K., and Gustafsson, Ö.: Source Forensics of Black Carbon Aerosols from China, Environ. Sci. Technol., 47, 9102–9108, https://doi.org/10.1021/es401599r, 2013.
Chen, C., Dubovik, O., Schuster, G. L., Chin, M., Henze, D. K., Lapyonok, T., Li, Z., Derimian, Y., and Zhang, Y.: Multi-angular polarimetric remote sensing to pinpoint global aerosol absorption and direct radiative forcing, Nat. Commun., 13, 7459, https://doi.org/10.1038/s41467-022-35147-y, 2022.
Chen, Y. and Prinn, R. G.: Estimation of atmospheric methane emissions between 1996 and 2001 using a three-dimensional global chemical transport model, J. Geophys. Res.-Atmos., 111, 2005JD006058, https://doi.org/10.1029/2005JD006058, 2006.
Chung, C. E., Lee, K., and Müller, D.: Effect of internal mixture on black carbon radiative forcing, Tellus B: Chemical and Physical Meteorology, 64, 10925, https://doi.org/10.3402/tellusb.v64i0.10925, 2012.
Cohen, J. B.: Quantifying the occurrence and magnitude of the Southeast Asian fire climatology, Environ. Res. Lett., 9, 114018, https://doi.org/10.1088/1748-9326/9/11/114018, 2014.
Cohen, J. B. and Wang, C.: Estimating global black carbon emissions using a top-down Kalman Filter approach, J. Geophys. Res.-Atmos., 119, 307–323, https://doi.org/10.1002/2013JD019912, 2014.
Cohen, J. B., Prinn, R. G., and Wang, C.: The impact of detailed urban-scale processing on the composition, distribution, and radiative forcing of anthropogenic aerosols: the impact of detailed urban-scale processing, Geophys. Res. Lett., 38, https://doi.org/10.1029/2011GL047417, 2011.
Diner, D. J., Beckert, J. C., Reilly, T. H., Bruegge, C. J., Conel, J. E., Kahn, R. A., Martonchik, J. V., Ackerman, T. P., Davies, R., Gerstl, S. A. W., Gordon, H. R., Muller, J., Myneni, R. B., Sellers, P. J., Pinty, B., and Verstraete, M. M.: Multi-angle Imaging SpectroRadiometer (MISR) instrument description and experiment overview, IEEE Trans. Geosci. Remote Sensing, 36, 1072–1087, https://doi.org/10.1109/36.700992, 1998.
Ding, A. J., Huang, X., Nie, W., Sun, J. N., Kerminen, V.-M., Petäjä, T., Su, H., Cheng, Y. F., Yang, X.-Q., Wang, M. H., Chi, X. G., Wang, J. P., Virkkula, A., Guo, W. D., Yuan, J., Wang, S. Y., Zhang, R. J., Wu, Y. F., Song, Y., Zhu, T., Zilitinkevich, S., Kulmala, M., and Fu, C. B.: Enhanced haze pollution by black carbon in megacities in China, Geophys. Res. Lett., 43, 2873–2879, https://doi.org/10.1002/2016GL067745, 2016.
Dubovik, O., Smirnov, A., Holben, B. N., King, M. D., Kaufman, Y. J., Eck, T. F., and Slutsker, I.: Accuracy assessments of aerosol optical properties retrieved from Aerosol Robotic Network (AERONET) Sun and sky radiance measurements, J. Geophys. Res.-Atmos., 105, 9791–9806, https://doi.org/10.1029/2000JD900040, 2000.
Eck, T. F., Holben, B. N., Ward, D. E., Dubovik, O., Reid, J. S., Smirnov, A., Mukelabai, M. M., Hsu, N. C., O'Neill, N. T., and Slutsker, I.: Characterization of the optical properties of biomass burning aerosols in Zambia during the 1997 ZIBBEE field campaign, J. Geophys. Res.-Atmos., 106, 3425–3448, https://doi.org/10.1029/2000JD900555, 2001.
Everett, J. T., Newton, E. N., and Odum, M. M.: A Review of Progress in Constraining Global Black Carbon Climate Effects, Earth Syst. Environ., 6, 771–785, https://doi.org/10.1007/s41748-022-00313-1, 2022.
Freire, J. L. M., Longo, K. M., Freitas, S. R., Coelho, C. A. S., Molod, A. M., Marshak, J., Da Silva, A., and Ribeiro, B. Z.: To What Extent Biomass Burning Aerosols Impact South America Seasonal Climate Predictions?, Geophys. Res. Lett., 47, e2020GL088096, https://doi.org/10.1029/2020GL088096, 2020.
Garay, M. J., Kalashnikova, O. V., and Bull, M. A.: Development and assessment of a higher-spatial-resolution (4.4 km) MISR aerosol optical depth product using AERONET-DRAGON data, Atmos. Chem. Phys., 17, 5095–5106, https://doi.org/10.5194/acp-17-5095-2017, 2017.
Garay, M. J., Witek, M. L., Kahn, R. A., Seidel, F. C., Limbacher, J. A., Bull, M. A., Diner, D. J., Hansen, E. G., Kalashnikova, O. V., Lee, H., Nastan, A. M., and Yu, Y.: Introducing the 4.4 km spatial resolution Multi-Angle Imaging SpectroRadiometer (MISR) aerosol product, Atmos. Meas. Tech., 13, 593–628, https://doi.org/10.5194/amt-13-593-2020, 2020.
Giles, D. M., Sinyuk, A., Sorokin, M. G., Schafer, J. S., Smirnov, A., Slutsker, I., Eck, T. F., Holben, B. N., Lewis, J. R., Campbell, J. R., Welton, E. J., Korkin, S. V., and Lyapustin, A. I.: Advancements in the Aerosol Robotic Network (AERONET) Version 3 database – automated near-real-time quality control algorithm with improved cloud screening for Sun photometer aerosol optical depth (AOD) measurements, Atmos. Meas. Tech., 12, 169–209, https://doi.org/10.5194/amt-12-169-2019, 2019.
Guo, J., Li, Y., Cohen, J. B., Li, J., Chen, D., Xu, H., Liu, L., Yin, J., Hu, K., and Zhai, P.: Shift in the Temporal Trend of Boundary Layer Height in China Using Long-Term (1979–2016) Radiosonde Data, Geophys. Res. Lett., 46, 6080–6089, https://doi.org/10.1029/2019GL082666, 2019.
Hansen, J., Sato, M., Ruedy, R., Kharecha, P., Lacis, A., Miller, R., Nazarenko, L., Lo, K., Schmidt, G. A., Russell, G., Aleinov, I., Bauer, S., Baum, E., Cairns, B., Canuto, V., Chandler, M., Cheng, Y., Cohen, A., Del Genio, A., Faluvegi, G., Fleming, E., Friend, A., Hall, T., Jackman, C., Jonas, J., Kelley, M., Kiang, N. Y., Koch, D., Labow, G., Lerner, J., Menon, S., Novakov, T., Oinas, V., Perlwitz, Ja., Perlwitz, Ju., Rind, D., Romanou, A., Schmunk, R., Shindell, D., Stone, P., Sun, S., Streets, D., Tausnev, N., Thresher, D., Unger, N., Yao, M., and Zhang, S.: Climate simulations for 1880–2003 with GISS modelE, Clim. Dyn., 29, 661–696, https://doi.org/10.1007/s00382-007-0255-8, 2007.
He, C., Liou, K.-N., Takano, Y., Zhang, R., Levy Zamora, M., Yang, P., Li, Q., and Leung, L. R.: Variation of the radiative properties during black carbon aging: theoretical and experimental intercomparison, Atmos. Chem. Phys., 15, 11967–11980, https://doi.org/10.5194/acp-15-11967-2015, 2015.
Helin, A., Virkkula, A., Backman, J., Pirjola, L., Sippula, O., Aakko-Saksa, P., Väätäinen, S., Mylläri, F., Järvinen, A., Bloss, M., Aurela, M., Jakobi, G., Karjalainen, P., Zimmermann, R., Jokiniemi, J., Saarikoski, S., Tissari, J., Rönkkö, T., Niemi, J. V., and Timonen, H.: Variation of Absorption Ångström Exponent in Aerosols From Different Emission Sources, J. Geophys. Res.-Atmos., 126, e2020JD034094, https://doi.org/10.1029/2020JD034094, 2021.
Hodnebrog, Ø., Myhre, G., and Samset, B. H.: How shorter black carbon lifetime alters its climate effect, Nat. Commun., 5, 5065, https://doi.org/10.1038/ncomms6065, 2014.
Huang, K.-T., Sui, C.-H., Lo, M.-H., Kuo, Y.-Y., and Chang, C.-W. J.: Effects of anthropogenic aerosols on the evolution of Indian summer monsoon, Terr. Atmos. Ocean. Sci., 34, 10, https://doi.org/10.1007/s44195-023-00041-7, 2023.
Jacobson, M. Z.: Strong radiative heating due to the mixing state of black carbon in atmospheric aerosols, Nature, 409, 695–697, https://doi.org/10.1038/35055518, 2001.
Jaganathan, S., Rajiva, A., Amini, H., De Bont, J., Dixit, S., Dutta, A., Kloog, I., Lane, K. J., Menon, J. S., Nori-Sarma, A., Prabhakaran, D., Schwartz, J., Sharma, P., Stafoggia, M., Walia, G. K., Wellenius, G. A., Prabhakaran, P., Ljungman, P., and Mandal, S.: Nationwide analysis of air pollution hotspots across India: A spatiotemporal PM2.5 trend analysis (2008–2019), Environ. Res., 264, 120276, https://doi.org/10.1016/j.envres.2024.120276, 2025.
Junghenn Noyes, K. T., Kahn, R. A., Limbacher, J. A., Li, Z., Fenn, M. A., Giles, D. M., Hair, J. W., Katich, J. M., Moore, R. H., Robinson, C. E., Sanchez, K. J., Shingler, T. J., Thornhill, K. L., Wiggins, E. B., and Winstead, E. L.: Wildfire Smoke Particle Properties and Evolution, From Space-Based Multi-Angle Imaging II: The Williams Flats Fire during the FIREX-AQ Campaign, Remote Sens., 12, 3823, https://doi.org/10.3390/rs12223823, 2020.
Kahn, R. A., Gaitley, B. J., Garay, M. J., Diner, D. J., Eck, T. F., Smirnov, A., and Holben, B. N.: Multiangle Imaging SpectroRadiometer global aerosol product assessment by comparison with the Aerosol Robotic Network, J. Geophys. Res.-Atmos., 115, 2010JD014601, https://doi.org/10.1029/2010JD014601, 2010.
Kahnert, M., Nousiainen, T., and Räisänen, P.: Mie simulations as an error source in mineral aerosol radiative forcing calculations, Q. J. R. Meteorol. Soc., 133, 299–307, https://doi.org/10.1002/qj.40, 2007.
Kalashnikova, O. V. and Kahn, R.: Ability of multiangle remote sensing observations to identify and distinguish mineral dust types: 2. Sensitivity over dark water, J. Geophys. Res.-Atmos., 111, 2005JD006756, https://doi.org/10.1029/2005JD006756, 2006.
Kalashnikova, O. V. and Kahn, R. A.: Mineral dust plume evolution over the Atlantic from MISR and MODIS aerosol retrievals, J. Geophys. Res.-Atmos., 113, 2008JD010083, https://doi.org/10.1029/2008JD010083, 2008.
Kalashnikova, O. V., Garay, M. J., Martonchik, J. V., and Diner, D. J.: MISR Dark Water aerosol retrievals: operational algorithm sensitivity to particle non-sphericity, Atmos. Meas. Tech., 6, 2131–2154, https://doi.org/10.5194/amt-6-2131-2013, 2013.
Kawano, A., Kelp, M., Qiu, M., Singh, K., Chaturvedi, E., Dahiya, S., Azevedo, I., and Burke, M.: Improved daily PM2.5 estimates in India reveal inequalities in recent enhancement of air quality, Sci. Adv., 11, eadq1071, https://doi.org/10.1126/sciadv.adq1071, 2025.
Kelesidis, G. A., Neubauer, D., Fan, L.-S., Lohmann, U., and Pratsinis, S. E.: Enhanced Light Absorption and Radiative Forcing by Black Carbon Agglomerates, Environ. Sci. Technol., 56, 8610–8618, https://doi.org/10.1021/acs.est.2c00428, 2022.
Kim, D., Wang, C., Ekman, A. M. L., Barth, M. C., and Rasch, P. J.: Distribution and direct radiative forcing of carbonaceous and sulfate aerosols in an interactive size-resolving aerosol–climate model, J. Geophys. Res.-Atmos., 113, 2007JD009756, https://doi.org/10.1029/2007JD009756, 2008.
Krol, M. C., Hooghiemstra, P. B., Van Leeuwen, T. T., Van Der Werf, G. R., Novelli, P. C., Deeter, M. N., Aben, I., and Röckmann, T.: Correction to “Interannual variability of carbon monoxide emission estimates over South America from 2006 to 2010”, J. Geophys. Res.-Atmos., 118, 5061–5064, https://doi.org/10.1002/jgrd.50389, 2013.
Kumar, P., Beig, G., Singh, V., Sahu, S. K., Siingh, D., and Bamniya, B. R.: Model simulation of carbonaceous fine particulate matter using SAFAR emission inventory and comparison with EDGAR-HTAP simulations, Atmos. Environ., 315, 120147, https://doi.org/10.1016/j.atmosenv.2023.120147, 2023.
Kunjir, G. M., Tikle, S., Das, S., Karim, M., Roy, S. K., and Chatterjee, U.: Assessing particulate matter (PM2.5) concentrations and variability across Maharashtra using satellite data and machine learning techniques, Discov. Sustain., 6, 238, https://doi.org/10.1007/s43621-025-01082-3, 2025.
Ladutenko, K., Pal, U., Rivera, A., and Peña-Rodríguez, O.: Mie calculation of electromagnetic near-field for a multilayered sphere, Comput. Phys. Commun., 214, 225–230, https://doi.org/10.1016/j.cpc.2017.01.017, 2017.
Lee, H., Kalashnikova, O. V., Suzuki, K., Braverman, A., Garay, M. J., and Kahn, R. A.: Climatology of the aerosol optical depth by components from the Multi-angle Imaging SpectroRadiometer (MISR) and chemistry transport models, Atmos. Chem. Phys., 16, 6627–6640, https://doi.org/10.5194/acp-16-6627-2016, 2016a.
Lee, J., Yun, J., and Kim, K. J.: Monitoring of black carbon concentration at an inland rural area including fixed sources in Korea, Chemosphere, 143, 3–9, https://doi.org/10.1016/j.chemosphere.2015.04.003, 2016b.
Li, B., Gasser, T., Ciais, P., Piao, S., Tao, S., Balkanski, Y., Hauglustaine, D., Boisier, J.-P., Chen, Z., Huang, M., Li, L. Z., Li, Y., Liu, H., Liu, J., Peng, S., Shen, Z., Sun, Z., Wang, R., Wang, T., Yin, G., Yin, Y., Zeng, H., Zeng, Z., and Zhou, F.: The contribution of China's emissions to global climate forcing, Nature, 531, 357–361, https://doi.org/10.1038/nature17165, 2016.
Li, J., Carlson, B. E., Yung, Y. L., Lv, D., Hansen, J., Penner, J. E., Liao, H., Ramaswamy, V., Kahn, R. A., Zhang, P., Dubovik, O., Ding, A., Lacis, A. A., Zhang, L., and Dong, Y.: Scattering and absorbing aerosols in the climate system, Nat. Rev. Earth Environ., 3, 363–379, https://doi.org/10.1038/s43017-022-00296-7, 2022a.
Li, L., Dubovik, O., Derimian, Y., Schuster, G. L., Lapyonok, T., Litvinov, P., Ducos, F., Fuertes, D., Chen, C., Li, Z., Lopatin, A., Torres, B., and Che, H.: Retrieval of aerosol components directly from satellite and ground-based measurements, Atmos. Chem. Phys., 19, 13409–13443, https://doi.org/10.5194/acp-19-13409-2019, 2019.
Li, L., Che, H., Derimian, Y., Dubovik, O., Schuster, G. L., Chen, C., Li, Q., Wang, Y., Guo, B., and Zhang, X.: Retrievals of fine mode light-absorbing carbonaceous aerosols from POLDER/PARASOL observations over East and South Asia, Remote Sens. Environ., 247, 111913, https://doi.org/10.1016/j.rse.2020.111913, 2020.
Li, L., Derimian, Y., Chen, C., Zhang, X., Che, H., Schuster, G. L., Fuertes, D., Litvinov, P., Lapyonok, T., Lopatin, A., Matar, C., Ducos, F., Karol, Y., Torres, B., Gui, K., Zheng, Y., Liang, Y., Lei, Y., Zhu, J., Zhang, L., Zhong, J., Zhang, X., and Dubovik, O.: Climatology of aerosol component concentrations derived from multi-angular polarimetric POLDER-3 observations using GRASP algorithm, Earth Syst. Sci. Data, 14, 3439–3469, https://doi.org/10.5194/essd-14-3439-2022, 2022b.
Li, L., Che, H., Su, X., Zhang, X., Gui, K., Zheng, Y., Zhao, H., Zhao, H., Liang, Y., Lei, Y., Zhang, L., Zhong, J., Wang, Z., and Zhang, X.: Quantitative Evaluation of Dust and Black Carbon Column Concentration in the MERRA-2 Reanalysis Dataset Using Satellite-Based Component Retrievals, Remote Sens., 15, 388, https://doi.org/10.3390/rs15020388, 2023.
Li, M., Zhang, Q., Kurokawa, J.-I., Woo, J.-H., He, K., Lu, Z., Ohara, T., Song, Y., Streets, D. G., Carmichael, G. R., Cheng, Y., Hong, C., Huo, H., Jiang, X., Kang, S., Liu, F., Su, H., and Zheng, B.: MIX: a mosaic Asian anthropogenic emission inventory under the international collaboration framework of the MICS-Asia and HTAP, Atmos. Chem. Phys., 17, 935–963, https://doi.org/10.5194/acp-17-935-2017, 2017.
Li, X., Cohen, J. B., Tiwari, P., Wu, L., Wang, S., He, Q., Yang, H., and Qin, K.: Space-based inversion reveals underestimated carbon monoxide emissions over Shanxi, Commun. Earth Environ., 6, 357, https://doi.org/10.1038/s43247-025-02301-5, 2025.
Limbacher, J. A., Kahn, R. A., and Lee, J.: The new MISR research aerosol retrieval algorithm: a multi-angle, multi-spectral, bounded-variable least squares retrieval of aerosol particle properties over both land and water, Atmos. Meas. Tech., 15, 6865–6887, https://doi.org/10.5194/amt-15-6865-2022, 2022.
Lin, C., Cohen, J. B., Wang, S., Lan, R., and Deng, W.: A new perspective on the spatial, temporal, and vertical distribution of biomass burning: quantifying a significant increase in CO emissions, Environ. Res. Lett., 15, 104091, https://doi.org/10.1088/1748-9326/abaa7a, 2020a.
Lin, C., Cohen, J. B., Wang, S., and Lan, R.: Application of a combined standard deviation and mean based approach to MOPITT CO column data, and resulting improved representation of biomass burning and urban air pollution sources, Remote Sensing of Environment, 241, 111720, https://doi.org/10.1016/j.rse.2020.111720, 2020b.
Liu, J., Cohen, J. B., Tiwari, P., Liu, Z., Yim, S. H.-L., Gupta, P., and Qin, K.: New top-down estimation of daily mass and number column density of black carbon driven by OMI and AERONET observations, Remote Sensing of Environment, 315, 114436, https://doi.org/10.1016/j.rse.2024.114436, 2024a.
Liu, Z., Cohen, J. B., Wang, S., Wang, X., Tiwari, P., and Qin, K.: Remotely sensed BC columns over rapidly changing Western China show significant decreases in mass and inconsistent changes in number, size, and mixing properties due to policy actions, npj Clim. Atmos. Sci., 7, 124, https://doi.org/10.1038/s41612-024-00663-9, 2024b.
Liu, Z., Cohen, J. B., Tiwari, P., Guan, L., Wang, S., Li, Z., and Qin, K.: Data from “A Global Black Carbon Dataset of Column Concentration and Microphysical Information Derived from MISR Muti-band Observations and Mie Scattering Simulations” (2004.10.1–2020.12.31), FigShare [data set], https://doi.org/10.6084/m9.figshare.30173917, 2026.
Lu, L., Cohen, J. B., Qin, K., Li, X., and He, Q.: Identifying missing sources and reducing NOx emissions uncertainty over China using daily satellite data and a mass-conserving method, Atmos. Chem. Phys., 25, 2291–2309, https://doi.org/10.5194/acp-25-2291-2025, 2025.
Lund, M. T., Berntsen, T. K., and Samset, B. H.: Sensitivity of black carbon concentrations and climate impact to aging and scavenging in OsloCTM2–M7, Atmos. Chem. Phys., 17, 6003–6022, https://doi.org/10.5194/acp-17-6003-2017, 2017.
Lund, M. T., Samset, B. H., Skeie, R. B., Watson-Parris, D., Katich, J. M., Schwarz, J. P., and Weinzierl, B.: Short Black Carbon lifetime inferred from a global set of aircraft observations, npj Clim. Atmos. Sci., 1, 31, https://doi.org/10.1038/s41612-018-0040-x, 2018.
Luo, B., Zhang, Y., Tang, T., Zhang, H., Hu, J., Mu, J., Wang, W., and Xue, L.: Spatial–temporal patterns in anthropogenic and biomass burning emission contributions to air pollution and mortality burden changes in India from 1995 to 2014, Atmos. Chem. Phys., 25, 4767–4783, https://doi.org/10.5194/acp-25-4767-2025, 2025.
Ma, Y., Ye, J., Xin, J., Zhang, W., Vilà-Guerau De Arellano, J., Wang, S., Zhao, D., Dai, L., Ma, Y., Wu, X., Xia, X., Tang, G., Wang, Y., Shen, P., Lei, Y., and Martin, S. T.: The Stove, Dome, and Umbrella Effects of Atmospheric Aerosol on the Development of the Planetary Boundary Layer in Hazy Regions, Geophys. Res. Lett., 47, e2020GL087373, https://doi.org/10.1029/2020GL087373, 2020.
Mallet, M., Solmon, F., Roblou, L., Peers, F., Turquety, S., Waquet, F., Jethva, H., and Torres, O.: Simulation of Optical Properties and Direct and Indirect Radiative Effects of Smoke Aerosols Over Marine Stratocumulus Clouds During Summer 2008 in California With the Regional Climate Model RegCM, J. Geophys. Res.-Atmos., 122, https://doi.org/10.1002/2017JD026905, 2017.
Mann, G. W., Carslaw, K. S., Spracklen, D. V., Ridley, D. A., Manktelow, P. T., Chipperfield, M. P., Pickering, S. J., and Johnson, C. E.: Description and evaluation of GLOMAP-mode: a modal global aerosol microphysics model for the UKCA composition-climate model, Geosci. Model Dev., 3, 519–551, https://doi.org/10.5194/gmd-3-519-2010, 2010.
Martonchik, J. V., Diner, D. J., Kahn, R., Gaitley, B., and Holben, B. N.: Comparison of MISR and AERONET aerosol optical depths over desert sites, Geophys. Res. Lett., 31, 2004GL019807, https://doi.org/10.1029/2004GL019807, 2004.
Mie, G.: Beiträge zur Optik trüber Medien, speziell kolloidaler Metallösungen, Ann. Phys.-Berlin, 330, 377–445, https://doi.org/10.1002/andp.19083300302, 1908.
Mylläri, F., Pirjola, L., Lihavainen, H., Asmi, E., Saukko, E., Laurila, T., Vakkari, V., O'Connor, E., Rautiainen, J., Häyrinen, A., Niemelä, V., Maunula, J., Hillamo, R., Keskinen, J., and Rönkkö, T.: Characteristics of particle emissions and their atmospheric dilution during co-combustion of coal and wood pellets in a large combined heat and power plant, J. Air Waste Manage. Assoc., 69, 97–108, https://doi.org/10.1080/10962247.2018.1521349, 2019.
NASA/LARC/SD/ASDC: MISR Level 3 Component Global Aerosol product in netCDF format covering a day V004, ASDC [data set], https://doi.org/10.5067/Terra/MISR/MIL3DAEN_L3.004, 2008.
Qin, W., Zhang, Y., Chen, J., Yu, Q., Cheng, S., Li, W., Liu, X., and Tian, H.: Variation, sources and historical trend of black carbon in Beijing, China based on ground observation and MERRA-2 reanalysis data, Environ. Pollut., 245, 853–863, https://doi.org/10.1016/j.envpol.2018.11.063, 2019.
Ramachandran, S., Rupakheti, M., Cherian, R., and Lawrence, M. G.: Aerosols heat up the Himalayan climate, Sci. Total Environ., 894, 164733, https://doi.org/10.1016/j.scitotenv.2023.164733, 2023.
Ramachandran, S., Ansari, K., and Cherian, R.: Air Pollution to Atmospheric Warming: Effects of Increasing Anthropogenic Aerosols on South Asia's Climate, Earth Syst. Environ., https://doi.org/10.1007/s41748-025-00732-w, 2025.
Ramanathan, V. and Carmichael, G.: Global and regional climate changes due to black carbon, Nat. Geosci., 1, 221–227, https://doi.org/10.1038/ngeo156, 2008.
Randles, C. A., Da Silva, A. M., Buchard, V., Colarco, P. R., Darmenov, A., Govindaraju, R., Smirnov, A., Holben, B., Ferrare, R., Hair, J., Shinozuka, Y., and Flynn, C. J.: The MERRA-2 Aerosol Reanalysis, 1980 Onward. Part I: System Description and Data Assimilation Evaluation, J. Clim., 30, 6823–6850, https://doi.org/10.1175/JCLI-D-16-0609.1, 2017.
Ren, Y., Oxford, C. R., Zhang, D., Liu, X., Zhu, H., Dillner, A. M., White, W. H., Chakrabarty, R. K., Hasheminassab, S., Diner, D. J., Le Roy, E. J., Kumar, J., Viteri, V., Song, K., Akoshile, C., Amador-Muñoz, O., Asfaw, A., Chang, R. Y.-W., Francis, D., Gahungu, P., Garland, R. M., Grutter, M., Kim, J., Langerman, K., Lee, P.-C., Lestari, P., Mayol-Bracero, O. L., Naidoo, M., Nelli, N., O'Neill, N., Park, S. S., Salam, A., Sarangi, B., Schechner, Y., Schofield, R., Tripathi, S. N., Windwer, E., Wu, M.-T., Zhang, Q., Rudich, Y., Brauer, M., and Martin, R. V.: Black carbon emissions generally underestimated in the global south as revealed by globally distributed measurements, Nat. Commun., 16, 7010, https://doi.org/10.1038/s41467-025-62468-5, 2025.
Roberts, D. L. and Jones, A.: Climate sensitivity to black carbon aerosol from fossil fuel combustion, J. Geophys. Res.-Atmos., 109, 2004JD004676, https://doi.org/10.1029/2004JD004676, 2004.
Rosenfeld, D., Andreae, M. O., Asmi, A., Chin, M., De Leeuw, G., Donovan, D. P., Kahn, R., Kinne, S., Kivekäs, N., Kulmala, M., Lau, W., Schmidt, K. S., Suni, T., Wagner, T., Wild, M., and Quaas, J.: Global observations of aerosol-cloud-precipitation-climate interactions: Aerosol-cloud-climate interactions, Rev. Geophys., 52, 750–808, https://doi.org/10.1002/2013RG000441, 2014.
Russell, P. B., Bergstrom, R. W., Shinozuka, Y., Clarke, A. D., DeCarlo, P. F., Jimenez, J. L., Livingston, J. M., Redemann, J., Dubovik, O., and Strawa, A.: Absorption Angstrom Exponent in AERONET and related data as an indicator of aerosol composition, Atmos. Chem. Phys., 10, 1155–1169, https://doi.org/10.5194/acp-10-1155-2010, 2010.
Santos, D. M. D., Oliveira, A. M. de, Duarte, E. S. F., Rodrigues, J. A., Menezes, L. S., Albuquerque, R., Roque, F. D. O., Peres, L. F., Hoelzemann, J. J., and Libonati, R.: Compound dry-hot-fire events connecting Central and Southeastern South America: an unapparent and deadly ripple effect, npj Nat. Hazards, 1, 32, https://doi.org/10.1038/s44304-024-00031-w, 2024.
Schuster, G. L., Dubovik, O., Holben, B. N., and Clothiaux, E. E.: Inferring black carbon content and specific absorption from Aerosol Robotic Network (AERONET) aerosol retrievals, J. Geophys. Res.-Atmos., 110, 2004JD004548, https://doi.org/10.1029/2004JD004548, 2005.
Schutgens, N., Dubovik, O., Hasekamp, O., Torres, O., Jethva, H., Leonard, P. J. T., Litvinov, P., Redemann, J., Shinozuka, Y., de Leeuw, G., Kinne, S., Popp, T., Schulz, M., and Stier, P.: AEROCOM and AEROSAT AAOD and SSA study – Part 1: Evaluation and intercomparison of satellite measurements, Atmos. Chem. Phys., 21, 6895–6917, https://doi.org/10.5194/acp-21-6895-2021, 2021.
Schwarz, J. P., Spackman, J. R., Fahey, D. W., Gao, R. S., Lohmann, U., Stier, P., Watts, L. A., Thomson, D. S., Lack, D. A., Pfister, L., Mahoney, M. J., Baumgardner, D., Wilson, J. C., and Reeves, J. M.: Coatings and their enhancement of black carbon light absorption in the tropical atmosphere, J. Geophys. Res.-Atmos., 113, 2007JD009042, https://doi.org/10.1029/2007JD009042, 2008.
Sedlacek, A. J., Lewis, E. R., Onasch, T. B., Zuidema, P., Redemann, J., Jaffe, D., and Kleinman, L. I.: Using the Black Carbon Particle Mixing State to Characterize the Lifecycle of Biomass Burning Aerosols, Environ. Sci. Technol., 56, 14315–14325, https://doi.org/10.1021/acs.est.2c03851, 2022.
Senf, F., Heinold, B., Kubin, A., Müller, J., Schrödner, R., and Tegen, I.: How the extreme 2019–2020 Australian wildfires affected global circulation and adjustments, Atmos. Chem. Phys., 23, 8939–8958, https://doi.org/10.5194/acp-23-8939-2023, 2023.
Shaban, A., Kourtit, K., and Nijkamp, P.: Causality Between Urbanization and Economic Growth: Evidence From the Indian States, Front. Sustain. Cities, 4, 901346, https://doi.org/10.3389/frsc.2022.901346, 2022.
Shanmugam, K. R. and Odasseril, M. K.: India at 100 and the Significance of Top Six States, Indian Public Policy Review, 5, 77–93, https://doi.org/10.55763/ippr.2024.05.03.003, 2024.
Shi, T. and Cressie, N.: Global statistical analysis of MISR aerosol data: a massive data product from NASA's Terra satellite, Environmetrics, 18, 665–680, https://doi.org/10.1002/env.864, 2007.
Si, Y., Chen, L., Xiong, X., Shi, S., Husi, L., and Cai, K.: Evaluation of the MISR fine resolution aerosol product using MODIS, MISR, and ground observations over China, Atmos. Environ., 223, 117229, https://doi.org/10.1016/j.atmosenv.2019.117229, 2020.
Sinyuk, A., Holben, B. N., Eck, T. F., Giles, D. M., Slutsker, I., Korkin, S., Schafer, J. S., Smirnov, A., Sorokin, M., and Lyapustin, A.: The AERONET Version 3 aerosol retrieval algorithm, associated uncertainties and comparisons to Version 2, Atmos. Meas. Tech., 13, 3375–3411, https://doi.org/10.5194/amt-13-3375-2020, 2020.
Song, Z., Fu, D., Zhang, X., Wu, Y., Xia, X., He, J., Han, X., Zhang, R., and Che, H.: Diurnal and seasonal variability of PM2.5 and AOD in North China plain: Comparison of MERRA-2 products and ground measurements, Atmos. Environ., 191, 70–78, https://doi.org/10.1016/j.atmosenv.2018.08.012, 2018.
Szidat, S., Jenk, T. M., Synal, H., Kalberer, M., Wacker, L., Hajdas, I., Kasper-Giebl, A., and Baltensperger, U.: Contributions of fossil fuel, biomass-burning, and biogenic emissions to carbonaceous aerosols in Zurich as traced by 14 C, J. Geophys. Res.-Atmos., 111, 2005JD006590, https://doi.org/10.1029/2005JD006590, 2006.
Tanaka, K., Berntsen, T., Fuglestvedt, J. S., and Rypdal, K.: Climate Effects of Emission Standards: The Case for Gasoline and Diesel Cars, Environ. Sci. Technol., 46, 5205–5213, https://doi.org/10.1021/es204190w, 2012.
Tegtmeier, S., Marandino, C., Jia, Y., Quack, B., and Mahajan, A. S.: Atmospheric gas-phase composition over the Indian Ocean, Atmos. Chem. Phys., 22, 6625–6676, https://doi.org/10.5194/acp-22-6625-2022, 2022.
Thornhill, G. D., Ryder, C. L., Highwood, E. J., Shaffrey, L. C., and Johnson, B. T.: The effect of South American biomass burning aerosol emissions on the regional climate, Atmos. Chem. Phys., 18, 5321–5342, https://doi.org/10.5194/acp-18-5321-2018, 2018.
Tiwari, P., Cohen, J. B., Wang, X., Wang, S., and Qin, K.: Radiative forcing bias calculation based on COSMO (Core-Shell Mie model Optimization) and AERONET data, npj Clim. Atmos. Sci., 6, 193, https://doi.org/10.1038/s41612-023-00520-1, 2023.
Tiwari, P., Cohen, J. B., Lu, L., Wang, S., Li, X., Guan, L., Liu, Z., Li, Z., and Qin, K.: Multi-platform observations and constraints reveal overlooked urban sources of black carbon in Xuzhou and Dhaka, Commun. Earth Environ., 6, 38, https://doi.org/10.1038/s43247-025-02012-x, 2025.
Torres, O., Jethva, H., Ahn, C., Jaross, G., and Loyola, D. G.: TROPOMI aerosol products: evaluation and observations of synoptic-scale carbonaceous aerosol plumes during 2018–2020, Atmos. Meas. Tech., 13, 6789–6806, https://doi.org/10.5194/amt-13-6789-2020, 2020.
Wang, C., An, X., Hou, Q., Sun, Z., Li, Y., and Li, J.: Development of four-dimensional variational assimilation system based on the GRAPES–CUACE adjoint model (GRAPES–CUACE-4D-Var V1.0) and its application in emission inversion, Geosci. Model Dev., 14, 337–350, https://doi.org/10.5194/gmd-14-337-2021, 2021a.
Wang, H., Ding, J., Xu, J., Wen, J., Han, J., Wang, K., Shi, G., Feng, Y., Ivey, C. E., Wang, Y., Nenes, A., Zhao, Q., and Russell, A. G.: Aerosols in an arid environment: The role of aerosol water content, particulate acidity, precursors, and relative humidity on secondary inorganic aerosols, Sci. Total Environ., 646, 564–572, https://doi.org/10.1016/j.scitotenv.2018.07.321, 2019.
Wang, M. and Gordon, H. R.: Estimating aerosol optical properties over the oceans with the multiangle imaging spectroadiometer: some preliminary studies, Appl. Opt., 33, 4042, https://doi.org/10.1364/AO.33.004042, 1994.
Wang, S., Cohen, J. B., Lin, C., and Deng, W.: Constraining the relationships between aerosol height, aerosol optical depth and total column trace gas measurements using remote sensing and models, Atmos. Chem. Phys., 20, 15401–15426, https://doi.org/10.5194/acp-20-15401-2020, 2020.
Wang, S., Wang, X., Cohen, J. B., and Qin, K.: Inferring Polluted Asian Absorbing Aerosol Properties Using Decadal Scale AERONET Measurements and a MIE Model, Geophys. Res. Lett., 48, e2021GL094300, https://doi.org/10.1029/2021GL094300, 2021b.
Wang, S., Cohen, J. B., Deng, W., Qin, K., and Guo, J.: Using a New Top-Down Constrained Emissions Inventory to Attribute the Previously Unknown Source of Extreme Aerosol Loadings Observed Annually in the Monsoon Asia Free Troposphere, Earth Future, 9, e2021EF002167, https://doi.org/10.1029/2021EF002167, 2021c.
Wang, S., Cohen, J. B., Guan, L., Lu, L., Tiwari, P., and Qin, K.: Observationally constrained global NOx and CO emissions variability reveals sources which contribute significantly to CO2 emissions, npj Clim. Atmos. Sci., 8, 87, https://doi.org/10.1038/s41612-025-00977-2, 2025.
Wang, Z., Wang, Q., and Zhang, H.: Equilibrium climate response of the East Asian summer monsoon to forcing of anthropogenic aerosol species, J. Meteorol. Res., 31, 1018–1033, https://doi.org/10.1007/s13351-017-7059-5, 2017.
Wei, L., Lu, Z., Wang, Y., Liu, X., Wang, W., Wu, C., Zhao, X., Rahimi, S., Xia, W., and Jiang, Y.: Black carbon-climate interactions regulate dust burdens over India revealed during COVID-19, Nat. Commun., 13, 1839, https://doi.org/10.1038/s41467-022-29468-1, 2022.
Xie, Y., Li, Z., Li, L., Wagener, R., Abboud, I., Li, K., Li, D., Zhang, Y., Chen, X., and Xu, H.: Aerosol optical, microphysical, chemical and radiative properties of high aerosol load cases over the Arctic based on AERONET measurements, Sci. Rep., 8, 9376, https://doi.org/10.1038/s41598-018-27744-z, 2018.
Xie, Y., Zeng, L., Hu, S., Wang, T., Du, Z., Tan, T., Xu, N., Chen, S., Mao, J., Xu, F., and Hu, M.: Long-term trends of black carbon levels, sources, and radiative effects from 2013 to 2022 in Beijing, China, npj Clean Air, 1, 10, https://doi.org/10.1038/s44407-025-00010-z, 2025.
Yan, G., Yu, H., Li, M., Zheng, X., Li, S., Yao, D., Liu, M., and Hu, P.: Pollution characteristics of black carbon based on MERRA-2 reanalysis data in core city of Central Plains Economic Zone, China: Historical trend and potential sources, Front. Environ. Sci., 10, 1028572, https://doi.org/10.3389/fenvs.2022.1028572, 2022.
Yang, J., Sakhvidi, M. J. Z., De Hoogh, K., Vienneau, D., Siemiatyck, J., Zins, M., Goldberg, M., Chen, J., Lequy, E., and Jacquemin, B.: Long-term exposure to black carbon and mortality: A 28-year follow-up of the GAZEL cohort, Environ. Int., 157, 106805, https://doi.org/10.1016/j.envint.2021.106805, 2021.
Yang, J., Kang, S., Chen, D., Zhao, L., Ji, Z., Duan, K., Deng, H., Tripathee, L., Du, W., Rai, M., Yan, F., Li, Y., and Gillies, R. R.: South Asian black carbon is threatening the water sustainability of the Asian Water Tower, Nat. Commun., 13, 7360, https://doi.org/10.1038/s41467-022-35128-1, 2022.
Yu, H., Li, M., Zheng, X., Zhu, M., Zheng, Z., Xie, T., Yan, G., Hu, P., Cao, Z., Feng, J., and Sun, J.: Potential source and health risks of black carbon based on MERRA-2 reanalysis data in a typical industrial city of North China Plain, J. Environ. Manage., 354, 120367, https://doi.org/10.1016/j.jenvman.2024.120367, 2024.
Zhang, Z., Li, J., Che, H., Dong, Y., Dubovik, O., Eck, T., Gupta, P., Holben, B., Kim, J., Lind, E., Saud, T., Tripathi, S. N., and Ying, T.: Long-term trends in aerosol properties derived from AERONET measurements, Atmos. Chem. Phys., 25, 4617–4637, https://doi.org/10.5194/acp-25-4617-2025, 2025.
Zhao, C. and Garrett, T. J.: Effects of Arctic haze on surface cloud radiative forcing, Geophys. Res. Lett., 42, 557–564, https://doi.org/10.1002/2014GL062015, 2015.
Zhao, C., Yang, Y., Chi, Y., Sun, Y., Zhao, X., Letu, H., and Xia, Y.: Recent progress in cloud physics and associated radiative effects in China from 2016 to 2022, Atmos. Res., 293, 106899, https://doi.org/10.1016/j.atmosres.2023.106899, 2023.
Zhao, M., Dai, T., Goto, D., Wang, H., and Shi, G.: Assessing the assimilation of Himawari-8 observations on aerosol forecasts and radiative effects during pollution transport from South Asia to the Tibetan Plateau, Atmos. Chem. Phys., 24, 235–258, https://doi.org/10.5194/acp-24-235-2024, 2024.