the Creative Commons Attribution 4.0 License.
the Creative Commons Attribution 4.0 License.
 | 26 May 2026
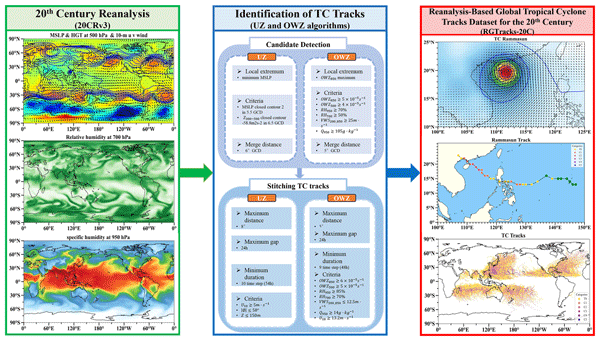
A Reanalysis-Based Global Tropical Cyclone Tracks Dataset for the Twentieth Century (RGTracks-20C)
Guiling Ye
Jeremy Cheuk-Hin Leung
Wenjie Dong
Ralf Toumi
Jianjun Xu
Weijing Li
Weihong Qian
Hoiio Kong
Banglin Zhang
Tropical cyclones (TCs) are among the deadliest disasters affecting human society, reconstructing their historical activity has become increasingly important. However, a comprehensive understanding of historical TC activity is challenging due to incomplete TC records in the early years. Here, we introduce the Reanalysis-Based Global Tropical Cyclone Tracks Dataset for the Twentieth Century (RGTracks-20C) (https://doi.org/10.5281/zenodo.14411917, Ye et al., 2024a), a publicly available century-long global TC track dataset spanning from 1850–2014. The first version of RGTracks-20C is reconstructed from the National Oceanic and Atmospheric Administration Twentieth Century Reanalysis (20CRv3) primarily using the Okubo–Weiss–Zeta (OWZ) tracker. RGTracks-20C provides a reasonable representation of TC climatology and interannual variability across the global ocean and most major basins during the satellite era. Case studies further highlight its value in providing supplementary track and intensity information for earlier periods when the historical record is sparse or incomplete. RGTracks-20C therefore offers a useful resource for augmenting the historical TC record prior to the satellite era.
- Article
(6541 KB) - Full-text XML
-
Supplement
(2724 KB) - BibTeX
- EndNote


Tropical cyclones (TCs), also known as hurricanes or typhoons, are intense weather systems that form over tropical and subtropical oceans and can cause severe disasters over the coastal regions and even inland areas (Qin et al., 2024; Zhu and Quiring, 2022). Globally, approximately 80 TCs are generated each year (Emanuel, 2018). As one of the most destructive weather systems (Bloemendaal et al., 2022; Dinan, 2017; Emanuel, 2017), TCs significantly impact society and the economy (Kunze, 2021; Lenzen et al., 2019; Noy, 2016). These impacts are expected to be exacerbated by climate change in the future (Chan, 2023; Hassanzadeh et al., 2020; Knutson et al., 2020; Moon et al., 2023; Murakami and Wang, 2022; Sparks and Toumi, 2025; Yamaguchi et al., 2020). Therefore, research on TCs has become increasingly vital in climate change and prediction (Bhatia et al., 2019; Chan, 2019; Lanzante, 2019; Moon et al., 2019; Sharmila and Walsh, 2018; Zhang et al., 2019). However, past TC activity and underlying mechanisms remain challenging due to incomplete early historical TC observation records, which may lead to controversies (Chan et al., 2022a, b; Knutson et al., 2019; Lee et al., 2020).
Previous research has revealed significant issues related to the completeness of historical TC observational data (Lee et al., 2020), which are highly dependent on the development of the global TC observation system, data analysis techniques, and other factors (Klotzbach and Landsea, 2015; Knapp et al., 2010; Kossin et al., 2020; Landsea et al., 2010; Mann et al., 2007; Ying et al., 2014). Before the introduction of satellite observation, TC information (e.g., intensity and location) primarily relied on conventional coastal weather stations and ship observation reports (Landsea et al., 2006, 2008). Aircraft reconnaissance emerged in the North Atlantic (NATL) and western North Pacific (WNP) after World War II (Emanuel, 2008). However, these observational techniques could not capture all occurred TCs due to their limited observation range. It is possible that an existing TC was unrecorded in the early years. In addition, even if a TC was observed and recorded, its track and intensity information may be discontinuous due to the absence of meteorological satellite observations. For instance, there were no observational records of TC wind speeds in the southern hemisphere before 1956 (Emanuel, 2021). Storm intensity in the Indian Ocean is weaker compared to other basins, partly due to the lack of direct coverage by geostationary satellites in that region before 1998 (Schreck et al., 2014). The incomplete observed data of TCs in the early years, mainly before the 1970s, is a commonly known unsolved issue in the community.
Given the limitations of historical TC records, a promising approach is to utilize reanalysis for TC identification (Li et al., 2024; Truchelut and Hart, 2011). Reanalysis combines historical observational data with modern numerical weather models to produce comprehensive, continuous datasets of global atmospheric conditions that adhere to physical principles (Compo et al., 2011; Kalnay et al., 1996; Parker, 2016; Slivinski, 2018). The Twentieth Century Reanalysis (20CR) (Compo et al., 2011), provided by the National Oceanic and Atmospheric Administration (NOAA), is a global reanalysis dataset that covers the longest period among all other reanalyses. The 20CR was designed for long-term analyses from individual extreme weather events to climate variability, and has been applied to a wide range of studies, including those on wave height, storm surge, Madden-Julian Oscillations, and TCs (Chand et al., 2022; Cid et al., 2017; Gergis et al., 2020; Lee et al., 2023; Leung et al., 2022; Moore and Babij, 2017; Slivinski et al., 2019; Truchelut et al., 2013; Wang et al., 2012). The fact that the 20CR only assimilates surface pressure and sea level pressure fields, instead of other observations such as satellites and aircraft, makes it less sensitive to the temporal inhomogeneity of observations (Slivinski et al., 2019, 2021). It therefore provides a long-term historical weather dataset with diverse variables and complete spatial and temporal coverage.
Such complete atmospheric fields provide an important basis for examining the large-scale structure and evolution of TCs over long historical periods. Several independent studies have documented the feasibility of reproducing the characteristics of some historical TC events based on the 20CR (Emanuel, 2010; Lee et al., 2023; Slivinski et al., 2019; Truchelut et al., 2013; Truchelut and Hart, 2011). For example, following Emanuel (2010), who first expanded and revised TC climatology based on the 20CR, Truchelut and Hart (2011) employed the 20CR to identify previously unknown TCs in the Atlantic and demonstrated that the 20CR can accurately describe large-scale TC thermodynamic structure. Recently, Truchelut et al. (2013) noted that the 20CR has the ability to investigate TC events that were previously undetected in the pre-satellite era. Compared to other reanalyses, the 20CR well captures the intensity of the 1915 Galveston hurricane (Slivinski et al., 2019) and also offers a more accurate representation of landfalling TCs in East Asia (Lee et al., 2023). These previous studies have demonstrated the effectiveness of the 20CR as a tool for characterizing historical TCs (Emanuel, 2010; Truchelut et al., 2013; Truchelut and Hart, 2011). Taking advantage of the 20CR, some researchers have extracted the century-long TC information from the reanalysis product (Chand et al., 2022; Lee et al., 2023; Yeasmin et al., 2023), suggesting, despite its limitations, its potential as a tool for supplementing incomplete historical TC records and extending our knowledge of TC activity into the pre-satellite era.
While the 20CR has been applied to studying the relationship between historical climate change and TC variability, the primary focus was mostly on the TC occurrence frequency, and little attention was given to other TC metrics such as intensity, duration, and location. More importantly, to date, there is no publicly available reanalysis-based global TC dataset covering a century-long period. The lack of such a dataset limits our ability to examine how TC track, intensity, and lifetime evolved in earlier periods when the observational record was sparse or incomplete. In many early historical cases, even when TC tracks are available, intensity and position information is often missing or discontinuous, making it difficult to investigate the full evolution of individual storms and to assess TC activity beyond frequency alone. Therefore, the main objective of this study is to extract TC information (including location, intensity, and lifetime) from the 20CR and reconstruct a historical global TC track dataset spanning 1850–2014. The produced dataset is named the Reanalysis-Based Global Tropical Cyclone Tracks Dataset for the Twentieth Century (RGTracks-20C) and is open to the public for research use. This paper first introduces the production details of the RGTracks-20C and then discusses the validity, key strengths, and usage notes of the datasets. We anticipate that RGTracks-20C will serve as a valuable new resource for reconstructing historical TC tracks, augmenting the limited observational record prior to the satellite era, and supporting future studies.
2.1 Data
The primary objective of this study was to reconstruct a 20th century global TC dataset from the 20th Century Reanalysis version 3 (20CRv3) (Slivinski et al., 2019, 2021), the latest version of the 20CR produced by NOAA. Then, the validity of the reconstructed 20th century global TC data was evaluated based on the observed TC records, i.e., the International Best Track Archive for Climate Stewardship (IBTrACS) dataset (Knapp et al., 2010).
2.1.1 20th Century Reanalysis
The 20CRv3 is led by NOAA's Physical Sciences Laboratory (PSL) and the Cooperative Institute for Research in Environmental Sciences (CIRES) at the University of Colorado, supported by the U.S. Department of Energy (DOE) (Slivinski et al., 2019, 2021). It, by combining advanced data assimilation and numerical prediction techniques with historical observation data, provides long-term historical weather data with diverse variables, complete spatial and temporal coverage. The 20CRv3 employs sea-surface temperature and sea-ice distributions as its boundary conditions and assimilates only surface pressure reports from the International Surface Pressure Databank (ISPD) version 4.7 (Compo et al., 2019; Cram et al., 2015), which include observations from stations and ships, as well as TC intensity (the minimum central pressure (SLPmin) from the IBTrACS (Knapp et al., 2010). As such, it is more consistent and homogeneous with time than other reanalyses (Slivinski et al., 2019).
One should note that the IBTrACS and 20CRv3 are not two independent datasets because the SLPmin records in the IBTrACS are partly assimilated in the production of 20CRv3. On the other hand, an advantage is that TCs structure and intensity more accurately and closer to observations than other 20th century reanalyses as a result of the assimilation of IBTrACS (Laloyaux et al., 2018; Slivinski et al., 2019). And it provides a four-dimensional global gridded atmospheric dataset that spans the whole 20th century and part of the 19th century (1836–2015, with an experimental extension spanning 1806–35), with a 3 h temporal resolution and 1° × 1° horizontal resolution (Slivinski et al., 2021). Thus, the 20CRv3 was applied to the production of the RGTracks-20C in this paper.
2.1.2 IBTrACS
The IBTrACS (Knapp et al., 2010), published by the NOAA, merges recent and historical TC data from meteorological agencies worldwide. These include the Regional Specialized Meteorological Centers (RSMC) and Tropical Cyclone Warning Centers (TCWC) of the World Meteorological Organization (WMO), as well as non-WMO Centers, such as the China Meteorological Administration, the Hong Kong Observatory and the Joint Typhoon Warning Center. The IBTrACS is the most comprehensive and publicly available global TC best-track dataset. It has been widely applied in previous research to investigate the characteristics of TCs (Lai et al., 2020; Li et al., 2023; Tu et al., 2021, 2022; Wang and Toumi, 2022; Zhang, 2023), and has served as a criterion for assessing TC records derived from reanalysis (Bell et al., 2018; Bourdin et al., 2022; Chand et al., 2022; Hodges et al., 2017; Lee et al., 2023). In this study, the most updated version of IBTrACS (v04) (Knapp et al., 2018) serves as an observation reference for evaluating the reliability of the RGTracks-20C. This dataset was cleaned before being used for analyses. Details about the data pre-processing procedures are referred to in Fig. B1 in Bourdin et al. (2022). In particular, we standardized maximum sustained wind speeds (WINDmax) in IBTrACS to 10 min sustained wind speeds to ensure a consistent global standard (Knapp et al., 2010). We then removed tracks that did not reach the tropical storm stage (WINDmax<16 m s−1) and those that lasted shorter than two days.
Although the IBTrACS has time coverage dating back to the early 20th century, we utilize the data only for the post-satellite period (1979–2014) due to the early data incompleteness issues (Chang and Guo, 2007; Lee et al., 2020; Truchelut et al., 2013). Given that the IBTrACS is the most reliable record of TCs after the 1970s, the IBTrACS serves as the best benchmark for validating the data quality of RGTracks-20C. However, because the starting years of records vary across basins within the IBTrACS, biases may occur in the assessment results (see Sect. 3.4 for more details).
2.2 Production of the RGTracks-20C
2.2.1 Procedure
The RGTracks-20C was constructed from the latest version of 20CR (20CRv3). The relatively short and imperfectly sampled observational record of TCs introduces considerable uncertainty in their data over the past century (Landsea, 2007; Landsea et al., 2010), hindering accurate detection and the reconstruction of complete historical TC track data (Knutson et al., 2019; Lee et al., 2020). In this context, reanalysis provides a physically consistent framework that can complement the limited observational record and support the reconstruction of historical TC tracks (Chand et al., 2022; Truchelut et al., 2013). Since TC information is not directly provided in the 20CRv3, objective TC trackers were applied to detect and track TCs in this dataset. A wide range of TC trackers has been developed for gridded datasets, including both physics-based and dynamics-based approaches (Hodges et al., 2017; Horn et al., 2014; Tory et al., 2013; Zarzycki and Ullrich, 2017). In this study, the current first version of RGTracks-20C is based primarily on the dynamics-based Okubo-Weiss-Zeta (OWZ) tracker (Tory et al., 2013), which has been widely applied to coarse-resolution datasets and is often regarded as relatively less sensitive to horizontal resolution. This version is primarily intended to reconstruct historical TC tracks and augment the limited observational record during early periods with sparse observations. We also tested the suitability of the physically-based Ullrich & Zarzycki (UZ) tracker (Zarzycki and Ullrich, 2017). Figure 1 illustrates the methodological workflow adopted in this study, and the details are described below.
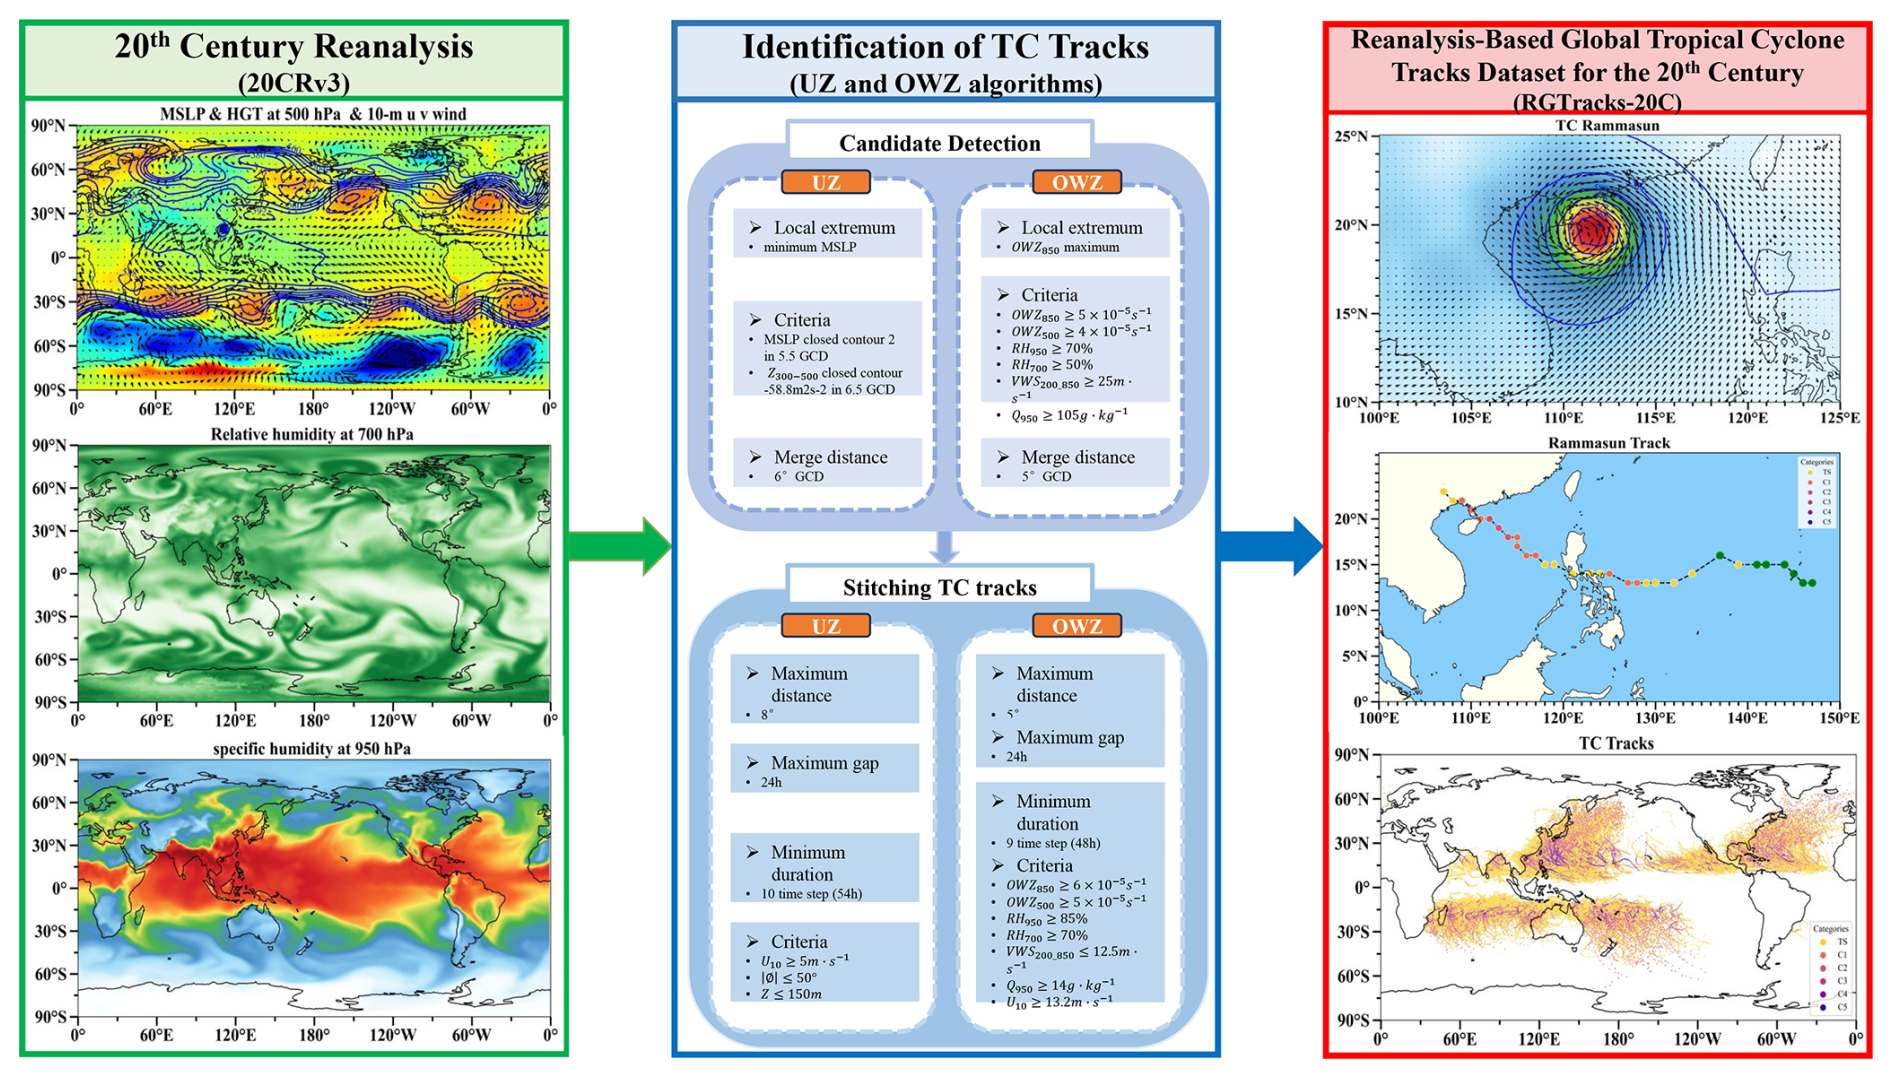
Figure 1Schematic diagram showing the production of the RGTracks-20C from the 20CRv3 based on the TC tracking algorithms. Variables shown include U10: 10 m wind speed, ∅: latitude, z: altitude, GCD: great circle distance.
2.2.2 TC tracker
OWZ Tracker
The OWZ tracker, initially proposed by Tory et al. (2013, is designed to detect low-deformation vorticity regions within large-scale disturbances, typically situated within the so-called “marsupial pouch”, which have the potential for tropical storm formation. Given that the OWZ approach relies solely on large-scale variables, it is particularly effective in detecting TC in coarse-resolution models or reanalysis (Bell et al., 2018; Bourdin et al., 2022).
The OWZ tracker involves a low-deformation vorticity variable parameter, which is the product of absolute vorticity and the Okubo-Weiss parameter normalized by the vertical components of relative vorticity squared (Eq. 1):
where f is the Coriolis parameter, is the vertical component of relative vorticity, (ζ+f) is the absolute vorticity, E is the stretching deformation (Eq. 2), and F is the shearing deformation (Eq. 3):
-
First step: Candidate detection.
The OWZ tracker begins by identifying local maxima of OWZ at 850 hPa. Any candidate with a stronger OWZ maximum within 5° of great circle distance (GCD) is excluded. Next, only candidates that meet the six initial threshold conditions shown in Table 1 within a 2° GCD of the identified maximum are retained. Based on the information provided in Table 1, besides the required minimum threshold values for the OWZ parameter at 850 and 500 hPa, additional dynamical and thermodynamic parameters related to TC formation are taken into account. These parameters include the maximum threshold for the wind vector difference (vertical wind shear) between 850 and 200 hPa, as well as the relative humidity at 950 and 700 hPa, and the minimum threshold for the specific humidity at 950 hPa. This step primarily aims to identify grid points that contain essential components of a storm. Subsequently, neighboring grid points are grouped together to define potential TCs.
-
Second step: Stitching TC tracks.
Consecutive TC points are linked together if their distance does not exceed 5° of GCD and there is a maximum gap of 24 h between them. To be considered as a valid TC, additional core thresholds (shown in Table 1) must be met for at least 9 time-steps (48 h). Finally, tracks that do not maintain tropical storm intensity (wind speed at 10 m ≥ 12.3 m s−1) for at least 1 time step are excluded.
Table 1Parameter threshold values for the OWZ detection criteria. Subscripts stand for isobaric levels in hPa (OWZ: Obuko-Weiss-Zeta s−1, RH: relative humidity %; VWS: vertical wind shear m s−1; Q: specific humidity g kg−1.)

UZ tracker
The UZ tracker , originally proposed by Zarzycki and Ullrich (2017), utilizes sea level pressure on the model grid, incorporating criteria for warm-core structures and storm lifetime. Its design prioritizes a low false-alarm rate (Roberts et al., 2020).
-
First step: Candidate detection.
Initially, candidates are identified based on the SLP minimum. And, only those candidates that meet the following two closed-contour criteria are kept:
- 1.
An increase in SLP minimum of at least 2 hPa within a 5.5° GCD from the candidate point to ensure the presence of a sufficiently strong and coherent low-pressure area.
- 2.
The geopotential thickness between 300 and 500 hPa (denoted as Z300–500) must decrease by 58.8 m2 s−2 over a distance of 6.5° GCD from the maximum center of Z300–500 within 1° GCD of the center of minimum SLP.
Finally, candidates with a stronger SLP minimum within a 6° = GCD are excluded.
- 1.
-
Second step: Stitching TC tracks.
The candidates are subsequently linked in time to create paths, ensuring a maximum distance of 8° GCD between candidates. Each path must last for at least 54 h without gaps longer than 24 h. Additionally, ten 6-hourly time steps (equivalent to 54 h) must satisfy the following thresholds: wind speed at 10 m ≥ 10 m s−1 and z≤150 m (where z represents the altitude), and the storm must form between 0 and 50°.
A command-line software, TempestExtremes, developed by Zarzycki and Ullrich (2017), enables fast and versatile and versatile implementation of TC trackers, was used in this study. For further details, please refer to Ullrich et al. (2021).
2.2.3 Bias Correction of TC intensity
Given the low horizontal resolution in the 20CRv3, TC intensities derived directly from the reanalysis generally underestimated those compared to observations (Fig. 2a) (Bourdin et al., 2022; Roberts et al., 2020). To address this issue, a quantile mapping bias correction, similar to the method used by Zhao and Held (2010), was applied to adjust for the TC intensity bias within the dataset. The main idea is to fit the 20CRv-derived TC intensity distributions, either probability distribution functions (PDFs) or cumulative distribution functions (CDFs), to the observed distributions. This method has demonstrated significant efficacy in enhancing the accuracy of TC intensity within models or reanalyses (Faranda et al., 2023; Yoshida et al., 2017). This adjustment resulted in a wind-pressure relationship in RGTracks-20C that aligns more closely with observational data (Fig. 2b).
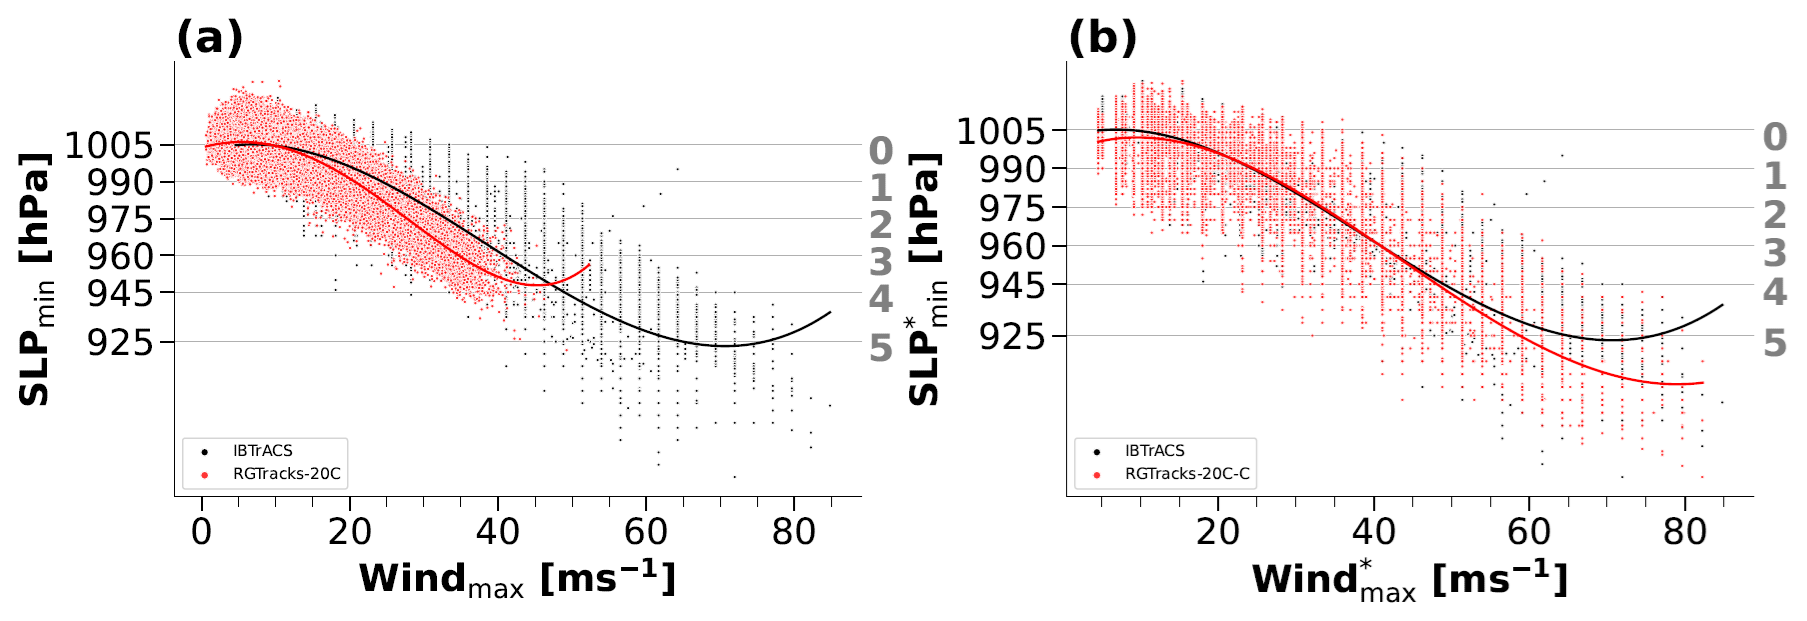
Figure 2Wind–pressure relationships for IBTrACS and RGTracks-20C. (a–b) Scatter plots of SLPmin (unit: hPa) against maximum sustained wind speeds (WINDmax) (unit: m s−1), based on the TCs from IBTrACS (black), RGTracks-20C (red), before (a) and after (b) intensity bias correction (see Methods). The curves represent fourth-order polynomial fit results. Storm categories, as defined in the Sect. 2.4.2, are indicated by horizontal gray lines.
2.3 Evaluation methods
2.3.1 Tracks matching
After detecting TC vortices from the 20CRv3, the resulting tracks are matched one-to-one with those observed in the IBTrACS. The specific procedures are detailed in Sect. 2.4 “Tracks Matching” by Bourdin et al. (2022).
Specifically, a detected track D consists of n points () corresponding to the moments (). Similarly, a track O observed in IBTrACS consists of a collection of points at a given time. For every point di (ti) on track D, points from O at the same time ti located within a 300 km radius of di are linked. There may be instances where no such points are found in O. The subset of points in O that are linked to any point in D is labeled as OD-paired. It consists of |OD-paired| . There are three possible scenarios:
-
|OD-paired| = 0: If none of the points in the RGTracks-20C track D match any points in track O, then track D is classified as a False Alarm (FA).
-
|OD-paired| > 0: If all points in OD-paired track correspond to points in the same observed track O, then track O is identified as the closest match for D.
-
|OD-paired| > 0: If the points in OD-paired correspond to several observed tracks in O, the observed track with the most points paired with D is regarded as the best match for D.
2.3.2 Track verification
Following the approach suggested by Bourdin et al. (2022), this study compares TC tracks detected from the 20CRv3 with observed tracks from the IBTrACS. The probability of detection (POD) (Eq. 4) and false alarm rate (FAR) (Eq. 5) are used to assess the detection skills of the two trackers.
where hits (H) refer to TC tracks detected from the 20CRv3 that are also present in IBTrACS, misses (M) denote those tracks that are recorded in IBTrACS but were not detected in the 20CRv3, and false alarms (FAs) refer to non-existing TCs that were detected from the 20CRv3.
2.4 Definitions
2.4.1 TC intensity
In assessing the TC intensity, SLPmin and WINDmax are two commonly used metrics in TC research. However, because WINDmax in both observations and reanalysis exhibits relatively higher uncertainties (Bourdin et al., 2022; Chavas et al., 2017; Knapp et al., 2010; Knutson et al., 2015; Schreck et al., 2014), this study opted to use SLPmin as the only indicator of TC intensity when verifying the validity of RGTracks-20C. Nevertheless, WINDmax of detected TCs is also provided in the RGTracks-20C (Table 2) as a reference for researchers who wish to use and improve the dataset, though it is not discussed in the paper.
Table 2Data format of the RGTracks-20C. track_id: storm identifier, lat: latitude degrees_north, lon: longitude degrees_east, SLPmin: minimum central pressure (unit hPa), WINDmax: maximum wind speed (unit: m s−1), WIND and SLP denotes TC intensities after bias correction.

2.4.2 Storm categories
The Saffir-Simpson Hurricane Scale (SSHS) from 1 to 5 based on their peak 1 min wind speed at 10 m above the surface. In this study, given the significant uncertainties in WINDmax due to differences between institutions and the limitations of model simulation capabilities (Chavas et al., 2017; Klotzbach et al., 2020; Knutson et al., 2015), we have chosen to classify based on SLPmin, following the definition of Klotzbach et al. (2020).
2.4.3 Basins
We explore the performance of TCs in RGTracks-20C on global and regional scales. The regional division is mainly based on the appendix guide of Knutson et al. (2015), which divides the globe into six basins: the WNP, Eastern North Pacific (ENP), South Pacific (SP), North Indian(NI), South Indian (SI), and NATL.
2.4.4 TC days
TC days is defined as the number of 6 h periods during which an active TC occurs within a basin, divided by 4 (to convert 6 h blocks into days) and accumulated for the year under consideration such that:
where Li is the individual lifetime of a TC within the bounds of a basin.
3.1 Data Records
The constructed RGTracks-20C (Ye et al., 2024) provides a century-long collection of global TCs identified from the 20CRv3. The RGTracks-20C is publicly available at https://github.com/jeremychleung/RGTracks-20C/ (last access: 12 December 2024) and https://doi.org/10.5281/zenodo.8410597 (Ye et al., 2024). This dataset provides detailed TC information, including location (longitude, latitude, hemisphere, and basin), time (year, month, day, hour, and season), and intensity (SLPmin and WINDmax), with a temporal resolution of 6 h, spanning from 1850 to 2014 and covering the globe. The dataset is provided as a comma separated values (.csv) file and has a format similar to that of the IBTrACS (Table 2). It is noted that, in the RGTracks-20C, WINDmax serves, in addition to SLPmin, as a supplementary reference of TC intensity for researchers, but is not discussed here due to accuracy issues and should be used cautiously.
3.2 Tracker performance
As documented in prior studies, biases are unavoidable when extracting TCs from reanalyses, given the limitations of reanalysis in reproducing the high-resolution TC structure and circulation patterns, as well as the errors caused by the application of different trackers (Bell et al., 2018; Horn et al., 2014; Lee et al., 2023; Slivinski et al., 2019; Truchelut et al., 2013). Before verifying the reliability of RGTracks-20C, it is necessary to evaluate the performance of the trackers applied. To further support the credibility assessment of RGTracks-20C, we also evaluate the performance of the UZ tracker as a methodological reference, with a more detailed discussion provided in Sect. 3.5, S1–S2 and Figs. S1–S7 in the Supplement.
The POD and FAR of TCs are used to assess OWZ's performance in detecting TCs in 20CRv3 at both the global scale and across six ocean basins (see Sect. 2.3.2). Globally, the OWZ tracker yields an overall POD of 77 % and an FAR of 15 % (Fig. 3a). Its higher POD and lower number of misses (Fig. 3b) are advantageous for augmenting the limited observational record during early periods with sparse observations. Most misses are associated with weak and short-lived TCs that the 20CRv3 fails to simulate or track (Hodges et al., 2017), as well as its inability to meet the threshold of the tracker. The false alarms, however, likely represent storms or their developmental stages that were not recorded in IBTrACS, possibly because they did not reach the tropical storm category (Fig. S2).
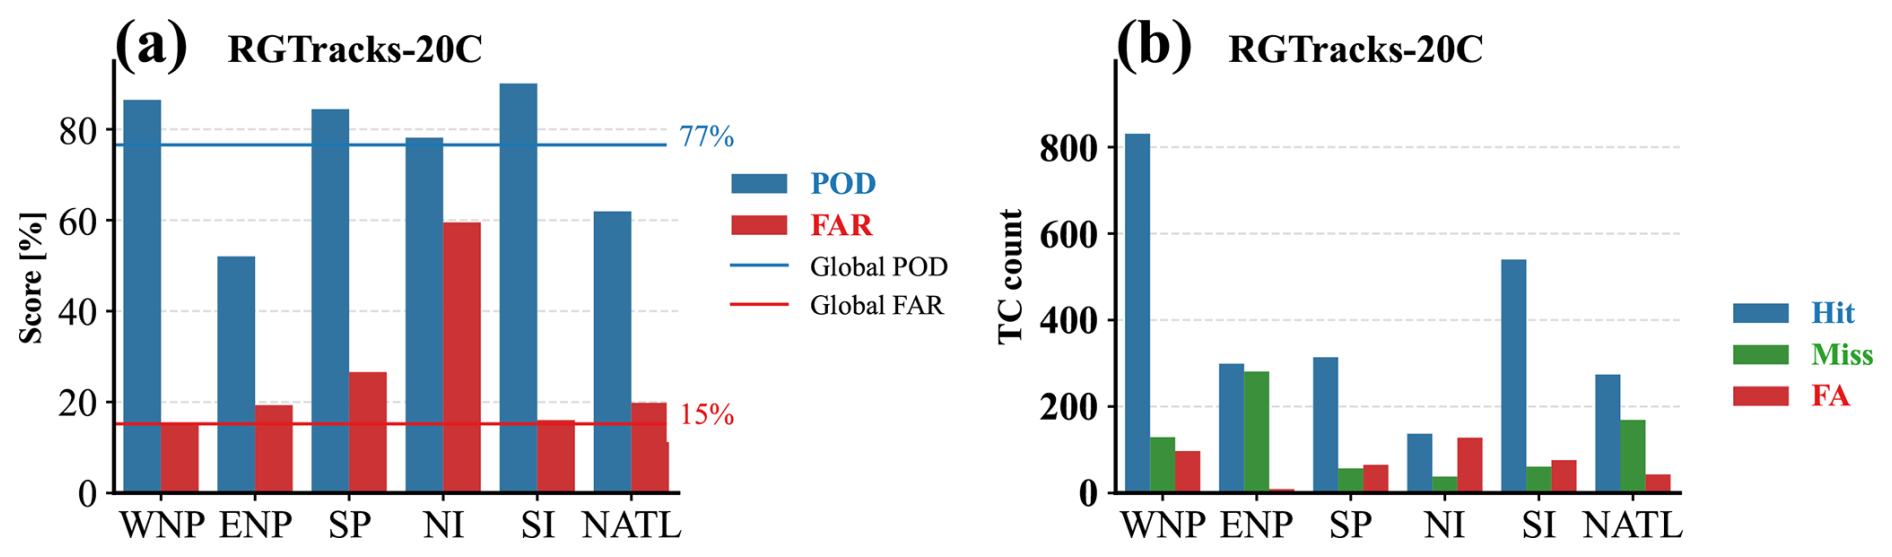
Figure 3Accuracy of TC number detection of the RGTracks-20C. (a) POD (blue bars and line, unit: %) and FAR (red bars and line, unit: %) for TC number detected by the OWZ tracker in each basin (bars), compared to the global mean (lines). Blue and red horizontal lines denote the POD and FAR over the globe. (b) same as (a), except for the number of hits (blue bars), misses (green bars), and false alarms (red bars) detected by the OWZ tracker.
For each basin, the OWZ tracker shows a pattern generally consistent with the global results. Higher POD values are found in the SI (90 %), WNP (86 %), and SP (84 %), followed by the NI (78 %), whereas lower POD values occur in the NATL (62 %) and ENP (52 %). The largest numbers of hits are found in the WNP and the SI Ocean, consistent with the results reported by Bourdin et al. (2022). Overall, the OWZ tracker identifies most of the observed TCs in the majority of basins, although missed detections remain evident in the ENP and NATL, where many of the missed TCs are very weak and short-lived TCs (Fig. S3), while the FAR is relatively high in the NI. In addition, some of the false alarms may correspond to subtropical storms or to weak systems that were not retained in IBTrACS, as suggested in previous studies (Bell et al., 2018; Bourdin et al., 2022).
Furthermore, comparison with previous studies, as well as the separately evaluated UZ-based results (Sects. 3.5 and S1, Fig. S1 and Table S1), provides additional support for the credibility of the OWZ-based detections in 20CRv3 (Bourdin et al., 2022; Murakami, 2014). Particularly, the POD and FAR obtained from 20CRv3 exhibit similar magnitudes to the results by applying OWZ to ERA5, which yields global POD and FAR values of 76 % and 25 %, respectively (Bourdin et al., 2022; see Table S1). This suggests that the OWZ-based detections provide a reasonable representation of historical TC activity in 20CRv3 and support their use as the primary dataset for the first version of RGTracks-20C.
3.3 Climatology
As the first version of RGTracks-20C, the primary objective is to supplement incomplete historical TC records. In the following sections, we therefore focus on evaluating its ability to capture TC climatology across various ocean basins.
In terms of climatology, the RGTracks-20C is able to capture the major spatial patterns of TC genesis locations and track density over most ocean basins (Fig. 4a–d), indicating that it provides a reasonable representation of the spatial distribution of historically observed TCs. The annual mean TC numbers are also consistent with observations in most ocean basins, especially in the WNP, SI, and SP, where the discrepancies range from −0.48 to 0.89 (Fig. 4e–f). Globally, the annual average TC number of RGTracks-20C is 78.56 (Fig. 4f), which is lower than the observed value of 87.03 (Fig. 4e). This underestimation mainly arises from biases in the ENP and NATL basins. Despite these regional underestimations, the overall TC detection level is broadly comparable to that reported in previous studies based on higher-quality reanalyses (Bourdin et al., 2022; Murakami, 2014), suggesting that RGTracks-20C provides a reasonable representation of global TC frequency climatology.
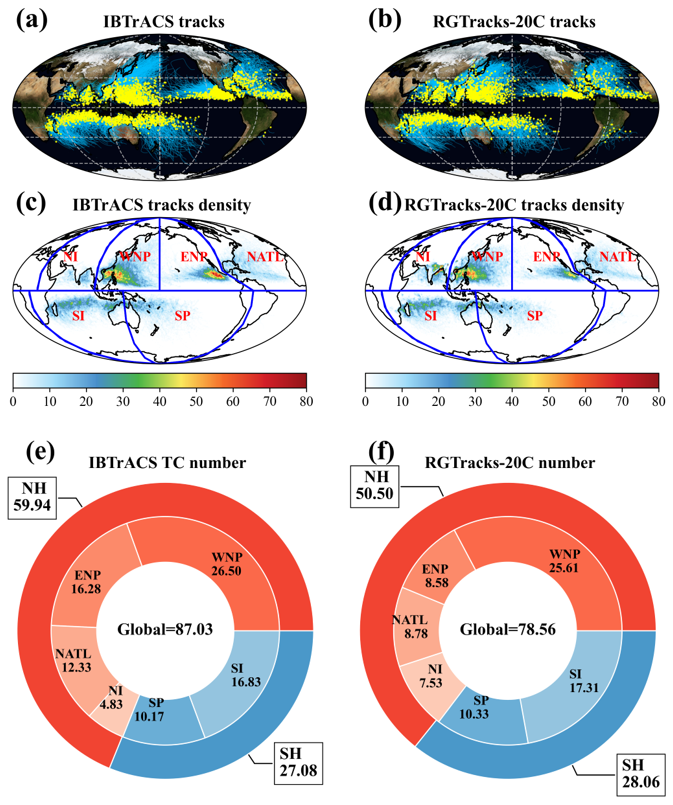
Figure 4TC genesis locations, tracks, and annual average number from IBTrACS and RGTracks-20C. (a–b) TC genesis locations (yellow dots) and tracks (blue lines) from IBTrACS (a), and RGTracks-20C (b). (c–d) TC tracks density (shading, number of TC occurrence per 1° × 1° latitude-longitude grid box, 1979–2014) from IBTrACS (c), and RGTracks-20C (d). (e–f) Mean number of TCs per year globally and for the six basins from IBTrACS (e), and RGTracks-20C (f).
Based on the spatial distribution shown above, we further compare TC locations between RGTracks-20C and IBTrACS. The results show that global TC location differences range from 10 to 300 km, with most cases falling between 75 and 125 km (Fig. 5a). Peak frequencies occur below 100 km, at approximately 95 km. Similar distributions are found across the individual basins (Fig. 5a). Given that the nominal horizontal resolution of 20CRv3 is 1° × 1°, corresponding to a characteristic spatial scale of about 100 km, this location differences are within a physically reasonable range for TC detection from this reanalysis.
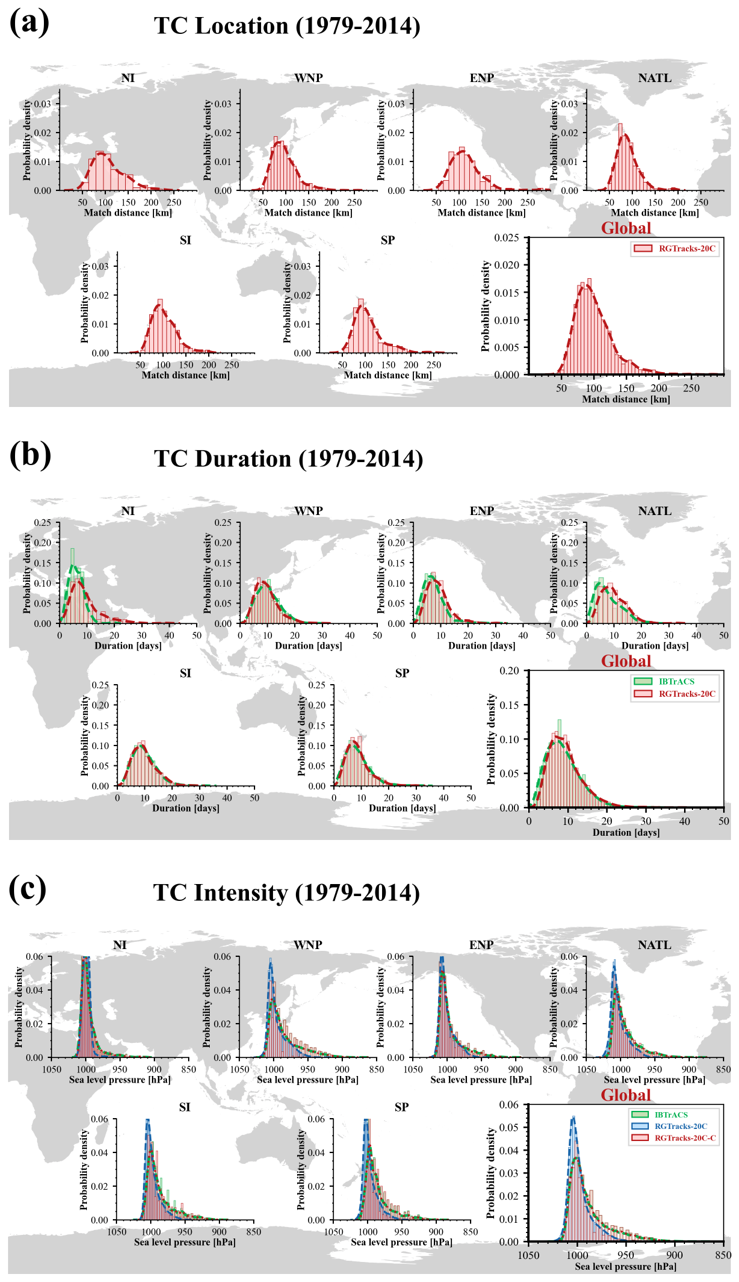
Figure 5Distribution of TC characteristics om the IBTrACS and RGTracks-20C. (a) Distribution of the mean TC location error from 1979–2014 (unit: km) between IBTrACS and the RGTracks-20C. (b) TC duration (unit: days) from 1979 to 2014 in IBTrACS (green) and the RGTracks-20C(red) (unit: hPa). (c) same as (b), but for TC intensity (SLPmin, unit: hPa), before (blue) and after (red) bias correction.
TC duration is also an important aspect of TC climatology (Knutson et al., 2010). Based on the IBTrACS, the majority of observed TCs globally last fewer than 20 d, with a peak around 8 d (Fig. 5b). The results show that the TC duration distribution in RGTracks-20C is close to the observations, with a peak near 8 d at both the global and basin scales (Bourdin et al., 2022; Tory et al., 2013). This is likely related to the ability of the dynamics-based OWZ tracker to identify storms from relatively early stages of development (Fig. S4) (Bell et al., 2018; Bourdin et al., 2022).
For TC intensity, given the relatively considerable uncertainty in WINDmax compared to SLPmin in both reanalyses and IBTrACS (see Methods) (Bourdin et al., 2022; Chavas et al., 2017; Knapp et al., 2010; Knutson et al., 2015; Schreck et al., 2014), the intensity evaluation of RGTracks-20C is based on SLPmin only. According to IBTrACS (Fig. 5c), the intensity of TCs is mainly distributed between 900 and 1020 hPa, peaking around 1000 hPa, with a long tail on the lower SLPmin side. In RGTracks-20C, the SLPmin distribution is mainly concentrated between 950 and 1020 hPa, with a peak near 1005 hPa. This suggests that the 20CRv3 generally underestimates the TC intensity (Fig. 2a), which, as expected, is primarily because the relatively low spatial resolution of the reanalysis may cause smoothing effects on the sea level pressure field. Apart from spatial resolution, the model's dependence on parameterization processes, along with other factors, may also influence its ability to reproduce TC intensity in the reanalysis (Aarons et al., 2021; Hodges et al., 2017; Malakar et al., 2020).
To address this issue, an intensity correction based on quantile mapping was applied (see Methods) (Zhao and Held, 2010). After intensity correction, the TC intensity distribution in RGTracks-20C is more consistent with IBTrACS (Figs. 2b and 5c), especially in terms of peak positions, and accurately reproduces the skewed distribution of TC intensity. In particular, the RGTracks-20C reproduces TC intensity values with SLPmin below 940 hPa, which were not found before the intensity bias correction. Notably, while the fitted curves show consistent patterns following correction, they do not perfectly overlap, suggesting that small discrepancies exist (Figs. S5d and S6d).
In summary, these results suggest that RGTracks-20C provides a reasonable representation of observed TC climatology in terms of spatial distribution, duration, and intensity.
3.4 Interannual variability
To assess whether RGTracks-20C can represent year-to-year variations in TC activity, we compare it with IBTrACS over 1979–2014, when the observational record is relatively complete and more reliable.
Firstly, the RGTracks-20C is able to capture the observed interannual variability of global TC number (Fig. 6a), with correlation coefficients of 0.68 (in the following context, all correlations are significant at the 99 % confidence level unless otherwise specified). This is also true for individual basins (Fig. 6a and Table 3), with the correlation coefficients exceeding 0.70 in most basins. Among the six basins, the highest correlation is found in the NATL (0.88), followed by the SP (0.79), WNP (0.75), and SI (0.74). Lower correlations are found in the ENP (0.35) and NI (0.54). These results suggest that RGTracks-20C can provide useful information on year-to-year variations in TC number, both globally and across most major ocean basins.
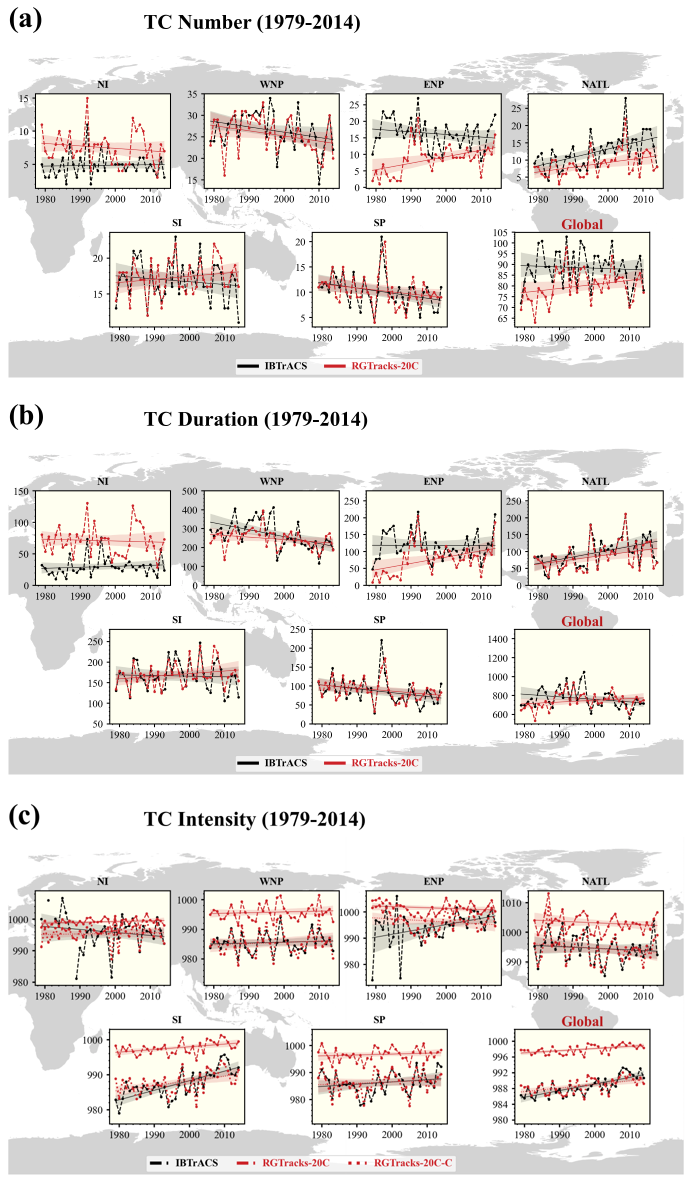
Figure 6Time series of globally TC activities from IBTrACS and RGTracks-20C during the periods 1979–2014. TC activities are from the IBTrACS and RGTracks-20C (red). (a) TC number. (b) TC days (unit: days). (c) TC intensity in SLPmin (unit: hPa) in IBTrACS (black) and RGTracks-20C before (red solid line) and after (red dotted line) bias correction. Shaded areas are the two-sided interval of the linear trend at the 95 % confidence level. Straight lines are the linear regression.
TC days, a metric that combines both TC frequency and lifetime (Bell et al., 2018), are also reasonably represented in RGTracks-20C. At the global scale, TC days in RGTracks-20C are significantly correlated with those in IBTrACS, with a correlation coefficient of 0.63 (Fig. 6b). Moreover, these results are further confirmed across basins (Fig. 6b and Table 3), with correlation coefficients generally exceeding 0.75. In particular, the highest correlations occur in the NATL (0.93), followed by the SP (0.79), SI (0.78), and WNP (0.75). However, the correlation coefficients for TC days are also relatively low in the ENP (0.57) and NI (0.34). Overall, these results suggest that RGTracks-20C provides a reasonable representation of the interannual variability of TC days at the global scale and in most ocean basins.
In addition, the global TC intensity series based on RGTracks-20C is significantly correlated with that from IBTrACS, with a correlation coefficient of 0.80 after intensity bias correction (Fig. 6c). This suggests that the SLPmin TC intensity in RGTracks-20C is broadly consistent with the observed interannual variability. Similar results are found in most basins (Fig. 6c and Table 2), with the highest correlation in the WNP (0.85), followed by the SI (0.78) and NATL (0.72), while the SP also shows a correlation close to 0.69. Because 20CRv3 tends to underestimate TC intensity owing to its coarse spatial resolution, intensity bias correction is necessary during the construction of RGTracks-20C (see Methods). After correction, the interannual variability of TC intensity becomes more consistent with the observations, especially in the WNP, NATL, and SI basins. Discrepancies remain in the ENP (−0.02) and NI (0.47), consistent with the results for TC number and TC days discussed above.
Overall, these results suggest that RGTracks-20C provides a reasonable basis for analyzing interannual variations in TC activity, particularly for TC number, TC days, and intensity, in periods when the observational record is more complete.
The basin-dependent differences discussed above are most evident in the ENP, NATL, and NI. Weak and short-lived storms are difficult to identify across all basins (Fig. S2), but this problem is particularly pronounced in the ENP and NATL (Fig. S3), where such storms account for a larger share of the historical record. The coarse resolution of the reanalysis makes these weak systems more difficult to represent, which in turn reduces the detection skill of the tracking algorithm. In the NI, the lower agreement is more likely related to a different combination of factors, including greater uncertainty in the historical observational record and the tendency of the tracking algorithm to misidentify monsoon depressions as TCs. Consistent with these basin-dependent characteristics, the agreement with IBTrACS is weaker in the ENP and NI: RGTracks-20C tends to underestimate TC activity in the ENP and overestimate it in the NI during the earlier part of the record (Fig. 6a and Sect. S3). When the comparison is restricted to the more reliable periods after 1988 in the ENP and after 1990 in the NI, the biases are reduced and the correlations improve substantially (Fig. S8 and Tables S2, S5). These results suggest that the discrepancies in these two basins are influenced not only by tracker and reanalysis limitations, but also by temporal inhomogeneities in the observational record (Table S3). Because part of the IBTrACS pressure information is assimilated into 20CRv3, such inhomogeneities may affect both the representation of TC activity in the reanalysis and the subsequent evaluation against IBTrACS. Consistent with this interpretation, excluding the ENP and NI also increases the global correlation coefficients between RGTracks-20C and IBTrACS (Table S6).
Although long-term trend analysis is not the primary purpose of the present dataset, the corresponding trend estimates are provided in Sect. S4 and Tables S4, S7 for completeness. Over 1979–2014, RGTracks-20C shows generally similar longer-term variations to IBTrACS at the global scale, and several basins exhibit trends of the same sign in both datasets, including significant trends in some cases. These results are provided as supporting information only; the current version of RGTracks-20C is not intended for standalone analyses of long-term trends in TC activity.
3.5 Comparison of the OWZ and UZ trackers
It is important to recognize that different TC detection and tracking schemes can yield different results, because they rely on different formulations and threshold criteria. In this study, the UZ tracker is included as a methodological reference and sensitivity test (Supplementary Sect. S2).
Compared with the OWZ tracker, the UZ tracker shows a lower global POD (68 % vs. 77 %) and a lower FAR (7 % vs. 15 %), but also a larger number of missed detections, especially for weak and short-lived storms (Figs. S1–3). The UZ-based annual mean TC number (63.39) is systematically lower than that of RGTracks-20C (78.56) and farther from the observed value (87.03) (Fig. S7). In addition, the UZ-based duration distribution is markedly shorter, with a peak near 5 d, whereas both RGTracks-20C and IBTrACS show a peak near 8 d (Figs. S5–S6). By contrast, differences in spatial location and intensity are relatively smaller.
In terms of interannual variability, the UZ-based results are broadly similar to the OWZ-based results (Fig. 7 and Table 3), but they show larger deviations from IBTrACS. In particular, the UZ-based annual TC number is systematically lower than the observations by about 10–20 storms (Fig. 7a), and TC days are also substantially lower than those in IBTrACS (Fig. 7b). For TC intensity, the OWZ-based results are more consistent with the observations, with a correlation coefficient reaching 0.80, whereas the corresponding UZ-based value is only 0.61 (Fig. 7c–d).
Therefore, these results indicate that the OWZ-based product provides a more suitable basis for the current first version of RGTracks-20C, while the UZ-based results remain useful as a methodological reference and for comparative analysis.
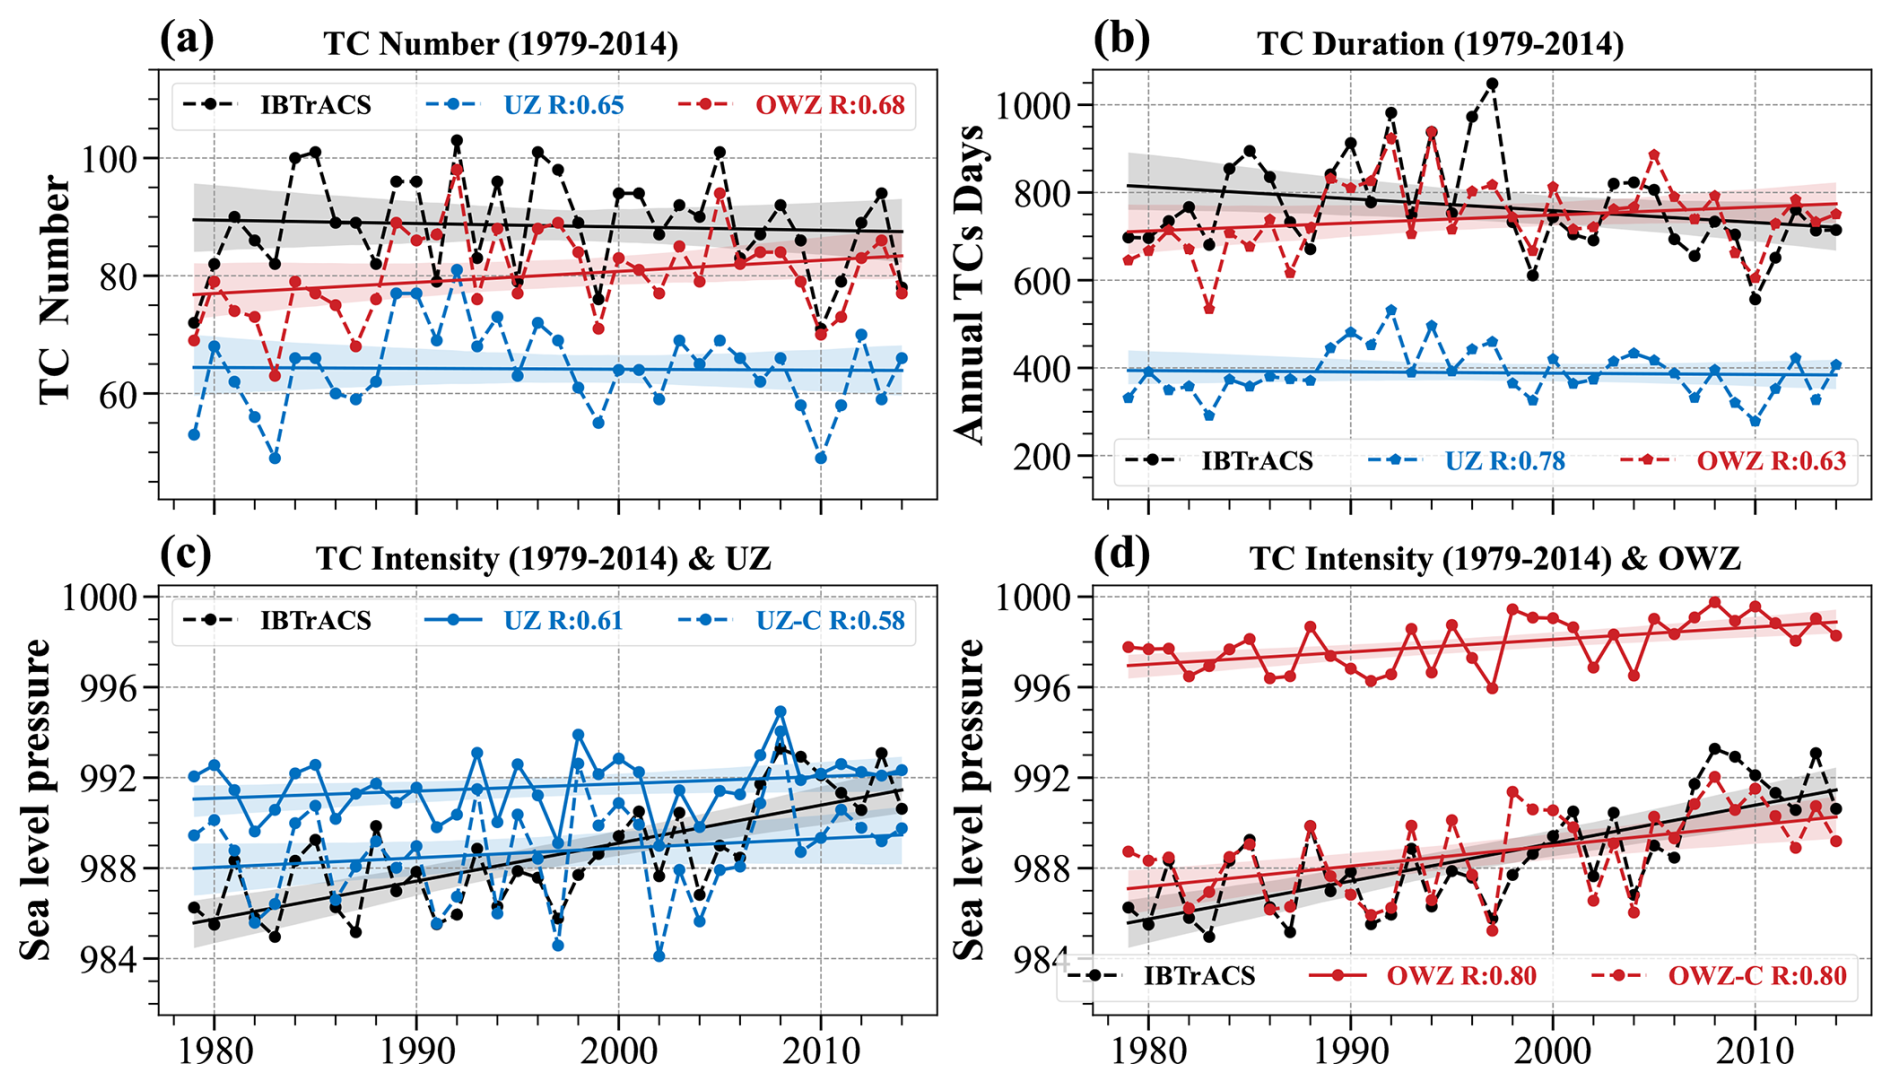
Figure 7Time series of globally TC activities from IBTrACS and RGTracks-20C during the periods 1979–2014. TC activities are from the IBTrACS and RGTracks-20Cand OWZ (red) trackers. (a) TC number. (b) TC days (unit: days). (c) TC intensity in SLPmin(unit: hPa) in IBTrACS (black) and RGTracks-20C using UZ tracker before (blue solid line) and after (blue dotted line) bias correction. (d) same as (c), except for TC intensity in SLPmin (unit: hPa) in IBTrACS (black) and RGTracks-20C using OWZ tracker before (red solid line) and after (red dotted line) bias correction. Shaded areas are the two-sided interval of the linear trend at the 95 % confidence level. Straight lines are the linear regression. The correlation coefficients (R) between from IBTrACS and RGTracks-20C are marked in the figure legends. All correlation coefficients are statistically significant at the 99 % confidence level.
Table 3The correlation coefficients (R) between the from IBTrACS and RGTracks-20C and UZ tracker.
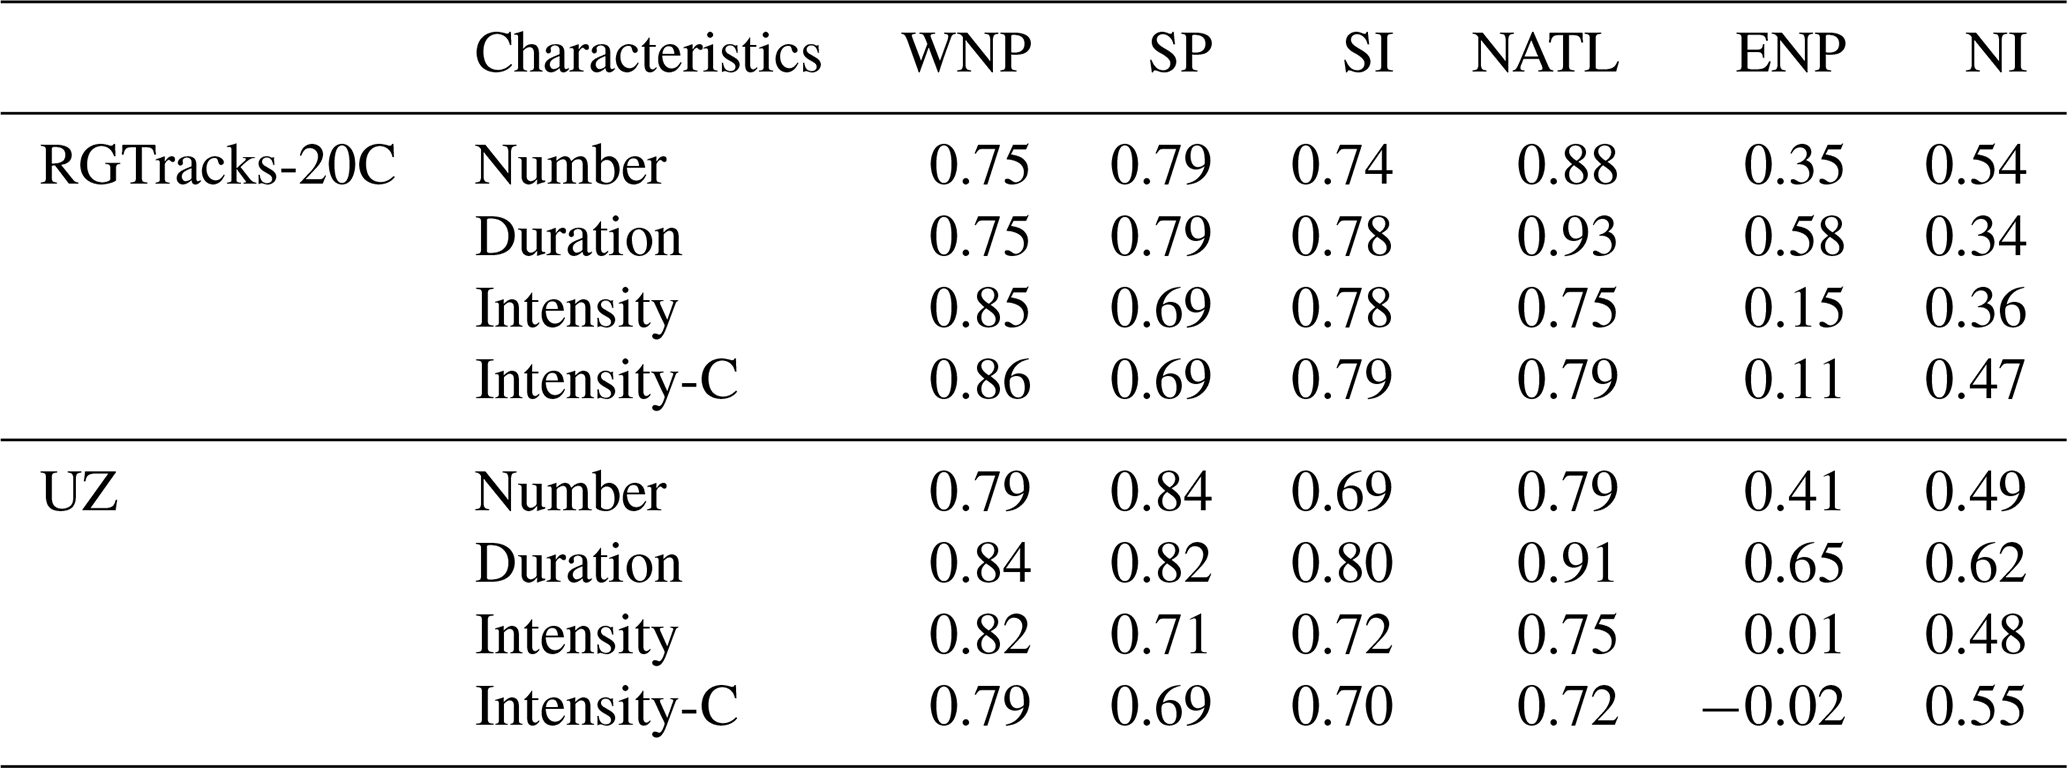
* The R values for TC number and intensity are not statistically significant at the 99 % confidence level in the NI and ENP.
3.6 Case Studies
Compared with observations, RGTracks-20C provides a reasonable representation of TC climatology and interannual variability at the global scale and across the major ocean basins. In this section, we examine the key strengths of RGTracks-20C, specifically its potential to provide supplementary track and intensity information of early-year TCs that may not be included in the observed data records.
Before digging into early-year TCs, we first assess whether RGTracks-20C can reasonably represent several well-documented individual events by comparison with observations. To provide representative examples across different ocean basins, we selected three high-impact TCs with complete observational records in the NATL, SI, and WNP: Hurricane “Andrew” in 1992 (Pimm et al., 1994) (Fig. 8a–d), TC “Geralda” in 1994 (Hoarau et al., 2012) (Fig. 8c–d), and Super Typhoon “Rammasun” in 2014 (Zhang et al., 2017) (Fig. 8e–f). These storms were chosen because they caused substantial human and economic losses and therefore provide useful test cases for assessing the representation of TC track, duration, and intensity evolution in RGTracks-20C.
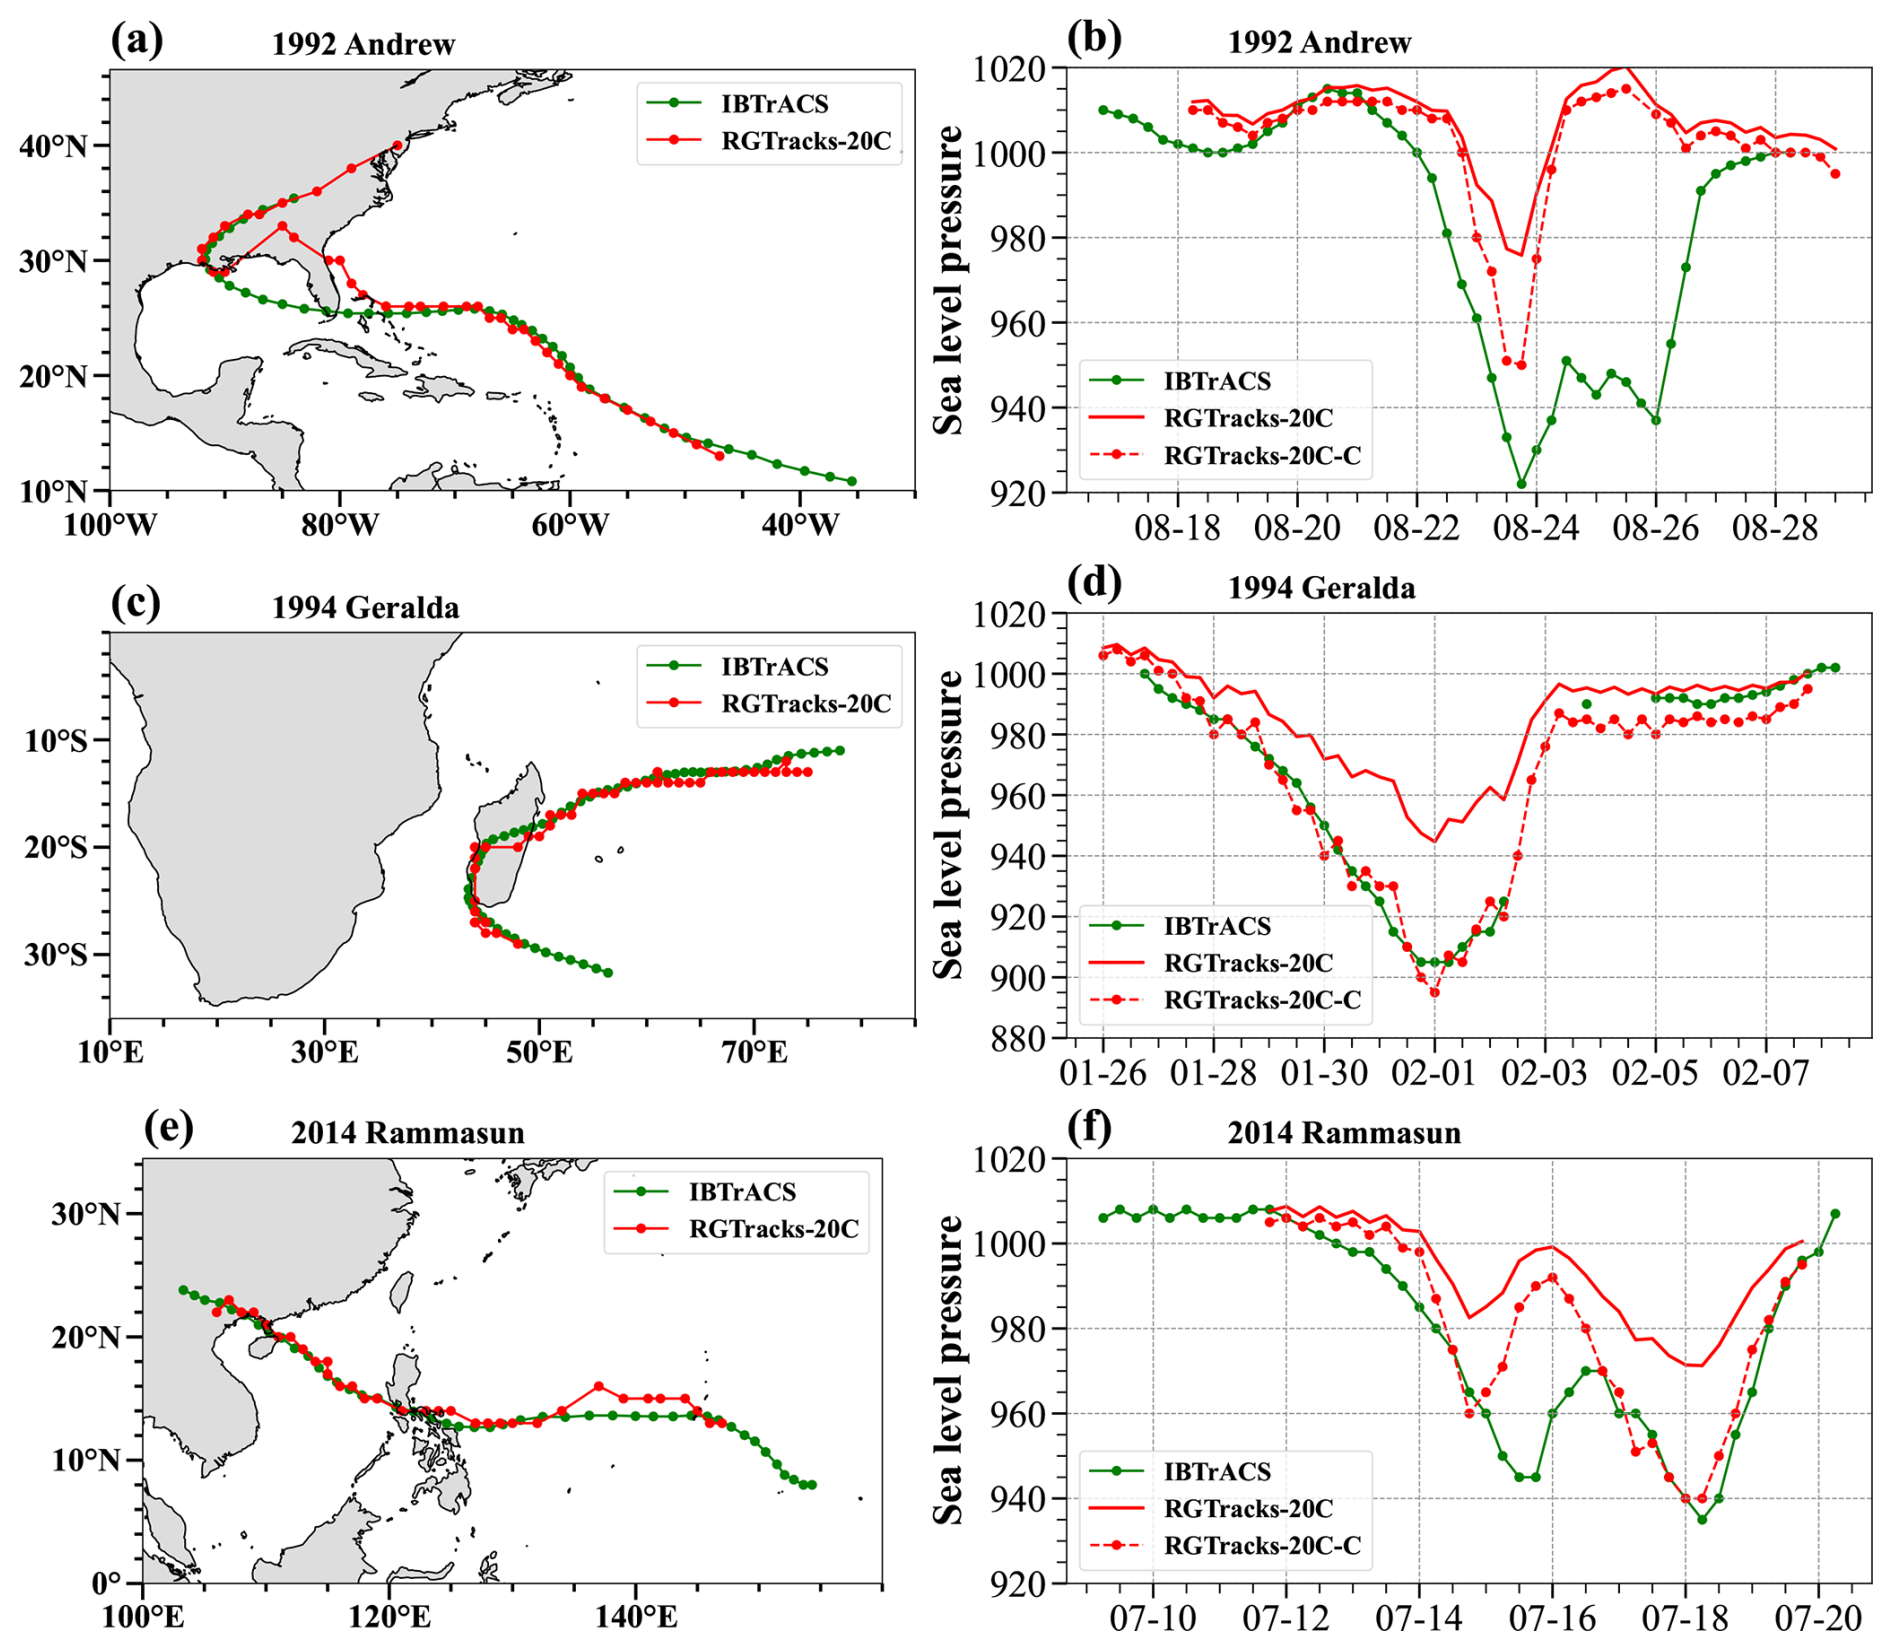
Figure 8The historical tracks and intensity records of individual TCs in the IBTrACS and RGTracks-20C. (a–b) Track (a) and intensity (b) SLPmin, unit: hPa) of Hurricane “Andrew”. (c)–(d) same as (a)–(b), but for tropical cyclone “Geralda”. (e)–(f) same as (a)–(b), but for Super typhoon “Rammasun”. Green and red lines denote results based on the IBTrACS and RGTracks-20C, respectively.
Compared with IBTrACS, the RGTracks-20C performs well in representing the track and duration of these TCs. Some discrepancies were observed during landfall (Fig. 8a), possibly due to small TC size, which were not captured by the low-resolution 20CRv3 (Sect. S5.1 and Fig. S9). While the 20CRv3 tends to underestimate the intensity of TCs, the corrected intensity in the RGTracks-20C is highly consistent with observations and accurately captures the temporal evolutions of TC intensities. These examples suggest that RGTracks-20C can provide a useful representation not only of TC climatology and variability, but also of the evolution of selected individual TC events.
Prior to the satellite era, limitations in observation systems often led to incomplete records of early TCs, particularly for TC intensity. An example is Hurricane Okeechobee in 1928, which was one of the deadliest to hit the United States in the early 20th century. Hurricane Okeechobee was recorded in the IBTrACS (Blake et al., 2011; Mitchell, 1928) (Sect. S5.2). However, during Okeechobee's lifetime, there were only 16 time points of the TC intensity that were recorded when it passed the Lesser Antilles and Puerto Rico, and made landfall in the United States (Figs. 8a–b, S10 and Table S8). Similar missing data are common in the IBTrACS records of early TCs, especially when the TCs were located over the open ocean (Fig. 8c–d). In some cases, the incompleteness is even more pronounced. For example, Typhoon No. 8, which made landfall and caused serious damage in Japan (Sect. S5.3), has only track records in the IBTrACS, but with intensity information missing (Fig. 8e–f).
In such cases, RGTracks-20C can provide supplementary information on both TC track and intensity where the observational record is incomplete. For Okeechobee, RGTracks-20C reproduces nearly the full storm lifetime recorded in IBTrACS, and its latitude-longitude evolution is broadly consistent with the observed track, with positional differences generally within ±1 (Fig. 8a and Fig. S10). The available observations also suggest that RGTracks-20C provides a reasonable estimate of Okeechobee's intensity evolution (Fig. 8d and Table S8). In particular, when the hurricane passed Guadeloupe, IBTrACS records a minimum sea-level pressure of 940 hPa, which is closely matched in RGTracks-20C. Moreover, RGTracks-20C captures the weakening and re-intensification of the hurricane between Puerto Rico and its landfall in Florida, a period for which IBTrACS lacks continuous intensity information. These comparisons indicate that, despite the sparsity of the historical intensity record, the RGTracks-20C represents the major intensity changes of the storm reasonably well and gives central pressure estimates that are broadly consistent with the recorded values at key stages of its evolution (Sect. S5.2 and Table S8). Similar value is seen for Typhoon No. 8 in 1920, where RGTracks-20C provides additional information not only on TC intensity but also on the later stage of storm evolution, including the landfall phase (Figs. 9g, S11–S13 and Sect. S5.3).
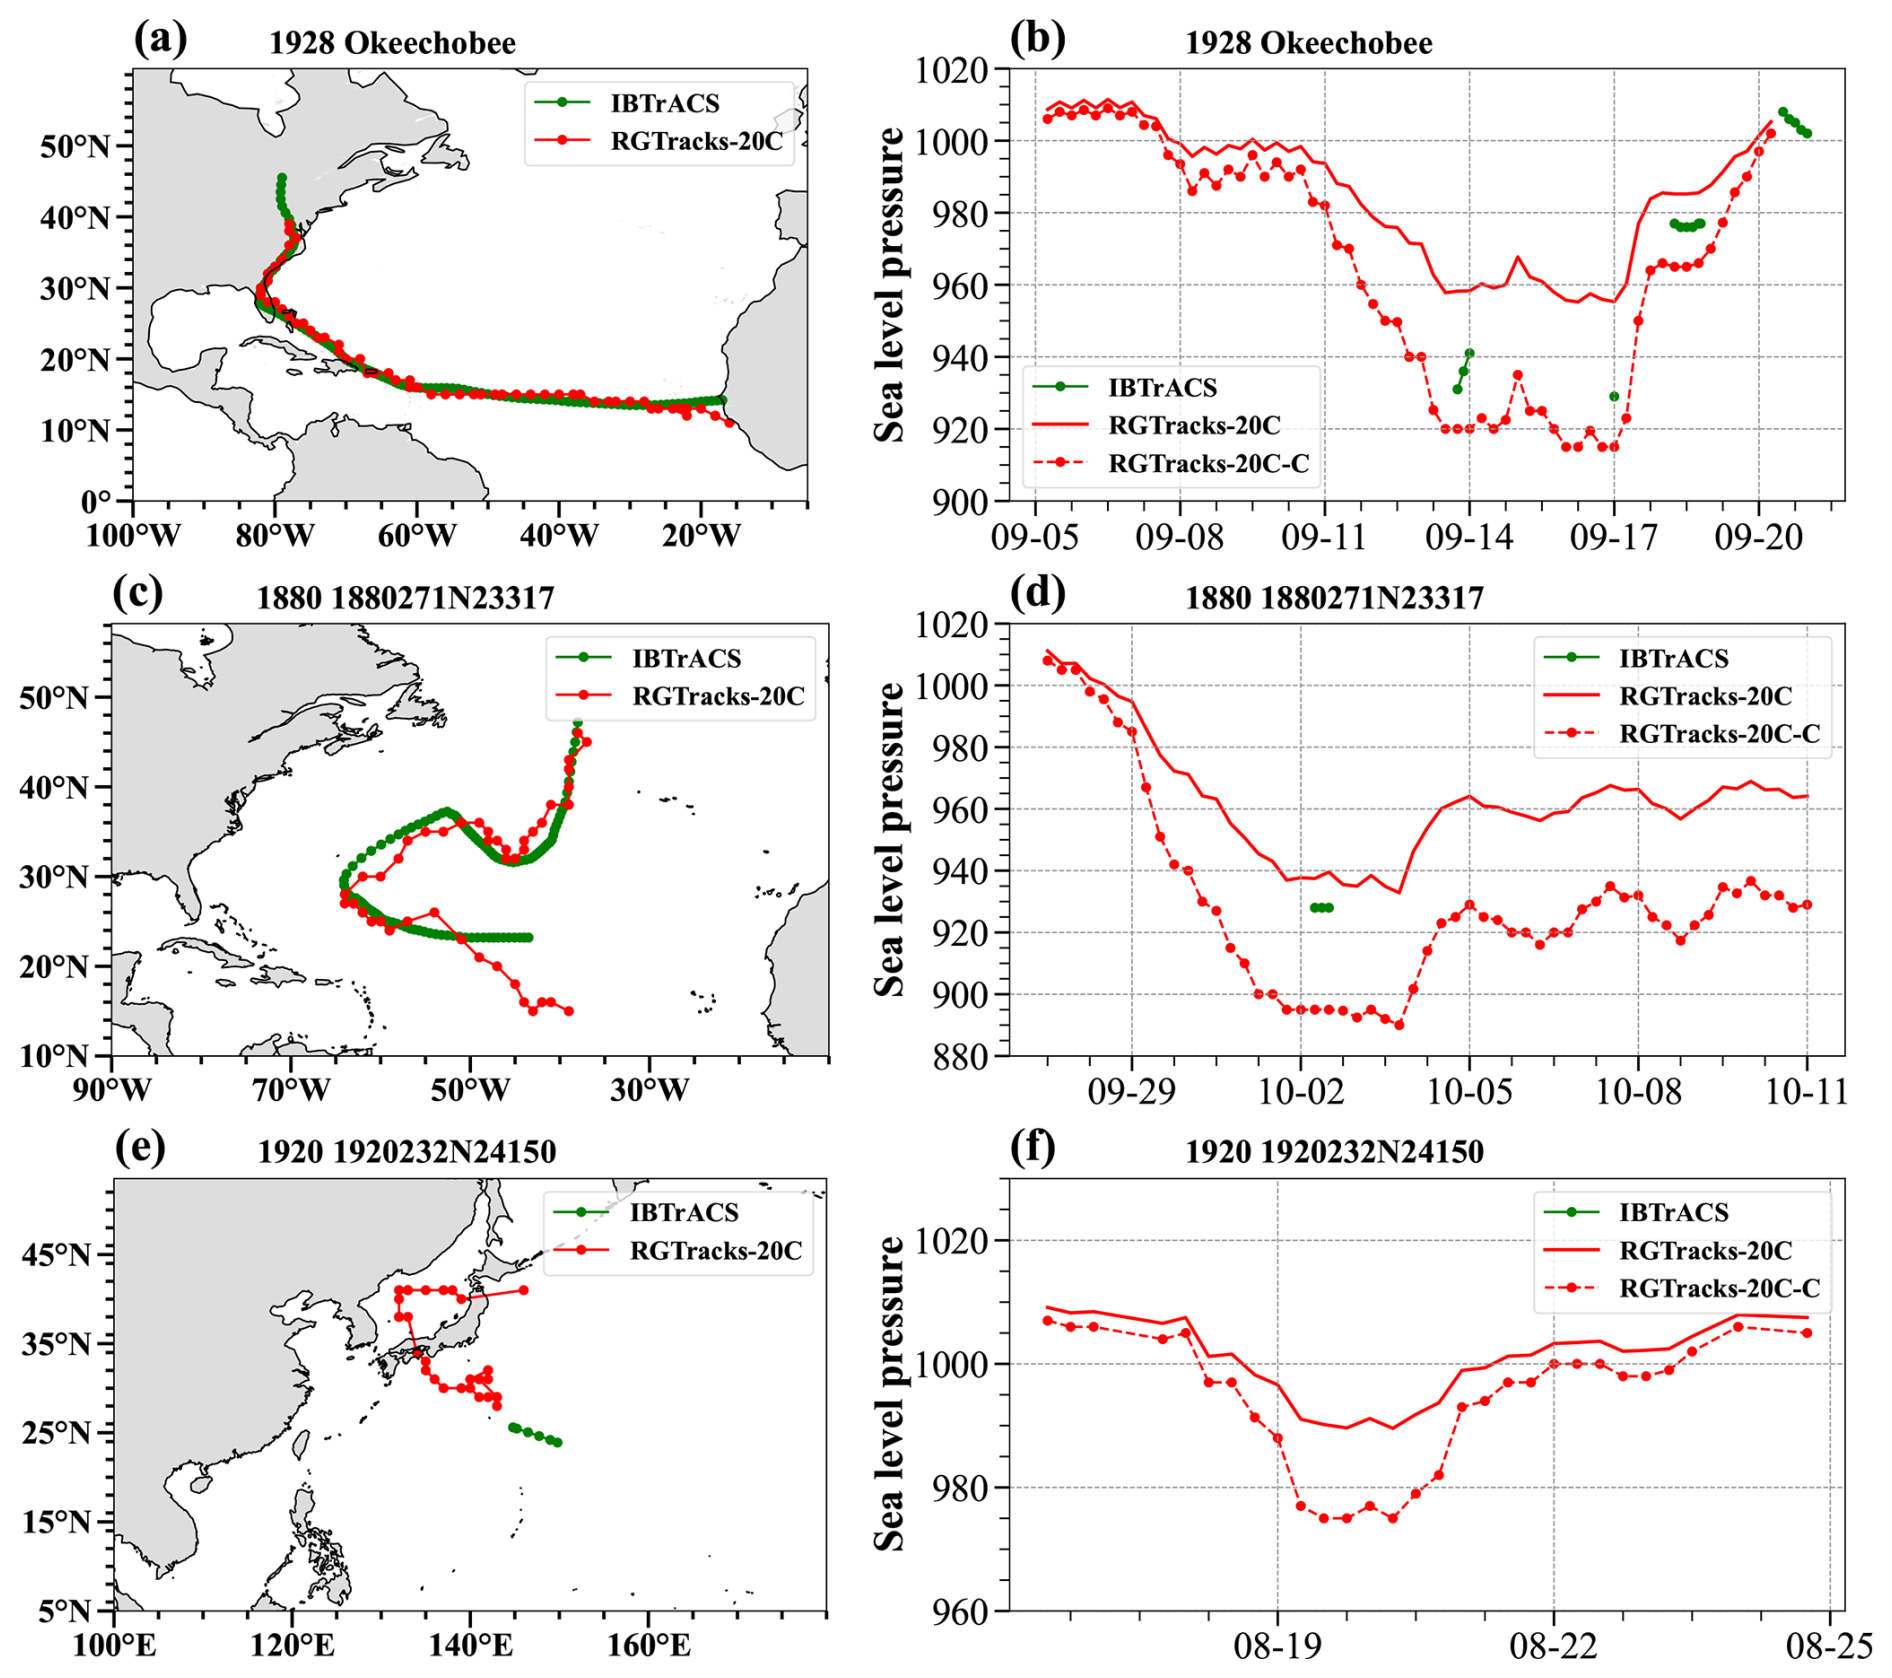
Figure 9As in Fig. 8, but for Hurricane “Okeechobee” (a–b), Hurricane “1880271N23317” (c–d), typhoon “192023N24150” (e–f).
Moreover, prior to the satellite era, the RGTracks-20C often reports a higher number of TCs than the IBTrACS, particularly from the early to mid-20th century (Sect. 6). This does not by itself confirm that every additional system represents a previously undocumented historical TC, but it does suggest that RGTracks-20C may provide useful supplementary information in periods when the historical observational archive is incomplete. This is in agreement with previous attempts at correcting historical biases (Vecchi and Knutson, 2008). These case studies, therefore, illustrate one of the main strengths of the current version of RGTracks-20C, that is, its potential to extend and complement the historical record of TC track and intensity information during early periods with sparse observations.
In this study, we introduce RGTracks-20C, a century-long reanalysis-based global TC dataset for the period 1850–2014. The evaluations above suggest that RGTracks-20C provides a reasonable representation of TC climatology and interannual variability at both global and basin scales during the modern observational era. One important strength of the dataset is its potential to provide supplementary track and intensity information for earlier periods when the historical record is sparse or incomplete.
At the same time, several points should be considered when interpreting or using the current version of RGTracks-20C.
-
TC intensity in RGTracks-20C remains relatively uncertain, compared with TC occurrence and track information. Although a bias correction based on quantile mapping was applied to reduce the low-intensity bias in 20CRv3, the corrected intensity should still be interpreted with caution, especially for weaker systems and for analyses requiring finer distinctions in storm intensity (Hodges et al., 2017). Given the relatively large uncertainties in wind fields, the wind information in the current version of RGTracks-20C should be used with caution.
-
Second, discrepancies between RGTracks-20C and IBTrACS in certain basins should not be attributed entirely to limitations of RGTracks-20C. The observational record itself carries uncertainties arising from changes in monitoring technology and data sources over time, which vary considerably across basins (Chan et al., 2022b; Torn and Snyder, 2012) (Table S3). These uncertainties are most pronounced in the ENP and NI basins, where the reliability of IBTrACS has changed substantially over time. Users are therefore advised to exercise particular caution when applying RGTracks-20C in these two regions.
-
Two characteristics of the underlying reanalysis should be noted. The use of the ensemble mean field of 20CRv3 introduces a smoothing effect that tends to weaken the representation of intense TCs (Emanuel, 2024), contributing to the residual low-intensity bias in RGTracks-20C even after bias correction. In addition, the number of assimilated observations in 20CRv3, including TC-related records from IBTrACS, increases substantially over time, particularly after the mid-twentieth century (Figs. S14–S15; Slivinski et al., 2019, 2021), meaning that the reliability of RGTracks-20C is higher in more recent decades than in the early record (Fig. S15). The growth in TC counts during the mid-twentieth century in both datasets is, moreover, substantially driven by improvements in observational technology rather than actual changes in TC activity. Users are therefore advised to exercise caution when examining long-term trends in TC activity, particularly before 1950.
-
TC tracking algorithms also introduce uncertainties into the dataset. In RGTracks-20C, the OWZ tracker is used as the primary tracking algorithm, as it demonstrates overall stability in TC detection and produces TC counts and TC days that are in closer agreement with IBTrACS at the global scale (Bourdin et al., 2022). It should be noted that globally uniform tracking thresholds were applied across all basins. Given the structural diversity of TCs and the influence of regional meteorological conditions and topography, this may affect detection accuracy in certain regions (Fu et al., 2021; Raavi and Walsh, 2020a, b). More broadly, different tracking algorithms applied to the same reanalysis can yield notably different results in terms of TC counts, track duration, and intensity distributions (Flaounas et al., 2023; Han and Ullrich, 2025). Users should therefore be aware that the TC statistics derived from RGTracks-20C are to some extent dependent on the choice of tracking algorithm and thresholds, and results may differ from those obtained using alternative approaches.
The RGTracks-20C dataset is publicly available through Zenodo. The concept DOI representing all versions is https://doi.org/10.5281/zenodo.8410596 (Ye et al., 2024b), while the specific version used in this study is archived at https://doi.org/10.5281/zenodo.14411917 (Ye et al., 2024a). The Other datasets utilized in this study are available: the IBTrACS at https://www.ncdc.noaa.gov/ibtracs/ (last access: 12 December 2025); and the 20CRv3 at https://psl.noaa.gov/data/gridded/data.20thC_ReanV3.html (last access: 12 December 2025). Historical weather chart of the 1920 typhoon that made landfall in Japan from https://agora.ex.nii.ac.jp/cgi-bin/weather-chart/calendar.pl?year=1920&month=8&lang=en&type=as (last access: 20 May 2026).
Bourdin (2022) provided the code for the UZ and OWZ algorithms, which are available at https://doi.org/10.5281/zenodo.7193463. TempestExtremes can be downloaded from https://climate.ucdavis.edu/tempestextremes.php (last access: 12 December 2024), and version 1.5.2 is used for this study.
In this paper, we introduce the first version of RGTracks-20C, a century-long reanalysis-based global TC dataset constructed primarily from the OWZ tracker applied to 20CRv3. Comparisons with IBTrACS over 1979–2014 show that RGTracks-20C provides a reasonable representation of TC climatology and interannual variability at both the global scale and across most major ocean basins during the period, when the observational record is relatively more complete. These evaluations suggest that the current version of RGTracks-20C can serve as a useful supplementary dataset for representing TC number, TC days, track location, duration, and intensity (SLPmin). The case studies further illustrate the main strength of the current version of RGTracks-20C. For well-observed storms in the modern era, RGTracks-20C shows good agreement with the observed evolution of TC tracks and intensity after bias correction. More importantly, for earlier periods with sparse or incomplete observations, RGTracks-20C can provide supplementary information on TC track and intensity evolution where the historical record is incomplete. In this sense, the present dataset is particularly valuable for augmenting the limited observational record prior to the satellite era. The results presented here indicate that RGTracks-20C provides a useful basis for extending information on historical TC activity into the pre-satellite era and for supporting future studies of TC activity and historical events.
The supplement related to this article is available online at https://doi.org/10.5194/essd-18-3587-2026-supplement.
GY: methodology, formal analysis, data curation, visualization, software, and writing: original draft. JCHL and BZ: supervision, conceptualization, methodology, formal analysis, funding acquisition, and writing – review and editing. WD: supervision, funding acquisition, and writing: review and editing. RT: supervision, manuscript structure refinement, and writing: review and editing. JX, WL, WQ, and HK: writing: review and editing. All authors contributed to reviewing and editing the final version of the manuscript.
The contact author has declared that none of the authors has any competing interests.
Publisher's note: Copernicus Publications remains neutral with regard to jurisdictional claims made in the text, published maps, institutional affiliations, or any other geographical representation in this paper. The authors bear the ultimate responsibility for providing appropriate place names. Views expressed in the text are those of the authors and do not necessarily reflect the views of the publisher.
The authors sincerely thank Dr. Stella Bourdin from the Laboratoire des Sciences du Climat et de l'Environnement, Institut Pierre Simon Laplace (LSCE-IPSL), Gif-sur-Yvette, for her invaluable assistance and guidance on the TC trackers. The authors are very grateful to Dr. Jennifer Gahtan from NOAA's National Center for Environmental Information for providing information about the starting years of the minimum central pressure in the IBTrACS. The authors are grateful to Yushan Han from the University of California, Davis for providing valuable assistance with the System for Classification of Low-Pressure Systems (SyCLoPS) algorithm. The authors thank for the technical support of the National Large Scientific and Technological Infrastructure “Earth System Numerical Simulation Facility” (https://cstr.cn/31134.02.EL, last access: 12 December 2024).
This study is primarily supported by the Innovation Group Project of Southern Marine Science and Engineering Guangdong Laboratory (Zhuhai) (grant no. 311024009). JX is supported by the National Natural Science Foundation of China (grant no. 72293604). GY and WD are also supported by the National Natural Science Foundation of China (grant nos. 42261144687 and U21A6001) and Project supported by Southern Marine Science and Engineering Guangdong Laboratory (Zhuhai) (grant no. SML2024SP011). GY, JCHL, JX, WL, WQ, and BZ are supported by the Guangdong Province Introduction of Innovative R&D Team Project China (grant no. 2019ZT08G669). JCHL is supported by the National Natural Science Foundation of China (grant no. 42405038) and the Guangdong Basic and Applied Basic Research Foundation (grant no. 2020A1515110275). RT was supported by the Natural Environmental Research Council 289 (grant no. NE/W009587/1).
This paper was edited by Graciela Raga and reviewed by Christopher W. Landsea and two anonymous referees.
Aarons, Z. S., Camargo, S. J., Strong, J. D. O., and Murakami, H.: Tropical cyclone characteristics in the MERRA-2 reanalysis and AMIP simulations, Earth Space Sci., 8, e2020EA001415, https://doi.org/10.1029/2020EA001415, 2021.
Bell, S. S., Chand, S. S., Tory, K. J., and Turville, C.: Statistical Assessment of the OWZ tropical cyclone tracking scheme in ERA-Interim, J. Climate, 31, 2217–2232, https://doi.org/10.1175/JCLI-D-17-0548.1, 2018.
Bhatia, K. T., Vecchi, G. A., Knutson, T. R., Murakami, H., Kossin, J., Dixon, K. W., and Whitlock, C. E.: Recent increases in tropical cyclone intensification rates, Nat. Commun., 10, 635, https://doi.org/10.1038/s41467-019-08471-z, 2019.
Blake, E. S., Landsea, C., and Gibney, E. J.: The deadliest, costliest, and most intense United States tropical cyclones from 1851 to 2010 (and other frequently requested hurricane facts), https://repository.library.noaa.gov/view/noaa/6929 (last access: 12 December 2024), 2011.
Bloemendaal, N., de Moel, H., Martinez, A. B., Muis, S., Haigh, I. D., van der Wiel, K., Haarsma, R. J., Ward, P. J., Roberts, M. J., Dullaart, J. C. M., and Aerts, J. C. J. H.: A globally consistent local-scale assessment of future tropical cyclone risk, Science Advances, 8, eabm8438, https://doi.org/10.1126/sciadv.abm8438, 2022.
Bourdin, S., Fromang, S., Dulac, W., Cattiaux, J., and Chauvin, F.: Intercomparison of Four Tropical Cyclones Detection Algorithms on ERA5 – Code and Data (Version v2), Zenodo [code, data set], https://doi.org/10.5281/zenodo.7193463, 2022.
Bourdin, S., Fromang, S., Dulac, W., Cattiaux, J., and Chauvin, F.: Intercomparison of four algorithms for detecting tropical cyclones using ERA5, Geosci. Model Dev., 15, 6759–6786, https://doi.org/10.5194/gmd-15-6759-2022, 2022.
Chan, J. C. L.: Frequency and intensity of landfalling tropical cyclones in East Asia: Past variations and future projections, Meteorology, 2, 171–190, https://doi.org/10.3390/meteorology2020012, 2023.
Chan, K. T. F.: Are global tropical cyclones moving slower in a warming climate?, Environ. Res. Lett., 14, 104015, https://doi.org/10.1088/1748-9326/ab4031, 2019.
Chan, K. T. F., Zhang, K., Wu, Y., and Chan, J. C. L.: Publisher Correction: Landfalling hurricane track modes and decay, Nature, 608, E14–E14, https://doi.org/10.1038/s41586-022-05078-1, 2022a.
Chan, K. T. F., Chan, J. C. L., Zhang, K., and Wu, Y.: Uncertainties in tropical cyclone landfall decay, NPJ Clim. Atmos. Sci., 5, 1–8, https://doi.org/10.1038/s41612-022-00320-z, 2022b.
Chand, S. S., Walsh, K. J. E., Camargo, S. J., Kossin, J. P., Tory, K. J., Wehner, M. F., Chan, J. C. L., Klotzbach, P. J., Dowdy, A. J., Bell, S. S., Ramsay, H. A., and Murakami, H.: Declining tropical cyclone frequency under global warming, Nat. Clim. Change, 12, 655–661, https://doi.org/10.1038/s41558-022-01388-4, 2022.
Chang, E. K. M. and Guo, Y.: Is the number of North Atlantic tropical cyclones significantly underestimated prior to the availability of satellite observations?, Geophys. Res. Lett., 34, L14801, https://doi.org/10.1029/2007GL030169, 2007.
Chavas, D. R., Reed, K. A., and Knaff, J. A.: Physical understanding of the tropical cyclone wind-pressure relationship, Nat. Commun., 8, 1360, https://doi.org/10.1038/s41467-017-01546-9, 2017.
Cid, A., Camus, P., Castanedo, S., Méndez, F. J., and Medina, R.: Global reconstructed daily surge levels from the 20th Century Reanalysis (1871–2010), Global Planet. Change, 148, 9–21, https://doi.org/10.1016/j.gloplacha.2016.11.006, 2017.
Compo, G. P., Slivinski, L. C., Whitaker, J. S., Sardeshmukh, P. D., McColl, C., Brohan, P., Allan, R., Yin, X., Vose, R., Spencer, L. J., Ashcroft, L., Bronnimann, S., Brunet, M., Camuffo, D., Cornes, R., Cram, T. A., Crouthamel, R., Dominguez-Castro, F., Freeman, J. E., Gergis, J., Giese, B. S., Hawkins, E. Jones, P. D., Jourdain, S., Kaplan, A., Kennedy, J., Kubota, H., Blancq, F. L., Lee, T., Lorrey, A., Luterbacher, J., Maugeri, M., Mock, C. J., Moore, K., Przybylak, R., Pudmenzky, C., Reason, C., Slonosky, V. C., Tinz, B., Titchner, H., Trewin, B., Valente, M. A., Wang, X. L., Wilkinson, C., Wood, K., and Wyszynski, P.: The International Surface Pressure Databank version 4. Research Data Archive at the National Center for Atmospheric Research, Computational and Information Systems Laboratory, http://rda.ucar.edu/datasets/ds132.2/ (last access: 12 December 2024), 2019.
Compo, G. P., Whitaker, J. S., Sardeshmukh, P. D., Matsui, N., Allan, R. J., Yin, X., Gleason, B. E., Vose, R. S., Rutledge, G., Bessemoulin, P., Brönnimann, S., Brunet, M., Crouthamel, R. I., Grant, A. N., Groisman, P. Y., Jones, P. D., Kruk, M. C., Kruger, A. C., Marshall, G. J., Maugeri, M., Mok, H. Y., Nordli, Ø., Ross, T. F., Trigo, R. M., Wang, X. L., Woodruff, S. D., and Worley, S. J.: The Twentieth Century Reanalysis Project, Q. J. Roy. Meteor. Soc., 137, 1–28, https://doi.org/10.1002/qj.776, 2011.
Cram, T. A., Compo, G. P., Yin, X., Allan, R. J., McColl, C., Vose, R. S., Whitaker, J. S., Matsui, N., Ashcroft, L., Auchmann, R., Bessemoulin, P., Brandsma, T., Brohan, P., Brunet, M., Comeaux, J., Crouthamel, R., Gleason Jr., B. E., Groisman, P. Y., Hersbach, H., Jones, P. D., Jónsson, T., Jourdain, S., Kelly, G., Knapp, K. R., Kruger, A., Kubota, H., Lentini, G., Lorrey, A., Lott, N., Lubker, S. J., Luterbacher, J., Marshall, G. J., Maugeri, M., Mock, C. J., Mok, H. Y., Nordli, Ø., Rodwell, M. J., Ross, T. F., Schuster, D., Srnec, L., Valente, M. A., Vizi, Z., Wang, X. L., Westcott, N., Woollen, J. S., and Worley, S. J.: The International Surface Pressure Databank version 2, Geosci. Data J., 2, 31–46, https://doi.org/10.1002/gdj3.25, 2015.
Dinan, T.: Projected increases in hurricane damage in the United States: The role of climate change and coastal development, Ecol. Econ., 138, 186–198, https://doi.org/10.1016/j.ecolecon.2017.03.034, 2017.
Emanuel, K.: The Hurricane–Climate Connection, B. Am. Meteorol. Soc., 89, ES10–ES20, https://doi.org/10.1175/BAMS-89-5-Emanuel, 2008.
Emanuel, K.: Tropical cyclone activity downscaled from NOAA-CIRES Reanalysis, 1908–1958, J. Adv. Model. Earth Sy., 2, https://doi.org/10.3894/JAMES.2010.2.1, 2010.
Emanuel, K.: Will global warming make hurricane forecasting more difficult?, B. Am. Meteorol. Soc., 98, 495–501, https://doi.org/10.1175/BAMS-D-16-0134.1, 2017.
Emanuel, K.: 100 Years of progress in tropical cyclone research, Meteor. Mon., 59, 15.1–15.68, https://doi.org/10.1175/AMSMONOGRAPHS-D-18-0016.1, 2018.
Emanuel, K.: Atlantic tropical cyclones downscaled from climate reanalyses show increasing activity over past 150 years, Nat. Commun., 12, 7027, https://doi.org/10.1038/s41467-021-27364-8, 2021.
Emanuel, K.: Limitations of reanalyses for detecting tropical cyclone trends, Nat. Clim. Change, 14, 143–145, https://doi.org/10.1038/s41558-023-01879-y, 2024.
Faranda, D., Messori, G., Bourdin, S., Vrac, M., Thao, S., Riboldi, J., Fromang, S., and Yiou, P.: Correcting biases in tropical cyclone intensities in low-resolution datasets using dynamical systems metrics, Clim. Dynam., https://doi.org/10.1007/s00382-023-06794-8, 2023.
Flaounas, E., Aragão, L., Bernini, L., Dafis, S., Doiteau, B., Flocas, H., Gray, S. L., Karwat, A., Kouroutzoglou, J., Lionello, P., Miglietta, M. M., Pantillon, F., Pasquero, C., Patlakas, P., Picornell, M. Á., Porcù, F., Priestley, M. D. K., Reale, M., Roberts, M. J., Saaroni, H., Sandler, D., Scoccimarro, E., Sprenger, M., and Ziv, B.: A composite approach to produce reference datasets for extratropical cyclone tracks: application to Mediterranean cyclones, Weather Clim. Dynam., 4, 639–661, https://doi.org/10.5194/wcd-4-639-2023, 2023.
Fu, D., Chang, P., Patricola, C. M., Saravanan, R., Liu, X., and Beck, H. E.: Central American mountains inhibit eastern North Pacific seasonal tropical cyclone activity, Nat. Commun., 12, 4422, https://doi.org/10.1038/s41467-021-24657-w, 2021.
Gergis, J., Ashcroft, L., and Whetton, P.: A historical perspective on Australian temperature extremes, Clim. Dynam., 55, 843–868, https://doi.org/10.1007/s00382-020-05298-z, 2020.
Han, Y. and Ullrich, P. A.: The System for Classification of Low-Pressure Systems (SyCLoPS): An All-In-One objective framework for large-scale data sets, J. Geophys. Res.-Atmos., 130, e2024JD041287, https://doi.org/10.1029/2024JD041287, 2025.
Hassanzadeh, P., Lee, C.-Y., Nabizadeh, E., Camargo, S. J., Ma, D., and Yeung, L. Y.: Effects of climate change on the movement of future landfalling Texas tropical cyclones, Nat. Commun., 11, 3319, https://doi.org/10.1038/s41467-020-17130-7, 2020.
Hoarau, K., Bernard, J., and Chalonge, L.: Intense tropical cyclone activities in the northern Indian Ocean, Int. J. Climatol., 32, 1935–1945, https://doi.org/10.1002/joc.2406, 2012.
Hodges, K., Cobb, A., and Vidale, P. L.: How well are tropical cyclones represented in reanalysis datasets?, J. Climate, 30, 5243–5264, https://doi.org/10.1175/JCLI-D-16-0557.1, 2017.
Horn, M., Walsh, K., Zhao, M., Camargo, S. J., Scoccimarro, E., Murakami, H., Wang, H., Ballinger, A., Kumar, A., Shaevitz, D. A., Jonas, J. A., and Oouchi, K.: Tracking scheme dependence of simulated tropical cyclone response to idealized climate simulations, J. Climate, 27, 9197–9213, https://doi.org/10.1175/JCLI-D-14-00200.1, 2014.
Kalnay, E., Kanamitsu, M., Kistler, R., Collins, W., Deaven, D., Gandin, L., Iredell, M., Saha, S., White, G., Woollen, J., Zhu, Y., Chelliah, M., Ebisuzaki, W., Higgins, W., Janowiak, J., Mo, K. C., Ropelewski, C., Wang, J., Leetmaa, A., Reynolds, R., Jenne, R., and Joseph, D.: The NCEP/NCAR 40-Year Reanalysis Project, B. Am. Meteorol. Soc., 77, 437–472, https://doi.org/10.1175/1520-0477(1996)077<0437:TNYRP>2.0.CO;2, 1996.
Klotzbach, P. J. and Landsea, C. W.: Extremely intense hurricanes: Revisiting Webster et al. (2005) after 10 Years, J. Climate, 28, 7621–7629, https://doi.org/10.1175/JCLI-D-15-0188.1, 2015.
Klotzbach, P. J., Bell, M. M., Bowen, S. G., Gibney, E. J., Knapp, K. R., and Schreck, C. J.: Surface pressure a more skillful predictor of normalized hurricane damage than maximum sustained wind, B. Am. Meteorol. Soc., 101, E830–E846, https://doi.org/10.1175/BAMS-D-19-0062.1, 2020.
Knapp, K. R., Kruk, M. C., Levinson, D. H., Diamond, H. J., and Neumann, C. J.: The International Best Track Archive for Climate Stewardship (IBTrACS): Unifying Tropical cyclone data, B. Am. Meteorol. Soc., 91, 363–376, https://doi.org/10.1175/2009BAMS2755.1, 2010.
Knapp, K. R., Diamond, H. J., Kossin, J. P., Kruk, M. C., and Schreck, C. J. I.: International best track archive for climate stewardship (IBTrACS) project, version 4, NOAA National Centers for Environmental Information [data set], https://doi.org/10.25921/82ty-9e16, 2018.
Knutson, T., Camargo, S. J., Chan, J. C. L., Emanuel, K., Ho, C.-H., Kossin, J., Mohapatra, M., Satoh, M., Sugi, M., Walsh, K., and Wu, L.: Tropical cyclones and climate change assessment: part i: Detection and attribution, B. Am. Meteorol. Soc., 100, 1987–2007, https://doi.org/10.1175/BAMS-D-18-0189.1, 2019.
Knutson, T., Camargo, S. J., Chan, J. C. L., Emanuel, K., Ho, C.-H., Kossin, J., Mohapatra, M., Satoh, M., Sugi, M., Walsh, K., and Wu, L.: Tropical cyclones and climate change assessment: Part II: Projected response to anthropogenic warming, B. Am. Meteorol. Soc., 101, E303–E322, https://doi.org/10.1175/BAMS-D-18-0194.1, 2020.
Knutson, T. R., McBride, J. L., Chan, J., Emanuel, K., Holland, G., Landsea, C., Held, I., Kossin, J. P., Srivastava, A. K., and Sugi, M.: Tropical cyclones and climate change, Nat. Geosci., 3, 157–163, https://doi.org/10.1038/ngeo779, 2010.
Knutson, T. R., Sirutis, J. J., Zhao, M., Tuleya, R. E., Bender, M., Vecchi, G. A., Villarini, G., and Chavas, D.: Global projections of intense tropical cyclone activity for the Late Twenty-First Century from dynamical downscaling of CMIP5/RCP4.5 scenarios, J. Climate, 28, 7203–7224, https://doi.org/10.1175/JCLI-D-15-0129.1, 2015.
Kossin, J. P., Knapp, K. R., Olander, T. L., and Velden, C. S.: Global increase in major tropical cyclone exceedance probability over the past four decades, P. Natl. Acad. Sci. USA, 117, 11975–11980, https://doi.org/10.1073/pnas.1920849117, 2020.
Kunze, S.: Unraveling the effects of tropical cyclones on economic sectors worldwide: Direct and indirect impacts, Environ. Resour. Econ., 78, 545–569, https://doi.org/10.1007/s10640-021-00541-5, 2021.
Lai, Y., Li, J., Gu, X., Chen, Y. D., Kong, D., Gan, T. Y., Liu, M., Li, Q., and Wu, G.: Greater flood risks in response to slowdown of tropical cyclones over the coast of China, P. Natl. Acad. Sci. USA, 117, 14751–14755, https://doi.org/10.1073/pnas.1918987117, 2020.
Laloyaux, P., de Boisseson, E., Balmaseda, M., Bidlot, J.-R., Broennimann, S., Buizza, R., Dalhgren, P., Dee, D., Haimberger, L., Hersbach, H., Kosaka, Y., Martin, M., Poli, P., Rayner, N., Rustemeier, E., and Schepers, D.: CERA-20C: A coupled reanalysis of the Twentieth Century, J. Adv. Model. Earth Sy., 10, 1172–1195, https://doi.org/10.1029/2018MS001273, 2018.
Landsea, C.: Counting Atlantic tropical cyclones back to 1900, Eos Transactions American Geophysical Union, 88, 197–202, https://doi.org/10.1029/2007EO180001, 2007.
Landsea, C. W., Harper, B. A., Hoarau, K., and Knaff, J. A.: Can we detect trends in extreme tropical cyclones?, Science, 313, 452–454, https://doi.org/10.1126/science.1128448, 2006.
Landsea, C. W., Glenn, D. A., Bredemeyer, W., Chenoweth, M., Ellis, R., Gamache, J., Hufstetler, L., Mock, C., Perez, R., Prieto, R., S¨¢nchez-Sesma, J., Thomas, D., and Woolcock, L.: A Reanalysis of the 1911–20 Atlantic hurricane database, J. Climate, 21, 2138–2168, https://doi.org/10.1175/2007JCLI1119.1, 2008.
Landsea, C. W., Vecchi, G. A., Bengtsson, L., and Knutson, T. R.: Impact of Duration Thresholds on Atlantic tropical cyclone counts, J. Climate, 23, 2508–2519, https://doi.org/10.1175/2009JCLI3034.1, 2010.
Lanzante, J. R.: Uncertainties in tropical-cyclone translation speed, Nature, 570, E6–E15, https://doi.org/10.1038/s41586-019-1223-2, 2019.
Lee, R., Chen, L., and Ren, G.: A comparison of East-Asia landfall tropical cyclone in recent reanalysis datasets–before and after satellite era, Front. Earth Sci., 10, 1026945, https://doi.org/10.3389/feart.2022.1026945, 2023.
Lee, T.-C., Knutson, T. R., Nakaegawa, T., Ying, M., and Cha, E. J.: Third assessment on impacts of climate change on tropical cyclones in the Typhoon Committee Region – Part I: Observed changes, detection and attribution, Trop. Cyclone Res. Rev., 9, 1–22, https://doi.org/10.1016/j.tcrr.2020.03.001, 2020.
Lenzen, M., Malik, A., Kenway, S., Daniels, P., Lam, K. L., and Geschke, A.: Economic damage and spillovers from a tropical cyclone, Nat. Hazards Earth Syst. Sci., 19, 137–151, https://doi.org/10.5194/nhess-19-137-2019, 2019.
Leung, J. C.-H., Qian, W., Zhang, P., and Zhang, B.: Geopotential-based Multivariate MJO Index: extending RMM-like indices to pre-satellite era, Clim. Dynam., 59, 609–631, https://doi.org/10.1007/s00382-022-06142-2, 2022.
Li, J., Tian, Q., Shen, Z., Xu, Y., Yan, Z., Li, M., Zhu, C., Xue, J., Lin, Z., Yang, Y., and Zeng, L.: Fidelity of global tropical cyclone activity in a new reanalysis dataset (CRA40), Meteorol. Appl., 31, e70009, https://doi.org/10.1002/met.70009, 2024.
Li, Y., Tang, Y., Li, X., Song, X., and Wang, Q.: Recent increase in the potential threat of western North Pacific tropical cyclones, NPJ Clim. Atmos. Sci., 6, 1–8, https://doi.org/10.1038/s41612-023-00379-2, 2023.
Malakar, P., Kesarkar, A. p., Bhate, J. N., Singh, V., and Deshamukhya, A.: Comparison of reanalysis data sets to comprehend the evolution of tropical cyclones over North Indian Ocean, Earth Space Sci., 7, e2019EA000978, https://doi.org/10.1029/2019EA000978, 2020.
Mann, M. E., Sabbatelli, T. A., and Neu, U.: Evidence for a modest undercount bias in early historical Atlantic tropical cyclone counts, Geophys. Res. Lett, 34, L22707, https://doi.org/10.1029/2007GL031781, 2007.
Mitchell, C. L.: The West Indian hurricane of September 10–20, 1928, Mon. Weather Rev., 56, 347–350, https://doi.org/10.1175/1520-0493(1928)56<347:TWIHOS>2.0.CO;2, 1928.
Moon, I.-J., Kim, S.-H., and Chan, J. C. L.: Climate change and tropical cyclone trend, Nature, 570, E3–E5, https://doi.org/10.1038/s41586-019-1222-3, 2019.
Moon, M., Ha, K.-J., Kim, D., Ho, C.-H., Park, D.-S. R., Chu, J.-E., Lee, S.-S., and Chan, J. C. L.: Rainfall strength and area from landfalling tropical cyclones over the North Indian and western North Pacific oceans under increased CO2 conditions, Weather Clim. Extrem., 41, 100581, https://doi.org/10.1016/j.wace.2023.100581, 2023.
Moore, G. W. K. and Babij, M.: Iceland's Great Frost Winter of 1917/1918 and its representation in reanalyses of the twentieth century, Q. J. Roy. Meteor. Soc., 143, 508–520, https://doi.org/10.1002/qj.2939, 2017.
Murakami, H.: Tropical cyclones in reanalysis data sets, Geophys. Res. Lett., 41, 2133–2141, https://doi.org/10.1002/2014GL059519, 2014.
Murakami, H. and Wang, B.: Patterns and frequency of projected future tropical cyclone genesis are governed by dynamic effects, Commun. Earth Environ., 3, 1–10, https://doi.org/10.1038/s43247-022-00410-z, 2022.
Noy, I.: The socio-economics of cyclones, Nat. Clim. Change, 6, 343–345, https://doi.org/10.1038/nclimate2975, 2016.
Parker, W. S.: Reanalyses and Observations: What's the difference?, B. Am. Meteorol. Soc., 97, 1565–1572, https://doi.org/10.1175/BAMS-D-14-00226.1, 2016.
Pimm, S. L., Davis, G. E., Loope, L., Roman, C. T., Smith, T. J., and Tilmant, J. T.: Hurricane Andrew, BioScience, 44, 224–229, https://doi.org/10.2307/1312226, 1994.
Qin, L., Zhu, L., Liu, B., Li, Z., Tian, Y., Mitchell, G., Shen, S., Xu, W., and Chen, J.: Global expansion of tropical cyclone precipitation footprint, Nat. Commun., 15, 4824, https://doi.org/10.1038/s41467-024-49115-1, 2024.
Raavi, P. H. and Walsh, K. J. E.: Basinwise statistical analysis of factors limiting tropical storm formation from an initial tropical circulation, J. Geophys. Res.-Atmos., 125, e2019JD032006, https://doi.org/10.1029/2019JD032006, 2020a.
Raavi, P. H. and Walsh, K. J. E.: Sensitivity of tropical cyclone formation to resolution-dependent and independent tracking schemes in High-Resolution Climate Model simulations, Earth Space Sci., 7, e2019EA000906, https://doi.org/10.1029/2019EA000906, 2020b.
Roberts, M. J., Camp, J., Seddon, J., Vidale, P. L., Hodges, K., Vanni¨¨re, B., Mecking, J., Haarsma, R., Bellucci, A., Scoccimarro, E., Caron, L.-P., Chauvin, F., Terray, L., Valcke, S., Moine, M.-P., Putrasahan, D., Roberts, C. D., Senan, R., Zarzycki, C., Ullrich, P., Yamada, Y., Mizuta, R., Kodama, C., Fu, D., Zhang, Q., Danabasoglu, G., Rosenbloom, N., Wang, H., and Wu, L.: Projected Future Changes in Tropical Cyclones Using the CMIP6 HighResMIP Multimodel Ensemble. Geophys. Res. Lett., 47, e2020GL088662, https://doi.org/10.1029/2020GL088662
Schreck, C. J., Knapp, K. R., and Kossin, J. P.: The impact of best track discrepancies on global tropical cyclone climatologies using IBTrACS, Mon. Weather Rev., 142, 3881–3899, https://doi.org/10.1175/MWR-D-14-00021.1, 2014.
Sharmila, S. and Walsh, K. J. E.: Recent poleward shift of tropical cyclone formation linked to Hadley cell expansion, Nat. Clim. Change, 8, 730–736, https://doi.org/10.1038/s41558-018-0227-5, 2018.
Slivinski, L. C.: Historical Reanalysis: What, How, and Why?, J. Adv. Model. Earth Sy., 10, 1736–1739, https://doi.org/10.1029/2018MS001434, 2018.
Slivinski, L. C., Compo, G. P., Whitaker, J. S., Sardeshmukh, P. D., Giese, B. S., McColl, C., Allan, R., Yin, X., Vose, R., Titchner, H., Kennedy, J., Spencer, L. J., Ashcroft, L., Brönnimann, S., Brunet, M., Camuffo, D., Cornes, R., Cram, T. A., Crouthamel, R., Domínguez-Castro, F., Freeman, J. E., Gergis, J., Hawkins, E., Jones, P. D., Jourdain, S., Kaplan, A., Kubota, H., Blancq, F. L., Lee, T.-C., Lorrey, A., Luterbacher, J., Maugeri, M., Mock, C. J., Moore, G. W. K., Przybylak, R., Pudmenzky, C., Reason, C., Slonosky, V. C., Smith, C. A., Tinz, B., Trewin, B., Valente, M. A., Wang, X. L., Wilkinson, C., Wood, K., and Wyszyński, P.: Towards a more reliable historical reanalysis: Improvements for version 3 of the Twentieth Century Reanalysis system, Q. J. Roy. Meteor. Soc., 145, 2876–2908, https://doi.org/10.1002/qj.3598, 2019.
Slivinski, L. C., Compo, G. P., Sardeshmukh, P. D., Whitaker, J. S., McColl, C., Allan, R. J., Brohan, P., Yin, X., Smith, C. A., Spencer, L. J., Vose, R. S., Rohrer, M., Conroy, R. P., Schuster, D. C., Kennedy, J. J., Ashcroft, L., Bö, S., Brunet, M., Camuffo, D., Cornes, R., Cram, T. A., Domínguez-Castro, F., Freeman, J. E., Gergis, J., Hawkins, E., Jones, P. D., Kubota, H., Lee, T. C., Lorrey, A. M., Luterbacher, J., Mock, C. J., Przybylak, R. K., Pudmenzky, C., Slonosky, V. C., Tinz, B., Trewin, B., Wang, X. L., Wilkinson, C., Wood, K., and Wyszyński, P.: An evaluation of the performance of the Twentieth Century Reanalysis Version 3, J. Climate, 34, 1417–1438, https://doi.org/10.1175/JCLI-D-20-0505.1, 2021.
Sparks, N. and Toumi, R.: The impact of global warming on U.S. hurricane landfall: a storyline approach, Environ. Res. Lett., 20, 114006, https://doi.org/10.1088/1748-9326/ae0956, 2025.
Torn, R. D. and Snyder, C.: Uncertainty of tropical cyclone best-track information, Weather Forecast., 27, 715–729, https://doi.org/10.1175/WAF-D-11-00085.1, 2012.
Tory, K. J., Dare, R. A., Davidson, N. E., McBride, J. L., and Chand, S. S.: The importance of low-deformation vorticity in tropical cyclone formation, Atmos. Chem. Phys., 13, 2115–2132, https://doi.org/10.5194/acp-13-2115-2013, 2013.
Truchelut, R. E. and Hart, R. E.: Quantifying the possible existence of undocumented Atlantic warm-core cyclones in NOAA/CIRES 20th Century Reanalysis data, Geophys. Res. Lett, 38, L08811, https://doi.org/10.1029/2011GL046756, 2011.
Truchelut, R. E., Hart, R. E., and Luthman, B.: Global identification of previously undetected Pre-satellite-era tropical cyclone candidates in NOAA/CIRES Twentieth-Century Reanalysis Data, J. Appl. Meteorol. Clim., 52, 2243–2259, https://doi.org/10.1175/JAMC-D-12-0276.1, 2013.
Tu, S., Xu, J., Chan, J. C. L., Huang, K., Xu, F., and Chiu, L. S.: Recent global decrease in the inner-core rain rate of tropical cyclones, Nat. Commun., 12, 1948, https://doi.org/10.1038/s41467-021-22304-y, 2021.
Tu, S., Chan, J. C. L., Xu, J., Zhong, Q., Zhou, W., and Zhang, Y.: Increase in tropical cyclone rain rate with translation speed, Nat. Commun., 13, 7325, https://doi.org/10.1038/s41467-022-35113-8, 2022.
Ullrich, P. A., Zarzycki, C. M., McClenny, E. E., Pinheiro, M. C., Stansfield, A. M., and Reed, K. A.: TempestExtremes v2.1: a community framework for feature detection, tracking, and analysis in large datasets, Geosci. Model Dev., 14, 5023–5048, https://doi.org/10.5194/gmd-14-5023-2021, 2021.
Vecchi, G. A., and T. R. Knutson.: On Estimates of Historical North Atlantic Tropical Cyclone Activity. J. Climate, 21, 3580–3600, https://doi.org/10.1175/2008JCLI2178.1, 2008.
Wang, S. and Toumi, R.: More tropical cyclones are striking coasts with major intensities at landfall, Sci. Rep., 12, 5236, https://doi.org/10.1038/s41598-022-09287-6, 2022.
Wang, X. L., Feng, Y., and Swail, V.: North Atlantic wave height trends as reconstructed from the 20th century reanalysis, Geophys. Res. Lett., 39, L18705, https://doi.org/10.1029/2012GL053381, 2012.
Yamaguchi, M., Chan, J. C. L., Moon, I.-J., Yoshida, K., and Mizuta, R.: Global warming changes tropical cyclone translation speed, Nat. Commun., 11, 47, https://doi.org/10.1038/s41467-019-13902-y, 2020.
Ye, G., Jeremy Cheuk-Hin, L., Dong, W., Xu, J., Li, W., Qian, W., Kong, H., and Zhang, B.: A Reanalysis-Based Global Tropical Cyclone Tracks Dataset for the Twentieth Century (RGTracks-20C), Zenodo [data set], https://doi.org/10.5281/zenodo.14411917, 2024a.
Ye, G., Leung, J., Dong, W., Xu, J., Li, W., Qian, W., Kong, H., and Zhang, B.: Reanalysis-Based Global Tropical Cyclone Tracks Dataset for the Twentieth Century (RGTracks-20C), Zenodo [data set], https://doi.org/10.5281/zenodo.8410596, 2024b.
Yeasmin, A., Chand, S., and Sultanova, N.: Reconstruction of tropical cyclone and depression proxies for the South Pacific since the 1850s, Weather Clim. Extrem., 39, 100543, https://doi.org/10.1016/j.wace.2022.100543, 2023.
Ying, M., Zhang, W., Yu, H., Lu, X., Feng, J., Fan, Y., Zhu, Y., and Chen, D.: An overview of the China meteorological administration tropical cyclone database, J. Atmos. Ocean. Tech., 31, 287–301, https://doi.org/10.1175/JTECH-D-12-00119.1, 2014.
Yoshida, K., Sugi, M., Mizuta, R., Murakami, H., and Ishii, M.: Future changes in tropical cyclone activity in high-resolution large-ensemble simulations, Geophys. Res. Lett., 44, 9910–9917, https://doi.org/10.1002/2017GL075058, 2017.
Zarzycki, C. M. and Ullrich, P. A.: Assessing sensitivities in algorithmic detection of tropical cyclones in climate data, Geophys. Res. Lett., 44, 1141–1149, https://doi.org/10.1002/2016GL071606, 2017.
Zhang, B., Zhang, R., Pinker, R. T., Feng, Y., Nie, C., and Guan, Y.: Changes of tropical cyclone activity in a warming world are sensitive to sea surface temperature environment, Environ. Res. Lett., 14, 124052, https://doi.org/10.1088/1748-9326/ab5ada, 2019.
Zhang, G.: Warming-induced contraction of tropical convection delays and reduces tropical cyclone formation, Nat. Commun., 14, 6274, https://doi.org/10.1038/s41467-023-41911-5, 2023.
Zhang, X., Duan, Y., Wang, Y., Wei, N., and Hu, H.: A high-resolution simulation of Supertyphoon Rammasun (2014) – Part I: Model verification and surface energetics analysis, Adv. Atmos. Sci., 34, 757–770, https://doi.org/10.1007/s00376-017-6255-7, 2017.
Zhao, M. and Held, I. M.: An analysis of the effect of global warming on the intensity of Atlantic hurricanes using a GCM with statistical refinement, J. Climate, 23, 6382–6393, https://doi.org/10.1175/2010JCLI3837.1, 2010.
Zhu, L. and Quiring, S. M.: Exposure to precipitation from tropical cyclones has increased over the continental United States from 1948 to 2019, Commun. Earth Environ., 3, 312, https://doi.org/10.1038/s43247-022-00639-8, 2022.