the Creative Commons Attribution 4.0 License.
the Creative Commons Attribution 4.0 License.
 | 13 May 2026
The new seismic catalog of the Gargano area (Southern Italy) after a decade of seismic monitoring by OTRIONS network
Andrea Pio Ferreri
Annalisa Romeo
Rossella Giannuzzi
Teresa Ninivaggi
Marilena Filippucci
Gianpaolo Cecere
Luigi Falco
Maddalena Michele
Giulio Selvaggi
Andrea Tallarico
The Gargano Promontory (hereafter GP) has attracted the attention of seismologists in recent years for its peculiarities regarding the high rate of low-magnitude seismicity and focal depths in the lower crust. These peculiarities have been highlighted thanks to the new data provided by the OTRIONS seismic network (hereafter OT), installed in 2013 in the GP area, consisting of 15 short-period seismometers, thanks to a fruitful collaboration between UniBa (University of Bari Aldo Moro) and INGV (Istituto Nazionale di Geofisica e Vulcanologia). The first available seismic catalog referred to the first 7 years of the network operation (2013–2018) and suffered from some technological problems of the acquisition system. Thanks to improvements in the data transmission system, these problems were overcome in 2019 and now the OT network data are available in real time. In order to include the most recent seismicity and to cover the temporal gaps existing in the previous catalog, we thoroughly reviewed the 24 h seismic recordings, collected over the decade after the installation, by employing an automatic detect and picking software (CASP, Complete Automatic Seismic Processor). More than 7100 seismic events were initially identified. Through careful manual review, approximately 60 % were confirmed as local earthquakes, and the others were recognized as quarry blasts or false/poorly-located events. Manual review significantly improved the quality of P- and S-phase picking, and consequently led to more accurate earthquake locations, using both linearized and nonlinear algorithms. The manual review resulted in two catalogs, both released on Mendeley Data (Ferreri et al., 2026) (https://doi.org/10.17632/nhfvx7ysxw.6). This study highlights the value of automatic analysis for compiling a seismic catalog, suggesting that the manual review is still necessary. The quality of the catalogs was assessed in detail using statistical parameters and a new formula for the location quality. The completeness magnitude of the new catalogs is as low as 0.82. The noise affecting the network was also evaluated. This study confirms the importance of the OT local network for seismic hazard analysis and provides a useful dataset for seismotectonic and geophysical studies in a long under-monitored region.
- Article
(23613 KB) - Full-text XML
- BibTeX
- EndNote


Monitoring small to moderate magnitude earthquakes is essential to understand the seismotectonic, seismic hazard and strong-motion characteristics in unexplored regions and to this end, the installation of dense seismic networks is essential. It is observed that the increasingly dense coverage provide better data quality that, together with novel technologies in observational seismology, have significantly improved the earthquake detection capabilities worldwide (refer to Li, 2021 for a review).
Of particular interest for Southern Italy are the examples of installation of permanent or temporary local seismic networks to improve the detection threshold of the Italian National Seismic Network (RSN, Istituto Nazionale di Geofisica e Vulcanologia (INGV), 2005): the Irpinia Seismic Network (ISNet) (Iannaccone et al., 2010); the Ischia local seismic network (Tramelli et al., 2024); the Val d'Agri seismic network INSIEME (Stabile et al., 2020); the Pollino seismic networks (Govoni et al., 2023). From the examples above, without claiming to be exhaustive with respect to the wide diffusion of local networks in Italy and worldwide, it can be argued that the multiplication of seismic stations involves, as a consequence of the large amount of seismic data, a strong effort in terms of human and information technology resources and of a non-trivial increase in costs. The trade-off between scientific benefits and costs, according to Ebel (2008), would require a broader public debate even though it is indubitable the improvement in the seismological knowledge for hazard mitigation and public safety issues. Therefore, earthquake monitoring is the basis of observational seismology and earthquake catalogs are its main product, essential in all the seismological based studies. The amount of continuous data available 24 h moves the seismological community toward automated processing approach to the arrival time picking of P and S waves and to earthquake location.
Recent developments in seismic monitoring include fully automated workflows to construct high-quality earthquake catalogs. Approaches based on Short-Term Average/Long-Term Average (STA/LTA) algorithm for earthquake detection have been used to built several catalogs also recently. Zhou et al. (2022) built the aftershock catalog for the 2019 Ridgecrest, California, earthquake by developing a detection and location architecture, PALM (phase Picking, phase Association, Location, and Matched filter technique). Cattaneo et al. (2017) and Spallarossa et al. (2021) applied the Complete Automatic Seismic Processor (CASP) to different case studies to built the seismic catalogs of Central-Eastern Italy and of the Amatrice earthquake sequence in Central Italy respectively. Zhang et al. (2019) proposed a new algorithm REAL (Rapid Earthquake Association and Location) and applied it to the 2016 Italian seismic crisis by applying a recursive STA/LTA algorithm for phase triggering. Advancements in machine learning techniques and in open-source software have provided new methods for automatic detection increasing the number of detected events and consequently also the number of false events as demonstrated by Ho et al. (2024) when comparing the results in earthquake catalogs built by STA/LTA based and machine learning based approach to detection. The reader can refer to Mousavi and Beroza (2023) for a review of machine learning based approach to earthquake detection and phase picking.
In this paper our focus is on the GP area that belongs to the Apulia region (Southern Italy) which is part of the Adria plate, shown in Fig. 1a (refer to Del Gaudio et al., 2007; Pierri et al., 2025 for a review). GP represents the northernmost sector of the Apulian foreland and is predominantly composed by slightly deformed carbonatic successions (Del Gaudio et al., 2007). A generalized geological map, in which the principal stratigraphic sequences and fault systems of the GP area are represented, is shown in Fig. 1. Several studies have identified some of the major faults, shown in Fig. 1b, like the Mattinata fault (MF) (Chilovi et al., 2000), the Apricena fault (AF) (Patacca and Scandone, 2004), the Candelaro fault (CF) (Mongelli and Ricchetti, 1970), and the Sannicandro fault (SF) (Salvi et al., 1999), although their characteristics and evolution still remain under discussion. In addition, according to Doglioni et al. (1994), the GP is also characterized by a parallel fault system (black lines in Fig. 1b) with an east-west orientation, causing uplift in this region. Six strong earthquakes throughout history, with magnitudes greater than 6, struck the GP area, the biggest of which in 1627 with Mw=6.7 (Rovida et al., 2022) while, in the instrumental era, the seismicity of GP is characterized by low magnitude seismicity with high seismic rate. A Mw=4.8 earthquake occurred in March 2025, the maximum magnitude instrumentally recorded in this area (data from https://terremoti.ingv.it/, last access: 30 May 2025).
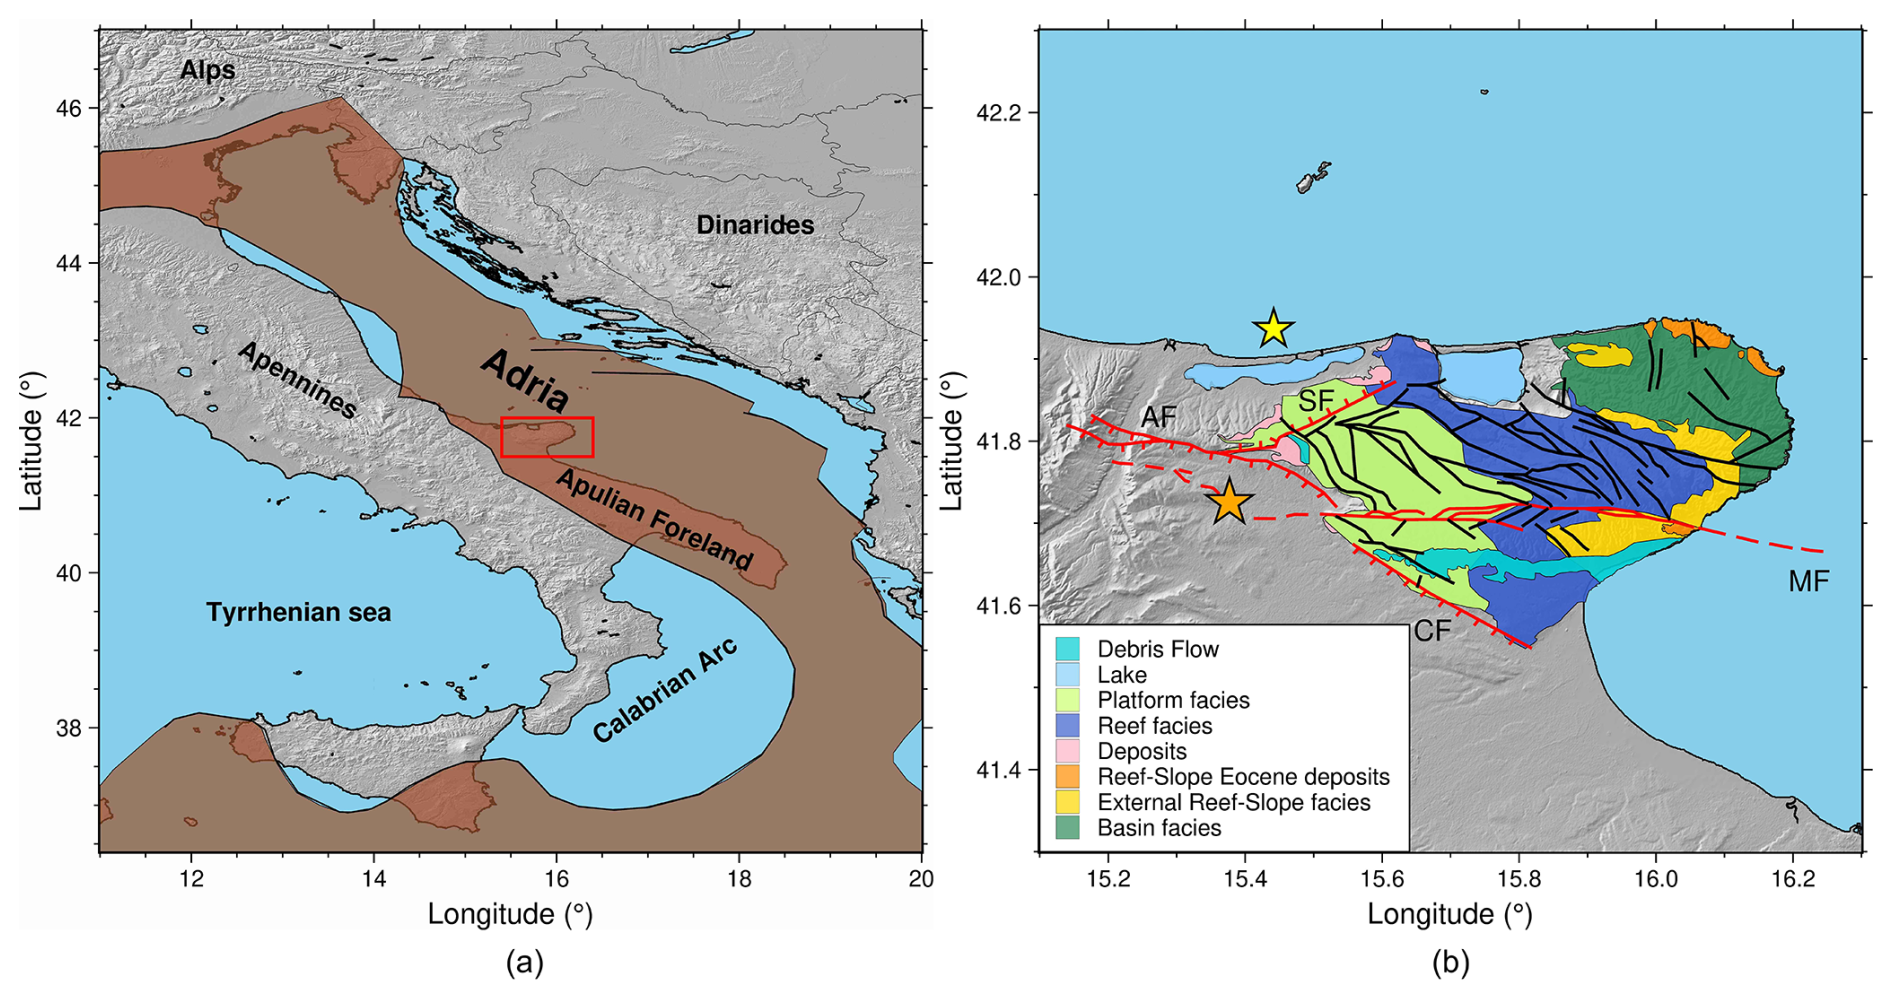
Figure 1(a) Brown area represents the Adria microplate with the studied area of the GP in the red square. (b) Generalized geological map of the GP area highlighting the principal stratigraphic sequences and fault systems: AF, SF, CF and MF refer to Apricena Fault, Sannicandro Fault, Candelaro Fault and Mattinata Fault respectively; black lines refer to other parallel fault systems; orange and yellow stars refer to the Mw=6.7 earthquakes of 1627 and Mw=4.8 earthquake of March 2025 respectively.
In recent years, thanks to the installation of the OT local seismic network (see Sect. 3.1 for an exhaustive description) the seismic monitoring of GP was strongly enhanced allowing the recording and detection of a high number of micro-earthquakes. With the aim of obtaining a more complete catalog of GP seismicity, in this work we adopted the Complete Automatic Seismic Processor (CASP) (Scafidi et al., 2019) to analyze 10 years of seismic recordings, from 2013 to 2022, in non-real time mode. CASP has been proven to be fast in processing big amount of 24 h seismograms, to be reliable in the automatic picking procedure of P and S waves arrival times thus allowing accurate event location. As already used by Spallarossa et al. (2021), the CASP workflow combines sensitive STA/LTA-based triggering method, iterative automatic P- and S-phase picking, non-linear locations with a calibrated 1-D velocity model and an automated local magnitude estimation. The seismic catalog obtained automatically by CASP was manually revised to evaluate the reliability in detection and location. The manual revision of P and S phase arrivals provided two seismic catalogs, by using both linearized (Hypo71) and non-linear (NonLinLoc) algorithms. The quality of the locations was assessed by using the location parameters in a quality factor formula. Magnitudes were also computed by using Di Bona (2016) attenuation law and compared with those obtained by the Hutton and Boore (1987) formulation. An analysis of the performance of the seismic network was assessed.
Despite its tectonic location within the foreland, where low seismic activity is typically expected, recent instrumental data reveal that the GP exhibits a particular low-magnitude seismicity rate, comparable to that of more tectonically active regions such as the Apennines (Del Gaudio et al., 2007; Miccolis et al., 2021). The seismic activity of the GP is predominantly composed by low-magnitude earthquakes, with the strongest earthquake recorded in instrumental era with Mw=4.8 on 14 March 2025 (https://terremoti.ingv.it/, last access: 2 March 2026). However, historical sources documented several stronger earthquakes in the GP region, with magnitudes greater than 6.0 (Del Gaudio et al., 2007) but with missing information relative to their kinematics, making it challenging to attribute them to a specific seismogenic source. This limitation has persisted over time due to the widespread instrumental coverage in the region until the installation of the OTRIONS seismic network in 2013, making a great improvement in local seismic surveillance of this area. This enhanced instrumentation enabled the detection of a significantly greater number of local earthquakes, including micro-earthquakes with magnitudes as low as −1. These observations provided a great improvement in the seismic knowledge of the GP. A first key contribution comes from Filippucci et al. (2020), who analyzed the seismicity recorded by the OTRIONS network for the period from 2013 to 2018, relocating a total of approximately 450 earthquakes. Their analysis revealed that the seismicity in this area is widespread across the GP, not showing any particular clustering in time that is typical of main shock – aftershock sequences, but simply a continuous low-magnitude activity. Most of the earthquakes are shallower than 15 km, although the seismicity extends down to 20 km, indicating deformation for both upper and middle-crust. The focal mechanism solutions have been evaluated suggesting a predominance of normal and strike-slip fault. The inferred fault planes align with previously known NW–SE and E–W structural trends, consistent with the faults trending. Another study was conducted by Miccolis et al. (2021) which considered the analysis of a larger dataset, covering the period from 2013 to 2020, analyzing over 630 relocated earthquakes. They obtained the focal mechanism, performed using the FOCMEC code (Snoke, 2003), confirming the compressive stress regime that characterize the GP. The maximum horizontal stress is oriented NW–SE, in agreement with the regional stress field obtained from geodetic data and the Italian stress map (Montone and Mariucci, 2016). Furthermore, recent thermo-rheological models suggest that the persistent lower-crustal seismicity beneath the GP is primarily controlled by the presence and circulation of mantle-derived fluids, which increase pore pressure and reduce the effective strength of granulite facies rocks, allowing for a greater concentration of earthquakes at depths of approximately 20–30 km, as demonstrated by Lavecchia et al. (2022) and can be the reason for high values of total attenuation as derived from coda Q analysis (Filippucci et al., 2019, 2021a; Lucente et al., 2023). The distribution of hypocentres along a NE-dipping layer has been interpreted as the reactivation of deep structures where fluids can accumulate and be periodically released (Lavecchia et al., 2022). Moreover, Tripaldi (2020) analyzed the shallow seismicity along the CF area of the GP attributing it to an anomalously high surface heat flow values (> 100 mW m−2), sustained by fluid circulation in the sedimentary cover and upper crust. This behavior emphasizes the crucial role of fluids in both deep and shallow seismicity across the GP region.
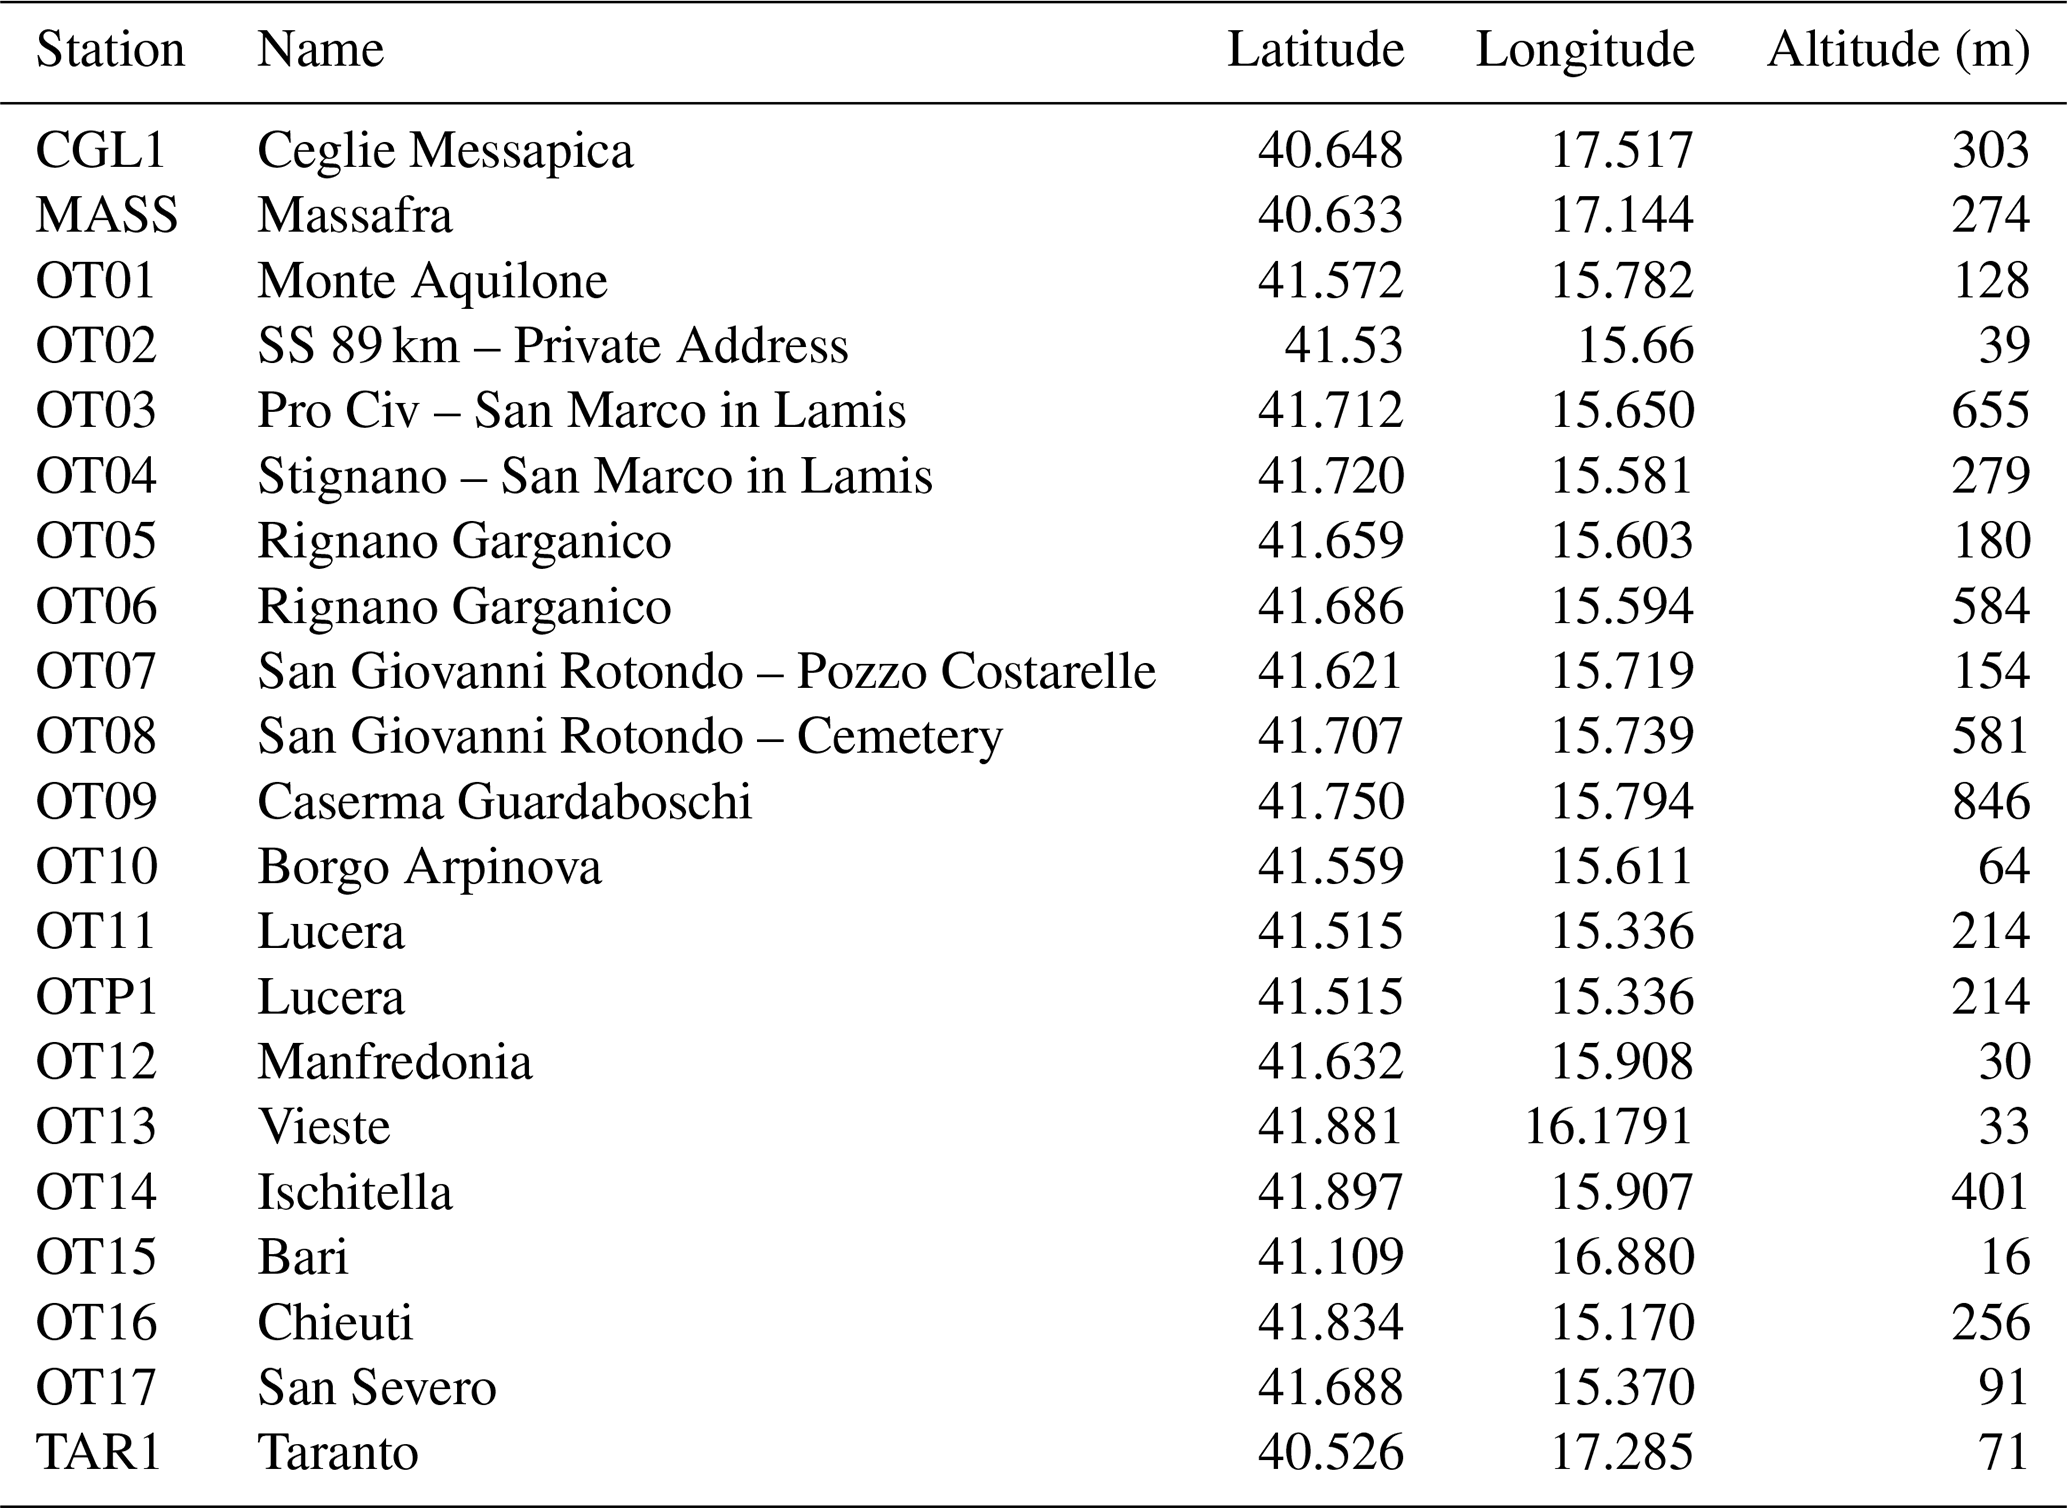
The microseismicity in the Gargano Promontory and surroundings is monitored by the OTRIONS Seismic Network (FDSN code OT, University of Bari “Aldo Moro”, 2013), managed by UniBa (Tallarico, 2015), and by the Rete Sismica Nazionale (FDSN code IV, Istituto Nazionale di Geofisica e Vulcanologia (INGV), 2005) managed by INGV. In this paper, we will refer to the Gargano Seismic Network (hereafter GSN) as to a network for the seismic monitoring of the GP area that includes 11 selected stations of the OT network and 10 selected stations of the IV network (Fig. 2) resulting in a very dense network optimized for this study.
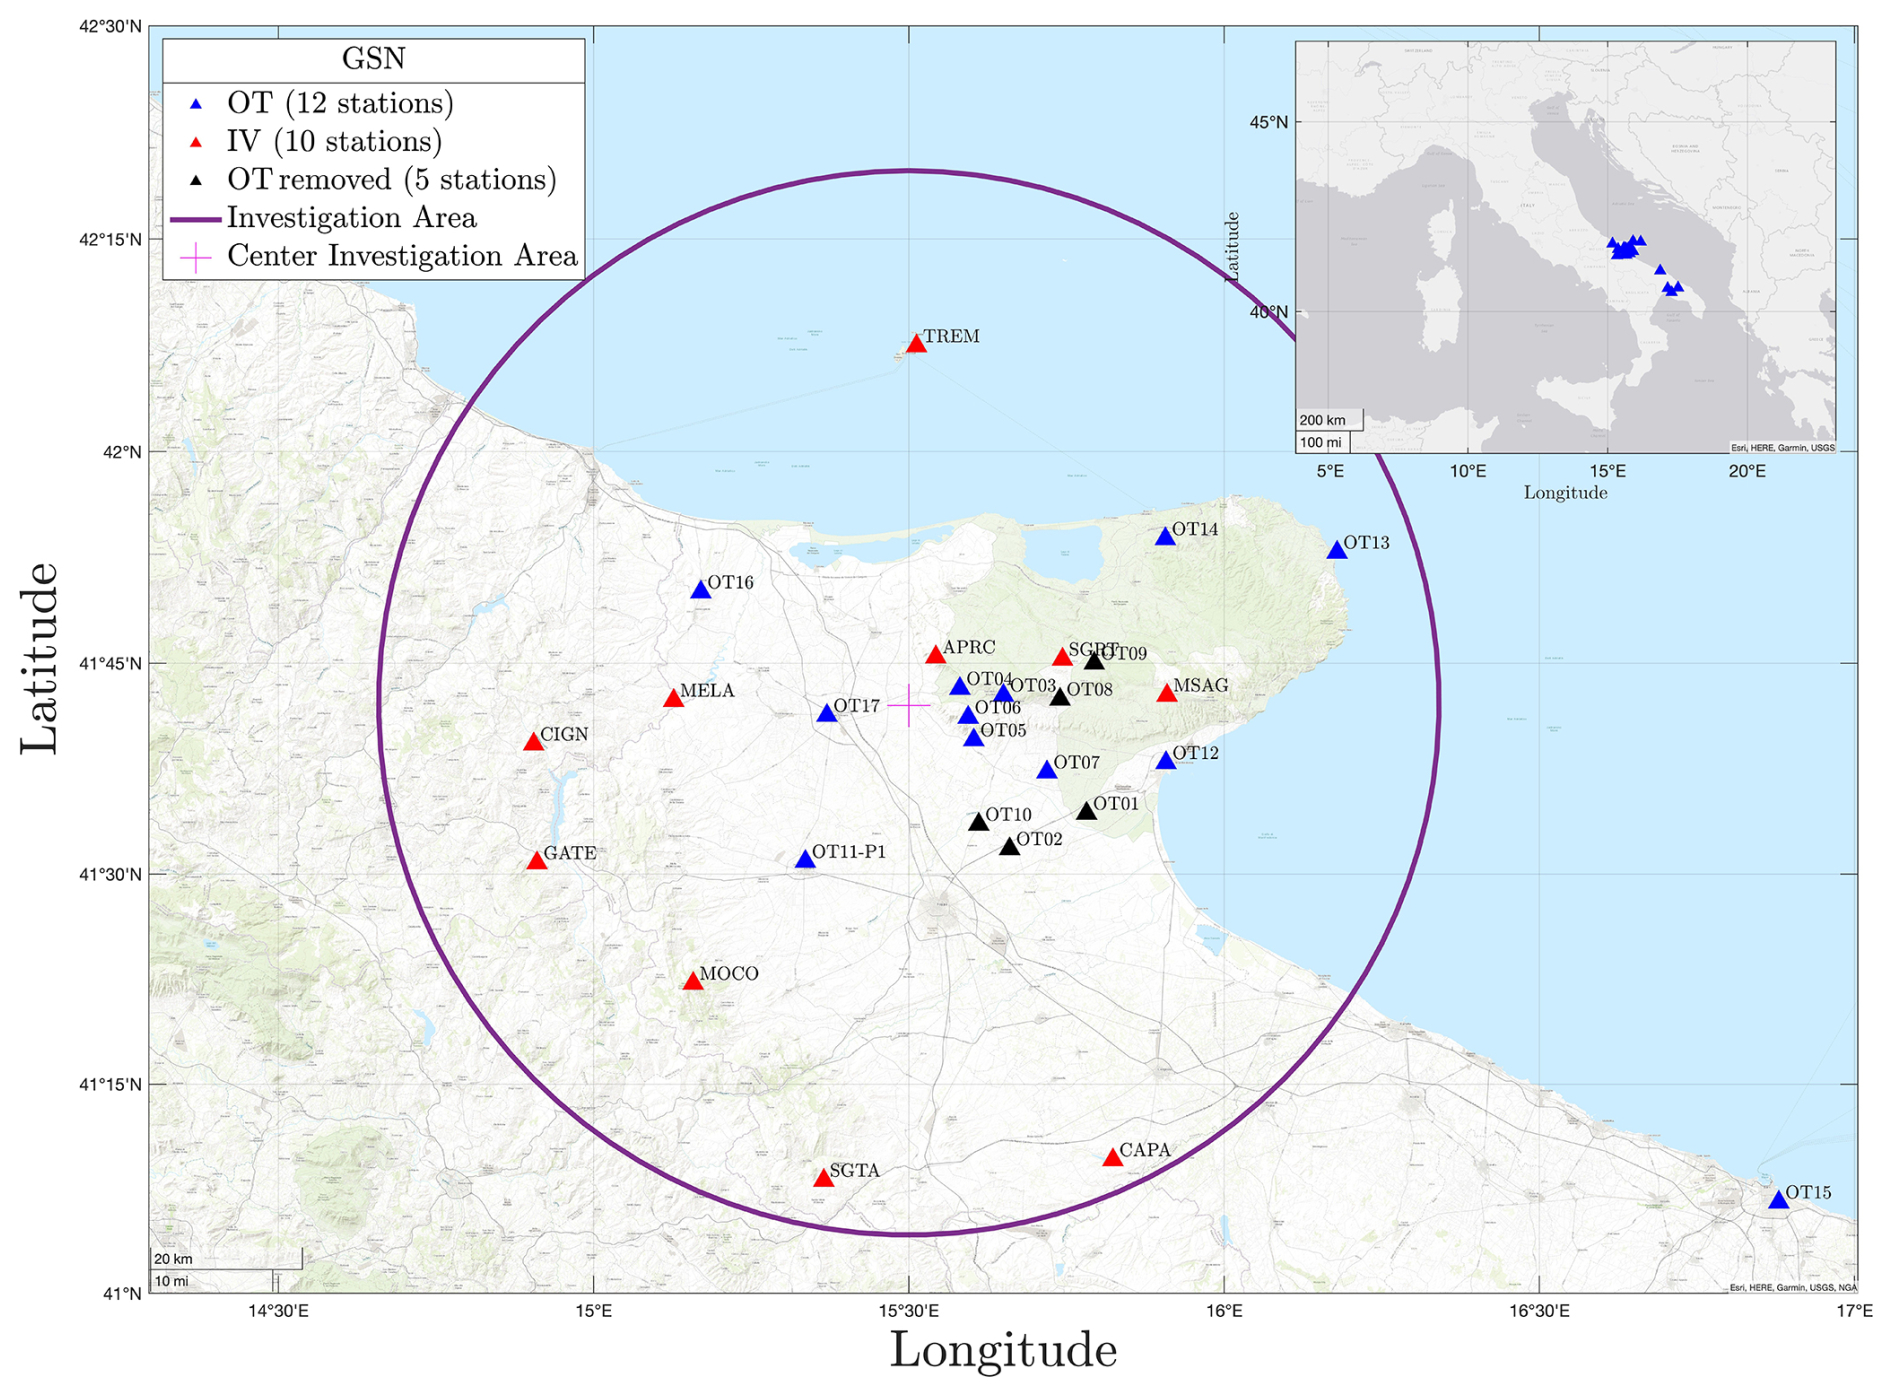
Figure 2GSN network (blue, red and black triangles, explained in the figure legend) and the investigation area (purple circle). The center of the investigation area (red cross) is [15.5° E; 41.7° N] with radius of 70 km. Esri, HERE, Garmin, USGS | Powered by Esri. Esri, HERE Garmin, USGS, NGA | Powered by Esri.
3.1 OTRIONS seismic network (OT)
In 2013, the OTRIONS (multi-parametric network for the study and monitoring of natural hazards in the OTRanto channel and IONian Sea) project was funded in the context of the “European Territorial Cooperation Programme Greece-Italy 2007–2013” (INTEREG III) and one of the goals was to deploy a local seismic network around the GP (Tallarico, 2015).
The first configuration of the OTRIONS seismic network, refers to years 2013–2014, consisted in 12 seismic stations in the Gargano Promontory: OT01, OT02, OT03, OT04, OT05, OT06, OT07, OT08, OT09, OT10, OT11, OT12. In June 2015, OT01, OT02, OT08 and OT09 were disabled and two new stations installed in the North of the area to provide a better coverage of the Northern part of the GP (OT13 and OT14 respectively). OT10 was disabled in 2019 due to technical problems. In 2021, two seismic stations were added (OT16 and OT17) . In Fig. 2 the actual OT network is shown, where the blue triangles refer to the active recording stations and black triangles refer to disabled stations. In order to detect eventual electromagnetic signals related to seismic activity in GP, the station OT04 hosts, since September 2021, a magnetotelluric sensors as described by Ventola et al. (2024). In the period 2013–2022 the present catalog refers to the OT network that was composed of three-component short-period Lennartz 3D-V seismometers, with a flat response above 1 Hz and data loggers 24-bit SL06/SARA with dynamic range equal to 124 dB sampled at 100 Hz (Tallarico et al., 2025).
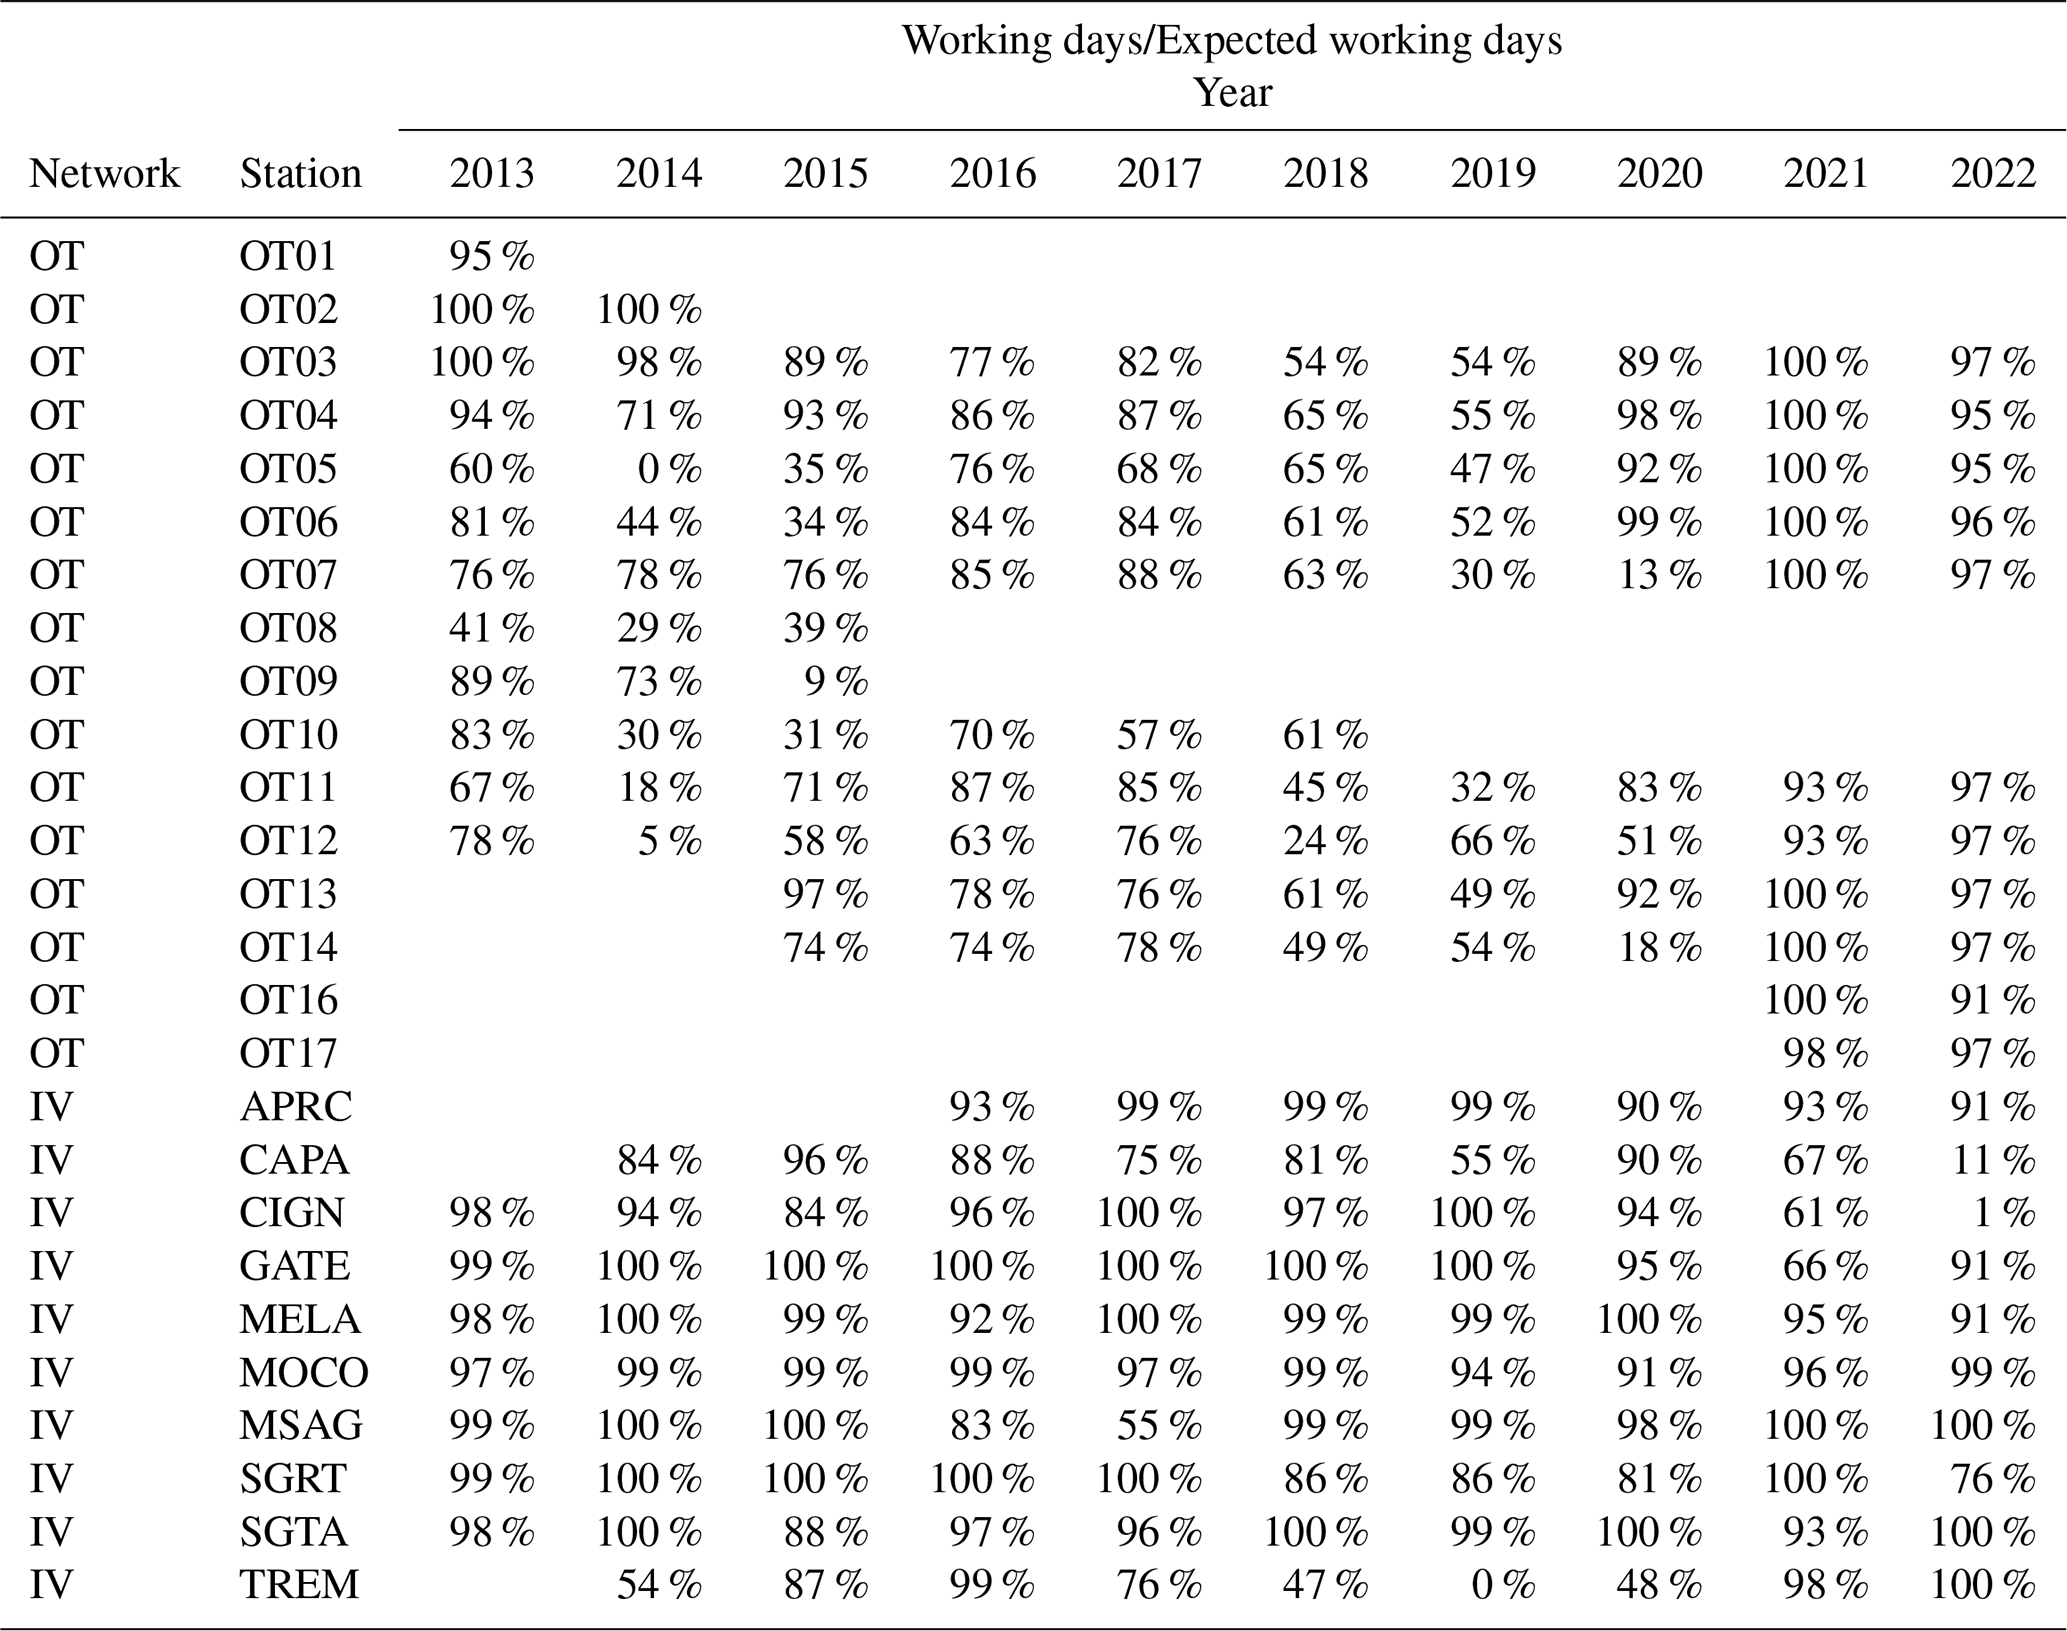
In April 2024, 5 OT stations (OT05, OT11, OT12, OT14, OT16) have been renewed by changing the short-period Lennartz 3D-Lite (1 s) seismometers with a broadband seismometer Nanometrics Trillium Compact (20 s). The station OT11 was integrated with a Nanometrics Titan accelerometer in the same manhole where the broadband seismometer is housed. Moreover, in the same station has been added a co-located station (OTP1) equipped with a broadband posthole seismometer (Nanometrics T120s-PH3) in a 30 m deep well, providing the simultaneously recording of seismic signal at the surface and at depth, useful for the orientation of the posthole sensor (details of the installation and of the sensor orientation are described by Tallarico et al., 2025). All OT stations, are real time connected to RSN (INGV) by LTE or/and satellite connection and now participates in the AdriaArray Seismology Group to cover the Adriatic Plate and its tectonically active surroundings (Kolínský et al., 2025). The OT stations used are indicated in Table A1 with the corresponding locations. Regarding IV stations of the GSN (red triangles in Fig. 2), TREM from 2017 experienced heavy problems in the internet connection solved only in 2020. The network performance was evaluated by the percentage of operating days per year for each station between 2013 and 2022 (Table A2). It is worth noting the clear improvement in network performance after 2019 compared to the preceding period. In fact, until the first half of 2019, the seismic recordings of the OT network were archived and managed by the seismic laboratory facilities at UniBa; as a consequence, many technical and connection issues affected several stations and the local server causing data gaps. In order to solve these problems, thanks to a collaboration with INGV, after 2019, data collection, transmission and repository have undergone a major technological improvement which allowed the transition to EIDA (European Integrated Data Archive, https://www.orfeus-eu.org/data/eida/, last access: 30 May 2025), witnessed by the meaningful improvement of OT performance. The stations of the IV network show consistently better performance over time in relation to the civil protection purpose of the network itself (Table A2).
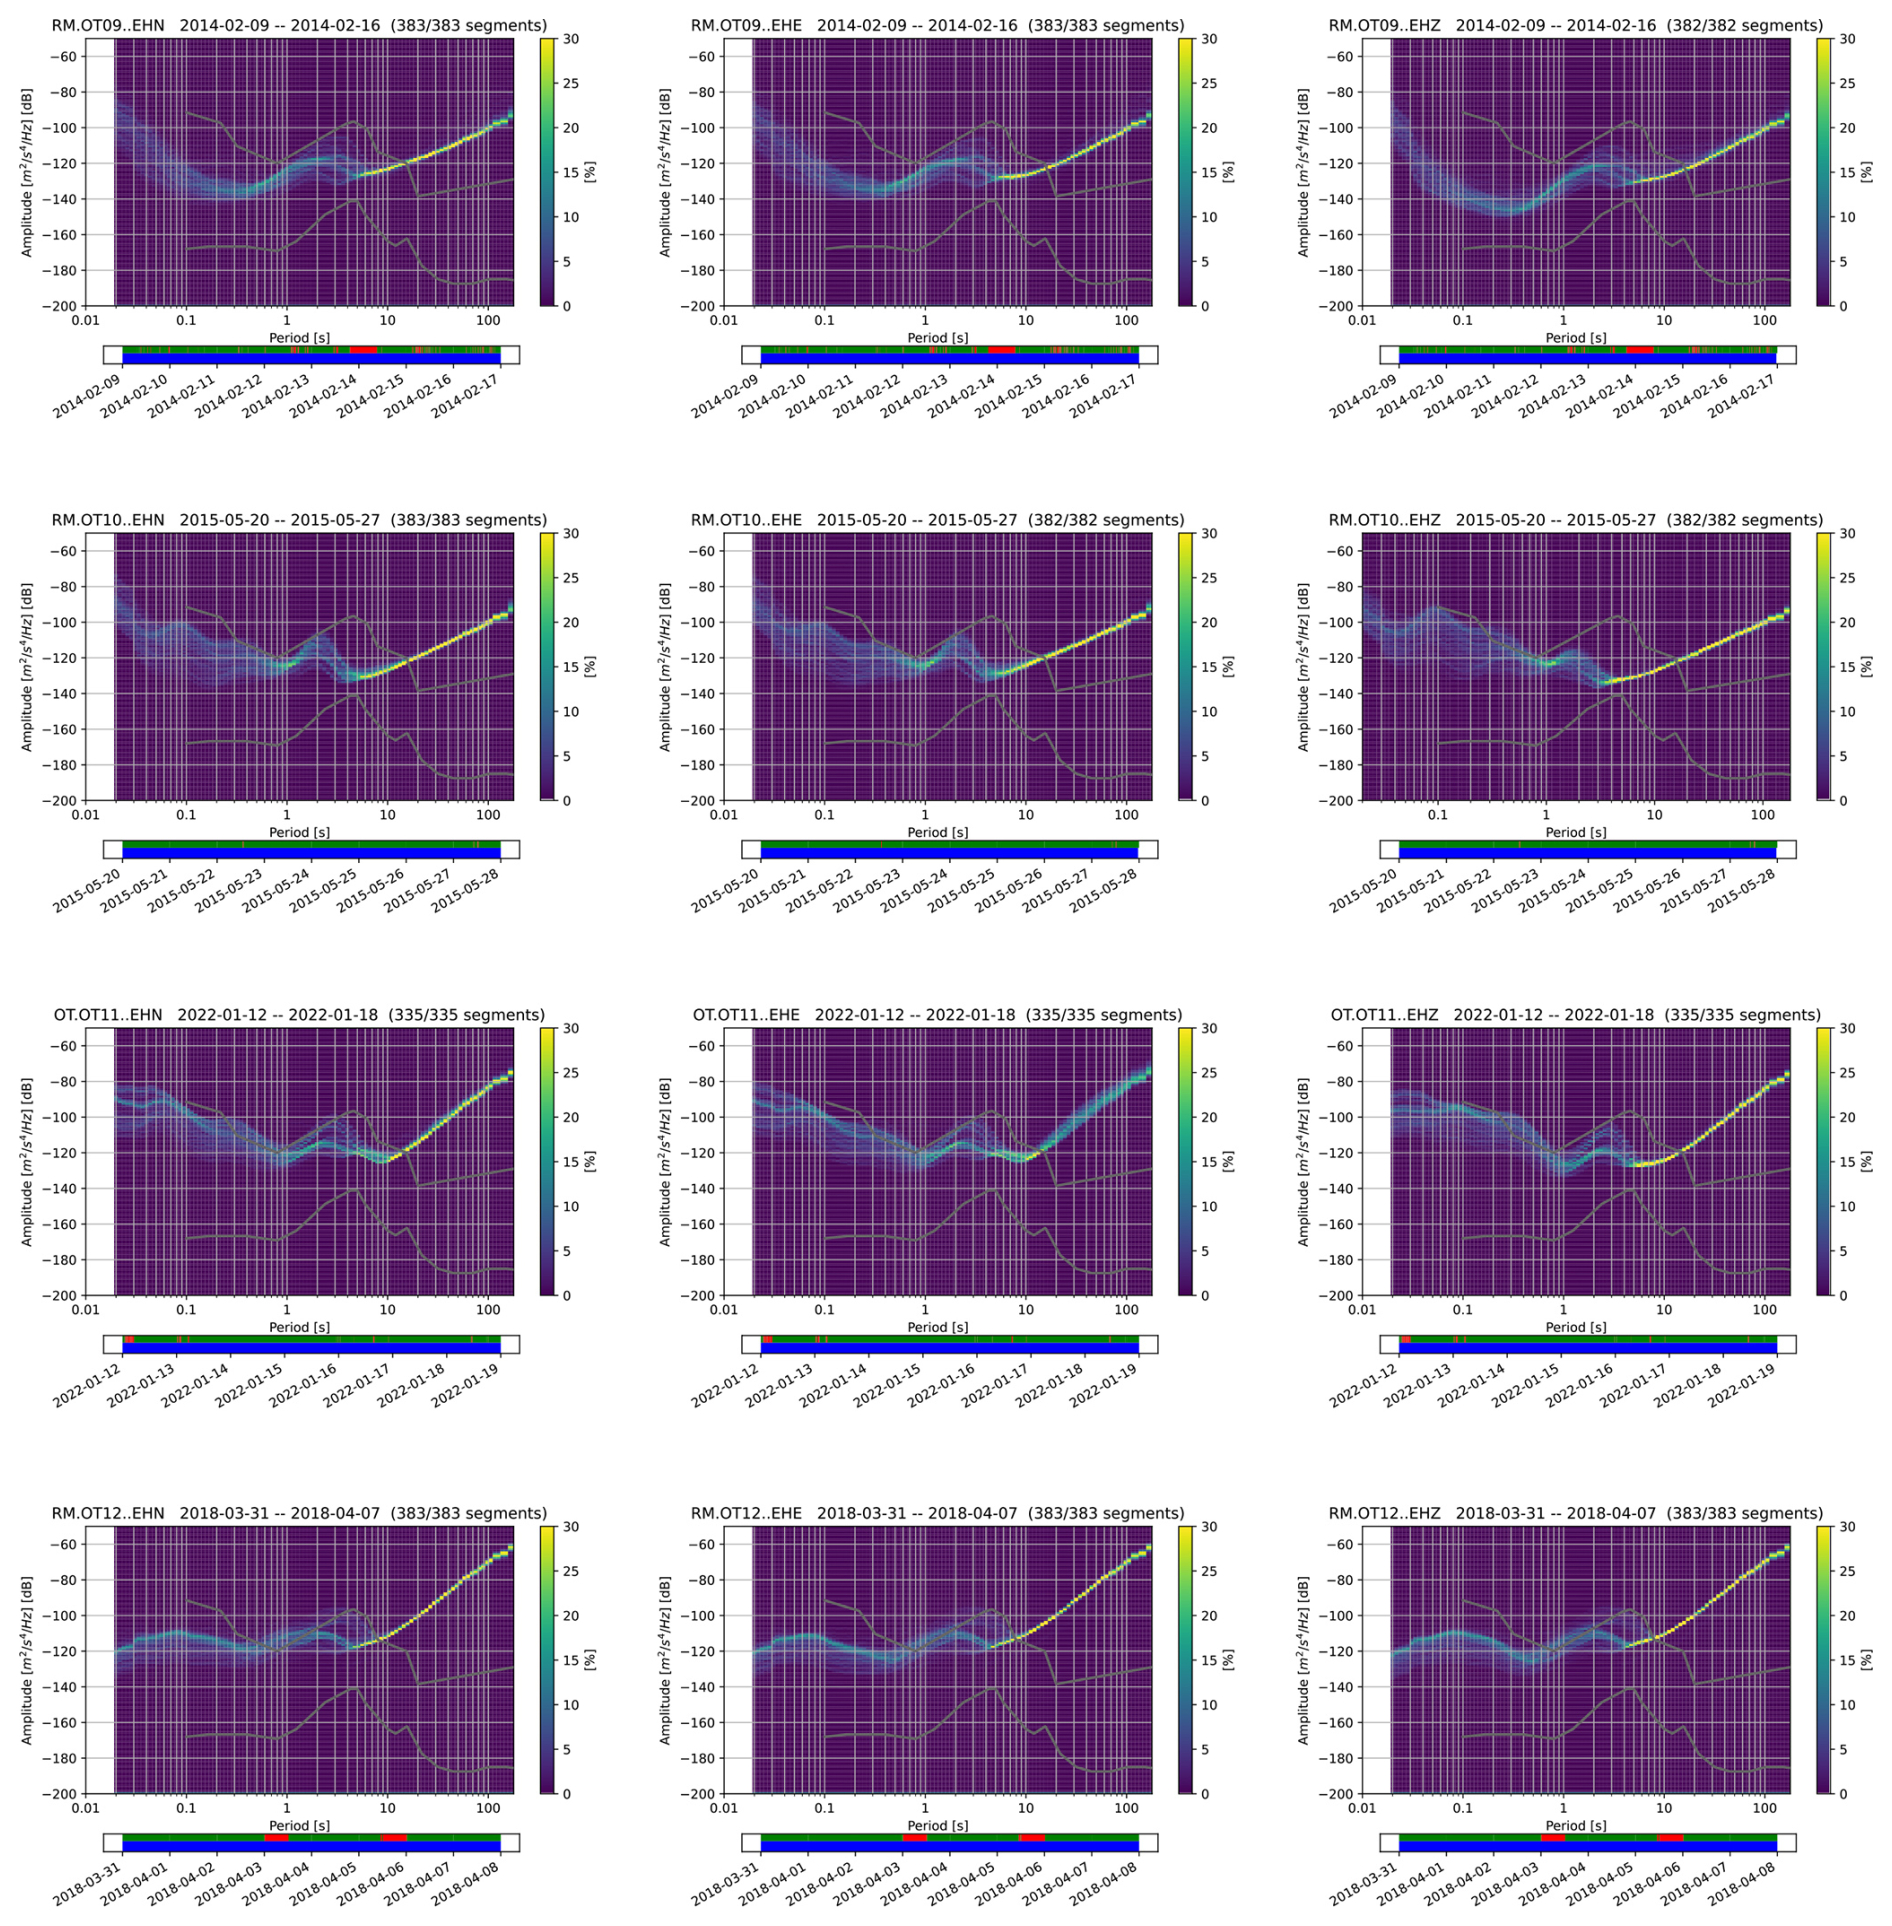
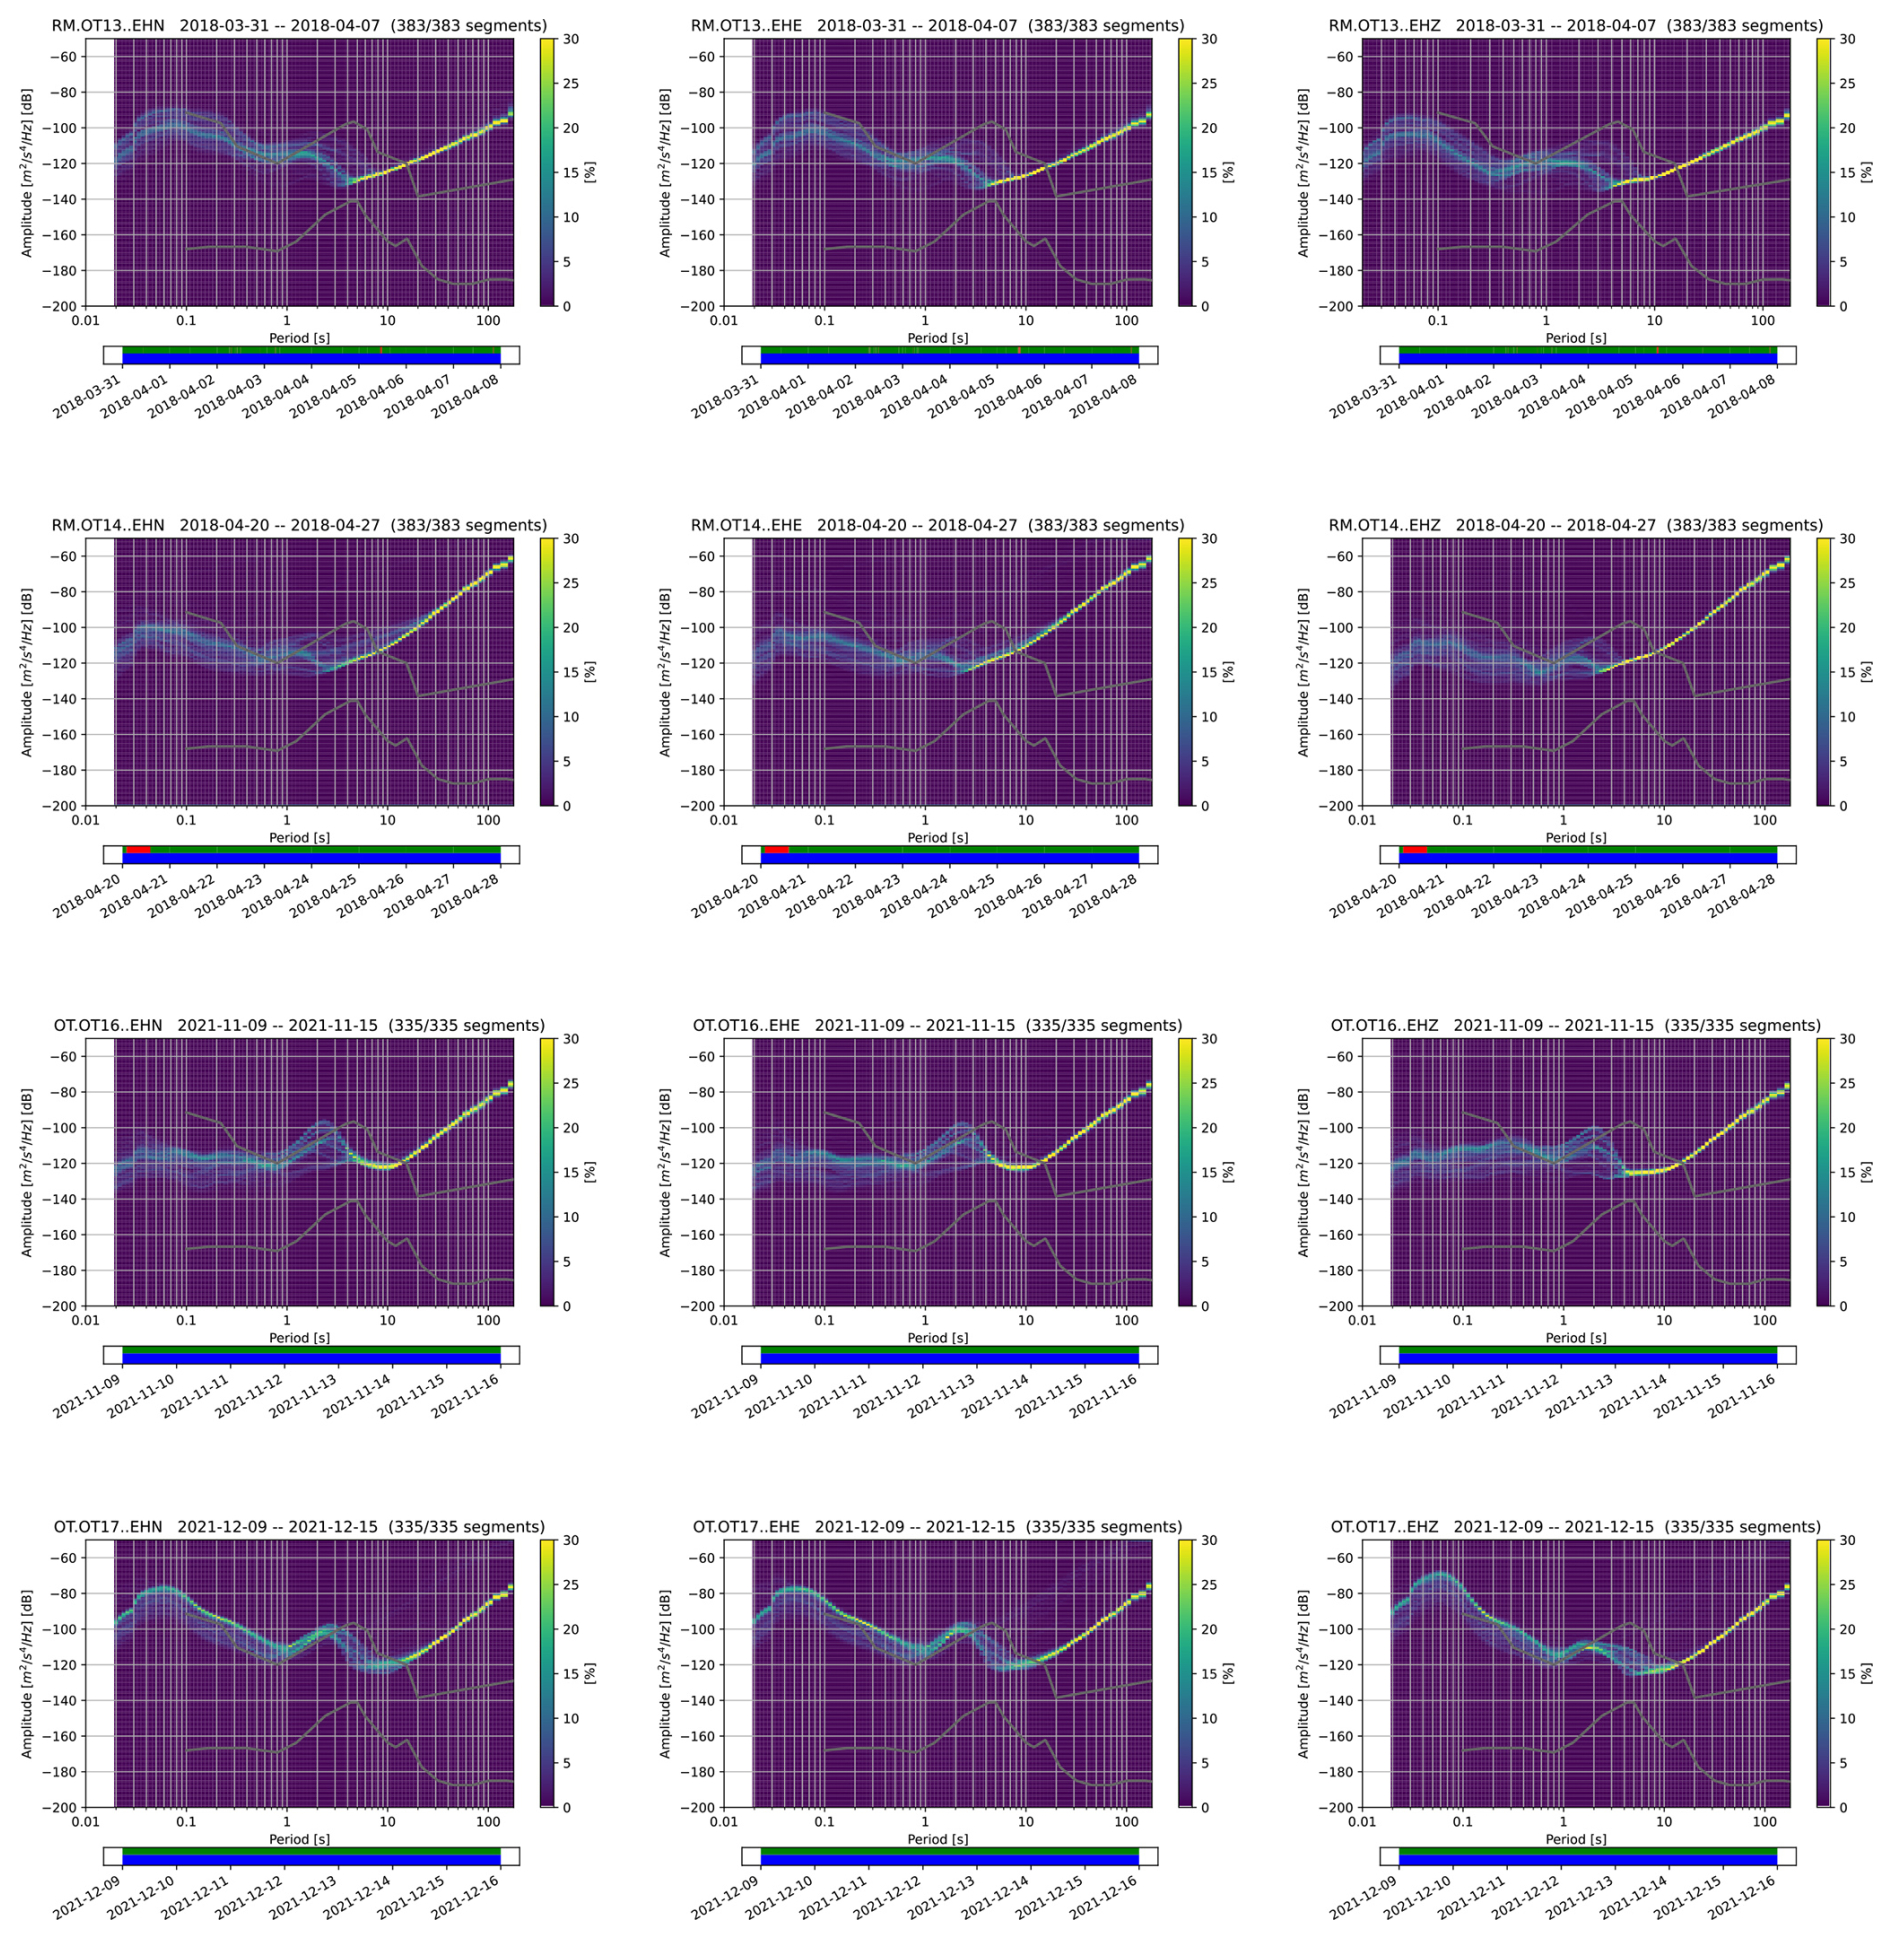
3.2 Seismic noise of the OT network
Quantifying the background seismic noise recorded by a seismic station is important to assess the quality of a registration site and the operational status of the seismic station. The standard method used to evaluate the background seismic noise is the calculation of the Power Spectral Density (PSD) of the seismic station recordings and its Probability Density Function (PDF). We have computed the PDF of the OT stations with ObsPy, the Python tool for seismology (Krischer et al., 2015). The function is based on the algorithm of McNamara and Buland (2004), which calculates the Probabilistic Power Spectral Densities (PPSDs), that is the probability of having a certain noise level in a given period. In Fig. 3 the PPSDs relative to the vertical component of six stations is shown. All of the short-period sensors show a dramatic increase of the noise level at periods greater than about 2 s, and at about 10 s, the noise is greater than the high-noise model, as a result of the instrumental self-noise at lower frequencies. We, therefore, focus on the noise level above 1 Hz (that is below 1 s). The noise level is overall good for most stations of the OT network, being the PPSD values located on the downside of the high-level noise (Peterson, 1993) model. In Fig. 3a–c, the stations OT01, OT03 and OT08 record very good signal, having a PPSD centered between the high- and low-level noise models with small variations of the noise level (about 10 dB) at periods less than 1 s. Some stations, such as OT10, OT13, OT17 in Fig. 3d–f, show higher values of cultural noise in the period range of [0.1,1] s. These stations are installed near state country roads (OT10) or in a city (OT13 and OT17), and probably suffer from the automobilistic traffic or machinery vibrations. Unfortunately some stations of the OT network (OT01, OT02, OT08, OT09) are no longer operational, and their high quality signals are even more valuable, suggesting that the recording sites are good for future installations. In Appendix A2 we released the PPSDs of the three-components for the OT stations of GSN. As observed in Fig. A2, we noticed that the stations with the lowest level of noise correspond to the stations that have the highest number of automatic pickings, thus contributing more to the detection.
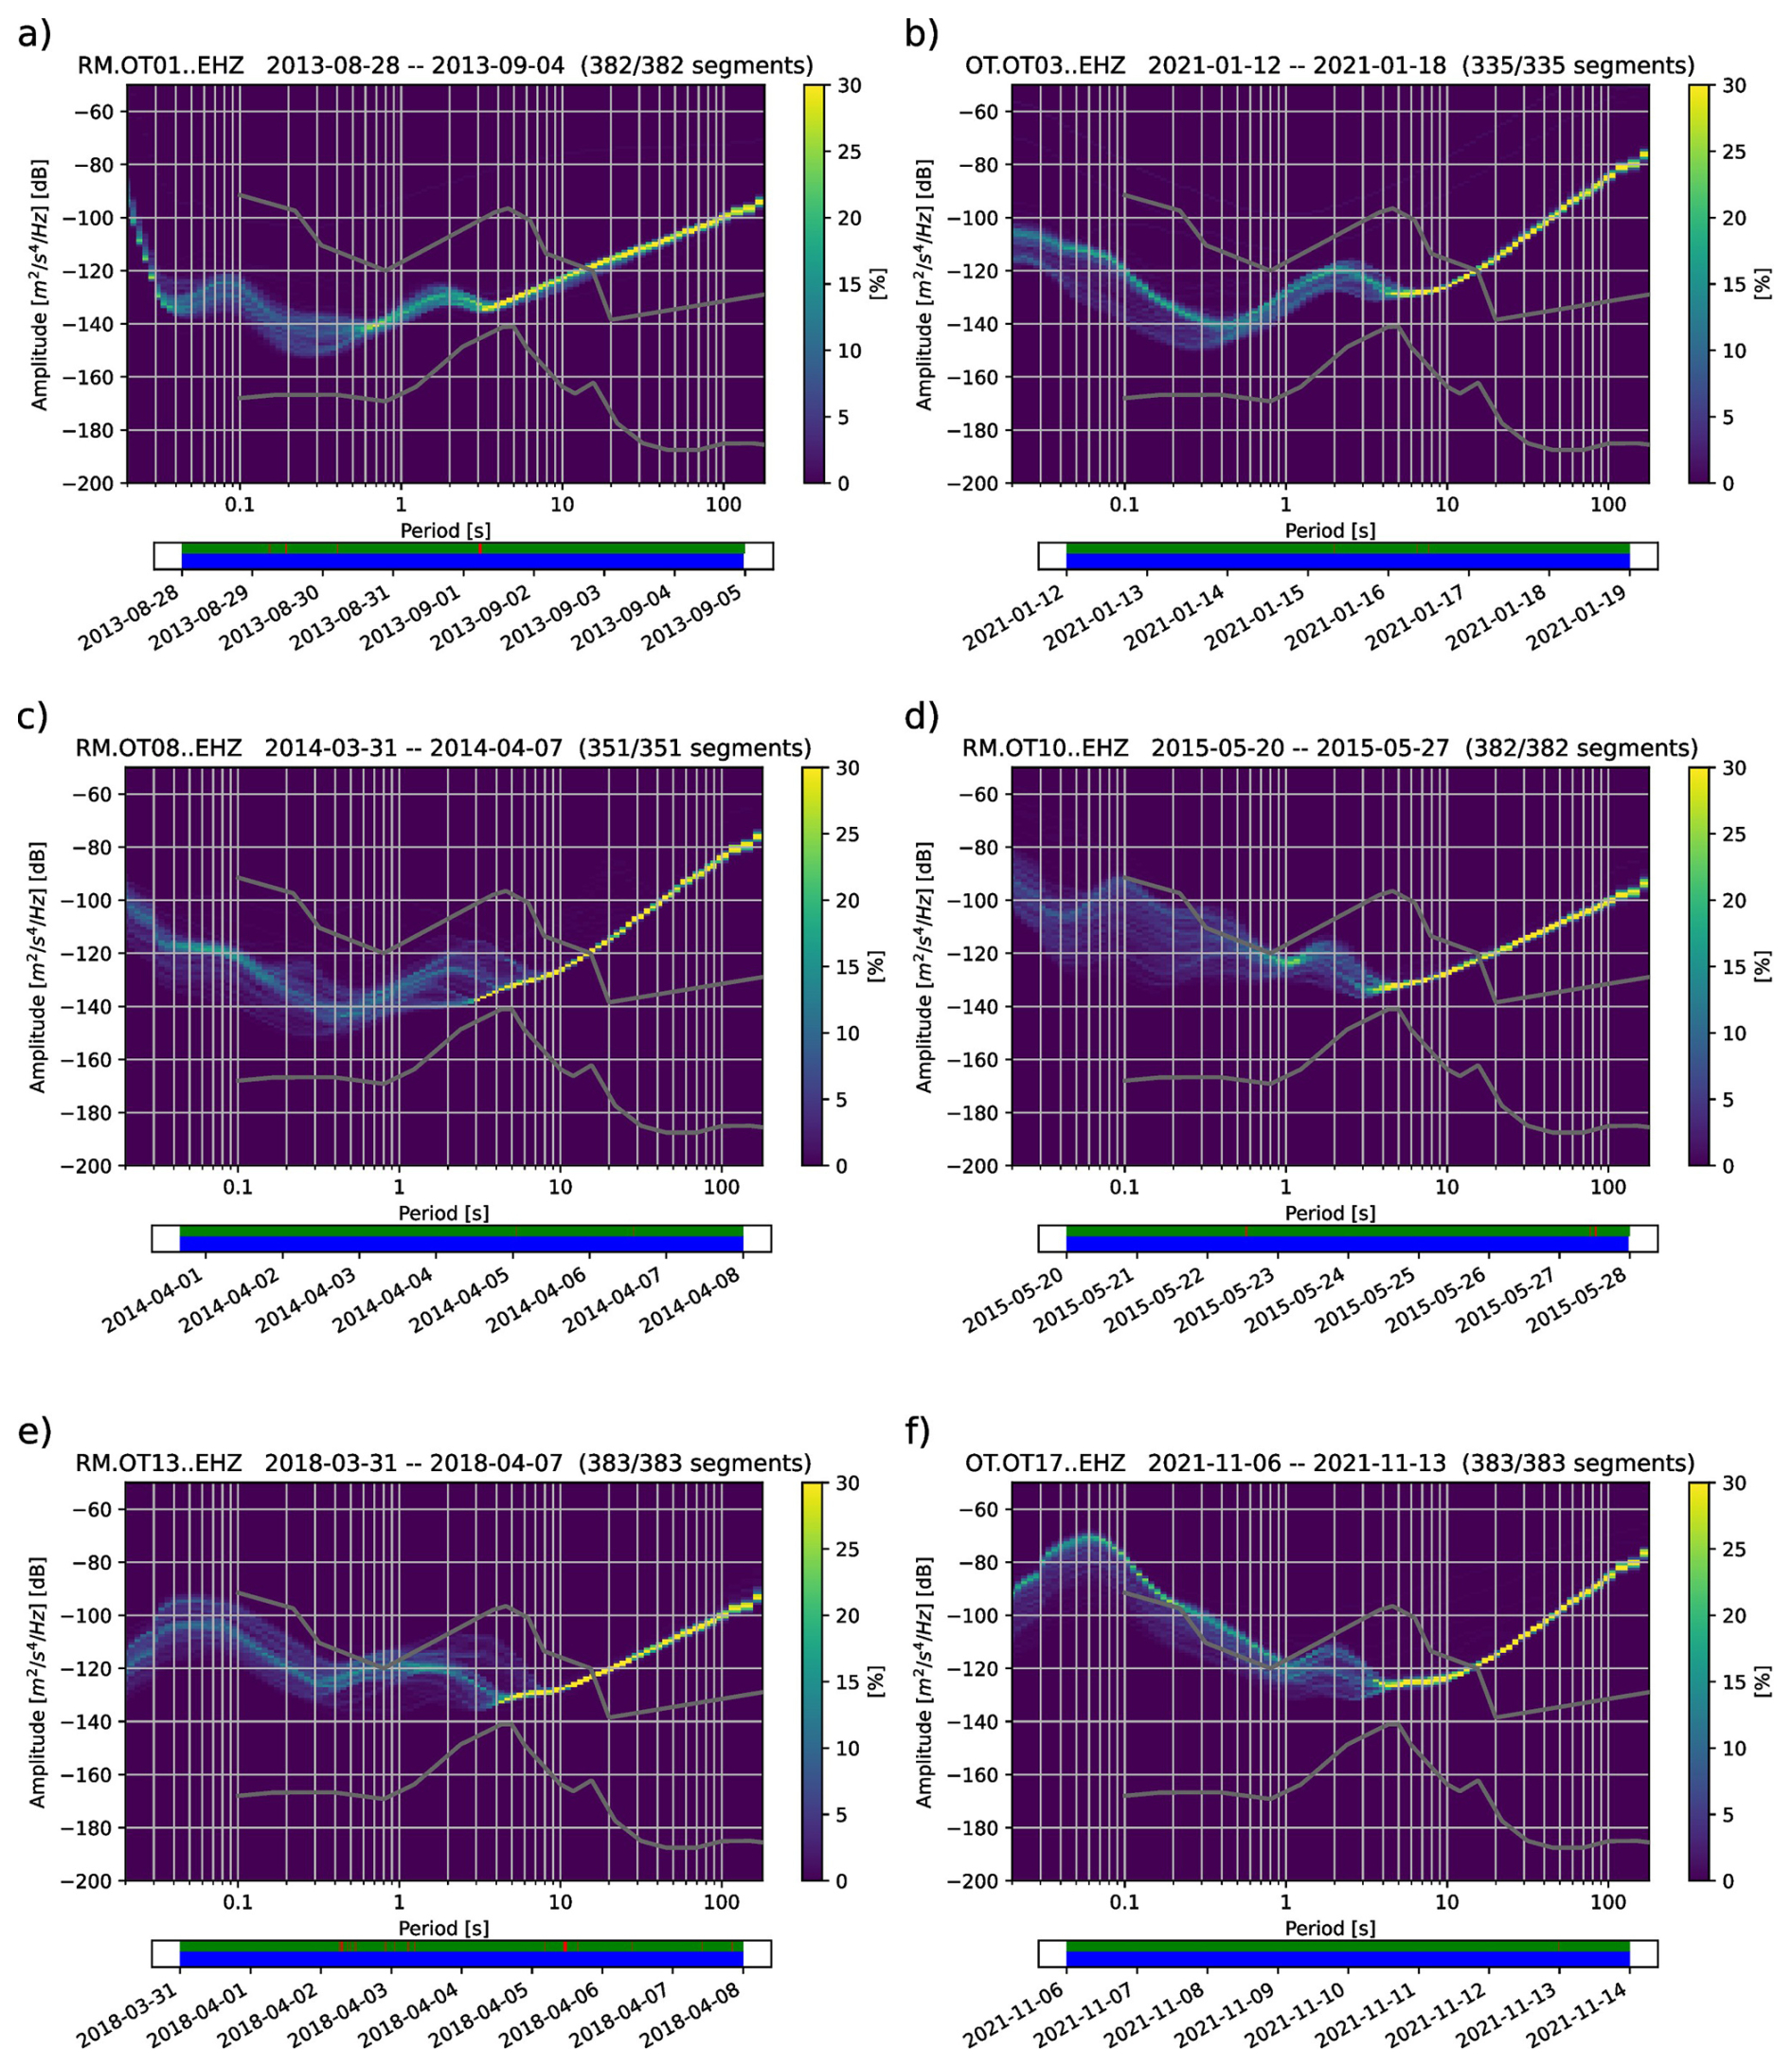
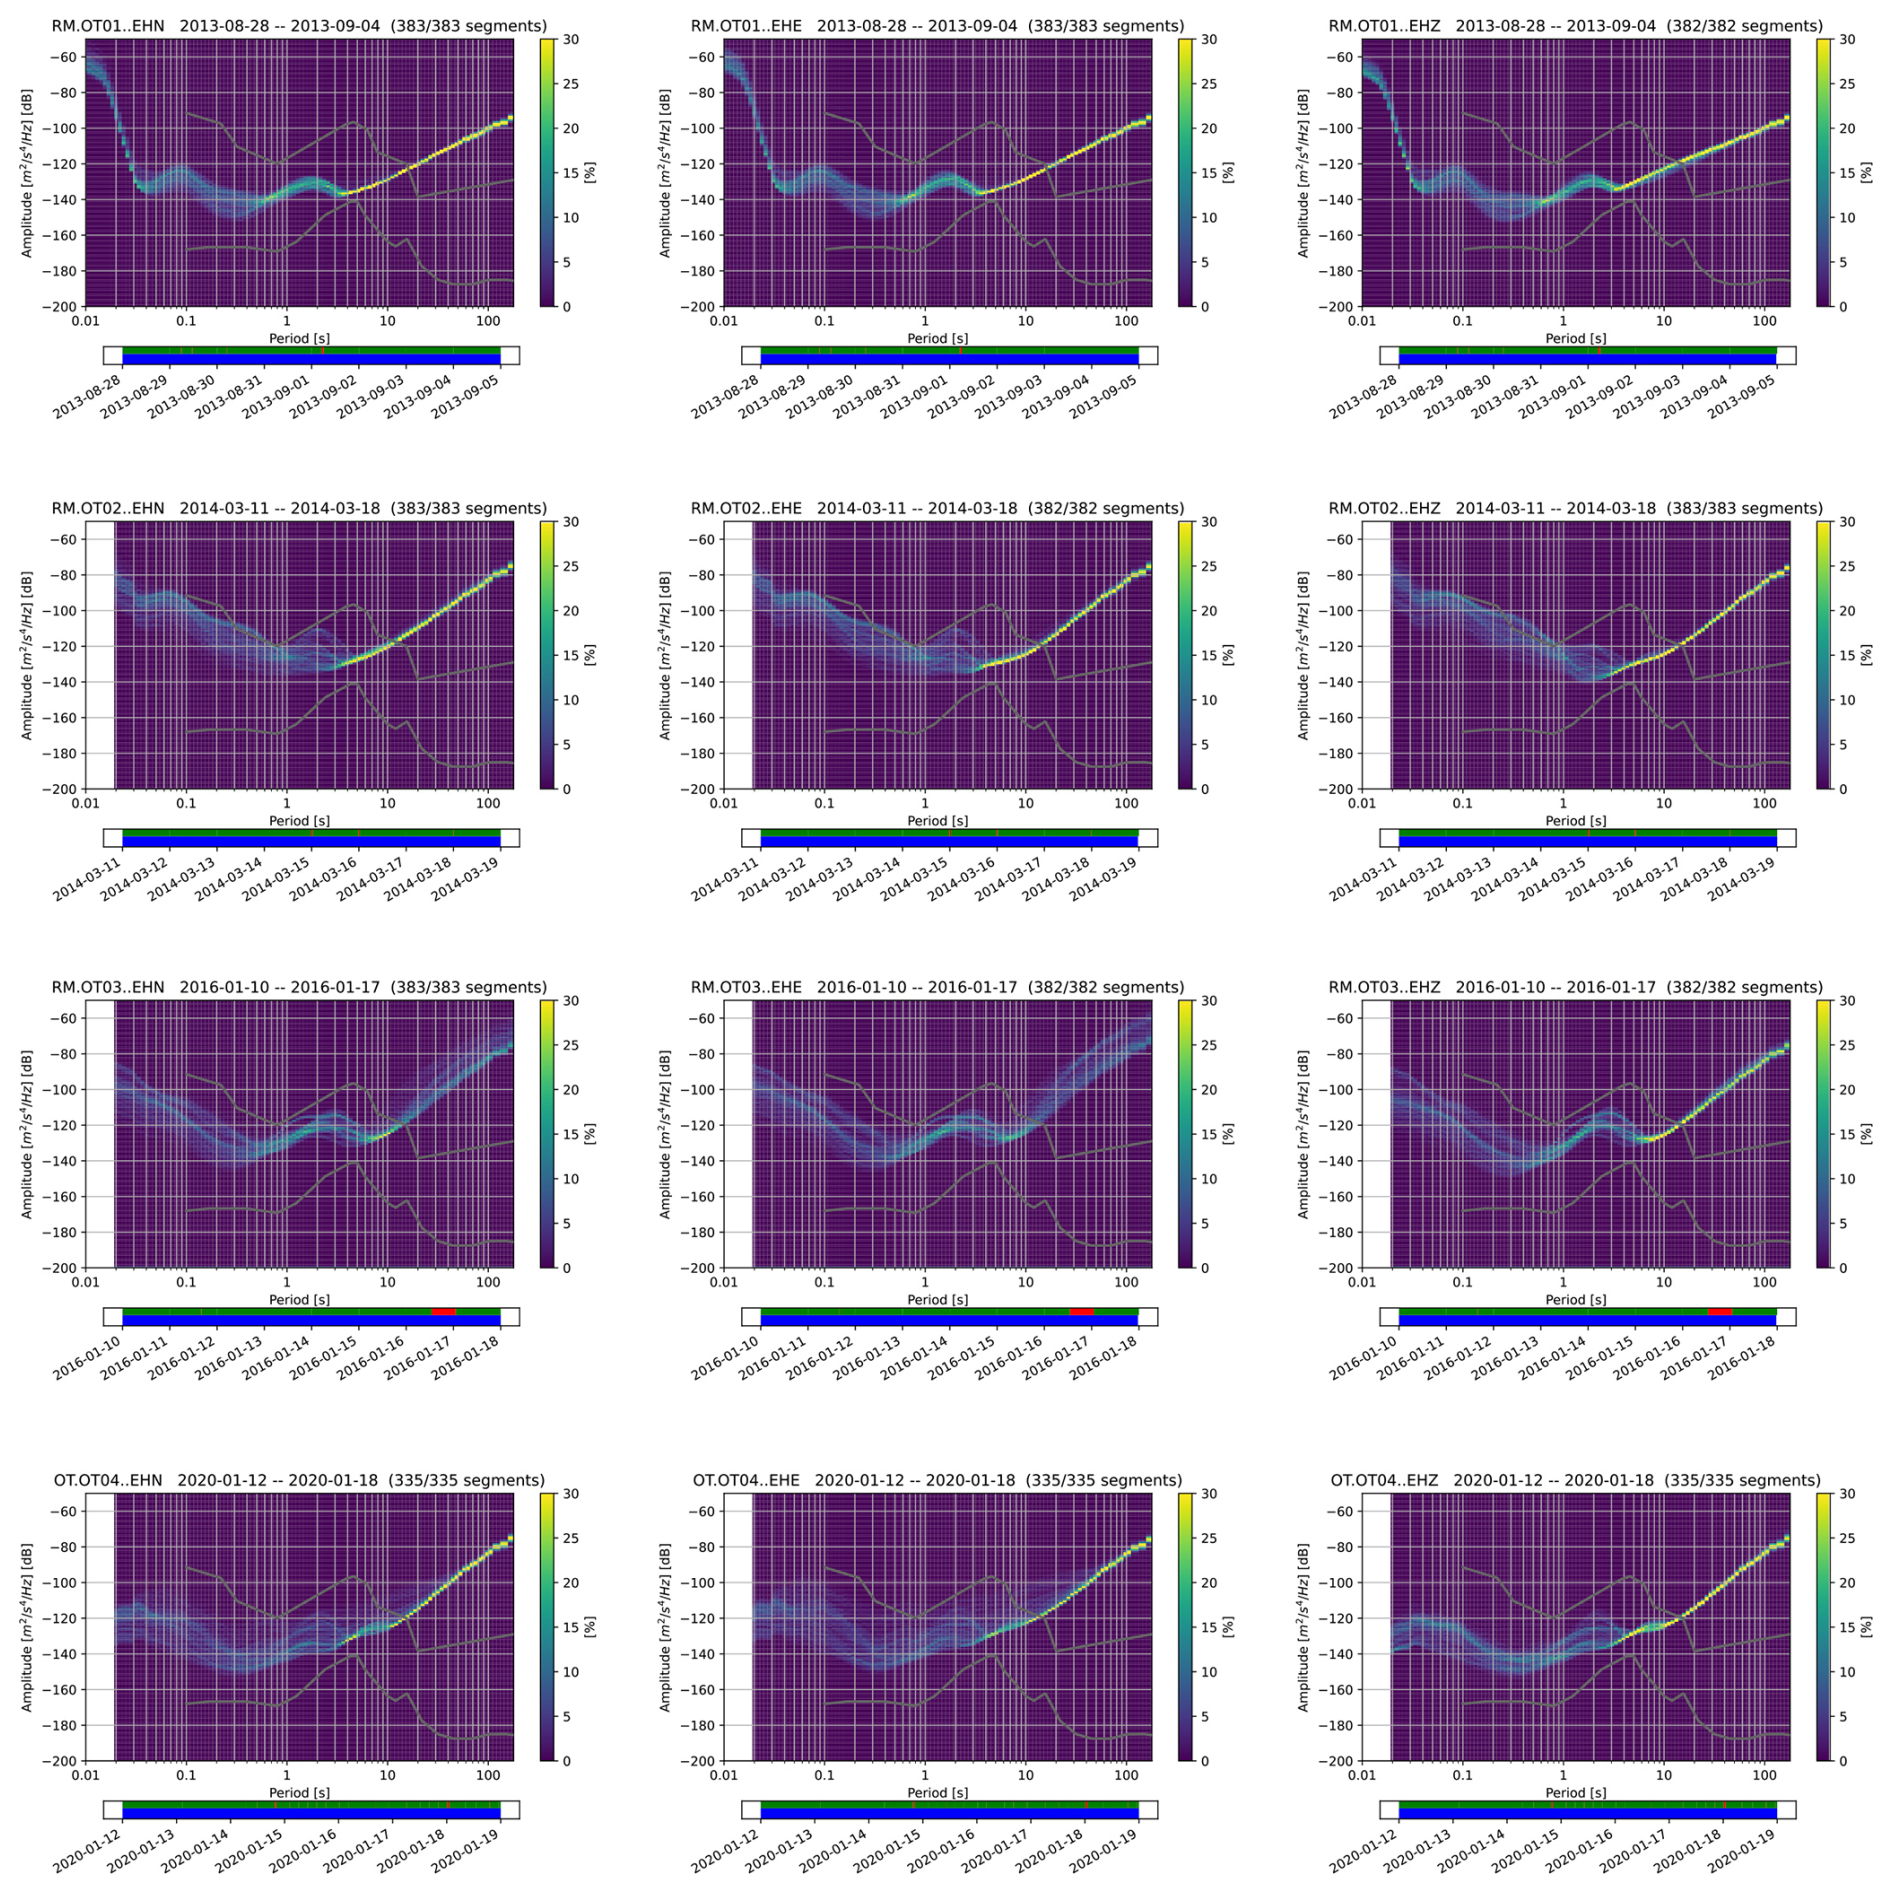
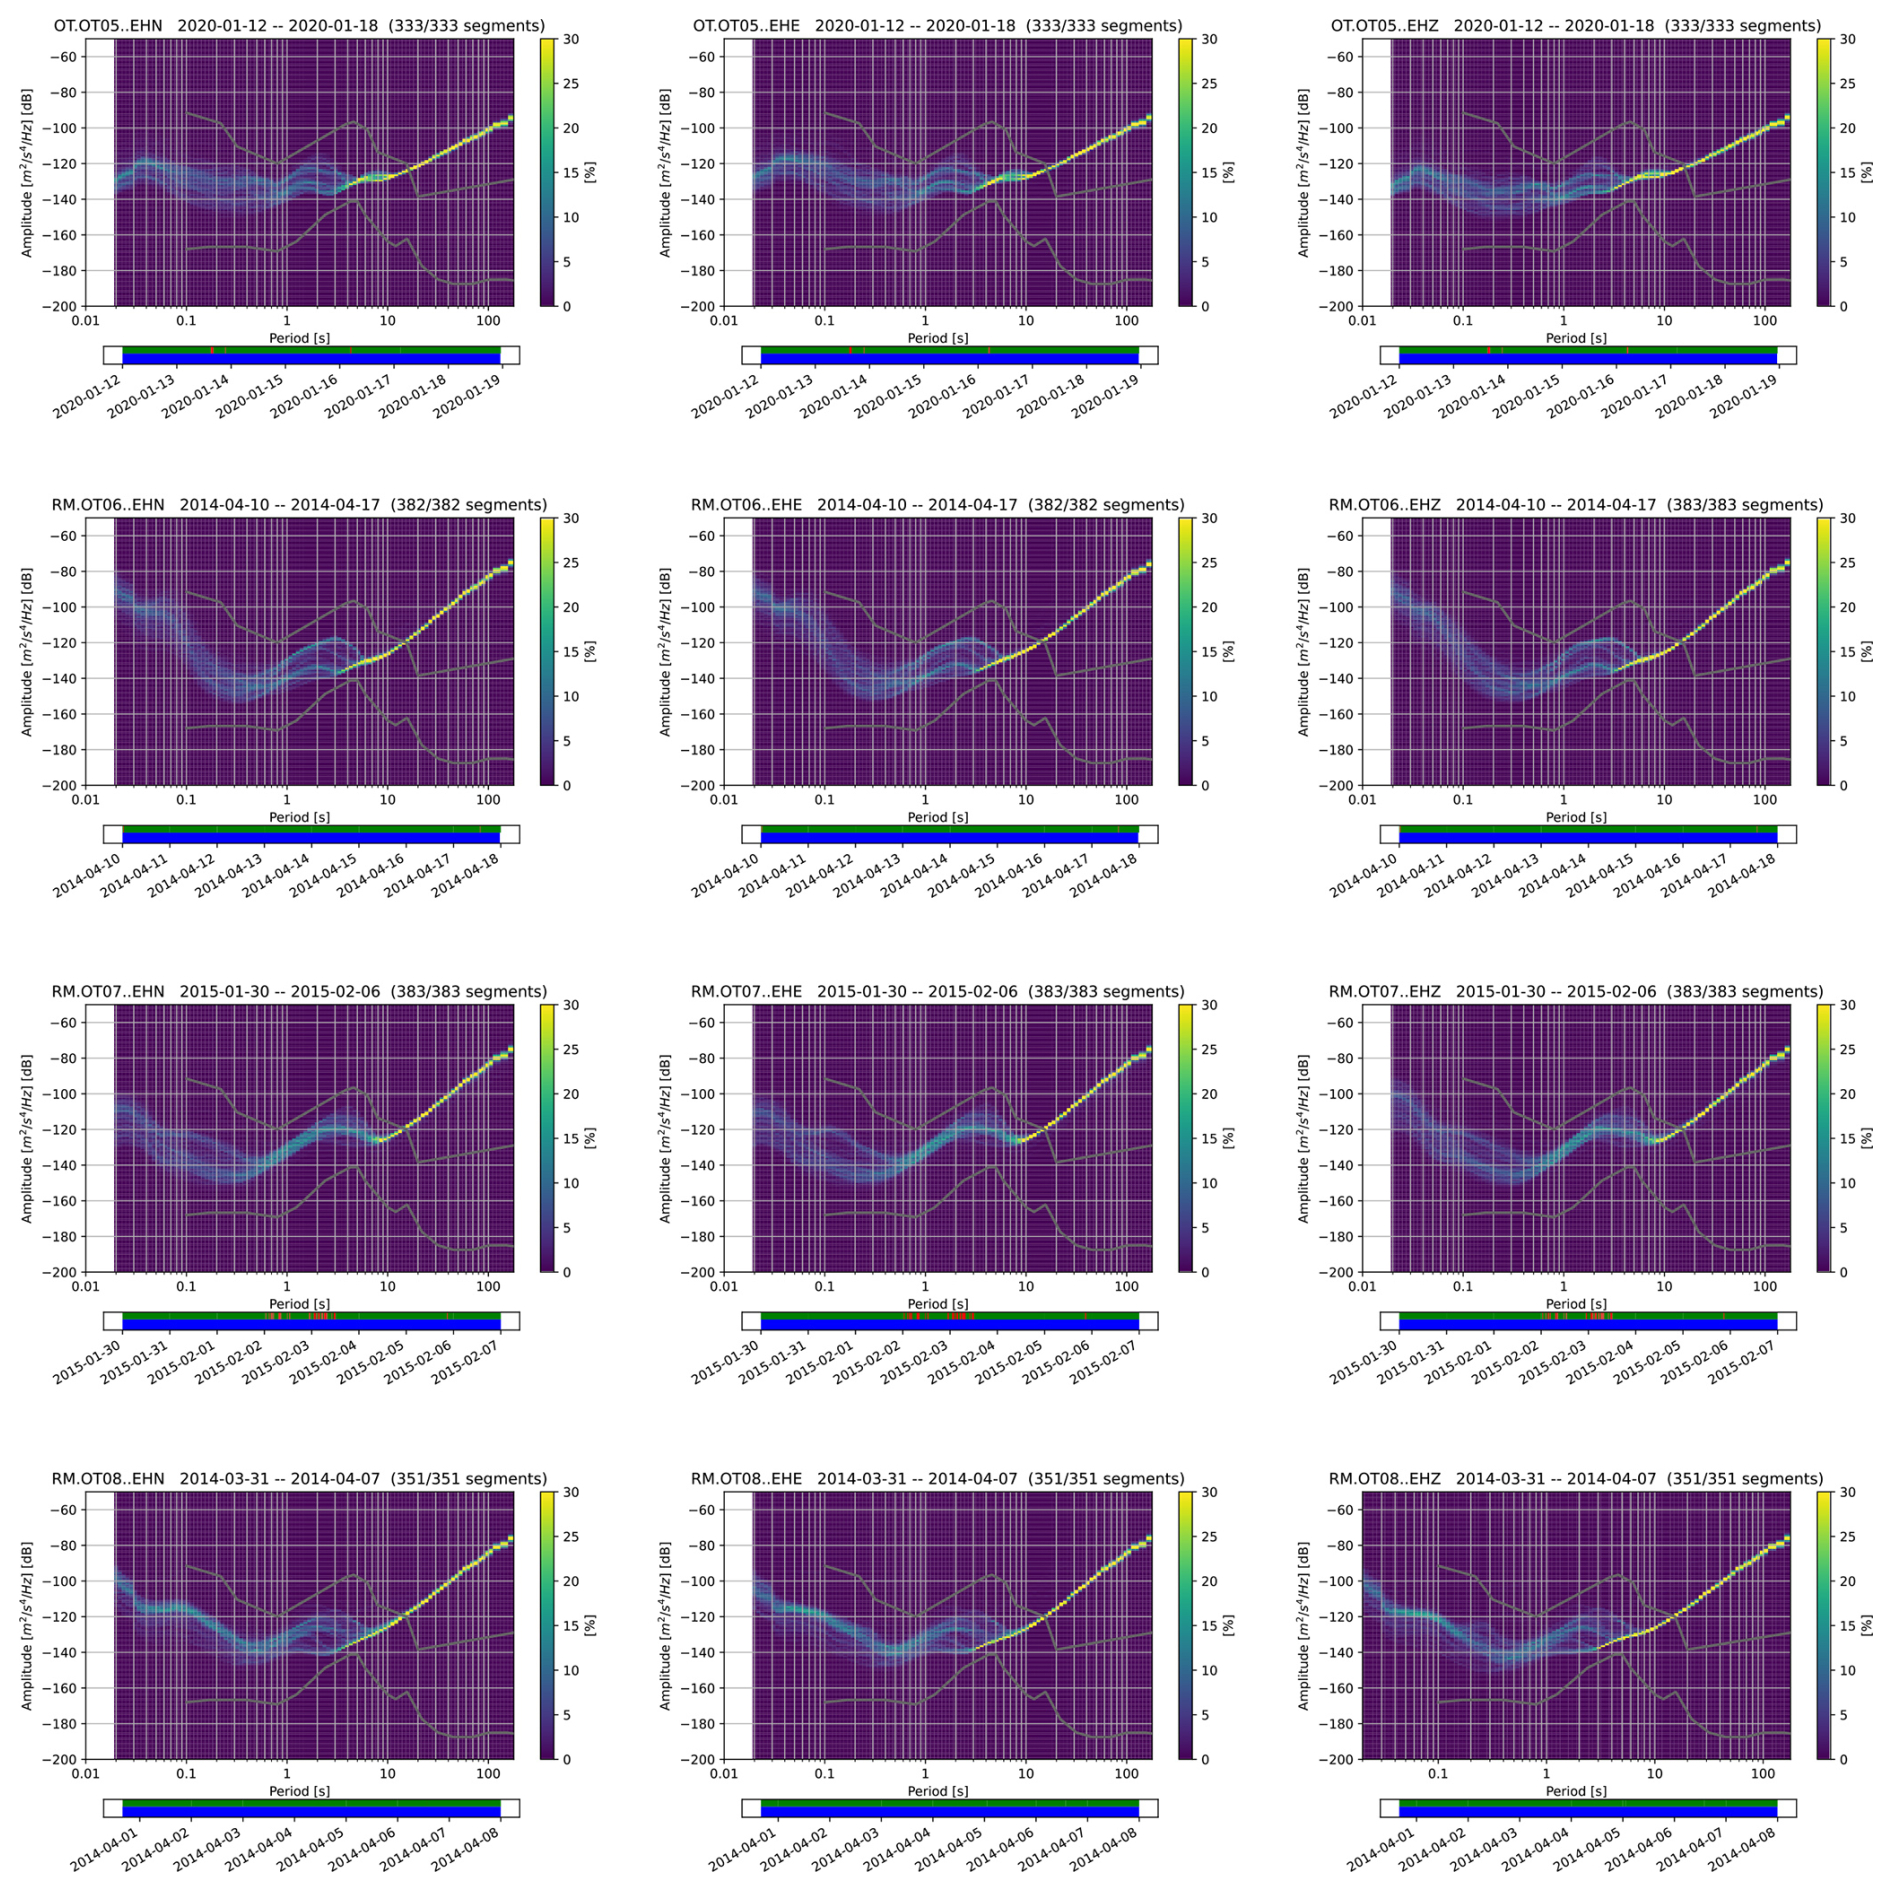
Figure 3PPSDs of some vertical components of OT stations in dB. The name of the seismic station and the selected period of time is on the top. The color palette on the right shows the probability of the noise level. The horizontal bar below the panel shows the data availability or the data gaps (top row, green or red, respectively) and the PSD of each 1 h time-series used for the probability calculation (bottom row, blue). The network code “RM” refers to the out-of-date name of the OT network. We computed the PPSD of the continuous data stream recorded by any station for 7 d. The color palette shows the probability of the corresponding noise level at that period. The two gray curves show the high-level and low-level noise models of Peterson (1993). The panel shows the values of PDF starting from the period of 0.02 s, which correspond to the Nyquist frequency fNyquist=50 Hz, one-half of the station sampling frequency. For a complete description and visualzation of the PSSDs of all the stations of the OT network, refer to Figs. A4, A5, A6 and A7 in Appendix A2.
The data used by CASP are the three components daily (24 h) recordings in miniSEED format. As already explained in Sect. 3.1, the 24 h recordings of the OT network are available online since May 2019. For the preceding period, from April 2013 to April 2019, we used the 24 h recordings archived in the seismic laboratory of UniBa and available under request. So the dataset of 24 h recordings, covering a period from April 2013 to December 2022, was collected as follow:
-
from April 2013 to April 2019: recordings of OT stations were available in the seismic laboratory at UniBa; recordings of IV stations were downloaded from the INGV web-service (https://eida.ingv.it/en/, last access: 30 May 2025);
-
from May 2019 to December 2022: recordings both of OT and IV stations were downloaded from the INGV web-service (https://eida.ingv.it/en/, last access: 30 May 2025);
Further details on the download of the OT and IV recordings can be found in the Sect. 8. The operation period and instrumental characteristics are explained by Tallarico et al. (2025).
Seismic daily recordings were analyzed by the CASP software that provides a list of seismic events (further details can be be found in Sect. 4.1). In order to ensure a high quality catalog and to evaluate the reliability of the results of CASP, we manually revised the automatic list of events (AL) in order to recognize 4 categories as labeled so far:
-
EQ = EarthQuake inside the investigation area,
-
QB = Quarry Blast,
-
FE = False Event,
-
BL = Bad Located earthquake.
Hereafter, we detail the procedure to obtain the final catalog.
4.1 CASP automatic list of events – AL
CASP is a software for the detection, picking and automatic location of seismic events (Scafidi et al., 2019) written in standard C programming language. The architecture of this software consists of four main modules.
-
The first module is the Trigger and it generates a list of triggers by applying the STA/LTA algorithm on the vertical component of each station recording. The STA/LTA method improves the identification of a wave arrival by continuously monitoring the ratio between the short-term and long-term energy averages of the recording signal. A sudden increase in this ratio, above a certain fixed threshold, typically indicates the onset of a seismic wave, enabling reliable and rapid detection in real-time applications. In this step, to ensure the best balance between signal noise and trigger sensitivity, the optimal STA/LTA values were defined through a series of preliminary tests conducted over a dataset of 100-day's recordings. An appropriate and filtering (band pass filter between 10 and 25 Hz), based on these tests, was selected as best choice as also used by Spallarossa et al. (2021).
-
The second module is the Detect for trigger association and event detection and it analyzes the list of triggers to associate traces and identify the possible seismic event. This process is done across multiple stations and, in this way, the module identifies clusters of triggers that are likely to belong to the same seismic source. Through this process, the presence of a seismic event is confirmed.
-
The third module is the Extract for extraction of time windows including potential earthquake and it works, if an event is detected, by converting seismograms into SAC format and by creating an event directory.
-
The fourth module is the Picker2 for picking of P- and S-arrival times and for event location and magnitude. It performs the automatic P- and S-phase picking working on the event directory, provides the locations by using NLL (Lomax et al., 2000, 2014) and computes the magnitude with the procedure adopted in Spallarossa et al. (2002) and the attenuation law of Di Bona (2016). Following Spallarossa et al. (2014), the Picker2 module detect P and S arrival times with the AIC (Akaike Information Criterion) function (Maeda, 1985) applied to the envelope of the band-pass filtered traces. The envelopes are Hilbert-transformed, squared and normalized. When a specific threshold is exceeded, a reference time TEnv is set and a window between 18 s before and 4 s after the TEnv is cut. On the vertical component, the Picker2 module compares the pre and post variances at each sample point via AIC criterion. The minimum of this function gives a preliminary P time, which is refined in a shorter window and validated only if the signal to noise ratio within ±1.5 s exceeds a fixed threshold. The P picks yield an initial location used to predict the S arrivals. On the horizontal components, the AIC criterion search around the theoretical S times providing the S picks, validated only if the signal to noise ratio within ±3 s exceeds a fixed threshold. The picking-location cycle is iterated until the stability is reached. This modular sequence enables a fully automatic processing of the 24 h recordings resulting in an automatic list of events, as fully described by Scafidi et al. (2018) and Scafidi et al. (2019). In this module configuration, the PostSTeo parameter, maximum time interval between the P-wave and S-wave picks, was set to a value determined through several tests, which demonstrated the sensitivity of event detection to this parameter. The optimal value for our study area is PostSTeo =5 s. The velocity model implemented was already used for the GP seismicity (Miccolis et al., 2021, and reference therein). The NLL location grid was set with a node spacing of 1 km both in latitude and longitude. This spacing allows optimal resolution in the location of the seismic events, ensuring an accurate representation of hypocentres within the investigation area. To study in detail the seismicity of the GP area and taking into account the geometry and density of GSN, we defined a circular investigation area shown on map as a purple circle, with 70 km radius and center in (15.5° E; 41.7° N) (Fig. 2). The results of this sequence of CASP modules, applied to the database of ten years recordings, is an automatic list of 7162 AL events that we decided to manually revise.
The configuration files of the modules described above are released as indicated in Sect. 8.
4.2 Manual revision of the automatic list
The analysis of the automatic catalog revealed several critical issues that negatively affected the quality and reliability of the events detected and located within the investigation area. The main issues encountered were associated to a number of factors like: the wrong location of seismic events outside the network, the reporting of false events and events with low-quality location. In order to address these issues, we manually revised the CASP automatic picking. A total number of 54 205 seismograms were manually re-picked. With the manual revised P and S wave picks, we then proceeded with the relocations by using the NLL code (Lomax et al., 2000, 2014).
4.2.1 False events and bad located earthquakes – FE and BL
In Fig. 4, an example of a false event recorded at 13 different stations, picked and located by CASP and so wrongly considered a seismic event, is shown. All the events recognized as false were discarded and labeled as FE.
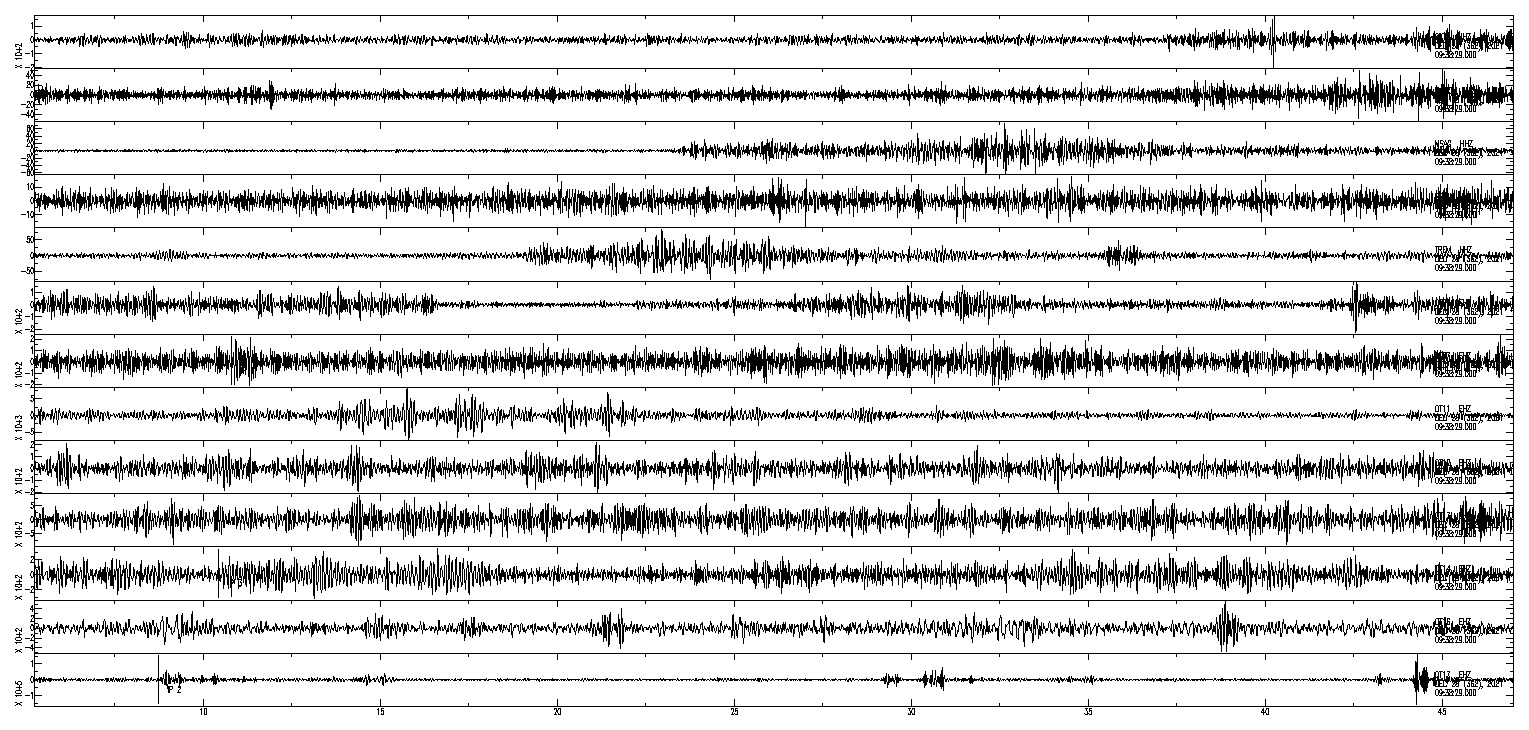
Figure 4Example of false event FE picked by CASP. The Z components of the 13 stations that detected the false events are shown. Vertical axes are “Velocity” in counts s−1; horizontal axis is “Time” in sec from the begin time indicated on the trace.
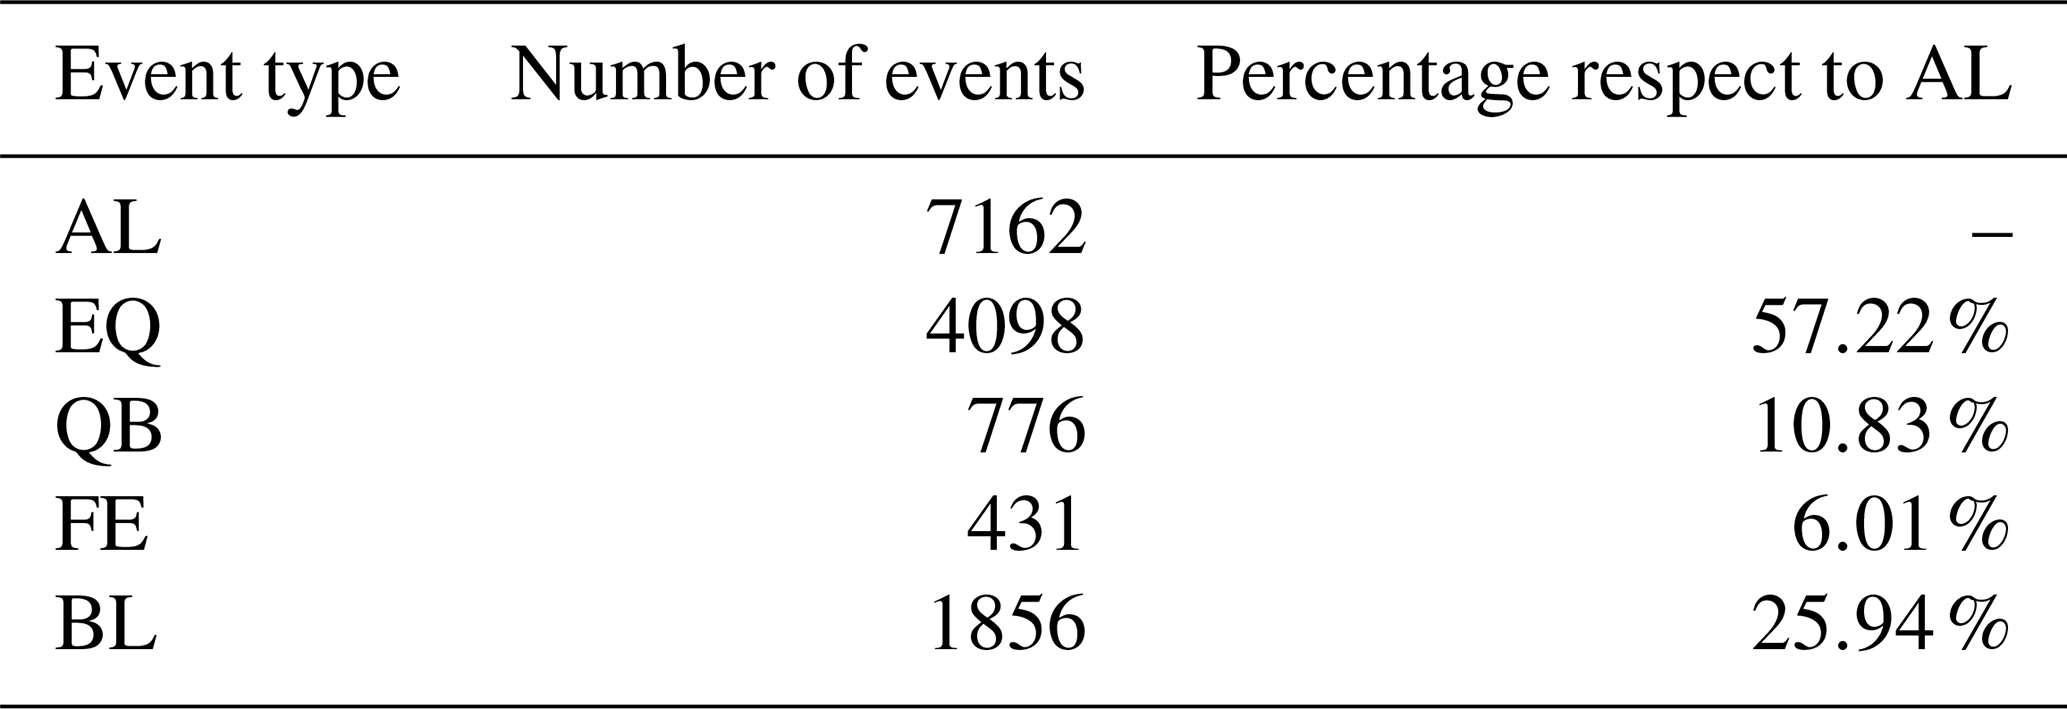
During the review of the automatic list of events AL, we recognized some errors that led to very bad locations of earthquakes that we discarded and labeled as BL. In Fig. 5 an example of erroneous picking of the S wave is shown, due to an anticipation of the recognition of the arrival of the S wave, constrained to be searched a few seconds after the recognition of the arrival of the P wave, through the setting of the PostSTeo parameter. If the error is repeated on more than three stations, the consequence is that the event is associated and detected as belonging to the GP area, even though it is an earthquake hundreds of kilometers away from the investigation area, as verifiable by a comparison with the earthquake list of the ONT (National Earthquake Observatory, INGV). The event in the Fig. 5 is an ML 2.3 on 13 July 2016 at 20:53:42 (UTC) in an area at few dozen kilometers from the edge of the investigation area. In the automatic list of events AL, we recognized 431 FE and 1856 BL, corresponding to the 6.01 % and 25.94 % of the total AL respectively. All these events were discarded. 4874 seismic events of the initial 7162 can be classified as seismic events, corresponding to the 71 %.
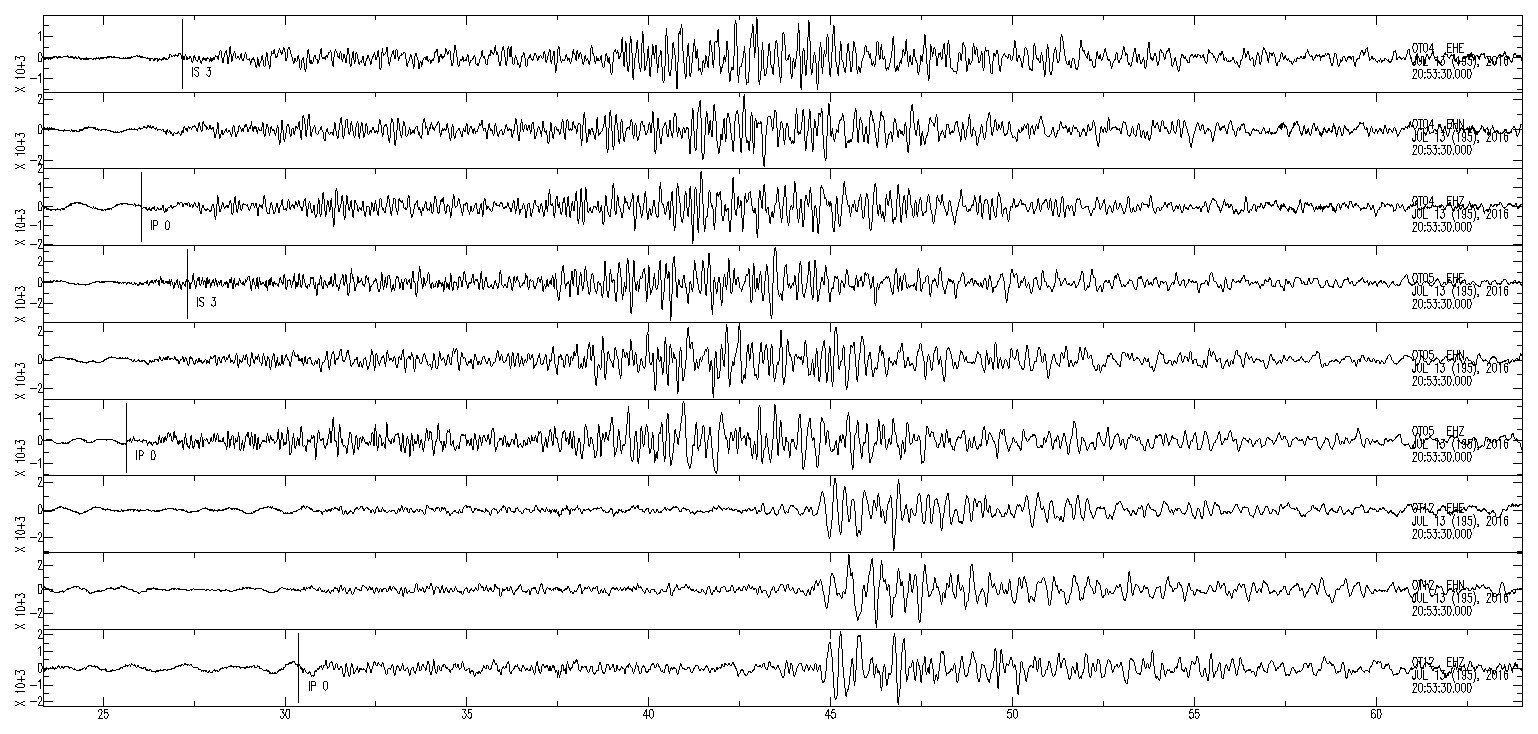
Figure 5Example of bad picking. The three component seismograms at stations OT04, OT05, OT12 with the corresponding picking of P waves (on the Z component) and S waves (on the E component) are reported in SAC format. Vertical axes are “Velocity” in counts s−1; horizontal axis is “Time” in sec from the begin time indicated on the trace.
In order to understand how the percentage of the FE and the BL respect to the AL events varies with varying the number of phases nphs used for detection, in Fig. 6 we plotted the percentage of FE and BL versus the nphs used for detection. The obtained trend indicates that the number of discarded events decreases with nphs. In particular, while the BL are always present in the automatic list of events for any value of nphs, the false events disappear for a number of nphs >10, thus indicating how the CASP tool can work alone without supervision.
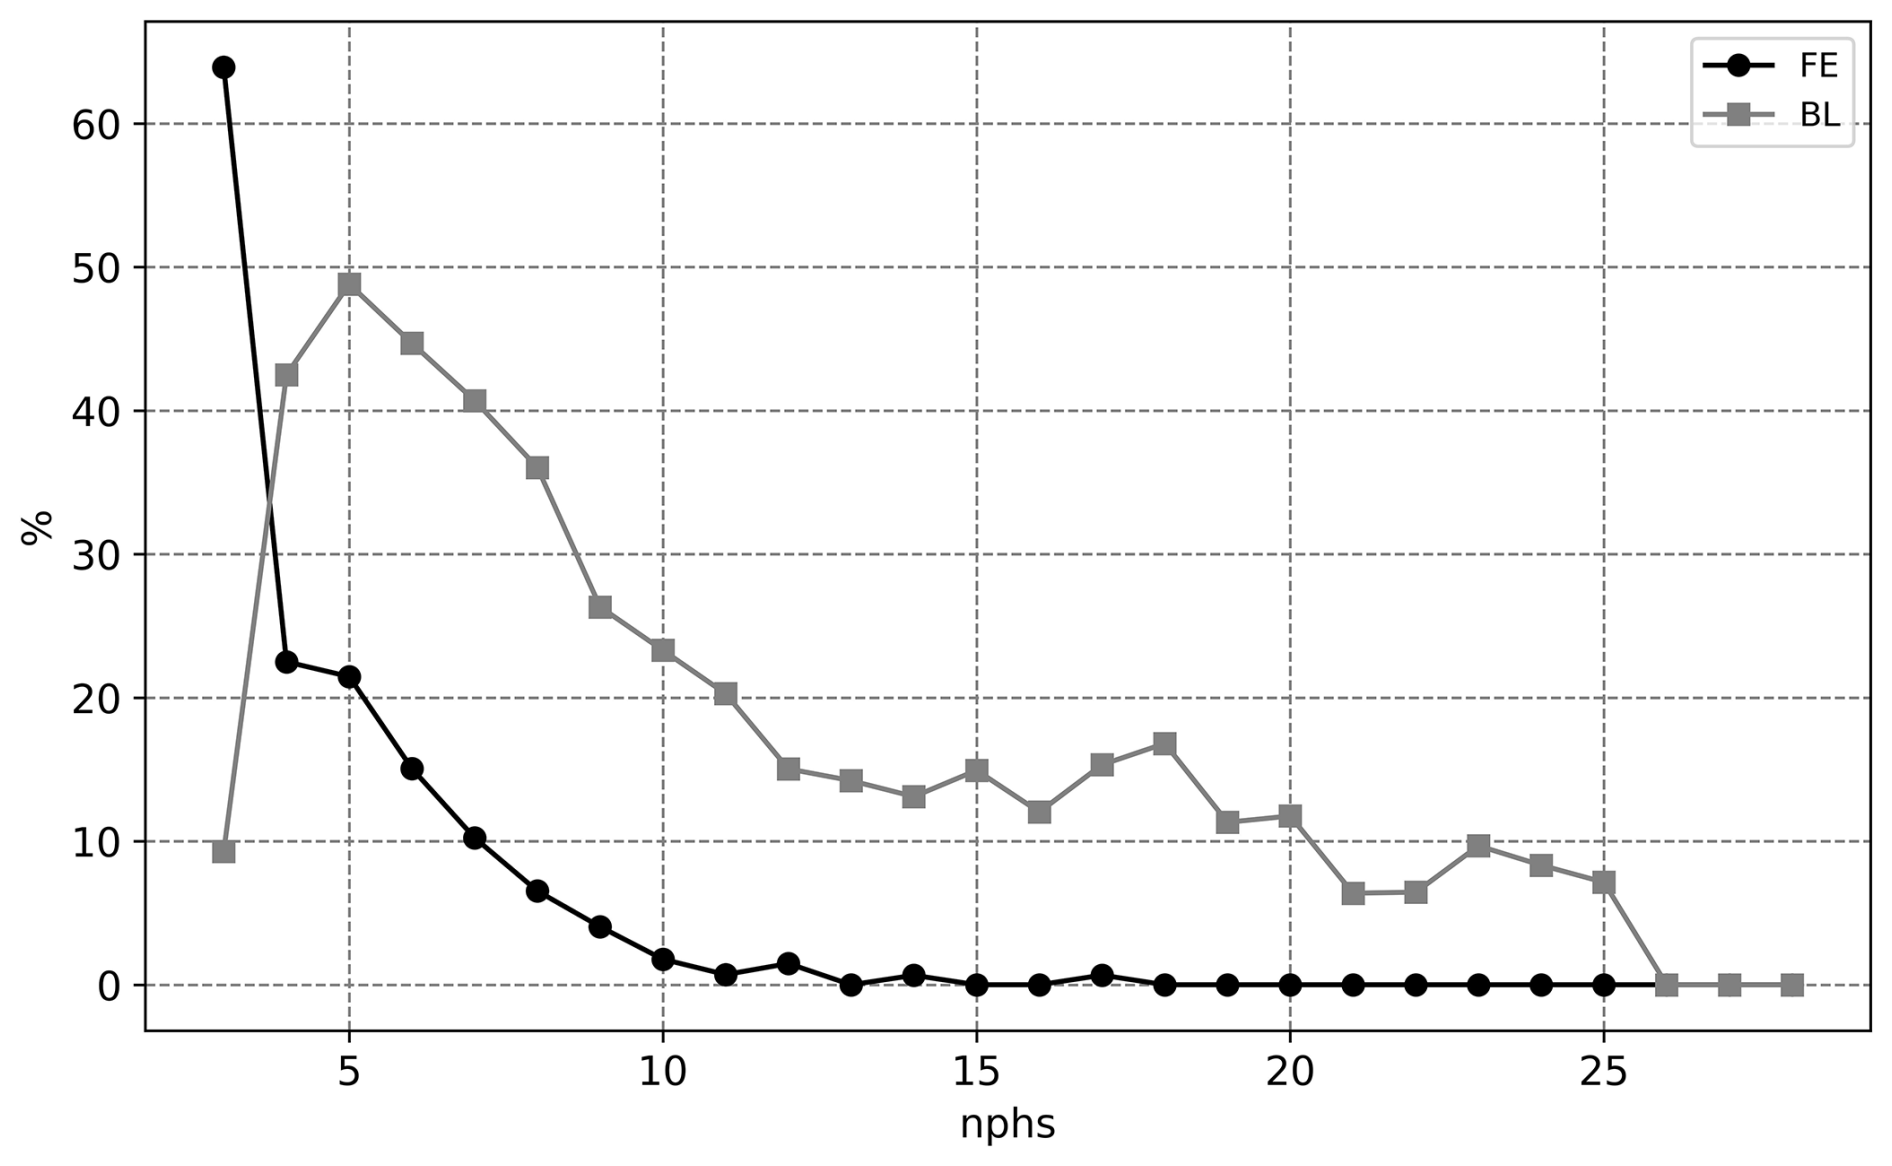
Figure 6Curves of percentage of BL and of FE (gray and black respectively) respect to the number of AL plotted versus nphs, the number of phases used by CASP for the detection.
4.2.2 Quarry blasts – QB
A separate discussion must be addressed for the explosions in the quarries. In the Apulian territory there are 399 active quarries divided in four production mining basin and the mining activity guaranteed throughout the year, thanks to climatic conditions and to the presence of a cutting-edge transformation and processing industry. The GP area produces 90 % of the total stone materials extracted in the Apulia region and 20 % of the Italian one, then it is the most important in southern Italy (a detailed description can be found at the institutional website of Apulia region (https://www.regione.puglia.it/web/cai/materiali-lapidei, last access: 18 March 2026). In the GP mining basin the famous shallow-water limestone (Festa et al., 2016 and reference therein) known as Apricena stone is extracted, one of the most appreciated in the world for its beauty and versatility. This intense mining activity can be recorded by local and dense seismic network since the magnitude of blasts can reach ML up to 2.5–3.0 in Europe and up to 4.0 in USA (Gulia, 2010). We recognized several hundred events probably caused by explosions in quarries to be examined. In the histogram in Fig. 8, the 4874 seismic events subdivided per daily hours, indicates that a great part of them occurs during daily time, when the seismic noise is higher and the seismic detect should be lower, so we can suspect that the source is anthropogenic. The identification of these events, labeled as QB, was obtained in different phases. First, we made a comparison with the quarry blasts recognized by the ONT bulletin, where the labeling of quarry explosions has recently been inserted. This comparison is not enough because the discrimination between tectonic earthquakes and anthropogenic events suffers from some problems of data processing and so artificial seismicity may be present in the ONT earthquake catalog, thus invalidating any physical or statistical interpretation using the earthquake catalog data (Gulia and Gasperini, 2021). Then we collected a subdataset by selecting those events that:
-
occurred on weekdays, from Monday to Friday;
-
occurred in a UTC time between 07:00:00 and 18:00:00;
-
having an hypocentral depth up to a maximum of 10 km;
-
located in the area which comprises known mining quarries, authorized to the use of explosives (by consulting a database provided by Apulia district), by observing the waveforms of the closest station, where the arrival of the S-wave is absent, and neglecting waveforms of the more distant ones, where a surface wave can be confused with the S-wave arrival.
No magnitude filter was used since the AL events in the automatic list have magnitude ML<3 for the vast majority. In a later and final phase, we visually inspected the seismograms of the selected subdataset to identify the explosions. In Fig. 7 an example recordings of identified blast is shown.
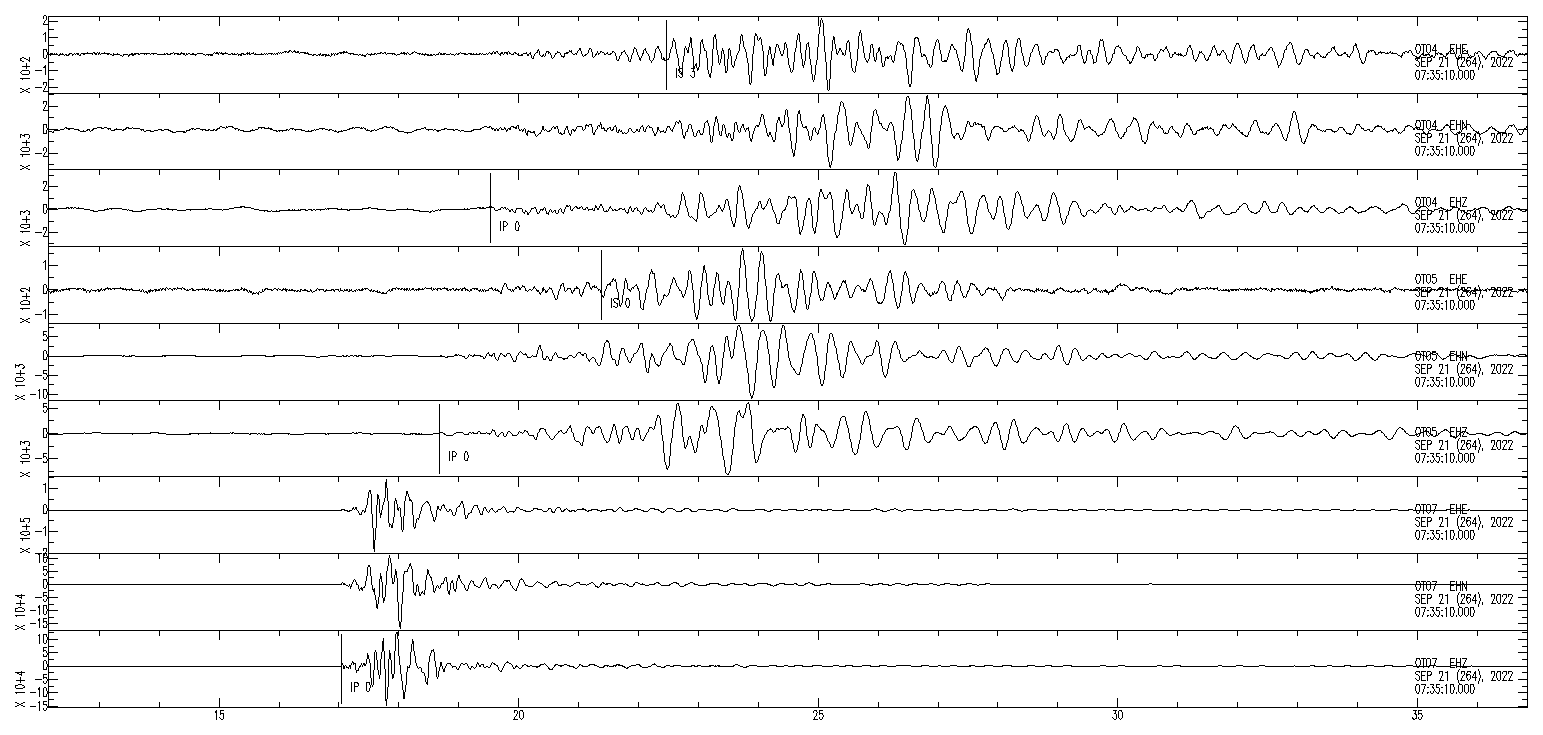
Figure 7Example of quarry blast registration. The three component seismograms at stations OT04, OT05, OT07 with the corresponding picking of P waves (on the Z component) and S waves (on the E component) are reported in SAC format. Vertical axes are “Velocity” in counts s−1; horizontal axis is “Time” in sec from the begin time indicated on the trace.
We recognized 776 explosions as shown on satellite orthophotos (yellow dots in Fig. 8a) where some clusters are clearly visible in correspondence with quarries for which the use of explosives is authorized. The explosions outside the clusters can be ascribed to survey activities by blasts. After removing the 776 quarry blasts, 4098 seismic events can be labeled as natural earthquakes (blue dots in Fig. 8a). In Fig. 8b the histograms of the number of earthquakes subdivided per daily hours is shown, indicating a pattern coherent with the tectonic activity and seismic noise in agreement with the results of Gulia (2010) for northern Italy. It is worth to note that, if we do not remove QB from the catalog, the interpretation of tectonics in the GP from the seismicity patterns can be strongly biased. In fact in Fig. 8c it can be observed that quarry blasts in our GP catalog brings to identify a fictitious shallow seismogenic layer between 3 and 7 km. Anyway, the QB plotted in map are located by the automatic procedure of the CASP tool. No re-picking neither relocation was carried out on quarry blasts as they were only discarded from the final catalogs.
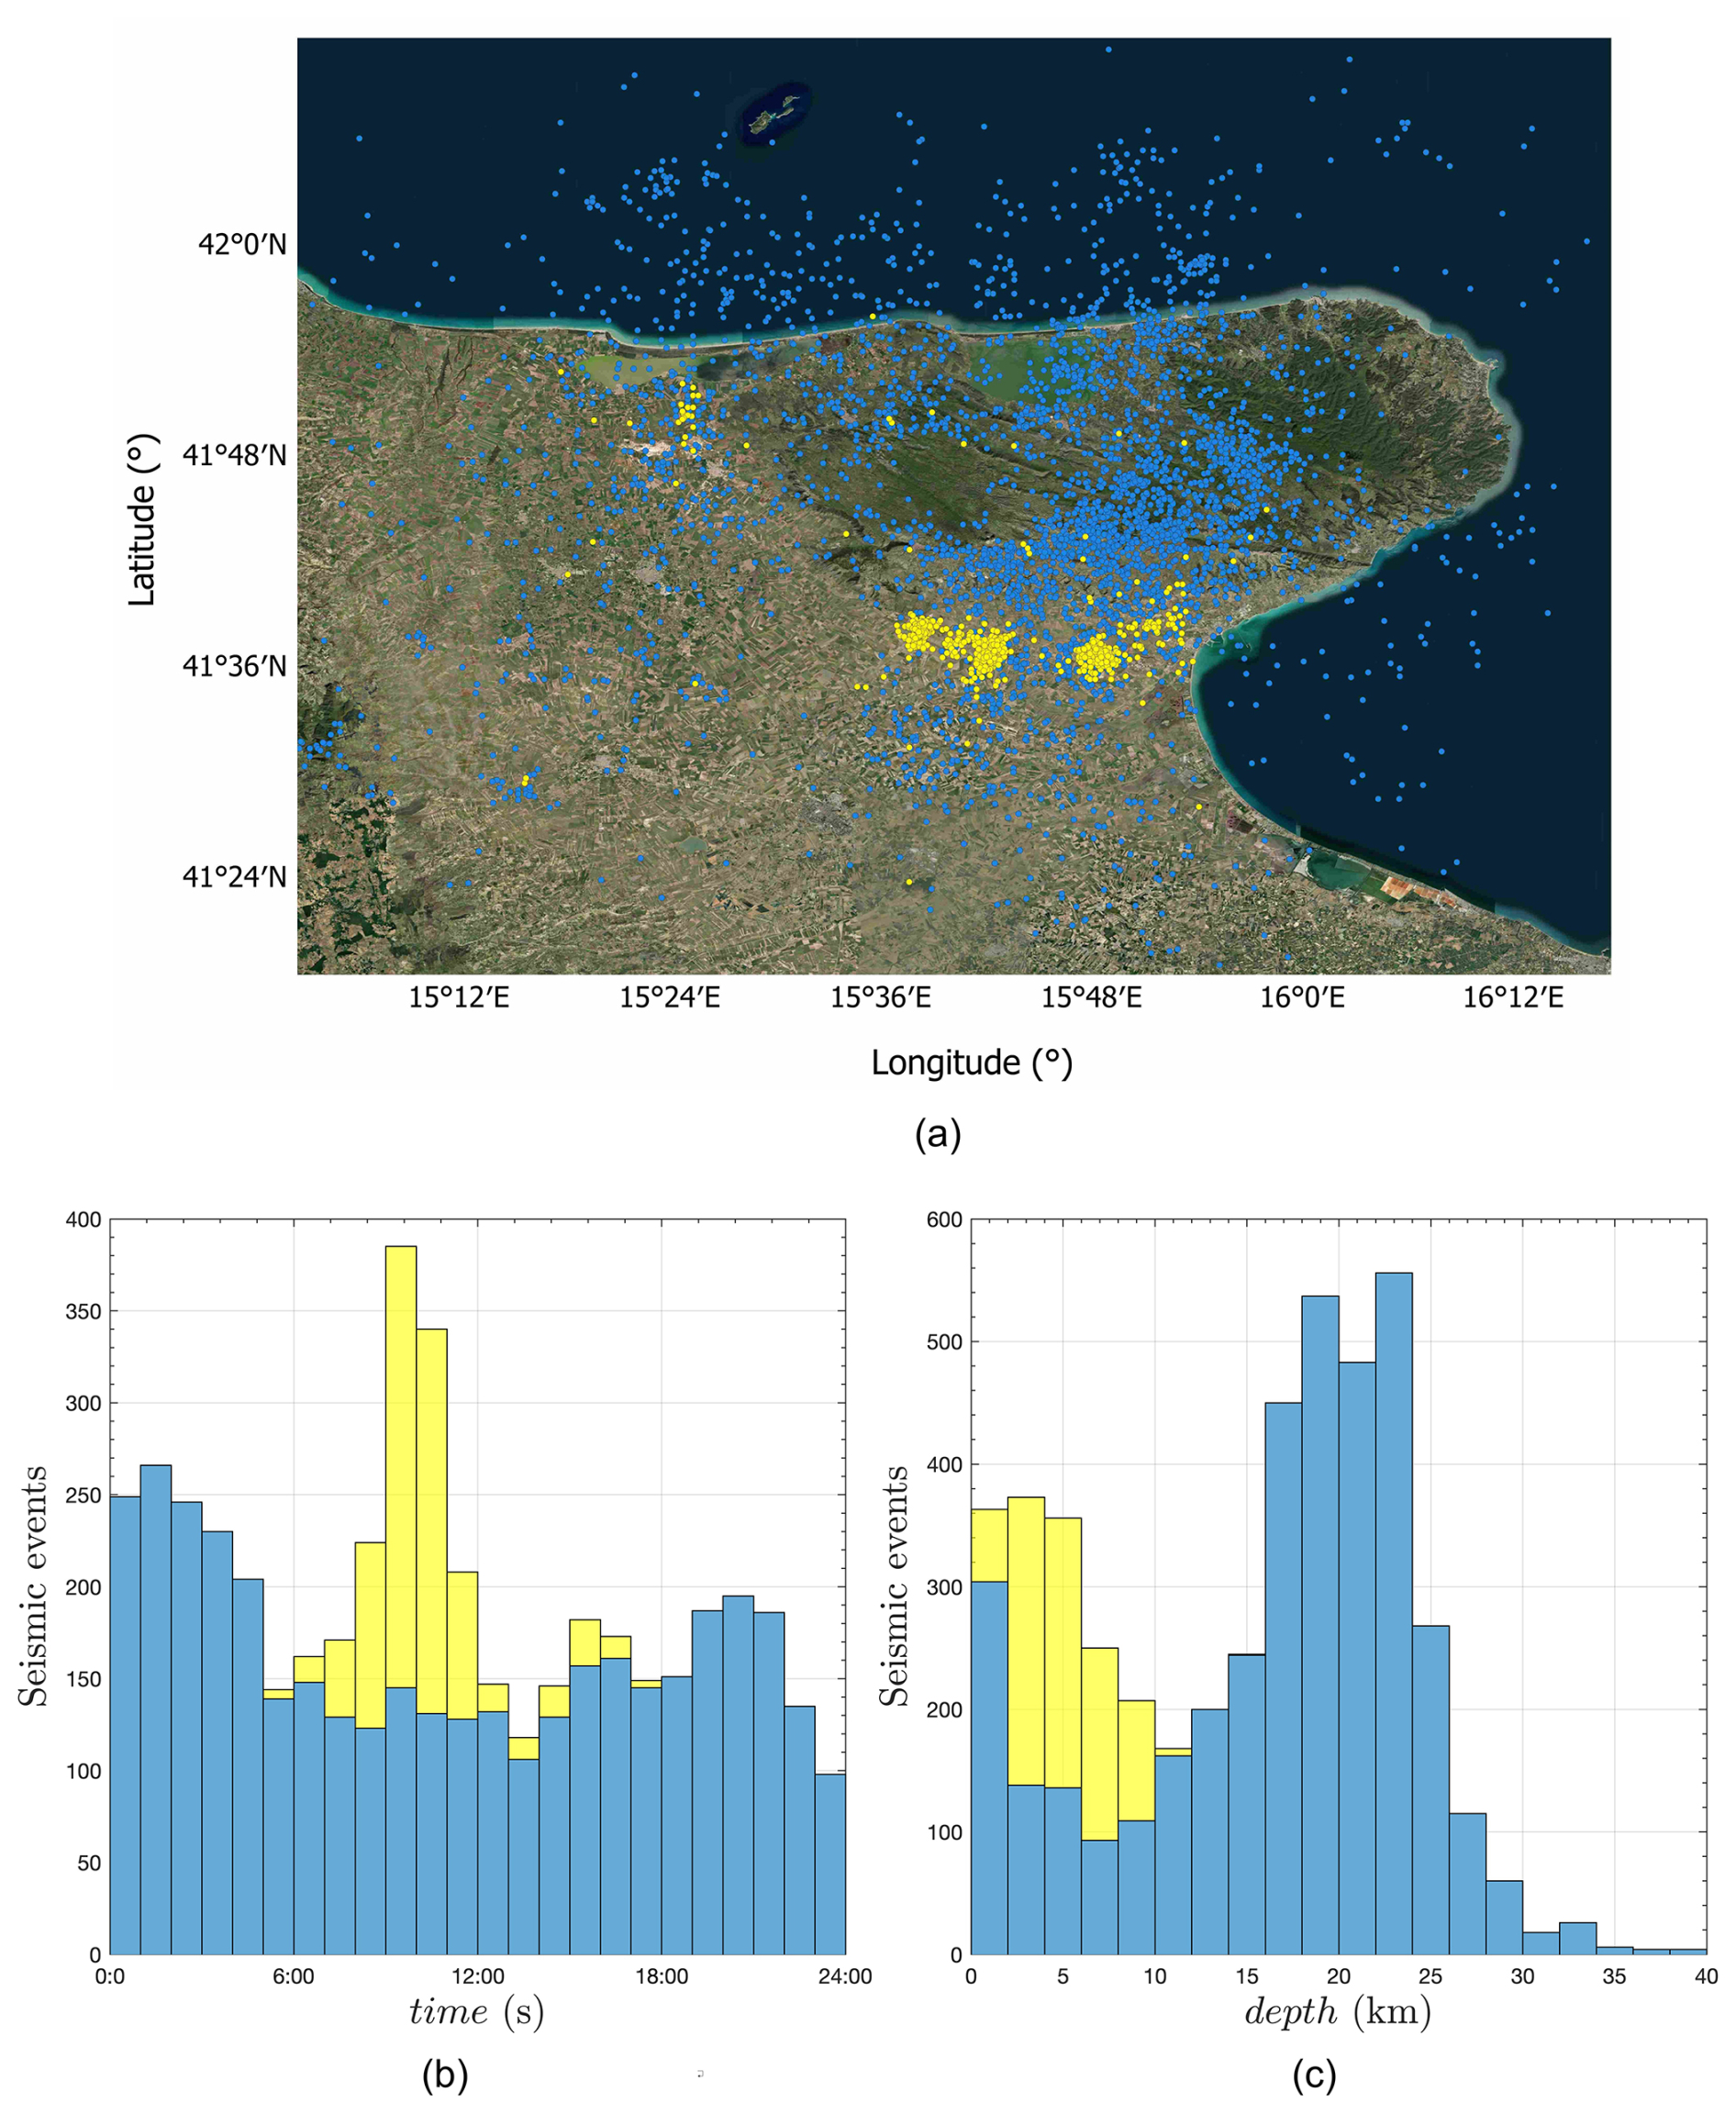
Figure 8(a) Map of QB and EQ epicenters. (b) Daytime histograms of EQ and QB, (c) depth histograms of EQ and QB. Yellow color in the histograms and in the map refers to QB events. Blue color in the histograms and in the map refers to EQ events. The daytime and the depth histograms are stacked histograms, thus the yellow bar indicating the number of QB is over the blue bar indicating the number of EQ. The map and the histograms were created in Matlab by MathWorks®.
At the end of the manual revision of the automatic event list, we obtained the results shown in Table 1. The result indicates that the rejected events are the 40 % of the automatic list highlighting that manual revision of picking is necessary to ensure the reliability of the seismic catalog.
Table 1Results of the revision of the automatic list (AL) of events. Acronyms are explained in Sect. 4. The number of events for each event type and the relative percentage respect to the total number of events present in the automatic list AL is reported.
A comparison between the automatic and manual picking of only EQ events was performed.
To evaluate the usefulness of the manual picking procedure in terms of number of pickings, we counted both the automatic and the manual picks only for the earthquakes (4098 EQ) of the catalogs and plotted the result in the histogram in Fig. A1, for each station. It is worth to note that in Fig. A1 do not appear all the automatic pickings of the CASP software that refer to the automatic list of events (7162 AL) but only the picks used for the location of the EQ. The histogram in Fig. A1 reveals that the manual procedure, slightly but systematically for all the OT stations, increases the number of pickings respect to the automatic procedure.
The differences between the manual and the automatic picking of the arrival times of P waves (, with and the P wave manual and automatic picks respectively) and S waves (, where and are the S wave manual and automatic picks respectively) are evaluated, obtaining the results shown in Fig. 9.
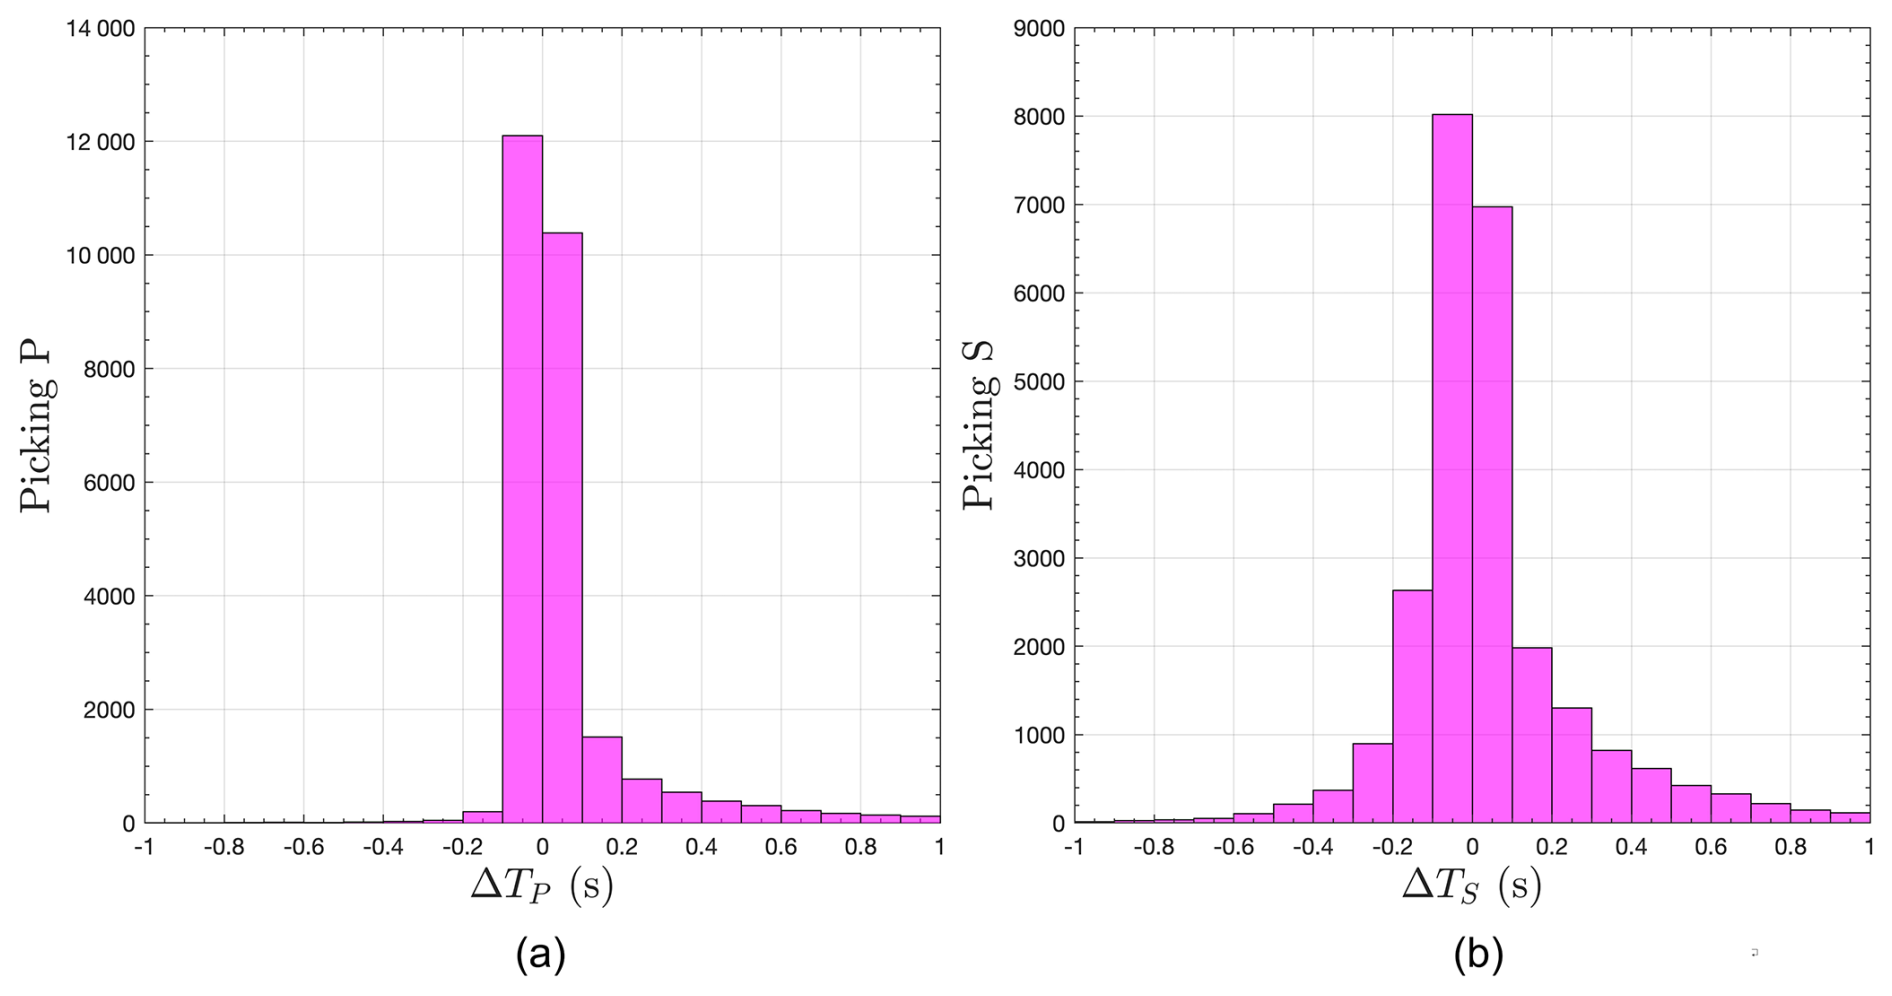
Figure 9Histograms of the number of (a) and (b) for the earthquake catalog EQ, grouped in bin of 0.1 s.
It can be observed, that for P waves the average s indicates a slight systematic error on picking while the standard deviation s indicates a small dispersion of ΔTP. indicates that the majority of the automatic picks are earlier than the manual ones. Differently for S waves, s indicates a greater systematic error on picking, picks are earlier in a greater extent than the manual ones and with a great dispersion ( s). The major dispersion of time picking differences is for ΔTS and indicates that the module Picker2 better identifies P-wave than S-wave arrivals. The asymmetric left distribution shown in Fig. 9 indicates that the automatic arrival times are systematically underestimated and this could affect event location bringing the event closer to the network than it should be, as described in Sect. 6.1.
Once selected the 4098 EQ from the automatic event list, the relocation with the manually reviewed arrival times of P and S waves was performed and the evaluation of the location quality was assessed. We decided to compare the location results obtained by both a linearized location algorithm (H71 by Lee and Lahr, 1975), used in the preceding catalog of the GP area (Filippucci et al., 2021b; Miccolis et al., 2021) and a non-linear location algorithm (NLL by Lomax et al., 2000, 2014) used also by CASP. Comparisons between linearized and non-linear location methods are not very numerous in the literature. Considering the comparison between location methods that use 1-D velocity models (Lomax et al., 2000; Presti et al., 2008) the results about both hypocentral coordinates and location errors indicate that a non-linear approach is generally preferable and leads to more reliable results especially when the problem is not well conditioned and the location probability in the space-time domain belongs to an undefined large volume. Otherwise, when the network coverage around the earthquakes is quite good, the errors on picking of P and S time arrivals are small and a crustal velocity model is adequate, the linearized location method gives locations of comparable quality to those of non-linear methods (Abbasi, 2019).
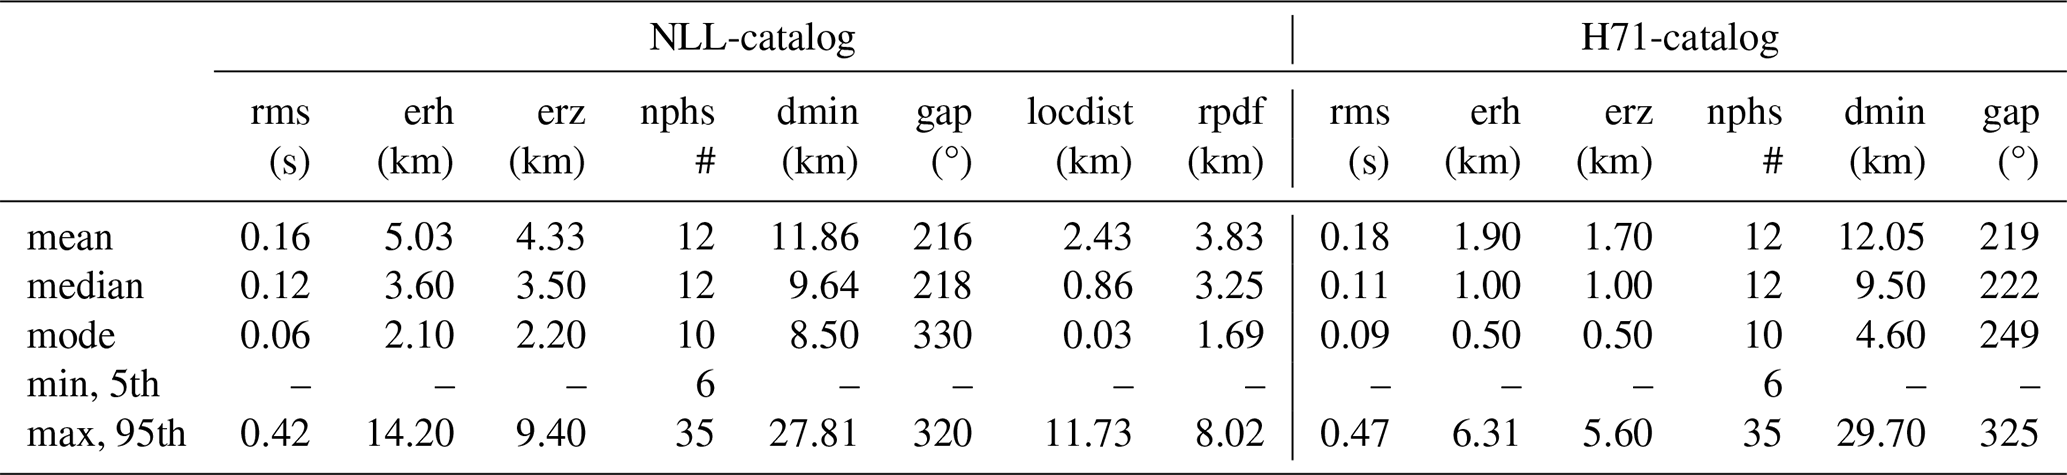
6.1 NLL-catalog of EQ
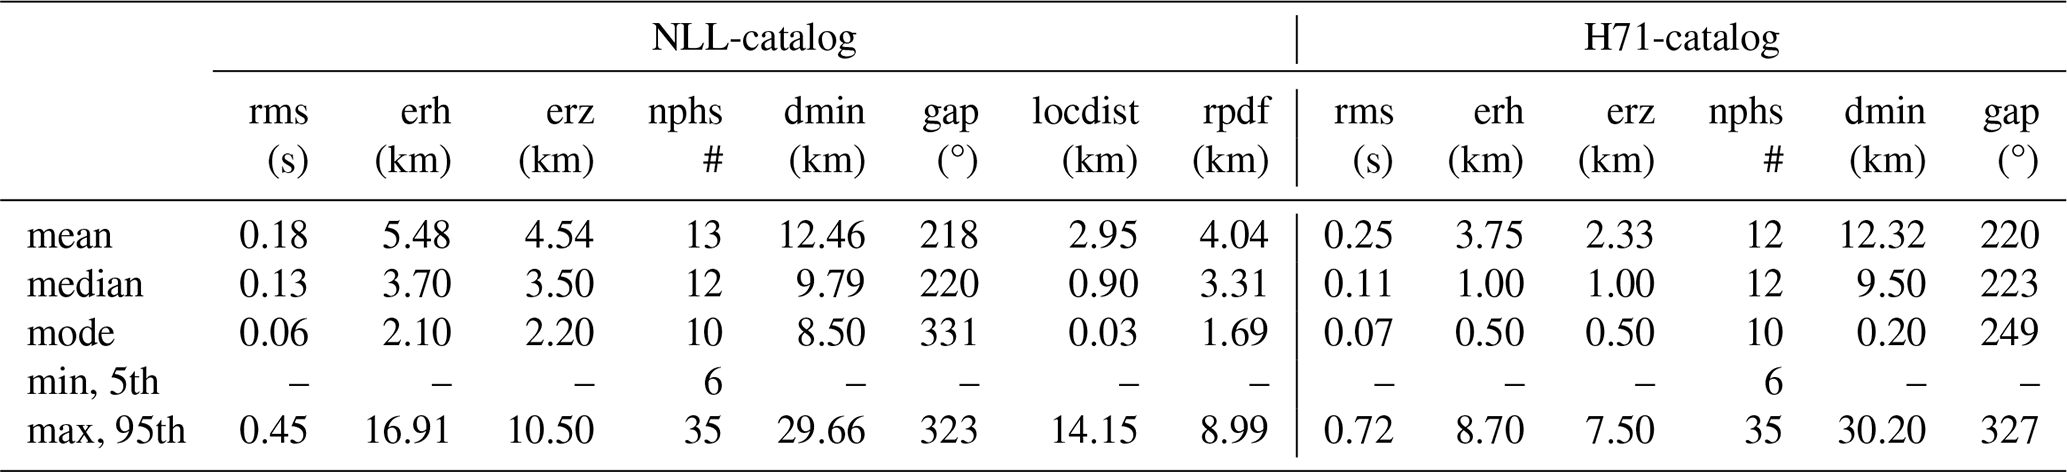
To assess the accuracy and robustness of a seismic location, one can employ estimators. For NLL, these might include 8 uncertainty parameters for location, organized in the histograms in Table 2. The uncertainty parameters are:
-
rms. root mean squared travel-time residuals;
-
erh. horizontal error on epicenter location;
-
erz. vertical error on hypocenter location;
-
nphs. number of P and S phases used for location;
-
gap. azimuthal gap that is the largest angle between two receivers as seen from the epicenter;
-
dmin. distance between the epicenter and the closest station of the network;
-
locdist. distance in km between the expected value of the probability density function (pdf) of the hypocenter location (expressed as latitude late, longitude lone and depth depthe) and its maximum likelihood (expressed as lat, lon, depth);
-
rpdf. radius in km of the volume V described by the scatter points.
The indicators locdist and rpdf are computed “a posteriori” as following (Lomax et al., 2009):
The location parameters rms, erh, erz, dmin are computed and showed by the NLL code in H71 format (Lomax et al., 2000, 2014). The uncertainty parameters are distributed over asymmetric statistics with maximum frequency on the statistical mode that is reported in Table 2 together with other statistical parameters. rms refers to location quality in time and its statistics (mean, median and mode) suggest an overall good quality; erh and erz refer to location quality in space and their statistics show that the majority of the locations are characterized by low hypocentral errors; the number of phases nphs used for location changes significantly showing the variability in the input travel times' dataset. The location quality in time and in space are linked with by the velocity model used for location. All the indicator of locations are of good quality except for gap, the azimuthal gap indicator. Gap, is the major issue in the GP area because of the geographical configuration of the Gargano Promontory, which elongates in E direction toward the Adriatic sea. This causes an high angle of network uncovering which makes locating earthquakes in this area as difficult as locating events offshore. The gap (Fig. 10e) shows values distributed quasi-symmetrically around an average , which is a very high value. If we would filter the earthquake database considering as quality criterion gap <240°, as already done in the previous earthquake catalogs of GP (Filippucci et al., 2021b; Miccolis et al., 2021) we should reject almost half of our dataset. Being a criterion based on gap too restrictive for the peculiar GP area, we evaluated the quality of earthquake location by following an approach similar to that of Michele et al. (2019). It is worth to note that the statistics of the parameters reported in Table 2 are used as indicator for the selection of the EQ in the final catalogs. Results of the selection are in Sect. 6.3.
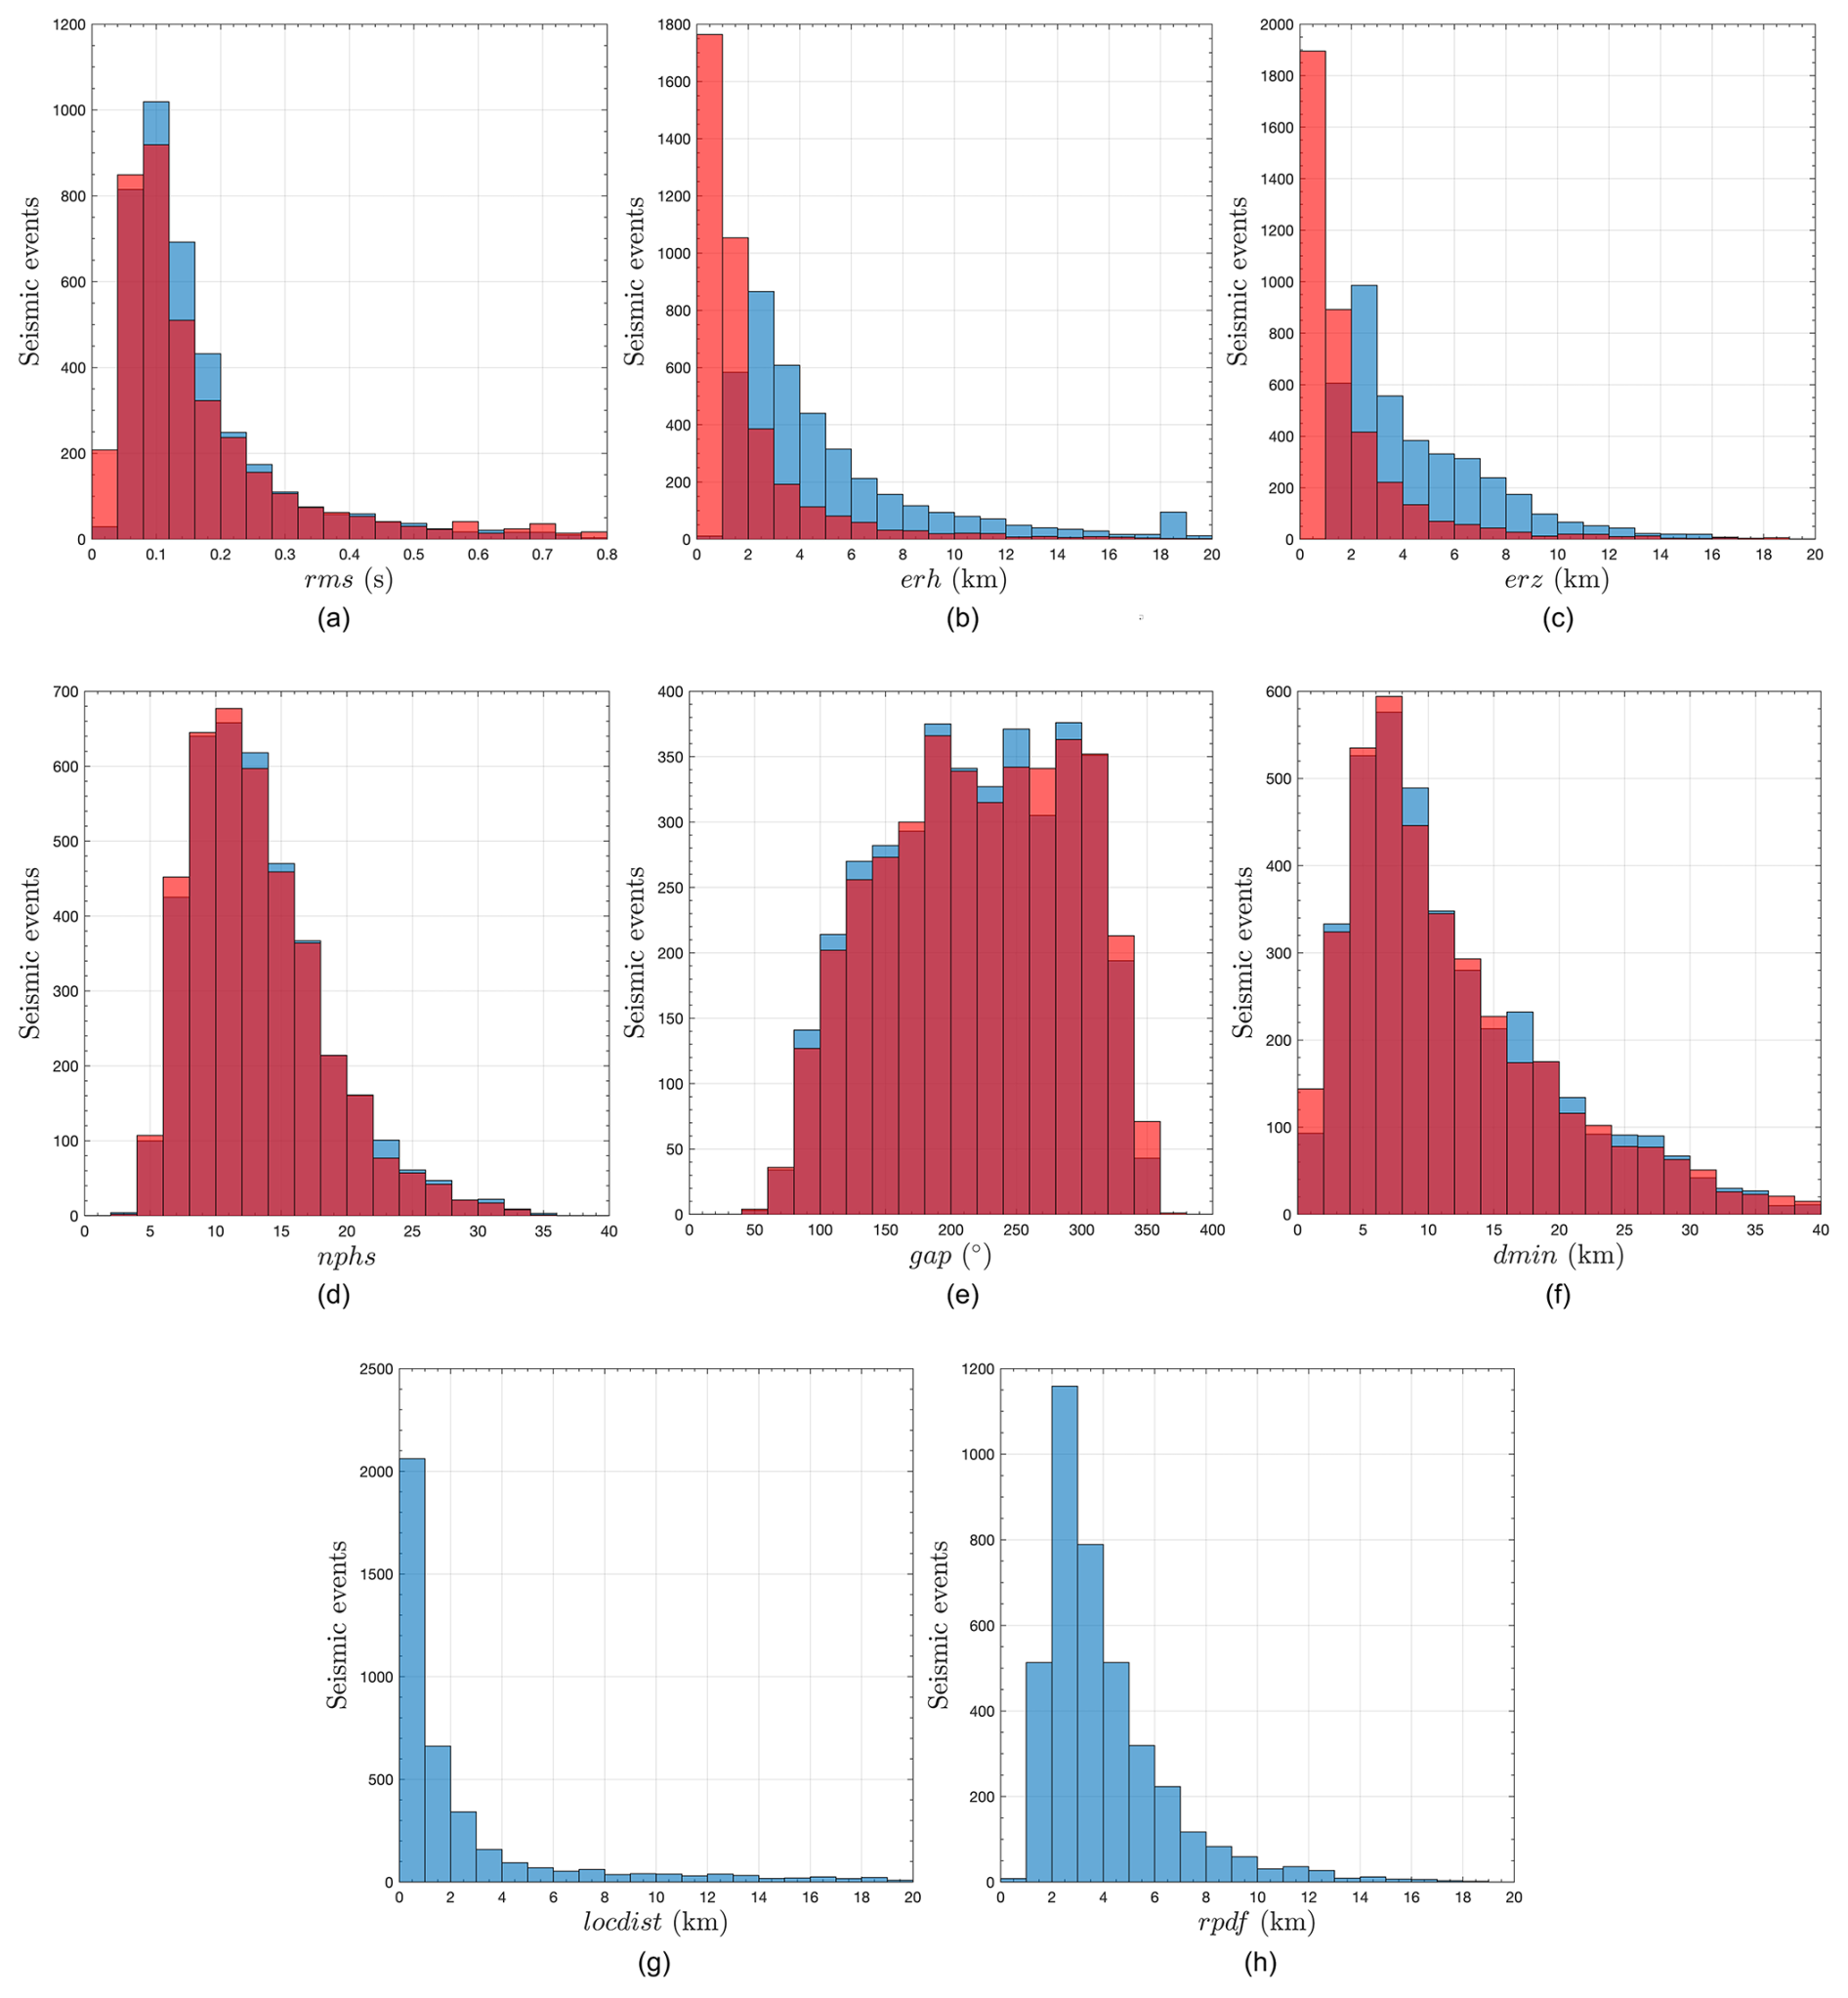
Figure 10Overlapped histograms of quality location estimators for the H71-catalog (orange + red areas) and NLL-catalog (blue + red areas). The areas in red color should be considered as common parts for both the H71 and NLL catalogs.
A total of 4098 earthquakes were located and these locations were compared with those provided by the CASP automatic procedure. In Fig. 11, the differences between the epicentral position (Δepi), hypocentral depth (Δdepth) and origin time (Δorig) are shown. The statistical distributions are Gaussian and centered on approximately zero ( km; km; −0.56 s) suggesting that systematic differences are negligible. Standard deviation on epicenter position difference, σΔepi=2.2 km, is less then the half average horizontal error . σΔdepth=4.0 km is comparable with the average vertical error km and σΔorig=0.3 s is comparable with s indicating a good agreement between manual and automatic location of epicenter and origin time.
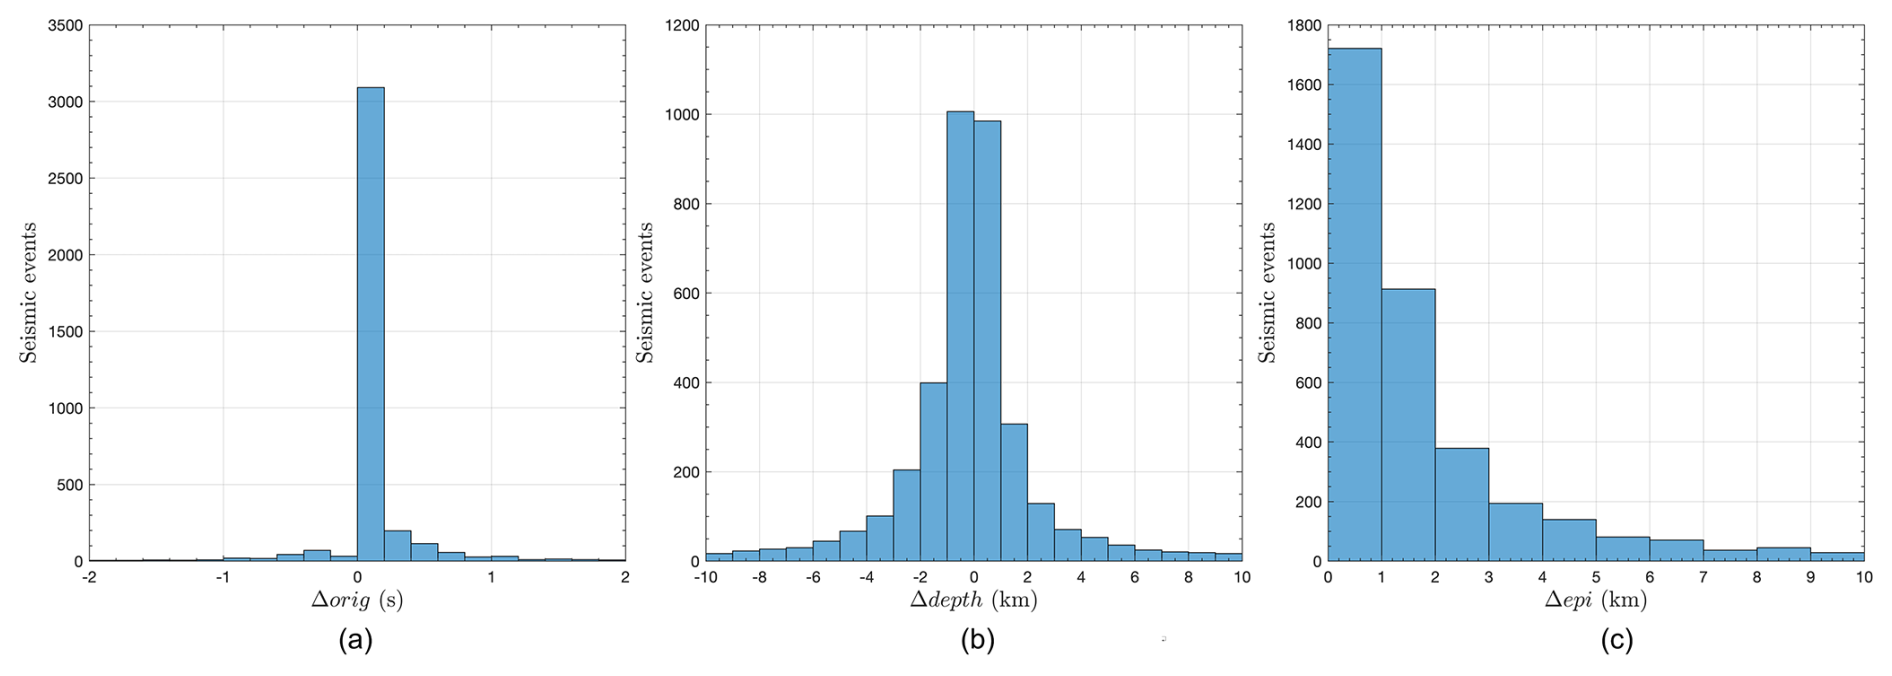
Figure 11Histograms of the location difference between the automatic catalog and the NLL manual catalog.
From this analysis it appears that the major issue related to the CASP automatic detection and location is the recognition of the event type, if it is a regional event, a false event or a quarry blasts of the type BL, FE, QB or EQ and a lot of human work is needed in selecting the event type from the AL, as described in Sect. 4.2. Once earthquake-type events have been identified and selected, their location in terms of P and S phase recognition is acceptable even without manual review, as shown in Fig. 11. If the effort to catalog the event type were automated, for example with artificial intelligence techniques trained on the specific dataset, rather than manual, the CASP software could operate without supervision. However, if high-quality picking is required, manual review of time arrivals is still necessary, as shown in Fig. 9.
6.2 H71-catalog of EQ
Deterministic location methods based on linearized inversion, as H71, start from an assumption on the initial hypocentral position. If the estimate of the initial position does not sufficiently match the true hypocenter, then the linearized solution may converge to a local minimum in the source parameter domain. This local minimum may differ substantially from the global minimum that should correspond to the exact hypocenter. In this paper, the initial value of the hypocentral depth has been refined using different initial depths (10 initial depths with a step of 10 km, starting from 10 km to a depth of 100 km) and the best location, among the 10 locations for each earthquake, has been selected through the minimization of the dimensionless parameter S (Miccolis et al., 2021):
where rms0=1 s is a reference residual time and dmin is the distance between the epicenter and the closest station of the network. A total of 4105 earthquakes were located. The indicators of H71 location quality, listed in Table 2 and plotted as histograms in Fig. 10 in orange color, are similar to those of NLL, except for the probabilistic estimators (locdist and rpdf) that are not computed by linearized location methods. Results indicate an overall good quality of the linearized catalog, except for the azimuthal gap values, gap, as expected.
Table 2Statistic parameters of the uncertainty estimators of the NLL and the H71 catalog. The rows min, 5th and max, 95th are used in the quality formula in Eq. (4) as following: the max value is reported only for the nphs estimator with the subscript max; the 95th percentiles is reported for all the other estimators with the subscript n; the 5th is reported for the nphs estimator with the subscript min.
6.3 Quality of NLL-catalog and H71-catalog of EQ
Differences between the 2 catalogs are shown in Fig. 10 relatively to the quality indicators. It is worth to note that, by analyzing the 3 indicators rms, erh and erz, the quality of H71-catalog is overall better that that of NLL-catalog, with time/space uncertainties systematically lower. In Fig. 12 we showed 3 hypocentral depth histograms for each catalog with relative vertical error bars. At left we can see that the histogram of depth-erz in the NLL catalog shows 550 earthquakes that could be located several km above the Earth surface while in the H71-catalog this number is reduced to 98. This result indicates that for some hundreds of earthquakes the NLL locations of foci depth are of poor quality.
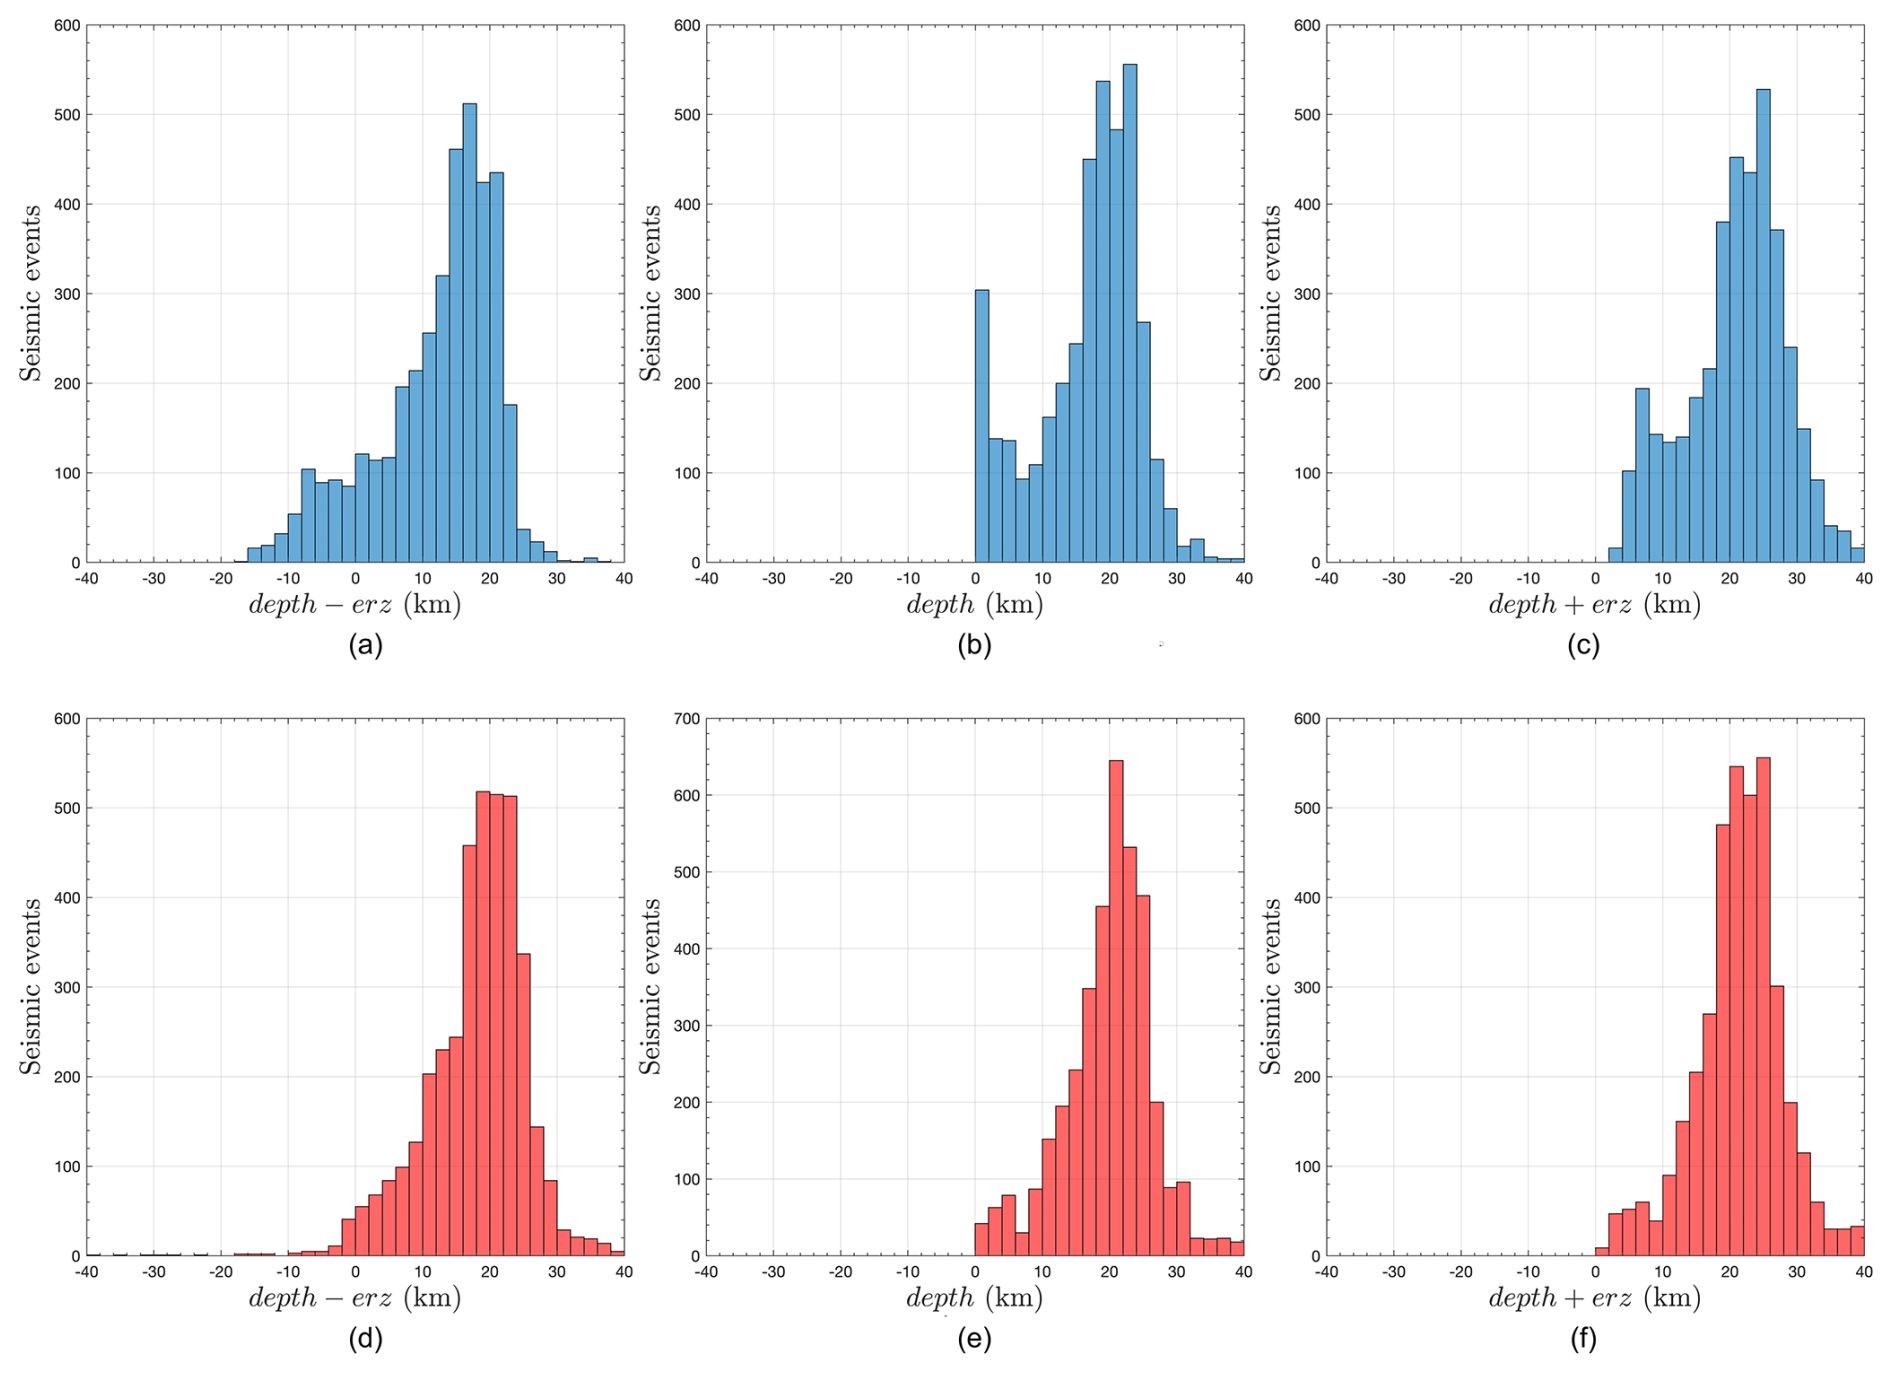
Figure 12Histograms of differences between depth and associated vertical error for NLL-catalog (blue) and H71-catalog (red).
In order to quantitatively analyze and compare the quality of the two catalogs, the correlation matrices of both NLL and H71 uncertainty estimators are shown in Fig. 13. The great dispersion observed in the correlation plots indicates that correlation is weak thus the possible bias in earthquake locations is minimized.
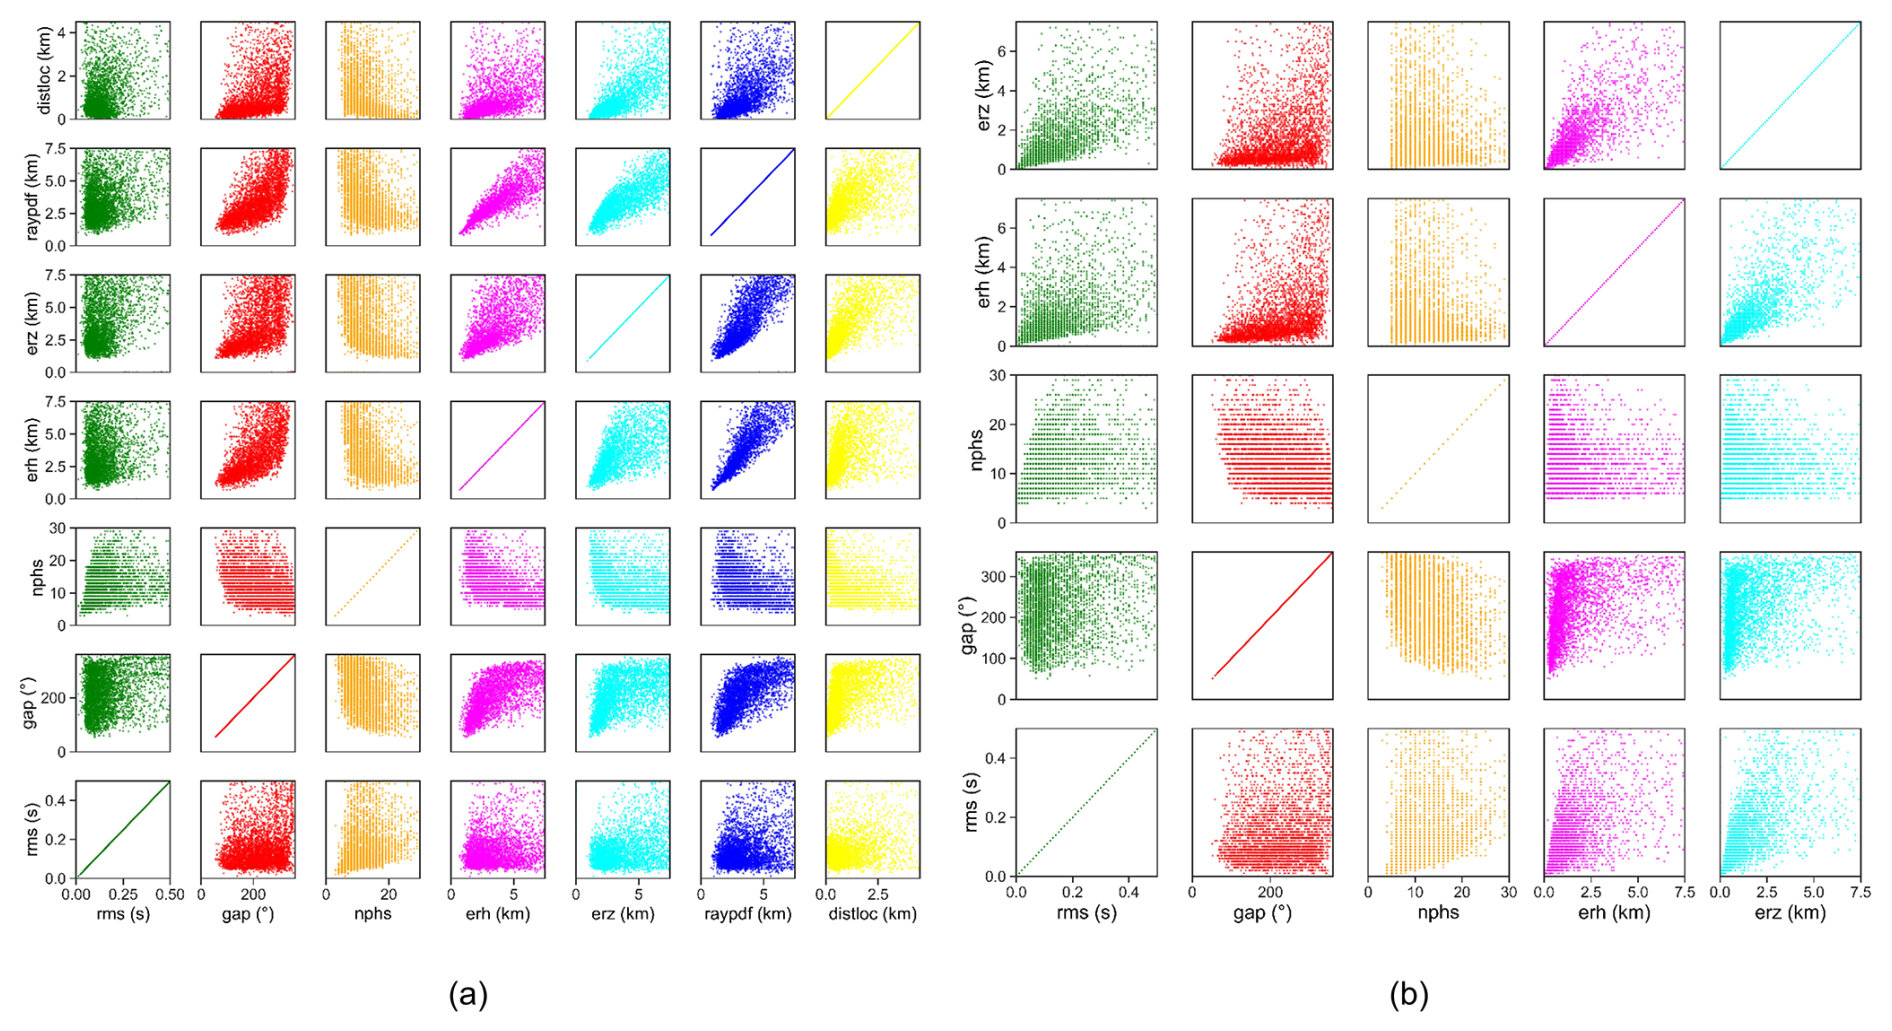
Figure 13Correlation matrices of the uncertainty parameters related to: (a) NLL-catalog, (b) H71-catalog.
We propose a quality parameter qf for locations following that proposed by Michele et al. (2019). The qf factor for each earthquake can be expressed by the following formula:
The subscript n means “normalized” to the 95th percentile value present in the considered catalog, wj is a weighting parameter ranging from 0 to 1 while the number j of indicators are j=7 for NLL and j=5 for H71. All indicators increase with decreasing location quality, except for nphs for which we used as nphsmin= 5th percentile and as nphsmax the maximum value of the considered catalog. Regarding the weights, we assumed wj=1 for all estimators, except gap where wgap=0.5 to prevent the quality of the entire catalog from being brought down by the quality of the gap. This is because the Gargano Promontory for its geographical characteristics can be assimilated to an offshore area and the earthquakes occurred in the Gargano Promontory should be treated as offshore earthquakes as proposed by Latorre et al. (2023). We used the 95th percentile to normalize those estimators which increase with decreasing quality and we used the 5th percentile to normalize the estimator (only nphs) that decreases with decreasing quality as reported in Table 2. The use of the 95th percentile instead of the maximum value as proposed by Michele et al. (2019) enable to eliminate from the catalogs the location outliers by using as acceptance criterion based on the quality formula: qf≤1. With this criterion we discarded 160 earthquakes for H71 and 97 for NLL for which qf>1. The earthquakes that NLL locates at shallow depths, with such a vertical error that they could be above the Earth's surface (Fig. 12), are 418, have an average foci depth of 1.95±6.88 km and an average quality therefore they were discarded from the final NLL-catalog. This example demonstrates that the qf parameter in Eq. (4) proposed in this paper is well formulated and qf>1 is a reliable criterion to discard bad quality events. The 418 earthquakes discarded from the NLL-catalog, when located with H71 result at an average depth of 14.56±4.03 km and have an average , so they were included in the H71-catalog. This explains why, in Table 3, the number of earthquakes in each quality class may differ between the NLL and H71 locations. Differences between the 2 catalogs after the EQ selection with the quality criterion qf>1 are shown in Table 4.
The EQ selection based on the quality acceptance criterion qf≤1 led to: EQ =3820 for NLL-catalog and EQ =3782 for H71-catalog. The statistical estimators of the final NLL and H71 catalogs are reported in Table 4 and indicate a general increase of the quality of locations. For the selected earthquakes, qf ranges from 0 (highest quality) to 1 (worst quality), and, based on this value, each earthquake falls into a quality class ranging from A (the highest quality) to D (the worst quality). The criteria for dividing qf into the alphabetical quality classes are in Table 3. The quality classes, reported in Table 3, indicate that most earthquakes fall into the 2 classes of B and C, for both the H71 and NLL catalogs. Earthquake locations on map are shown in Fig. 14 divided for quality class.
Table 3The 4 different quality classes for 4 evenly spaced intervals of qf as adopted in Eq. (4) and the number of earthquakes that fall into each class with the percentage relative to the total number of earthquakes.
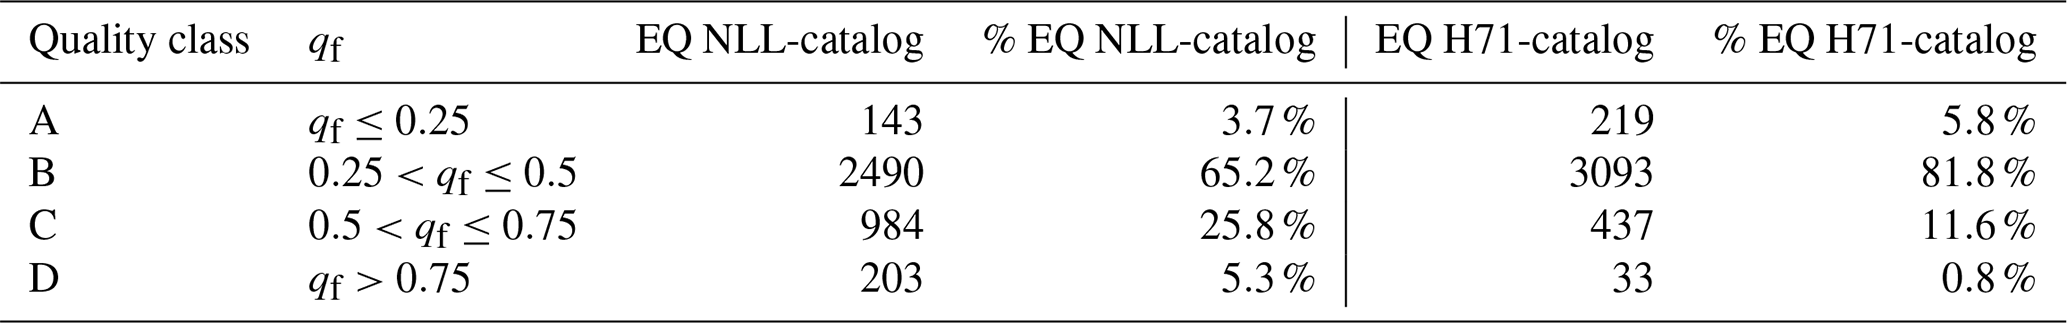
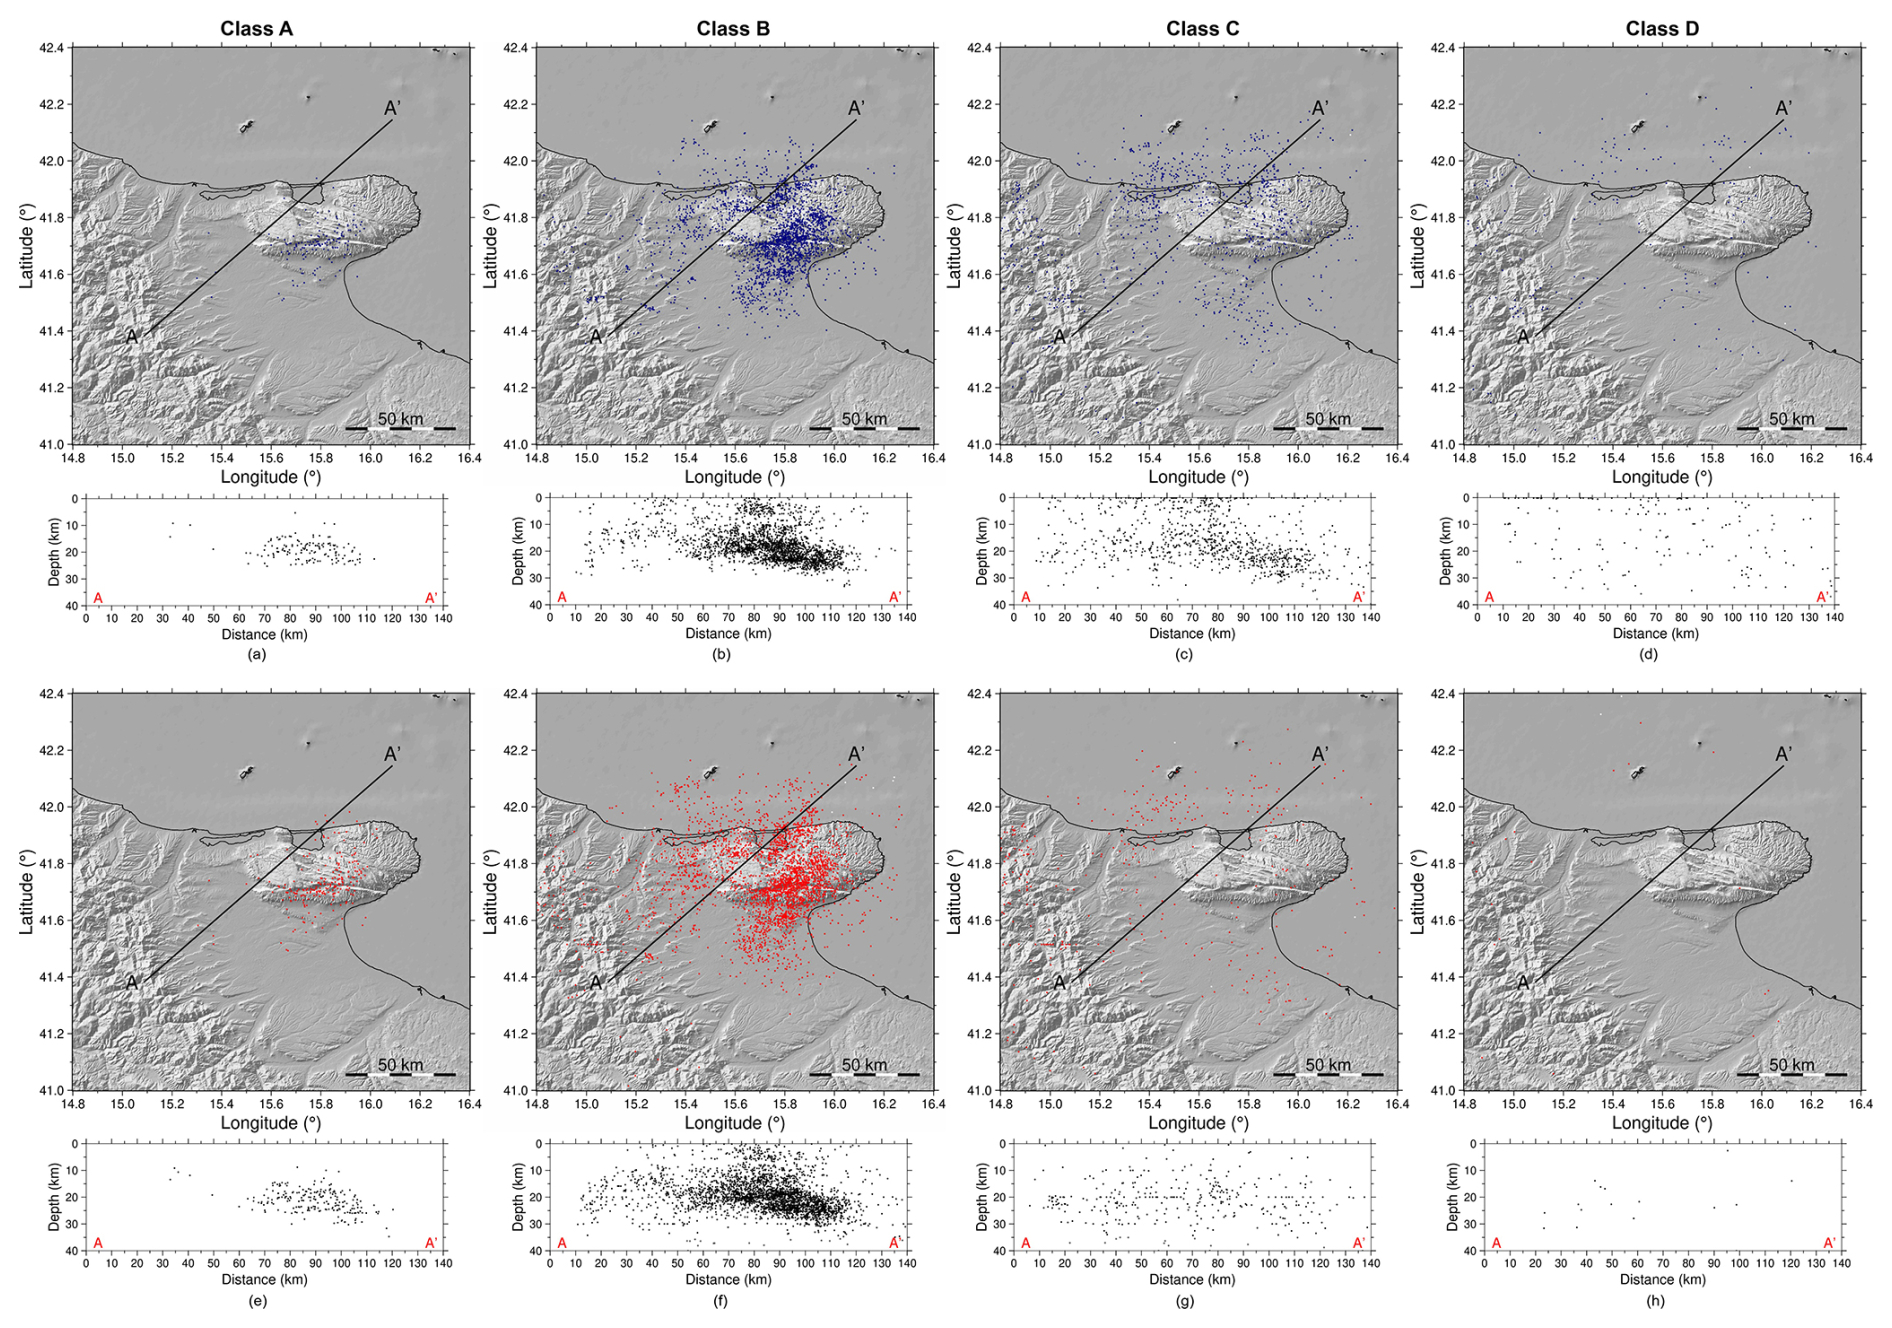
Figure 14Maps of seismicity in quality classes as defined in Table 3. Black line on the map is the diameter of the investigation area oriented 45° N and corresponds to the vertical sections, plotted below each map for NLL (blue) and H71 (red), where all earthquakes are projected.
Table 4Statistical parameters of the uncertainty estimators of the final NLL and H71 catalogs after the selection based on the quality acceptance criterion qf≤1. See Table 2 for the meaning of the parameters and for a comparison with the estimators before the selection based on quality.
6.4 Local Magnitude ML
We used the Di Bona (2016) ML scale since it is derived for the Italian region and it is based on recent seismicity (between 2003 and 2009). Di Bona (2016) analyzed the local magnitude bias with the Hutton and Boore (1987) ML scale, used in the routine magnitude computation in the ONT at INGV. The author found that for the Italian region the magnitude as computed with the Hutton and Boore (1987) attenuation law, ML(HB87), would lead to magnitude overestimation at short-range stations and underestimation farther than 100 km. The ML bias varies with distance and increases in absolute value up to ∼ 0.55 from 100 to 10 km and up to ∼ 0.35 from 100 to 600 km. Moreover, the effect of the attenuation function of Di Bona (2016) highlights that, using HB87 leads to overestimation of the lowest magnitudes and underestimation of the highest magnitudes, with a bias within about 0.2 within a magnitude range from 2.8 to 5.5. In our seismic catalog we have earthquakes both of low magnitude and at short distance so the effect of overestimation of the HB87 attenuation law respect to DB16 could be enhanced and greater than 0.2.
In the CASP procedure for location, the local magnitude ML is automatically calculated using the algorithm proposed by Spallarossa et al. (2002) for northern Italy. This procedure is included in the module Picker2 where the configuration parameters are: the Butterworth pre-deconvolution low level filter (0.8–1.5 Hz), that cut the lower frequencies, the high level filter (30 Hz) that is lower than the Nyquist frequency, fNyquist=50 Hz, being 100 sps the sampling rate of the GSN, to avoid any aliasing effect. The module Picker2 generates synthetic Wood-Anderson seismograms and calculates the local magnitude ML considering the attenuation function calibrated by Di Bona (2016). log A0 is computed considering n=1.667, k=0.001736 and the reference distance D=100 km. ML was computed for both the catalogs (H71 and NLL) and the histograms are shown in Fig. 15a.
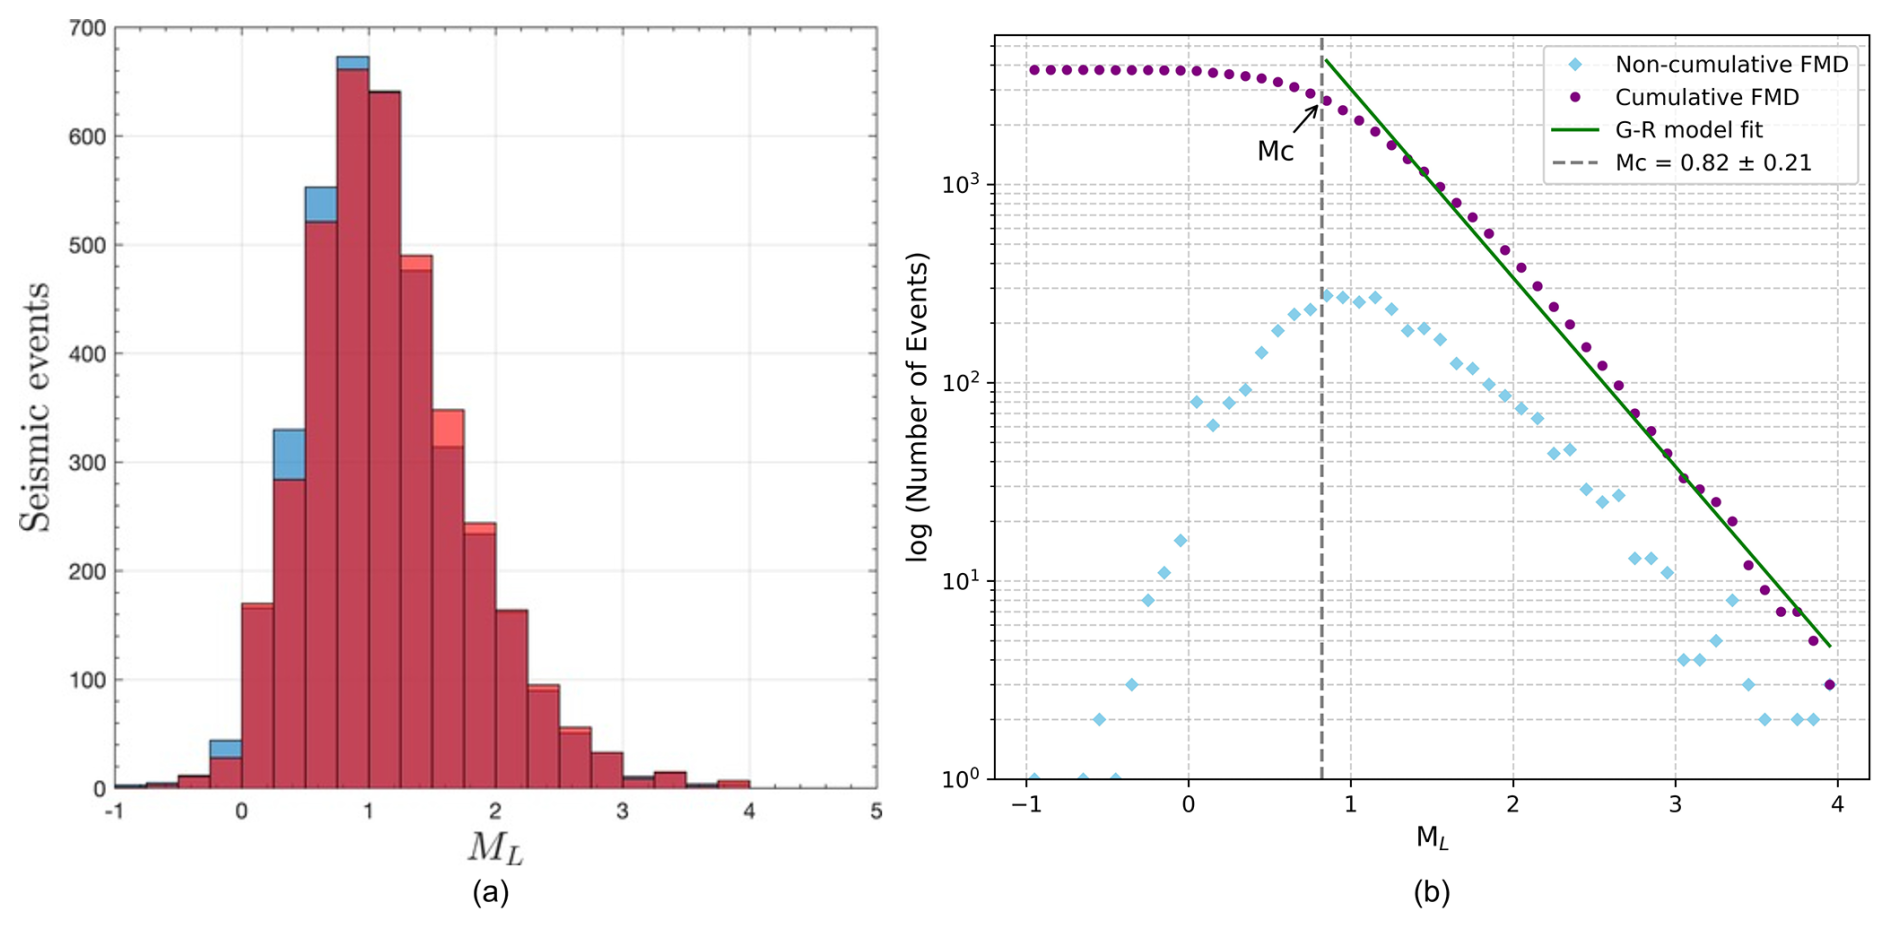
Figure 15(a) Overlapped histograms of local magnitude ML for the H71-catalog (orange + red areas), NLL-catalog (blue + red areas). The areas in red color should be considered as common parts for both the H71 and NLL catalogs. (b) Frequency magnitude distribution (FMD) for the H71 catalog. Green line is the fit of the Gutenberg–Richter law between the computed Mc and the maximum magnitude value of the catalog. Blue diamonds and purple circles are, respectively, the non-cumulative and cumulative frequency magnitude distribution.
The recorded magnitudes are distributed within a range of −1 to 4, with a peak between −0.5 and 2 (Fig. 15a) and no appreciable difference between the 2 catalogs can be observed. The completeness magnitude Mc of the H71 catalog, which represents the lowest magnitude in which all seismic events can reliably be recorded, was computed by using the EMR method (Entire Magnitude Range) proposed by Woessner and Wiemer (2005). This method, based on the consideration of the Gutenberg-Richter law (Gutenberg and Richter, 1956), enables the estimation of Mc by considering the entire range of event's magnitude, modeling both the complete and the incomplete part of the distribution. For our dataset Mc=0.82 with a standard deviation (Fig. 15b). This is a further confirmation of the CASP detection capability in identifying low-magnitude events. From a comparison between the range of magnitude calculated in this paper and the previous catalog (Filippucci et al., 2021b) it can be observed that the threshold of the minimum detectable magnitude is lowered to respect to , thus indicating an enhanced capability of earthquake detection. Regarding Mc, the comparison with the preceding catalog cannot be done due to the formulation used to compute the MLV magnitude, which slightly underestimates the horizontal magnitude (the documentation can be found here: https://www.seiscomp.de/seiscomp3/doc/seattle/2014.084/apps/global_mlv.html (last access: 30 May 2025).
To address and quantify the overestimation of the Hutton and Boore (1987) magnitude scale for the released earthquakes, we computed ML(HB87) for the NLL-catalog. In Fig. 16a, the histogram of the differences ML−ML (HB87) shows an average overestimation of ML (HB87) respect to ML of 0.3. The comparison between ML and ML (HB87) along the magnitude range of the NLL-catalog is plotted in Fig. 16b. The effect of the overestimation, as expected and predicted by Di Bona (2016), increases moving toward very small magnitudes and the HB87 does not compute ML<0. The bias decreases moving toward greater values of magnitude where the two formulations agree. For ML>2.8 the bias is less than 0.2 as also observed by Di Bona (2016). The observed bias between the two ML formulation can be a suggestion for the study of a magnitude scale for very small earthquakes.
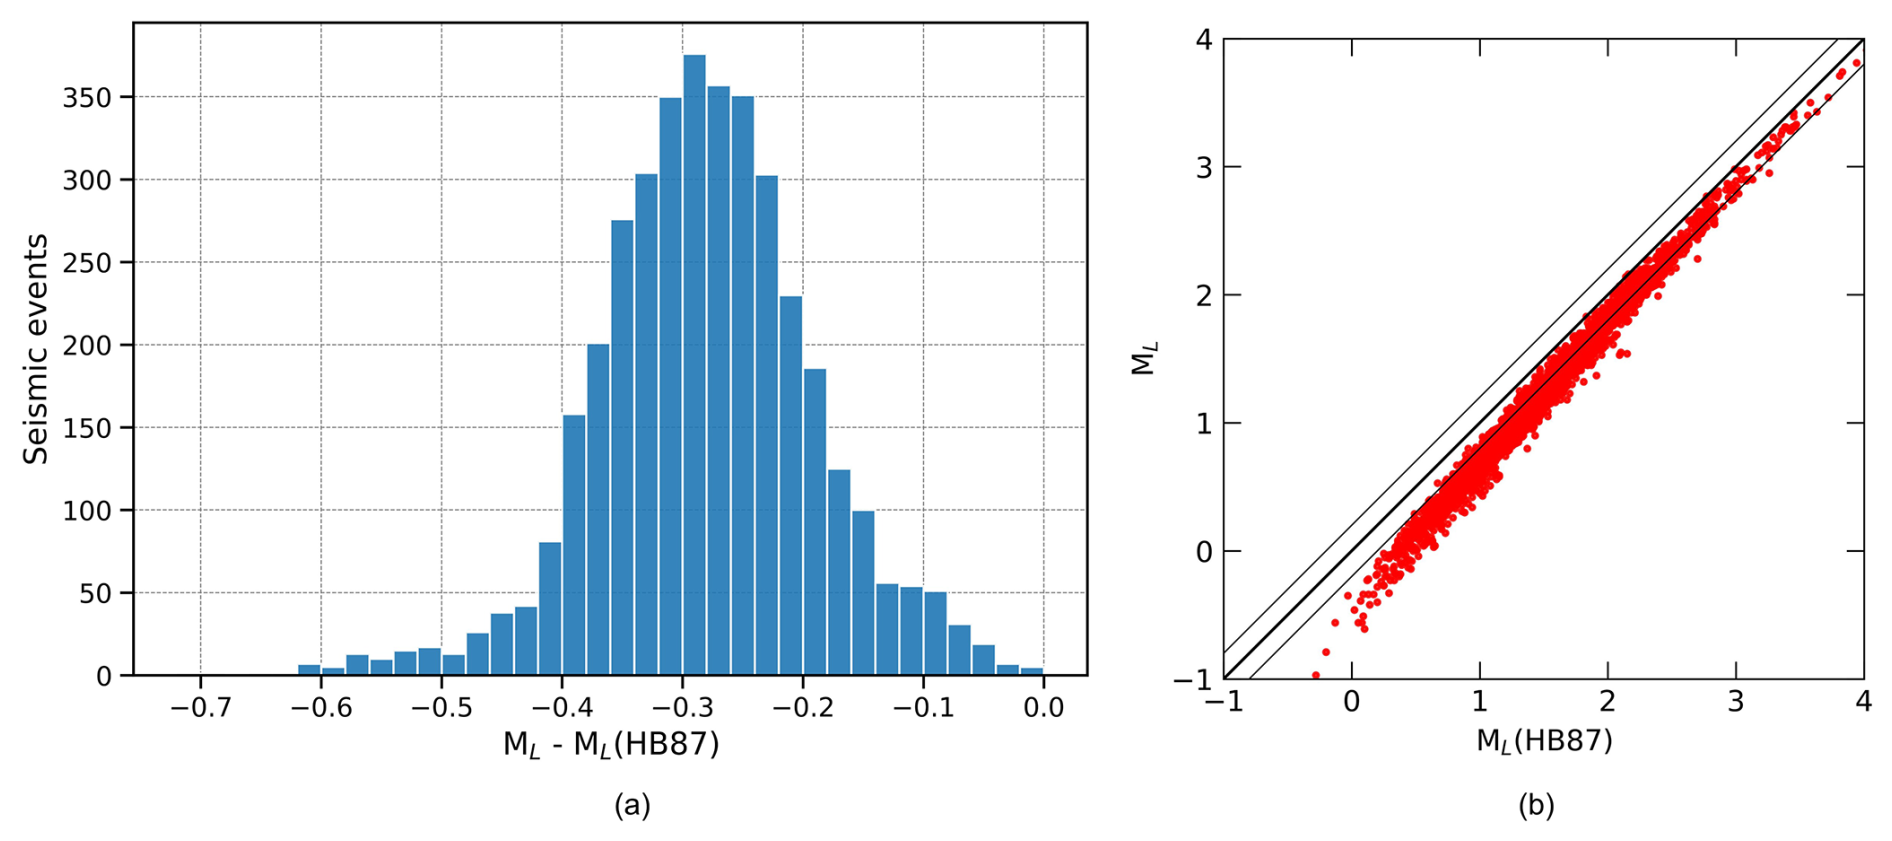
Figure 16Local magnitudes computed with two different attenuation functions: ML which refers to Di Bona (2016) and ML(HB87) which refers to Hutton and Boore (1987), are compared with each other. (a) Histogram of the difference ML−ML(HB87) computed for each EQ of the NLL-catalog. (b) plot of ML vs. ML(HB87) for each EQ of the NLL-catalog with the lines ML=ML(HB87) and ML=ML(HB87) ±0.2 also plotted.
The aim of our catalog is to detect the microseismicity of the GP, so, our interest is related to low magnitude earthquakes. The OT network was designed to this purpose, in terms of network layout and type of instruments (Tallarico et al., 2025, and reference therein). The dataset presented in this study collects the locations of earthquakes that occurred in the Gargano Promontory, a particularly characteristic area of the southern Apennines whose significant seismic hazard has not yet been explored in depth. Despite the geological and seismic importance of the region, studies on this area are limited, making further scientific investigation essential. The dataset developed in this study makes it possible to significantly improve knowledge of local seismicity, providing an indispensable basis for numerous geophysical studies, including seismotectonic studies, implementation of seismic velocity and attenuation models, tomography studies or site effects assessment.
The CASP tool is successfully implemented for the seismic monitoring of Northwestern Italy. So we explored the possibility to implement this code for the seismic monitoring of the Gargano Promontory. The CASP license was acquired thank to a collaboration between the University of Bari Aldo Moro and the INGV. The code is nowadays operative. The CASP code gave us the possibility to analyze ten years of seismic recordings in offline mode. We observed that the CASP software is able to detect a large number of small magnitude events, the S-wave picking suffers of some uncertainties that do not affect the reliability of the final location, manual revision is necessary to exclude from the catalog the false event and the bad located events. Manual review of the entire catalog automatically collected by CASP allowed us to build a dataset of highly reliable earthquakes. This dataset, for which we have released a bulletin as detailed in Sect. 8, can be useful to test the effectiveness of machine learning techniques in automatic picking when building automatic catalogs.
The choice of CASP allowed us to improve the seismic catalog by greatly increasing the number of collected earthquakes but some issues related to false location and non-tectonic events suggest that manual revision is a time-consuming operation but is still necessary to ensure reliability of the dataset of P and S phase arrivals and the consequent accuracy of earthquake locations. This discrimination is critical for an accurate seismic analysis of the area because the presence of quarry blasts can affect the results if not properly recognized. Therefore, the manual review of the automatic seismic catalog produced by CASP has proven to be essential to improve the quality of seismic data. By visual inspection we were able to recognize false events (together with bad located) and the quarry blasts, evaluated as the 30 % and the 11 % of the automatic catalog respectively. This revision highlighted that the main issue with the CASP software is the discrimination whether an event is an earthquake. The primary aim of this work was to maximize the detection rate and to compile the largest possible catalog, fully aware that this strategy would increase the number of false events. To this end, we changed the CASP parameter settings, in particular by reducing the STA/LTA time windows from the commonly used values (2–80) to (0.8–25) s and by allowing the event detection with a minimum of 3 phases, in order to improve the detection of small earthquakes. These choices increase inevitably the number of false detections, but we considered this acceptable because the complete automatic list of CASP was subsequently manually reviewed and cleaned. A different tuning of the detection parameters, with the specific aim of minimizing the number of false detections may be necessary if CASP were used without this manual review step, for example increasing the number of phases used for detection as shown in Fig. 4.
A possible inconvenience of the automatic processing procedures is the bad location inside the network of external events as also observed by Cattaneo et al. (2017) for the Central-Italy seismic catalog. This is particularly true for networks of limited extension, and dealing with P phases only for detection. In our case, BL events accounted for 25.9 % of the total AL, a rather high percentage that can be reduced by using a larger network and some additional stations capable of detecting the external origin. Once that the earthquake is selected, the automatic location is of very good quality.
A critical aspect concerns the robustness of the hypocentral locations. The 1D velocity model used was calibrated with the OT network geometry of the early operational years (2013–2015), before the installation of stations OT13, OT14, OT16, OT17 and TREM and the removal of OT01, OT02, OT08, OT09 and OT10. As a consequence, the model may now be slightly too fast in the upper crust, which would systematically bias focal depths towards larger values and may account for the anomalously deep locations obtained for some quarry blasts. In addition, the seismicity of the GP is very deep in the crust, at depth between 15 and 25 km, and it is of very low energy, ( for the majority of the earthquakes) so the takeoff angle of the most of the recording stations is small and the recordings are few for each event. This could explain why horizontal and vertical errors seems typical of regional events.
Looking at the national bulletin provided by INGV, the comparison of our catalog with the ONT catalog is possible only from 2019 to 2022. Being the CASP software set ad hoc for the microseismicity detection, our catalog present a greater number of events of lower magnitude than that of the ONT catalog (2640 in our catalog respect to 1463 of ONT). Among the 1463 of the ONT catalog, there are about 300 earthquakes that CASP did not detect, probably for the different settings in the STA/LTA algorithm. Data of the ONT catalog can be found at https://terremoti.ingv.it/ (last access: 30 May 2025). Differences in locations are of the order of 1 km both in horizontal and 1 km in vertical. Differences are due to the number of stations used for locations and the velocity model.
The greater number of earthquakes in our catalogs allowed to lower the magnitude threshold to values close to −1 (Fig. 15a) and thus providing a more detailed view of the microseismicity of the GP.
In Fig. 14 the location of the total earthquakes falling in classes A, B, C and D is shown. It is worth to note that the pattern of the seismicity plotted in the vertical section indicates the presence of a seismogenic layer between 15 and 25 km of depth. At this depth the major frequency in the histogram of the depths (Fig. 12) can be also observed. This seismogenic layer was already observed by Miccolis et al. (2021). The authors, with a dataset of 635 earthquakes, found that GP seismicity is concentrated in the lower crust, aligned on a seismic layer that becomes deeper moving in NE direction towards the Adriatic Sea. Furthermore, the authors observed that most of the GP seismicity occurs in the area at north of the Mattinata fault (MF in Fig. 1b) with focal mechanisms mainly of transpressive type oriented in a NW-SE direction. In this paper we can confirm the existence of the same seismogenic layer in the lower crust with a dataset ten times larger than the previous one by Miccolis et al. (2021). It can also be observed that earthquakes seem clustered along the Mattinata fault, as was also visible in Miccolis et al. (2021), and a distribution of seismicity is observed along 2 main clusters elongated in SW–NE direction. In Fig. 14 Class B, it is visible to the SE of the AA′ profile, a denser cluster that seems to follow the shape of the seismogenic layer that deepens towards the NE, and the other with more scattered seismicity that is found over the AA′ profile. The two clusters elongated in SW–NE direction are located one at the northern part of GP and the other at the southern part of GP crossing the MF; they are separated by an area elongated in the same SW–NE direction characterized by absence of seismicity and are clearly visible both with the H71-catalog and with the NLL catalog in Fig. 14 Class B. Looking at the foci depth, it can be observed that:
-
the shallower seismicity with hypocentres confined down to ≈ 10 km (yellow circles in Fig. 17d) is scarce and widespread all over the investigation area;
-
deeper seismic activity can be found along a seismogenic layer in the lower crust down to ≈ 25 km (green circles in Fig. 17d) that was interpreted as due to fluid circulation from the mantle by Lavecchia et al. (2022);
-
the intermediate seismicity (orange circles in Fig. 17d) is clustered along the Mattinata Fault (MF) toward S direction, confined at ≈ 15 km.
It is worth to note the absence of shallow seismicity in the NE of GP as also documented by the historical seismicity showed by Del Gaudio et al. (2007). This peculiarity has been already observed and justified by the presence of a ductile upper crust in the thermo-rheological model of GP (Lavecchia et al., 2022). The absence of seismicity in NE of GP doesn't seem to depend on the network geometry. In fact in Fig. 17b–d we show the maps of epicenters recorded with three different network configuration adopted since 2013. Adding the stations OT13 and OT14 in NE of GP did not resolve this seismic gap but increased the number of recorded earthquakes NE offshore. Another seismic gap is present in the area between stations APRC and SGRT (Fig. 17a) that cannot be ascribed to the network density. The OT network geometry evolution does not affect detection rate in the period 2013–2022 (blue line in Fig. A3). The detection rate of the ONT catalog is positively affected by the acquisition of the OT network by EIDA-INGV, as witnessed by the sharp change in the slope of the cumulative number of detected events in GP (dashed line in Fig. A3). The flat trend in the cumulative curve of CASP (this work) (Fig. A3) belongs to the period between 2018 and 2019 and corresponds to the updates of the network data transmission systems required for data sharing on EIDA (as described by Filippucci et al., 2021b).
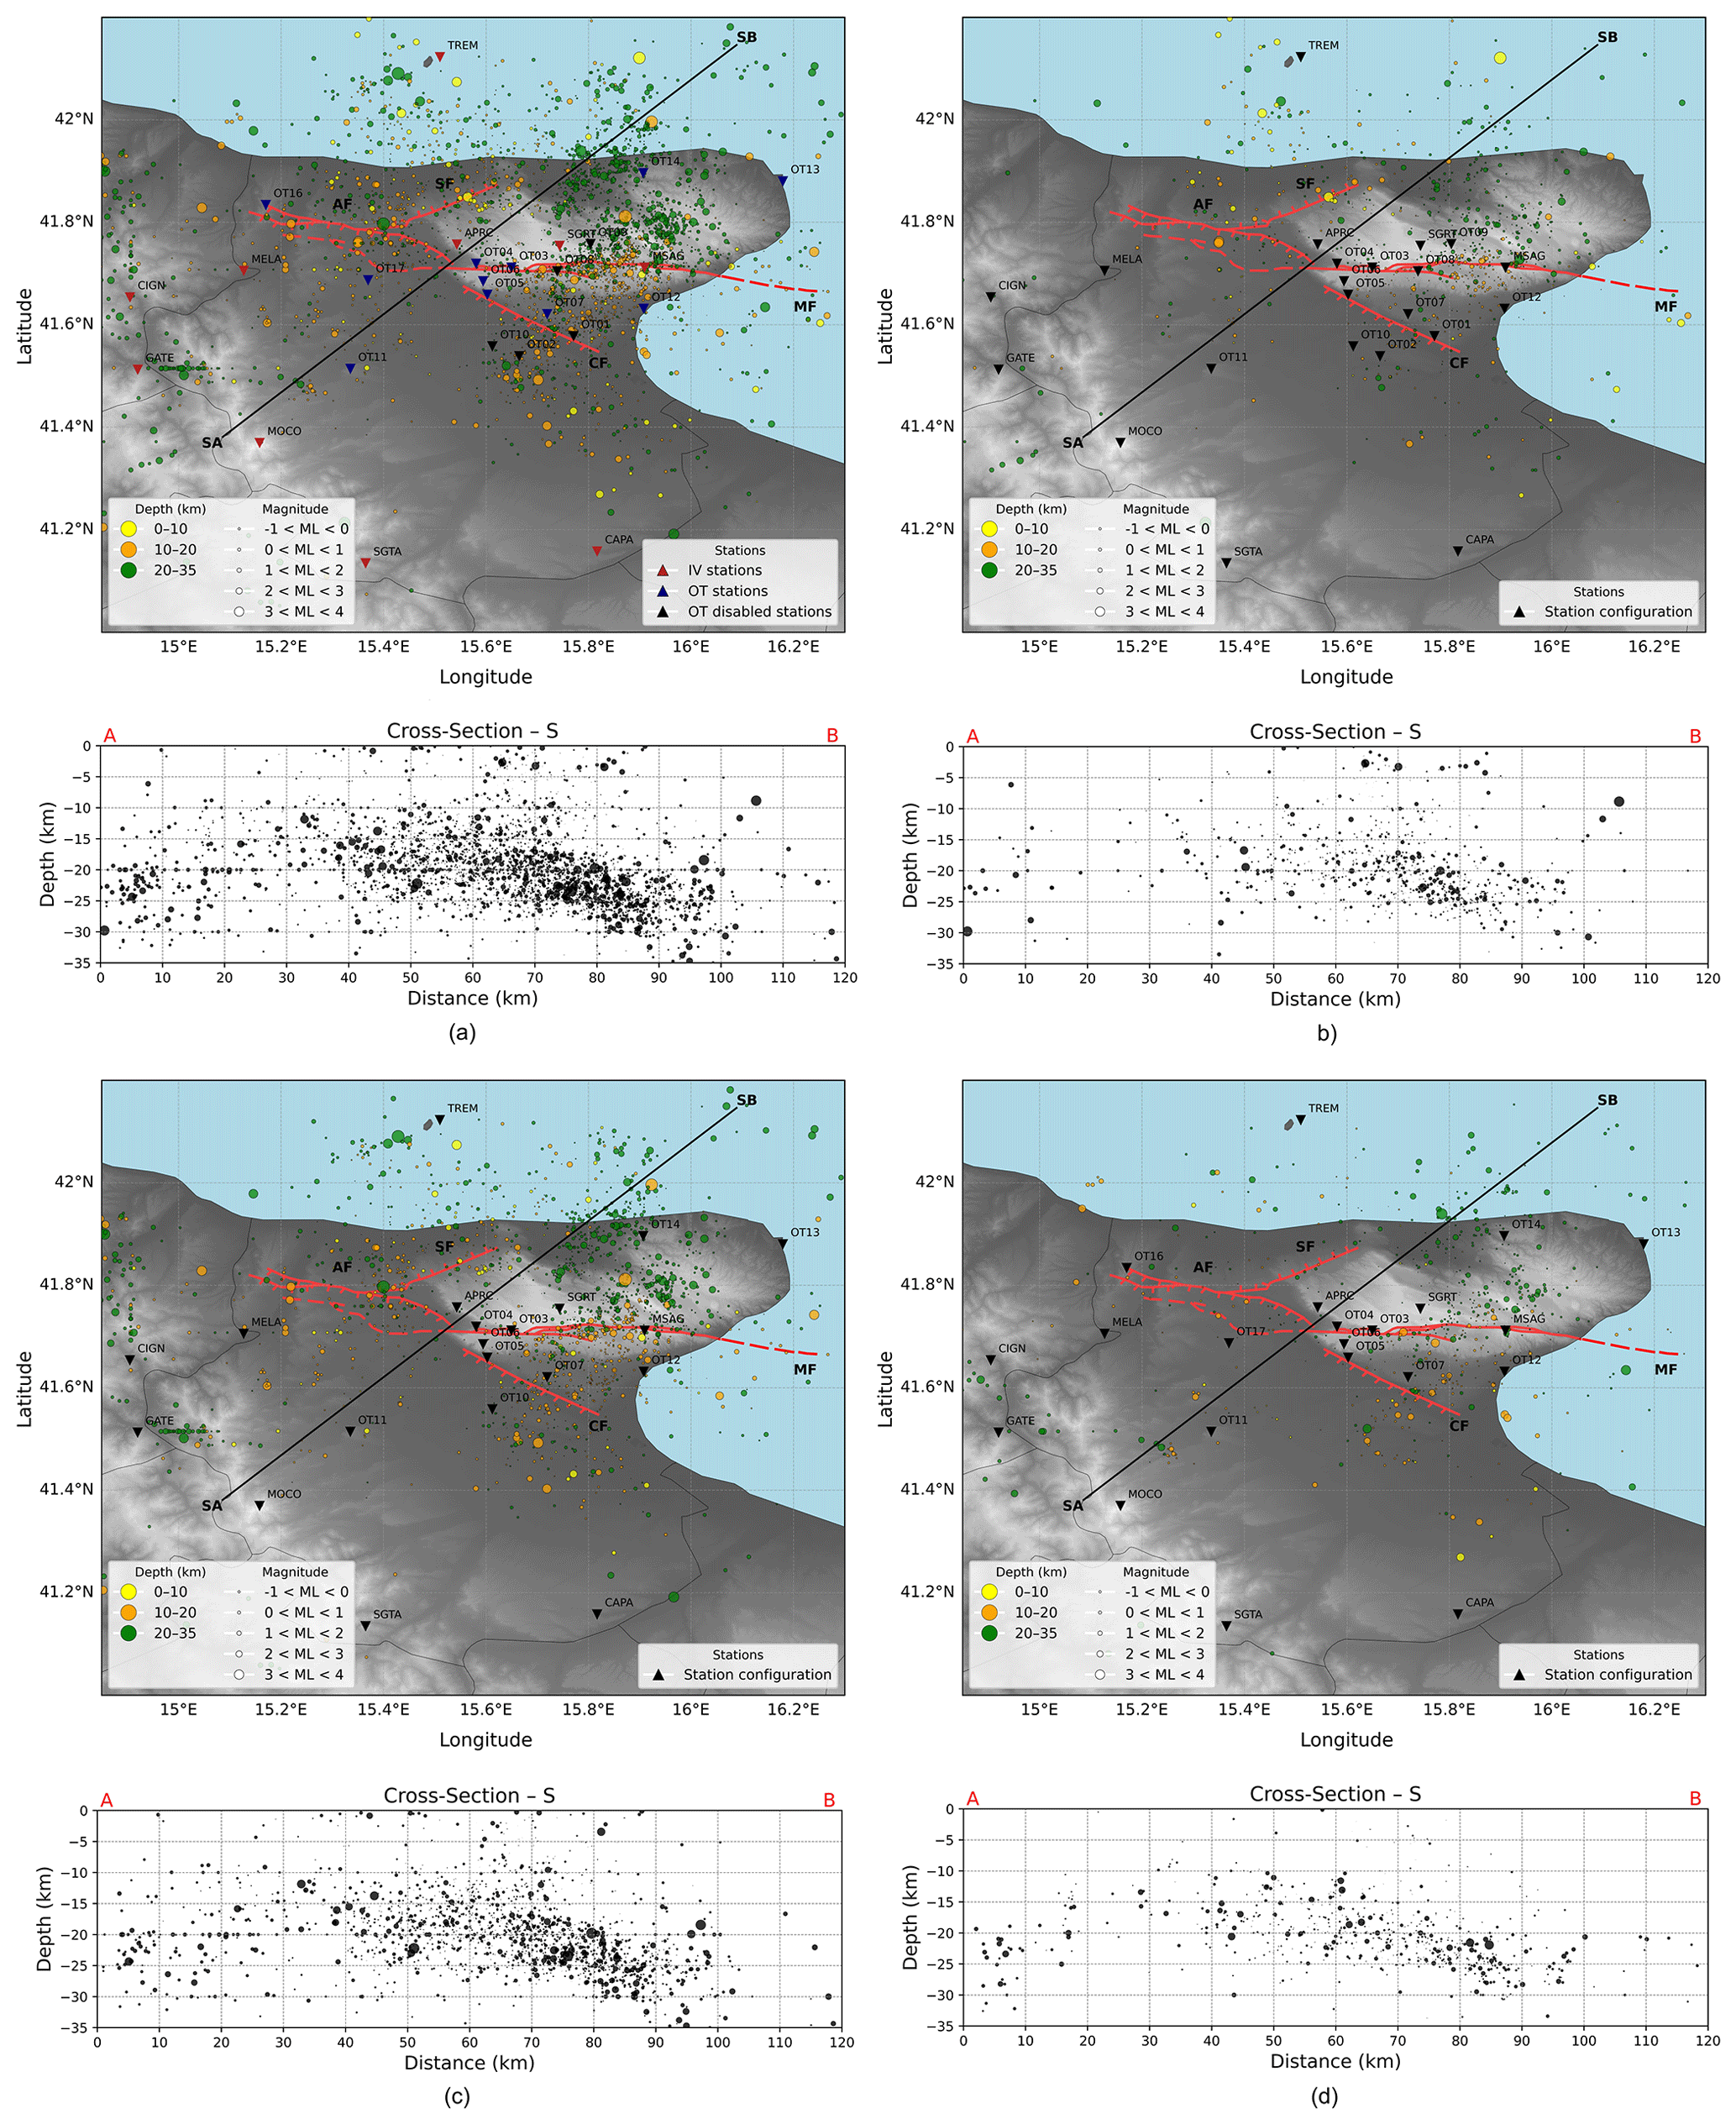
Figure 17Maps of the epicenters of the H71 catalog with time and vertical sections along the black line indicated as Cross-Section SA-SB. Red lines refer to the principal fault systems: AF, SF, CF and MF, described in the text and in Fig. 1. Circle dimension is proportional to ML, color refers to depth, as indicated in the superimposed legend. (a) Plot of the seismicity for the entire period, from April 2013 to December 2022; colored triangles refer to network (red for IV, blue for OT, black for OT disabled, as indicated in the superimposed legend). (b) From April 2013 to June 2015; (c) from July 2015 to March 2021; (d) from April 2021 to December 2022; black triangles indicate the GSN stations.
Regarding the estimated magnitudes, we observe that further development of the studies on the GP seismicity should include the investigation of an “ad hoc” attenuation law for the small magnitude earthquakes that characterize this area.
The NLL catalog file (catalog_nll.txt) and H71 catalog file (catalog_h71.txt) are available on Mendeley Data (Ferreri et al., 2026) at https://doi.org/10.17632/nhfvx7ysxw.6. These datasets were collected by using the recordings of the GSN network (as described in Sect. 3) composed by stations of the OT network (University of Bari “Aldo Moro”, 2013) and by stations of IV network (Istituto Nazionale di Geofisica e Vulcanologia (INGV), 2005). Together with the catalog files, at the link of Mendeley Data (https://doi.org/10.17632/nhfvx7ysxw.6, Ferreri et al., 2026) the reader can download the configuration files of the CASP software. The dataset of time arrivals and amplitude, also in Wood Anderson conversion, can be released under request.
The recordings of the OT stations after 2019 can be downloaded through the standard FDSN web services (https://www.fdsn.org/webservices/, last access: 2 March 2026), using the INGV webservice. For example, the availability from 2019 to 2014 for station OT07, channel EHE, can be obtained through the following web request: https://webservices.ingv.it/fdsnws/availability/1/query?network=OT&station=OT07&start=2019-01-01T00:00:00&end=2024-12-31T00:00:00&mergegaps=86400&channel=EHE (last access: 2 March 2026). This request shows the availability of the channel, ignoring the gaps smaller than 24 h (mergegaps = 86 400 s). To obtain information on seismic station and instrumentation, one possible query can be https://webservices.ingv.it/fdsnws/station/1/query?level=channel&network=OT&format=text (last access: 2 March 2026) which returns the geographical coordinates and instrument details of the seismic stations belonging to the network OT. Some other information and examples could be found at the link: https://www.orfeus-eu.org/data/eida/nodes/INGV/ (last access: 2 March 2026). The configuration files of the CASP modules as described in Sect. 4.1 are downloadable on Mendeley data (https://doi.org/10.17632/nhfvx7ysxw.6, Ferreri et al., 2026).
The code CASP has been purchased by INGV under a corporate license at https://lunitek.it/seismic/seismic-software/casp/ (last access: 30 May 2025); NLL (Lomax et al., 2000) and H71 (Lee and Lahr, 1975) codes are available for free; MATLAB (MathWorks®) code was used for histograms and for the map in Fig. 8 and is available under license purchased by UniBa; Maps and codes were written with python language, available for free. The manuscript was written with Overleaf, available for free.
In this work we have built a new dataset of earthquakes in the GP area in southern Italy, collected using the CASP software detect and the OTRIONS network recordings in the decade from 2013 to 2022. Manual review work was necessary and indispensable to discriminate the type of automatic event provided by the software and eliminate both false and poorly localized earthquakes and quarry blasts. The use of CASP represented an important step to collect a robust dataset of earthquakes. However, to improve the potential of this software, in the future it will be necessary to continue to improve the automatic detection and picking algorithms, to reduce the time costs of manual review by the operator. The results are released in two catalogs of about 3800 earthquakes localized with 2 different methods, non-linear and linearized (NLL and H71 respectively). We observed differences in 418 locations probably due to the difficulty of NLL to adapt the location grid to the network geometry. The quality of the locations was calculated with a formula inspired by that proposed for the Italian earthquake catalog (Michele et al., 2019), adapted for the GP area and applied to the 2 catalogs with different normalization factors. In general, the location quality, despite the large azimuthal gap of the GP preventing optimal locations, is of good/medium quality and confirms the presence of a seismogenic layer in the lower crust, observed in previous studies (Miccolis et al., 2021), site of intense low-magnitude seismic activity and shows an intense seismogenic activity along the MF at intermediate depths. Shallow seismicity seems scarce and scattered all over the investigation area. As regard the network coverage of the GP, the area over the coast line and offshore in the N of GP has been recently affected by an intense seismic activity with the major earthquake of ML=4.7 occurred 14 March 2025 (https://terremoti.ingv.it/, last access: 4 June 2025), the most energetic event ever instrumentally recorded in this area. This seismic sequence highlights the crucial role of the OT network in the seismic monitoring of the area, a task carried out by INGV with surveillance purposes on behalf of the Italian Department of Civil Protection.
A1 GSN network details
The station locations of the OT network are listed in the Table A1.
In Table A2 the performance of the GSN stations during the period 2013–2022. Regarding the OT stations, an evident increase can be observed in the ratio between working days/expected working days in the years after 2019, thanks to the change in the data acquisition system of OT network. Regarding the IV stations, any particular variations are observed in the considered decade. Empty cells indicate not working periods.
To evaluate the usefulness of the manual picking procedure in terms of number of pickings, we counted both the automatic and the manual ones only for the earthquakes (4098 EQ) of the catalogs (histogram in Fig. A1)..
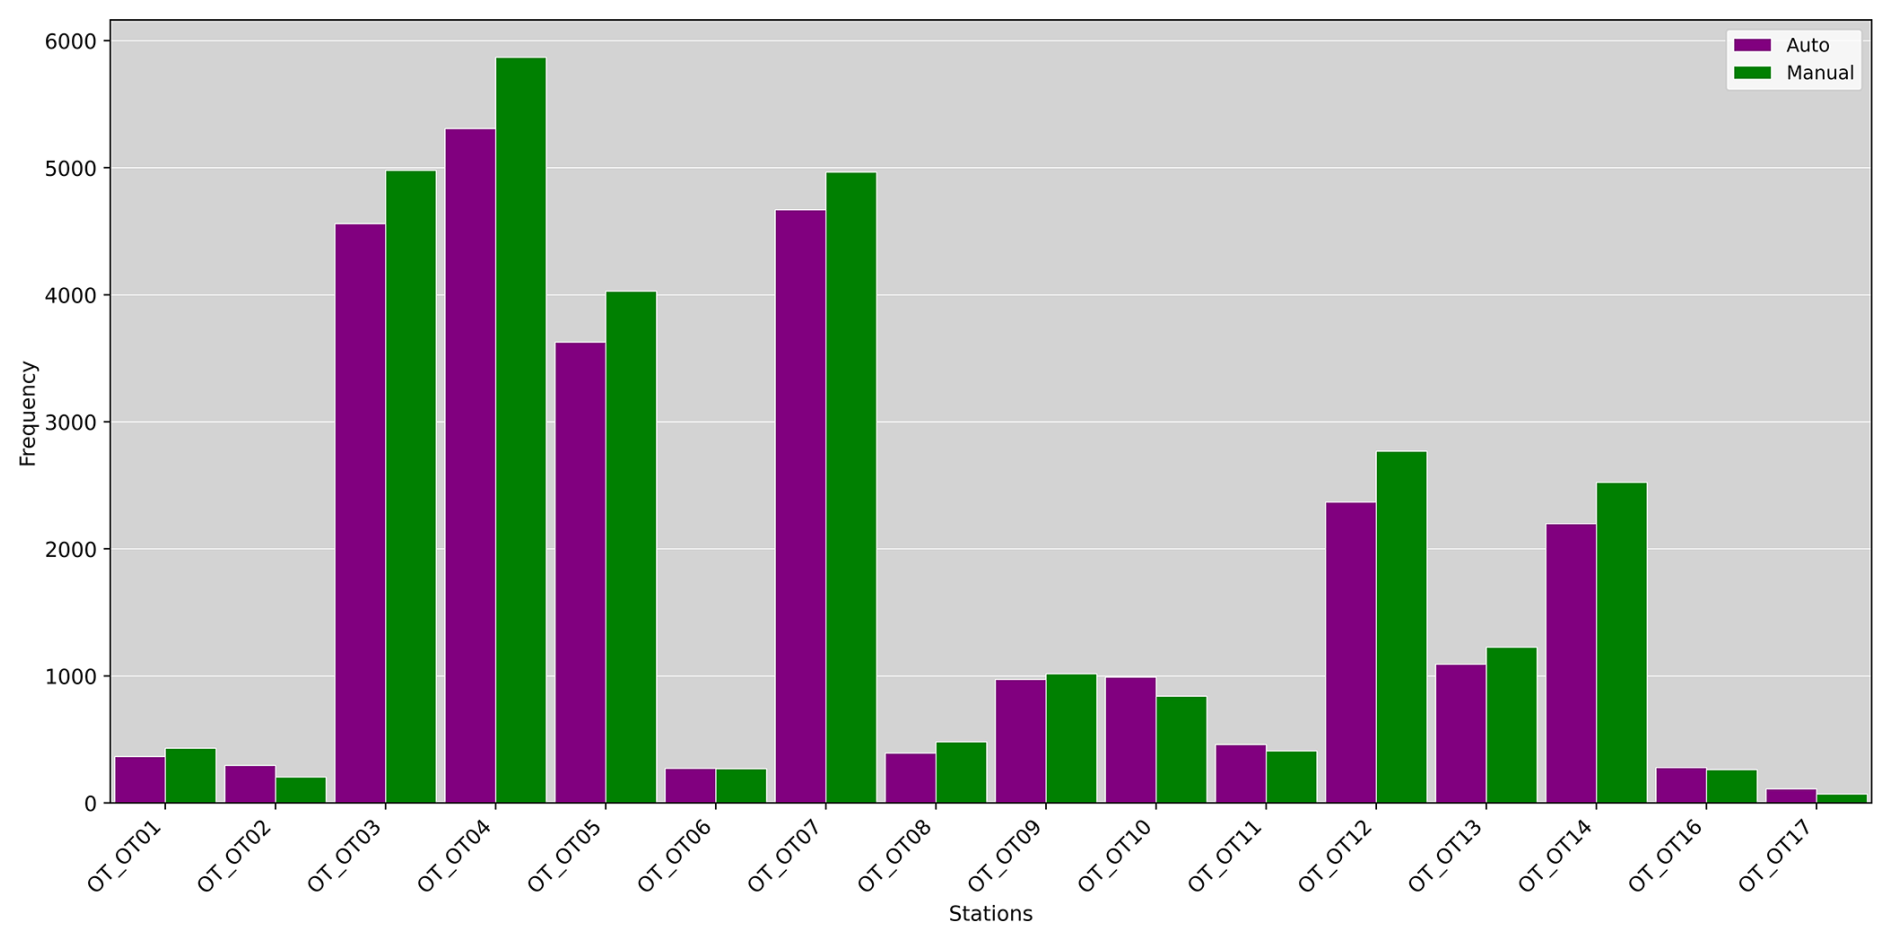
Figure A1Histogram of the number of automatic (purple) and manual (green) pickings for the earthquake catalog EQ carried out on all OT stations.
The histogram in Fig. A1 reveals that the manual procedure, slightly but systematically for almost all the OT stations, increases the number of picks.
The detection was evaluated by counting the number of the reviewed P and S phases picking for each station every three months for the decade from 2013 to 2022. The results are organized in the histograms in Fig. A2. From the comparison of the PPSD in Fig. 3 and the histograms of total pickings of the P and the S arrivals in Fig. A2, some considerations can be done. In the frequency range [10,25] Hz of the STA/LTA algorithm of CASP used for detection, the stations with the lowest level of noise (OT01, OT03, OT04, OT05, OT06, OT07, OT08, OT09) and those with an intermediate noise level (OT12, OT14 and OT16) are characterized by the highest number of pickings in the period of operation. The stations OT05 and OT06 were used as an unique station given their closeness. The stations with a high noise level (OT02, OT10, OT11, OT13 and OT17) correspond to the stations that contributed less to the detection.
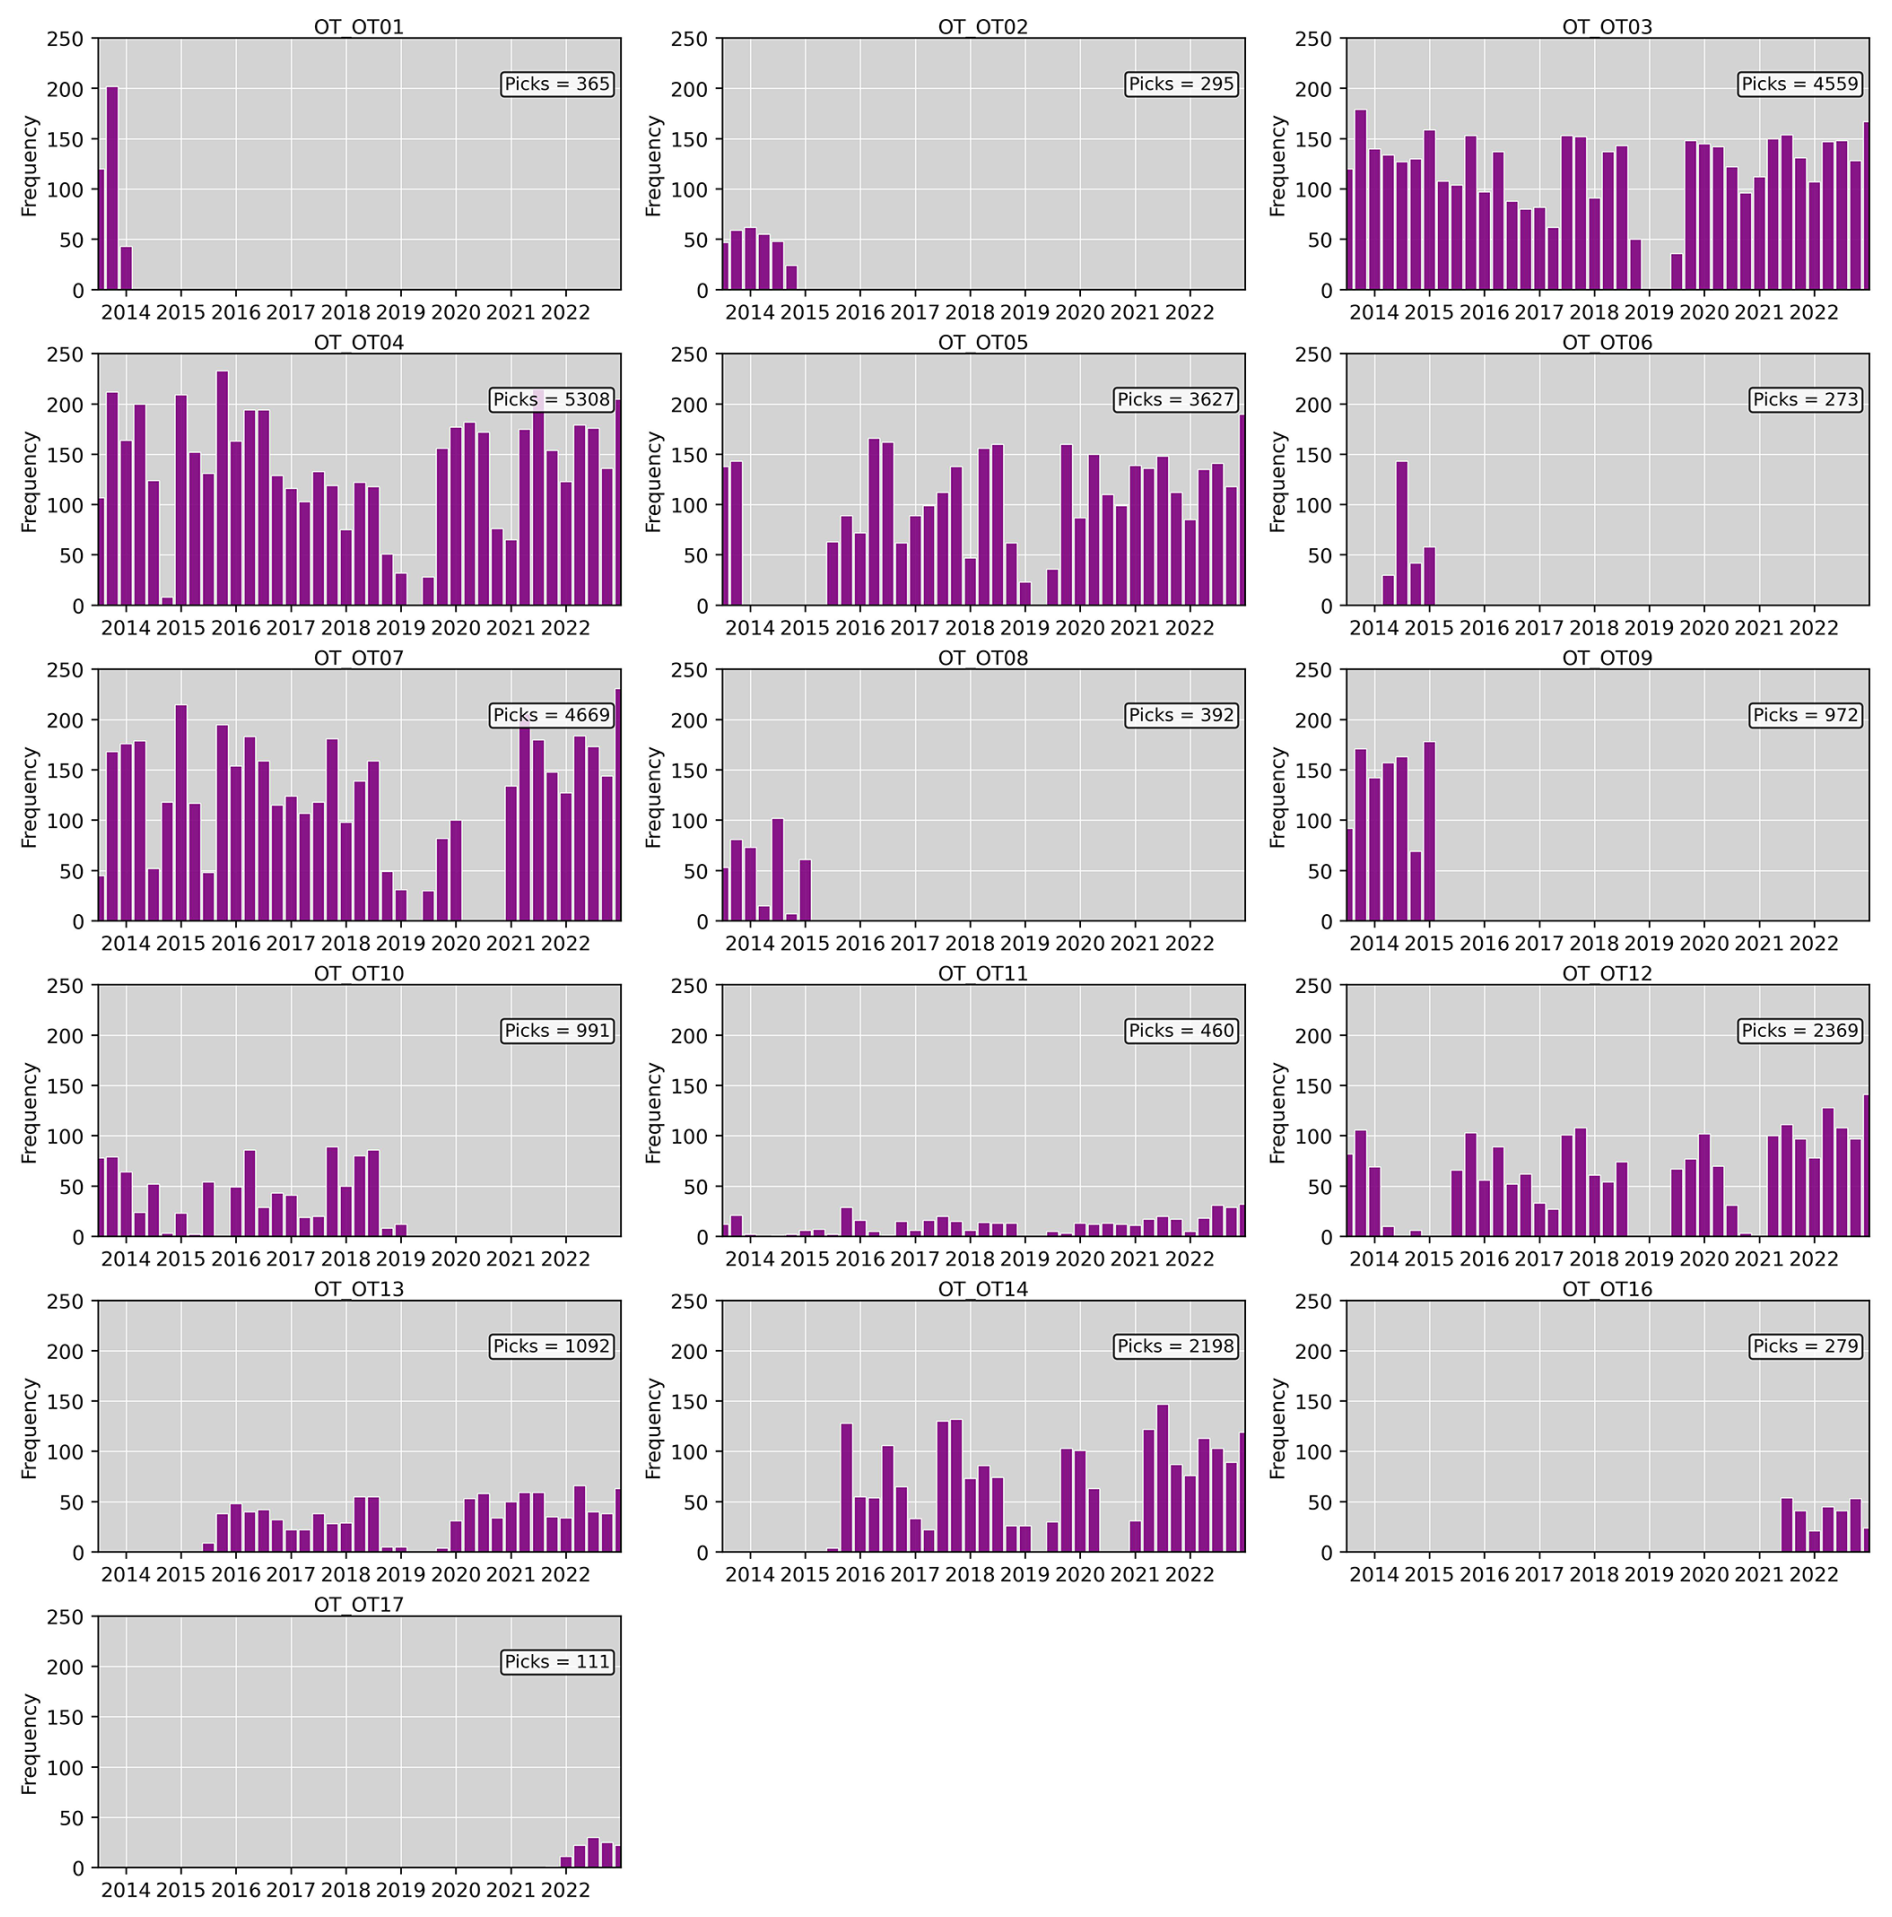
Figure A2Histograms of number of automatic picking, used for EQ catalogs, for each station of the OT network, from 2013 to 2022 with bins of three months. Superimposed the total number of P ans S pickings.
The cumulative number of earthquakes detected in this work by using CASP software and detected by Italian ONT are plotted in Fig. A3.
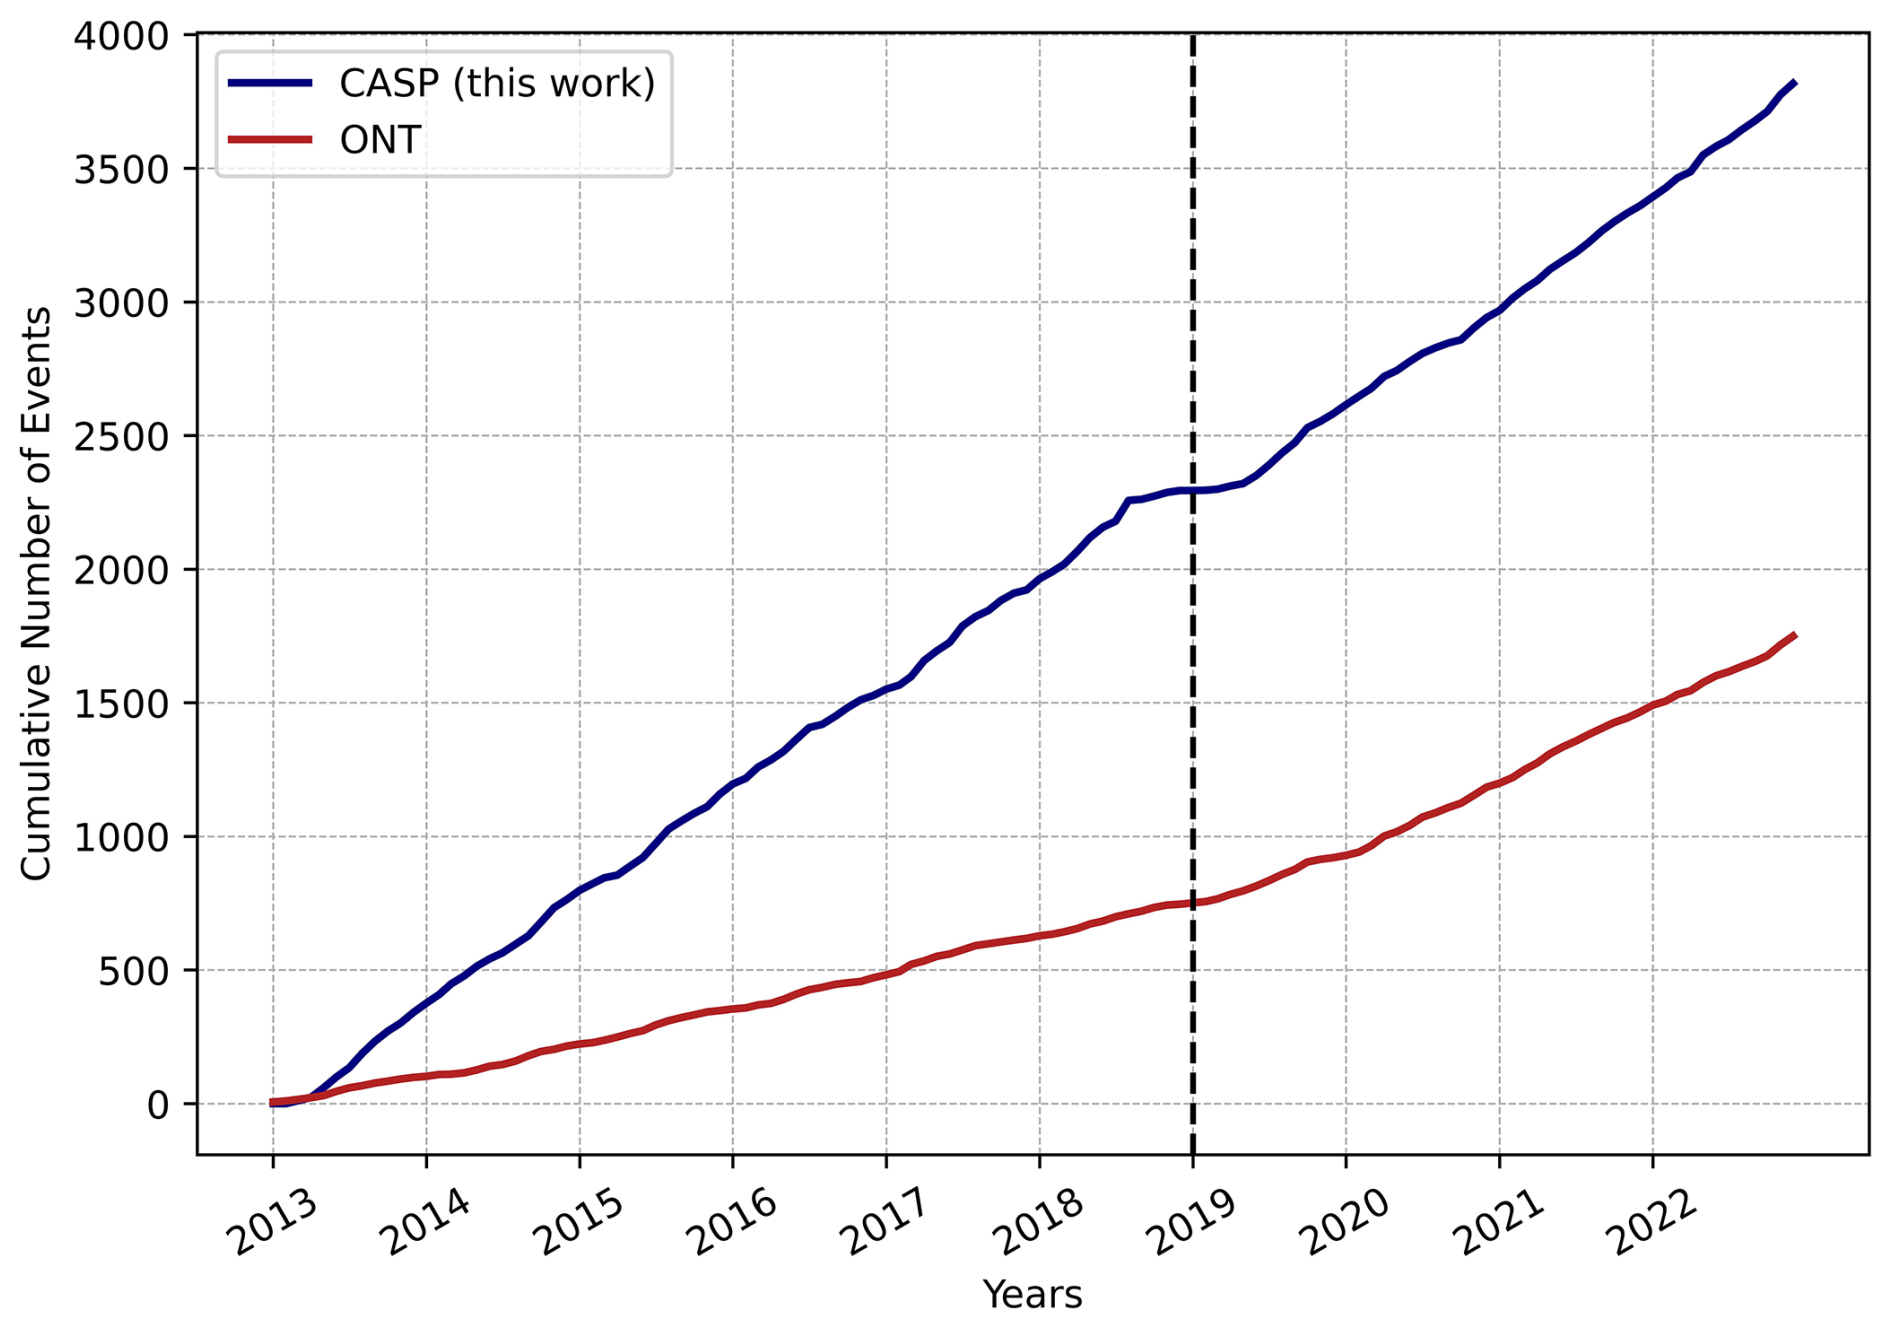
Figure A3Detection rate as cumulative number of detected events per month for the ONT catalog (red line) and for this work (blue line). The dashed line indicates the acquisition of OT stations by ONT.
A2 PPSDs
In this section, we exhibit the Probability Power Spectral Densities (PPSDs) calculated for the OT seismic stations of the GSN. See the main text for details. Figure A4 shows the PPSDs of stations OT01, OT02, OT03, OT04, Fig. A5 shows stations OT05, OT06, OT07, OT08, Fig. A6 shows stations OT09, OT10, OT11, OT12, and Fig. A7 the stations OT13, OT14, OT16, OT17.
Conceptualization APF, MF, GS, AT; Data curation AR, GC, LF; Formal analysis APF, AR, RG, TN, MM, Funding acquisition GS, AT; Methodology APF, MF, TN, AT; Visualization APF, AR, RG, TN, AT; all the authors participated to the validation and to the writing of the paper.
The contact author has declared that none of the authors has any competing interests.
Publisher's note: Copernicus Publications remains neutral with regard to jurisdictional claims made in the text, published maps, institutional affiliations, or any other geographical representation in this paper. The authors bear the ultimate responsibility for providing appropriate place names. Views expressed in the text are those of the authors and do not necessarily reflect the views of the publisher.
We wish to thank Anthony Lomax for his help in project and writing the input file per NLL (Lomax et al., 2000, 2014) software for earthquake location. We wish to thank Dino Bindi for his helpful comment about magnitude estimates and an anonymous reviewer for his/her suggestions which improved the quality of the manuscript. We declare that any part of this work was generated with AI tools.
This research has been supported by: RETURN Project (Multi-Risk science for resilient commUnities undeRa changiNg climate) Extended Partnership in the framework of European Union – NextGenerationEU (National Recovery and Resilience Plan – NRRP, Mission 4, Component 2, Investment 1.3 – D.D. 1243 2/8/2022, PE0000005); MEET Project (Monitoring Earth's Evolution and Tectonics) in the framework of National Recovery and Resilience Plan (PNRR) – Mission 4, “Education and Research” – Component 2, “From research to business” – Investment line 3.1, “Fund for the creation of an integrated system of research and innovation. Infrastructures” – project code IR0000025.
This paper was edited by Andrea Rovida and reviewed by Dino Bindi and one anonymous referee.
Abbasi, A.: Linear and nonlinear earthquake location approaches in a case study overview, Physics of the Earth and Planetary Interiors, 293, 106265, https://doi.org/10.1016/j.pepi.2019.05.008, 2019. a
Cattaneo, M., Frapiccini, M., Ladina, C., Marzorati, S., and Monachesi, G.: A mixed automatic-manual seismic catalog for Central-Eastern Italy: analysis of homogeneity, Annals of Geophysics, 60, S0667–S0667, https://doi.org/10.4401/ag-7333, 2017. a, b
Chilovi, C., de Feyter, A. J., and Pompucci, A.: Wrench zone reactivation in the Adriatic Block; the example of the Mattinata fault system (SE Italy), Italian Journal of Geosciences, 119, 3–8, 2000. a
Del Gaudio, V., Pierri, P., Frepoli, A., Calcagnile, G., Venisti, N., and Cimini, G.: A critical revision of the seismicity of Northern Apulia (Adriatic microplate – Southern Italy) and implicationsfor the identification of seismogenic structures, Tectonophysics, 436, 9–35, https://doi.org/10.1016/j.tecto.2007.02.013, 2007. a, b, c, d, e
Di Bona, M.: A Local Magnitude Scale for Crustal Earthquakes in Italy, Bulletin of the Seismological Society of America, 106, 242–258, https://doi.org/10.1785/0120150155, 2016. a, b, c, d, e, f, g, h, i
Doglioni, C., Mongelli, F., and Pieri, P.: The Puglia uplift (SE Italy): An anomaly in the foreland of the Apenninic subduction due to buckling of a thick continental lithosphere, Tectonics, 13, 1309–1321, https://doi.org/10.1029/94TC01501, 1994. a
Ebel, J. E.: The importance of small earthquakes, Seismological Research Letters, 79, 491–493, https://doi.org/10.1785/gssrl.79.4.491, 2008. a
Ferreri, A. P., Romeo, A., Giannuzzi, R., Cecere, G., Falco, L., Filippucci, M., Michele, M., Ninivaggi, T., Selvaggi, G., and Tallarico, A.: The new seismic catalog of the Gargano area (Southern Italy) after a decade of seismic monitoring by OTRIONS network, Mendeley Data, V6 [data set], https://doi.org/10.17632/nhfvx7ysxw.6, 2026. a, b, c, d
Festa, V., Tripaldi, S., Siniscalchi, A., Acquafredda, P., Fiore, A., Mele, D., and Romano, G.: Geoelectrical resistivity variations and lithological composition in coastal gypsum rocks: A case study from the Lesina Marina area (Apulia, southern Italy), Engineering Geology, 202, 163–175, https://doi.org/10.1016/j.enggeo.2015.12.026, 2016. a
Filippucci, M., Del Pezzo, E., de Lorenzo, S., and Tallarico, A.: 2D kernel-based imaging of coda-Q space variations in the Gargano Promontory (Southern Italy), Physics of the Earth and Planetary Interiors, 297, 106313, https://doi.org/10.1016/j.pepi.2019.106313, 2019. a
Filippucci, M., Pierri, P., de Lorenzo, S., and Tallarico, A.: The stress field in the Northern Apulia (Southern Italy), as deduced from microearthquake focal mechanisms: new insight from local seismic monitoring, in: International Conference on Computational Science and Its Applications, Springer, 914–927, https://doi.org/10.1007/978-3-030-58820-5_66, 2020. a
Filippucci, M., Lucente, S., Del Pezzo, E., de Lorenzo, S., Prosser, G., and Tallarico, A.: 3D-Kernel based imaging of an improved estimation of (Qc) in the Northern Apulia (Southern Italy), Applied Sciences, 11, 7512, https://doi.org/10.3390/app11167512, 2021a. a
Filippucci, M., Miccolis, S., Castagnozzi, A., Cecere, G., de Lorenzo, S., Donvito, G., Falco, L., Michele, M., Nicotri, S., Romeo, A., Selvaggi, G., and Tallarico, A.: Seismicity of the Gargano promontory (Southern Italy) after 7 years of local seismic network operation: Data release of waveforms from 2013 to 2018, Data in Brief, 35, 106783, https://doi.org/10.1016/j.dib.2021.106783, 2021b. a, b, c, d
Govoni, A., Margheriti, L., Moretti, M., Chiarabba, C., D'Alema, E., Marzorati, S., Franceschi, D., De Gori, P., Carluccio, I., Delladio, A., Cecere, G., D'Ambrosio, C., Danecek, P., Della Bina, E., Fares, M., Lucente, F. P., Braun, T., Pintore, S., and Gervasi, A.: Seismic Data acquired by the INGV Emergency Group – Pollino-Italy 2011 – T07, European Integrated Data Archive [data set], https://doi.org/10.13127/SD/SX4PYRLDWA, 2023. a
Gulia, L.: Detection of quarry and mine blast contamination in European regional catalogues, Natural Hazards, 53, 229–249, https://doi.org/10.1007/s11069-009-9426-8, 2010. a, b
Gulia, L. and Gasperini, P.: Contamination of Frequency-Magnitude Slope (b-Value) by Quarry Blasts: An Example for Italy, Seismological Research Letters, 92, https://doi.org/10.1785/0220210080, 2021. a
Gutenberg, B. and Richter, C. F.: Earthquake magnitude, intensity, energy, and acceleration, Bulletin of the Seismological Society of America, https://doi.org/10.1785/BSSA0320030163, 1956. a
Ho, L. M., Walter, J. I., Hansen, S. E., Sánchez-Roldán, J. L., and Peng, Z.: Evaluating automated seismic event detection approaches: An application to Victoria Land, East Antarctica, Journal of Geophysical Research: Machine Learning and Computation, 1, e2024JH000185, https://doi.org/10.1029/2024JH000185, 2024. a
Hutton, L. and Boore, D. M.: The ML scale in southern California, Bulletin of the Seismological Society of America, 77, 2074–2094, https://doi.org/10.1785/BSSA0770062074, 1987. a, b, c, d, e
Iannaccone, G., Zollo, A., Elia, L., Convertito, V., Satriano, C., Martino, C., Festa, G., Lancieri, M., Bobbio, A., Stabile, T. A., Vassallo, M., and Emolo, A.: A prototype system for earthquake early-warning and alert management in southern Italy, Bulletin of Earthquake Engineering, 8, 1105–1129, https://doi.org/10.1007/s10518-009-9131-8, 2010. a
Istituto Nazionale di Geofisica e Vulcanologia (INGV): Rete Sismica Nazionale (RSN), European Integrated Data Archive [data set], https://doi.org/10.13127/SD/X0FXNH7QFY, 2005. a, b, c
Kolínský, P., Meier, T., Agius, M. R., Bijedić, A., Bokelmann, G., Borleanu, F., Brnović, D., Cambaz, M. D., Cammarano, F., Čarman, M., Cauzzi, C., Chernih, D., Csicsay, K., Cvijić Amulić, S., Czuba, W., Diaz, J., Dimitrova, L., Dushi, E., Evangelidis, C. P., Faccenna, C., Farfuliak, L., Friederich, W., Georgieva, G., Horn, N., Ivančić, I., Jia, Y., Kaviris, G., Kovács, I. J., Lebedev, S., Le Breton, E., Lukešová, R., Mazur, S., van der Meijde, M., Molinari, I., Mustafa, S., Nagel, T., Nielsen, S. B., Obermann, A., Papazachos, C., Parolai, S., Paul, A., Piromallo, C., Plicka, V., Rietbrock, A., Rondenay, S., Rossi, G., Rümpker, G., Schiffer, C., Schlömer, A., Sigloch, K., Silvennoinen, H., Sokos, E., Špaček, P., Stipčević, J., Tallarico, A., Tiira, T., Tilmann, F., Valčić, D., Wassermann, J., Wesztergom, V., Xhahysa, A., Živčić, M., and the AdriaArray Seismology Group: AdriaArray – a Passive Seismic Experiment to Study Structure, Geodynamics and Geohazards of the Adriatic Plate, Annals of Geophysics, 68, DM555, https://doi.org/10.4401/ag-9284, 2025. a
Krischer, L., Megies, T., Barsch, R., Beyreuther, M., Lecocq, T., Caudron, C., and Wassermann, J.: ObsPy: A bridge for seismology into the scientific Python ecosystem, Computational Science & Discovery, 8, 014003, https://doi.org/10.1088/1749-4699/8/1/014003, 2015. a
Latorre, D., Di Stefano, R., Castello, B., Michele, M., and Chiaraluce, L.: An updated view of the Italian seismicity from probabilistic location in 3D velocity models: The 1981–2018 Italian catalog of absolute earthquake locations (CLASS), Tectonophysics, 846, 229664, https://doi.org/10.1016/j.tecto.2022.229664, 2023. a
Lavecchia, A., Filippucci, M., Tallarico, A., Selvaggi, G., Cecere, G., and Cloetingh, S.: Role of crustal fluids and thermo-mechanical structure for lower crustal seismicity: The Gargano Promontory (southern Italy), Global and Planetary Change, 217, 103929, https://doi.org/10.1016/j.gloplacha.2022.103929, 2022. a, b, c, d
Lee, W. H. and Lahr, J. C.: HYPO71 (revised; a computer program for determining hypocenter, magnitude, and first motion pattern of local earthquakes, Tech. rep., US Dept. of the Interior, Geological Survey, National Center for Earthquake, https://doi.org/10.3133/ofr72224, 1975. a, b
Li, Z.: Recent advances in earthquake monitoring I: Ongoing revolution of seismic instrumentation, Earthquake Science, 34, 177–188, https://doi.org/10.29382/eqs-2021-0011, 2021. a
Lomax, A., Virieux, J., Volant, P., and Berge-Thierry, C.: Probabilistic Earthquake Location in 3D and Layered Models, Springer Netherlands, Dordrecht, 101–134, ISBN 978-94-015-9536-0, https://doi.org/10.1007/978-94-015-9536-0_5, 2000. a, b, c, d, e, f, g
Lomax, A., Michelini, A., and Curtis, A.: Earthquake Location, Direct, Global-Search Methods, Springer, New York, 2449–2473, ISBN 978-0-387-30440-3, https://doi.org/10.1007/978-0-387-30440-3_150, 2009. a
Lomax, A., Michelini, A., and Curtis, A.: Earthquake location, direct, global-search methods, in: Encyclopedia of complexity and systems science, Springer, 33 pp., https://doi.org/10.1007/978-3-642-27737-5_150-2, 2014. a, b, c, d, e
Lucente, S., Ninivaggi, T., de Lorenzo, S., Del Pezzo, E., Filippucci, M., Prosser, G., and Tallarico, A.: Qβ, Qc, Qi, Qs of the Gargano Promontory (Southern Italy), Journal of Seismology, 27, 827–846, https://doi.org/10.1007/s10950-023-10157-5, 2023. a
Maeda, N.: A method for reading and checking phase times in autoprocessing system of seismic wave data, Zisin, 38, 365–379, 1985. a
McNamara, D. E. and Buland, R. P.: Ambient Noise Levels in the Continental United States, Bulletin of the Seismological Society of America, 94, 1517–1527, https://doi.org/10.1785/012003001, 2004. a
Miccolis, S., Filippucci, M., Lorenzo, S., Frepoli, A., Pierri, P., and Tallarico, A.: Seismogenic Structure Orientation and Stress Field of the Gargano Promontory (Southern Italy) From Microseismicity Analysis, Frontiers in Earth Science, 09, 589332, https://doi.org/10.3389/feart.2021.589332, 2021. a, b, c, d, e, f, g, h, i, j
Michele, M., Latorre, D., and Emolo, A.: An Empirical Formula to Classify the Quality of Earthquake Locations, Bulletin of the Seismological Society of America, 109, 2755–2761, https://doi.org/10.1785/0120190144, 2019. a, b, c, d
Mongelli, F. and Ricchetti, G.: Heat flow along the candelaro fault – gargano headland (Italy), Geothermics, 2, 450–458, https://doi.org/10.1016/0375-6505(70)90043-X, 1970. a
Montone, P. and Mariucci, M. T.: The new release of the Italian contemporary stress map, Geophysical Journal International, 205, 1525–1531, https://doi.org/10.1093/gji/ggw100, 2016. a
Mousavi, S. M. and Beroza, G. C.: Machine learning in earthquake seismology, Annual Review of Earth and Planetary Sciences, 51, 105–129, https://doi.org/10.1146/annurev-earth-071822-100323, 2023. a
Patacca, E. and Scandone, P.: The 1627 Gargano earthquake (Southern Italy): Identification and characterization of the causative fault, Journal of Seismology, 8, 259–273, https://doi.org/10.1023/B:JOSE.0000021393.77543.1e, 2004. a
Peterson, J. R.: Observations and modeling of seismic background noise, Tech. rep., US Geological Survey, https://doi.org/10.3133/ofr93322, 1993. a, b
Pierri, P., Filippucci, M., Del Gaudio, V., Tallarico, A., Venisti, N., and Festa, V.: New Insights on the Seismic Activity of Ostuni (Apulia Region, Southern Italy) Offshore, Applied Sciences, 15, 784, https://doi.org/10.3390/app15020784, 2025. a
Presti, D., Orecchio, B., Falcone, G., and Neri, G.: Linear versus non-linear earthquake location and seismogenic fault detection in the southern Tyrrhenian Sea, Italy, Geophysical Journal International, 172, 607–618, https://doi.org/10.1111/j.1365-246X.2007.03642.x, 2008. a
Rovida A., Locati M., Camassi R., Lolli B., Gasperini P., and Antonucci A.: Catalogo Parametrico dei Terremoti Italiani (CPTI15), versione 4.0, Istituto Nazionale di Geofisica e Vulcanologia (INGV) [data set], https://doi.org/10.13127/cpti/cpti15.4, 2022. a
Salvi, S., Quattrocchi, F., Brunori, C. A., Doumaz, F., Angelone, M., Billi, A., Buongiorno, M. F., Funiciello, R., Guerra, M., Mele, G., Pizzino, L., and Salvini, F.: A Multidisciplinary Approach to Earthquake Research: Implementation of a Geochemical Geographic Information System for the Gargano Site, Southern Italy, Natural Hazards, 20, 255–278, https://doi.org/10.1023/A:1008105621134, 1999. a
Scafidi, D., Viganò, A., Ferretti, G., and Spallarossa, D.: Robust Picking and Accurate Location with RSNI‐Picker2: Real‐Time Automatic Monitoring of Earthquakes and Nontectonic Events, Seismological Research Letters, 89, 1478–1487, https://doi.org/10.1785/0220170206, 2018. a
Scafidi, D., Spallarossa, D., Ferretti, G., Barani, S., Castello, B., and Margheriti, L.: A Complete Automatic Procedure to Compile Reliable Seismic Catalogs and Travel‐Time and Strong‐Motion Parameters Datasets, Seismological Research Letters, 90, 1308–1317, https://doi.org/10.1785/0220180257, 2019. a, b, c
Snoke, J. A.: 85.12 FOCMEC: FOCal MEChanism determinations, International Geophysics Series, 81, 1629–1630, 2003. a
Spallarossa, D., Bindi, D., Augliera, P., and Cattaneo, M.: An ML scale in northwestern Italy, Bulletin of the Seismological Society of America, 92, 2205–2216, https://doi.org/10.1785/0120010201, 2002. a, b
Spallarossa, D., Ferretti, G., Scafidi, D., Turino, C., and Pasta, M.: Performance of the RSNI-Picker, Seismological Research Letters, 85, 1243–1254, https://doi.org/10.1785/0220130136, 2014. a
Spallarossa, D., Cattaneo, M., Scafidi, D., Michele, M., Chiaraluce, L., Segou, M., and Main, I.: An automatically generated high-resolution earthquake catalogue for the 2016–2017 Central Italy seismic sequence, including P and S phase arrival times, Geophysical Journal International, 225, 555–571, https://doi.org/10.1093/gji/ggaa604, 2021. a, b, c
Stabile, T. A., Serlenga, V., Satriano, C., Romanelli, M., Gueguen, E., Gallipoli, M. R., Ripepi, E., Saurel, J.-M., Panebianco, S., Bellanova, J., and Priolo, E.: The INSIEME seismic network: a research infrastructure for studying induced seismicity in the High Agri Valley (southern Italy), Earth System Science Data, 12, 519–538, https://doi.org/10.5194/essd-12-519-2020, 2020. a
Tallarico, A.: Rete multi-parametrica per lo studio e il monitoraggio dei rischi naturali nel canale d'Otranto e nel Mar Ionio, Ragusa Service, ISBN 9788890670763, 2015. a, b
Tallarico, A., Patella, D., Ninivaggi, T., Ruzza, G., Cecere, G., Filippucci, M., and Selvaggi, G.: The OTRIONS Seismic Network: Instrumentation Upgrade and Borehole Installation, Ann. Geophys., 68, DM578, https://doi.org/10.4401/ag-9305, 2025. a, b, c, d
Tramelli, A., Orazi, M., Nardone, L., Bobbio, A., Benincasa, A., Buonocunto, C., Capello, M., Caputo, A., Castellano, M., D'Auria, L., Cesare, W. D., Filippo, A. D., Galluzzo, D., Gaudiosi, G., Giudicepietro, F., Liguoro, F., Bascio, D. L., Martini, M., Martino, C., Peluso, R., Ricciolino, P., Scarpato, G., Torello, V., and Bianco, F.: The seismic network of Ischia island from 1993 to 2021, Geological Society, London, Special Publications, 519, 47–58, https://doi.org/10.1144/SP519-2021-192, 2024. a
Tripaldi, S.: Electrical signatures of a permeable zone in carbonates hosting local geothermal manifestations: Insights for the deep fluid flow in the gargano area (South-eastern Italy), Bollettino di Geofisica Teorica ed Applicata, 61, https://doi.org/10.4430/bgta0312, 2020. a
University of Bari “Aldo Moro”: OTRIONS, FSDN [data set], https://doi.org/10.7914/SN/OT, 2013. a, b
Ventola, I., Balasco, M., De Girolamo, M., Falco, L., Filippucci, M., Hillmann, L., Romano, G., Serlenga, V., Stabile, T. A., Strollo, A., Tallarico, A., Tripaldi, S., Zieke, T., and Siniscalchi, A.: Seismic-electromagnetic signals from two monitoring stations in Southern Italy: Electromagnetic time series release, Geoscience Data Journal, https://doi.org/10.1002/gdj3.262, 2024. a
Woessner, J. and Wiemer, S.: Assessing the Quality of Earthquake Catalogues: Estimating the Magnitude of Completeness and Its Uncertainty, Bulletin of the Seismological Society of America, 95, 684–698, https://doi.org/10.1785/0120040007, 2005. a
Zhang, M., Ellsworth, W. L., and Beroza, G. C.: Rapid earthquake association and location, Seismological Research Letters, 90, 2276–2284, https://doi.org/10.1785/0220190052, 2019. a
Zhou, Y., Yue, H., Fang, L., Zhou, S., Zhao, L., and Ghosh, A.: An earthquake detection and location architecture for continuous seismograms: Phase picking, association, location, and matched filter (PALM), Seismological Society of America, 93, 413–425, https://doi.org/10.1785/0220210111, 2022. a
- Abstract
- Introduction
- Seismological setting
- Gargano seismic network (GSN)
- Data analysis
- CASP automatic vs. manual picking
- Earthquake catalogs of GP
- Discussion
- Data availability
- Code availability
- Conclusions
- Appendix A: Additional material
- Author contributions
- Competing interests
- Disclaimer
- Acknowledgements
- Financial support
- Review statement
- References