the Creative Commons Attribution 4.0 License.
the Creative Commons Attribution 4.0 License.
 | 15 Apr 2026
A 28-year-long (1997–2024) hydrographic dataset from the southern Baltic Sea
Daniel Rak
Anna Izabela Bulczak
Waldemar Walczowski
Piotr Wieczorek
Małgorzata Merchel
Robert Osiński
Ilona Goszczko
Agnieszka Beszczynska-Möller
Agnieszka Strzelewicz
Małgorzata Kitowska
The data set presented here consists of Conductivity–Temperature–Depth (CTD) observations collected during 96 research cruises of R/V Oceania across the southern Baltic Sea between 1997 and 2024. The collection comprises towed and vertical station profiles acquired along a repeat transect spanning the Arkona Basin, Bornholm Basin, Słupsk Furrow, and Gdańsk Basin. Acquisition and post-processing procedures include standardized parsing of CNV/TXT files, robust time/position handling, pressure-binning to 1 dbar, median filtering, automated geolocation quality control, and pruning of incomplete profiles. The dataset enables analyses of seasonal to decadal variability in temperature and salinity, inflow propagation, ventilation events, and model validation. Manufacturer specifications for the principal instruments (Guildline 87104, Idronaut OS316/OS316Plus, Sea-Bird SBE49, Sea-Bird SBE19plus) are summarized to inform uncertainty assessment. The dataset is publicly available from IOPAN GeoNetwork (Rak, 2025b; https://doi.org/10.48457/IOPAN.2025.531), while the processing and CF-1.8 NetCDF export scripts are available from Zenodo (Rak, 2025a; https://doi.org/10.5281/zenodo.17814769).
- Article
(8714 KB) - Full-text XML
- BibTeX
- EndNote


The Southern Baltic Sea, a semi-enclosed marginal sea, forms an important transitional region connecting the North Sea through the Danish Straits. This geographic setting leads to distinct hydrographic conditions characterized by episodic inflows of saline North Sea waters, which strongly influence stratification, deep-water renewal, and regional marine dynamics (Matthäus and Franck, 1992; Mohrholz et al., 2015). The proximity of the Danish Straits exerts a dominant control on hydrography in the region, as episodic inflows of saline North Sea water propagate eastward, shaping stratification and deep-water renewal. Consequently, this region exhibits pronounced vertical stratification patterns driven by inflow events and the progressive downstream modification of water masses with increasing distance from the Danish Straits, coupled with distinct seasonal variability in temperature and salinity (Leppäranta and Myrberg, 2009).
Major Baltic Inflows (MBIs), occur episodically from the North Sea into the Baltic Sea, significantly affecting its hydrography and circulation (Fischer and Matthäus, 1996; Mohrholz et al., 2015). These inflows are classified into two main types: barotropic and baroclinic. Barotropic inflows result primarily from large-scale meteorological forcing, such as prolonged westerly winds, significant changes in atmospheric pressure, and sea level differences between the North Sea and Baltic Sea, causing substantial volumes of saline water to enter the Baltic basins (Burchard et al., 2005; Stigebrandt and Gustafsson, 2003). Baroclinic inflows, on the other hand, are driven by density gradients and stratification differences, often involving internal waves and subsurface transport mechanisms. MBIs transport large volumes of dense, oxygen-rich saline waters into deeper Baltic basins, replenishing oxygen levels in bottom waters and impacting both physical and ecological processes (Mohrholz, 2018). The frequency, intensity, and impact of these inflow events are crucial for understanding the long-term environmental status of the Baltic Sea, influencing deep-water renewal and ecosystem dynamics (Reissmann et al., 2009).
Comprehensive observational datasets for the Southern Baltic Sea remain relatively scarce, particularly continuous, high-resolution Conductivity-Temperature-Depth (CTD) profiles spanning multiple decades (Feistel et al., 2008). Hydrographic observations in the Baltic Sea are represented in long-standing international data compilations and infrastructures (e.g., ICES data archives, SeaDataNet, EMODnet, Copernicus Marine Service, and global repositories such as the World Ocean Database). However, many historical measurements are spatially heterogeneous or episodic, and a substantial fraction originates from fixed monitoring stations rather than repeated basin-scale sections. In contrast, the IOPAN program provides a rare, long-term, repeatedly sampled transect that consistently links the Arkona Basin, Bornholm Basin, Słupsk Furrow, and Gdańsk Basin, enabling coherent analysis of along-basin hydrographic structure and variability over nearly three decades. While sporadic measurement campaigns and shorter-term datasets exist, long-term, systematic collections are limited, making it challenging to fully understand the variability and long-term trends in the region (Omstedt et al., 2014). This scarcity is especially pronounced within the Polish Exclusive Economic Zone (EEZ), where the availability of openly accessible, high-resolution CTD data is particularly limited. In contrast to the better-monitored central basins of the Baltic Sea – such as the Bornholm and Gotland Basins – data coverage in the Polish EEZ has been historically sparse and fragmented. Regular measurements in this area have often been conducted only a few times per year, and real-time or near-real-time data have not been readily available until the recent deployment of Argo floats (Walczowski et al., 2020). The lack of dense, long-term in situ CTD records hinders detailed analyses of vertical structure, stratification, oxygen dynamics, and long-term hydrographic shifts in this environmentally and economically important sector of the Baltic Sea. Furthermore, this data gap poses significant challenges to numerical modeling, operational oceanography, and marine environmental management.
Addressing this critical gap, this article introduces a unique, meticulously curated dataset comprising CTD profiles collected over 28 years (1997–2024) in the Southern Baltic Sea by the Observational Oceanography Laboratory of the Institute of Oceanology Polish Academy of Sciences (IOPAN), Physical Oceanography Department. The data, gathered systematically aboard the research vessel R/V Oceania, provide invaluable insights into the physical oceanographic processes shaping the local environment and their connection to broader climatic phenomena. Some of these data have already been used in previous publications on long-term changes in the southern Baltic Sea, including studies on temperature and salinity (Rak and Wieczorek, 2012), oxygen levels (Rak et al., 2020), the upper ocean mixing and stratification (Bulczak et al., 2024) and the sea energy (Rak et al., 2024), and inflow propagation (Rak, 2016). However, in this work, we make the full dataset publicly available and provide a comprehensive description of its processing and key features.
The significance of these measurements lies in their extensive temporal coverage and high spatial resolution, which enable comprehensive analyses of variability across a range of temporal scales – from seasonal to decadal – and spatial scales, from sub-mesoscale to basin-wide. Furthermore, this dataset serves as a vital resource for improving numerical ocean modeling and validation efforts, contributing significantly to our understanding of both local marine dynamics and global climate-related processes (Gröger et al., 2021).
The repeat hydrographic section follows the axis of the deep basins in the southern Baltic Sea, from the Arkona Basin through the Bornholm Basin and the Słupsk Furrow to the Gdańsk Basin. This section spans approximately 280 nautical miles (≈ 519 km), and the measurement time with the towed probe varies from 3 to 5 d, depending on weather conditions.
Although the monitoring program was originally designed to cover the full transect linking the Arkona Basin, Bornholm Basin, Słupsk Furrow, and Gdańsk Basin, not all cruises achieved complete spatial coverage. Weather conditions, ship-time constraints, and operational limitations occasionally resulted in partial transects or a reduced number of stations. Full-transect coverage was achieved most consistently prior to 2018. In subsequent years, reduced ship time, budget constraints, and operational limitations progressively curtailed the western reach of the section – first to the vicinity of the Bornholm Channel and ultimately to profiles within the Polish Exclusive Economic Zone, which remains the current operational limit. Nevertheless, the Gdańsk Basin and Słupsk Furrow were sampled during the majority of campaigns, ensuring continuity of the key hydrographic time series. Over the 28-year period, the dataset therefore represents a quasi-regular repeated section rather than a perfectly uniform annual survey.
The transect evolved over time. Since the early 2000s, the core transect from the Bornholm Channel (Bornholmsgat) to the Gdańsk Basin has been performed in a highly repeatable manner. In contrast, the western segment across the Arkona Basin did not follow a single fixed track. Depending on logistics and weather conditions, the route varied between a more northerly pathway oriented toward the Sound and a more southerly pathway closer to the Darss Sill.
Over the 28-year period (Fig. 1), sampling was designed to capture the pathways and transformation of North Sea inflow waters while maintaining consistent coverage within the Polish sector of the southern Baltic. As a result, data density is highest in the Bornholm Basin, the Słupsk Furrow and Słupsk Sill region, and the Gdańsk Basin, which together form the core observation corridor of the long-term monitoring. To quantify spatial coverage, we classified each cruise by its westernmost extent along the section (based on the westernmost station longitude). Approximately 31 % of cruises reached the Arkona Basin, ∼ 62 % reached at least the Bornholm Channel, and ∼ 80 % reached at least the Bornholm Basin. This variability should be considered when interpreting basin-scale climatologies and the long-term statistics.
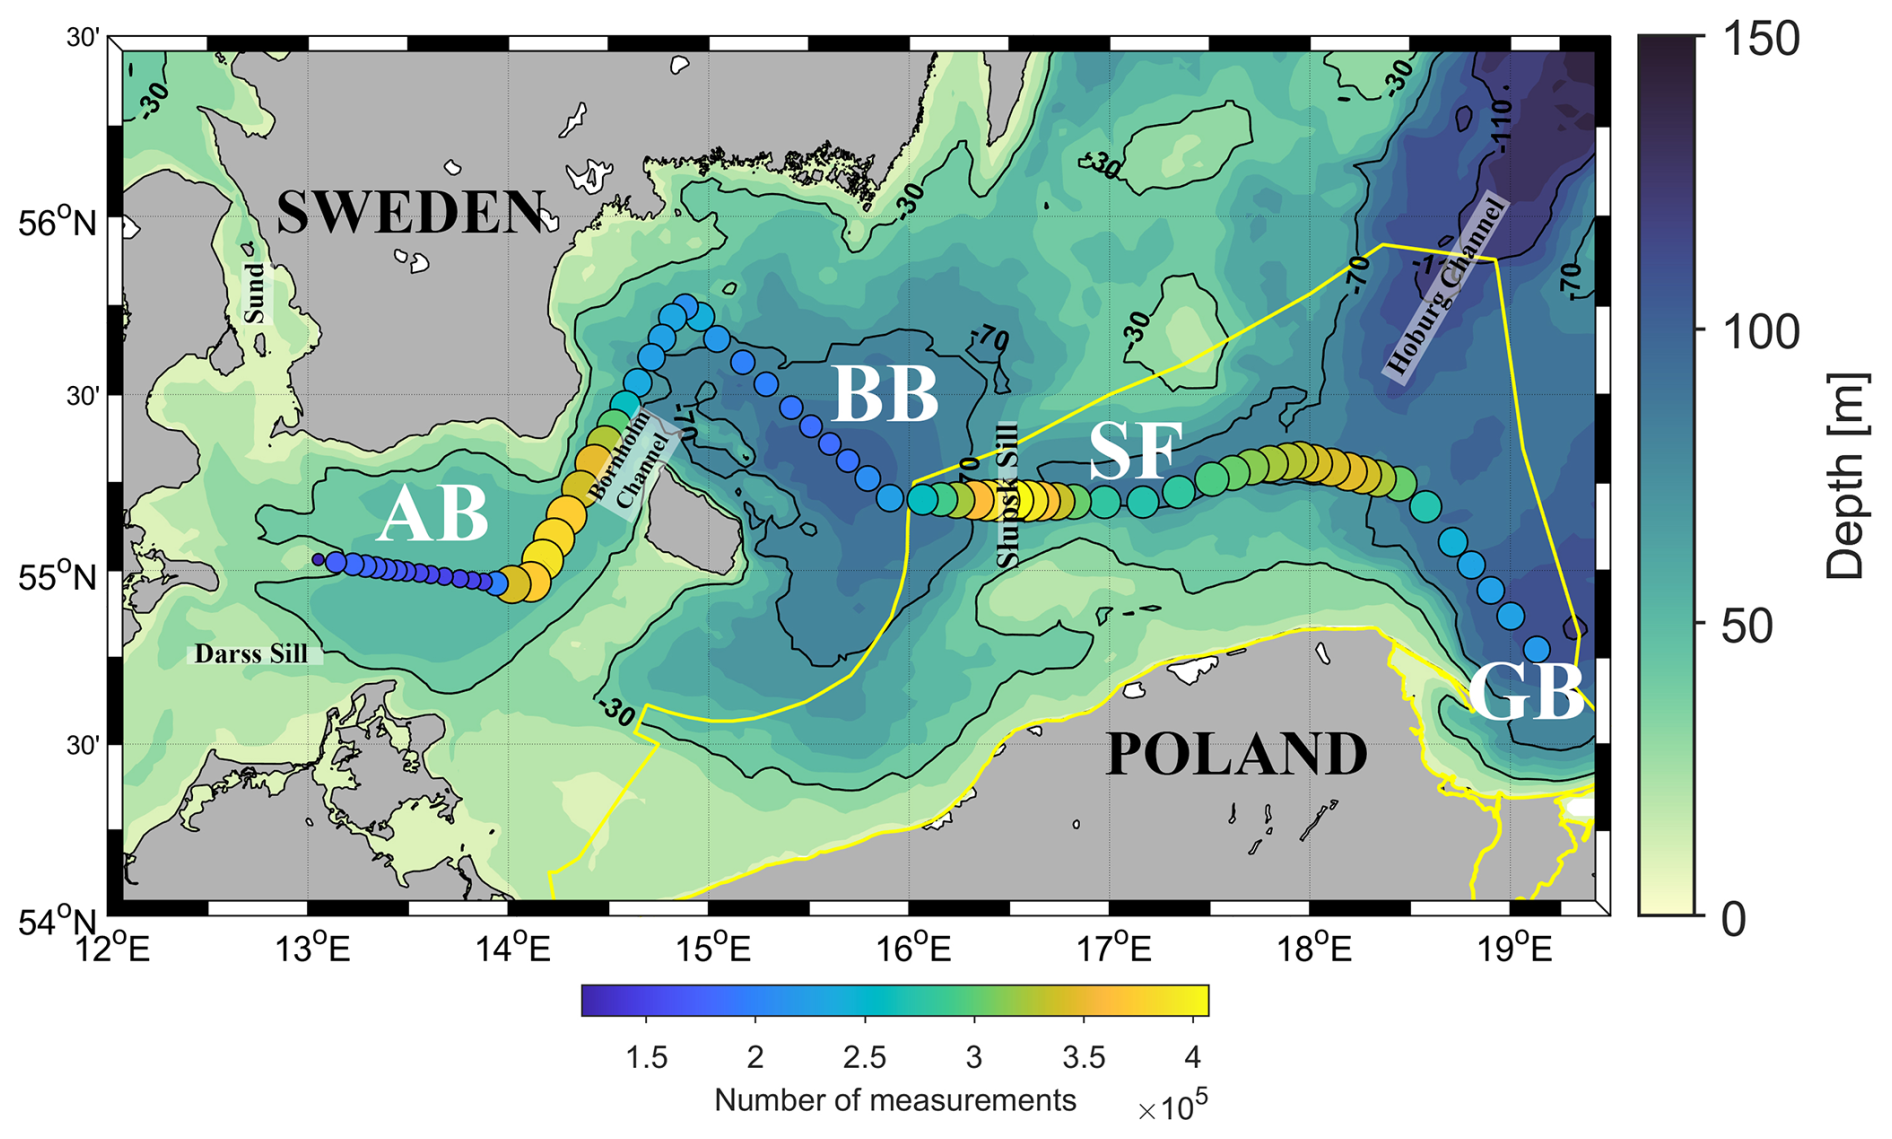
Figure 1Spatial distribution of CTD profiles collected during R/V Oceania cruises between 1997 and 2024 in the southern Baltic Sea. The yellow line indicates the Polish Exclusive Economic Zone (EEZ). The labels AB, BB, SF and GB denote the Arkona Basin, Bornholm Basin, Słupsk Furrow and Gdańsk Basin, respectively.
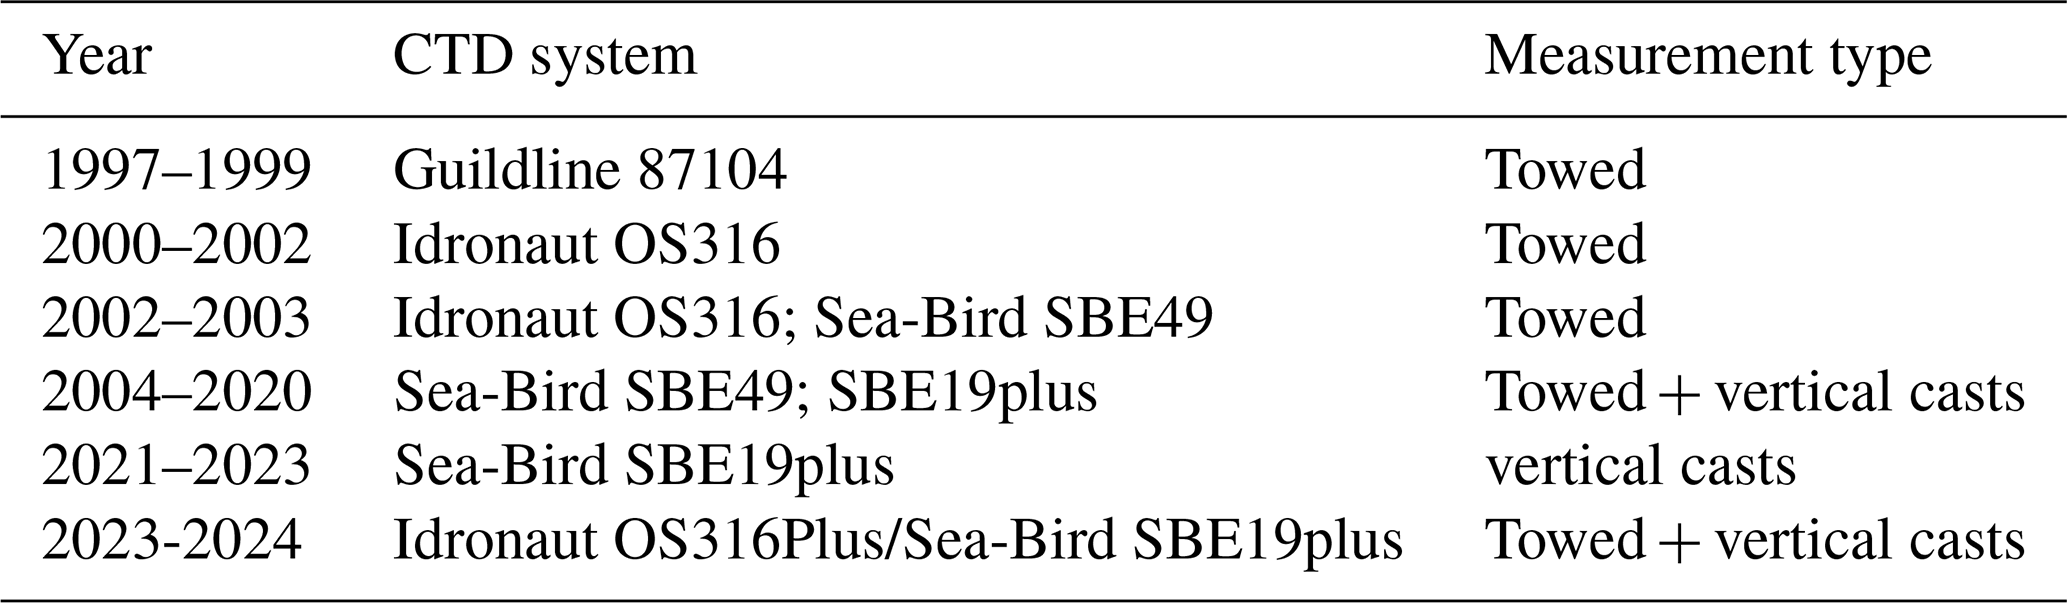
Hydrographic observations of IOPAN were conducted with several CTD systems (Table 1). Early operations used a Guildline 87104 and an Idronaut OS316; the OS316 was soon complemented and largely superseded by the Sea-Bird SBE49 FastCAT. All of these instruments were initially deployed in towed mode (underway profiling). Since 2020, vertical casts (stations) profiling has largely replaced towing, primarily with a Sea-Bird SBE19plus and, more recently, an Idronaut OS316Plus. No routine discrete water samples for salinity calibration were collected during the majority of cruises. Salinity quality control relied on manufacturer calibration procedures, pre- and post-cruise sensor checks, and internal consistency between temperature, conductivity, and density structure. Long-term stability was additionally assessed through intercomparison between different CTD systems used over the monitoring period and by verifying the consistency of deep-layer salinity signals during major inflow events.
Table 1Overview of CTD instruments used by IOPAN for hydrographic observations in the southern Baltic Sea between 1997 and 2024. The table lists the main devices and corresponding measurement types conducted during each period.
During towing, the CTD is mounted in a protective metal frame with an under-slung chain to minimize the risk of seabed contact. This configuration maintains a stable, near-horizontal probe orientation while providing mechanical protection (Fig. 2). To produce a near-sinusoidal sampling pattern, the probe is cycled repeatedly between surface and bottom. At a towing speed of ∼ 4 kn (≈7.4 km h−1), this yields a horizontal resolution of ∼ 200–500 m in typical water depths of 60–120 m. Towed data are acquired on both the downcast and upcast. Since 2020, vertical stations with a nominal along-track spacing ∼ 5 nm have replaced towing. Owing to the probe's mounting and its orientation relative to the direction of motion, only the downcast is retained for vertical (station) measurements. The nominal spacing of approximately 5 nautical miles (≈9 km) between vertical stations was selected as a compromise between resolving mesoscale hydrographic structures and maintaining practical survey duration. In the southern Baltic basins, horizontal density and salinity gradients associated with inflow propagation, halocline tilt, and basin-scale circulation typically occur on spatial scales of 10–30 km. A 5 nm (∼ 9 km) station interval therefore provides sufficient resolution to capture these gradients and the structure of the permanent halocline while allowing completion of the transect within available ship time and weather windows. This spacing has been maintained consistently over the monitoring period to ensure comparability of sections and long-term variability analyses.
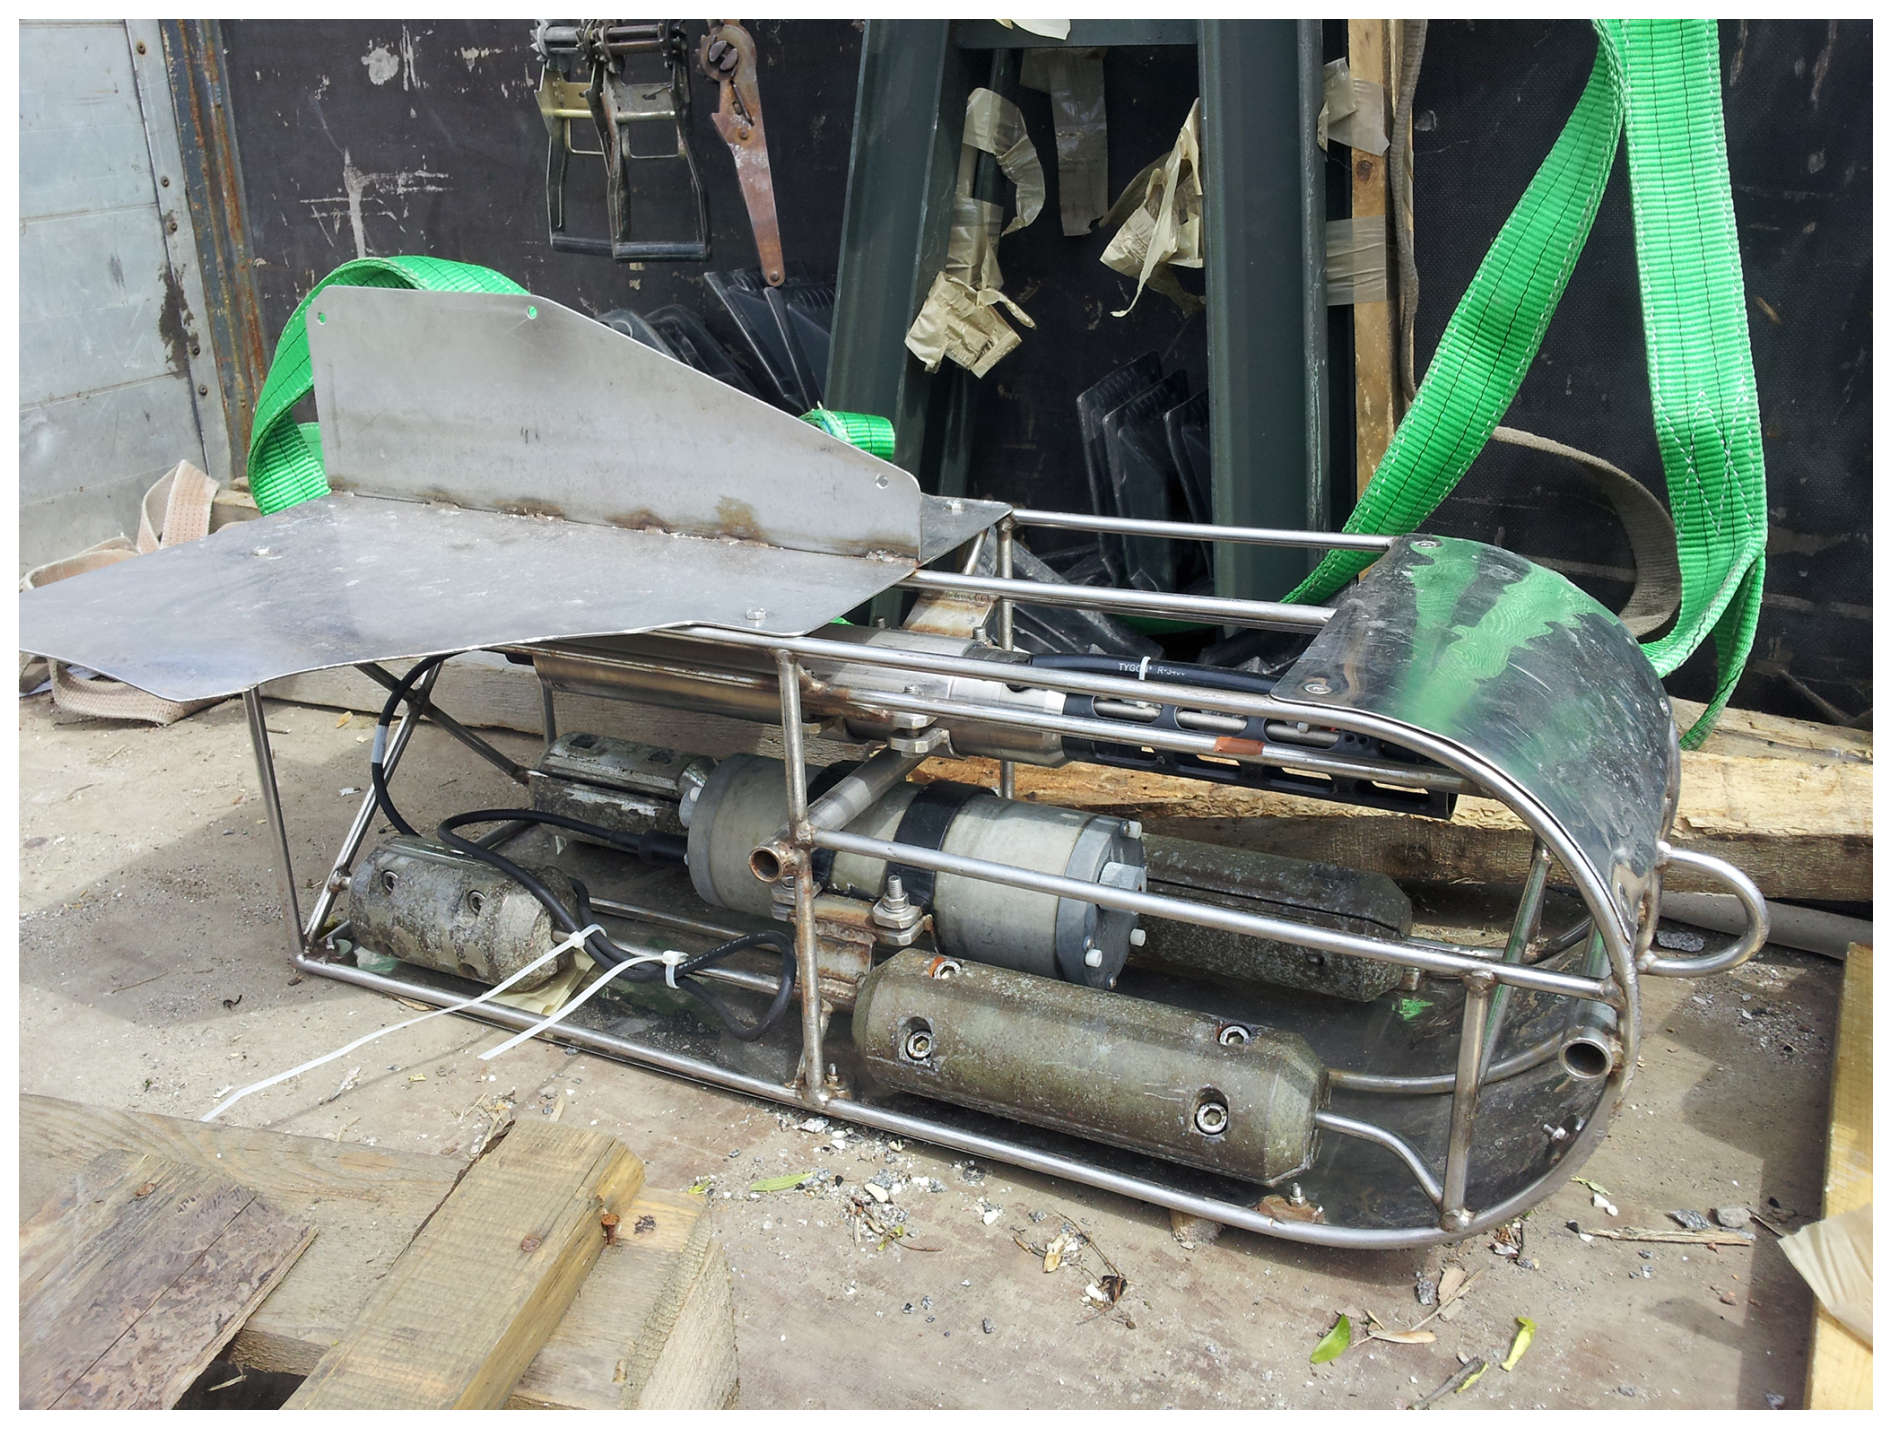
Figure 2CTD towed probe system used for the collection of data with Sea-Bird SBE49 (2002–2020).
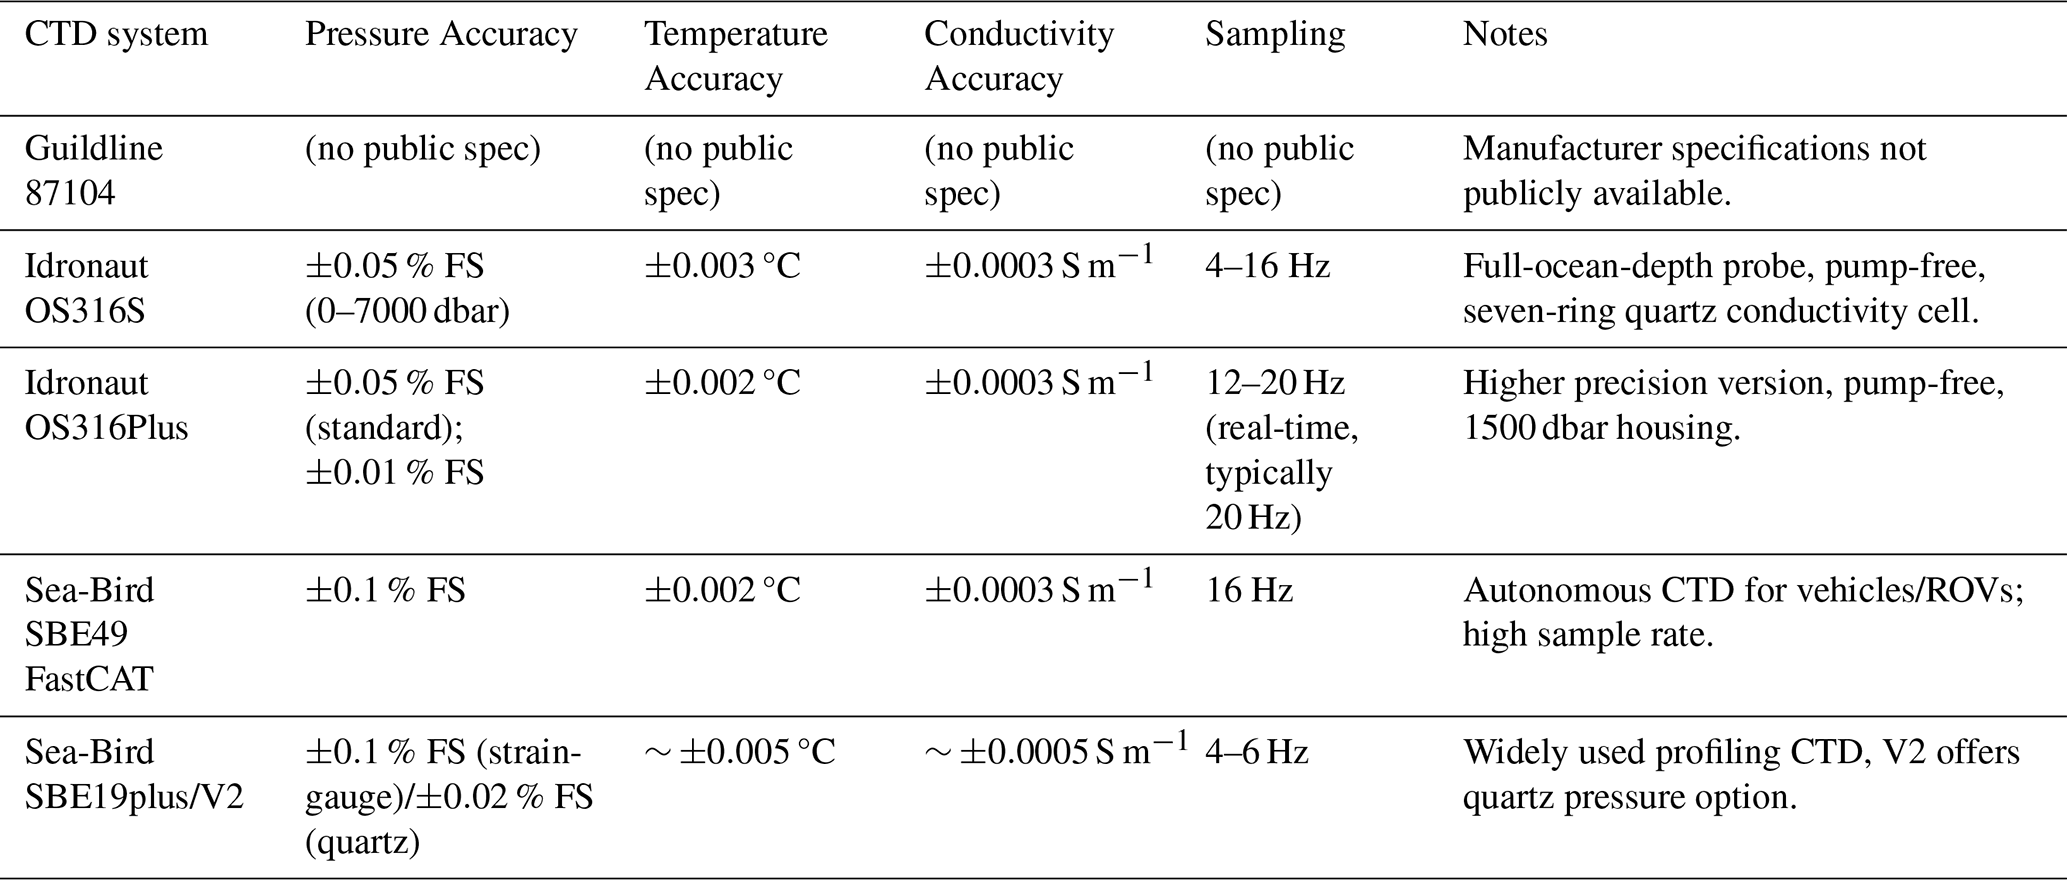
Instrument choice for the towed platform was driven by high sample-rate capability and robust real-time telemetry. The Sea-Bird SBE19plus has been the primary shipboard profiling CTD on board R/V Oceania, whereas the Idronaut OS316Plus – initially used at stations – has more recently been integrated into a refurbished towed frame. A further advantage of the OS316Plus is its pass-through interface that allows additional auxiliary sensors (e.g., dissolved oxygen, turbidity) to be powered and telemetered over a single cable. Manufacturer accuracy specifications for all instruments used in this program are summarized in Table 2.
Table 2Manufacturer specifications of conductivity-temperature-depth (CTD) profilers used by the Institute of Oceanology, Polish Academy of Sciences (IOPAN) during long-term hydrographic monitoring in the southern Baltic Sea.
Observational data utilized in this study were gathered during research voyages of the Institute of Oceanology of the Polish Academy of Sciences' vessel, R/V Oceania. These data originated from the Southern Baltic Sea, spanning the period between 1997 and 2024 (Fig. 3). Approximately four surveys were conducted annually, with the observational program designed to cover the full repeat section linking the Arkona Basin, Bornholm Basin, Słupsk Furrow, and Gdańsk Basin. In practice, the number of surveys per year varied (typically 2–5) depending on ship availability, weather, and operational constraints, and not all cruises achieved full spatial coverage (see Sect. 2). Owing to the engagement of R/V Oceania in the Arctic research, the period from June to August is the least represented in the dataset.
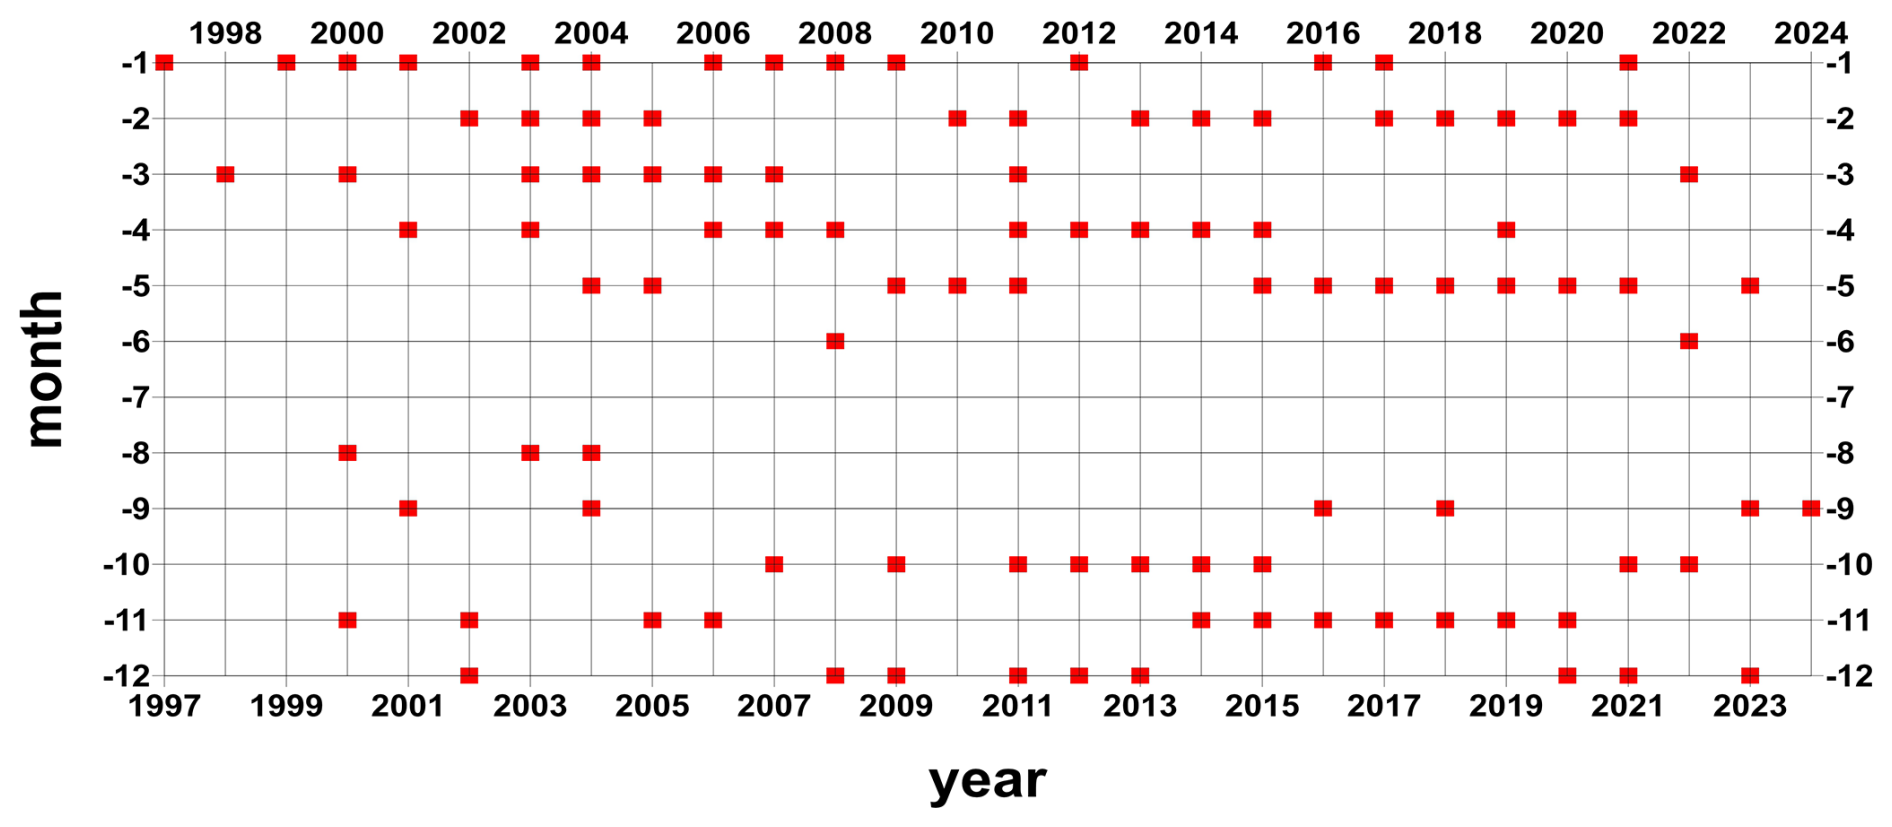
Figure 3Time distribution (1997–2024) of R/V Oceania CTD cruises conducted by the Observational Oceanography Laboratory, Institute of Oceanology PAN.
The temporal sampling is therefore not uniform over the 28-year period. Sampling frequency was the highest in the early and mid-2000s, when intensive towed surveys provided dense profile coverage, and decreased after 2020 due to the loss of the SBE49 towed system, reduced ship time, and logistical constraints. As a result, the dataset contains interannual variability in the number of cruises and profiles. This heterogeneity should be considered when applying statistical methods that assume regular sampling (e.g., long-term linear trend estimation or evenly spaced climatologies). The dataset is, however, fully suitable for analyses focused on vertical structure, water-mass variability, stratification, and episodic processes such as inflow and ventilation events, which depend primarily on profile-scale resolution rather than uniform temporal spacing.
In total, from 1997 to 2024, 96 hydrographic voyages were conducted, during which 55 032 measurement profiles were recorded (Fig. 4). The annual profile counts show strong interannual variability with a clear maximum in the early–mid 2000s, when intensive towed CTD surveys routinely yielded several hundred to >1000 profiles per year. From the late 2000s into the 2010s the effort gradually declined, reflecting reduced sea time and a growing share of discrete station work. A sharp drop is evident after 2019, consistent with the loss of the SBE49 towed system in May 2020 and COVID-19 operational constraints; only sparse profiles were collected in 2020–2024. Overall, the variability primarily reflects instrument availability, cruise logistics, and weather, rather than changes in processing or quality control.
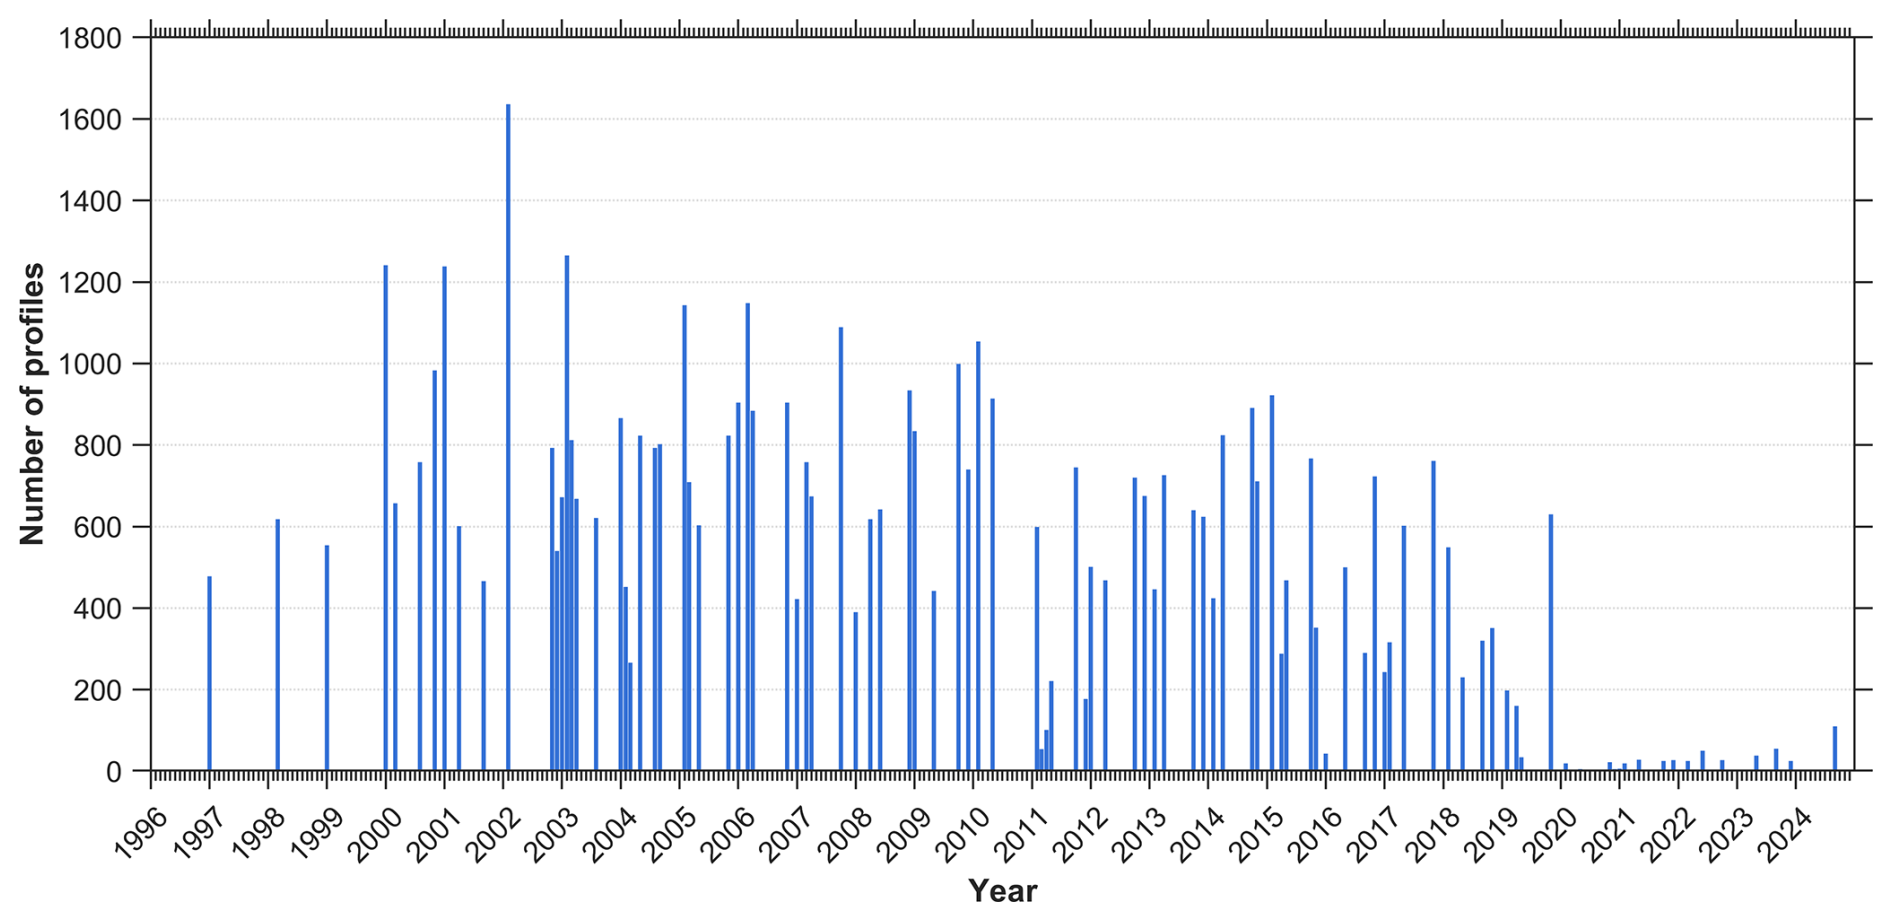
Figure 4Distribution of CTD profiles conducted by IOPAN along the main monitoring transect in the southern Baltic Sea.
Towed measurements made with the Guildline 87104, Idronaut OS316, and Sea-Bird SBE49 typically store a single geographic position and timestamp at the beginning of each profile. Because the probe trails behind the vessel on a cable, the actual sampling position deviates from the ship's GPS location. The horizontal offset increases with depth and cable length. A simple geometric upper bound assuming a large cable angle suggests that near-bottom samples could, in extreme cases, be displaced by up to approximately three times the local water depth (e.g., ∼ 300 m at 100 m depth). In practice, however, actual offsets are substantially smaller and remain negligible relative to the mesoscale and basin-scale variability resolved by the section.
For vertical (station) profiles, positional uncertainty is much smaller and arises primarily from vessel drift during the cast. In the southern Baltic, station drift is typically modest; when present, it reflects a combination of wind forcing and local currents during the cast, but remains small relative to the nominal station spacing. In systems such as the Idronaut OS316Plus, each sample is associated with a geographic position; however, this corresponds to the ship's GPS location rather than the exact sensor position in the water column. Consequently, a small horizontal offset remains, but it is minor compared to the horizontal scales resolved by the nominal station spacing.
As illustrated in Fig. 5 for the towed measurements, the descent rate is not uniform: it varies when crossing the pycnocline and with irregular ship motion. Additionally, winch speed is routinely reduced near the surface and close to the seabed for safety reasons, further modulating sampling speed.
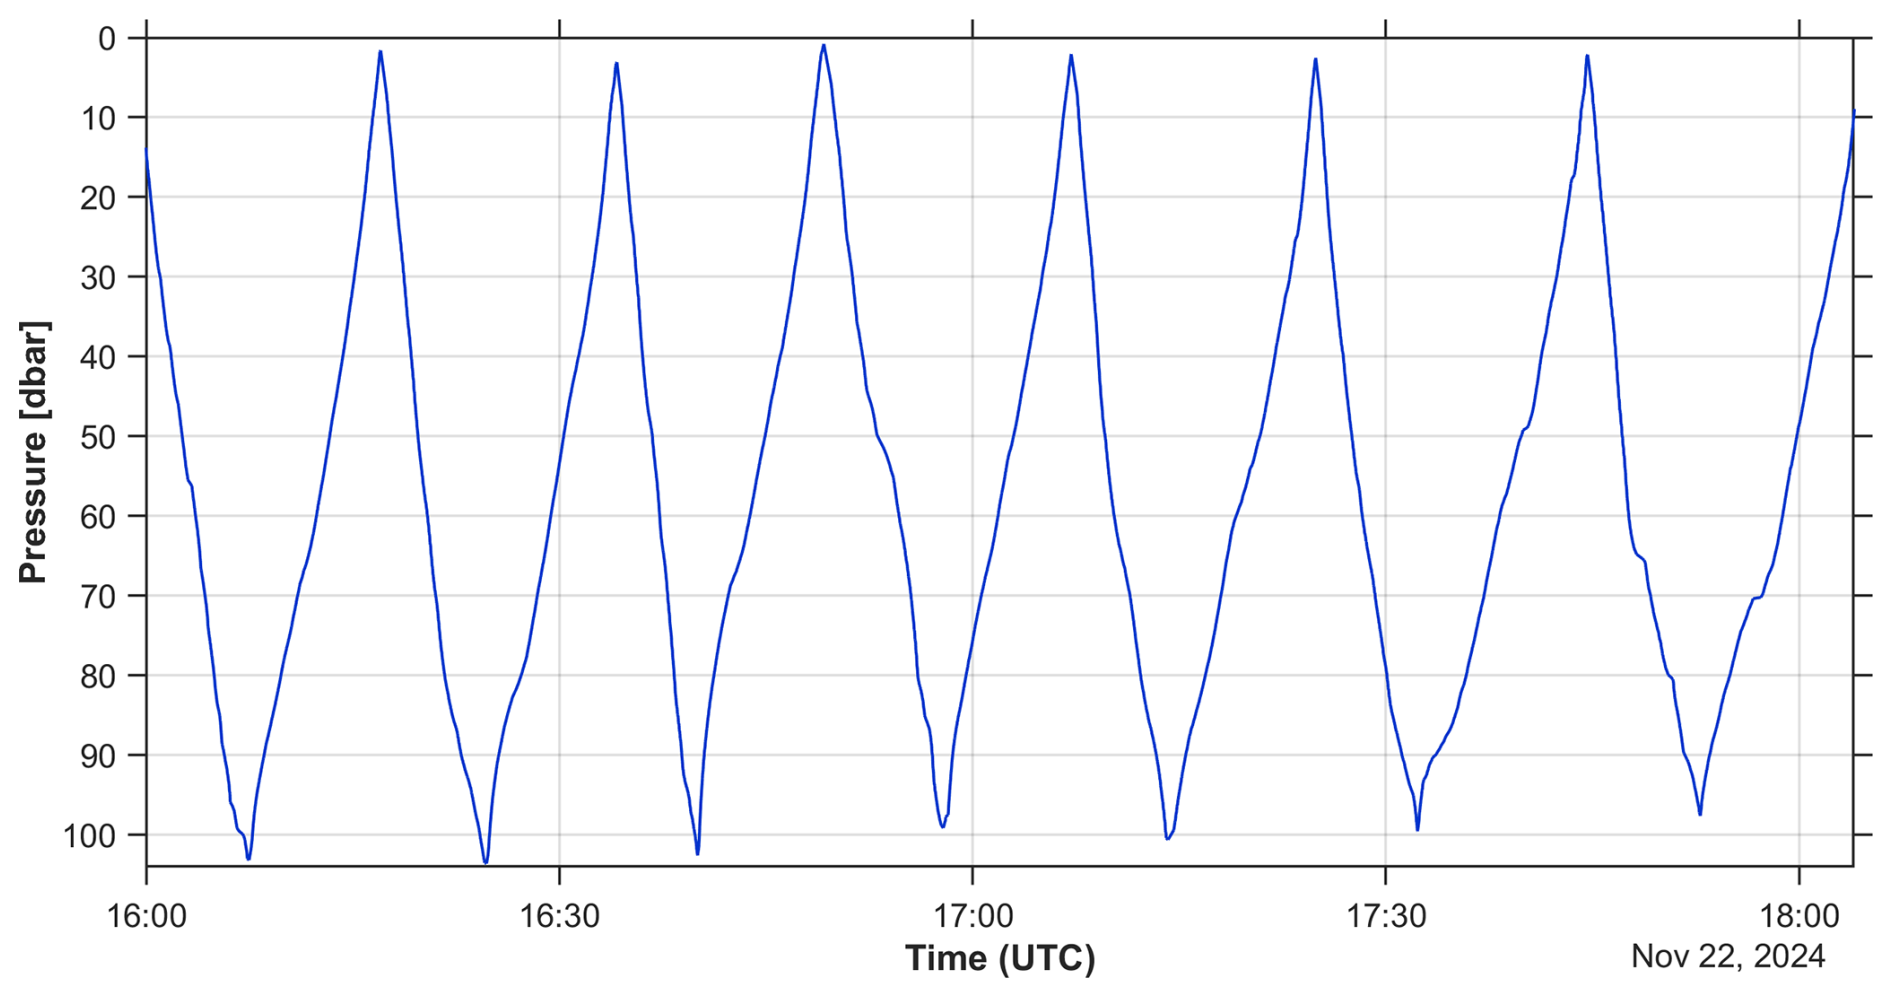
Figure 5Example of a typical continuous CTD probe trajectory in the water column during towed measurements.
From 1997 to 2020, towed operations were routine. On 20 May 2020 the towed system carrying the Sea-Bird SBE49 was lost; since then, measurements have been conducted predominantly as vertical station casts, with limited towing resumed in 2023–2024 using a refurbished frame. In the post-2020 period, towing is applied selectively due to weather constraints and reduced ship time (typically ∼ 7 d cruises vs. ∼ 14 d in earlier intensive periods, e.g., around 2003), and is therefore combined with a reduced set of station casts.
The number of cruises decreased after 2020, leading to a temporal discontinuity in sampling frequency. Accordingly, analyses that require regular annual sampling, such as precise decadal trend estimation, should be interpreted with caution. However, the dataset remains fully suitable for studies of vertical structure, stratification, water-mass variability, and episodic events (e.g., inflows and ventilation), which depend primarily on profile-scale resolution. Complementary observations from Argo floats and global data archives provide additional regional context during periods of reduced ship-based sampling, although they generally lack the spatial focus and repeatability of the IOPAN section.
Instrument calibration and uncertainty budget
All Sea-Bird sensors used in this dataset (SBE 49 FastCAT, Sea-Bird SBE19plus/V2) were regularly returned to Sea-Bird GmbH (Kempten, Germany) for servicing and post-cruise calibration, typically every 1–3 years, depending on instrument usage and cruise schedules. Service reports document routine post-cruise calibration of temperature and conductivity sensors, calibration of pressure sensors, firmware updates and full system checks for the SBE 49 FastCAT and associated pump and conductivity modules.
Table 3Overview of the main CTD instruments used in the dataset and the conservative instrumental uncertainties adopted for temperature, practical salinity (PSS-78; reported here in PSU) and pressure.

For the most frequently used CTD on the towed system (Sea-Bird SBE 49 FastCAT), the latest post-cruise calibration performed in March 2018 yielded extremely small residuals relative to laboratory standards. Temperature calibration over the range 1–32.5 °C showed residuals within ±0.0001 °C, i.e. more than an order of magnitude smaller than the nominal manufacturer accuracy.
Conductivity calibration residuals were on the order of 10−4 S m−1 across the full range of bath salinities, i.e. negligible compared to the nominal conductivity accuracy.
Pressure calibration for the 870 psia (≈ 600 dbar) pressure sensor showed residuals within ±0.01 % of full scale, effectively at the limit of the calibration procedure.
Based on manufacturer specifications and these post-cruise calibration results, we adopt conservative instrumental uncertainties of ±0.005 °C for temperature, ±0.01 in practical salinity and ±0.5 dbar for pressure for individual 1 dbar binned measurements from Sea-Bird CTDs. These values are larger than the formal calibration residuals, but they account for potential long-term sensor drift between service intervals and any residual biases introduced by data processing (vertical binning, median filtering) and deployment configuration (e.g. slight lags due to pump response and flow through the conductivity cell). For other CTD models used earlier in the time series (Guildline 87104, Idronaut OS316), we adopt comparable or slightly larger uncertainties consistent with manufacturer specifications and our internal cross-comparisons (Table 3). The Idronaut OS316Plus was factory-calibrated at Idronaut (24 November 2025). Although the dataset analysed here ends in 2024, we report the most recent factory calibration to document instrument performance and to motivate the conservative uncertainties adopted for the processed products. Calibration residuals were within ±0.0011 °C for temperature and ±0.0039 mS cm−1 for conductivity. For consistency with the long-term record and to account for drift between service intervals and processing effects, we adopt conservative uncertainties of ±0.005 °C, ±0.01 PSU, and ±1 dbar for 1 dbar binned products.
In addition to instrumental uncertainties, there is a finite spatial representativeness error associated with towed sections. During towing, the CTD is pulled astern and may therefore be horizontally displaced from the ship's GPS position. Simple geometric considerations show that an extreme upper bound of three times the local depth would require the tow cable to be almost horizontal, which is unrealistic for our operating conditions (towing speeds of ≈4 kn and depths of 60–100 m). In practice, observed cable angles correspond to horizontal offsets of the order of 0.3–0.8 times the local depth; for the error budget we therefore adopt the local depth as a conservative upper limit on horizontal position uncertainty (≈ 100 m at 100 m depth), while typical offsets are likely closer to 0.5 times the depth. We therefore recommend that the dataset be used primarily for basin-scale and mesoscale analyses, rather than for resolving fine-scale (< O(100 m)) frontal structures, where unresolved horizontal offsets may become non-negligible.
The quality control (QC) and postprocessing procedures applied to the CTD data collected by IOPAN are essential for ensuring the scientific value, internal consistency, and long-term usability of the dataset. Raw data were recorded using several CTD systems operated over the multi-decade period and were calibrated according to manufacturer recommendations. Thermal-lag (temperature–conductivity misalignment) effects were addressed during standard instrument preprocessing prior to salinity computation. Subsequent pressure sorting, 1 dbar binning, and median filtering further reduce residual high-frequency noise while preserving mesoscale gradients.
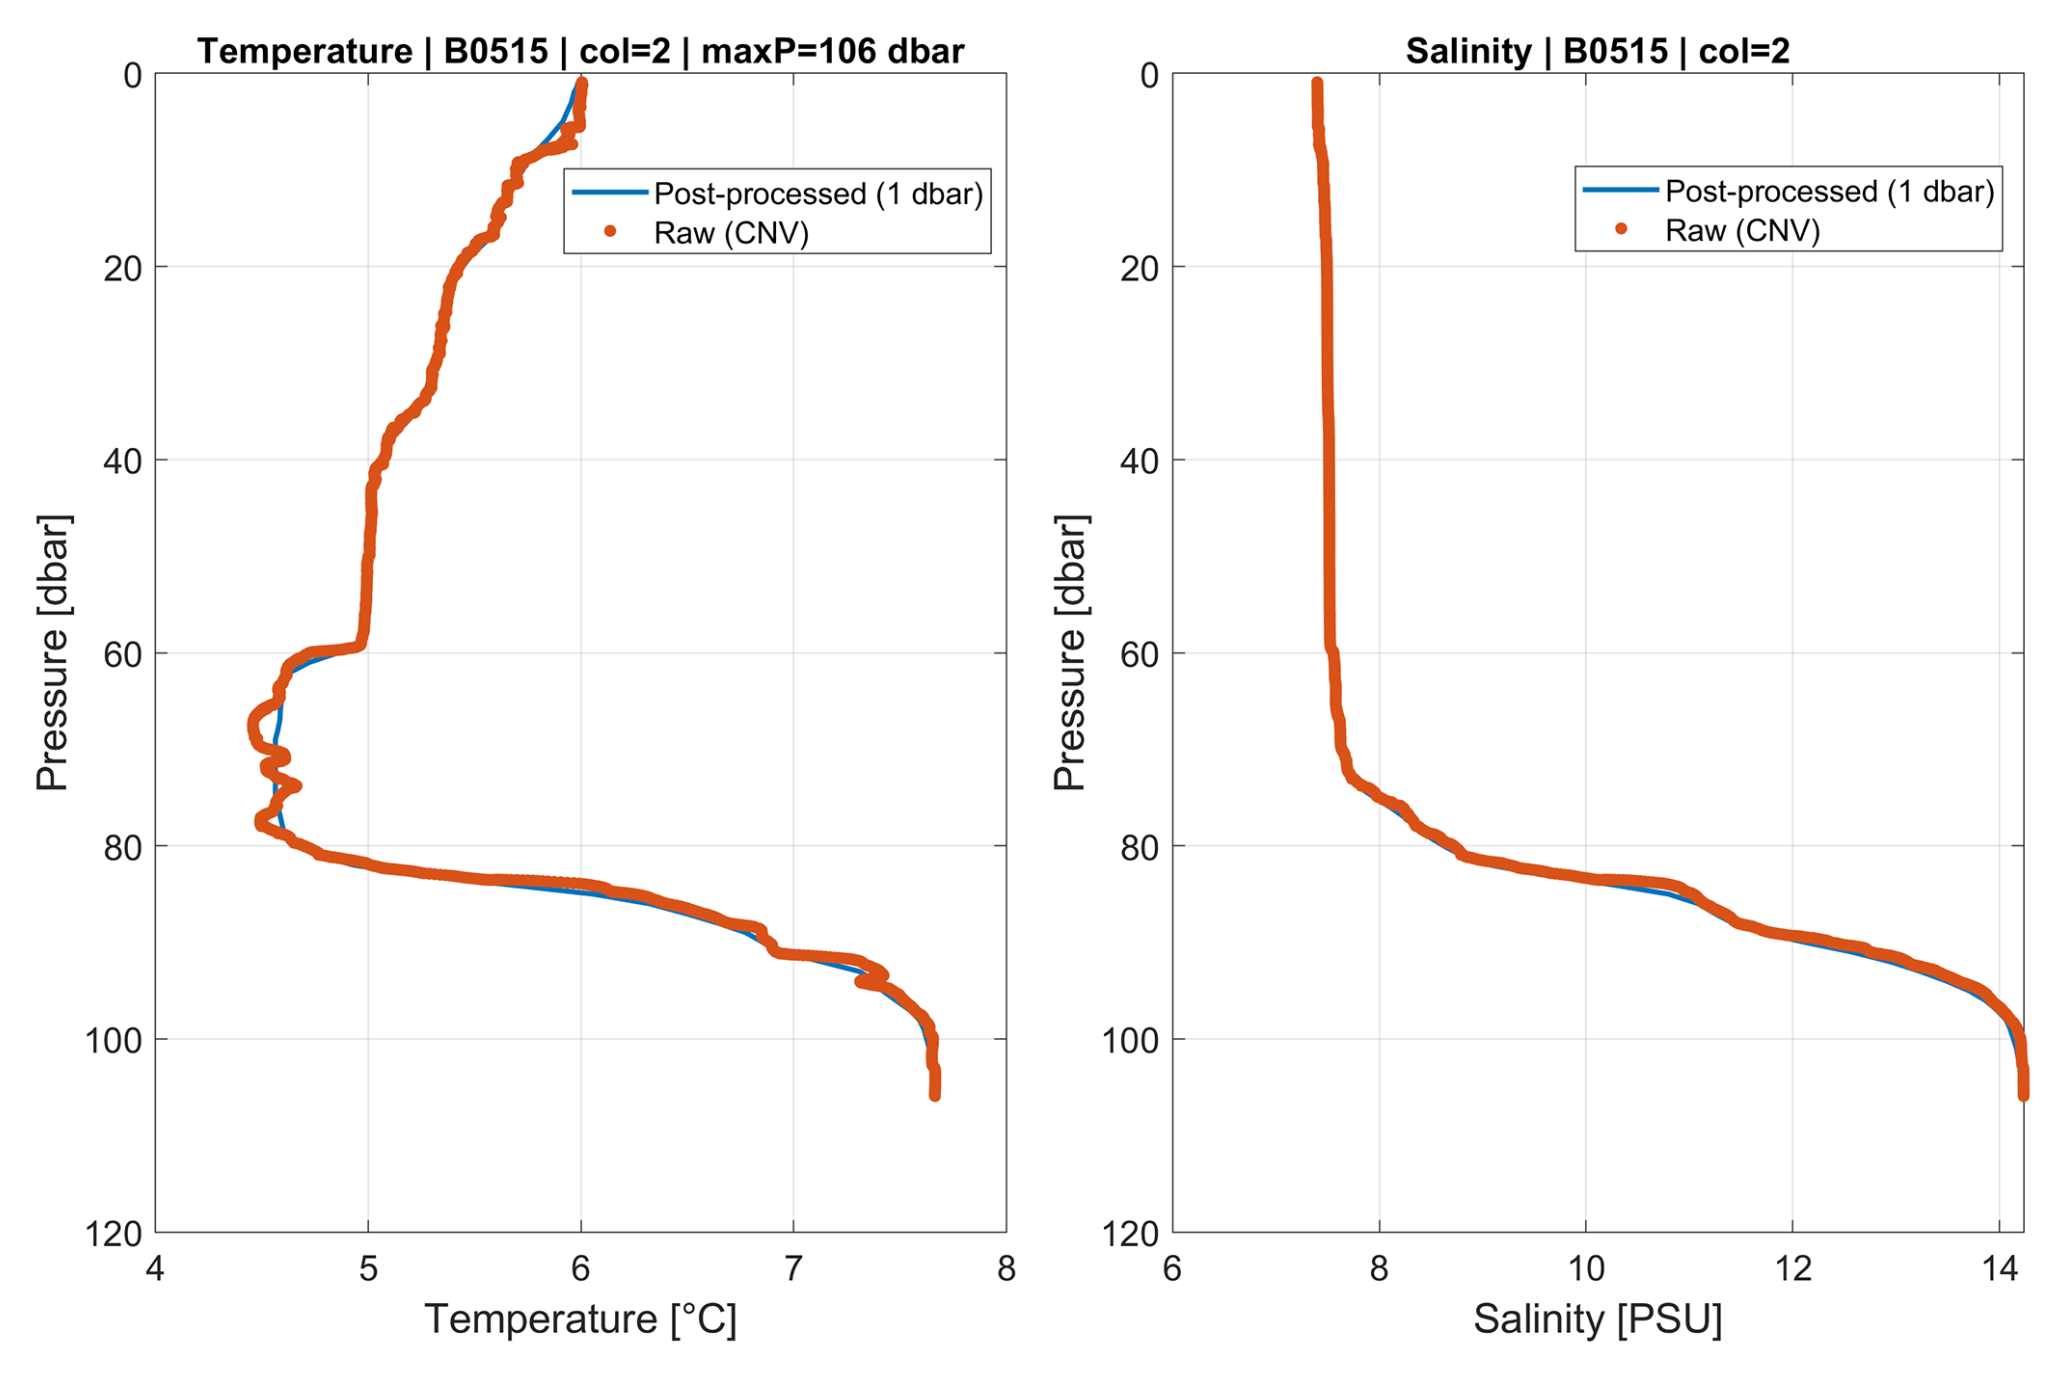
Figure 6Example of a raw CTD profile and the same profile after post-processing. Raw CNV samples (dots) and the 1 dbar product (solid line) are shown for temperature (°C) and salinity (PSU); pressure increases downward (dbar).
Postprocessing starts with an automated MATLAB routine that imports CNV/TXT files and parses station metadata (date/time and geographic coordinates). Raw samples are first screened for common acquisition artefacts: records with negative pressure (p<0 dbar) are removed, and instrument fill values (e.g., −9.990 × 10⁻²⁹) are converted to NaN. Each cast is then sorted by pressure, repeated pressure levels are consolidated by averaging, and the profile is standardized onto a uniform vertical axis (0–199 dbar, Δp=1 dbar) using local averaging within a ±1 dbar window around each target level. Temperature and salinity are denoised using a running median filter (movmedian, window size typically 20 samples, omitting NaNs). Profiles with missing or invalid metadata are excluded by masking casts where longitude/latitude/time are equal to 0 or NaN. For the gridded processing stream, navigation is additionally quality-checked using broad domain limits (lon 13–22° E, lat 54.2–58° N) and a despiking rule that flags positions deviating by more than 0.1° from a 5-point running median; flagged lon/lat/time values are propagated as a common mask across variables.
Hydrographic variables are further checked for physically implausible values and unstable segments. Salinity is constrained to a plausible range (7.2–21), with values outside this range set to NaN. The adopted salinity range is based on the long-term hydrographic characteristics of the southern Baltic Sea. These limits are consistent with regional climatological conditions and historical monitoring data. The vast majority of observations throughout the 28-year record fall within this interval. Values outside the adopted range therefore represent clear outliers attributable to measurement artefacts or processing errors rather than physically plausible hydrographic conditions. A single conservative salinity range was applied uniformly across all basins as part of the automated QC pipeline, to avoid spatially dependent filtering and ensure consistent treatment of all profiles.
A static-stability check based on TEOS-10 density was applied. Adjacent levels implying any density inversion (Δρ<0 kg m−3) were flagged as unstable, and the corresponding salinity values were set to NaN. Profiles are truncated below the first occurrence of ≥5 consecutive NaNs in salinity, and casts exhibiting an abrupt salinity decrease larger than 0.01 between adjacent levels are terminated from that depth downward. For the gridded product, an additional optional vertical smoothing step is applied using a moving mean (smoothdata, window 10) to reduce residual small-scale noise while retaining vertical gradients.
After automated QC and postprocessing, profiles are aggregated into structured arrays, enabling downstream climatological and statistical analyses. The processed data are routinely visualized to identify potential outliers and systematic artefacts, and a manual review complements the automated steps, particularly for casts affected by strong ship motion or transient sensor behaviour. To illustrate the effect of our pipeline, Fig. 6 contrasts a raw cast with its post-processed counterpart for cruise B0515. This cast was selected as a stress-test case with pronounced motion/sensor transients near the halocline. Residual small-scale noise visible in the raw data is only lightly attenuated by design: our post-processing is intentionally conservative to preserve mesoscale gradients and avoid over-smoothing that could bias stratification metrics.
The dataset is delivered in two interoperable formats. First, as a single MATLAB container in which each cruise is stored as a separate field of the top-level struct IOPAN. Cruise fields follow the BMMYY convention (B – Baltic; MM – month; YY – year; e.g., B0523 for May 2023) and contain gridded, column-oriented hydrographic profile matrices together with a shared vertical coordinate. Second, the same cruise-wise products are exported as a collection of per-cruise NetCDF files (IOPAN_BMMYY.nc) compliant with the CF-1.8 conventions and the discrete sampling geometry (DSG) profile representation, with depth × profile hydrographic variables and profile-wise (1-D) geolocation and time coordinates.
MATLAB (IOPAN_Baltic.mat)
For each cruise:
-
Pressure, Temperature, Salinity: size N × M, where rows are 1 dbar levels and columns are individual profiles.
-
Pressure_string: size N × 1, the common vertical grid (e.g., 0 : 1 : 199 dbar).
-
Time (MATLAB datenum), Longitude, Latitude: stored as size N × M for convenience and co-registration with the hydrographic matrices; within each profile (column) these values are constant with depth (i.e., they represent station-level metadata repeated along the vertical). Timestamps represent MATLAB serial days (fractional part = time of day) and should be interpreted as UTC unless stated otherwise.
NetCDF (IOPAN_BMMYY.nc)
The NetCDF files use a compact CF-DSG layout in which:
-
Hydrographic variables are stored on a common pressure grid (dbar) as 2-D arrays with dimensions (pressure, profile), with 1-D coordinates lon(profile), lat(profile), and time(profile).
-
Coordinates lon(profile) and lat(profile) are stored as 1-D profile-wise variables.
-
Time is provided as a 1-D CF-compliant coordinate time(profile) (e.g., seconds since 1 January 1970 00:00:00 UTC, calendar = gregorian).
During export, the station-level time and position are obtained from the MATLAB N × M matrices by extracting a representative value per profile (e.g., the first finite value in each column).
A metadata block accompanies the cruise fields and documents units, creation timestamp, ownership and contact point. Missing or filtered values are encoded as NaN in MATLAB and as _FillValue in NetCDF; pruning during processing removes empty profiles (all-NaN columns) and ensures consistent dimensions within each cruise. The processing and export workflow is implemented in the MATLAB scripts build_IOPAN_from_CNV_TXT.m and write_IOPAN_to_netcdf.m (Zenodo, https://doi.org/10.5281/zenodo.17814769, Rak, 2025a).
Basin-scale vertical structure along the repeat transect is summarized in Fig. 7. In all four basins, the upper ∼ 40–60 dbar are dominated by seasonally varying, relatively fresh surface waters, as reflected in the broad temperature envelope and modest salinity range. Below the seasonal thermocline, temperature variability is much reduced, while salinity exhibits a pronounced step-like increase across the permanent halocline. Below ∼ 50 dbar, salinity variability increases markedly compared with the upper layer. This depth range corresponds to the permanent halocline that separates the seasonally mixed brackish surface waters from deeper, more saline North Sea–derived water masses. Variability at depth is therefore governed by episodic inflow events, lateral spreading of saline intrusions, and isopycnal mixing, while the upper layer is more frequently homogenized by wind-driven and seasonal mixing processes. The mean halocline depth and deep salinity systematically change along the section: in the shallow Arkona Basin stratification is generally confined to the upper water column; however, during inflow periods this basin often contains some of the highest salinities observed along the section and can exhibit a pronounced halocline extending from ∼ 30 dbar to the bottom. Farther east, the Bornholm Basin and Słupsk Furrow display strong, well-defined haloclines overlying more saline deep waters. Toward the Gdańsk Basin, deep salinities decrease and the halocline shoals slightly, consistent with progressive dilution and mixing of North Sea inflow waters along their downstream pathway. The shaded ranges highlight that, despite substantial interannual and event-scale variability, the basic vertical structure and along-transect contrasts between basins are robust features of the 28-year record.
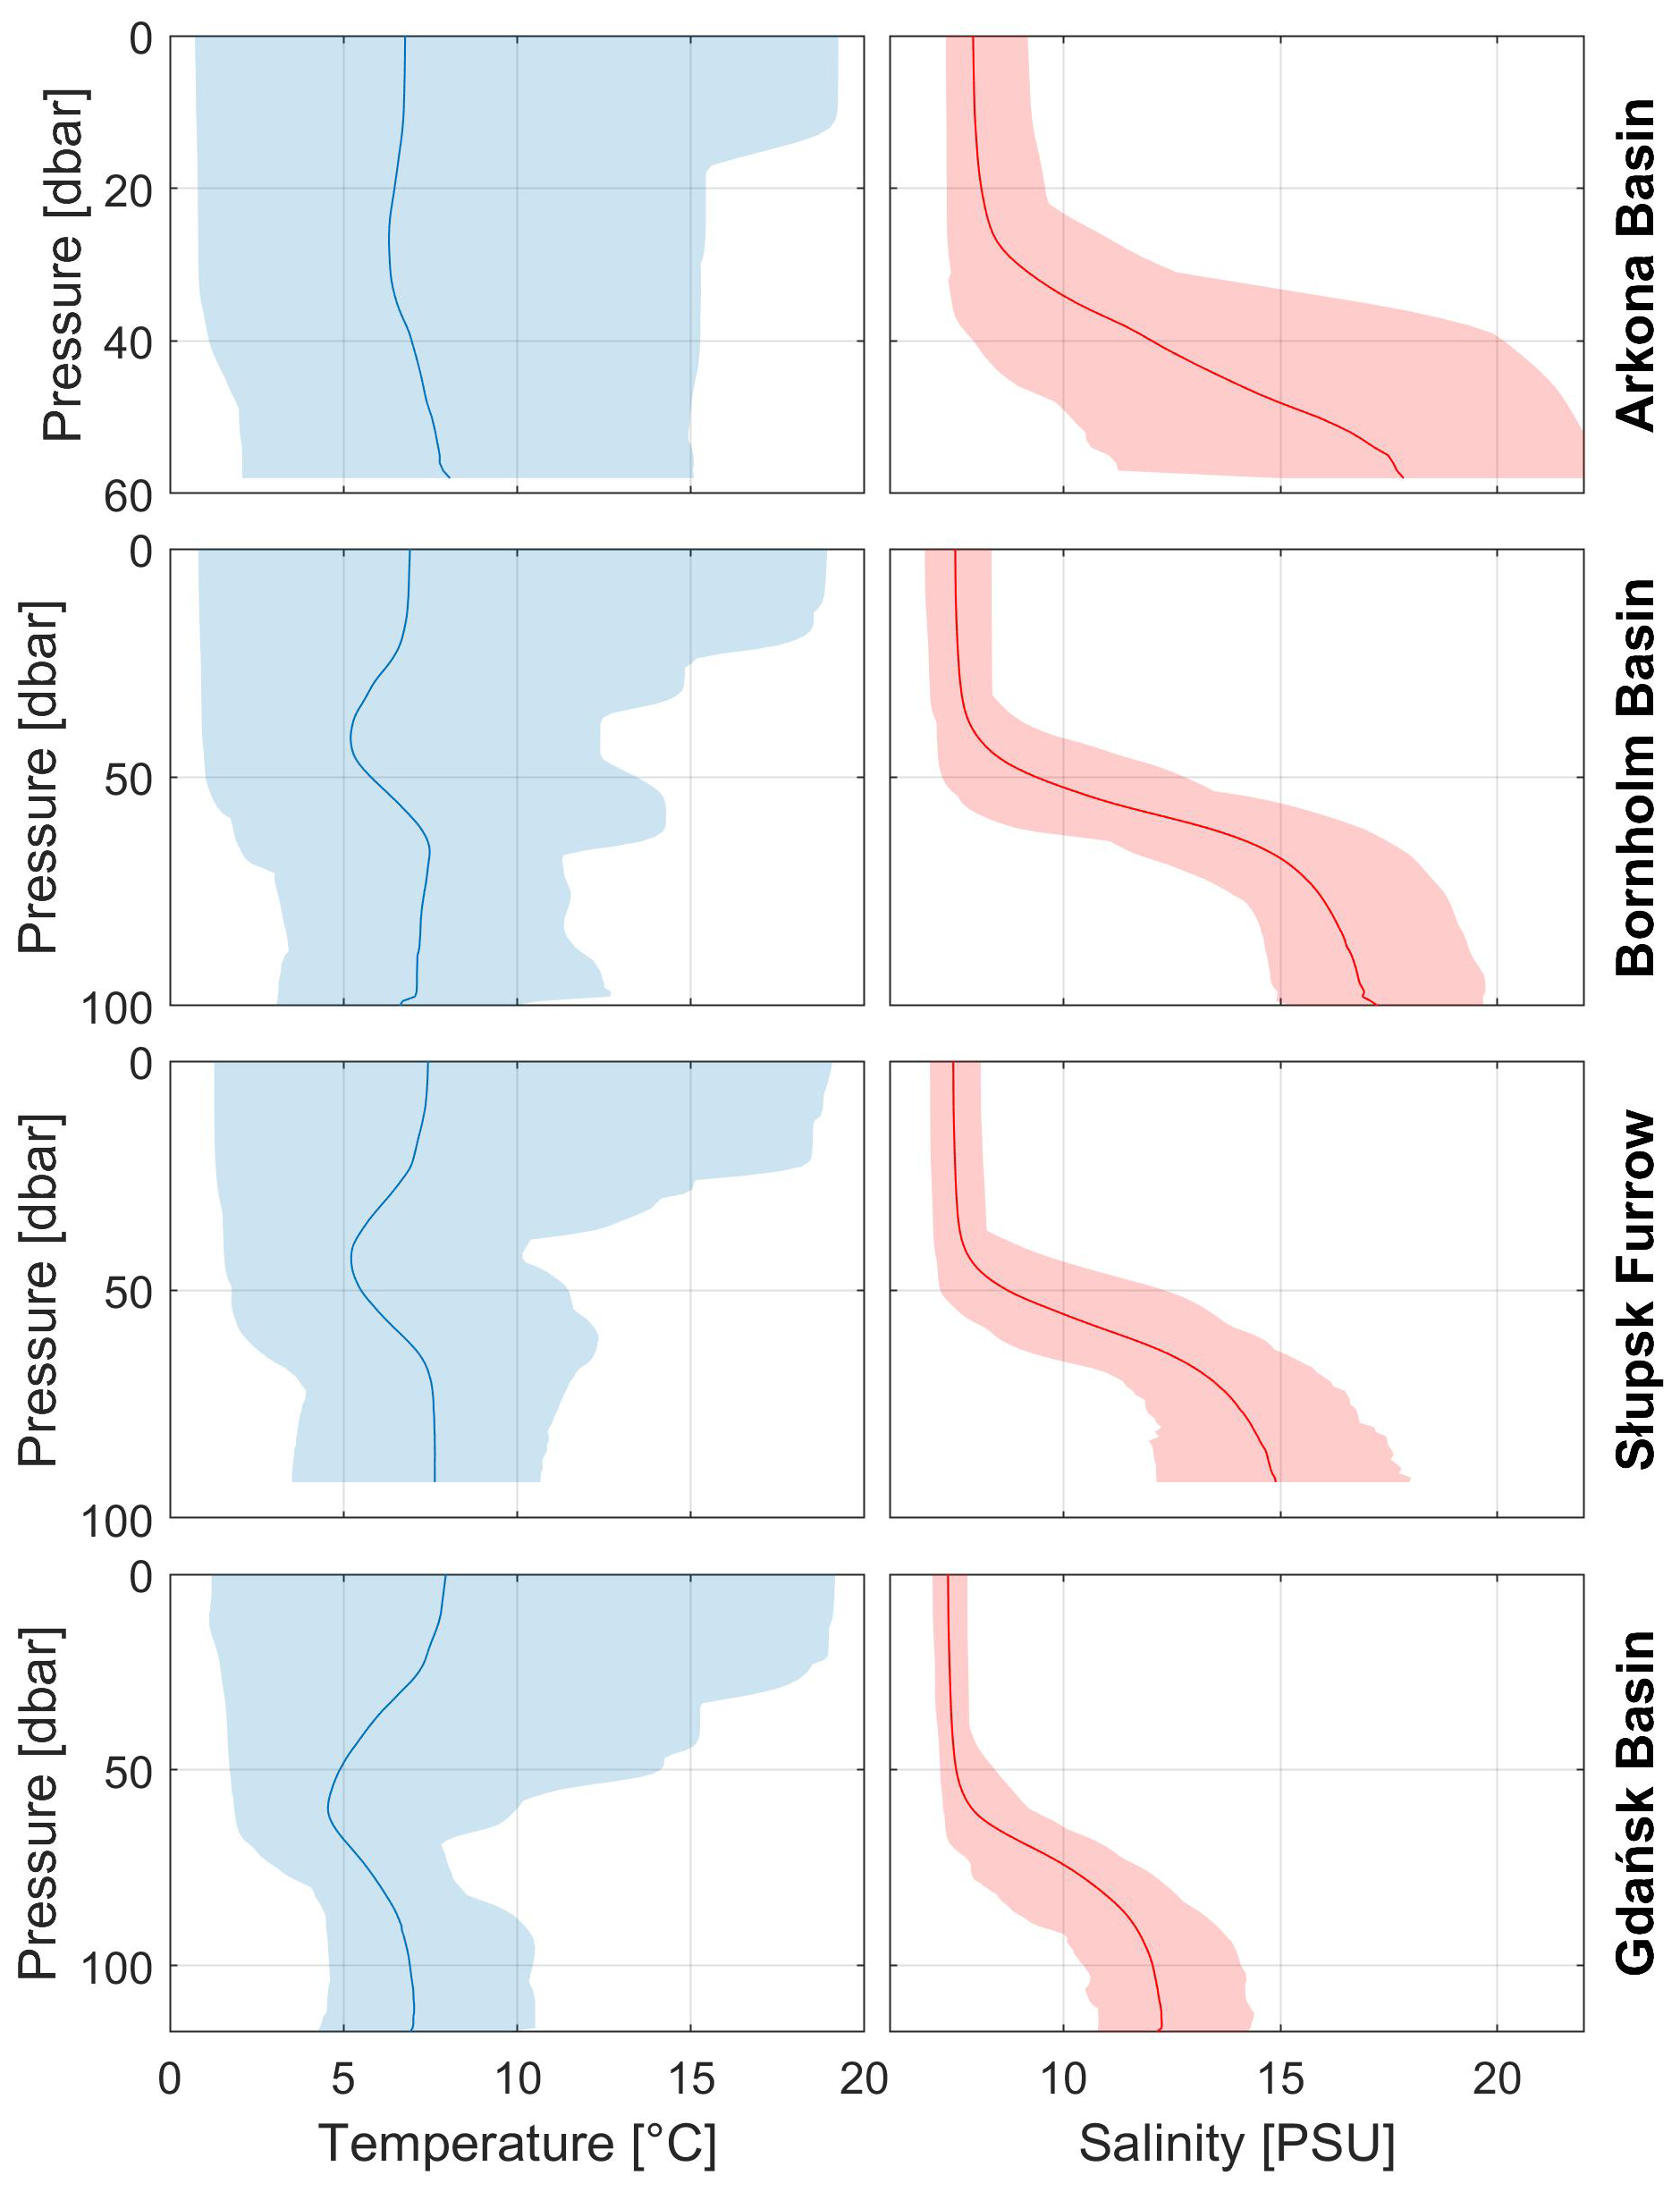
Figure 7Basin-mean vertical profiles of temperature and salinity in the Arkona Basin, Bornholm Basin, Słupsk Furrow and Gdańsk Basin derived from all CTD casts collected along the repeat section between 1997 and 2024. Solid lines indicate the multi-year mean and shaded envelopes the full range (min–max) across all cruises.
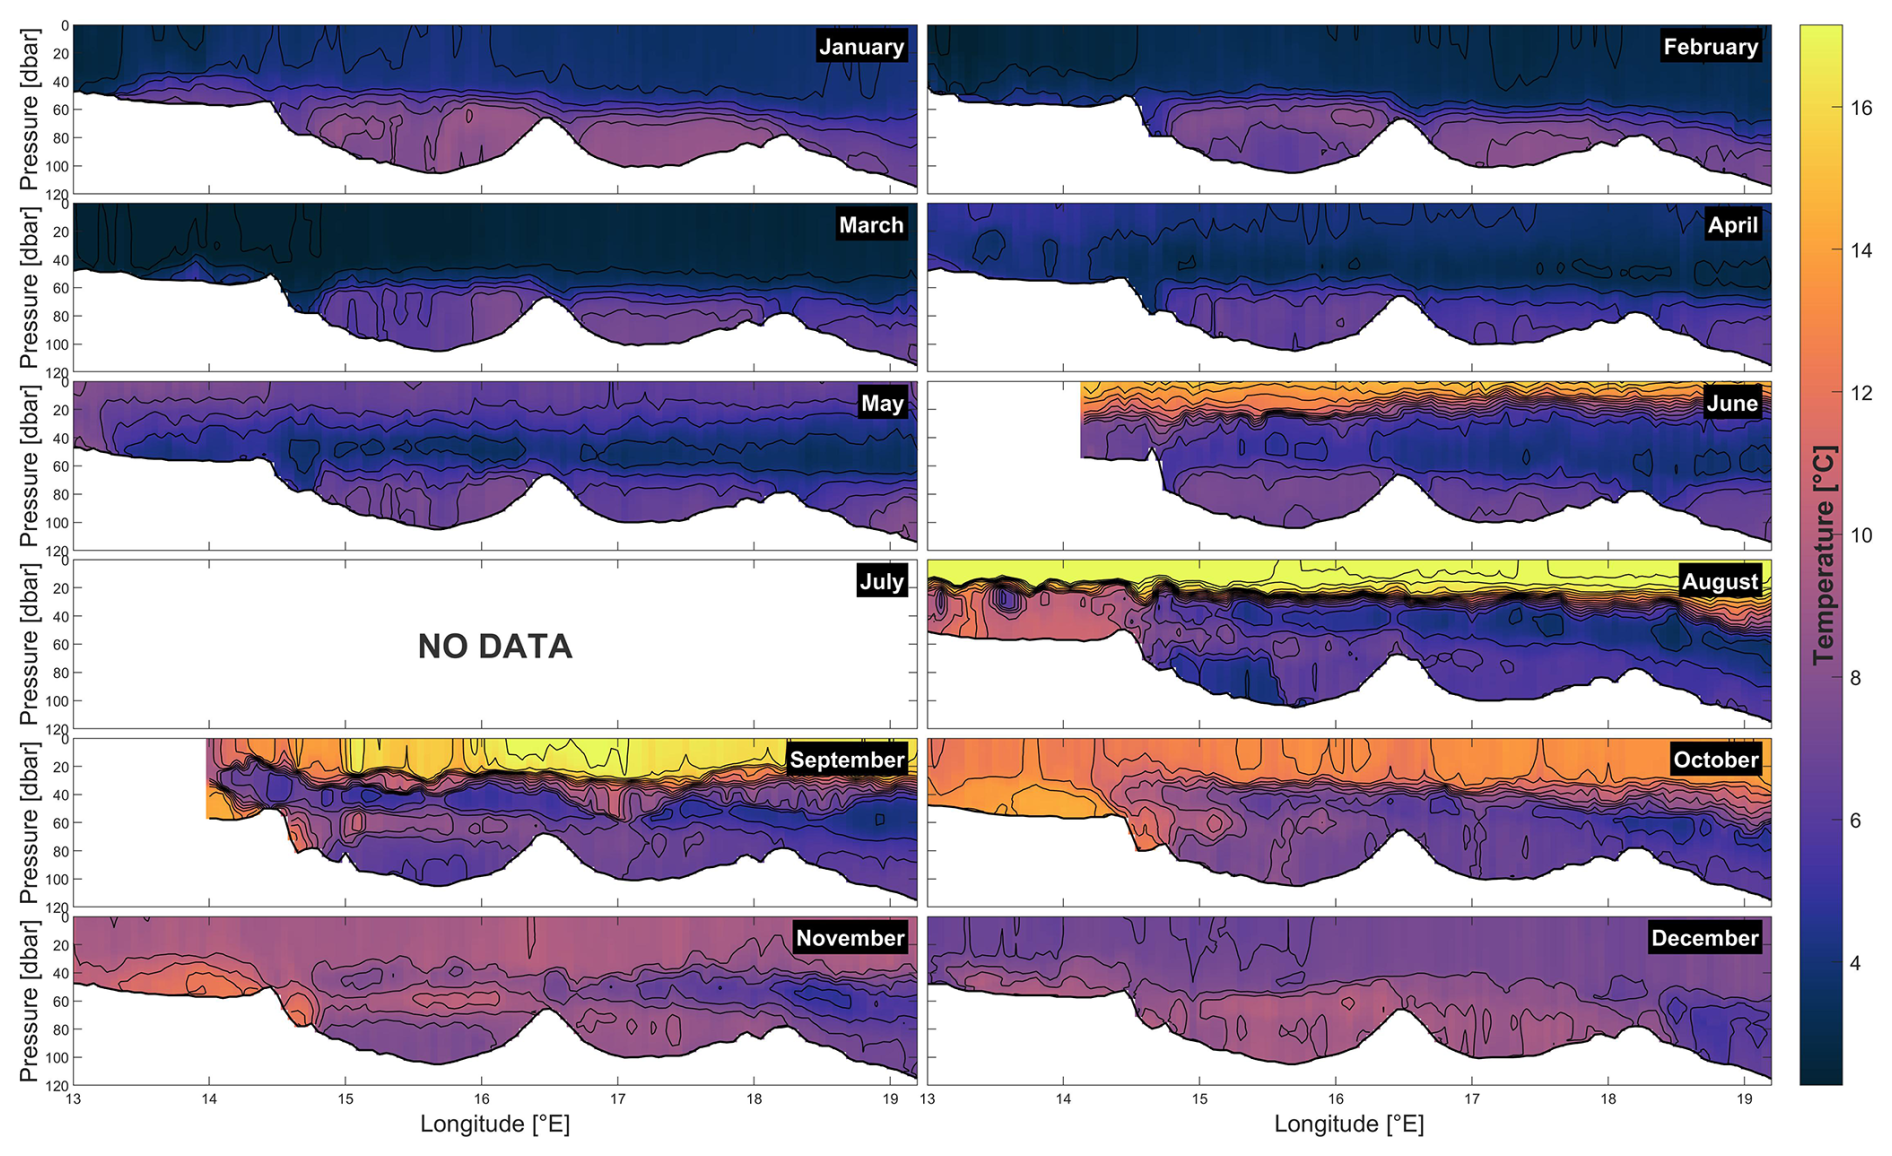
Figure 8Monthly mean temperature sections (January–December) along the Baltic transect as a function of longitude (°E) and pressure (dbar).
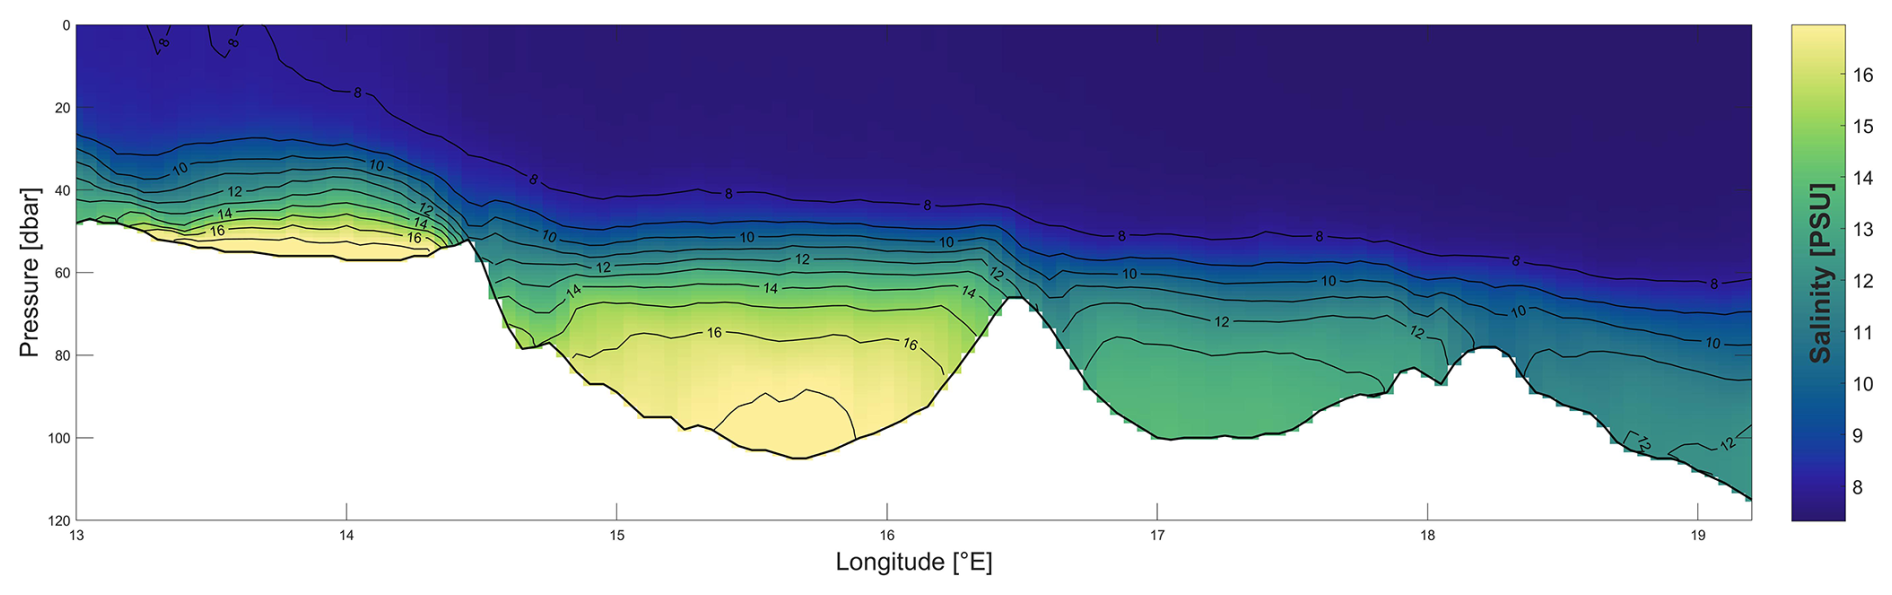
Figure 9Mean salinity (1997–2024) section along the repeat Baltic transect, shown as a function of longitude (° E) and pressure (dbar).
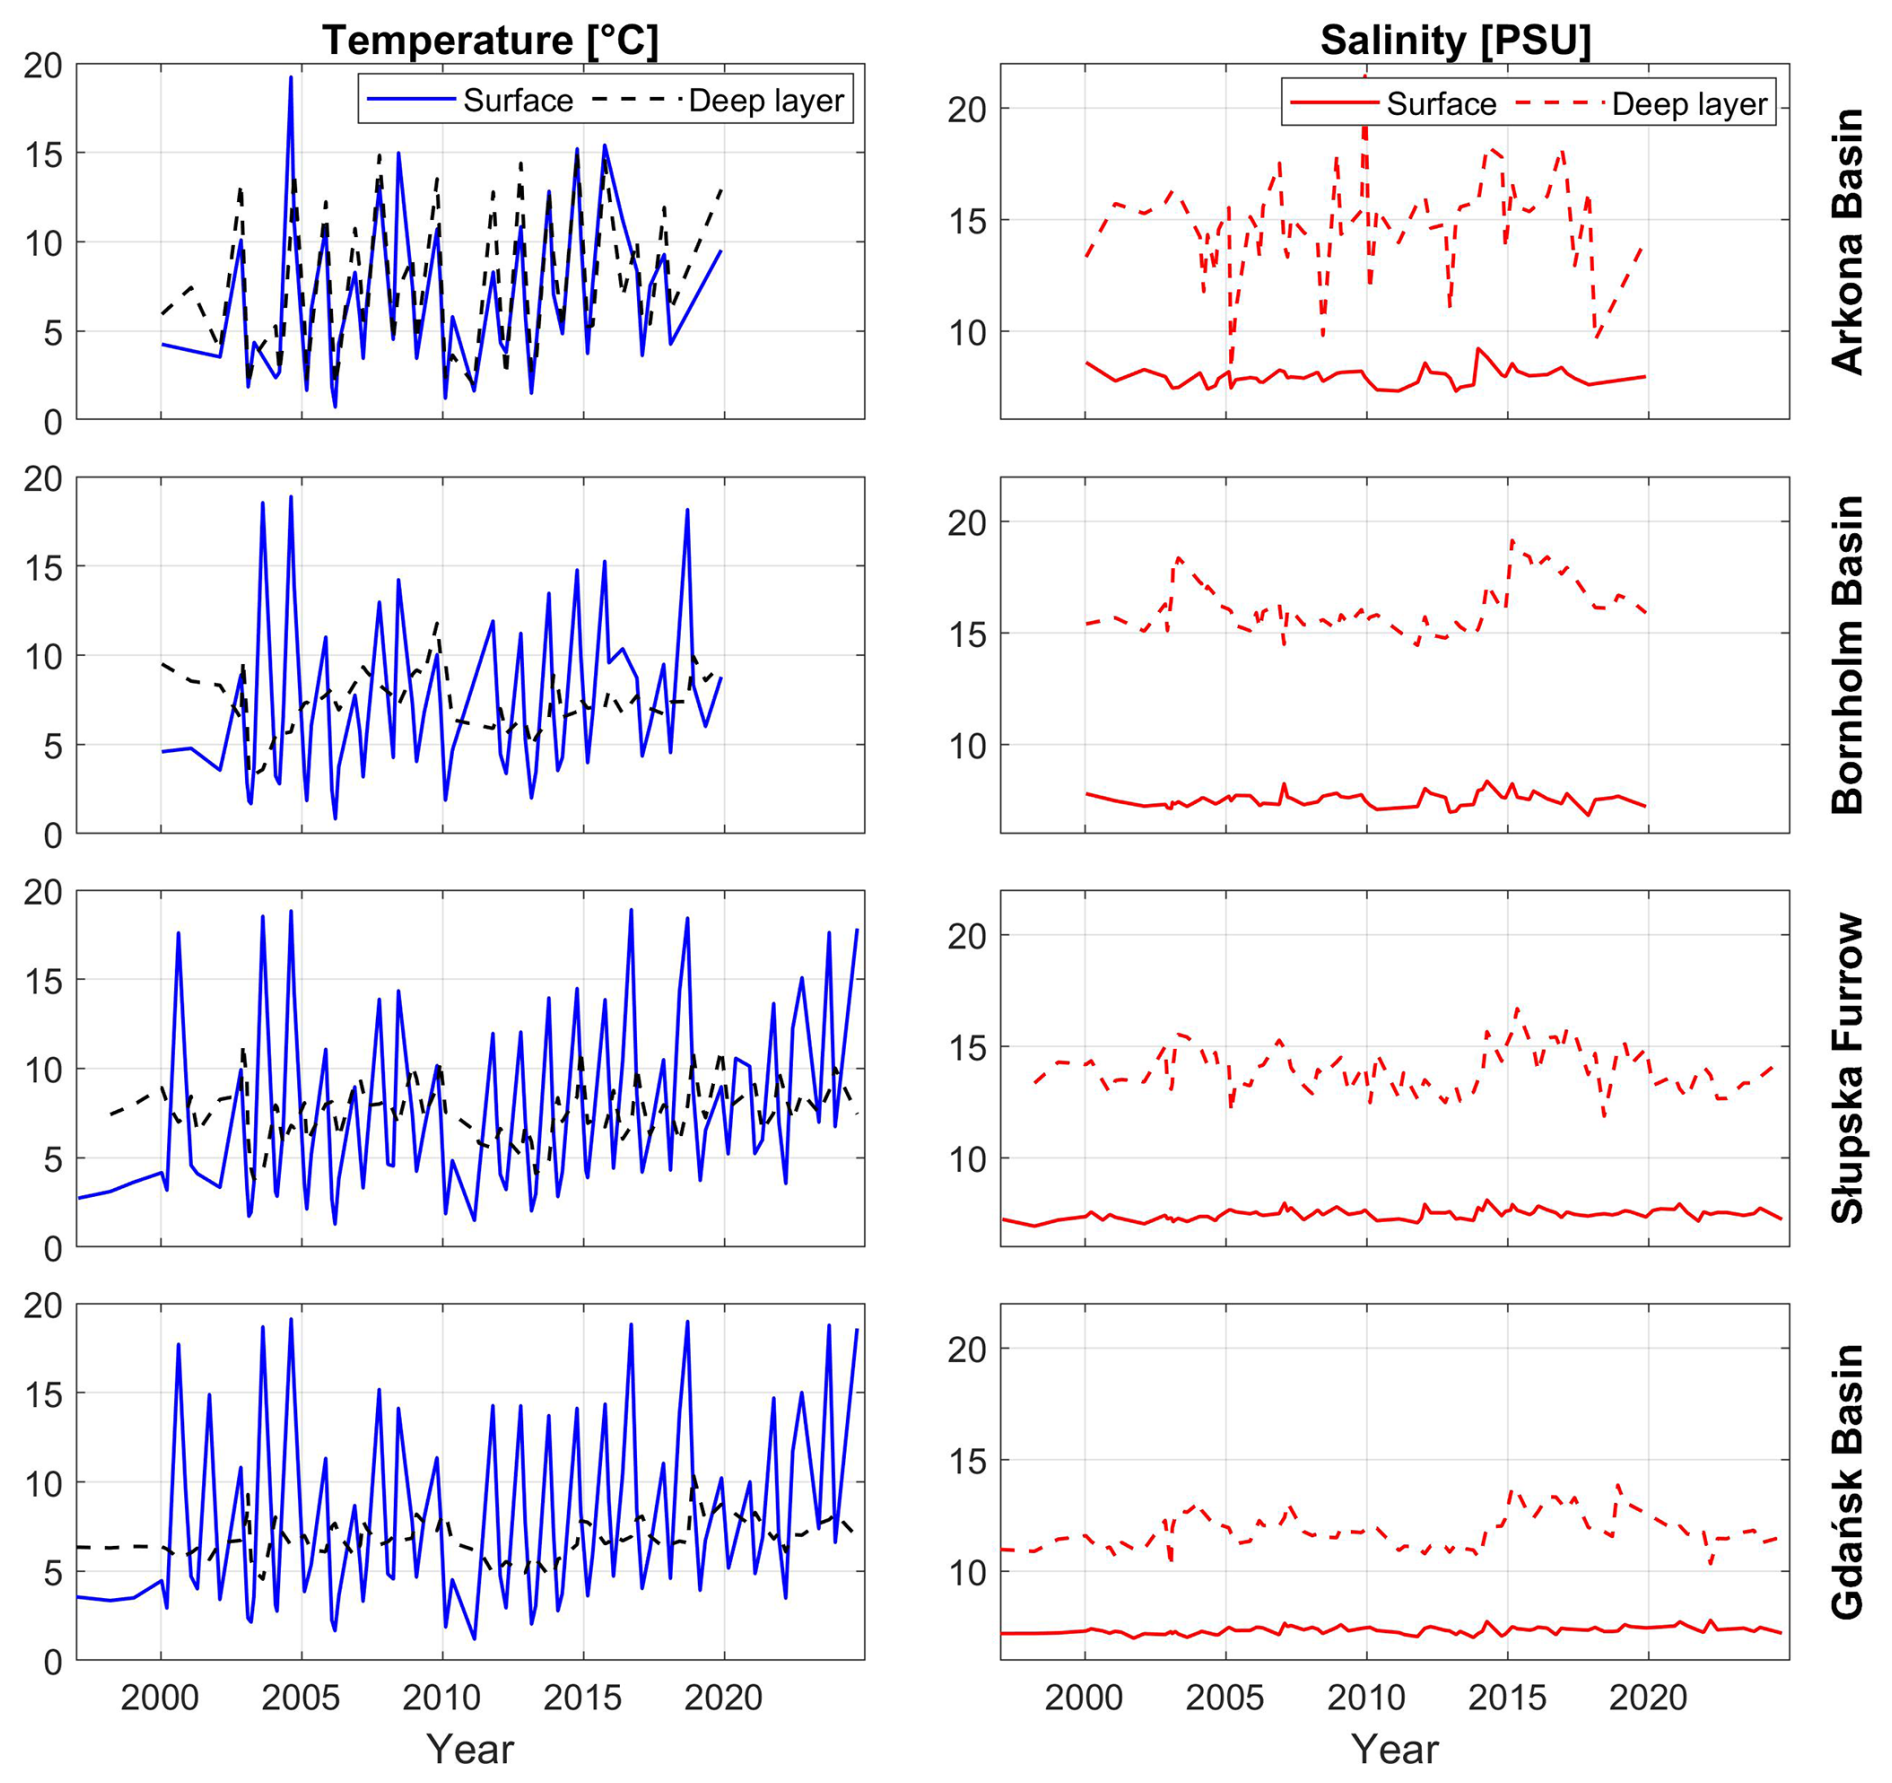
Figure 10Basin-mean time series of layer-averaged temperature (left) and salinity (right) in the Arkona, Bornholm, Słupsk Furrow and Gdańsk basins for 1997–2024. Solid lines show the surface layer (0–10 dbar), while dashed lines show a bottom layer defined uniformly from 20 dbar above the bottom down to the bottom in each basin.
Monthly mean temperature sections (January–December) along the repeat Baltic transect are shown in Fig. 8. The 12-panel climatology highlights the pronounced seasonal cycle of the upper water column, with winter cooling and a deep, relatively homogeneous mixed layer followed by spring onset of stratification, summer surface warming and development of a shallow thermocline, and an autumnal erosion of stratification. A persistent dichothermal (cold intermediate) layer is visible from approximately April through November, reflecting winter-cooled water retained below the seasonal thermocline while the surface layer warms. Along-transect differences reflect the changing basin geometry and hydrographic regime from the Arkona Basin through the Bornholm Basin and Słupsk Furrow toward the Gdańsk Basin, and the month-to-month variability in deeper layers suggests that advection plays a key role in shaping the subsurface temperature field along the monitoring section.
In contrast to temperature, salinity does not exhibit a pronounced seasonal cycle. Surface salinity variability is mainly influenced by episodic freshwater input, vertical mixing, and horizontal advection, while deeper salinity variability reflects irregular advective and mixing processes rather than seasonally phase-locked forcing. Because salinity variability is dominated by these irregular and spatially structured processes rather than a repeatable annual cycle, its large-scale characteristics are more clearly represented by the multi-year mean section. Figure 9 shows the multi-year mean salinity section along the repeat southern Baltic transect. The upper ∼ 40–60 dbar is dominated by relatively fresh surface waters, while a distinct step-like increase in salinity below marks the permanent halocline; this halocline is most pronounced over the Bornholm Basin and Słupsk Furrow, which also host the highest salinities in deeper layers. Farther east toward the Gdańsk Basin, deep salinity decreases and the halocline structure changes along the section, reflecting the along-transect hydrographic contrasts and downstream modification of more saline waters.
Complementary basin-mean time series of layer-averaged temperature and salinity (Fig. 10) illustrate how this vertical structure evolves in time. The 0–10 dbar surface layer is characterized by large interannual variability in temperature and relatively modest changes in salinity, reflecting the combined influence of atmospheric forcing, riverine input, and local mixing. In contrast, the bottom layer (defined consistently as the interval from 20 dbar above the seabed down to the bottom) varies more episodically, with pronounced salinity and temperature anomalies associated with inflow-driven ventilation events and subsequent stagnation periods. Along the transect, deep-layer signals are particularly pronounced in the Arkona Basin and in the deeper Bornholm Basin and Słupsk Furrow, and become progressively attenuated toward the Gdańsk Basin, in line with the downstream transformation of dense inflow waters inferred from the vertical structure in Fig. 7. The comparatively strong deep-layer signals observed in the Arkona Basin reflect its position as the first basin reached by North Sea inflow waters entering the Baltic. These newly arrived waters retain high salinity and oxygen content and have undergone limited dilution or mixing, leading to pronounced anomalies. Farther east, in the Bornholm Basin and Słupsk Furrow, the same inflow waters are progressively modified through mixing and entrainment (Bulczak and Rak, 2026), which reduces the amplitude of deep-layer signals.
The full dataset (Rak, 2025b) is available from https://doi.org/10.48457/IOPAN.2025.531 in two formats: a single MATLAB file (IOPAN_Baltic.mat) containing all cruises as the IOPAN struct, and a collection of per-cruise, CF-1.8-compliant NetCDF files (IOPAN_BMMYY.nc, one file per cruise). Both formats provide the same gridded hydrographic fields and associated metadata, enabling straightforward use in MATLAB, Python and other common analysis environments.
The MATLAB scripts used to build the processed IOPAN structure from raw exports and to generate the CF-1.8 NetCDF products (build_IOPAN_from_CNV_TXT.m and write_IOPAN_to_netcdf.m) are archived on Zenodo (https://doi.org/10.5281/zenodo.17814769, Rak, 2025a). The processed dataset is available from IOPAN GeoNetwork (https://doi.org/10.48457/IOPAN.2025.531, Rak, 2025b).
We present a unique, quality-controlled CTD dataset spanning 1997–2024, assembled along a repeat section from the Arkona Basin through the Bornholm Basin and Słupsk Furrow to the Gdańsk Basin. In total, 96 cruises and 55 032 profiles were collected, providing rare temporal continuity and along-track resolution for the southern Baltic Sea.
The observing system evolved from high-rate towed profiling to a hybrid approach that, since 2020, also includes vertical station casts with a nominal ≤5 nm spacing. Instrumentation progressed from Guildline 87104 and Idronaut OS316 to Sea-Bird SBE49 and SBE19plus, and most recently Idronaut OS316Plus – choices driven by sampling-rate capability and robust telemetry. Together, these modes and sensors yield horizontal scales of ∼ 200–500 m at ∼ 4 kn in 60–120 m depths and enable both down- and up-cast sampling in tow.
A consistent processing chain – standardized parsing of CNV/TXT, robust time/position handling, binning to 1 dbar, median filtering, automated geolocation QC, and pruning of incomplete casts – ensures inter-comparability through time and across instruments. The final distribution package (IOPAN_Baltic.mat) provides cruise-wise fields (BMMYY) with 1 dbar vertical grids, co-registered P–T–S matrices, and MATLAB serial-day time stamps (UTC), ready for analysis and conversion.
We explicitly acknowledge limitations that inform interpretation: reduced summer coverage due to Arctic commitments; tow-induced horizontal uncertainty comparable to the local depth (with typical offsets ≈ 0.5 × depth; see Sect. “Instrument calibration and uncertainty budget”); and a marked post-2020 decline in sampling linked to the loss of the SBE49 towed system (May 2020) and COVID-19 constraints. These variations predominantly reflect instrument availability, logistics, and weather rather than changes in QC or processing.
Despite these constraints, the dataset fills a long-standing observational gap in the Polish EEZ, where long, high-resolution CTD time series have been scarce, thereby strengthening model validation, reanalysis, and process studies of stratification, mixing, and inflow-driven ventilation along hydraulic controls. The section also serves as a reference line for quality control and validation of Baltic Argo float profiles and other autonomous observations, anchoring their measurements in a well-characterized hydrographic framework.
By making the full resource publicly available in both MATLAB and CF-compliant NetCDF formats, with transparent methods and structure, we provide an immediate foundation for multi-scale studies – from seasonal to decadal variability in temperature and salinity to the propagation and transformation of North Sea inflows – and for data assimilation in regional models. Continued observations along this established transect, ideally with renewed high-rate towed capability and routine auxiliary sensors (e.g., dissolved oxygen, turbidity) leveraging the OS316Plus pass-through interface, will be essential for tracking ongoing hydrographic change and supporting evidence-based management in the Baltic Sea.
DR coordinated the compilation of the IOPAN CTD dataset, designed the processing and quality-control workflow, processed and quality-controlled the data, developed the MATLAB processing and NetCDF export scripts, and prepared the figures and the initial manuscript draft. All authors contributed to CTD data acquisition during the cruises, participated in discussions on data interpretation and quality assessment, reviewed the manuscript, and approved the final version.
The contact author has declared that none of the authors has any competing interests.
Publisher's note: Copernicus Publications remains neutral with regard to jurisdictional claims made in the text, published maps, institutional affiliations, or any other geographical representation in this paper. The authors bear the ultimate responsibility for providing appropriate place names. Views expressed in the text are those of the authors and do not necessarily reflect the views of the publisher.
We gratefully acknowledge the late Prof. dr hab. Jan Piechura for his invaluable contribution to the collection of the hydrographic data used in this study. We also thank the crew of R/V Oceania for their long-term support during the field campaigns.
This publication was supported by the project Argo-Poland, funded by the Polish Ministry of Science and Higher Education (grant no. 2022/WK/04).
This paper was edited by Davide Bonaldo and reviewed by Vanessa Cardin and one anonymous referee.
Bulczak, A. I. and Rak, D.: Propagation and mixing of the 2023/24 inflow: impacts on stratification and deep-water ventilation in the Southern Baltic Sea, Front. Mar. Sci., 13, 1629491, https://doi.org/10.3389/fmars.2026.1629491, 2026.
Bulczak, A. I., Nowak, K., Jakacki, J., Muzyka, M., Rak, D., and Walczowski, W.: Seasonal variability and long-term winter shoaling of the upper mixed layer in the southern Baltic Sea, Cont. Shelf Res., 276, 105232, https://doi.org/10.1016/j.csr.2024.105232, 2024.
Burchard, H., Lass, H.-U., Mohrholz, V., Umlauf, L., Sellschopp, J., Fiekas, V., Bolding, K., and Arneborg, L.: Dynamics of medium-intensity dense water plumes in the Arkona Basin, Western Baltic Sea, Ocean Dynam., 55, 391–402, https://doi.org/10.1007/s10236-005-0025-2, 2005.
Feistel, R., Nausch, G., and Wasmund, N. (Eds.): State and Evolution of the Baltic Sea, 1952–2005: A detailed 50-year survey of meteorology and climate, physics, chemistry, biology, and marine environment, Wiley, Hoboken, NJ, USA, https://doi.org/10.1002/9780470283134, 2008.
Fischer, H. and Matthäus, W.: The importance of the Drogden Sill in the Sound for major Baltic inflows, J. Mar. Syst., 9, 137–157, https://doi.org/10.1016/S0924-7963(96)00046-2, 1996.
Gröger, M., Dieterich, C., Haapala, J., Ho-Hagemann, H. T. M., Hagemann, S., Jakacki, J., May, W., Meier, H. E. M., Miller, P. A., Rutgersson, A., and Wu, L.: Coupled regional Earth system modeling in the Baltic Sea region, Earth Syst. Dynam., 12, 939–973, https://doi.org/10.5194/esd-12-939-2021, 2021.
Leppäranta, M. and Myrberg, K.: Physical Oceanography of the Baltic Sea, Springer, Berlin, Heidelberg, https://doi.org/10.1007/978-3-540-79703-6, 2009.
Matthäus, W. and Franck, H.: Characteristics of major Baltic inflows – A statistical analysis, Cont. Shelf Res., 12, 1375–1400, https://doi.org/10.1016/0278-4343(92)90060-W, 1992.
Mohrholz, V.: Major Baltic inflow statistics – Revised, Front. Mar. Sci., 5, 384, https://doi.org/10.3389/fmars.2018.00384, 2018.
Mohrholz, V., Naumann, M., Nausch, G., Krüger, S., and Gräwe, U.: Fresh oxygen for the Baltic Sea – An exceptional saline inflow after a decade of stagnation, J. Mar. Syst., 148, 152–166, https://doi.org/10.1016/j.jmarsys.2015.03.005, 2015.
Omstedt, A., Elken, J., Lehmann, A., Leppäranta, M., Meier, H. E. M., Myrberg, K., and Rutgersson, A.: Progress in physical oceanography of the Baltic Sea during the 2003–2014 period, Prog. Oceanogr., 128, 139–171, https://doi.org/10.1016/j.pocean.2014.08.010, 2014.
Rak, D.: The inflow in the Baltic Proper as recorded in January–February 2015, Oceanologia, 58, 241–247, https://doi.org/10.1016/j.oceano.2016.04.001, 2016.
Rak, D.: IOPAN Baltic CTD processing and CF-1.8 NetCDF export (MATLAB) (Version 1.0.0), Zenodo [code], https://doi.org/10.5281/zenodo.17814769, 2025a.
Rak, D.: Southern Baltic Sea hydrographic CTD profiles along the Arkona–Bornholm–Słupsk–Gdańsk transect (1997–2024), IOPAN GeoNetwork [data set], https://doi.org/10.48457/IOPAN.2025.531, 2025b.
Rak, D. and Wieczorek, P.: Variability of temperature and salinity over the last decade in selected regions of the southern Baltic Sea, Oceanologia, 54, 339–354, https://doi.org/10.5697/oc.54-3.339, 2012.
Rak, D., Walczowski, W., Dzierzbicka-Głowacka, L., and Shchuka, S.: Dissolved oxygen variability in the southern Baltic Sea in 2013–2018, Oceanologia, 62, 525–537, https://doi.org/10.1016/j.oceano.2020.08.005, 2020.
Rak, D., Przyborska, A., Bulczak, A. I., and Dzierzbicka-Głowacka, L.: Energy fluxes and vertical heat transfer in the Southern Baltic Sea, Front. Mar. Sci., 11, 1365759, https://doi.org/10.3389/fmars.2024.1365759, 2024.
Reissmann, J. H., Burchard, H., Feistel, R., Hagen, E., Lass, H.-U., Mohrholz, V., Nausch, G., Umlauf, L., and Wieczorek, G.: Vertical mixing in the Baltic Sea and consequences for eutrophication – A review, Prog. Oceanogr., 82, 47–80, https://doi.org/10.1016/j.pocean.2007.10.004, 2009.
Stigebrandt, A. and Gustafsson, B.: The response of the Baltic Sea to climate change – Theory and observations, J. Sea Res., 49, 243–256, https://doi.org/10.1016/S1385-1101(03)00021-2, 2003.
Walczowski, W., Merchel, M., Rak, D., Wieczorek, P., and Goszczko, I.: Argo floats in the southern Baltic Sea, Oceanologia, 62, 478–488, https://doi.org/10.1016/j.oceano.2020.07.001, 2020.
- Abstract
- Introduction
- Study area and campaign design
- Instruments and measurement modes
- Dataset and methods
- Quality check and postprocessing of CTD data
- Data structure and export
- Basin-scale hydrographic structure and variability
- Data availability
- Code availability
- Conclusion
- Author contributions
- Competing interests
- Disclaimer
- Acknowledgements
- Financial support
- Review statement
- References