the Creative Commons Attribution 4.0 License.
the Creative Commons Attribution 4.0 License.
 | 19 Dec 2025
A long-term dataset of debris-flow and hydrometeorological observations from 1961 to 2024 in Jiangjia Ravine, China
Peng Cui
Lijun Su
Gordon G. D. Zhou
Kaiheng Hu
Fangqiang Wei
Yong Hong
Guoqiang Ou
Jun Zhang
Zhicheng Kang
Xiaojun Guo
Wei Zhong
Xiaoyu Li
Yaonan Zhang
Chao Shi
Hui Tang
The study of mechanisms of debris-flow formation and movement is constrained by the lack of comprehensive and long-term field monitoring data. In 1961, the Dongchuan Debris Flow Observation and Research Station (DDFORS) was established in the highly active debris-flow catchment of Jiangjia Ravine to conduct continuous field observations of debris flows. With the advancement of technology, more high-precision instruments have been employed to monitor the entire process of debris flows. This paper presents a unique and comprehensive dataset of debris-flow and hydrometeorological observations collected over a 64-year period (1961–2024) in Jiangjia Ravine, China. The dataset documents 17 001 surges for a total of 278 debris-flow events and encompasses detailed measurements of kinematic parameters of debris flow, including velocity, depth, and discharge, as well as physical–mechanical parameters, such as the particle size distribution of debris flow, yield stress, and viscosity of debris-flow slurry. It also incorporates the induced seismic data, providing insights into the dynamic characteristics of debris flows. Furthermore, it includes continuous records of rainfall at 1 min intervals, soil moisture, and suspended sediment concentrations at the catchment scale. This extensive dataset provides invaluable insights into the initiation, transportation, and deposition processes of debris flows. It can be utilized to analyze flow resistance and dynamic characteristics of debris flows, validate various computational models, investigate the effects of debris flows on channel morphology, and evaluate the impact of climate change on sediment transport within watersheds. The dataset is publicly accessible through the National Cryosphere Desert Data Center (NCDC; https://doi.org/10.12072/ncdc.ddfors.db6803.2025; https://doi.org/10.12072/ncdc.ddfors.db6804.2025; https://doi.org/10.12072/ncdc.ddfors.db6721.2025; https://doi.org/10.12072/ncdc.ddfors.db6720.2025; https://doi.org/10.12072/ncdc.ddfors.db6807.2025; https://doi.org/10.12072/ncdc.ddfors.db6719.2025; https://doi.org/10.12072/ncdc.ddfors.db6805.2025; https://doi.org/10.12072/ncdc.ddfors.db6716.2025; https://doi.org/10.12072/ncdc.ddfors.db6718.2025; https://doi.org/10.12072/ncdc.ddfors.db6802.2025; https://doi.org/10.12072/ncdc.ddfors.db6806.2025; Song et al., 2025a–k) and is organized into several categories to facilitate ease of use and analysis.
- Article
(22910 KB) - Full-text XML
- BibTeX
- EndNote


Debris flows are catastrophic mass movement phenomena that occur in mountainous regions, and they are characterized by their multiple surges, high velocity, high concentration of sediment, and destructive potential. These events pose a significant threat to human lives, infrastructure, and the natural environment. In situ debris-flow observation is crucial for improving our understanding of the triggering conditions (runoff-generated, landslide transition, etc.) and flow dynamics as well as for the development, calibration, and validation of debris-flow models (Berti et al., 2000; Marchi et al., 2002; Cui et al., 2005; McCoy et al., 2010; Suwa et al., 2011; Coviello et al., 2015). Direct field observations yield real-time data that capture the physical attributes and behavior of debris flows, such as the flow velocity, sediment concentration, and flow depth, which are not fully obtainable through remote sensing or modeling alone (LaHusen, 2005; Arattano and Marchi, 2008; Hübl and Mikoš, 2018; Hürlimann et al., 2019).
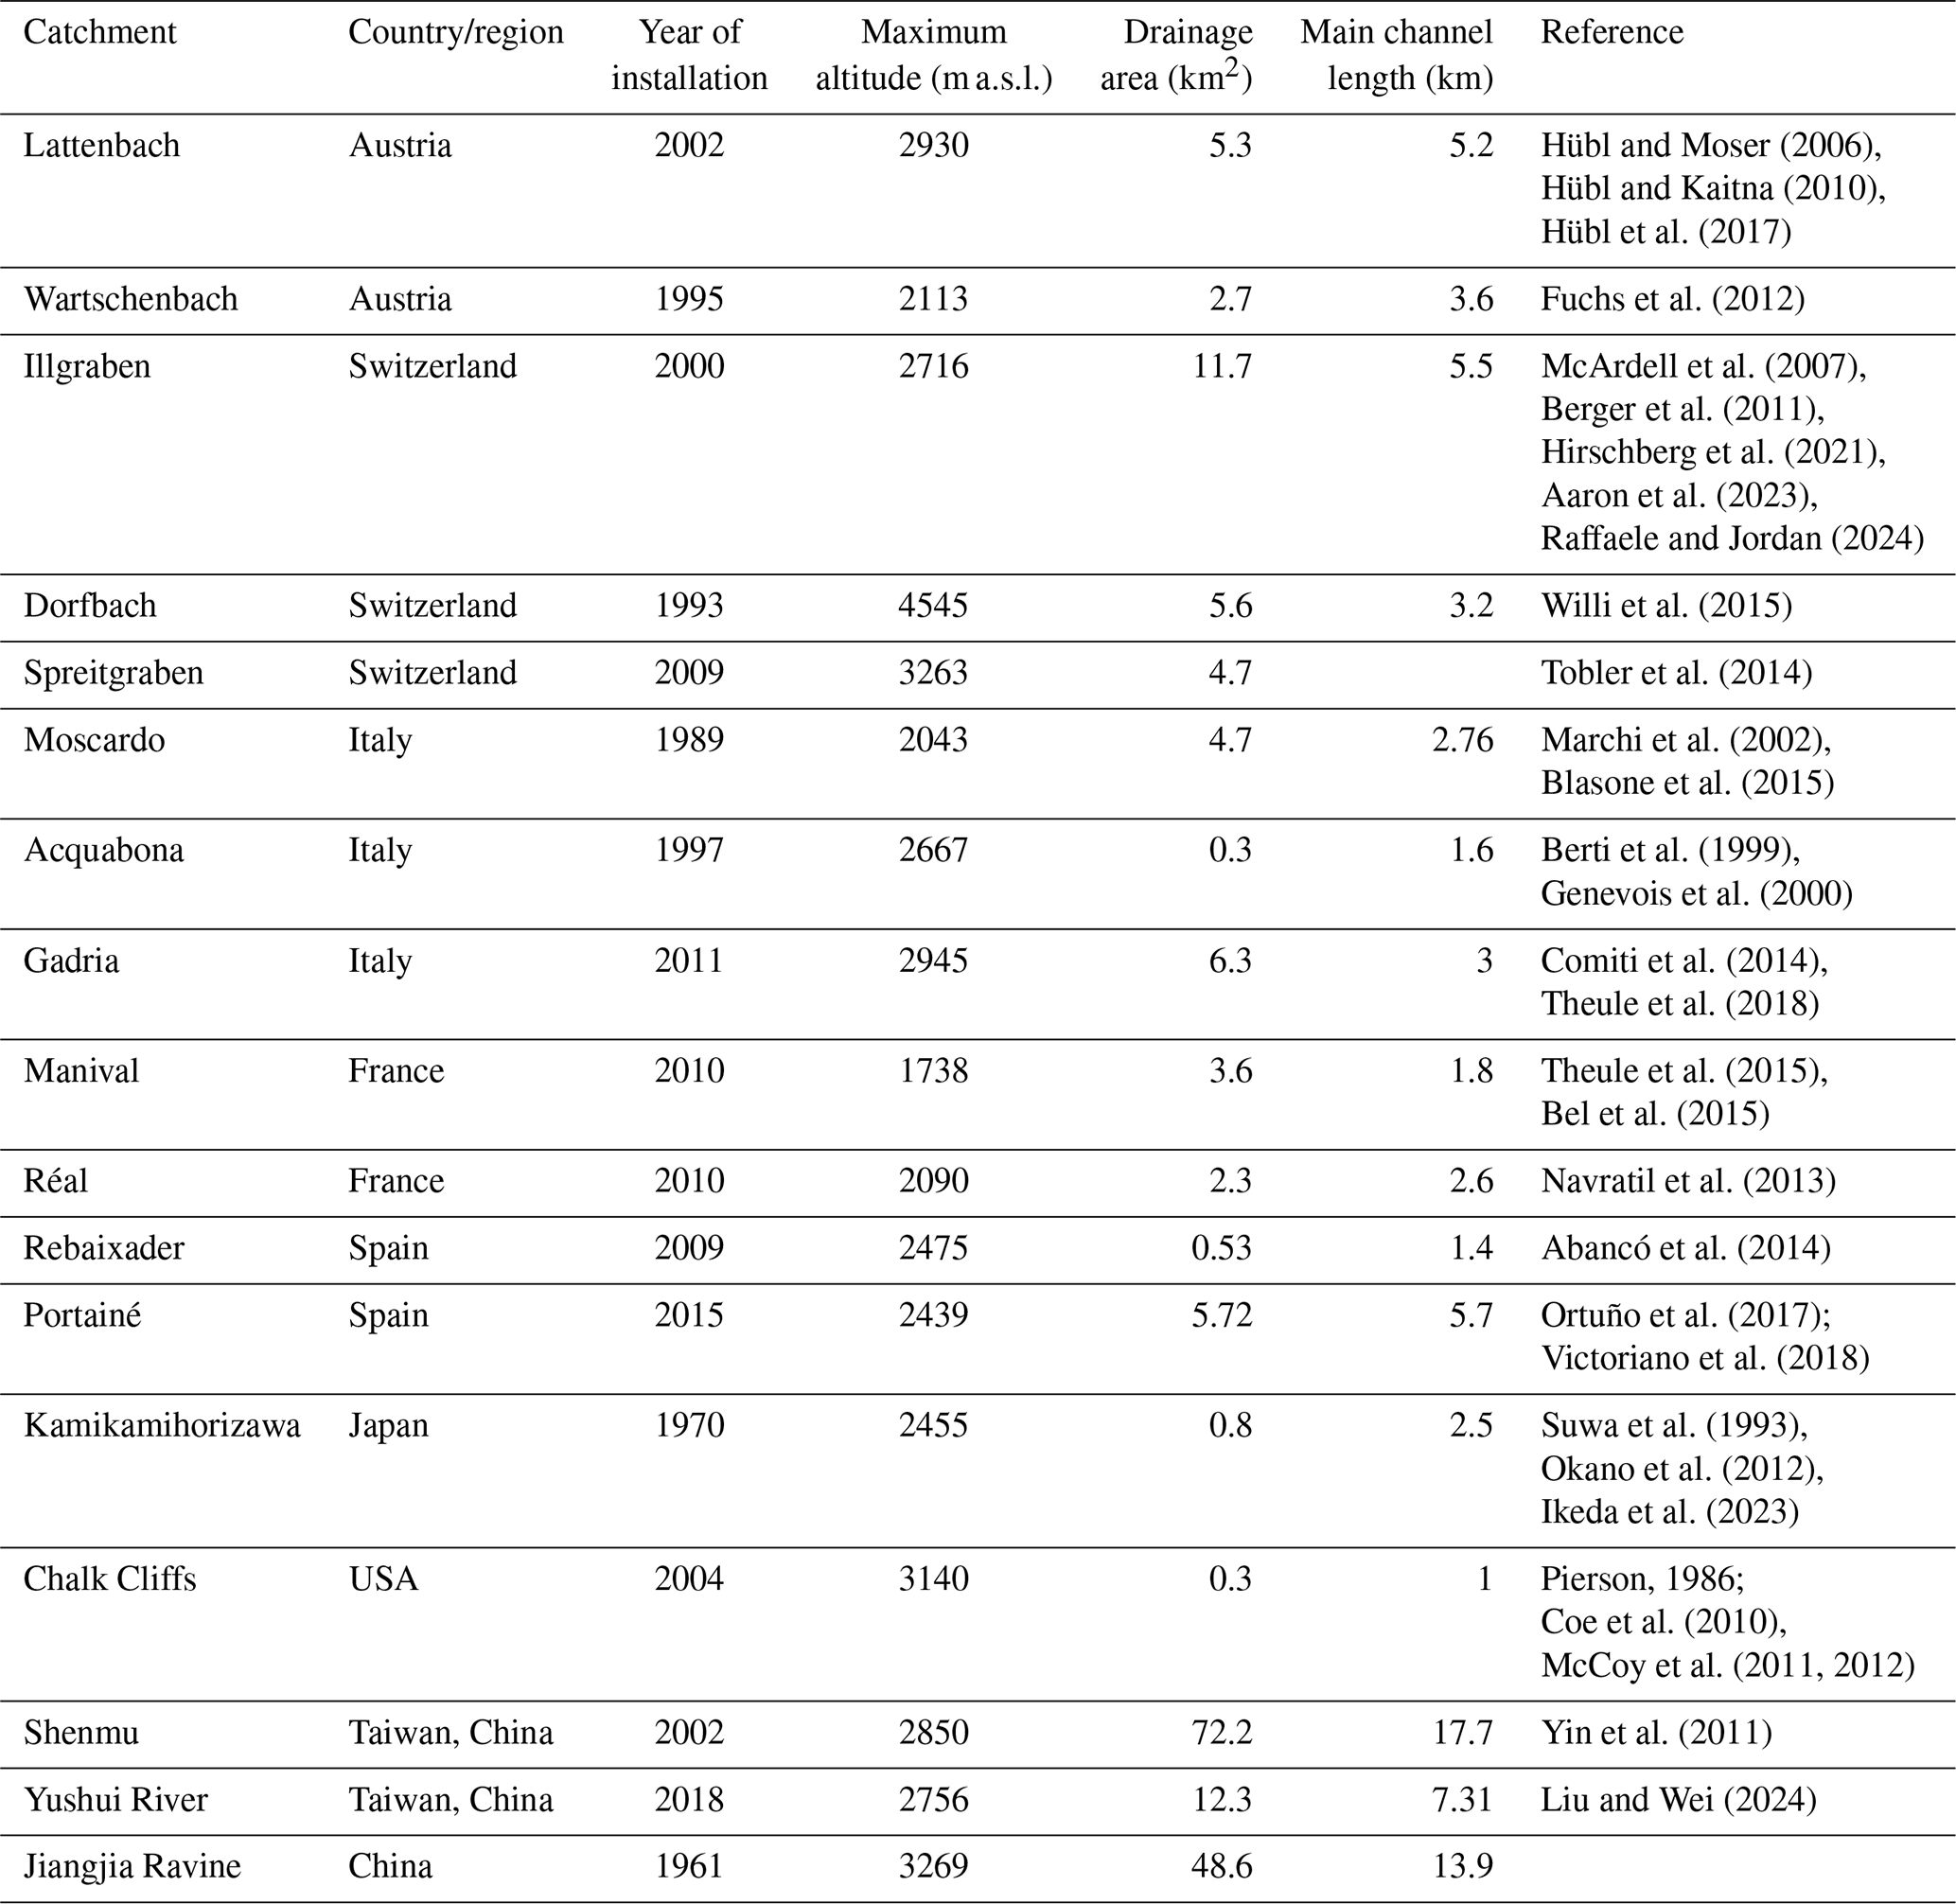
Several catchments prone to debris flows are equipped with observation systems (Table 1). In the European Alps, these include Lattenbach Creek and Wartschenbach Catchment in Austria (Hübl and Moser, 2006; Hübl and Kaitna, 2010; Fuchs et al., 2012; Hübl et al., 2017); Illgraben Catchment, Dorfbach Torrent, and Spreitgraben Catchment in Switzerland (McArdell et al., 2007; Berger et al., 2011; Tobler et al., 2014; Willi et al., 2015; Hirschberg et al., 2021; Aaron et al., 2023; Raffaele and Jordan, 2024); Moscardo Torrent, Acquabona Creek, and Gadria Basin in Italy (Berti et al., 1999; Genevois et al., 2000; Marchi et al., 2002; Comiti et al., 2014; Blasone et al., 2015; Theule et al., 2018); and Manival Torrent and Réal Torrent in France (Navratil et al., 2013; Theule et al., 2015; Bel et al., 2015). In the European Pyrenees, observation stations are located at Rebaixader Torrent and Portainé Catchment in Spain (Abancó et al., 2014; Hürlimann et al., 2013; Ortuño et al., 2017; Victoriano et al., 2018). In Asia, stations are situated at Kamikamihorizawa Creek on Mount Yake in Japan (Suwa et al., 1993; Okano et al., 2012; Ikeda et al., 2023), Shenmu Village and Yushui River (Yin et al., 2011; Liu and Wei, 2024), and Jiangjia Ravine in the Xiaojiang River catchment in China. Additionally, the Chalk Cliffs in the Colorado Rocky Mountains in the USA are continuously monitored (Pierson, 1986; Coe et al., 2010; McCoy et al., 2011, 2012). Most debris-flow monitoring systems have been operational for less than 30 years.
Despite the extensive investment in debris-flow monitoring, the availability of publicly accessible debris-flow datasets remains limited (Lapillonne et al., 2023). Among these datasets, notable examples include those from the Moscardo Torrent, Dorfbach Torrent, Spreitgraben Catchment, Lattenbach Creek, and Illgraben Catchment. Marchi and Crema (2018) compiled a dataset encompassing 809 debris-flow events across 537 basins in the mountainous regions of northeastern Italy from the mid-19th century to 2016, including debris-flow volume, year of occurrence, drainage basin area, and the geographical coordinates of the basin outlets. Marchi et al. (2021) later provided debris-flow hydrographs and rainfall data for 30 events recorded in the Moscardo Torrent between 1990 and 2019. Mitchell et al. (2022) published records of discharge, flow depth, and velocity for 11 debris-flow events in the Dorfbach Torrent, 1 event in the Spreitgraben Catchment, and 9 events at Lattenbach Creek. McArdell and Hirschberg (2020) documented dates and bulk volumes of 75 debris-flow events at the Illgraben Catchment from 2000 to 2007, while McArdell et al. (2023) extended this with debris-flow characteristics including occurrence date and time, peak-flow depth, peak-flow velocity, total volume, and bulk density for the period from 2019 to 2022. Hirschberg et al. (2024) contributed volumetric water content measurements, water level, and pressure data for a location along the Illgraben debris-flow channel during the 2022 debris-flow season. Fan et al. (2019) recorded the debris-flow events and their triggering rainfall that occurred from 2008 to 2017 in Longmen Mountains after the 2008 Wenchuan earthquake, with parts of the events comprising detailed discharge, flow depth, and density. Wang et al. (2022) provided the date of 186 debris flows and the triggering rainfall induced by the 2008 Wenchuan earthquake.
In addition, several published academic articles provide data sheets detailing the dynamic characteristics of debris-flow events. For example, Theule et al. (2018) presented dynamic parameters of debris-flow surges based on large-scale particle-image velocimetry (LSPIV) measurements; visual feature analyses from orthorectified images; and radar sensor data collected in 2011, 2013, 2014, and 2015. Lapillonne et al. (2023) summarized hydraulic features such as the Froude regime, velocity, flow level, and discharge for 35 debris-flow surges gathered between 2011 and 2020 in the Réal Torrent catchment. Comiti et al. (2014) provided the main characteristics of three debris flows that occurred in the Gadria Basin from 2011 to 2013. Additionally, Marchi et al. (2002, 2021) reported debris-flow velocity, peak discharge, and volume for 30 events between 1990 and 2019.
Overall, the majority of available datasets pertains to parameters of individual debris-flow events. There is a notable absence of long-term datasets that include both dynamic-process characteristics and physical–mechanical parameters, which are essential for a comprehensive dynamic analysis of debris-flow processes. Continuous field observations of debris flows in the highly active Jiangjia Ravine catchment commenced in 1961 and continue to be conducted by the Dongchuan Debris Flow Observation and Research Station (DDFORS) (Zhang, 1993; Cui et al., 2005; Hu et al., 2011a). The station was initially established by the Dongchuan Mining Bureau to mitigate the impacts of debris flows on river blockages and damage to the transportation infrastructure of the copper mines. It was later taken over by the Chinese Academy of Sciences in 1972. The observations at the station focus on the initiation, transportation, and deposition processes of debris flows. The data collected at this observatory now span 64 years, including starting–ending moments, velocity, depth, discharge, bulk density, particle size distribution, yield stress, and viscosity. In addition to these parameters, long-term measurements of rainfall, cross-sectional elevation, and other meteorological variables (such as soil moisture and suspended sediment content) have also been recorded. Furthermore, seismic information and video footage of debris flows have been collected in recent years. This dataset records the detailed flow characteristics of debris-flow surges, rather than merely the parameters of individual debris-flow events. This 64-year dataset documents 17 001 surges for a total of 278 debris-flow events, with a maximum surge-flow discharge and volume recorded at 8026 m3 s−1 and 249 112 m3, respectively.
This paper summarizes the debris-flow observations in Jiangjia Ravine and provides an overview of the core data, including kinematic parameters, seismic data, particle size distribution, yield stress, viscosity, and other related measurements. We begin by introducing the study area and then describe the methods used for data collection and processing. Illustrative examples of the dataset are provided to demonstrate its utility. Finally, we review several studies that have utilized this dataset and conclude with information on how to access the full dataset.
2.1 Geology
Jiangjia Ravine is located on the right-hand side of the Xiaojiang River, Yunnan Province, in China. The coordinates of the ravine are between 103°05′46′′–103°13′01′′ E and 26°13′16′′–26°17′13′′ N. The elevation ranges from 1088 to a maximum of 3269 m a.s.l. (meters above sea level), with an area of 48.6 km2 and a main gully length of 13.9 km. It is situated within the Xiaojiang Fault Zone, one of the most active fault systems on the southeastern margin of the Tibetan Plateau. The region is characterized by active neotectonic movements and intense seismic activity. The rocks are intersected by three fault systems trending north–south, northeast, and northwest (Wu et al., 1990). This region is characterized by intense neotectonic activity, resulting in frequent and severe earthquakes, with Intensity IX to X events occurring almost every century. The sandstone and slate within this area are weak, highly susceptible to weathering, and easily fragmented. Approximately 80 % of the exposed rocks are highly fractured and slightly metamorphosed, serving as the primary source of material for debris flows (Zhang et al., 2023).
2.2 Geomorphology
The topography of the watershed is higher in the east (with the highest elevation of 3269 m) and lower in the west (with the lowest elevation of 1042 m). The shape of the watershed is wider in the east (about 7 km) and narrower in the west (about 2 km). The watershed is characterized by high mountains and steep slopes, with a relative elevation difference of approximately 500 m between the ridges and valleys (Fig. 1a). Areas with slopes exceeding 25° and 35° make up 55 % and 16 % of the total watershed area, respectively (Cui et al., 2005). Jiangjia Ravine contains more than 200 tributary gullies, including 154 incised gullies and 46 gullies. The main channel is divided into three sections, each with distinct morphological characteristics: (1) the erosion area, also known as the debris-flow-triggering zone, is 6.5 km long with an average slope of 11°; (2) the transportation area is 2.6 km long with an average slope of 4.9°; and (3) the deposition area, which is 4.8 km long, has an average slope of 3.7°. With the siltation of sediment in the main channel, the deposition area keeps increasing, while the transportation area keeps decreasing.

Figure 1Photos of the observation systems, including Jiangjia Ravine and station: (a) the observation systems in Jiangjia Ravine (satellite image obtained from https://data.cresda.cn/#/2dMap, last access: 3 March 2025); (b) aerial view of Jiangjia Ravine, with localized heavy rainfall captured at higher elevation (the terrain is deformed); (c) aerial view of the Dongchuan Debris Flow Observation and Research Station (DDFORS).
2.3 Climate
The climate of Jiangjia Ravine is characterized by distinct wet and dry seasons, along with a pronounced vertical climatic zonation (Chen, 1985). It can be divided into three climatic zones: (1) the subtropical dry, hot valley region, located at elevations below 1600 m a.s.l.; (2) the subtropical and warm temperate subhumid region, situated between 1600 and 2200 m a.s.l.; and (3) the temperate humid mountain region, found at elevations above 2200 m a.s.l. (Guo et al., 2012). The rainy season extends from May to October, during which more than 85 % of the annual rainfall occurs, while the dry season lasts from November to April, receiving less than 15 % of the yearly total (Scott and Wang, 2004). Heavy rains and thunderstorms are frequent in the rainy season, contributing to more than half of the annual precipitation. The heaviest rainfall typically occurs between 2500 and 3000 m a.s.l. Annual precipitation in the watershed increases with elevation, while evaporation decreases with rising elevation (Chen et al., 2011).
2.4 Soil and vegetation
The underlying soils in the region include torrid red soil, red soil, brown soil, yellow soil, and mountainous brown soil, corresponding to different zones. Croplands are mainly distributed on gentler hillslopes (<25°) near the divides and on the alluvial fan. Some steeper hillslopes are covered by sparse shrubs or grass, while the others are barren due to frequent failures (Yang et al., 2022).
Due to the weak lithology, crisscrossing faults, steep terrain, and sparse vegetation in the watershed, landslide and collapse activity is intense, covering an area that accounts for 61 % of the total watershed, storing 1.23×10⁹ m3 of loose solid material (Fig. 1b). Weathering-derived debris accounts for 70 %–80 % of the loose-material sources, while loose sedimentary deposits constitute 20 %–30 % of the total (Li and Wu, 1981). During the rainy season, debris flows frequently occur, with each event consisting of tens to hundreds of surges (Fig. 2a). These surges, known as surge flows, are characterized by a distinct head and body. Surge flows are typically separated by periods of flow interruption or quiescence. In contrast, when a debris flow persists for an extended period without noticeable surge features (such as a pronounced head), it is classified as a continuative flow (Kang, 1990). The ravine, now known as the “debris-flow museum” in China, offers optimal research conditions. It is the site where China's earliest prototype observations and research on debris flows were initiated, primarily to address the recurring river blockages caused by debris flows (up to 10 blockages in the year 1961) (Wu et al., 1990) (Fig. 2b). Initially, basic observational devices were installed in 1961, followed by the early-stage infrasound monitoring of debris flows (Zhang et al., 2004). Over the past 64 years, the site has developed into a comprehensive field laboratory for automated observation, experimentation, and instrument validation (Fig. 1c). More information on DDFORS and its debris-flow monitoring can be found in Cui et al. (2005) and Kang et al. (2004).
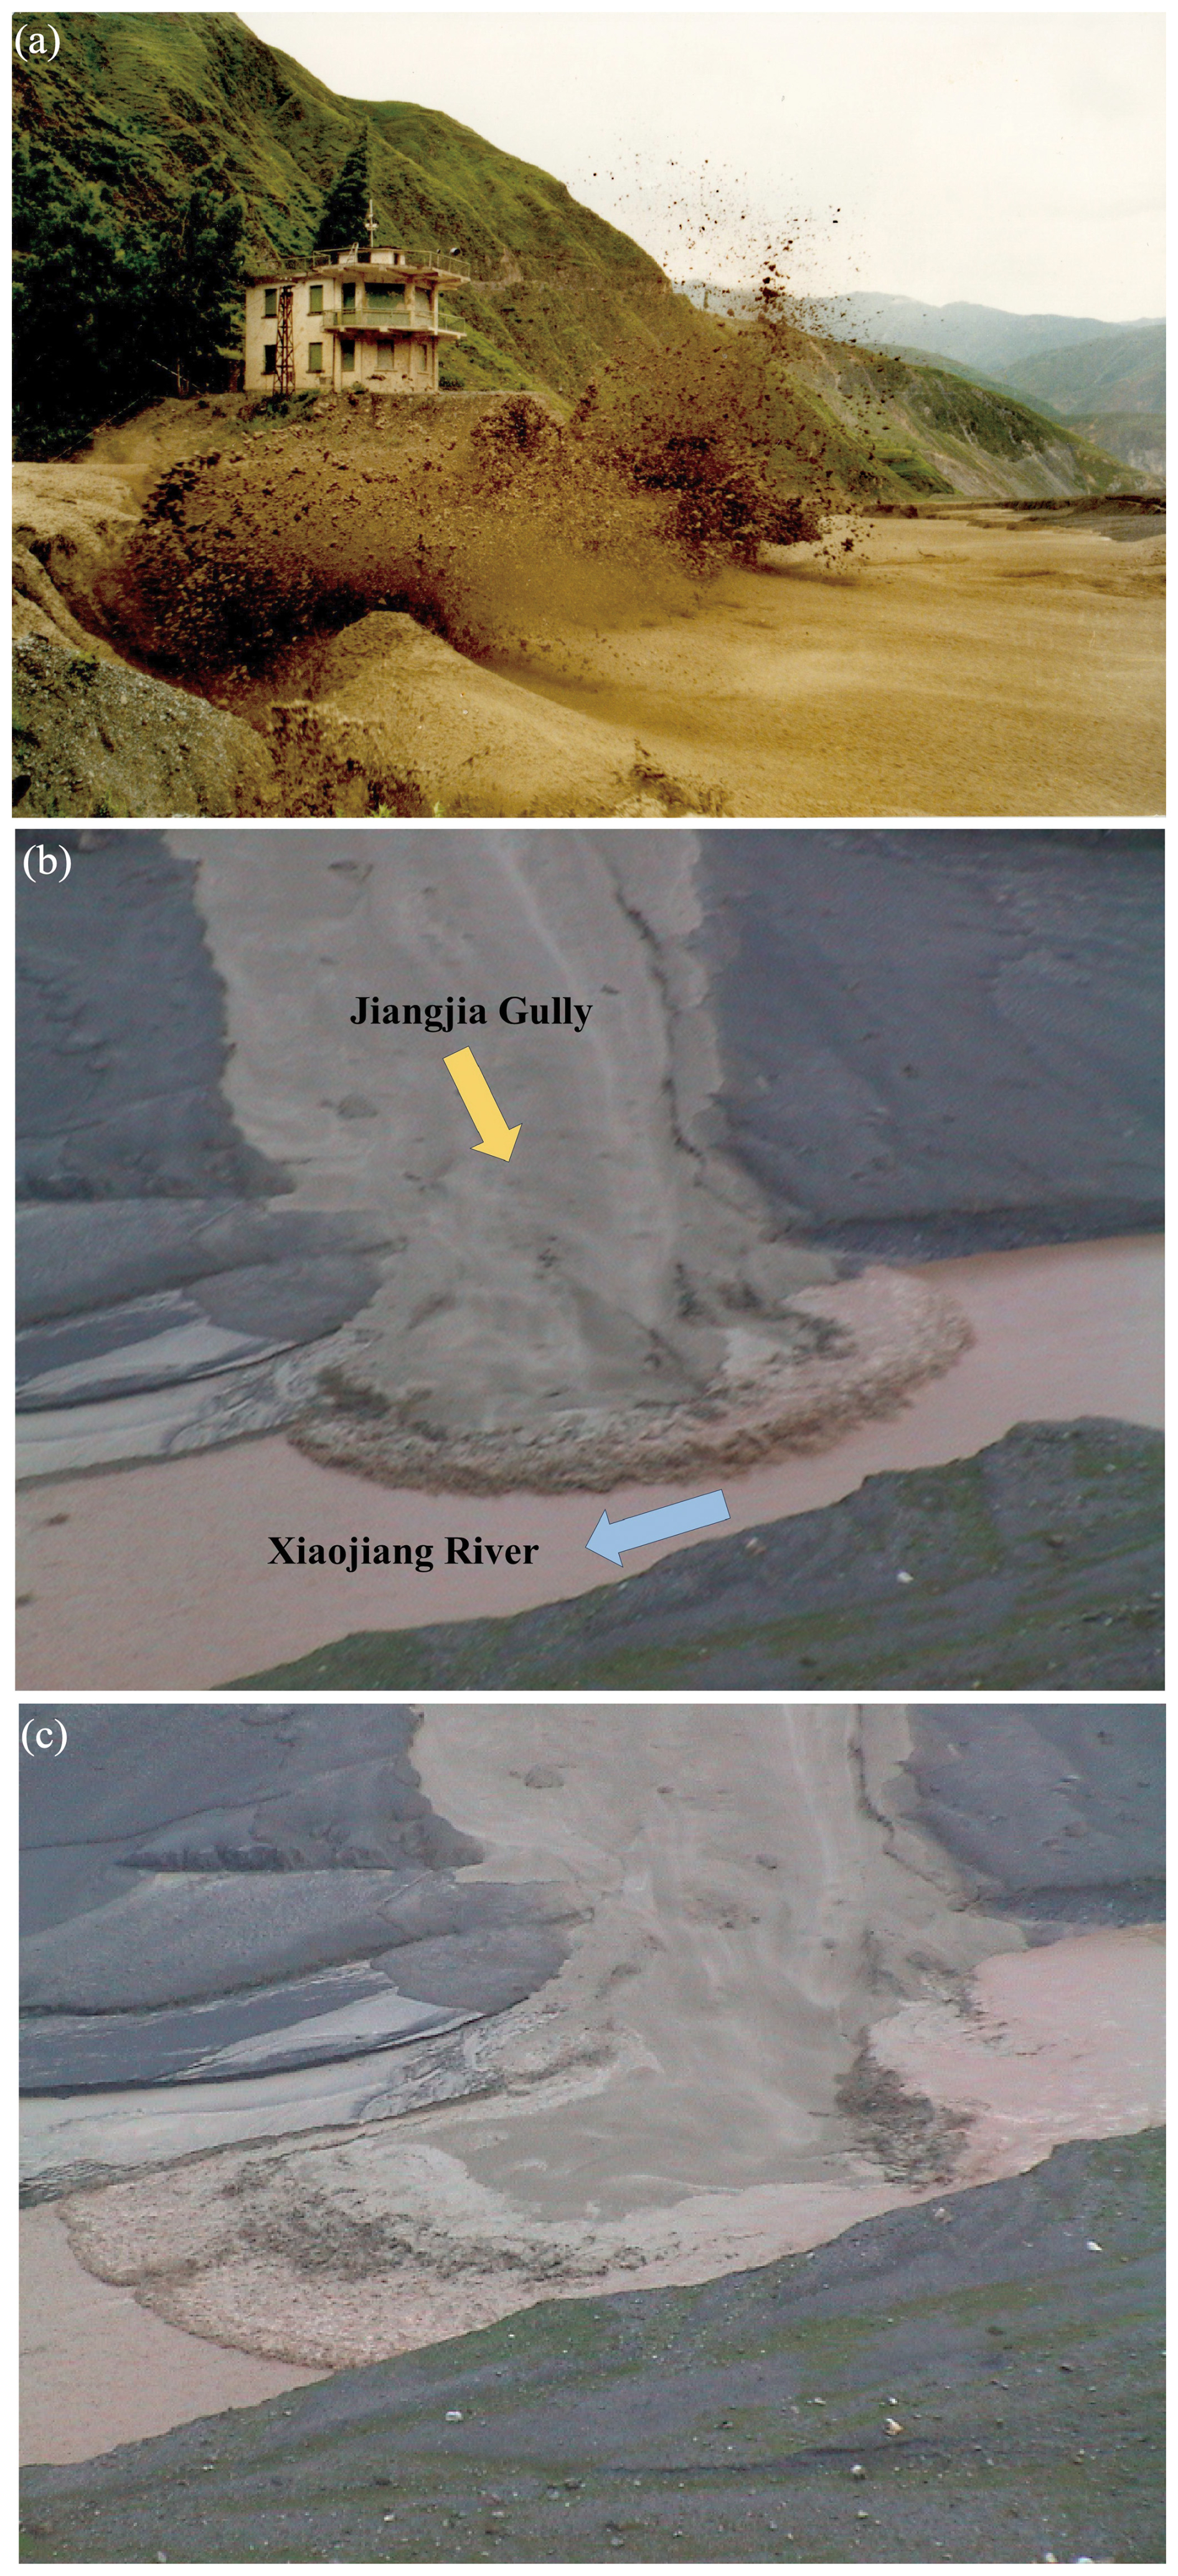
Figure 2Debris flows in Jiangjia Ravine: (a) debris flow erodes the channel bank (photos by Shunli Chen) and (b, c) the confluence of debris flows into the Xiaojiang River.
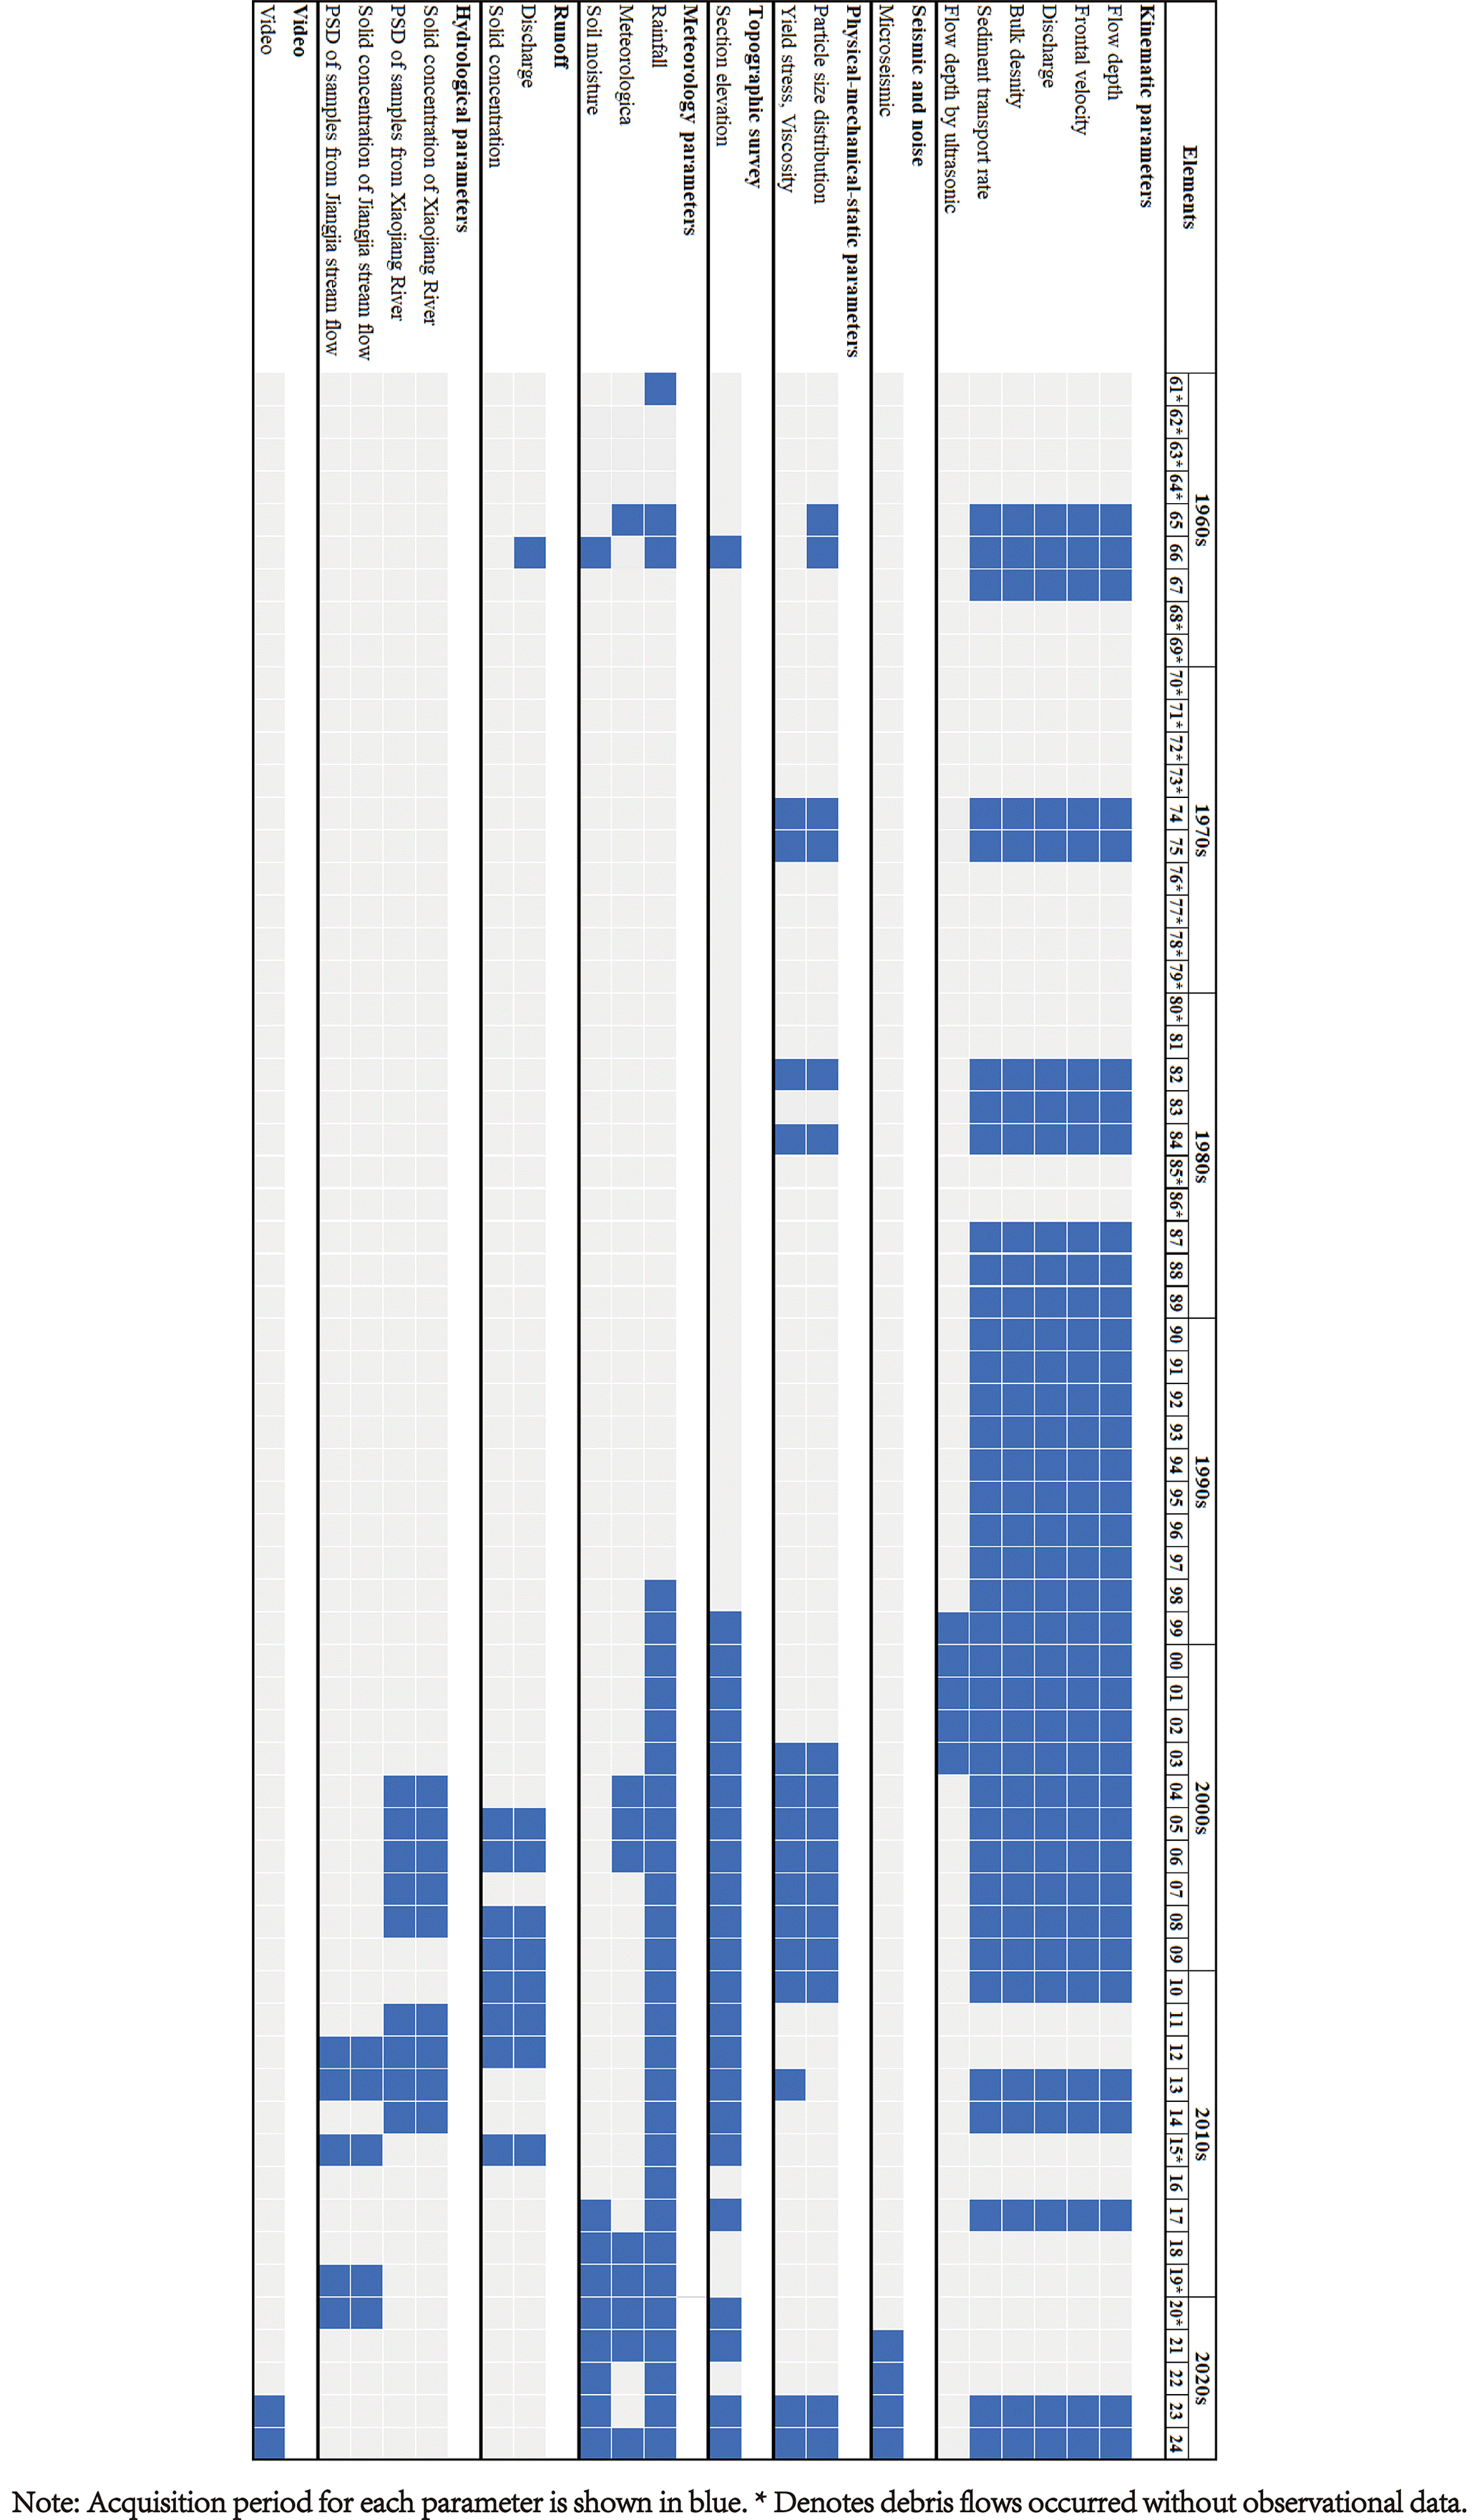
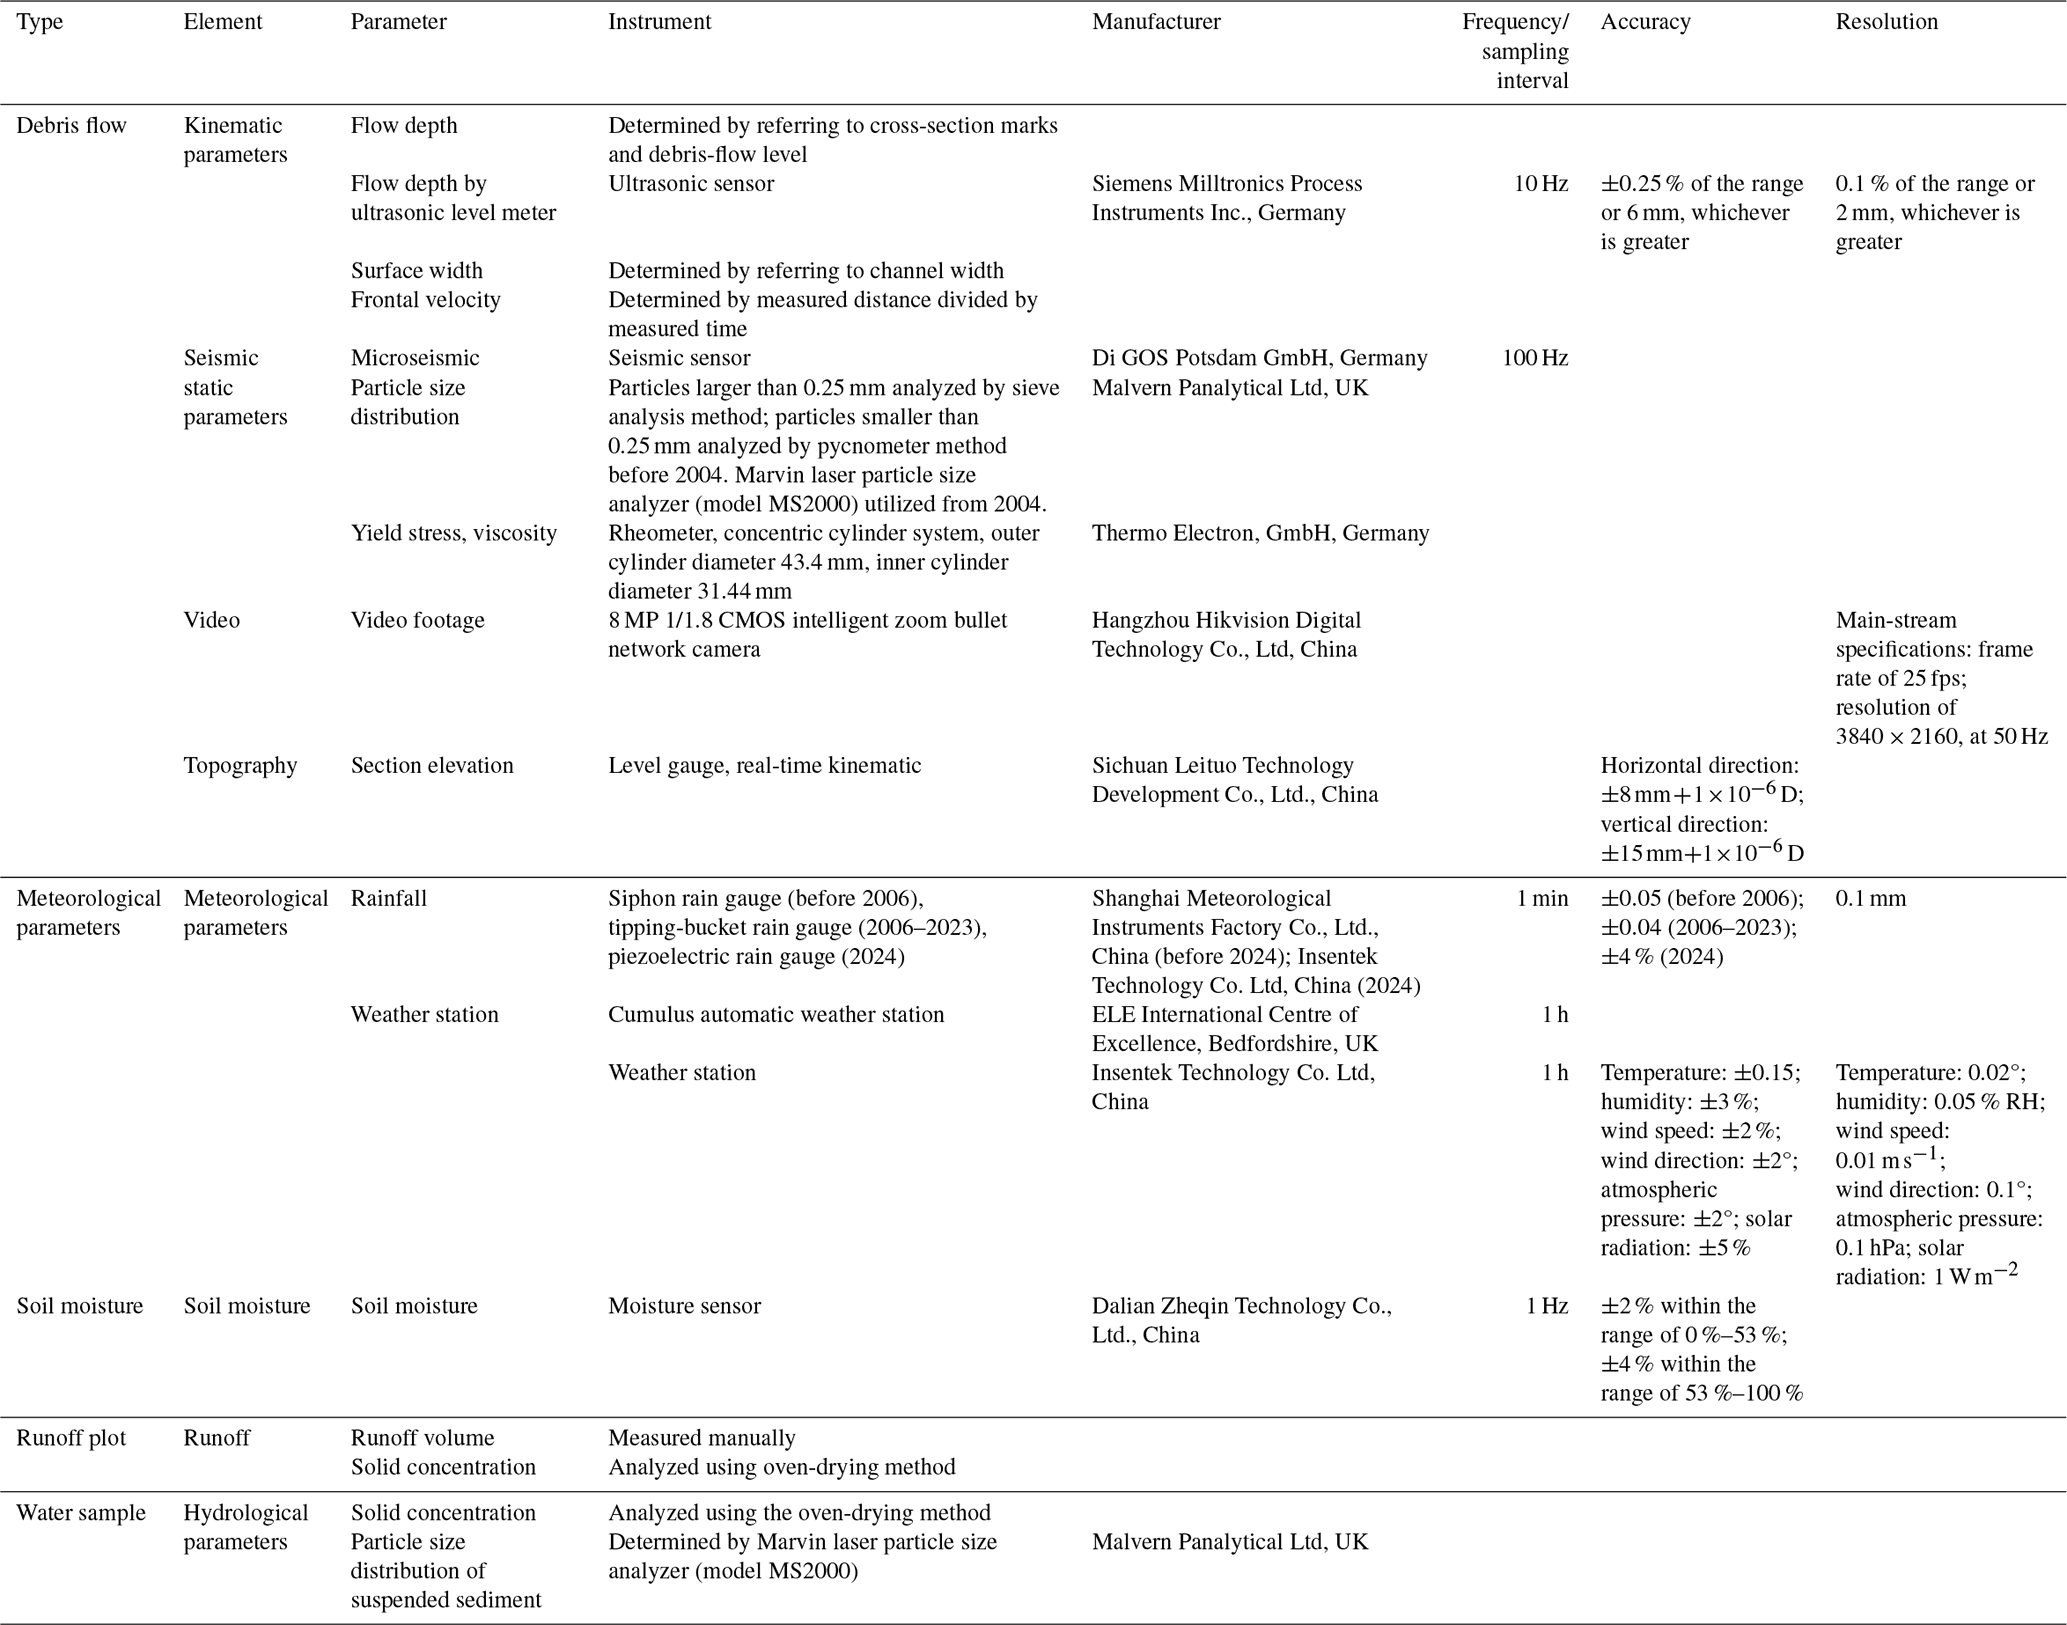
The dataset comprises multiple parameters, including debris-flow kinematic data; rheological data; particle size distribution data; seismic data; debris-flow videos; cross-section elevation data; meteorological, rainfall, soil moisture, and temperature data; sediment concentration and runoff data from plots; and suspended sediment data. The dataset comprises, although it is not limited to, the data from three publication-based datasets (in Chinese), containing debris-flow observation records from 1961 to 2000 (Zhang and Xiong, 1997; Kang et al., 2006, 2007). Figure 1a indicates the sampling or monitoring locations. The specific coordinates of the monitoring location can be found in the dataset. Figure 3 summarizes these datasets, along with their respective acquisition periods. The majority of the data were collected in Jiangjia Ravine, while additional sediment flux, rainfall, and meteorological data were also acquired in Xiaojiang River catchment. The instruments and measurement methods employed are detailed in Table 2.
3.1 Debris flow
3.1.1 Kinematic parameters
Measurement
The debris-flow kinematic parameters were monitored in a straight channel adjacent to the DDFORS (Fig. 4). The locations of two debris-flow observation sections are shown in Fig. 1a. Observation distances ranged from 50 to 200 m. Flow time between the two sections was measured using a second chronograph. Depth, defined as the surge front height, was determined by referencing cross-sectional marks on the channel banks, representing the vertical distance between the top of the debris-flow surge and the channel surface (Fig. 4c). The surface width of the debris flow was determined by referencing the channel width. Velocity was calculated by dividing the observation distance by the flow time for each surge as it passed through the cross sections. The bulk density of each surge was determined either through sampling weighting or estimation.
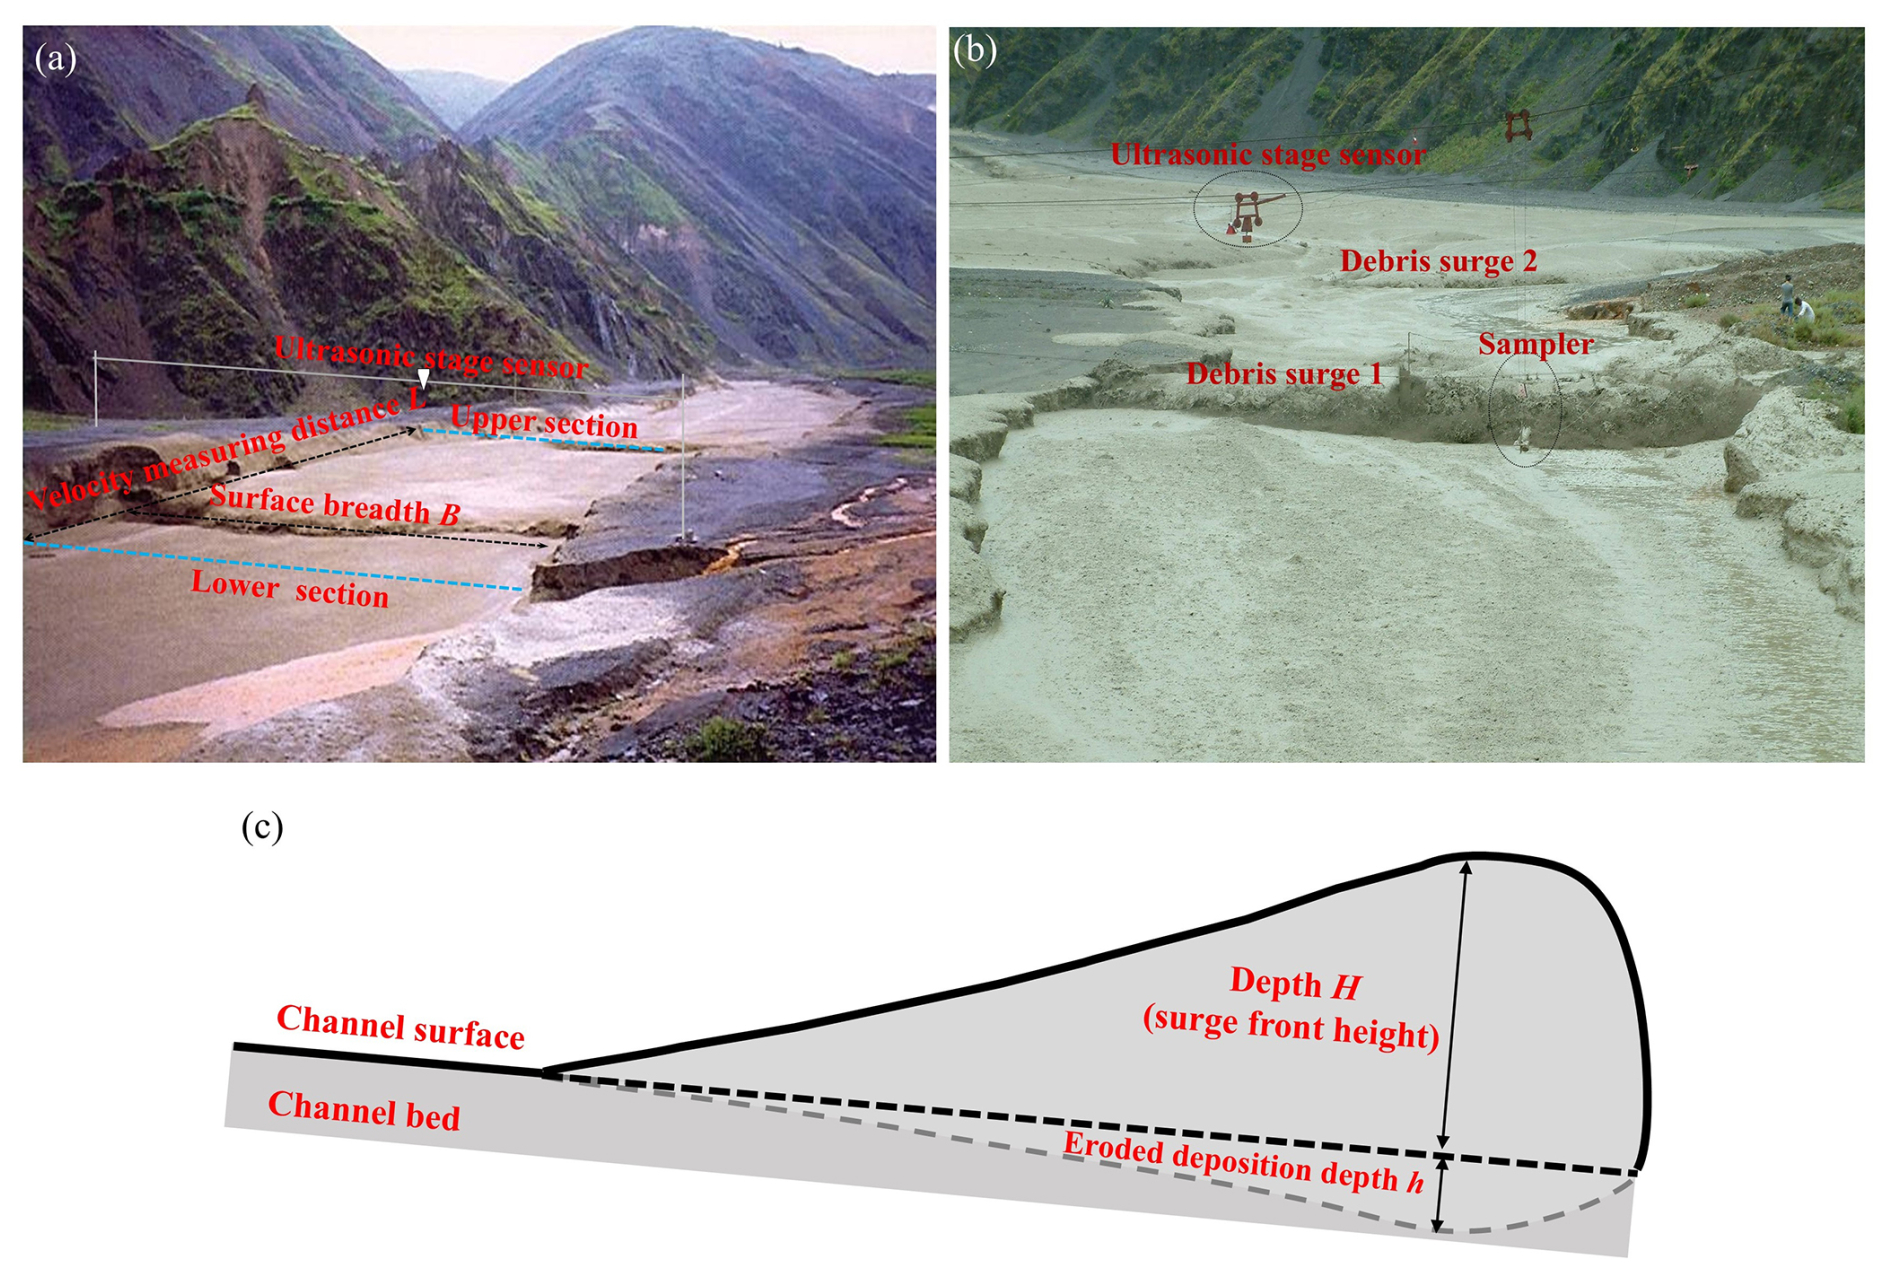
Figure 4Field observation of debris-flow kinematics and sampling: (a, b) surface width, depth, and velocity measurement; (c) illustration of flow depth.
During 1999–2001, the flow depth of specific debris-flow surges was simultaneously measured using an AIRANGER SPL ultrasonic level meter installed directly above the channel with a sampling frequency of 10 Hz (Fig. 4b). The measurement range extends from 0.3 to 60 m. The depth value is calculated as the difference between the installation height of the ultrasonic sensors, set at 10 m, and the measured values.
Data processing
The discharge, volume, sediment concentration, sediment volume, and sediment transport rate of the debris-flow surge were determined based on the observational parameters. A rectangular channel cross section was assumed.
The surge discharge Q (m3 s−1) was calculated as follows:
where V is velocity (m s−1), B is surface width (m), and H is surge depth (m).
Surge-flow volume Wc (m3) was calculated as follows:
Here, T is the record time (duration) of debris-flow surge (s), which is the time for the surge front to pass the upper observational section minus the time for the surge rear to pass the lower observational section. The flow depth hydrograph of the surge flow exhibits a triangular shape, so the factor is applied in the calculation.
The sediment concentration S (kg m−3) and the volume concentration of debris flow Cv are obtained as follows:
Here, γ, γc, and γs are the density of water, debris flow, and sediment (grain density), respectively; γs is taken as 2650 (kg m−3).
The sediment volume Ws (m3) and the sediment transport rate Qc (t s−1) are calculated as follows:
Example kinematic parameters of debris-flow surges that occurred on 7 June 2013 are presented in Table 3. In addition, statistics of debris-flow surge parameters, such as total sediment transport volume and total runoff volume, are also provided.
Table 3Example of the kinematic parameters of the debris-flow surges that occurred on 7 June 2013.
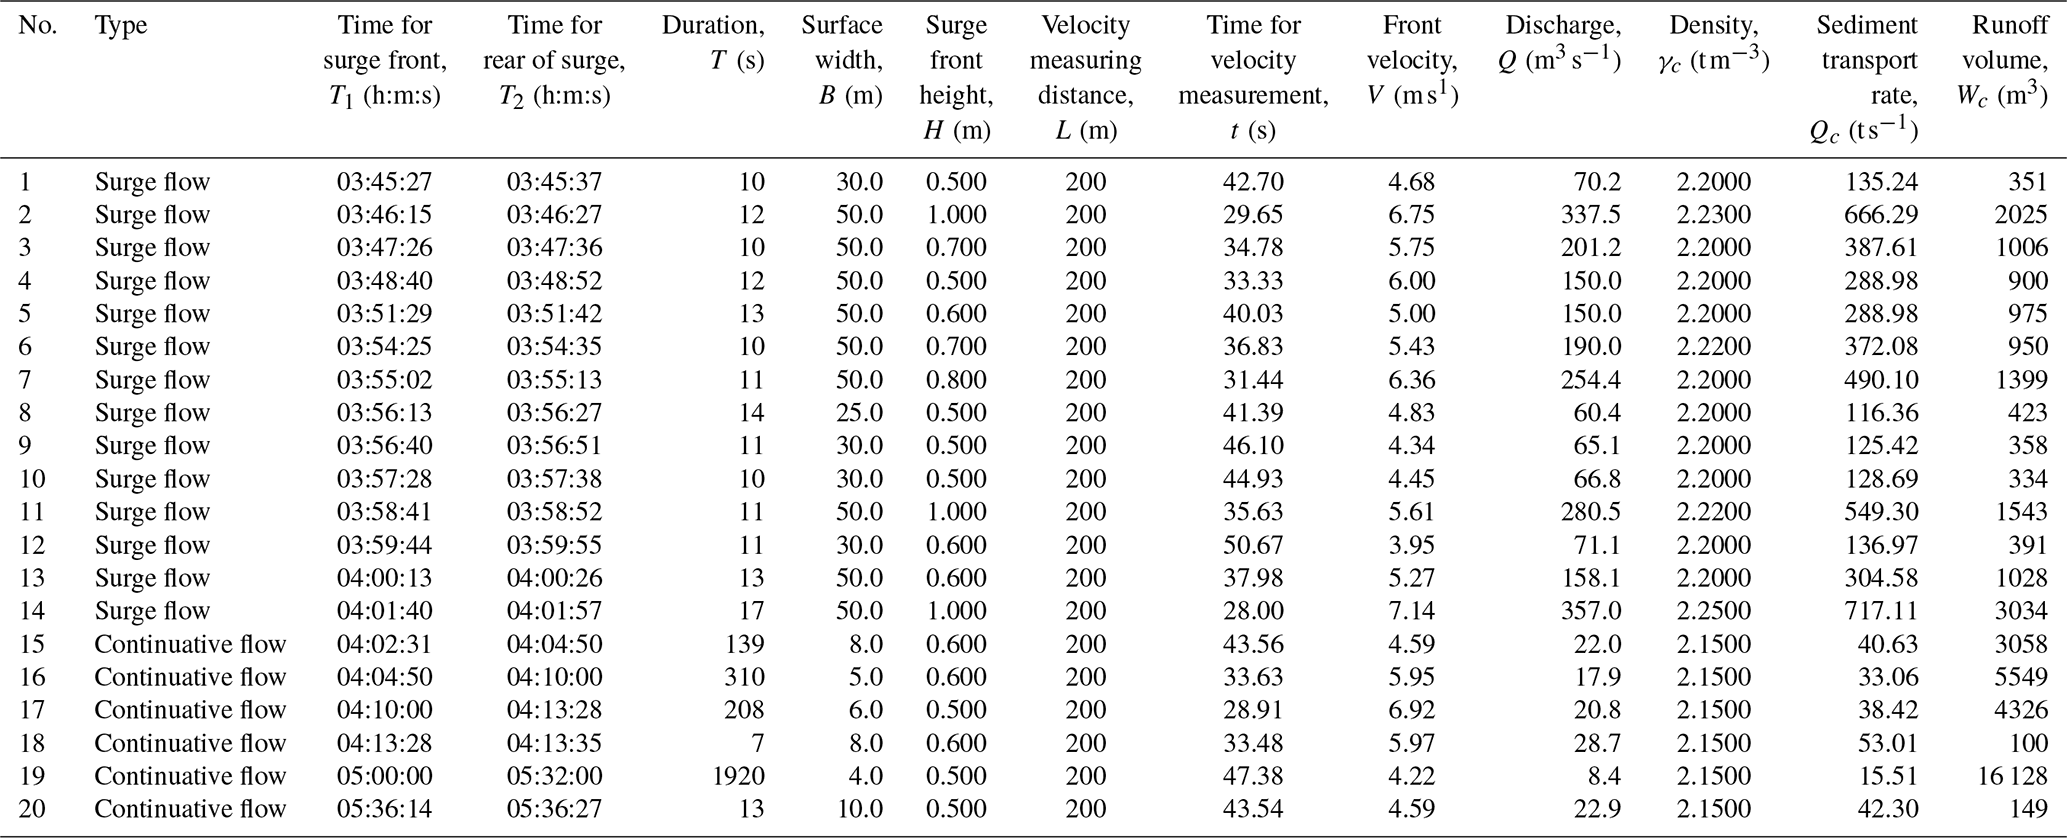
Note that all times are provided as China standard time (CST, UTC+8).
Example of results
The kinematic characteristics of debris-flow surges provide critical information for understanding their behavior and impact. Between 1965 and 2024, a total of 278 debris-flow events were recorded, including 14 887 surge flows and 2114 continuative flows. These events predominantly occur during the monsoon season, from May to September, with the highest frequency observed in June (55 events), July (113 events), and August (98 events).
Cumulative distribution functions of flow depth, discharge, and volume for surge flows and continuative flows are depicted in Fig. 5. The maximum flow depth is 5.5 m for surge flow and 2.7 m for continuative flow (Fig. 5a; quantiles at 25 %, 50 %, and 75 % of 0.29, 0.39, and 0.49 m for surge flows, respectively; quantiles at 25 %, 50 %, and 75 % of 0.50, 0.80, and 1.2 m for continuative flows, respectively). The discharge of surge flows ranges from 0.5 to 8026 m3 s−1, while discharge for continuative flows ranges from 0.3 to 1800 m3 s−1 (Fig. 5b; quantiles at 25 %, 50 %, and 75 % of 67.7 m3 s−1, 156.2 m3 s−1, and 325 m3 s−1 for surge flows, respectively; quantiles at 25 %, 50 %, and 75 % of 4.9 m3, 13.3 m3 s−1, and 36.3 m3 s−1 for continuative flows, respectively). The volume of surge flows ranges from 2 to 249 112 m3, while the volume for continuative flows ranges from 3.4 to 825 600 m3 (Fig. 5c; quantiles at 25 %, 50 %, and 75 % of 3344, 6673, and 10 009 m3 for surge flows, respectively; quantiles at 25 %, 50 %, and 75 % of 522, 1043, and 1564 m3 for continuative flows, respectively).
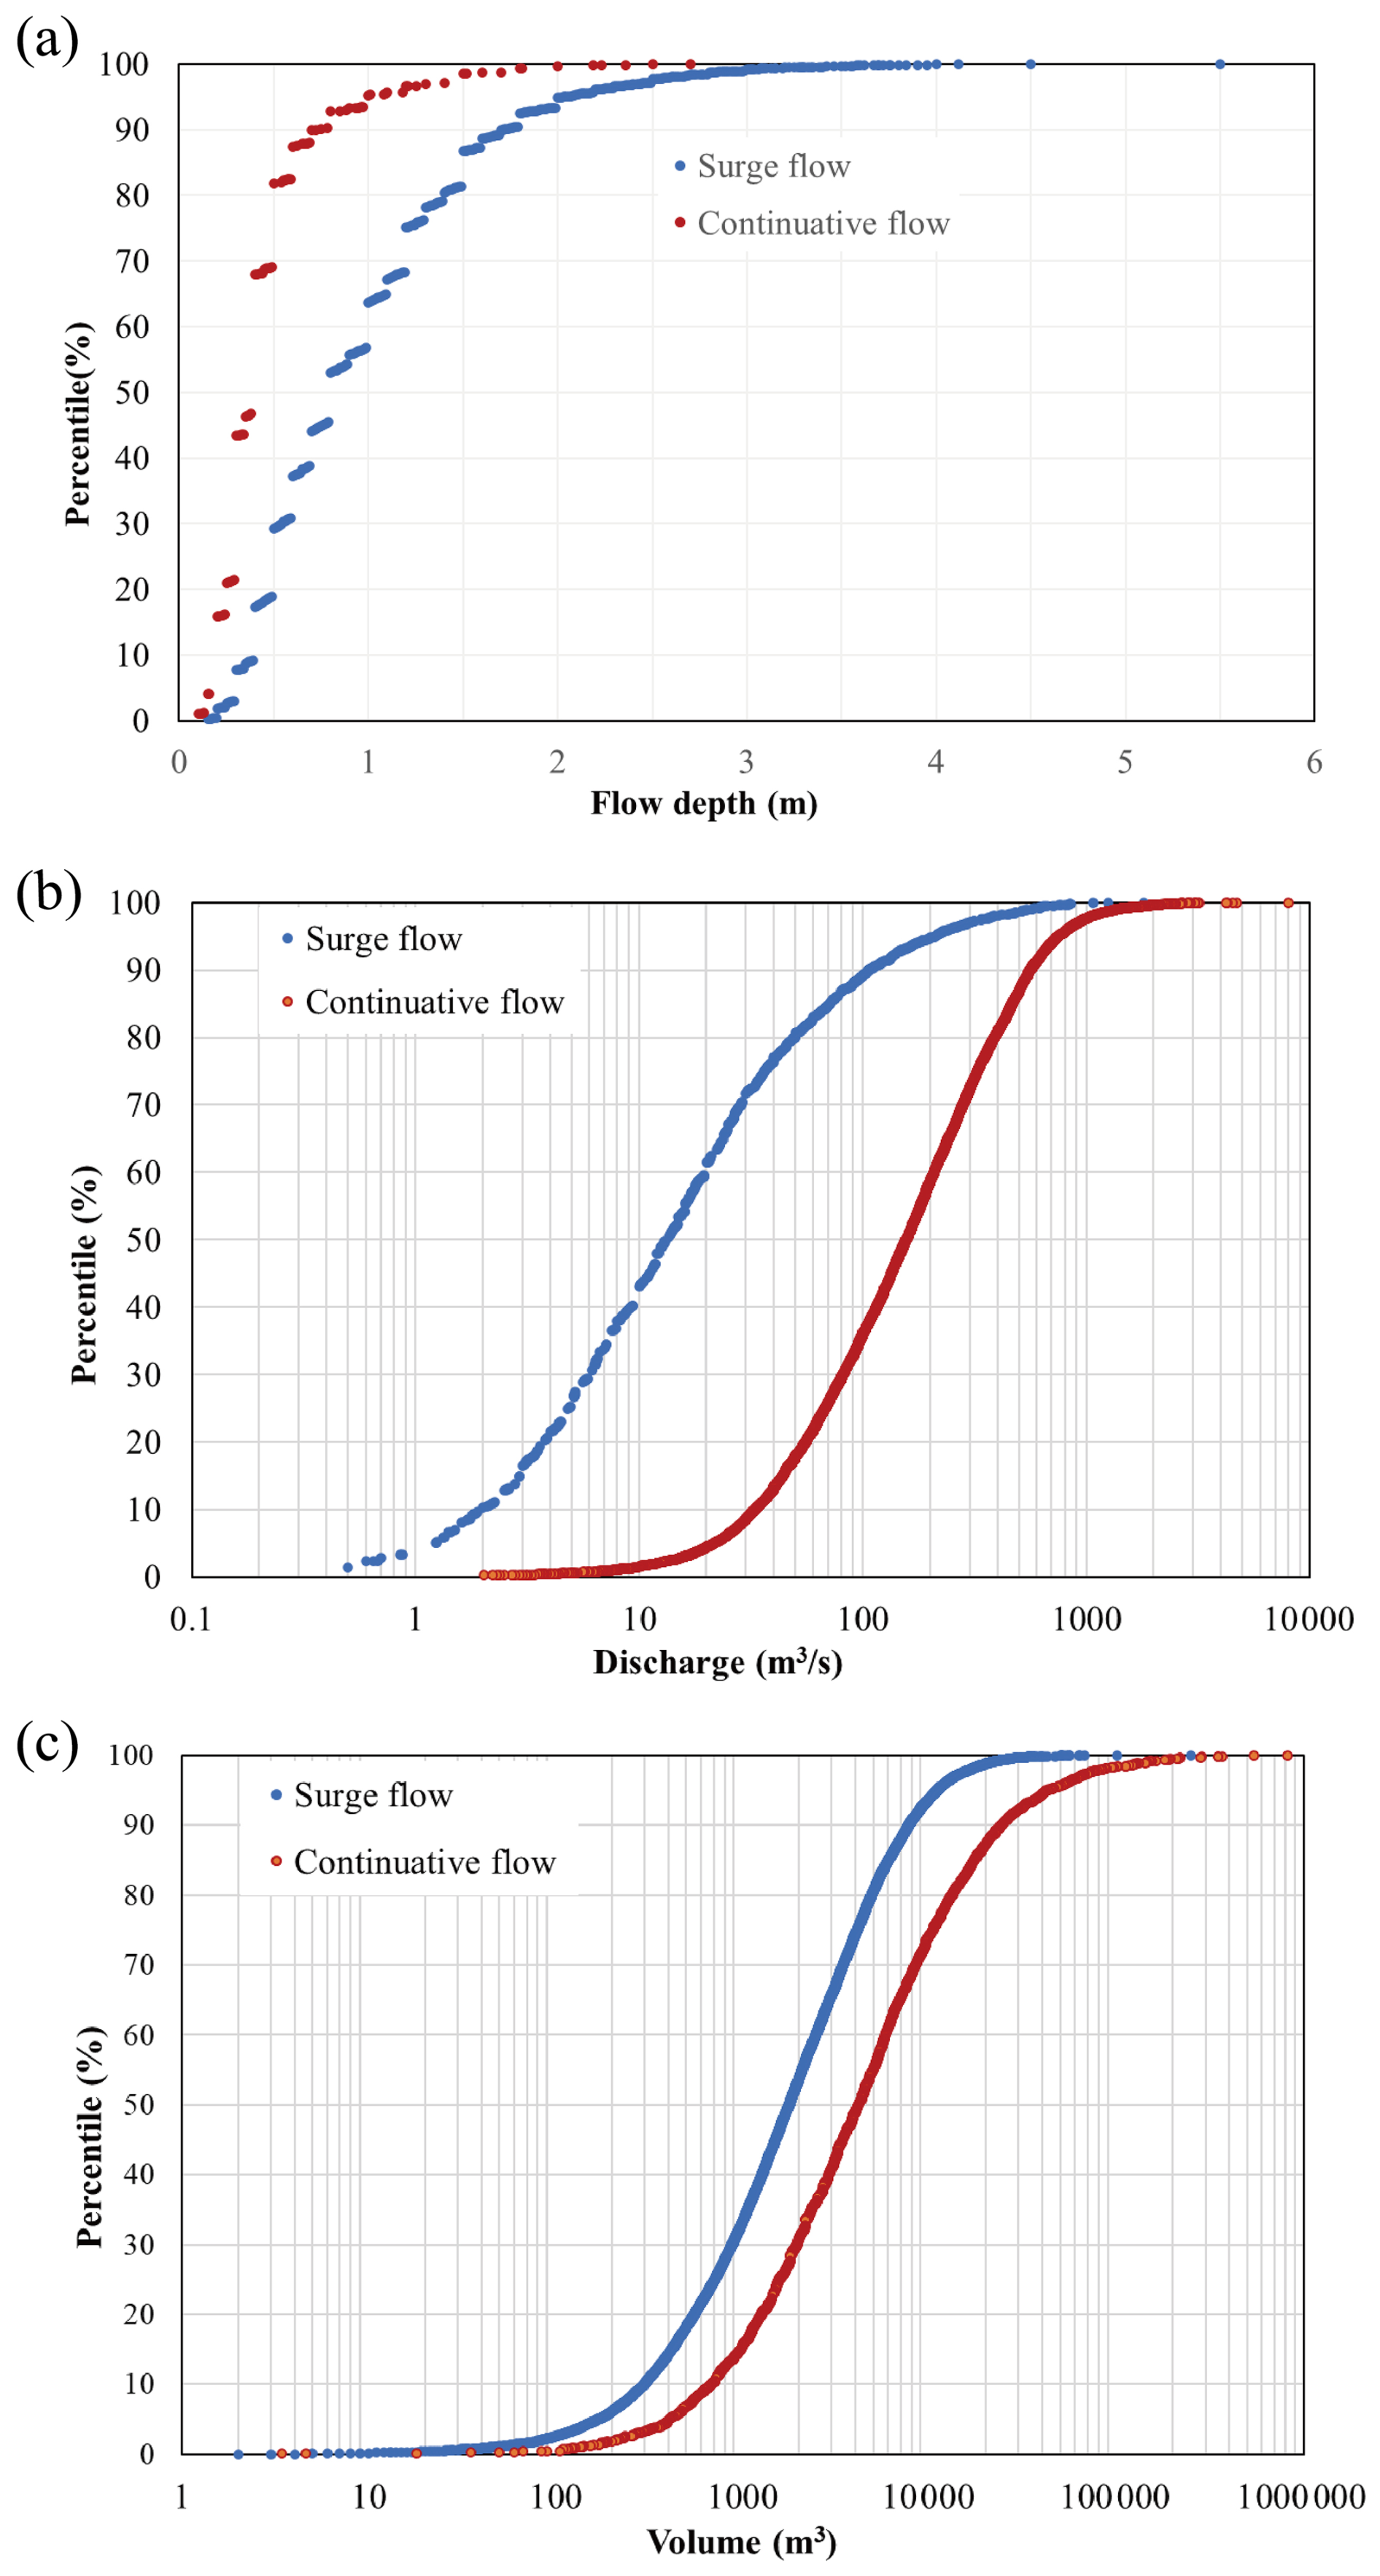
Figure 6 illustrates examples of the measured debris-flow depth, velocity, discharge, and runoff volume of events that occurred on 16 July 1999. The flow depth measured by ultrasonic level meter, velocity, discharge, and volume exhibit strong fluctuations, with the maximum flow depth and velocity reaching up to 5.4 m and 10.6 m s1, respectively. The volume of debris flow ranged from 403 to 74 615 m3. The maximum values represent the volume of the continuative flow, which has a long duration and typically occurs during the final period of the event.
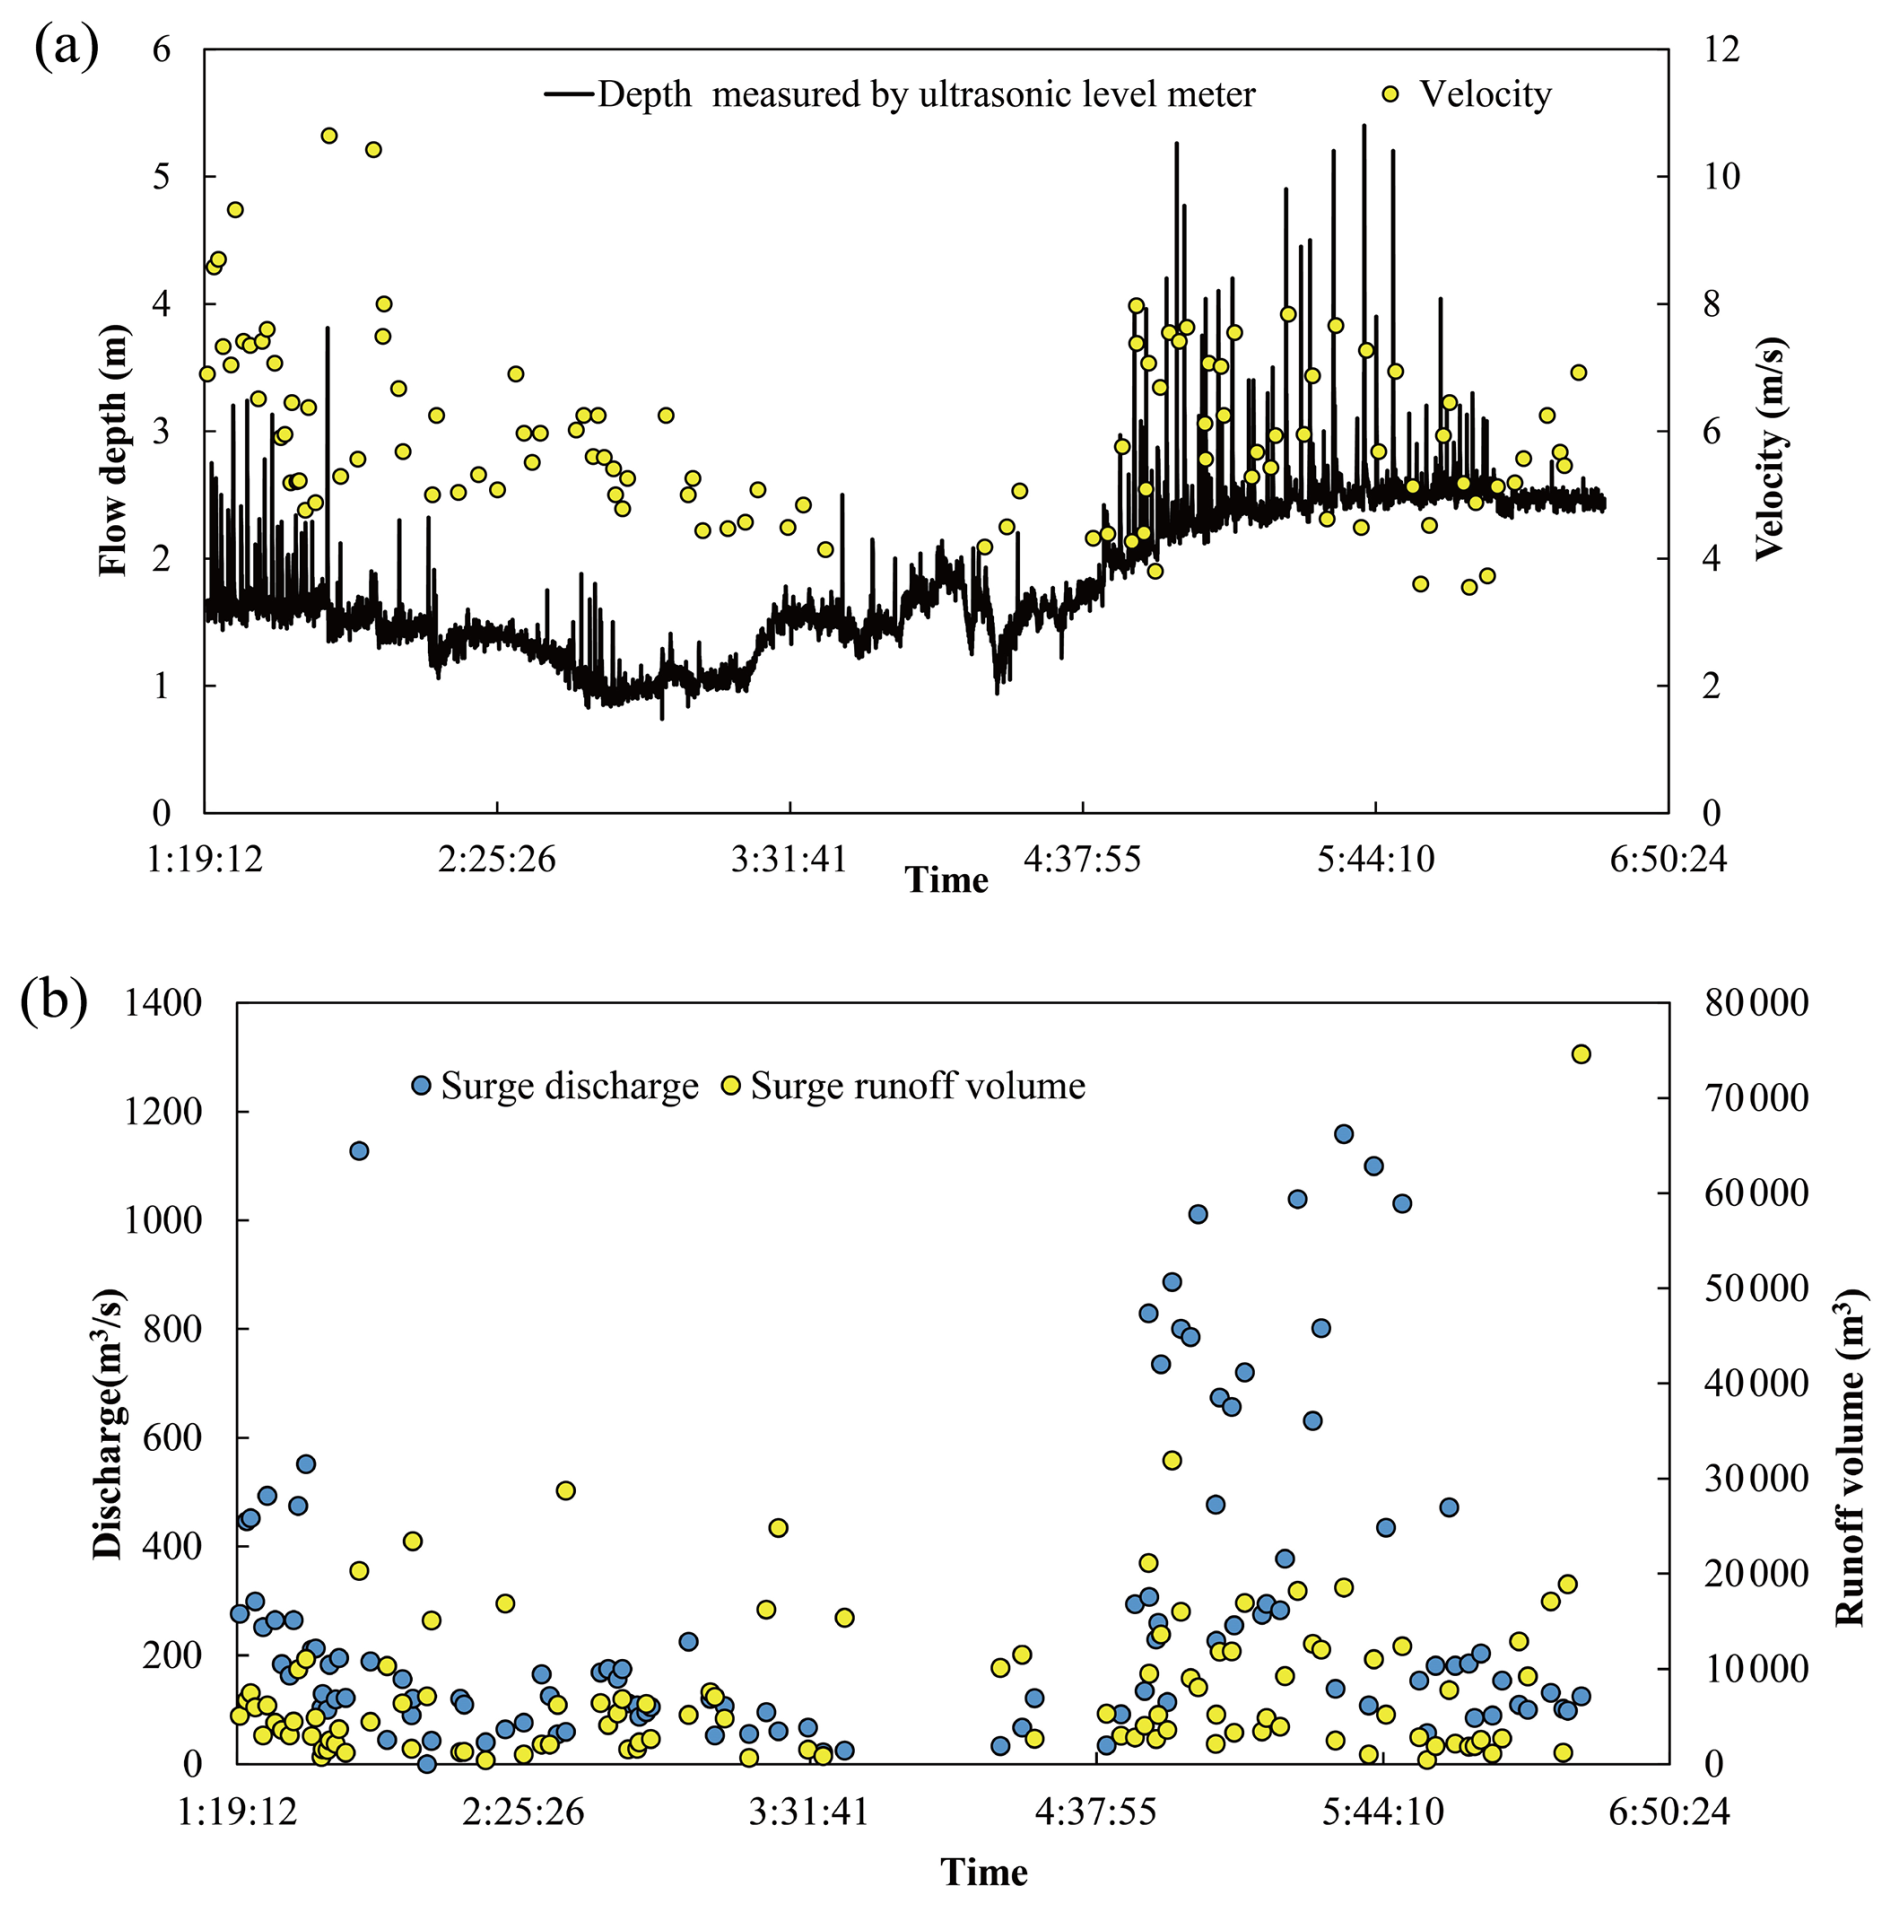
Figure 6Variation in the (a) flow depth and velocity and the (b) discharge and volume of debris-flow surges that occurred on 16 July 1999.
Figure 7 presents the measured annual sediment volume from 1966 to 2024. During this period, debris flows transported 43.3×10⁶ m3 of sediment. Sediment mainly deposited in the main channel, while a portion was transported to the Xiaojiang River. The most substantial debris flows occurred in 1991, transporting 6.69×10⁶ m3 of sediment. Overall, the frequency and magnitude of debris flows have significantly declined in recent decades. However, the events in 2023 and 2024 still recorded significant sediment transport volumes of 52 682 and 31 450 m3, respectively, which remain substantial for mountainous watersheds. The decreasing trend may be a result of climate change.
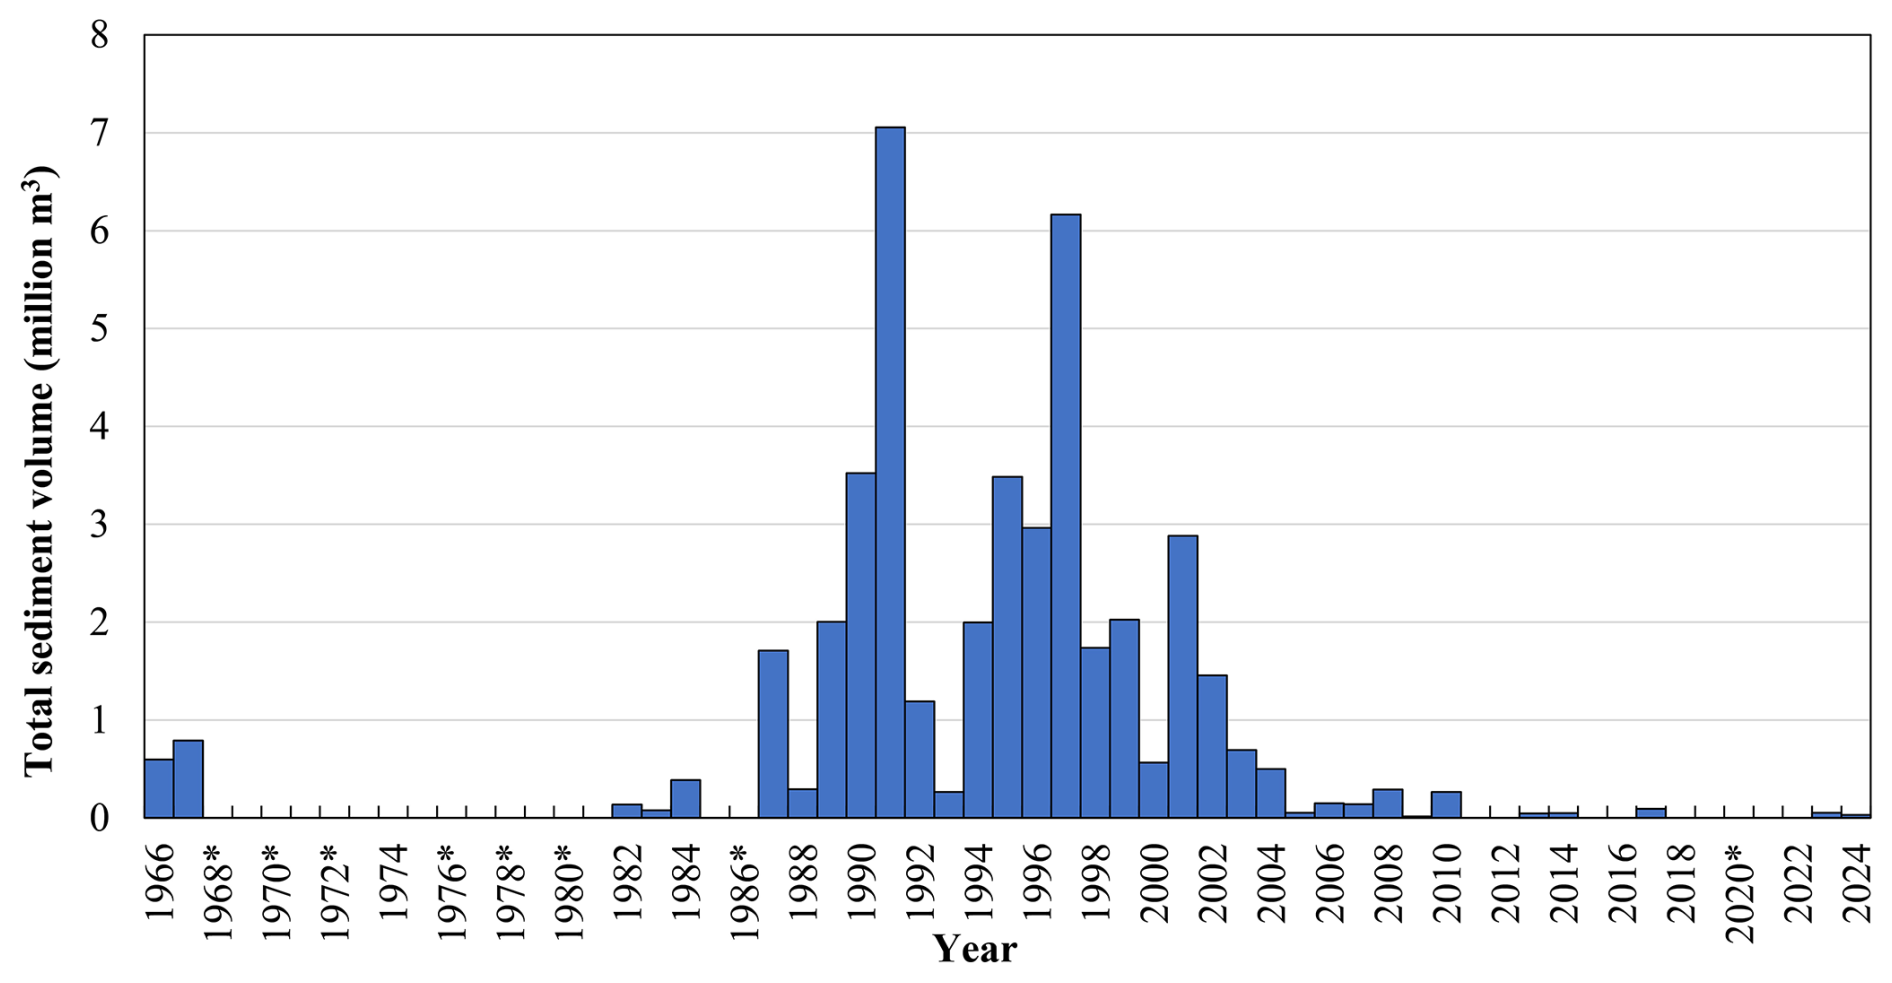
Figure 7Variation in the sediment transported by debris flows recorded from 1966 to 2024. An asterisk (*) denotes that debris flows occurred without observational data.
3.1.2 Seismic data
Measurement
The ground seismic response induced by debris flows was monitored by a DATA-CUBE three-channel seismic recorder. The sensors contain three geophones for different directions and were installed at three locations with an average distance of 1.1 km along the main channel within the transportation area (Figs. 1a and 8a). The recorded seismic data were stored in the data logger of the sensors and download manually after the debris-flow events.
Example of results
Figure 8b illustrates the time–domain seismic signal and time–frequency characteristics of the debris-flow event that occurred on 28 July 2024. The event began at approximately 11:24 (UTC+8) and ended at 12:04 (UTC+8), lasting a total of 40 min.
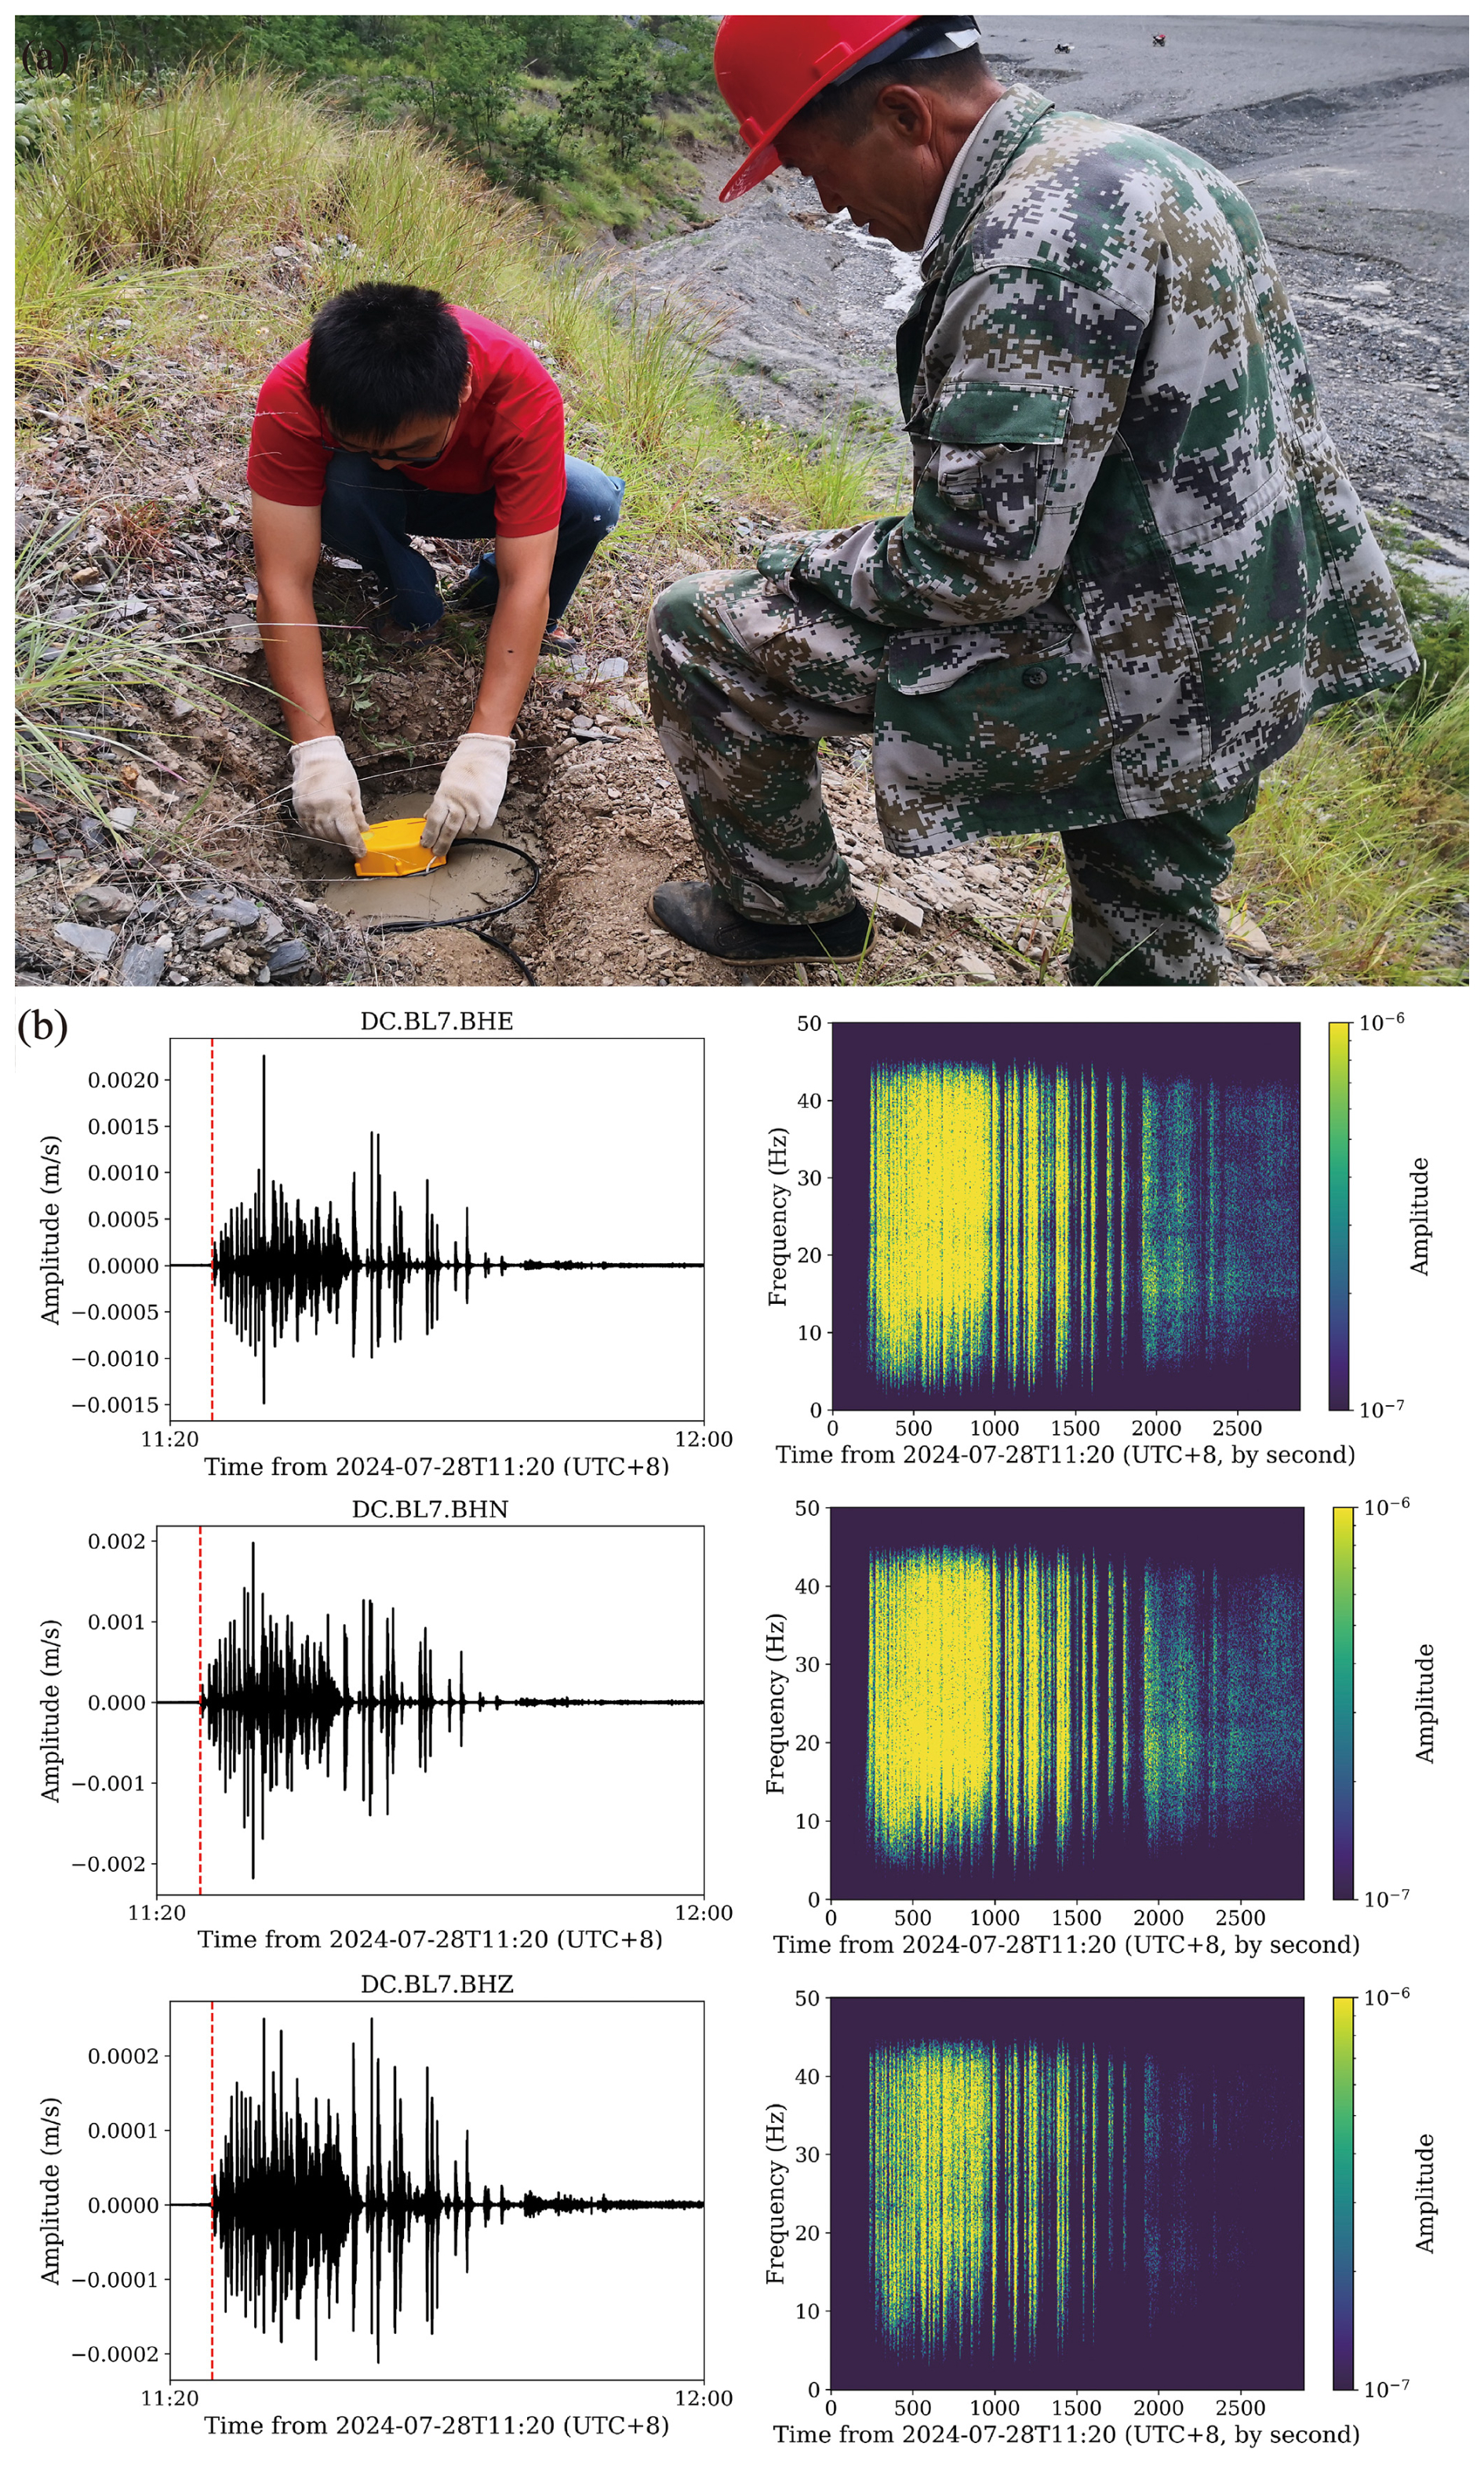
Figure 8The (a) installation of a seismic sensor and (b) the time–domain seismic signal and time–frequency characteristic curves of the debris-flow event on 28 July 2024.
From the time–domain waveforms and time–frequency spectra of seismic signals in the east–west (E–W), north–south (N–S), and vertical (Z) directions, the initiation and cessation of the debris flow are clearly identifiable. A distinct increase in signal amplitude is observed starting around 11:25 LT, peaking at approximately 12:00 LT, which corresponds to the main surge of the debris flow. After this peak, a significant attenuation of the seismic signal is noted after 12:00 LT, indicating a decrease in flow intensity and the eventual cessation of the debris flow.
3.1.3 Particle size, yield stress, and viscosity
Measurement
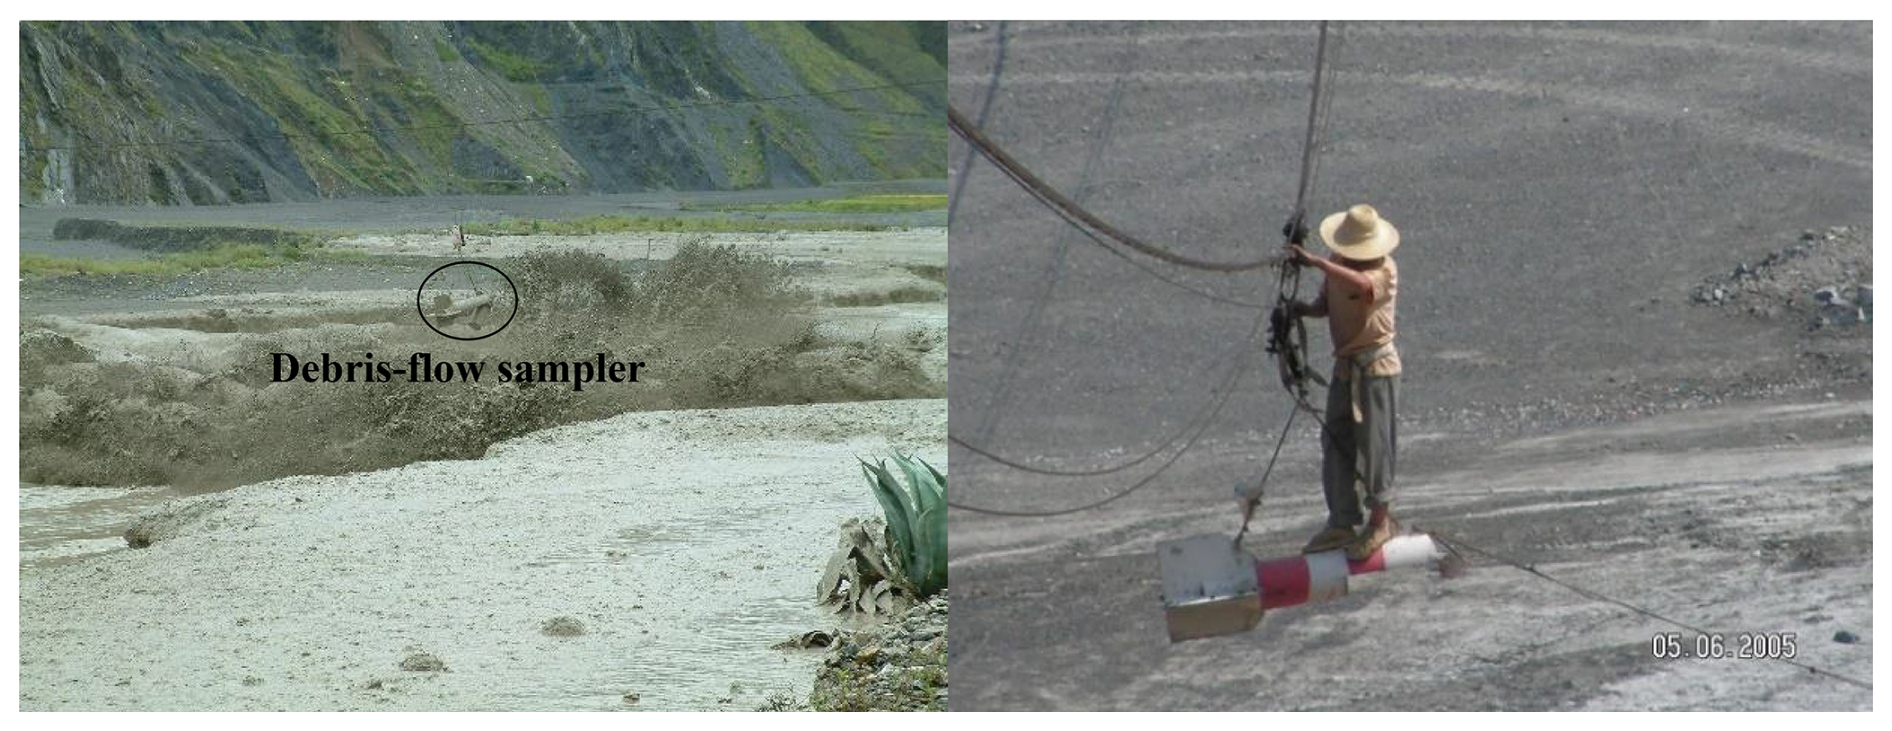
Debris-flow samples are collected by suspending a cable sampler or by manual sampling. Cable samples are collected from the moving surges with a bucket that has a diameter of 190 mm and a volume of 0.012 m3 (Fig. 9). Manual sampling collects the debris-flow deposition near the channel bank using a circular or square bucket with a volume of 0.0155 or 0.009 m3, respectively.
The sample is air-dried and sieved through a steel mesh for particle size analysis. For sediments larger than 0.25 mm, the particle size is determined using the sieve analysis method. For particles smaller than 0.25 mm, the pycnometer method was employed for particle size distribution analysis before 2004. Since 2004, a Marvin laser particle size analyzer (model MS2000) has been used.
The yield stress and viscosity of the debris-flow slurry (particles smaller than 1.2 mm) were obtained using a Thermo Haake RS600 rheometer, which employs a concentric cylinder system. This system features an outer cylinder diameter of 43.4 mm and an inner cylinder diameter of 31.44 mm. The debris-flow slurry sample, containing particles smaller than 1.2 mm, had a volume of 50.5 mL. Measurements were conducted using a Z31 rotor, which has a 15.72 mm diameter and is 55 mm high.
Example of results
Figure 10a illustrates the grain size distribution of debris-flow deposition samples collected from 1974 to 2024. The bulk densities of the samples range from 2026 to 2470 kg m−3, with median grain sizes ranging from 2 and 30 mm. Additionally, Fig. 10b depicts the rheological curves of two debris-flow slurries during 2004–2004 that have bulk densities ranging from 1665 to 2100 kg m−3. The shear stress increases rapidly at lower shear rates, whereas at higher shear rates, the increase becomes more gradual.
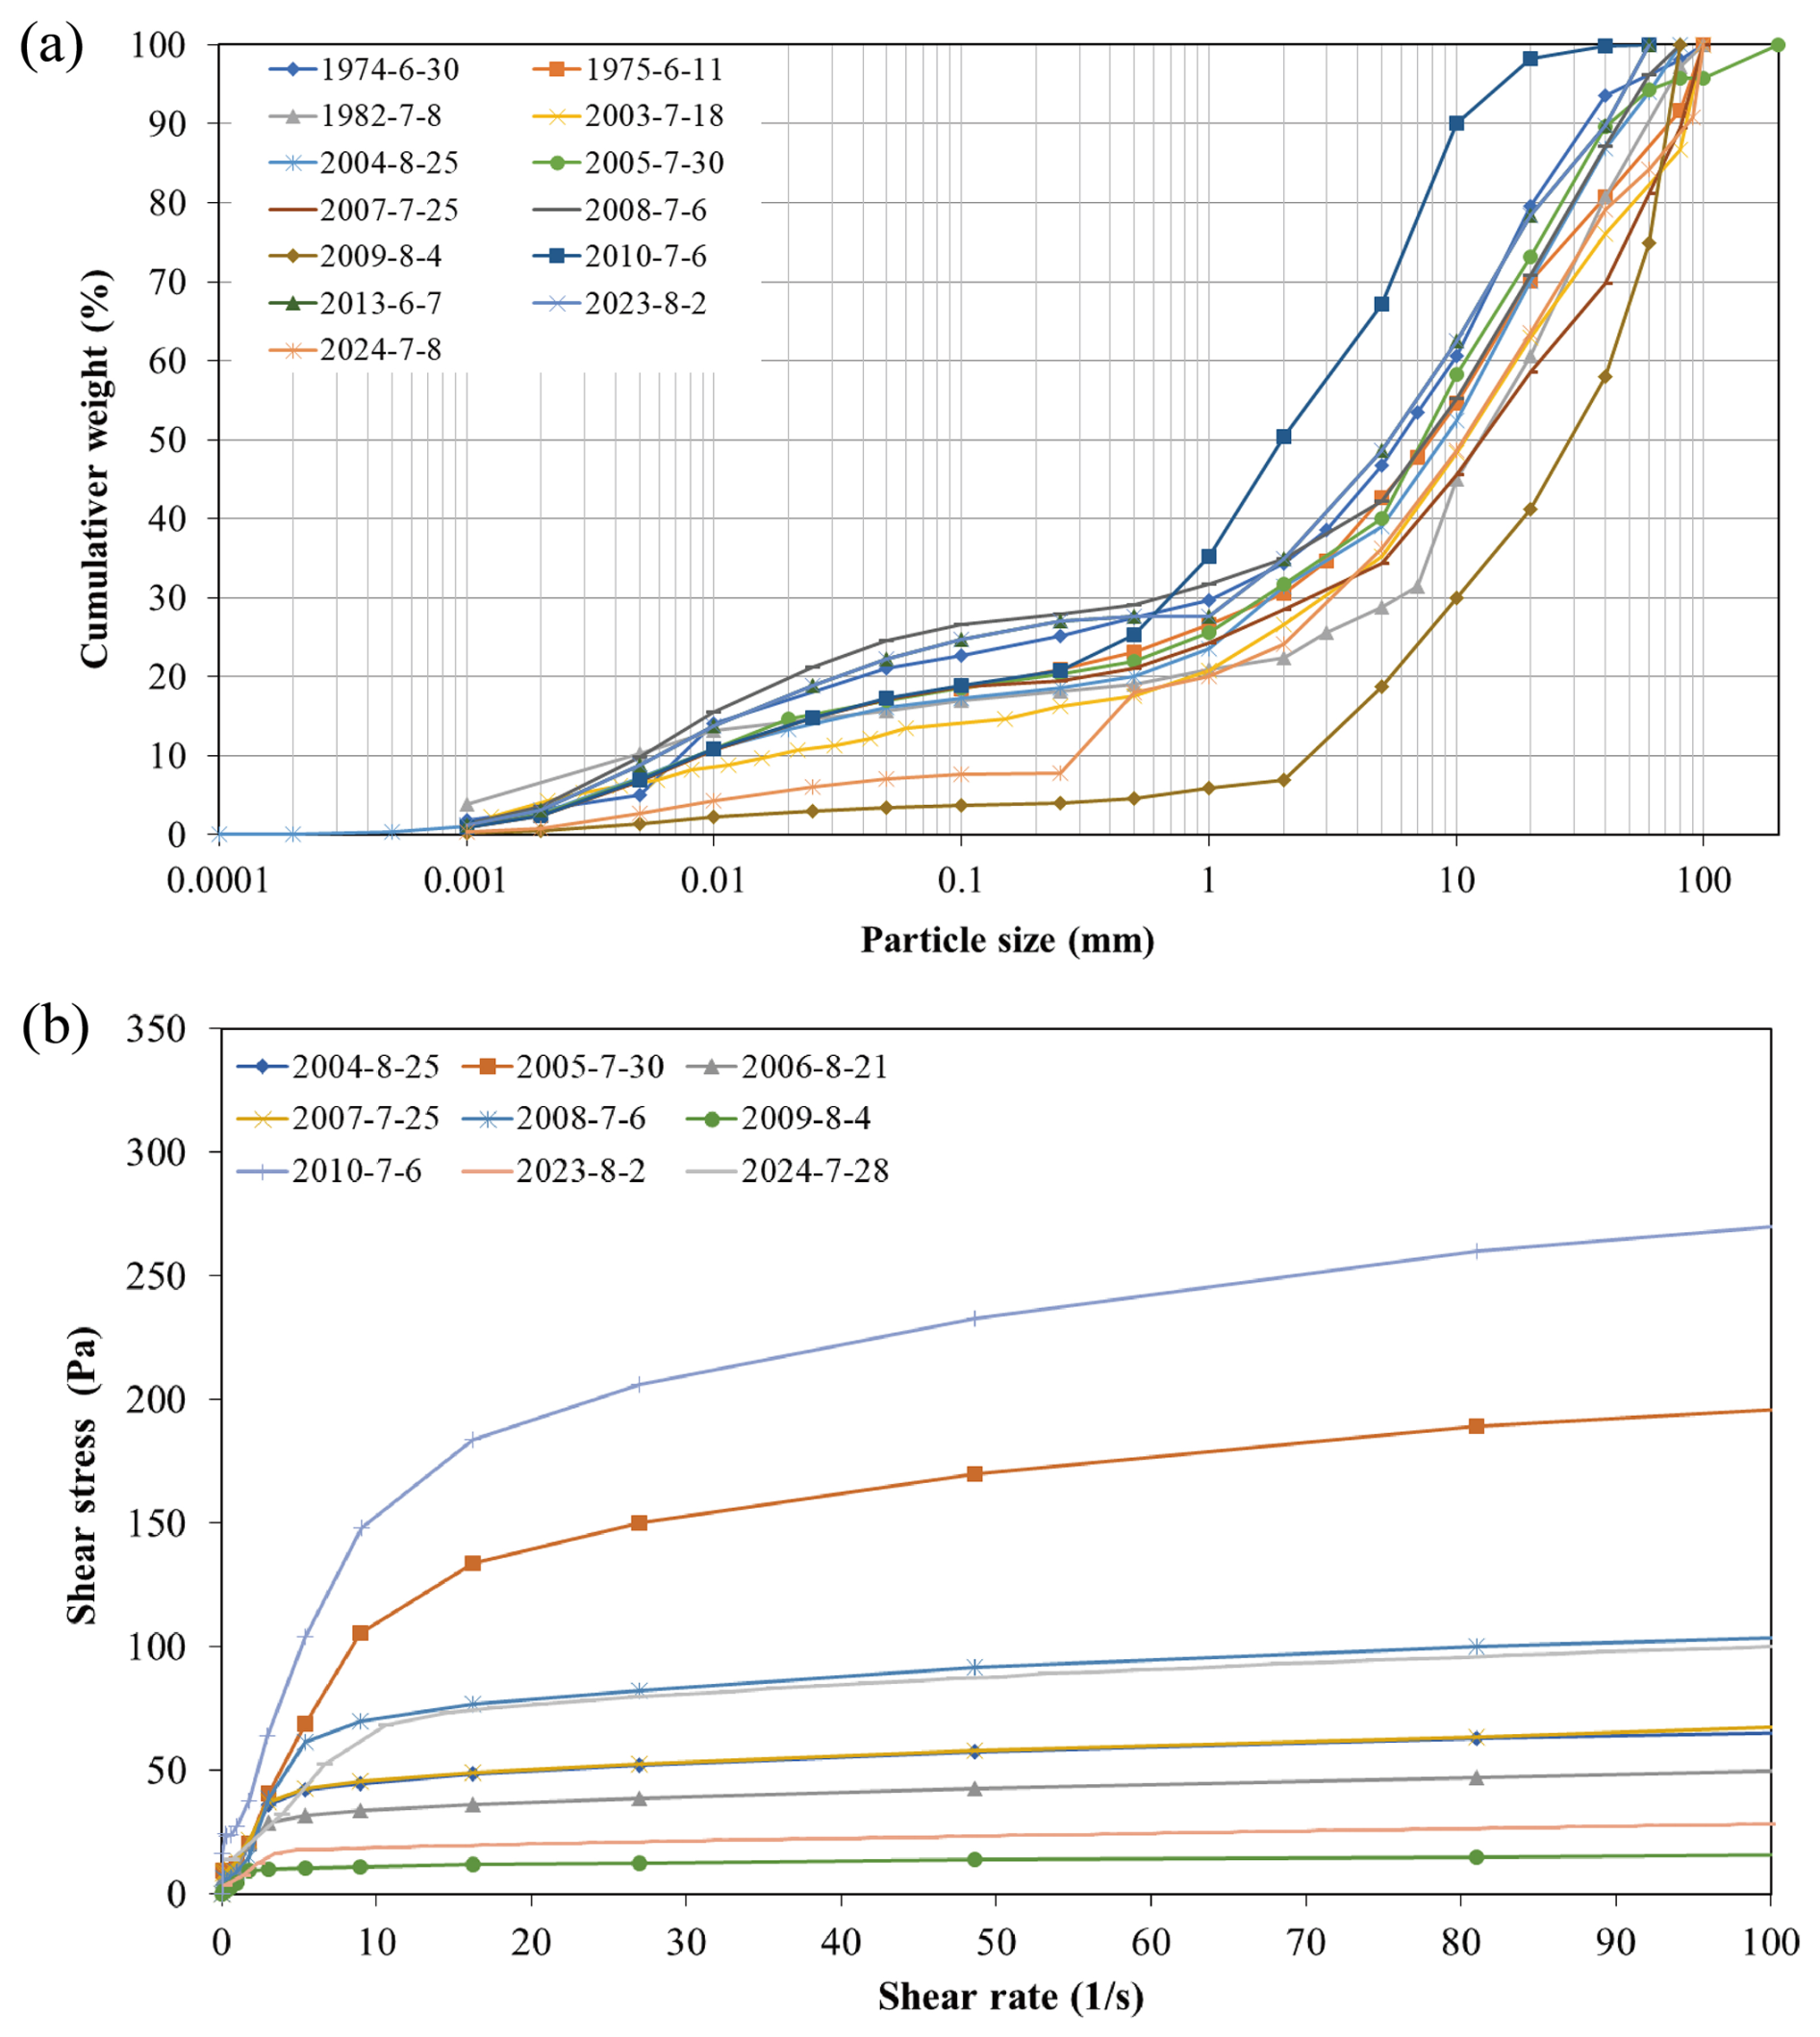
Figure 10The (a) particle size distribution of debris-flow surges that occurred during 1974–2024 and (b) the shear stress of the debris-flow slurry that occurred during 2004–2024.
3.1.4 Debris-flow video footage
Since 2020, high-resolution cameras (3840×2160 at 25 fps) have been installed on both sides of the debris-flow channel, including the observation section (Fig. 1a). Data are transmitted in real time through a wireless relay network and can be viewed online via a mobile client app. These cameras capture real-time footage of debris-flow movements (Fig. 11), which can be used for research of surge-flow formation, flow state assessment, and others.
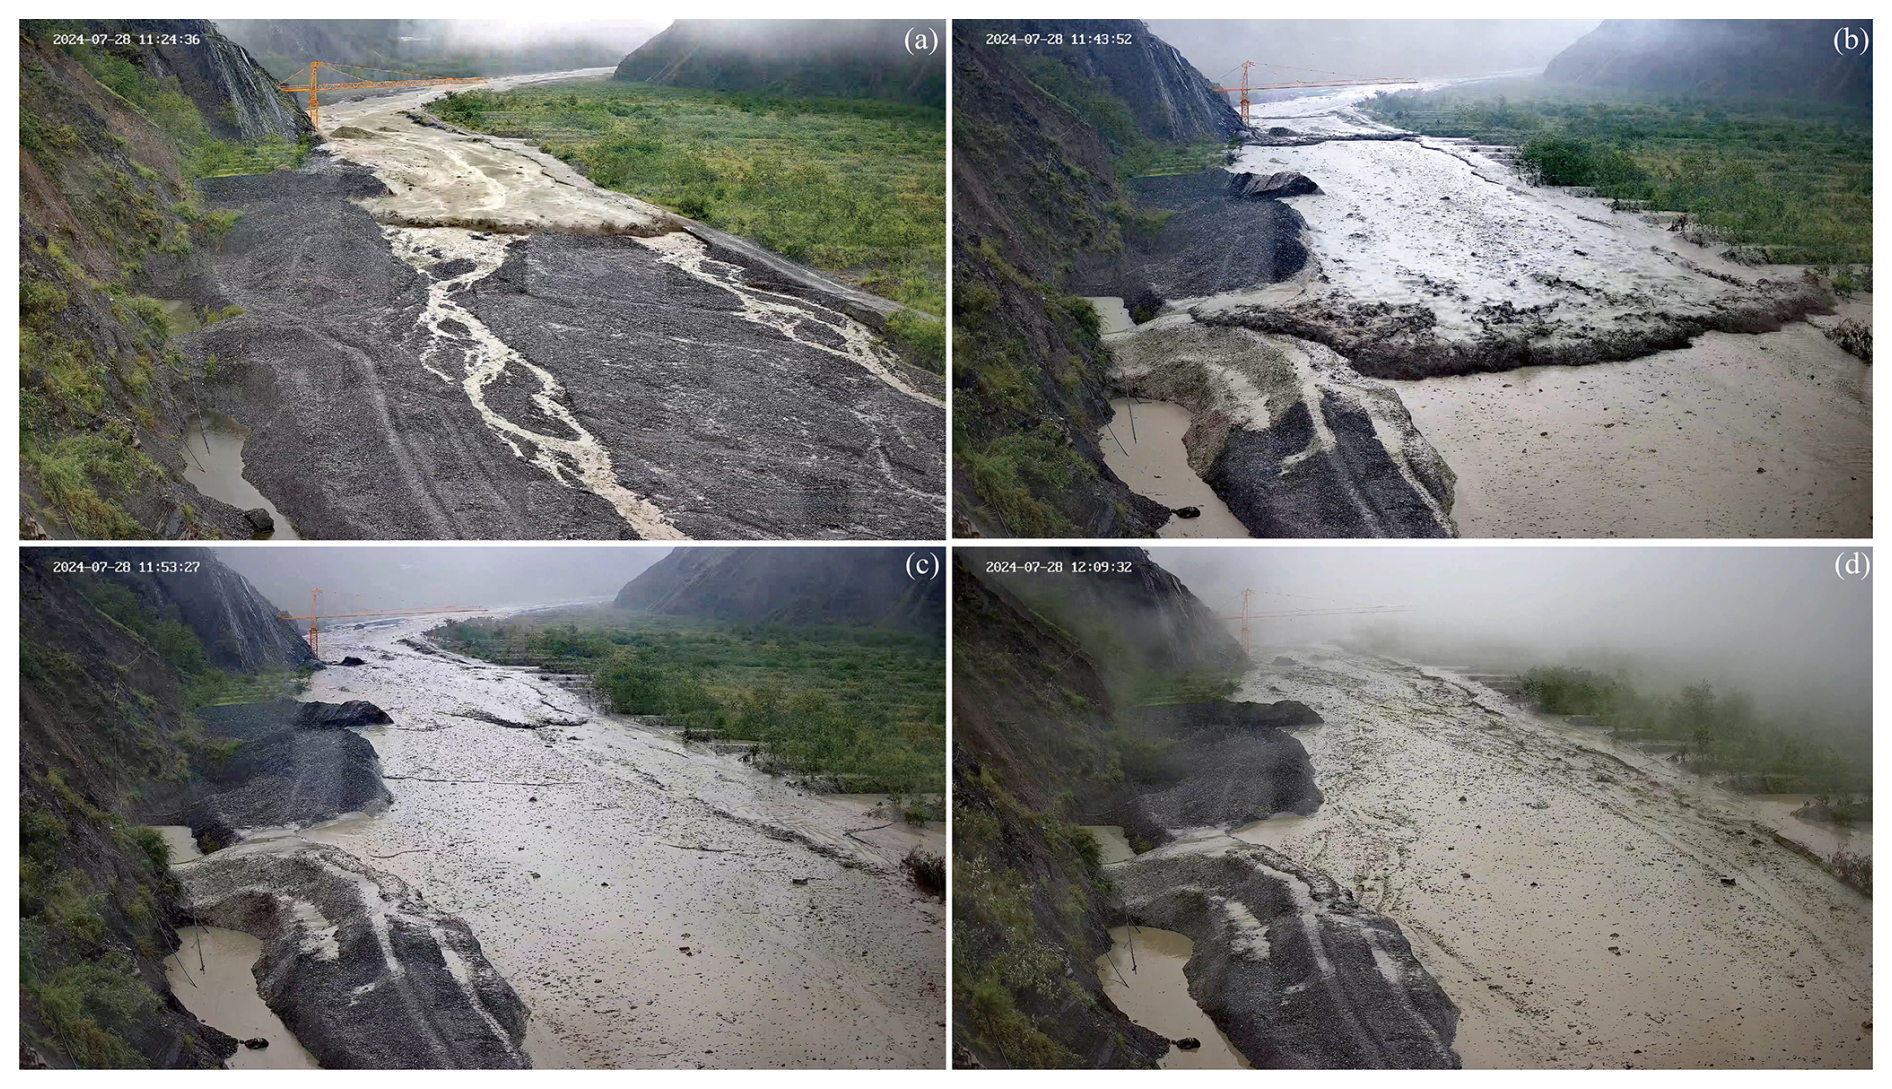
Figure 11Debris-flow video frames captured on 28 July 2024: (a) the first debris-flow surge on a coarse bed, (b) surge flow, (c) continuative flow, and (d) hyperconcentrated flow.
3.1.5 Cross-section elevation
Measurement
To investigate the erosion and deposition resulting from the debris flows, the elevation of various cross-sections was measured after the event. The cross-section elevation was measured using different methods over several decades. From 1962 to 1966, a level gauge was utilized for measurements. In the year 1999 and 2010, measurements were conducted using a total station theodolite. Starting in August 2010, a real-time kinematic (RTK) surveying instrument was employed to measure the cross-section elevation.
Example of results
Figure 12 presents the change in elevation of cross-section M3 from 1999 to 2024. The M3 section is located at the debris-flow observation section (Fig. 1a). Due to the extremely strong siltation of debris flows, the channel has been raised by 11 m in the past 25 years, with an average annual sedimentation height of 0.44 m. The main channel gradually shifted to the right-hand bank and has become narrower and shallower.
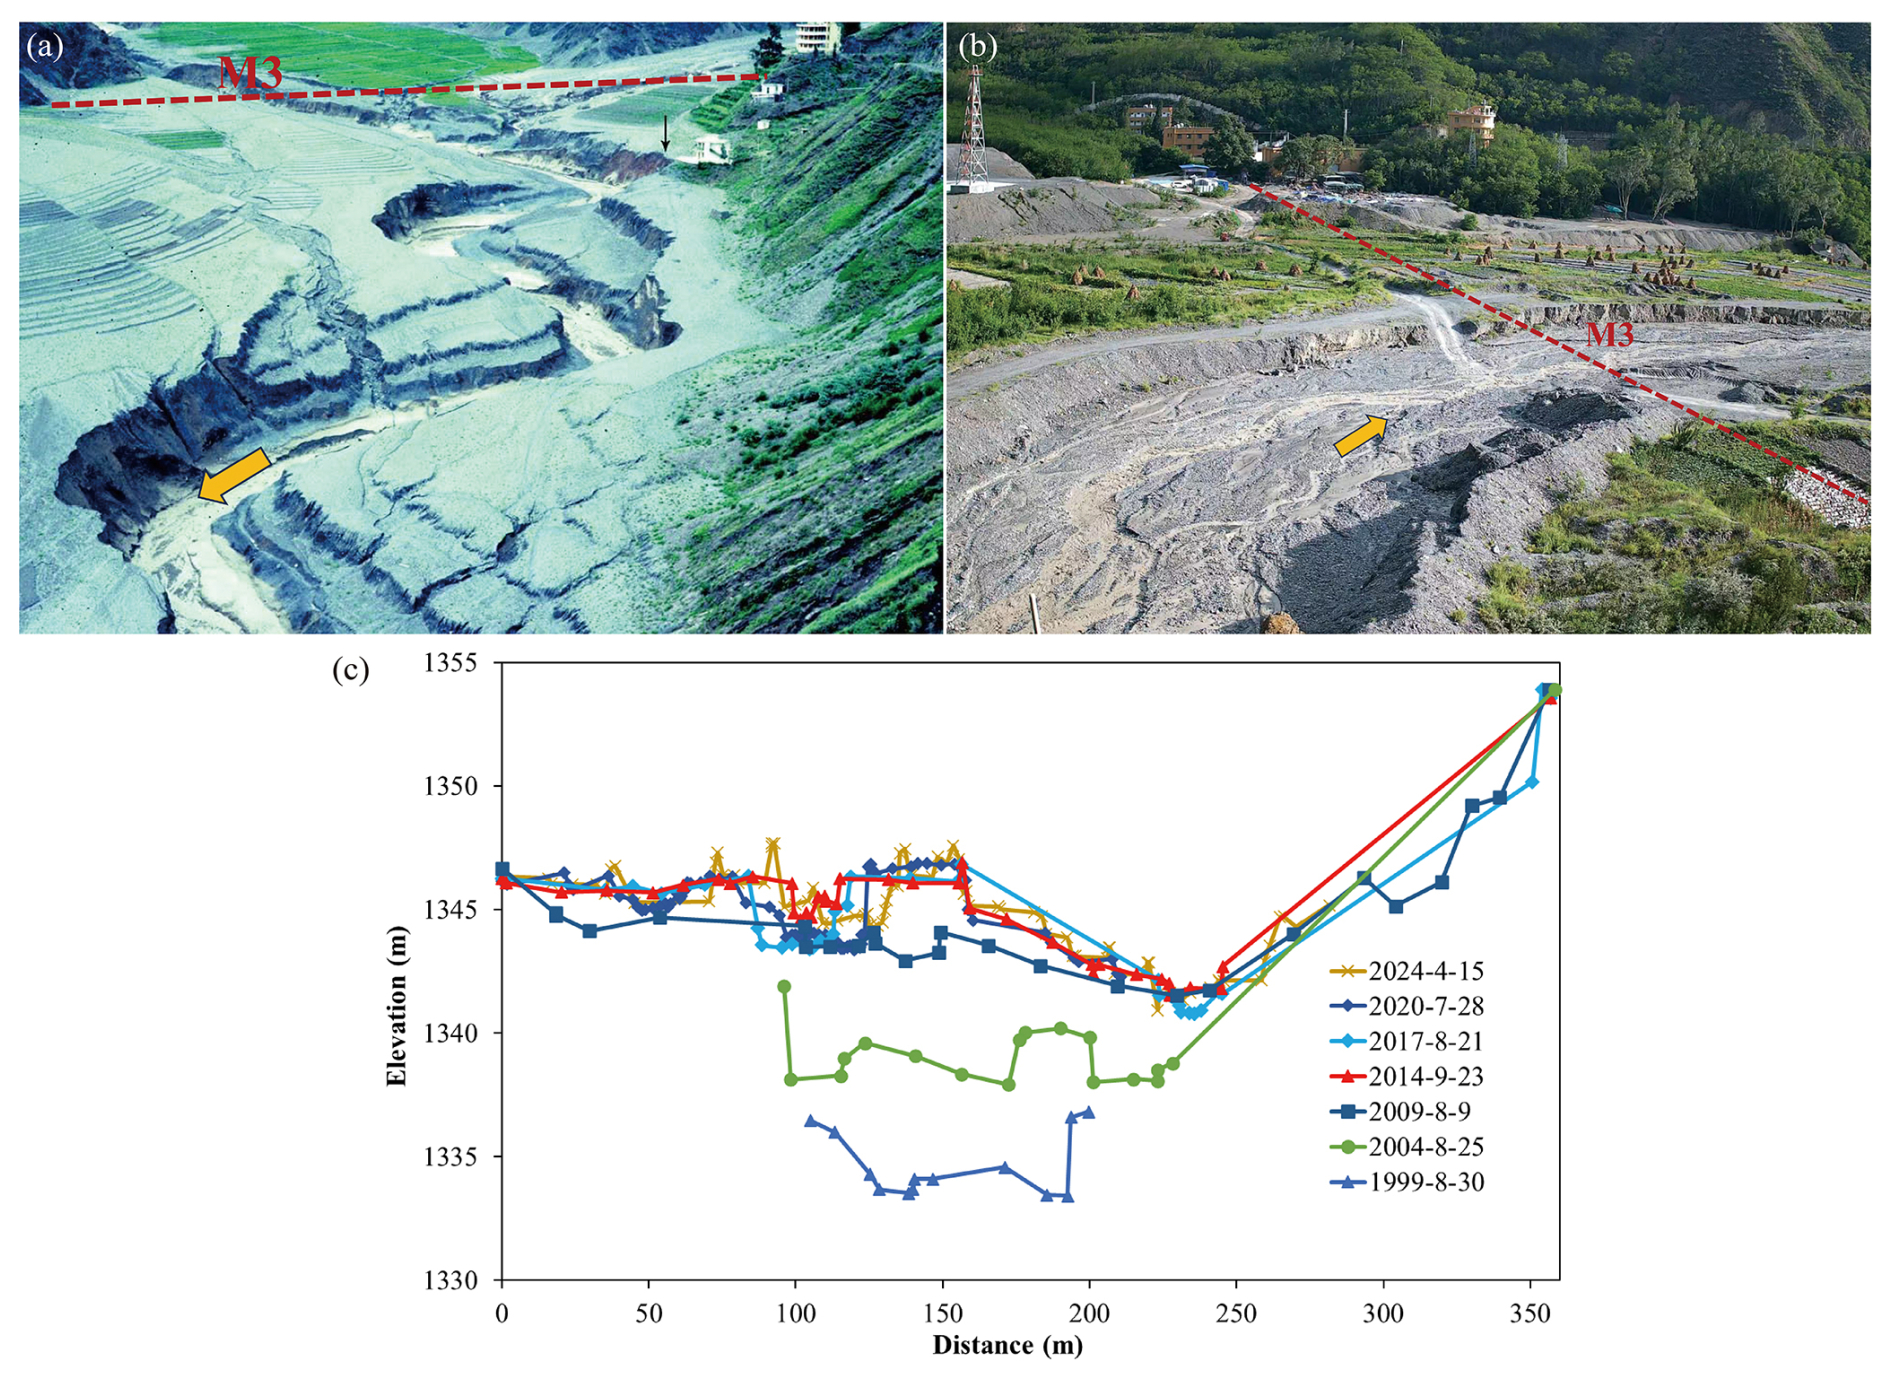
Figure 12(a) Location of cross-section M3 in the 1990s (photo by Richard J. Janda), (b) its location in 2024, and (c) the change in the elevation of cross-section M3 from 1999 to 2024 (from the right-hand bank to the left-hand bank).
3.2 Atmosphere
3.2.1 Rainfall
Measurement
Before 2006, rainfall was measured using a siphon rain gauge with a measurement range of 0.1–10 mm and an error margin of ±0.05 mm. This gauge could measure precipitation intensities from 0.1 to 40 mm (10 min)−1. From 2006 to 2023, rainfall measurements were conducted using a tipping-bucket rain gauge (Fig. 13a), which had a range of 0–4 mm min−1, a minimum measurement increment of 0.1 mm, and a maximum allowable error of ±4 %. In 2024, the rainfall was monitored by piezoelectric rain gauges (Fig. 13b), which had a range of 0–200 mm h−1, a minimum measurement increment of 0.1 mm, and a maximum allowable error of ±4 %.
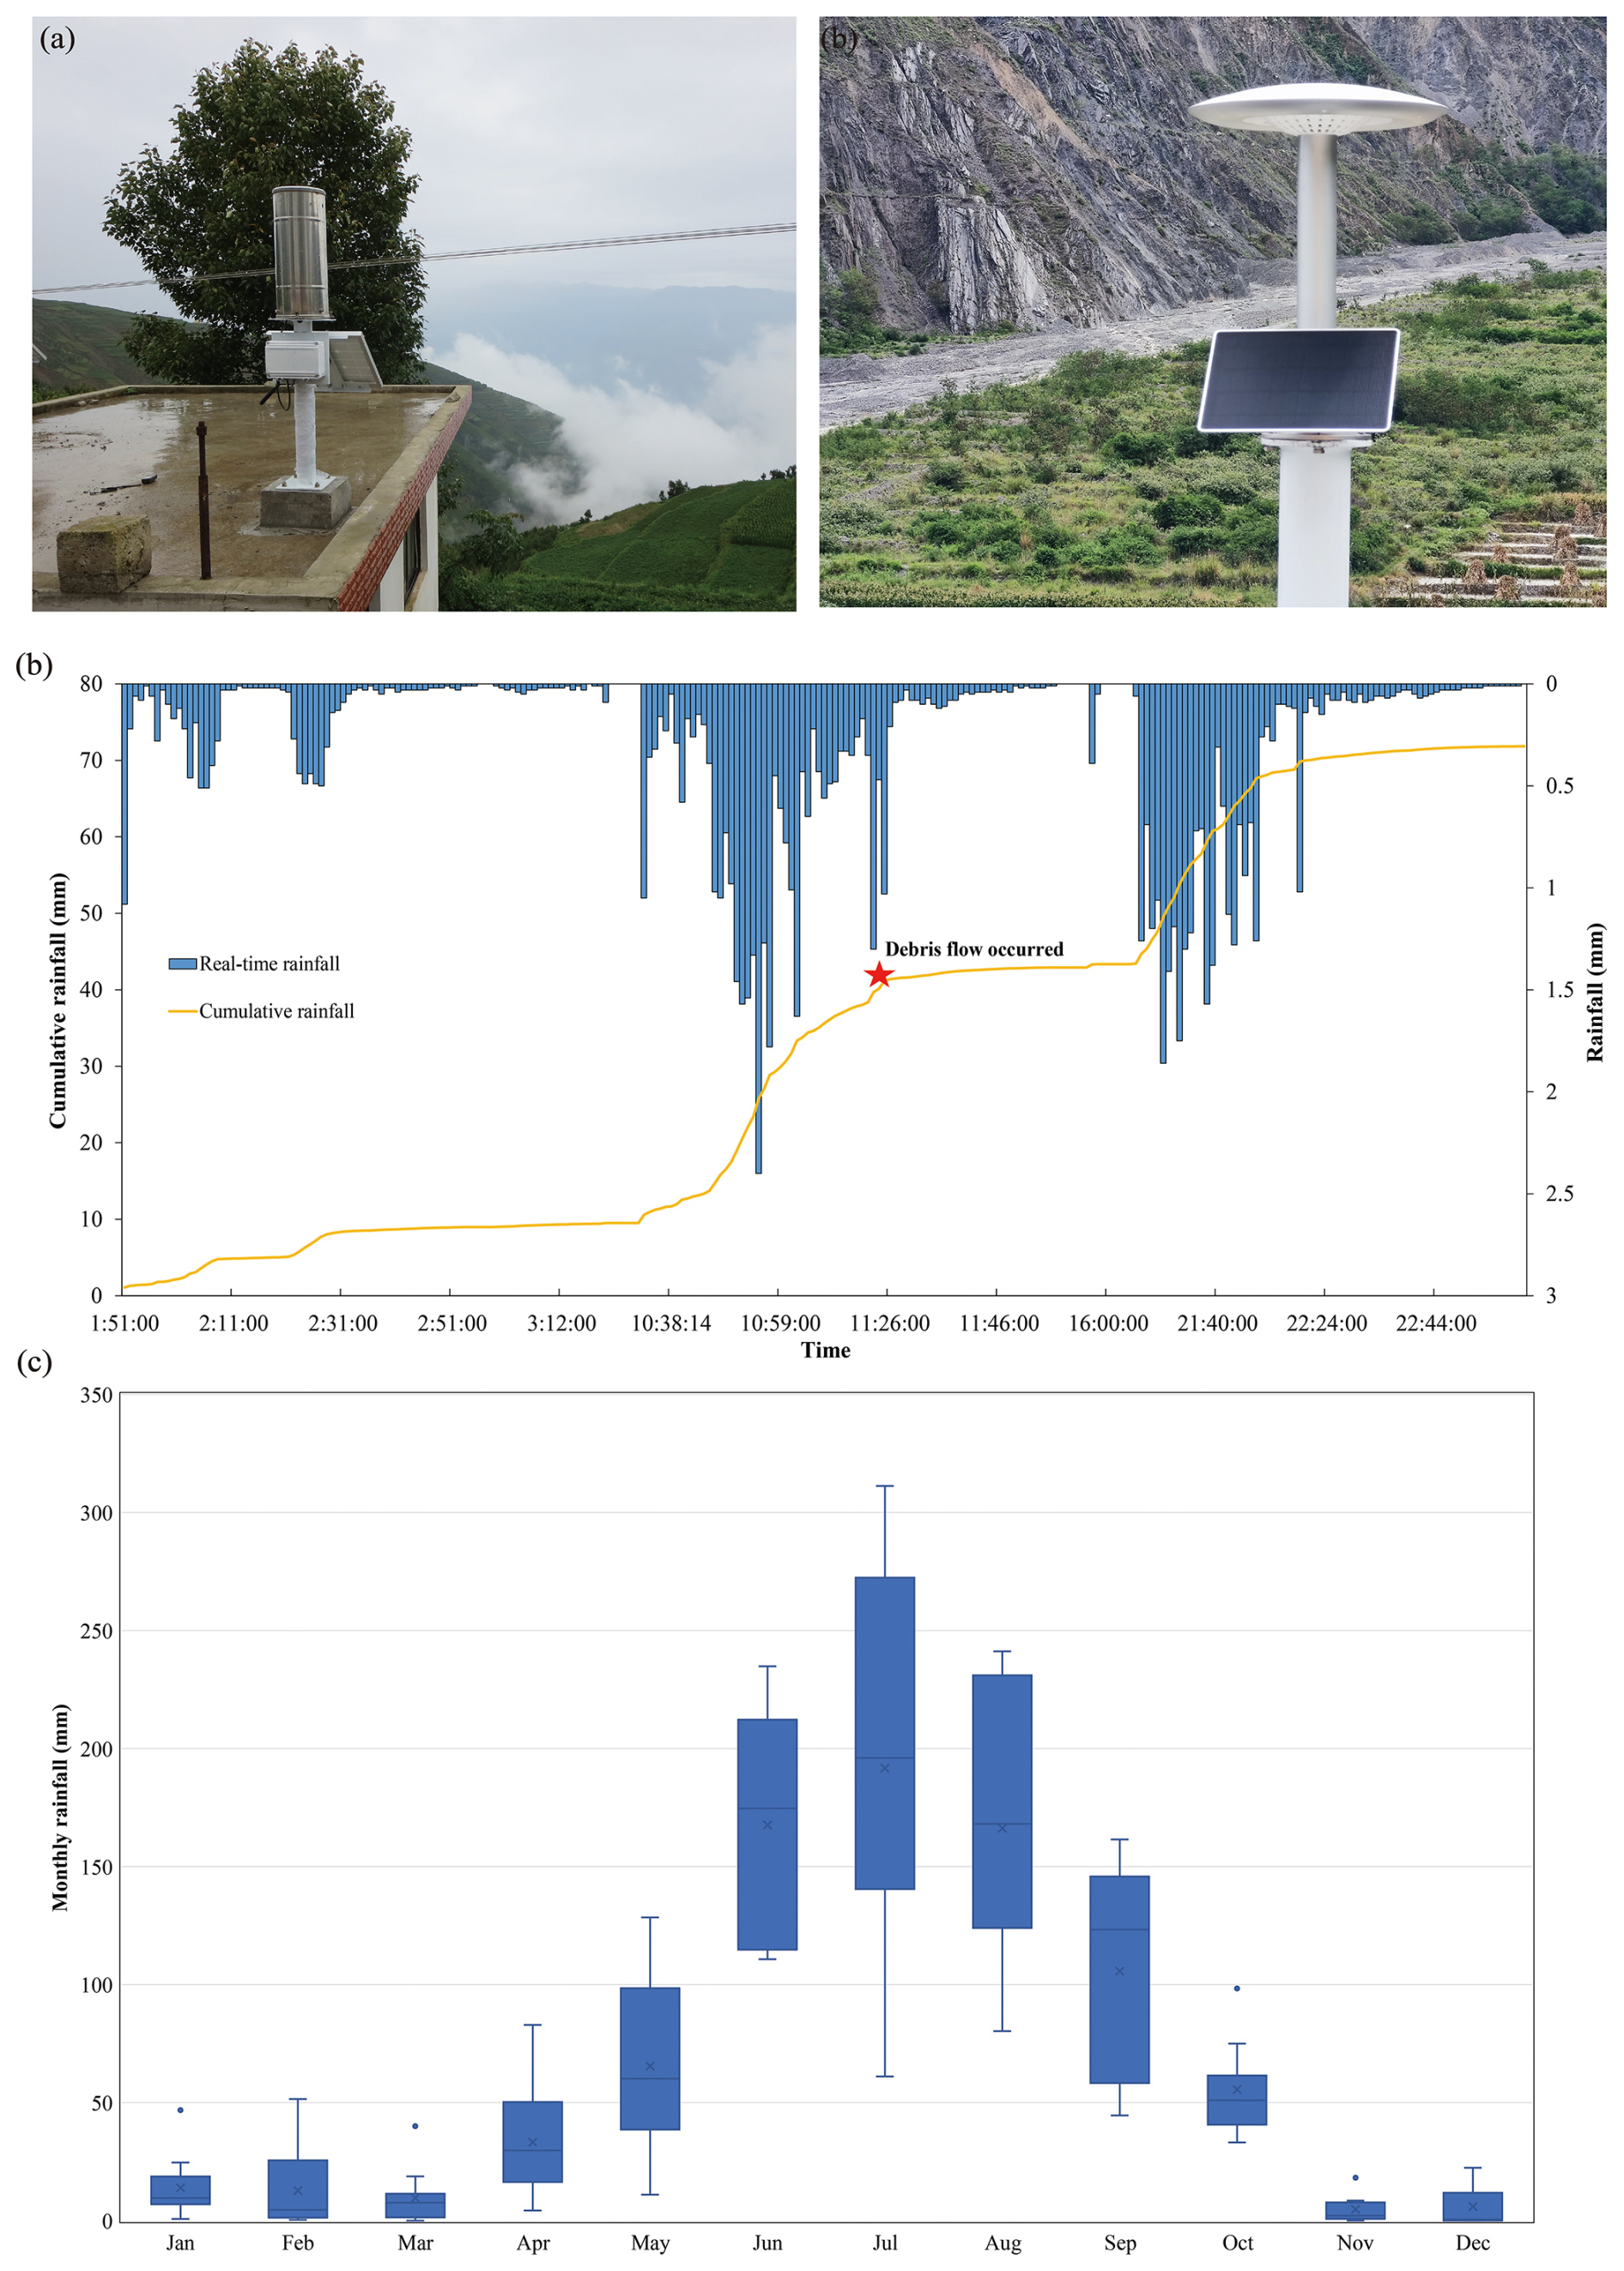
Figure 13(a) Photo of a tipping-bucket rain gauge. (b) Photo of a piezoelectric rain gauge. (c) Real-time and cumulative rainfall at Lijiayakou rain gauge on 28 July 2024. (d) Statistical box plot of monthly rainfall at the Mayiping rain gauge (rainfall data are averaged over the period from 2013 to 2023). The points above the box plot denote extreme monthly rainfall.
Before 2024, the rainfall data were stored in a logger system that recorded rainfall time. Every 3 months, data were retrieved from the logger, and the rain gauge was cleaned if needed (e.g. leaves and spider webs removed). The 2024 rainfall data measured by piezoelectric rain gauge were transmitted wirelessly via 4G signals. With a dome-type sensor area, this new type of rain gauge requires no maintenance.
Example of results
Detailed records of rainfall allow for deep research into the initiation mechanism of debris flows. An example of rainfall measured at 1 min intervals from 01:51 (UTC+8) to 23:00 (UTC+8) on 28 July 2024, at Lijiayakou rain gauge, is shown in Fig. 13c. The debris flow occurred at 11:25, when the cumulative rainfall reached 41.2 mm and rainfall intensity computed over 1 min reached 31.6 mm h−1.
Rainfall records are also aggregated and analyzed on a daily scale. The box plot in Fig. 13d illustrates the distribution of monthly rainfall throughout the year. Rainfall shows obvious seasonality, peaking during the rainy season (June–September) and reaching its lowest levels during the dry season (November–March).
3.2.2 Meteorology
Measurement
Early in the year 1965, meteorological data for Xiadawa included measurements of air pressure, temperature, relative humidity, soil temperature, wind speed, and rainfall. A Cumulus automatic weather station manufactured by ELE International was installed in 2004 and 2005 at the observation station and at Mayiping Station, respectively. In 2024, a new weather station was installed at the observation station, Mayiping Station, and Kuikou Station (see locations in Fig. 1a). It includes soil temperature, air temperature, air humidity, wind direction and speed, radiation, and pressure. Table 1 summarizes the type of instruments, record interval, accuracy, and resolution.
Three climatic stations were installed at three locations at various altitudes within the Xiaojiang River catchment (Nideping Station coordinates are 103.11528 and 26.264444° at an elevation of 1132 m; Daduo Station coordinates are 103.0774 and 26.240339° at an elevation of 2030 m; Yinmin Station coordinates are 103.01156 and 26.26244° at an elevation of 3045 m). The station includes air temperature, air humidity, illuminance, and soil moisture and temperature at different depths. Data are stored in a logger system and are retrieved from the logger every 6 months.
Example of results
The Xiaojiang River catchment is a typical dry, hot valley region in southwestern China, characterized by a prolonged dry season with low precipitation and high evaporation rates (Jiang et al., 2024). Figure 14 illustrates the temporal variation in air temperature at three stations located at different altitudes within the catchment from 10 October to 13 December 2018. The temperature increases as altitude decreases, with an average temperature difference of 10.4 °C between Nideping and Yinmin.
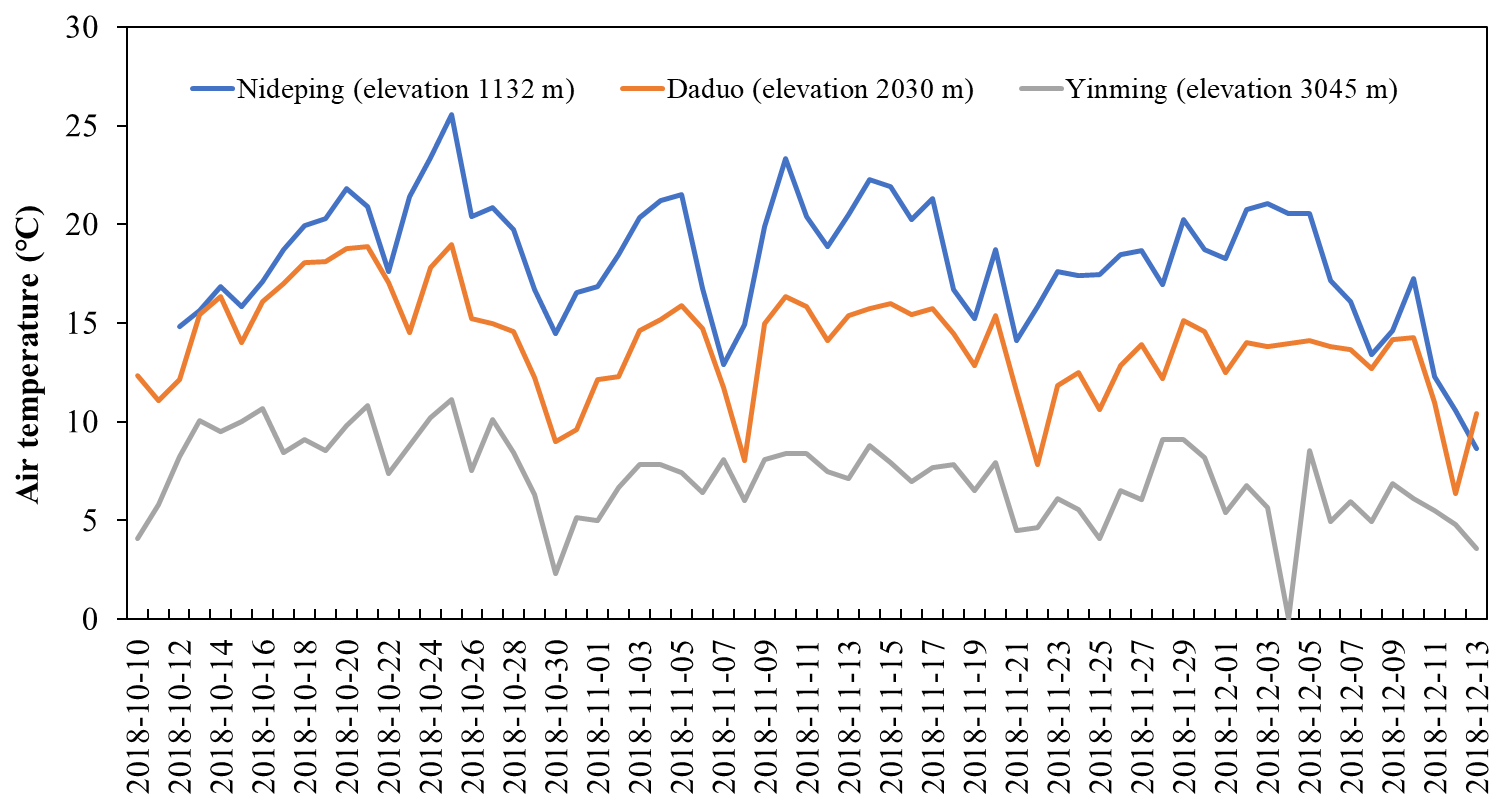
Figure 14Temporal variation in the air temperature at Nideping, Daduo, and Yinmin stations from 10 October to 13 December in 2018.
3.2.3 Soil moisture
Measurement
In 1966, soil moisture at a runoff plot (location see Fig. 1a) was manually sampled and analyzed using the oven-drying method. From 2017 to 2024, MS-20 sensors were used to monitor soil moisture and temperature at depths of 10, 20, and 30 cm at three locations with wide-graded gravelly soil in Jiangjia Ravine. These sensors provide precise soil moisture measurements across a 0 %–100 % range and at temperatures from −40 to 80 °C. The accuracy of moisture measurements varies: ±2 % within the 0 %–53 % range and ±4 % for values exceeding 53 %, up to 100 %. Additionally, the sensors offer a temperature measurement accuracy of ±0.4 °C.
3.3 Runoff and sediment in a runoff plot
Measurement
Naturally restored runoff plots and Leucaena leucocephala runoff plots were built near DDFORS in 2005 (Fig. 15). The runoff plots are 20 m × 5 m in size, and the slope is approximately 22°. In terms of vegetation coverage, the Leucaena leucocephala runoff plots include Leucaena leucocephala (Lam.) de Wit, Leucaena leucocephala (Lam.) de Wit and Agave sisalana Perr. ex Engelm., and Leucaena latisiliqua (L.) Gillis with the crown removed. The naturally restored runoff plots are categorized into forest land dominated by Leucaena leucocephala, agricultural land, and wasteland. These plots have not undergone any artificial interventions, and the data are for reference only. Runoff volume is obtained by measuring the flow volume in an iron bucket. The sediment concentration is obtained by the same method as mentioned above.
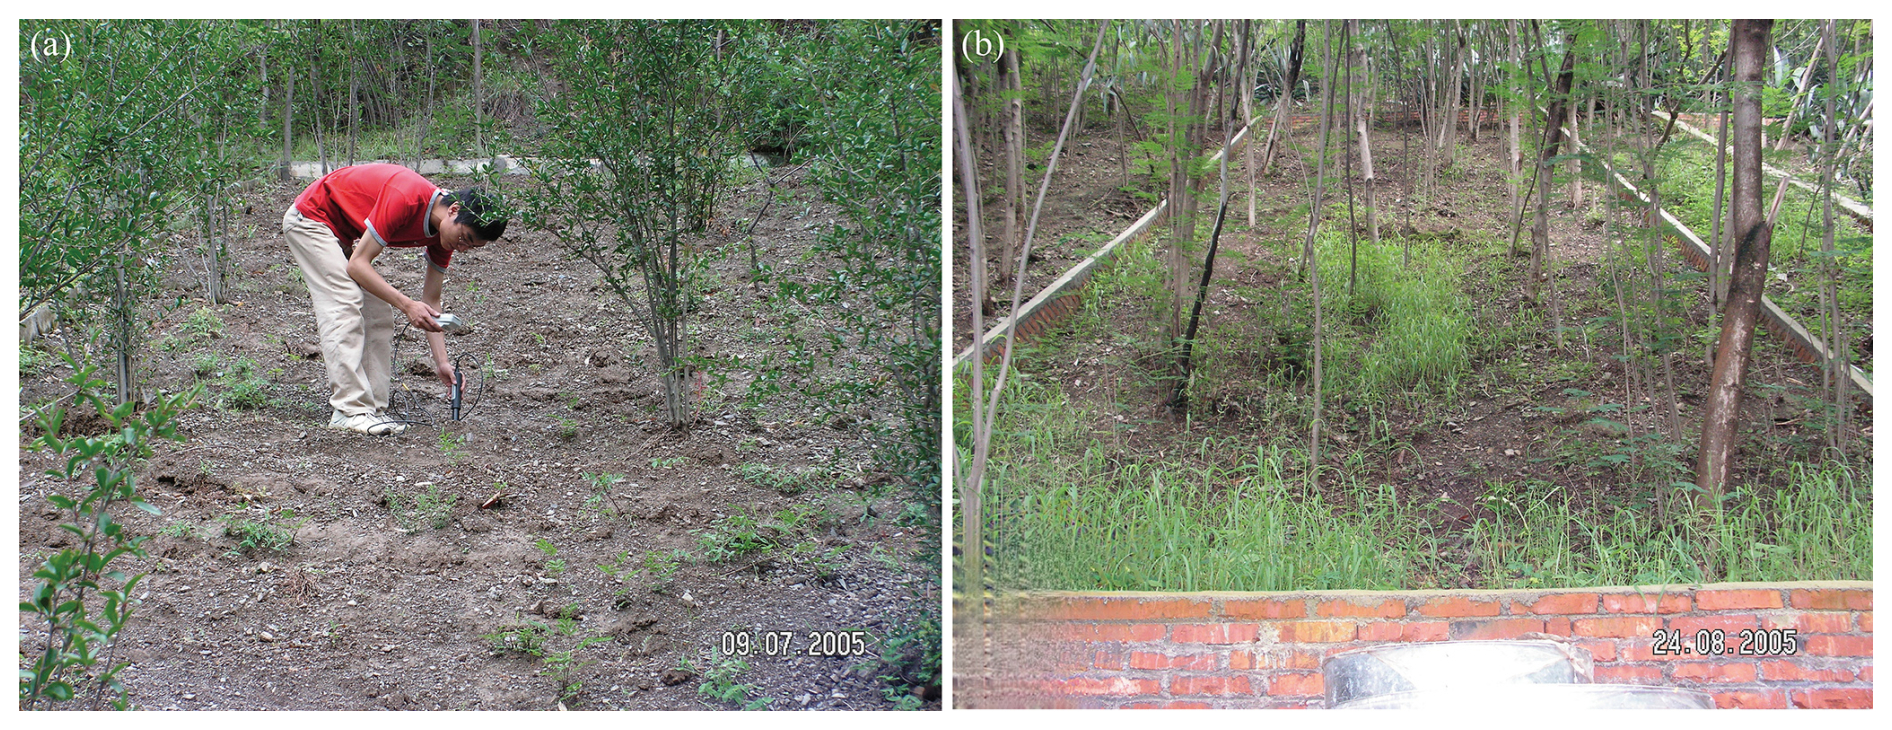
Figure 15Photos of the runoff plot: (a) an agricultural land runoff plot and (b) a forest land runoff plot.
3.4 Suspended sediment in Jiangjia Ravine and Xiaojiang River
Measurement
In 1966, the runoff discharge in Jiangjia Ravine in Baishapo and Xiadawa was estimated based on manually measured flow area and velocity. From 2004, the suspended sediment concentration and grain size distribution were measured in Xiaojiang River at different locations. From 2012, the sediment concentration and sediment grain size distribution of runoff were measured in Jiangjia Ravine. A water sample was manually collected with a volume of 500 mL, and the sediment contained within the sample was then filtered, dried, and weighed. Sediment concentration was determined by comparing the weight of the sediment to the total sample weight. Particle size analysis of the sediment was conducted using a Malvern laser particle size analyzer (Model MS2000).
Example of results
An example of the suspended sediment concentration time series for the Xiaojiang River, obtained from 10 May to 3 December 2007 at Gele Station (103.0611438°, 26.53562376°), is presented in Fig. 16a. The highest concentration, 43 kg m−3, was observed on 13 July. The concentration varied significantly between 11 July and 23 September, a period characterized by frequent debris flows in the Xiaojiang River catchment, which transported large amounts of sediment to the main river. Figure 16b also illustrates the variation in suspended sediment concentration in Jiangjia Ravine between 9 June and 20 August, with the highest concentration, 628 kg m−3, observed on 30 June. Concentrations exceeding 628 kg m−3 were consistently recorded following debris-flow events when floods carried additional sediment and caused a significant increase in the sediment concentration.
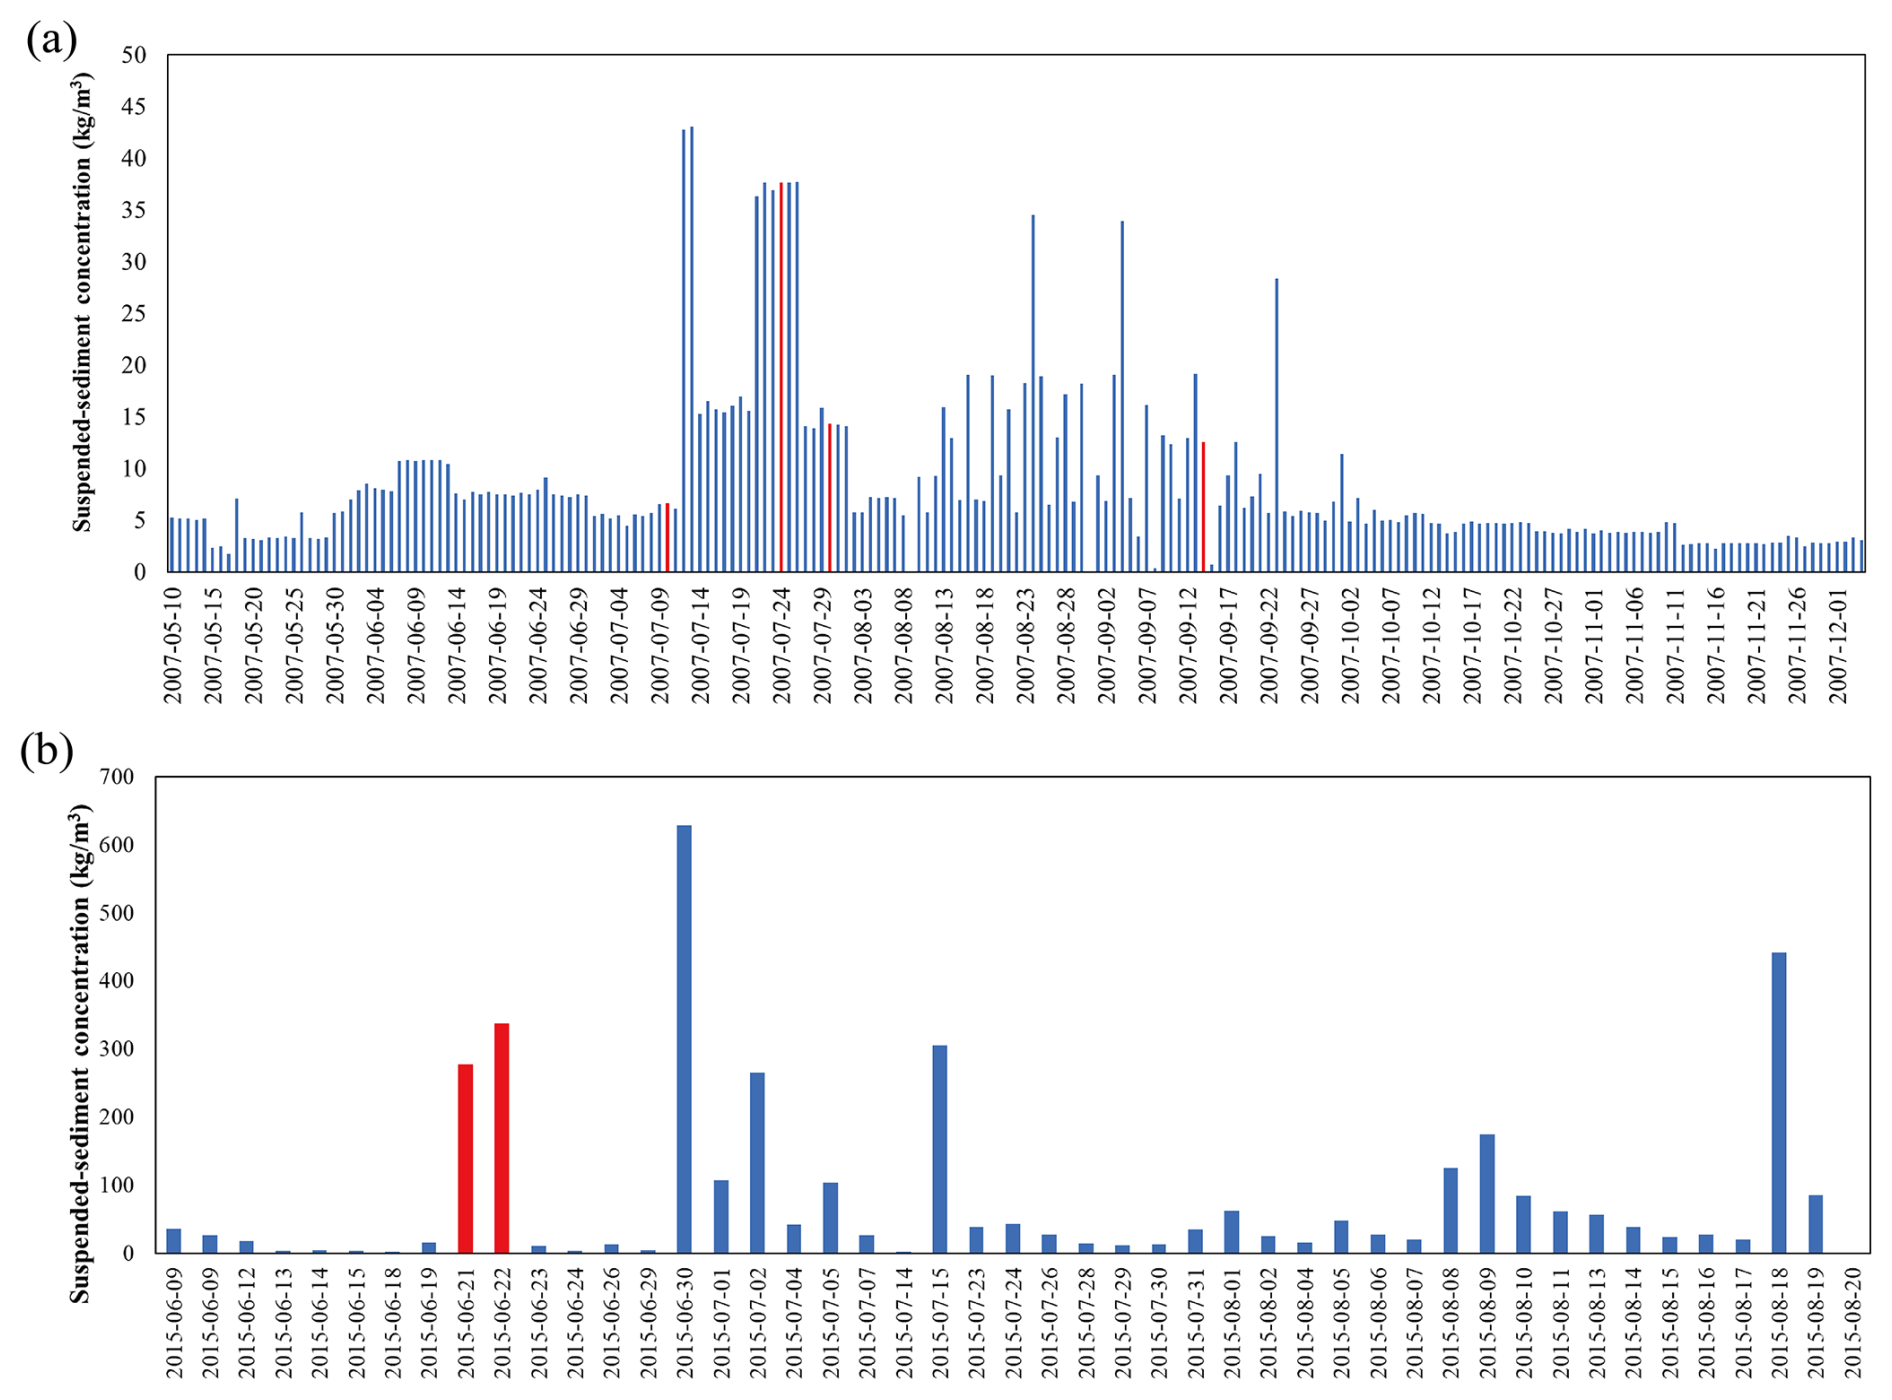
Figure 16Suspended sediment concentration variation: (a) Xiaojiang River at Gele Station in 2007 and (b) Jiangjia Ravine in 2015. The red bars represent water samples collected after the debris-flow event in Jiangjia Ravine.
Most datasets, including debris-flow kinematic data, particle size distribution of debris flows, rheological data of debris-flow slurry, cross-sectional measurement data, sediment concentration, grain size distribution data, and observation data from runoff plots, were obtained through manual observation. These data are considered to have relatively small errors. Additionally, rainfall data from tipping-bucket rain gauges, collected prior to 2024, showed high reliability when cross-validated with data from regional national meteorological stations. In 2024, piezoelectric rain gauges and meteorological stations were installed and underwent performance verification at national benchmark sites before deployment. The correlation coefficients between these instruments and the reference data from national meteorological stations were 0.951 for the piezoelectric rain gauges and 0.996 for the meteorological stations.
This debris-flow dataset is valuable for analyzing the dynamic behavior, deposition, and erosion characteristics of debris flows. Several studies are presented to demonstrate the dataset's potential and to elicit open questions.
4.1 Debris-flow dynamic characteristics
The comprehensive records of debris-flow depth, velocity, density, and discharge enable the analysis of dynamic characteristics of debris flows and the comparison of various computational models (Wu, 1987; Hu et al., 2011b, 2013; Tian et al., 2014; Zhu et al., 2020; Chen et al., 2023, 2024). In the early 1980s, based on observational data from Jiangjia Ravine, Chinese researchers modified the Manning formula for velocity and resistance calculation of viscous (high-solid-concentration) debris flows. These formulas have been widely applied in the design of debris-flow mitigation structures across China (Chen et al., 1983; Kang, 1984, 1987, 1990; Kang et al., 2004; Kwan, 2012). Additionally, Zhang (1993) reported that the impact pressure of debris flows obeys the conservation of momentum (proportional to the unit weight and the square of the flow velocity), while the impulse load of boulders within debris flows varies with the stiffness of the exposed elements.
The flow depth time history (e.g., Fig. 6a) provides solid evidence for the verification of dynamic models. Chen et al. (2024) adopted the surge depth hydrographs measured by ultrasonic sensors (1999–2001) to quantify the eroded deposition depth of surge flows (see Fig. 4c). For surge flows with erosion–deposition propagation, significant downward erosion potential is confirmed. Therefore, the total momentum of surge flow not only originates from the apparent surge front but also includes the momentum within the eroded deposition layer. The revealed erosion pattern and hidden momentum in debris-flow surges may improve the reliability of debris-flow risk assessment.
Based on 5085 debris-flow measurements collected from Jiangjia Ravine between 1990 and 2001, along with 1035 measurements from catchments across Asia, America, Europe, and Oceania, Du et al. (2023) established a criterion for distinguishing debris flows, hyperconcentrated flows, and streamflows. Their findings indicate that sediments in hyperconcentrated flows and streamflows are primarily supported by viscous shear and turbulent stresses, whereas grain collisional stresses play a dominant role in debris-flow dynamics. The study identifies flow discharge and sediment flux as key factors differentiating debris flows, hyperconcentrated flows, and streamflows.
4.2 The non-hydrostatic pore fluid pressure
Current research, integrating field observations (McArdell et al., 2007; Nagl et al., 2020) and flume experiments (Cassar et al., 2005; Iverson et al., 2010; Kaitna et al., 2014; Song et al., 2021, 2023), has recognized the non-hydrostatic pore fluid pressure, notably excess pore fluid pressure, in debris flows. However, direct measurement of basal normal stress, shear stress, and pore fluid pressure in Jiangjia Ravine remains impractical, due to challenges posed by erosion, deposition, and channel migration. To circumvent these limitations, Chen et al. (2023) proposed a simplified analytical method to estimate debris-flow liquefaction. By assuming steady-state flow on a 3.7° slope and neglecting particle-collision-induced resistance, they attributed flow resistance primarily to Coulomb friction regulated by pore fluid pressure and liquid-phase viscosity. Analysis of 93 debris-flow events (1999–2017) revealed near-liquefaction conditions, with the degree of liquefaction ranging from 0.89 to 0.95. Therefore, with the consideration of particle-collision-induced resistance, the degree of liquefaction would be even higher (close to unity). This finding demonstrates that analyses relying on hydrostatic pore fluid pressure assumptions to infer grain-contact stresses (i.e., effective stresses) are invalid. Such approaches, initially introduced by Iverson (1997) to calculate dimensionless parameters (e.g., the Savage number or friction number) for debris flows, have been largely abandoned in light of direct pore fluid pressure and effective stress measurements (Iverson et al., 2010). As a result, we caution against the derivation of flow regime characteristics (by dimensionless parameters) from observational datasets lacking direct basal stress measurements.
4.3 Surge-flow characteristics and surge-flow formation
Debris flows in Jiangjia Ravine propagate as surge waves (roll waves), comprising dozens to hundreds of intermittent surges. Discharge values within a surge series (1966–2004) follow an exponential cumulative distribution, with exponents scaling as a power-law function of peak discharge (Liu et al., 2009). This implies that the mean discharge evolves dynamically during the surge sequence, ultimately decaying via a power-law relationship. Surge velocities in 1994 conform to a Weibull distribution, characterized by stable parameters across events, where the shape parameter correlates with mean velocity (Li et al., 2012). Similarly, the peak discharge–frequency relationship for surges (1987–2004) adheres to a Weibull distribution (Chen et al., 2011), while the magnitude–cumulative frequency relationship aligns with either an exponential function or a linear logarithmic transformation (Liu et al., 2008; Gao et al., 2019). Notably, discharge fluctuations within individual events span 4 orders of magnitude, with sediment transport variability diminishing in a power-law manner as surges progress (Liu et al., 2023).
The debris-flow surge waves carry much higher momentum flux than the continuative flows in the same debris-flow event, posing higher destructive potential to the infrastructures. The formation of surge flows is currently one of the hot research topics of debris-flow dynamics. The discontinuous sediment supply is regarded as a potential explanation for surge flows. The formation of intermittent surges arises from shallow slope failures distributed across broad source areas, rather than discrete large landslides. These failures can be modeled using a Pareto–Poisson process (PPP model), where the intensity parameter is governed by rainfall dynamics in source regions (Guo et al., 2023). Through captured processes by video camera at Chalk Cliffs, Kean et al. (2013) attributed the surge-flow formation to upstream variations in channel slope. The low-gradient sections act as “sediment capacitors,” temporarily storing incoming bed load transported by water flow and periodically releasing the accumulated sediment as debris surges. This “store–release” pattern is also observed in the small branch gullies in Jiangjia Ravine. However, this pattern may not explain the surge behavior in the main channel, which is characterized by a high degree of liquefaction. On the one hand, further understanding of the surge-flow formation relies on the intense and precise instrumentation in the debris-flow source area (e.g., processes captured by video cameras); on the other hand, this understanding benefits from the development of granular-fluid flow models (Meng et al., 2022).
4.4 Debris-flow grain composition
The effect of particle size on debris-flow behavior is a fundamental question. Previous research frameworks have adopted specific particle parameters to distinguish clay, silt, sand, and gravel. Based on particle size distribution data from debris flows in Jiangjia Ravine, Li et al. (2013) developed a generalized grain size distribution model defined by parameters closely linked to key dynamical properties, including flow density, velocity, and discharge. Subsequent studies have demonstrated that grain composition imposes power-law constraints on debris-flow surge fluctuations (Li et al., 2014), while debris-flow density and cumulative sediment yield adhere to a unified sediment size distribution framework (Wang et al., 2018; Liu et al., 2023; Zhang et al., 2025). Observations reveal a progressive increase in fine particles and a corresponding decline in coarse particles during intermittent flow sequences, alongside reductions in the median grain diameter, bimodality parameters, and mass density. The viscous particle content in continuous flows increases incrementally, whereas mass density exhibits a pronounced decrease (Wei and Hu, 2014).
4.5 Debris-flow erosion and deposition characteristics
Between 1966 and 1973, the debris-flow channel in Jiangjia Ravine experienced substantial erosion and deposition due to viscous (high-solid-fraction) debris flows. The average annual scouring depth in the upper reaches was 2–3 m, while the average annual deposition depth in the lower reaches was 2–2.5 m (Kang, 1997). During this period, a single debris-flow event could erode the channel bed to a depth of 2–3 m, sometimes even to 8–10 m (Li et al., 1983). From 1999 to 2003, the relatively lower magnitudes of debris flows led to sediment deposition in the majority of the river sections. However, the increasing annual sediment discharge resulted in a reduction in deposition in the upper reaches and an enhancement of deposition in the lower reaches (Chen et al., 2005). Wei et al. (2017) reported that, between 1999 and 2009, the channel width increased significantly, stabilizing after 2009 when erosion and deposition intensity decreased. From 2003 to 2014, the gradient of the channel profile experienced a gradual increase, eventually reaching 0.07, although the rate of increase slowed after 2009. Debris flows were primarily characterized by siltation in the transportation zone, with variations across different sections. The middle and upper reaches experienced greater siltation, while the lower reaches underwent more substantial scouring (Fang et al., 2018). Overall, from 1962 to 2024, the channel underwent significant siltation. The underlying causes of this channel aggradation may be related to a climate-change-induced reduction in debris-flow frequency or long-term geomorphic evolution controlled by the tectonic activities.
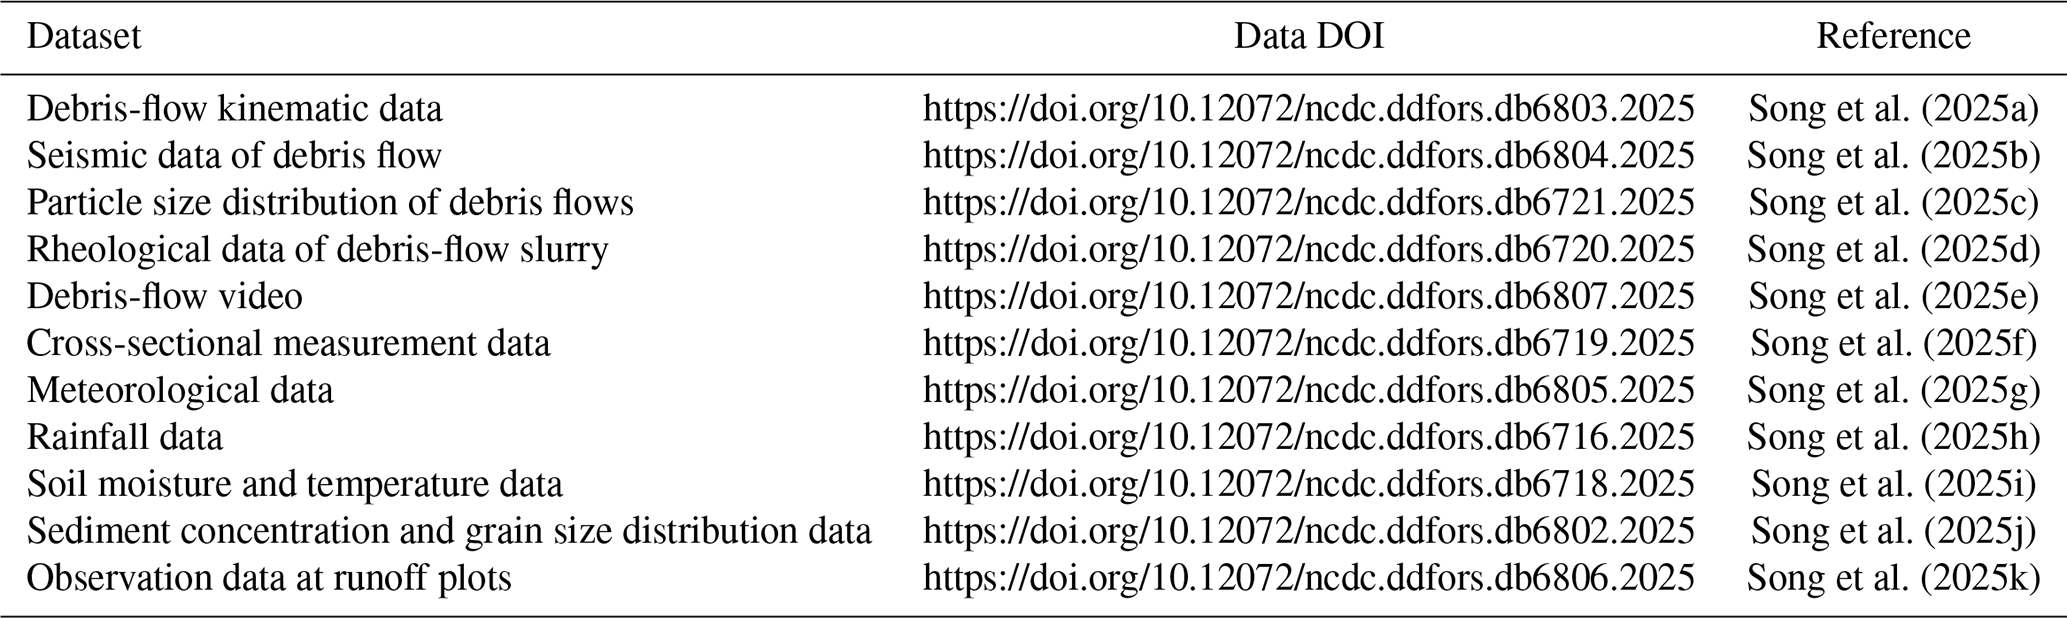
Table 4Dataset categories and the open repository information.
4.6 Rainfall threshold triggering debris flows
Detailed rainfall records have enabled the investigation of rainfall threshold in debris-flow forecasting. A total of 167 debris-flow events in Jiangjia Ravine occurred at night (from 19:00 to 07:00 of the next day), accounting for 58.4 % of the events (Chen et al., 2025). Debris flows are primarily triggered by intraday precipitation lasting 6 h or less, while antecedent precipitation is not a significant factor; intensity–duration (I–D) thresholds for debris flows at 50 %, 70 %, and 90 % probabilities have been determined (Zhuang et al., 2015). In contrast, the rainfall threshold for triggering debris flows does not consistently decrease with increasing antecedent effective precipitation (AEP). In fact, a higher AEP value may require more stringent triggering conditions (Zhang et al., 2023). The relationship between the probability of a debris flow and the AEP can be quantified using a piecewise function. When , the rainfall I–D threshold curves can be described by an exponential function. This indicates that a higher soil water content allows solid material from shallow landslides to become readily available without prolonged rainfall infiltration, and a high soil water content in the topsoil facilitates rapid runoff generation (Zhang et al., 2024). Yang et al. (2024) demonstrated that models using maximum rainfall intensity over short durations and absolute energy are the most effective predictors of debris-flow occurrence. Adding rainfall duration or antecedent rainfall to these models further improves their performance.
The intermittent failure of shallow landslides makes the rainfall-induced debris flows in Jiangjia Ravine even complicated. Guo et al. (2020) revealed that a debris flow is the product of a rainfall-induced “normal” or “abnormal” hydrological process involving the supply of soil materials. They argued that, although various types of debris flows may require similar rainfall conditions, the threshold for debris-flow initiation can be expressed as a power function. Debris flows are more closely related to rainfall patterns than to rainfall amounts, typically occurring within 6 h of a rainfall event characterized by a high mean intensity and short duration. However, the formation type, process, and discharge of debris flows show no direct relationship with rainfall amount. These findings highlight the significance of soil supply in debris-flow formation through random disturbances to the normal hydrological process. Additionally, Guo et al. (2021) demonstrated that interpolation errors decrease with higher rainfall amounts, while the representativeness of rain gauges diminishes when the distance between gauges exceeds 3 km. The influence of climate change, such as changes in precipitation intensity and frequency and changes in temperature, on the triggering mechanisms of debris flows in Jiangjia Ravine requires further analysis.
For a more comprehensive list of data-based research papers, please refer to https://nsl.imde.ac.cn/en/publ/article_2020/ (last access: 25 September 2025).
Debris-flow, atmospheric, runoff, and sediment data (including the suspended sediment concentration and particle size in the Xiaojiang River) are publicly accessible through the National Cryosphere Desert Data Center (NCDC) (https://doi.org/10.12072/ncdc.ddfors.db6803.2025; https://doi.org/10.12072/ncdc.ddfors.db6804.2025; https://doi.org/10.12072/ncdc.ddfors.db6721.2025; https://doi.org/10.12072/ncdc.ddfors.db6720.2025; https://doi.org/10.12072/ncdc.ddfors.db6807.2025; https://doi.org/10.12072/ncdc.ddfors.db6719.2025; https://doi.org/10.12072/ncdc.ddfors.db6805.2025; https://doi.org/10.12072/ncdc.ddfors.db6716.2025; https://doi.org/10.12072/ncdc.ddfors.db6718.2025; https://doi.org/10.12072/ncdc.ddfors.db6802.2025; https://doi.org/10.12072/ncdc.ddfors.db6806.2025; Song et al., 2025a–k). The dataset is organized into 11 categories: dynamic parameters of debris flow, seismic data, particle size distribution of debris-flow sediment, yield stress and viscosity of debris-flow slurry, debris-flow video footage, cross-sectional elevation of the debris-flow channel, rainfall, meteorological data, soil moisture, runoff and sediment data in runoff plots, and suspended sediment concentration (Table 4). Detailed descriptions of the measurement methods, data collection locations, and data processing techniques are included for each category. All data files are provided in China standard time (CST, UTC+8).
This debris-flow dataset will be updated using newly collected measure data at a 1-year interval. The updated dataset will continue to be released freely and publicly via the National Cryosphere Desert Data Center (NCDC).
We present a comprehensive dataset of debris-flow and hydrometeorological observations collected from 1961 to 2024 in Jiangjia Ravine. This collection encompasses detailed measurements of kinematic parameters (such as debris-flow velocity, depth, and surge discharge) and physical–mechanical parameters (including particle size, yield stress, and viscosity), along with seismic data. In addition, it features extensive records of rainfall, soil moisture, and suspended sediment concentrations at the catchment scale. The breadth of this documentation supports rigorous analyses of debris-flow initiation, transport, and deposition, while highlighting the crucial role of hydrometeorological conditions, particularly rainfall, in triggering debris flows. Furthermore, the suspended sediment concentration data provide valuable insights into sediment transport within mountainous watersheds prone to frequent debris-flow events. The dataset is also useful for the research on the influence of climate change on debris-flow occurrence and tectonic–disaster–geomorphic evolution. Overall, this dataset constitutes a vital resource with a significant potential to advance both theoretical and practical research on debris-flow processes.
DS designed the framework of this research; LW, XG, CS, and HT performed the data analyses and wrote the manuscript; ZK, JZ, GO, PC, FW, KH, LS, GGDZ, DS, WZ, and YZ contributed to data collection; YH and XL installed and maintained the instruments and infrastructure.
The contact author has declared that none of the authors has any competing interests.
Publisher's note: Copernicus Publications remains neutral with regard to jurisdictional claims made in the text, published maps, institutional affiliations, or any other geographical representation in this paper. The authors bear the ultimate responsibility for providing appropriate place names. Views expressed in the text are those of the authors and do not necessarily reflect the views of the publisher.
We would like to thank Jishan Wu, Pinghua Hu, Jingwu Chen, Renwen Yang, Yuyi Wang, Jingri Chen, Huifang Diao, Guisheng Luo, Mingfu Ye, Xingwen Wu, Gang Xiong, Yuzhang Wang, Kai Wang, Ningsheng Chen, Xuelan Liu, Shucheng Zhang, Shunli Chen, Guoqiang Tu, Youfu Zhang, Shufen Hu, Zunlan Cheng, Yong You, Jinshan Zhang, and all of the other colleagues of the Dongchuan Debris Flow Observation and Research Station (DDFORS), Chinese Academy of Sciences, who have contributed to the field observations of the Jiangjia Ravine debris flows since the year 1961.
This work has been financially supported by the Science and Technology Research Program of Institute of Mountain Hazards and Environment, Chinese Academy of Sciences (grant no. IMHE-JCCX-02); the National Natural Science Foundation of China (grant nos. 42477193 and 52409109); and the National Cryosphere Desert Data Center (grant no. E01Z790201).
This paper was edited by Zihao Bian and reviewed by two anonymous referees.
Aaron, J., Spielmann, R., McArdell, B. W., and Graf, C.: High-frequency 3D LiDAR measurements of a debris flow: A novel method to investigate the dynamics of full-scale events in the field, Geophys. Res. Lett., 50, e2022GL102373, https://doi.org/10.1029/2022GL102373, 2023.
Abancó, C., Hürlimann, M., and Moya, J.: Analysis of the ground vibration generated by debris flows and other torrential processes at the Rebaixader monitoring site (Central Pyrenees, Spain), Nat. Hazards Earth Syst. Sci., 14, 929–943, https://doi.org/10.5194/nhess-14-929-2014, 2014.
Arattano, M. and Marchi, L.: Systems and sensors for debris-flow monitoring and warning, Sensors, 8, 2436–2452, https://doi.org/10.3390/s8042436, 2008.
Bel, C., Navratil, O., Liébault, F., Fontaine, F., Bellot, H., and Laigle, D.: Monitoring debris flow propagation in steep erodible channels, in: Engineering geology for society and territory, vol. 3, edited by: Lollino, G., Arattano, M., Rinaldi, M., Giustolisi, O., Marechal, J.-C., and Grant, G. E., Springer International Publishing, 103–107, https://doi.org/10.1007/978-3-319-09054-2_20, 2015.
Berger, C., McArdell, B., and Schlunegger, F.: Direct measurement of channel erosion by debris flows, Illgraben, Switzerland, J. Geophys. Res., 116, F01002, https://doi.org/10.1029/2010JF001722, 2011.
Berti, M., Genevois, R., Simoni, A., and Tecca, P. R.: Field observations of a debris flow event in the Dolomites, Geomorphology, 29, 265–274, https://doi.org/10.1016/S0169-555X(99)00018-5, 1999.
Berti, M., Genevois, R., La Husen, R., Simoni, A., and Tecca, P. R.: Debris flow monitoring in the Acquabona watershed on the Dolomites (Italian Alps), Phys. Chem. Earth, 25, 707–715, https://doi.org/10.1016/S1464-1909(00)00090-3, 2000.
Blasone, G., Cavalli, M., and Cazorzi, F.: Debris-flow monitoring and geomorphic change detection combining laser scanning and fast photogrammetric surveys in the Moscardo catchment (Eastern Italian Alps), In: Engineering geology for society and territory, vol. 3, edited by: Lollino, G., Arattano, M., Rinaldi, M., Giustolisi, O., Marechal, J., and Grant, G. E., Springer, 51–54, https://doi.org/10.1007/978-3-319-09054-2_10, 2015.
Cassar, C., Nicolas, M., and Pouliquen, O.: Submarine granular flows down inclined planes, Phys. Fluids, 17, 103301, https://doi.org/10.1063/1.2069864, 2005.
Chen, G. X., Wang, J. K., Wang, H. L.: Debris Flow Prevention and Control, China Railway Publishing House, 71–80, ISBN 15043 6443, https://pdfyl.ertongbook.com/85/34869821.pdf (last access: 20 November 2025) 1983.
Chen, J., He, Y. P., and Wei, F. Q.: Debris flow erosion and deposition in Jiangjia gully, Yunnan, China, Environ. Geol., 48, 771–777, https://doi.org/10.1007/s00254-005-0017-z, 2005.
Chen, J. W.: A Preliminary Analysis of the Relation Between Debris Flow and Rainstorm at Jiangjia Gully of Dongchuan in Yunnan, Memoris of Lanzhou Institute of Glaciology and Cryopedology, Chinese Academy of Science, 4, 88–96, https://doi.org/10.3133/pp1671, 1985.
Chen, N. S., Yang, C. L., Zhou, W., Wei, F. Q., Li, Z. L., Han, D., and Hu, G. S.: A new total volume model of debris flows with intermittent surges: based on the observations at Jiangjia Valley, southwest China, Nat. Hazards, 56, 37–57, https://doi.org/10.1007/s11069-010-9548-z, 2011.
Chen, Q., Song, D., Chen, X., and Zhong, W.: Visco-collisional scaling law of flow resistance and its application in debris-flow mobility, J. Geophys. Res.-Earth, 128, e2022JF006712, https://doi.org/10.1029/2022JF006712, 2023.
Chen, Q., Song, D., Chen, X., Feng, L., Li, X., Zhao, W., and Zhang, Y.: The erosion pattern and hidden momentum in debris-flow surges revealed by simple hydraulic jump equations, Water Resour. Res., 60, e2023WR036090, https://doi.org/10.1029/2023WR036090, 2024.
Chen, Q., Song, D., Wei, L., Jiang, H, Tang, H., and Wang, Y.: The nocturnal occurrence of debris flows: evidence from western China, npj Natural Hazards, 2, 1–15, https://doi.org/10.1038/s44304-025-00114-2, 2025.
Coe, J., Kean, J., McCoy, S., Staley, D., and Wasklewicz, T.: Chalk Creek Valley: Colorado's natural debris-flow laboratory, Geol. Soc. Am. Field Guides, 18, 95–117, https://doi.org/10.1130/2010.0018(05), 2010.
Comiti, F., Marchi, L., Macconi, P., Arattano, M., Bertoldi, G., Borga, M., Brardinoni, F., Cavalli, M., D'Agostino, V., Penna, D., and Theule, J.: A new monitoring station for debris flows in the European Alps: first observations in the Gadria basin, Nat. Hazards, 73, 1175–1198, https://doi.org/10.1007/s11069-014-1088-5, 2014.
Coviello, V., Arattano, M., and Turconi, L.: Detecting torrential processes from a distance with a seismic monitoring network, Nat. Hazards 78, 2055–2080 https://doi.org/10.1007/s11069-015-1819-2, 2015.
Cui, P., Chen, X. Q., Wang, Y. Y., Hu, K. H., and Li, Y.: Jiangjia Ravine debris flows in south-western China, in: Debris-flow hazards and related phenomena, edited by: Jakob, M. and Hungr, O., Springer, Berlin, https://link.springer.com/chapter/10.1007/3-540-27129-5_22 (last access: 25 September 2025), 2005.
Du, J., Zhou, G. G. D., Tang, H., Turowski, J. M., and Cui, K. F. E.: Classification of stream, hyperconcentrated, and debris flow using dimensional analysis and machine learning, Water Resour. Res., 59, e2022WR033242, https://doi.org/10.1029/2022WR033242, 2023.
Fan, X., Scaringi, G., Domènech, G., Yang, F., Guo, X., Dai, L., He, C., Xu, Q., and Huang, R.: Two multi-temporal datasets that track the enhanced landsliding after the 2008 Wenchuan earthquake, Earth Syst. Sci. Data, 11, 35–55, https://doi.org/10.5194/essd-11-35-2019, 2019.
Fang, Y. C., Wang, D. J., He, S. T., Lan, H. J., and Chang, S. Q.: Characteristics of debris flow erosion and deposition at Jiangjia Gully, Dongchuan, Yunnan Province, China for 2003–2014, Mountain Research, 36, 907–916, https://doi.org/10.16089/j.cnki.1008-2786.000386, 2018.
Fuchs, S., Ornetsmüller, C., and Totschnig, R.: Spatial scan statistics in vulnerability assessment: an application to mountain hazards, Nat. Hazards, 64, 2129–2151, https://doi.org/10.1007/s11069-011-0081-5, 2012.
Gao, Y. C., Chen, N. S., Hu, G. S., and Deng, M. F.: Magnitude-frequency relationship of debris flows in the Jiangjia Gully, China, J. Mt. Sci., 16, https://doi.org/10.1007/s11629-018-4877-6, 2019.
Genevois, R., Tecca, P., Breti, M., and Simoni, A.: Debris-flow in the dolomites: experimental data from a monitoring system, in: Debris-flow hazards mitigation: mechanics, prediction, and assessment, Proceedings of the 2nd international conference, edited by: Wieczorek, G. F. and Naeser, N. D., Balkema Press, Taipei, Taiwan, Rotterdam, 283–291, 16–18, https://www.mendeley.com/catalogue/8c98474c-a214-34cc-98ef-f3ad22bd9643/ (last access: 25 September 2025), 2000.
Guo, X. J., Su, F. H., Hong, Y., and Zou, Q.: Characteristics of hydrogen and oxygen isotopes in rainy season precipitation in Jiangjiagou Watershed, Research of Soil and Water Conservation, 19, 82–85, 2012.
Guo, X. J., Li, Y., Cui, P., Yan, H., and Zhuang, J. Q.: Intermittent viscous debris flow formation in Jiangjia Gully from the perspectives of hydrological processes and material supply, J. Hydrol., 589, 125184, https://doi.org/10.1016/j.jhydrol.2020.125184, 2020.
Guo, X. J., Li, Y., Chen, X. C., Zhang, J., and Sun, Y. Q.: Variation of debris flow/flood formation conditions at the watershed scale in the Wenchuan Earthquake area, Landslides, 18, 1–17, https://doi.org/10.1007/s10346-021-01644-2, 2021.
Guo, X. J., Li, Y., Yao, Y. J., Liu, D. C., and Zhang, J.: A Pareto-Poisson process model for intermittent debris flow surges developing from slope failures, Eng. Geol., 314, 106998, https://doi.org/10.1016/j.enggeo.2023.106998, 2023.
Hirschberg, J., Fatichi, S., Bennett, G. L., McArdell, B. W., Peleg, N., Lane, S. N., Schlunegger, F., and Molnar, P.: Climate change impacts on sediment yield and debris flow activity in an Alpine catchment, J. Geophys. Res.-Earth, 126, e2020JF005739, https://doi.org/10.1029/2020JF005739, 2021.
Hirschberg, J., McArdell, B. W., and Mirus, B. B.: Volumetric Water Content Measurements at Illgraben 2022, EnviDat [data set], https://doi.org/10.16904/envidat.489, 2024.
Hu, K. H., Hu, C., Li, Y., and Cui, P.: Characteristics and mechanism of debris-flow surges at Jiangjia Ravine, in: 5th international conference on debris-flow hazards mitigation: mechanics, prediction and assessment, edited by: Genevois, R., Hamilton, D. L., and Prestininzi, A., 211–217, https://doi.org/10.4408/IJEGE.2011-03.B-025, 2011a.
Hu, K. H., Wei, F. Q., and Li, Y.: Real-time measurement and preliminary analysis of debris-flow impact force at Jiangjia Ravine, China, Earth Surf. Proc. Land., 36, 1268–1278, https://doi.org/10.1002/esp.2155, 2011b.
Hu, K. H., Mi, T., and Li, Y: The Influence of Flow Width on Mean Velocity of Debris Flows in Wide Open Channel, Journal of Hydraulic Engineering, 139, 65–69, https://doi.org/10.1061/(ASCE)HY.1943-7900.0000648, 2013.
Hübl, J. and Kaitna, R.: Sediment delivery from the Lattenbach catchment by debris floods and debris flows, EGU General Assembly, 2–7 May 2010, Vienna, Austria, 10585, https://docslib.org/doc/7009467/sediment-delivery-from-the-lattenbach-catchment-to-the-river-sanna-by-debris-floods-and-debris-flows (last access: 25 September 2025), 2010.
Hübl, J. and Mikoš, M.: Practice guidelines on monitoring and warning technology for debris flows, in: Landslide Dynamics: ISDR-ICL Landslide Interactive Teaching Tools, edited by: Sassa, K., Guzzetti, F., Yamagishi, H., Arbanas, Ž., Casagli, N., McSaveney, M., and Dang, K., Springer Nature, 567–585, https://doi.org/10.1007/978-3-319-57774-6_41, 2018.
Hübl, J. and Moser, M.: Risk management in Lattenbach: a case study from Austria, in: Monitoring. Simulation, prevention and remediation of dense and debris flows, edited by: Lorenzi, G., Brebbia, C., and Emmanouloudis, D., WIT Press, Southamption, 333–342, https://doi.org/10.2495/DEB060321, 2006.
Hübl, J., Schimmel, A., and Koschuch, R.: Monitoring of debris flows with an improved system setup at the lattenbach catchment, austria, Springer, Cham, https://doi.org/10.1007/978-3-319-53485-5_53, 2017.
Hürlimann, M., Abancó, C., and Moya, J.: Experiences of Debris-Flow Monitoring and Warning at Catchment Scale in the Pyrenees, Landslide Science and Practice: Early Warning, Instrumentation and Monitoring, 2, 153–159, https://doi.org/10.1007/978-3-642-31445-2_20, 2013.
Hürlimann, M., Coviello, V., Bel, C., Guo, X. J., Berti, M., Graf, C., Hübl, J., Miyata, S., Smith, J. B., and Yin, H. Y.: Debris-flow monitoring and warning: Review and examples, Earth-Sci. Rev., 199, 102981, https://doi.org/10.1016/j.earscirev.2019.102981, 2019.
Ikeda, A., Itoh, T., and Mizuyama, T.: Study of debris flow peak discharge at Kamikamihorizawa Creek, in: 8th International Conference on Debris Flow Hazard Mitigation (DFHM8), E3S Web of Conferences, 415, 03012, https://doi.org/10.1051/e3sconf/202341503012, 2023.
Iverson, R. M.: The physics of debris flows, Rev. Geophys., 35, 245–296, https://doi.org/10.1029/97RG00426, 1997.
Iverson, R. M., Logan, M., Lahusen, R. G., and Berti, M.: The perfect debris flow? Aggregated results from 28 large-scale experiments, J. Geophys. Res., 115, https://doi.org/10.1029/2009JF001514, 2010.
Jiang, H., Chen, X. Q., Li, Y. P., Chen, J. G., Wei, L., and Zhang, Y. B.: Seasonal dynamics of soil microbiome in response to dry-wet alternation along the Jinsha River Dry-hot Valley, BMC Microbiol., 24, 496, https://doi.org/10.1186/s12866-024-03662-1, 2024.
Kaitna, R., Dietrich, W. E., and Hsu, L.: Surface slopes, velocity profiles and fluid pressure in coarse-grained debris flows saturated with water and mud, J. Fluid Mech., 741, 377–403, https://doi.org/10.1017/jfm.2013.675, 2014.
Kang, Z. C.: An analysis of maximum discharge of viscous debris flow at Jiangjia Gully of Dongchuan in Yunnan, in: Memoirs of Lanzhou Institute of Glaciology and Cryop edology, Chinese Academy of Sciences, Science Press, Beijing, 108–118, ISBN 13031 2795, 1984.
Kang, Z. C.: Velocity research of debris flow and it's calculation method in China, Mountain Research, 5, 247–259, https://doi.org/10.16089/j.cnki.1008-2786.1987.04.012, 1987.
Kang, Z. C.: Motion Characteristics of Debris Flow at Jiangjia Gully, Yunnan Province, China, International Research and Training Center on Erosion and Sedimentation (IRTCES), 1–38, http://ir.imde.ac.cn/handle/131551/5023 (last access: 25 September 2025), 1990.
Kang, Z. C.: Topographic Change in the Stream Channel by Viscous Debris Flow, in: Annuals of disasters prevention Research Institution, 40th edn., Kyoto University, 167–172, ISBN 7-03-013800-7, 1997.
Kang, Z. C., Li, Z. F., Ma, A. N., and Luo, J. T.: Research on Debris Flows in China, Science Press, Beijing, ISBN 7-03-013800-7, 2004.
Kang, Z. C., Cui, P., Wei, F. Q., and He, S. F.: Data collection of kinematic observation of debris flows in Jiangjia Ravine, Dongchuan, Yunnan (1961–1984), Science Press, Beijing, ISBN 7-03-017351-1, 2006.
Kang, Z. C., Cui, P., Wei, F. Q., and He, S. F.: Data collection of kinematic observation of debris flows in Jiangjia Ravine, Dongchuan, Yunnan (1995–2000), Science Press, Beijing, ISBN 7-03-019067-X, 2007.
Kean, J. W., McCoy, S. W., Tucker, G. E., Staley, D. M., and Coe, J. A.: Runoff-generated debris flows: observations and modeling of surge initiation, magnitude, and frequency, J. Geophys. Res.-Earth, 118, 2190–2207, https://doi.org/10.1002/jgrf.20148, 2013.
Kwan, J. S. H.: Supplementary technical guidance on design of rigid debris-resisting barriers, GEO Report No. 270, Geotechnical Engineering Office, HKSAR Government, https://www.cedd.gov.hk/filemanager/eng/content_486/er270links.pdf (last access: 25 September 2025), 2012.
LaHusen, R.: Debris-flow instrumentation. in: Debris- Flow Hazards and Related Phenomena, edited by: Jakob, M. and Hungr, O., Springer, Berlin, 291–304, ISBN 9783540207269, 2005.
Lapillonne, S., Fontaine, F., Liebault, F., Richefeu, V., and Piton, G.: Debris-flow surges of a very active alpine torrent: a field database, Nat. Hazards Earth Syst. Sci., 23, 1241–1256, https://doi.org/10.5194/nhess-23-1241-2023, 2023.
Li, J. and Wu, J. N.: An Analysis on the Formation Condition of Debris Flows in the Jingjia Gully, Dongchuan, Yunna, in: Collected Papers on Debris Flows, Chongqing Branch of Science and Technology Press, 26–29, http://ir.imde.ac.cn/handle/131551/26980 (last access: 20 November 2025), 1981.
Li, J., Yuan, J., Bi, C., and Luo, D.: The main features of the mudflow in Jiang-Jia Ravine, Z. Geomorphol., 27, 325–341 https://doi.org/10.1127/zfg/27/1983/325, 1983.
Li, Y., Liu, J. J., Hu, K. H., and Su, P. C.: Probability distribution of measured debris-flow velocity in Jiangjia Gully, Yunnan Province, China, Nat. Hazards, 60, 689–701, https://doi.org/10.1007/s11069-011-0033-0, 2012.
Li, Y., Zhou, X. J., Su, P. C., Kong, Y. D., and Liu, J. J.: A scaling distribution for grain composition of debris flow, Geomorphology, 192, 30–42, https://doi.org/10.1016/j.geomorph.2013.03.015, 2013.
Li, Y., Liu, J. J., Su, F. H., Xie, J., and Wang, B. L.: Relationship between grain composition and debris flow characteristics: a case study of the Jiangjia Gully in China, Landslides, 12, https://doi.org/10.1007/s10346-014-0475-z, 2014.
Liu, D. C., Jia, Y., He, Y. Y., Shao, J., Xiang, B., Liang, M., Wang, F. M., and Guo, C. C.: Spatial-temporal characteristics of sediment transport by intermittent surges, Landslides, 1–17, https://doi.org/10.1007/s10346-023-02025-7, 2023.
Liu, J. J., Li, Y., Su, P. C., and Cheng, Z. L.: Magnitude-frequency relations in debris flow, Environ. Geol., 55, 1345–1354, https://doi.org/10.1007/s11629-018-4877-6, 2008.
Liu, J. J., Li, Y., Su, P. C., Cheng, Z. L., and Cui, P.: Temporal variation of intermittent surges of debris flow, J. Hydrol., 365, 322–328, https://doi.org/10.1016/j.jhydrol.2008.12.005, 2009.
Liu, K. F. and Wei, S. C.: Real-time debris flow monitoring and automated warning system, J. Mt. Sci., 21, 4050–4061, https://doi.org/10.1007/s11629-024-9269-5, 2024.
Marchi, L. and Crema, S.: Data on debris-flow volumes in northeastern Italy, PANGAEA [data set], https://doi.org/10.1594/PANGAEA.896595, 2018.
Marchi, L., Arattano, M., and Deganutti, A. M.: Ten years of debris-flow monitoring in the Morcardo Torrent (Italian Alps), Geomorphology, 46, 1–17, https://doi.org/10.1016/S0169-555X(01)00162-3, 2002.
Marchi, L., Cazorzi, F., Arattano, M., Cucchiaro, S., Cavalli, M., and Crema, S.: Debris flows recorded in the Moscardo catchment (Italian Alps) between 1990 and 2019, Nat. Hazards Earth Syst. Sci., 21, 87–97, https://doi.org/10.5194/nhess-21-87-2021, 2021.
McArdell, B. W. and Hirschberg, J.: Debris-flow volumes at the Illgraben 2000–2017, EnviDat [data set], https://doi.org/10.16904/envidat.173, 2020.
McArdell, B. W., Bartelt, P., and Kowalski, J.: Field observations of basal forces and fluid pore pressure in a debris flow, Geophys. Res. Lett., 34, L07406, https://doi.org/10.1029/2006GL029183, 2007.
McArdell, B. W., Hirschberg, J., Graf, C., Boss, S., and Badoux, A.: Illgraben debris-flow characteristics 2019–2022, EnviDat [data set], https://doi.org/10.16904/envidat.378, 2023.
McCoy, S. W., Kean, J. W., Coe, J. A., Staley, D. M., Wasklewicz, T. A., and Tucker, G. E.: Evolution of a natural debris flow: in situ measurements of flow dynamics, video imagery, and terrestrial laser scanning, Geology, 38, 735–738, https://doi.org/10.1130/G30928.1, 2010.
McCoy, S. W., Coe, J. A., Kean, J. W., Tucker, G. E., Staley, D. M., and Wasklewicz, T. A.: Observations of debris flows at Chalk Cliffs, Colorado, USA: Part 1, In situ measurements of flow dynamics, tracer particle movement and video imagery from the summer of 2009, Ital. J. Eng. Geol. Environ., https://doi.org/10.4408/IJEGE.2011-03.B-078, 2011.
McCoy, S. W., Coe, J. A., Kean, J. W., Tucker, G. E., Staley, D. M., and Wasklewicz, T. A.: Sediment entrainment by debris flows: In situ measurements from the headwaters of a steep catchment, J. Geophys. Res., 117, F03016, https://doi.org/10.1029/2011JF002278, 2012.
Meng, X., Johnson, C. G., and Gray, J. M. N. T.: Formation of dry granular fronts and watery tails in debris flows, J. Fluid Mech., 943, A19, https://doi.org/10.1017/jfm.2022.400, 2022.
Mitchell, A., Jacquemart, M., Hübl, J., Kaitna, R., and Graf, C.: Debris flow discharge hydrographs from Dorfbach & Spreitgraben, Switzerland, and Lattenbach, Austria, PANGAEA [data set], https://doi.org/10.1594/PANGAEA.943970, 2022.
Nagl, G., Hübl, J., and Kaitna, R.: Velocity profiles and basal stresses in natural debris flows, Earth Surf. Proc. Land., 45, 1764–1776, https://doi.org/10.1002/esp.4844, 2020.
Navratil, O., Liébault, F., Bellot, H., Travaglini, E., Theule, J., Chambon, G., and Laigle, D.: High-frequency monitoring of debris-flows propagation in the Réal Torrent, Southern French Alps, Geomorphology, 201, https://doi.org/10.1016/j.geomorph.2013.06.017, 2013.
Okano, K., Suwa, H., and Kanno, T.: Characterization of debris flows by rainstorm condition at a torrent on the Mount Yakedake volcano, Japan, Geomorphology, 136, 88–94, https://doi.org/10.1016/j.geomorph.2011.04.006, 2012.
Ortuño, M, Guinau, M., Calvet, J., Furdada, G., Bordonau, J., Ruiz, A., and Camafort, M.: Potential of airborne LiDAR data analysis to detect subtle landforms of slope failure: Portainé, Central Pyrenees, Geomorphology, 295, 364–382, https://doi.org/10.1016/j.geomorph.2017.07.015, 2017.
Pierson, T. C.: Flow behavior of channelized debris flows, Mount St. Helens, Washington, in: Hillslope processes, edited by: Abrahms, A. D., Allen & Unwin, Boston, 269–296, https://doi.org/10.4324/9781003028840-13, 1986.
Raffaele, S. and Jordan, A.: A new method for detailed discharge and volume measurements of debris flows based on high-frequency 3D LiDAR point clouds; Illgraben, Switzerland, Eng. Geol., 329, 107386, https://doi.org/10.1016/j.enggeo.2023.107386, 2024.
Scott, K. M. and Wang, Y. Y.: Debris flows: geologic process and hazard; illustrated by a surge sequence at Jiangjia Ravine, Yunnan, China, Reston, VA, http://nsl.imde.ac.cn/en/publ/article_2020/202310/P020250911337941672444.pdf (last access: 25 September 2025), 2004.
Song, D. R., Chen, X. Q., Gordon, G. D. Zhou, Lu, X. Q., Cheng, G. W., and Chen, Q.: Impact dynamics of debris flow against rigid obstacle in laboratory experiments, Eng. Geol., 291, 106211, https://doi.org/10.1016/j.enggeo.2021.106211, 2021.
Song, D. R., Chen, X. Q., Sadeghi, H., Zhong, W., Hu, H., and Liu, W.: Impact behavior of dense debris flows regulated by pore-pressure feedback, J. Geophys. Res.-Earth, 128, e2023JF007074, https://doi.org/10.1029/2023JF007074, 2023.
Song, D. R., Zhong, W., Li, X. Y., and Wei, L.: Debris-flow kinematic data at Jiangjia Ravine, Dongchuan, Yunnan, China, from 1961 to 2024, National Cryosphere Desert Data Center [data set], https://doi.org/10.12072/ncdc.ddfors.db6803.2025, 2025a.
Song, D. R., Zhong, W., Li, X. Y., and Wei, L.: Seismic data of debris flow at Jiangjia Ravine, Yunnan, China, from 2023 to 2024, National Cryosphere Desert Data Center [data set], https://doi.org/10.12072/ncdc.ddfors.db6804.2025, 2025b.
Song, D. R., Zhong, W., Li, X. Y., and Wei, L.: Particle size distribution of debris flows at Jiangjia Ravine, Dongchuan, Yunnan, China, in 1965, 1966, 1974, 1975, 1982, and from 2003 to 2024, National Cryosphere Desert Data Center [data set], https://doi.org/10.12072/ncdc.ddfors.db6721.2025, 2025c.
Song, D. R., Zhong, W., Li, X. Y., and Wei, L.: Rheological data of debris-flow slurry at Jiangjia Ravine, Yunnan, China, from 2003 to 2024, National Cryosphere Desert Data Center [data set], https://doi.org/10.12072/ncdc.ddfors.db6720.2025, 2025d.
Song, D. R., Zhong, W., Li, X. Y., and Wei, L.: Video of debris flows that occurred in 2023 and 2024 at Jiangjia Ravine, Dongchuan, Yunnan, China, National Cryosphere Desert Data Center [data set], https://doi.org/10.12072/ncdc.ddfors.db6807.2025, 2025e.
Song, D. R., Zhong, W., Li, X. Y., and Wei, L.: Cross-sectional measurement data at Jiangjia Ravine, Yunnan, China, National Cryosphere Desert Data Center [data set], https://doi.org/10.12072/ncdc.ddfors.db6719.2025, 2025f.
Song, D. R., Zhong, W., Li, X. Y., and Wei, L.: Meteorological data at Jiangjia Ravine and Xiaojiang River Catchment, Yunnan, China, National Cryosphere Desert Data Center [data set], https://doi.org/10.12072/ncdc.ddfors.db6805.2025, 2025g.
Song, D. R., Zhong, W., Li, X. Y., and Wei, L.: Rainfall data at Jiangjiag Ravine and Xiaojiang River Catchment, Yunnan, China, National Cryosphere Desert Data Center [data set], https://doi.org/10.12072/ncdc.ddfors.db6716.2025, 2025h.
Song, D. R., Zhong, W., Li, X. Y., and Wei, L.: Soil moisture and temperature data at Jiangjia Ravine, Yunnan, China, from 2017 to 2024, National Cryosphere Desert Data Center [data set], https://doi.org/10.12072/ncdc.ddfors.db6718.2025, 2025i.
Song, D. R., Zhong, W., Li, X. Y., and Wei, L.: Sediment concentration and grain size distribution of runoff water sample at Jiangjia Ravine and Xiangjiang River, National Cryosphere Desert Data Center [data set], https://doi.org/10.12072/ncdc.ddfors.db6802.2025, 2025j.
Song, D. R., Zhong, W., Li, X. Y., and Wei, L.: Observation data at runoff plots at Jiangjia Ravine, Yunnan, China, National Cryosphere Desert Data Center [data set], https://doi.org/10.12072/ncdc.ddfors.db6806.2025, 2025k.
Suwa, H., Okunishi, K., and Sakai, M.: Motion, debris size and scale of debris flows in a valley on Mount Yakedake, Japan, in: Proc. international symposium, Yokohama, IAHS Publ., 217, 239–248, 1993.
Suwa, H., Okano, K., and Kanno, T.: Forty years of debris-flow monitoring at Kamikamihorizawa Creek, Mount Yakedake, Japan, in: Proceedings of the 5th International Conference on Debris Flow Hazards Mitigation, Mechanics, Prediction and Assessment, edited by: Genevois, R., Hamilton, D. L., and Prestininzi, A., 605–613, https://doi.org/10.4408/IJEGE.2011-03.B-066, 2011.
Theule, J. I., Liébault, F., Laigle, D., and Loye, A., and Jaboyedoff, M.: Channel scour and fill by debris flows and bedload transport, Geomorphology, 243, 92–105, https://doi.org/10.1016/j.geomorph.2015.05.003, 2015.
Theule, J. I., Crema, S., Marchi, L., Cavalli, M., and Comiti, F.: Exploiting LSPIV to assess debris-flow velocities in the field, Nat. Hazards Earth Syst. Sci., 18, 1–13, https://doi.org/10.5194/nhess-18-1-2018, 2018.
Tian, M., Hu, K. H., Ma, C., and Lei, F. H.: Effect of Bed Sediment Entrainment on Debris-Flow Resistance, J. Hydraul. Eng., 140, 115–120, https://doi.org/10.1061/(ASCE)HY.1943-7900.0000805, 2014.
Tobler, D., Kull, I., Jacquemart, M., and Haehlen, N.: Hazard Management in a Debris Flow Affected Area: Case Study from Spreitgraben, Switzerland. in: Landslide Science for a Safer Geoenvironment, edited by: Sassa, K., Canuti, P., Yin, Y., Springer, Cham, https://doi.org/10.1007/978-3-319-04996-0_5, 2014.
Victoriano, A., Brasington, J., Guinau, M., Furdada, G., Cabré, M., and Moysset, M.: Geomorphic impact and assessment of flexible barriers using multi-temporal LiDAR data: the Portainé mountain catchment (Pyrenees), Eng. Geol. 237, 168–180, https://doi.org/10.1016/j.enggeo.2018.02.016, 2018.
Wang, B., Li, Y., Liu, D. C., and Liu, J. J.: Debris flow density determined by grain composition, Landslides, 15, 1205–1213, https://doi.org/10.1007/s10346-017-0912-x, 2018.
Wang, L., Chang, M., Le, J., Xiang, L. L., and Ni, Z.: Two multi-temporal datasets to track debris flow after the 2008 Wenchuan earthquake, Scientific Data, 9, 525, 1–9, https://doi.org/10.1038/s41597-022-01658-y, 2022.
Wei, L. and Hu, K. H.: Study on sediment transporting characteristics of intermittent debris flows in Jiangjia Ravine, Journal of Natural Disasters, 23, 53–60, https://doi.org/10.13577/j.jnd.2014.0208, 2014.
Wei, L., Hu, K. H., Li, X. Y., and Yan, C. D.: Inter-annual Variation of the Morphology of Debris Flow Channel in Jiangjia Gully, Journal of Yangtze River Scientific Research Institute, 34, 57–62, https://doi.org/10.11988/ckyyb.20160528, 2017.
Willi, C., Graf, C., Deubelbeiss, Y., and Keiler, M.: Methods for detecting channel bed surface changes in a mountain torrent – experiences from the Dorfbach torrent, Geogr. Helv., 70, 265–279, https://doi.org/10.5194/gh-70-265-2015, 2015.
Wu, J. S.: Fluid state of debris flow in the Jiangjia Ravine, Mountain Research, 5, 237–246, 1987.
Wu, J. S., Kang, Z. C., and Tian, L. Q.: Observation and Research on Debris Flows in Jiangjia Ravine, Yunnan, Science Press, Beijing, ISBN 7-03-001370-0, 1990.
Yang, H. J., Zhang, S. J., Hu, K. H., Wei, F. Q., Wang, K., and Liu, S.: Field observation of debris-flow activities in the initiation area of the Jiangjia Gully, Yunnan Province, China, J. Mt. Sci., 19, 1602–1617, https://doi.org/10.1007/s11629-021-7292-3, 2022.
Yang, H. J., Zhang, S. J., Hu, K. H., Wei, F. Q., and Liu, Y. H.: Evaluation of rainfall threshold models for debris flow initiation in the Jiangjia Gully, Yunnan Province, China, J. Mt. Sci., 21, 1799–1813, https://doi.org/10.1007/s11629-023-8507-6, 2024.
Yin, H. Y., Huang, C. J., Chen, C. Y., Fang, Y. M., Lee, B. J., and Chou, T. Y.: The present development of debris flow monitoring technology in Taiwan-a case study presentation, in: 5th International Conference on Debris-Flow Hazards Mitigation, Casa Editrice Universita La Sapienza, Padua, edited by: Genevois, R., Hamilton, D., and Prestininzi, A., 623–631, https://doi.org/10.4408/IJEGE.2011-03.B-068, 2011.
Zhang, J. and Xiong, G.: Data collection of kinematic observation of debris flows in Jiangjia Ravine, Dongchuan, Yunnan (1987–1994), Science Press, Beijing, ISBN 7-03-004379-7, 1997.
Zhang, M., Li, Y., Cui, Y. F., Wu, Z., Xue, Y., Cheng, J. Y., Jiang, H., Li, Y., Guo, J. Nie, J. Y., Wang, G. D., and Luo, A.: Unity of terrestrial and extraterrestrial soils in granular configuration, Earth Planet. Sc. Lett., 654, 119239, https://doi.org/10.1016/j.epsl.2025.119239, 2025.
Zhang, S., Lei, X., Yang, H., Hu, K., Ma, J., Liu, D., and Wei, F.: Investigation of the functional relationship between antecedent rainfall and the probability of debris flow occurrence in Jiangjia Gully, China, Hydrol. Earth Syst. Sci., 28, 2343–2355, https://doi.org/10.5194/hess-28-2343-2024, 2024.
Zhang, S. C.: A comprehensive approach to the observation and prevention of debris flows in China, Nat. Hazards, 7, 1–23, 1993.
Zhang, S. C., Hong, Y., and Yu, B.: Detecting infrasound emission of debris flow for warning purposes, in: International Symposium Interpraevent, Riva, Trient, 359–360, https://xueshu.baidu.com/ndscholar/browse/detail?paperid=75311f8ca3d14f559be1d68adc6d0a29 (last access: 25 September 2025), 2004.
Zhang, S. J., Xia, M. Y., Li, L., Yang, H. J., Liu, D. L., and Wei, F. Q.: Quantify the effect of antecedent effective precipitation on rainfall intensity-duration threshold of debris flow, Landslides, 20, 1719–1730, https://doi.org/10.1007/s10346-023-02066-y, 2023.
Zhu, X. H., Liu, B. X., and Liu, Y. New Method for Estimating Roughness Coefficient for Debris Flows, Water, 12, 2341, https://doi.org/10.3390/w12092341, 2020.
Zhuang, J. Q., Cui, P., Wang, G. H., Chen, X. Q., Iqbal, J., and Guo, X. J.: Rainfall thresholds for the occurrence of debris flows in Jiangjia Gully, Yunnan Province, China, Eng. Geol., 195, 335–346, https://doi.org/10.1016/j.enggeo.2015.06.006, 2015.