the Creative Commons Attribution 4.0 License.
the Creative Commons Attribution 4.0 License.
 | 17 Dec 2025
First high-resolution surface spectral clear-sky ultraviolet radiation dataset across China (1981–2023): development, validation, and variability
Qinghai Qi
Yuting Tan
Christian A. Gueymard
Martin Wild
Taowen Sun
Ming Zhang
Lunche Wang
Solar ultraviolet radiation (UV) plays a fundamental role in the Earth's energy balance, influencing a wide range of processes, including material degradation, biophysical reactions, ecological dynamics, or public health. In this context, the first high-resolution (10×10 km) hourly dataset of surface solar UV under clear-sky conditions over mainland China from 1981 to 2023 is introduced, derived from ERA5 and MERRA2 reanalysis data and a reconstruction based on the SMARTS (Simple Model of the Atmospheric Radiative Transfer of Sunshine) spectral model. Leveraging the SMARTS model's accuracy and capabilities, this dataset provides UV data at 0.5 nm intervals between 280 and 400 nm, offering enhanced granularity for wavelength-specific analysis, thus filling a key gap in high-resolution hourly UV data for China. Validation of the UV dataset against ground observations at 37 stations of the Chinese Ecosystem Research Network (CERN) demonstrates strong performance, with a correlation coefficient (R), root mean square error (RMSE), and mean bias error (MBE) of 0.919, 5.07 W m−2 and −0.07 W m−2, respectively. Compared with the Clouds and the Earth's Radiant Energy System (CERES) UV product, this dataset offers higher spatial and temporal resolution as well as higher accuracy in comparison with observations, thus enhancing data quality for a wide range of applications. The spatial and temporal distribution of clear-sky UV radiation exhibits distinct regional and seasonal variations, with higher values in the west and south, and lower values in the east and north. Over the past 43 years, the annual mean clear-sky broadband UV radiation averaged over China was 20.05 W m−2, showing a slightly increasing trend (+0.0237 W m−2 yr−1). This dataset is now available at https://doi.org/10.6084/m9.figshare.28234298 (Qi et al., 2025), offering a valuable resource for addressing regional challenges related to UV radiation.
- Article
(7834 KB) - Full-text XML
- BibTeX
- EndNote


Although ultraviolet (UV) radiation accounts for a small fraction (≈8 %) of the total solar radiation (Gueymard, 2004), it significantly impacts human health, ecosystems, and various atmospheric photochemical reactions (Neale et al., 2023; Thomas et al., 2012), in particular. A moderate level of UV radiation facilitates the synthesis of vitamin D3 in the human body, essential for calcium absorption and bones health (Novotná et al., 2024; Wu et al., 2025). However, prolonged exposure to UV radiation can be harmful to the skin and eyes (Ma et al., 2023; Narayanan et al., 2010). UV radiation not only directly damages surface cells of plant leaves but also penetrates aquatic environment, affecting phytoplankton and weakening photosynthesis, which impacts plant growth (Williamson et al., 2014). UV radiation in the troposphere can accelerate photochemical reactions in the near-surface layer, contributing to the formation of secondary pollutants (Goti et al., 2024). Consequently, acquiring accurate UV data is essential in various fields, including public health, climate modeling, photobiology, ecosystem monitoring, and environmental management.
In the 1980s, the American Antarctic Program and the National Science Foundation established a high-latitude UV monitoring and observation network (Booth et al., 1994). In parallel, the Australian Radiation Laboratory (ARL) monitored UV radiation with spectroradiometers (SRM) and broadband detectors at 18 sites in Australia and Antarctica (Roy et al., 1998). In the 1990s, China set up its UV observation network with the establishment of a Brewer UV SRM at both the Zhongshan Research Station in Antarctica and the Waliguan Global Atmosphere Station on the Qinghai-Tibet Plateau, which marked the beginning of the UV observation network in China (Bo et al., 2009). The Chinese Ecosystem Research Network (CERN) established in 2004, continues to provide high-quality long-term UV data (Tong et al., 2023). Despite these efforts, the number of UV monitoring stations remains sparse compared to conventional meteorological or radiometric stations, leaving many regions of China uncovered (Lu et al., 2023). To address this gap, various methods for UV estimation have been developed, primarily classified into station-based and satellite-based approaches (Tang et al., 2022).
Station-based methods estimate the UV irradiance through an empirical model that ingests local meteorological and/or radiometric data (Laiwarin et al., 2023; Qin et al., 2020b). For instance, the normalized global surface irradiance (usually referred to as “clearness index”), solar zenith angle, and total ozone column data can be used to estimate UV radiation (Antón et al., 2011; Wang et al., 2013). These methods have been applied successfully in regions such as the Tibetan Plateau, the Pearl River Delta and the North China Plain in China (Xia et al., 2008; Gong et al., 2014; Peng et al., 2015). Another alternative method is to utilize the locally measured global solar irradiance and other meteorological variables as inputs to empirical models (Barbero et al., 2006; Habte et al., 2019). Whereas station-based methods are expected to provide accurate UV estimates near the station under scrutiny, their applicability is limited when attempting to generalize results to other regions. Furthermore, these methods are sensitive to local weather conditions and geographic variations, making them unfit to represent broader regional patterns (Qi et al., 2024). One solution is to use gridded input data derived from reanalysis models or from satellite observations. In particular, satellite-based methods (Jesus et al., 2023) can map large-scale, spatially continuous UV radiation based on observations from instruments like the Total Ozone Mapping Spectrometer (TOMS) (Chubarova et al., 2020; Zerefos et al., 2023), the Global Ozone Monitoring Experiment (GOME) (Kujanpää and Kalakoski, 2015; Parisi et al., 2021), the Ozone Monitoring Instrument (OMI) (Valappil et al., 2024; Zhang et al., 2019), the TROPOspheric Monitoring Instrument (TROPOMI) (Lakkala et al., 2020; Lamy et al., 2021), or the Fengyun-4 (FY-4) (Qin et al., 2023; Wang et al., 2024). Several algorithms have been developed to estimate UV from satellite data, including statistical methods (Katsambas et al., 1997; Laguarda and Abal, 2019; Pei and He, 2019), look-up table (LUT) methods (Leng et al., 2023; Su et al., 2005; Verdebout, 2000), and radiative transfer models (Janjai et al., 2010).
Radiative transfer models explicitly consider various atmospheric processes such as scattering and absorption from ozone, air molecules, clouds, or aerosols (Huang et al., 2019). For instance, Meerkoetter et al. (1997) and Li et al. (2000) calculate UV using models based on the matrix-operator theory and the discrete ordinate method (DISORT), respectively. Both methods account for multiple scattering and absorption processes. Such models have been proven effective for UV radiation estimation, but are computationally intensive and sensitive to various uncertainties, such as cloud fractional cover or adverse weather conditions, making them less suitable for large-scale UV estimation over extended spatial and temporal scales (Wu et al., 2022a, 2024).
In the past, many UV datasets containing long-term time series have been reconstructed based on satellite data (Ciren and Li, 2003; Čížková et al., 2018; Fragkos et al., 2024; Pei and He, 2019). Over China, Liu et al. (2017) reconstructed daily UV data from 1961 to 2014 using an all-sky estimation model combined with a hybrid model partly based on satellite observations. However, the main model's inputs use station-based meteorological data, resulting in an incomplete spatial coverage and a low spatiotemporal resolution. An attractive alternative consists in using gridded reanalysis data because of their global coverage, consistency, and perfect spatiotemporal continuity (no data breaks, contrary to satellite-based data). Reanalyses of interest include ERA5 (Li et al., 2023; Xia et al., 2021), MERRA2 (Laguarda et al., 2024; Lipponen et al., 2020), JRA-55 (Japanese 55-year Reanalysis) (Krizan, 2024; Wang et al., 2019) and CFSR (Climate Forecast System Reanalysis) (Li et al., 2024; Wang et al., 2011). Qin et al. (2020a) utilized MERRA2 to establish a novel physical broadband parameterization (FASTUV) for estimating surface solar UV radiation under all-sky conditions. Wu et al. (2022b) incorporated surface pressure and surface solar radiation from the ERA5 reanalysis data as input variables into their clear-sky UV radiation estimation model. Jiang et al. (2024) also used various ERA5 predictions, along with machine-learning methods, to derive the all-sky UV radiation over China on a daily basis.
Compared to the conventional methods reviewed above that only provide the broadband UV, the novelty of this study's goal is to obtain gridded estimates of the spectral UV irradiance under clear-sky conditions, and its spatiotemporal variations over mainland China. The remainder of this article is structured as follows. The methodology for estimating clear-sky UV radiation is presented in Sect. 2. Section 3 describes the input data used for that task, in addition to the observations and satellite data used for validation. Section 4 presents the validation results for the clear-sky UV radiation data, along with an analysis of the model's sensitivity and its spatial distribution over China. Section 5 discusses data availability, and finally Sect. 6 provides a summary and conclusions.
2.1 The SMARTS model
The “Simple Model for Atmospheric Transmission of Sunshine”, or SMARTS for short, is a radiative transfer spectral model that has been under development since the early 1990s (Gueymard, 2001, 2005, 2019). SMARTS estimates the different clear-sky irradiance components (direct, diffuse, and global) at the surface over the entire short-wave solar spectrum (280–4000 nm), and has become an essential tool in various disciplines, most importantly in various solar energy applications (Bicer et al., 2022; Mouhib et al., 2022; Pelland and Gueymard, 2022), the development of spectral irradiance standards (Habte et al., 2020; Xue and Igari, 2023), and UV research (Habte et al., 2019; Apell and McNeill, 2019). The UV band under scrutiny here extends from 280 to 400 nm at 0.5 nm resolution.
The SMARTS computational flow is shown in Fig. 1. As visualized, single-image metadata is converted from planar to 3D at run time, thus significantly increasing the time cost of computation. To optimize the process, the model's Fortran code was reconstructed and converted to MATLAB®. In that optimized implementation, the model can perform matrix operations in an efficient way.
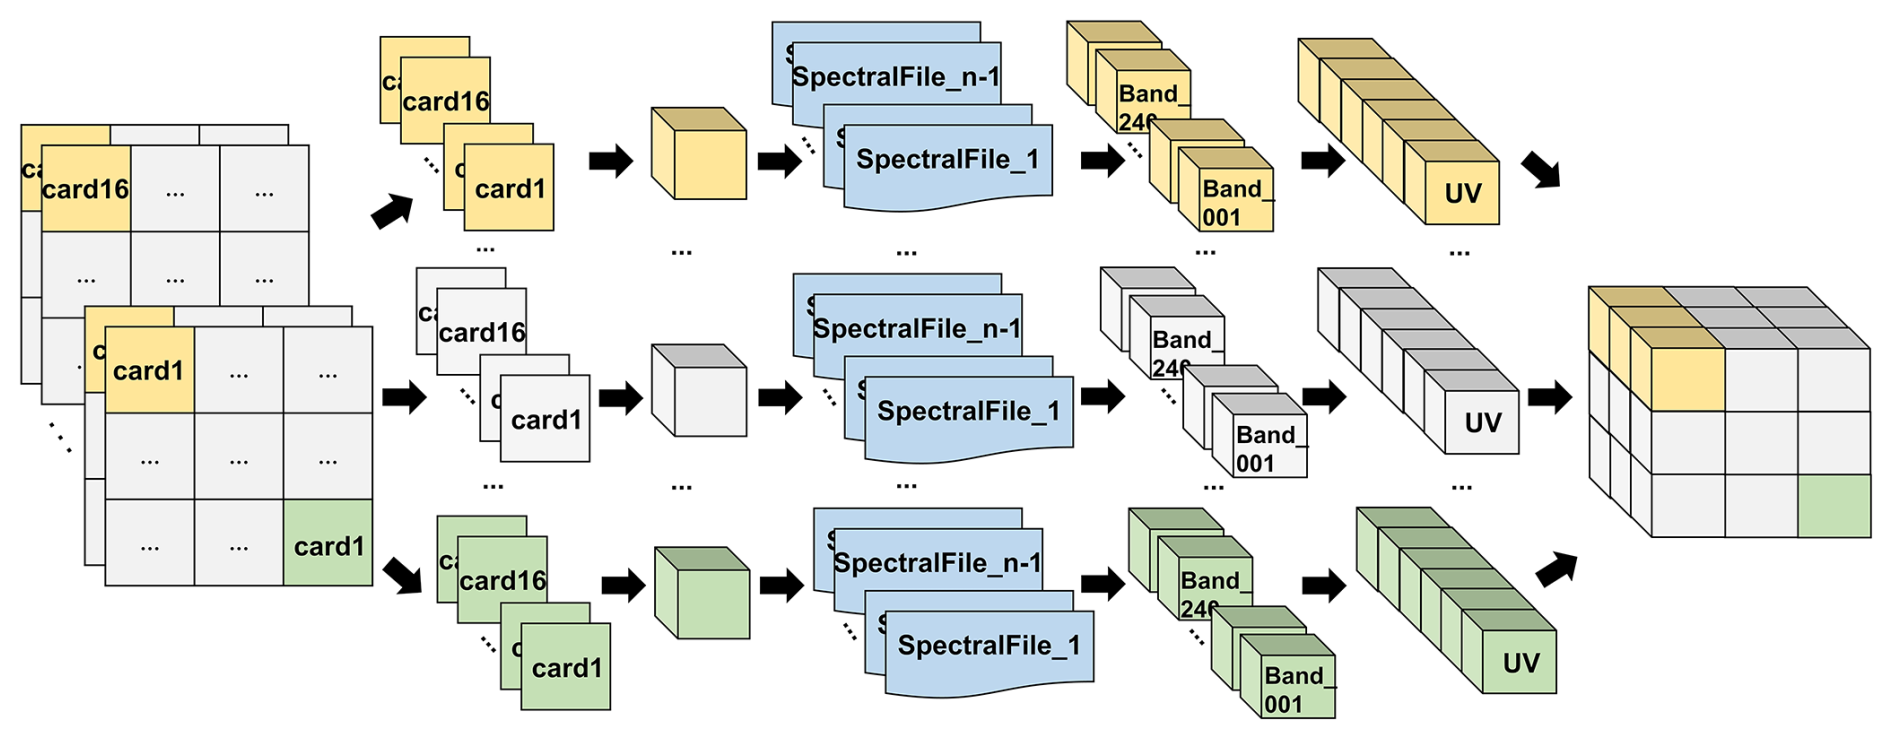
Figure 1Schematic diagram of the SMARTS workflow process for the large-scale application involved here.
2.2 Quality control of UV radiation observations
The quality control of the measured UV data involves two parallel procedures: (i) quality control of the observations; and (ii) detection of the clear-sky periods in the observational time series (Fig. 2). The quality control of observation data can be divided into two parts: detection and elimination of systematic errors, and quality assessment of the observation data. The systematic errors include operator errors and sensor errors. Furthermore, many obvious errors and missing observations need to be eliminated. The quality assessment of observational data is conducted in successive steps. First, the observed surface broadband UV irradiance should be less than extraterrestrial UV radiation. Second, the ratio of UV radiation to total solar radiation should be in the range 0.02–0.08 (Liu et al., 2017).
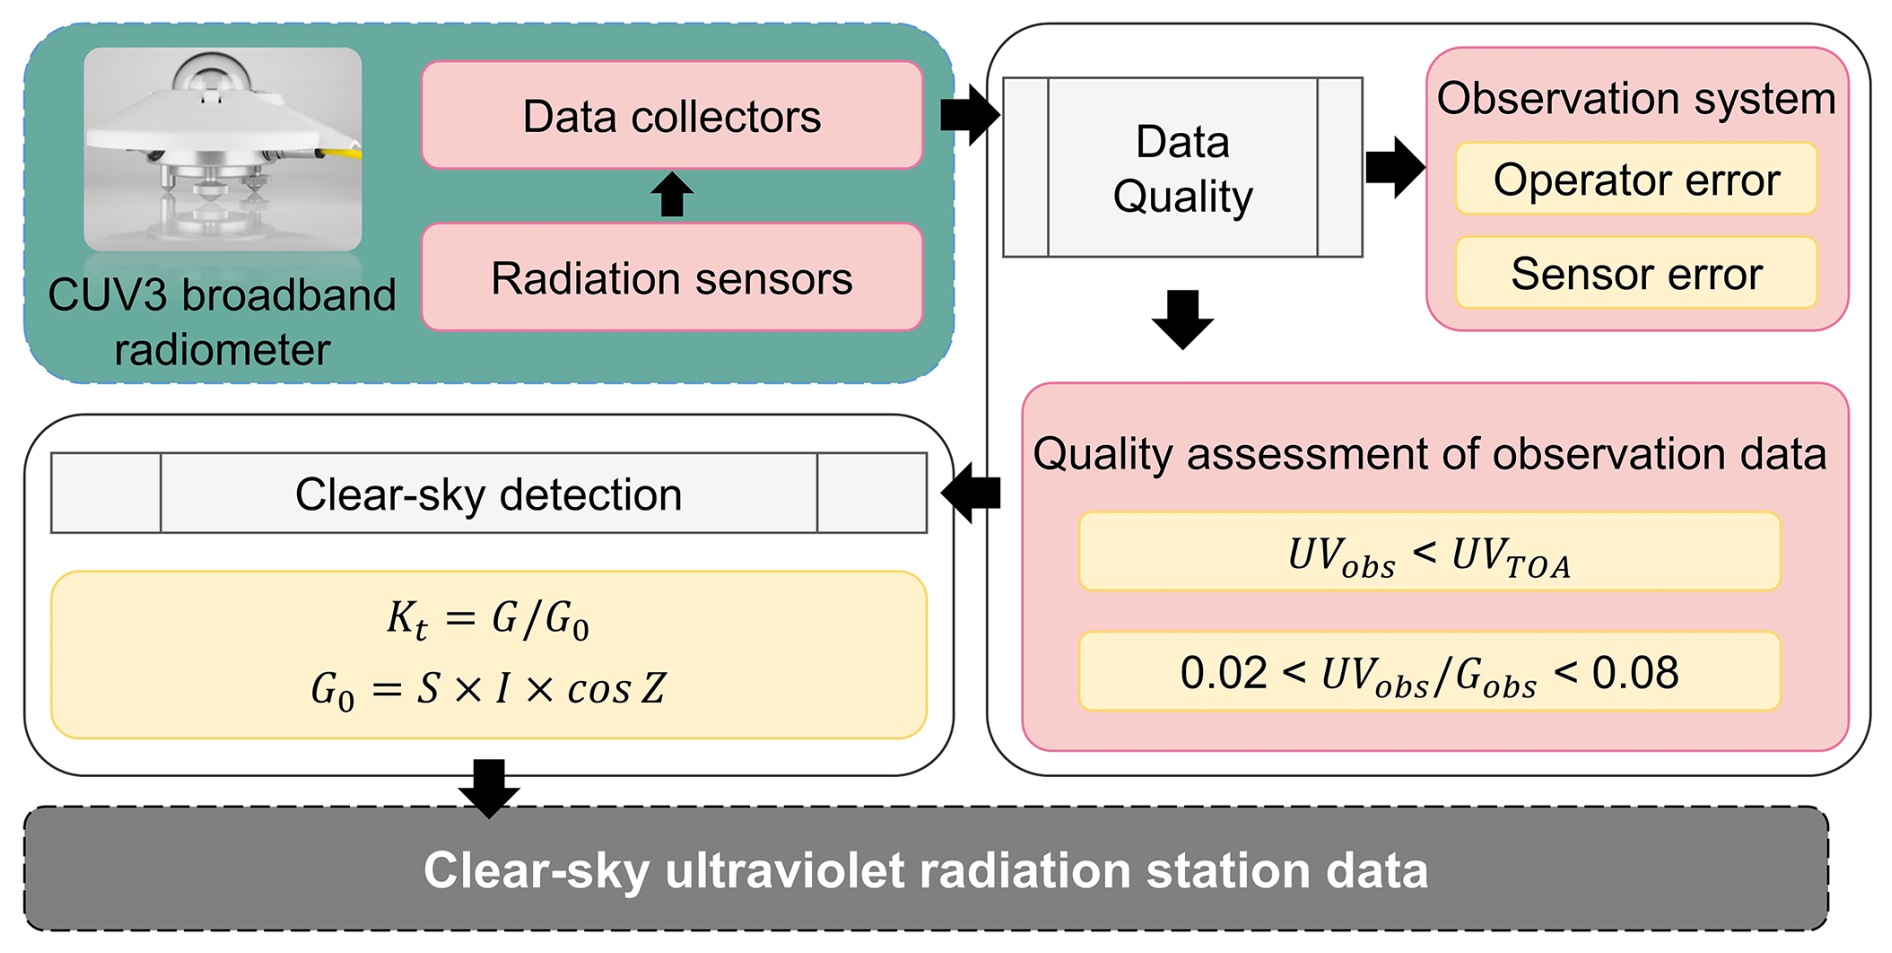
Figure 2Flowchart describing the quality control procedure of UV radiation observational data.
It should be noted that, in the present investigation, the estimated UV radiation exclusively relates to clear-sky conditions. Therefore, it is necessary to conduct an efficient clear-sky screening of the observational time series, which needs to be done. The clearness index (Kt), which is the ratio between the surface global solar irradiance (G) measured at 1 hourly resolution and its extraterrestrial counterpart (G0), is employed as the primary screening tool in this study. Clear-sky conditions are identified as those for which Kt exceeds 0.7 (Qi et al., 2024). The global solar irradiance was obtained from the CERN site observations at 1 hourly temporal resolution and the extraterrestrial radiation was calculated using:
where S is the sun–earth distance correction factor, I is the solar constant (1361.1 W m−2) (Gueymard, 2018), and Z is the solar zenith angle. At each instant, Z and S are provided by a precise sun position algorithm.
2.3 Evaluation of the model
In the absence of spectral measurements, which would necessitate costly SRMs, the assessment of the accuracy of the clear-sky UV modeled estimates is done relatively to broadband measurements, as described in Sect. 3.1. The assessment uses conventional evaluation metrics (Gueymard, 2014), including mean bias error (MBE), root mean square error (RMSE), and correlation coefficient (R). MBE and RMSE are expressed both in absolute terms (W m−2) and relative percentage.
In addition, the probability density functions (PDFs) of the bias and the cumulative distribution functions (CDFs) of the absolute relative error (ARE) are used to compare the accuracy of the estimates with respect to various satellite products (Jiang et al., 2020). The PDFs and CDFs provide complementary information about the distribution of the deviations between different UV radiation products and station observations. In particular, the position and shape of the PDF peaks can offer insights into the temporal characteristics of the bias. The CDF curves of different UV radiation products also allow a visual comparison of their overall performance. The steeper the CDF curve, the more concentrated the error and the higher the accuracy of the product, whereas a flat curve indicates a dispersed error and lower precision.
3.1 Observational data from CERN
The UV database collected from the China Ecosystem Research Network (CERN) observation sites is used to validate the accuracy of the UV radiation estimates obtained with the SMARTS model. Detailed information on CERN sites is provided in Table 1. CERN has established a network of ecosystem observatories throughout China to monitor the meteorological, environmental, and radiometric conditions over a widely diverse range of ecosystems, including nature reserves, forest ecosystems, grassland ecosystems, wetland ecosystems, and urban ecosystems. The observational database selected for this study comprises hourly UV and total solar irradiance data from all the 37 stations in mainland China over the 2005–2013 period. The CERN stations use the CM11 global radiometer (Kipp & Zonen, the Netherlands) to measure global radiation with a spectral range of 285–2800 nm, with an accuracy of 5 %. The CUV3 broadband radiometer (Kipp & Zonen, the Netherlands) is used to measure UV radiation, with a spectral range of 280–400 nm and an accuracy of 5 %, which meets the World Meteorological Organization's (WMO) measurement standards. As shown in Fig. 3, the CERN sites are relatively well distributed in the east. Due to the influence of topography, however, the density of sites in the west is much lower than in the east, which results in an uneven spatial distribution overall. The spatial coverage of this product is constrained by the continuous availability of ERA5 reanalysis data, resulting in the exclusion of certain coastal observation stations at CERN.
Table 1Detailed information about the CERN station used by this study.
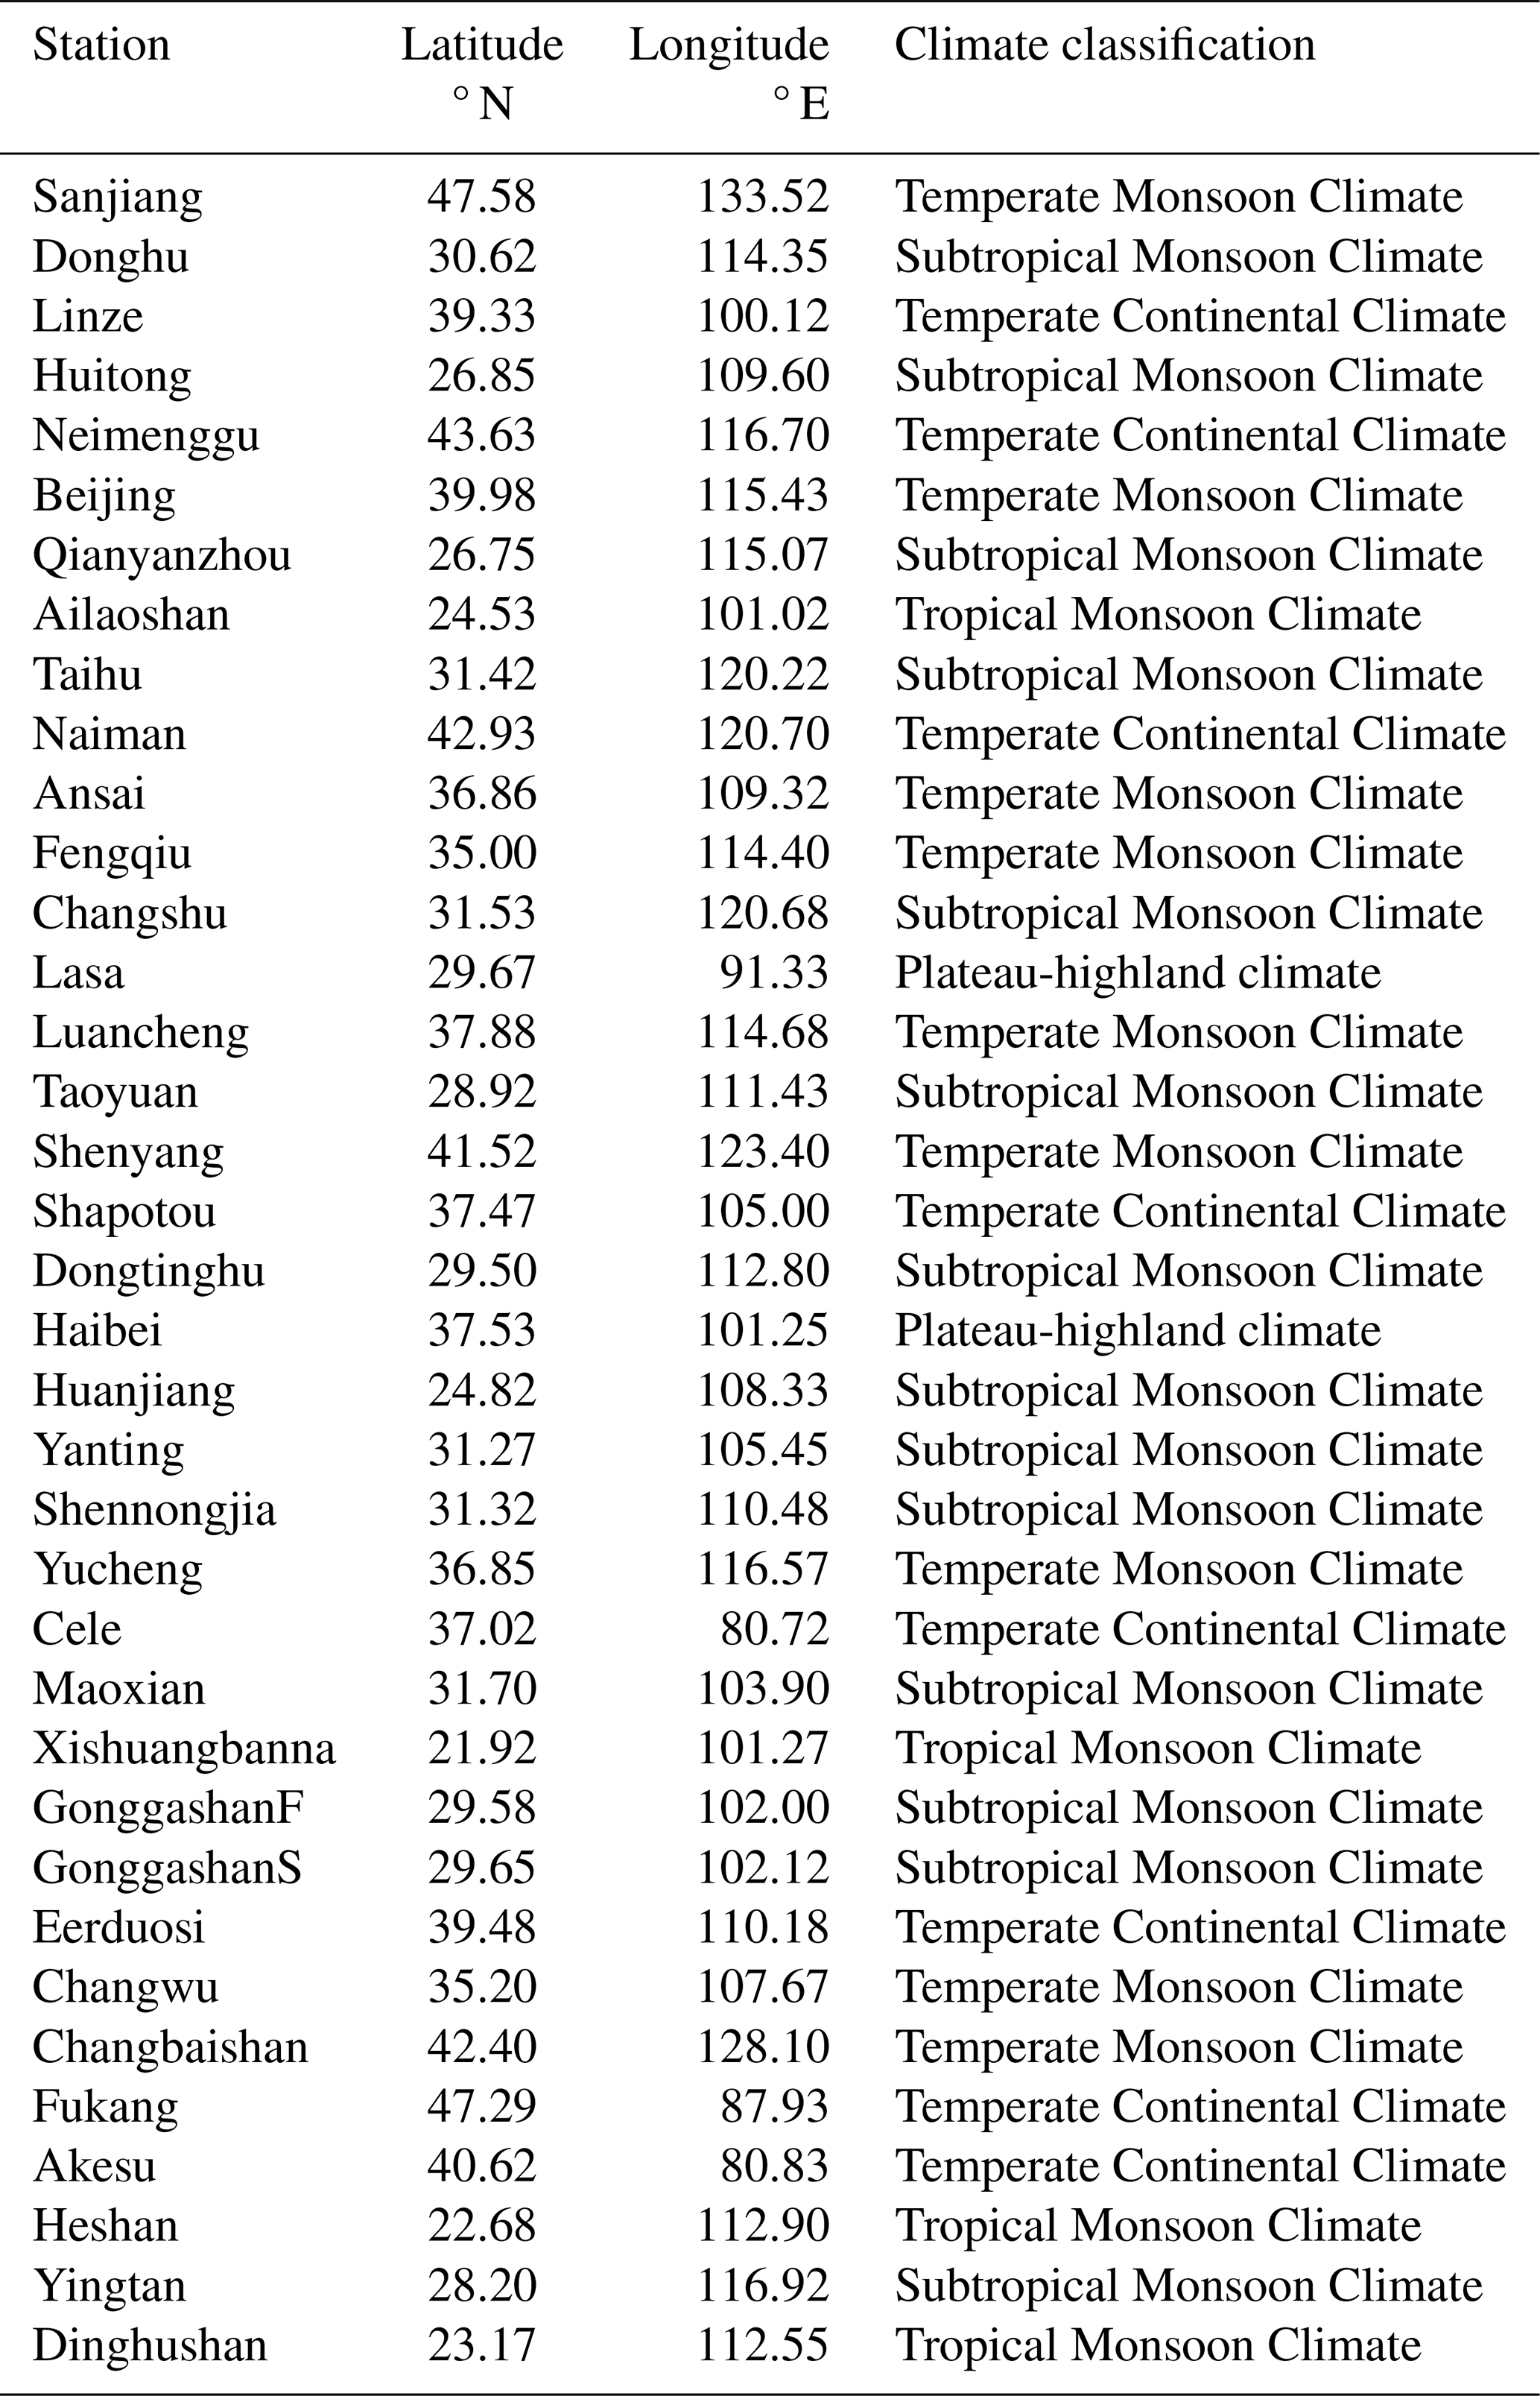
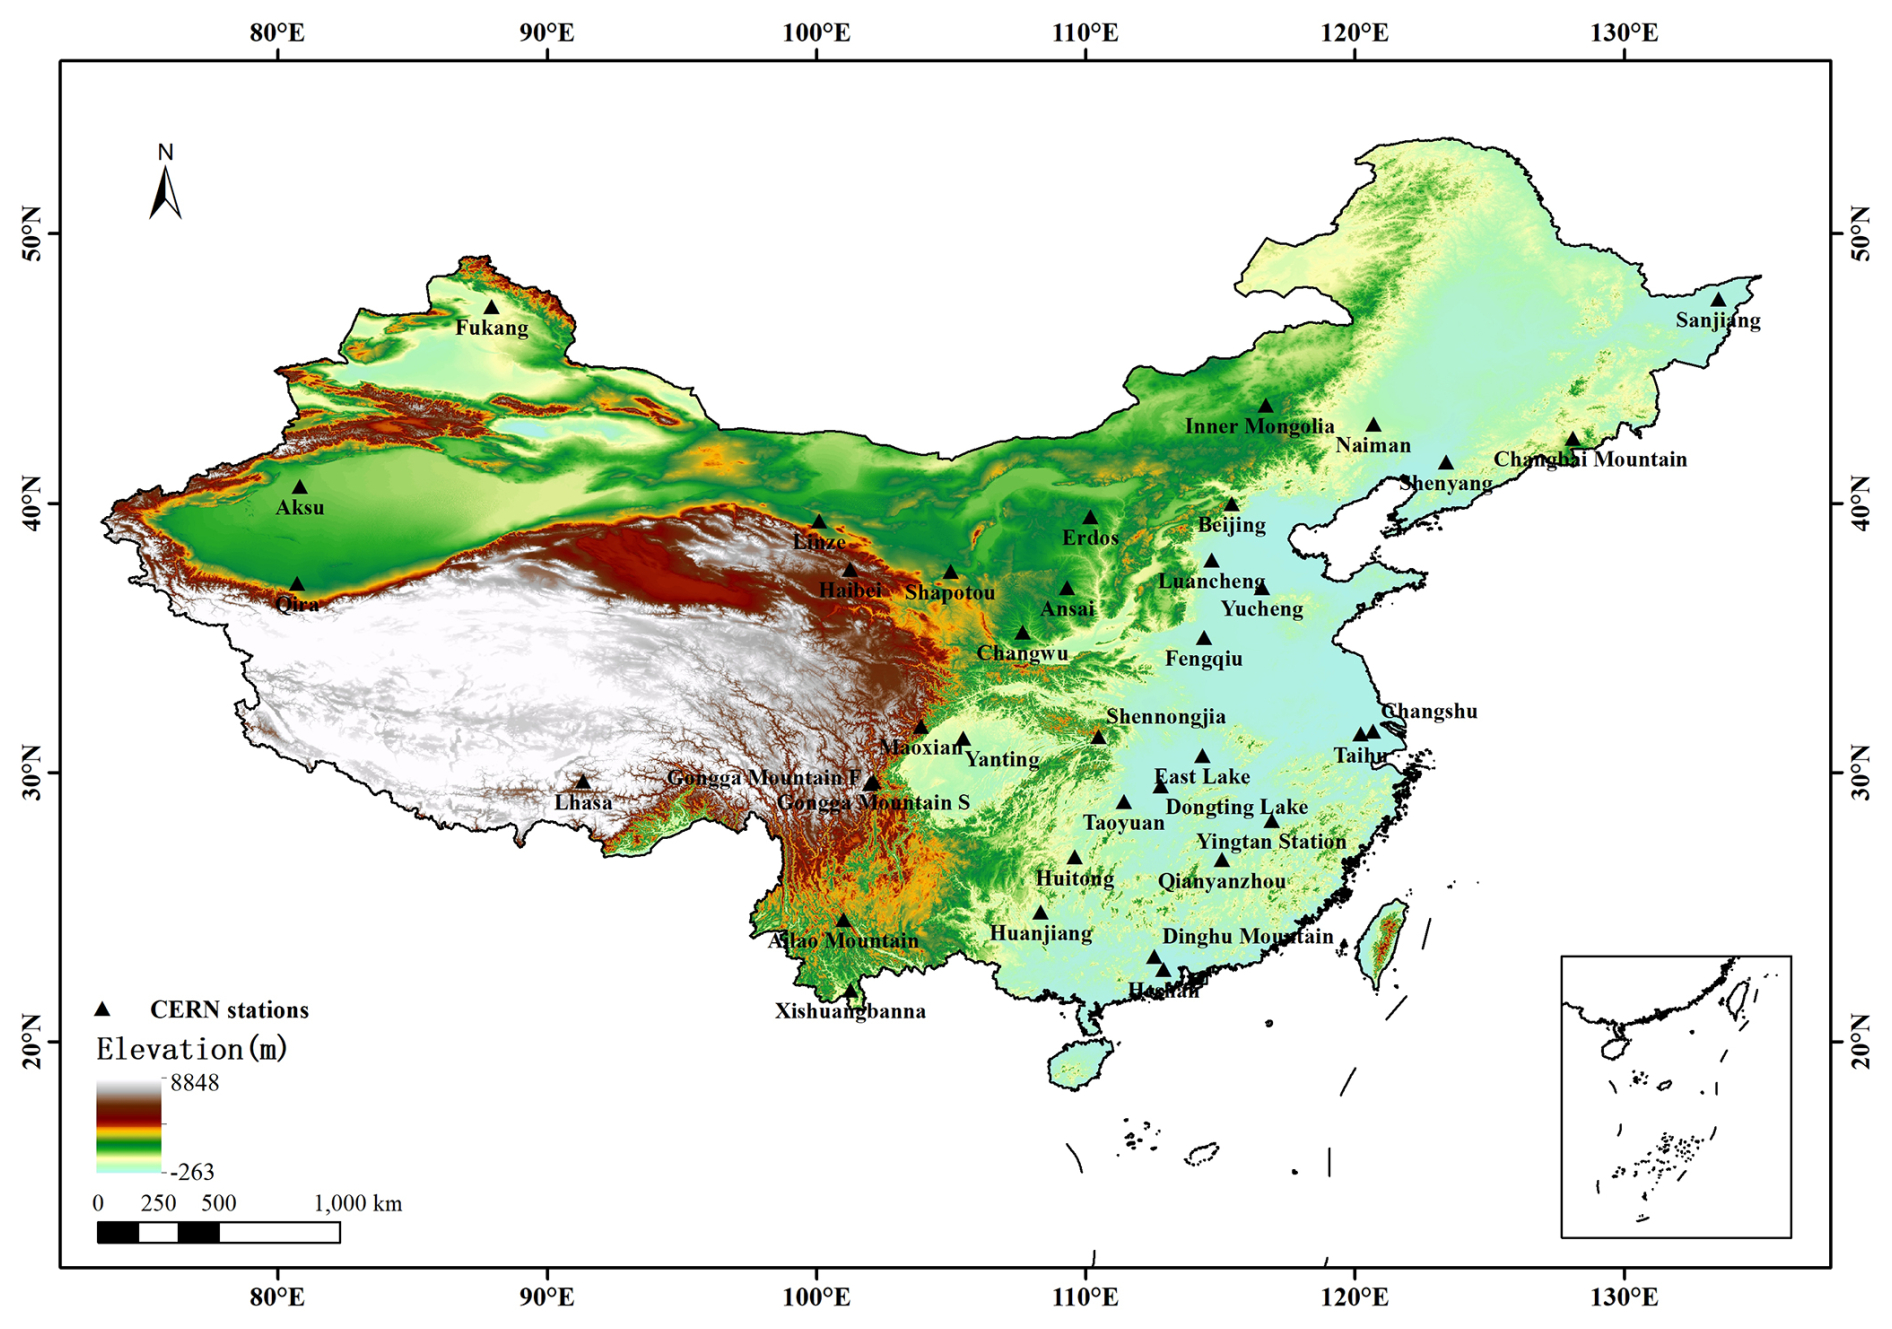
Figure 3Distribution of the 37 CERN sites in China that provide solar and UV irradiance observations.
3.2 Reanalysis-derived SMARTS model input variables
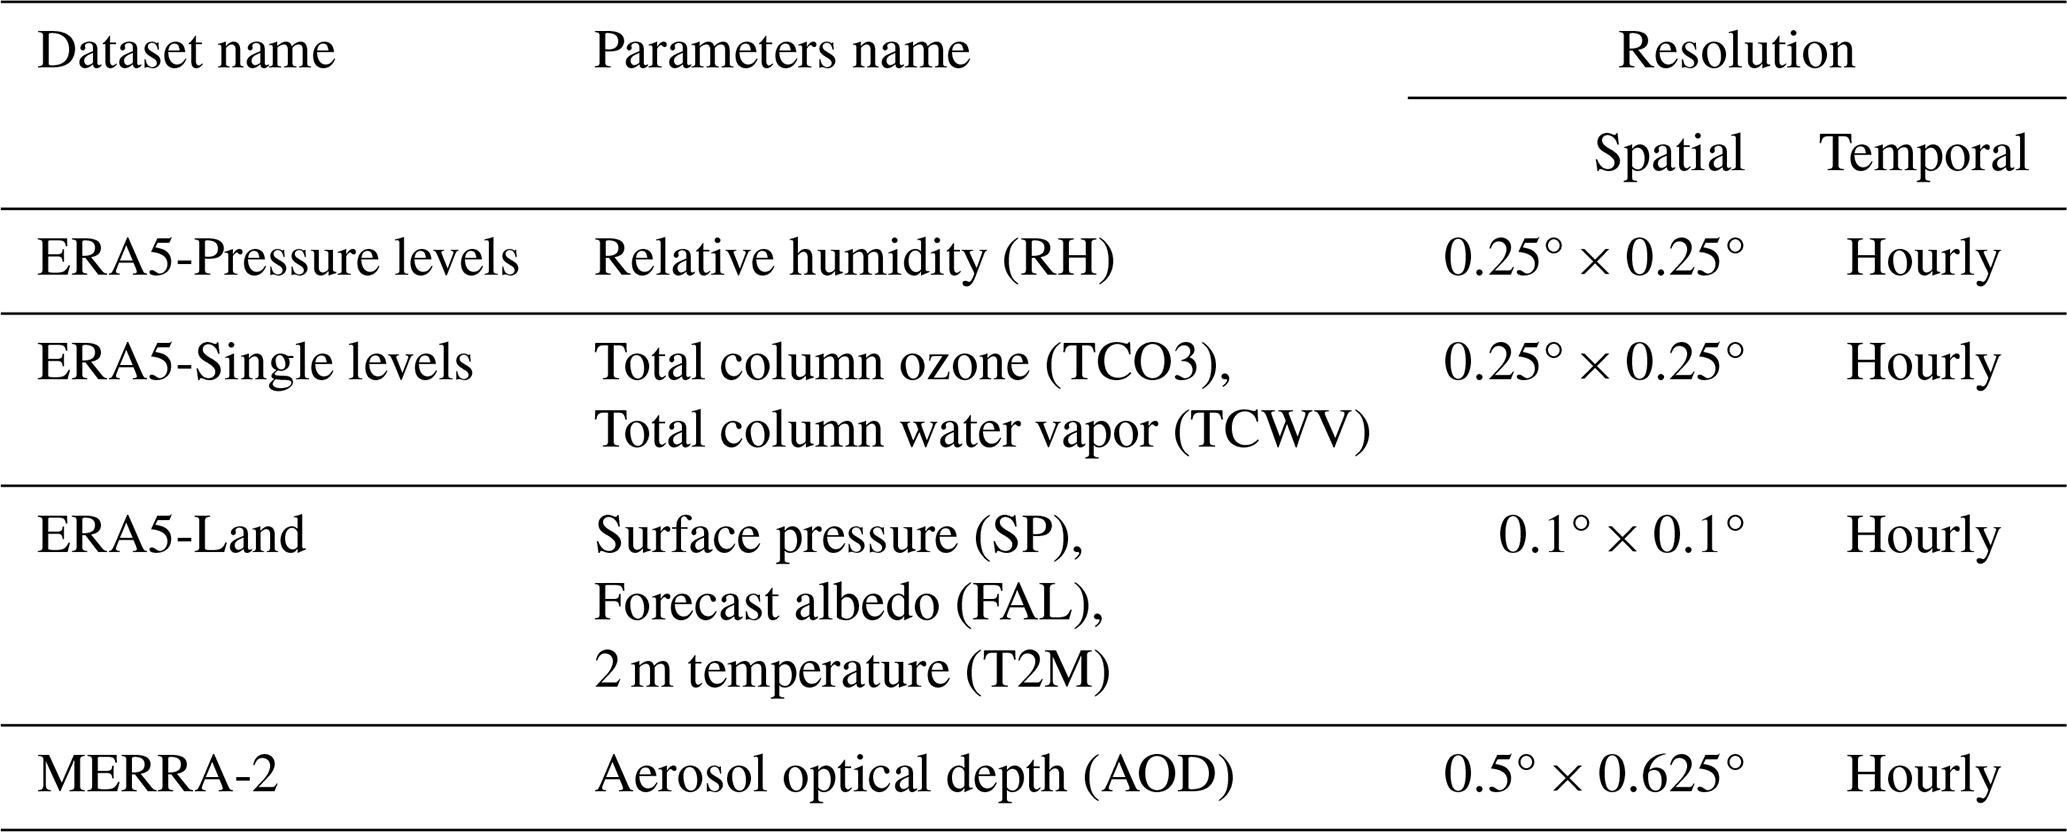
The inputs to SMARTS are derived primarily from key products generated by the ERA5 and MERRA2 reanalysis over the period 1981–2023. ERA5 (ECMWF Reanalysis: Fifth generation) is an atmospheric reanalysis dataset published by the European Centre for Medium-Range Weather Forecasts (ECMWF) to describe the state and variability of the Earth's atmospheric system (Muñoz-Sabater et al., 2021). The data employed in this study comprise ERA5_Land, ERA5_Pressure levels, and ERA5_Single levels. ERA5_Land has a spatial resolution of 0.1°×0.1°, whereas ERA5_Pressure levels and ERA5_Single levels have a spatial resolution of 0.25°×0.25°. Consequently, that coarser grid is resampled to achieve a unified spatial resolution of 0.1°×0.1° or ≈10 km. The forecast albedo (FAL) from the ERA5-Land product is a land-specific parameter, as its values over ocean and lake surfaces are systematically set to NAN, making it suitable for continental-scale analysis.
MERRA-2 (Modern-Era Retrospective analysis for Research and Applications, Version 2) is an atmospheric reanalysis dataset released by NASA (Gelaro et al., 2017). MERRA-2 provides a long time series of AOD data (1980–present) with reasonable accuracy (Gueymard and Yang, 2020; Ou et al., 2022). The coarse resolution (0.5°×0.625°) of the MERRA2 AOD data requires bilinear resampling to 0.1°×0.1°, however. Table 2 shows the summarized information pertaining to all input variables. The position of each grid cell (latitude, longitude, and elevation) is also necessary to operate the radiation model.
Table 2Summarized information about the gridded variables used as inputs in this study.
3.3 Satellite-based solar UV radiation product
CERES (Clouds and the Earth's Radiant Energy System) is a project initiated by NASA with the objective of conducting long-term monitoring and research on the Earth's radiant energy balance. In particular, CERES SYN1deg is a synthetic data base that provides various products related to the surface radiant field including radiative fluxes, cloudiness, and temperature. The SYN1deg database provides global coverage at a horizontal resolution of 1°×1°, with hourly temporal resolution (Wielicki et al., 1998). Here, the hourly UVA and UVB estimates from SYN1deg are used as a benchmark against which the present model's estimates can be assessed.
4.1 SMARTS-derived UV irradiance performance assessment
Figure 4 presents the validation results of the hourly clear-sky UV radiation model estimates. Out of the 196 original observed data points from 37 CERN stations during 2005–2013, 170 were selected after applying the clear-sky screening procedure described in Sect. 2.2. Overall, the estimated hourly clear-sky broadband UV irradiance exhibits satisfactory accuracy, as evidenced by Fig. 4a, with an R of 0.919, an RMSE of 5.07 W m−2, and an MBE of −0.07 W m−2. The density scatter plot shows that the model performs well across most UV radiation levels, particularly in the range of 20–40 W m−2, where the highest density of points is observed. However, at lower (<10 W m−2) and higher (>50 W m−2) UV radiation levels, the scatter points become more dispersed, indicating increased model uncertainty under these extreme conditions. Notably, the regression slope of 1.009 and a negative intercept (−0.319) suggest a slight systematic underestimation under low UV radiation conditions, possibly due to factors like local atmospheric characteristics not fully captured by the model. In addition, the upper and lower boundaries of the scatter points reveal distinct patterns: overestimation occurs predominantly under high UV conditions, whereas underestimation is more frequent at low to moderate radiation levels. The broader scatter at extreme values also suggests that the model's performance might be sensitive to solar zenith angles, particularly during sunrise and sunset.
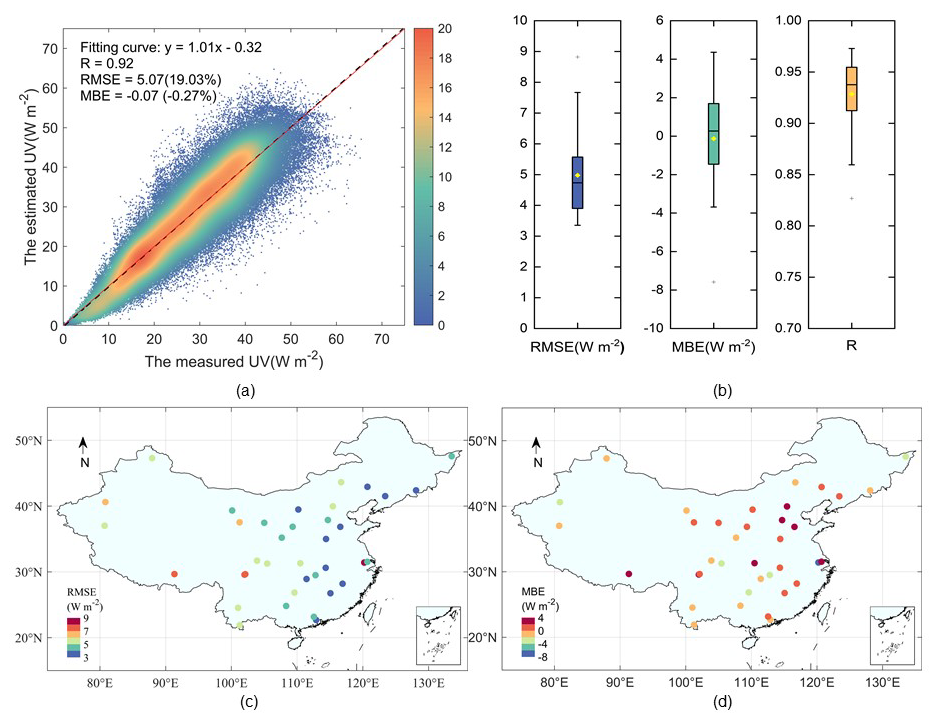
Figure 4Validation results of the estimated hourly clear-sky UV dataset against observations at 37 CERN stations from 2005–2013. (a) Density scatter plot between the estimated dataset and observations. (b) Box plots of the three statistical error metrics (RMSE, MBE, and R). (c) Spatial distribution of RMSE at individual stations. (d) Spatial distribution of MBE at individual stations.
In addition, boxplots of R, MBE and RMSE for all stations combines are shown in Fig. 4b. In particular, the RMSE for the majority of stations ranges between 3.9 and 5.6 W m−2, with a mean value of 4.98 W m−2 and a maximum value not exceeding 9 W m−2. The mean and median MBE values are −0.13 and 0.27 W m−2, respectively, indicating a small overall error. The R value at most sites is greater than 0.9. The median value is notably elevated, approaching the upper quartile, which collectively suggests that the overall R value remains satisfactory and that the model's performance has strong spatial consistency and robustness, even in regions with varying climatic conditions. Figure 4c and d displays the RMSE and MBE results, respectively, for each station. About half of the stations are affected by only low RMSEs below 5 W m−2. The two most challenging stations are Taihu (TAL) and Aksu (AKA). The Taihu (TAL) station, located in the humid, cloud-prone region of eastern China, exhibits significant errors, with RMSE and MBE reach 8.82 and −7.59 W m−2, respectively. These errors are likely influenced by high humidity and the reflective surface of the Taihu Lake, which complicates the estimation of clear-sky UV radiation. The Aksu (AKA) station, situated in the arid desert region of northwestern China, also stands out with RMSE = 6.40 W m−2, MBE = −3.09 W m−2, and R=0.877. The larger errors at AKA may be attributed to several factors, including the high aerosol loading in the region, where mineral dust particles from the surrounding deserts can significantly scatter and absorb UV radiation. Additionally, the reflective properties of the desert surface, extreme climatic conditions, and local meteorological variations could further complicate the accurate estimation of clear-sky UV radiation, leading to the observed discrepancies. These unique atmospheric conditions, combined with the station's extreme climatic environment, likely reduce the model's estimation accuracy (Wu et al., 2022b).
Figure 5 presents similar results as in Fig. 4, but on a daily mean basis. From Fig. 5a, the overall validation results are satisfactory, with an R of 0.907, an RMSE of 3.37 W m−2, and an MBE of 0.14 W m−2. The box plots in Fig. 5b show that most stations have RMSE values below 4 W m−2, reflecting consistent performance across regions. The MBE values are tightly clustered around zero, indicating minimal biases overall. Additionally, R values for most stations range between 0.88 and 0.95, demonstrating the model's strong spatial consistency and reliable performance. The spatial distributions of RMSE and MBE in Fig. 5c and d reveal patterns similar to those observed with the hourly estimates. Whereas most stations maintain low RMSE and near-zero MBE, the same two stations as before, TAL and AKA exhibit notable discrepancies again. For instance, the daily-mean RMSE, MBE, and R at AKA are 7.07 W m−2, −6.16 W m−2, and 0.783, respectively.
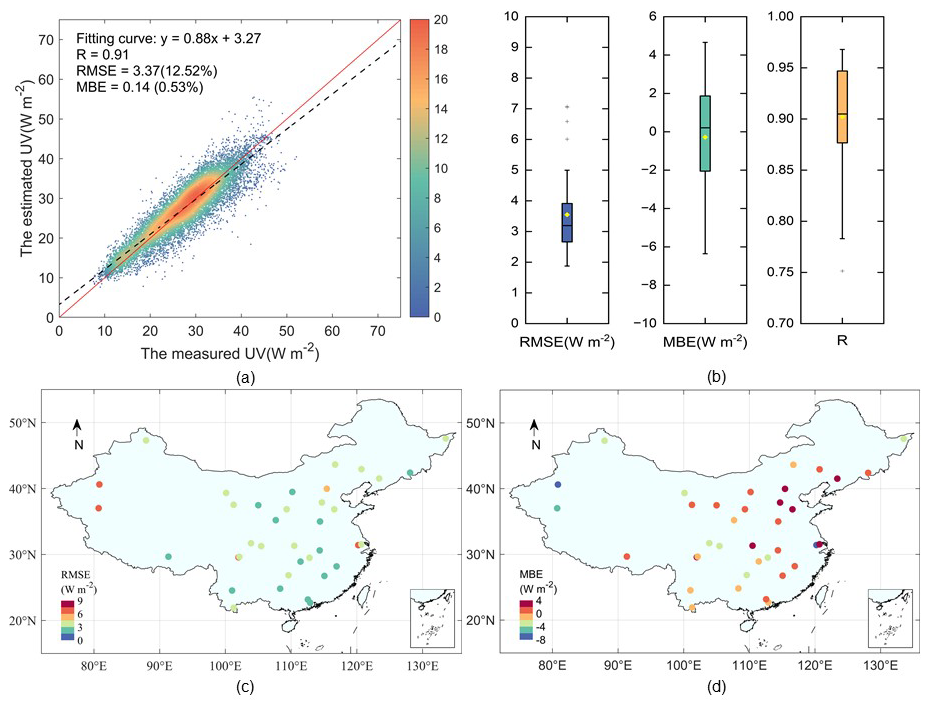
Figure 5Same as Fig. 4 but for daily mean clear-sky UV radiation.
Overall, the validation results demonstrate that the model reliably captures hourly and daily mean clear-sky UV radiation across diverse environments, maintaining high accuracy and minimal bias at all 37 sites, with the possible exception of two challenging stations. The strong agreement between the model estimates and observations underscores its robustness. These findings support the reliability of the SMARTS model in estimating clear-sky UV radiation. A supplementary quantile binning analysis was conducted to guard against regression bias from uneven data density in our large sample. The results, shown in Fig. A2, align with Figs. 4 and 5, confirming the model's excellent overall performance and offering a more robust characterization of its behavior at the extremes.
4.2 Benchmarking the estimated clear-sky UV radiation against the CERES product
A comparison between the present hourly UV estimates and those from CERES SYN1deg is desirable as a form of benchmarking, owing to the important status of the latter as a reference global database. Using CERN observations in 2013, the results in Fig. 6 demonstrate that the present UV product significantly outperforms SYN1deg in terms of overall accuracy. As shown in Fig. 6a and b, the estimated hourly clear-sky UV radiation achieves an R of 0.923, an RMSE of 4.92 W m−2, and an MBE of 0.04 W m−2, which are substantially better than the CERES product (R=0.825, RMSE = 10.61 W m−2, MBE = 4.68 W m−2). Notably, SYN1deg exhibits systematic biases, with overestimation at high UV values and underestimation at low UV values, whereas the newly proposed product aligns more closely with the observed values. The distribution of the PDF (Fig. 6c) further highlights the differences between the two products. The bias distribution of the newly proposed product closely resembles a Gaussian curve, with a sharp peak near zero, indicating small and stable deviations across most data points. In contrast, SYN1deg displays a broader and flatter PDF curve, suggesting larger and more widely distributed errors, hence lower precision than the new SMARTS-derived product. Figure 6d reinforces this conclusion: the CDF curve for ARE is steeper for the newly proposed product, reaching the 95 % threshold for a much lower mean error than SYN1deg. This confirms that a larger fraction of the estimated product's deviations is confined to smaller bias ranges.
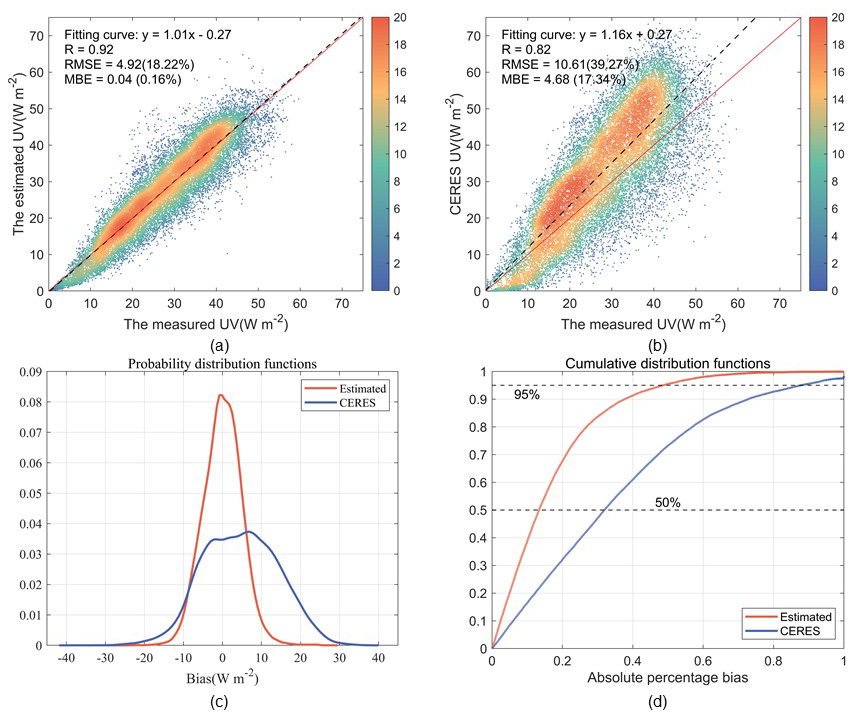
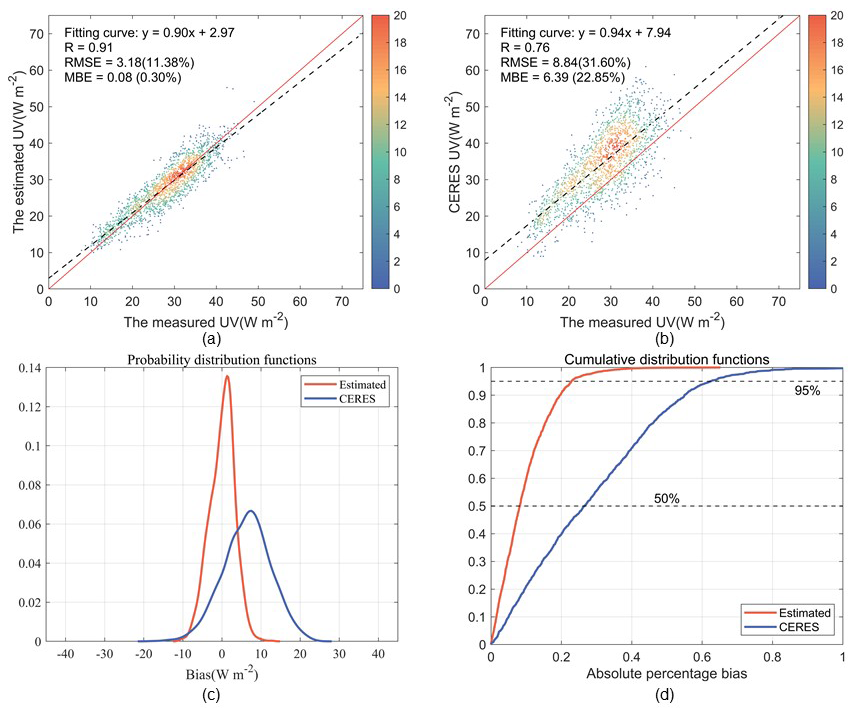
Figure 6Hourly assessment results for two clear-sky UV radiation products. (a) Density scatterplot between the hourly clear-sky SMARTS-derived UV irradiance estimates and CERN observations. (b) Same as (a) but for the CERES SYN1deg estimates. (c) Probability distribution function of the bias for the SMARTS-derived product (orange line) and the CERES product (blue line); (d) cumulative distribution function of the absolute relative error for the SMARTS-derived product (orange line) and the CERES product (blue line).
Figure 7 is similar to Fig. 6, but on a coarser daily-mean resolution. The R value for the new UV radiation product, 0.911, is markedly higher than the CERES product (0.763). In parallel, the RMSE and MBE for the new product, 3.18 and 0.09 W m−2, respectively, are much lower than their CERES counterparts (8.84 and 6.39 W m−2). From Fig. 7b, it is evident that the CERES product systematically overestimates UV radiation, as indicated by the positive deviation of its best-fit line from the 1:1 line in almost all cases. In contrast, the estimated product aligns much more closely with the observations. The PDF and CDF in Fig. 7c and d further emphasize the differences between the two products, and confirm the results in Fig. 6c and d.
In summary, the hourly and daily mean clear-sky UV radiation product proposed here demonstrates significantly better performance than the CERES SYN1deg product in terms of accuracy, stability, and error distribution. As shown in the binned fitting results in Fig. A3, both products exhibit distribution characteristics similar to those described previously. The CERES SYN1deg product exhibits systematic biases in its representation of UV radiation, overestimating at high values and underestimating at low values. This results in a border and flatter probability density function compared to the new CHUV product, which indicates larger errors and lower overall precision. Consequently, the SYN1deg product also demonstrates a significantly weaker agreement with daily mean observations than the CHUV product.
4.3 Sensitivity of the SMARTS UV predictions to key input variables
The results above indicate that the SMARTS-based UV estimates are satisfactory in general, but are nevertheless affected by reduced accuracy at a few sites where challenging situations are likely to impact the model's inputs. It is thus desirable to evaluate the sensitivity of the modeled UV estimates to discrepancies in the atmospheric inputs. To that effect, a series of scaling factors (0.5, 0.9, 1.1, and 1.5) are applied to three key input variables as way to analyze the intrinsic model's sensitivity to them. These inputs are the aerosol optical depth (AOD), the total column ozone (TCO3), and the forecast albedo (FAL). In all cases, the clear-sky UV irradiances estimated using the original input data are used as the baseline reference. As shown in Fig. 8, the 37-station mean clear-sky UV irradiance thus obtained exhibits a typical unimodal distribution, peaking in summer and reaching a minimum in winter, as could be expected. This seasonal variation is closely tied to changes in solar zenith angle. Among the four input parameters tested here, AOD induces the most significant impact on clear-sky UV radiation (Fig. 8a). As AOD increases, the UV irradiance decreases substantially, highlighting the strong attenuation effect of aerosols in the UV. The sensitivity analysis revealed a strong negative relationship between AOD and surface UV irradiance. Specifically, a one-unit increase in AOD was associated with a fractional reduction in UV irradiance ranging from −50.06 % to −40.90 %. This is consistent with the physical properties of aerosols, which scatter and absorb radiation mostly in the UV spectrum. As TCO3 increases incrementally relative to its original value, the clear-sky UV radiation decreases progressively (Fig. 8b), which reflects the strong absorption of ozone in the UV spectrum, although this is confined to wavelengths below ≈340 nm only. Surface albedo (FAL) is shown to enhance UV radiation when it increases (Fig. 8c). Higher albedo values, such as those from snow-covered surfaces, amplify the reflection of UV radiation back into the atmosphere, which can subsequently increase the downward UV irradiance through the atmospheric backscattering effect (Shine et al., 2012).
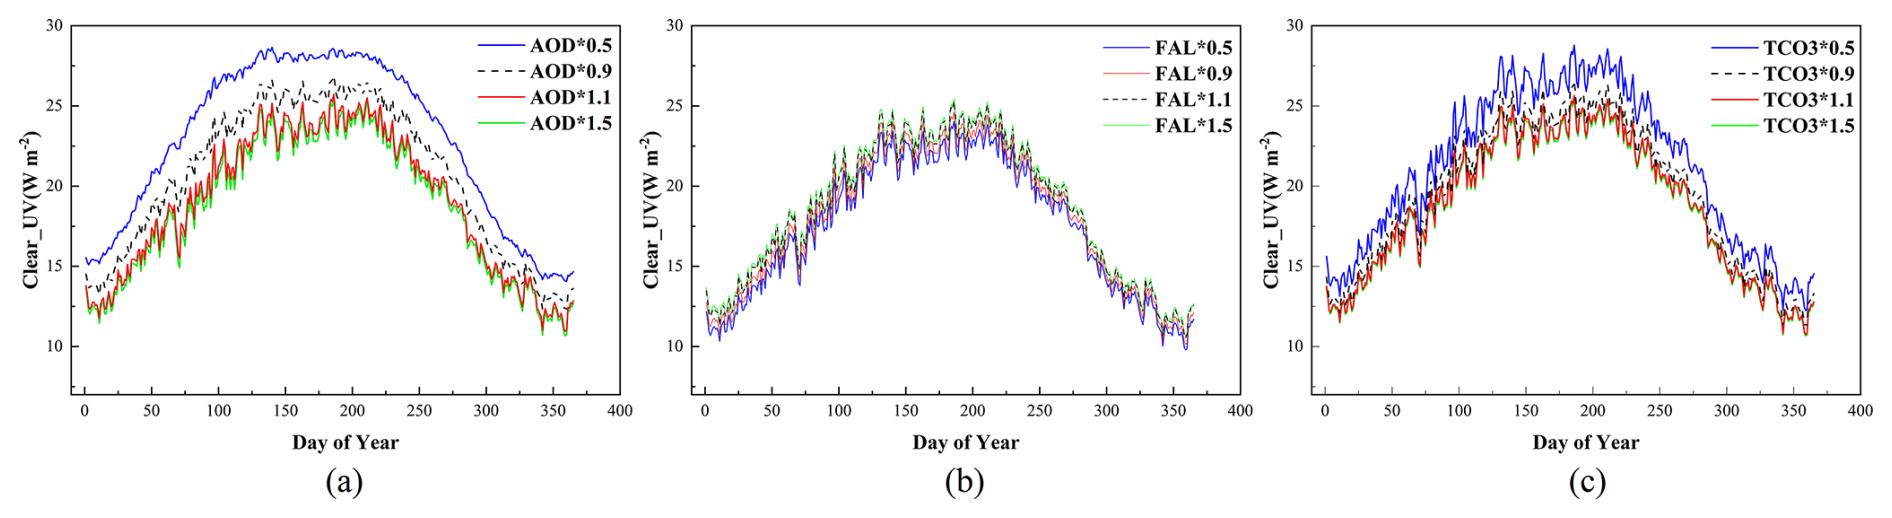
Figure 8Mean annual variation of estimated clear-sky UV irradiance at 37 CERN stations under different conditions. The baseline (red curve) uses the original input data. The four green curves represent the estimates obtained after scaling the indicated input.
A key limitation in this study arises from the selection of the aerosol model in the SMARTS radiative transfer simulations. To maintain consistency with the continental focus of our work, the built-in “Continental” aerosol model was employed. While this model is representative of typical inland aerosol species such as sulfates, nitrates, black carbon, and dust, it does not include an explicit parameterization for sea salt aerosols. This discrepancy could introduce systematic biases in simulated UV radiation in coastal regions and inland areas subject to marine air mass advection, as sea salt aerosols differ significantly from continental types in their size distribution, and scattering efficiency (Zhu et al., 2022; Kouvarakis et al., 2002; Chatzopoulou et al., 2025). Future research should aim to integrate a more sophisticated hybrid or maritime aerosol model and couple it with higher-resolution aerosol reanalysis or observational data to better constrain the aerosol-type dependence and improve the accuracy of UV estimates in complex coastal-continental transition zones.
Figure 9 presents the validation results of the SMARTS model's clear-sky UV radiation estimates against station observations under different scaling factors. For AOD, as the scaling factor increases from 0.5 to 1.5, the R value decreases from 0.943 to 0.918, indicating a slight decline in the model's correlation with observations. The MBE shifts from 1.83 to −1.51 W m−2, suggesting that the model overestimates UV radiation at lower scaling factors and underestimates it at higher scaling factors. The RMSE initially decreases from 5.08 to 4.87 W m−2 (scaling factors 0.5–0.9), and subsequently increases to 5.44 W m−2 when the scaling factor exceeds 1, demonstrating a reduction in the model's predictive capability with increasing AOD scaling factors. As the scaling factor for TCO3 increases, the R value remains stable between 0.932 and 0.934, showing minimal variation. The MBE decreases from 1.19 to −0.74 W m−2, indicating a transition from overestimation to underestimation. Meanwhile, the RMSE decreases from 5.21 to 4.69 W m−2, suggesting that the model's prediction error is reduced at higher TCO3 scaling factors. When the FAL scaling factor reaches 1.5, the model exhibits the lowest overall accuracy, with an R value of 0.929, MBE of 1.05 W m−2, and RMSE of 5.29 W m−2, indicating that increasing FAL scaling factors significantly amplify the model's prediction error. The MBE shifts from −0.98 to 1.05 W m−2, demonstrating that the model underestimates at lower scaling factors and overestimates at higher scaling factors. These results reveal the complex influence of different input parameters on UV radiation estimation and provide critical insights for optimizing model performance.
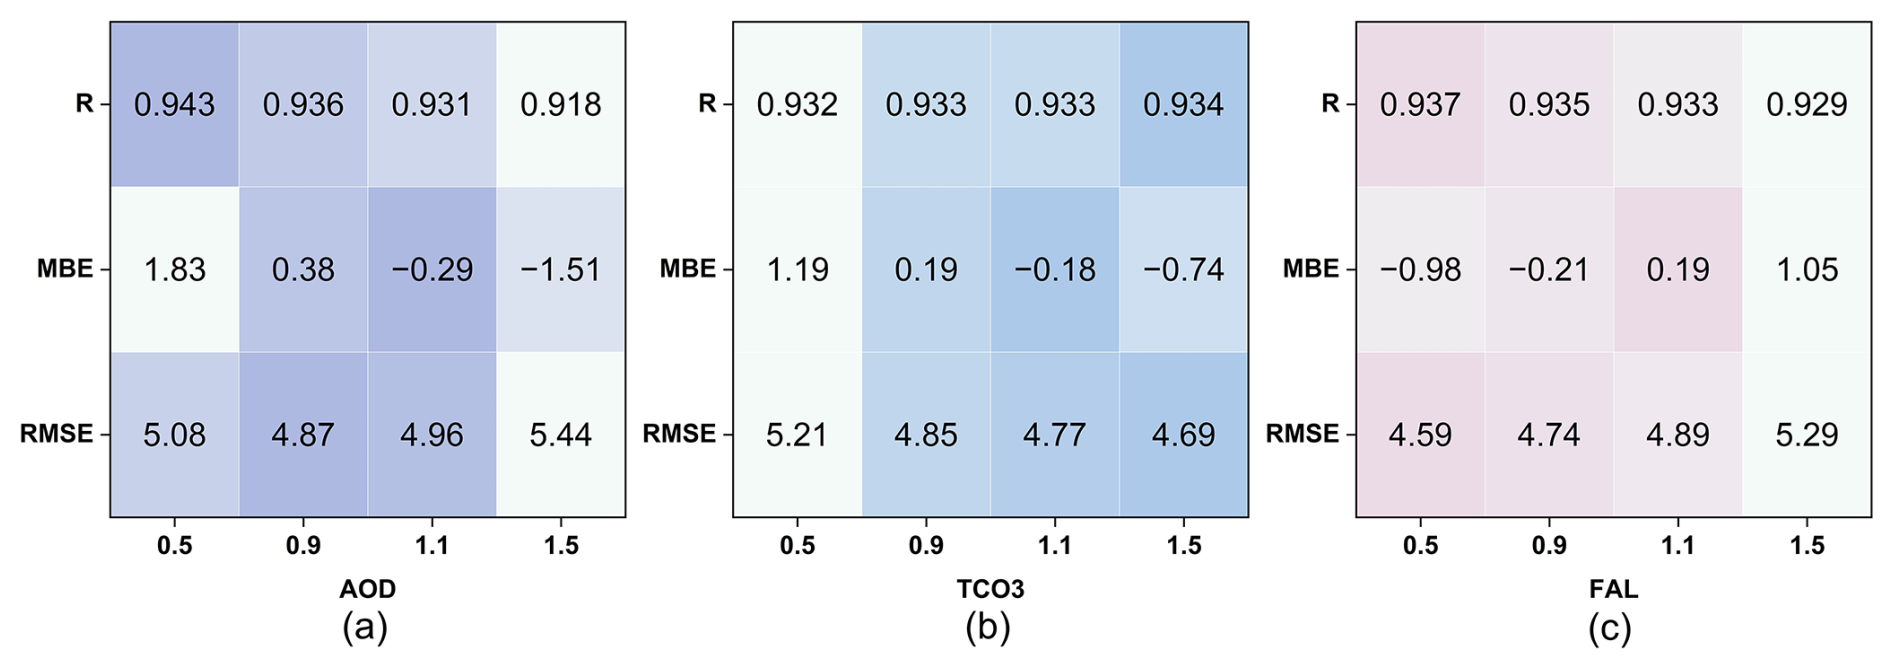
Figure 9Accuracy validation of clear-sky UV radiation estimates and station observations under different conditions.
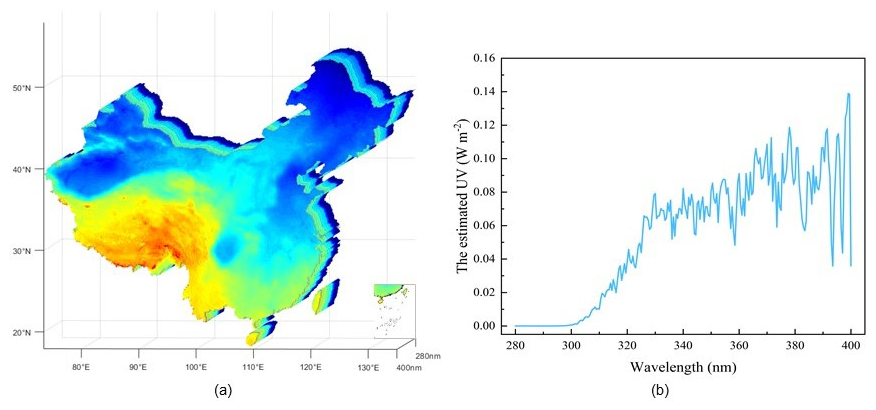
Figure 10(a) 3D hyperspectral distribution of clear-sky UV radiation in China (2023). (b) Spectral variation of clear-sky UV radiation (280–400 nm) across entire China.
4.4 Evaluating the spatial and temporal variability of clear-sky UV radiation
4.4.1 Evaluating the spatial variability of clear-sky UV radiation across wavelengths
In this study, we generated a stereogram of clear-sky UV radiation by wavelength using the SMARTS model. The data range spans 280–400 nm with a step size of 0.5 nm, encompassing radiation values across 241 wavelength bands (Fig. 10a). The first layer of this figure illustrates the distribution of total UV radiation under clear-sky conditions across China in 2023, while the subsequent 241 layers represent the radiation value distributions for individual wavelength bands. Figure 10b shows an unfolded representation of the mean clear-sky UV radiation values across China for each wavelength bands from Fig. 10a, showing a gradual increase in UV radiation intensity with increasing wavelength. In the short wavelength range (280–310 nm), the radiation is relatively weak, likely due to strong absorption by the ozone layer. In contrast, the long wavelength range (380–400 nm) exhibits stronger radiation, indicating greater penetration capability. By analyzing the radiation intensity at different wavelengths, the impact of UV radiation at various wavelengths on human health and the environment can be studied.
4.4.2 Evaluating the spatial variability of clear-sky UV radiation
The SMARTS model was employed to reconstruct a long-term dataset of clear-sky UV radiation across China from 1981 to 2023. Figure 11 presents the annual average spatial distribution of clear-sky UV radiation in China during 1981–2023. The clear-sky UV radiation values range from 14.26 to 31.25 W m−2, with an overall annual average value of 20.05 W m−2. Spatially, clear-sky UV radiation exhibits a distinct west-to-east decreasing gradient, accompanied by lower values in northeastern China compared to the southern regions. The Tibetan Plateau, characterized by its high altitude, exhibits the highest clear-sky UV radiation levels in the country. The reduced atmospheric thickness over high-altitude regions results in less attenuation of UV radiation, thereby enhancing surface UV levels. In contrast, northeastern China experiences lower UV radiation due to its higher latitude, where lower solar altitude angles lead to greater atmospheric absorption and scattering, significantly attenuating surface UV radiation. Additionally, the Sichuan Basin is identified as a region with notably low clear-sky UV radiation levels. This is attributed to its low elevation and surrounding mountains, which limits the amount of solar radiation received, which enhances UV radiation absorption and scattering within the atmosphere (Qin et al., 2020a).
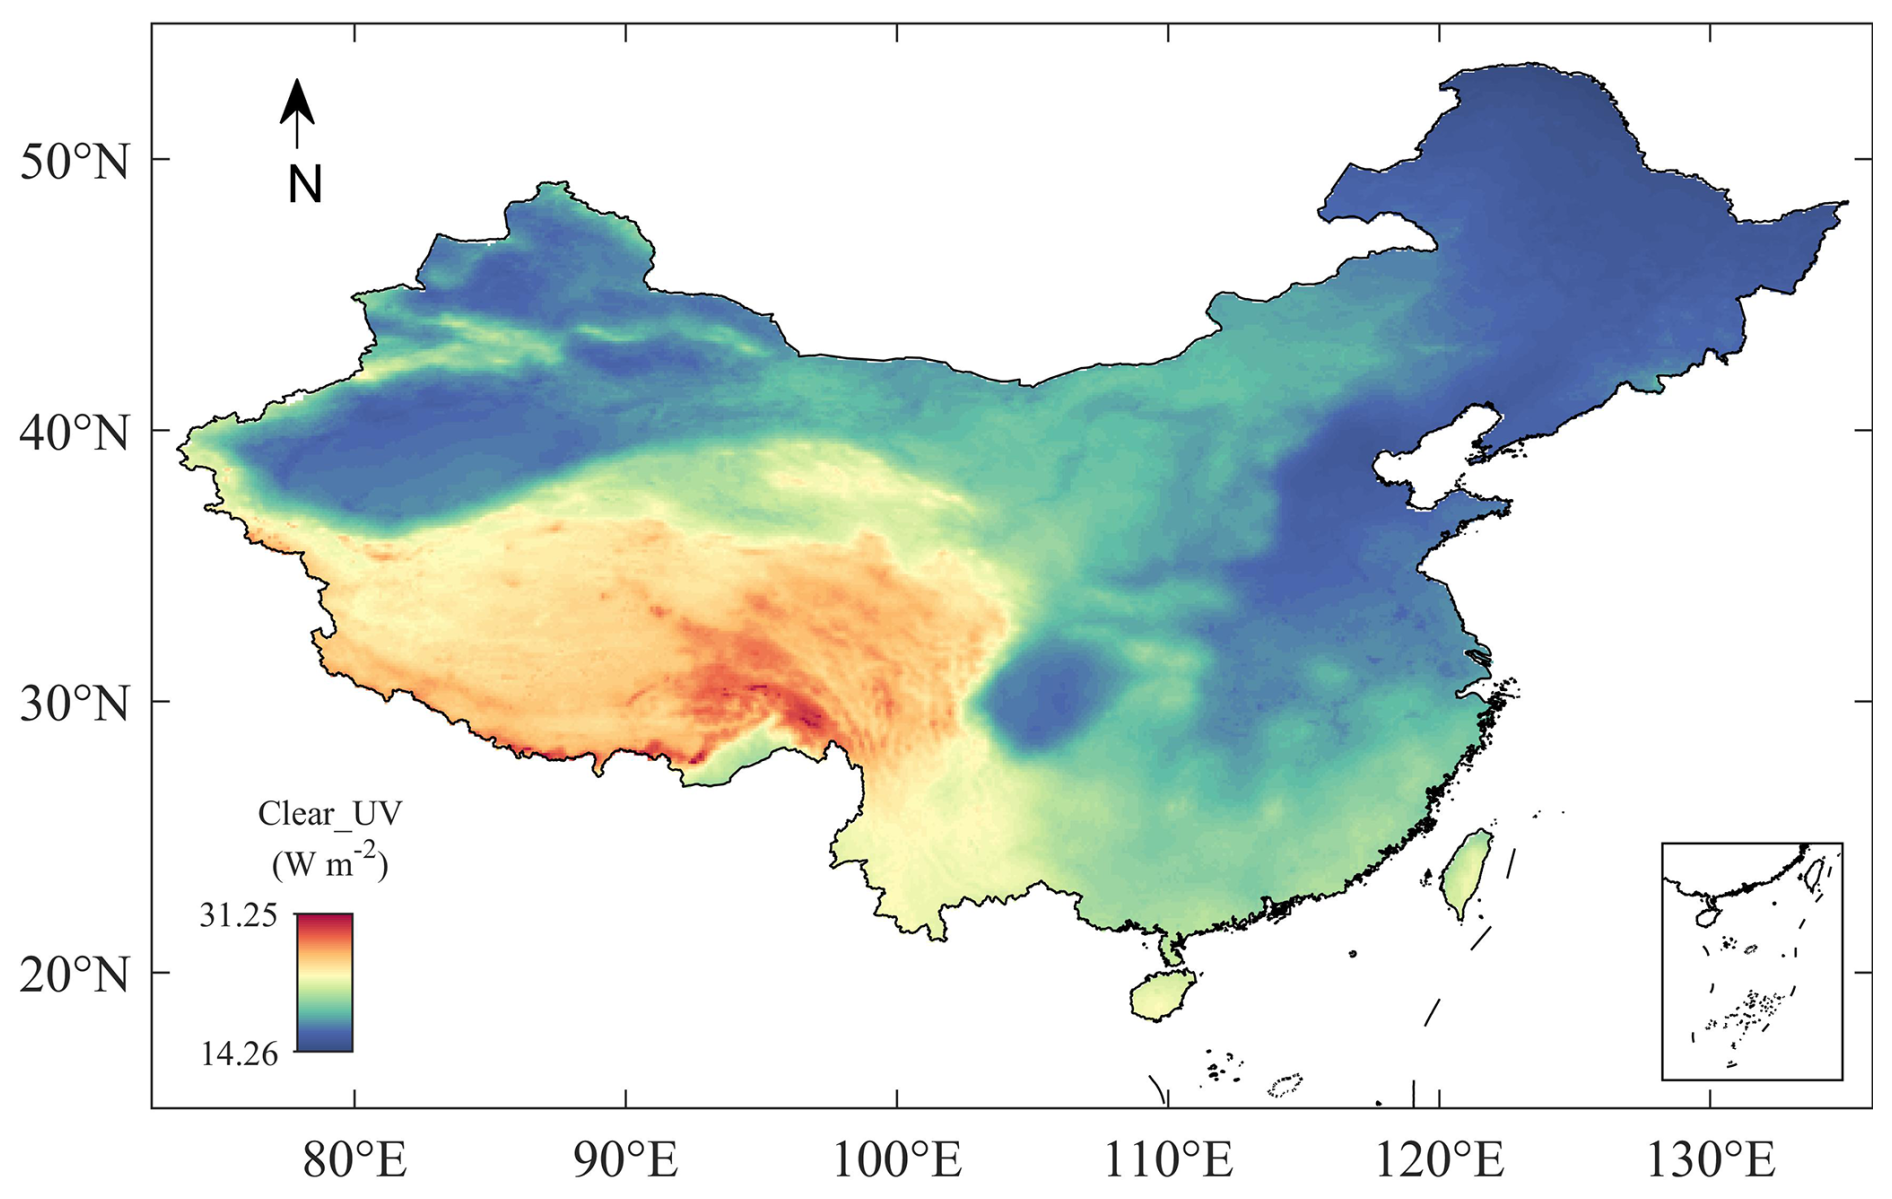
Figure 11Annual average spatial distribution of clear-sky UV radiation in China from 1981 to 2023.
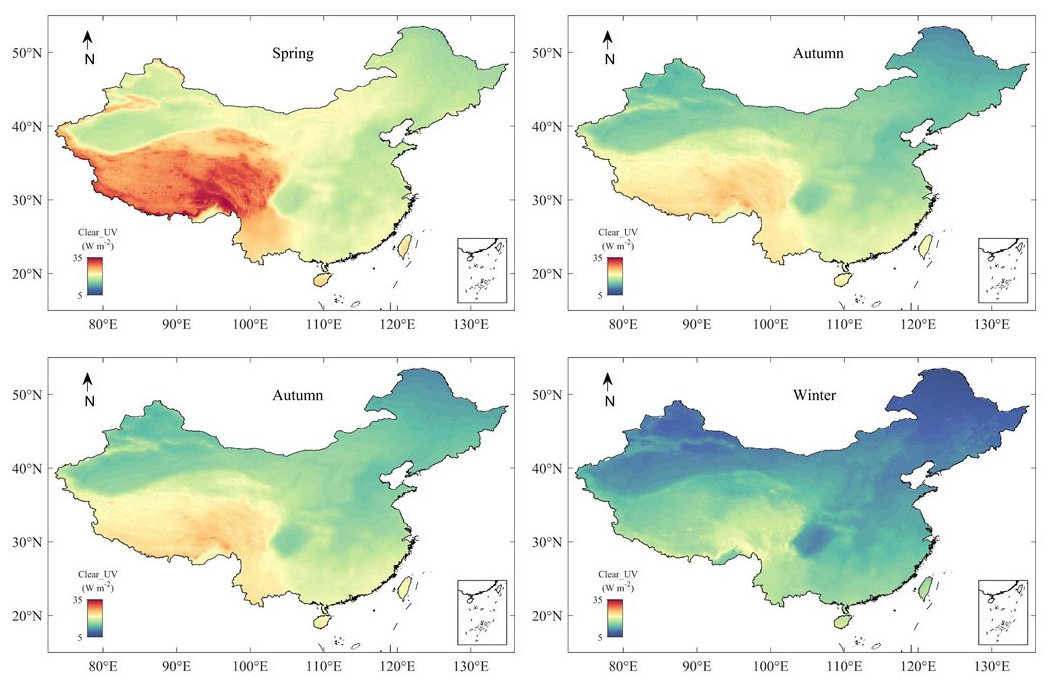
Figure 12Average seasonal spatial distribution of clear-sky UV radiation in China from 1981 to 2023.
As illustrated in Fig. 12, the clear-sky UV radiation in China exhibits pronounced seasonal variations, primarily driven by changes in the solar zenith angle and maximum sunshine duration throughout the year. The highest UV radiation levels are observed in summer (Fig. 12b), particularly over the Tibetan Plateau, where values approach 35 W m−2. Conversely, the winter (Fig. 12d) demonstrate the least intensity of UV radiation, with values in northern regions reaching only 5–10 W m−2. Spring (Fig. 12a) and autumn (Fig. 12c) exhibit intermediate radiation levels, reflecting the seasonal transition between the extremes of summer and winter. The average national UV radiation levels experienced a notable increase of 0.8962 W m−2 in the spring months when compared to the annual mean. Conversely, during the autumn season, a decline of approximately 0.9277 W m−2 was observed. From a spatial perspective, the Tibetan Plateau consistently records the highest UV radiation levels across all seasons due to its high-altitude (mean elevation exceeding 4000 m) and thinner atmosphere. In contrast, eastern regions of China, characterized by lower altitudes and denser atmospheric layers, display comparatively lower UV radiation levels. These spatial patterns underscore the influence of both altitude and latitude on the distribution of UV radiation across China.
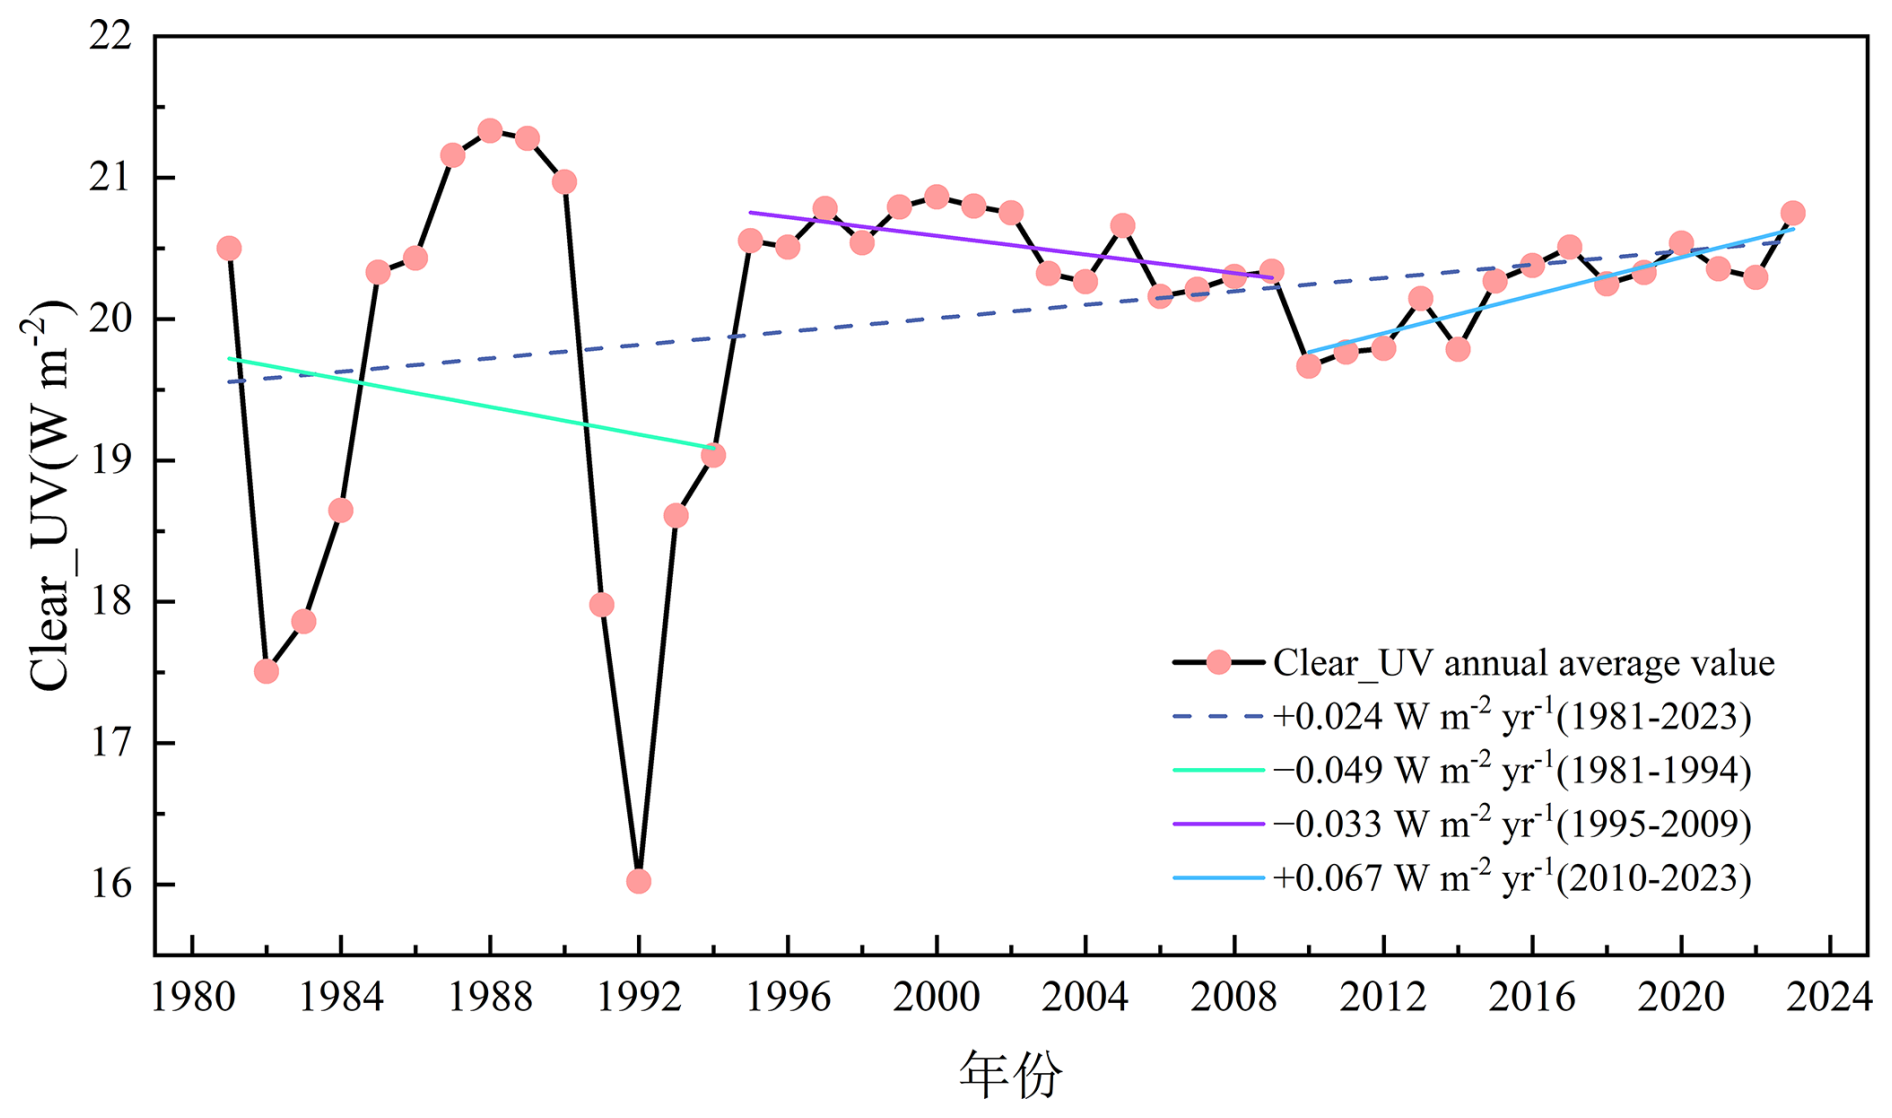
4.4.3 Evaluating the inter-annual variability and trends of clear-sky UV radiation
The annual trend of clear-sky UV radiation in the Chinese region from 1981 to 2023 is shown in Fig. 13. Over the 43-year period, the annual average clear-sky UV radiation demonstrates a slight overall upward trend (+0.0237 W m−2 yr−1), with annual mean values ranging from 16.02 to 21.33 W m−2. The analysis of trends in long-term environmental time series is recognized as being sensitive to the selected data range and to methodology of detrending (Wu et al., 2007). In this study, the inter-annual variability can be divided into three distinct phases. From 1981 to 199−2 yr−1). This reduction is primarily attributed to the eruption of the El Chichón volcano in Mexico in 1982 and the Mount Pinatubo eruption in the Philippines in 1991. A large amount of smoke and volcanic ash was released from the stratosphere into the troposphere, leading to a sharp increase in aerosol particle concentration in the atmosphere. High concentrations of aerosols significantly reduce the intensity of UV radiation reaching the Earth's surface through scattering and absorption processes (Fang et al., 2021). In 1992, clear-sky UV radiation reached its lowest value in 43 years at 16.02 W m−2. After 1992, the impact of volcanic eruptions on clear-sky UV radiation gradually diminished, with the overall trend levelling off by 1995. Following this period, from 1995 to 2009, with rapid economic development and the extensive burning of fossil fuels, air pollution became more severe, leading to an increase in anthropogenic aerosols. At the same time, the rise in ozone concentration over China enhanced the scattering and absorption processes in the atmosphere (Verstraeten et al., 2015), thereby reducing the UV radiation reaching the Earth's surface (−0.0329 W m−2 yr−1). Since 2010, clear-sky UV radiation has risen sharply (+0.0670 W m−2 yr−1), following the implementation of stringent air pollution control policies in China that led to a reduction in atmospheric aerosols, ozone, and other pollutants through curbed coal consumption and industrial emissions (He et al., 2016). The continuous improvement in air quality has significantly enhanced the intensity of UV radiation under clear-sky conditions, showing a significant upward trend. Finally, while the identified trend is statistically significant and physically consistent, it should be noted that its quantitative value is methodology- and period-dependent, a common consideration in non-stationary time series analysis.
The hourly clear-sky UV radiation dataset reconstructed in this study, covering 43 years (1981–2023), has been uploaded to figshare, and is stored in NetCDF format. Users can access the complete dataset via the links: https://doi.org/10.6084/m9.figshare.28234298 (Qi et al., 2025). The one-year datasets include 365 or 366 NetCDF files, with file names following the format “UV_yyyymmdd”, where “yyyy” represents the year, “mm” represents the month, and “dd” stands for the day. The unit of the data is W m−2. Each file contains three variables: solar UV radiation, longitude, and latitude, with dimensions of . The dataset covers the region from 73.5 to 135° E and 18 to 53.5° N, with a spatial resolution of 0.1° (approximately 10 km). The data is presented in local standard time (LST), corresponding to UTC+8 for China.
In addition, leveraging the spectral computation capabilities of the SMARTS model, the dataset has been further refined to provide UV radiation data at 0.5 nm intervals within the wavelength range of 280–400 nm, covering a total of 241 bands. This refined dataset has also been uploaded to figshare (https://doi.org/10.6084/m9.figshare.28234298) (Qi et al., 2025), accessible through their respective links for download. Each file is named using the format “UV_05nm_yyyymmddhh,” where “yyyy” denotes the year, “mm” represents the month, “dd” stands for the day, and “hh” denotes the hour, with units in W m−2. Each file contains four variables (solar UV radiation, longitude, latitude, and wavelength), with dimensions of .
We used the SMARTS model to reconstruct a long-term (1981–2023) hourly clear-sky UV radiation dataset (10 km × 10 km) in China. The SMARTS model is capable of generating wavelength-specific clear-sky UV radiation with a spectral resolution of 0.5 nm, covering the 280–400 nm range, which enhances its ability to analyze spectral UV characteristics. Key inputs to the model include conventional meteorological products from ERA5 (e.g., relative humidity, total column ozone, total column water vapor, surface pressure, 2 m temperature and forecast albedo) and aerosol properties from MERRA2. The generated clear-sky UV radiation dataset was rigorously validated against CERN site observations and further compared with UV radiation estimates from CERES products. For the hourly clear-sky UV radiation, the overall R, RMSE and MBE were 0.919, 5.07 W m−2 and −0.07 W m−2, respectively. On the daily scale, these values were 0.907, 3.37 W m−2 and 0.14 W m−2, respectively. The generated clear-sky UV radiation dataset significantly outperforms the CERES product on both temporal scales.
In addition, this study conducted a sensitivity analysis on the key input parameters (AOD, TCO3, and FAL) of the SMARTS model using scaling factors of 0.5, 0.9, 1.1, and 1.5. The results indicate that AOD and TCO3 are the primary attenuating factors for UV radiation, while FAL has an enhancing factor. Specifically, as the AOD scaling factor increases, the model's predictive capability significantly declines. At higher TCO3 scaling factors, the model's prediction error decreases. Conversely, increasing the FAL scaling factor substantially amplifies the model's prediction error. The spatial distribution of clear-sky UV radiation in China generally exhibits a pattern of “higher in the west and lower in the east, higher in the south and lower in the north”. In addition, there is significant seasonal variation. The annual mean values of clear-sky UV radiation range from 14.26 to 31.25 W m−2, with the overall annual mean reaching 20.05 W m−2. By analyzing the spectral UV radiation distribution, it was observed that the clear-sky UV radiation increases with wavelength across the 280–400 nm range. Throughout the study period, clear-sky UV radiation exhibited a slight increasing trend (+0.0237 W m−2 yr−1).
This study reconstructed a long-term, high-temporal, and high-spatial resolution dataset of clear-sky UV radiation and further refined it into a spectral UV radiation dataset with 0.5 nm intervals. We anticipate that this dataset will provide valuable support for research in fields such as human health and ecological environments. However, as the SMARTS model only simulates UV radiation under clear-sky conditions, future research should integrate the effects of cloud cover to develop an all-sky UV radiation dataset. Furthermore, the scope of the study could be expanded from the national to the global scale, enabling a more comprehensive spatial and temporal analysis.
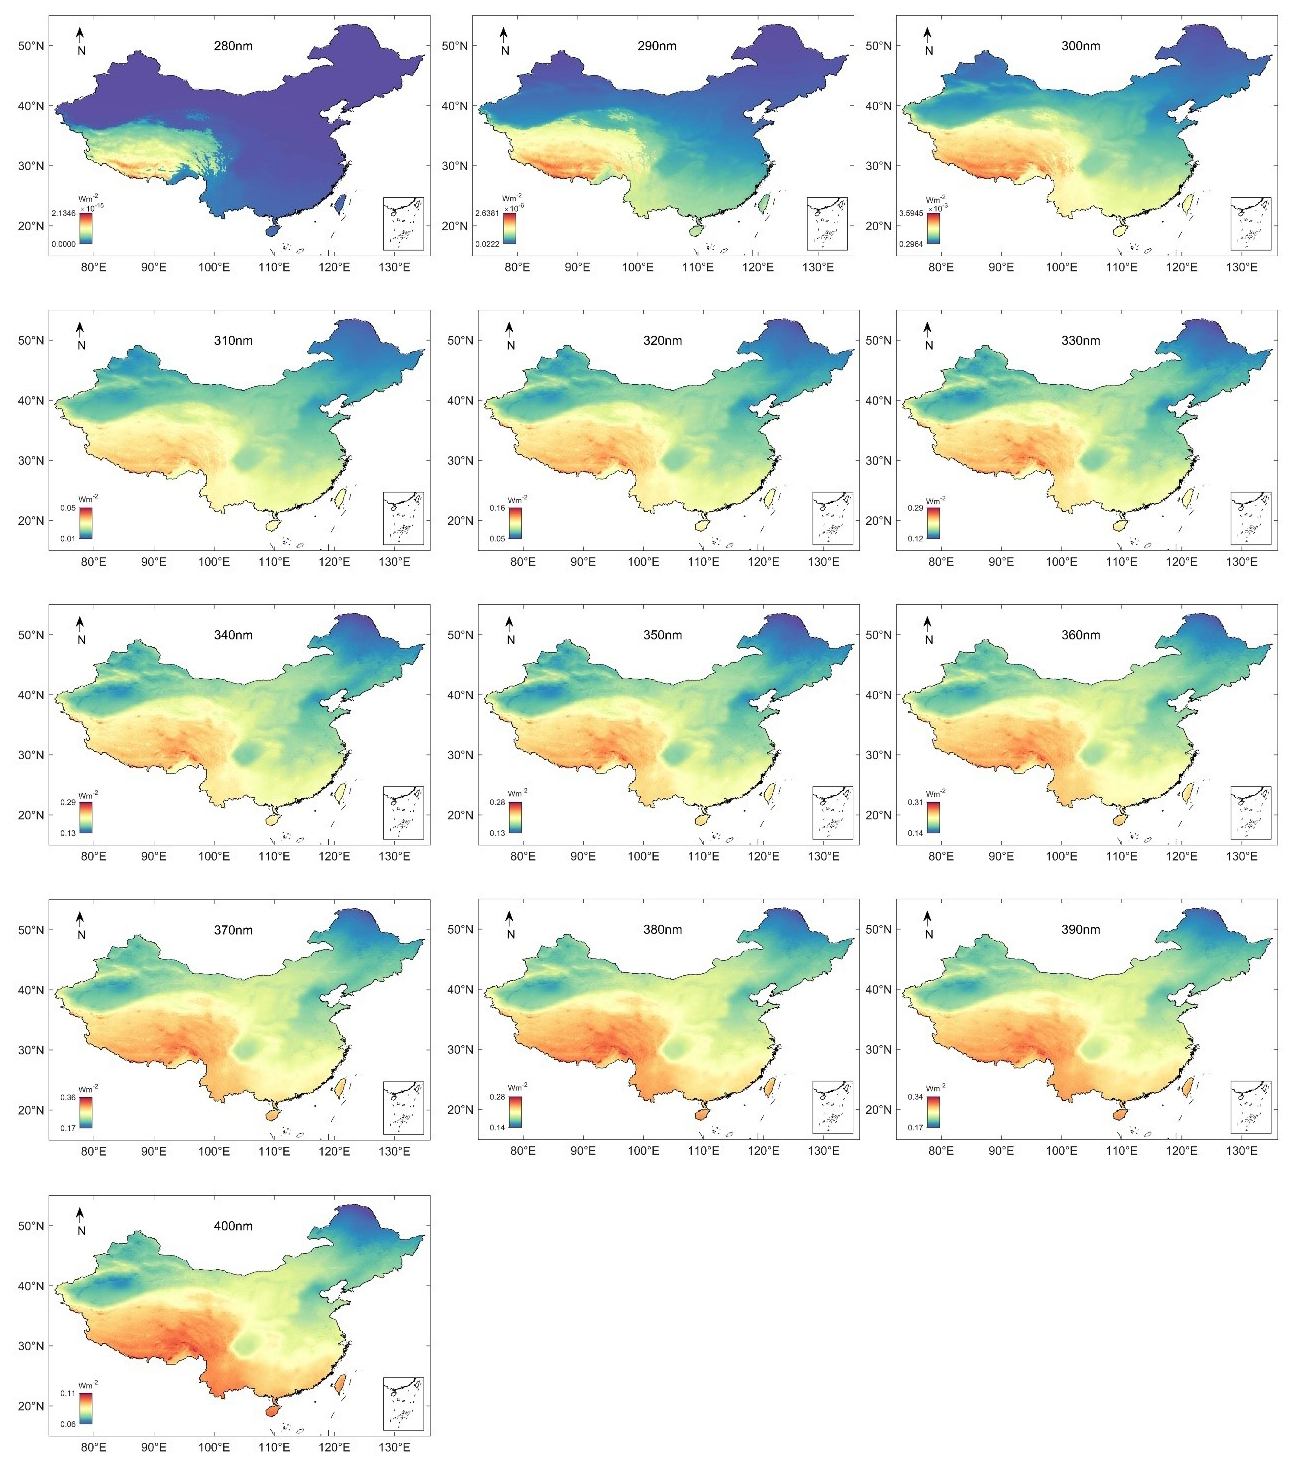
Figure A1Spatial distribution map of specific spectral bands in China (2023).
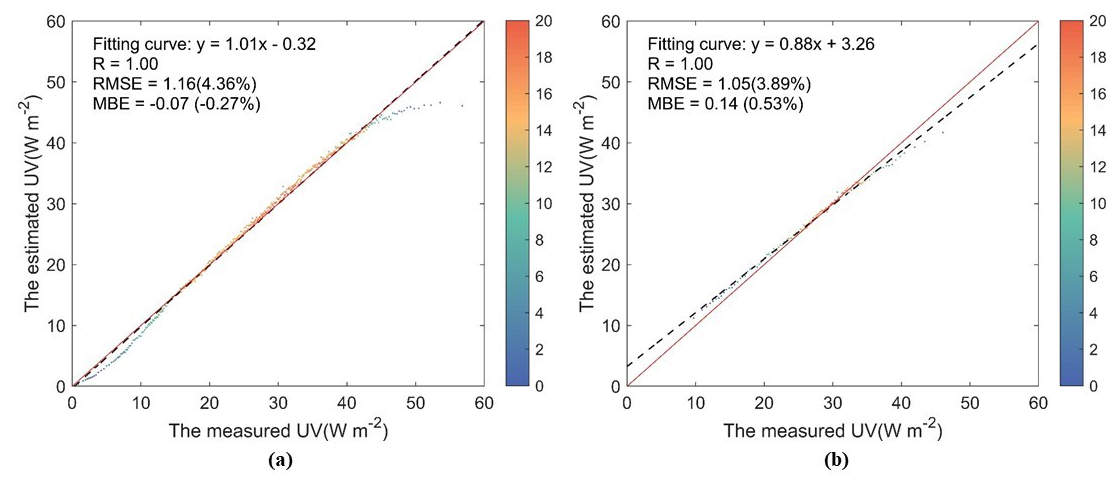
Figure A2Binning scatter validation results of the estimated clear-sky UV dataset against observations at 37 CERN stations from 2005–2013. (a) Density scatter plot between the hourly estimated dataset and observations; (b) same as (a) but for daily results.
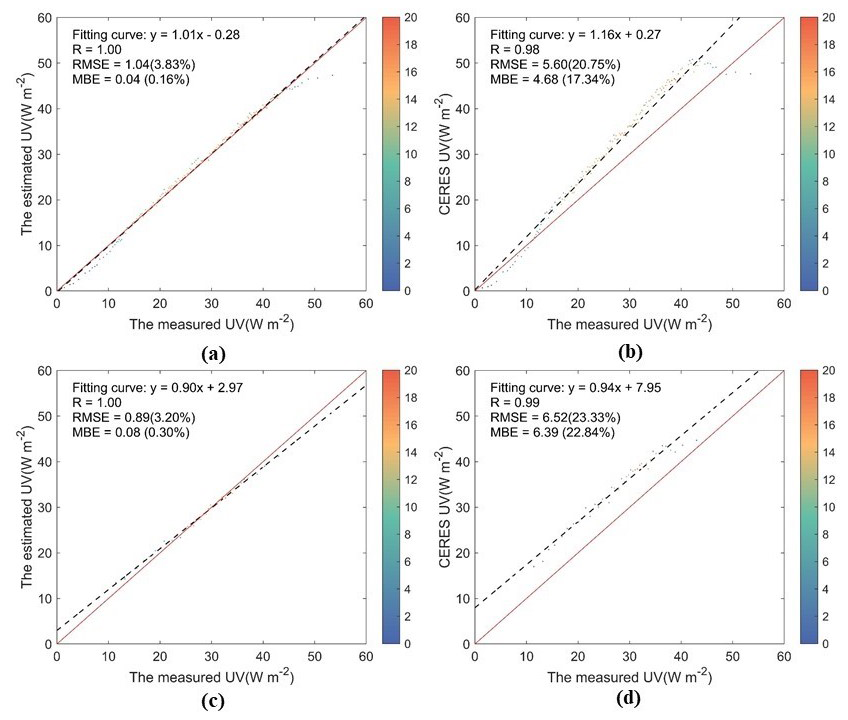
Figure A3Binning scatterplot of assessment results for two clear-sky UV radiation products. (a) Density scatterplot between the hourly clear-sky SMARTS-derived UV irradiance estimates and CERN observations. (b) Same as (a) but for the CERES SYN1deg estimates. (d) and (e) same as (a) and (b) but for daily results.
QQ designed the research, analyzed the results, wrote and revised the manuscript. YT calculated the dataset and validation. CAG supported the initial code of SMARTS model. WQ designed the research, revised the manuscript. HB revised the manuscript and provide the CERN Data. TS analyzed the data. MZ revised the manuscript. MW revised the manuscript. LW revised the manuscript.
At least one of the (co-)authors is a member of the editorial board of Earth System Science Data. The peer-review process was guided by an independent editor, and the authors also have no other competing interests to declare.
Publisher's note: Copernicus Publications remains neutral with regard to jurisdictional claims made in the text, published maps, institutional affiliations, or any other geographical representation in this paper. The authors bear the ultimate responsibility for providing appropriate place names. Views expressed in the text are those of the authors and do not necessarily reflect the views of the publisher.
The UV radiation station data were obtained from the China Ecosystem Research Network (CERN). The ERA5 conventional meteorological data and MERRA-2 aerosol data are available from their official websites (https://cds.climate.copernicus.eu, last access: 10 September 2024 and https://disc.gsfc.nasa.gov, last access: 15 October 2024). The authors would like to thank the staff of the data management and production organizations for their valuable work.
This research has been supported by the National Natural Science Foundation of China (grant no. 42371031).
This paper was edited by Alexander Kokhanovsky and reviewed by three anonymous referees.
Antón, M., Serrano, A., Cancillo, M. L., García, J. A., and Madronich, S.: Application of an analytical formula for UV Index reconstructions for two locations in Southwestern Spain, Tellus B, 63, 1052–1058, https://doi.org/10.1111/j.1600-0889.2011.00541.x, 2011.
Apell, J. N. and McNeill, K.: Updated and validated solar irradiance reference spectra for estimating environmental photodegradation rates, Environ. Sci.: Process. Imp., 21, 427–437, https://doi.org/10.1039/C8EM00478A, 2019.
Barbero, F. J., López, G., and Batlles, F. J.: Determination of daily solar ultraviolet radiation using statistical models and artificial neural networks, Ann. Geophys., 24, 2105–2114, https://doi.org/10.5194/angeo-24-2105-2006, 2006.
Bicer, Y., Sajid, M. U., and Al-Breiki, M.: Optimal spectra management for self-power producing greenhouses for hot arid climates, Renew. Sustain. Energ. Rev., 159, 112194, https://doi.org/10.1016/j.rser.2022.112194, 2022.
Bo, H., Yue-Si, W., and Guang-Ren, L.: Properties of Solar Radiation over Chinese Arid and Semi-Arid Areas, Atmos. Ocean. Sci. Lett., 2, 183–187, https://doi.org/10.1080/16742834.2009.11446790, 2009.
Booth, C. R., Lucas, T. B., Morrow, J. H., Weiler, C. S., and Penhale, P. A.: The United States National Science Foundation's Polar Network for Monitoring Ultraviolet Radiation, in: Ultraviolet Radiation in Antarctica: Measurements and Biological Effects, AGU – American Geophysical Union, 17–37, https://doi.org/10.1029/AR062p0017, 1994.
Chatzopoulou, K., Tourpali, K., Bais, A. F., and Braesicke, P.: Effects of different aerosol types on surface UV radiation in the 21st century, Atmos. Environ., 362, 121595, https://doi.org/10.1016/j.atmosenv.2025.121595, 2025.
Chubarova, N. E., Pastukhova, A. S., Zhdanova, E. Y., Volpert, E. V., Smyshlyaev, S. P., and Galin, V. Y.: Effects of Ozone and Clouds on Temporal Variability of Surface UV Radiation and UV Resources over Northern Eurasia Derived from Measurements and Modeling, Atmosphere, 11, 59, https://doi.org/10.3390/atmos11010059, 2020.
Ciren, P. and Li, Z.: Long-term global earth surface ultraviolet radiation exposure derived from ISCCP and TOMS satellite measurements, Agr. Forest Meteorol., 120, 51–68, https://doi.org/10.1016/j.agrformet.2003.08.033, 2003.
Čížková, K., Láska, K., Metelka, L., and Staněk, M.: Reconstruction and analysis of erythemal UV radiation time series from Hradec Králové (Czech Republic) over the past 50 years, Atmos. Chem. Phys., 18, 1805–1818, https://doi.org/10.5194/acp-18-1805-2018, 2018.
Fang, H., Qin, W., Wang, L., Zhang, M., and Yang, X.: Solar Brightening/Dimming over China's Mainland: Effects of Atmospheric Aerosols, Anthropogenic Emissions, and Meteorological Conditions, Remote Sens., 13, 88, https://doi.org/10.3390/rs13010088, 2021.
Fragkos, K., Fountoulakis, I., Charalampous, G., Papachristopoulou, K., Nisantzi, A., Hadjimitsis, D., and Kazadzis, S.: Twenty-Year Climatology of Solar UV and PAR in Cyprus: Integrating Satellite Earth Observations with Radiative Transfer Modeling, Remote Sens., 16, 1878, https://doi.org/10.3390/rs16111878, 2024.
Gelaro, R., McCarty, W., Suárez, M. J., Todling, R., Molod, A., Takacs, L., Randles, C. A., Darmenov, A., Bosilovich, M. G., Reichle, R., Wargan, K., Coy, L., Cullather, R., Draper, C., Akella, S., Buchard, V., Conaty, A., da Silva, A. M., Gu, W., Kim, G.-K., Koster, R., Lucchesi, R., Merkova, D., Nielsen, J. E., Partyka, G., Pawson, S., Putman, W., Rienecker, M., Schubert, S. D., Sienkiewicz, M., and Zhao, B.: The Modern-Era Retrospective Analysis for Research and Applications, Version 2 (MERRA-2), J. Climate, 30, 5419–5454, https://doi.org/10.1175/JCLI-D-16-0758.1, 2017.
Gong, W., Zhang, M., Hu, B., and Ma, Y.: Measurement and estimation of ultraviolet radiation in Pearl River Delta, China, J. Atmos. Sol.-Terr. Phy., 123, https://doi.org/10.1016/j.jastp.2014.12.010, 2014.
Goti, G., Manal, K., Sivaguru, J., and Dell'Amico, L.: The impact of UV light on synthetic photochemistry and photocatalysis, Nat. Chem., 16, 684–692, https://doi.org/10.1038/s41557-024-01472-6, 2024.
Gueymard, C. A.: Parameterized transmittance model for direct beam and circumsolar spectral irradiance, Solar Energy, 71, 325–346, https://doi.org/10.1016/S0038-092X(01)00054-8, 2001.
Gueymard, C. A.: The sun's total and spectral irradiance for solar energy applications and solar radiation models, Solar Energy, 76, 423–453, https://doi.org/10.1016/j.solener.2003.08.039, 2004.
Gueymard, C. A.: SMARTS code, version 2.9.5 For Linux USER'S MANUAL, Solar Consulting Services, https://www.nrel.gov/grid/solar-resource/smarts (last access: 10 October 2024), 2005.
Gueymard, C. A.: A review of validation methodologies and statistical performance indicators for modeled solar radiation data: Towards a better bankability of solar projects, Renew. Sustain. Energ. Rev., 39, 1024–1034, https://doi.org/10.1016/j.rser.2014.07.117, 2014.
Gueymard, C. A.: A reevaluation of the solar constant based on a 42-year total solar irradiance time series and a reconciliation of spaceborne observations, Solar Energy, 168, 2–9, https://doi.org/10.1016/j.solener.2018.04.001, 2018.
Gueymard, C. A.: The SMARTS spectral irradiance model after 25 years: New developments and validation of reference spectra, Solar Energy, 187, 233–253, https://doi.org/10.1016/j.solener.2019.05.048, 2019.
Gueymard, C. A. and Yang, D.: Worldwide validation of CAMS and MERRA-2 reanalysis aerosol optical depth products using 15 years of AERONET observations, Atmos. Environ., 225, 117216, https://doi.org/10.1016/j.atmosenv.2019.117216, 2020.
Habte, A., Sengupta, M., Gueymard, C. A., Narasappa, R., Rosseler, O., and Burns, D. M.: Estimating Ultraviolet Radiation From Global Horizontal Irradiance, IEEE J. Photovolt., 9, 139–146, https://doi.org/10.1109/JPHOTOV.2018.2871780, 2019.
Habte, A., Sengupta, M., and Gueymard, C. A.: Consensus International Solar Resource Standards and Best Practices Development, in: 2020 47th IEEE Photovoltaic Specialists Conference (PVSC), 1967–1971, https://doi.org/10.1109/PVSC45281.2020.9300559, 2020.
He, Q., Zhang, M., and Huang, B.: Spatio-temporal variation and impact factors analysis of satellite-based aerosol optical depth over China from 2002 to 2015, Atmos. Environ., 129, 79–90, https://doi.org/10.1016/j.atmosenv.2016.01.002, 2016.
Huang, G., Li, Z., Li, X., Liang, S., Yang, K., Wang, D., and Zhang, Y.: Estimating surface solar irradiance from satellites: Past, present, and future perspectives, Remote Sens. Environ., 233, 111371, https://doi.org/10.1016/j.rse.2019.111371, 2019.
Janjai, S., Buntung, S., Wattan, R., and Masiri, I.: Mapping solar ultraviolet radiation from satellite data in a tropical environment, Remote Sens. Environ., 114, 682–691, https://doi.org/10.1016/j.rse.2009.11.008, 2010.
Jesus, H. S., Coelho Costa, S. M. S., Ceballos, J. C., and Corrêa, M. P.: Cloud modification factor parametrization for solar UV based on the GOES satellite: Validation using ground-based measurements in São Paulo city, Brazil, Atmos. Environ., 309, 119942, https://doi.org/10.1016/j.atmosenv.2023.119942, 2023.
Jiang, H., Yang, Y., Wang, H., Bai, Y., and Bai, Y.: Surface Diffuse Solar Radiation Determined by Reanalysis and Satellite over East Asia: Evaluation and Comparison, Remote Sens., 12, 1387, https://doi.org/10.3390/rs12091387, 2020.
Jiang, Y., Shi, S., Li, X., Xu, C., Kan, H., Hu, B., and Meng, X.: A 10 km daily-level ultraviolet-radiation-predicting dataset based on machine learning models in China from 2005 to 2020, Earth Syst. Sci. Data, 16, 4655–4672, https://doi.org/10.5194/essd-16-4655-2024, 2024.
Katsambas, A., Varotsos, C. A., Veziryianni, G., and Antoniou, C.: Surface solar ultraviolet radiation: A theoretical approach of the SUVR reaching the ground in Athens, Greece, Environ. Sci. Pollut. Res., 4, 69–73, https://doi.org/10.1007/BF02986280, 1997.
Kouvarakis, G., Doukelis, Y., Mihalopoulos, N., Rapsomanikis, S., Sciare, J., and Blumthaler, M.: Chemical, physical, and optical characterization of aerosols during PAUR II experiment, J. Geophys. Res., 107, 8141, https://doi.org/10.1029/2000JD000291, 2002.
Krizan, P.: Attempt to Explore Ozone Mixing Ratio Data from Reanalyses for Trend Studies, Atmosphere, 15, 1298, https://doi.org/10.3390/atmos15111298, 2024.
Kujanpää, J. and Kalakoski, N.: Operational surface UV radiation product from GOME-2 and AVHRR/3 data, Atmos. Meas. Tech., 8, 4399–4414, https://doi.org/10.5194/amt-8-4399-2015, 2015.
Laguarda, A. and Abal, G.: Assessment of empirical models to estimate UV-A, UV-B and UV-E solar irradiance from GHI, Conference Proceedings, https://doi.org/10.18086/swc.2019.42.04, 2019.
Laguarda, A., Abal, G., Russo, P., and Habte, A.: Estimating UV-B, UV-Erithemic, and UV-A Irradiances From Global Horizontal Irradiance and MERRA-2 Ozone Column Information, J. Solar Energ. Eng., 147, https://doi.org/10.1115/1.4066202, 2024.
Laiwarin, P.: Development of monthly average hourly maps of vitamin D weighted solar ultraviolet radiation for Thailand using an empirical model from ground- and satellite-based data, Thesis, Silpakorn University, https://sure.su.ac.th/xmlui/handle/123456789/28462 (last access: 18 June 2024), 2023.
Lakkala, K., Kujanpää, J., Brogniez, C., Henriot, N., Arola, A., Aun, M., Auriol, F., Bais, A. F., Bernhard, G., De Bock, V., Catalfamo, M., Deroo, C., Diémoz, H., Egli, L., Forestier, J.-B., Fountoulakis, I., Garane, K., Garcia, R. D., Gröbner, J., Hassinen, S., Heikkilä, A., Henderson, S., Hülsen, G., Johnsen, B., Kalakoski, N., Karanikolas, A., Karppinen, T., Lamy, K., León-Luis, S. F., Lindfors, A. V., Metzger, J.-M., Minvielle, F., Muskatel, H. B., Portafaix, T., Redondas, A., Sanchez, R., Siani, A. M., Svendby, T., and Tamminen, J.: Validation of the TROPOspheric Monitoring Instrument (TROPOMI) surface UV radiation product, Atmos. Meas. Tech., 13, 6999–7024, https://doi.org/10.5194/amt-13-6999-2020, 2020.
Lamy, K., Portafaix, T., Brogniez, C., Lakkala, K., Pitkänen, M. R. A., Arola, A., Forestier, J.-B., Amelie, V., Toihir, M. A., and Rakotoniaina, S.: UV-Indien network: ground-based measurements dedicated to the monitoring of UV radiation over the western Indian Ocean, Earth Syst. Sci. Data, 13, 4275–4301, https://doi.org/10.5194/essd-13-4275-2021, 2021.
Leng, W., Wang, T., Wang, G., Letu, H., Wang, S., Xian, Y., Yan, X., and Zhang, Z.: All-sky surface and top-of-atmosphere shortwave radiation components estimation: Surface shortwave radiation, PAR, UV radiation, and TOA albedo, Remote Sens. Environ., 298, 113830, https://doi.org/10.1016/j.rse.2023.113830, 2023.
Li, T., Xin, X., Zhang, H., Yu, S., Li, L., Ye, Z., Liu, Q., and Cai, H.: Evaluation of Six Data Products of Surface Downward Shortwave Radiation in Tibetan Plateau Region, Remote Sens., 16, 791, https://doi.org/10.3390/rs16050791, 2024.
Li, Z., Wang, P., and Cihlar, J.: A simple and efficient method for retrieving surface UV radiation dose rate from satellite, J. Geophys. Res.-Atmos., 105, 5027–5036, https://doi.org/10.1029/1999JD900124, 2000.
Li, Z., Yang, X., and Tang, H.: Evaluation of the hourly ERA5 radiation product and its relationship with aerosols over China, Atmos. Res., 294, 106941, https://doi.org/10.1016/j.atmosres.2023.106941, 2023.
Lipponen, A., Ceccherini, S., Cortesi, U., Gai, M., Keppens, A., Masini, A., Simeone, E., Tirelli, C., and Arola, A.: Advanced Ultraviolet Radiation and Ozone Retrieval for Applications – Surface Ultraviolet Radiation Products, Atmosphere, 11, 324, https://doi.org/10.3390/atmos11040324, 2020.
Liu, H., Hu, B., Wang, Y., Liu, G., Tang, L., Ji, D., Bai, Y., Bao, W., Chen, X., Chen, Y., Ding, W., Han, X., He, F., Huang, H., Huang, Z., Li, X., Li, Y., Liu, W., Lin, L., Ouyang, Z., Qin, B., Shen, W., Shen, Y., Su, H., Song, C., Sun, B., Sun, S., Wang, A., Wang, G., Wang, H., Wang, S., Wang, Y., Wei, W., Xie, P., Xie, Z., Yan, X., Zeng, F., Zhang, F., Zhang, Y., Zhang, Y., Zhao, C., Zhao, W., Zhao, X., Zhou, G., and Zhu, B.: Two ultraviolet radiation datasets that cover China, Adv. Atmos. Sci., 34, 805–815, https://doi.org/10.1007/s00376-017-6293-1, 2017.
Lu, Y.-B., Wang, L.-C., Zhou, J.-J., Niu, Z.-G., Zhang, M., and Qin, W.-M.: Assessment of the high-resolution estimations of global and diffuse solar radiation using WRF-Solar, Adv. Clim. Change Res., 14, 720–731, https://doi.org/10.1016/j.accre.2023.09.009, 2023.
Ma, B., Burke-Bevis, S., Tiefel, L., Rosen, J., Feeney, B., and Linden, K. G.: Reflection of UVC wavelengths from common materials during surface UV disinfection: Assessment of human UV exposure and ozone generation, Sci. Total Environ., 869, 161848, https://doi.org/10.1016/j.scitotenv.2023.161848, 2023.
Meerkoetter, R., Wissinger, B., and Seckmeyer, G.: Surface UV from ERS-2/GOME and NOAA/AVHRR data: A case study, Geophys. Res. Lett., 24, 1939–1942, https://doi.org/10.1029/97GL01885, 1997.
Mouhib, E., Rodrigo, P. M., Micheli, L., Fernández, E. F., and Almonacid, F.: Quantifying the rear and front long-term spectral impact on bifacial photovoltaic modules, Solar Energy, 247, 202–213, https://doi.org/10.1016/j.solener.2022.10.035, 2022.
Muñoz-Sabater, J., Dutra, E., Agustí-Panareda, A., Albergel, C., Arduini, G., Balsamo, G., Boussetta, S., Choulga, M., Harrigan, S., Hersbach, H., Martens, B., Miralles, D. G., Piles, M., Rodríguez-Fernández, N. J., Zsoter, E., Buontempo, C., and Thépaut, J.-N.: ERA5-Land: a state-of-the-art global reanalysis dataset for land applications, Earth Syst. Sci. Data, 13, 4349–4383, https://doi.org/10.5194/essd-13-4349-2021, 2021.
Narayanan, D. L., Saladi, R. N., and Fox, J. L.: Review: Ultraviolet radiation and skin cancer, Int. J. Dermatol., 49, 978–986, https://doi.org/10.1111/j.1365-4632.2010.04474.x, 2010.
Neale, R. E., Lucas, R. M., Byrne, S. N., Hollestein, L., Rhodes, L. E., Yazar, S., Young, A. R., Berwick, M., Ireland, R. A., and Olsen, C. M.: The effects of exposure to solar radiation on human health, Photochem. Photobiol. Sci., 22, 1011–1047, https://doi.org/10.1007/s43630-023-00375-8, 2023.
Novotná, M., Láska, K., Cizkova, K., Metelka, L., and Staněk, M.: Variability of solar UV radiation in the northern mountains of the Czech Republic, 2020–2021, Czech Polar Reports, 14, https://doi.org/10.5817/CPR2024-1-8, 2024.
Ou, Y., Li, Z., Chen, C., Zhang, Y., Li, K., Shi, Z., Dong, J., Xu, H., Peng, Z., Xie, Y., and Luo, J.: Evaluation of MERRA-2 Aerosol Optical and Component Properties over China Using SONET and PARASOL/GRASP Data, Remote Sens., 14, 821, https://doi.org/10.3390/rs14040821, 2022.
Parisi, A. V., Igoe, D., Downs, N. J., Turner, J., Amar, A., and Jebar, M. A.: Satellite Monitoring of Environmental Solar Ultraviolet A (UVA) Exposure and Irradiance: A Review of OMI and GOME-2, Remote Sens., 13, 752, https://doi.org/10.3390/rs13040752, 2021.
Pei, C. and He, T.: UV Radiation Estimation in the United States Using Modis Data, in: IGARSS 2019 – 2019 IEEE International Geoscience and Remote Sensing Symposium, 1880–1883, https://doi.org/10.1109/IGARSS.2019.8900659, 2019.
Pelland, S. and Gueymard, C. A.: Validation of Photovoltaic Spectral Effects Derived From Satellite-Based Solar Irradiance Products, IEEE J. Photovolt., 12, 1361–1368, https://doi.org/10.1109/JPHOTOV.2022.3216501, 2022.
Peng, S., Du, Q., Wang, L., Lin, A., and Hu, B.: Long-term variations of ultraviolet radiation in Tibetan Plateau from observation and estimation, Int. J. Climatol., 35, 1245–1253, https://doi.org/10.1002/joc.4051, 2015.
Qi, Q., Wu, J., Gueymard, C. A., Qin, W., Wang, L., Zhou, Z., Niu, J., and Zhang, M.: Mapping of 10-km daily diffuse solar radiation across China from reanalysis data and a Machine-Learning method, Sci. Data, 11, 756, https://doi.org/10.1038/s41597-024-03609-1, 2024.
Qi, Q., Tan, Y., and Qin, W.: A 0.5 nm high-resolution (1 h, 10 km) surface solar clear-sky ultraviolet radiation dataset for China (1981–2023), Figshare [data set], https://doi.org/10.6084/m9.figshare.28234298, 2025.
Qin, J., Liu, H., Yin, X., Liu, M., Wang, J., Mao, T., Liu, M., Zhang, X., Zong, W., Lu, F., and Fu, L.: Inferring the Ionospheric State With the Far Ultraviolet Imager on the Fengyun-4C Geostationary Satellite: Retrieval Algorithm and Verification, Earth Space Sci,, 10, e2023EA003222, https://doi.org/10.1029/2023EA003222, 2023.
Qin, W., Wang, L., Wei, J., Hu, B., and Liang, X.: A novel efficient broadband model to derive daily surface solar Ultraviolet radiation (0.280–0.400 µm), Sci. Total Environ., 735, 139513, https://doi.org/10.1016/j.scitotenv.2020.139513, 2020a.
Qin, W., Wang, L., Gueymard, C. A., Bilal, M., Lin, A., Wei, J., Zhang, M., and Yang, X.: Constructing a gridded direct normal irradiance dataset in China during 1981–2014, Renew. Sustain. Energ. Rev., 131, 110004, https://doi.org/10.1016/j.rser.2020.110004, 2020b.
Roy, C. R., Gies, H. P., Lugg, D. J., Toomey, S., and Tomlinson, D. W.: The measurement of solar ultraviolet radiation, Mutation Res./Fundament. Molec. Mech. Mutagen., 422, 7–14, https://doi.org/10.1016/S0027-5107(98)00180-8, 1998.
Shine, K. P., Ptashnik, I. V., and Rädel, G.: The Water Vapour Continuum: Brief History and Recent Developments, Surv. Geophys., 33, 535–555, https://doi.org/10.1007/s10712-011-9170-y, 2012.
Su, W., Charlock, T. P., and Rose, F. G.: Deriving surface ultraviolet radiation from CERES surface and atmospheric radiation budget: Methodology, J. Geophys. Res.-Atmos., 110, https://doi.org/10.1029/2005JD005794, 2005.
Tang, W., Qin, J., Yang, K., Jiang, Y., and Pan, W.: Mapping long-term and high-resolution global gridded photosynthetically active radiation using the ISCCP H-series cloud product and reanalysis data, Earth Syst. Sci. Data, 14, 2007–2019, https://doi.org/10.5194/essd-14-2007-2022, 2022.
Thomas, P., Swaminathan, A., and Lucas, R. M.: Climate change and health with an emphasis on interactions with ultraviolet radiation: a review, Global Change Biol., 18, 2392–2405, https://doi.org/10.1111/j.1365-2486.2012.02706.x, 2012.
Tong, L., He, T., Ma, Y., and Zhang, X.: Evaluation and intercomparison of multiple satellite-derived and reanalysis downward shortwave radiation products in China, Int. J. Digit. Earth, 16, 1853–1884, https://doi.org/10.1080/17538947.2023.2212918, 2023.
Valappil, N. K. M., Mammen, P. C., de Oliveira-Júnior, J. F., Cardoso, K. R. A., and Hamza, V.: Assessment of spatiotemporal variability of ultraviolet index (UVI) over Kerala, India, using satellite remote sensing (OMI/AURA) data, Environ. Monit. Assess., 196, 106, https://doi.org/10.1007/s10661-023-12239-w, 2024.
Verdebout, J.: A method to generate surface UV radiation maps over Europe using GOME, Meteosat, and ancillary geophysical data, J. Geophys. Res.-Atmos., 105, 5049–5058, https://doi.org/10.1029/1999JD900302, 2000.
Verstraeten, W. W., Neu, J. L., Williams, J. E., Bowman, K. W., Worden, J. R., and Boersma, K. F.: Rapid increases in tropospheric ozone production and export from China, Nat. Geosci., 8, 690–695, https://doi.org/10.1038/ngeo2493, 2015.
Wang, L., Gong, W., Ma, Y., Hu, B., Wang, W., and Zhang, M.: Analysis of ultraviolet radiation in Central China from observation and estimation, Energy, 59, 764–774, https://doi.org/10.1016/j.energy.2013.07.017, 2013.
Wang, Q., Wang, Y., Xu, N., Mao, J., Sun, L., Shi, E., Hu, X., Chen, L., Yang, Z., Si, F., Liu, J., and Zhang, P.: Preflight Spectral Calibration of the Ozone Monitoring Suite-Nadir on FengYun 3F Satellite, Remote Sens., 16, 1538, https://doi.org/10.3390/rs16091538, 2024.
Wang, W., Xie, P., Yoo, S.-H., Xue, Y., Kumar, A., and Wu, X.: An assessment of the surface climate in the NCEP climate forecast system reanalysis, Clim. Dynam., 37, 1601–1620, https://doi.org/10.1007/s00382-010-0935-7, 2011.
Wang, W., Matthes, K., Tian, W., Park, W., Shangguan, M., and Ding, A.: Solar impacts on decadal variability of tropopause temperature and lower stratospheric (LS) water vapour: a mechanism through ocean–atmosphere coupling, Clim. Dynam., 52, 5585–5604, https://doi.org/10.1007/s00382-018-4464-0, 2019.
Wielicki, B. A., Barkstrom, B. R., Baum, B. A., Charlock, T. P., Green, R. N., Kratz, D. P., Lee, R. B., Minnis, P., Smith, G. L., Wong, T., Young, D. F., Cess, R. D., Coakley, J. A., Crommelynck, D. A. H., Donner, L., Kandel, R., King, M. D., Miller, A. J., Ramanathan, V., Randall, D. A., Stowe, L. L., and Welch, R. M.: Clouds and the Earth's Radiant Energy System (CERES): algorithm overview, IEEE T. Geosci. Remote, 36, 1127–1141, https://doi.org/10.1109/36.701020, 1998.
Williamson, C. E., Zepp, R. G., Lucas, R. M., Madronich, S., Austin, A. T., Ballaré, C. L., Norval, M., Sulzberger, B., Bais, A. F., McKenzie, R. L., Robinson, S. A., Häder, D.-P., Paul, N. D., and Bornman, J. F.: Solar ultraviolet radiation in a changing climate, Nat. Clim. Change, 4, 434–441, https://doi.org/10.1038/nclimate2225, 2014.
Wu, J., Fang, H., Qin, W., Wang, L., Song, Y., Su, X., and Zhang, Y.: Constructing High-Resolution (10 km) Daily Diffuse Solar Radiation Dataset across China during 1982–2020 through Ensemble Model, Remote Sens., 14, 3695, https://doi.org/10.3390/rs14153695, 2022a.
Wu, J., Qin, W., Wang, L., Hu, B., Song, Y., and Zhang, M.: Mapping clear-sky surface solar ultraviolet radiation in China at 1 km spatial resolution using Machine Learning technique and Google Earth Engine, Atmos. Environ., 286, 119219, https://doi.org/10.1016/j.atmosenv.2022.119219, 2022b.
Wu, J., Niu, J., Qi, Q., Gueymard, C. A., Wang, L., Qin, W., and Zhou, Z.: Reconstructing 10-km-resolution direct normal irradiance dataset through a hybrid algorithm, Renew. Sustain. Energ. Rev., 204, 114805, https://doi.org/10.1016/j.rser.2024.114805, 2024.
Wu, Y., Zhong, Y., Liu, S., Xu, G., Xiao, C., Wu, X., Xie, B., and Li, Z.: Hydrogeodesy Facilitates the Accurate Assessment of Extreme Drought Events, J. Earth Sci., 36, 347–350, https://doi.org/10.1007/s12583-024-0123-z, 2025.
Wu, Z., Huang, N. E., Long, S. R., and Peng, C. K.: On the trend, detrending, and variability of nonlinear and nonstationary time series, P. Natl. Acad. Sci. USA, 104, 14889–14894, https://doi.org/10.1073/pnas.0701020104, 2007.
Xia, X., Li, Z., Wang, P., Cribb, M., Chen, H., and Zhao, Y.: Analysis of relationships between ultraviolet radiation (295–385 nm) and aerosols as well as shortwave radiation in North China Plain, Ann. Geophys., 26, 2043–2052, https://doi.org/10.5194/angeo-26-2043-2008, 2008.
Xia, Y., Hu, Y., Huang, Y., Bian, J., and Zhao, C.: Stratospheric ozone loss-induced cloud effects lead to less surface ultraviolet radiation over the Siberian Arctic in spring, Environ. Res. Lett., 16, 084057, https://doi.org/10.1088/1748-9326/ac18e9, 2021.
Xue, Y. and Igari, S.: Reference Solar Spectra and Their Generation Models, J. Sci. Technol. Light., 46, 6–18, https://doi.org/10.2150/jstl.IEIJJ22000657, 2023.
Zerefos, C., Fountoulakis, I., Eleftheratos, K., and Kazantzidis, A.: Long-term variability of human health-related solar ultraviolet-B radiation doses from the 1980s to the end of the 21st century, Physiol. Rev., 103, https://doi.org/10.1152/physrev.00031.2022, 2023.
Zhang, H., Wang, J., Castro García, L., Zeng, J., Dennhardt, C., Liu, Y., and Krotkov, N. A.: Surface erythemal UV irradiance in the continental United States derived from ground-based and OMI observations: quality assessment, trend analysis and sampling issues, Atmos. Chem. Phys., 19, 2165–2181, https://doi.org/10.5194/acp-19-2165-2019, 2019.
Zhu, L., Shu, S., Wang, Z., and Bi, L.: More or less: How do inhomogeneous sea-salt aerosols affect the precipitation of landfalling tropical cyclones?, Geophys. Res. Lett., 49, e2021GL097023, https://doi.org/10.1029/2021GL097023, 2022.