the Creative Commons Attribution 4.0 License.
the Creative Commons Attribution 4.0 License.
 | 11 Feb 2025
EARice10: a 10 m resolution annual rice distribution map of East Asia for 2023
Mingyang Song
Ji Ge
Hong Zhang
Lijun Zuo
Jingling Jiang
Yinhaibin Ding
Yazhe Xie
Fan Wu
Timely and accurate high-resolution annual mapping of rice distribution is essential for food security, greenhouse gas emissions assessment, and support of sustainable development goals. East Asia (EA), a major global rice-producing region, accounts for approximately 29.3 % of the world's rice production. Therefore, to acquire the latest rice distribution of the EA, this study proposed a novel rice distribution mapping method based on the Google Earth Engine (GEE) platform, producing a 10 m resolution annual rice distribution map (EARice10) of EA for 2023. A new synthetic aperture radar (SAR)-based rice distribution mapping index (SRMI) was firstly proposed and combined with optical indices to generate representative rice samples. In addition, a stacking-based optical–SAR adaptive fusion model was designed to fully integrate the features of Sentinel-1 and Sentinel-2 data for high-precision rice mapping in EA. The accuracy of EARice10 was evaluated using more than 90 000 validation samples and achieved an overall accuracy of 90.48 %, with both the user accuracy and the producer accuracy exceeding 90 %. The reliability of the product was verified by R2 values ranging between 0.94 and 0.98 with respect to official statistics and between 0.79 and 0.98 with respect to previous rice mapping products. EARice10 is accessible at https://doi.org/10.5281/zenodo.13118409 (Song et al., 2024).
- Article
(17058 KB) - Full-text XML
- BibTeX
- EndNote


Rice is a primary global food source, occupying approximately 11.21 % of the world's agricultural land and feeding over half of the global population, according to recent Food and Agriculture Organization (FAO) data (Zhang et al., 2018; Xu et al., 2023; FAO, 2024). As the global population continues to increase, so does the demand for rice in human societies. In 2022, the total rice production in East Asia (EA) reached 227 494 000 t, which accounted for about 29.3 % of the total global rice production (Chen and Zhao, 2023; FAO, 2024). Therefore, timely and accurate mapping of rice distribution in EA is critical for realizing the United Nations Sustainable Development Goal 2 (SDG 2) (Zhang et al., 2018).
Traditional methods of rice area mapping rely heavily on manual surveys, which are often labor-intensive and time-consuming (Pan et al., 2021; Abdali et al., 2023). With the open access to data from remote sensing satellites such as MODIS, the Landsat series, and the Sentinel series, remote sensing has become an effective tool for mapping the spatial distribution of rice on a large scale (Dong and Xiao, 2016; Abdali et al., 2023; Gao et al., 2023; Zhang et al., 2023b). Currently, studies have been conducted to produce rice distribution maps in EA using various remote sensing data. For example, Xiao et al. (2005a) and Han et al. (2022) used MODIS data to create 500 m resolution rice area maps covering south China and the Asian monsoon region, respectively; Carrasco et al. (2022) created 30 m resolution rice area maps for Japan from 1985 to 2019 using phenological algorithms and Landsat data; Jo et al. (2023) used recurrent U-Net and Sentinel-1 data to map rice distribution in the Republic of Korea at 10 m resolution from 2017 to 2021; Han et al. (2021b) combined MODIS and Sentinel-1 data to release a 10 m resolution rice distribution dataset, NESEA-Rice10, covering northeast and southeast Asia; Pan et al. (2021) used Sentinel-1 data and the TWDTW algorithm to map the distribution of double-cropping rice in nine southern provinces of China; and Shen et al. (2023) used the TWDTW algorithm and Sentinel-1 and Sentinel-2 data to map the distribution of single-cropping rice across 21 provinces in China. Existing rice distribution datasets with complete coverage of EA are mainly produced using 500 m resolution MODIS data, while 10 m resolution rice distribution datasets mapped using Sentinel-1 and Sentinel-2 data cover only part of EA and still do not fully cover the whole region.
The Google Earth Engine (GEE) cloud platform integrates remote sensing images with varying temporal and spatial resolutions and provides professional image processing and classification algorithms, which has become the main platform for national- and subcontinental-scale rice area mapping (Gorelick et al., 2017; Yu et al., 2023). Approaches to map rice area on the GEE platform can be summarized as phenology-based and machine-learning-based approaches (Dong et al., 2016; Ni et al., 2021). Phenology-based methods are relatively easy to understand and to practice; they usually determine rice-planting areas with specific spectral bands or vegetation indices that are sensitive to the water–soil–vegetation characteristics of rice paddies during specific phenological stages (Xiao et al., 2005b, 2006; Han et al., 2021b; Zhan et al., 2021; Carrasco et al., 2022; Gao et al., 2023; Xu et al., 2023). Machine-learning-based approaches depend less on the rice phenological stages by exploring the relationship between specific bands or indices and the label information, and to achieve high rice recognition accuracies, a large number of training data is demanded to train the supervised model, through the use of random forest (RF) (He et al., 2021; You et al., 2021) and support vector machine (SVM) (Ni et al., 2021; Huang et al., 2023) methods, for example.
The robustness of machine learning models relies on extensive high-quality training samples. Obtaining samples through manual labeling is often costly and time-consuming, especially in large-scale land cover mapping tasks. Some studies proposed to generate sample sets with existing public datasets to support the fine classification of crops (Song et al., 2017; Hao et al., 2020; Xu et al., 2020; Johnson and Mueller, 2021; Wen et al., 2022; Yang et al., 2023; Pandžić et al., 2024), such as the United States Department of Agriculture's (USDA) Cropland Data Layer (CDL) (Johnson and Mueller, 2010) and the Agriculture and Agri-Food Canada (AAFC) Crop Inventory (CI) dataset (Fisette et al., 2013). However, the limited availability of moderate- to high-resolution (10–250 m) rice distribution maps in EA does not allow the use of historical data to generate reliable training samples for the entire region (Lin et al., 2022; Zhi et al., 2022; Sun et al., 2024). Some efforts have been made to generate training samples automatically using current-season remote sensing data. Zhang et al. (2023a) generated training sample sets using optical remote sensing indices during multiple specific phenological stages of rice, while Gao et al. (2023) combined synthetic aperture radar (SAR) data and object-oriented methods to generate training samples. However, when mapping rice distribution in EA, the vast differences in climate conditions and landscape complexity across different areas make it insufficient to rely on a single data source to obtain high-quality training datasets for various regions. Therefore, a new sample generation strategy is urgently needed to fully utilize both optical and SAR data.
Currently, studies have been conducted to combine optical and SAR data for rice distribution mapping and demonstrated that the classification accuracy of the combined data sources is superior to that of a single data source (Chen et al., 2020; Xiao et al., 2021; Gao et al., 2023; Wang et al., 2024). However, existing studies have mainly used SAR features as complementary features to optical data, and optical and SAR are fed into the same model (Chen et al., 2020; He et al., 2021), which does not take into account the respective characteristics of SAR and optical data. Therefore, it is necessary to design a new rice classification strategy that can uncover the intrinsic features of optical and SAR data independently and effectively integrate their advantages to obtain better classification results.
To address these challenges, this study designs a high-precision rice distribution mapping framework applicable to different regions in EA. The framework takes the advantages of both the phenology-based and machine-learning-based approaches: (1) a novel SAR-based rice mapping index (SRMI) is proposed and combined with optical indices to generate representative training samples and (2) an optical–SAR adaptive fusion model that considers the impacts of cloud cover on the rice recognition is designed, which makes full use of the features of Sentinel-1 and Sentinel-2 data with a stacked model and can achieve accurate rice mapping results. Based on the proposed method, a 10 m resolution rice area map for EA in 2023 (EARice10) is produced, providing essential data for monitoring the growth and estimating the yield of rice in EA.
2.1 Study area
The EA region includes five countries: China, Japan, the Democratic People's Republic of Korea, the Republic of Korea, and Mongolia. Rice is cultivated in all these countries except Mongolia, as shown in Fig. 1a.
Japan, the Democratic People's Republic of Korea, the Republic of Korea, and China encompass diverse climatic conditions, landscape features, and agricultural practices, leading to significant regional variations in rice-planting areas and cropping systems (Luo et al., 2020; Hu et al., 2023). Based on cropping systems, the entire EA can be categorized into single-season, double-season, and mixed-season areas, where the mixed-season area includes a mixture of single-season and double-season rice (see Fig. 1b).
Single-season rice is the dominant system in the Democratic People's Republic of Korea, the Republic of Korea, and Japan due to thermal limitations, with transplanting typically occurring from May to June. As the world's largest rice producer, the situation of rice cultivation in China is more complex. There are 31 provincial-level administrative regions in China where rice can be grown (except for Qinghai Province, Hong Kong SAR, and Macao SAR). Eight of these provinces, Beijing, Tianjin, Hebei, Shanxi, Tibet, Gansu, Ningxia, and Xinjiang, have less than 100 000 ha under rice cultivation. Single-season rice is grown in northern China, while double-season rice is prevalent in southern China, with early rice transplanting from March to April and late rice transplanting from July to August (Pan et al., 2021; You et al., 2021; Shen et al., 2023).
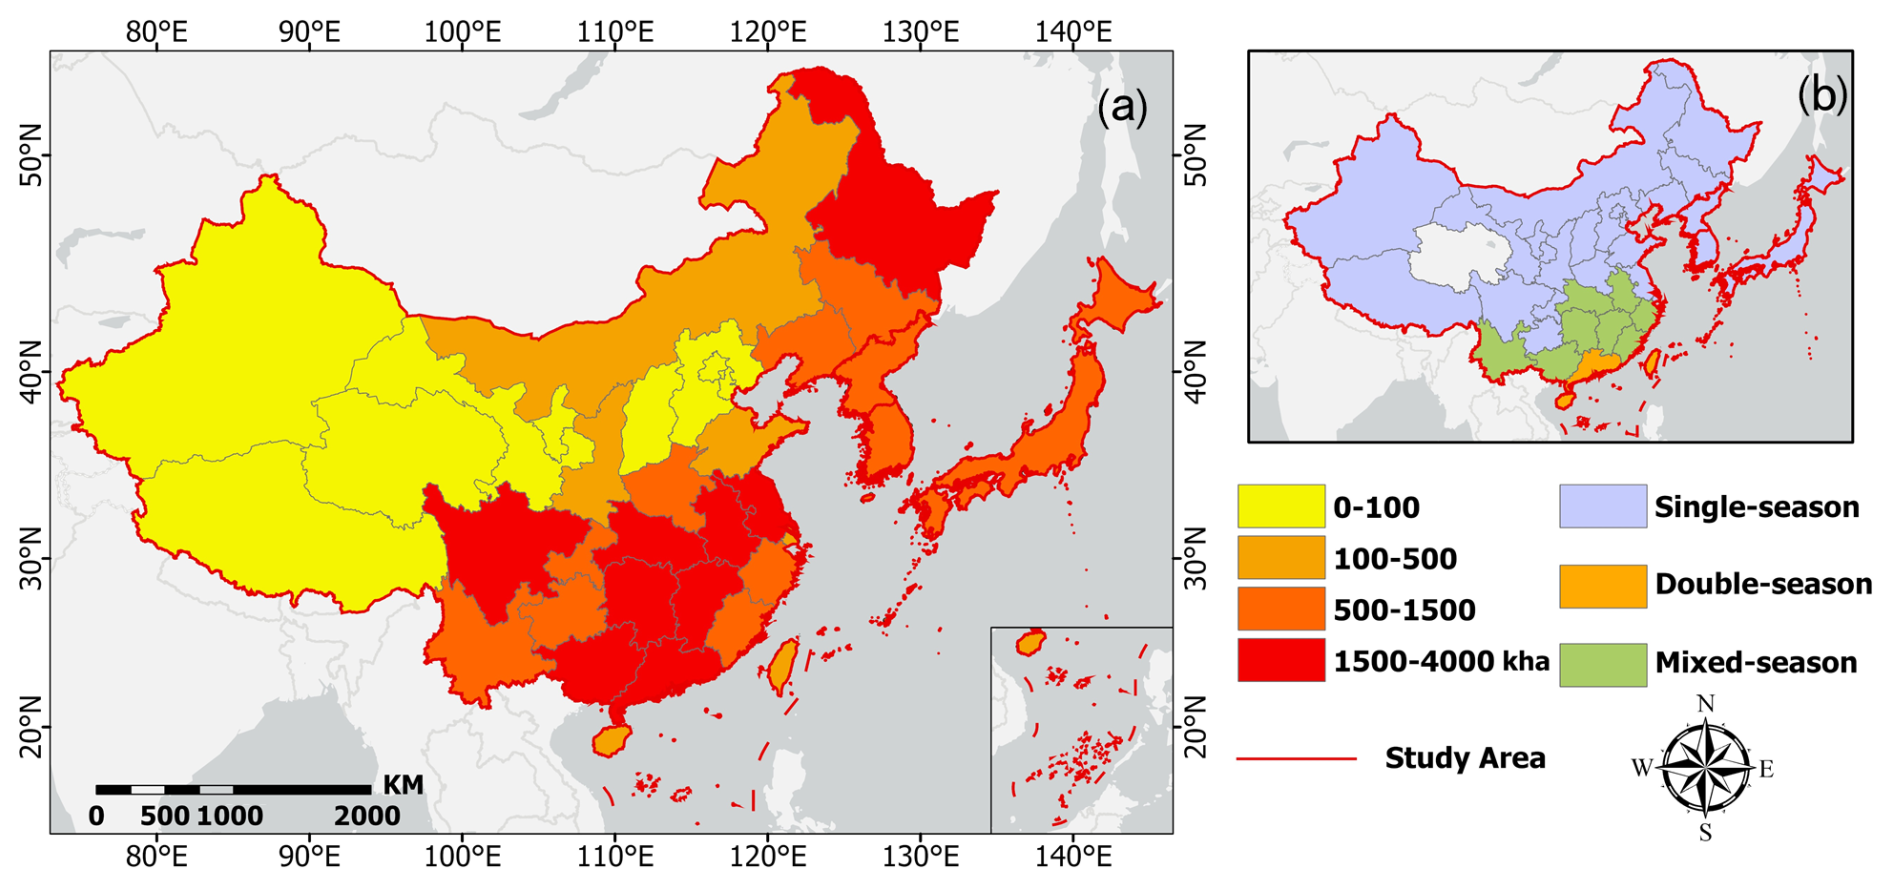
Figure 1Overview of the study area: (a) rice-planting areas and (b) rice cropping systems.
2.2 Satellite imagery
In this study, Sentinel-1 and Sentinel-2 data were used for rice mapping at 10 m resolution. In 2023, a total of more than 202 000 scenes of Sentinel-2 images and over 13 000 scenes of Sentinel-1 images covered the study area.
2.2.1 Sentinel-2 data
The Sentinel-2 (S2) mission comprises two twin satellites, S2A and S2B, providing wide-swath, high-resolution, multi-spectral imagery with a global revisit time of 5 d (Zhao et al., 2021), with the Multi-Spectral Instrument (MSI) acquiring data in 13 spectral bands, including visible and near-infrared (NIR) bands at 10 m resolution, red-edge and shortwave infrared (SWIR) bands at 20 m resolution, and atmospheric bands at 60 m resolution. The red-edge bands of S2 have proven particularly valuable for vegetation and agricultural monitoring applications (Griffiths et al., 2019; You et al., 2021; Zhang et al., 2022b). This study used S2 surface reflectance (SR) data (Level-2A), which more accurately reflects ground object information compared to S2 top-of-atmosphere (TOA) data (Level-1C), making it more suitable for rice extraction (Shelestov et al., 2017; Ni et al., 2021).
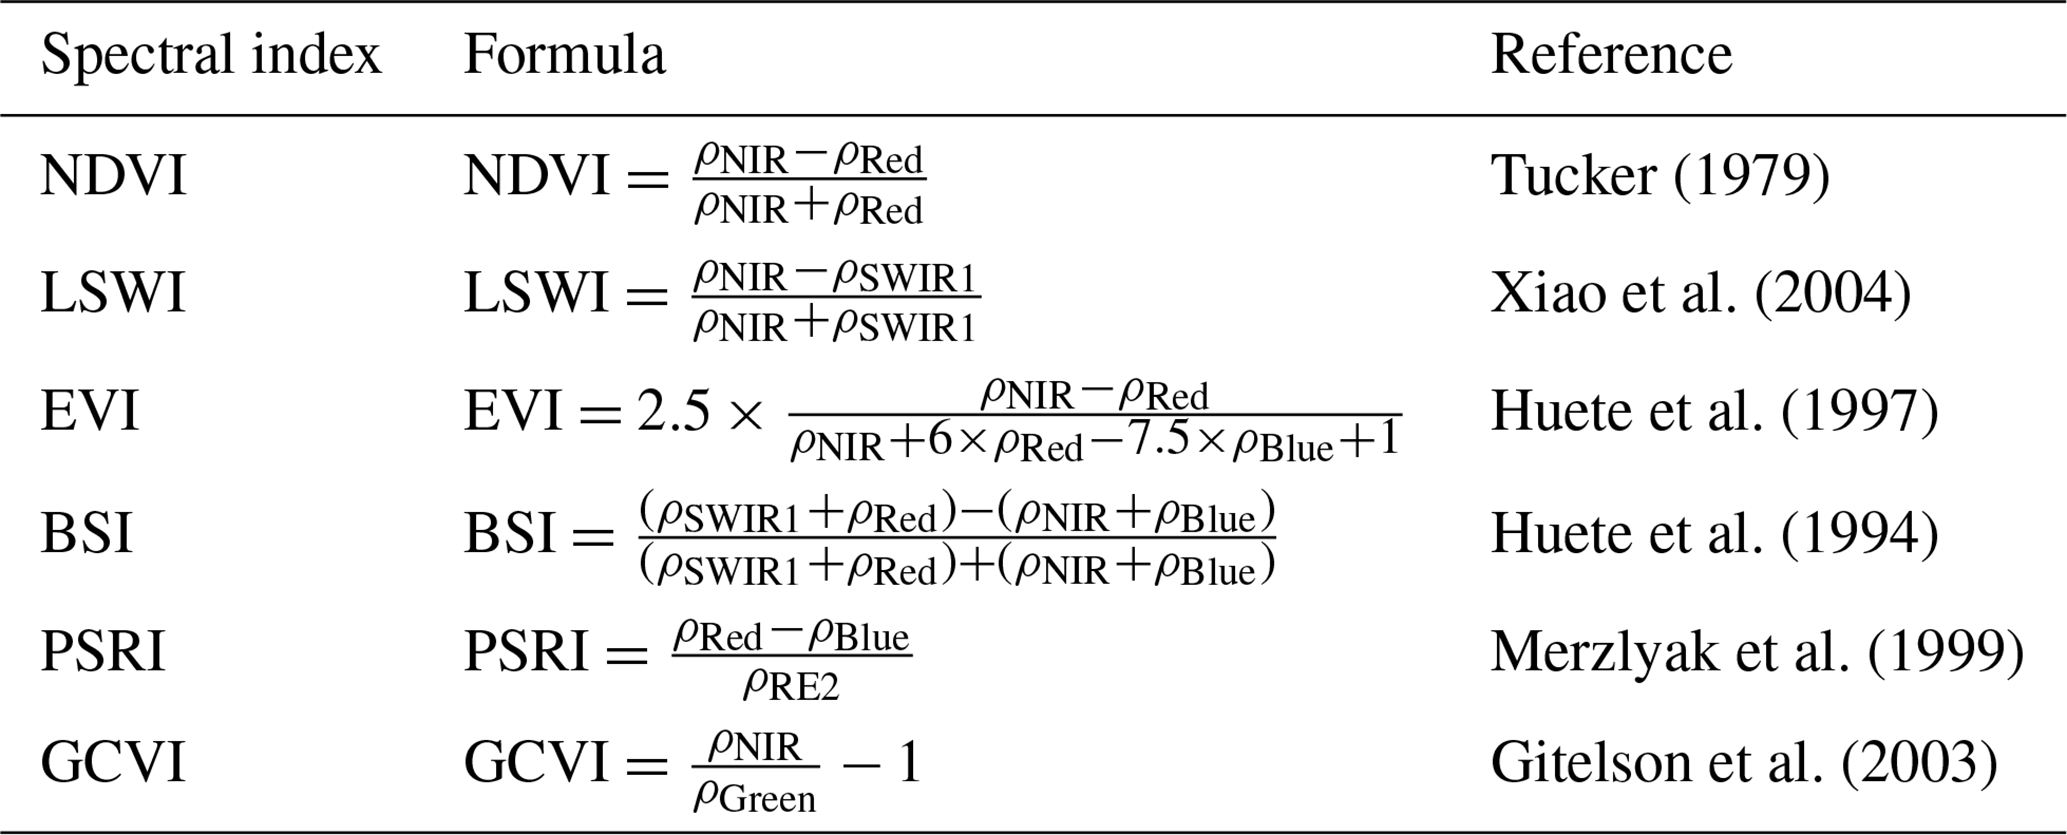
To leverage the rich spectral information of S2 data, we utilized the 10 original bands and several commonly used spectral indices as input features for the classification model. The original bands include blue, green, red, near-infrared (NIR), red-edge (RE) 1–4, and SWIR 1–2. All bands were resampled to a 10 m spatial resolution. The selected spectral indices, commonly employed for rice mapping, include the Normalized Difference Vegetation Index (NDVI), Land Surface Water Index (LSWI), Enhanced Vegetation Index (EVI), Bare Soil Index (BSI), Plant Senescence Reflectance Index (PSRI), and Green Chlorophyll Vegetation Index (GCVI) (Table 1) (Ni et al., 2021; Gao et al., 2024; Zhu et al., 2024). To maximize data availability while minimizing cloud contamination, we applied the Cloud Score+ algorithm to all S2 SR images acquired during the rice-growing season (Pasquarella et al., 2023). Subsequently, we generated semi-monthly cloud-free composites by averaging the cloud-masked pixel values within each composite period. All the pre-processing and the feature extraction were accomplished on the GEE platform.
2.2.2 Sentinel-1 data
The Sentinel-1 (S1) mission provides C-band (5.405 GHz) SAR data at 10 m spatial resolution with a 12 d revisit time, making it a valuable data source for agricultural monitoring (Wei et al., 2019; Xu et al., 2021; Tian et al., 2023; Xu et al., 2023). This study utilized S1 Interferometric Wide (IW) swath mode Ground Range Detected (GRD) data, comprising VH and VV polarization channels.
The S1 data on the GEE platform undergo basic pre-processing (e.g., thermal noise removal, radiometric calibration, terrain correction). To obtain higher-quality SAR features, we further processed the S1 data on GEE using the S1 Analysis Ready Data (ARD) framework described in Mullissa et al. (2021). This additional processing involved border noise removal, speckle filtering using the Refined Lee filter, and radiometric terrain normalization. To generate spatially and temporally consistent S1 composites, mean compositing was performed on all available data within the rice-growing season at a 12 d interval. In addition to the original VH and VV backscattering coefficients, the cross-polarization ratio (CR) defined as VH VV was calculated, which has proven valuable for crop classification (Veloso et al., 2017; d'Andrimont et al., 2021).
2.3 Auxiliary data
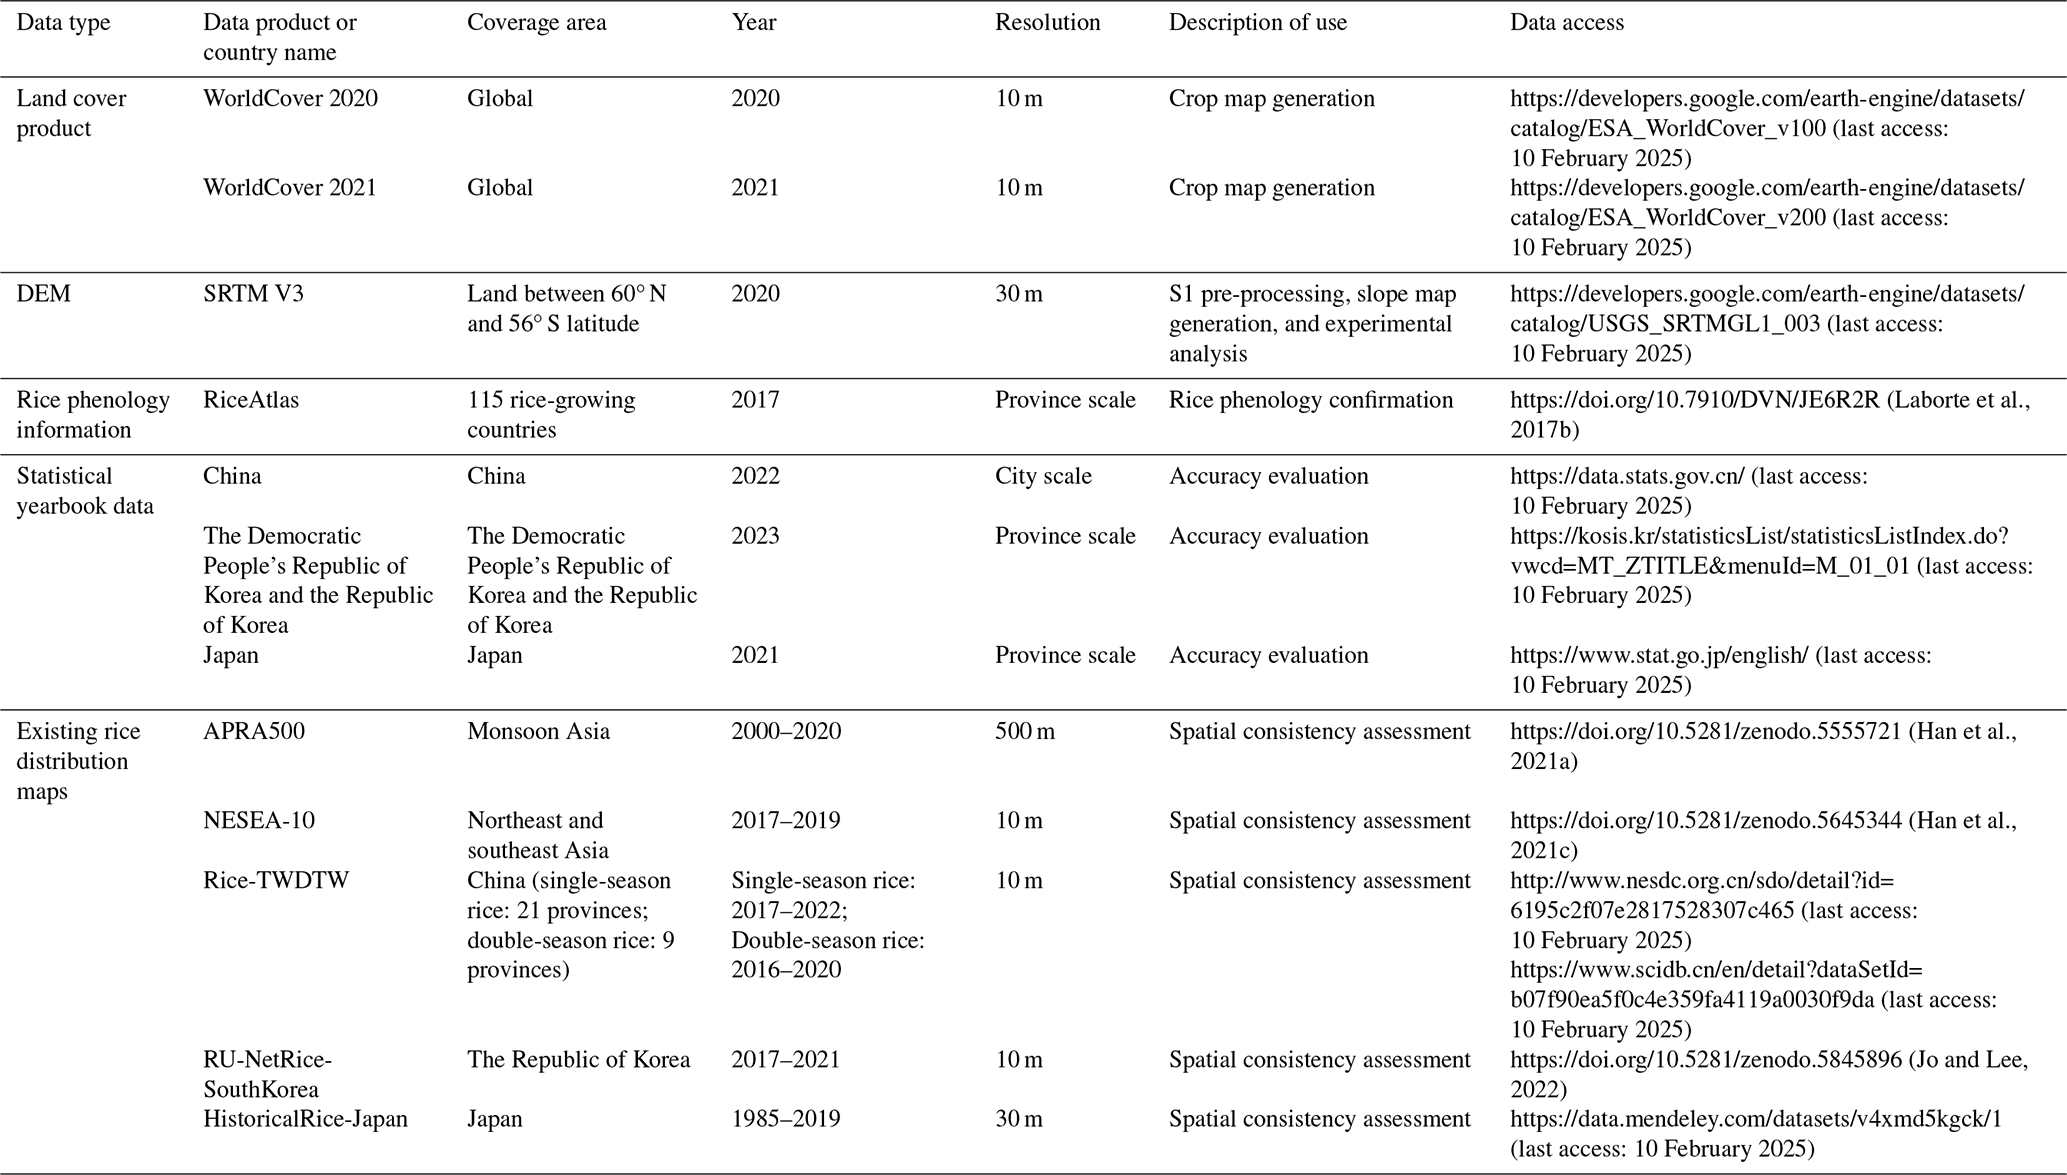
Several auxiliary datasets were incorporated, including land cover products, digital elevation models (DEMs), rice phenology data, existing rice distribution maps, statistical yearbook data, and validation samples (Table 2).
To minimize classification errors associated with non-cropland areas and account for potential inter-annual cropland changes, we applied a cropland mask generated by merging the cropland classes from the ESA WorldCover 2020 and 2021 products (Gao et al., 2023; Wang et al., 2024).
The Shuttle Radar Topography Mission (SRTM) Version 3 digital elevation model (DEM) at 1 arcsec resolution (approximately 30 m) was used for S1 data pre-processing and analysis of rice spatial distribution patterns (Farr et al., 2007).
The phenology information for this study was sourced from the RiceAtlas rice calendar and yield database (Laborte et al., 2017a). RiceAtlas records data on rice-planting and harvest dates by growing season and yield estimates for all rice-producing countries. It contains detailed information on rice phenology for all seasons in the provincial regions of EA countries. These phenological metrics include the start, peak, and end dates of sowing, transplanting, and harvesting for each rice-growing season.
To assess the accuracy of the generated rice map, an independent validation sample set containing 91 320 samples (46 908 rice and 44 412 non-rice) was constructed through field surveys and visual interpretation, with field survey samples accounting for 11.56 % of the total samples, as shown in Fig. 2. In addition, both official statistical yearbook data as well as existing rice data products were collected. Annual rice area statistics were collected from national statistical yearbooks at the city level in China and at the provincial level in Japan, the Democratic People's Republic of Korea, and the Republic of Korea. All area values were converted to hectares. Five existing publicly available datasets were acquired, including APRA500 (Han et al., 2022), NESEA-Rice10 (Han et al., 2021b), Rice-TWDTW (Pan et al., 2021; Shen et al., 2023), RU-NetRice-SouthKorea1 (Jo et al., 2023), and HistoricalRice-Japan2 (Carrasco et al., 2022).
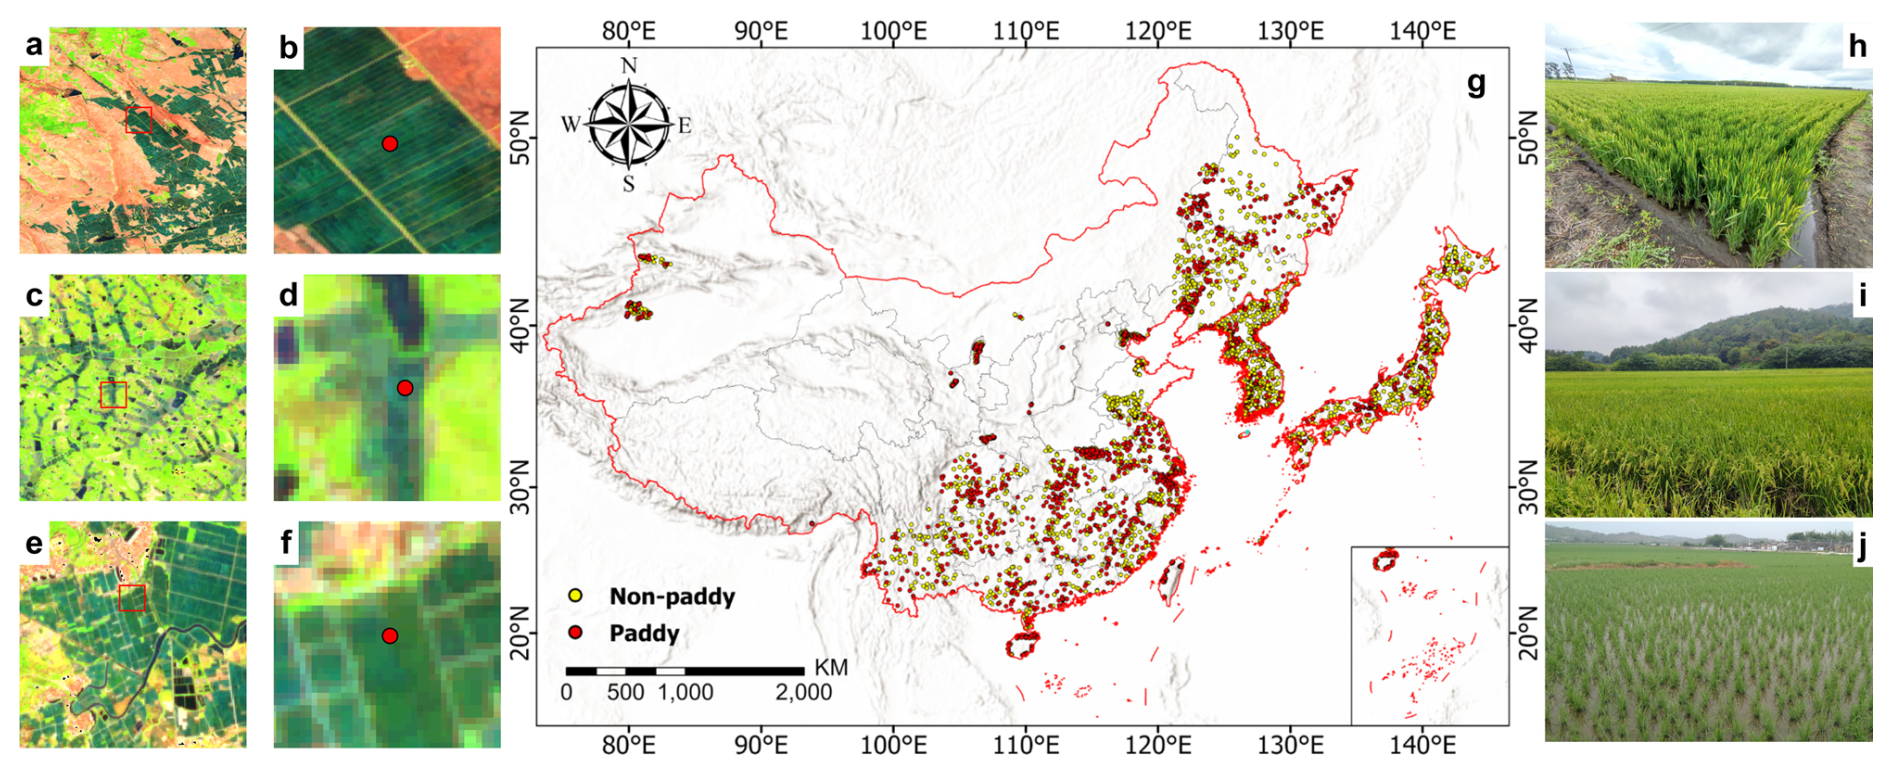
Figure 2The distribution of the validation sample set: (a, c, e) Sentinel-2 false-color images (R: SWIR1, G: NIR, B: red) and (b, d, f) enlarged local views of (a), (c), and (e), respectively. (g) The distribution of rice and non-rice validation sample set. (h, i, j) Ground truth photos of rice fields. Basemap sources for (g) are Esri, TomTom, Garmin, FAO, NOAA, USGS, © OpenStreetMap contributors, and the GIS User Community.
To produce the annual rice distribution map for EA in 2023, this study designed a high-precision overall rice mapping framework that consists of two key components: (1) an indices-based sample set generation method and (2) an optical–SAR adaptive fusion model, as illustrated in Fig. 3.
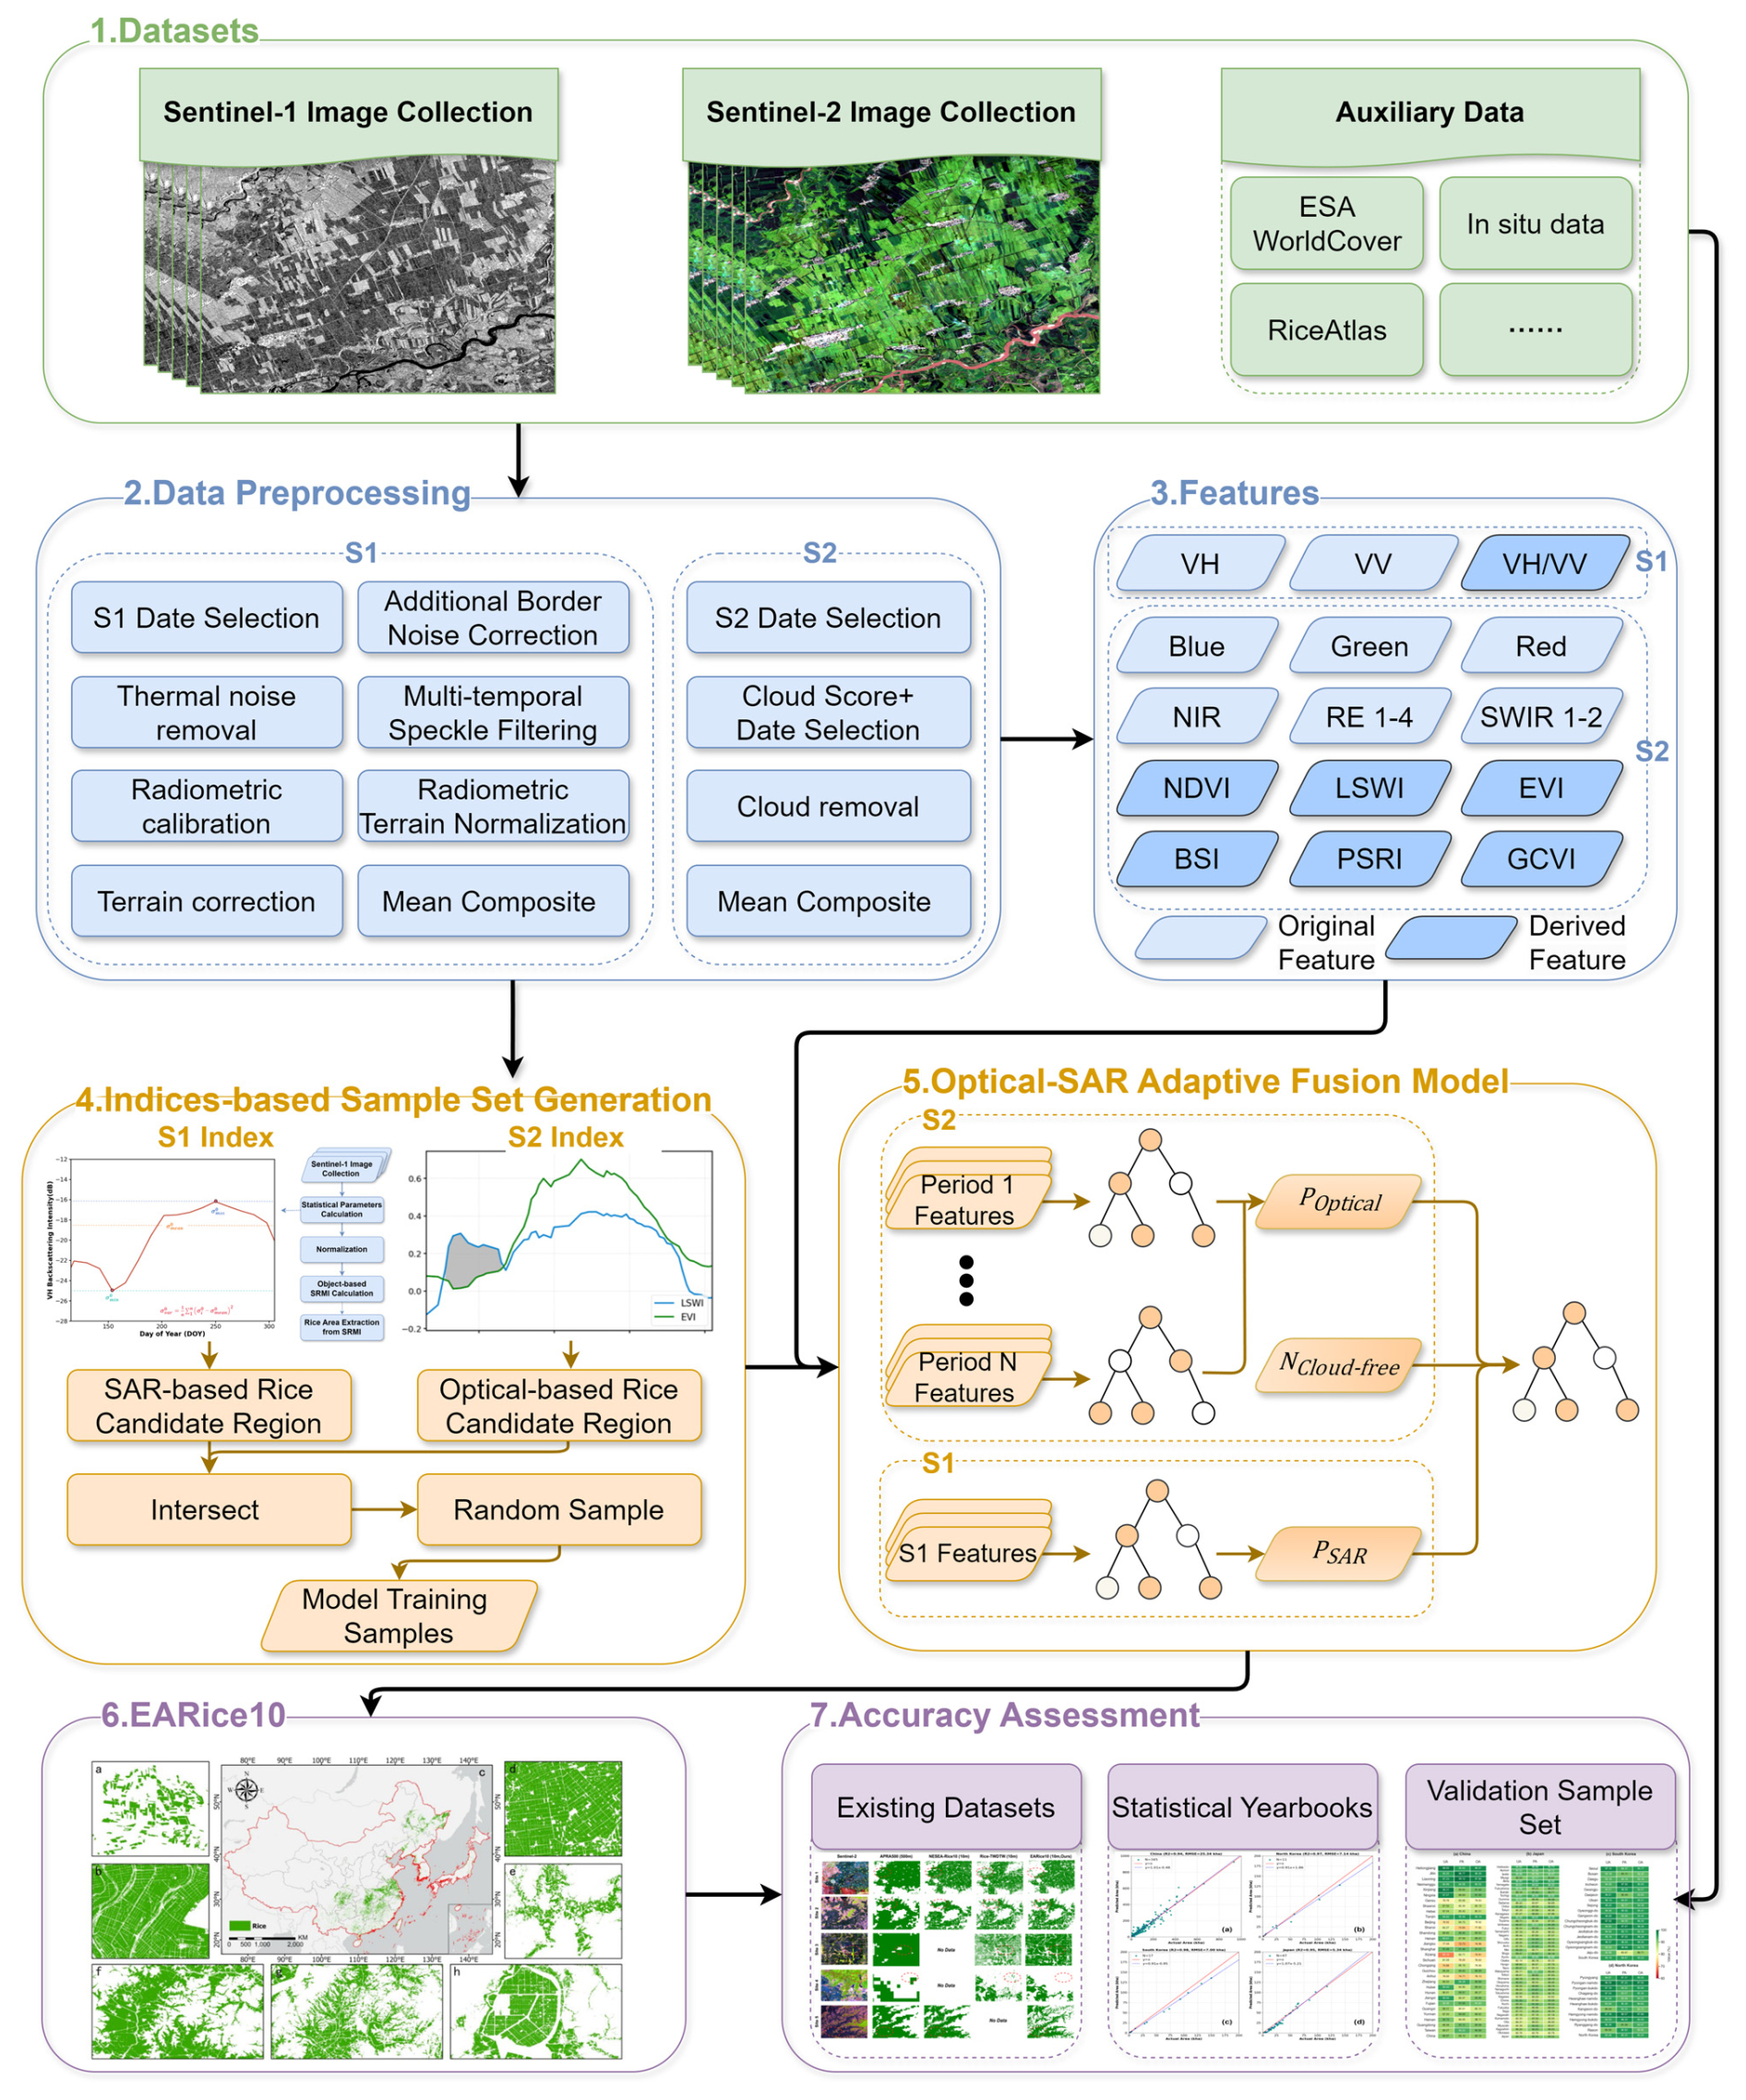
Figure 3The overall workflow of the proposed rice distribution mapping framework.
3.1 Indices-based sample set generation method
Due to the different cultivation conditions and phenological patterns in the EA, relying only on a single data source to identify rice candidate areas may result in misclassification or omission. In this study, we designed a robust sample set generation method that employs indices from both SAR and optical data to identify rice candidate areas and combines the results to refine the sample set.
3.1.1 SAR-based rice candidate area extraction
Existing studies have demonstrated that SAR VH polarization is more effective in capturing the unique characteristics of rice growth compared to VV polarization (Zhan et al., 2021; Xu et al., 2023). However, current phenology-based methods for rice mapping using SAR often rely on multiple rice phenological stages, making large-scale application challenging. Therefore, we proposed SRMI, a new rice index based on the temporal characteristics of the entire rice phenological period of the time-series S1 VH data.
As illustrated in our previous work (Xu et al., 2021; Sun et al., 2023), the minimum backscatter coefficient () identifies the flooding stage, distinguishing rice from other crops. The maximum backscatter coefficient () reduces misclassification due to water bodies. The mean backscatter coefficient () helps differentiate rice from other objects such as water bodies and buildings. The variance of the backscatter coefficient () indicates the variability of the backscatter coefficient over time, distinguishing farmland from other land cover types. Thus, four temporal statistical parameters (, , , and ) that effectively distinguish rice from other land cover types during the phenological period were calculated with the following equations.
where is the backscatter coefficient at the ith observation.
Next, the four features (, , , and ) were normalized to eliminate outlier values according to Eq. (5):
where x represents the statistical parameters, A and B are preset parameters for normalization, and F(x) is the normalized value ranging from 0 to 1. Based on experience and extensive comparative experiments, we set the thresholds of and for and ; and for ; and A=0 and B=10 for . Through Eq. (5), the normalized values of the four features (, , , ) were obtained.
Subsequently, to mitigate the impact of SAR data speckle noise, the Simple Non-Iterative Clustering (SNIC) (Achanta and Susstrunk, 2017) superpixel segmentation was applied to divide the image into different objects. The input features for SNIC included the normalized values of the four features (, , , ). In this study, the SNIC algorithm was configured with a size parameter of 15, a compactness value of 0.8, and a connectivity of 8. Consequently, the mean feature values within different objects (, , , ) were obtained.
Then, the object-based SRMI was defined as follows:
Finally, the SAR-based rice candidate area RiceSAR was established using SRMI:
where β is the SRMI threshold for extract candidate rice areas.
The range of SRMI values for common land cover types, as shown in Fig. 4, demonstrates that setting the threshold β to 0.5 can effectively distinguishes rice from non-rice fields. Figure 5 displays some examples of potential rice candidate areas identified by SRMI. Located in different countries and with various cultivation backgrounds, these patches maintained good consistencies with manual interpretations, demonstrating the effectiveness of SRMI.
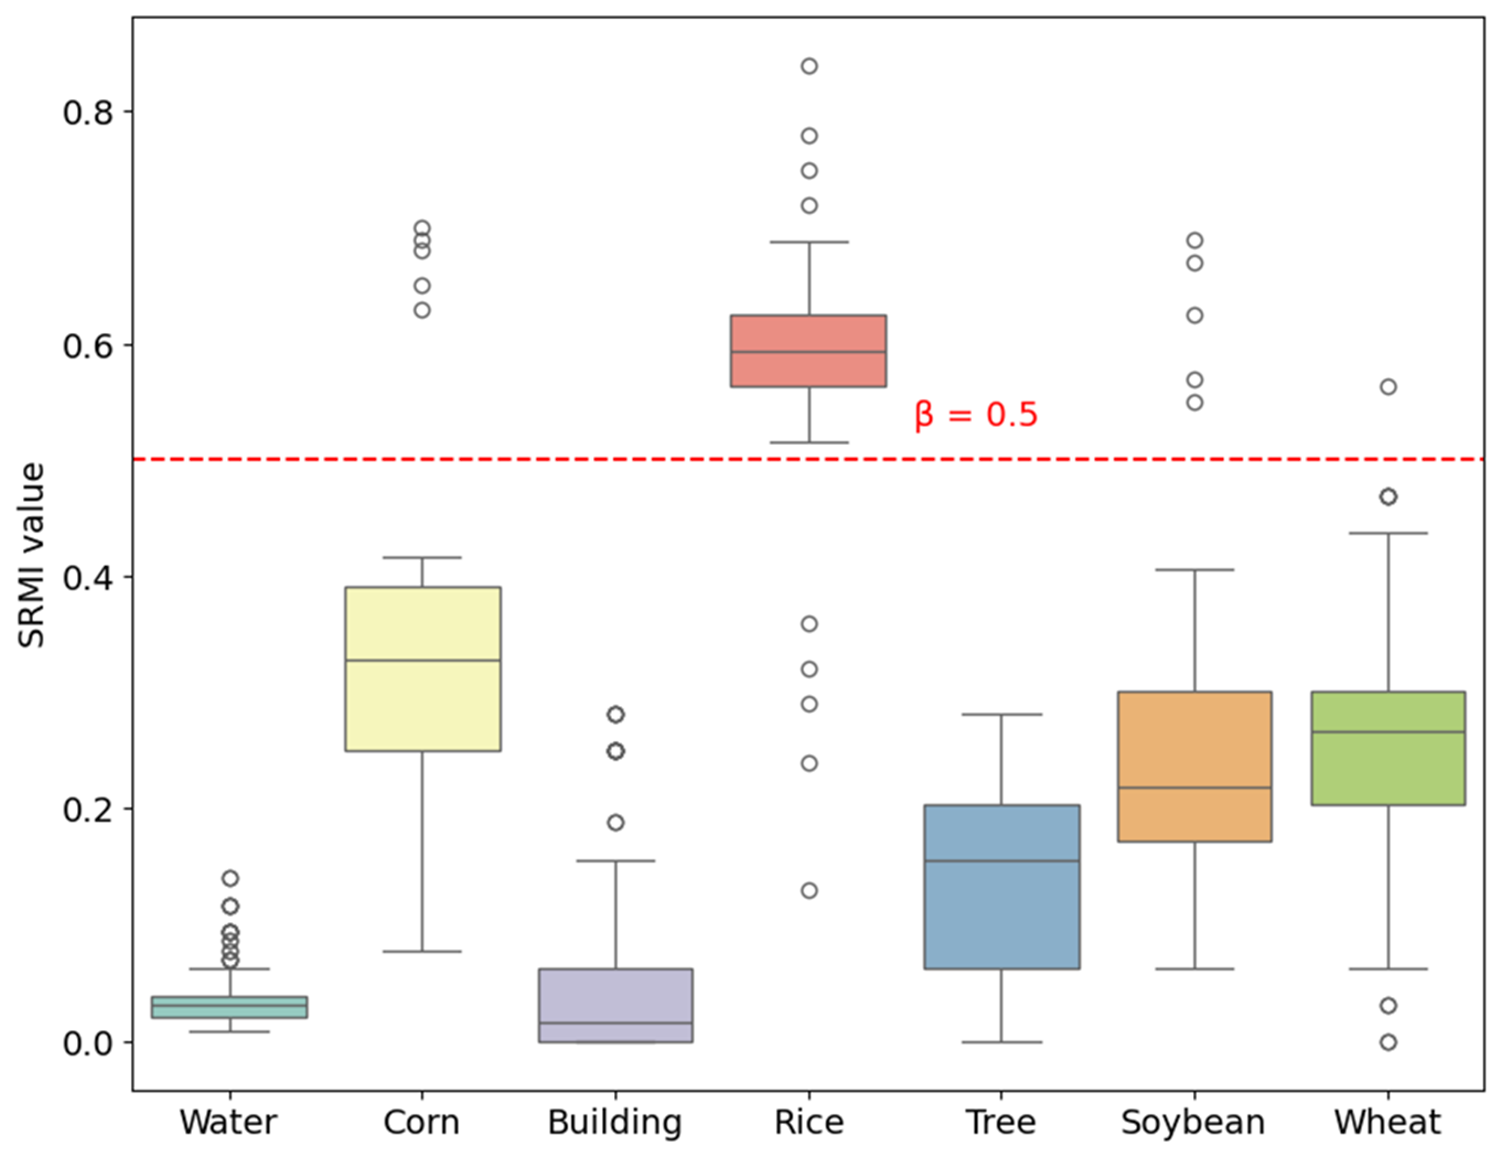
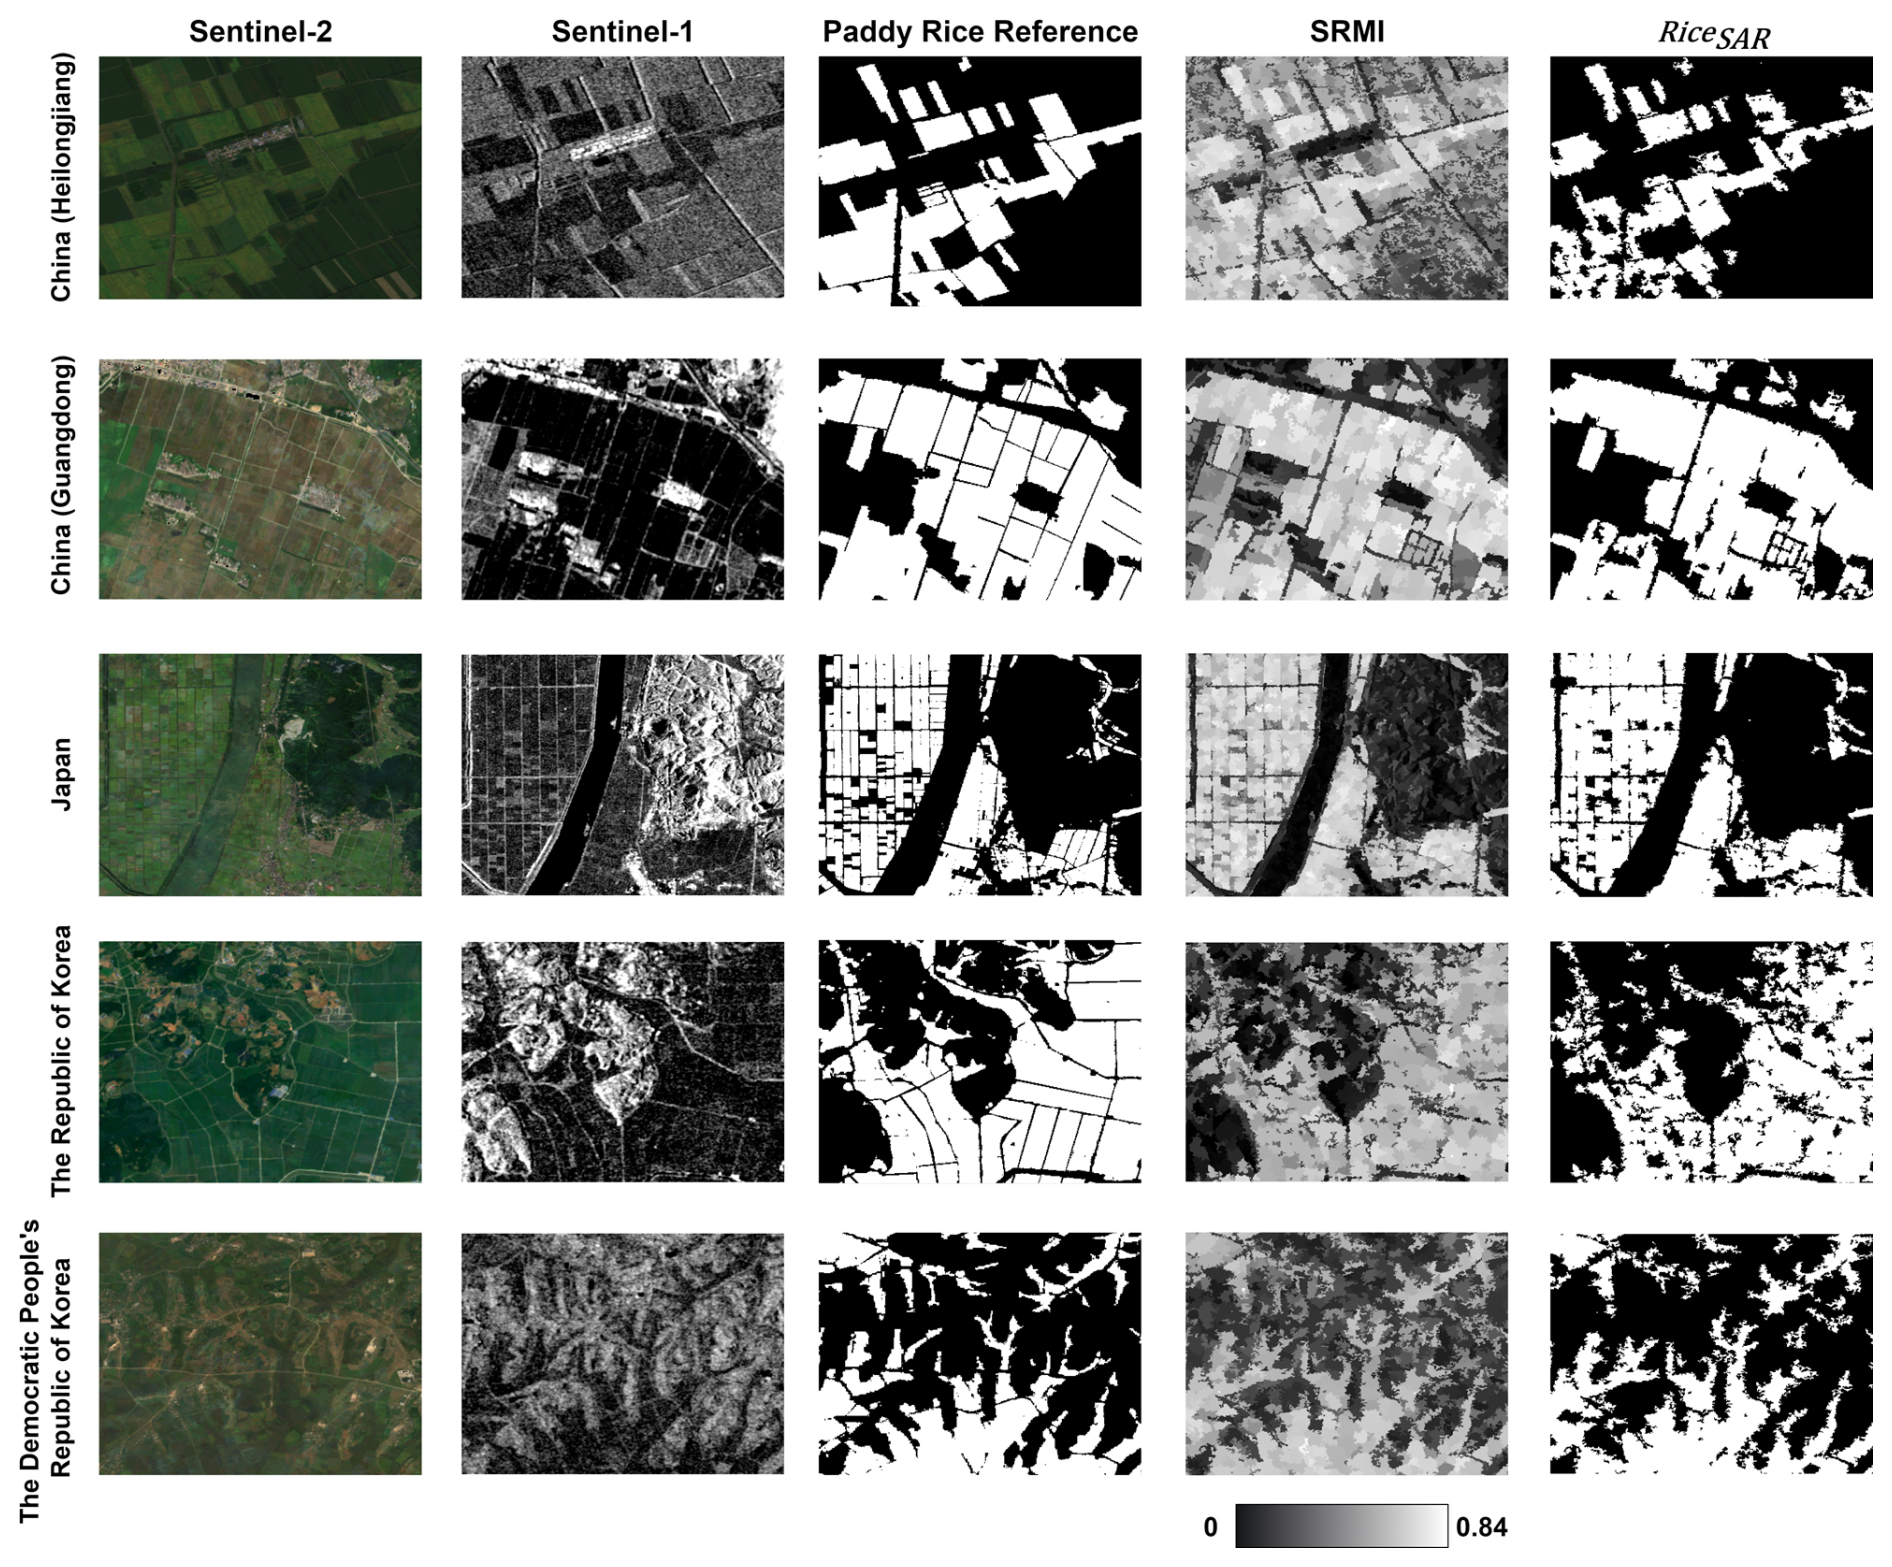
Figure 5Demonstrations of rice candidate areas in different regions based on SRMI.
3.1.2 Optical-based rice candidate area extraction
During the seeding and transplanting period of rice, the paddy field has a unique flood inundation period. The flood signal of the paddy field can be determined by the relationship between LSWI and EVI to determine the optical-based rice candidate area (RiceOptical), as shown in Fig. 6. RiceOptical was defined as
where α is the threshold set to 0.05 (Xiao et al., 2005a). The entire seeding and transplanting period for rice spans approximately 30 to 50 d (approximately 6–10 S2 scenes). Due to the variations in the rice-planting cycle and cloud interference, the number of available images might not be guaranteed for each pixel. To maximize the number of usable rice samples in cloudy regions, if a pixel satisfied Eq. (8) in at least one image, it was initially marked as a potential rice area. Unlike Sentinel-1 data, the operations for Sentinel-2 data were conducted at the pixel level.
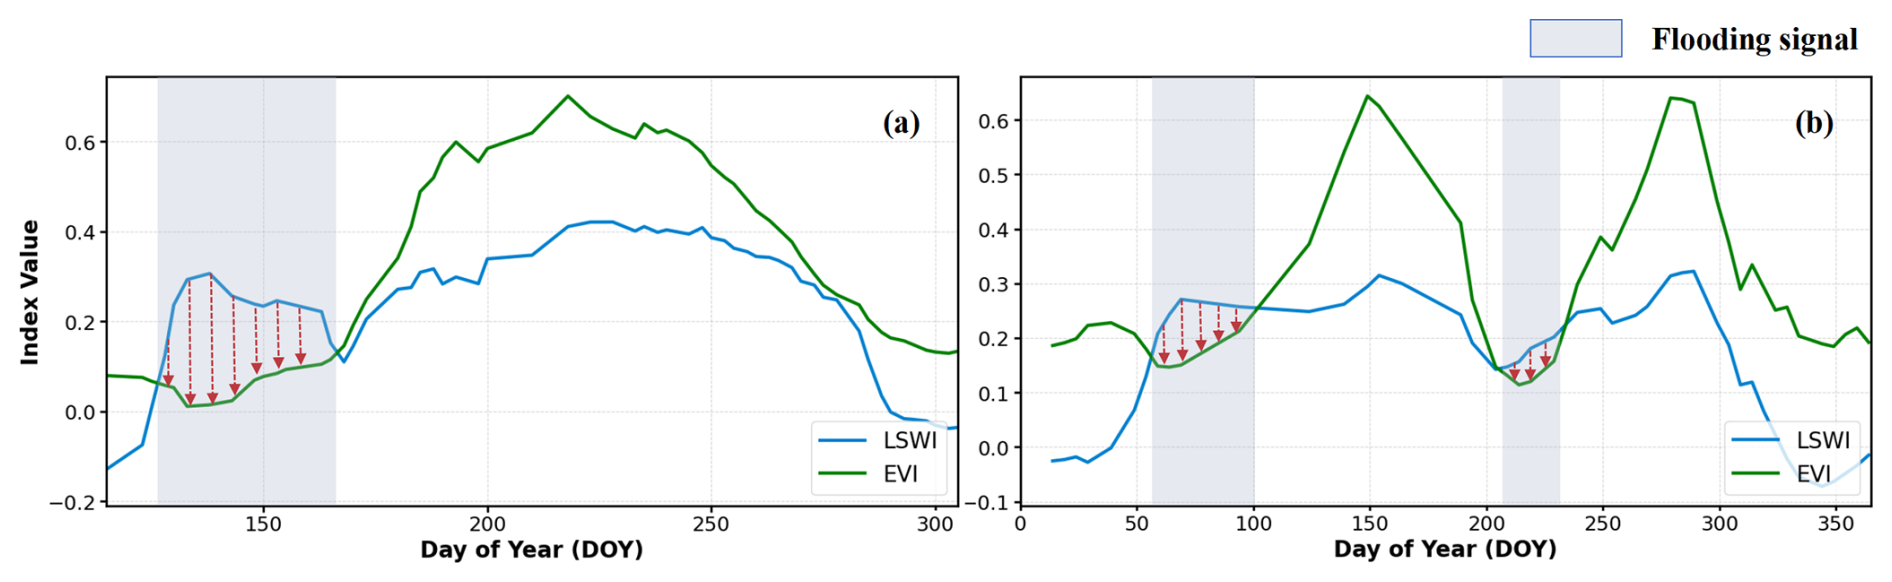
Figure 6Temporal variations of EVI and LSWI for single-season and double-season rice based on field sample points: (a) single-season rice and (b) double-season rice.
3.1.3 Sample selection based on combined candidate area
To improve the accuracy of rice samples, the RiceOptical and RiceSAR candidate areas were intersected to obtain the comprehensive rice/non-rice candidate area (RiceBoth), which was defined as
Finally, considering spatial heterogeneity, a fishnet covering the study area with 1° intervals in longitude and latitude was created with GEEMAP (Wu, 2020). Within each grid, 2000 sample points were selected from RiceBoth using stratified random sampling, maintaining a 1:1 ratio of rice to non-rice sample points.
3.2 Optical–SAR adaptive fusion model
After completing the training sample preparation in Sect. 3.1, an optical–SAR adaptive fusion model was designed by stacking multiple RF classifiers to fully leverage the advantages of SAR and optical data in the rice classification task, as shown in Fig. 7.
The RF model integrates multiple decision trees to reduce the bias and variance of individual trees, thus providing more accurate classification performance. RF is robust to noise, less prone to overfitting, and highly generalizable and transferable, which has been proven effective by previous remote sensing rice mapping research studies (He et al., 2021; Abdali et al., 2023; Zhang et al., 2023b). In contrast to the commonly utilized strategy of directly feeding original SAR and optical features into the same RF model for classification, we proposed a hierarchical integration strategy. First, a parallel structure was designed to exploit the time-series features of S1 and S2 data with independent RF models. Afterwards, another RF model was trained to adaptively fuse the classification probabilities of both data sources. In this process, the data availability of S2 was confirmed by introducing the cloud-free indicator as the input feature.
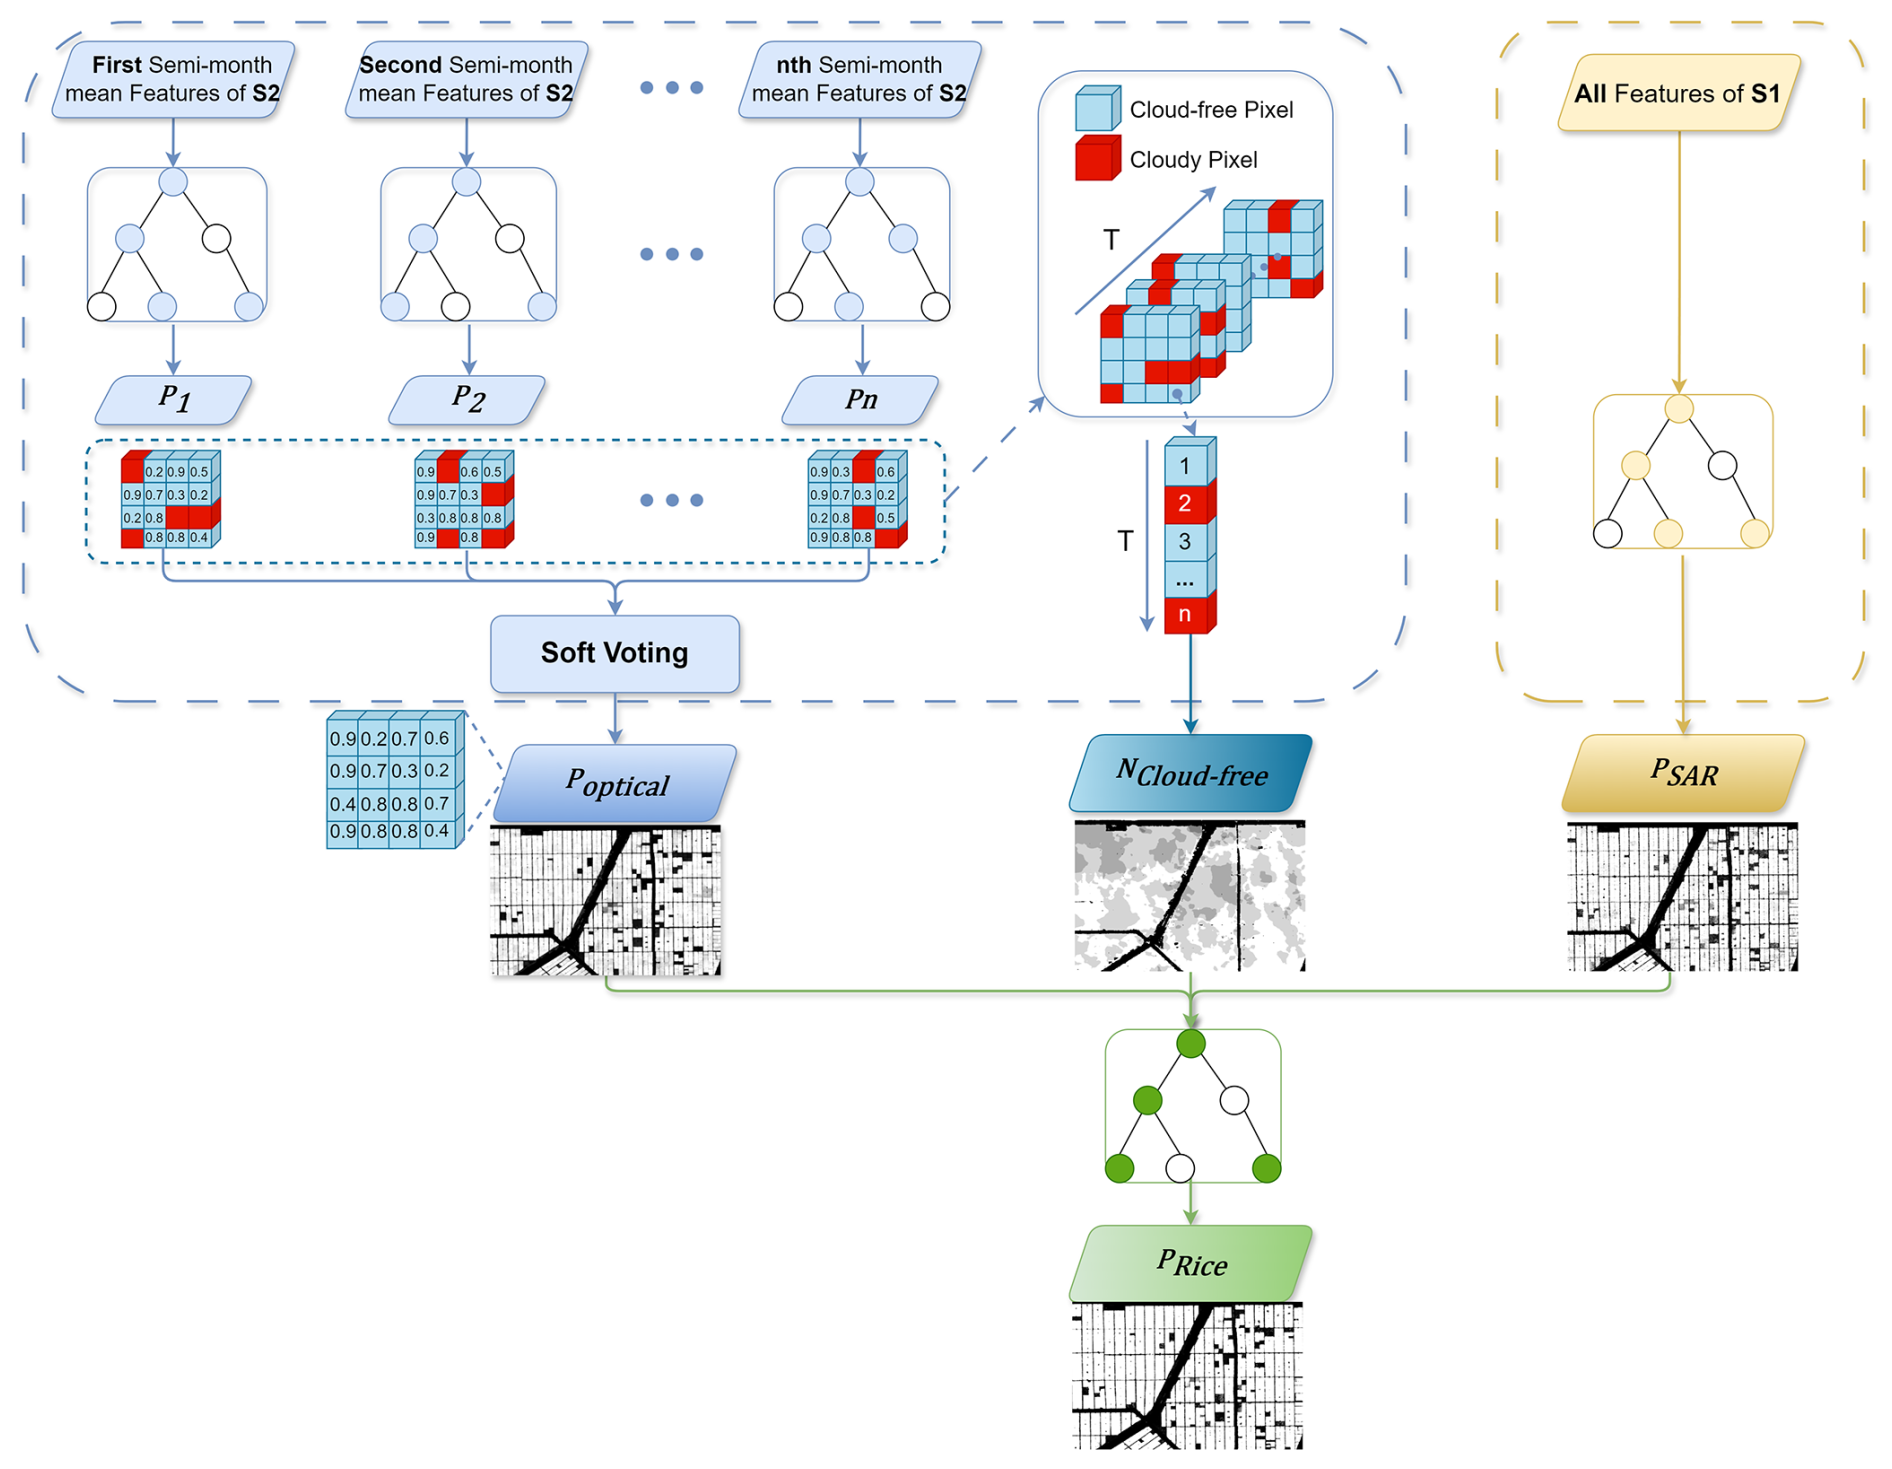
Given that S2 data have a revisit period of 5 d but are affected by clouds, a separate RF model was trained for the mean features of each semi-monthly period during the entire rice phenological period. The classification results of each model were output as probability values (Pi). The mean of all RF classification results generated the optical-based rice classification probability (POptical):
where NCloud-free represents the number of cloud-free pixels in all semi-monthly images during the rice phenological period, and N is the total number of semi-monthly images during the rice phenological period. For instance, for a 150 d rice growth cycle, N=10, NCloud-free≤N, i=1, 2, …, N. In general, the closer the NCloud-free value is to N, the more reliable the POptical result is. Conversely, the greater the distance between NCloud-free and N, the higher the uncertainty of POptical.
For S1 data, the RF model was trained with VH, VV, and CR as inputs, using the 12 d mean composite of all S1 images.
The RF classification result was represented as the SAR-based rice classification probability (PSAR).
With all the independent RF models trained by both optical and SAR data, the probabilities were further combined through another RF model, which intended to uncover the hidden relationship between the rice recognition results derived by two data sources. The cloud-free frequency was taken as the input feature as well, which could modulate the POptical with optical data availability to generate the final rice classification result (PRice).
In this study, the ntrees parameter of the RF was set to 100, and other parameters were set to default values.
3.3 Accuracy evaluation
To assess the reliability and accuracy of the EA rice distribution map, we used three metrics, overall accuracy (OA), user accuracy (UA), and producer accuracy (PA). These metrics were calculated based on the confusion matrix, using the following formulas:
where TP is the number of pixels correctly classified as rice, FP is the number of non-rice pixels misclassified as rice, TN is the number of pixels correctly classified as non-rice, and FN is the number of rice pixels misclassified as non-rice.
Additionally, we used the coefficient of determination (R2) to evaluate the correlation between the rice area map we produced and the government statistics or existing rice distribution maps. The formula for R2 is as follows:
where n is the total number of administrative units, xi represents the rice area of our rice map in the administrative unit, is the average rice area of our rice map across all administrative unit, ki is the rice area from government statistics or existing products in the administrative unit, and is the average rice area from government statistics or existing products across all administrative units.
4.1 2023 East Asia 10 m resolution rice distribution map
The 2023 10 m resolution rice distribution map for East Asia, referred to as EARice10, is illustrated in Fig. 8, along with statistical information on its distribution analyzed in conjunction with DEM and other data. The rice distribution maps of each country are shown in Figs. 9–12, respectively.
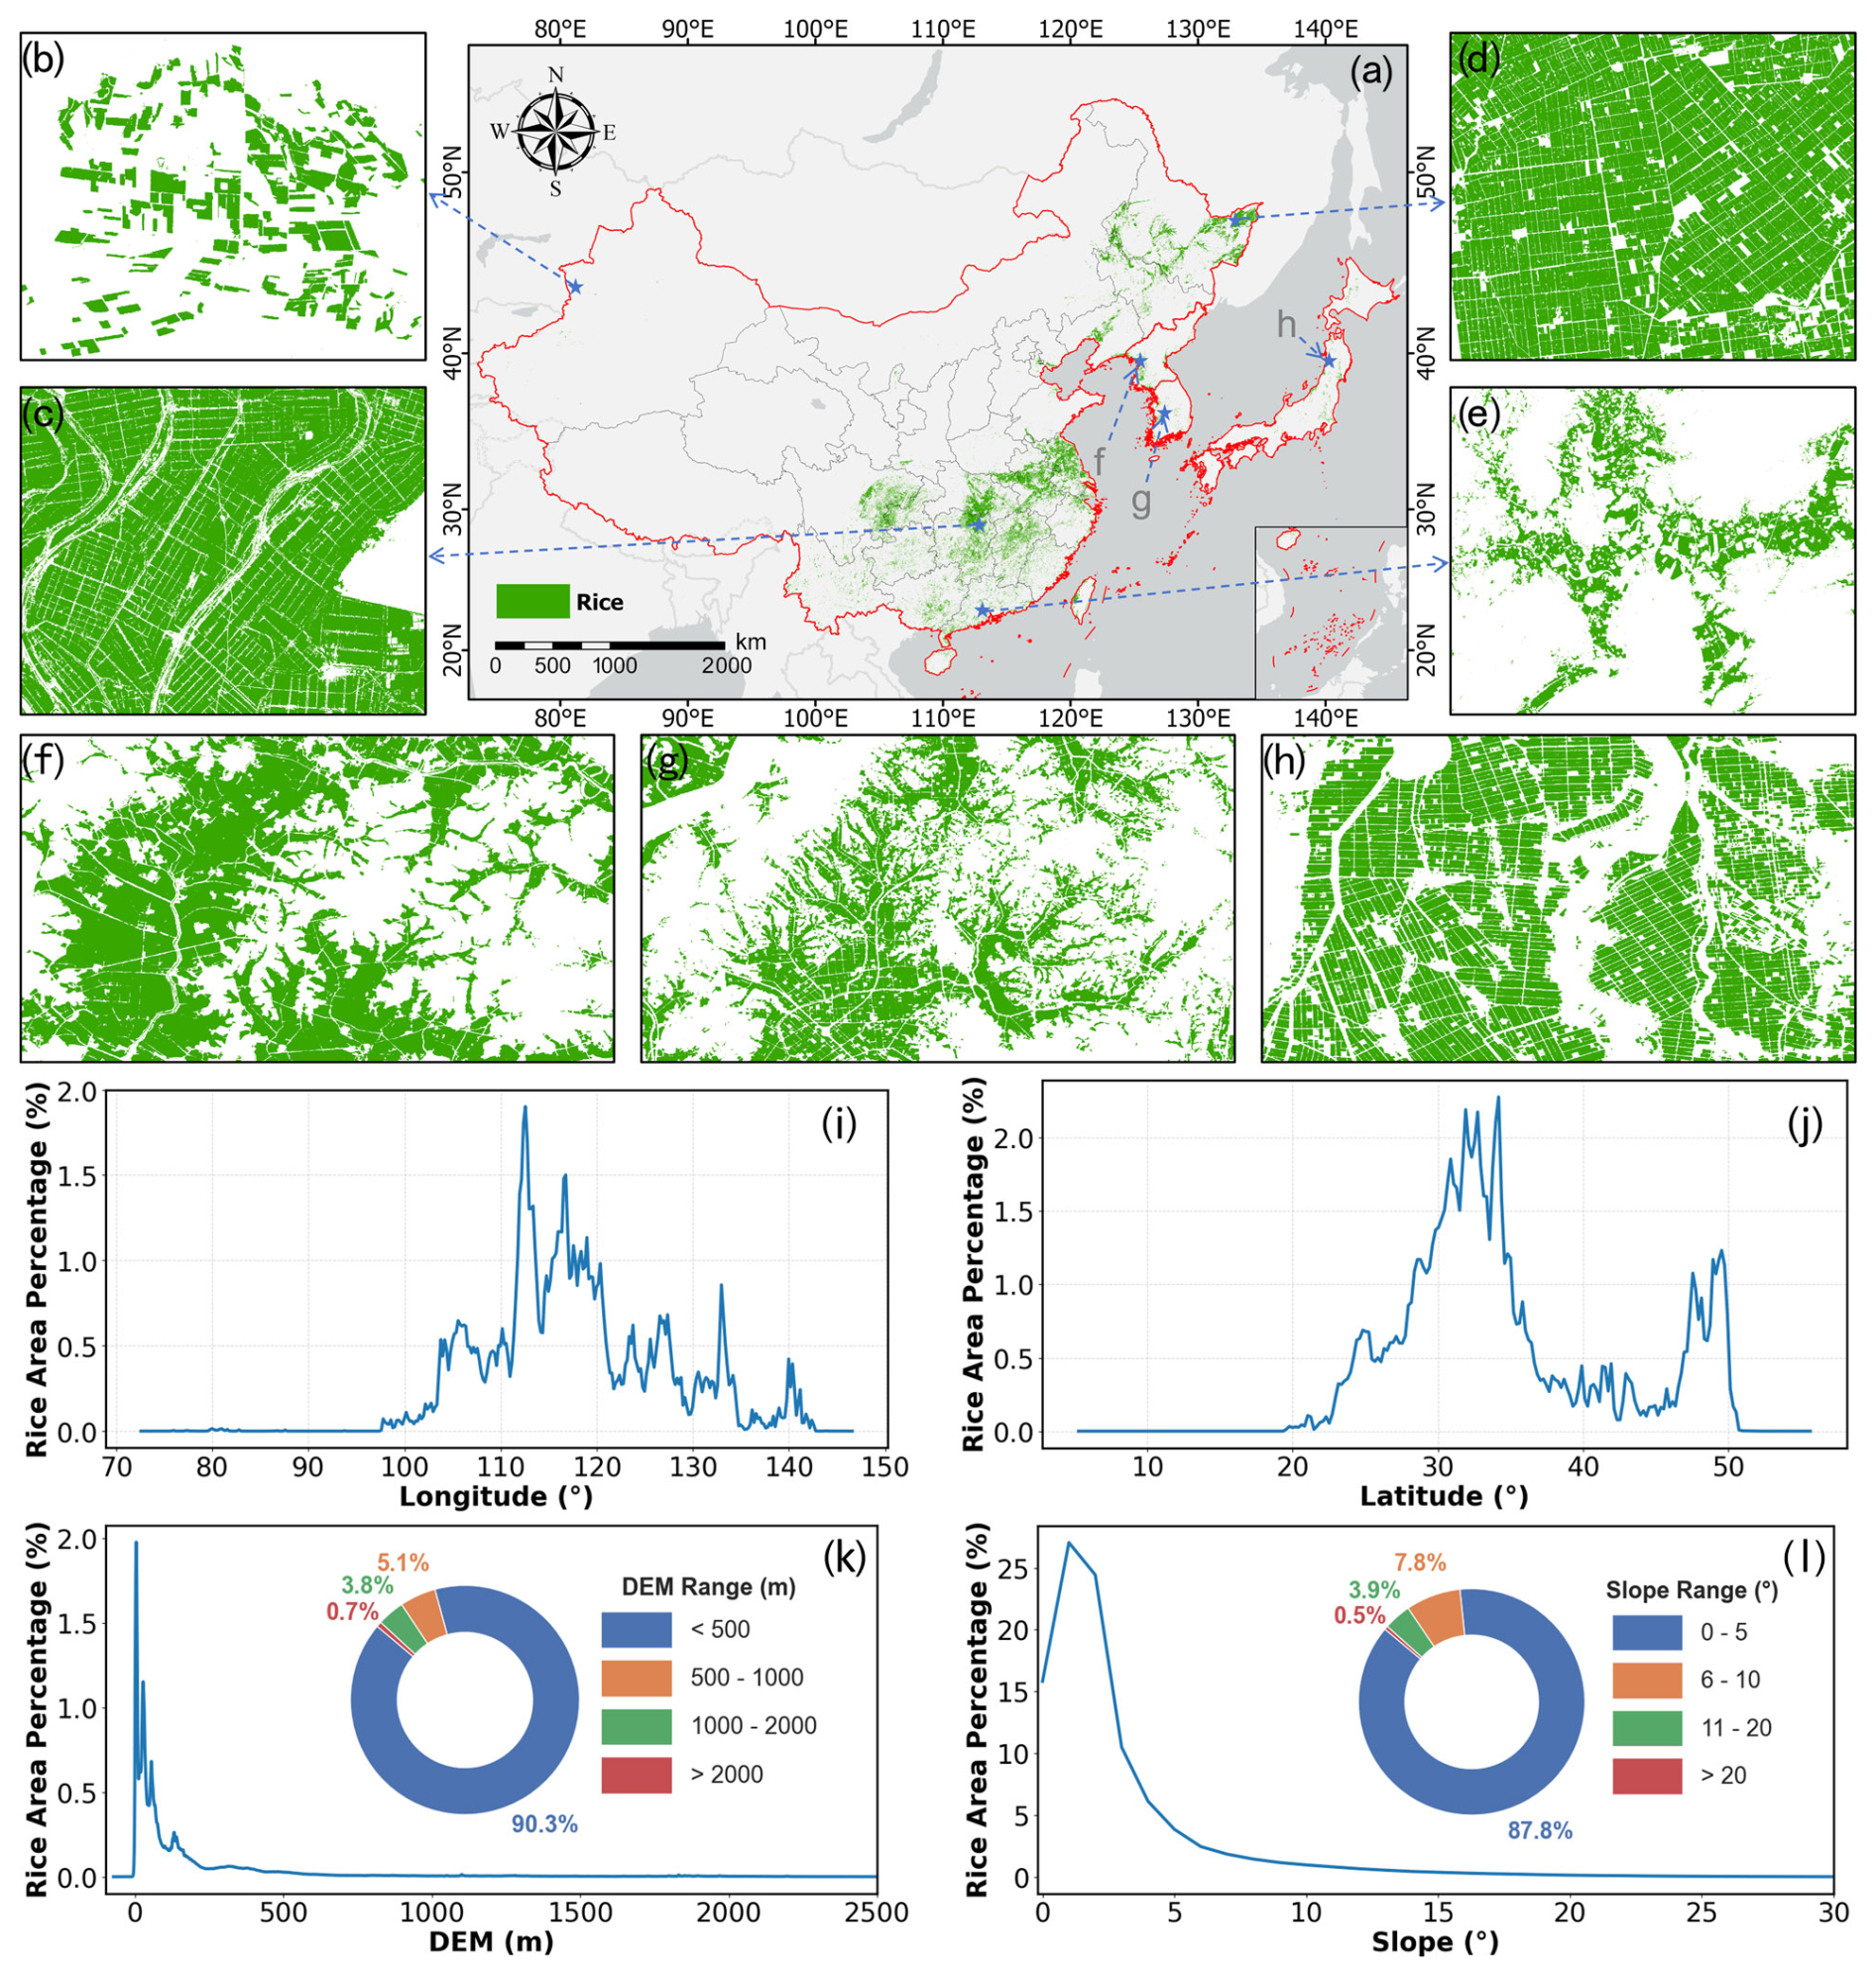
Figure 82023 East Asia 10 m resolution rice distribution map (EARice10) and statistical analysis of rice area in different geographical regions: (a) full coverage of EARice10 and (b–h) zoomed-in views of rice distribution in selected regions – (b) Xinjiang, China (provincial rice-planting area less than 100 000 ha); (c) Heilongjiang, China (single-season rice region); (d) Hunan, China (mixed-season rice region); (e) Guangdong, China (double-season rice region); (f) the Democratic People's Republic of Korea (single-season rice region); (g) the Republic of Korea (single-season rice region); and (h) Japan (single-season rice region). (i–l) Statistical analysis of rice area in different geographical regions: (i) longitude, (j) latitude, (k) DEM, and (l) slope.
As indicated by Fig. 8, rice cultivation in EA was mainly distributed between 20–50° N and 98–142° E, with the highest density of rice cultivation near 34.18° N, 112.58° E. Figure 8j showed a bimodal distribution pattern in latitude, with the peaks corresponding to central China and northeast Asia, which have hydrologic and soil conditions suitable for rice growth. Figure 8k showed that rice cultivation areas were mainly concentrated at low altitudes, with about 95.5 % of the rice cultivated in areas below 1000 m, 3.8 % cultivated between 1000 and 2000 m, and only 0.7 % of the rice cultivated in areas above 2000 m. Most of the rice in EA was grown in low-slope areas, as shown in Fig. 8l, because these areas are more suitable for irrigation and management. Specifically, about 87.8 % of it was grown in areas with slopes of less than 5°. About 12.2 % of the rice-growing areas have slopes greater than 5°, mainly in the hilly areas of southern China, where single-season rice is common (He et al., 2021).
In 2023, China's annual rice cultivation area was 24 716 000 ha. The top three provinces with largest annual rice cultivation area were Heilongjiang (14.54 %), Hunan (10.98 %), and Anhui (9.46 %). This rice distribution map aligns well with the spatial distribution patterns identified in previous studies (Xiao et al., 2005a; Dong et al., 2016; Carrasco et al., 2022; Wei et al., 2022). Furthermore, EARice10 includes provinces in China where the area under rice cultivation is less than 100 000 ha, which were not considered in other datasets (Pan et al., 2021; Shen et al., 2023).
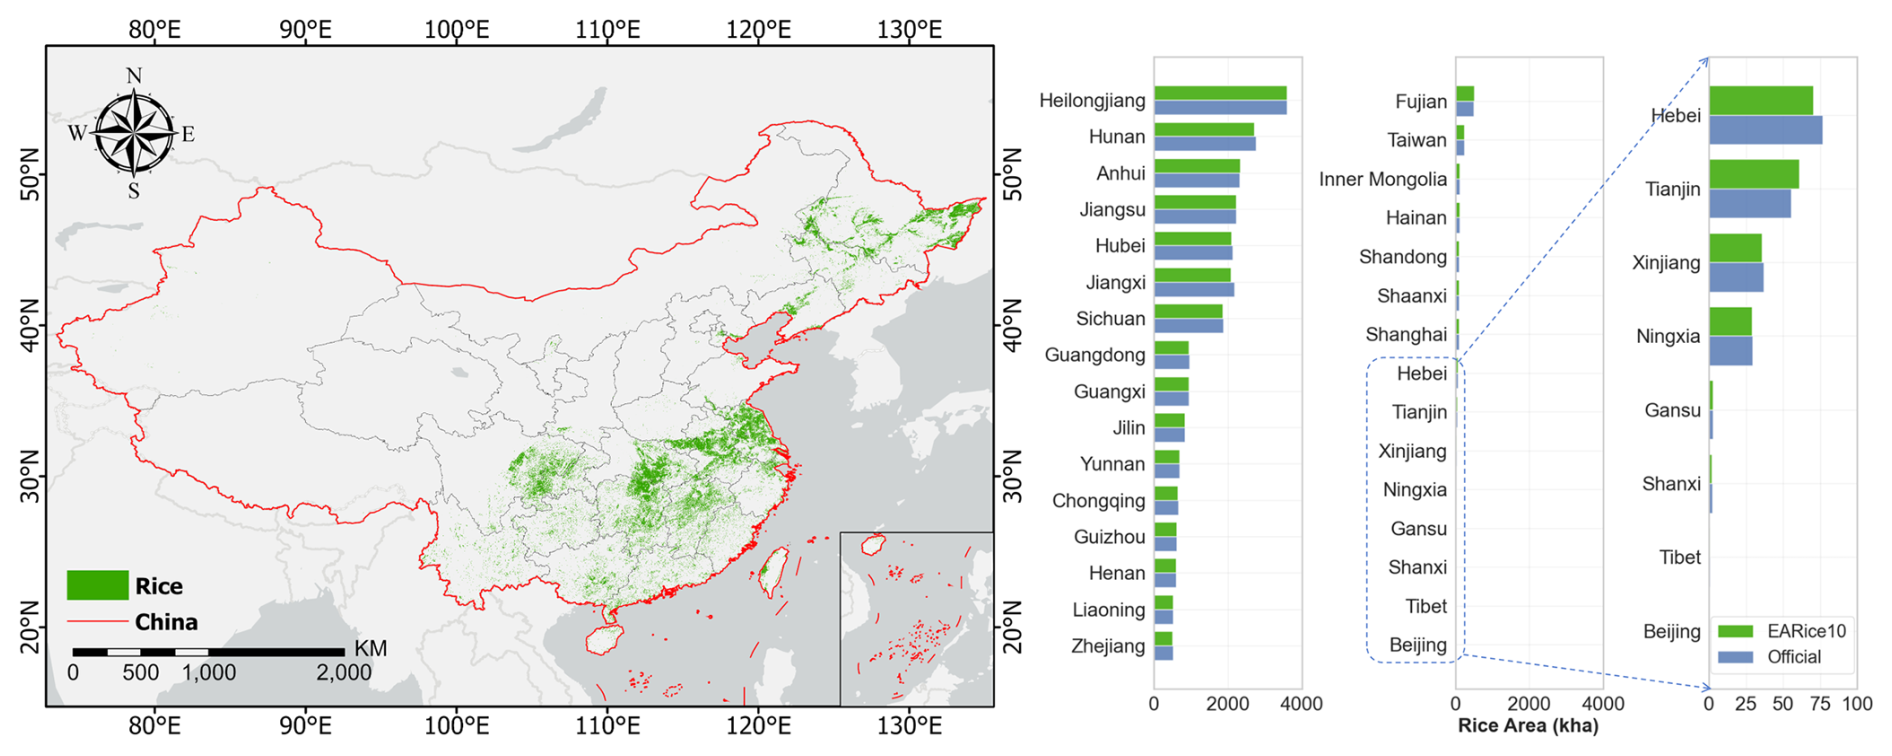
Figure 9The 10 m rice distribution map in China and provincial rice area statistics (2023).
In Japan, the annual rice cultivation area was 1 251 464 ha. Specifically, rice cultivation was primarily concentrated on coastal alluvial plains, with the most extensive areas found in western Hokkaido, the northwest and central coastal regions of Honshu, the Kantō Plain, areas surrounding Lake Biwa in central Honshu, and western Kyushu island. Significant rice cultivation regions included Tohoku (29.76 %), Chūbu (20.97 %), Kantō (16.83 %), and Hokkaido (8.08 %), and the top three prefectures for rice cultivation in 2023 were Niigata (9.17 %), Hokkaido (8.08 %), and Akita (6.48 %).
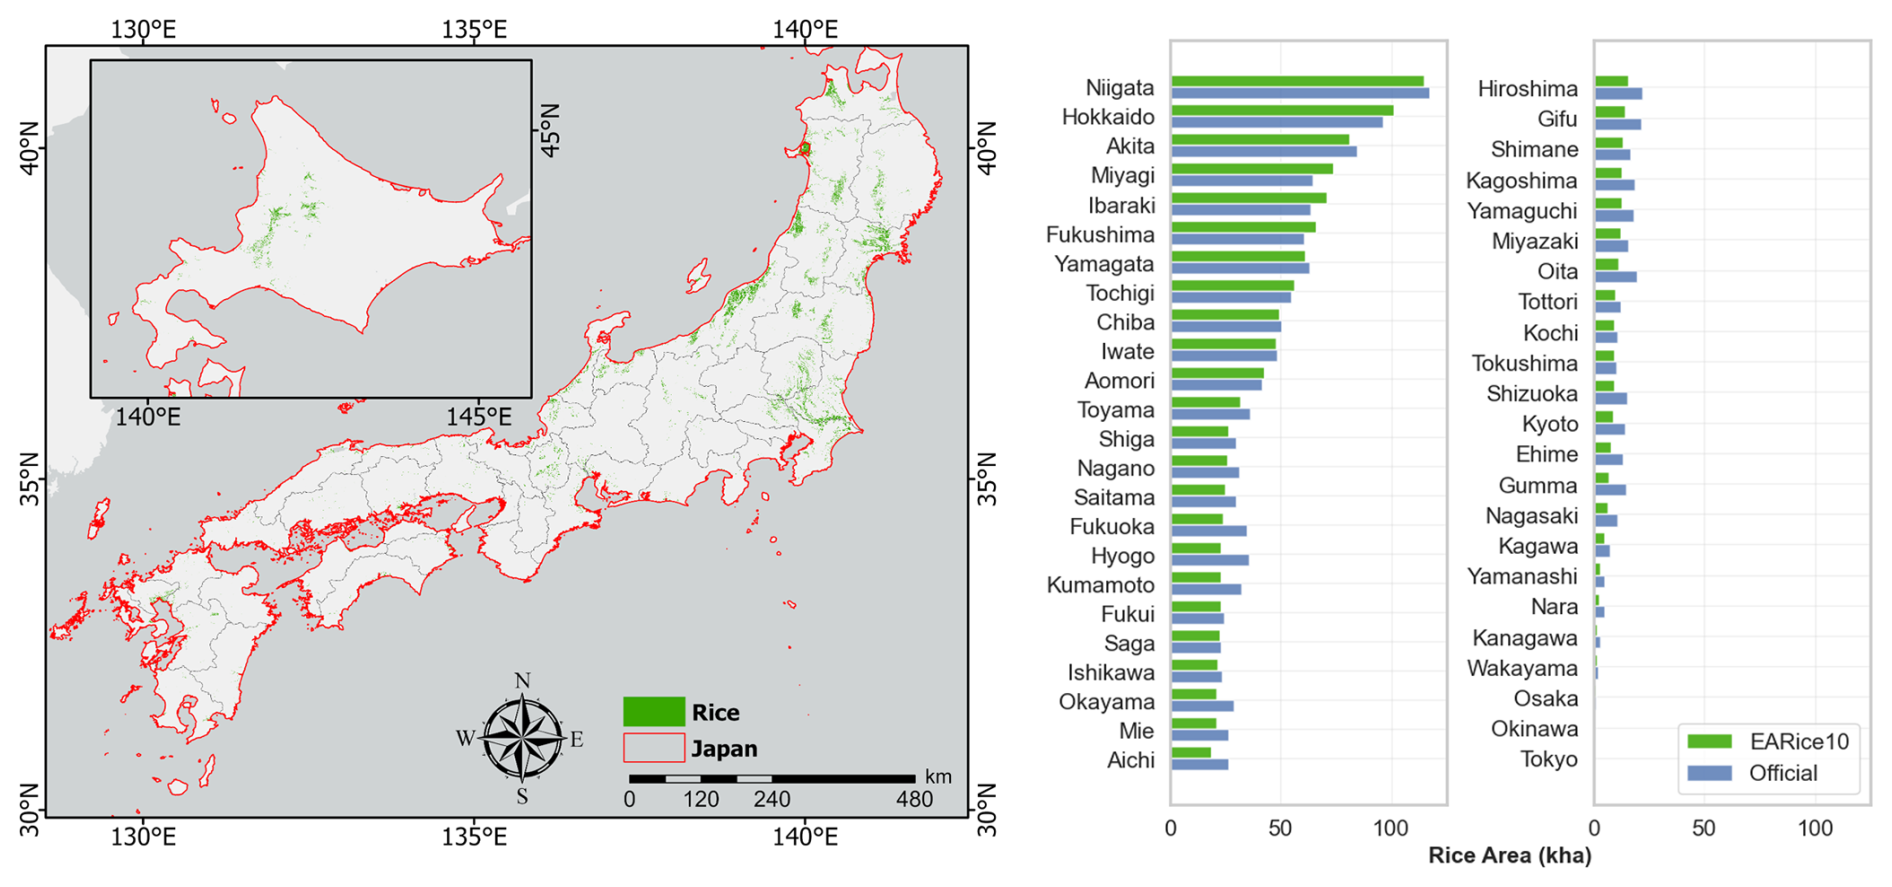
Figure 10The 10 m rice distribution map in Japan and provincial rice area statistics (2023).
On the Korean Peninsula, rice cultivation was primarily concentrated on the western and southern coastal plains, as these regions offer favorable conditions for large-scale rice cultivation due to the abundance of plains, rivers, and reservoirs, which provide ample irrigation. Some rice paddies are also found in the eastern mountainous areas.
In the Republic of Korea, the annual rice cultivation area was 626 830 ha. Specifically, rice cultivation was mainly concentrated in the provinces of Jeollanam-do, Chungcheongnam-do, Jeollabuk-do, Gyeongsangbuk-do, Gyeonggi-do, and Gyeongsangnam-do, which together represent 88 % of the total rice cultivation area in the Republic of Korea. The top three provinces for rice cultivation in 2023 were Jeollanam-do (21.62 %), Chungcheongnam-do (19.47 %), and Jeollabuk-do (15.90 %).
In the Democratic People's Republic of Korea, the annual rice cultivation area was 504 692 ha. Specifically, rice cultivation was predominantly concentrated in the western provinces, specifically Hwanghae-namdo, Pyongan-bukdo, Pyongan-namdo, Hamgyŏng-namdo, and Hwanghae-bukdo. These regions account for 82.49 % of the nation's total rice cultivation area. The top three provinces for rice cultivation in 2023 were Hwanghae-namdo (25.35 %), Pyongan-bukdo (20.33 %), and Pyongan-namdo (18.27 %).
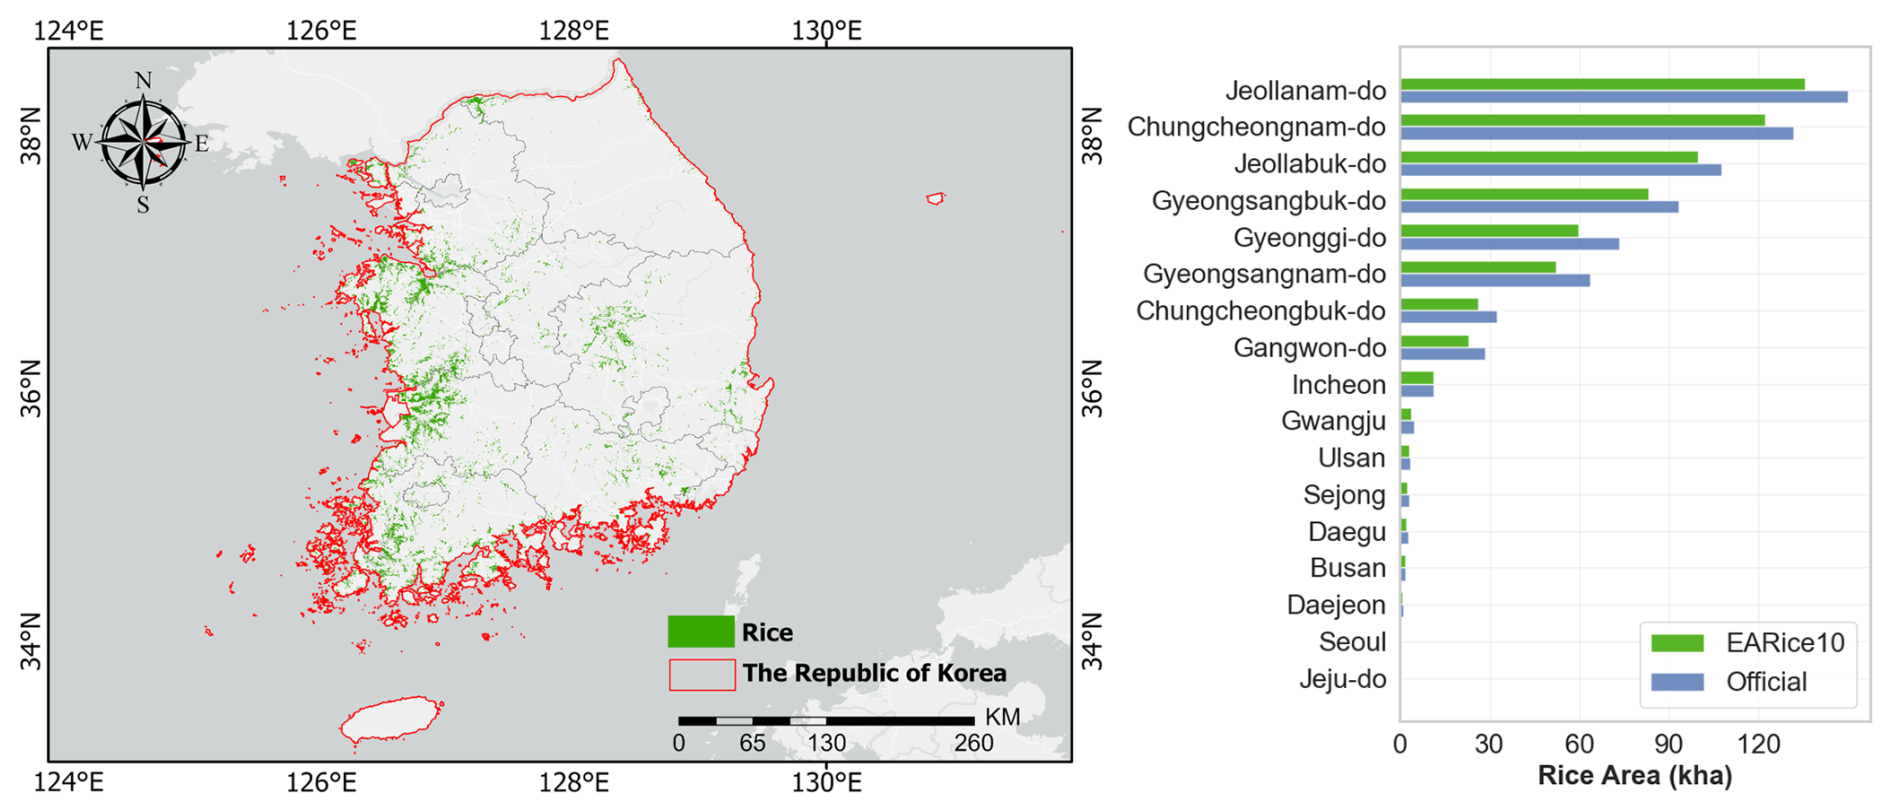
Figure 11The 10 m rice distribution map in the Republic of Korea and provincial rice area statistics (2023).
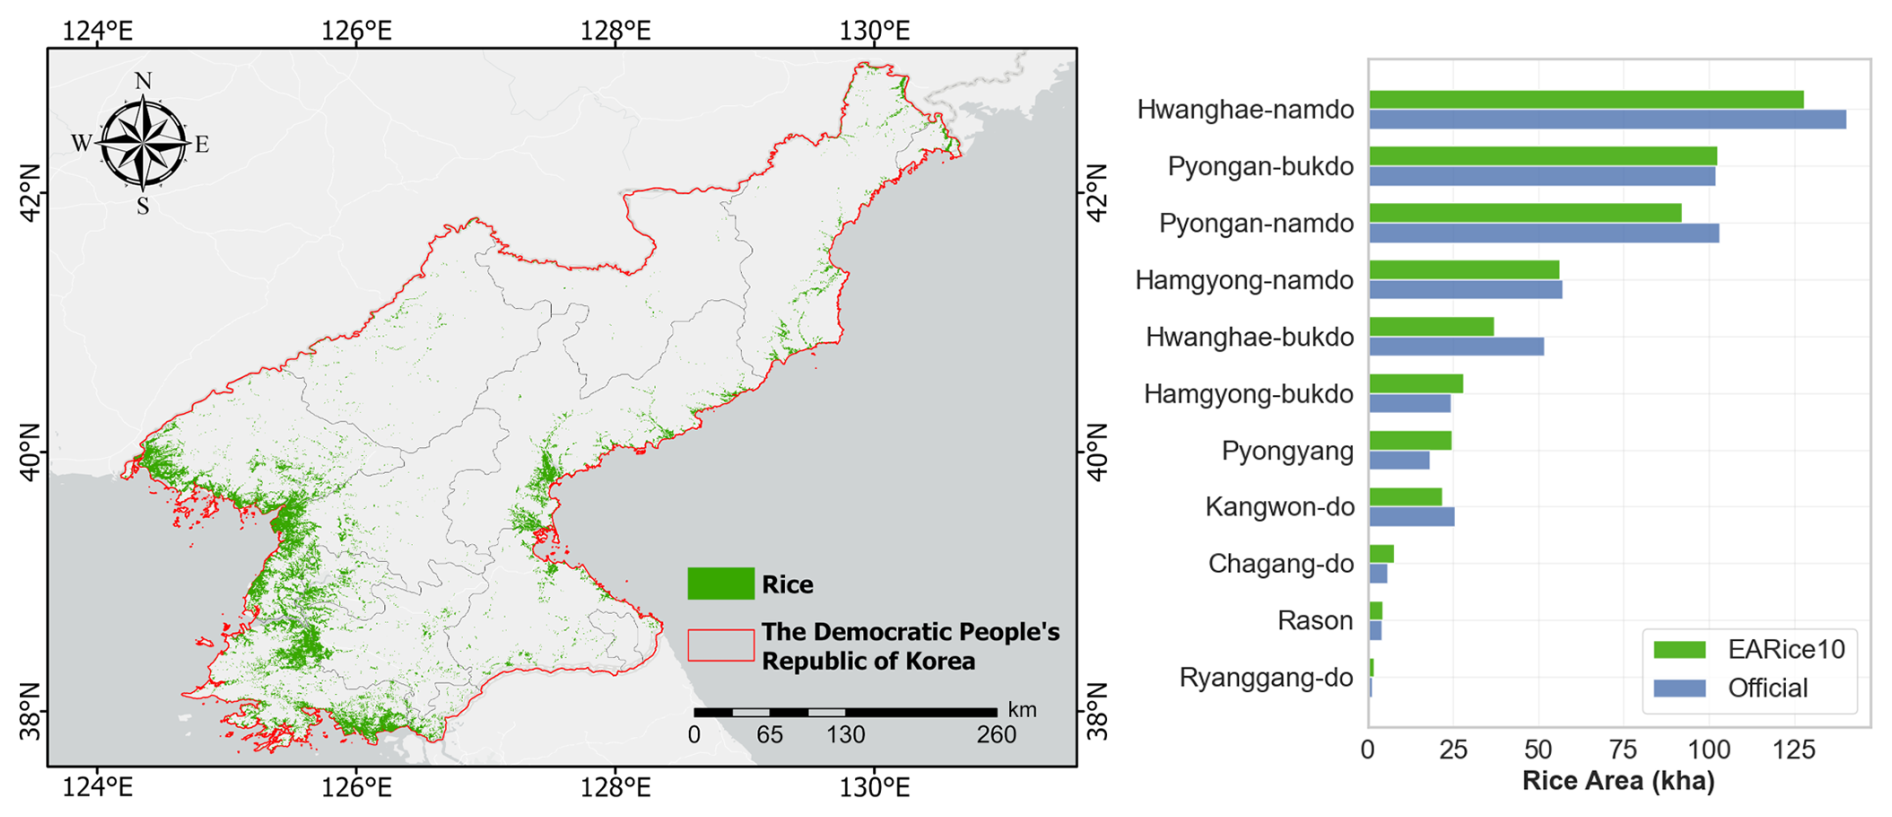
Figure 12The 10 m rice distribution map in the Democratic People's Republic of Korea and provincial rice area statistics (2023).
4.2 Accuracy evaluation results of EARice10
The accuracy of EARice10 was evaluated using the validation sample set and statistical yearbook data, as shown in Table 3 and Fig. 13.
In Table 3, EARice10 achieved the OA of 90.48 %, UA of 90.93 %, and PA of 90.49 %, indicating high consistency between the extracted rice areas and the validation sample set. Specifically, the Democratic People's Republic of Korea and the Republic of Korea exhibited the highest classification accuracy, with OAs of 95.20 % and 95.03 %, respectively. Japan had an OA of 90.02 %, while China's OA was slightly lower at 89.16 %. This discrepancy may be due to its larger geographical area and diverse rice cropping systems.
As shown in Fig. 13, the accuracy assessment results at the provincial scale indicated that most provinces in the Democratic People's Republic of Korea, the Republic of Korea, and northern provinces of China (such as Heilongjiang, Jilin, and Liaoning) performed excellently, with OAs above 92 %. These rice areas belonged to the single-season region and were characterized by vast plains and abundant water resources, making them highly suitable for large-scale rice cultivation, which was consistent with previous studies (Dong et al., 2016; Ni et al., 2021; Zhang et al., 2022a; Zhang et al., 2023b). Conversely, the classification accuracy of rice paddies in southwestern China (such as Tibet and Chongqing) exhibited marginally lower performance due to the complex topography and fragmented distribution of land fields. Nonetheless, it is noteworthy that the OAs in these areas all exceeded 74 %.
Table 3National-level confusion matrix for the EARice10 against validation sample set.

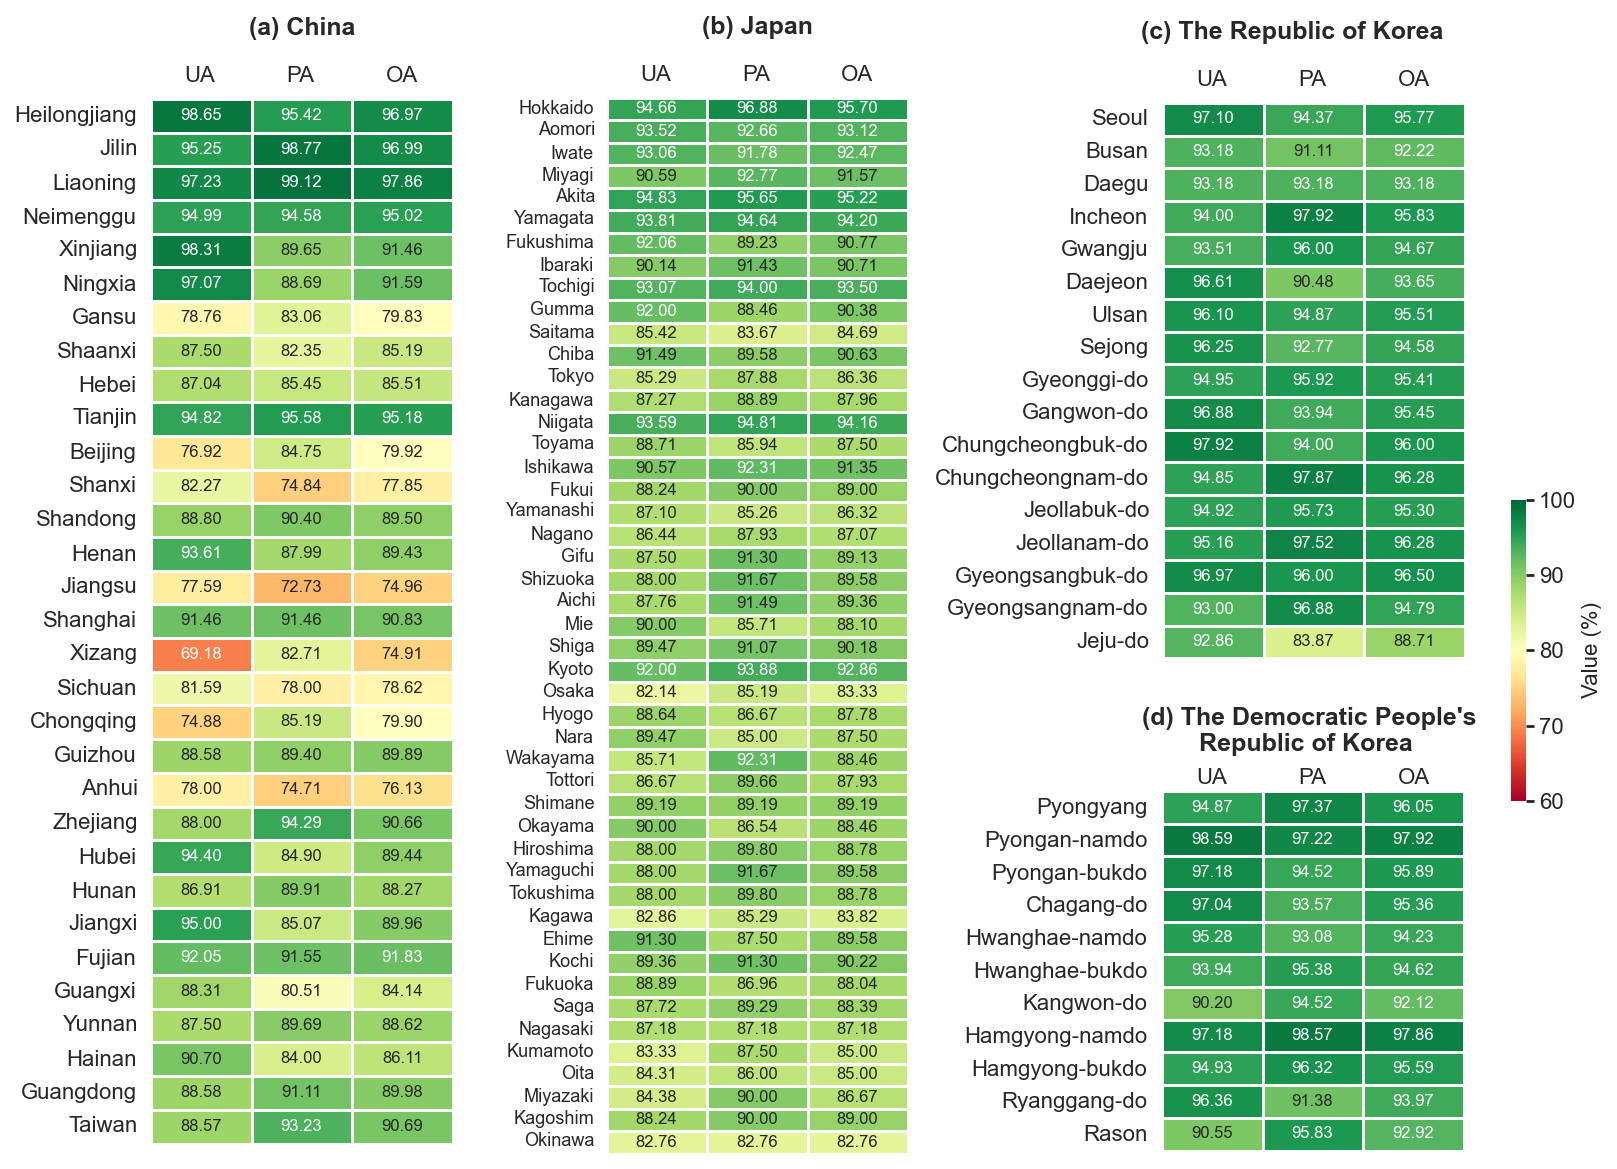
Figure 13Provincial-level confusion matrix metrics for the EARice10 based on validation sample set.
In addition, we compared the rice area derived from EARice10 with the rice area reported in official statistical yearbooks, using municipal-level statistical yearbook data for China and provincial-level statistical yearbook data for Japan, the Republic of Korea, and the Democratic People's Republic of Korea. Notably, the EARice10 reflects the annual distribution of rice, whereas the statistical yearbooks report the planted areas for early, middle, and late rice, with middle rice being single-season rice and early and late rice classified as double-season rice systems. Therefore, for double-season rice areas, we used the maximum value between early and late rice as the official statistical data to ensure a reasonable comparison. As illustrated in Fig. 14, the R2 of EARice10 at the municipal level in China was 0.94. For the Democratic People's Republic of Korea, the Republic of Korea, and Japan, the R2 values at the provincial level were 0.97, 0.98, and 0.95, respectively. All correlations were statistically significant (p<0.01). These results demonstrated robust agreement between EARice10-derived rice area and government-reported rice area statistics.
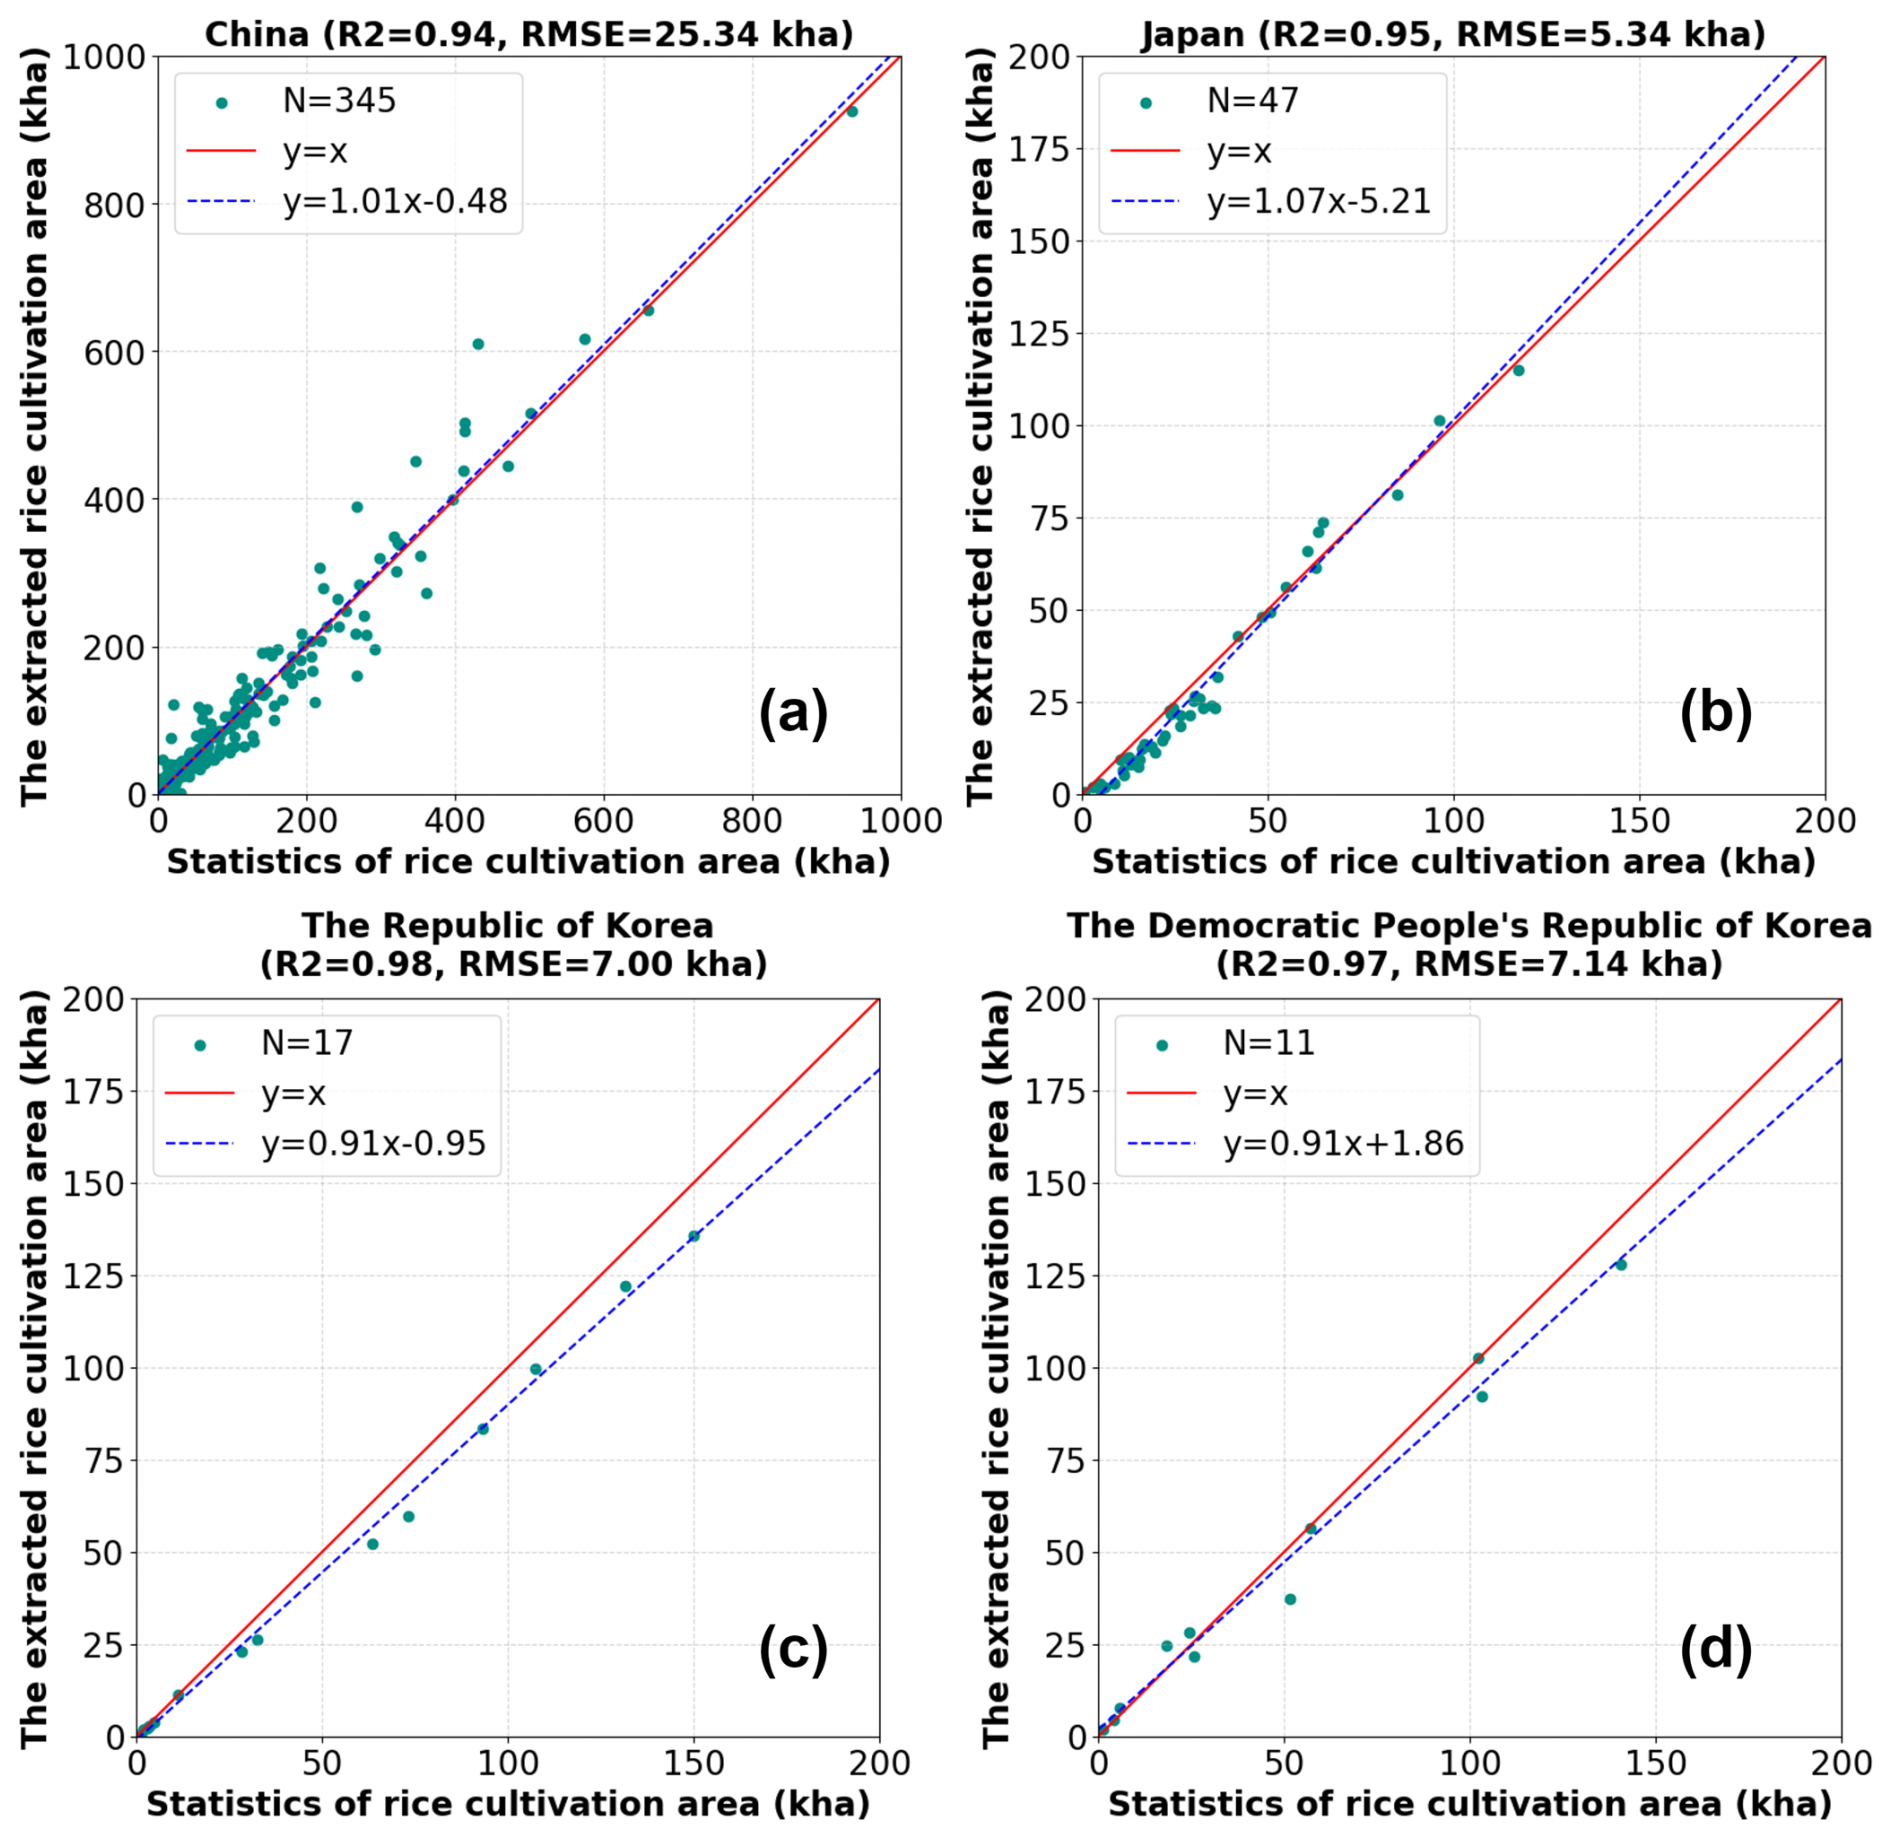
Figure 14Comparison of the extracted rice area from the EARice10 with the rice area from statistical yearbooks at the administrative division scale: (a) municipal-level comparison in China and (b, c, d) provincial-level comparisons in Japan, the Republic of Korea, and the Democratic People's Republic of Korea, respectively.
4.3 Comparison of the EARice10 with existing rice distribution maps
Seven representative sites were selected for comparison with five existing EA rice distribution products, as shown in Fig. 15. These sites cover a wide range of countries and cropping patterns, with Sites 1 and 2 in the single-season region of China; Site 3 in the mixed-season region of China; Site 4 in the double-season region of China; and Sites 5–7 in the Democratic People's Republic of Korea, the Republic of Korea, and Japan, respectively.
The comparison results, as shown in Fig. 16, indicated that EARice10 can show more detail relative to the 500 m resolution rice distribution map of APRA500. The EARice10 dataset also showed a high degree of spatial consistency with rice distribution maps from different countries at either 30 or 10 m resolution. Some localized differences could be found at Sites 1, 2, 5, 6, and 7, where EARice10 depicted more complete paddy plots and clearer road networks reflecting finer spatial details than the existing products. At Sites 3 and 4, EARice10 showed higher spatial completeness and lower noise levels than the existing products. Overall, the comparison results demonstrated the satisfying quality of EARice10.
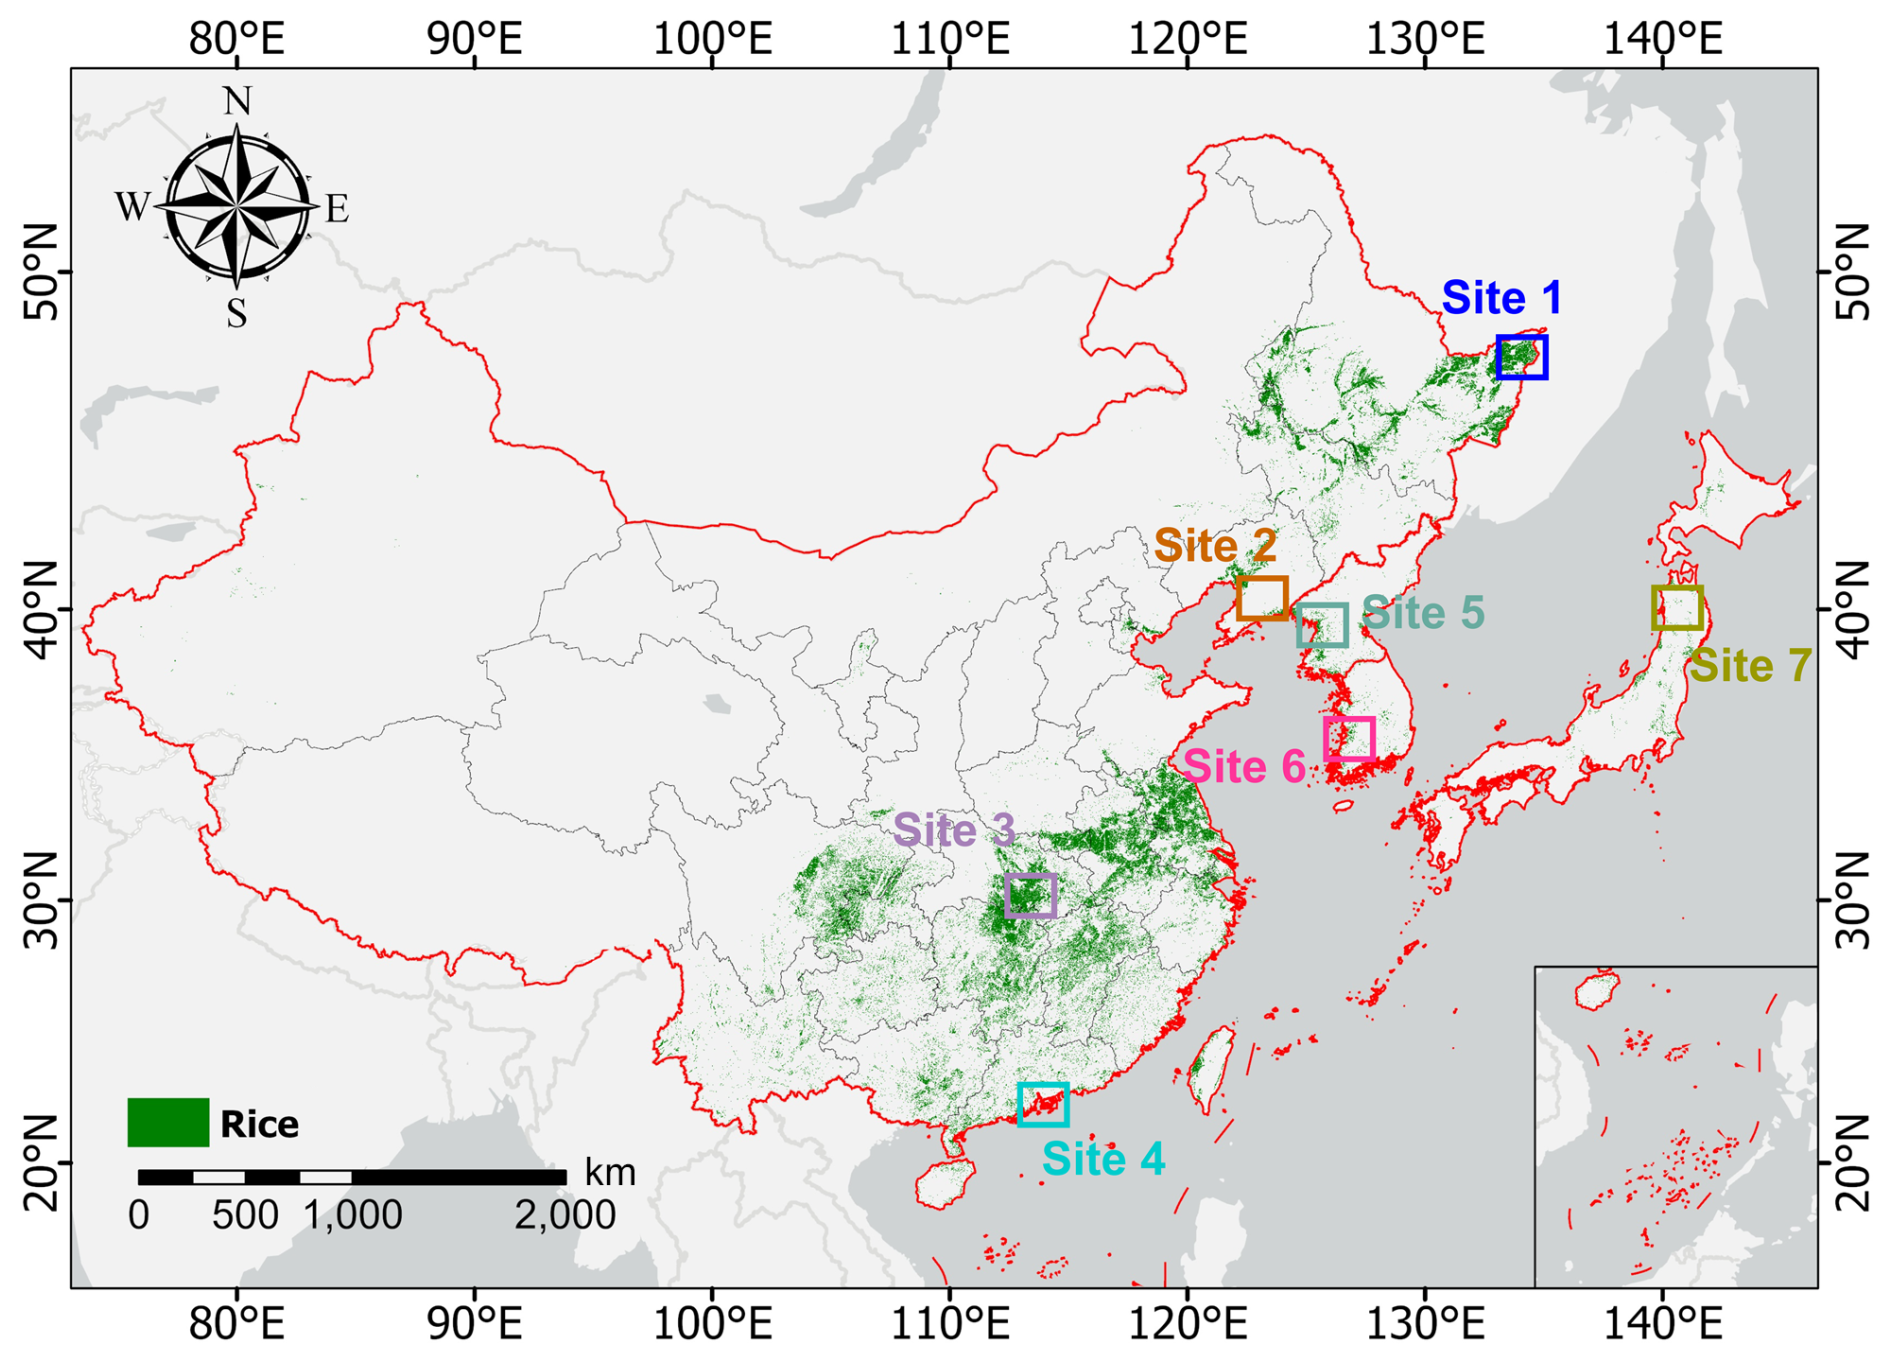
Figure 15The sites for comparison.
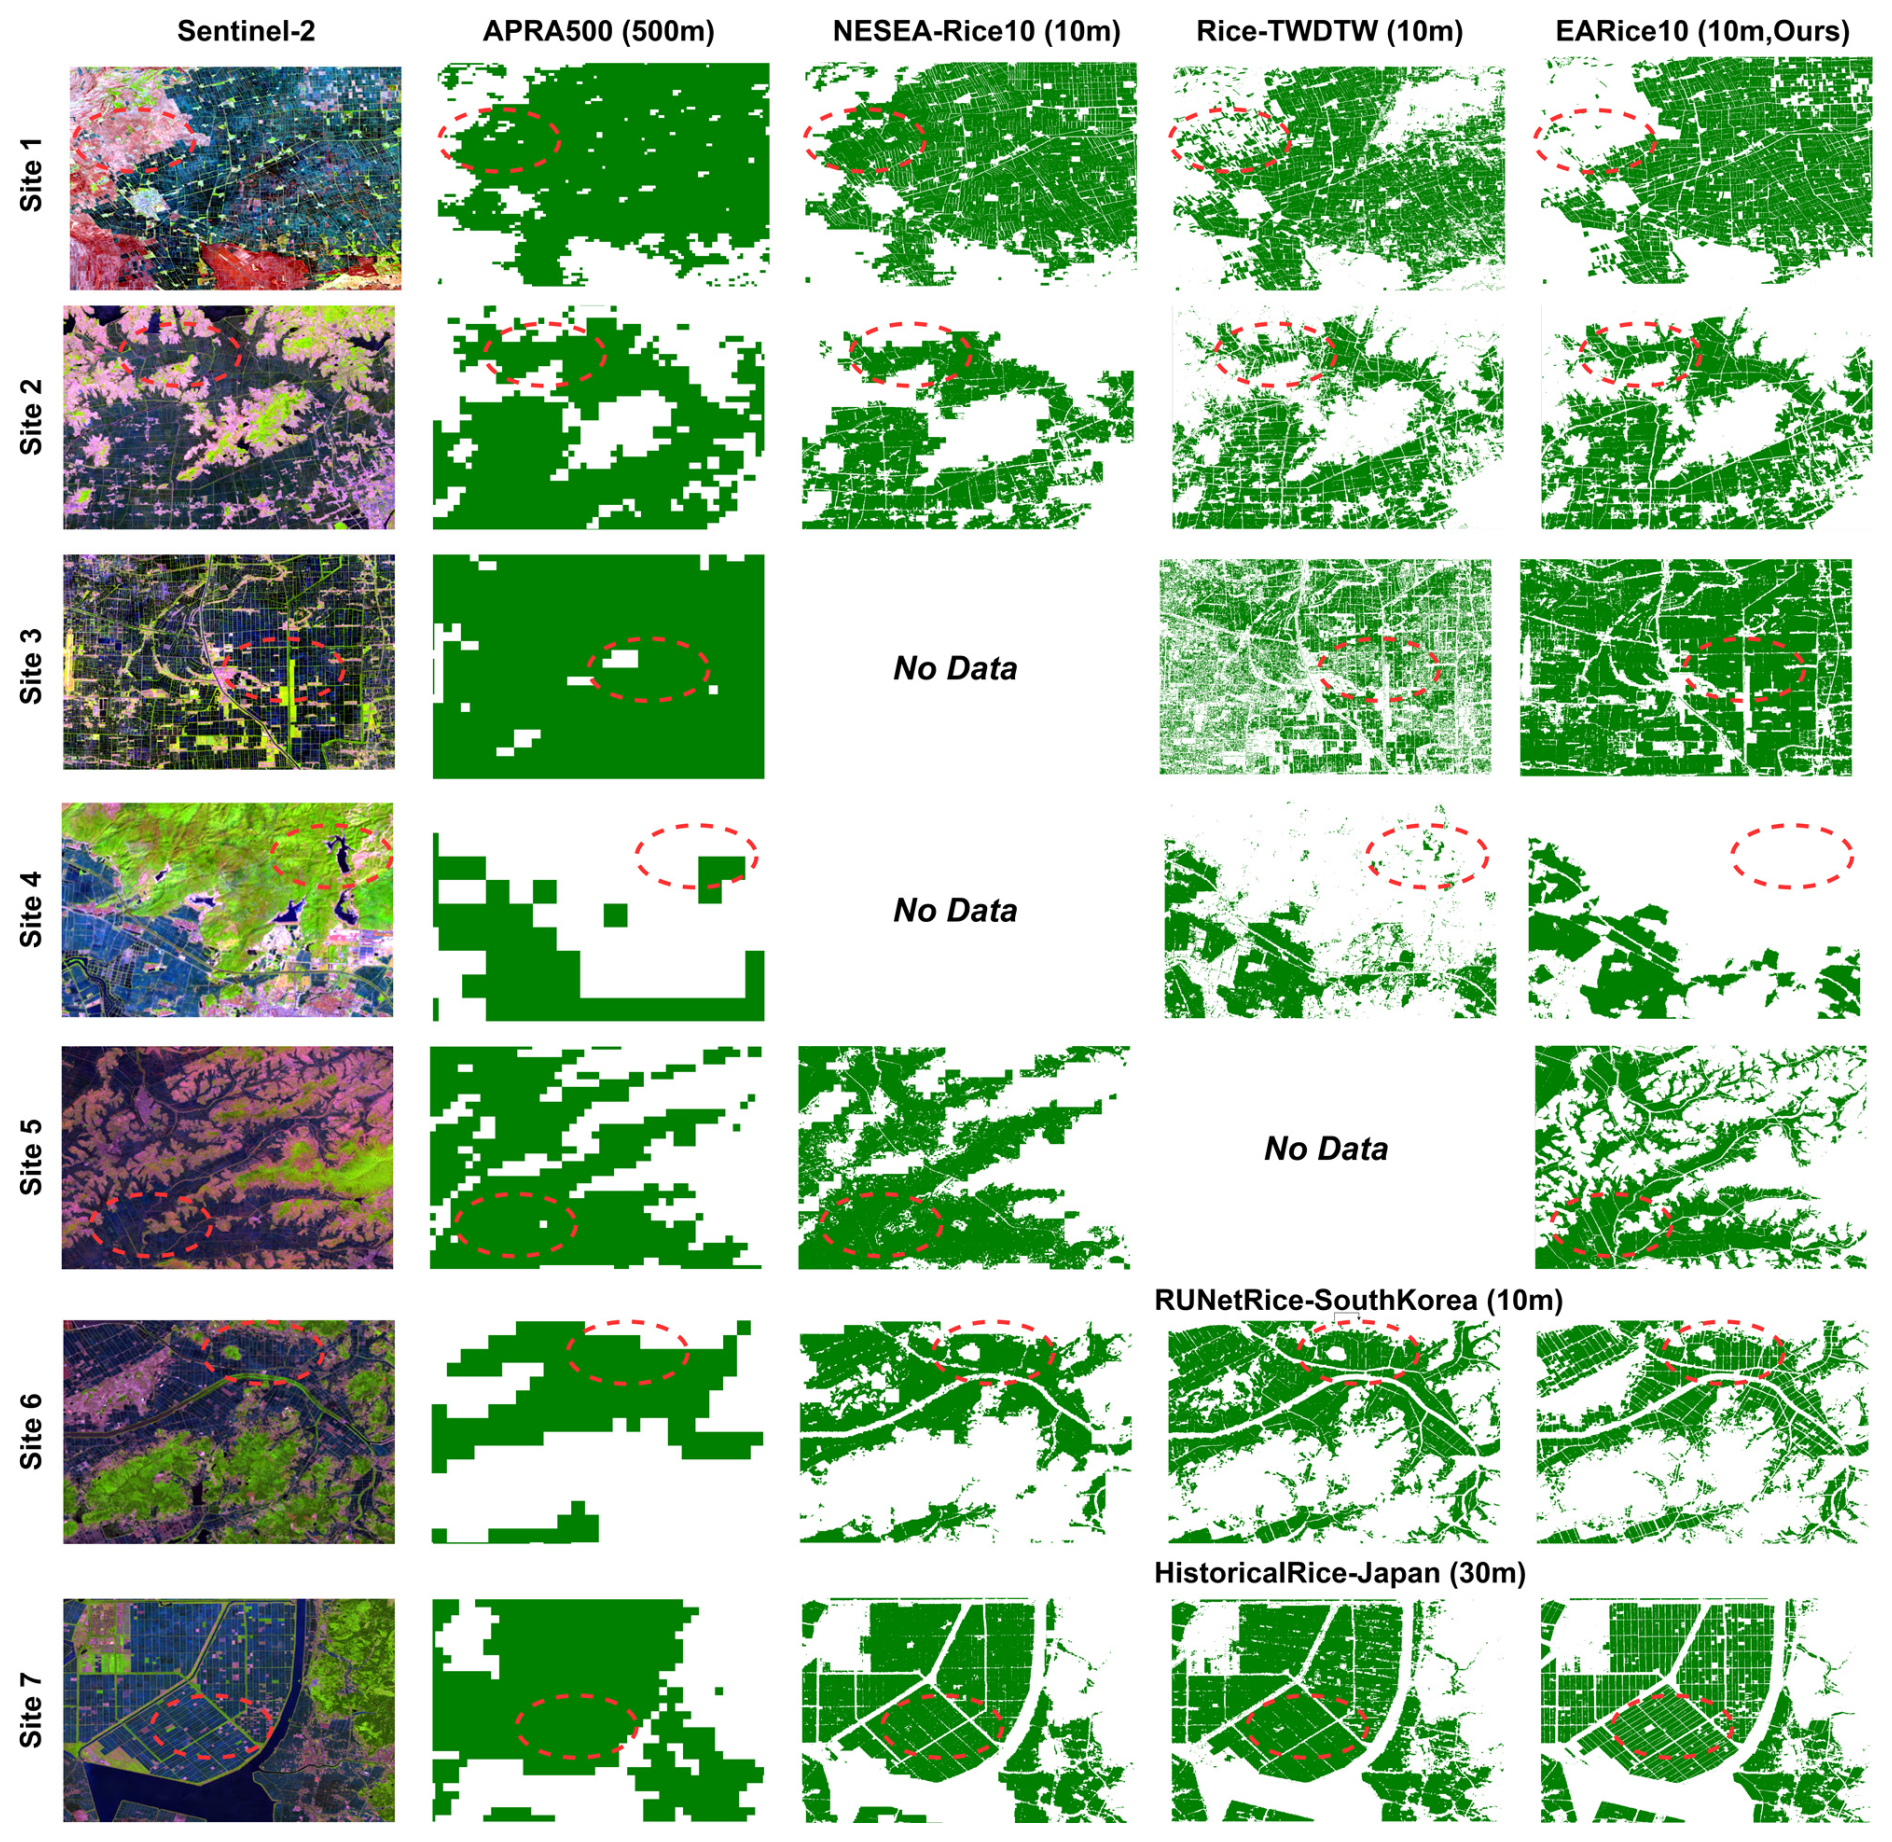
Figure 16Detailed comparison of the EARice10 with five existing rice distribution maps. Site 1 and Site 2 are single-season rice-planting areas in China (Heilongjiang and Liaoning Province); Site 3 is a mixed-season rice-planting area in China (Hubei Province); Site 4 is a double-season rice-planting area in China (Guangdong Province); and Sites 5–7 are single-season rice-planting areas located in the Democratic People's Republic of Korea, the Republic of Korea, and Japan, respectively.
Figure 17 compares rice area estimates derived from EARice10 and existing rice distribution maps at the administrative unit level for each country. Strong correlations were observed between rice area estimates by EARice10 and existing products. In China, EARice10 rice area estimates were significantly correlated with those from Rice-TWDTW (R2=0.91, p<0.01) and NESEA-Rice10 (R2=0.98, p<0.01). Similarly, strong correlations were observed in the Democratic People's Republic of Korea with NESEA-Rice10 (R2=0.91, p<0.01), in the Republic of Korea with RU-NetRice-SouthKorea (R2=0.97, p<0.01), and in Japan with NESEA-Rice10 (R2=0.91, p<0.01) and HistoricalRice-Japan (R2=0.79, p<0.01). Notably, in Japan, rice area estimates from EARice10 were consistently lower than those from the HistoricalRice-Japan (slope = 0.72). This discrepancy was likely attributable to differences in mapping periods: HistoricalRice-Japan represented a 5-year aggregate (2015–2019), whereas EARice10 reflected the year 2023. Despite the temporal differences in map products, our comparisons with existing products validated the reliability of EARice10 in accurately representing the spatial distribution of rice cultivation in EA for 2023.
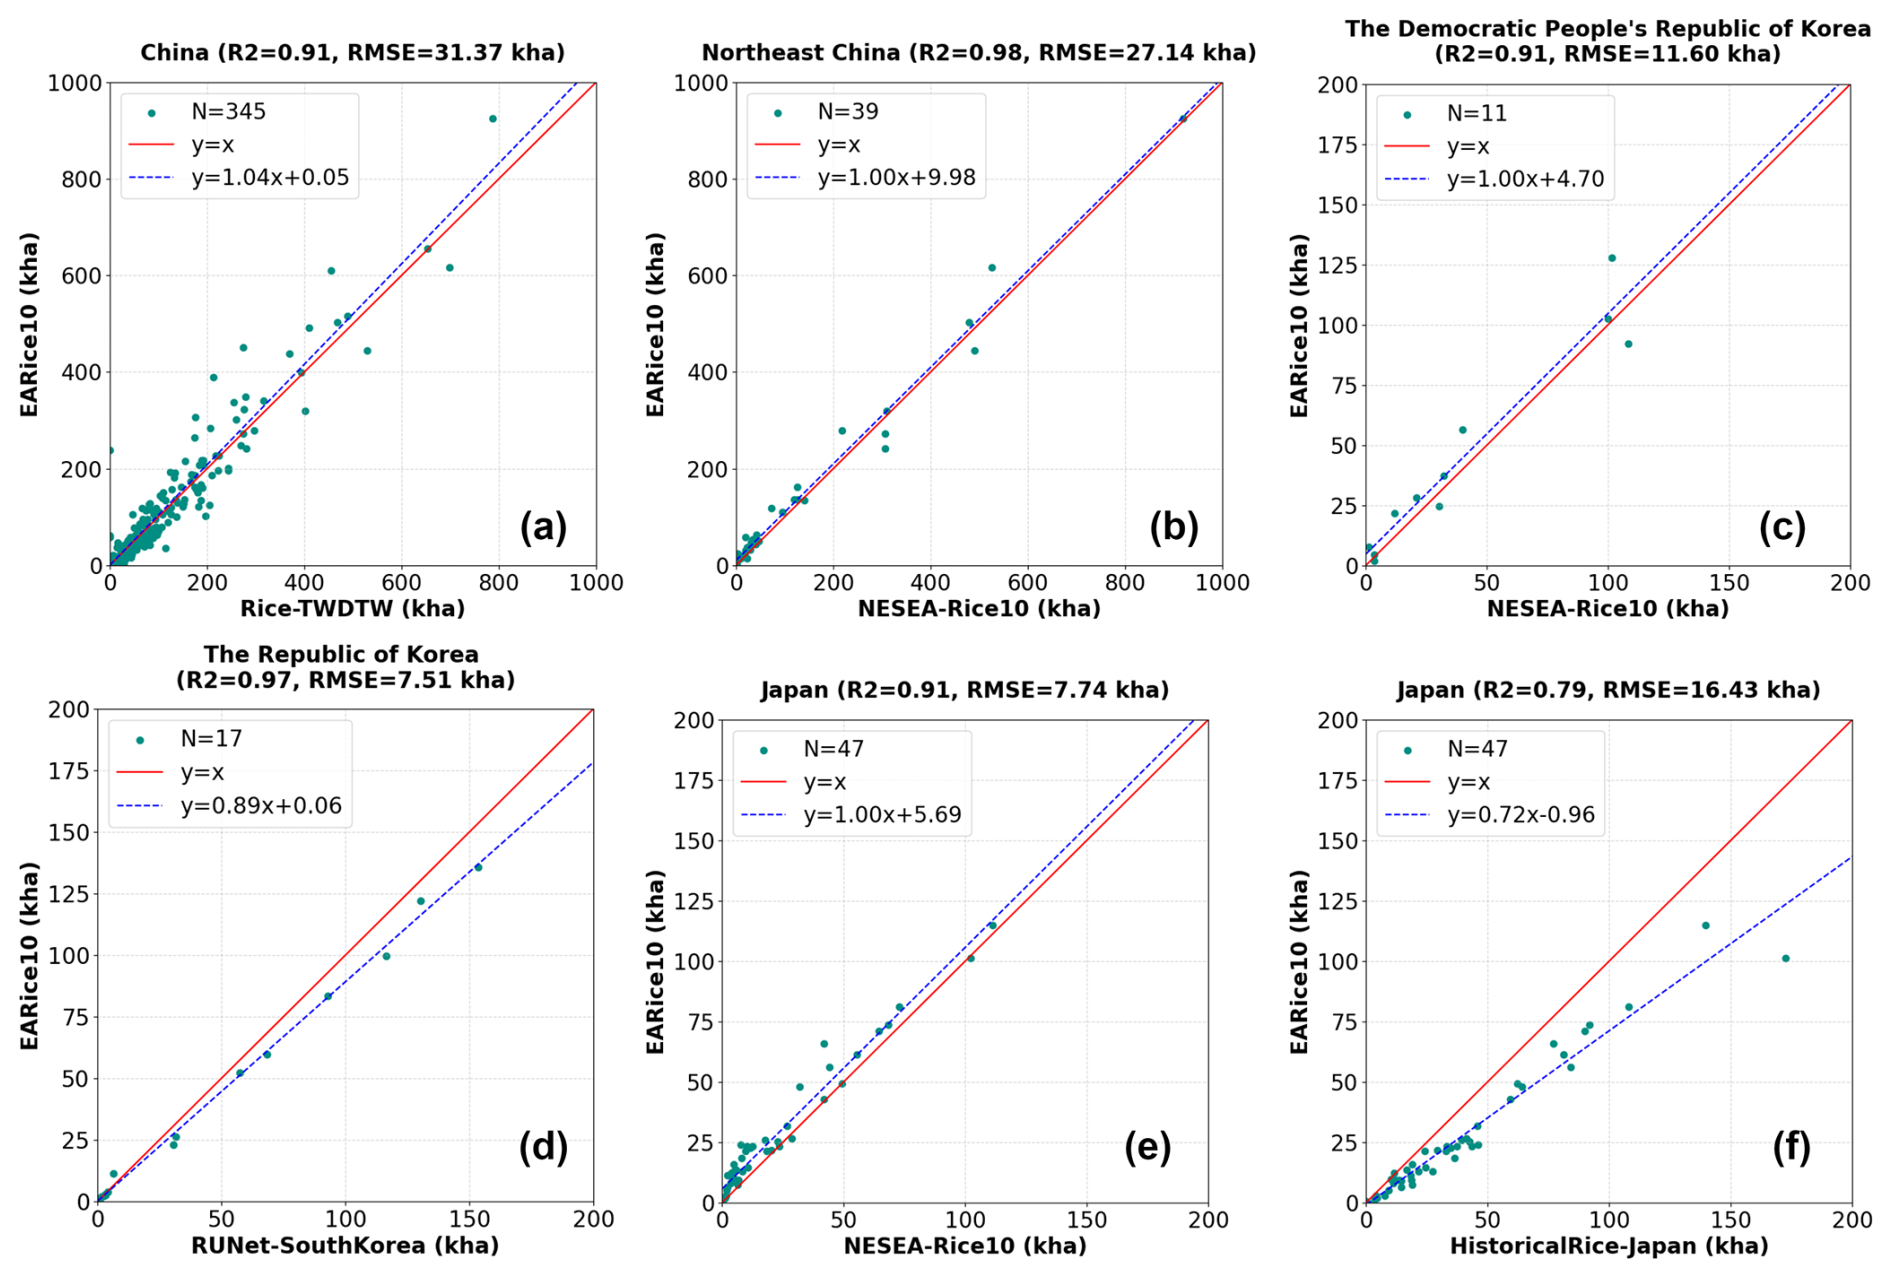
Figure 17Comparison between EARice10 and existing datasets from different countries' administrative regions.
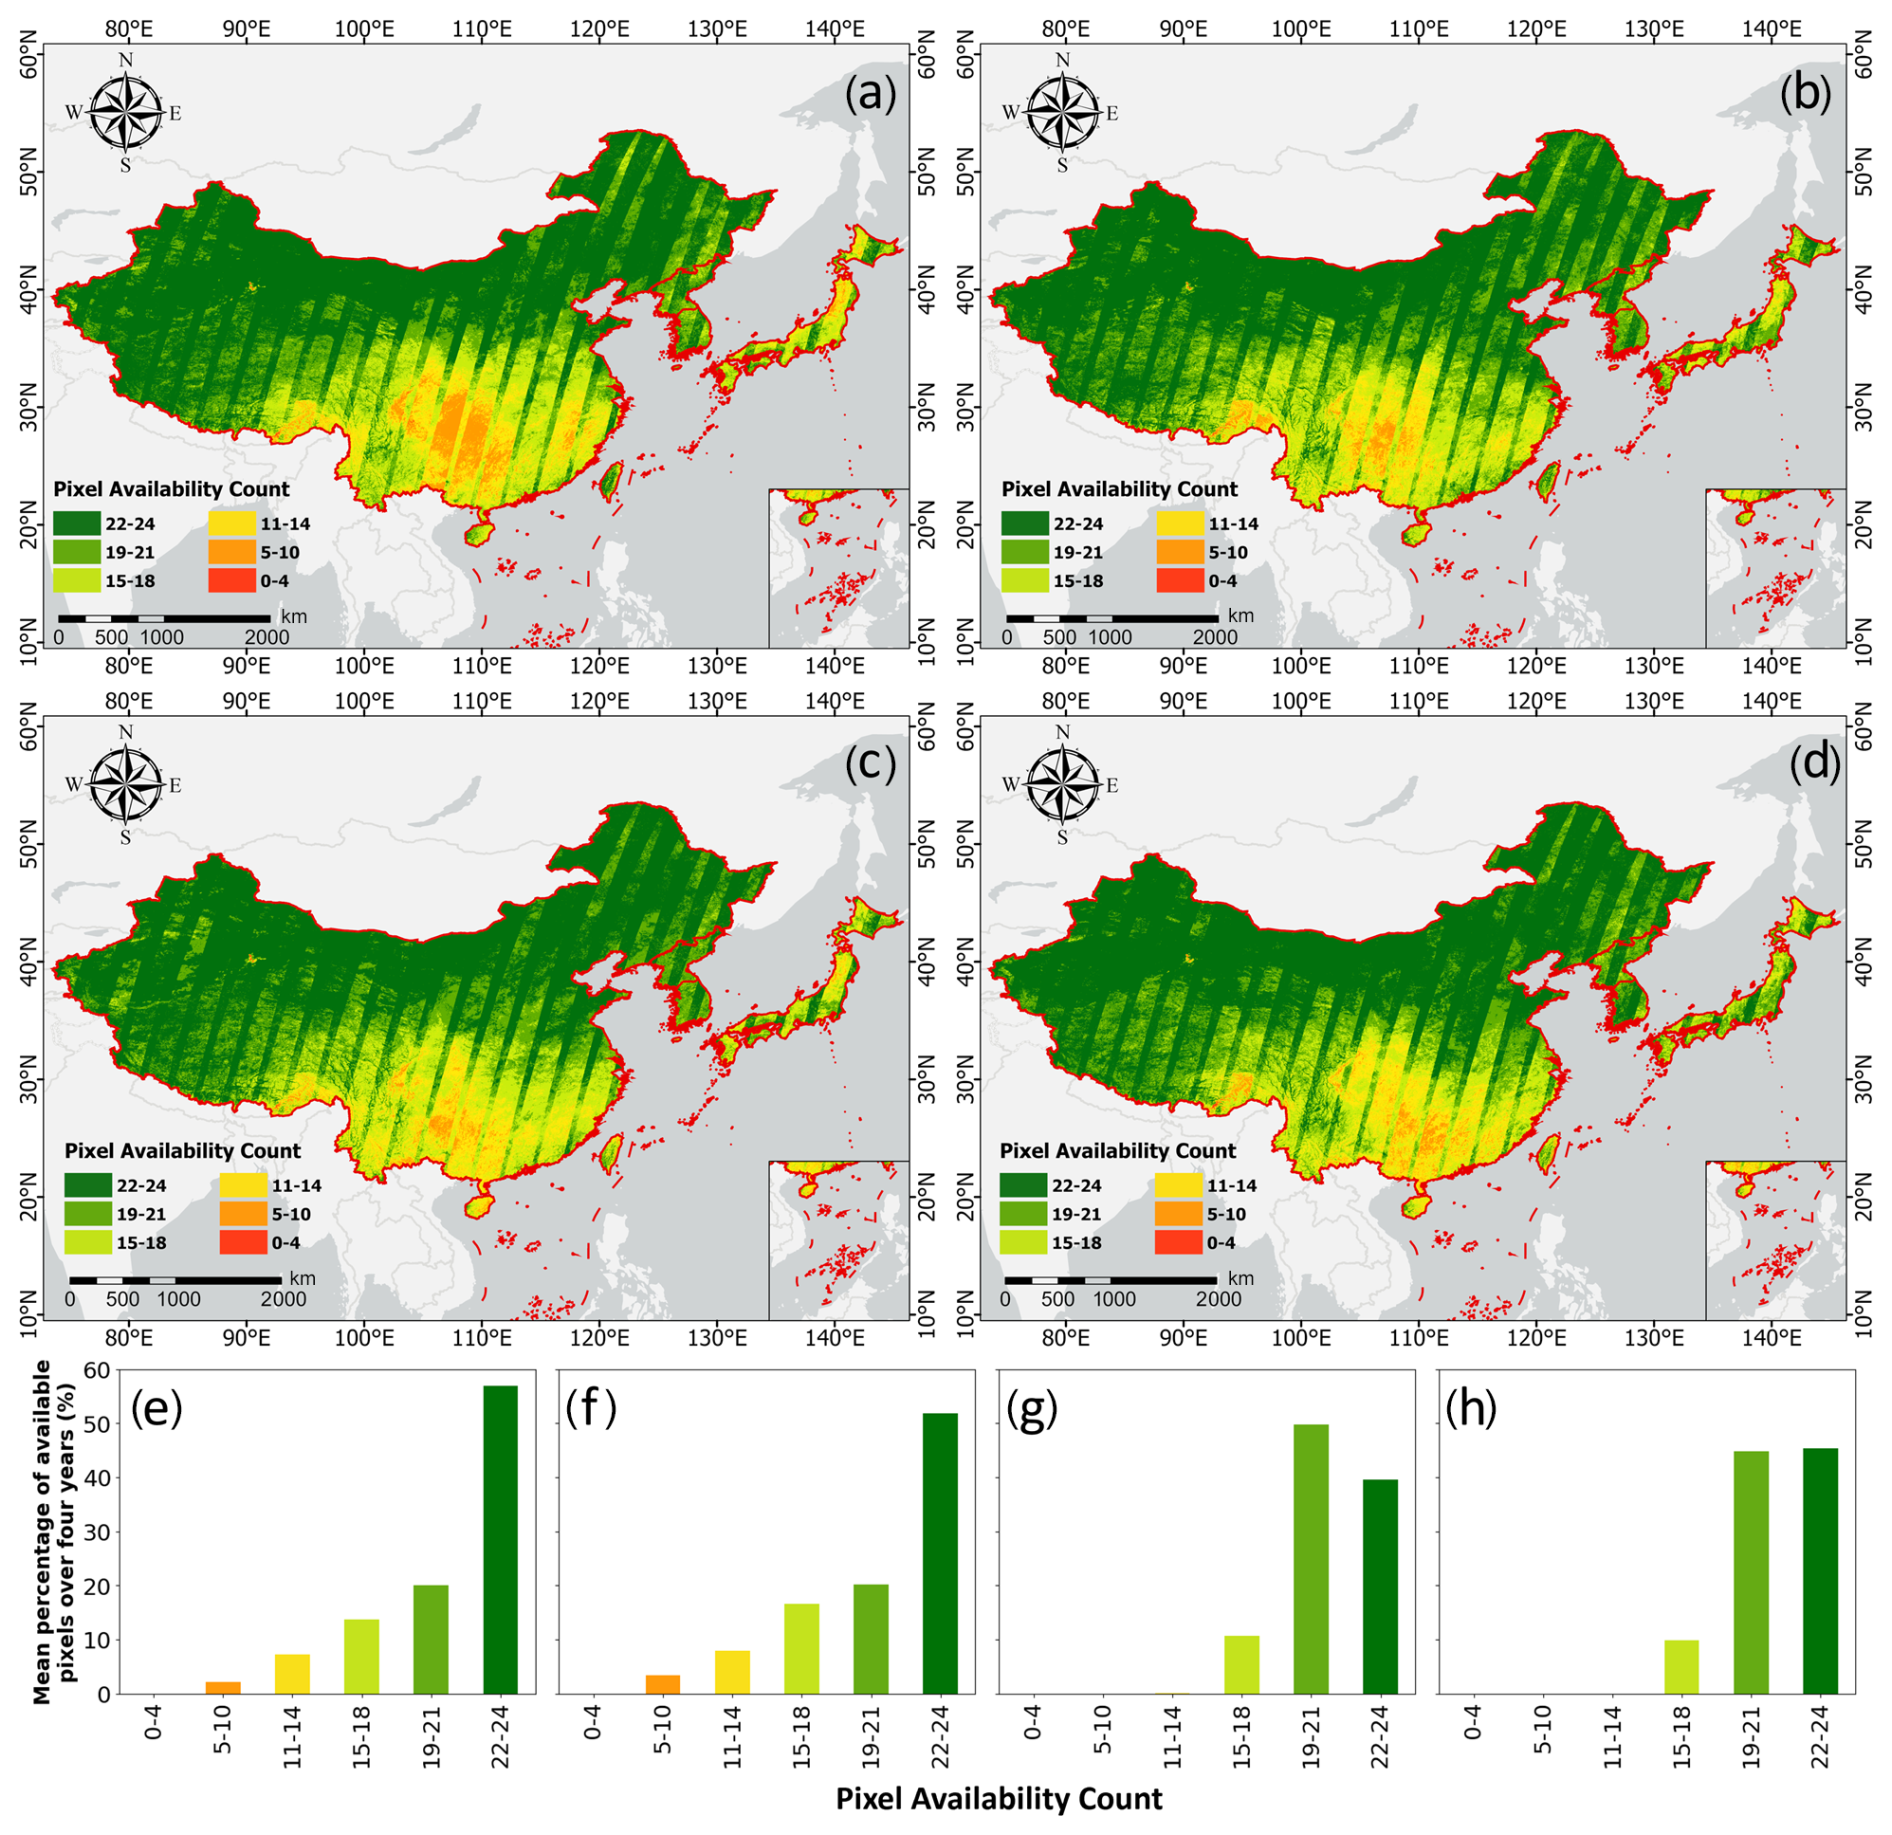
Figure 18Number of cloud-free semi-monthly pixels from 2020 to 2023 and proportion of cloud-free semi-monthly pixel counts in different countries: (a–d) number of cloud-free semi-monthly pixels from 2020 to 2023, where (a), (b), (c), and (d) represent 2020, 2021, 2022, and 2023, respectively. (e–h) Mean proportion of cloud-free semi-monthly pixel counts from 2020 to 2023 in different countries: (e) China, (f) Japan, (g) Republic of Korea, and (h) Democratic People's Republic of Korea.
With its vast expanse, EA is a significant global rice production area that encompasses multiple climate zones. However, cloud cover presents challenges for high-precision rice area mapping in the region. Figure 18 illustrates the number of cloud-free S2 semi-monthly images in different regions of EA from 2020 to 2023, revealing significant differences due to the uneven temporal and spatial distribution of clouds. Southern China and parts of Japan are particularly affected, with 9.39 % and 11.38 % of areas in China and Japan, respectively, having fewer than 15 cloud-free pixels. Therefore, relying solely on optical remote sensing data is insufficient, and a combination of optical and SAR data is required for accurate mapping of rice distribution.
Using in-season remote sensing data and phenological methods to generate training samples offers a feasible solution for large areas (Gao et al., 2023; Zhang et al., 2023a). However, cloud cover and variations in rice-planting cycles in different regions mean optical data alone cannot accurately determine rice distribution. To address this, we propose SRMI, a novel SAR-based index for rice mapping, which identifies SAR-based rice candidate areas through a single threshold during one rice phenological period. The rice candidate area extracted by SAR is combined with the optical-derived area by the intersection operation, which intends to filter the rice candidates to increase the quality of samples. This combination avoids misclassification or omission due to the limitations of a single data source, enhancing sample representativeness.
In subcontinental rice mapping, phenological methods alone are insufficient for high-precision rice distribution maps. Therefore, to achieve high-precision rice mapping and leverage the advantages of both optical and SAR data, this study designs an optical–SAR adaptive fusion model based on a stacking approach. This model utilizes a parallel structure to fully exploit the features of both optical and SAR data and incorporates the number of cloud-free S2 pixels as a feature in the final decision model, thereby achieving accurate rice classification by considering the uncertainty impact of clouds on rice mapping results.
Using this method, we obtain a 10 m rice distribution map of EA for 2023 (EARice10). The product is comprehensively evaluated using validation sample sets, statistical yearbook data, and existing rice distribution maps. The results indicate that EARice10 is highly consistent with statistical information and existing products and is able to reflect precise rice distribution information of EA in 2023.
Despite the promising results of EARice10, there is room for improvement. To obtain high-precision rice distribution maps of EA, the optical–SAR adaptive fusion model designed in this study is based on a stacking model approach. This method improves classification accuracy by combining the strengths of multiple models, but it sacrifices computational efficiency to some extent compared to single machine learning models. While the high-performance computing capabilities of the GEE platform facilitate the implementation of such computationally intensive models at a subcontinental scale, future research could explore more lightweight and robust classification models to enhance computational efficiency without significantly compromising classification accuracy. This would enable the method to be more effectively applied in global rice mapping studies.
The 2023 East Asia 10 m annual rice distribution map can be accessed on Zenodo at https://doi.org/10.5281/zenodo.13118409 (Song et al., 2024). The spatial reference system for this dataset is EPSG:4326 (WGS84).
Addressing the sample generation challenges inherent in subcontinental-scale rice classification, in this paper, a novel large-scale rice mapping framework was designed to generate a 10 m resolution rice distribution map of EA in 2023 (EARice10). The framework involves an indices-based sample set generation method and an optical–SAR adaptive fusion model, to take full advantage of S1 and S2 data. The generated EARice10 has an OA of 90.48 % on the validation samples, showing good consistency with statistical data and existing datasets, with R2 values ranging between 0.94 and 0.98 with statistical data and between 0.79 and 0.98 with existing datasets. Moreover, EARice10 is the most up-to-date rice distribution map that comprehensively covers four rice production countries of EA in 10 m resolution. And for the first time, it covers rice areas of less than 100 000 ha in China, filling the data gaps of eight provincial administrative regions of China in previous studies.
Conceptualization, methodology, software: MS and HZ. Validation, formal analysis: JG. Investigation: MS and HZ. Resources, data curation: LX and FW. Writing (original draft preparation): MS, HZ, and LX. Writing (review and editing): HZ, LX, JG, and LZ. Visualization: JJ, YD, and YX. Supervision, project administration: HZ and LZ. All authors have read and agreed to the published version of the paper.
The contact author has declared that none of the authors has any competing interests.
Publisher's note: Copernicus Publications remains neutral with regard to jurisdictional claims made in the text, published maps, institutional affiliations, or any other geographical representation in this paper. While Copernicus Publications makes every effort to include appropriate place names, the final responsibility lies with the authors. Regarding the maps used in this paper, please note that Figs. 1, 2, 3, 8, 9, 15, and 18 contain disputed territories.
The authors acknowledge the support of data and computational power provided by the Google Earth Engine platform.
The research was supported by the International Research Center of Big Data for Sustainable Development Goals (CBAS) (grant no. CBASYX0906).
This paper was edited by Hanqin Tian and reviewed by Jinwei Dong and three anonymous referees.
Abdali, E., Valadan Zoej, M. J., Taheri Dehkordi, A., and Ghaderpour, E.: A Parallel-Cascaded Ensemble of Machine Learning Models for Crop Type Classification in Google Earth Engine Using Multi-Temporal Sentinel-1/2 and Landsat-8/9 Remote Sensing Data, Remote Sens., 16, 127, https://doi.org/10.3390/rs16010127, 2023.
Achanta, R. and Susstrunk, S.: Superpixels and polygons using simple non-iterative clustering, Proceedings of the IEEE conference on computer vision and pattern recognition, 21–26 July 2017, Honolulu, HI, USA, 4651–4660, 2017.
Carrasco, L., Fujita, G., Kito, K., and Miyashita, T.: Historical mapping of rice fields in Japan using phenology and temporally aggregated Landsat images in Google Earth Engine, ISPRS J. Photogramm. Remote, 191, 277–289, https://doi.org/10.1016/j.isprsjprs.2022.07.018, 2022.
Chen, N., Yu, L., Zhang, X., Shen, Y., Zeng, L., Hu, Q., and Niyogi, D.: Mapping Paddy Rice Fields by Combining Multi-Temporal Vegetation Index and Synthetic Aperture Radar Remote Sensing Data Using Google Earth Engine Machine Learning Platform, Remote Sens., 12, 2992, https://doi.org/10.3390/rs12182992, 2020.
Chen, W. and Zhao, X.: Understanding global rice trade flows: Network evolution and implications, Foods, 12, 3298, https://doi.org/10.3390/foods12173298, 2023.
d'Andrimont, R., Verhegghen, A., Lemoine, G., Kempeneers, P., Meroni, M., and Van Der Velde, M.: From parcel to continental scale–A first European crop type map based on Sentinel-1 and LUCAS Copernicus in-situ observations, Remote Sens. Environ., 266, 112708, https://doi.org/10.1016/j.rse.2021.112708, 2021.
Dong, J. and Xiao, X.: Evolution of regional to global paddy rice mapping methods: A review, ISPRS J. Photogramm. Remote, 119, 214–227, https://doi.org/10.1016/j.isprsjprs.2016.05.010, 2016.
Dong, J., Xiao, X., Menarguez, M. A., Zhang, G., Qin, Y., Thau, D., Biradar, C., and Moore 3rd, B.: Mapping paddy rice planting area in northeastern Asia with Landsat 8 images, phenology-based algorithm and Google Earth Engine, Remote Sens. Environ., 185, 142–154, https://doi.org/10.1016/j.rse.2016.02.016, 2016.
FAO: World rice production (Crops > Items > Rice, paddy), https://www.fao.org/faostat/en/#data/QCL, last access: 17 June 2024.
Farr, T. G., Rosen, P. A., Caro, E., Crippen, R., Duren, R., Hensley, S., Kobrick, M., Paller, M., Rodriguez, E., and Roth, L.: The shuttle radar topography mission, Rev. Geophys., 45, https://doi.org/10.1029/2005RG000183, 2007.
Fisette, T., Rollin, P., Aly, Z., Campbell, L., Daneshfar, B., Filyer, P., Smith, A., Davidson, A., Shang, J., and Jarvis, I.: AAFC annual crop inventory, 2013 Second International Conference on Agro-Geoinformatics (Agro-Geoinformatics), 12–16 August 2013, Fairfax, VA, USA, 270–274, 2013.
Gao, X., Chi, H., Huang, J., Han, Y., Li, Y., and Ling, F.: Comparison of Cloud-Mask Algorithms and Machine-Learning Methods Using Sentinel-2 Imagery for Mapping Paddy Rice in Jianghan Plain, Remote Sens., 16, 1305, https://doi.org/10.3390/rs16071305, 2024.
Gao, Y., Pan, Y., Zhu, X., Li, L., Ren, S., Zhao, C., and Zheng, X.: FARM: A fully automated rice mapping framework combining Sentinel-1 SAR and Sentinel-2 multi-temporal imagery, Computers and Electronics in Agriculture, 213, 108262, https://doi.org/10.1016/j.compag.2023.108262, 2023.
Gitelson, A. A., Gritz, Y., and Merzlyak, M. N.: Relationships between leaf chlorophyll content and spectral reflectance and algorithms for non-destructive chlorophyll assessment in higher plant leaves, J. Plant Physiol,, 160, 271–282, 2003.
Gorelick, N., Hancher, M., Dixon, M., Ilyushchenko, S., Thau, D., and Moore, R.: Google Earth Engine: Planetary-scale geospatial analysis for everyone, Remote Sens. Environ., 202, 18–27, 2017.
Griffiths, P., Nendel, C., and Hostert, P.: Intra-annual reflectance composites from Sentinel-2 and Landsat for national-scale crop and land cover mapping, Remote Sens. Environ., 220, 135–151, 2019.
Han, J., Zhang, Z., Luo, Y., Cao, J., Zhang, L., Cheng, F., Zhuang, H., and Zhang, J.: APRA500: a 500 m annual paddy rice dataset for monsoon Asia using multisource remote sensing data, Zenodo [data set], https://doi.org/10.5281/zenodo.5555721, 2021a.
Han, J., Zhang, Z., Luo, Y., Cao, J., Zhang, L., Cheng, F., Zhuang, H., Zhang, J., and Tao, F.: NESEA-Rice10: high-resolution annual paddy rice maps for Northeast and Southeast Asia from 2017 to 2019, Earth Syst. Sci. Data, 13, 5969–5986, https://doi.org/10.5194/essd-13-5969-2021, 2021b.
Han, J., Zhang, Z., Luo, Y., Cao, J., Zhang, L., Cheng, F., Zhuang, H., Zhang, J., and Tao, F.: NESEA-Rice10: high-resolution annual paddy rice maps for Northeast and Southeast Asia from 2017 to 2019, Zenodo [data set], https://doi.org/10.5281/zenodo.5645344, 2021c.
Han, J., Zhang, Z., Luo, Y., Cao, J., Zhang, L., Zhuang, H., Cheng, F., Zhang, J., and Tao, F.: Annual paddy rice planting area and cropping intensity datasets and their dynamics in the Asian monsoon region from 2000 to 2020, Agric. Syst., 200, 103437, https://doi.org/10.1016/j.agsy.2022.103437, 2022.
Hao, P., Di, L., Zhang, C., and Guo, L.: Transfer Learning for Crop classification with Cropland Data Layer data (CDL) as training samples, Sci. Total Environ., 733, 138869, https://doi.org/10.1016/j.scitotenv.2020.138869, 2020.
He, Y., Dong, J., Liao, X., Sun, L., Wang, Z., You, N., Li, Z., and Fu, P.: Examining rice distribution and cropping intensity in a mixed single-and double-cropping region in South China using all available Sentinel 1/2 images, Int. J. Appl. Earth Obs., 101, 102351, https://doi.org/10.1016/j.jag.2021.102351, 2021.
Hu, J., Chen, Y., Cai, Z., Wei, H., Zhang, X., Zhou, W., Wang, C., You, L., and Xu, B.: Mapping Diverse Paddy Rice Cropping Patterns in South China Using Harmonized Landsat and Sentinel-2 Data, Remote Sens., 15, 1034, https://doi.org/10.3390/rs15041034, 2023.
Huang, C., You, S., Liu, A., Li, P., Zhang, J., and Deng, J.: High-Resolution National-Scale Mapping of Paddy Rice Based on Sentinel-1/2 Data, Remote Sens., 15, 4055, https://doi.org/10.3390/rs15164055, 2023.
Huete, A., Justice, C., and Liu, H.: Development of vegetation and soil indices for MODIS-EOS, Remote Sens. Environ., 49, 224–234, 1994.
Huete, A., Liu, H., Batchily, K., and Van Leeuwen, W.: A comparison of vegetation indices over a global set of TM images for EOS-MODIS, Remote Sens. Environ., 59, 440–451, 1997.
Jo, H.-W. and Lee, W.-K.: Paddy Rice Maps South Korea (2017–2021), Zenodo [data set], https://doi.org/10.5281/zenodo.5845896, 2022.
Jo, H.-W., Park, E., Sitokonstantinou, V., Kim, J., Lee, S., Koukos, A., and Lee, W.-K.: Recurrent U-Net based dynamic paddy rice mapping in South Korea with enhanced data compatibility to support agricultural decision making, GIScience Remote Sens., 60, 2206539, https://doi.org/10.1080/15481603.2023.2206539, 2023.
Johnson, D. M. and Mueller, R.: The 2009 cropland data layer, Photogramm. Eng. Remote Sens, 76, 1201–1205, 2010.
Johnson, D. M. and Mueller, R.: Pre-and within-season crop type classification trained with archival land cover information, Remote Sens. Environ., 264, 112576, https://doi.org/10.1016/j.rse.2021.112576, 2021.
Laborte, A. G., Gutierrez, M. A., Balanza, J. G., Saito, K., Zwart, S. J., Boschetti, M., Murty, M. V. R., Villano, L., Aunario, J. K., Reinke, R., Koo, J., Hijmans, R. J., and Nelson, A.: RiceAtlas, a spatial database of global rice calendars and production, Sci. Data, 4, 170074, https://doi.org/10.1038/sdata.2017.74, 2017a.
Laborte, A. G., Gutierrez, M. A., Balanza, J. G., Saito, K., Zwart, S. J., Boschetti, M., Murty, M. V. R., Villano, L., Aunario, J. K., Reinke, R., Koo, J., Hijmans, R. J., and Nelson, A.: RiceAtlas, a spatial database of global rice calendars and production, Harvard Dataverse, V4 [data set], https://doi.org/10.7910/DVN/JE6R2R, 2017b.
Lin, C., Zhong, L., Song, X.-P., Dong, J., Lobell, D. B., and Jin, Z.: Early-and in-season crop type mapping without current-year ground truth: Generating labels from historical information via a topology-based approach, Remote Sens. Environ., 274, 112994, https://doi.org/10.1016/j.rse.2022.112994, 2022.
Luo, Y., Zhang, Z., Li, Z., Chen, Y., Zhang, L., Cao, J., and Tao, F.: Identifying the spatiotemporal changes of annual harvesting areas for three staple crops in China by integrating multi-data sources, Environ. Res. Lett., 15, 074003, https://doi.org/10.1088/1748-9326/ab80f0, 2020.
Merzlyak, M. N., Gitelson, A. A., Chivkunova, O. B., and Rakitin, V. Y.: Non-destructive optical detection of pigment changes during leaf senescence and fruit ripening, Physiol. Plant., 106, 135–141, 1999.
Mullissa, A., Vollrath, A., Odongo-Braun, C., Slagter, B., Balling, J., Gou, Y., Gorelick, N., and Reiche, J.: Sentinel-1 sar backscatter analysis ready data preparation in google earth engine, Remote Sens., 13, 1954, https://doi.org/10.3390/rs13101954, 2021.
Ni, R., Tian, J., Li, X., Yin, D., Li, J., Gong, H., Zhang, J., Zhu, L., and Wu, D.: An enhanced pixel-based phenological feature for accurate paddy rice mapping with Sentinel-2 imagery in Google Earth Engine, ISPRS J. Photogramm. Remote, 178, 282–296, https://doi.org/10.1016/j.isprsjprs.2021.06.018, 2021.
Pan, B., Zheng, Y., Shen, R., Ye, T., Zhao, W., Dong, J., Ma, H., and Yuan, W.: High Resolution Distribution Dataset of Double-Season Paddy Rice in China, Remote Sens., 13, 4609, https://doi.org/10.3390/rs13224609, 2021.
Pandžić, M., Pavlović, D., Matavulj, P., Brdar, S., Marko, O., Crnojević, V., and Kilibarda, M.: Interseasonal transfer learning for crop mapping using Sentinel-1 data, Int. J. Appl. Earth Obs., 128, 103718, https://doi.org/10.1016/j.jag.2024.103718, 2024.
Pasquarella, V. J., Brown, C. F., Czerwinski, W., and Rucklidge, W. J.: Comprehensive quality assessment of optical satellite imagery using weakly supervised video learning, 2023 IEEE/CVF Conference on Computer Vision and Pattern Recognition Workshops (CVPRW), 17–24 June 2023, Vancouver, BC, Canada, https://doi.org/10.1109/cvprw59228.2023.00206, 2023.
Shelestov, A., Lavreniuk, M., Kussul, N., Novikov, A., and Skakun, S.: Exploring Google Earth Engine platform for big data processing: Classification of multi-temporal satellite imagery for crop mapping, Front. Earth Sci., 5, 232994, https://doi.org/10.3389/feart.2017.00017, 2017.
Shen, R., Pan, B., Peng, Q., Dong, J., Chen, X., Zhang, X., Ye, T., Huang, J., and Yuan, W.: High-resolution distribution maps of single-season rice in China from 2017 to 2022, Earth Syst. Sci. Data, 15, 3203–3222, https://doi.org/10.5194/essd-15-3203-2023, 2023.
Song, M., Xu, L., Ge, J., Zhang, H., Zuo, L., Jiang, J., Ding, Y., Xie, Y., and Wu, F.: EARice10: A 10 m Resolution Annual Rice Distribution Map of East Asia for 2023, Zenodo [data set], https://doi.org/10.5281/zenodo.13118409, 2024.
Song, X.-P., Potapov, P. V., Krylov, A., King, L., Di Bella, C. M., Hudson, A., Khan, A., Adusei, B., Stehman, S. V., and Hansen, M. C.: National-scale soybean mapping and area estimation in the United States using medium resolution satellite imagery and field survey, Remote Sens. Environ., 190, 383–395, 2017.
Sun, C., Zhang, H., Xu, L., Ge, J., Jiang, J., Zuo, L., and Wang, C.: Twenty-meter annual paddy rice area map for mainland Southeast Asia using Sentinel-1 synthetic-aperture-radar data, Earth Syst. Sci. Data, 15, 1501–1520, https://doi.org/10.5194/essd-15-1501-2023, 2023.
Sun, L., Lou, Y., and Zhang, L.: Spatial domain transfer: Cross-regional paddy rice mapping with a few samples based on Sentinel-1 and Sentinel-2 data on GEE, Int. J. Appl. Earth Obs., 128, 103762, https://doi.org/10.1016/j.jag.2024.103762, 2024.
Tian, G., Li, H., Jiang, Q., Qiao, B., Li, N., Guo, Z., Zhao, J., and Yang, H.: An Automatic Method for Rice Mapping Based on Phenological Features with Sentinel-1 Time-Series Images, Remote Sens., 15, 2785, https://doi.org/10.3390/rs15112785, 2023.
Tucker, C. J.: Red and photographic infrared linear combinations for monitoring vegetation, Remote Sens. Environ., 8, 127–150, 1979.
Veloso, A., Mermoz, S., Bouvet, A., Le Toan, T., Planells, M., Dejoux, J.-F., and Ceschia, E.: Understanding the temporal behavior of crops using Sentinel-1 and Sentinel-2-like data for agricultural applications, Remote Sens. Environ., 199, 415–426, 2017.
Wang, G., Meng, D., Chen, R., Yang, G., Wang, L., Jin, H., Ge, X., and Feng, H.: Automatic Rice Early-Season Mapping Based on Simple Non-Iterative Clustering and Multi-Source Remote Sensing Images, Remote Sens., 16, 277, https://doi.org/10.3390/rs16020277, 2024.
Wei, J., Cui, Y., Luo, W., and Luo, Y.: Mapping Paddy Rice Distribution and Cropping Intensity in China from 2014 to 2019 with Landsat Images, Effective Flood Signals, and Google Earth Engine, Remote Sens., 14, 759, https://doi.org/10.3390/rs14030759, 2022.
Wei, S., Zhang, H., Wang, C., Wang, Y., and Xu, L.: Multi-temporal SAR data large-scale crop mapping based on U-Net model, Remote Sens., 11, 68, https://doi.org/10.3390/rs11010068, 2019.
Wen, Y., Li, X., Mu, H., Zhong, L., Chen, H., Zeng, Y., Miao, S., Su, W., Gong, P., and Li, B.: Mapping corn dynamics using limited but representative samples with adaptive strategies, ISPRS J. Photogramm. Remote, 190, 252–266, 2022.
Wu, Q.: geemap: A Python package for interactive mapping with Google Earth Engine, J. Open Source Softw., 5, 2305, https://doi.org/10.21105/joss.02305, 2020.
Xiao, W., Xu, S., and He, T.: Mapping Paddy Rice with Sentinel-1/2 and Phenology-, Object-Based Algorithm – A Implementation in Hangjiahu Plain in China Using GEE Platform, Remote Sens., 13, 990, https://doi.org/10.3390/rs13050990, 2021.
Xiao, X., Hollinger, D., Aber, J., Goltz, M., Davidson, E. A., Zhang, Q., and Moore III, B.: Satellite-based modeling of gross primary production in an evergreen needleleaf forest, Remote Sens. Environ., 89, 519–534, 2004.
Xiao, X., Boles, S., Liu, J., Zhuang, D., Frolking, S., Li, C., Salas, W., and Moore, B.: Mapping paddy rice agriculture in southern China using multi-temporal MODIS images, Remote Sens. Environ., 95, 480–492, https://doi.org/10.1016/j.rse.2004.12.009, 2005a.
Xiao, X., Boles, S., Liu, J., Zhuang, D., Frolking, S., Li, C., Salas, W., and Moore III, B.: Mapping paddy rice agriculture in southern China using multi-temporal MODIS images, Remote Sens. Environ., 95, 480–492, https://doi.org/10.1016/j.rse.2004.12.009, 2005b.
Xiao, X., Boles, S., Frolking, S., Li, C., Babu, J. Y., Salas, W., and Moore III, B.: Mapping paddy rice agriculture in South and Southeast Asia using multi-temporal MODIS images, Remote Sens. Environ., 100, 95–113, https://doi.org/10.1016/j.rse.2005.10.004, 2006.
Xu, J., Zhu, Y., Zhong, R., Lin, Z., Xu, J., Jiang, H., Huang, J., Li, H., and Lin, T.: DeepCropMapping: A multi-temporal deep learning approach with improved spatial generalizability for dynamic corn and soybean mapping, Remote Sens. Environ., 247, 111946, https://doi.org/10.1016/j.rse.2020.111946, 2020.
Xu, L., Zhang, H., Wang, C., Wei, S., Zhang, B., Wu, F., and Tang, Y.: Paddy Rice Mapping in Thailand Using Time-Series Sentinel-1 Data and Deep Learning Model, Remote Sens., 13, 3994, https://doi.org/10.3390/rs13193994, 2021.
Xu, S., Zhu, X., Chen, J., Zhu, X., Duan, M., Qiu, B., Wan, L., Tan, X., Xu, Y. N., and Cao, R.: A robust index to extract paddy fields in cloudy regions from SAR time series, Remote Sens. Environ., 285, 113374, https://doi.org/10.1016/j.rse.2022.113374, 2023.
Yang, L., Huang, R., Zhang, J., Huang, J., Wang, L., Dong, J., and Shao, J.: Inter-Continental Transfer of Pre-Trained Deep Learning Rice Mapping Model and Its Generalization Ability, Remote Sens., 15, 2443, https://doi.org/10.3390/rs15092443, 2023.
You, N., Dong, J., Huang, J., Du, G., Zhang, G., He, Y., Yang, T., Di, Y., and Xiao, X.: The 10-m crop type maps in Northeast China during 2017–2019, Sci. Data, 8, 41, https://doi.org/10.1038/s41597-021-00827-9, 2021.
Yu, Z., Di, L., Shrestha, S., Zhang, C., Guo, L., Qamar, F., and Mayer, T. J.: RiceMapEngine: A Google Earth Engine-Based Web Application for Fast Paddy Rice Mapping, IEEE J. Sel. Top. Appl. Earth Obs., 16, 7264–7275, https://doi.org/10.1109/jstars.2023.3290677, 2023.
Zhan, P., Zhu, W., and Li, N.: An automated rice mapping method based on flooding signals in synthetic aperture radar time series, Remote Sens. Environ., 252, 112112, https://doi.org/10.1016/j.rse.2020.112112, 2021.
Zhang, C., Zhang, H., and Tian, S.: Phenology-assisted supervised paddy rice mapping with the Landsat imagery on Google Earth Engine: Experiments in Heilongjiang Province of China from 1990 to 2020, Computers and Electronics in Agriculture, 212, 108105, https://doi.org/10.1016/j.compag.2023.108105, 2023a.
Zhang, C., Zhang, H., and Tian, S.: Phenology-assisted supervised paddy rice mapping with the Landsat imagery on Google Earth Engine: Experiments in Heilongjiang Province of China from 1990 to 2020, Computers and Electronics in Agriculture, 212, 108105, https://doi.org/10.1016/j.compag.2023.108105, 2023b.
Zhang, H., He, B., and Xing, J.: Mapping Paddy Rice in Complex Landscapes with Landsat Time Series Data and Superpixel-Based Deep Learning Method, Remote Sens., 14, 3721, https://doi.org/10.3390/rs14153721, 2022a.
Zhang, K., Chen, Y., Zhang, B., Hu, J., and Wang, W.: A Multitemporal Mountain Rice Identification and Extraction Method Based on the Optimal Feature Combination and Machine Learning, Remote Sens., 14, 5096, https://doi.org/10.3390/rs14205096, 2022b.
Zhang, X., Wu, B., Ponce-Campos, G. E., Zhang, M., Chang, S., and Tian, F.: Mapping up-to-Date Paddy Rice Extent at 10 M Resolution in China through the Integration of Optical and Synthetic Aperture Radar Images, Remote Sens., 10, 1200, https://doi.org/10.3390/rs10081200, 2018.
Zhao, R., Li, Y., Chen, J., Ma, M., Fan, L., and Lu, W.: Mapping a Paddy Rice Area in a Cloudy and Rainy Region Using Spatiotemporal Data Fusion and a Phenology-Based Algorithm, Remote Sens., 13, 4400, https://doi.org/10.3390/rs13214400, 2021.
Zhi, F., Dong, Z., Guga, S., Bao, Y., Han, A., Zhang, J., and Bao, Y.: Rapid and Automated Mapping of Crop Type in Jilin Province Using Historical Crop Labels and the Google Earth Engine, Remote Sens., 14, 4028, https://doi.org/10.3390/rs14164028, 2022.
Zhu, W., Peng, X., Ding, M., Li, L., Liu, Y., Liu, W., Yang, M., Chen, X., Cai, J., Huang, H., Dong, Y., and Lu, J.: Decline in Planting Areas of Double-Season Rice by Half in Southern China over the Last Two Decades, Remote Sens., 16, 440, https://doi.org/10.3390/rs16030440, 2024.