the Creative Commons Attribution 4.0 License.
the Creative Commons Attribution 4.0 License.
 | 21 Oct 2025
Pollen-based reconstruction of spatially-explicit vegetation cover over the Tibetan Plateau since the last deglaciation
Pengchao Zhang
Yi Luo
Xiaoyi Wang
Tao Wang
Spatiotemporally contiguous paleo-vegetation reconstructions are essential for studying climate-vegetation interactions, providing critical data for paleoclimate modeling, and refining past land cover in Earth System Models (ESMs) and scenarios of anthropogenic land-cover changes (ALCCs). Here, we present the first spatiotemporally contiguous paleo-vegetation cover dataset for the Tibetan Plateau, spanning from the last deglaciation (16 ka) to the preindustrial era. This dataset was achieved using two sets of random forest (RF) models: one focused on temporal reconstructions (RF-temporal) and the other on spatial reconstructions (RF-spatial). RF-temporal reconstructs temporal trends from 61 fossil pollen records across the Tibetan Plateau, while RF-spatial interpolates site-based cover, producing a dataset with a spatial resolution of 0.5°×0.5° and a temporal resolution of 400 years. The dataset provides estimates of vegetation cover, along with a 95 % confidence interval, for seven vegetation types (total vegetation, woody vegetation, herbaceous vegetation, coniferous forest, broadleaved forest, alpine steppe, and alpine meadow). To illustrate, we present the temporal trends and spatial distribution of vegetation cover for these vegetation types, comparing them with the vegetation cover used in ESMs. We further discuss the dataset's reliability, limitations, and applications, along with the discrepancies between our reconstructed results and those used in ESMs, highlighting possible reasons for these differences. This dataset presented here can be downloaded from https://doi.org/10.5281/zenodo.16908779 (Zhang, 2024).
- Article
(5348 KB) - Full-text XML
-
Supplement
(1708 KB) - BibTeX
- EndNote


Climate affects vegetation distribution and structure, while vegetation, in turn, influences climate through biogeophysical effects, including changing albedo (Alibakhshi et al., 2020), roughness (Thomas and Foken, 2007), and evapotranspiration (Yan et al., 2012), and biogeochemical effects, including changing greenhouse gases (CH4 and CO2) (Gui et al., 2024). Therefore, the spatiotemporal dynamics of vegetation cover serve as crucial boundary conditions driving global climate models (GCMs) and Earth system models (ESMs). Reconstructing the past spatiotemporal dynamics of vegetation cover not only aids in understanding the responses and feedbacks of vegetation to climate change but also provides foundational data for these models and anthropogenic land-cover changes (ALCCs) (e.g., KK10 and HYDE) (Githumbi et al., 2022; Li et al., 2023). Long-term vegetation cover data can be derived from paleo-vegetation records in stratigraphic sediments (e.g., fossil pollen) reconstructions and dynamic global vegetation models (DGVMs) simulations.
Fossil pollen, as a direct proxy for past vegetation, has been widely used to reconstruct paleo-vegetation cover. Early methods for reconstructing vegetation changes used qualitative (Biomization) (Sun et al., 2020) and semi-quantitative methods (relative changes in different biomes) (Zhao et al., 2017). Subsequently, researchers employed the Landscape Reconstruction Algorithm (LRA), which corrects for the non-linear relationship between pollen abundance and vegetation cover, such as through the “Regional Estimates of VEgetation Abundance from Large Sites” (REVEALS) (Sugita, 2007), to quantitatively reconstruct vegetation cover changes. While REVEALS was mainly developed to estimate vegetation cover changes from fossil pollen deposited in large lakes (>50 ha), and from multiple small-sized sites (Marquer et al., 2017; Githumbi et al., 2022; Li et al., 2023). However, it is still challenging to obtain a spatio-temporally explicit estimate of vegetation cover changes. The outputs from REVEALS represent the proportion of different vegetation types within the vegetation area, and they still require correction using DGVMs' estimates of total vegetation cover or bare ground cover to obtain the actual cover of vegetation types (Strandberg et al., 2023). Although these outputs are useful for summarizing paleo-vegetation changes over time based on pollen assemblages, they are of limited utility when spatially continuous data or actual vegetation cover is required.
The ESMs or DGVMs use mathematical representations of the physical, chemical, and biological principles to simulate how vegetation varies with climate and CO2 concentration (Braghiere et al., 2023; Chen et al., 2023). However, these models often do not activate dynamic vegetation processes but use prescribed vegetation cover. For example, in PMIP4 simulations, only one model activated vegetation dynamics, while other models used prescribed preindustrial vegetation cover, due to the lack of a comprehensive and reliable vegetation dataset during these paleo periods (Jungclaus et al., 2017; Kageyama et al., 2018). ESMs with vegetation dynamics could simulate potential vegetation distributions corresponding to paleoclimate, but the model outputs are often fraught with notorious uncertainties in paleoclimate variables (Brierley et al., 2020). Machine learning approaches such as the modern analogy technique (MAT) (Davis et al., 2024) have been increasingly used to reconstruct past vegetation dynamics from fossil pollen records at the biome level (e.g., Sobol et al., 2019; Lindgren et al., 2021). These machine learning methods (e.g., random forest, extreme gradient boosting, and k-nearest neighbor) do not require prior knowledge, can quickly learn relationships within data, and are adept at handling nonlinear relationships and high-dimensional data (Sobol et al., 2019; Lindgren et al., 2021).
The Tibetan Plateau is of particular interest as a global region where the westerlies and Asian monsoons converge, making it a climate-sensitive area with noticeable vegetation responses to climate change (Wang et al., 2021). Additionally, due to its unique geographical position, the plateau's terrestrial ecosystem plays a crucial role as an ecological security barrier (Chen et al., 2021; Wang et al., 2024). Even small changes in vegetation can have significant effects on local and broader Asian climates, potentially influencing other global climate-sensitive regions, such as the Arctic, through teleconnections (Tang et al., 2023, 2024). Understanding the response and feedback of plateau paleo-vegetation to climate change from the last Glaciation to the present can provide essential insights into potential vegetation changes under future climate scenarios (Zhao et al., 2015; McElwain, 2018; Nolan et al., 2018).
Here, we reconstructed spatiotemporally contiguous vegetation cover changes at a regional scale using machine learning algorithms. Specifically, we first used a temporally random-forest model (RF-temporal) to reconstruct the cover of different vegetation types from fossil pollens at the site level. We then employed a spatial RF model (RF-spatial) to obtain a spatially contiguous dataset. The generated dataset provided vegetation cover data for the Tibetan Plateau from the Last deglaciation (16 ka BP) to the present, with a temporal resolution of 400 years and a spatial resolution of 0.5°, covering different vegetation types (including vegetation, woody vegetation, herbaceous vegetation, coniferous forest, broadleaved forest, alpine steppe, and alpine meadow). This dataset will be expected to enhance our understanding of paleo-vegetation dynamics and their response to climate change on the Tibetan plateau. More importantly, this dataset could provide the vegetation boundary condition for ESMs that are used to simulate paleoclimate changes and resultant biogeochemical and biophysical impacts.
2.1 Fossil and modern pollen datasets
2.1.1 Fossil pollen datasets
The fossil pollen dataset was obtained from Cao et al. (2022a), including 65 records and 4395 samples with 143 harmonized pollen taxa. The age-depth model for each pollen record was reconstructed using Bayesian age-depth modeling and the IntCal09 radiocarbon calibration curve (detailed information about the standardized chronology is presented in Cao et al., 2013). We further filtered the dataset according to the following criteria to ensure data quality and an adequate site distribution: (1) each record had more than three chronological controls; (2) the duration of the record was more than 2000 years; (3) the sampling resolution was finer than 1000 years. We then followed the harmonized taxonomy table published by Herzschuh et al. (2022) to harmonize 245 pollen taxa into 125 taxa. The selected records (61 records and 4224 samples) are evenly distributed across the Tibetan Plateau (Fig. 1), and the number of samples increased from ∼20 during the deglaciation to ∼100 in the Late Holocene, meeting the requirements for reconstructing the past spatiotemporal patterns of vegetation on the Tibetan Plateau.
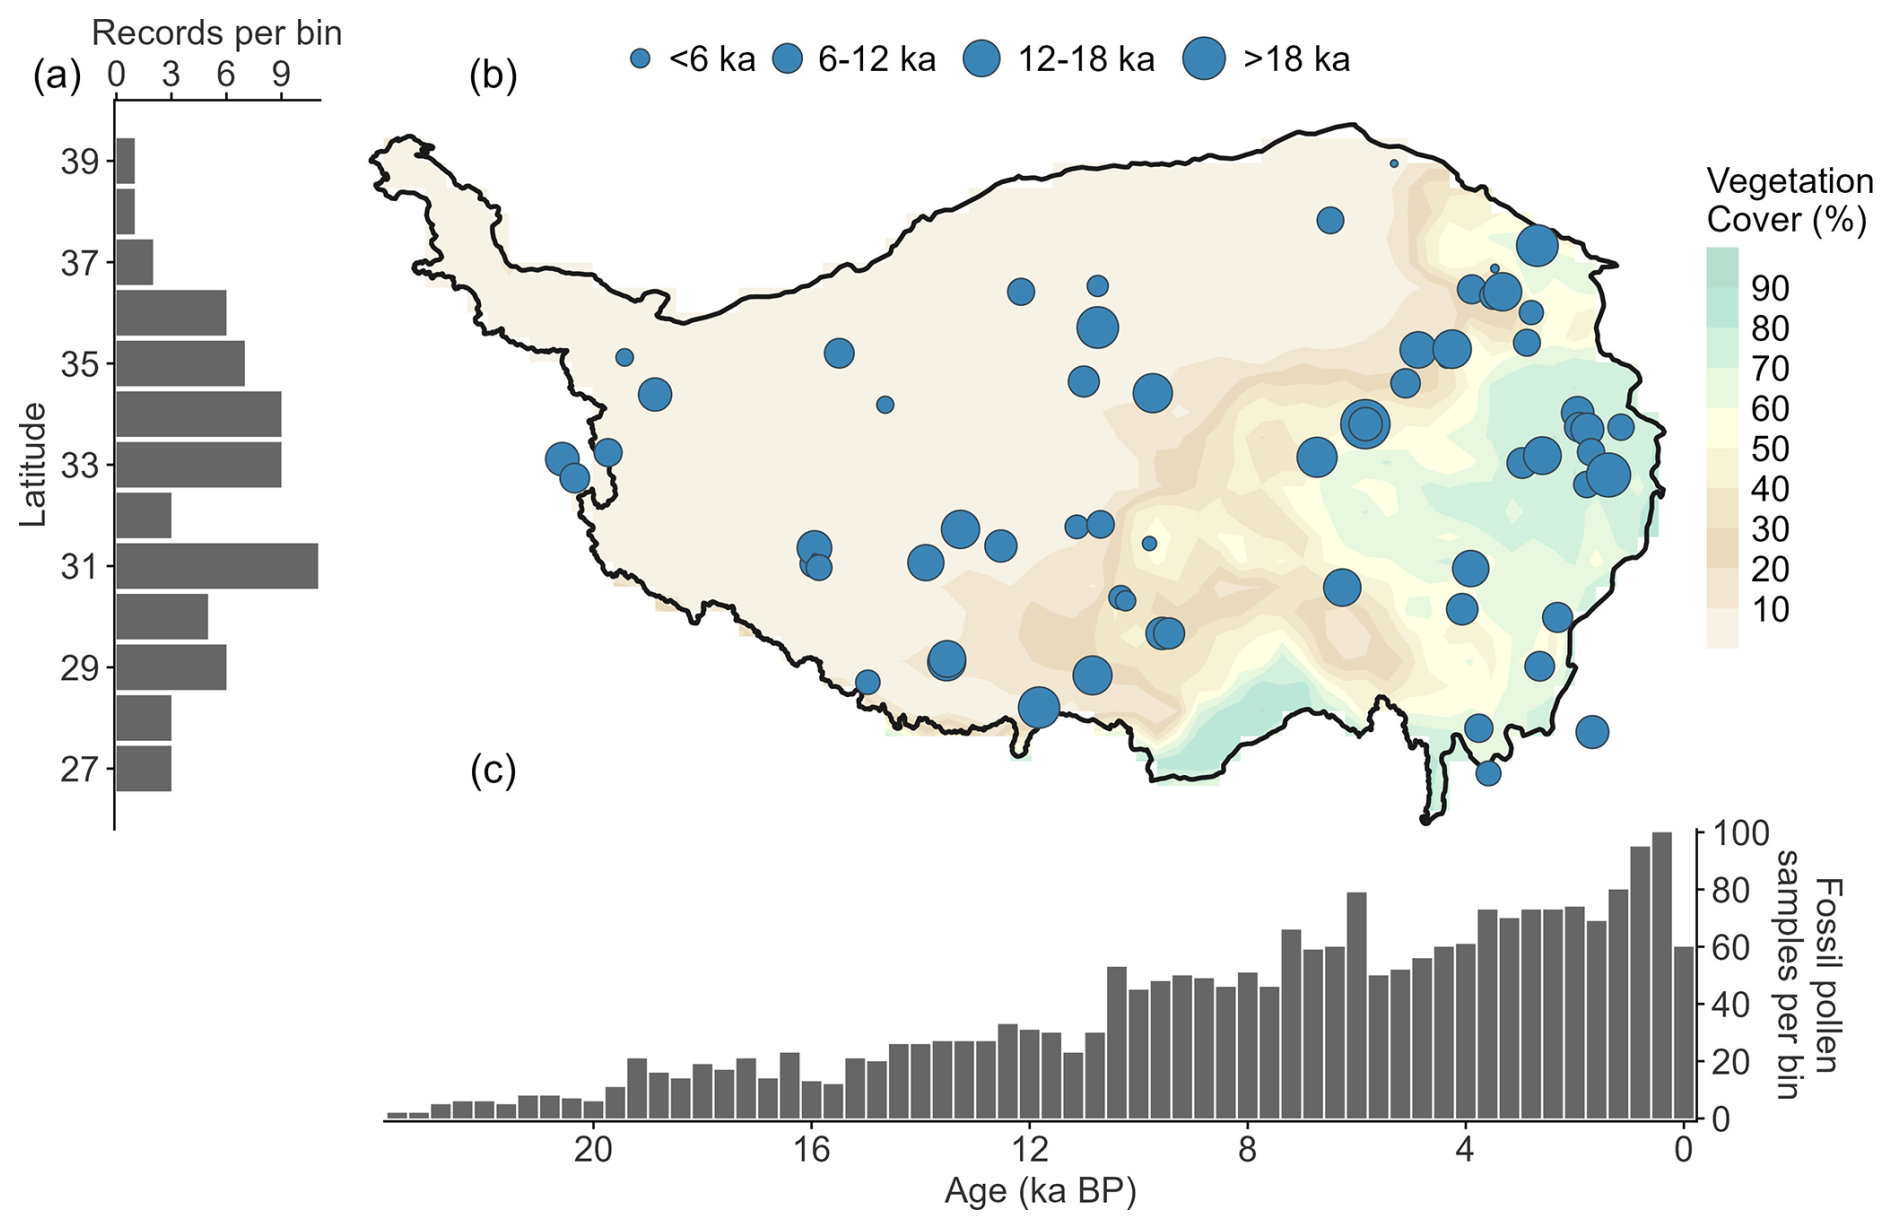
Figure 1Locations and temporal coverage of the fossil pollen records. (a) Latitudinal distribution of fossil pollen records, as well as their (b) site locations. (c) Temporal coverage of the fossil pollen samples, binned at 400-year intervals. Years before the present (ka BP) are relative to 1950 CE. The bubble diameter corresponds to the temporal coverage of each record.
2.1.2 Modern pollen datasets
To encompass as many scenarios as possible of different vegetation combinations under varying climate conditions within the stratigraphic fossil record (Wang et al., 2023), the modern pollen datasets were obtained from the “Modern pollen dataset for Asia” (Cao et al., 2022b). This dataset covers eastern and northern Asia, including 9772 pollen assemblages and 242 harmonized pollen taxa, which represent the diverse vegetation types across most of Asia (Fig. S1 in the Supplement). Although the dataset underwent rigorous quality control, we conducted an additional three-step preprocessing procedure to ensure the robustness of model construction. (1) To address potential duplicate records across datasets and the fact that modern lake-sediment surface pollen samples may derive from multiple samples of a single fossil pollen record collected after 1950 CE, we averaged the pollen percentages of samples sharing identical coordinates but differing in taxa composition (resulting in n=7832 sites after averaging). (2) To ensure accurate correspondence between modern pollen sites and true vegetation cover, we excluded sites with coordinates recorded only to the nearest degree (n=245; 3.1 % of all sites). (3) For consistency with the fossil pollen dataset, we first standardized the taxa names in this dataset using the same harmonized taxonomy table. We then selected taxa shared with the fossil pollen dataset and proportionally standardized their values to 100 %. In total, 7587 modern pollen assemblages – each corresponding to a unique coordinate – comprising 125 taxa were used for paleo-vegetation cover model construction. Furthermore, to assess the robustness of the dataset, we conducted a sensitivity test by introducing random perturbations to site coordinates. Specifically, we randomly selected 10 % of the pollen sites and applied random shifts within a range of 0 to 0.05° (∼5.6 km). The choice of 0.05° is reasonable, as coordinates derived from map-based estimates typically have an error of about ±2 km depending on latitude (Whitmore et al., 2005).
2.2 Vegetation cover data
2.2.1 Modern vegetation cover
Modern vegetation cover data were obtained from the Global Land Surface Satellite (GLASS) fractional vegetation cover products (http://www.glass.umd.edu/FVC/MODIS/500m/, last access: October 2024) (Jia et al., 2015). This dataset provides global vegetation cover data at a 500 m pixel resolution, with extensive validation from high-resolution satellite data and ground measurements demonstrating high accuracy (Liu et al., 2019). In this study, the average annual maximum vegetation cover from 2000 to 2020 was used to represent modern vegetation cover. For the 7587 modern pollen samples, circular buffers were applied, with a 5 km radius for surface soil samples and a 50 km radius for lake surface sediments. The average vegetation cover within each buffer was used to represent the cover associated with each pollen record. Since the modern pollen dataset does not distinguish land use at the site level, the Global Lakes and Wetlands Database: Lakes and Wetlands Grid (Level 3) (Lehner and Döll, 2004) was used to identify pollen originating from lake sources. Among the samples, 858 pollen records were from lakes and 6729 were from topsoil. To further differentiate vegetation cover by type, we used the MODIS Land Cover Type Product (MCD12Q1), which provides an annual Plant Functional Type (PFT) classification (DiMiceli et al., 2022). We grouped deciduous broadleaved and evergreen broadleaved forest as “broadleaved forest”, and grouped deciduous coniferous and evergreen coniferous forest as “coniferous forest”, due to their relatively small spatial extents on the Tibetan Plateau (<7 % and <1 %, respectively; Fig. S2). Furthermore, shrubs and trees were grouped as “woody”, rather than being shrubs as a separate vegetation type, as shrub distribution across the Tibetan Plateau accounts for less than 1 %.
The proportion of each vegetation type's area within the circular buffer of each modern pollen sample relative to the total vegetation area was calculated, and this proportion, multiplied by the total vegetation cover, provided the cover of each specific vegetation type (woody vegetation, herbaceous vegetation, broadleaved forest, and coniferous forest). To further distinguish alpine meadow and alpine steppe – two ecologically important herbaceous types in the region – we used the updated Vegetation Map of China (1:1 000 000) (Su et al., 2020) to determine their relative proportions within herbaceous vegetation areas, and then apportioned herbaceous cover accordingly. In total, we obtained the cover of seven vegetation types corresponding to the modern pollen samples: vegetation, woody vegetation, herbaceous vegetation, coniferous forest, broadleaved forest, alpine steppe, and alpine meadow.
2.2.2 Paleo-vegetation cover
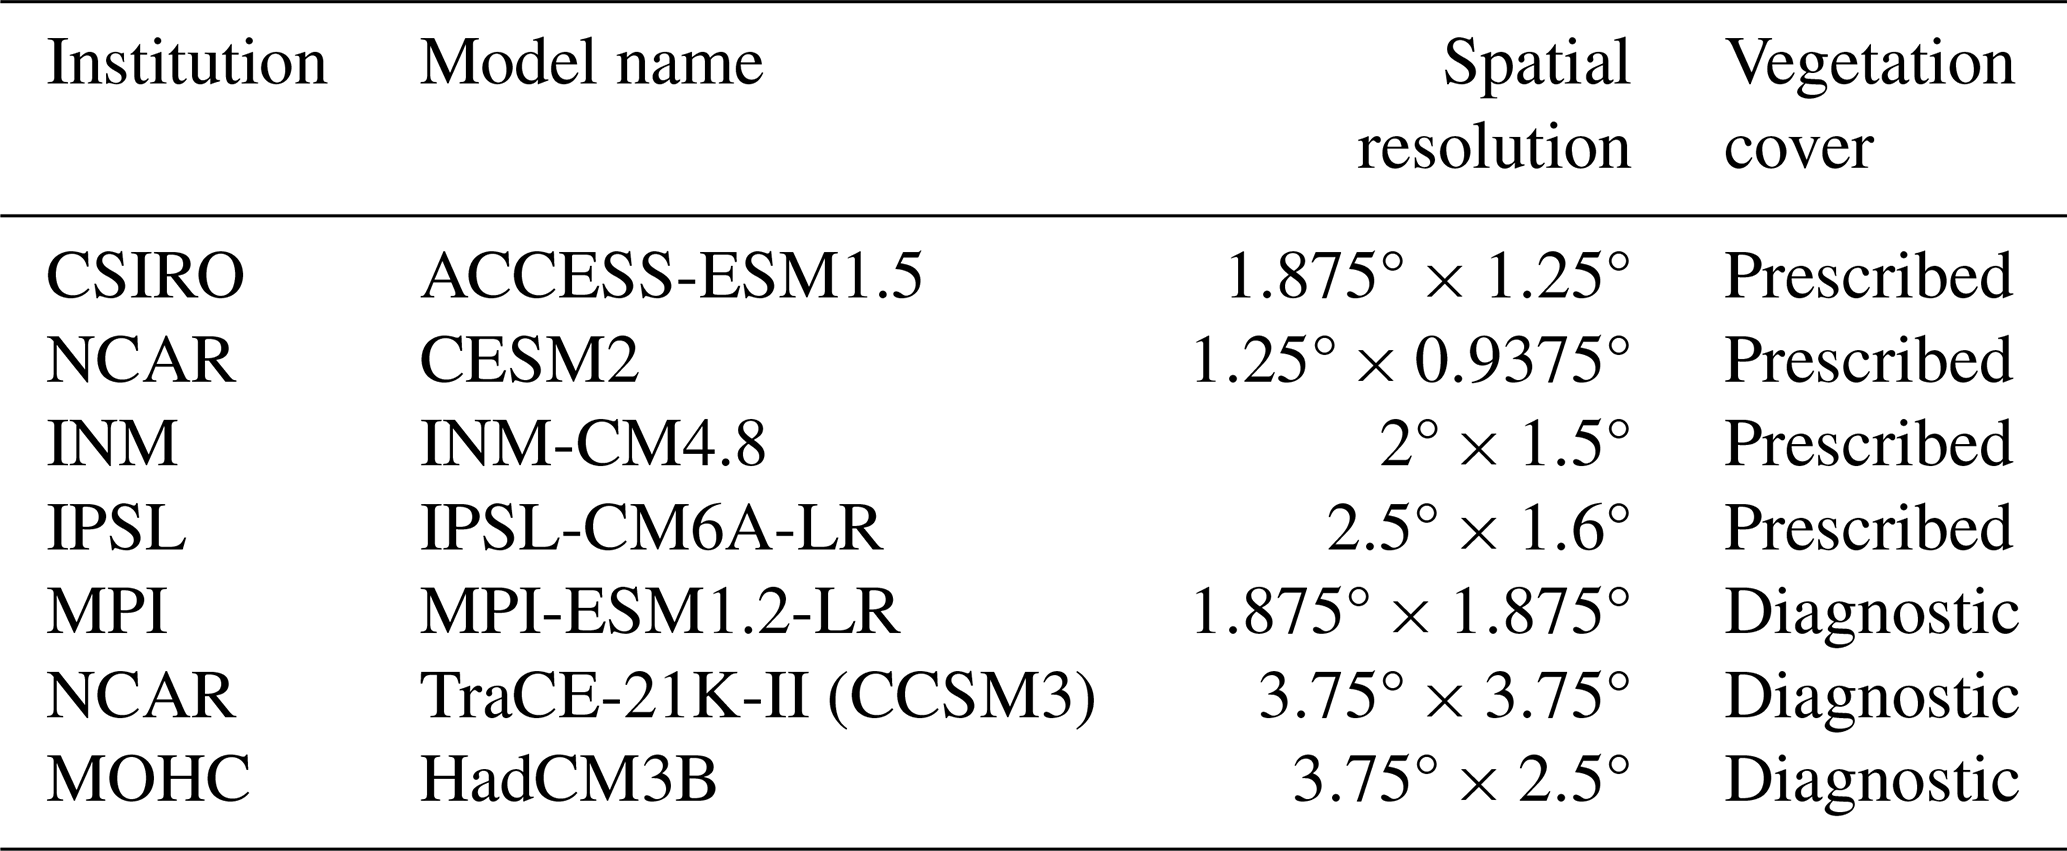
Paleo-vegetation cover derived from seven ESMs from the CMIP4 project (Kageyama et al., 2018), TraCE-21k-II (He and Clark, 2022), and HadCM3B (Hopcroft and Valdes, 2021), including models ACCESS-ESM1.5, CESM2, INM-CM4.8, IPSL-CM6A-LR, MPI-ESM1.2-LR, TraCE-21K-II (CCSM3), and HadCM3B (Table 1) are evaluated in this study. Among these, TraCE-21K-II (CCSM3) and HadCM3B are transient simulations with dynamic vegetation, while MPI-ESM1.2-LR is a snapshot simulation with dynamic vegetation. The remaining four models run with prescribed preindustrial vegetation cover due to the lack of a comprehensive and reliable global vegetation dataset (Otto-Bliesner et al., 2017). For comparison with the reconstruction results in this study, we also grouped all forest and shrub vegetation types in the models as woody and all grass vegetation types as herbaceous. All broadleaved forests were grouped as “broadleaved forest”, and all coniferous forests as “coniferous forest”, although INM-CM4.8 and MPI-ESM1.2-LR did not provide vegetation cover data at the forest-type level.
2.3 Paleoclimate data
Paleoclimate data were taken from the CHELSA TraCE21k database (Karger et al., 2023), which offers high spatial (30 arcsec) and temporal (centennial time slices) resolution. CHELSA TraCE21k uses a similar algorithm to CHELSA (Climatologies at High Resolution for Earth's Land Surface Areas) to process TraCE21k data, and it has been corrected using modern data. In this study, we resampled the spatial resolution to 0.5°×0.5° using bilinear interpolation and averaged the temporal resolution to 400 years, ensuring consistency in both spatial and temporal scales with pollen records.
2.4 Random forest
Random forest, as an advanced machine learning technique, is known for its high accuracy and efficiency in handling high-dimensional data, making it widely used in the field of ecology (Wang et al., 2023; Liu et al., 2024a). In this study, we employed two sets of random forest models. The first set of RF models (RF-temporal) was used to reconstruct the temporal trends of vegetation cover corresponding to fossil pollen. Based on these results, the second set of RF models (RF-spatial) predicted the spatial distribution of vegetation cover across the Tibetan Plateau by analyzing the spatial relationships between point-based vegetation cover, climate, and terrain data (Fig. 2).
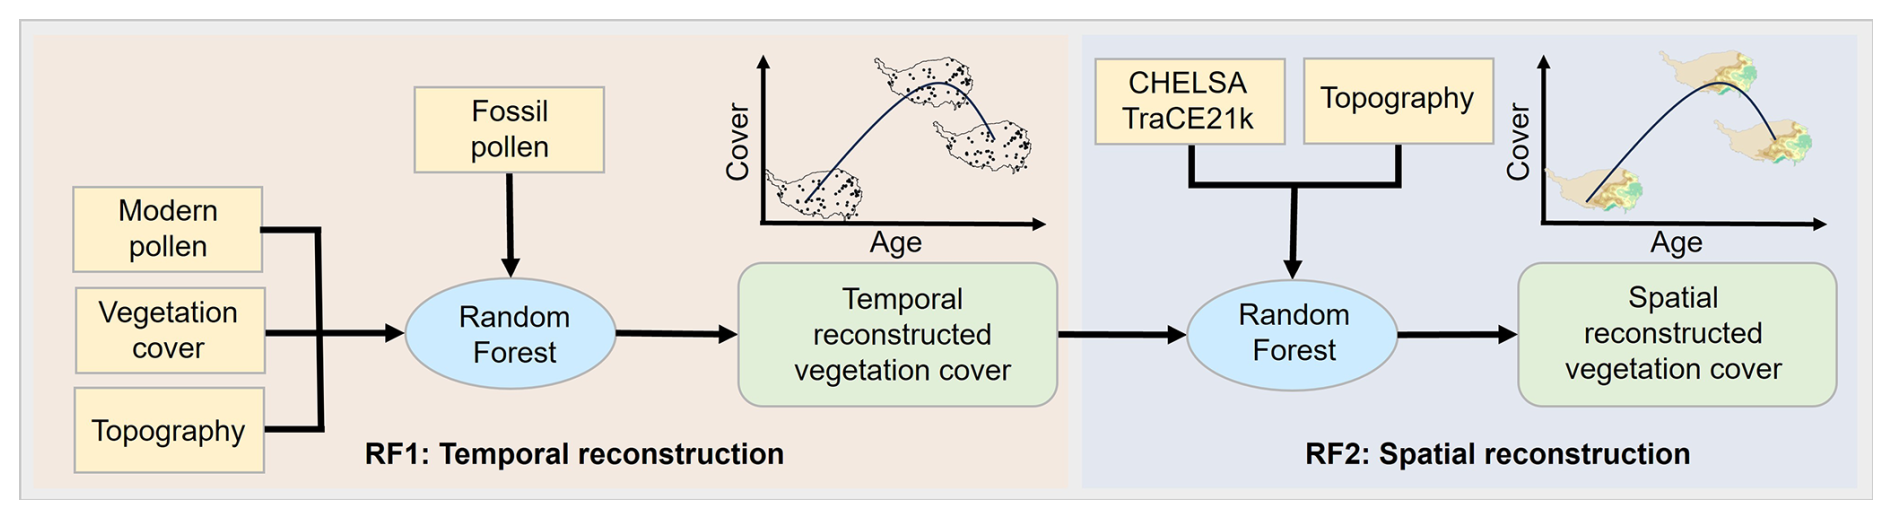
Figure 2Summary of major steps used in reconstructing vegetation cover using the random forest.
Specifically, in the first model, we used modern pollen percentages and terrain variables as predictors (Table S1), and the cover of different vegetation types as the response variable to predict the vegetation cover represented by fossil pollen at different periods. During the model-building process, we selected the model with the lowest error as the optimal model based on the coefficient of determination (R2) and root mean square error (RMSE) through ten-fold cross-validation. For the second set of models, RF-spatial models were constructed at 400-year bins from the last deglaciation to the present for each vegetation type. This 400-year resolution was determined based on the temporal resolution of the fossil pollen records (interquartile range: 180–360 years; Fig. S3), providing both high modeling accuracy (Fig. S4) and the capacity to capture vegetation responses to centennial-scale climatic events, such as the Younger Dryas and Bølling–Allerød periods (Fig. S5). The predictors included 55 climate variables and 8 terrain variables (Table S2), while the response variable was the vegetation cover at fossil pollen sites. Similar to the RF-temporal, after determining the optimal model, we ran the model 100 times to obtain confidence intervals of the spatial predictions. To address potential errors inherent in the RF model itself, we applied the classical Delta Method to perform bias correction using modern vegetation cover data (Beyer et al., 2020; Karger et al., 2023).
3.1 Paleochanges in vegetation cover over the Tibetan Plateau
By comparing MAT and five ML algorithms, we found that the random forest (RF) algorithm performed the best, achieving the highest goodness of fit and the lowest error (Fig. S6). Consequently, this study selected RF to reconstruct the spatiotemporal changes in vegetation cover across various vegetation types on the Tibetan Plateau over the past 16 000 years (see Method). The ten-fold cross-validation showed that the RF model achieved a high accuracy in the reconstruction of vegetation cover (Fig. 3). For temporal reconstruction of different vegetation types, the R2 values for total vegetation, woody vegetation, herbaceous vegetation, coniferous forest, broadleaved forest, alpine steppe, and alpine meadow cover were 0.79, 0.82, 0.65, 0.76, 0.68, 0.46, and 0.53, respectively. In spatial reconstruction, the R2 values for these types were 0.83, 0.64, 0.52, 0.51, 0.52, 0.32, and 0.38.
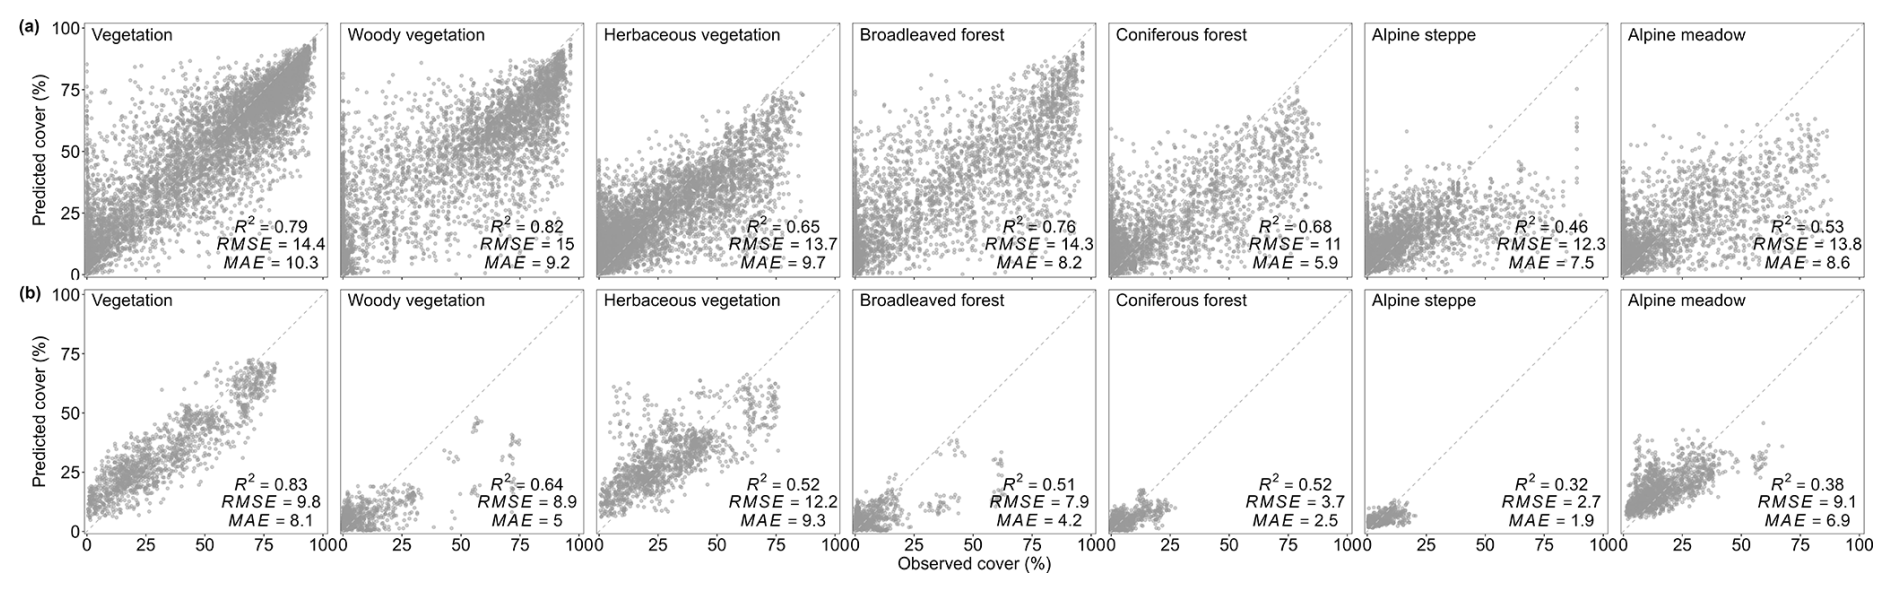
Figure 3Performance of the RF-temporal (a) and RF-spatial (b). Each panel presents the relationship between predicted versus trained vegetation cover values for each model based on 10-fold cross-validation. The dashed line represents the 1:1 line.
Based on the above-mentioned spatiotemporal model, we reconstructed the spatial-temporal changes in the different vegetation types at a temporal resolution of 400 years from the Last Deglaciation period (16 ka BP) to the present (see Methods). For total vegetation cover, the coverage over the past 16 ka BP varied by more than 8 %, approximately quarter of the present-day cover (23.6 % ± 2.3 %) (Fig. 4a). Throughout the past 16 000 years, total vegetation cover reached its lowest value (19.8 % ± 2.3 %) during the Last Deglaciation period (15 ka BP), gradually peaking (28.5 % ± 2.3 %) during the warmest period of the Mid-Holocene (∼8 ka BP), and then gradually declining toward the present-day (23.6 % ± 2.3 %).
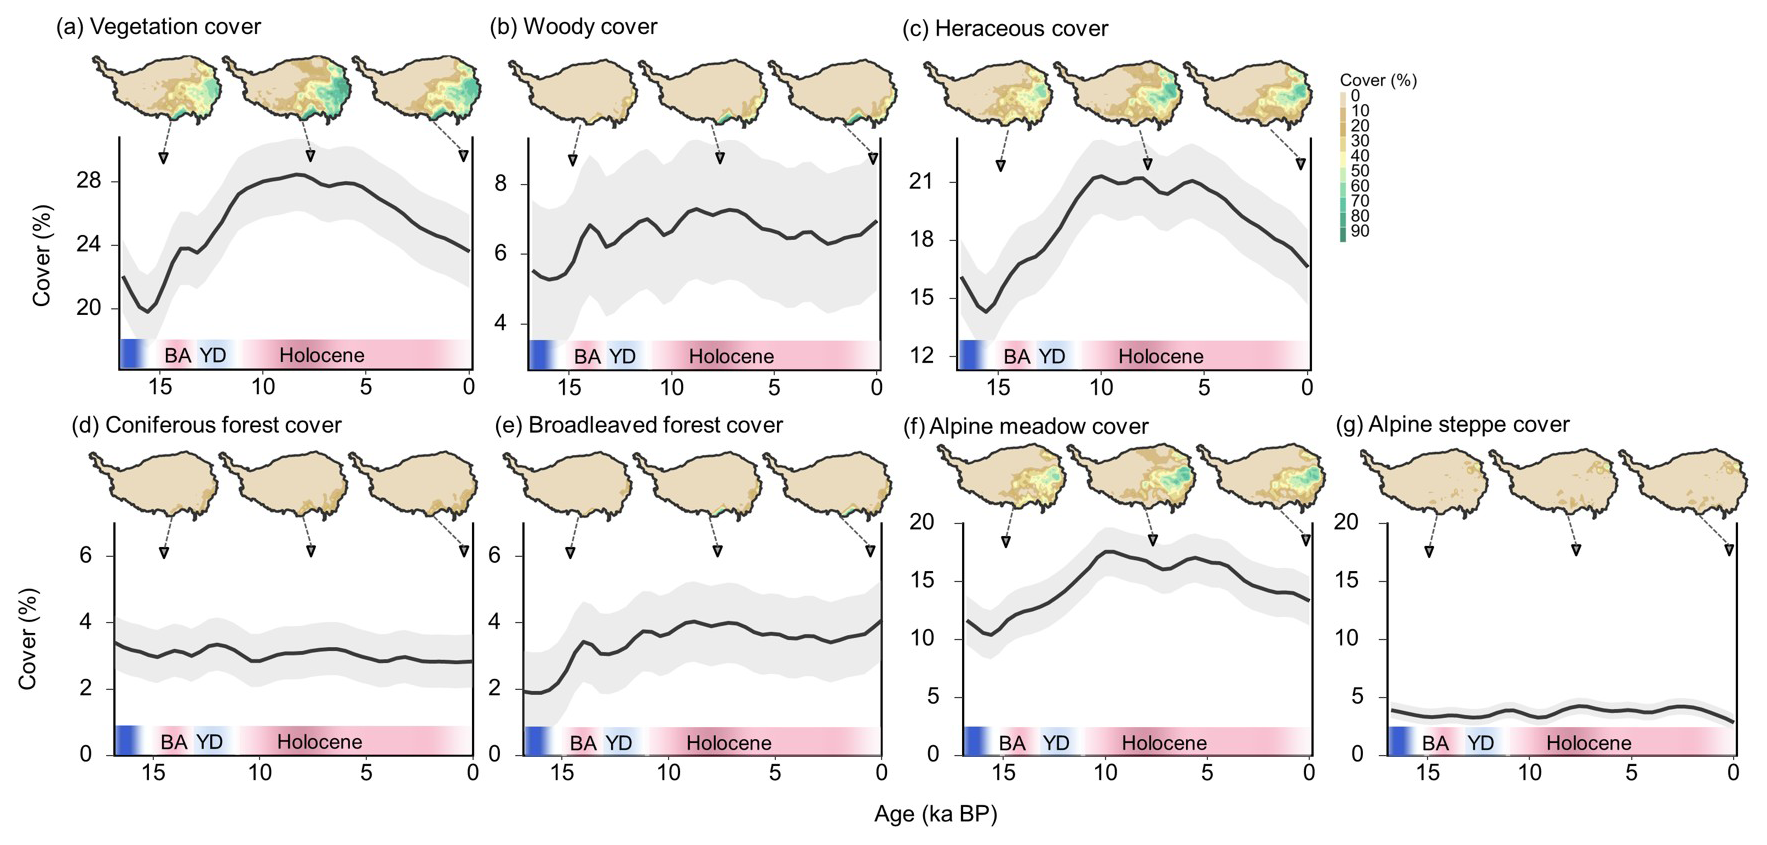
Figure 4Changes in vegetation cover on the Tibetan plateau since 16 ka BP (a–g). The solid lines represent the smoothed changes in vegetation cover using a cubic smoothing spline. The shading indicates the 95 % confidence interval. Shown at the top are spatial distributions of vegetation cover at 15.2, 7.6, and 0 ka BP.
Specifically, changes in vegetation cover reveal a distinct three-phase pattern that generally corresponds to climatic shifts. The first phase coincides with the Bølling–Allerød warm event (14.7–12.9 ka BP) when rapid warming of ∼1.5° within a millennium led to a 6 % rise in vegetation cover. This trend was interrupted by the Younger Dryas cold event (12.9–11.7 ka BP) when vegetation on the Tibetan Plateau was primarily concentrated in the southeastern region (Fig. S7). During the second phase, from the Early Holocene (11.7 ka BP) to the Mid-Holocene (8 ka BP), vegetation cover gradually increased, reaching its peak value (28.5 % ± 2.3 %), which is ∼5 % higher than the present (23.6 % ± 2.3 %). At this time, vegetation on the Tibetan Plateau expanded further from the southeast to the western and northern regions (Fig. S7). Throughout the third phase, from the Mid-Holocene (8 ka BP) to the preindustrial era, the climate experienced a period of steady cooling with fluctuating warm and cold phases, resulting in a gradual decrease in vegetation cover. During this period, the spatial distribution of vegetation on the Tibetan Plateau retreated from the north toward the southeast (Fig. S7).
For woody cover, the variation over the entire period from 16 ka BP to the present is 2 %, approximately a quarter of the present-day cover (7 % ± 2 %) (Fig. 4b). The temporal changes in woody vegetation cover reveal a distinct three-phase pattern. The first phase spans from the Last Deglaciation period (16 ka BP) to the Early Holocene (9 ka BP), during which woody vegetation cover rapidly increased, reaching its peak value (7.3 % ± 2 %), which is 0.3 % higher than the present (7 % ± 2 %). The response of woody cover to millennial-scale climate events (BA and YD) is pronounced. During this phase, forests expanded from the southernmost edge of the plateau to the southeastern margin. Throughout the second phase, from the Early Holocene (11 ka BP) until the Late Holocene (3 ka BP), woody cover experienced a steady decline, decreasing by approximately 1 % over the entire period. Spatially, although forests remained distributed along the southeastern margin, the overall area of distribution contracted compared to the Mid-Holocene. During the third phase, from the Late Holocene (3 ka BP) to the preindustrial era, woody cover exhibited a renewed upward trend, increasing by 1 % and bringing the present-day cover (7 % ± 2 %) close to its peak value (7.3 % ± 2 %). Changes in woody cover were primarily driven by coniferous forests, while broadleaved forests remained relatively stable at around 3 % ± 0.9 % over the past 16 000 years.
For herbaceous cover, the variation over the entire period is 7 %, approximately half of the present-day cover (16.6 % ± 2.2 %) (Fig. 4c). The temporal changes in herbaceous cover exhibit a three-phase pattern similar to that of vegetation cover: a rapid increase during the Last Deglaciation period (15–11 ka BP), steady fluctuations from the Early Holocene to the Mid-Holocene (6 ka BP), and a gradual decrease in the third phase (6–0 ka BP). Spatially, during the Deglaciation period, herbaceous vegetation was primarily distributed in the southeastern part of the plateau. By the Mid-Holocene, their distribution expanded eastward and northward, followed by a retreat back towards the southeast in the present day. Variations in herbaceous cover were predominantly driven by alpine meadow in the eastern Plateau, accounting for 80 % of the herbaceous area, while alpine steppe – primarily located in the southwest and northeast – maintained an average cover below 4 %.
3.2 The comparison of pollen-based reconstruction with model outputs
Compared to the reconstruction, most of the models have poor performance in capturing the spatial pattern of vegetation cover for the Mid-Holocene (6 ka BP). Only ACCESS-ESM1.5 and INM-CM4.8 generally capture this pattern (Fig. 5), with spatial correlations of 0.86 and 0.68, respectively. These two models have correctly simulated high vegetation cover in the southeastern TP and low vegetation cover in the northwestern TP. By contrast, other ESMs overestimate the spatial extent of vegetation cover, especially in the western TP, resulting in relatively low spatial correlations, ranging from 0.27 for HadCM3B to 0.61 for MPI-ESM1.2-LR.
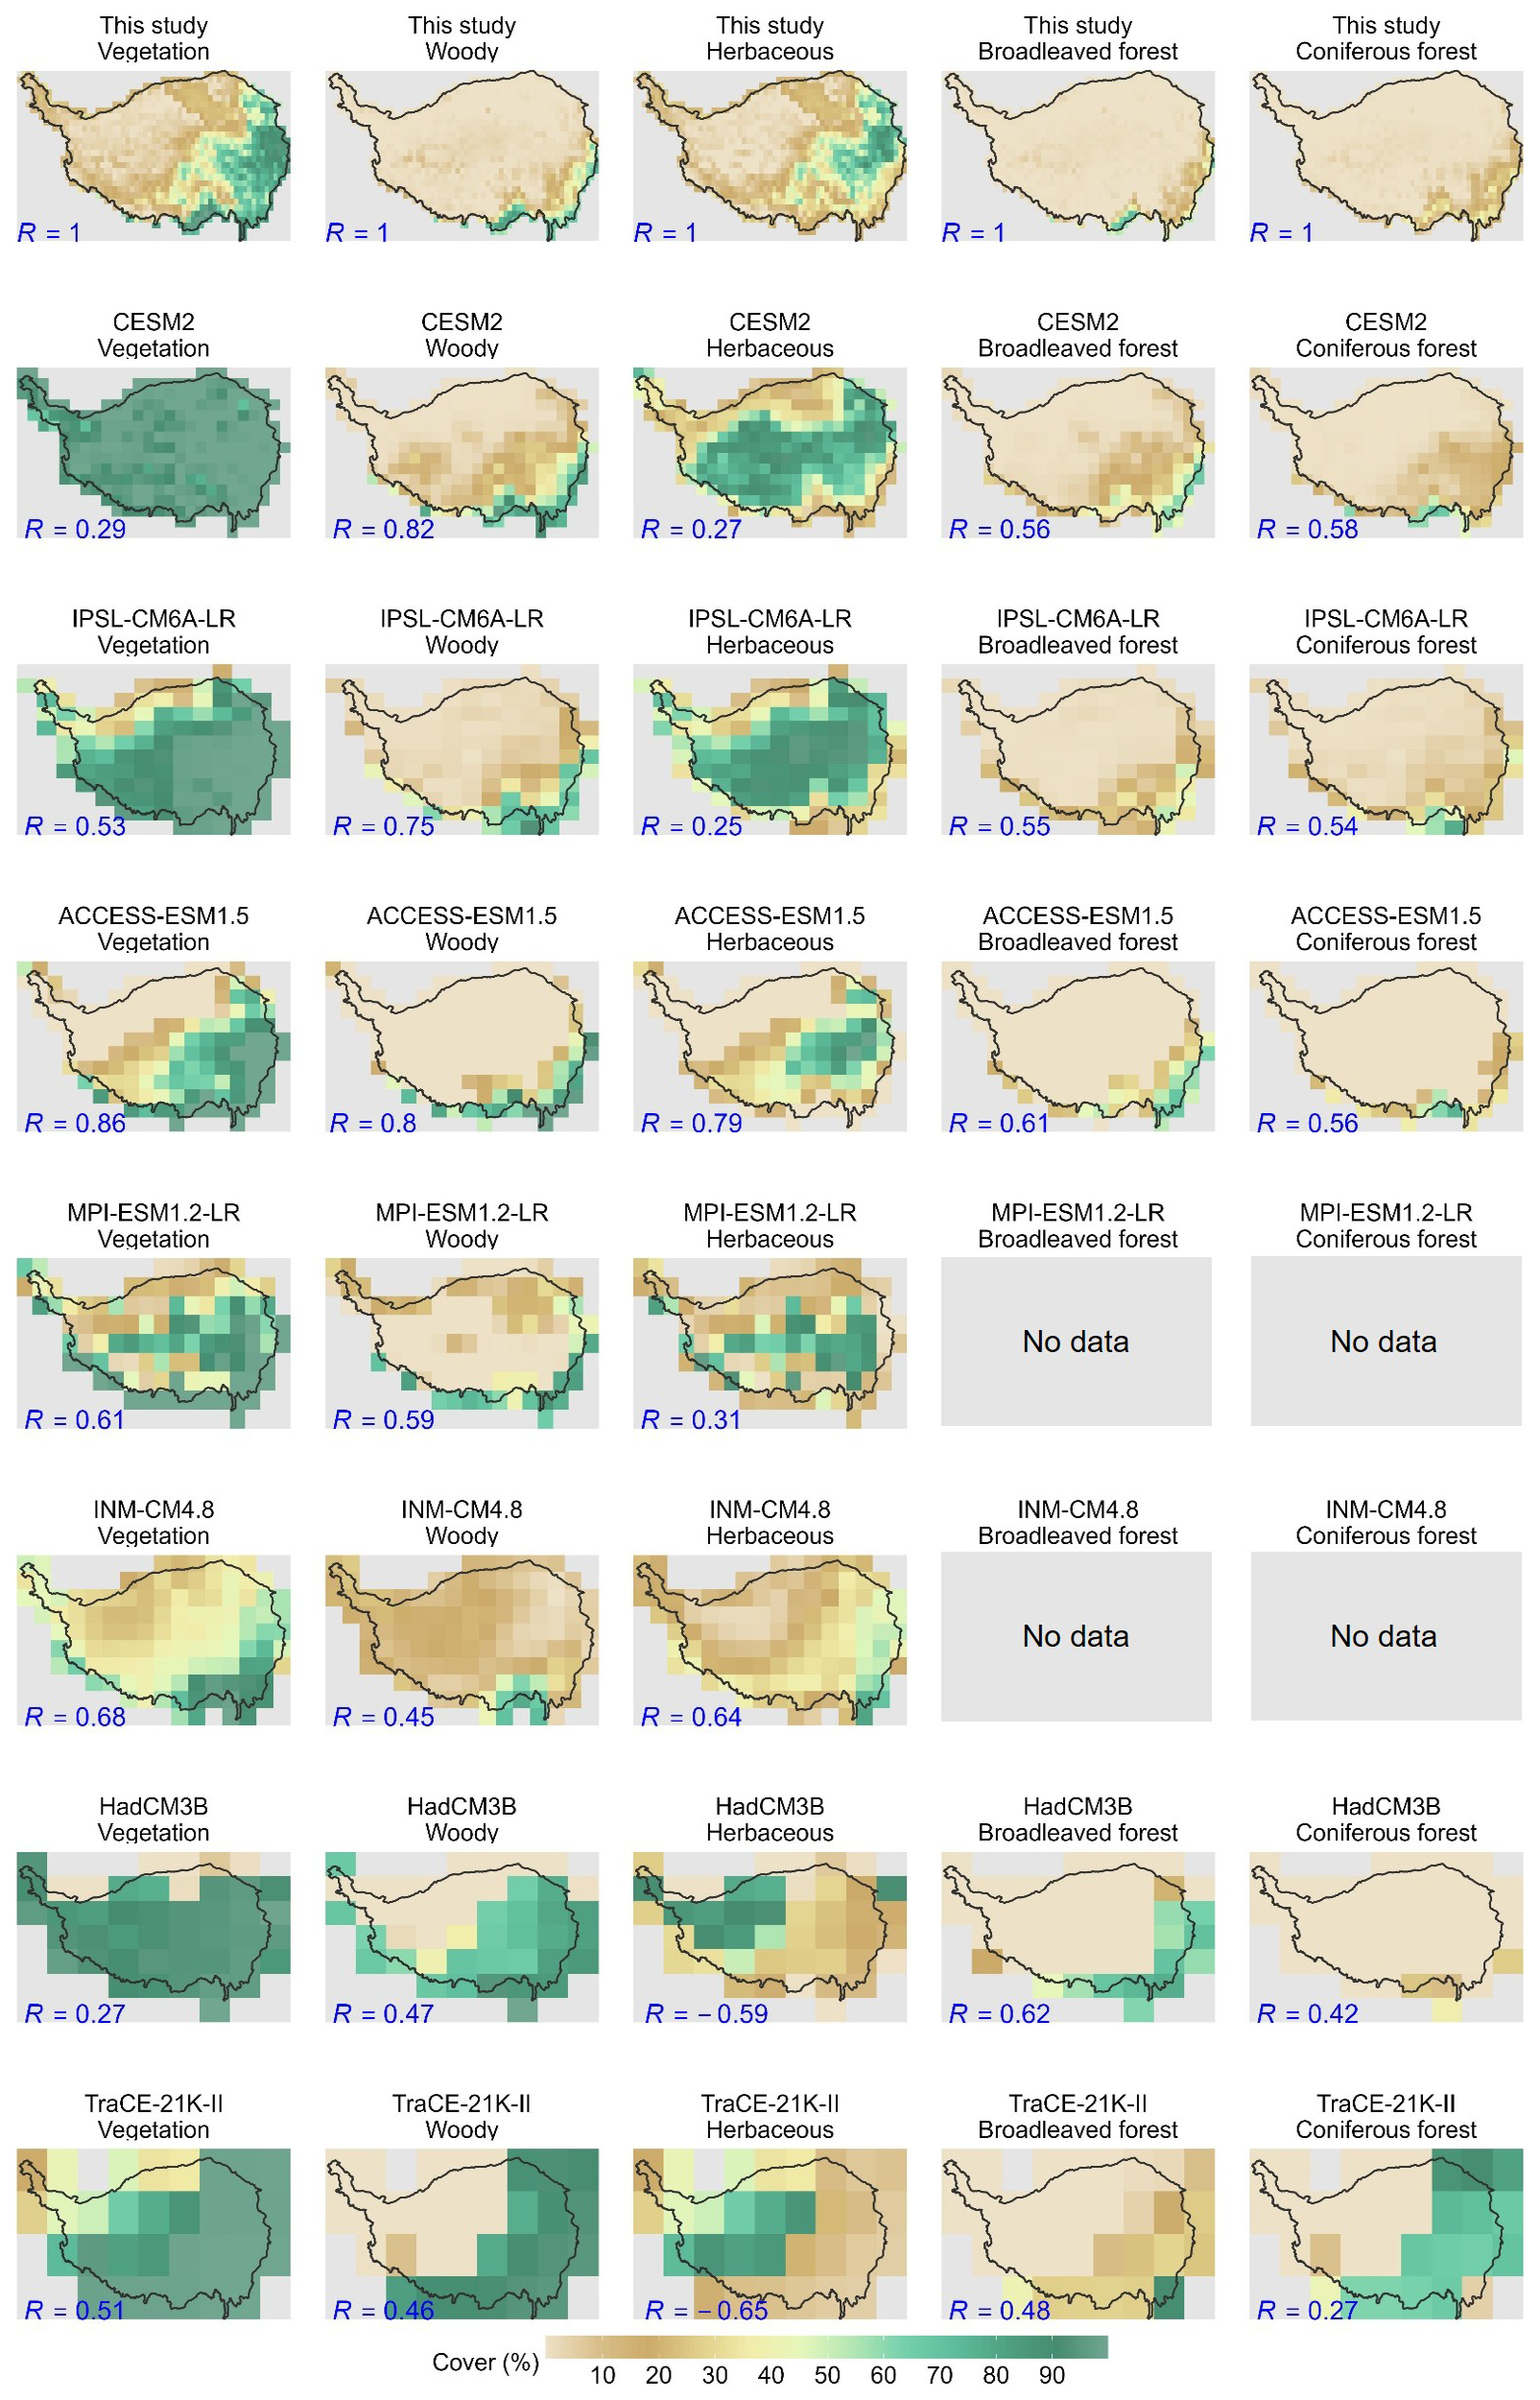
Figure 5Spatial distribution of vegetation cover from model-prescribed or simulations and the reconstructed dataset for the Mid-Holocene (6 ka BP). The numerical values in the lower left of each panel indicate the spatial correlation between the reconstructed data and model-prescribed or simulated cover.
In terms of vegetation types, most models can capture the spatial pattern of woody cover, with spatial correlations ranging from 0.45 (INM-CM4.8) to 0.82 (CESM2), with the woody cover mainly distributed along the southeastern edge of the plateau. Pollen-based reconstructions indicate that broadleaved forests are mainly confined to the southeastern Tibetan Plateau, whereas model simulations often suggest a more extensive spatial distribution, with spatial correlations between 0.48 (TraCE-21K-II) and 0.62 (HadCM3B). Coniferous forests exhibit a broader distribution in the southeastern Plateau, with spatial correlations ranging from 0.27 (TraCE-21K-II) to 0.58 (CESM2). By contrast, except for ACCESS-ESM1.5 and INM-CM4.8, there is a notorious bias in the simulation of herbaceous cover, with a spatial correlation coefficient ranging from −0.65 (TraCE-21K-II) to 0.31 (MPI-ESM1.2-LR). They failed to capture the pollen-based spatial pattern, with high cover in the east and low cover in the west. These models either simulated an opposite spatial pattern (e.g., TraCE-21K-II and HadCM3B), or a homogenized high cover across the entire plateau (e.g., CESM2 and IPSL-CM6A-LR). The model-data comparison suggested a general overestimation of the spatial extent of herbaceous cover, particularly in the western plateau. This model-data discrepancy primarily contributes to the total vegetation cover (Fig. S8).
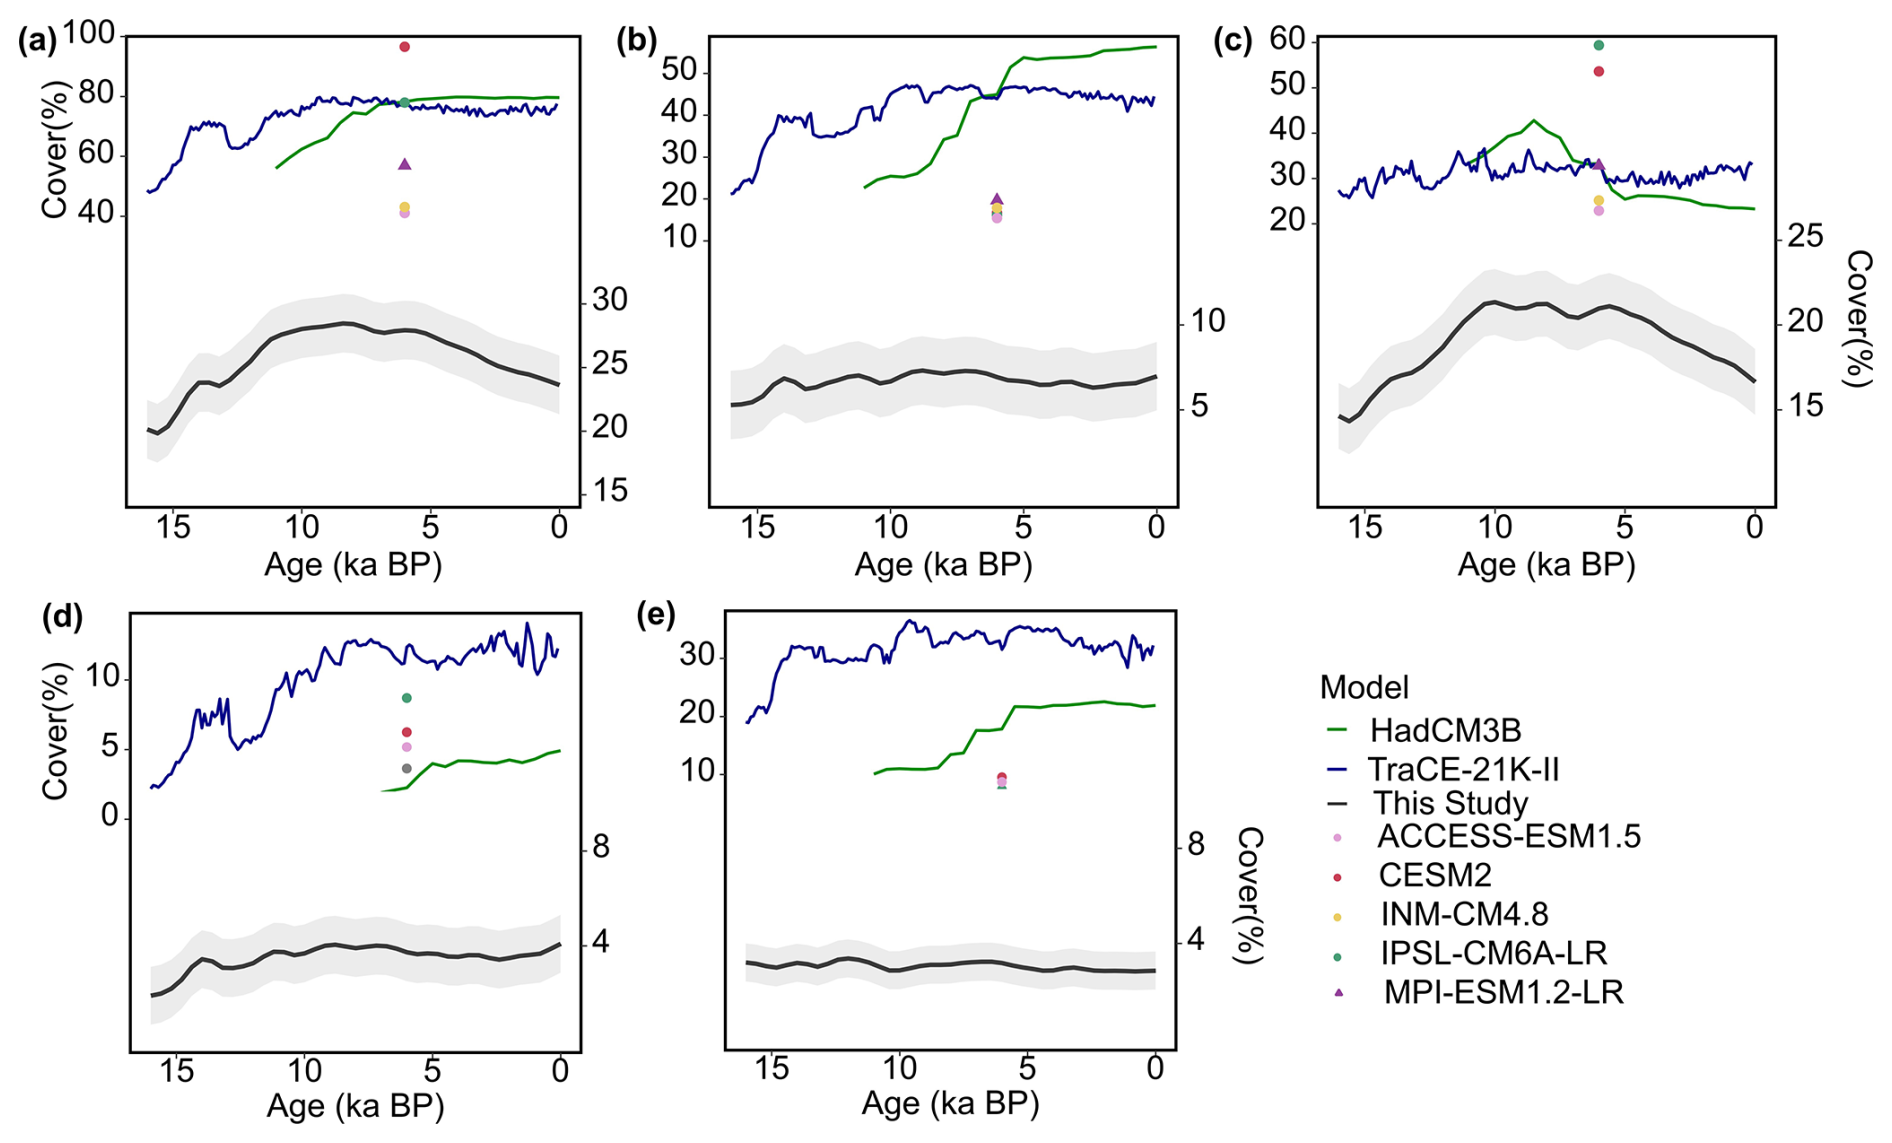
Figure 6Changes in vegetation cover of model-prescribed or simulations and reconstruction dataset since 16 ka BP. Total vegetation cover (a), Woody cover (b), herbaceous cover (c), broadleaved forest cover (d), and coniferous forest cover (e). Circular indicates models using prescribed preindustrial vegetation cover, whereas triangular indicates models with activated dynamic vegetation modeling. Transition simulations (TraCE-21K-II and HadCM3B) both use dynamic vegetation.
In terms of variations at the centennial timescale, the pollen-based reconstruction shows an increase from 16 to 8 ka BP, followed by a decline from 8 to 0 ka BP (Fig. 6). While the model simulations display differing temporal patterns. In HadCM3B, vegetation cover rises from 10 ka BP, reaching its peak at 6 ka BP, and then remains stable due to relatively steady woody and herbaceous cover. In contrast, TraCE-21k-II largely captures a similar temporal trend to that from pollen reconstruction, but the decline from 8 ka BP to the present is primarily driven by a decrease in woody cover, whereas the reduction in total vegetation cover from pollen-based reconstruction is mainly due to a decrease in herbaceous cover. In PMIP4, the model-prescribed vegetation cover for the Mid-Holocene exhibits significant variability, with vegetation cover across different models ranging from 41.3 % to 97 %. This substantial difference in vegetation cover between models primarily stems from herbaceous cover, which ranges from 25 % to 54 %, rather than woody cover, which ranges more narrowly from 16.7 % to 17.8 %.
4.1 Reliability of machine learning-based reconstruction of vegetation cover
Here we employed five machine learning methods and the Modern Analogy Technique (all models used default parameters) for reconstructing temporal trends. Among these, RF models achieved the highest R2 values and the lowest RMSE and MAE, followed by extreme gradient boosting, Modern Analogy Technique, k-nearest neighbor, gradient boosting machine, and support vector machines (Fig. S6), consistent with other studies (Hengl et al., 2018; Lindgren et al., 2021). This study suggested that the RF model is a superior method for reconstructing vegetation cover using pollen data.
We employed a comprehensive pollen dataset from the Tibetan Plateau to develop an RF-temporal model at the site level. This extensive modern surface pollen database across Asia spans the spatial climate gradient that could be large enough to encompass the temporal one recorded by fossil pollen assemblages (Fig. S9), giving us a relatively high level of confidence in the reconstruction of vegetation cover at the site level. Sensitivity tests introducing random perturbations to site coordinates demonstrated that vegetation cover reconstructions from perturbed coordinates were highly consistent with the original dataset (R2=1; Fig. S10). In addition, the inclusion of topographic variables in developing the RF-temporal model could significantly improve the predictive accuracy at the site level (Fig. S11).
By extrapolating vegetation cover from the site level to the spatial scale, we first develop an individual RF-spatial model for each 400-year time bin and use gridded climate and topographic data from paleoclimatic simulations to obtain spatially continuous vegetation cover within each time bin. The 400-year resolution was selected as an optimal balance between model accuracy and the temporal granularity required to capture rapid vegetation changes. On one hand, fossil pollen datasets exhibit a median temporal resolution of 220 years and a 75th percentile of 360 years (Fig. S2), indicating that increasing the time bin beyond 400 years yields minimal gains in sample size for RF-spatial model reconstruction (Fig. S12). On the other hand, coarser resolutions risk overlooking vegetation responses to centennial-scale climatic events, such as the Younger Dryas and Bølling–Allerød periods (Fig. S5).
We found that ESMs generally performed much better in capturing spatial variation in paleoclimatic variables than their temporal variability. The notorious model errors in the temporal variability of paleoclimatic variables would not greatly affect our reconstruction within each time bin, since we only use the spatial pattern of paleoclimate variables in spatial interpolation. This statement was further confirmed by our perturbation tests. Specifically, within each 400-year bin, we developed 20 sets of spatial RF models by using the fossil pollen data within this bin as the response variable and randomly selecting paleoclimate data from other bins as drivers. These perturbation results were generally consistent with the original results (Fig. S13), suggesting that the temporal variability in gridded climate data would not affect the temporal variability in our reconstruction.
4.2 Uncertainty of machine learning-based vegetation cover
Although data-driven machine learning methods provide a less parameter-intensive approach to reconstructing paleo-vegetation, they still rely on the assumption that the relationship between pollen assemblages and vegetation cover, extracted from modern observations, has remained consistent over time. Consequently, the robustness of our reconstruction ultimately depends on the quality of the input datasets, including pollen percentage data and vegetation cover derived from remote sensing observations.
Pollen datasets, compiled from diverse studies with varying objectives and methods, inevitably contain inconsistencies in sampling, taxonomic identification, and age control. We implemented rigorous quality-control procedures, including duplicate removal, correction of inaccurate coordinates, taxonomic standardization, and filtering for higher temporal resolution and reliable chronologies. Nonetheless, unavoidable uncertainties remain due to environmental contamination and the absence of standardized pollen processing and identification protocols. Furthermore, pollen samples could potentially be corrupted by anthropogenic disturbances, such as land use, agricultural practices, and the introduction of exotic plants (Cronin et al., 2017; Sobol et al., 2019; Zhang et al., 2025).
To link modern pollen assemblages with vegetation cover, we employed the MCD12Q1 land cover product in conjunction with the GLASS vegetation cover dataset to estimate the cover of different plant functional types. While these satellite-based reanalysis datasets are robust at the global scale and are widely applied, they generally introduce larger uncertainties than field observations or region-specific vegetation maps. Such acceptable but non-negligible errors inevitably affect the precision of paleovegetation reconstructions. In addition, although the majority of modern pollen samples used in this study were collected after the 2000s, some were obtained in the 1980s and 1990s. The vegetation represented by these earlier samples may have shifted under contemporary climate change, particularly given the rapid warming observed in recent decades.
The accuracy of both pollen- and remote-sensing-based vegetation classifications imposes constraints on the vegetation classification scheme of our reconstruction. Pollen identification, relying primarily on exine morphology, is typically limited to the genus or family level, making it difficult to distinguish functional ecological traits such as evergreen versus deciduous. For example, evergreen and deciduous species of Quercus display only minor morphological differences in their pollen and are therefore generally grouped as “Quercus-type pollen” (Peñuelas et al., 2009), with finer distinctions requiring additional evidence such as macrofossils (Liu et al., 2007). This limitation is compounded by the relatively coarse spatial resolution of MODIS data, which is suitable for regions with simple land cover types but often yields low classification accuracy in areas with more complex vegetation (Zeng et al., 2016). As a result, we did not separate evergreen and deciduous forests from broadleaved and coniferous forests. Additionally, all existing global land cover datasets consistently indicate that shrub cover on the Tibetan Plateau is minimal, generally less than 2 % (Yang et al., 2017). Accordingly, shrubs were not treated as a separate class but instead merged with trees under the broader category of woody vegetation. The absence of a more detailed vegetation classification scheme constrains the applications of this paleovegetation dataset in climate, carbon cycle, and biodiversity studies, particularly when differences among vegetation types are of primary interest.
Additionally, the RF models tend to overestimate low values and underestimate high values (Wang et al., 2023; Liu et al., 2024a). The spatially uneven distribution of surface pollen samples would exacerbate this problem. In addition, the long-distance transport of arboreal pollen from forested regions at lower altitudes may lead to an overestimate of vegetation cover in receptor regions (Wang et al., 2023). An alternative solution is to create mock records (Hengl et al., 2018; Lindgren et al., 2021). For instance, fossil pollen records are inherently sparse in barren regions (e.g., alpine glaciers and the deserts of the Tarim Basin), while we could assume that these areas have been devoid of vegetation during certain periods. Adding sample points across these unvegetated regions would enhance model performance in the prediction of vegetation cover. Moreover, incorporating records of past desert regions from other paleo-evidence beyond pollen could further improve accuracy (Davis et al., 2024).
Coupling data-driven and process-based approaches offers a promising avenue toward higher-quality paleovegetation reconstructions. Process-based models such as REVEALS provide taxon-specific cover estimates by accounting for pollen productivity and dispersal, while data-driven approaches provide actual vegetation cover to refine these taxon-based reconstructions. Such integration not only strengthens the robustness and credibility of the datasets through cross-validation of independent methods but also provides taxon-level reconstructions that allow the tracing of species' migrations, expansions, and contractions in response to climatic transitions.
4.3 Applications of a spatio-temporally explicit estimate of vegetation cover
Here we reconstruct the first spatiotemporally continuous vegetation cover dataset using random forest. The spatiotemporally continuous vegetation cover datasets provide a millennial-scale perspective on how vegetation responds and adapts to paleoclimatic change on the one hand (Xu et al., 2023; Dziomber et al., 2024). On the other hand, by analyzing the woody-to-herbaceous ratio in our reconstruction, we could potentially reveal how westerlies and Asian monsoons evolved over the Tibetan Plateau since the LGM (Sun et al., 2017). In addition, the vegetation cover presented in this dataset is a result of impacts from both paleoclimatic change and prehistoric human activities. By comparing pollen-based reconstruction to pure climate change-induced changes in vegetation cover (e.g., ESMs results), we could identify the onset and magnitude of human activities on the Tibetan Plateau (Strandberg et al., 2023).
Second, the comparison of our reconstruction with vegetation cover in ESMs over the Tibetan Plateau shows that the models generally overestimate vegetation-related variables, which is linked to inaccurate parameterization of soil moisture dynamics (Yang et al., 2020; Song et al., 2021; Kang et al., 2022). Such overestimation would introduce a significant bias into simulations of surface radiation balance, water, energy, and carbon cycles (Alibakhshi et al., 2020; Gui et al., 2024). For instance, models generally overestimate vegetation cover in the western plateau, which suggests that models have a lower-than-expected surface albedo and then a notable climate bias. Evidence is mounting that surface darkening over the Tibetan plateau could enhance Asian monsoon systems (Tang et al., 2023). The lower-than-expected albedo in models could then introduce a bias into simulations of atmospheric circulation and precipitation patterns over Asian regions (Tang et al., 2023). Prescribing our spatio-temporally explicit map in ESMs could help realistically capture the biophysical and biogeochemical impacts of vegetation cover changes on paleoclimatic change.
The construction methods and spatiotemporal resolution of this dataset necessitate several considerations in its application: (1) the magnitude of modern vegetation cover datasets directly influences the magnitude of reconstructed vegetation cover, while their spatial heterogeneity shapes the temporal variability of reconstructed sequences. However, substantial discrepancies exist among vegetation cover datasets owing to differences in data sources, processing methods, and classification systems (Liu et al., 2024b; Xu et al., 2024). Therefore, when comparing paleovegetation reconstructions derived from different modern vegetation cover datasets, these intrinsic differences must be carefully taken into account. (2) The spatiotemporal resolutions of 0.5°×0.5° and 400 years are appropriate for regional to continental-scale analyses and for examining long-term trends, but they are insufficient to resolve fine-scale ecological heterogeneity or capture decadal climatic fluctuations. (3) The classification of vegetation into seven types, while facilitating comparability with Earth System Models, does not fully capture the complexity of plant functional diversity or ensure direct equivalence with model-specific plant functional types.
Data are publicly accessible at Zenodo via the following link: https://doi.org/10.5281/zenodo.16908779 (Zhang, 2024). This link provides a detailed data summary along with instructions on variable definitions in the file and their usage, ensuring that readers can effectively utilize the dataset.
Here we integrate fossil pollen records, along with the relationship between modern pollen assemblages and vegetation cover, in a machine-learning approach to generate a spatio-temporally explicit map of vegetation cover (total vegetation, woody vegetation, herbaceous vegetation, coniferous forest, broadleaved forest, alpine steppe, and alpine meadow) for the Tibetan Plateau, spanning from the deglaciation period to the present, at a spatial resolution of 0.5° and a temporal resolution of 400 years. We discussed how different settings of random forest modeling affect reconstruction accuracy and demonstrated the robustness of our pollen-based reconstruction. In contrast to the previous pollen-based reconstruction at the site level over the Tibetan Plateau, we have produced the most spatially complete estimate by ingesting spatial information on climate variables. We demonstrated that the use of spatial information on paleoclimatic data in producing the temporal evolution of regional vegetation cover would not be affected by notorious uncertainties in the temporal evolution of paleoclimatic variables. Our machine learning-based vegetation cover dataset can be used to understand how vegetation responds and adapts to paleoclimatic change. Moreover, this vegetation data can also be fed into the Earth system models for quantifying the “true” feedback of vegetation cover changes on paleoclimatic change.
The supplement related to this article is available online at https://doi.org/10.5194/essd-17-5557-2025-supplement.
PC conceived the idea for the study and developed the concept together with TW. PC performed the data analysis and wrote the manuscript, with major contributions provided by TW. All the authors contributed to the discussions and paper revision.
The contact author has declared that none of the authors has any competing interests.
Publisher's note: Copernicus Publications remains neutral with regard to jurisdictional claims made in the text, published maps, institutional affiliations, or any other geographical representation in this paper. While Copernicus Publications makes every effort to include appropriate place names, the final responsibility lies with the authors. Views expressed in the text are those of the authors and do not necessarily reflect the views of the publisher.
The authors would like to thank the topic editor, Hangin Tian, and the two anonymous referees for their constructive comments, which have greatly improved our study and manuscript. We also acknowledge all the ESSD staff who contributed to this work, including Kirsten Elger, Polina Shvedko, Lorena Grabowski, Mario Ebel, Katja Gänger, Luigi Vigil, and Janina Schulz.
This research has been supported by the National Key Research and Development Project of China (grant no. 2024YFF0809104) and the National Natural Science Foundation of China (grant no. 42425106).
This paper was edited by Hanqin Tian and reviewed by Hanqin Tian and two anonymous referees.
Alibakhshi, S., Naimi, B., Hovi, A., Crowther, T. W., and Rautiainen, M.: Quantitative analysis of the links between forest structure and land surface albedo on a global scale, Remote Sens. Environ., 246, 111854, https://doi.org/10.1016/j.rse.2020.111854, 2020.
Beyer, R. M., Krapp, M., and Manica, A.: High-resolution terrestrial climate, bioclimate and vegetation for the last 120,000 years, Sci. Data, 7, 236, https://doi.org/10.1038/s41597-020-0552-1, 2020.
Braghiere, R. K., Fisher, J. B., Miner, K. R., Miller, C. E., Worden, J. R., Schimel, D. S., and Frankenberg, C.: Tipping point in North American Arctic-Boreal carbon sink persists in new generation Earth system models despite reduced uncertainty, Environ. Res. Lett., 18, 025008, https://doi.org/10.1088/1748-9326/acb226, 2023.
Brierley, C. M., Zhao, A., Harrison, S. P., Braconnot, P., Williams, C. J. R., Thornalley, D. J. R., Shi, X., Peterschmitt, J.-Y., Ohgaito, R., Kaufman, D. S., Kageyama, M., Hargreaves, J. C., Erb, M. P., Emile-Geay, J., D'Agostino, R., Chandan, D., Carré, M., Bartlein, P. J., Zheng, W., Zhang, Z., Zhang, Q., Yang, H., Volodin, E. M., Tomas, R. A., Routson, C., Peltier, W. R., Otto-Bliesner, B., Morozova, P. A., McKay, N. P., Lohmann, G., Legrande, A. N., Guo, C., Cao, J., Brady, E., Annan, J. D., and Abe-Ouchi, A.: Large-scale features and evaluation of the PMIP4-CMIP6 midHolocene simulations, Clim. Past, 16, 1847–1872, https://doi.org/10.5194/cp-16-1847-2020, 2020.
Cao, X., Ni, J., Herzschuh, U., Wang, Y., and Zhao, Y.: A late Quaternary pollen dataset from eastern continental Asia for vegetation and climate reconstructions: Set up and evaluation, Rev. Palaeobot. Palynol., 194, 21–37, https://doi.org/10.1016/j.revpalbo.2013.02.003, 2013.
Cao, X., Tian, F., Herzschuh, U., Ni, J., Xu, Q., Li, W., Zhang, Y., Luo, M., and Chen, F.: Human activities have reduced plant diversity in eastern China over the last two millennia, Global Change Biol., 28, 4962–4976, https://doi.org/10.1111/gcb.16274, 2022a.
Cao, X., Tian, F., Xu, Q., Ni, J., and Herzschuh, U.: Modern pollen dataset for Asia, National Tibetan Plateau/Third Pole Environment Data Center [data set], https://doi.org/10.11888/Paleoenv.tpdc.272378, 2022b.
Chen, F., Ding, L., Piao, S., Zhou, T., Xu, B., Yao, T., and Li, X.: The Tibetan Plateau as the engine for Asian environmental change: the Tibetan Plateau Earth system research into a new era, Sci. Bull., 66, 1263–1266, https://doi.org/10.1016/j.scib.2021.04.017, 2021.
Chen, M., Qian, Z., Boers, N., Jakeman, A. J., Kettner, A. J., Brandt, M., Kwan, M.-P., Batty, M., Li, W., Zhu, R., Luo, W., Ames, D. P., Barton, C. M., Cuddy, S. M., Koirala, S., Zhang, F., Ratti, C., Liu, J., Zhong, T., Liu, J., Wen, Y., Yue, S., Zhu, Z., Zhang, Z., Sun, Z., Lin, J., Ma, Z., He, Y., Xu, K., Zhang, C., Lin, H., and Lü, G.: Iterative integration of deep learning in hybrid Earth surface system modelling, Nat. Rev. Earth Environ., 4, 568–581, https://doi.org/10.1038/s43017-023-00452-7, 2023.
Cronin, K., Kaplan, H., Gaertner, M., Irlich, U. M., and Timm Hoffman, M.: Aliens in the nursery: assessing the attitudes of nursery managers to invasive species regulations, Biol. Invasions, 19, 925–937, https://doi.org/10.1007/s10530-016-1363-3, 2017.
Davis, B. A. S., Fasel, M., Kaplan, J. O., Russo, E., and Burke, A.: The climate and vegetation of Europe, northern Africa, and the Middle East during the Last Glacial Maximum (21 000 yr BP) based on pollen data, Clim. Past, 20, 1939–1988, https://doi.org/10.5194/cp-20-1939-2024, 2024.
DiMiceli, C., Sohlberg, R., and Townshend, J.: MODIS/Terra Vegetation Continuous Fields Yearly L3 Global 250 m SIN Grid V061, NASA, https://doi.org/10.5067/MODIS/MOD44B.061, 2022.
Dziomber, L., Gobet, E., Leunda, M., Gurtner, L., Vogel, H., Tournier, N., Damanik, A., Szidat, S., Tinner, W., and Schwörer, C.: Palaeoecological multiproxy reconstruction captures long-term climatic and anthropogenic impacts on vegetation dynamics in the Rhaetian Alps, Rev. Palaeobot. Palynol., 321, 105020, https://doi.org/10.1016/j.revpalbo.2023.105020, 2024.
Githumbi, E., Fyfe, R., Gaillard, M.-J., Trondman, A.-K., Mazier, F., Nielsen, A.-B., Poska, A., Sugita, S., Woodbridge, J., Azuara, J., Feurdean, A., Grindean, R., Lebreton, V., Marquer, L., Nebout-Combourieu, N., Stančikaitė, M., Tanţău, I., Tonkov, S., Shumilovskikh, L., and LandClimII data contributors: European pollen-based REVEALS land-cover reconstructions for the Holocene: methodology, mapping and potentials, Earth Syst. Sci. Data, 14, 1581–1619, https://doi.org/10.5194/essd-14-1581-2022, 2022.
Gui, Y., Wang, K., Jin, Z., Wang, H., Deng, H., Li, X., Tian, X., Wang, T., Chen, W., Wang, T., and Piao, S.: The decline in tropical land carbon sink drives high atmospheric CO2 growth rate in 2023, Natl. Sci. Rev., nwae365, https://doi.org/10.1093/nsr/nwae365, 2024.
He, F. and Clark, P. U.: Freshwater forcing of the Atlantic Meridional Overturning Circulation revisited, Nat. Clim. Change, 12, 449–454, https://doi.org/10.1038/s41558-022-01328-2, 2022.
Hengl, T., Walsh, M. G., Sanderman, J., Wheeler, I., Harrison, S. P., and Prentice, I. C.: Global mapping of potential natural vegetation: an assessment of machine learning algorithms for estimating land potential, Peer J., 6, e5457, https://doi.org/10.7717/peerj.5457, 2018.
Herzschuh, U., Li, C., Böhmer, T., Postl, A. K., Heim, B., Andreev, A. A., Cao, X., Wieczorek, M., and Ni, J.: LegacyPollen 1.0: a taxonomically harmonized global late Quaternary pollen dataset of 2831 records with standardized chronologies, Earth Syst. Sci. Data, 14, 3213–3227, https://doi.org/10.5194/essd-14-3213-2022, 2022.
Hopcroft, P. O. and Valdes, P. J.: Paleoclimate-conditioning reveals a North Africa land–atmosphere tipping point, P. Natl. Acad. Sci. USA, 118, e2108783118, https://doi.org/10.1073/pnas.2108783118, 2021.
Jia, K., Liang, S., Liu, S., Li, Y., Xiao, Z., Yao, Y., Jiang, B., Zhao, X., Wang, X., Xu, S., and Cui, J.: Global Land Surface Fractional Vegetation Cover Estimation Using General Regression Neural Networks From MODIS Surface Reflectance, IEEE T. Geosci. Remote, 53, 4787–4796, https://doi.org/10.1109/TGRS.2015.2409563, 2015.
Jungclaus, J. H., Bard, E., Baroni, M., Braconnot, P., Cao, J., Chini, L. P., Egorova, T., Evans, M., González-Rouco, J. F., Goosse, H., Hurtt, G. C., Joos, F., Kaplan, J. O., Khodri, M., Klein Goldewijk, K., Krivova, N., LeGrande, A. N., Lorenz, S. J., Luterbacher, J., Man, W., Maycock, A. C., Meinshausen, M., Moberg, A., Muscheler, R., Nehrbass-Ahles, C., Otto-Bliesner, B. I., Phipps, S. J., Pongratz, J., Rozanov, E., Schmidt, G. A., Schmidt, H., Schmutz, W., Schurer, A., Shapiro, A. I., Sigl, M., Smerdon, J. E., Solanki, S. K., Timmreck, C., Toohey, M., Usoskin, I. G., Wagner, S., Wu, C.-J., Yeo, K. L., Zanchettin, D., Zhang, Q., and Zorita, E.: The PMIP4 contribution to CMIP6 – Part 3: The last millennium, scientific objective, and experimental design for the PMIP4 past1000 simulations, Geosci. Model Dev., 10, 4005–4033, https://doi.org/10.5194/gmd-10-4005-2017, 2017.
Kageyama, M., Braconnot, P., Harrison, S. P., Haywood, A. M., Jungclaus, J. H., Otto-Bliesner, B. L., Peterschmitt, J.-Y., Abe-Ouchi, A., Albani, S., Bartlein, P. J., Brierley, C., Crucifix, M., Dolan, A., Fernandez-Donado, L., Fischer, H., Hopcroft, P. O., Ivanovic, R. F., Lambert, F., Lunt, D. J., Mahowald, N. M., Peltier, W. R., Phipps, S. J., Roche, D. M., Schmidt, G. A., Tarasov, L., Valdes, P. J., Zhang, Q., and Zhou, T.: The PMIP4 contribution to CMIP6 – Part 1: Overview and over-arching analysis plan, Geosci. Model Dev., 11, 1033–1057, https://doi.org/10.5194/gmd-11-1033-2018, 2018.
Kang, Z., Qiu, B., Xiang, Z., Liu, Y., Lin, Z., and Guo, W.: Improving Simulations of Vegetation Dynamics over the Tibetan Plateau: Role of Atmospheric Forcing Data and Spatial Resolution, Adv. Atmos. Sci., 39, 1115–1132, https://doi.org/10.1007/s00376-022-1426-6, 2022.
Karger, D. N., Nobis, M. P., Normand, S., Graham, C. H., and Zimmermann, N. E.: CHELSA-TraCE21k – high-resolution (1 km) downscaled transient temperature and precipitation data since the Last Glacial Maximum, Clim. Past, 19, 439–456, https://doi.org/10.5194/cp-19-439-2023, 2023.
Lehner, B. and Döll, P.: Development and validation of a global database of lakes, reservoirs and wetlands, J. Hydrol., 296, 1–22, https://doi.org/10.1016/j.jhydrol.2004.03.028, 2004.
Li, F., Gaillard, M.-J., Cao, X., Herzschuh, U., Sugita, S., Ni, J., Zhao, Y., An, C., Huang, X., Li, Y., Liu, H., Sun, A., and Yao, Y.: Gridded pollen-based Holocene regional plant cover in temperate and northern subtropical China suitable for climate modelling, Earth Syst. Sci. Data, 15, 95–112, https://doi.org/10.5194/essd-15-95-2023, 2023.
Lindgren, A., Lu, Z., Zhang, Q., and Hugelius, G.: Reconstructing Past Global Vegetation With Random Forest Machine Learning, Sacrificing the Dynamic Response for Robust Results, J. Adv. Model. Earth Syst., 13, e2020MS002200, https://doi.org/10.1029/2020MS002200, 2021.
Liu, (C.) Y.-S., Zetter, R., Ferguson, D. K., and Mohr, B. A. R.: Discriminating fossil evergreen and deciduous Quercus pollen: A case study from the Miocene of eastern China, Rev. Palaeobot. Palynol., 145, 289–303, https://doi.org/10.1016/j.revpalbo.2006.12.001, 2007.
Liu, D., Jia, K., Wei, X., Xia, M., Zhang, X., Yao, Y., Zhang, X., and Wang, B.: Spatiotemporal Comparison and Validation of Three Global-Scale Fractional Vegetation Cover Products, Remote Sens., 11, 2524, https://doi.org/10.3390/rs11212524, 2019.
Liu, L., Wang, N., Zhang, Y., Liang, J., Ni, J., and Cao, X.: Spatial and temporal variations of vegetation cover on the central and eastern Tibetan Plateau since the Last glacial period, Global Planet. Change, 104536, https://doi.org/10.1016/j.gloplacha.2024.104536, 2024a.
Liu, Y., Liu, R., Chen, J., Wei, X., Qi, L., and Zhao, L.: A global annual fractional tree cover dataset during 2000–2021 generated from realigned MODIS seasonal data, Sci. Data, 11, 832, https://doi.org/10.1038/s41597-024-03671-9, 2024b.
Marquer, L., Gaillard, M.-J., Sugita, S., Poska, A., Trondman, A.-K., Mazier, F., Nielsen, A. B., Fyfe, R. M., Jönsson, A. M., Smith, B., Kaplan, J. O., Alenius, T., Birks, H. J. B., Bjune, A. E., Christiansen, J., Dodson, J., Edwards, K. J., Giesecke, T., Herzschuh, U., Kangur, M., Koff, T., Latałowa, M., Lechterbeck, J., Olofsson, J., and Seppä, H.: Quantifying the effects of land use and climate on Holocene vegetation in Europe, Quaternary Sci. Rev., 171, 20–37, https://doi.org/10.1016/j.quascirev.2017.07.001, 2017.
McElwain, J. C.: Paleobotany and Global Change: Important Lessons for Species to Biomes from Vegetation Responses to Past Global Change, Annu. Rev. Plant Biol., 69, 761–787, https://doi.org/10.1146/annurev-arplant-042817-040405, 2018.
Nolan, C., Overpeck, J. T., Allen, J. R. M., Anderson, P. M., Betancourt, J. L., Binney, H. A., Brewer, S., Bush, M. B., Chase, B. M., Cheddadi, R., Djamali, M., Dodson, J., Edwards, M. E., Gosling, W. D., Haberle, S., Hotchkiss, S. C., Huntley, B., Ivory, S. J., Kershaw, A. P., Kim, S.-H., Latorre, C., Leydet, M., Lézine, A.-M., Liu, K.-B., Liu, Y., Lozhkin, A. V., McGlone, M. S., Marchant, R. A., Momohara, A., Moreno, P. I., Müller, S., Otto-Bliesner, B. L., Shen, C., Stevenson, J., Takahara, H., Tarasov, P. E., Tipton, J., Vincens, A., Weng, C., Xu, Q., Zheng, Z., and Jackson, S. T.: Past and future global transformation of terrestrial ecosystems under climate change, Science, 361, 920–923, https://doi.org/10.1126/science.aan5360, 2018.
Otto-Bliesner, B. L., Braconnot, P., Harrison, S. P., Lunt, D. J., Abe-Ouchi, A., Albani, S., Bartlein, P. J., Capron, E., Carlson, A. E., Dutton, A., Fischer, H., Goelzer, H., Govin, A., Haywood, A., Joos, F., LeGrande, A. N., Lipscomb, W. H., Lohmann, G., Mahowald, N., Nehrbass-Ahles, C., Pausata, F. S. R., Peterschmitt, J.-Y., Phipps, S. J., Renssen, H., and Zhang, Q.: The PMIP4 contribution to CMIP6 – Part 2: Two interglacials, scientific objective and experimental design for Holocene and Last Interglacial simulations, Geosci. Model Dev., 10, 3979–4003, https://doi.org/10.5194/gmd-10-3979-2017, 2017.
Peñuelas, J., Rutishauser, T., and Filella, I.: Phenology Feedbacks on Climate Change, Science, 324, 887–888, https://doi.org/10.1126/science.1173004, 2009.
Sobol, M. K., Scott, L., and Finkelstein, S. A.: Reconstructing past biomes states using machine learning and modern pollen assemblages: A case study from Southern Africa, Quaternary Sci. Rev., 212, 1–17, https://doi.org/10.1016/j.quascirev.2019.03.027, 2019.
Song, X., Wang, D.-Y., Li, F., and Zeng, X.-D.: Evaluating the performance of CMIP6 Earth system models in simulating global vegetation structure and distribution, Adv. Clim. Change Res., 12, 584–595, https://doi.org/10.1016/j.accre.2021.06.008, 2021.
Strandberg, G., Chen, J., Fyfe, R., Kjellström, E., Lindström, J., Poska, A., Zhang, Q., and Gaillard, M.-J.: Did the Bronze Age deforestation of Europe affect its climate? A regional climate model study using pollen-based land cover reconstructions, Clim. Past, 19, 1507–1530, https://doi.org/10.5194/cp-19-1507-2023, 2023.
Su, Y., Guo, Q., Hu, T., Guan, H., Jin, S., An, S., Chen, X., Guo, K., Hao, Z., Hu, Y., Huang, Y., Jiang, M., Li, J., Li, Z., Li, X., Li, X., Liang, C., Liu, R., Liu, Q., Ni, H., Peng, S., Shen, Z., Tang, Z., Tian, X., Wang, X., Wang, R., Xie, Z., Xie, Y., Xu, X., Yang, X., Yang, Y., Yu, L., Yue, M., Zhang, F., and Ma, K.: An updated Vegetation Map of China (1:1 000 000), Sci. Bull., 65, 1125–1136, https://doi.org/10.1016/j.scib.2020.04.004, 2020.
Sugita, S.: Theory of quantitative reconstruction of vegetation I: pollen from large sites REVEALS regional vegetation composition, Holocene, 17, 229–241, https://doi.org/10.1177/0959683607075837, 2007.
Sun, A., Luo, Y., Wu, H., Chen, X., Li, Q., Yu, Y., Sun, X., and Guo, Z.: An updated biomization scheme and vegetation reconstruction based on a synthesis of modern and mid-Holocene pollen data in China, Global Planet. Change, 192, 103178, https://doi.org/10.1016/j.gloplacha.2020.103178, 2020.
Sun, X., Zhao, Y., and Li, Q.: Holocene peatland development and vegetation changes in the Zoige Basin, eastern Tibetan Plateau, Sci. China Earth Sci., 60, 1826–1837, https://doi.org/10.1007/s11430-017-9086-5, 2017.
Tang, S., Vlug, A., Piao, S., Li, F., Wang, T., Krinner, G., Li, L. Z. X., Wang, X., Wu, G., Li, Y., Zhang, Y., Lian, X., and Yao, T.: Regional and tele-connected impacts of the Tibetan Plateau surface darkening, Nat. Commun., 14, 32, https://doi.org/10.1038/s41467-022-35672-w, 2023.
Tang, S., Piao, S., Holland, D. M., Kan, F., Wang, T., Yao, T., and Li, X.: Resonance between projected Tibetan Plateau surface darkening and Arctic climate change, Sci. Bull., 69, 367–374, https://doi.org/10.1016/j.scib.2023.12.008, 2024.
Thomas, C. and Foken, T.: Flux contribution of coherent structures and its implications for the exchange of energy and matter in a tall spruce canopy, Bound.-Lay. Meteorol., 123, 317–337, https://doi.org/10.1007/s10546-006-9144-7, 2007.
Wang, T., Zhao, Y., Xu, C., Ciais, P., Liu, D., Yang, H., Piao, S., and Yao, T.: Atmospheric dynamic constraints on Tibetan Plateau freshwater under Paris climate targets, Nat. Clim. Change, 11, 219–225, https://doi.org/10.1038/s41558-020-00974-8, 2021.
Wang, T., Huang, X., Zhang, J., Luo, D., Zheng, M., Xiang, L., Sun, M., Ren, X., Sun, Y., and Zhang, S.: Vegetation cover dynamics on the northeastern Qinghai-Tibet Plateau since late Marine Isotope Stage 3, Quaternary Sci. Rev., 318, 108292, https://doi.org/10.1016/j.quascirev.2023.108292, 2023.
Wang, T., Zhang, Y., Yue, C., Wang, Y., Wang, X., Lyu, G., Wei, J., Yang, H., and Piao, S.: Progress and challenges in remotely sensed terrestrial carbon fluxes, Geo-Spat. Inf. Sci., 1–21, https://doi.org/10.1080/10095020.2024.2336599, 2024.
Whitmore, J., Gajewski, K., Sawada, M., Williams, J. W., Shuman, B., Bartlein, P. J., Minckley, T., Viau, A. E., Webb, T., Shafer, S., Anderson, P., and Brubaker, L.: Modern pollen data from North America and Greenland for multi-scale paleoenvironmental applications, Quaternary Sci. Rev., 24, 1828–1848, https://doi.org/10.1016/j.quascirev.2005.03.005, 2005.
Xu, D., Chu, G., Shen, C., Sun, Q., Wu, J., Li, F., Dong, Y., Cui, A., Wu, N., and Lu, H.: 500-Year Periodic Vegetation and Monsoonal Climate Oscillations During the Last Deglaciation in East Asia, Geophys. Res. Lett., 50, e2023GL103535, https://doi.org/10.1029/2023GL103535, 2023.
Xu, P., Tsendbazar, N.-E., Herold, M., de Bruin, S., Koopmans, M., Birch, T., Carter, S., Fritz, S., Lesiv, M., Mazur, E., Pickens, A., Potapov, P., Stolle, F., Tyukavina, A., Van De Kerchove, R., and Zanaga, D.: Comparative validation of recent 10 m-resolution global land cover maps, Remote Sens. Environ., 311, 114316, https://doi.org/10.1016/j.rse.2024.114316, 2024.
Yan, H., Wang, S. Q., Billesbach, D., Oechel, W., Zhang, J. H., Meyers, T., Martin, T. A., Matamala, R., Baldocchi, D., Bohrer, G., Dragoni, D., and Scott, R.: Global estimation of evapotranspiration using a leaf area index-based surface energy and water balance model, Remote Sens. Environ., 124, 581–595, https://doi.org/10.1016/j.rse.2012.06.004, 2012.
Yang, H., Ciais, P., Santoro, M., Huang, Y., Li, W., Wang, Y., Bastos, A., Goll, D., Arneth, A., Anthoni, P., Arora, V. K., Friedlingstein, P., Harverd, V., Joetzjer, E., Kautz, M., Lienert, S., Nabel, J. E. M. S., O'Sullivan, M., Sitch, S., Vuichard, N., Wiltshire, A., and Zhu, D.: Comparison of forest above-ground biomass from dynamic global vegetation models with spatially explicit remotely sensed observation-based estimates, Global Change Biol., 26, 3997–4012, https://doi.org/10.1111/gcb.15117, 2020.
Yang, Y., Xiao, P., Feng, X., and Li, H.: Accuracy assessment of seven global land cover datasets over China, ISPRS J. Photogram. Remote Sens., 125, 156–173, https://doi.org/10.1016/j.isprsjprs.2017.01.016, 2017.
Zeng, L., Wardlow, B. D., Wang, R., Shan, J., Tadesse, T., Hayes, M. J., and Li, D.: Ahybridapproach fordetecting corn and soybean phenology with time-series MODIS data, Remote Sens. Environ., 181, 237–250, https://doi.org/10.1016/j.rse.2016.03.039, 2016.
Zhang, P.: Tibetan Plateau spatially-explicit vegetation cover (16–0 ka BP), Zenodo [data set], https://doi.org/10.5281/zenodo.16908779, 2024.
Zhang, P.-C., Wang, T., Cao, X.-Y., Jin, Y.-H., Luo, Y., and Wang, X.-Y.: Human-accelerated Holocene vegetation change is greater than expected on the Tibetan Plateau, J. Plant Ecol., rtaf139, https://doi.org/10.1093/jpe/rtaf139, 2025.
Zhao, Y., Herzschuh, U., and Li, Q.: Complex vegetation responses to climate change on the Tibetan Plateau: a paleoecological perspective, Natl. Sci. Rev., 2, 400–402, https://doi.org/10.1093/nsr/nwv057, 2015.
Zhao, Y., Liu, Y., Guo, Z., Fang, K., Li, Q., and Cao, X.: Abrupt vegetation shifts caused by gradual climate changes in central Asia during the Holocene, Sci. China Earth Sci., 1–11, https://doi.org/10.1007/s11430-017-9047-7, 2017.