the Creative Commons Attribution 4.0 License.
the Creative Commons Attribution 4.0 License.
 | 16 Oct 2025
State of Wildfires 2024–2025
Chantelle Burton
Francesca Di Giuseppe
Matthew W. Jones
Maria L. F. Barbosa
Esther Brambleby
Joe R. McNorton
Zhongwei Liu
Anna S. I. Bradley
Katie Blackford
Eleanor Burke
Andrew Ciavarella
Enza Di Tomaso
Jonathan Eden
Igor José M. Ferreira
Lukas Fiedler
Andrew J. Hartley
Theodore R. Keeping
Seppe Lampe
Anna Lombardi
Guilherme Mataveli
Yuquan Qu
Patrícia S. Silva
Fiona R. Spuler
Carmen B. Steinmann
Miguel Ángel Torres-Vázquez
Renata Veiga
Dave van Wees
Jakob B. Wessel
Emily Wright
Bibiana Bilbao
Mathieu Bourbonnais
Carlos M. Di Bella
Kebonye Dintwe
Victoria M. Donovan
Sarah Harris
Elena A. Kukavskaya
Aya Brigitte N'Dri
Cristina Santín
Galia Selaya
Johan Sjöström
John T. Abatzoglou
Niels Andela
Rachel Carmenta
Emilio Chuvieco
Louis Giglio
Douglas S. Hamilton
Stijn Hantson
Sarah Meier
Mark Parrington
Mojtaba Sadegh
Jesus San-Miguel-Ayanz
Fernando Sedano
Marco Turco
Guido R. van der Werf
Sander Veraverbeke
Liana O. Anderson
Hamish Clarke
Paulo M. Fernandes
Crystal A. Kolden
Climate change is increasing the frequency and intensity of extreme wildfires globally, yet our understanding of these high-impact events remains uneven and shaped by media attention and regional research biases. The State of Wildfires project systematically tracks global and regional fire activity of each annual fire season, analyses the causes of prominent extreme wildfire events, and projects the likelihood of similar events occurring in future climate scenarios. This, its second annual report, covers the March 2024 to February 2025 fire season. During the 2024–2025 fire season, fire-related carbon (C) emissions totalled 2.2 Pg C, 9 % above average and the sixth highest on record since 2003, despite below-average global burned area (BA). Extreme fire seasons in South America's rainforests, dry forests, and wetlands and in Canada's boreal forests pushed up the global C emissions total. Fire C emissions were over 4 times above average in Bolivia, 3 times above average in Canada, and ∼ 50 % above average in Brazil and Venezuela. Wildfires in 2024–2025 caused 100 fatalities in Nepal, 34 in South Africa, and 31 in Los Angeles, with additional fatalities reported in Canada, Côte d'Ivoire, Portugal, and Türkiye. The Eaton and Palisades fires in Southern California caused 150 000 evacuations and USD 140 billion in damages. Communities in Brazil, Bolivia, Southern California, and northern India were exposed to fine particulate matter at concentrations 13–60 times WHO's daily air quality standards. We evaluated the causes and predictability of four extreme wildfire episodes from the 2024–2025 fire season, including in Northeast Amazonia (January–March 2024), the Pantanal–Chiquitano border regions of Brazil and Bolivia (August–September 2024), Southern California (January 2025), and the Congo Basin (July–August 2024). Anomalous weather created conditions for these regional extremes, while fuel availability and human ignitions shaped spatial patterns and temporal fire dynamics. In the three tropical regions, prolonged drought was the dominant fire enabler, whereas in California, extreme heat, wind, and antecedent fuel build-up were compounding enablers. Our attribution analyses show that climate change made extreme fire weather in Northeast Amazonia 30–70 times more likely, increasing BA roughly 4-fold compared to a scenario without climate change. In the Pantanal–Chiquitano, fire weather was 4–5 times more likely, with 35-fold increases in BA. Meanwhile, our analyses suggest that BA was 25 times higher in Southern California due to climate change. The Congo Basin's fire weather was 3–8 times more likely with climate change, with a 2.7-fold increase in BA. Socioeconomic changes since the pre-industrial period, including land-use change, also likely increased BA in Northeast Amazonia. Our models project that events on the scale of 2024–2025 will become up to 57 %, 34 %, and 50 % more frequent than in the modern era in Northeast Amazonia, the Pantanal–Chiquitano, and the Congo Basin, respectively, under a medium–high scenario (SSP370) by 2100. Climate action can limit the added risk, with frequency increases held to below 15 % in all three regions under a strong mitigation scenario (SSP126). In Southern California, the future trajectory of extreme fire likelihood remains highly uncertain due to poorly constrained climate–vegetation–fire interactions influencing fuel moisture, though our models suggest that risk may decline in future. This annual report from the State of Wildfires project integrates and advances cutting-edge fire observations and modelling with regional expertise to track changing global wildfire hazard, guiding policy and practice towards improved preparedness, mitigation, adaptation, and societal benefit. Thirteen new datasets and model codebases presented in this work are available from the State of Wildfires Project's Zenodo community, including updated annual statistics on wildfire extent (Jones et al., 2025; https://doi.org/10.5281/zenodo.15525674), outputs from modelling of fire causality using PoF model (Di Giuseppe, 2025; https://doi.org/10.24433/CO.8570224.v1) and codebase for the extreme event attribution/projections model, ConFLAME (Barbosa et al., 2025a, https://doi.org/10.5281/zenodo.16790787).
- Article
(13442 KB) - Full-text XML
-
Supplement
(39604 KB) - BibTeX
- EndNote


1.1 Background
Recent years have been marked by a series of extreme wildfire events spanning the globe (Abatzoglou et al., 2025). Record levels of burned area (BA) were observed during the 2019–2020 Australian “Black Summer” bushfires (Abram et al., 2021; Canadell et al., 2021), while successive high-ranking wildfire seasons took place in the western United States (2020 and 2021; Higuera and Abatzoglou, 2020), Siberia (2020 and 2021; Zheng et al., 2023), Europe (e.g. 2017, 2022, 2023; European Commission Joint Research Centre, 2023, 2024, 2025), South America (2019, 2020, 2023, 2024; Kelley et al., 2021; Barbosa et al., 2022; Silveira et al., 2020; Mataveli et al., 2024, 2025), and Canada (2023, 2024; Jones et al., 2024b; Jain et al., 2024; Byrne et al., 2024; Kolden et al., 2024). The 2024–2025 fire season was marked by extreme fire extent and emissions in Amazonia and the Pantanal–Chiquitano (Mataveli et al., 2025; Kolden et al., 2025) and a second consecutive year of extreme fire extent and emissions in Canada (Kolden et al., 2025; Parrington and Di Tomaso, 2025). Equatorial Africa experienced severe fire activity that received little international attention despite driving record levels of forest loss (stand-replacing fire extent) in the region (World Resources Institute, 2025). In addition, highly destructive and costly individual fires affected Southern California (Barnes et al., 2025; Woolcott, 2025) and Jasper National Park in Alberta (Parks Canada, 2024; Insurance Bureau of Canada, 2025). Widespread anomalies were also recorded in northern India and Nepal, where high fire activity contributed to severe haze episodes (Copernicus Atmosphere Monitoring Service (CAMS), 2024b) and at least 100 people were killed (Bolakhe, 2024).
These recent high-impact events align with a growing trend towards increasing extent, intensity, and severity of fires globally, particularly in the extratropics. Key trends observed over approximately the past 2 decades include a ∼ 40 % increase in the extent of forest fires, predominantly in the extratropics, and a 2-fold increase in the intensity of globally extreme fires (Jones et al., 2024a; Cunningham et al., 2024a). These changes are linked to both climatic and human factors. Climate change is intensifying the frequency and severity of drought and fire-favourable weather conditions, lowering vegetation (fuel) moisture and preconditioning landscapes to burn more regularly, intensely, and severely (Seneviratne et al., 2021; United Nations Environment Programme, 2022; Jones et al., 2022; Abatzoglou et al., 2019; Cunningham et al., 2024a). At the same time, human activities, including land use and land-use change, exacerbate the risk of large, fast-moving, or intense fires, especially in tropical forests where they remain the dominant cause of ignition and degradation (Lapola et al., 2023; World Resources Institute, 2025).
The prominence of recent extreme wildfire events contrasts with the broader global trend in BA. Since the early 2000s, global BA has declined by roughly one-quarter, driven mainly by reductions in the area burned by fires in African savannahs linked to landscape fragmentation and changes in the distribution of rainfall (Andela et al., 2017; Zubkova et al., 2019; Jones et al., 2022; Chen et al., 2024). Critically, this decline in fire extent masks major shifts in the distribution of fires globally, with regions such as eastern Siberia and the western United States and Canada experiencing a more than 40 % increase in BA since 2000 (Jones et al., 2022; Zheng et al., 2021) and regions such as southeast Australia also showing significant increases over longer periods despite high interannual variability (Canadell et al., 2021). Excessive focus on global aggregated BA totals, which are principally responding to trends in low-intensity fire regimes in savannahs, underplays the scale and magnitude of the significant shifts in wildfire activity and impact that are underway across many world regions.
The extreme wildfire events of recent years have brought significant impacts on societies across the globe (Cunningham et al., 2024a, b). Since 1990, wildfire disasters have directly killed or injured at least ∼ 18 000 people, a conservative measure based on incomplete records and reporting biased to the global northern countries (updated from Jones et al., 2022; Delforge et al., 2025). In 2023, 232 000 people were evacuated due to wildfires in Canada alone (Jain et al., 2024; Kolden et al., 2024). Also since 1990, fires are estimated to have caused on the order of 1.5 million premature deaths per year through degraded air quality related to fine particulate matter (PM2.5; Johnston et al., 2021; Xu et al., 2024; Chen et al., 2021). Degraded air quality related to fires is experienced most strongly in the tropics (Pai et al., 2022) and often disproportionately affects the elderly, the young, the infirm, and Traditional communities with poor public services or means of protection (Johnston et al., 2021; Carmenta et al., 2021). Extreme fires can moreover impact the livelihoods of various communities and landowners who depend on intact natural landscapes. For example, the lands, territories, and cultural heritage of Traditional communities and Indigenous Peoples can be degraded and transformed by wildfires, raising climate justice issues that compound a legacy of colonisation, dispossession, and forced cessation of cultural practices (Garnett et al., 2018; Barlow et al., 2018; Lapola et al., 2023; Pascoe et al., 2023).
Extreme fires are also a threat to ecosystem services, including biological and cultural diversity and C storage (Jones et al., 2024a, b; United Nations Environment Programme, 2022). The intensification of fire regimes in environments that are less fire-adapted is particularly critical because these ecosystems are expected to be least resilient to such changes (Grau-Andrés et al., 2024) and because they are often home to communities relying directly on intact forests (Newton et al., 2020; Shepherd et al., 2020; Schleicher et al., 2018). As anthropogenic emissions of CO2 remain persistently high, the world's natural C sinks in forests, peatlands, marine, and other ecosystems are increasingly pivotal to mitigating CO2 emissions (Friedlingstein et al., 2025). Intact forests are often relied upon for delivering national plans for reaching net zero (Smith et al., 2023) and offering sites for nature-based solutions. Yet, massive wildfire emissions from boreal forests and soils in Siberia and Canada amount to over 1×10⁹ t of C across the years 2020, 2021, and 2023 alone, a gross flux comparable in magnitude to annual CO2 emissions from fossil fuel combustion in India, the EU27, or the United States (Friedlingstein et al., 2025; Zheng et al., 2023). In a natural fire regime, these gross emissions would likely be recuperated through post-fire recovery. However, shifts in fire regime towards more widespread and severe fires have contributed to a reversal of terrestrial carbon budgets from sinks to sources in some regions, driven by the enhanced disturbance of vegetation and soils carbon stores (Zheng et al., 2021; Gatti et al., 2021; Nolan et al., 2021a; Phillips et al., 2022; Harrison et al., 2018; Jones et al., 2024a; Burton et al., 2024a). Loss of vegetation during extreme fire seasons can also have wider lasting effects on ecosystems, for instance by reducing the habitat area available to endemic species (Ward et al., 2020; Carmenta et al., 2025). Emerging evidence further suggests that extreme fire events can influence marine carbon sinks, through deposition of pyrogenic aerosols and nutrients that alter ocean biogeochemistry, creating feedbacks between terrestrial fires and the global carbon cycle (Tang et al., 2021)
Mitigating and adapting to increases in wildfire potential are growing priorities of policymakers and require coordination with many other stakeholders. National and international disaster management centres are seeking to enhance predictive capacity, while fire management agencies are expanding or re-allocating their resources to rapidly suppress fires to avoid them becoming too large, fast, or intense (e.g. Bowman et al., 2020). Various international organisations such as the UN Environment Programme (United Nations Environment Programme, 2022), the World Bank (2020, 2024a), and the Organisation for Economic Co-operation and Development (OECD, 2023), as well as a range of other inter- or non-governmental organisations are producing reports that consolidate evidence on the changing risk of extreme fires and identify best practices for mitigating their impacts, including through land management, urban/rural planning, ignition risk reduction, pre-suppression, and rapid early/initial attack. Many land managers are developing and implementing approaches such as fuel reduction (Fernandes and Botelho, 2003; Stephens et al., 2012; Moreira et al., 2020; Chuvieco et al., 2023; Hsu et al., 2025). Wildfire response agencies are exploring innovative approaches to detecting and responding to fires, and there is rising interest in the prospect of integrated fire management around the world (Food and Agriculture Organization of the United Nations, 2024). Operators of C market projects and forest carbon-conservation initiatives, such as REDD+, are particularly wary of the risks that wildfires present to the permanence of C offsets, which often feature as a key tool in national policies and international initiatives for achieving net zero emissions (Barlow et al., 2012; Smith et al., 2023).
Not all landscape fires are “bad fires”. Many ecosystems are fire-adapted, with flora that have developed competitive advantages to defend against damage from fire or to resprout or regenerate after fire and fauna that exploit the habitats created by fire-adapted vegetation (Kelly et al., 2020; Pausas and Keeley, 2023). As Pausas et al. (2025) note, fire is a “defining feature of our biosphere, having appeared when the first plants colonised the land, and it continues to occur across the planet at different frequencies and intensities”. In addition, fire has played a vital role in the success of the human species, from its early domestication for cooking, warmth, and protection, through millennia of cultural burning to shape landscapes and resources (Bowman et al., 2011; Pyne, 2011). Small-scale intergenerational fire use continues to be used by Indigenous and Traditional communities around the world, and to label all fire as “bad fire” would risk erasing culturally embedded stewardship, stigmatising traditional practices and cultural values, undermining livelihoods and biodiversity, and increasing future wildfire risk by preventing the low-intensity cultural burns that maintain habitat mosaics and keep hazardous fuels in check (Carmenta et al., 2021; Barlow et al., 2020; Pascoe et al., 2023). The practice of low-intensity prescribed burning, which recognises the need for fire on fire-adapted landscapes, is applied in many world regions for the purpose of hazardous fuel reduction or for the rejuvenation of vegetation aligned with vegetation adaptations, often with inspiration from cultural burning practices (Hiers et al., 2020; Hsu et al., 2025). Nonetheless, trends towards larger, more intense, or more severe fire properties have the potential to push fire-adapted ecosystems towards the edge of their physiological range (Kelly et al., 2020; Pausas et al., 2025). At the same time, low-intensity controlled burning is, in some regions, facing shrinking windows of weather conditions in which low-intentional burns can be safely maintained (Fernandes et al., 2013; Swain et al., 2023; Di Virgilio et al., 2020).
Amidst extreme wildfires and wildfire seasons, stakeholders increasingly turn to scientists for answers. How extreme was this fire event in a historical context? Is climate change amplifying fire occurrence? Can we disentangle the factors responsible in order to target those in policy and management? Will we see more wildfires like this in the future? Did land-use or management factors exacerbate or ameliorate the problem? Could we have predicted these events, and how can we improve early warning systems and preparedness in the future? What is the role of climate and socioeconomic factors, such as land use, in reducing risk of extreme wildfires in future?
While observational, statistical, and modelling tools for assessing extreme wildfire drivers and predicting wildfire occurrence are advancing rapidly, their application to studying extreme wildfire seasons or events on timescales relevant to public and political interest remains limited. The State of Wildfires report represents an annual effort to systematically catalogue extreme wildfire events at annual frequency and explain their occurrence, predictability, and attribution to climate and land-use changes. As well as collating records of extreme fire activity from Earth observations, we convened regional expert panels for each continent to help identify events considered extreme in terms of their social, economic, and ecological impacts, thereby capturing important dimensions of fire activity not always visible in satellite data. The report incorporates recent methodological advances in disentangling the drivers of four selected extreme wildfire events to fuel dryness, fuel load, weather, and ignition and suppression factors. By applying these methodological advances in conjunction with models of global change, we quantify the change in likelihood of the past year's events under climate and land-use changes. Observable fire metrics (e.g. BA) are the target variable of our causal inference and attribution work, which thereby advances on more common climate attribution studies that attribute change in fire-favourable meteorological conditions to climate change. Overall, this report capitalises on recent advances in the study of extreme fire events and seasons to provide timely information about shifting fire regimes and their causes. The findings of the report are relevant to organisations involved in wildfire prevention and combat efforts, policymakers, the media, and the wider public.
1.2 Objectives of this report
The State of Wildfires report brings together the latest science on extreme fire monitoring, prediction, and modelling to track how wildfire impacts on society and the environment are changing and to explain the drivers behind these shifts. It forms the foundation of the wider State of Wildfires project, which aims to deliver insights into climate, land-use, and fire management policy to decision-makers and practitioners, ultimately supporting stronger societal and environmental resilience to wildfire. In this edition of the State of Wildfires report, we do the following:
-
regionally identify extreme individual wildfires or extreme wildfire seasons of the period March 2004–February 2025 and place them in the context of recent trends (Sect. 2);
-
shortlist four “focal” extremes events (extreme individual wildfires or extreme wildfire seasons) with notable impacts on society or the environment, which are the subject of dedicated analysis in subsequent report sections (Sect. 2);
-
globally assess the impacts of extreme wildfire events in terms of the exposure of population, physical assets (built environment), and carbon projects to fire as well as their impacts on air quality (Sect. 3);
-
diagnose the contributions of weather, fuel dryness, fuel load, ignitions, and suppression to the occurrence of each focal event (Sect. 4);
-
assess the capacity of operational predictive systems to predict the scale of fire occurrence in each focal event (Sect. 4);
-
attribute each focal event to anthropogenic influences by testing the role of climate change and socioeconomic factors such as land use, land-use change, and human ignitions (Sect. 5);
-
provide an outlook for the probability of extreme events in the early months of the 2025–2026 fire season (Sect. 6);
-
project future changes in the probability of each focal event under future climate scenarios (Sect. 6).
The delivery of this report and its objectives relies on critical datasets and models developed by the research community over many decades. By applying these tools to the challenge of studying extreme wildfires, we not only gain insights into their strengths and limitations for studying extreme fires, but also drive scientific and technological innovation that advances our ability to monitor, explain, and predict such events. To address objectives 1 and 2, we build a comprehensive dataset of fire metrics including BA, fire counts, fire C emissions, and regional statistics of individual fire properties such as size and rate of growth, all for consistent world regions, and quantitatively identify anomalies in these metrics during the past fire season (Giglio et al., 2018; van der Werf et al., 2017; Andela et al., 2019b). To address objectives 4 and 5, we leverage weather forecasts from the European Centre for Medium-Range Weather Forecasts (ECMWF) at different time horizons from medium (1–15 d) to long range (up to 4 months ahead) and additionally employ two state-of-the-art fire models, Controlar Fogo Local Analise pela Máxima Entropia – English “Local Fire Control Analysis by Maximum Entropy” (ConFLAME; Kelley et al., 2019; Barbosa et al., 2025b) and Probability of Fire (PoF; McNorton et al., 2024) to pinpoint the causes of the extreme fire events of 2024–2025. To address objective 6, we employ projections of fire weather from the Hadley Centre Large Ensemble (HadGEM3-A, Ciavarella et al., 2018) to attribute change in the Fire Weather Index (FWI) to climate change (Abatzoglou et al., 2019; Clarke et al., 2022), and we drive ConFLAME (Kelley et al., 2019; Barbosa et al., 2025b) with outputs from HadGEM3-A and separately with the Intersectoral Impacts Model Intercomparison Project 3a (ISIMIP3a) and Joint UK Land Environment Simulator Earth System model (JULES-ES; Mathison et al., 2023) to attribute extreme BA to climate and land-use changes (Burton et al., 2024b). To address objective 7, we use seasonal outlook of FWI from the Copernicus Emergency Management Service (Di Giuseppe et al., 2024). To address objective 8, we again pair ConFLAME with JULES-ES (Mathison et al., 2023) to project future changes in BA under several future climate and land-use scenarios and provide a comprehensive assessment of past and future extreme wildfire events.
The State of Wildfires report was launched in 2024 and is an annual report that can harness and adopt new methodologies brought forward by the scientific community in the interim between its yearly publication. Over the coming years and decades, we aim to enhance the tools presented in this report to predict extremes with increasing lead times, monitor emerging situations in near-real time (NRT), and explain their causes rapidly, thus enhancing our ability to deliver timely insights to decision-makers when they are most needed.
2.1 Methods
We catalogued the extreme regional wildfire events or annual fire seasons in the period March 2024–February 2025 based on a combination of anomalies in the distribution of several observable fire metrics from Earth observations (Sect. 2.1.1 and 2.1.2). In this work, the global fire season is defined as occurring in March–February windows oriented around the annual minima of global fire activity in boreal spring (see further details in “Input data uncertainties” in Sect. 2.1.1). As a new development for this edition of the report, we added statistics describing anomalies in fire intensity (with respect to fire radiative power; see Sect. 2.1.1) during the 2024–2025 fire season, complementing anomaly statistics provided in the prior edition related to regional BA, fire emissions, fire size, and rate of growth.
Due to the diversity of environmental settings in which fires occur and the range of ecological, economic, or societal impacts caused, defining an extreme fire or an extreme fire season remains inherently challenging. To date, extreme fires have commonly been defined by their BA extent, by their feedback on the global climate, and by their socioeconomic and ecological impacts (Linley et al., 2022, 2025; Driscoll et al., 2024). We reviewed the range of approaches that can be taken to identify extreme wildfire events in our inaugural report (see Appendix B1.1 of Jones et al., 2024b). A universally accepted objective definition of “extreme” remains elusive, reflecting a series of data- and knowledge-oriented challenges. Data-oriented challenges include the absence of consensus on quantitative criteria, with no universally applicable thresholds for size, severity, or other measurable properties; pronounced geographic variability, as regional fire regimes dictate the relevance of particular thresholds; evolving definitions that have progressively expanded to encompass a broader range of fire types and behaviours under changing climatic conditions; and context dependence, whereby interpretation is contingent on ecosystem characteristics, historical fire regimes, and benchmarks such as return intervals or ecosystem damage. Knowledge-oriented challenges centre on the lack of agreement over qualitative criteria, including fire behaviour and impacts; the proliferation of overlapping and sometimes redundant terminology (e.g. “megafire,” “catastrophic fire”); the influence of linguistic and cultural context on interpretation and reporting; the shaping of scientific terminology by societal discourse, necessitating accessibility to diverse audiences; and the limited rigour, clarity, and standardisation evident in existing definitions. Recognising these complexities and the need for transdisciplinary processes to establish robust, standardised criteria in future work, this report maintains a deliberately broad and flexible definition of extreme.
While an extreme fire event or extreme fire season may be visible as a significant anomaly against historical Earth observations, the scientific community seeks to apply a more comprehensive definition of extreme fire, including its impacts on society and the environment. To catalogue extreme events that were not necessarily visible in Earth observations, regional expert panels were constructed and given responsibility for identifying extreme events of the past fire season (Sect. 2.1.3). The expert panels were given flexibility to identify and catalogue extremes that are not captured by Earth observations, such as suppression difficulty or impacts on society or the environment (see Sect. 2.1.3). Hence, Sect. 2.2 identifies a variety of impactful events displaying a broad range of characteristics and impacts that can occur across diverse fire regimes (e.g. Archibald et al., 2009; Cunningham et al., 2024a, b; Keeley, 2009).
As a new development for this report, we added several new analyses providing context to the observed extremes in fire during the past fire season (Sect. 2.1.4). Specifically, we added an analysis of extreme (95th percentile) fire weather days for the 2024–2025 fire season, allowing the spatial and temporal context of extreme fires with extreme fire weather to be described (“Contemporaneous extremes in fire weather” in Sect. 2.1.4).
2.1.1 Earth observations of fire
Input datasets
We assembled observations of burned area (BA), synonymous with fire extent, for the period March 2002–February 2025 from the National Aeronautics and Space Administration (NASA) product MCD64A1 (collection 6.1). MCD64A1 provides daily BA observations at 500 m spatial resolution with global coverage and is based on retrievals from the Moderate Resolution Imaging Spectroradiometer (MODIS) sensors mounted on the Terra and Aqua satellites (Giglio et al., 2018, 2021). We also produced a global record of individual fires for the period March 2002–February 2025 by updating the Global Fire Atlas (Andela et al., 2019b) through February 2025, driven by the 500 m MODIS BA data. The Global Fire Atlas algorithm clusters burned cells into individual fires, tracks their daily progression, and logs attributes such as fire size and mean daily rate of growth. Our updates are provided in Andela and Jones (2025). The Global Fire Atlas is one of several products tracking daily fire progression and identifying individual fires at global scale based on moderate resolution satellite data (Andela et al., 2019b; Laurent et al., 2018; Artés et al., 2019). The product uses the MODIS BA product. The smallest unit of disaggregation is 500 m, and the shortest time step on which the expansion of a fire can be observed is daily. Given its resolution, the Global Fire Atlas is expected to represent the dynamics of large fires better than smaller fast-moving fires.
In addition, we gathered estimates of fire carbon (C) emissions for the period March 2024–February 2025 from two models driven by Earth observations of active fires or BA: firstly, the Global Fire Assimilation System (GFAS) product, provided operationally by the Copernicus Atmospheric Services (CAMS) at 0.1° spatial resolution (approximately 11 km at the Equator) and daily temporal resolution (Kaiser et al., 2012; European Centre for Medium-Range Weather Forecasts, 2024), and, secondly, the Global Fire Emissions Database (GFED; version 4.1s, Global Fire Emissions Database, 2024) product at 0.25° spatial resolution and daily temporal resolution (van der Werf et al., 2017). GFAS is driven by the fire radiative power (FRP) retrievals in the MODIS active fire product MCD14A1 and biome-level relationships between FRP and biomass consumed based on GFED3 (Kaiser et al., 2012). For the 1997–2016 period, GFED4s is driven by MODIS BA data (MCD64A1 collection 5) supplemented with small fire BA based on MODIS active fire data and a model for biomass productivity and fuel consumption (van der Werf et al., 2017). For the post-2016 period in GFED4.1s, emissions estimates rely solely on MODIS active fire data, with pixel-level scaling factors trained on the relationship between active fire detections and burned-area-driven emissions during 2003-2016.
As a new analysis developed for the 2024–2025 report, we added summaries of the peak (95th percentile) intensity of the fires detected in the Global Fire Atlas. The underlying data for this analysis were daily observations of fire radiative power (FRP) from the NASA active fire products MOD14A1 and MYD14A1 (Giglio et al., 2016). These products report FRP as the instantaneous rate of radiative energy release from actively burning fires, expressed in megawatts (MW) per pixel. Conceptually, FRP provides a satellite-derived measure of the combustion rate and is therefore more closely aligned with fire radiative intensity (W m−2) than with measures of fireline intensity (W m−1) used more frequently in field studies, fire behaviour modelling, and active fire management. MOD14A1 and MYD14A1 each provide FRP observations at two different times of the day, with the MOD14A1 dataset produced based on retrievals from the MODIS sensor aboard NASA's Terra satellite, which overpasses at around 10:30 a.m. and 10:30 p.m. local time, and the MYD14A1 dataset produced based on retrievals from the MODIS sensor aboard NASA's Aqua satellite, which overpasses at around 01:30 p.m. and 01:30 a.m. local time. In our case, daytime and nighttime observations of FRP were combined into a single dataset of active fire detections obtained from any satellite overpass and either MODIS sensor. To minimise potential uncertainties, we excluded FRP measurements associated with large MODIS scan angles (> 50°), and normalised the FRP measurements by pixel size (Li et al., 2024).
The upcoming decommissioning of the Terra and Aqua satellites on which the MODIS instruments are mounted poses potential challenges for evaluating long-term data records of BA and estimated emissions from wildfires. The wider community requires continued development of BA and active fire products from sensors such as VIIRS (e.g. Parrington and Di Tomaso, 2025).
Input data uncertainties
We note that the MODIS BA product data used in our analyses of anomalies in BA and individual fire properties (via the Global Fire Atlas) are known to be conservative due to the limitations to detecting small or short-lived fires (e.g. agricultural fires) based on surface spectral changes at 500 m resolution. Recent work has shown that including detections of small active fires increases global BA estimates by 93 % (Chen et al., 2023). However, variability and trends in regional BA totals using datasets that include small fires do not differ significantly from the variability and trends present in the MODIS MCD64A1 BA product because the corrections made for small fires are consistent over time (Chen et al., 2023). In this report, we require a BA product that has global coverage and ideally a spatial resolution that can be aggregated within geographical divisions (e.g. Table 1) and also a temporal consistency over a multi-decadal time series up to the present year. The MODIS MCD64A1 BA product meets these needs and allows us to address our research questions, though we caution that the absolute values of BA reported by the MODIS BA product are underestimated due to small fire omission.
Uncertainties in the BA estimation can be decomposed into observational uncertainty and parameter uncertainty. Observational uncertainty arises due to errors of omission (missed detections of true fires) and commission (incorrect identification of fires that did not occur). The NASA MODIS MCD64A1 was previously assessed to have a 40 % commission error and 73 % omission error, with an overall 50 % under-detection of BA versus higher-resolution Landsat imagery due to omitted small fires (based on analysis from 558 sites selected by probability sampling). Note that these uncertainties are highly consistent with the reported 93 % increase in BA in the GFED5 BA product versus MCD64A1, which occurs due to small fire omissions in MCD64A1 (Chen et al., 2024). Other work comparing the ESA FireCCI51 BA product (based on 250 m MODIS retrievals) with the high-resolution ESA FireCCISFD11 BA product (based on 20 m Sentinel-2 retrievals) also suggests an approximately 50 % under-detection of BA in sub-Saharan Africa (Chuvieco et al., 2022). Parameter uncertainty arises from the range of methodological choices that can be made when producing a global BA product based on the same or similar observational inputs. These uncertainties can be quantified by comparing different global BA products using similar observations as input. For instance, the estimates of global BA from the NASA MODIS MCD64A1 product (based on 500 m MODIS observations) are 20 % lower than the BA estimates provided by the Copernicus Land service (2025; based on 300 m Sentinel-3 observations with similar sensor properties and with no corrections for small fires as in ESA FireCCI products).
Uncertainties in fire carbon emissions estimates from GFED4.1s are on the order of ±20 %–25 % at 1 standard deviation for global totals (van der Werf et al., 2017; van der Werf et al., 2010). Uncertainties in GFED4.1s stem from uncertainties in BA (see above), the amount of biomass consumed per unit BA, and the carbon emitted per unit biomass burned. Uncertainties in fire carbon emissions estimates from GFAS are on the order of approximately ±25 % at 1 standard deviation for global totals. Uncertainties are introduced by missed active fire detections, either below the detection threshold of the MODIS instruments or not observed during the limited diurnal coverage of low-Earth-orbiting satellites, assumptions made for biome classifications, coefficients used to convert observed thermal anomalies to consumed dry matter, and emission factors used to estimate emitted quantities of carbon and pyrogenic pollutants. Variation in C emissions estimates on the order of approximately 20 %–60 % has been observed in studies comparing multiple emissions products (Wiedinmyer et al., 2023).
The fire radiative power (FRP) data provided by the MOD14A1 and MYD14A1 products are subject to several qualitatively described uncertainties that affect both the detection of active fires and the precision of retrieved energy estimates (Giglio et al., 2016; Wooster et al., 2021). Omission errors typically arise when fires are obscured by clouds or, in some cases, dense smoke incorrectly flagged as clouds during masking procedures (Atwood et al., 2016). Additional omissions occur when the mid-infrared (MIR) radiance levels of small, low-intensity fires fall below detection thresholds, which is most common in the case of sub-canopy or peatland combustion (Schroeder et al., 2008; Roberts et al., 2018). Temporal gaps in satellite coverage also contribute, as MODIS instruments observe any given location only up to four times per day, often missing short-lived events or peak fire activity in the late afternoon (Roberts and Wooster, 2014). Commission errors, by contrast, typically occur when non-fire thermal anomalies are misclassified as active fires. False positives can be caused by sunglint on water or clouds or by thermally anomalous surfaces such as bare soils, urban infrastructure, gas flares, and volcanic eruptions, which produce elevated MIR radiance that mimics fire signatures (Wooster et al., 2021). Contextual detection algorithms help mitigate these errors by comparing candidate pixels to local background conditions. These approaches have been particularly successful in reducing commission errors, which are often below 10 % (Giglio et al., 2016; Wooster et al., 2021). In contrast, uncertainties in omission errors and FRP observations remain less well characterised (Wooster et al., 2021; Li et al., 2024). Freeborn et al. (2014) quantified overall MODIS FRP uncertainty by analysing > 400 000 near-simultaneous duplicate fire detections from consecutive satellite scans, comparing overlapping measurements to assess variability mainly in relation to a fire's position within the sensor's point spread function. They found uncertainties of ∼ 27 % (at 1 standard deviation) for individual fire pixels but showed through simulations that these decline rapidly with aggregation, falling to ∼ 17 % for two-pixel clusters and below 5 % once ∼ 50 or more pixels are included, making large-fire or regional FRP estimates more robust than single-pixel estimates.
Regional burned area, carbon emissions, and fire count totals
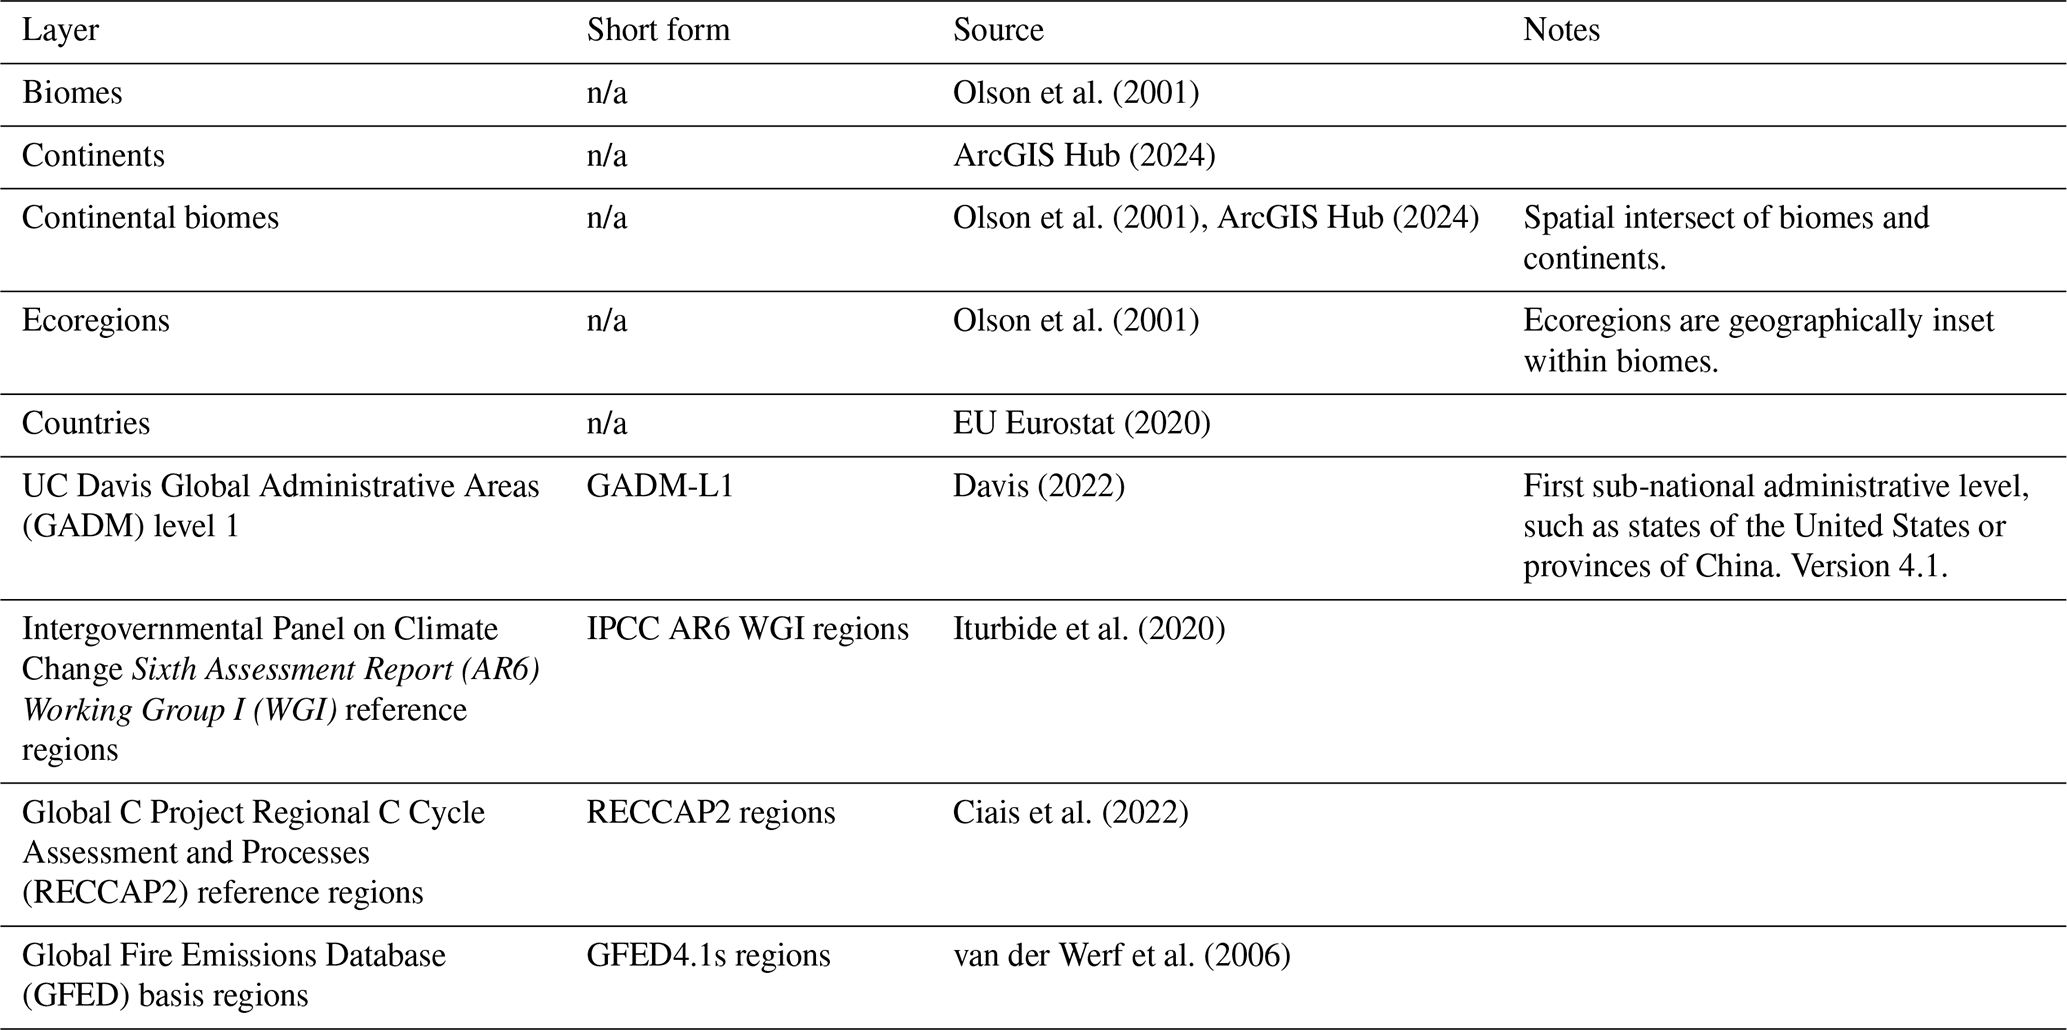
We calculated regional totals of BA and C emissions based on a variety of regional layers defined in Table 1. The regional layers represent a range of biogeographical boundaries (e.g. biomes), geopolitical boundaries (e.g. countries), and values used in scientific reports (e.g. by the Intergovernmental Panel on Climate Change; IPCC). We calculated monthly totals of BA and fire C emissions for each region by aggregating monthly BA and daily C emissions data, summing the data from the input datasets both spatially and temporally as required. In the case of fire C emissions, we also calculated the mean estimate of fire C emissions from GFED4.1s and GFAS, regionally.
Our March–February definition of the global fire season (e.g. the latest global fire season spans March 2024–February 2025) is chosen so as to align with an annual lull in the global fire calendar in the boreal spring months (Giglio et al., 2013). It was previously shown that fire season BA totals are least sensitive to the shifts in fire season cutoffs of 1–2 months if the fire season centres on boreal spring (Boschetti and Roy, 2008). This makes the global fire season centred on spring a pragmatic option for the study of interannual variability or trends in fire extent (Boschetti and Roy, 2008). The period March–February is specifically oriented at the end of the austral fire season and before widespread fires have begun in the boreal extratropics. The regions where this global definition of the fire season is most problematic are northern hemispheric South America, Southeast Asia, and Central America (Giglio et al., 2013).
In addition, we calculated totals of regional fire counts for each global fire season based on the number of individual fire ignition points present within each region, using ignition point vectors from the Global Fire Atlas (Andela et al., 2019b). The resolution of the MODIS MCD64A1 data supplied to the Global Fire Atlas algorithm is 500 m, and hence small fires omitted from the MCD64A1 product are also omitted from the Global Fire Atlas outputs. Regional or national systems may record greater fire counts due to the inclusion of smaller fires.
Table 1Regional layers to which global Earth observations were disaggregated and used to define regions with extreme wildfire seasons or extreme individual wildfire attributes. Regional layers are available from Jones et al. (2025). n/a – not applicable.
Cross-product intercomparison of regional burned area totals
In this report, to characterise the dependence of our findings on BA product choices, we add a supplementary comparison between the regional BA totals detected by the MCD64A1 BA product and two other BA products. The first product was the ESA Climate Change Initiative FireCCIS311 product, derived from Sentinel-3 SYN reflectance and Visible Infrared Imaging Radiometer Suite (VIIRS) active fires (Lizundia-Loiola et al., 2022; see Fig. S1 in the Supplement). FireCCIS311 is provided at a spatial resolution of 300 m and is based on a contextual algorithm based on Sentinel-3 SYN surface reflectance (SYN combines OLCI and SLSTR reflectance), guided by active fire detections from VIIRS. The second product is NASA's VIIRS BA product (VNP64A1 v002; Zubkova et al., 2024; Giglio, 2024; see Fig. S1), generated using an adaptation of the MODIS MCD64A1 Collection 6.1 algorithm, applied to 750 m VIIRS imagery and active fire detections. The hybrid algorithm uses dynamic thresholds on composite imagery derived from a burn-sensitive vegetation index and temporal texture measures, enabling it to distinguish fire-induced changes from other land surface changes. It identifies the burn date at 500 m resolution for each grid cell, with prior probabilities of burned/unburned areas informed by cumulative VIIRS active fire observations.
The FireCCIS311 product has been computed since 2019, and hence our cross-product comparisons focus on the fire seasons March 2019–February 2025. We followed identical approaches as described in prior sections to calculate regional BA totals and to quantify anomalies of the past fire season. With very few exceptions, we find a high level of consistency between the MCD64A1, FireCCIS311, and VIIRS VNP64A1 BA products with regards to the relative magnitude of regional BA anomalies, the geographical distribution of those anomalies, and the rankings of BA in the 2024–2025 fire season versus previous fire seasons since 2019 (Fig. S1; Jones et al., 2025). This analysis adds confidence that regional anomalies identified in the MCD64A1 BA product are consistent across products from different space agencies using different algorithms applied to different combinations of Earth-observing sensors. The MCD64A1 BA product will soon discontinue due to the decommissioning of MODIS sensors aboard NASA's Terra and Aqua satellites, and the consistency across products is an encouraging finding for the continuity of our annual reporting.
2.1.2 Identifying extreme fire seasons and events from Earth observations
Regions with extreme wildfire seasons
Anomalies in BA, fire C emissions, and fire counts in the latest global fire season (March 2024–February 2025) were calculated in several ways:
- i.
as relative anomalies (expressed in %) from the annual mean during all previous March–February periods since 2002 (2003 for fire C emissions);
- ii.
as standardised anomalies (standard deviations) from the annual mean during all previous March–February periods since 2002 (2003 for C emissions);
- iii.
as a rank amongst all March–February periods since 2002 (2003 for fire C emissions), March 2024–February 2025 inclusive.
In this report, anomalies in fire C emissions are reported based on the two-model mean estimate from GFED4.1s and GFAS; however anomalies based on the GFED4.1s or GFAS estimates individually are also available via Jones et al. (2025).
We identified regions in which the latest fire season was potentially classifiable as “extreme” based on the rank of BA, C emissions, and fire count amongst all fire seasons. For visualisation purposes, we identified regions in which the latest fire season ranked in the top five of all annual fire seasons on record (see Sect. 2.2.1). The BA data for the period March 2002–February 2025 include 23 fire seasons, while the C emissions data for the period March 2003–February 2025 include 21 fire seasons. Hence, a top-five ranking translates approximately to a fire season in the upper quartile of those on record.
We further characterised the onset, peak, and cessation of anomalous monthly BA in March 2024–February 2025. First, we identified the “peak” month as the maximum anomaly between monthly BA values in March 2024–February 2025 and the climatological mean monthly values from the prior March–February periods. Thereafter, the event's onset and cessation were defined as the bounds of consecutive months with above-average BA prior to and following the peak but limited to the March 2024–February 2025 period.
The annual data and anomalies produced using these methods are available from Jones et al. (2025).
Regions with extreme individual wildfire attributes
We identified regions in which large or fast-moving fires occurred in the latest fire season based on records of individual fires from the Global Fire Atlas (Andela et al., 2019b). For each region (Table 1) and year, we estimated the size of the largest fire, the daily rate of growth of the fire that spread most rapidly, the size of the 95th percentile fire, and the daily rate of growth of the 95th percentile fire. In the Global Fire Atlas, the daily rate of growth for any given fire is determined by calculating the average daily rate of growth at which the fire advanced across all its constituent cells.
As a new analysis developed for the 2024–2025 report, we also identified regions in which intense fires occurred in the latest fire season based on the Global Fire Atlas and FRP observations from the MODIS active fire datasets (MOD14A1 and MYD14A1). Regional values were calculated per fire season across two steps as follows. First, each fire present in the Global Fire Atlas was assigned a peak intensity value equivalent to the 95th percentile of all FRP measurements (daytime and nighttime) occurring within the perimeter and date range of the fire. Second, the regional summary values were taken to be the mean of all peak (95th percentile) intensity values from the cohort of fires occurring in a region and fire season. This approach effectively masks FRP measurements to fires that occur in the Global Fire Atlas prior to averaging, meaning that the fire intensity anomalies presented here relate to the same set of fires as the fire size and fire rate of growth statistics. Anomalies in each fire attribute were calculated relative to other fire seasons since 2003 using the same metrics as for BA (see (i)–(iii) above), and we identified regions in which the latest fire season featured fires with potentially extreme attributes based on the ranking of the individual fire metrics amongst all fire seasons.
The annual data and anomalies produced using these methods are available from Jones et al. (2025).
2.1.3 Identifying extreme fire seasons and events from expert consultation
Role of expert consultation
We assembled a panel of regional experts from each continent (Table A1) to contribute to the identification, description, and characterisation of extreme wildfire seasons or impactful events in the latest fire season. A key role of the expert panel was to catalogue regional events that significantly impacted society or the environment but which may not have been detected by Earth-observing satellites due to issues such as scale, short duration, timing of overpass, and cloud or canopy cover. This includes (but is not limited to) wildfires that presented major suppression difficulty or impacted society by causing fatalities, evacuations, displacement (e.g. homelessness), direct structure or infrastructure loss or damage, degradation of air or water quality, loss of livelihood, cultural practice or other ways of life, and loss of economic productivity. This definition also includes (but is not limited to) wildfires that impact the environment via disturbance to vulnerable ecosystems, biodiverse areas, or ecosystem services such as C storage. This approach recognises that Earth observations do not provide a complete record of all impactful fires. We do not define ubiquitous quantitative thresholds of impact by any of the measures outlined above but rather invite in-region experts to identify events that triggered impacts that were sufficient in magnitude to infiltrate public and political discourse. The sources of information available for cataloguing regional events include national/regional fire records, land and fire management agencies reports, disaster management reports, news reports, and social media. A second key role of our expert panel was to describe and contextualise the impacts of the fire seasons highlighted as extreme by Earth observations or regional assessment (see Sect. 2.2.3). We stress that extremes identified in this way often reflect vulnerability and resilience shaped by factors beyond climate, such as governance, funding, and policy decisions, which are not strictly biophysical conditions.
The year in review by continent, produced by the expert panel, is presented in Appendix A.
Shortlisting of focal events
In later sections of this report, we conducted various analyses to understand the causes and predictability of a selection of extreme wildfire seasons or events during March 2024–February 2025 (see Sects. 4–6). We limited the number of analyses to three globally prominent focal events of the 2024–2025 global fire season because the approaches used are not operational and time is required to train and optimise our models regionally.
In discussion with our expert panel, we prioritised the three events studied in this report by weighing up the anomalies in Earth observations during the latest fire season as well as a suite of impacts that these extremes had on people and the environment. The focal events are notable for their international significance even where they have not attracted international media attention and where they have been highly relevant and recognised within and beyond their region.
2.1.4 Contextualising analyses
Contemporaneous extremes in fire weather
In the Supplement of this report, we introduce routine summaries of the extreme (95th percentile) fire weather days during the March 2024–February 2025 global fire season based on the FWI, a common metric of fire danger developed by the Canadian Forest Service as part of the Canadian Forest Fire Danger Rating System (CFFDRS; Van Wagner, 1987). The FWI comprises various components that consider the influence of weather on fire danger, with 2 m temperature, 10 m wind speed, precipitation, and 2 m relative humidity as prerequisite variables. Higher FWI values are generally seen during droughts, heatwaves, and strong winds as these conditions are conducive to wildfires in environments with sufficient fuel load (Jolly et al., 2015; Di Giuseppe, 2016; Jones et al., 2022). We base our analysis of extreme (95th percentile) fire weather on the FWI dataset derived from the Copernicus Climate Change Service ERA5 reanalysis (Hersbach et al., 2023; Vitolo et al., 2020) and maintained by the Copernicus Emergency Management Service (CEMS, version 4.1, 2019). The 95th percentile value for extreme fire weather has been used in many prior publications (e.g. Abatzoglou et al., 2019; Jones et al., 2022). The same statistics are reported for the 2024–2025 fire season as in the case of fire observational datasets, including (i) ranks, (ii) proportional anomalies, and (iii) standardised anomalies amongst all fire seasons since 2002 (Fig. S2). Full discussion of the methodology and results is provided in Sect. S2 in the Supplement. The data produced using these methods are available from Turco et al. (2025).
21st century trends in burned area
To place recent extremes in the context of fire trends of the past 2 decades, we update our regional analyses of trends in annual BA from Jones et al. (2022). In addition to reporting trends in total BA, we also present trends in forest BA as these regularly diverge from total BA trends (Fig. S3), following Jones et al. (2024a). Full discussion of the methodology and results are provided in Sect. S2 in the Supplement.
2.2 Results
2.2.1 Extreme fire seasons and events of 2024–2025 from global Earth observations
Global summary
According to the MODIS BA product, at least 3.7×10⁶ km2 burned globally during the 2024–2025 global fire season (March 2024–February 2025), 9 % below the average of previous fire seasons (4.0×10⁶ km2) since 2002 and overall ranking 16th (i.e. 8th lowest) of all fire seasons since 2002 (Jones et al., 2025). Despite this, fire C emissions were 9 % above average at 2.2 Pg C during the 2024–2025 global fire season, which ranks sixth amongst all fire seasons since 2003 (based on annual averages of GFED4.1s and GFAS estimates; see Sect. 2.1.2; Jones et al., 2025). The 2024–2025 fire season therefore followed a similar pattern as in the 2023–2024 fire season, with above-average emissions occurring despite below-average BA at the global level. These anomalies, signifying lesser fire extent but more severe fires than average, are consistent with a reported trend towards increased fire extent and intensity in forests globally (Jones et al., 2024a). It is important to note that the MODIS BA product is uncorrected for missed small fire detections as in the case other estimates (e.g. Chen et al., 2023; Lizundia-Loiola et al., 2022), meaning that the estimated BA extents from MODIS are conservative (i.e. at least 3.7×10⁶ km2 burned globally during 2024–2025).
Stark regional contrasts in the anomalies in BA, fire C emissions, and individual fire properties are visible in the Earth observations at various regional scales (Figs. 1, 2, 3). The three countries with greatest positive anomalies in BA and C emissions during 2024–2025 were Bolivia, Brazil, and Canada (Tables 2, 3), marking a second consecutive year in which the Americas experienced an anomalous fire season.
On the scale of continental biomes (Figs. 1, 2, 3), the greatest BA and fire C emissions anomalies of 2024–2025 were seen in the North American boreal forests (mostly in Canada), the South American moist tropical forests (mostly in Amazonia), the South American dry tropical forests (mostly in the Chiquitano dry forests of Bolivia), and the South American grassland and savannah biome (mostly in the Cerrado region). On the other hand, it was a second consecutive year the African savannahs experienced a low fire season. In the world's tropical savannah regions, which contribute around 70 % towards global BA, the total BA in the 2024–2025 fire season was 290 000 km2 (12 %) below average in Africa, slightly above average in South America, and slightly above average in Australia (Fig. 2). Total BA across the global (sub)tropical grassland, savannah, and shrubland biome was 290 000 km2 (10 %) below average and the sixth lowest on record but still contributed 70 % towards total global BA during 2024–2025. Correspondingly, the C emitted by fires in global savannahs was 102 Tg C (10 %) below average in 2024–2025.
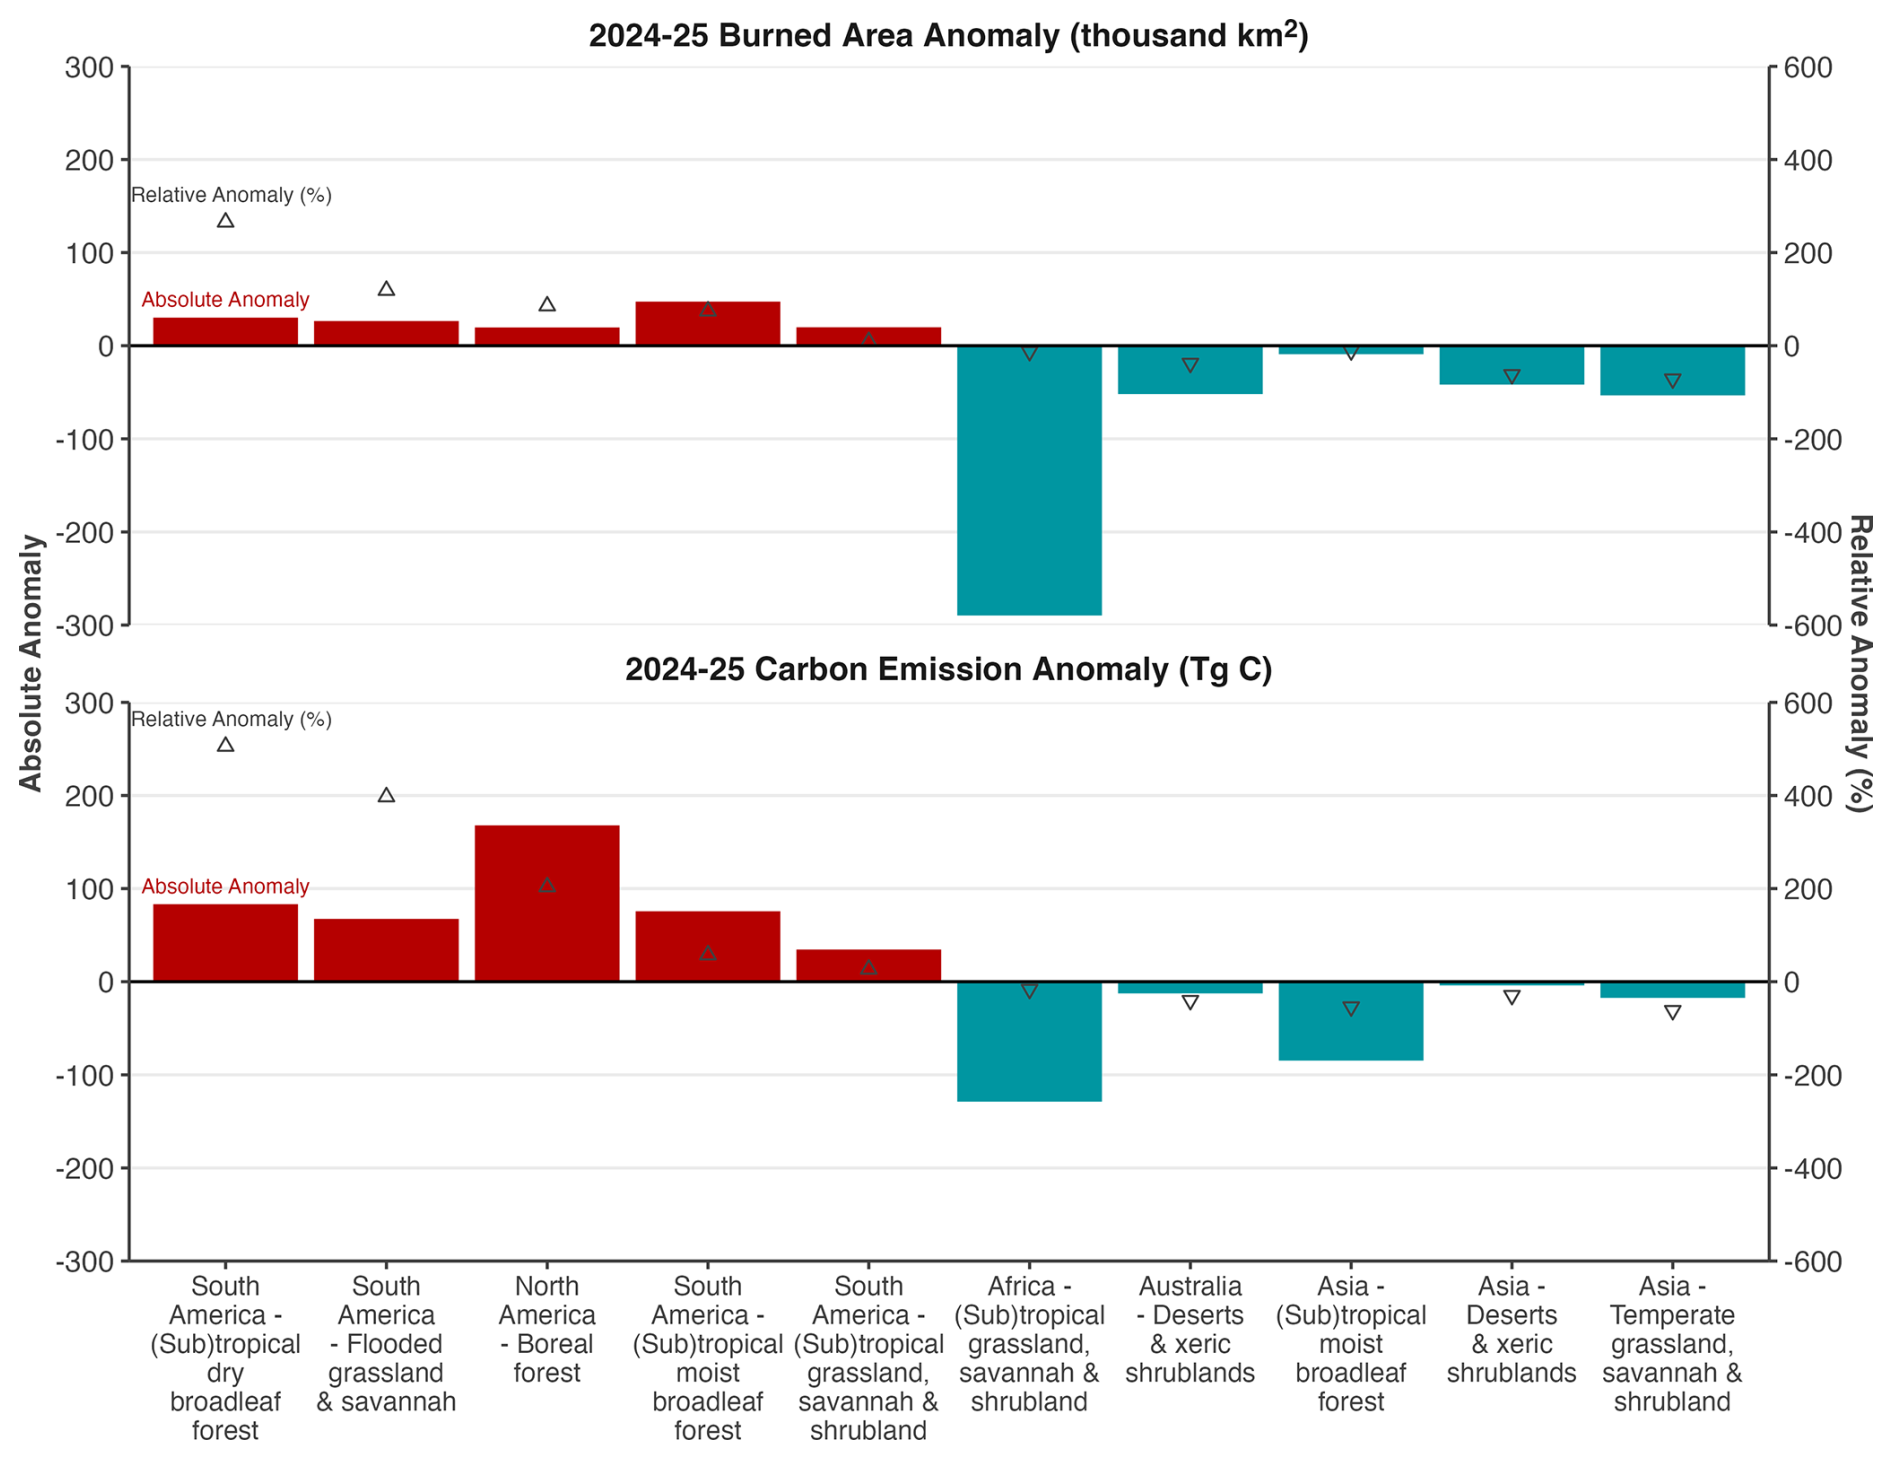
Figure 1Anomalies in burned area (BA) and carbon (C) emissions for selected continental biomes in the 2024–2025 global fire season (March 2024–February 2025), versus the average of prior fire seasons since 2002. The selected regions all experienced BA anomalies of over ±20 000 km2 or C emissions anomalies over ±30 Tg C during the 2024–2025 global fire season. Relative changes (%) are also marked by triangular symbols and can be read on the secondary axis. The notation “(sub)tropical” is an abbreviation of “tropical and subtropical” and is used consistently in this report.
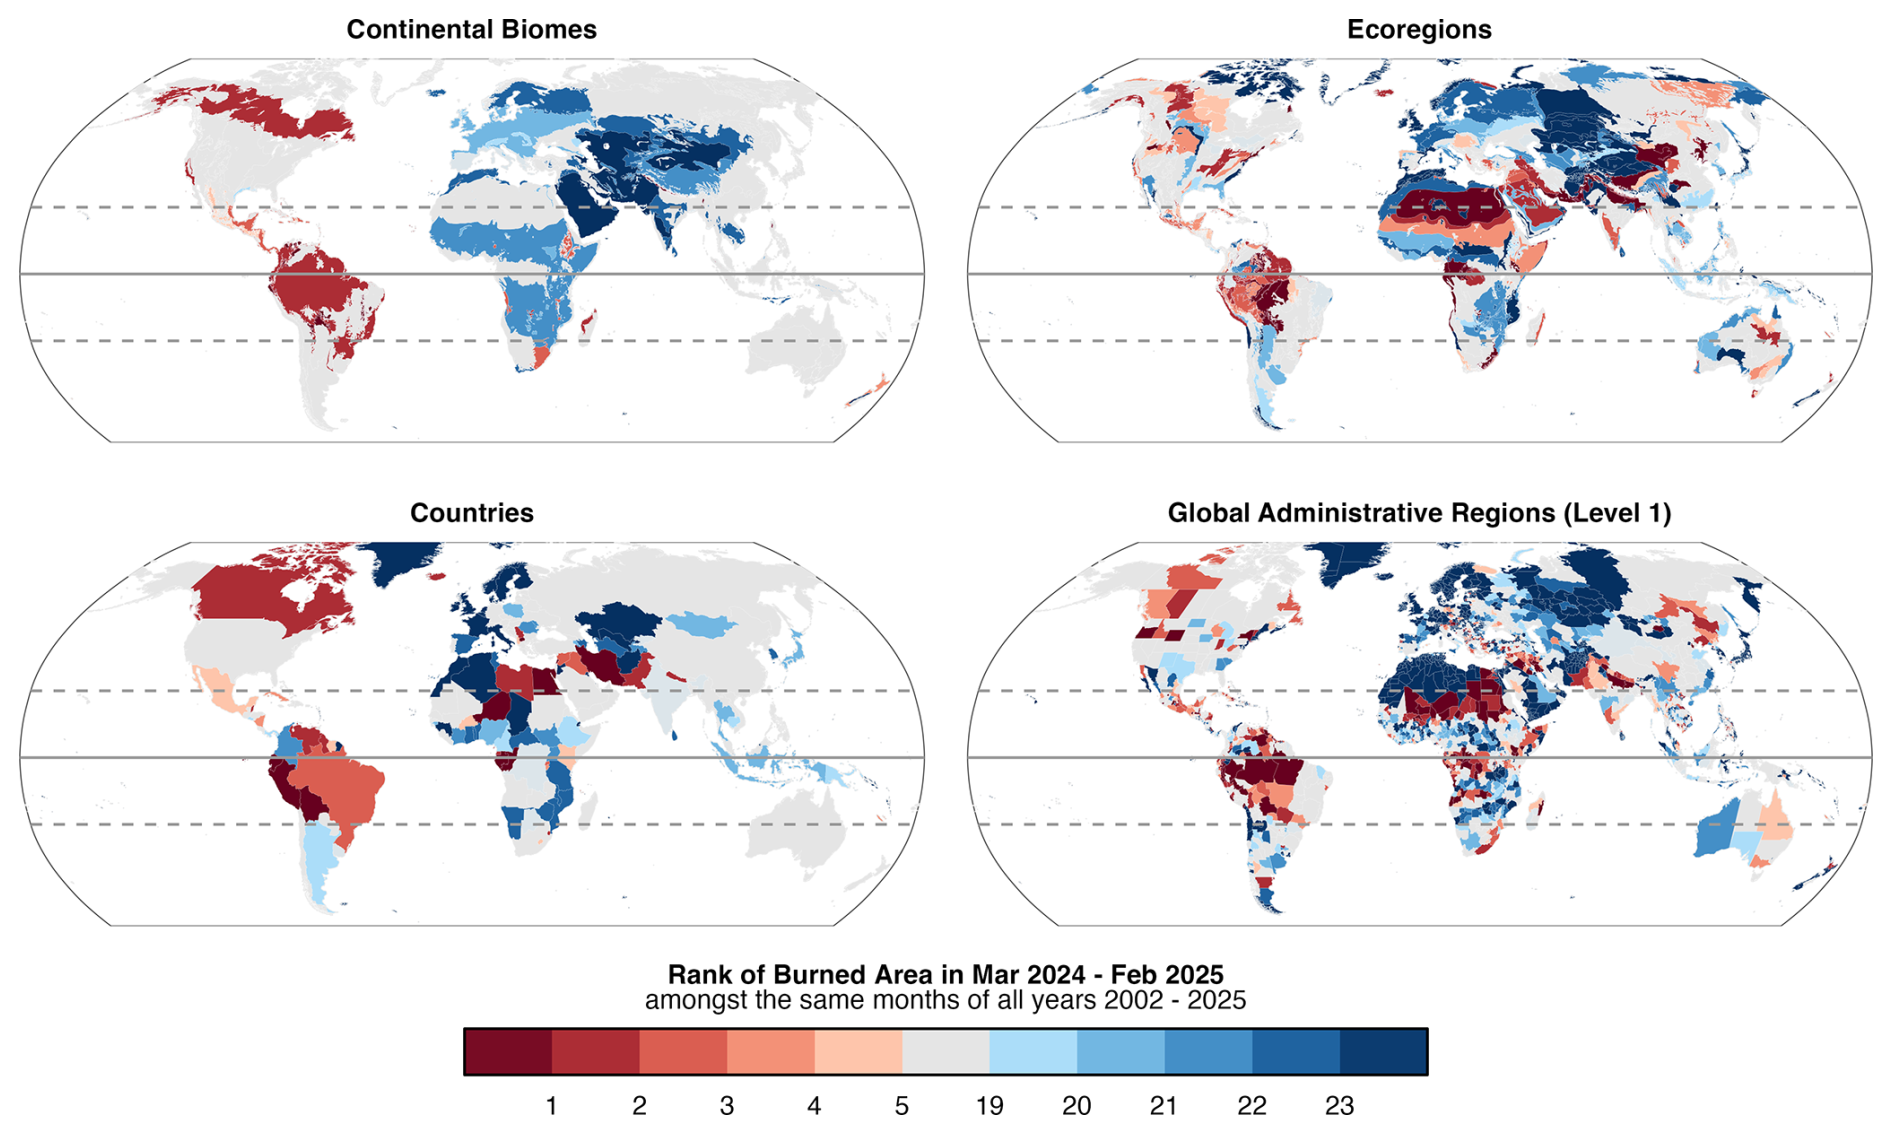
Figure 2Ranks of BA during March 2024–February 2025 versus previous March–February periods (n = 23 global fire seasons), at the scales of (top left) continental biomes, (top right) ecoregions, (bottom left) countries, and (bottom right) level 1 administrative regions. Results for regions with high-ranking (top 5 years) or low-ranking (bottom 5 years) events are highlighted. The timing of BA anomalies is shown in Fig. S4.
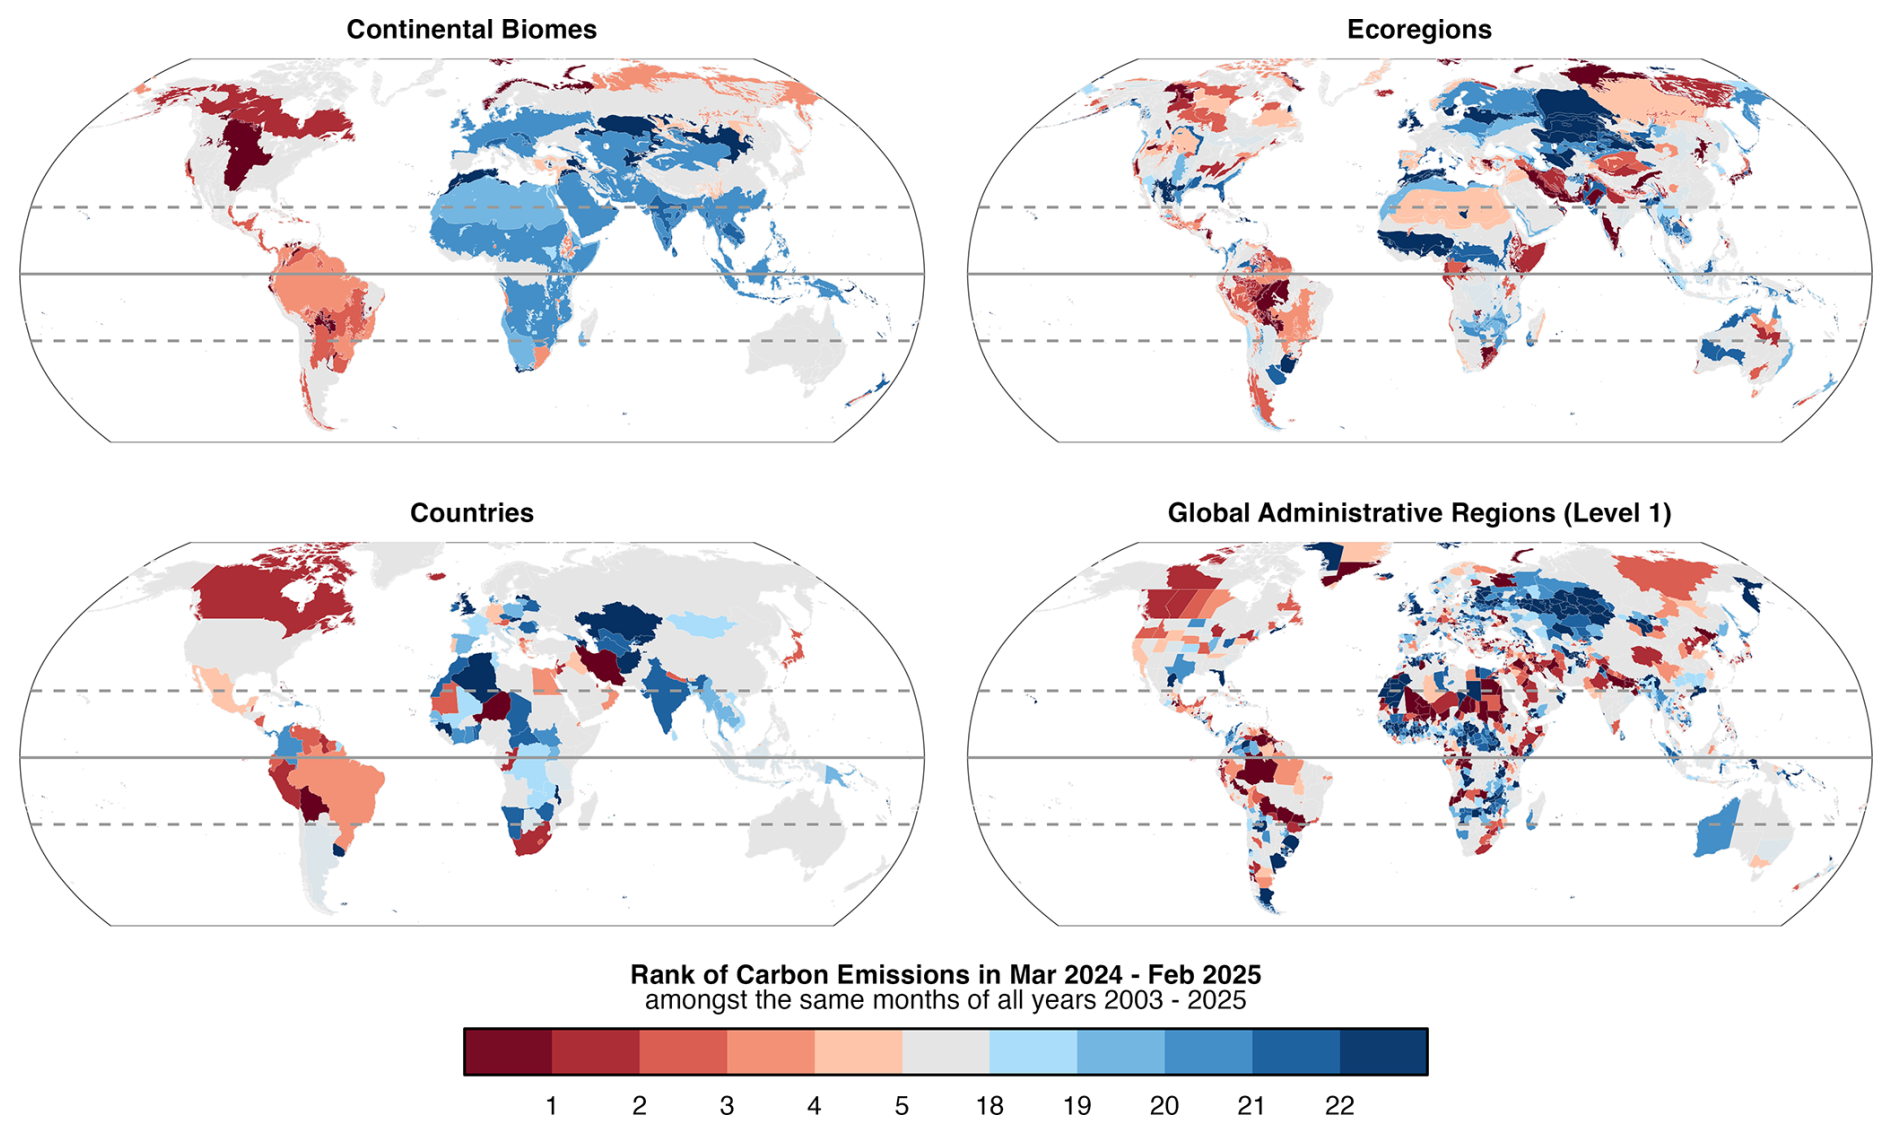
Figure 3Rank of fire C emissions during March 2024–February 2025 versus all March–January periods since 2003 (n = 22 global fire seasons), at the scales of (top left) continental biomes, (top right) ecoregions, (bottom left) countries, and (bottom right) level 1 administrative regions. We consider C emissions estimates from two products (GFAS and GFED), first calculating the mean emissions value from the two products and then ranking the values.
Table 2Summary of the largest positive anomalies in burned area (BA) during the 2024–2025 fire season on national and sub-national scales. Anomalies are expressed relative to all previous fire seasons 2002–2024 (n = 23). The table includes the top 10 countries ranked by the magnitude of their absolute BA anomalies and the top 30 level 1 administrative regions (e.g. states or provinces) grouped into countries where applicable. Extended data for all countries and region layers are available from Jones et al. (2025). Rows with bold text represent national values; rows with regular text are states or provinces.
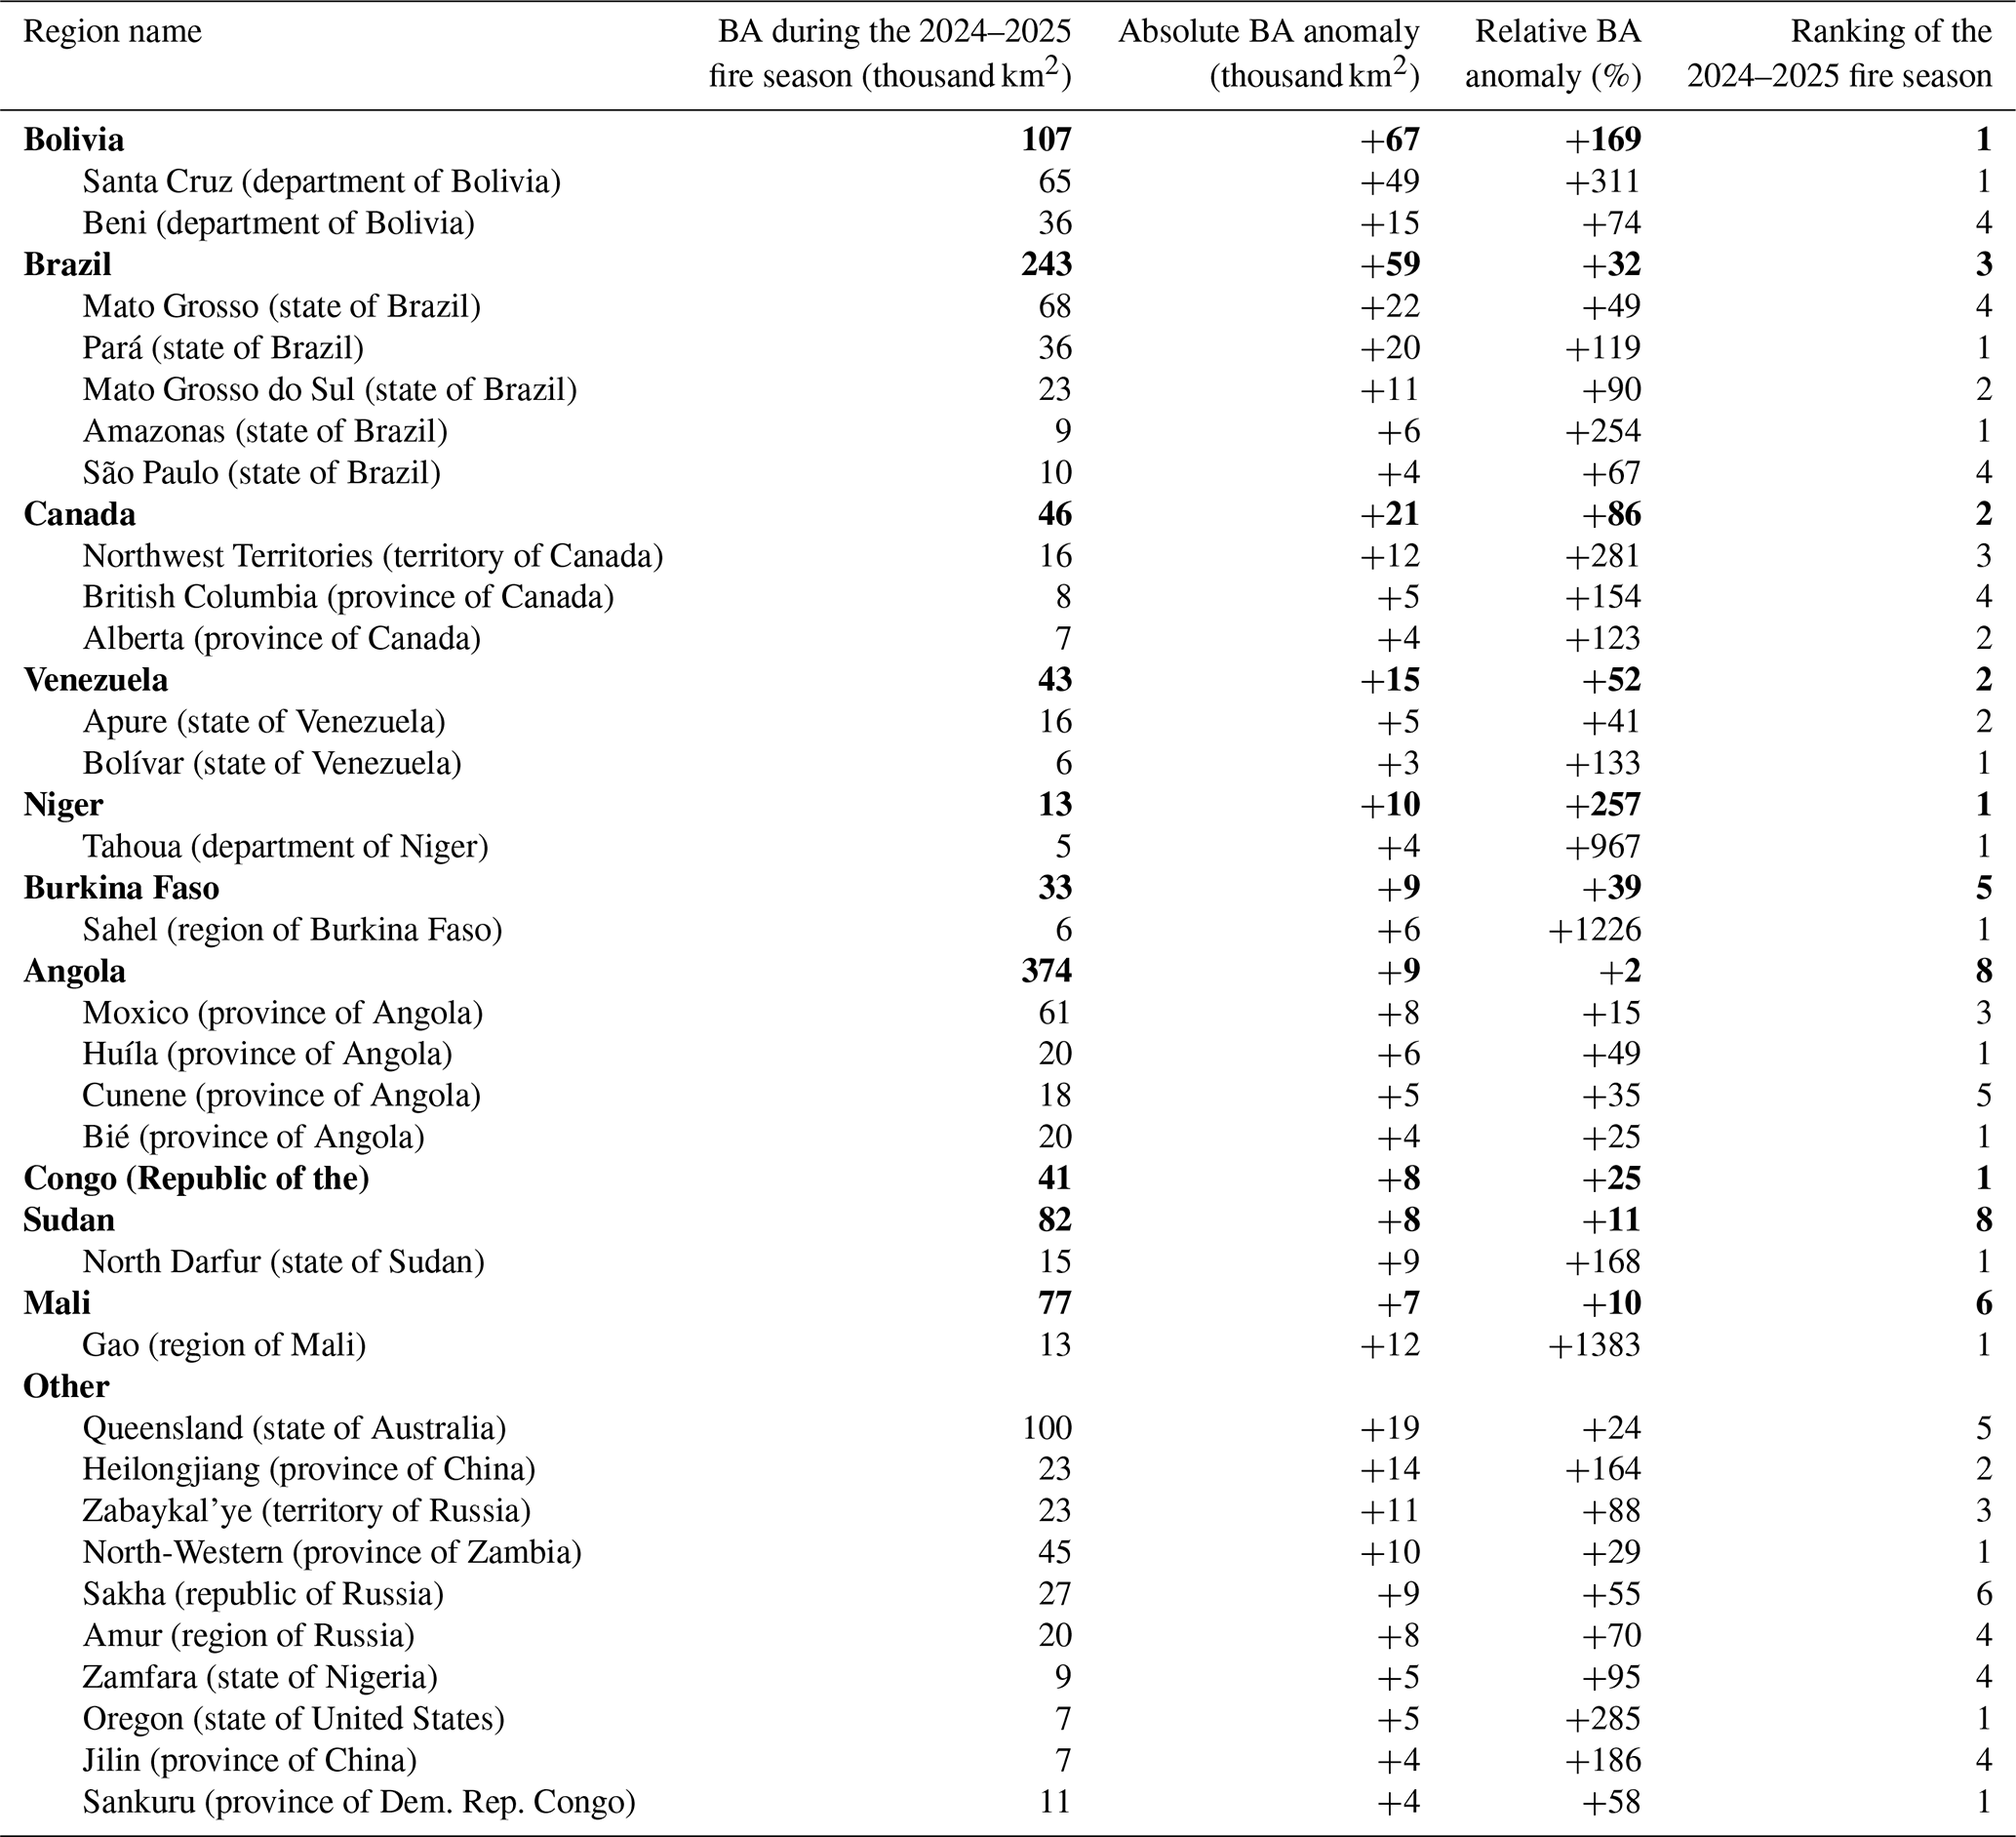
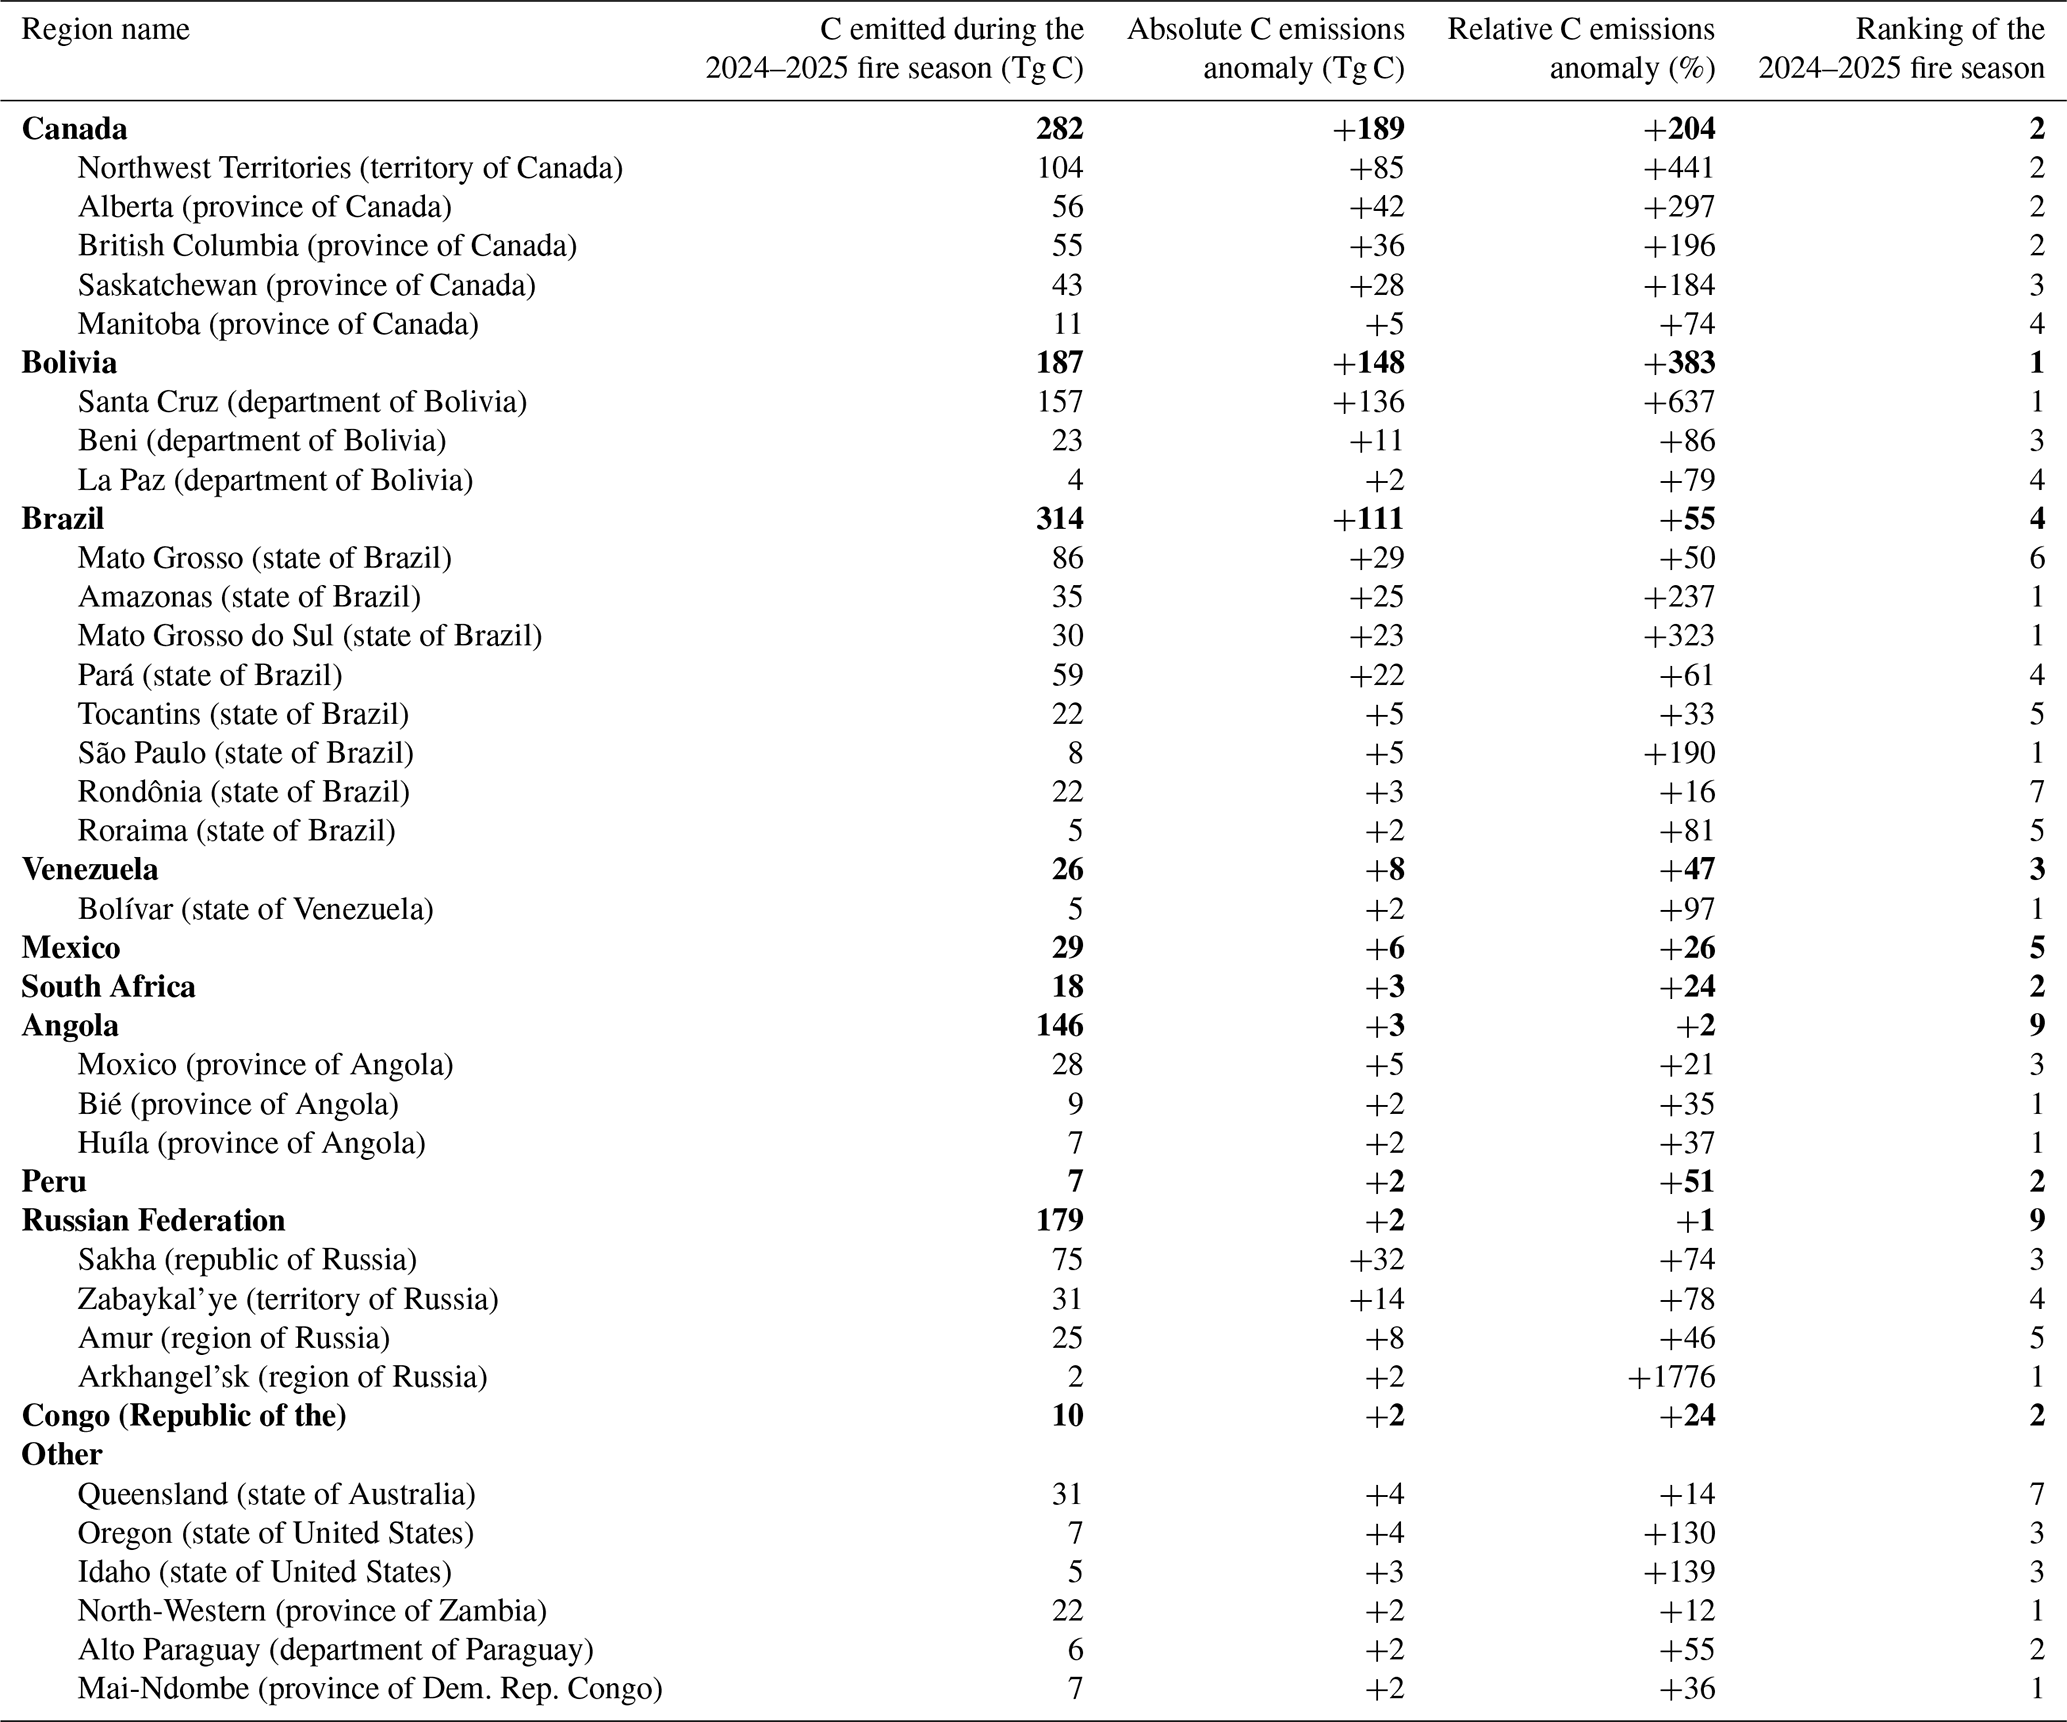
Table 3Summary of the largest positive anomalies in carbon (C) emissions during the 2024–2025 fire season on national and sub-national scales. Anomalies are expressed relative to all previous fire seasons 2003–2024 (n = 22). The table includes the top 10 countries ranked by the magnitude of their absolute C emissions anomalies and the top 30 level 1 administrative regions (e.g. states or provinces) grouped into countries where applicable. Extended data for all countries and region layers are available from Jones et al. (2025). Rows with bold text represent national values; rows with regular text are states or provinces.
An unprecedented fire season in South America
There were pronounced and widespread positive anomalies in BA in 2024–2025 across South America during 2024–2025 (Figs. 1, 2). Several South American biomes experienced extremely high or even record-setting BA in the 2024–2025 fire season (Fig. 1). The South American (sub)tropical dry broadleaf forests, principally comprising the Chiquitano and Chaco dry forests, experienced a record-breaking fire season, with the 42 000 km2 burned exceeding the average since 2002 by a factor of 3.6 and the 100 Tg C emitted exceeding the average since 2003 by a factor of 6. In the South American (sub)tropical moist broadleaf forests, principally comprising the Amazon rainforest, BA was 47 000 km2 (75 %) above average since 2002, which is the second-highest year on record, and C emissions were correspondingly 76 Tg C (58 %) above average. Finally, in the South American flooded grassland and savannah biome, which principally includes the seasonally inundated Pantanal region, BA was 26 000 km2 (119 %) above average since 2002, which is also the second-highest year on record, and C emissions were correspondingly 67 Tg C (397 %) above average. Across South America as a whole, BA was 120 000 km2 (35 %) above average, and C emissions were 263 Tg C (84 %) above average, producing the highest C emissions total on record for the continent. The spatial breadth of the record-setting or high-ranking anomalies in fire extent, emissions, size, rate or spread, and intensity (Figs. 2, 3, 4), as well as their impact on society and the environment, made the last fire season unprecedented on the continent. Appendix A6 discusses the unprecedented South American fire season of 2024–2025 in greater detail, including its impacts and regional context, relying also on information from regional fire monitoring systems and reporting.
Of South America's 115 ecoregions, 15 experienced new record levels of BA or C emissions during 2024–2025 (Figs. 2, 3), and 72 of South America's ecoregions experienced BA or C emissions in the top 3 years on record (Figs. 2, 3). Regions with record levels of BA or C emissions included the Chiquitano dry forests and the Pantanal wetlands of Bolivia and central-west Brazil. In nearby southern and southwestern parts of Amazonia, five moist forest and seasonally flooded (várzea) ecoregions also showed record-breaking BA or C emissions. The widespread positive BA anomalies in southern and southwest Amazonia, the Chiquitano, and the Pantanal were visible in the MODIS BA dataset from March and April 2024, peaking in August–November 2024 before subsiding around November (Fig. S4). In the Guianan shield region, encompassing much of Northeast Amazonia (north of the Amazon River and the Rio Negro tributary) and the Guianan forests of Venezuela, Guyana, and Suriname, four moist forest and swamp forest ecoregions also experienced record-breaking levels of BA or C emissions (Figs. 2, 3). Here, BA anomalies peaked around March–April before subsiding in May in northern parts but persisted through to December in areas closer to the Equator (Fig. S4).
At the national level within South America, the most significant anomalies in BA during the 2024–2025 fire season occurred in Bolivia, where BA was 67 000 km2 (169 %) above average, and fire C emissions were 148 Tg C (383 %) above average, the greatest values on record in the country (Figs. 2, 3; Tables 2, 3). In Brazil, BA was 59 000 km2 (32 %) above average, and emissions were 111 Tg C (55 %) above average during 2024–2025, making it the country's third-highest fire season on record for BA after 2007–2008 and 2010–2011. Additionally, Venezuela recorded an anomaly of +15 000 km2 (+52 %), its second-highest BA total after 2023–2024. Anomalies in these three countries are highlighted due to global totals of BA and C emissions (Tables 2, 3). On sub-national scales, the 2024–2025 fire season saw record-breaking BA or C emissions in four states of Brazil (Pará, Amazonas, Mato Grosso do Sul, and São Paulo), one department of Bolivia (Santa Cruz), and three states of Venezuela (Bolivar, Delta Amacuro, Monagas). Other record-breaking anomalies were seen at sub-national levels across South America (Figs. 2, 3), including in six regions of Guyana, seven regions of Peru, two districts of Suriname, and eight provinces of Ecuador, as well as some parts of Chile and Colombia (Figs. 2, 3), clearly signalling the large geographical breadth of the extremes on the continent during the 2024–2025 fire season.
For most regions of South America, the anomalies in BA and C emissions were explained by particularly large, fast-moving and intense fires, rather than above-average fire counts (Fig. 4). In Brazil, data on individual fire characteristics from the Global Fire Atlas showed new record fire sizes at the 95th percentile threshold for six states (Amapá, Mato Grosso, Mato Grosso do Sul, Paraná, Rondônia, and São Paulo). In Mato Grosso, Mato Grosso do Sul, and São Paulo, 95th percentile fire sizes were 105 %–266 % above average, driving record-breaking BA despite fire counts being 18 %–54 % below average. Meanwhile, three states (Mato Grosso, Mato Grosso do Sul, and São Paulo) all saw the fastest rates of growth at the 95th percentile threshold, and five states (Mato Grosso do Sul, Paraná, Rio de Janeiro, Roraima, and São Paulo) experienced the most intense fires on record (measured per the average fire's 95th percentile intensity; Fig. 4). Unlike in other parts of Brazil, the fire count anomaly (+154 %) was record-breaking in Amazonas during 2024–2025, combining with the 95th percentile fire size anomaly (+60 %) to produce the record-breaking BA. Similar patterns were observed across South America, with anomalies in fire size, rates of growth, and intensities generally being more widespread than anomalies in fire count (Fig. 4). Some notable exceptions were five regions of Peru, five regions of Ecuador, three regions of Colombia, and three regions of Guyana, where record-setting fire counts were observed, as well as in parts of Venezuela where high-ranking fire counts occurred (Fig. 4).
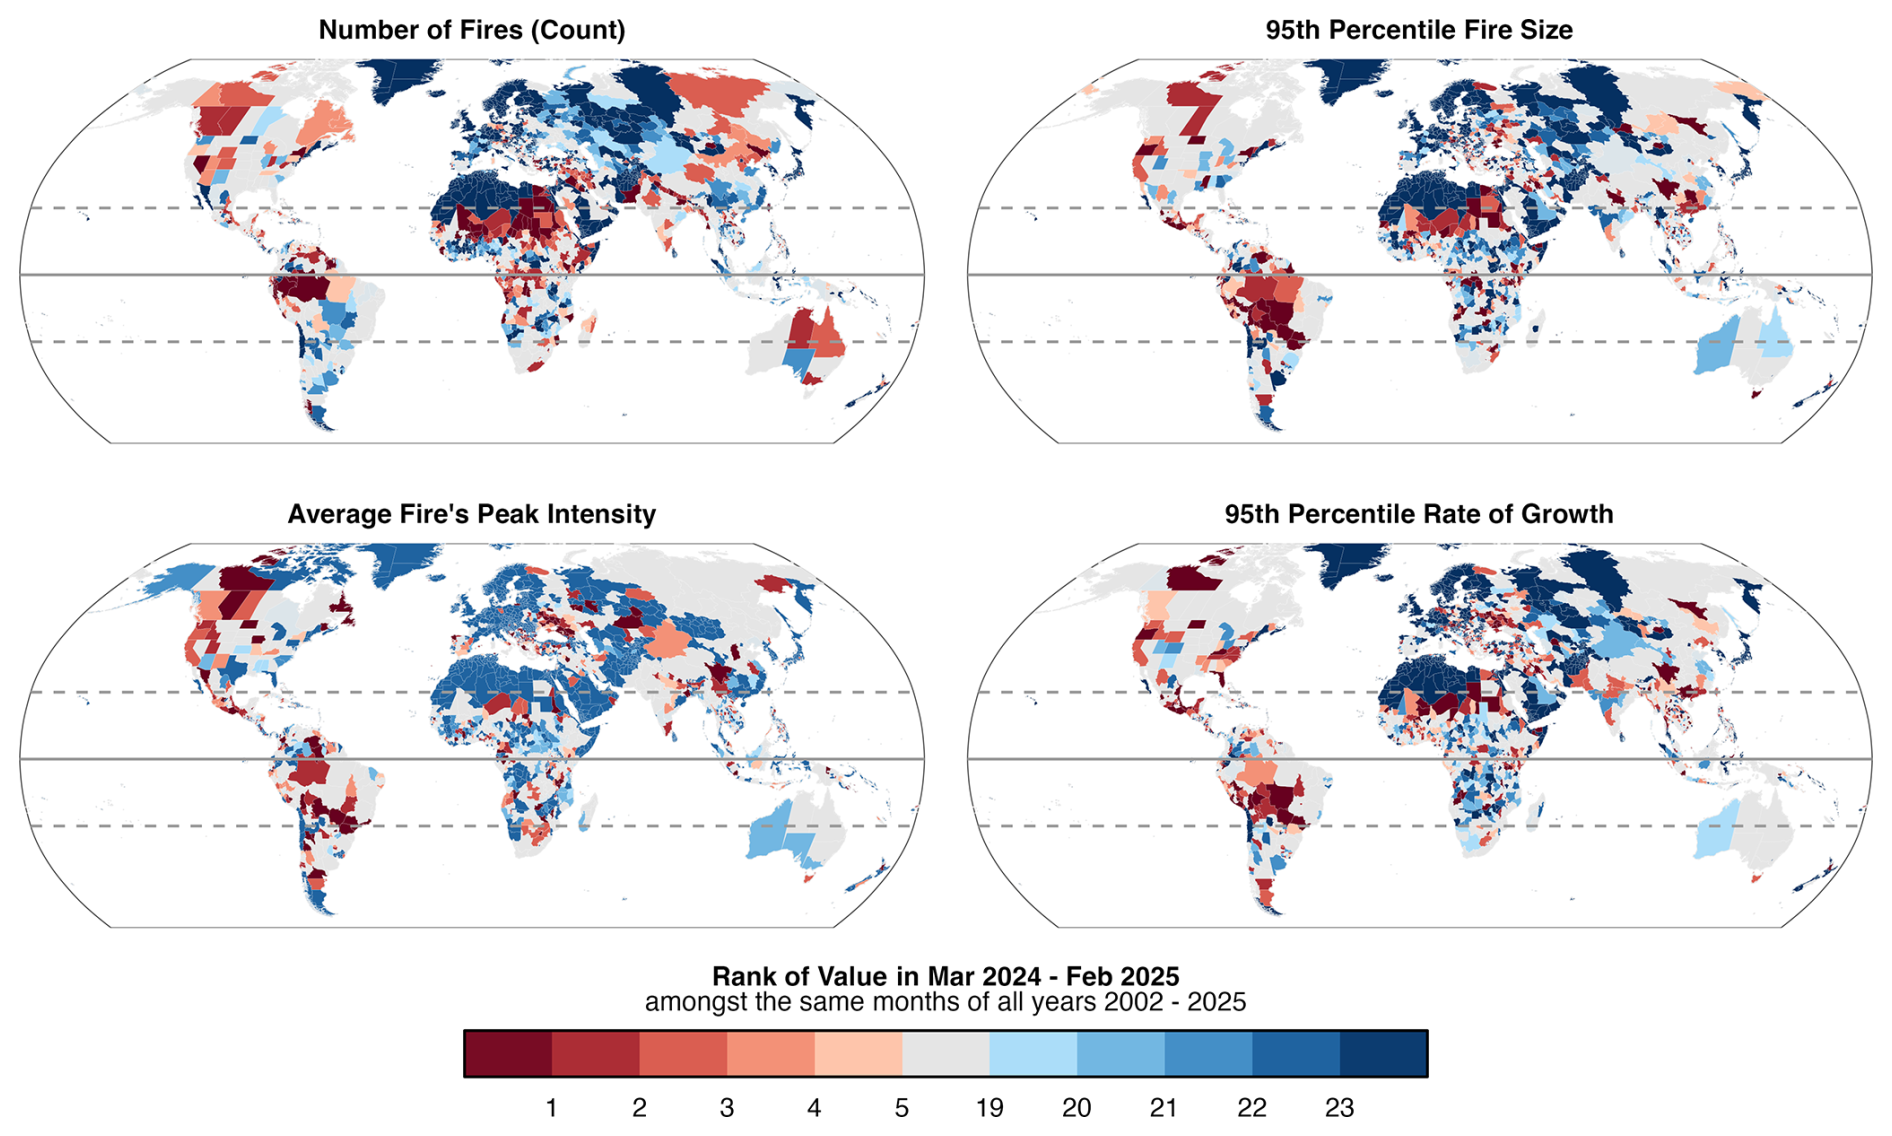
Figure 4Ranks of selected individual fire properties during the March 2024–February 2025 fire season versus previous March–February periods (n = 23 global fire seasons), including (top left) fire count, (top right) 95th percentile fire size, (bottom left) the average value of a the peak intensity (95th percentile FRP within fire perimeters) considering all regional fires, and (bottom right) 95th percentile daily rate of growth. Results are shown at the scale of states or provinces (GADM administrative level 1 regions).
A second consecutive extreme fire year in North America
The 2024–2025 fire season was the second-highest fire year on record for BA and C emissions in the North American boreal forests, with BA 86 % above average since 2002 (+20 000 km2) and C emissions 3 times the average since 2003 (+168 Tg C). These large anomalies follow the record-breaking 2023–2024 fire season when BA was 5 times above average, and C emissions were 7 times above average, marking 2 consecutive years of extreme fire activity in the North American boreal forests. Elsewhere, BA extent was in the top 3 years on record in the North American (sub)tropical moist broadleaf forest (concentrated in Latin America) and in the North American Mediterranean forests, woodlands, and scrub (concentrated in Southern California). Across North America as a whole, BA was 31 000 km2 (35 %) above average, and C emissions were 194 Tg C (112 %) above average, the second-highest totals on record for both metrics.
Of North America's 189 ecoregions, 11 experienced new record levels of BA or C emissions during 2024–2025 (Figs. 2, 3), with these regions principally concentrated in northwest Canadian taiga and tundra, mountain forests of the northwest United States and southwest Canada (principally in Oregon and Alberta), and moist tropical forest ecoregions of Mesoamerica (principally in Mexico) but also including the Central Valley grasslands of California and the northeast coastal forests of the United States. More broadly, but with a similar geographical distribution, 44 North American ecoregions experienced BA or C emissions in the top 3 years on record (Figs. 2, 3). The positive BA anomalies in extratropical North America were visible in the MODIS BA dataset from April 2024 in western regions (e.g. mountain forests of the northwest United States and southwest Canada), July–August 2024 in the central regions (e.g. Canadian tundra and taiga), and late into the 2024 summer in eastern regions (e.g. northeast coastal forests; Fig. S4). Thereafter, BA anomalies were consistently observed through summer (July–September 2024) and in some cases persisted through October 2024.
In Canada, BA was 21 000 km2 (86 %) above average, and C emissions were 189 Tg C (204 %) above average during 2024–2025, marking the country's second-highest fire season on record immediately following the record-breaking fire season of 2023–2024 (Figs. 2, 3; Tables 2, 3). Notably, the anomalies of 2024–2025 were concentrated in the western Canadian states of British Columbia, Alberta, and northwest Territories, which all saw the second-highest BA or C emissions on record, with large anomalies in the range of 120 %–440 %, second only to the 2023–2024 fire season. More generally, record levels of BA or C emissions were less spatially extensive in North America than in South America, though the US states of Oregon, Wyoming, and New York saw record BA, as did several Mesoamerican states of Mexico, Guatemala, and Costa Rica (Figs. 2, 3).
For western Canada, individual fire metrics from the Global Fire Atlas were also anomalous and highly ranked amongst previous years but generally fell short of the records set in the 2023–2024 fire season (Fig. 4). For example, fire counts were 170 %–190 % above average in Alberta and British Columbia, ranking second (behind 2023–2024), whereas anomalies in 95th percentile fire size and rate of growth were not particularly large. Meanwhile, the explanation for the anomalous BA in some states of the northwest United States was not consistent, with some states experiencing above-average fire counts, some experiencing above-average fire sizes, but few experiencing both.
Appendix A4 provides a more complete summary of the fire season in North America based on the regional panel assessment.
A mixed picture in Africa
For the second consecutive year, BA was around 290 000 km2 (12 %) below the average of previous fire seasons in the African (sub)tropical grassland, savannah, and shrubland biome and the third lowest on record (Fig. 2) but still contributed 56 % towards the global BA total and 86 % towards total BA in Africa. BA anomalies in the African savannahs have a significant influence on the continental BA anomalies, and indeed BA across Africa as a whole was 313 000 km2 (12 %) below average. Despite the low fire activity in Africa during 2023, several exceptions emerged in both central and northern Africa. Record levels of BA were observed in several parts of the Congo Basin (Figs. 2, 3) due to an unusually high number of fires (Fig. 4). BA in the Republic of Congo was 25 % above average, the highest on record, and similarly fire C emissions were 25 % above average (Tables 2, 3). In the Democratic Republic of the Congo, the Mai-Ndombe and Sankuru provinces each experienced record levels of BA or fire C emissions, with anomalies in the range of 36 %–58 % (Tables 2, 3). These anomalies were centred on several western ecoregions of the Congo Basin, including the Atlantic Equatorial coastal forests where BA was more than triple the annual mean, Western Congolian swamp forests where BA was twice the annual average, the Central Congolian lowland forests where BA was 77 % above average, and the Northwestern Congolian lowland forests where BA was 55 % above average.
Likewise, several northern regions of Angola experienced record BA (Figs. 2, 3, Tables 2, 3). In northern Africa, Mali, Niger, Chad, and Sudan all saw high BA in various states or regions that encompass the semi-arid Sahel region, though these anomalies notably occur against a low baseline in most cases due to the typically sparse vegetation fuel loadings in such regions. Appendix A1 provides a more complete summary of the fire season in Africa based on the regional panel assessment.
A low fire year in Eurasia
Asian and European biomes generally experienced a low fire year that contributed towards the below-average global BA total in 2024–2025 (Figs. 1, 2). BA was around 50 000 km2 (71 %) below average in the Asian temperate grassland, savannah, and shrubland biome, aligning with unusually low number of fires (44 % below average) and unusually low fire sizes (95th percentile fire size was 42 % below average). BA was also 42 000 km2 (62 %) below average in the Asian xeric shrublands, with fire counts 22 % below average and 95th percentile fire sizes 39 % below average. Elsewhere, BA was 9 000 km2 (11 %) below average in the Asian (sub)tropical moist broadleaf forests, with fire counts and sizes both 10 %–15 % below average. The below-average fire extent in all of these regions translated into below-average C emissions, though not in direct proportion because the combustion of vegetation per unit BA also varied compared with previous years (Fig. 1). For example, while BA was 11 % below average in the Asian (sub)tropical moist broadleaf forests, C emissions were 54 % (85 Tg C) below average signifying that areas that did burn tended to do so with anomalously low severity. Across Asia as a whole, the total BA was 99 000 km2 (26 %) below average during 2024–2025, the fourth lowest annual total on record, and C emissions were 119 Tg C (28 %) below average, the fifth lowest on record.
While most regions of Asia experienced a low fire year in general, there were some notable exceptions. Many states of northeast India and Nepal experienced high-ranking or record-breaking levels of BA or C emissions (Figs. 2, 3), highlighting a coherent regional-scale anomaly during 2024–2025, similarly, in northeast Asia where two provinces of China (Heilongjiang and Jilin; Table 2), two provinces of South Korea, and seven prefectures of Japan experienced record-breaking BA or C emissions, and many neighbouring regions likewise experienced high-ranking fire years (Figs. 2, 3). Appendix A2 provides a more complete assessment of the fire season in Asia.
Though less impactful on the global BA and C emissions totals than in the vast Asian biomes, the 2024–2025 fire season was notably another low fire year in Europe. For example, BA was 13 000 km2 (59 %) below average in the European temperate broadleaf and mixed forests, chiefly because the number of fires was 72 % below average. BA was also 12 000 km2 (40 %) below average in the European temperate grassland, savannah, and shrubland biome, chiefly because the number of fires was 44 % below average. Across Europe as a whole, the total BA was 30 000 km2 (49 %) below average during 2024–2025, the fourth lowest annual total on record, and C emissions were 5 Tg C (22 %) below average, the seventh lowest on record.
Despite the low fire activity in Europe, there were several exceptions in southeast Europe. Regions of Serbia, North Macedonia, and western Türkiye experienced record-high BA or C emissions in 2024–2025. Further north, several eastern regions of Ukraine experienced record-breaking fire C emissions, with some suggesting a link between elevated ignitions and the ongoing conflict in the country (European Commission Joint Research Centre, 2025). Appendix A3 provides a more complete assessment of the fire season in Europe based on regional panel assessment.
2.2.2 Focal events of this report
In this year's report, we identify four focal events with global relevance for further study across Sects. 4–6. The four events are Northeast Amazonia, the Pantanal–Chiquitano, Southern California, and the Congo Basin (Fig. 5), and our reasons for selecting these particular events are detailed below. In Sects. 4–6, our analyses explain the causes of each of the events (Sect. 4), evaluate the predictability of the events (Sect. 4), attribute the events to climate change and land-use factors (Sect. 5), and predict the likelihood of similar events under future climate-change scenarios (Sect. 6).
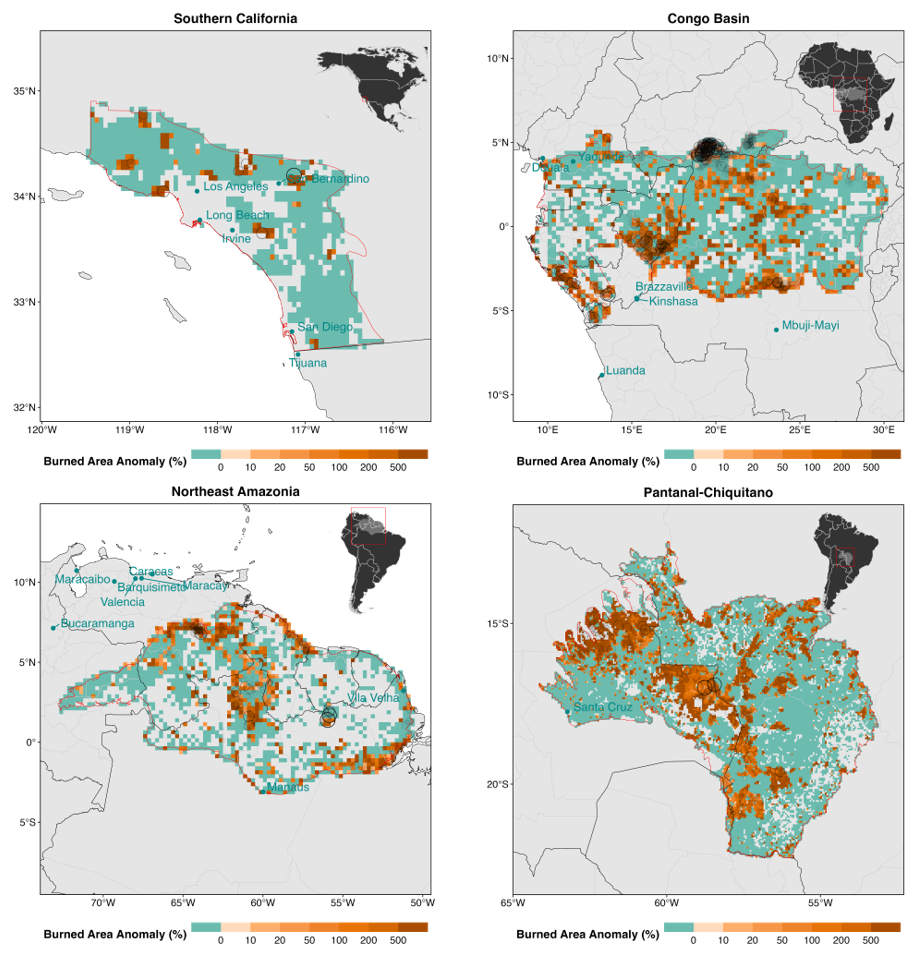
Figure 5Spatial distribution of burned area (BA) anomalies during 2024–2025 relative to the mean annual BA (%). BA is shown at 0.25° resolution (Northeast Amazonia and Congo Basin) or 0.05° resolution (Pantanal and Southern California). Fire ignition points (open circles) from the Global Fire Atlas are also shown for the fires with sizes in the upper quartile regionally during 2002–2025, with the largest fires for each region displayed as the largest and most visible circles.
Northeast Amazonia (January–March 2024)
Study area and fire regime
The Northeast Amazonia region here refers to the moist tropical forest ecoregions northeast of the Amazon River and the Rio Negro tributary, mostly including Amazonia but also including the Guianan Shield forests that extend into Venezuela, Guyana, Suriname, and French Guiana (Fig. 5). Fire regimes in Northeast Amazonia reflect interactions among ecosystems, human activity, and climate. Ecological heterogeneity, spanning humid and floodplain forests, natural grasslands, and savannah formations, produces marked variation in fire impacts. Savannahs and forest–savannah transition zones in Roraima, Venezuela, and the Guianas are relatively fire-adapted, historically experiencing low-intensity surface burns at multi-year intervals (Alvarado et al., 2020; Pivello et al., 2021). Yet their resilience declines under more frequent or intense burning. Fire-sensitive ecosystems such as humid forests and wetlands are even more vulnerable, with elevated fire pressure threatening long-term stability and biodiversity (Alvarado et al., 2020). In these ecosystems, anthropogenic climate forcing is most likely driving increases in fire activity. Most ignitions now arise from human use, particularly pasture management, with escaped fires the dominant source of wildfires (Cano-Crespo et al., 2015). Burning follows distinct seasonal patterns: August–October in the southern Amazon (Jakimow et al., 2018), December–January in coastal savannahs (Brunel et al., 2021), and January–March in the northeast (Carvalho et al., 2021). These dynamics help explain the late peak of the 2024 event. Climatic variability remains the principal temporal control (Brando et al., 2020; Berenguer et al., 2021), while land-use practices and socioeconomic drivers shape fire use (Cammelli et al., 2020). Addressing these coupled drivers requires management that integrates ecological context, community practices, and regional policy frameworks (Bilbao et al., 2019).
Extreme event
We specifically target the period January–March 2024. In this region, as in other parts of the northern hemisphere tropics, our global March–February fire season definition can be misaligned with local fire seasonality, specifically where fire seasons span 2 calendar years. Although this event straddles the boundary between the 2023–2024 and 2024–2025 fire seasons, we include it here to ensure that significant fire activity is not excluded solely due to the constraints of our reporting framework. Section 2.2.1 discusses the regional anomalies that led this region to be identified (e.g. Figs. 2, 3), with further review of the fire season provided by our expert panel in Appendix A6. It emerges as a major event of global relevance for the following reasons:
-
Record-breaking burned area in forests. The area of forest burned was more than 4 times (+332 %) the average and the highest on record, while total BA (including non-forests) was also 67 % above average. In forests, 8 continuous months of the fire season (March–September 2024) had BA above the climatological mean, peaking in March 2024. The most pronounced anomalies occurred in the northern Amazonian savannahs around Roraima, the forest–savannah transition zones of northern Venezuela and southern Guyana, and the coastal ecosystems near the Guyana–Suriname border (Fig. S5).
-
Carryover from the previous fire season. A new record for total BA had been set in the previous fire season (2023–2024) mostly due to an anomalously high count of large fires in non-forests. The transition of anomalously high fire activity into forest environments during the 2024–2025 fire season was a distinguishing factor.
-
Anomalous fire counts. The large BA anomalies were explained by an anomalously high number of fires, with 1500 (52 %) more fires than the average fire season.
-
Widespread forest loss. The highest rates of forest loss (stand-replacing fire extent) since 2016 were recorded in Amazonia with 60 % attributed to wildfires.
-
Disproportionate impact on rural, Traditional populations and Indigenous territories. Fires degraded air quality and destroyed crops, homes, and native vegetation, intensifying food and water insecurity for those living in the region, including Indigenous peoples. The compounded effects of fire and drought deepened the humanitarian crisis in the Yanomami Territory, and local organisations estimate at least 70 000 people across urban and rural areas without access to clean water.
Pantanal and Chiquitano (August–September 2024)
Study area and fire regime
The Pantanal–Chiquitano region here refers to the areas draining into the Pantanal (IBGE, 2021), the world's largest tropical wetland area, and the Chiquitano dry forest ecoregion in Bolivia (Fig. 5).
In the Pantanal, the annual cycle of flooding (October–March) and drying (April–September) plays a central role in shaping fire regimes. During the wet season, extensive inundation keeps most of the landscape too moist to burn. As waters recede, grasses and savannah vegetation dry out, creating windows of flammability, but under normal conditions fires remain patchy and largely restricted to grasslands, savannahs, and wetland margins (Damasceno-Junior et al., 2021). When this cycle is disrupted, often by multi-year droughts, large areas stay dry for longer, exposing grasslands, forests, and even peat-rich soils to extensive burning. In the Chiquitano, surface fires are the dominant type, frequently originating in deforested or agricultural areas before spreading into forest edges. Human activity is the primary ignition source in both regions (Romero-Muñoz et al., 2019; Menezes et al., 2022), with escaped agricultural and pasture-renewal fires driving many of the catastrophic events of recent years. These coupled processes illustrate that fire activity in the Pantanal and Chiquitano is no longer governed by climate alone but increasingly by altered hydrology, land-use frontiers, and the intensity of human fire use (Barbosa et al., 2022).
Extreme event
We specifically target the period January–March 2024, when the most substantial anomalies in BA were observed (Fig. S6). Section 2.2.1 discusses the regional anomalies in Brazil and Bolivia that led this region to be identified (e.g. Figs. 2, 3), with further review of the fire season provided by our expert panel in Appendix A6. It emerges as a major event of global relevance for the following reasons:
-
Record-breaking burned area. BA in the Pantanal–Chiquitano region was almost triple (+196 %) the annual average and the highest on record. This anomaly included a +466 % BA anomaly in forests. There were 8 continuous months (March–October) with BA above the climatological mean, oriented around a peak in August 2024.
-
Record-breaking carbon emissions. Fire C emissions were 6 times (+502 %) the annual mean, driven up by the large anomaly in forest fire C emissions in the period.
-
Record fire size and spread. The 95th percentile fire size for the region was over 3 times (+226 %) the average and the 95th percentile rate of growth was 88 % above average, signifying that large, fast-spreading fires drove up the anomalous BA total in the region.
-
Severe air quality degradation. Over 900 µg m−3 of fine particulate matter (PM2.5) was recorded in September 2024, which is 60 times above WHO standard.
-
Economic losses. Agribusiness losses due to wildfires reached BRL 1.2 billion (∼ USD 222 million) in the Pantanal, the biome's main economic sector.
-
Challenges in response. 78 d of firefighting effort which involved multiple actors was marked by significant access and logistical challenges in remote regions, making it difficult to reach and support isolated communities.
Southern California (January 2025)
Study area and fire regime
Southern California here refers to the Mediterranean portions of seven counties in California (Los Angeles, Orange, Riverside, San Bernardino, San Diego, Santa Barbara, and Ventura; Fig. 5). The Mediterranean portions are defined based on the ecoregional definition of the US Environmental Protection Agency (US EPA, 2025).
Southern California's fire regime reflects the interaction of Mediterranean-climate vegetation, frequent extreme weather, and dense human presence. The region is dominated at lower elevations by chaparral shrublands that historically experienced fire return intervals of several decades and frequent-fire forests at higher elevations. Southern California's chaparral shrubland ecosystem is distinctly different from the frequent-fire dry forests elsewhere in the western United States, where over-suppression is often discussed as a driver of extreme burning (Keeley and Fotheringham 2001) Over-suppression is less likely to have influenced the January 2025 fires. Pre-colonial Indigenous burning shaped fire patterns and fuel distribution (Keeley, 2002), but Euro-American settlement and ongoing urban expansion have altered ignition patterns and increased the frequency of fire (Keeley et al., 1999). Fire suppression resources are extensive but overwhelmed during extreme fire weather, particularly where land use and climate “whiplash” between extremely wet and dry years produce heavy fuel loads (Swain et al., 2025b). Consequently, the contemporary fire regime is characterised by highly variable burned area, frequent wildland–urban interface impacts, and substantial sensitivity to meteorological extremes such as katabatic “Santa Ana” winds. This context highlights that while human activity strongly influences fire occurrence and exposure, the underlying bioclimatic and ecological conditions continue to govern fire behaviour in Southern California (Jin et al., 2015; Parks et al., 2015).
Extreme event
Although California as a whole did not experience a particularly strong fire season in 2024–2025 from the vantage of BA or fire C emissions (e.g. Figs. 2, 3), the regional expert panel identified the numerous wildfires affecting LA and surrounding counties in January 2025 as a major event of the 2024–2025 fire season (see Appendix A4), with the Palisades and Eaton fires in particular leading to loss and damage in the suburbs of LA. We specifically target the period January 2025 when the most substantial anomalies were observed (Fig. S7). Southern California emerges as a major event of global relevance for the following reasons:
-
High fatalities and structure loss. Over 11 750 homes were destroyed across Los Angeles County, and at least 31 lives were lost (County of Los Angeles Medical Examiner, 2025). The Palisades Fire severely damaged or destroyed 5614 homes, while the Eaton Fire severely damaged or destroyed 6150 homes and hundreds more commercial structures (CALFIRE, 2025). Notably, most of the destroyed structures were in moderate- to high-density suburban and urban neighbourhoods, not on large lots in rural, low-density areas, as has historically been the case for structure loss wildfires in the United States.
-
Mass evacuations. At least 153 000 people were evacuated, with up to 200 000 under evacuation warnings or orders during the peak of the crisis (USGS, 2025b; Kim et al., 2025; Wikipedia, 2025).
-
Air quality impacts. Air and municipal water quality were heavily impacted by the fires, contributing to negative health outcomes for thousands. During the fires, peak PM2.5 levels were recorded at 483 µg m−3 (an order of magnitude greater than the 35 µg m−3 daily standard set by the US Environmental Protection Association), part of a prolonged period of hazardous air quality (California Air Resources Board, 2025. Over 400 excess deaths in Los Angeles County have since been attributed to exposure to poor air quality during January 2025 (Paglino et al., 2025).
-
Water quality impacts. Municipal water supplies were considered unsafe for several weeks following the fires for tens of thousands of residents in the affected areas (Pasadena Office of the City Manager, 2025). As a political response to the fires, over 8.3×10⁶ m3 of water was released from federal reservoirs over 200 km away from Los Angeles in central California, a move which has been criticised because this water did not supply Southern California, because it happened well after the fires were controlled, and because it would otherwise have been used for irrigation in the Central Valley (Levin et al., 2025).
-
Exceptional economic loss. Total economic losses were estimated at USD 140 billion including property destruction, health costs, business disruption, and infrastructure impacts, making this one of the most costly wildfire events in US history (Los Angeles County Economic Development Corporation, 2025; Li and Yu, 2025).
-
Wider economic disruption. The fires are projected to cause USD 4.6–8.9 billion in lost economic output over 5 years, 25 000–50 000 job years lost, and labour income reductions of USD 1.9–3.7 billion (Los Angeles County Economic Development Corporation, 2025). The Palisades and Eaton fires affected almost 2000 businesses (Los Angeles County Economic Development Corporation, 2025). As LA is also the largest port on the US Pacific coast, the fires impacted broader supply chains that run through the port of LA (Terrill, 2025).
-
High insured losses. Industry estimates have placed insured losses in the range of to USD 20–75 billion (Li and Yu, 2025; Morningstar DBRS, 2025; Dalton et al., 2025), placing substantial additional stress on the already volatile home insurance market in California and on most global reinsurers.
-
Housing and affordability crisis. Thousands of affordable housing units were destroyed, worsening Southern California's housing shortage, displacing large numbers of lower-income residents, and exacerbating the problem of homelessness in the region (Mattson-Teig, 2025; Li and Yu, 2025; Booth, 2025). This triggered a ripple mass displacement into both surrounding communities and beyond in the months following the fires (New York Times, 2025).
-
Debris flows. The geology of Southern California is highly conducive to erosion and debris flows after wildfires. Several debris flows following high-intensity rainfall events in the weeks after the fire produced further damage and required hundreds of additional evacuations in and near the affected areas (USGS, 2025a).
The fires in Southern California have already been subject to several detailed investigations, which found that the fires were driven by exceptionally late onset of winter rains that extended the fire season into January, unseasonably warm winter temperatures, fuel build-up from very wet conditions in the prior 2 years, and powerful Santa Ana winds locally exceeding 130 km h−1, creating extreme fire weather conditions that propelled fires to progress downhill from wildlands into the built environment and become an urban conflagration (Barnes et al., 2025; Garrett, 2025). The potential for extreme wildfires to develop under dry downslope winds was predicted several days in advance, including by the National Interagency Fire Center (NIFC), the National Weather Service (NWS), and the Storm Prediction Center (SPC; see summary by Wikipedia, 2025), as well as by specialist commentators (e.g. Swain, 2025).
Congo Basin (July–August 2024)
Study area and fire regime
The Congo Basin region here refers to the moist tropical forest ecoregions of equatorial Africa (Fig. 5). Here, fires have historically been rare because short, dry seasons and high moisture constrain fuel availability and limit the natural ignitions and spread of fires (Wimberly et al., 2024). Interannual fire variability is positively correlated with higher temperatures and atmospheric drying, and widespread outbreaks were recorded under the anomalously warm and dry conditions of some El Niño events, such as in 2015–2016 (Wimberly et al., 2024; Dwomoh et al., 2019; Verhegghen et al., 2016). Recent satellite observations demonstrate increasing fire occurrence across multiple Congolian ecoregions, particularly in the central lowland and swamp forests, where active fire detections approximately doubled between 2003 and 2021 (Wimberly et al., 2024). These trends are closely associated with deforestation and fragmentation in the central and western parts of the basin, which are largely driven by small-scale agriculture and logging (Shapiro et al., 2021, 2023). Land-use change alters canopy structure and understorey microclimates, increasing the likelihood that anthropogenic ignitions will spread into forested areas (Zhao et al., 2021; Dwomoh et al., 2019). The contemporary fire regime is thus characterised by rising exposure of tropical forests to anthropogenic ignitions; heightened sensitivity to climate extremes; and growing implications for carbon storage, biodiversity, and local livelihoods (Wimberly et al., 2024).
Extreme event
We specifically target the period July–August 2024, when the most substantial anomalies in BA were observed (Fig. S8). Section 2.2.1 discusses the regional anomalies that led this region to be identified (e.g. Figs. 2, 3), with further review of the fire season provided by our expert panel in Appendix A6. The Congo Basin emerges as a major event of global relevance for the following reasons:
-
Record-breaking burned area. BA was the highest ranked on record at 28 % above the annual mean due to there being 4000 (20 %) more fires than in the average year. For 7 months in a row, the observed burned area was greater than the historical average for those same months, based on the reference climatology since 2002. The largest fire anomalies were observed during July and August (Fig. S8), especially in southern Democratic Republic of the Congo, northern Angola, and parts of the Republic of the Congo.
-
Unprecedented role of fire in primary forest loss. Forest loss statistics from the recent Global Forest Watch report (Goldman et al., 2025) showed that wildfires were the dominant driver of a more than doubling (+150 %) of rates of forest loss in the Republic of the Congo and the Democratic Republic of the Congo during 2024 versus 2023, representing the highest rates of primary forest loss since 2015.
-
Sparse reporting and poor media coverage. Reporting on the occurrence, drivers, and consequences of fire is extremely sparse in this region, including by government agencies and the international and national news media. This demonstrates that extreme fire events in this region are often overlooked, making it an important case study to investigate in this report.
In this edition of the report, we introduce new routine regional assessments of fire impacts on society in terms of population exposure to fire, physical asset exposure to fire, the exposure of carbon projects to fire, and the degradation of air quality through emissions of fine particulate matter (PM2.5). For our air quality analysis, estimates are generated for the focal events only (Sect. 2.2.2). In all other cases, estimates are provided for each of the regional layers detailed in Table 1, mirroring our approach to providing regional summaries of BA, C emissions, and individual fire properties (Sect. 2.1.2).
3.1 Methods
3.1.1 Population exposure assessment
Population exposure estimates are produced using the global risk assessment platform CLIMADA (Aznar-Siguan and Bresch, 2019). CLIMADA has previously been validated and applied to systematically quantify exposed population to a variety of natural hazards globally, such as river floods (Kam et al., 2021) and tropical cyclones (Stalhandske et al., 2024; Kam et al., 2024). The BA hazard set is set up using the MCD64A1 MODIS BA product (Giglio et al., 2018). The original BA data are aggregated monthly on a regular grid with a resolution of 150 arcsec and expressed as the fraction of total cell area burned. For the spatial distribution of exposed population, we use the Gridded Population of the World (Doxsey-Whitfield et al., 2015), which is spatially reaggregated on the same grid as the hazard using the LitPop exposure layer (Eberenz et al., 2020). The population exposed to wildfires is estimated by multiplying the BA fraction (BA expressed as a fraction of burnable area) of each cell by the population present in each grid cell. As a complementary approximation to the main analysis, a single displacement share is derived by comparing population exposure estimates with reported displacement figures from the Internal Displacement Monitoring Center (IDMC, 2025), acknowledging that exposure only partially translates into impact. Event records are matched to BA observations following the methodology described in Riedel et al. (2025). We compute the ratio between recorded impacts and exposed values for each event and provide the median of these damage ratios across events.
The data produced using these methods are available from Steinmann et al. (2025).
3.1.2 Physical asset exposure assessment
Physical asset exposure estimates are produced using the global risk assessment platform CLIMADA (Aznar-Siguan and Bresch 2019). CLIMADA has previously been validated and applied to systematically quantify economic impacts resulting from exposure of physical assets to a variety of natural hazards globally (Stalhandske et al., 2024), including fires (Lüthi et al., 2021). The exposure layer LitPop (Eberenz et al., 2020) was used to spatially distribute national-scale macroeconomic indicators as a function of night light intensity (Román et al., 2018) and population density (Doxsey-Whitfield et al., 2015) within national geographical domains. We disaggregate country-based produced capital estimates (World Bank, 2024c) for the year 2018 to approximate physical asset density in US dollars (USD). Physical asset exposure to wildfires is estimated by multiplying the BA fraction of each cell by the physical asset totals present in each grid cell (analogous to our analysis of population exposure, Sect. 3.1.1). In addition to this analysis, a single overall loss fraction is provided recognising that exposure tends to overstate actual asset damage. This fraction is derived by comparing modelled exposure estimates with asset damages from wildfire events, as reported in the Emergency Events Database (EM-DAT; Delforge et al., 2025) maintained by the Centre for Research on the Epidemiology of Disasters (CRED). Event records are matched to BA observations following the methodology described in Riedel et al. (2025). We compute the ratio between recorded impacts and exposed values for each event and provide the median of these damage ratios across events.
The data produced using these methods are available from Steinmann et al. (2025).
3.1.3 Carbon project exposure
We estimated the exposure of carbon offset projects to fire by combining a large set (n = 927) of project boundaries for forestry projects in Latin America (n = 394), northern America (n = 316), Eurasia (n = 150), Africa (n = 60), and Australasia (7) with information on fire and climate. Project boundaries were sourced from BeZero Carbon Ltd., who have collated and digitised boundaries for all nature-based projects in the Voluntary Carbon Market (VCM). Information on annual BA was derived from the MCD64A1 collection 6.1 data (Giglio et al., 2018), and this was combined with information on land cover from MCD12Q1 collection 6.1 (Sulla-Menashe et al., 2019) to separate forest from non-forest fires. To evaluate drought conditions, we calculated the 12-month Standardized Precipitation Evapotranspiration Index (SPEI) using data from ERA5-Land (Muñoz-Sabater et al., 2021) calibrated over the 1980–2014 period.
We evaluated fire activity during the 2024 calendar year in the context of long-term trends in drought and fire risk. First, to assess how 2024 compared to previous years since 2001, we calculated the number of carbon projects affected by fire in each year and the average percentage of project area burned per year (%). Second, to place this in the context of climate change, we calculated the 2024 drought anomaly as the 2024 SPEI minus the long-term average SPEI (1980–2023).
3.1.4 Air quality impact assessment
The human health risks associated with fire smoke pollution are well established. Smoke contains toxic compounds, including ozone, carbon monoxide, and volatile organic compounds (VOCs), as well as fine particulate matter (PM2.5) that can carry heavy metals and environmentally persistent free radicals (Hamilton et al., 2022; Andreae, 2019; Fang et al., 2023). Even short-term exposure to these pollutants has been associated with increased risk of cardiovascular and respiratory illnesses, including asthma exacerbation, reduced lung function, and acute infections (Johnston et al., 2021; Xu et al., 2024; Chen et al., 2021; Xu et al., 2023; Aguilera et al., 2021; Zhang et al., 2025). Furthermore, wildfire smoke contributes to increased mortality, particularly among vulnerable populations. In addition to these physiological effects, heavy smoke can significantly reduce visibility, compounding health risks by increasing the likelihood of injuries during regular driving, evacuation, or emergency response (Gill and Britz-McKibbin, 2020), and generates lasting mental health effects amongst exposed or displaced communities (Humphreys et al., 2022).
To quantify the contribution of fires to degraded air quality we used the global model framework utilised by the Copernicus Atmosphere Monitoring Service (CAMS) to simulate concentrations of fine (< 2.5 µm diameter) particulate matter (PM2.5; Peuch et al., 2022). One of the key objectives of CAMS is to monitor and forecast global atmospheric composition including smoke from vegetation fires. Fire emissions in CAMS derive from the Global Fire Assimilation System (GFAS; Kaiser et al., 2012), which calculates hourly estimates of biomass burning emissions by assimilating fire radiative power (FRP) observations from satellite-based sensors and by means of land-cover-dependent conversion (FRP to dry matter) and emission factors (dry matter to emitted gas or aerosol species per biome) describing the rate at which about 40 smoke constituents are released into the atmosphere. This study uses GFAS version 1.4, which is the version used currently for the NRT production input of CAMS global and regional forecast services, plus some improvements that include the use of VIIRS FRP retrievals. Spurious FRP observations of no vegetation fire origin are filtered out in GFAS with a static map. GFAS ingests active fire information together with a characterisation of its uncertainty, including an uncertainty component related to the satellite sensor detection limit and a solution for partial observational cloud coverage.
Simulations are run with the Integrated Forecasting System extended with modules of atmospheric composition (IFS-COMPO), which describe source, sink, and transport processes of the main reactive trace gases (Flemming et al., 2015; Huijnen et al., 2016) and aerosol species (Morcrette et al., 2009; Rémy et al., 2022, 2024) and which, together with satellite observations, are at the core of the CAMS system for the global domain. Mass fluxes of atmospheric constituents from the surface into the atmosphere are either prescribed from CAMS pre-compiled emissions inventories, with some aspects of online simulated temporal variability, as in the case of pollutants from the burning of fossil fuels for transportation and electricity, or estimated online at every time step in the IFS when strongly dependent on meteorological conditions as in the case of desert dust and sea salt aerosol and of biogenic fluxes of CO2. The resolution used is the current operational resolution of 40 km, with 137 vertical levels. GFAS biomass burning emissions are estimated at 0.1° resolution based on FRP observations from the MODIS sensor on both the Terra and Aqua satellites (Giglio et al., 2016) and from the VIIRS sensor on the Suomi NPP satellite (Csiszar et al., 2014). The vertical distribution of fire emissions within the simulation follows the GFAS IS4FIRES injection height estimation (Sofiev et al., 2012; Rémy et al., 2017).
To isolate the contribution of extreme fire events to atmospheric PM2.5 concentrations, two sets of forecast experiments are run for specific focal events using a similar assessment framework. In the first (“with local fires”), all emission sources of PM2.5 were considered including those of anthropogenic, dust, biogenic, and other natural origin. In the second (“no local fires”), biomass burning emissions from within the focal event are excluded. The difference in simulated PM2.5 concentrations between the two runs then represents the fire contribution to PM2.5 within the region.
After PM2.5 concentrations had been simulated at a 3-hourly temporal and 40 km spatial resolution, we summarised the influence of fires in the region to a daily population-weighted mean PM2.5 concentration at ground-level (in units of µg m−3) for each focal region. Population data for the year 2020 from the Gridded Population of the World (GPW) dataset version 4 (Doxsey-Whitfield et al., 2015) were used to weight the values of PM2.5 concentration in each grid cell of the focal regions, producing a weighted mean value for PM2.5 concentration for each simulated date. This process was repeated for each simulation (“with local fires” and “no local fires”), and daily differences between the simulations were used to assess the additional number of days with poor air quality caused by fires in the focal regions.
To illustrate the scale and intensity of wildfire smoke health-relevant exposure within the 2024–2025 fire season, total population-weighted PM2.5 and the isolated contribution of fires to population-weighted PM2.5 in a focal region are compared against the World Health Organisation 24 h mean (15 µg m−3) standard for daily PM2.5 exposure (WHO, 2021).
3.2 Results
3.2.1 Population exposure
During the 2024–2025 fire season, we estimate approximately 100 million people to have been exposed to wildfires worldwide. Exposure was most pronounced across South and Southeast Asia, as well as Central and East Africa. At the country level, India and the Democratic Republic of the Congo show the highest numbers, with around 15 million people affected in each (Figs. 6, S9). Nigeria, China, Mozambique, and South Sudan also were also exposed substantially, each with more than 5 million people affected. At the sub-national level, we estimate the highest population exposures in Uttar Pradesh State (India) with over 4.6 million people, Heilongjiang Province (China) with 3.7 million, and Punjab State (India) with 3.6 million exposed (Figs. 6, S9). Several provinces in the Democratic Republic of the Congo also exceed 2 million, illustrating how national-level exposure is often driven by a few highly affected administrative regions.
Some of the countries with the most extreme anomalies in fire BA and C emissions, most notably Bolivia, Brazil, and Canada, accounted for only a small share of absolute global population exposure and showed negative (Canada) to modest positive (e.g. Bolivia and Brazil) anomalies (Figs. 6, S9). This decoupling highlights the relevance of the spatial distributions of both BA and population to population exposure, which might be low when extensive fires occur in remote places.
Several of the countries with the highest absolute exposures, such as India and the Democratic Republic of the Congo, showed negative anomalies on a national level, related to the fact that fire-related population exposure in these regions is more recurrent. Nonetheless, on a sub-national level, some regions of these countries show considerable positive anomalies, such as in India's Uttar Pradesh State, where 4.6 million people were exposed (146 % above average) and in the provinces Kasaï-Central (+33 %) and Kongo-Central (+27 %) in the DRC, where about half a million were exposed. We note that our analysis of population exposure to fire captures exposures to all fire types (see Sect. 3.1.1), including wildland fires but also fires observed in agricultural settings (e.g. crop stubble removal or for pasture maintenance) or in shifting cultivation systems, which generally pose low direct risks of fatality or injury. The use of fire for agricultural burning is widely documented in Uttar Pradesh (Shyamsundar et al., 2019), and shifting cultivation is a widespread practice in the Congo Basin (Molinario et al., 2015; Tyukavina et al., 2018), with these modes of fire use dominating over other uses in the respective regions (Millington et al., 2022). As a result, some regions ranked highly for population exposure in our analysis are particularly susceptible to inflated estimates due to the prevalence of exposure to relatively low-risk fire types. Recent work has begun to address this issue by quantifying exposure specifically to higher-intensity fires (Teymoor Seydi et al., 2025), an approach we intend to adopt in future editions of this report.
Population exposure anomalies were also high in relative terms across parts of the Middle East and the Balkans (e.g, Jordan, Iran, Iraq, North Macedonia, Albania), the Andes region (e.g. Peru, Ecuador), the northern coast of South America (Venezuela, Guyana, Suriname, broadly encompassing our focal region of Northeast Amazonia), and Central Sahel (e.g. Niger), as well as isolated cases such as Nepal and Iceland. For example, Jordan shows divergent anomalies in population exposure (+201 %) resulting from large sub-national regions of Balqa (+322 %) and Irbid (+393 %). These patterns of exposure mostly align with patterns in BA and carbon emissions (Sect. 2), in the Middle East and the Balkans, Andes, the northern coast of South America, and Central Sahel. Although the absolute number of people affected in some of these countries remains low, the relative anomaly marks a sharp departure from historical patterns.
It is important to distinguish between the exposed and affected population. Based on 521 events in the years 2008–2025 recorded by IDMC (2025), we estimate the damage ratio of exposed to displaced population to amount to 3.0 %. While nearly 100 million people were exposed to wildfire activity in the 2024–2025 season, only a small fraction – 20 046 people (IDMC, 2025) – were formally displaced (0.02 %). Note that this figure likely understates the true scale of disruption, as displacement records are incomplete. Many affected individuals may not be forced to leave their homes but still experience substantial short- and long-term consequences, including health burdens (Gould et al., 2024) and financial distress such as short-term earning disruptions (Borgschulte et al., 2024), increased missed mortgage payments (Ho et al., 2023), declines in property values (Huang and Skidmore, 2024), and lasting reductions in income later in life (Meier et al., 2025). Moreover, recent cases have emphasised that the number of people impacted by wildfire smoke can be many times higher than the number of people directly exposed to fire (Jones et al., 2024b; Kolden et al., 2024, 2025; Johnston et al., 2021). As such, these records should be viewed as a conservative lower bound on the broader human impacts of wildfire exposure.
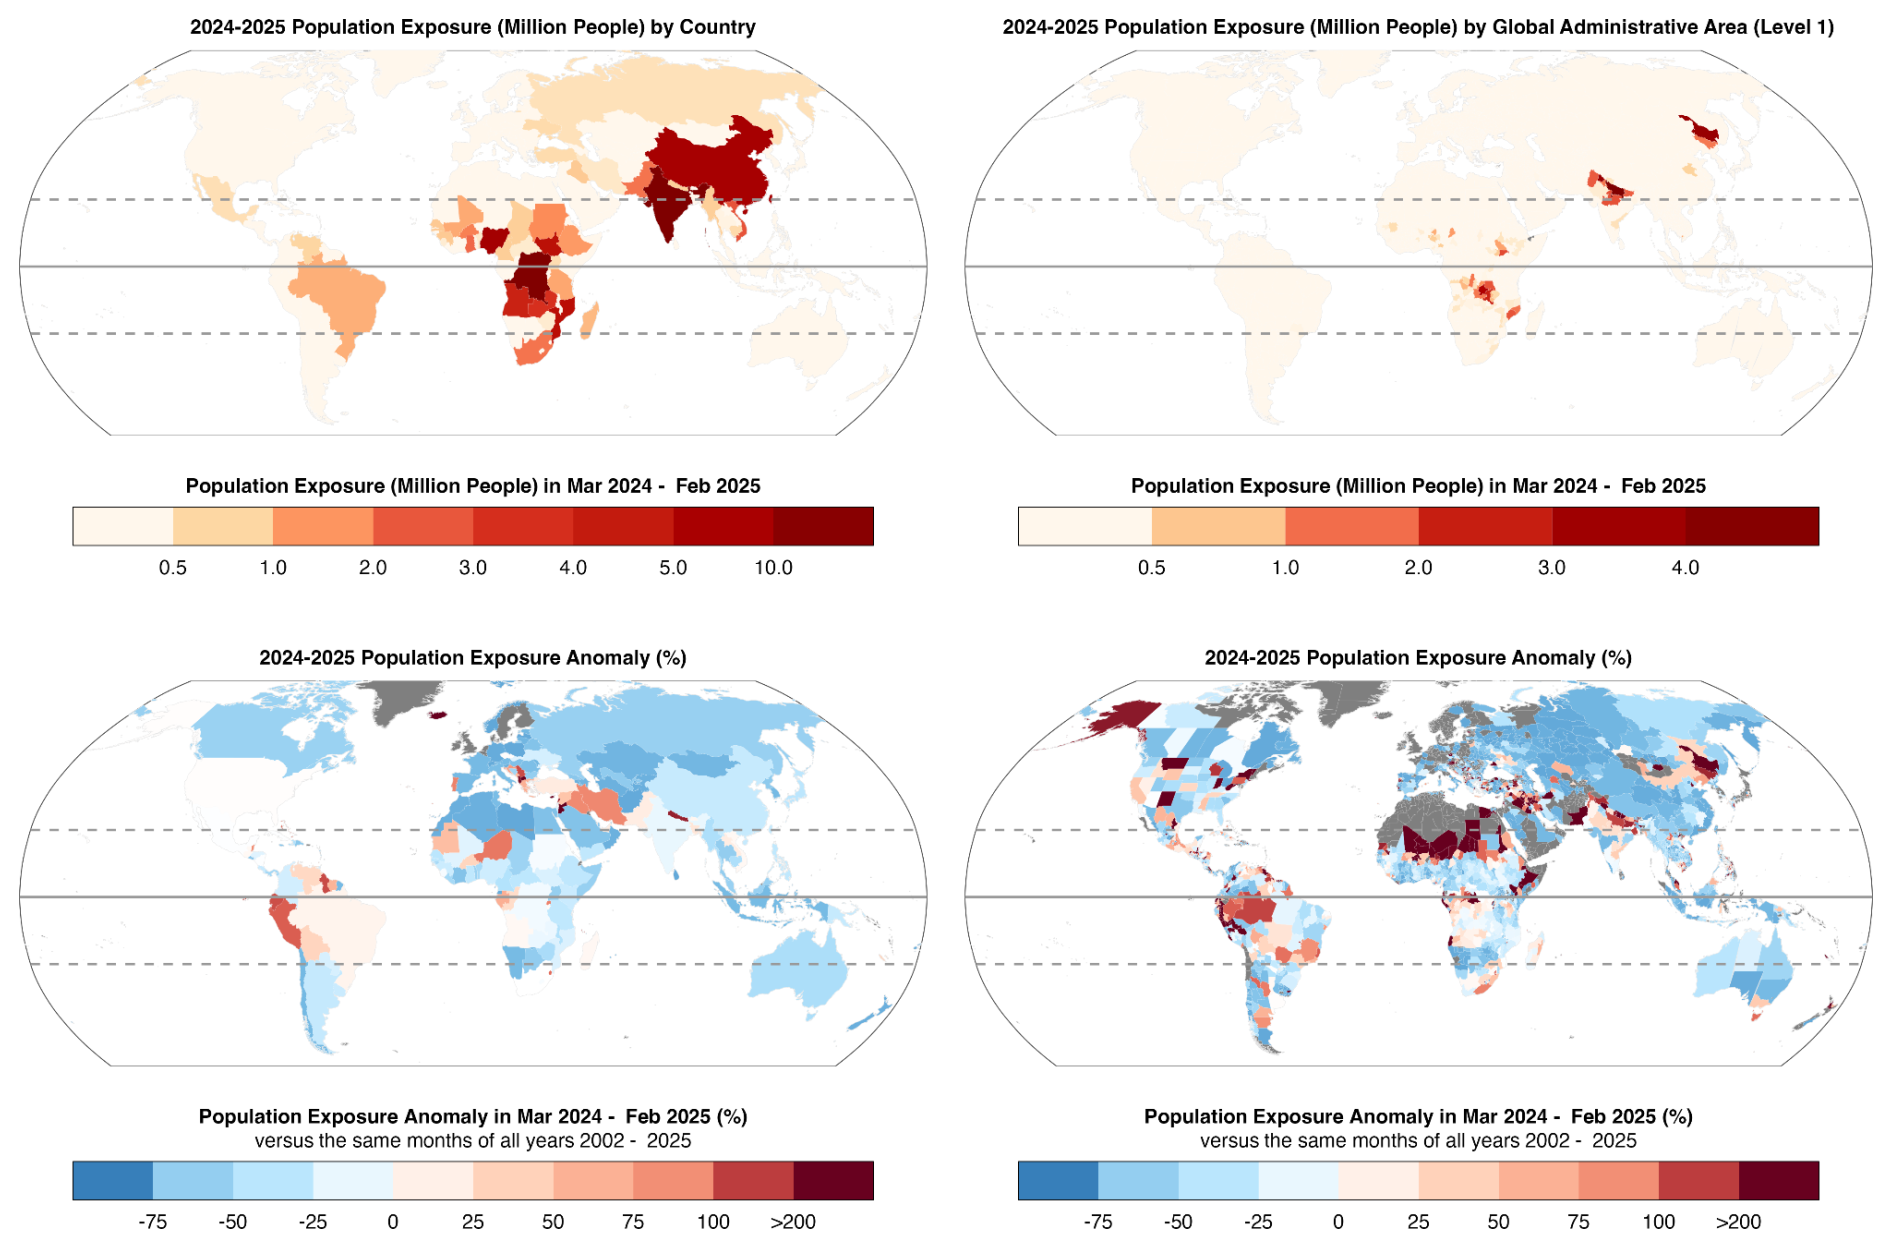
Figure 6(left panels) Population and (right panels) physical assets exposed to burned area (BA) during the 2024–2025 global fire season. The figure shows (top panels) the number of people or the asset value (billion USD) exposed to fire and (bottom panels) the relative anomaly versus all years since 2002. Results are shown at the national scale in Fig. S9.
3.2.2 Physical asset exposure
We estimate that physical assets exposed to wildfires during the 2024–2025 season amounted to USD 215 billion worldwide. The highest asset exposures were concentrated in a mix of middle- and high-income countries, led by India (USD 44 billion), the United States (USD 26 billion), and China (USD 17 billion), followed by Venezuela, South Africa, and Brazil (Figs. 6, S9). While India, and to a lesser extent Brazil and China, ranked highly in both population and asset exposure, the asset exposure landscape broadens to include developed countries such as the United States and South Africa (USD 14 billion). This divergence reveals not only different spatial patterns of wealth and infrastructure but also the concentration of high-value assets in certain sub-national regions (Figs. 6, S9). For instance, South Africa's Gauteng Province, its economic hub, ranked among the most exposed globally at USD 8 billion, despite the country's moderate population exposure. Similarly, in the United States, California alone accounted for over USD 17 billion in exposed assets, driven largely by the severe January 2025 wildfires (USD 14 billion) discussed in Sect. 2.2.3. These estimates are still low in comparison to damage records provided by EM-DAT for the LA fires (USD 52.5 billion). This difference is likely caused by an underestimation of the affected exposure, which consisted of exceptionally high-value structures not represented by LitPop. This also explains the underestimation of the asset exposure anomaly in California, which is less pronounced (+60 %) than in other states and regions of the world (Fig. 6).
In contrast, Central African countries such as the Democratic Republic of the Congo, Nigeria, and Mozambique, which featured prominently in population exposure, did not rank highly in terms of exposed assets (Figs. 6, S9). The exception is South Sudan (USD 4 billion), where asset exposure remains substantial. The data also highlight high absolute asset exposure in Mexico, Türkiye, and the Russian Federation, each with national totals around USD 8 billion. At the sub-national level, exposure was concentrated in economically important regions, including Izmir in Türkiye (USD 3 billion), Mexico City (Distrito Federal; USD 3 billion), and Russia's Kemerovo and Rostov regions (approximately USD 3 billion each). These patterns underscore how wildfire-related asset exposure is shaped by the intersection of fire occurrence with concentrated infrastructure and economic activity.
Asset exposure anomalies for the 2024–2025 fire season, expressed relative to the same months of all previous fire seasons from 2002–2024 (n = 23), reveal several hotspots with unusually high physical asset exposure. Notable positive national-level anomalies were concentrated across the Middle East (e.g. Iraq, Syria), southeast Europe and the Balkans (e.g. Albania, Bosnia and Herzegovina, Greece), parts of the Sahel and Horn of Africa (e.g. Niger, Eritrea), and the northern tropical parts of South America (e.g. Ecuador, Colombia, Guyana) (Figs. 6, S9). At the sub-national level (Figs. 6, S9), pronounced relative anomalies were observed in regions not necessarily among the highest in absolute asset exposure. For example, many of the strongest asset exposure anomalies were highly localised, including regions of Chad, Sudan, Brazil, and Pakistan, where this season's values sharply deviate from past levels (Figs. 6, S9). In contrast, while California recorded the highest total asset exposure, its relative anomaly was modest, reflecting its regular exposure to fire. These spatial contrasts underscore the fact that extreme fire seasons can affect both high-value regions and those with historically lower risk.
A comparison between asset exposure anomalies and BA anomalies (Fig. 6) shows areas of both alignment and divergence. Overlaps are evident in Venezuela, western Brazil, Niger, and parts of India and Bolivia, where elevated fire activity coincided with high asset exposure. In contrast, strong BA anomalies in parts of equatorial Africa and Russia were not matched by anomalous asset exposure. This disconnect underscores that fire activity alone is not a sufficient proxy for physical asset impact. Rather, extensive burns in remote or forested areas may have limited consequences for built infrastructure, whereas smaller fires near wildland–urban interfaces can generate disproportionately high asset exposure (Calkin et al., 2023).
As with population exposure, asset exposure does not equate to realised impact. Comparing modelled exposed assets with reported EM-DAT figures, economic losses from 105 historic wildfire events in the time period 2002–2025 show a damage ratio of around 29 % of exposed asset value. While a modelled USD 215 billion in physical assets was exposed to wildfires in 2024–2025, a smaller sum of USD 57 billion in realised damages was recorded by EM-DAT, or around one-quarter of our exposure estimate. Note that these figures reflect differences in scope and data quality. EM-DAT's total economic damage records may include indirect losses, such as business interruption and sectoral impacts. Its definition is broad, source-dependent, and rarely disaggregated. Thus, reporting is uneven and regionally biased due to variation in local capacity and data availability (Doerr and Santín, 2016, Jones et al., 2023). In contrast, our modelled asset exposure offers a consistent estimate of physical assets at risk, representing the maximum potential asset loss. Yet, it does not represent realised or total economic damage. While both measures have limitations, together they help to characterise the scale of global wildfire-related economic impacts.
3.2.3 Carbon project exposure
Forestry projects can provide cost-effective climate mitigation and co-benefits to society and biodiversity, though their outcomes depend on complex interactions between project activities and their local ecological and social context (Holl and Brancalion, 2020). Wildfires present a growing threat to forest carbon offset projects, posing risks to the permanence of stored carbon (Anderegg et al., 2020) and thus credit integrity (Badgley et al., 2022a, b) and the financial viability of project activities (Conte and Kotchen, 2010; Michaelowa et al., 2021). Forestry projects can focus on emissions avoidance (e.g. REDD+), emissions removal (e.g. afforestation or forest restoration), or a combination (e.g. improved forest management). Here we evaluate fire activity during the 2024 calendar year across an unprecedented number of forestry projects in the Voluntary Carbon Market (VCM) and place results in the context of long term trends in fire risk.
The 2024 fire season was characterised by anomalously high fire activity across the 927 projects evaluated. In total 169, or 18 % of projects, recorded BA in 2024, a record over the observational period (2001–2024) (Fig. S10a). This coincided with record annual BA, with 1.6 % of project areas affected on average (Fig. S10b). Regional drought extremes were likely responsible for the observed uptick in fire activity during 2024, with drought conditions in 72 % of projects exceeding the long-term (1980–2023) average and, in 13 % of projects, exceeding extreme (SPEI < −2) drought conditions (Fig. S10c).
Interestingly, observed anomalies vary regionally and further depend on project activities. Exceptional drought conditions in Latin America resulted in a record number of projects being affected by fire but total BA was just short of previous peak years. In this region, many projects focus on the avoidance of deforestation (38 %), and in addition to climate, fire risk is driven by changing land cover and land use over time (Alencar et al., 2015). In comparison, in northern America a smaller number of projects are prone to fire annually, and the majority (93 %) of projects focus on improved forest management. Here, a record average BA was observed, but the total number of projects affected was modest and aligned with average drought conditions. Africa had the highest average BA, but 2024 was a low fire year, aligned with long-term BA trends in African savannahs and woodlands (Andela and van der Werf, 2014; Andela et al., 2017), and a relatively large number of projects focused on afforestation or forest restoration (52 %), which may result in decreasing fire activity over time.
Notably, despite increasing fire risk, about 46 % of projects did not experience any BA over the observational period, and 67 % of projects were at moderately low risk from fire (with less than 0.5 % burned annually in the forests within a 50 km buffer zone around the project).
Aligned with long-term changes in fire weather (Jolly et al., 2015, Abatzoglou et al., 2019), we found that the majority of forest carbon projects faced anomalous drought conditions in 2024. The 2024 fire season affected a record number of forest carbon projects globally, resulting in an unprecedented annual percentage of BA within project boundaries. High-integrity forest carbon projects can help to mitigate global climate change, and some prior work has shown that these interventions can reduce fire risk locally (Croker et al., 2023). Nonetheless, the quality of carbon credits issued by nature-based projects depends on the permanence of the carbon emissions avoided or removed, which we show to be increasingly at risk.
3.2.4 Air quality impact
Here, we present estimates of the concentration of fine particulate matter (PM2.5) that the average person in the Pantanal–Chiquitano region experienced due to wildfire smoke emissions (the population-weighted PM2.5 concentration; Fig. 7). In the Pantanal–Chiquitano, the population-weighted PM2.5 concentration exceeded the WHO daily PM2.5 daily standard of 15 µg m−3 on most days from August to November (Fig. 7), with only 30 d between July and October falling below the threshold, most of which were in early July. Considering fire emissions alone, the average person experienced PM2.5 above 15 µg m−3 on 16 additional days between July and October due to local fire emissions, which is slightly lower (20 %) than the previous 30 % estimate of the contribution of Brazilian deforestation fires to PM2.5 (Reddington et al., 2015). September marked the peak pollution month where the average person experienced PM2.5 concentrations of 61 µg m−3 and fires accounted for approximately 59 % of the pollution mass (∼ 36 µg m−3). In comparison to Fig. 7, non-population-weighted daily concentrations met or exceeded the US Environmental Protection Agency's 24 h maximum standard of 150 µg m−3 on 5 d. Though no comparable single-day maxima standard exists under WHO or Brazilian air quality regulations, this highlights the potential of extreme pollution exposure in low-population regions closer downwind of South American fire occurrence. Furthermore, even in the absence of fires, background pollution levels are already severely degraded; the presence of fire emissions, however, significantly worsens air quality conditions. Furthermore, this analysis has focused only on the impact of local fires, yet the overall seasonality of PM matches the fire season in South America. This suggests that while local fires are enhancing exposure to pollution, there is likely to be a significant contribution from longer-range fire smoke transport to the region.
To help contextualise model findings, we also examined model results for the January 2025 Los Angeles (LA) wildfire (not shown). The modelled PM2.5 results for the LA region were muted, with a maximum population-weighted daily concentration of 29 µg m−3 on 17 January. However, observational reports of the LA fire document much more extreme pollution, including a 480 µg m−3 1 h peak and a 93 µg m−3 daily mean peak on 8 January (US EPA, 2025; Briscoe and Rainey, 2025). This discrepancy likely stems from insufficient spatial and temporal resolution in both the model and the analysis region, which cannot capture the rapid and highly localised plume behaviour typical of urban or wildland–urban interface fires. It illustrates why high-resolution modelling that captures community-scale air quality analysis of short-lived extreme events is needed for comprehensive impact assessments of fires as they encroach into populated regions. Benchmarking model performance against documented local maxima could guide improvements and enhance reliability for future health risk evaluations in all burning environments.
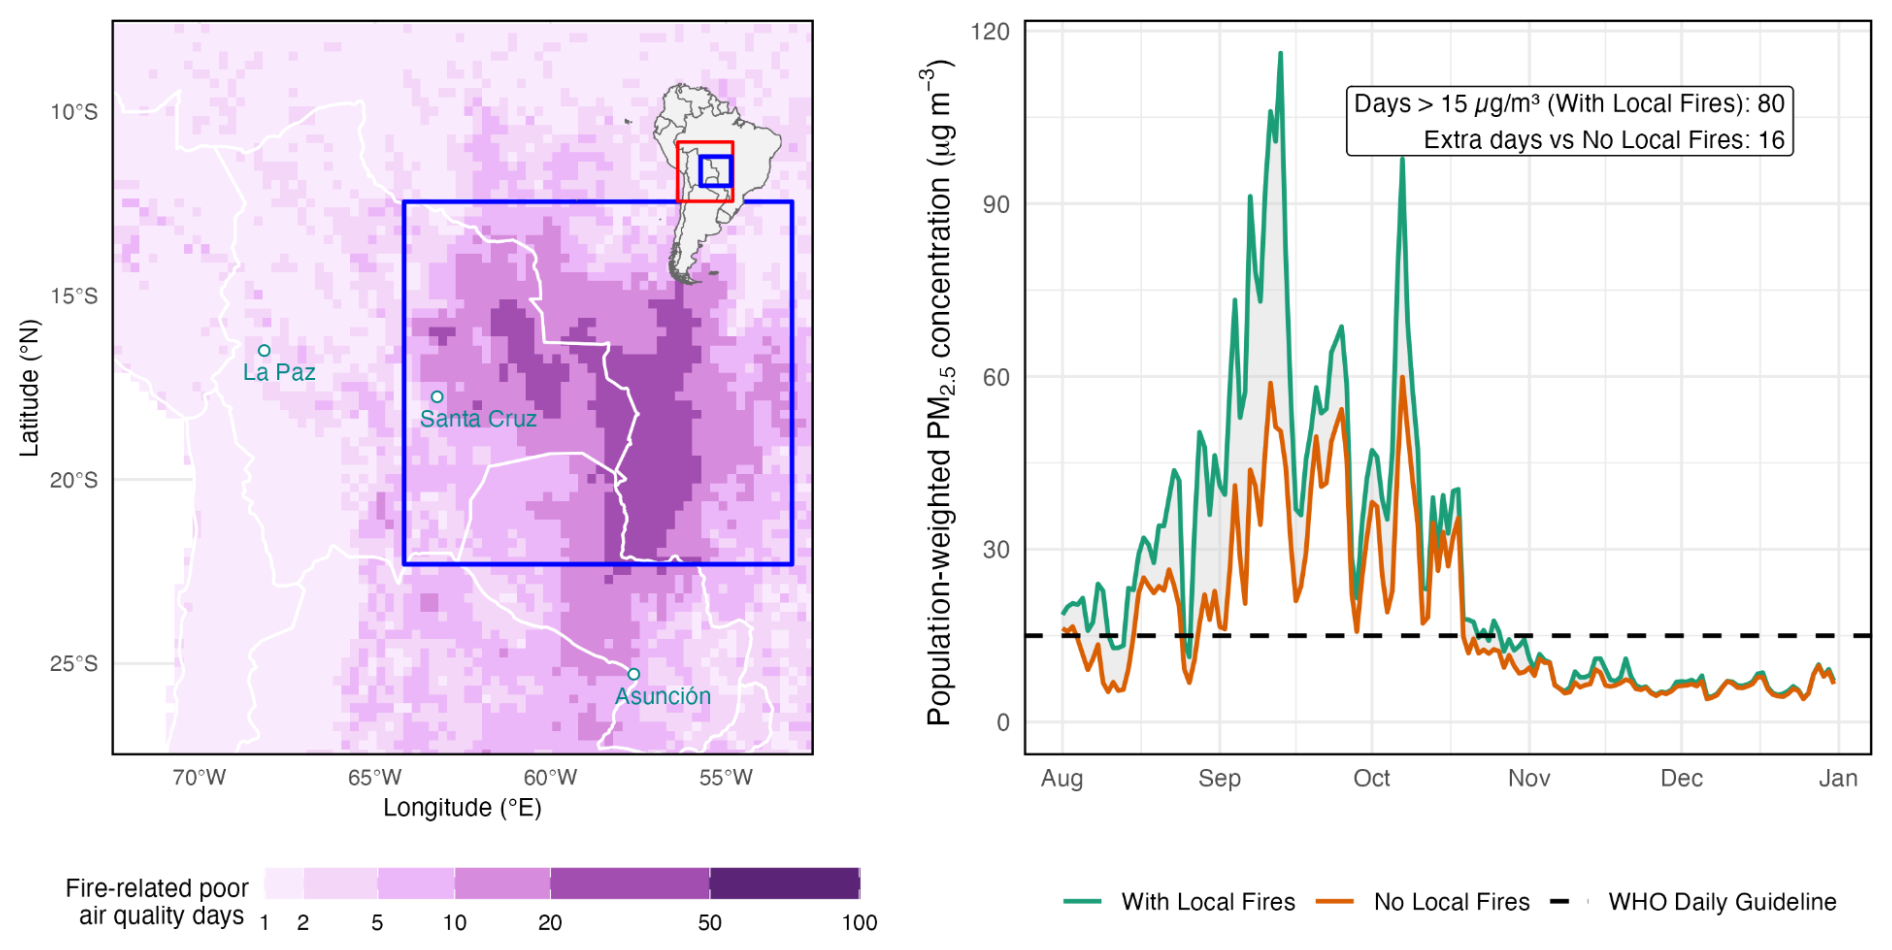
Figure 7Poor air quality days caused by anomalous fire activity in the Pantanal–Chiquitano region during the 2024–2025 fire season. The left panel shows the additional number of days exceeding the World Health Organisation (WHO) daily standard of 15 µg m−3 as a result of fire emissions occurring within the defined regions (red outlines), over and above the number of poor air quality days caused by all other sources of PM2.5 (e.g. industrial, transport, and residential) and from fires occurring outside of the defined regions. The right panel shows a daily time series of population-weighted PM2.5 concentrations (µg m−3) under scenarios that include or exclude local fires. The WHO daily standard of 15 µg m−3 is shown, and days exceeding that threshold are counted as poor air quality days.
4.1 Methods
4.1.1 Predictability of focal events of the 2024–2025 fire season
Short- to medium-range forecasts
We evaluated the capacity of two distinct methods to predict fire occurrence over short- to medium-range time periods (1 to 15 d): the Fire Weather Index (FWI; Van Wagner, 1987; Vitolo et al., 2020) and the Probability of Fire (PoF; McNorton et al., 2024).
FWI is a described in “Contemporaneous extremes in fire weather” in Sect. 2.1.4. Here, we used weather inputs from the ECMWF Integrated Forecasting system in its operational configurations at 9 km resolutions.
PoF is one of the outputs of the ECMWF Sparky fire model and aims to improve upon the fire forecasting skill of the FWI (McNorton et al., 2024; Di Giuseppe et al., 2025). The Sparky-PoF is a data-driven fire prediction system that advances on fire danger metrics by modelling not only the effect of meteorological variables on fire likelihood but also (i) the temporal evolution of fuel load and fuel moisture content and (ii) ignition events informed by lightning forecasts, human population density, and road networks. PoF is an example of a new generation of indicators based on machine learning methods that have recently been created to produce more informative operational predictions of wildfire (Shmuel et al., 2025; Di Giuseppe, 2023). One of the practical advantages of PoF is that it can directly output a prediction of the number of fire hotspots when averaged over vast areas, which is directly comparable to active fire observations. While these approaches are relatively new, they hold great promise for improving fire forecasting, particularly in fuel-limited biomes where FWI is a weaker predictor of fire activity (Bedia et al., 2015; Jones et al., 2022). Sparky-PoF l is trained on observed hotspots from several sensors (McNorton et al., 2024) and uses a XGBoost methodology (Shmuel et al., 2025; Jain et al., 2020). Predictions of PoF from Sparky showed better skills than FWI in recent events and are available operationally with forecasts up to 10 d in advance (Di Giuseppe et al., 2025).
In general, FWI is effective at capturing the immediate emergence of fire-conducive weather conditions across much of the globe. However, it does not consider the fuel build-up and the state of vegetation in specific biomes other than boreal forests, which is often a critical factor in fire occurrence. As a result, FWI-based systems may predict fire-prone conditions too far in advance of actual fire emergence, particularly in ecosystems where vegetation availability (i.e. fuel) governs ignition potential. In contrast, data-driven models like PoF, which incorporate information on both dead and live fuel moisture content are better able to reflect the delayed response of ecosystems to dry conditions. These models provide a more realistic representation of fire potential in fuel-limited landscapes or in regions where the hydroclimatic cascade delays fire onset. This is especially relevant for wetland biomes, which have been a key focus of analysis this year.
Subseasonal to seasonal forecast
The prediction of fire weather over subseasonal to seasonal (up to 6 months ahead) is a relatively unexplored field of research (Roads et al., 2005). Until recently, only a few studies had specifically examined the prediction and predictability of fire weather-related quantities and their connection to actual fire activity globally (Di Giuseppe et al., 2024). Here, we evaluate the ability of cutting-edge seasonal prediction systems to predict anomalies in the FWI, using data available through the Copernicus Emergency Management Service which uses ECMWF's SEAS5 seasonal forecasts as forcing (Di Giuseppe et al., 2024). We probabilistically quantify the likelihood of FWI values exceeding the seasonal mean prediction time steps ranging from 1 to 3 months considering a climate that spans the period 1991–2016. These predictions are not designed to inform on the exact location of fire outbreaks, but rather to serve as an indicator of landscape preconditioning to burn. The predictions highlight regions where anomalous fire weather may emerge and thus merit closer monitoring, offering an early signal of where fires could become a concern.
On seasonal timescales, patterns of fire weather are significantly influenced by large-scale climate modes such as the El Niño–Southern Oscillation (ENSO) through variation in temperature and rainfall patterns across the tropics (Latif et al., 1998; Chen et al., 2017; Bedia et al., 2018). In some tropical countries, forecasts of ENSO have been used directly to predict risk of fire and to implement pre-emptive fire management actions including bans on fire (Pan et al., 2018). For example, major fire anomalies and regional haze events in Southeast Asia are thought to have been avoided during the 2023–2024 El Niño, following the implementation of new predictive systems and policy interventions since earlier El Niño years (e.g. 2015) (World Resources Institute, 2016). The effect of other large-scale climate modes is also present in other world regions, such as in the case of the Indian Ocean Dipole (IOD) in the case of Australia (Harris and Lucas, 2019) and several Atlantic and Pacific oscillations in the case of Amazonia (Aragão et al., 2018). The ECMWF's SEAS5 forecasts have been shown to accurately predict the meteorological variability associated with ENSO and their effects on fire activity over timescales of 1 to 2 months ahead (Johnson et al., 2019; Di Giuseppe et al., 2024).
Turning fire weather anomalies into accurate predictions of seasonal fire activity is not straightforward, as it requires incorporating additional drivers, namely fuel availability, ignition sources, and suppression capacity. Modelling the complex dynamics among fire and its bioclimatic and human drivers remains a challenge and is the focus of extensive research (e.g. Jones et al., 2022). Nevertheless, when considering forecasting ability in the long range and accuracy, climate remains the most reliable parameter among the drivers of fire activity. Accordingly, we examine the potential of machine learning techniques to forecast BA anomalies, which are being developed to provide targeted forecasts that guide the deployment and coordination of limited firefighting resources amidst increasingly synchronous wildfires (Torres-Vázquez et al., 2025a; Abatzoglou et al., 2021). We employ the model developed by Torres-Vázquez et al. (2025b), which is a hybrid approach combining dynamical seasonal drought forecasts with a statistical climate–fire model based on the random forest (RF) algorithm. This model leverages the Standardized Precipitation Index (SPI), aggregated over periods of 3, 6, or 12 months, to capture both antecedent and concurrent climatic conditions that influence fire activity. Calibrated with historical BA and SPI data, the RF model forecasts BA anomalies one month ahead of the fire season. The system has shown promising predictive skill, successfully capturing BA anomalies across the globe (Torres-Vázquez et al., 2025b).
Uncertainties and forecast skills
Uncertainty is a key factor in prediction and is likely to increase with forecast horizon. The forecast uncertainty is provided as the spread across a set of ensemble simulations from possible scenarios or by expressing the forecast as probability. Variability across the ensemble of forecast realisations was previously estimated to be in the range of 10 %–15 % for FWI (Vitolo et al., 2020) and in this study is reported as variance in the forecast values. PoF is a measure that is probabilistic in nature and is reported as probability of occurrence. For long-range predictions, uncertainty is also explicitly incorporated by expressing forecasts in probabilistic terms, specifically as the probability of exceeding (or falling below) certain thresholds, such as the upper and lower tercile.
The quality of fire forecasts is assessed by visually examining how well the forecasts capture the likelihood of key focal fire events. This approach mirrors the way fire management agencies typically interpret and use these indicators during the fire season. It is designed to partially reflect the operational context in which such indices are applied. Similarly, the seasonal predictions of FWI and the probability of above-median BA aim to demonstrate the type of information currently available to support informed decision-making for resource planning at extended lead times.
4.1.2 Identifying causes of focal events
We assess the main or concurrent causes of the 2024–2025 focal fire events using two complementary modelling frameworks: the Probability of Fire as part of the Sparky modelling complex (McNorton et al., 2024) and the ConFLAME attribution framework (Kelley et al., 2021; Barbosa et al., 2025b). PoF is applied to satellite observations of active fires (Giglio et al., 2018; regridded to 0.1°) and targets a prediction of absolute fire counts on daily timescales. Meanwhile, ConFLAME is applied to satellite observations of BA from MODIS (Giglio et al., 2018; regridded to 0.5°), enabling causality analysis of fire events to key environmental and human-related causes. The ConFLAME analysis is performed on absolute BA fraction and anomalies from the 2002–2025 climatological mean and includes full regional summaries to provide broader context and to better support interpretation of region-wide drivers and trends. Used together, as in this report, the two systems provide complementary analyses of the causes of both active fire hotspots and BA anomalies.
Each model groups predictors into broader categories of causation: weather, fuel, and ignitions (Table S1 in Sect. S4 in the Supplement). Some predictors are shared or overlap between categories due to their interconnected nature (e.g. fuel moisture and weather), but the models are designed to avoid double-counting. To identify the main causes of the fire event, PoF uses an ensemble-based gradient-boosted decision tree classifier (XGBoost), with attribution provided through the SHapley Additive exPlanations (SHAP) method taken from the SHAP library (Lundberg and Lee, 2017) values to quantify the influence of each driver group on predicted fires.
ConFLAME, in contrast, uses a probabilistic Bayesian approach to assess the contribution of each driver group to observed BA, accounting for model uncertainty and fire stochasticity. While PoF is trained globally, ConFLAME is trained separately for each region to capture regional variation in the relationship between fire drivers and BA. This design is particularly important because global parameterisations, such as the use of population density as a proxy for human influence, are known to mask regional differences in ignition practices, land-use regimes, and fire management (Perkins et al., 2024). By focusing on regional training, ConFLAME can more directly capture local ecological conditions (e.g. vegetation type, biomass structure). Population density in particular is split between urban and rural population densities, and BAs' response to them is represented with flexible, non-linear response curves, allowing them to act as both ignition-related drivers (alongside lightning, crop and pasture fractions) and suppression/fragmentation controls (alongside crop, pasture, and urban extent). This formulation captures region-specific, potentially humped relationships between population density and burned area, reflecting how ignition pressure and suppression capacity vary across different human–landscape contexts. Vegetation type shapes how vegetation and biomass affect burning (Lehmann et al., 2014), and human control can result in fire being promoted (e.g. through deforestation or water extraction) or suppressed (Andela et al., 2017). In ConFLAME causes are combined through logistic functions, with results expressed in terms of likelihoods for a detectable BA to be associated to a specific cause.
Both systems include uncertainty estimates. A representation of PoF attribution uncertainty is made by applying a relative error derived from the comparison of observations and forecast. In ConFLAME, uncertainty has two main components: first, the uncertainty in driver–response relationships; because ConFLAME uses a maximum entropy, Bayesian inference framework, the strength and form of associations between predictors (e.g. climate, land use, population density) and burned area are not fixed but estimated from the data. This generates posterior distributions for each fitted function, which translate into confidence intervals for their contribution to fire probability. Second, the model explicitly incorporates stochastic uncertainty, which is particularly important for extreme fire events. This reflects the inherent randomness in ignition and spread under similar conditions and ensures that variability in event BA is not smoothed away. Together, these components produce confidence intervals that account both for parameter uncertainty and for the stochasticity of fire occurrence, which is irreducible locally (i.e. grid cell) but can reduce over scale (i.e. over focal regions). They also form the basis for formal model benchmarking in Sect. S9.1.
It is important to stress that the representation of human influence on fire is very crude in both systems, with PoF relying only on static maps of population density, road networks, and land use and ConFLAME using time-varying maps of urban and rural population density and land use but still missing human agency. In reality, human influence on fire is far more complex and often shaped by cultural and political constraints, which here are reflected only in observed fire occurrence rather than being explicitly represented as drivers leading to fire outcomes. These limitations are likely to introduce uncertainties that are much larger than those currently associated with the predictions, but they remain difficult to quantify due to the limited availability of detailed datasets on direct fire use, including suppression efforts. Neither system is free of limitations. Still, this dual-model setup allows for a more robust assessment of fire causes across different spatial and temporal scales, with prediction of occurred fires providing a fine-scale measure of fire activity and BA an integrated assessment of landscape impacts. ConFLAME's Bayesian framework additionally helps address some of these limitations by propagating uncertainty in the estimated contribution of drivers into the modelled probability distribution, which we use directly in our analysis. This means that part of the variability in how human influences shape burning is reflected in the likelihood ranges reported by ConFLAME. Therefore, uncertainties in human-driven effects are incorporated into the analysis. However these reflect uncertainty within the model's current driver set, rather than fully capturing structural uncertainties linked to missing human agency information (e.g. suppression activities, cultural fire use, or policy change). As such, while the posterior ranges provide a useful quantitative benchmark, they likely underestimate the true uncertainty associated with human influence on fire.
The PoF from the Sparky model does not assume that each factor always pushes fire activity in the same direction. For example, while increased fuel moisture generally reduces fire activity by dampening ignition and spread, in some regions, higher antecedent rainfall can lead to greater vegetation growth, increasing available fuel and potentially resulting in more intense fires later. In fuel-limited regions, where grasses and herbaceous plants dominate, high rainfall can boost fuel growth and lead to more burning. But in fuel-rich areas, that same rainfall mostly increases fuel moisture, potentially decreasing fire activity. In contrast, ConFLAME allows you to specify the expected direction of influence. When a factor can both increase and decrease fire activity depending on context, those effects are represented separately in the model.
Both PoF and ConFLAME use Sparky-PoF fuel information, which inherently reflects long-term conditions; for example antecedent weather and multi-year processes are expressed in the fuel state on the day of the event. In such cases, e.g. where prior weather manifests through its influence on fuel accumulation, it is therefore categorised as a fuel driver rather than as weather itself. We assign past conditions that build up fuel loads to the fuel category, while shorter-term processes such as drying are attributed to weather, though the boundary between these two timescales is not always clear. See Sect. S4 in the Supplement for a detailed description. ConFLAME driving data is available at Barbosa et al. (2025d).
4.2 Results
4.2.1 Predictability of focal events
Northeast Amazonia
Between January and March, satellites detected over 30 200 fire hotspots, marking the highest number recorded for that period since monitoring began in 1999 (Eschenbacher, 2024). These fires were intensified by persistent extreme drought conditions associated with the El Niño phenomenon, which led to higher temperatures and reduced rainfall (NASA Earth Observatory, 2024c; Fig. 8). This part of the region lies in the Northern Hemisphere tropics, where the peak of the fire season aligns with boreal winter months. The region is lesser studied than parts of southern hemispheric Amazonia (Brando et al., 2020; Alencar et al., 2015).
Both FWI and PoF systems identified two main fire seasons in 2024: February–April and August–November. However, around 80 % of the total BA concentrated in the early months of the year and only 20 % during the second dry season. The total probabilities of PoF values over the focal region translate into a number of predicted hotspots, and this is directly comparable to the detections from MODIS. In March, when approximately 60 % of the annual BA was recorded, the PoF reached its peak, predicting nearly 700 fire hotspots in a single day, closely matching the ∼ 600 observed hotspots. While the FWI also indicated anomalously high fire risk, its peak occurred later in September. The onset of the first fire wave aligned closely with the emergence of fire-prone weather conditions (Fig. 8), highlighting the role of weather in enabling fire activity. In this region, where over 90 % of ignitions are human-driven and fuel availability remains high, atmospheric conditions primarily act as the trigger for widespread burning. Interestingly, both the PoF and FWI systems failed to capture a lull in fire activity during the second emergence of fire-conducive conditions between August and November, highlighting the limitations of forecasting fire activity rather than fire danger. In this region, ignitions are believed to be largely driven by escaped pasture burning Cano-Crespo et al. (2015), which typically occurs between August and October Jakimow et al. (2018). The models may have learned and reproduced this seasonal behaviour, but such patterns can be disrupted by changes in human practices. One possible explanation is that these conditions fell outside the usual burning cycles – for example, in agricultural areas where fires are often timed around harvest, the prolonged drought may have reduced crop yields and therefore fire use. This suggests that the models missed the quiet September period because they only incorporate limited information on human ignition patterns; land ownership and land-use types; and less-documented factors such as fire suppression, policy interventions, and cultural burning practices (Lapola et al. 2023). These gaps underscore the need for improved datasets on human activity, which could significantly enhance fire prediction (Jones et al., 2022).
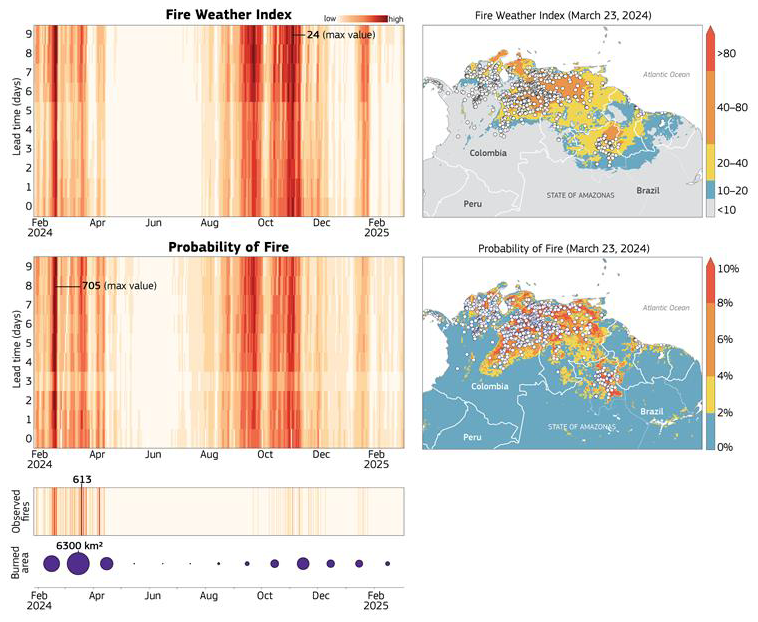
Figure 8Northeast Amazonia forecasts of the FWI and PoF, with lead times up to 10 d prior for the period February 2024–February 2025 as an average value over the focal area. The total percentage of PoF values over the focal region translates into a number of predicted hotspots, and this is directly comparable to the detections observed by MODIS. The x axis corresponds to specific dates throughout the year, while the y axis denotes either observations or the time leading up to the date when a forecast was generated. The vertical colour coherence allows for quick identification of the time windows of predictability associated with the observed fire activity provided in terms of both number of detected active fires per day and total monthly BA (circles). The maps represent a snapshot in time at day 0 to allow the comparison of the spatial distribution of the forecasts and the recorded fire activity by MODIS.
Pantanal and Chiquitano
The Pantanal and Chiquitano have been enduring a prolonged dry period since 2019, leading to the worst water availability crisis ever recorded in the biome in 2024 (World Wildlife Fund, 2024). Notably, the Pantanal did not experience its typical flood season in early 2024, and the average area covered by water during the first 4 months was smaller than that of the previous year's dry periods (Van Dijk et al., 2025). By the end of May 2024, almost the entire Pantanal and Chiquitano region was classified as experiencing extreme drought, the second-highest classification of drought intensity on the Integrated Drought Index (NASA Earth Observatory, 2025a, 2024c). As the Pantanal is a wetland ecosystem, the establishment of dry conditions is a prerequisite for the onset of fire activity. A full hydrological cascade must occur before widespread burning can take place: prolonged precipitation deficits must lead to the reduction of flooded areas, their replacement by grasslands, and the progressive desiccation of both live and dead vegetation. This sequence introduces a natural delay, which explains why fire activity in the region peaked in August and September, well after the onset of dry weather in June (Fig. S11 in Sect. S4).
The total percentage of PoF values over the focal region translates into a number of predicted cells with fires, and this is directly comparable to the detections from MODIS. The most severe PoF forecast, predicting 971 fire cells, closely matches the 885 observed in late August. At large scales, the FWI offers a useful overview of fire-conducive weather conditions. However, it is the inclusion of fuel characteristics in the PoF that provides the finer spatial granularity (maps in Fig. S11 in Sect. S4) needed for more accurate and actionable fire risk assessments.
Southern California
California is arguably one of the most extensively studied regions in terms of shifts in fire regimes (see, for example, Billmire et al., 2014; Littell et al., 2016; Williams et al., 2019; Swain et al., 2025b). In 2024, Southern California experienced severe burning in September, with a total of 1200 km2 burned. Although these fires fell within the typical fire season, the total BA was unremarkable for the region compared to previous years. However, the most significant fire event took place much later, in January 2025, well outside the typical fire period, when the Palisades and Eaton fires broke out in Los Angeles county. The events sparked widespread public debate about how prepared we are to anticipate off-season fires (Woolcott, 2025).
As shown in Fig. S12 (Sect. S4), fire-prone weather conditions persist across much of the year, extending well into autumn, a reflection of the expanding fire season driven by climate warming. Yet, in regions like Southern California, fire prediction based solely on weather indicators is often inadequate. The primary cause of the severity of these events was an intensification of the hydrological cycle that exacerbated both wet and dry extremes. Southern California experienced an unusually wet antecedent period prior to intense drying in an unusually dry winter, which created an accumulation of dry fuel, setting the ideal conditions for intense fire activity (Swain et al., 2025a). Fuel accumulation is a persistent feature throughout the fire season and therefore does not result in a large difference between the PoF and FWI forecasts when averaged over the Mediterranean areas of California. However, its inclusion in the prediction system allows for the identification of zones with higher susceptibility, which are clearly visible in the accompanying map. Neither the FWI nor PoF metrics could provide adequate warning regarding the magnitude of the winter fire event affecting the wildland–urban interface. These events were driven by atmospheric phenomena influenced by steep orography, which are not resolved by current weather forecasting models. The lack of the required resolution impacts equally on empirical and machine learning methods. This highlights the need for improved high-resolution forecasting for fire danger in the wildland–urban interface
Congo Basin
The 2024 dry anomaly in Central Africa has been partly attributed to the co-occurrence of a positive El Niño phase and a warm Indian Ocean Dipole (McPhaden et al., 2024). These conditions tend to shift the West African monsoon northward, leading to suppressed precipitation over the Congo Basin during the core of the rainy season, a pattern observed globally in recent years (Toreti et al., 2024). This event also aligns with a broader trend of a lengthening and intensifying dry season in the Congo rainforest. Satellite analyses over the past few decades show that the dry season is starting earlier and ending later, increasing the region's vulnerability (Jiang et al., 2019). There are typically two main fire seasons in the Congo Basin: from December to March north of the Equator and from June to September south of the Equator. In the equatorial zone, however, fires are not naturally occurring, as precipitation is distributed throughout the year. The expansion of dry seasons both north and south of the Equator has led to a situation where fire seasons in the Congo Basin now span almost the entire year, with peak activities between July and August and December and March. Compounding this, a decline in lightning activity over the region (Chakraborty and Menghal, 2025) suggests that fires are increasingly of human rather than natural origin. This combination of persistent drier-than-average conditions and human-driven ignition means that fire activity is now widespread and weakly correlated with weather patterns. As a result, predictions have a very short predictability window of only a few days (horizon at correlation of lines in Fig. S13). The detachment of fire activity from natural conditions in the Congo Basin presents a significant challenge for forecasting (Fig. S13). In these regions, the discriminatory power between fire-prone and non-prone conditions is greatly reduced, and both FWI and PoF tend to overpredict fire occurrence. In particular, the FWI fails to capture the complex interactions among fuel availability, ignition sources, and human activity. Although the PoF incorporates some of these elements, it also struggles in regions where human presence and behaviour are rapidly changing. In such cases, while most burning occurred outside conflict zones (Trigg et al., 2011), the broader instability in the region may still influence local fire activity, challenging the predictive capabilities of data-driven systems if not trained on the most recent data. This limitation is especially evident in areas where natural ignitions are infrequent and fuel dynamics, rather than weather alone, drive fire occurrence and behaviour (Fig. S13). In the future, these inherent limitations may be addressed by incorporating more fire-specific socioeconomic factors. We are aware that datasets providing more detailed information on human practices are becoming available (Kasoar et al., 2024), and these may help constrain and improve forecast skill going forward. Such datasets could also provide a valuable basis for further exploring the links between fire predictability and human influences, building on the data presented in this report.
Seasonal predictability from fire weather forecasts
The year 2024 has been officially declared the warmest year on record, surpassing previous temperature benchmarks (WMO, 2025; NOAA, 2025). This exceptional warmth has been driven not only by long-term global warming (IPCC, 2023a), but also by a combination of short-term ocean-atmosphere anomalies. In particular, extensive and persistent oceanic heatwaves have been observed across multiple ocean basins, contributing to elevated sea surface temperatures (Holbrook et al., 2019). These marine heatwaves have been further reinforced by an unusual reduction in low-level cloud cover over parts of the Atlantic Ocean, allowing for increased solar radiation absorption at the ocean surface and amplifying the warming (Ceppi and Nowack, 2021).
Given this overall picture, seasonal forecasts of FWI anomalies successfully captured the broad regional patterns of elevated fire danger, particularly in Northeast Amazonia and parts of Bolivia and Venezuela (Fig. 9). These forecasts aligned with the widespread drought and above-average temperatures linked to the strongest El Niño since 2015, a concurrent positive Indian Ocean Dipole, and record-breaking ocean heatwaves. Together, these factors intensified drying across equatorial South America, expanding fire-prone conditions well beyond the regions that ultimately experienced the most extreme burning.
All forecasts issued 1 month before the fire season showed high confidence (between 60 % and 90 %) in the development of above-normal conditions in our focal regions, all exceeding the 66th percentile of climatological values.
Figure 9 demonstrates both the strengths and limitations of FWI-based seasonal forecasts. While they provide valuable early warnings by detecting fire weather anomalies, their broad-scale nature can lead to overestimations of fire impact if not combined with information on fire susceptibility. These findings reinforce the value of FWI in anticipating periods of increased landscape flammability but also highlight the need to more appropriately model anomalies in fuel load and moisture and to integrate non-climatic factors, such as ignition sources, land-use practices, suppression capacity, and landscape accessibility, into fire impact forecasting models to improve precision and operational relevance. Future seasonal-scale forecasts may seek to implement PoF as a predictive tool, which improves upon FWI by tracking fuel loads and moisture and thus the legacy effects of antecedent conditions on landscape flammability.
Figure S14 presents an example of the burned-area anomaly forecasting system using our hybrid dynamical and random forest (RF) approach (“Subseasonal to seasonal forecast” in Sect. 4.1.1 and Torres-Vázquez et al., 2025b). The maps illustrate the predicted probability of a BA anomaly and whether these predictions could trigger alerts for BA anomalous seasons within a potential early warning system. Following Torres-Vázquez et al. (2025b), alerts are issued when predicted probabilities exceed thresholds optimised to balance correct detections and false alarms. For the 2024 season, anomalies in South America, notably in drought-affected regions influenced by El Niño conditions, were reasonably well anticipated. However, in other regions, particularly parts of Africa including the Congo Basin, there were numerous false alarms, reflecting current limitations in fully capturing regional complexities and non-climatic fire drivers. This first implementation demonstrates operational potential, and future refinements (such as incorporating extended fire records and adjusting region-specific thresholds) could enhance skills by reducing false positives.
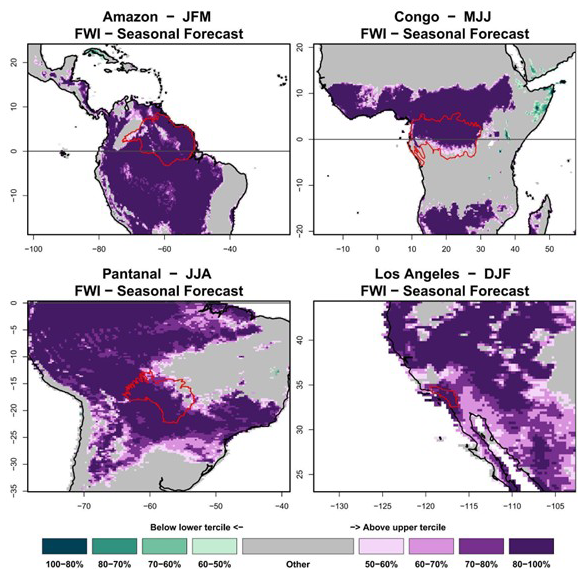
Figure 9Seasonal prediction of Fire Weather Index (FWI) during the periods relevant to our focal events, presented in probabilistic terms that indicate the likelihood of an increased or decreased anomalous fire season.
4.2.2 Identifying causes of focal events – fires
Weather, fuel, and ignitions are the three primary factors influencing the occurrence and intensity of fire events (Di Giuseppe et el., 2025). These broad categories can be further examined to pinpoint individual factors, for example, precipitation and temperature within the weather category or fuel moisture from dead and live vegetation in the fuel category. Analysing the single factors can give an idea not only of the probability of the fire to occur but also of their intensity and behaviour. For example, anomalies above the expected climate (here 2003–2023) in the moisture of dead fuel, due to its lower moisture content and higher combustibility, often plays a significant role in determining ignition potential. Low live fuel moisture increases vegetation flammability, thereby contributing significantly to greater fire severity and intensity.
Beyond this descriptive approach, the PoF and ConFLAME causality models enable a probabilistic attribution of fire occurrence to the three primary controls. These models provide attribution even when no fire is recorded: a low probability across all controls reflects an accurate forecast of no fire, while a high probability without observed fire activity could point to successful suppression efforts, fire-prevention policies, or other unaccounted human factors not included in the model forecasts. The discrepancies between the model prediction and the observed fire activity (cells with identified fire hotspot or BA anomalies) are included to provide a measure of the model uncertainties.
Northeast Amazonia
According to our Sparky-PoF analysis, the extreme fire activity during the 2024–2025 fire season in Northeast Amazonia (described in Sect. 2.2.2) was predominantly driven by anomalous dry weather. Northeast Amazonia experienced an exceptionally severe fire season between January and April (Fig. 10), driven by extreme drought which started in 2023, intensified by the combined effects of El Niño and the Atlantic Meridional Mode, which brought unusually high temperatures and suppressed rainfall. At the peak of the season, during the week of 20–26 March, nearly 2000 fires were observed. Fires were fuelled by prolonged and intense drying across the entire landscape, which made vegetation highly flammable and enabled rapid fire spread across large areas. On the most severe week of burns our causation analysis shows that weather conditions were the dominant factor, accounting for about 60 % of fire activity, while fuel availability and ignition sources each contributed around 20 %. During the first part of the year the exceptional dryness meant that soil humidity levels and moisture in both dead and live vegetation fell to among the driest 2 % of historical conditions, while deep soil moisture dropped below 1 %. The time series of lightning activity (Fig. 10, bottom panel) further illustrates that ignitions in the region are predominantly human-driven. During the May–August period, lightning activity is high and is linked to storms and rainfall, which tend to suppress fire ignition and spread. As a result, even though lightning increases the relative contribution of ignition to predicted fire activity, doubling its weight to around 40 %, this is not reflected in actual fire occurrence or BA. A second, less intense onset of fires occurred between September and January. This was driven by a more superficial drying of the landscape that did not extend into deeper soil layers. Unlike the earlier season, which was associated with hydrological drought, this later period was more reflective of meteorological drought (precipitation deficit).
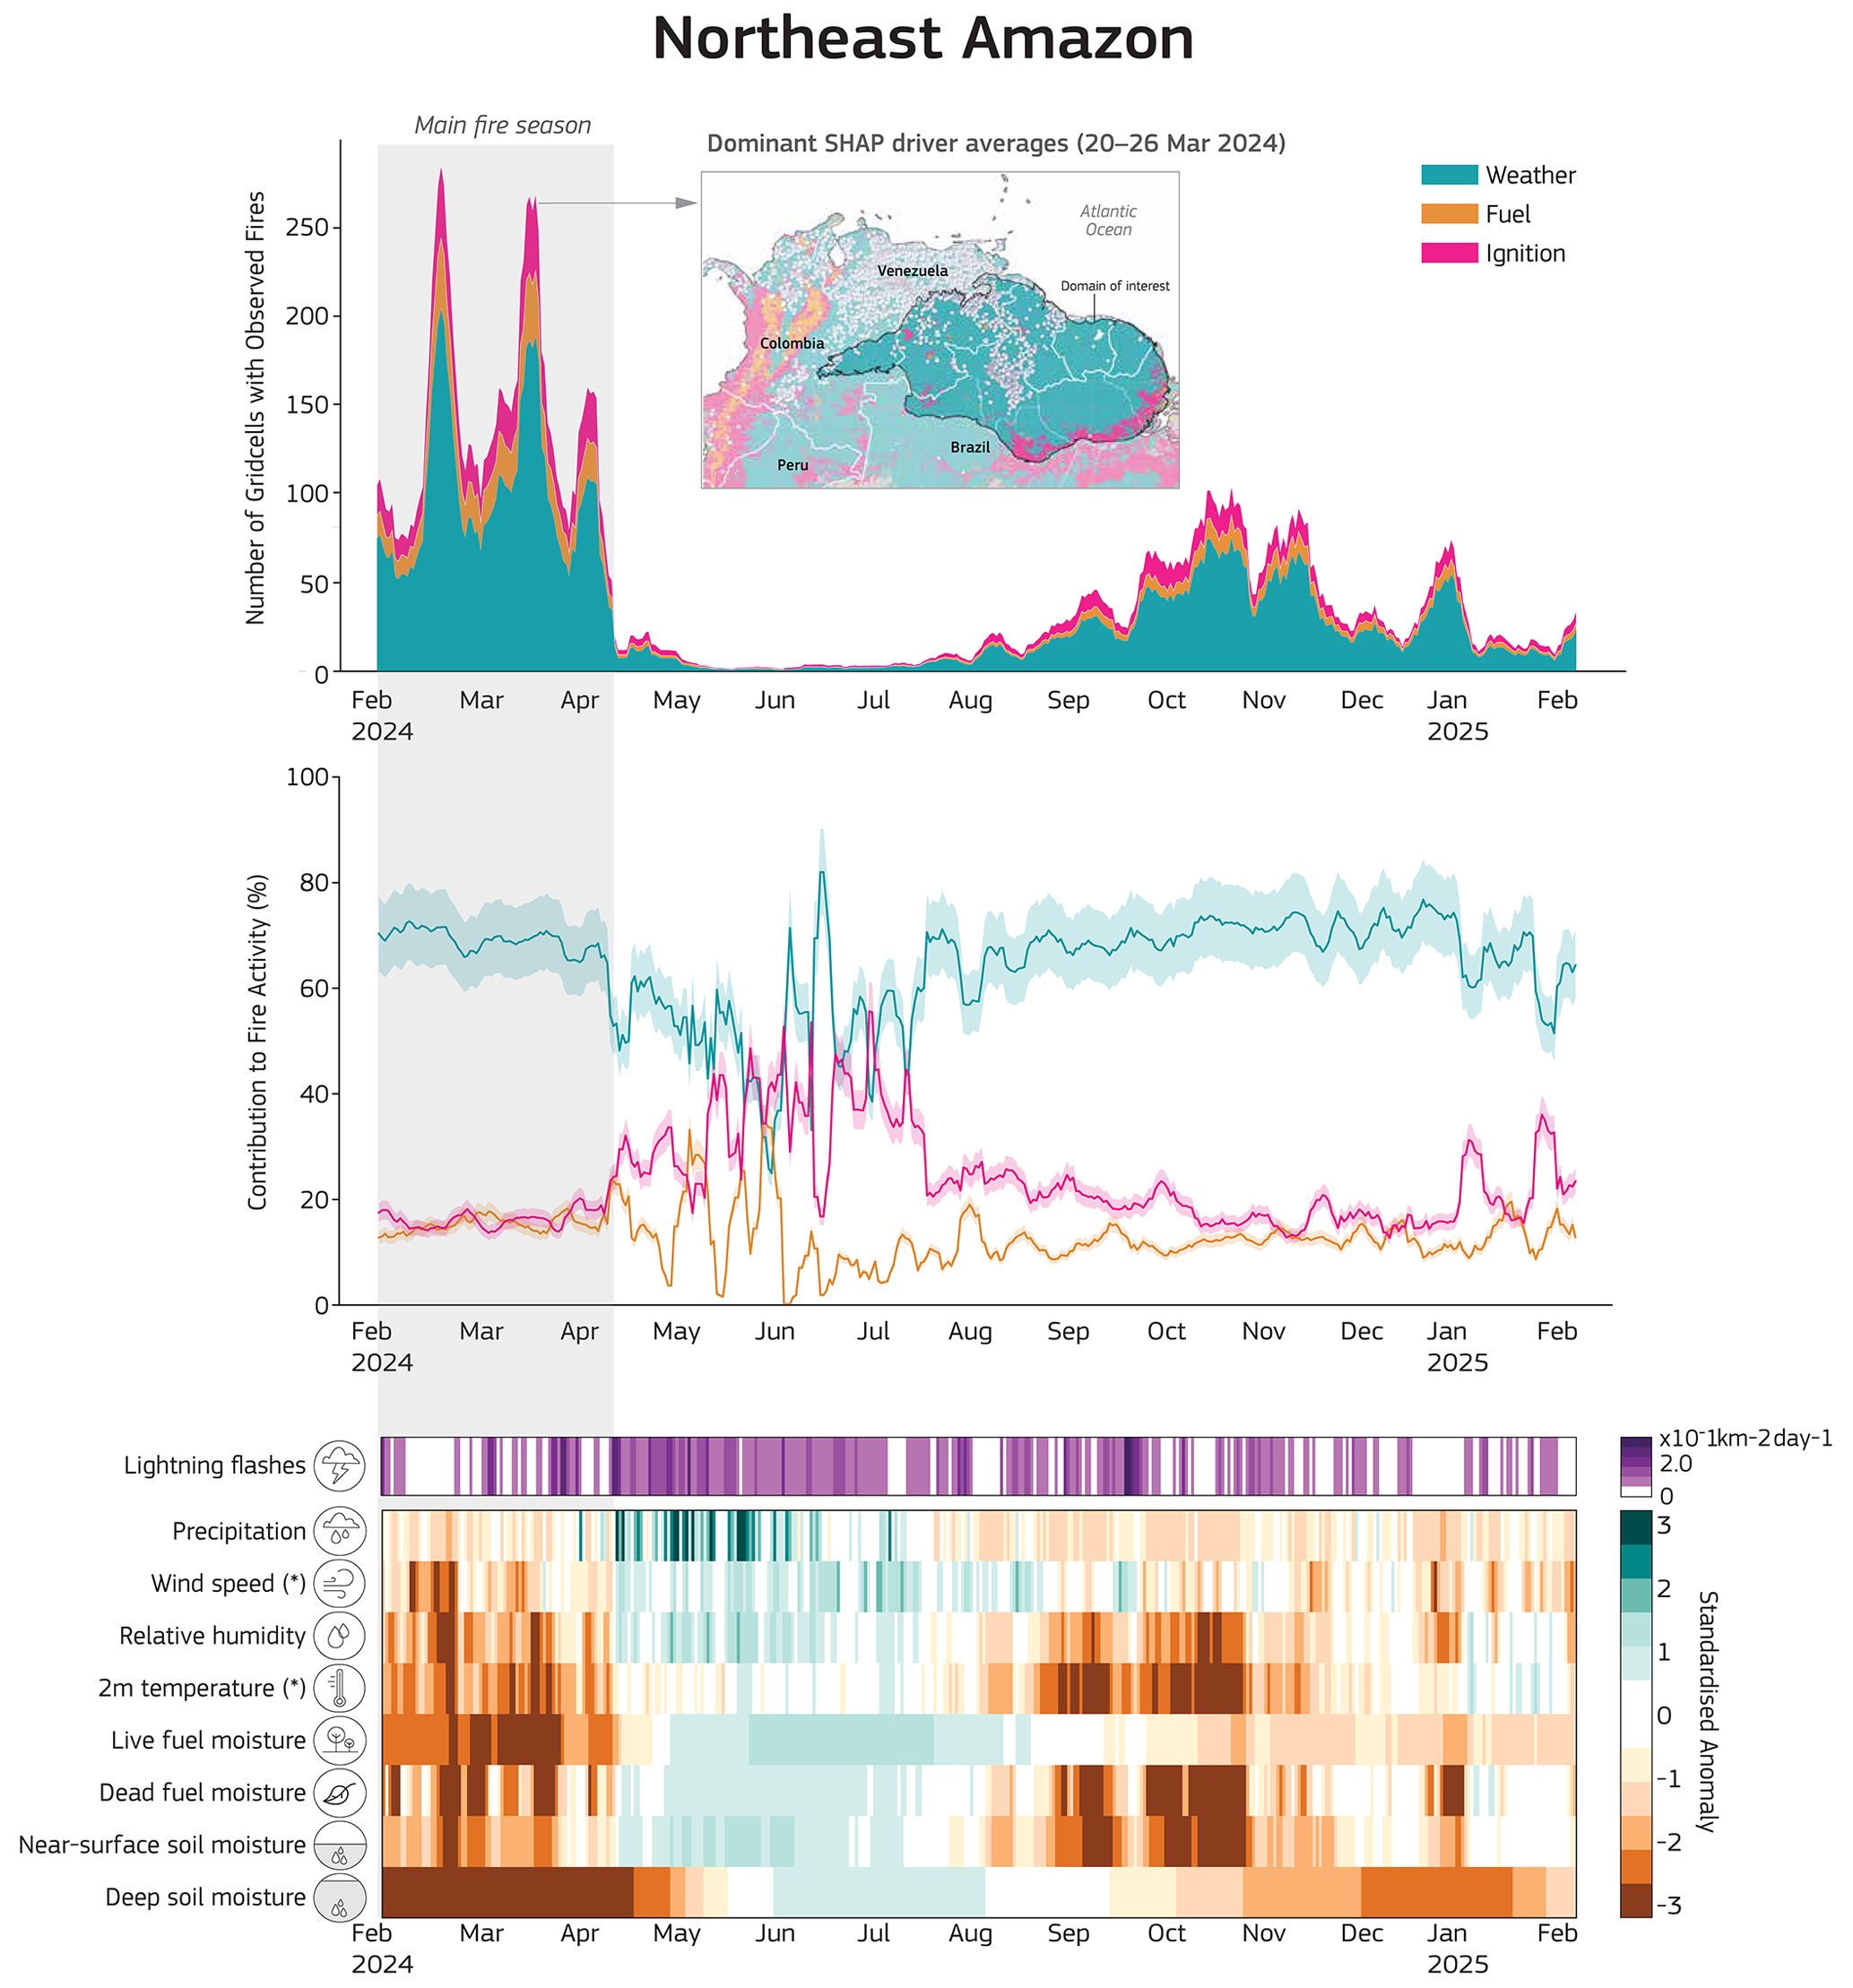
Figure 10Drivers explaining fire (cell with identified hotspots) prediction in Northeast Amazonia. Daily fire activity and contributing drivers from February 2024 to February 2025. Top panel: daily count of grid cells with detected fire, stacked by dominant driver category, fuel, weather, or ignition/suppression. A dominant driver is assigned only if its contribution exceeds 50 % of the total attribution; otherwise, the grid cell is left unclassified (grey). An inset map shows the spatial distribution of dominant drivers during the peak fire week, highlighting regional heterogeneity in fire causation. Middle panel: elative contributions (%) of each driver category to predicted fire occurrence, with shaded bands indicating model-observation uncertainty. Bottom panel: standardised anomalies (in units of standard deviations) for each input driver variable, including lightning flash density. Asterisks (*) indicate reversed anomalies.
Pantanal and Chiquitano
According to our Sparky-PoF analysis, the extreme fire activity during the 2024–2025 fire season in the Pantanal–Chiquitano (described in Sect. 2.2.2) was mainly the result of extremely dry weather which had started since 2023. Drought conditions affecting the Pantanal and Chiquitano continued into the early months of the 2024–2025 fire season following multiple years of below-average rainfall (Fig. 11). Although the year began with relatively moist surface conditions, deep soil moisture remained in the driest 15 % of observed records or 1–2 standard deviations below the mean (Fig. 11). A wet phase in February–April allowed moisture transfer from the atmosphere to surface fuels, but it did not infiltrate deeply into the soil. As a result, when surface conditions dried out again at the beginning of June, vegetation quickly became highly flammable and primed to ignite.
While fire activity in this region was predominantly controlled by weather (71 % mean contribution throughout the year), the role of fuel became increasingly important during the most intense burning phases (up to 40 % during the most intense week between 5 and 14 August 2024). In fact, the contribution of fuel conditions doubles during these peak events, indicating that the persistence of fire-conducive weather over time, rather than the specific daily weather, plays a dominant role in driving the most severe fires.
In the Pantanal and Chiquitano, the lack of correlation between fire occurrence and natural ignition sources, such as lightning density (Fig. 11, bottom panel), is even more evident than in other regions. When lightning does occur, it is typically accompanied by rainfall due to the convective nature of tropical storm systems, further reducing the likelihood of fire ignition. The only notable “dry lightning” event, observed in mid-May, caused a spike in the modelled PoF, which translated into a spike of fire activity that was observable though small in magnitude. Humans are the main source of ignitions in the region (Menezes et al., 2022), and, while weather remains the main driver of fire activity overall, fuel conditions are playing an increasingly important role in determining the severity and extent of extreme fire events (Fig. 11).
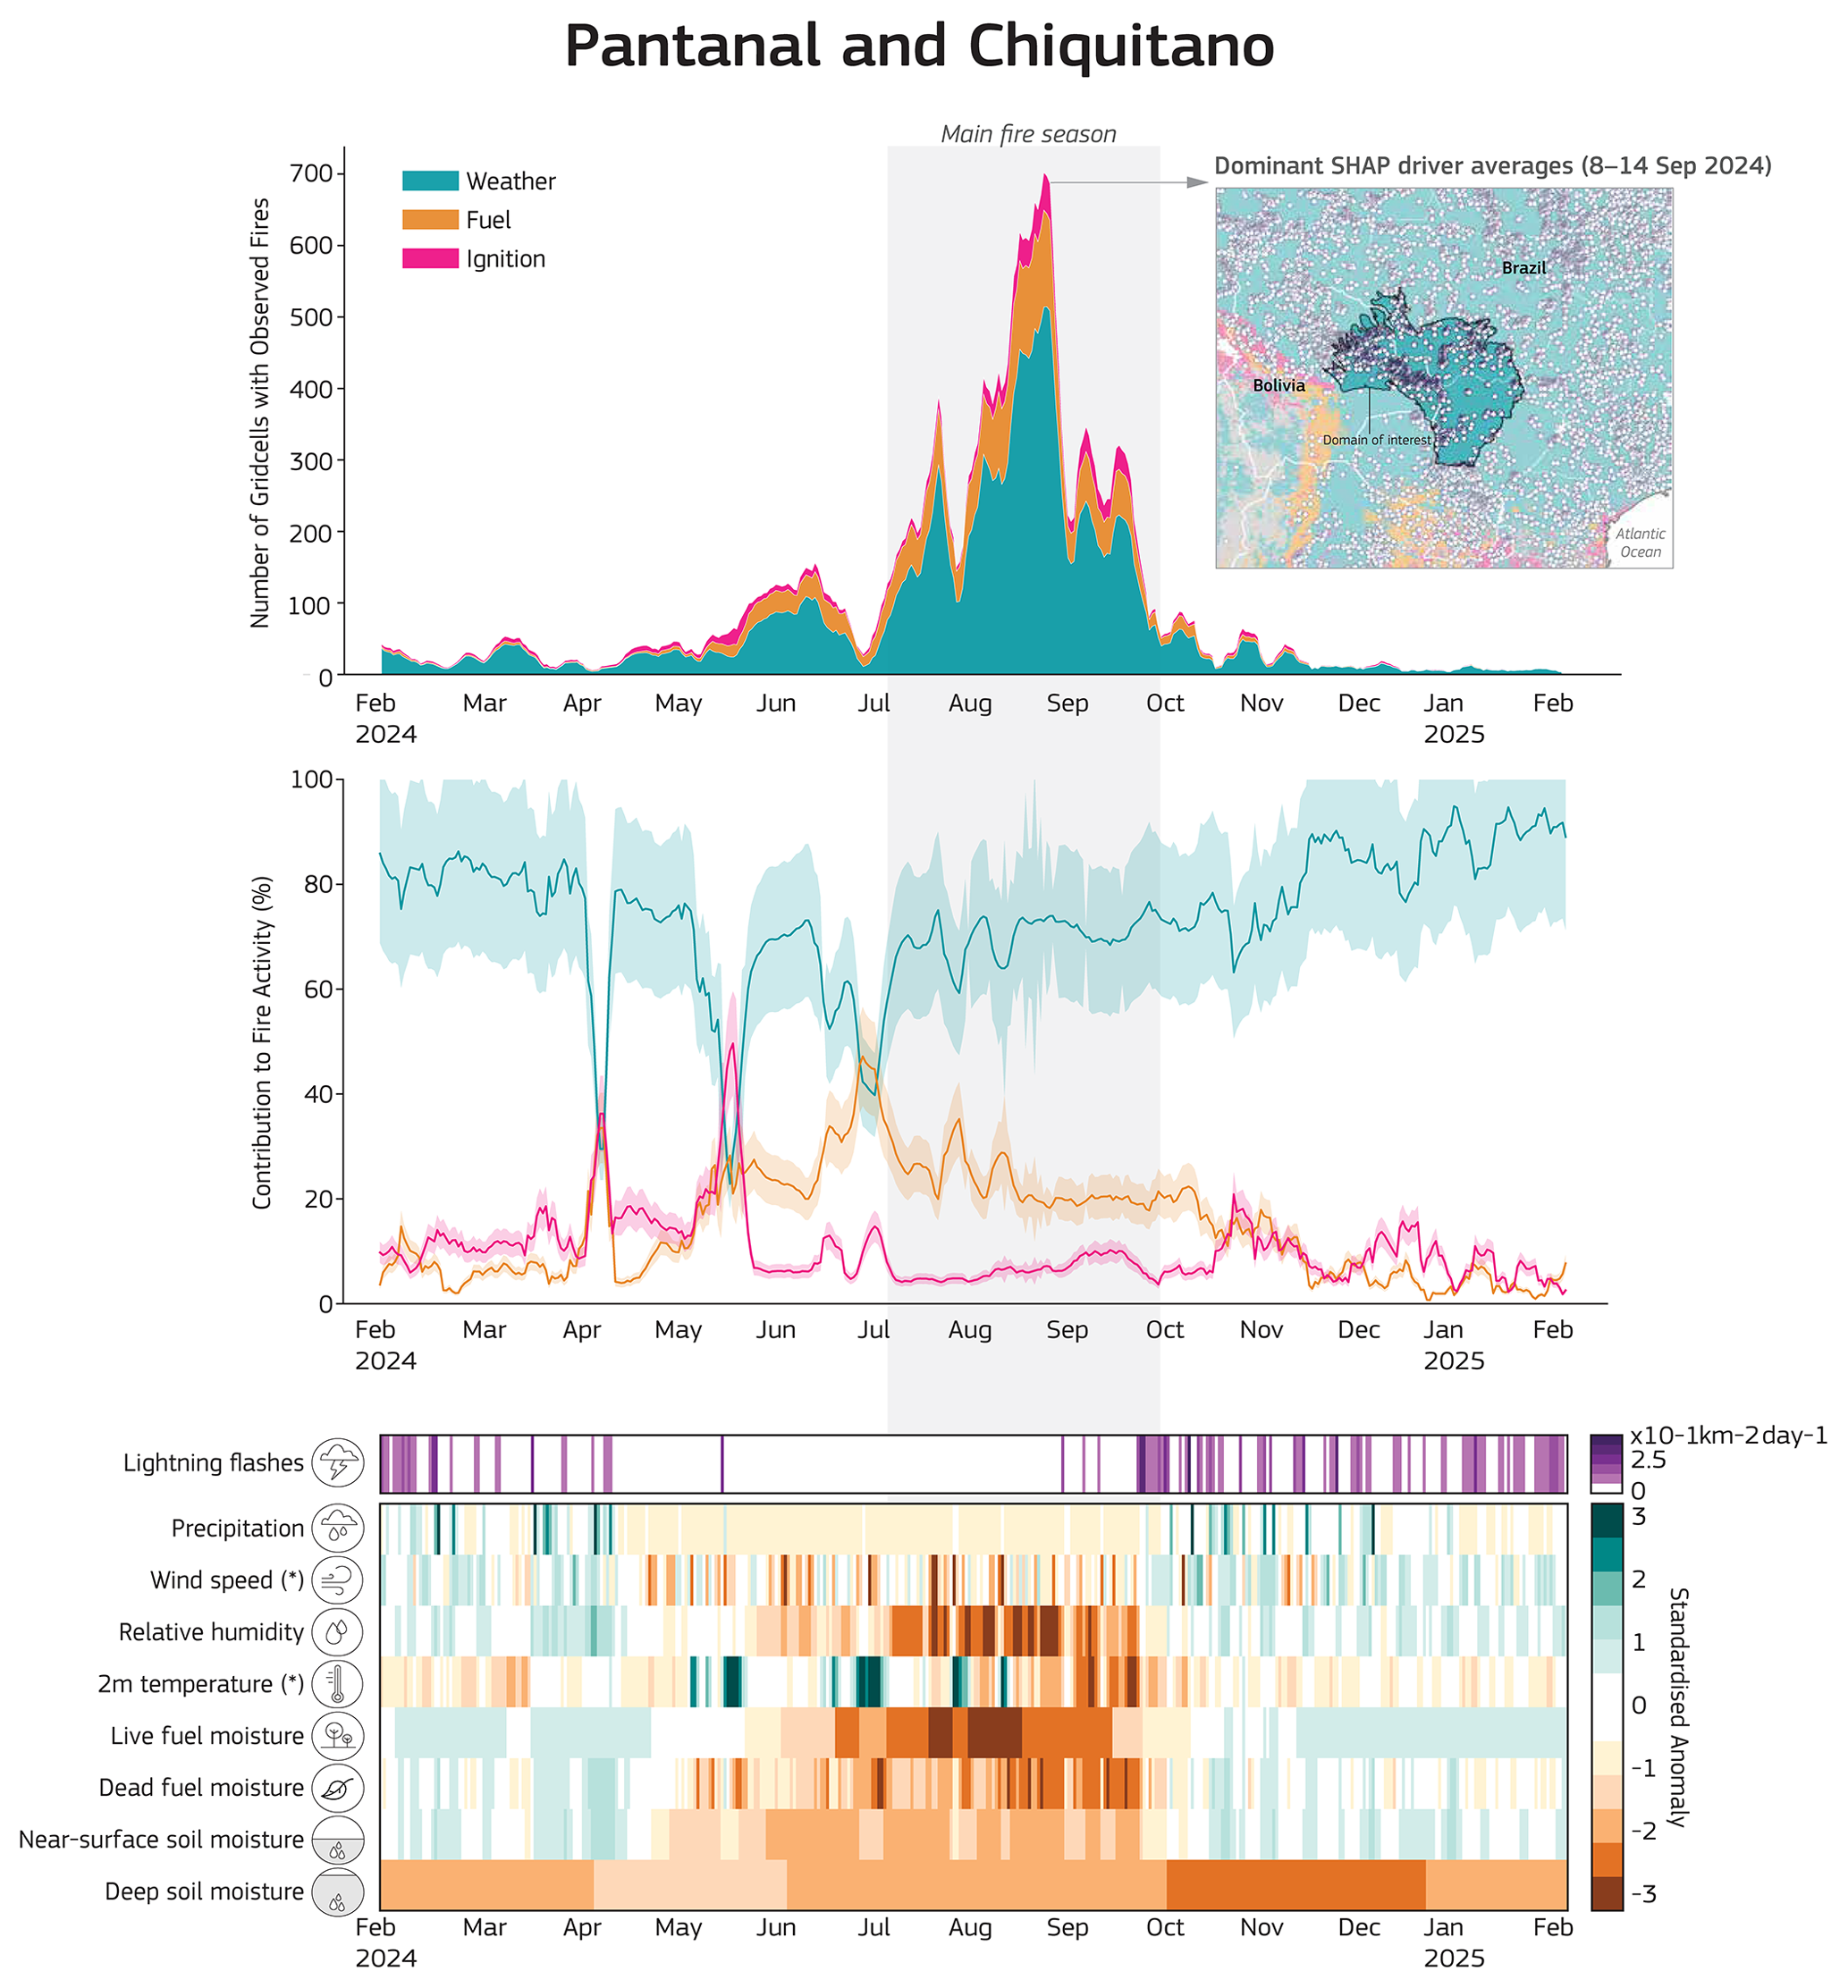
Figure 11Drivers explaining fires (model cells with identified hotspots) in the Pantanal–Chiquitano (as for Fig. 10).
Southern California
According to our Sparky PoF analysis of the extreme fire activity during the 2024–2025 fire season in Southern California (described in Sect. 2.2.2), the results point to a combination of drivers, weather, fuel, and ignitions, each playing an almost equal role in creating the fire-prone conditions observed during the two major events in January 2025 (Palisades and Eaton fires).
Early in the 2024–2025 fire season, Southern California was emerging from a 2-year period of very wet conditions, with deep soil moisture levels at 2 to 3 standard deviations wetter than the climatological average (McNorton et al., 2025) (Fig. S15). During the summer of 2024, lightning may have contributed to ignitions, although in these areas most fires are typically human-induced. Overall, fire activity remained relatively low and below the climatological average.
However, the Palisades and Eaton fires in January 2025 were well outside the typical fire season. These fires were clear outliers in terms of their seasonality, triggered by a rare alignment of short-lived but intense fire-prone conditions, while fuel moisture remained low (Fig. S15). Between 5 and 25 January, favourable weather, fuel availability, and ignition sources aligned, creating ideal conditions for ignition and rapid fire spread.
In the week preceding the fires, fire weather conditions contributed around 40 % to the predicted fire probability, fuel availability 30 %, and ignition sources the remaining 20 %. Despite the generally moist deep soil conditions, a brief but extreme episode of surface drying (reaching 3 standard deviations below normal), combined with unusually strong winds (also 3 standard deviations above average), was sufficient to create highly flammable conditions at the wildland–urban interface, enabling the fires to ignite and spread rapidly.
Congo Basin
According to our Sparky-PoF analysis, the extreme fire activity during the 2024–2025 fire season in the Congo Basin (described in Sect. 2.2.2) was the result of the extreme drought that has affected the region in recent years.
In 2024–2025, fire activity in the Congo occurred year-round in a region marked by abundant and widespread vegetation cover. The spring wet season (March–May) did not materialise due to extreme and persistent drought conditions. As a result, the second wet season later in the year also brought limited relief, leaving deep soil layers significantly dry (up to 2 standard deviations below climatological norms). The region remains in a prolonged state of water deficit until now (Fig. S16).
Throughout the year, weather conditions were the dominant and most stable factor influencing the number, intensity, and duration of fire events. A combination of low rainfall (67 % below the climatological average) and elevated temperatures (90 % above the climatological average) led to sustained drying of both vegetation and soil, placing them among the driest 2 % and 1 % of the climatological record, respectively. These conditions maintained highly flammable landscapes across the region (Fig. S16)
Most fire ignitions in the Congo Basin can be attributed to human activity. Although lightning occurs year-round (Fig. S16), it is more frequent during the wet season due to the convective nature of tropical precipitation. However, during these wetter periods, high moisture levels typically prevent fire ignition and spread. In contrast, during prolonged dry spells, even a small number of human-caused ignitions can trigger widespread and persistent fire outbreaks, owing to the highly combustible state of the vegetation.
4.2.3 Identifying causes of focal events – burned areas
Northeast Amazonia
According to our ConFLAME analysis of the extreme BA during the 2024–2025 fire season in Northeast Amazonia (described in Sect. 2.2.2), weather conditions explained about 40 %–60 % of the BA anomalies, though with fuel conditions acting as an important determinant cause during the periods with greatest fire extent (Fig. 12). In the peak month of March 2024, BA exceeded the long-term average (2002–2024) by over 12 000 km2. Nearly half of the March 2024 anomaly could be attributed to fuel conditions, while weather anomalies potentially accounted for between 50 % and 150 % of the BA anomaly (a high-end value of 150 % would suggest that weather alone would have caused anomalies exceeding the observed values, but below-average ignitions moderated the BA response; Fig. 12). During the secondary peak in BA anomalies during October–November, fuel and weather contributed similarly, with fuel rising in importance due to the insufficient water recharge from the wet season. Weather and fuel together accounted for between 1000 km2 and over 10 000 km2 of BA anomalies.
Consistent with active fire analysis (“Short- to medium-range forecasts” in Sect. 4.2.1), fuel played a key role in determining the geographical distribution of BA during the 2024–2025 fire season (Fig. S19). This is visible in northern regions such as the forest–savannah transition zone in northern Venezuela and southern Guyana and the northern Amazonia savannahs of Roraima and northern Pará, where savannah outcrops are surrounded by rainforest (see maps in Fig. S19). In the forest landscapes, fuel anomalies and fire weather anomalies drove the predicted anomalies in BA. Interestingly, predicted BA anomalies were large in some parts of the region (e.g. Suriname) but went undetected by the MODIS BA product. The causality framework is very confident in its prediction, raising the question of whether detections were missed, possibly due to dense canopy and persistent cloud cover (Giglio et al., 2006).
Despite widespread BA in early 2024, many parts of the region remained largely unburned. Understanding why is as important as knowing what drove the fires. Our analysis shows that in areas with very low BA fraction (less than 0.5 % of burnable area), no single factor (fuel, weather, or human activity) clearly limited fire spread (refer to Fig. S18). Instead, a combination of factors, such as low ignition rates, patchy fuels, or short dry spells, likely prevented fires from taking hold. On the other hand, in the most severely burned areas (top 5 % of BA), the relative importance of fuel and weather was reversed compared to broader patterns. Here, fuel moisture emerged as the primary driver of BA. Drier conditions could have increased BA by 30 %–40 %. Weather still played a role contributing an additional 20 % increase, but its influence was secondary to that of fuel.
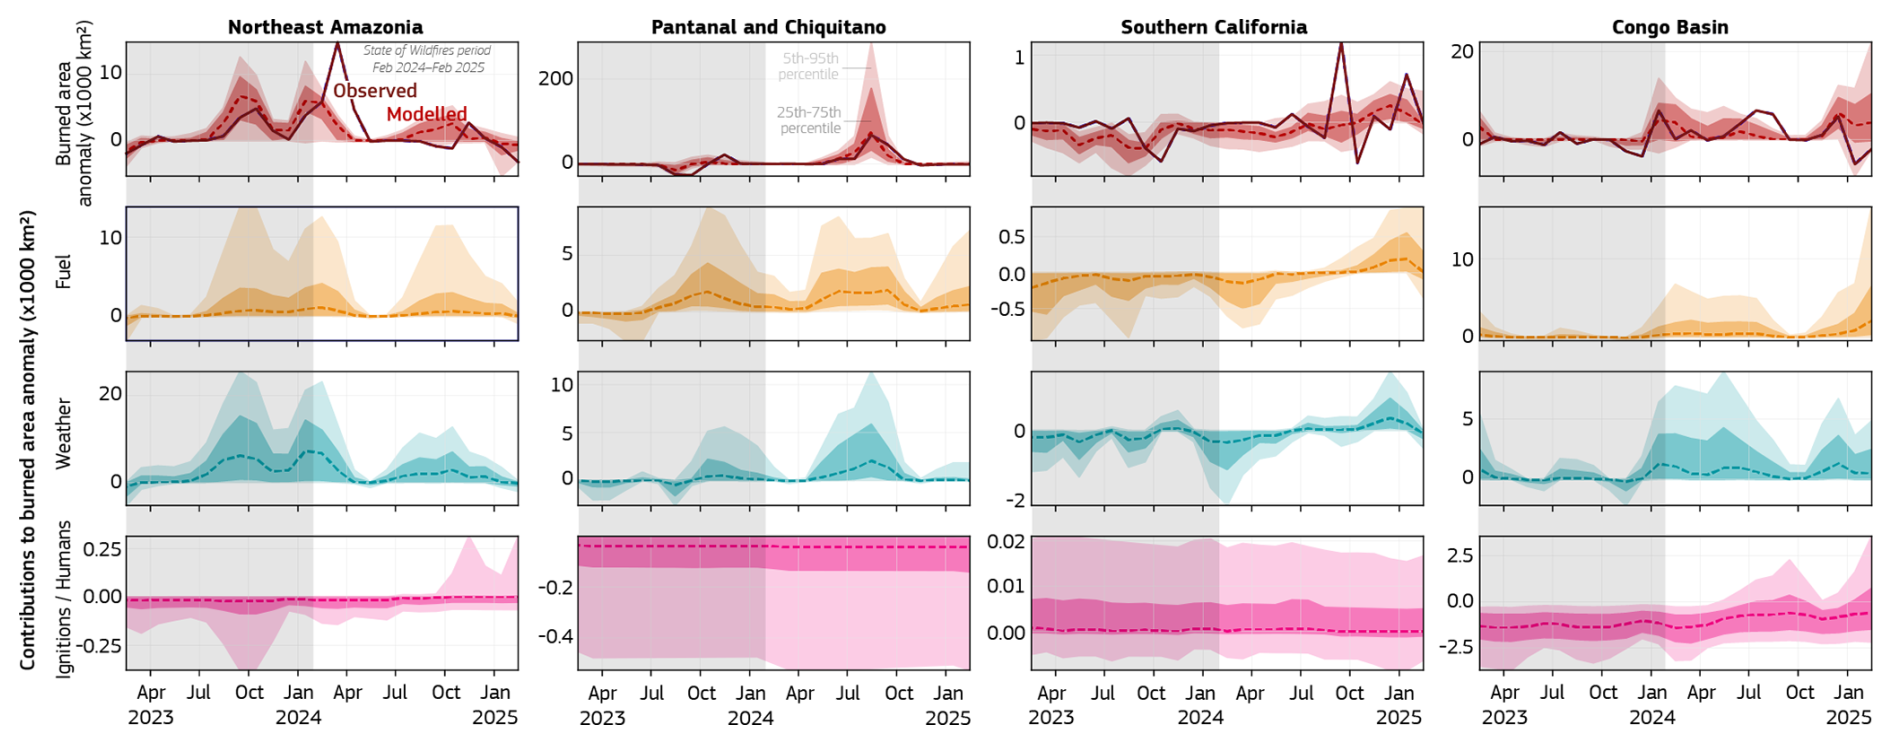
Figure 12Anomalies in burned area (BA) and driver contributions for each focus region during 2024, relative to the 2002–2024 average. Columns represent regions; rows show different variables. Top row: modelled and observed BA anomalies, expressed in thousand km2. Model output shows median, interquartile range (shaded), and 5th–95th percentile range (lighter shading). Other rows: modelled contributions to BA anomalies from fuel conditions, fire weather, and human/ignition-related factors, also shown in thousand km2. These panels highlight which drivers contributed most to regional fire deviations from the historical average in 2024.
Pantanal and Chiquitano
According to our ConFLAME analysis of the extreme BA during the 2024–2025 fire season in the Pantanal–Chiquitano (described in Sect. 2.2.2), weather conditions explained half of the BA anomalies, and fuel conditions explained almost 30 % (Fig. 12). June, July, and August accounted for the most extensive burning in the Pantanal, with 25 %–75 % of the landscape experiencing some fire activity, even if large parts featured only small anomalies. The peak occurred in June, when the BA exceeded climatological values by more than 5 000 km2 (almost triple than the annual mean). This anomaly was primarily driven by weather conditions (50 %–60 %), with fuel (10 %–20 %) and ignition (10 %–20 %) contributing equally. Although fire weather remained favourable in September and October due to persistently high temperatures, overall fire activity was lower than during the earlier peak (Figs. 12, S20).
We found that ignition sources contributed only 10 %–20 % to the anomalously high fire activity in 2024. However, we caution that our modelling framework only partially captures ignition dynamics, particularly those related to human activities such as farming. This limited representation is reflected in the wide uncertainty range assigned to ignition within the causality framework. Key factors like land clearing, water extraction, and the proximity of ignitions to protected areas are known contributors to extreme fires in the Pantanal (Barbosa et al., 2022), and they are not fully accounted for in our analysis.
Regional differences in fire drivers were evident (Fig. S20). Fuel conditions played a key role in the fine-scale geographical distribution of BA anomalies. Exceptionally dry fuels affected the Chiquitano dry forests in the east, while weather was the dominant driver in upland regions along the edge of the Pantanal wetlands, such as the Serra do Amolar hills in western Brazil. The most extreme fires were observed where these two influences overlapped, where both vegetation was unusually flammable and atmospheric conditions were conducive to burning.
As for what prevented the fires from becoming even more severe (Fig. S18), no single factor alone limited fire spread, even in the areas that burned most intensely. However, small shifts in conditions, such as drier weather, drier fuels, or fewer land-use barriers, could have led to 2 %–12 % more BA in the model cells experiencing the greatest fire anomalies regions (top 5 % of anomalies).
Southern California
According to our ConFLAME analysis of the extreme BA during the 2024–2025 fire season in Southern California (described in Sect. 2.2.2), the most important cause of the extent of burned areas was fuel (30 % to 60 %), closely followed by weather (20 %–40 %), while the number of ignitions (20 %) was less pronounced that in previous years and acted as reducing factor (Fig. 12). During January 2025, unusually dry fuel conditions played a key role in promoting BA anomalies, explaining up to 500 km2 of the 800 km2 of the anomalous BA in that month. Fire weather conditions, starting as early as October 2024, were also anomalous versus previous years. Focusing on the areas with the most extensive burning (top 5 % of BA), we found that anomalies could have been 30 %–60 % larger under drier fuel conditions and more extreme fire weather, with an additional 5 % increase if fuel availability anomalies had also been higher (Fig. S17). The substantial suppression efforts deployed are unaccounted for in our modelling framework and could be one of the possible reasons the fires did not escalate even further.
Congo Basin
According to our ConFLAME analysis of the extreme BA during the 2024–2025 fire season in the Congo Basin (described in Sect. 2.2.2), weather conditions explained about 30 %–60 % of the BA anomalies, with fuel conditions acting as an important secondary control during the periods with greatest fire extent (Fig. 12). Fuel conditions in the Congo Basin remained relatively stable throughout 2024, contributing between 10 %–35 % to fire activity year-round. In contrast, the influence of weather conditions varied more substantially, with virtually no fire-conducive weather in October–November, outside the typical fire season, and moderate levels (5 %–15 %) during peak fire periods, particularly in January and July (see also Fig. S17). July stood out as the month with the largest deviation from typical fire patterns. During this time, fuel conditions and fire weather contributed almost equally to the BA (Fig. S22).
ConFLAME indicates widespread anomalous BA across the southern part of the Congo Basin. These model estimates of BA are larger than the BA detected by satellites (Fig. S22). Dense canopy in these remote regions may have led to missed detections of BA. Particularly high fire-conducive conditions were predicted across much of southern Democratic Republic of the Congo (DRC), as well as northern Angola and parts of the Republic of the Congo. However, two notable pockets, in the far northeast of the basin, around the border of northeast DRC and South Sudan, and a smaller zone just east of the border between the DRC and Republic of the Congo in the north, did not emerge in our analysis.
Despite these broad areas of fire-favourable conditions, fires did not become much larger in many places. The key reasons for this were moisture and weather limitations. Looking at areas at the top 5 % of burning, up to 15 % more fire could have occurred if fuel had been even drier or if atmospheric conditions had been slightly more favourable.
Many of the direct drivers and controls on fire events, outlined in Sect. 4 (e.g. weather, fuel, moisture, ignition and suppression), are influenced by global change factors such as climate and land-use change. Since the pre-industrial era, global mean temperature has increased by ∼ 1.3 °C (Betts et al., 2023; Forster et al., 2025), with greater rates of warming at higher latitudes, adding potential for fuel drying. Climate change has also resulted in altered precipitation patterns, with total rainfall and dry season length increasing or decreasing variably across regions (Polade et al., 2014; Swain et al., 2018; IPCC, 2023a). Meanwhile, changes to fuel load and ignition rates are driven by emissions, climate change, and land-use change, with varying effects regionally (Foley et al., 2005; Finney et al., 2018; Romps, 2019; Wang et al., 2024).
5.1 Methods
5.1.1 Overview of attribution approaches
Fire is a complex phenomenon that impacts societies and ecosystems in many ways, from the extent of BA to the severity of individual fire events. Different user groups seek information on different aspects of fire risk, whether policymakers, communities, fire managers, litigators, or those working to build a broader scientific evidence base. To provide results relevant for a wide range of stakeholders, we apply various modelling approaches to fire attribution, drawing on different metrics and attribution techniques, to build a more comprehensive understanding of human influence on recent extreme fire activity. Our approach includes analyses of fire weather indices and BA, alongside a range of attribution metrics suited to these different contexts. Our BA attribution also provides the evidence, in the form of a calibrated probabilistic model, needed to perform future risk projections in Sect. 6.
While most attribution research has focused on the contribution of anthropogenic climate change, humans influence fire occurrence and risk in multiple other ways: the direct influence of people via activities such as land-use change and landscape configuration and changes in ignition probability and fire suppression, among others. Considering human-driven climate change separately to changes in human activity, in addition to their combined effect, allows us to disentangle the contributions of local socioeconomic and global environmental change.
A key challenge that has rarely been addressed before is how to represent socioeconomic influences on fire within a framework that can also attribute climate change (Huntingford et al., 2025). This is a relatively new area of research, and progress has been limited by data availability, the complexity of human–fire interactions, and how to represent these in models. The absence of variables capturing human agency, such as deliberate ignitions, suppression, or governance, has made it difficult to capture the ways people influence fire (Perkins et al., 2024). For instance, previous attempts to incorporate socioeconomic drivers have often relied on global parameterisation of population density as a simple predictor of fire activity. However, this relationship is shaped by local cultural, political, and economic contexts and can therefore give misleading results. In this report we extend last year's framework by taking a more detailed and regionally grounded view of how people influence burning through using urban and rural population densities (see Sect. 5.1.3) and using non-linear response mechanisms (Sect. 4.1.2). This represents an important step towards capturing socioeconomic influences more realistically, but it is still only a partial representation. Considerable work remains to incorporate human agency and broader socioeconomic context (Millington et al., 2022), and we see this as an active area of development for future reports.
Understanding the influence of people or climate on fire and its drivers is inherently challenging, given the complexity of fire processes and the interactions between natural and human systems. Integrating this range of complementary methods – each with its own strengths and limitations – helps build confidence in attribution results that no single method could provide alone. We can therefore identify where there is broad agreement across methods. This dual focus on climate forcing and socioeconomic drivers also allows us to identify where there is broad agreement across methods and to highlight where gaps remain, particularly in representing local socioeconomic influences on burning.
To quantify the different ways people affect fire, we apply four types of attribution in this report (Table 4), designed to meet diverse user needs and to align with the modelling frameworks currently available:
- i.
Firstly, our attribution to anthropogenic climate forcing explicitly targets the changes driven by anthropogenic greenhouse gas emissions and land-use change, following the IPCC WGI definition (Hegerl et al., 2009; Mengel et al., 2021). We prescribe these emissions in a model to specifically isolate human forcing from natural variability (Sect. 5.1.2 and 5.1.3).
- ii.
Our attribution to total climate forcing considers changes driven by climate change since the pre-industrial period, including both anthropogenic climate forcing and natural variability in line with the IPCC WGII and the Intersectoral Impacts Model Intercomparison Project 3a (ISIMIP3a) definition of climate-change impact attribution (IPCC, 2023b, c; Mengel et al., 2021). This involves comparing simulations driven with historical reanalysis, our factual scenario, to a detrended counterfactual simulation, where the trend in each climate variable is removed (with both simulations including historical transient land-use change). Therefore only the impacts of climate change are attributed, not distinguishing between anthropogenic or natural causes (Mengel et al., 2021; Burton et al., 2024b). We perform this between 2003–2019, the overlap between available counterfactual simulations and satellite data used for training in Burton et al. (2024b).
- iii.
Our attribution to socioeconomic factors is applied via the same set of simulations as our attribution to total climate forcing. We isolate the role of socioeconomic factors by comparing the early industrial period to the late industrial period (1901–1917 versus 2003–2019) using detrended ISIMIP3a data, in which only land use and population density are allowed to change (Burton et al., 2024b), with one of our frameworks incorporating a more detailed representation of local population–fire interactions. This definition, used consistently in both Burton and Lampe et al. (2024) and Jones et al. (2024b), provides a transparent and comparable first-order approach to including direct human pressures in attribution analyses.
At the same time, this should be viewed as a step in an active but still incomplete field of research. Full socioeconomic attribution remains an emerging area, and further work is needed to incorporate processes such as ignition practices, suppression, and governance, as well as capturing how human–fire relationships evolve over time. Our framework therefore represents a step forward, internally consistent, peer-reviewed, and comparable across regions, while highlighting where future developments will be most impactful.
- iv.
Our attribution to all forcings compares the early industrial period in the counterfactual scenario to the last industrial period in the factual scenario, which gives the net effect of all forcings combined (anthropogenic climate forcing + total climate forcing + socioeconomic factors).
The attribution methods described above enable us to assess the influence of climate and socioeconomic forcings on fire in each focal region with respect to three different target variables:
- i.
Extremes in fire weather during 2024–2025. Using the HadGEM3-A large ensemble, we attribute changes in the probability of extreme fire weather conditions to anthropogenic climate forcing. This analysis specifically targets the months identified as extreme for each focal event as outlined in Sect. 2.2.2 focusing on sub-regional extremes that occur in the model grid cells with the highest FWI values (top 5 % of all regional grid cells). By focusing exclusively on these areas of most severe fire weather, this approach provides a proxy for understanding how each forcing influences the locations and times of highest fire risk within the region. We used this methodology as in last year's report. See Sect. 5.1.2 for details.
- ii.
Region-wide extreme BA during 2024–2025 focal events. Event-specific BA reflects how climate and human factors jointly influence the actual extent of burning during major fire events, offering a direct measure of fire impact on people and ecosystems.
Using the ConFLAME model framework we attribute changes in the likelihood of the 2024–2025 observed total BA across the entire focal region to anthropogenic climate forcing, total climate forcing, socioeconomic factors, and all forcings combined. Like our FWI, analysis focuses on the observed peak burning months and captures the overall influence of each forcing on the extent of fire activity at the regional scale. See Sect. 5.1.3 for details.
- iii.
Background changes in BA this century using median monthly over recent decades. Background BA shows how climate change is reshaping regional fire regimes over the long term, revealing gradual shifts in baseline fire activity that may go unnoticed in year-to-year variability.
Using fire-enabled dynamic global vegetation models (DGVMs) participating in the Fire Model Intercomparison Project (FireMIP), we attribute changes in median monthly BA averaged over recent decades (2003–2019) to total climate forcing, socioeconomic factors, and all forcings combined. This approach provides context on longer-term background fire activity and applies the same methodology as last year's report, though this year focussing on specific focal regions. See Sect. 5.1.4 for details.
In each approach we include an explicit estimate of uncertainty. We use bootstrapping to give uncertainty estimates for the FWI risk ratios (RR) defined as the ratio between the probability of seeing the observed FWI with the target forcing vs without anthropogenic climate forcing, reported here at 90 % confidence intervals. ConFLAME is designed as an uncertainty quantification model (as per our driver assessment, Sect. 4.2.4), giving the likelihood of all possible BA outcomes for each region based on a probabilistic analysis of past burn patterns and environmental conditions. We combine the information from the FireMIP models in a weighted multi-model ensemble to give uncertainty ranges across the models. Each result therefore presents a 5–95th percentile probability estimate.
For consistency with last year's report we also report attribution estimates based on methods used in the State of Wildfires 2023–2024 report (Jones et al., 2024b):
- iv.
Sub-regional extreme BA during 2024–2025. We attribute changes in the likelihood of extreme BA occurring within the model grid cells with the highest BA (top 5 % of all regional grid cells), focusing on areas where fire activity was most spatially concentrated during peak burning months. This analysis uses the same ConFLAME simulations and forcing scenarios as the region-wide BA attribution and provides insight into how forcings affect the most severely impacted locations within the region. See Sect. S5.2.3 in the Supplement for discussion of results.
In the coming years, our project seeks to incorporate attribution results based on a broader set of Earth system models (ESMs) to better sample the structural uncertainty arising from differences in process representation across different models (i.e. beyond HadGEM3-A). In this report, we introduce results based on the one ESM as follows:
- v.
Background changes in fire weather this decade. Using the Canadian Earth System Model (CanESM5; Swart et al., 2019), we attribute changes in the frequency of extreme fire weather to total climate forcing with the FWI, identifying how the likelihood of extreme fire weather has changed by comparing the frequency of high FWI values in pre-industrial and present-day climates. Our analysis covers the years 2016 to 2025, focusing on the climatological months of peak burning during the 2024–2025 fire season. See Sect. S5.1.2 for methodology and Sect. S5.2.2 for discussion of results.
Table 4Summary of the attribution approaches used in this report. See Table S2 for a breakdown on the what each attribution type includes and what each modelling targets. Bold indicates the terms used in the rest of the report with key timeperiods used.
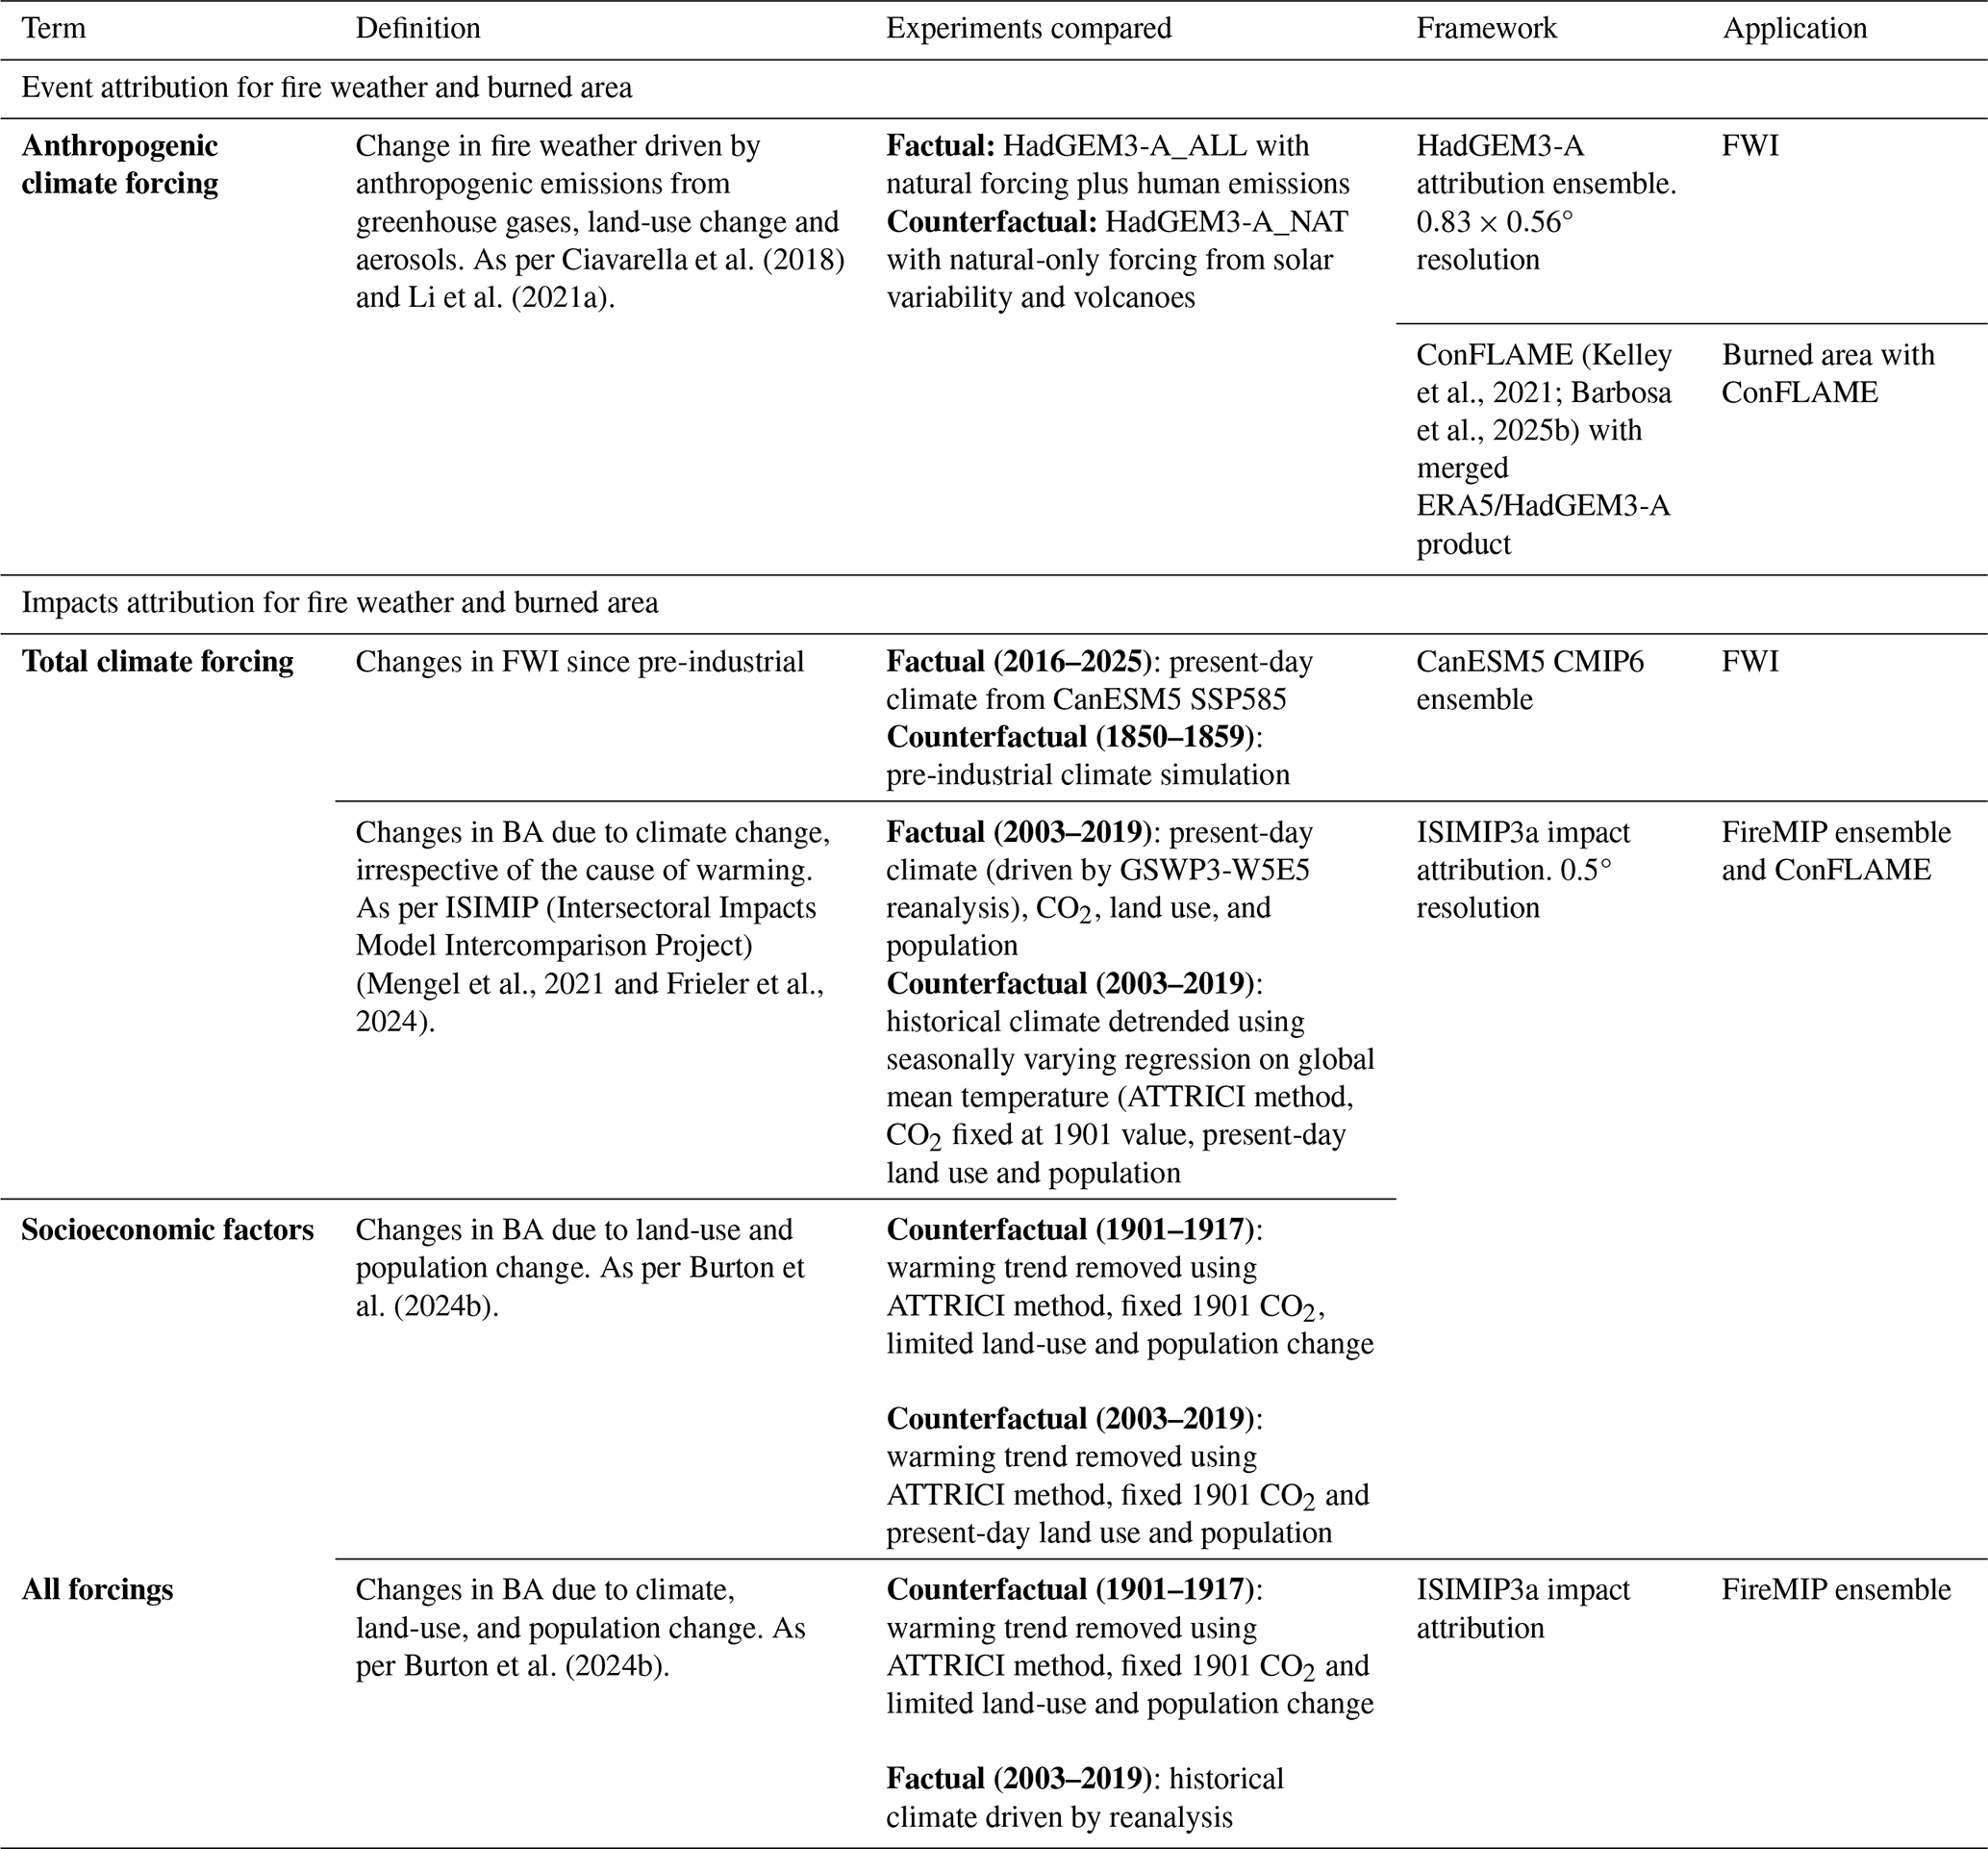
5.1.2 Attributing extremes in fire weather during 2024–2025
We use two complementary approaches to attribute changes in the probability of high fire weather, measured by the FWI, to anthropogenic climate change. The first method uses a targeted large-ensemble weather model simulation to assess the influence of climate change on the 2024/25 fire seasons directly. The second method applies a longer-term, probabilistic framework using simulations from a fully coupled Earth system model.
The first approach follows the same methodology used in the previous State of Wildfires report (Jones et al., 2024b). This is an established approach to attribute changes in the probability of high fire weather, measured using FWI, to anthropogenic climate forcing. This method has been previously used by the World Weather Attribution Initiative (Barnes et al., 2023; Barnes et al., 2024; Barnes et al., 2025), using outputs from the HadGEM3-A large ensemble (Ciavarella et al., 2018). Our approach builds on the methodology introduced by Stott et al. (2004) for attributing extreme weather events, and it has been applied in other attribution studies targeting fire weather, such as Li et al. (2021a).
As outlined in Sect. 4.1.1, the FWI is used operationally and in research contexts to rate fire danger based on meteorological conditions. Due to the availability of model output, which is typically only available on a daily temporal resolution variables we use maximum daily temperature at 1.5 m as a proxy for noon values, total daily precipitation, mean daily relative humidity at 1.5 m, and mean daily wind speed at 10 m, following Perry et al. (2022). We calculate the daily FWI for the months of 2024–2025 peak BA anomaly for each focus region, using the same month and region for validation over the historical time series (1960–2013). Note that at the time of writing, data for HadGEM3-A were only available till the end of 2024, so we do not report on Southern California fires using this method.
We validate and bias-adjust the model estimates of high FWI for the period 1960–2013 by comparing a 15-member HadGEM3-A ensemble with ERA5 reanalysis data (Copernicus Emergency Management Service (C3S), 2019) representing “observed” FWI. The FWI observed with 0.25° resolution from ERA5 was coarsened by linear interpolation (calculated by extending the gradient of the closest two points) to match the 0.5° model grid. We compare the time series of individual components of the FWI (Figs. S52–S59) and the distribution of the modelled and observed FWI (Figs. S67–S70) and apply a simple linear regression to find the bias correction required for the 2023 model output. Before bias adjustment, the modelled FWI is generally higher than the observed FWI for Amazonia and Congo, which modelled FWI compares more favourably to ERA5 in the Pantanal. The correction adjusts the trend and absolute value while maintaining variability, and the model successfully reproduces the observed distribution after applying the correction in each region (see Sect. S9).
For the events occurring in the 2024 fire season, we calculate the FWI from the HadGEM3-A model simulations comprising two experiments of 525 members each, one driven by all forcings including historical greenhouse gas emissions, aerosols, zonal-mean ozone concentrations, and land-use change and natural forcing (ALL) and a second counterfactual simulation with natural-only forcing from solar variability and volcanic emissions and 1850 land-use (NAT) (see Table 4). By applying the bias adjustment from the previous step, and comparing the fire weather in the two simulations to the 2024–2025 observed FWI from ERA5, we calculate the change in probability of high fire weather due to anthropogenic climate forcing. The standard definition of “high fire weather” that we use is the 95th percentile of daily FWI values across all grid cells and days during the season. However, as in last year's report and in Burton et al. (2025), when the region is small or when climate conditions significantly influence the higher FWI in our counterfactual, leading to few ensemble members reaching higher FWI values, we need to adjust our definition of extreme. In this year's assessment, we apply the 90th percentile threshold for the Northeastern Amazonia and Congo regions, as the differences between the factual and counterfactual ensembles are so large that very few counterfactual members reach the 95th percentile of the factual distribution, making the calculation of risk ratios unreliable.
5.1.3 Attributing region-wide extreme BA during 2024–2025
We use the ConFLAME framework for direct BA attribution. For this report, we apply two configurations of the ConFLAME attribution framework to attribute anomalies in BA fraction during the peak burning months of the 2024–2025 fire season:
-
A near-real-time (NRT) setup for targeting anthropogenic climate forcing, which largely mirrors the configuration used in the drivers attribution section (see Sect. 4), assesses how human influences affected the likelihood of BA via meteorological drivers of fire conditions observed during the specific 2024 events. This setup targets the actual environmental conditions leading up to and during the events, providing the most up-to-date picture of climate and socioeconomic influences. By focusing on the precise timing and location of the event, the NRT configuration provides an up-to-date and high-resolution picture of how anthropogenic climate forcings have influenced the likelihood of extreme fire activity.
-
The Inter-Sectoral Impact Model Intercomparison Project (ISIMIP) 3a setup was previously used with ConFire in last year's report. This setup enables the analysis of how often fire events such as those in 2024 might occur under environmental conditions from 2002 to 2019. While 2024 itself is excluded, we look for similar events in this earlier period to understand how likely they would be without the recent changes in climate and land use. This broader, long-term setup helps us assess how the background risk is shifting over time and complements the more event-specific analysis shown earlier. This setup also directly links to the future projections presented in Sect. 6, which also use ISIMIP. As an addition to last year's report's setup, our ISIMIP setup also includes (i) changes in land use and cover (measured as the difference between tree cover and agricultural fraction since the previous year) and (ii) a separation of urban and rural population density in the socioeconomic forcing attribution (see Table S3). The former allows us to capture direct effects of land-use change on fire, rather than only static land-use states, while the latter enables us to represent non-linear relationships between population density and fire, including both positive and negative influences. Together, these developments represent methodological advances introduced in this year's report. As noted in Sect. 4.1.2, ConFLAME is optimised regionally and, for population density in particular, provides a more effective parameterisation than would be possible with a globally optimised model (Perkins et al., 2024).
As each configuration uses data that are somewhat similar to our Fire Weather Index (in the case of NRT) or FireMIP (when using ISIMIP) setups, neither setup is fully independent of our other two modelling approaches. However, the fire modelling in ConFLAME captures different components of fire than FWI or FireMIP by attributing BA during the events themselves. The advantage of ConFLAME is that it bridges the gap between event-focused real-time attribution and global process-based fire models. That said, future iterations would benefit from incorporating more independent, preferably observation-driven input datasets, to improve robustness and reduce potential structural alignment across methods.
Each attribution experiment involved training ConFLAME using “observed” or reanalysis driving data against MODIS BA (as described in Sect. 4) using data found in Barbosa et al. (2025d). We then ran the framework with factual driving data followed by a separate run counterfactual with the effect we aim to attribute (e.g. all forcings, climate, or socioeconomic drivers) removed. We conducted paired ConFLAME factual and counterfactual predictive model simulations at monthly resolution, using a structure similar to that in Sect. 4.1.2, with specific drivers grouped into controls in Table S1 and evaluated the model following Barbosa (2025a, b; Sect. 4.1.2). We separately train ConFLAME on 50 % of the data between 2003–2011 and perform evaluation on years 2012–2019. Further details of the model fitting and validation can be found in Sect. S5.1.3 and Sect. S9.2.2, respectively.
To determine the impact of total climate forcing, socioeconomic factors, and total forcing on increased BA during our focal events using the ISIMIP configuration, we conducted paired sampling of monthly BA in the target months (see Table 4). Total climate forcing's factual driving data use the same 2003–2019 GSWP3-W5W5 reanalysis data used for training for factual, while we use detrended data for the counterfactual, whereas socioeconomic used detrended data 2003–2019 for factual and 1901–1917 for counterfactual. Total forcing used 2003–2019 from GWSP3-W5W5 for the factual and 1901–1917 from detrended GWSP3-W5W5 for the counterfactual. We used paired sampling to account for uncertainty in the relationships between drivers and BA, ensuring co-variation between experiments (as in Kelley et al., 2021). In total, we drew 1000 samples across the 17 years of each simulation, resulting in 17 000 paired samples. Evaluation of performance can be found in Sect. S9.3.
We report attribution results both for the entire region (reported in the main text, Sect. 5.2.2) and for “sub-regional extremes” – the grid cells with the top 5 % of BA, to also assess how anthropogenic factors may have influenced the most severely affected areas (in Sect. S5.2.2). We use three complementary metrics to assess how our target factors have influenced burned area (BA) during extreme fire events:
-
Amplification factor (AF) quantifies how much larger or smaller BA was because of the considered driver. It compares factual BA for events as large or larger than the observed target months with counterfactual BA. An AF > 1 indicates an increase due to the driver (e.g. AF = 2 → twice as much area burned, or an AF = → half as much burned area due to the target factor). We calculate this across our model simulations and report both the central estimate (median) value and the range of uncertainties based on 10th to 90th percentiles.
-
Likelihood of attribution is the probability that BA was higher under the factual (with-forcing) world than it would have been in the counterfactual (without-forcing) world, expressed as a percentage.
-
For the NRT setup, we can also use the risk ratio (RR), which expresses how many times more likely an event of comparable BA was under factual versus counterfactual conditions. Similarly to Sect. 5.1.2, it compares the chance of seeing the observed BA under today's climate to the chance under a climate without human influence. A RR above 1 means climate change made the event more likely; a RR below 1 means it made it less likely.
Observed BA is calculated in a manner consistent with model outputs by averaging BA either across the entire region or, for sub-regional extremes, across the top 5 % of grid cells. Observations are taken from the monthly MCD64A1 dataset. In near-real-time (NRT) applications, the comparison is made for the specific year of interest; in the ISIMIP setup, the comparison spans 2003–2019.
Because the early industrial factual simulation in our ISIMIP setup includes no human influence on the climate, we first adjusted the target event's BA to the level expected without climate change. This adjustment involved identifying the percentile of the observed BA in the factual simulation and then finding the BA at that same percentile in the counterfactual simulation.
5.1.4 Attributing background changes in burned area this century
We assess how BA has changed over recent decades due to climate and socioeconomic drivers using the FireMIP (“Fire Model Intercomparison Project”) attribution framework developed by Burton et al. (2024b). This method uses state-of-the-art global FireMIP models, employing each model's native fire scheme, to estimate the contribution of different drivers to BA by comparing simulated fire activity under different ISMIP3a experiments. We quantify the effect of climate forcings on BA by comparing the present-day factual burned area to the present-day counterfactual BA. The effect of socioeconomic forcings is assessed by comparing the present-day BA of the counterfactual simulations to the early industrial BA of the counterfactual simulations since long-term climate is stationary in these simulations. Lastly, we find the effect of all forcings by comparing the present-day factual BA to the early industrial counterfactual BA.
The attribution focuses on changes in median monthly BA during 2003–2019 and uses a weighted multi-model ensemble, where weights reflect each model's ability to reproduce observed regional fire anomalies in GFED5 and FireCCI datasets. Uncertainty is evaluated through random resampling of the weighted ensemble, including a stochastic parameter that captures uncertainty in overall ensemble performance. This weighting reduces the influence of models that fail to capture local fire–population or fire–bioclimate relationships but does not fully resolve structural gaps in the ensemble. In particular, weak performance for socioeconomic drivers may widen overall uncertainty without attributing it to the specific process. As a result, FireMIP provides a conservative estimate of regional-scale fire responses, complementing our more detailed but regionally focused approaches.
All results are reported as relative anomalies, and uncertainty is assessed via a random resampling of the weighted ensemble, including a stochastic parameter which accounts for uncertainty on the performance of the entire ensemble. This approach provides a robust and conservative estimate of trends, particularly suited to assessing regional-scale fire responses.
In contrast to last year's report, where results were reported for IPCC AR6 regions containing the focal fire zones, this year we refined the analysis by tailoring the attribution directly to the specific areas featured in the report. This regional adjustment enhances the relevance and interpretability of the attribution results for each case study.
For full details on the method, model evaluation, and baseline results across all IPCC regions, see Burton et al. (2024b).
5.2 Results
5.2.1 Extremes in fire weather during the 2024–2025 focal events
Northeast Amazonia
We find that the fire weather conditions in Northeast Amazonia during January–March 2024 were significantly more likely due to anthropogenic climate forcing. The probability of experiencing fire weather at or above the levels observed during the event was 32 to 73 times more likely in the factual simulations compared to the counterfactual simulations (Fig. 13). A substantially larger proportion of the factual ensemble exceeds the observed 90th percentile of FWI from the ERA5 reanalysis than in the counterfactual ensemble (Fig. 13), indicating that high fire weather conditions during early 2024 were much more likely in a climate influenced by anthropogenic emissions.
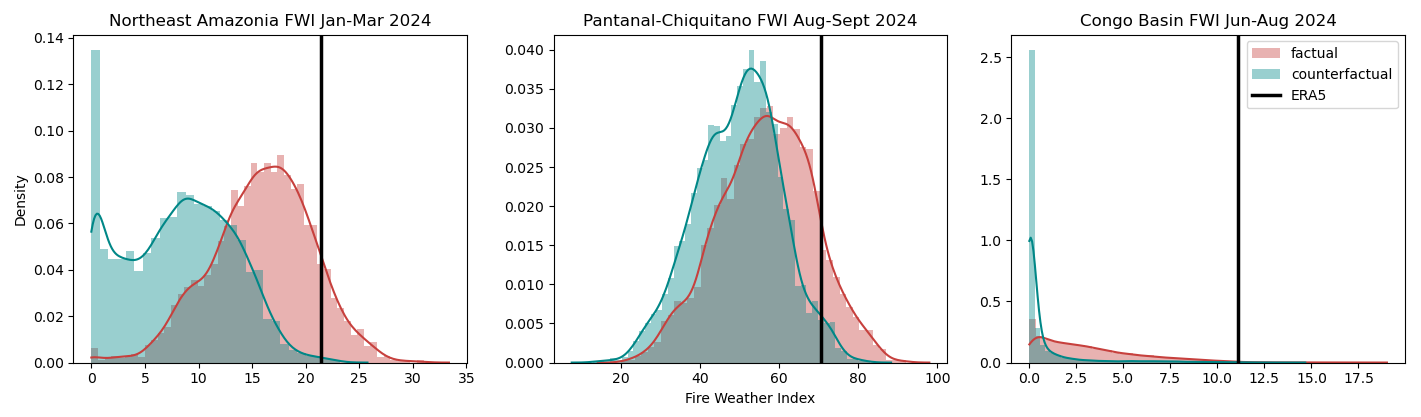
Figure 13High fire weather conditions in 2024/2025: probability distributions of FWI in the HadGEM3 ensemble for the focal fire season in each region, comparing simulations with anthropogenic and natural forcings (red; factual) to natural-only forcings (teal; counterfactual). Black line shows ERA5 reanalysis. The x axis shows the regional average of high-percentile FWI days: 89th percentile for January–March in Northeast Amazonia (left), 95th percentile for August–September in the Pantanal and Chiquitano (middle), and 90th percentile for June–August in the Congo Basin (right).
Pantanal and Chiquitano
The high fire weather conditions experienced during the peak anomaly in fire activity in August–September 2024 were 4.2–5.5 times more likely due to anthropogenic climate forcing (Fig. 13). While this increase in likelihood is smaller than that estimated for Northeast Amazonia, the narrower range suggests we have greater confidence that human influence increased the probability of extreme fire weather conditions in this region.
Our results largely agree with the rapid attribution analysis from the World Weather Attribution (WWA) initiative (Barnes et al., 2024), though with smaller uncertainty ranges, WWA found that the accumulated fire weather conditions, represented by the June Daily Severity Rating (DSR), were 4.6 (1.1 to 20) times more likely due to human-induced climate change. The DSR, a fire-suppression oriented rescaling of the FWI, is commonly used to assess the cumulative fire weather danger over monthly timescales (Van Wagner, 1987). WWA focused on June conditions because of their role in setting up the severe fire season that followed and their direct relevance to the large BA that severely impacted wildlife and livelihoods in the Pantanal. Observations also indicated a decrease in annual rainfall of −23.5 % (−46 % to +5 %) in the region, though this trend was not reproduced by climate models (Barnes et al., 2024).
Southern California
Due to the lack of data availability from HadGEM3-A for 2025, we were unable to perform bespoke FWI attribution analysis for Southern California. However, in previously published analysis, the rapid attribution study by WWA (Barnes et al., 2025) found that the extreme fire weather conditions (peak FWI) in the coastal Southern California ecoregion surrounding Los Angeles during January 2025 were 1.37 (0.48 to 3.6) times more likely in comparison to the pre-industrial climate, suggesting that climate change may have led to a moderate increase in fire weather, though causing a reduction in fire weather is also plausible and within the confidence range. As the impacts of Los Angeles fires related to extreme single days of wildfire spread, the monthly maximum FWI value averaged over the study region was used here. This result is complemented by the increasing likelihood of an extended dry season in the region. Decreased October–December precipitation allowed for protracted fuel drying, resulting in a more likely overlap between dry conditions and the winter Santa Ana winds. Observed trends (ERA5) in the October–December standardised precipitation index found that the dry conditions leading up to the LA fires were 2.4 (0.33 to 20.9) times more likely than in the pre-industrial climate. Using analogue-based attribution (Vautard et al., 2016), the cut-off-low circulation pattern associated with the strong Santa Ana winds around Los Angeles was found to have increased in likelihood by 2.5 (0.4 to 17) times.
Congo Basin
The high fire weather conditions observed across the Congo Basin during June–August 2024 were unusual in both the factual and counterfactual simulations. Our analysis indicates that these conditions were 3.0–8.0 times more likely due to anthropogenic climate forcing (Fig. 13). The entire FWI distribution in the factual ensemble is shifted toward higher values compared to the counterfactual ensemble. This means that across the full range of fire weather conditions, the probability of conditions conducive to burning is substantially greater in a climate influenced by human emissions.
5.2.2 Region-wide extreme BA during 2024–2025
Northeast Amazonia
We find strong evidence that anthropogenic climate forcing contributed to increased regional BA during the January–March 2024 fire season in Northeast Amazonia. Our analysis shows a 96 % likelihood (very likely under IPCC definitions of confidence) that BA was higher than it would have been without anthropogenic climate forcing (Fig. 14). We estimate that regional BA was approximately 4.3 times larger (our amplification factor – how much larger or smaller burned area is because of climate change) than it would have been in a counterfactual world without anthropogenic climate forcing (Fig. 14; Table 5), with a 90 % confidence range of 1.02 to 25.32. While the central estimate suggests a quadrupling of BA, the wide uncertainty range reflects the natural variability of fire processes. Nonetheless, even the lower bound supports a small but clear increase.
We assess the risk ratio, the likelihood of an event like January–March 2024 occurring under current climate conditions versus a pre-industrial baseline (Table 5). Based on historical data provided as evidence for the model, we estimate that a similar event is now 2.1 times more likely due to anthropogenic climate forcing. This figure captures the longer-term climate signal that would shape the overall frequency of such events. When we control for meteorological variability by comparing simulations with and without anthropogenic forcing but using identical weather patterns from 2024, we see slightly stronger effects (Table 5). The risk ratio rises to 2.7, and the upper bound of our amplification factor increases dramatically (over 100-fold in some ensemble members). This suggests that climate forcing alone could account for much, or possibly all, of the burning under certain conditions, although the central estimate remains close to our previous assessment.
Climate influence was widespread across Northeast Amazonia, most of the entire region showing a greater likelihood of increased BA due to anthropogenic forcing (Fig. 15). The strongest attribution signal occurred in the Southern Guiana Shield Fringe Forests, where climate change was very likely (≥ 90 % confidence) to have increased BA. These forests are particularly important due to their extensive areas of primary rainforest and high ecological sensitivity. In contrast, attribution confidence tapered to around 70 %–80 % in the Guiana Coastal Plain, and only a few localised areas, particularly in savannah mosaics, showed weak or no signal.
For regional BA totals, the likelihood that socioeconomic drivers increased BA was 47 % (Fig. 14), indicating no clear signal that human landscape modification influences the extent of burning in seasons like early 2024. The estimated amplification factor was 1.08 but with a wide 90 % confidence interval of 0.44 to 7.21 (Table 5). The wide confidence range, from potential halving of BA to a 7-fold increase, indicates that our model finds socioeconomic drivers to have a highly uncertain influence on regional fire activity during this period. This uncertainty likely reflects both the limited resolution of the socioeconomic variables used (e.g. population density, broad land-cover classes) and the challenge of capturing the complex ways that human activities interact with fire. It is also possible that opposing effects, such as suppression in one area versus ignition pressure in another, could be offsetting each other in regional statistics, though the modelling framework does not resolve these interactions explicitly.
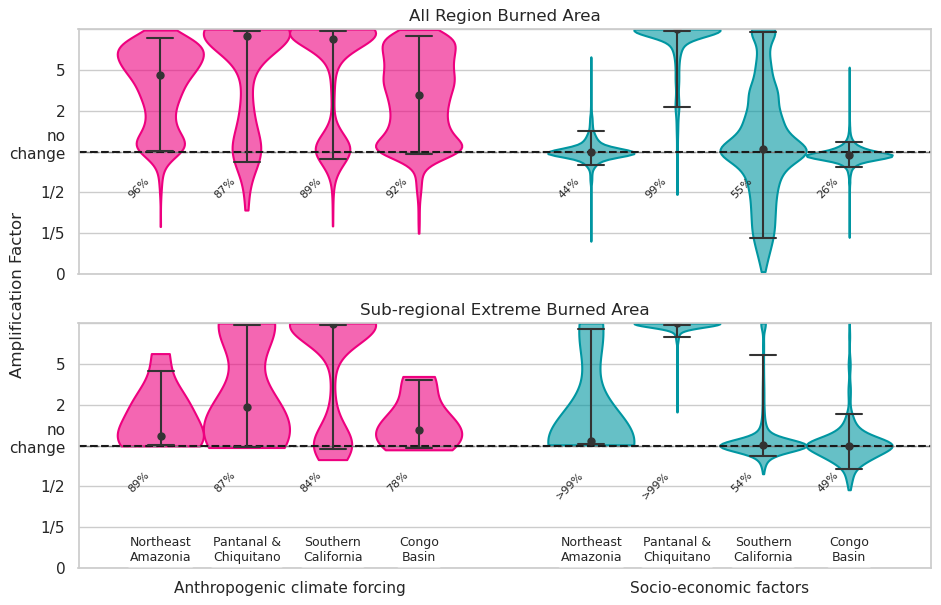
Figure 14Probability density of the amplification factor (AF) for each region, showing how different factors influenced the extent of burning for each focal region. The top panel displays results for the entire region, while the bottom panel focuses on sub-regional extremes (defined as the grid cells in the top 5 % of BA fraction). Anthropogenic climate forcing targets the 2024/2025 focal months using the NRT setup with counterfactuals using all HadGEM ensemble members; socioeconomic factors use the ISIMIP setup, looking at increased likelihood of 2024–2025-like events in 2003–2019 with climate trends removed vs 1900–1917. An AF greater than 1 indicates that the factor contributed to an increase in burned area extent, an AF less than 1 indicates a reducing influence, and a value near 1 suggests no change. Vases show probability distribution of AF, dots within each vase show central estimate, and bars show 90th percentile confidence range. The percentages on the lower left of each vase show the likelihood of each factor increasing burned area.
Pantanal and Chiquitano
The Pantanal and Chiquitano regions showed one of the strongest anthropogenic climate-change signals of all focal regions studied here or in previous reports (Jones et al., 2024b). The likelihood that anthropogenic climate forcing increased the observed regional BA is estimated at 88 % (Fig. 14), indicating anthropogenic climate forcing likely drove an increase in BA (Table 5). The total BA was 34.5 times higher (our amplification factor) in the factual ensemble than in the counterfactual, although the wide uncertainty range of 0.84 to 100 suggests the effect of anthropogenic climate change could range from minimal to extremely large (Table 5). When internal meteorological variability is removed (using ensemble mean), the estimated amplification factor remains largely unchanged. The model-based risk ratio for the event is 3.3, meaning the observed extent was roughly 3 times more likely due to anthropogenic climate change.
Climate influence was relatively consistent across the region (Fig. 15). Uniformity in attribution results may reflect the broad-scale influence of anthropogenic climate change. It also suggests that climate change is amplifying fire risk, even in areas with relatively intact ecosystems or seasonal wetlands, underscoring the vulnerability of these landscapes to the ongoing warming. However, the wide range in uncertainty highlights the need for improved observational data and better representation of fuel-moisture dynamics in fire-prone wetland mosaics such as Pantanal.
Historically, the Pantanal has been characterised by limited human fire use and relatively low natural fire incidence, largely due to its wetland-dominated landscape and seasonal flooding that constrained fuel ignitability (e.g. Alho et al., 2019). This makes the emergence of a clear climate-change signal particularly notable: in a system where fire has not been a dominant disturbance, anthropogenic drying is now creating conditions conducive to burning. The broader Pantanal–Chiquitano region, however, also includes drier savannah and forest mosaics where fire use has been more common, meaning that the 2024 anomaly reflects both the novel susceptibility of wetlands and the intensification of burning in adjacent ecosystems. This historical context strengthens the case that, in a region that has not traditionally experienced large-scale burning, the 2024 fires arose from compounding drivers: climate change removing long-standing hydrological constraints on fire and human activity providing ignition and land-use pressures.
Socioeconomic factors show a very strong role of direct human influence in shaping BA anomalies during 2024-like events in the Pantanal and Chiquitano region. At the regional scale, the likelihood that socioeconomic factors increased BA is 99 %, with an estimated amplification factor (AF) exceeding 100 (90 % confidence interval: 2.12 to 100). This means that even under conservative estimates, human activity at least doubled BA during comparable fire years. In sub-regional extremes, the amplification factor range is even more extreme, with a central estimate of more than 100 (lower 90 % confidence bound of 16.24), with a similarly high likelihood (> 99 %) that human activity contributed. This implies that the vast majority of burning in these most severely affected areas was directly linked to socioeconomic drivers and would have been extremely unlikely in their absence.
Our socioeconomic analysis is necessarily based on relatively coarse indicators (population density and land-use change) and so should be viewed as a restricted but internally consistent representation of direct human influence. Nonetheless, the framework captures a wide range of plausible anthropogenic effects and indicates a substantial role of people in shaping fire outcomes. Importantly, this finding is consistent with independent evidence from recent fire extremes in the Pantanal, including the 2020 event (Barbosa et al., 2022; Barbosa, 2024), which shows that land management, ignition patterns, and water extraction have amplified fire risk alongside climate pressures. Previous studies highlight that management of ignition sources, enforcement of land-use regulation, and reduction of wetland degradation and water extraction can reduce fire vulnerability in this region (Barbosa et al., 2022; Menezes et al., 2022; Marques et al., 2021). Thus, while global mitigation remains essential, locally targeted actions represent concrete and tractable pathways for reducing future fire risk. The consistency between regional and sub-regional attribution indicates that these influences are not just diffuse but are concentrated in areas of greatest impact. Even the lower bounds of the confidence intervals provide compelling evidence that anthropogenic pressure substantially elevated fire outcomes.
These results agree with a growing body of evidence pointing to compounding non-linear effects of human and climatic drivers in the Pantanal (Marques et al., 2021; Barbosa et al., 2022; Santos et al., 2024). While this attribution includes some of the human drivers identified in the region, such as land-use change, other key drivers, like wetland degradation and water extraction (which can intensify fire risk by drying out the landscape; Barbosa et al., 2022, 2025b), are not captured here.
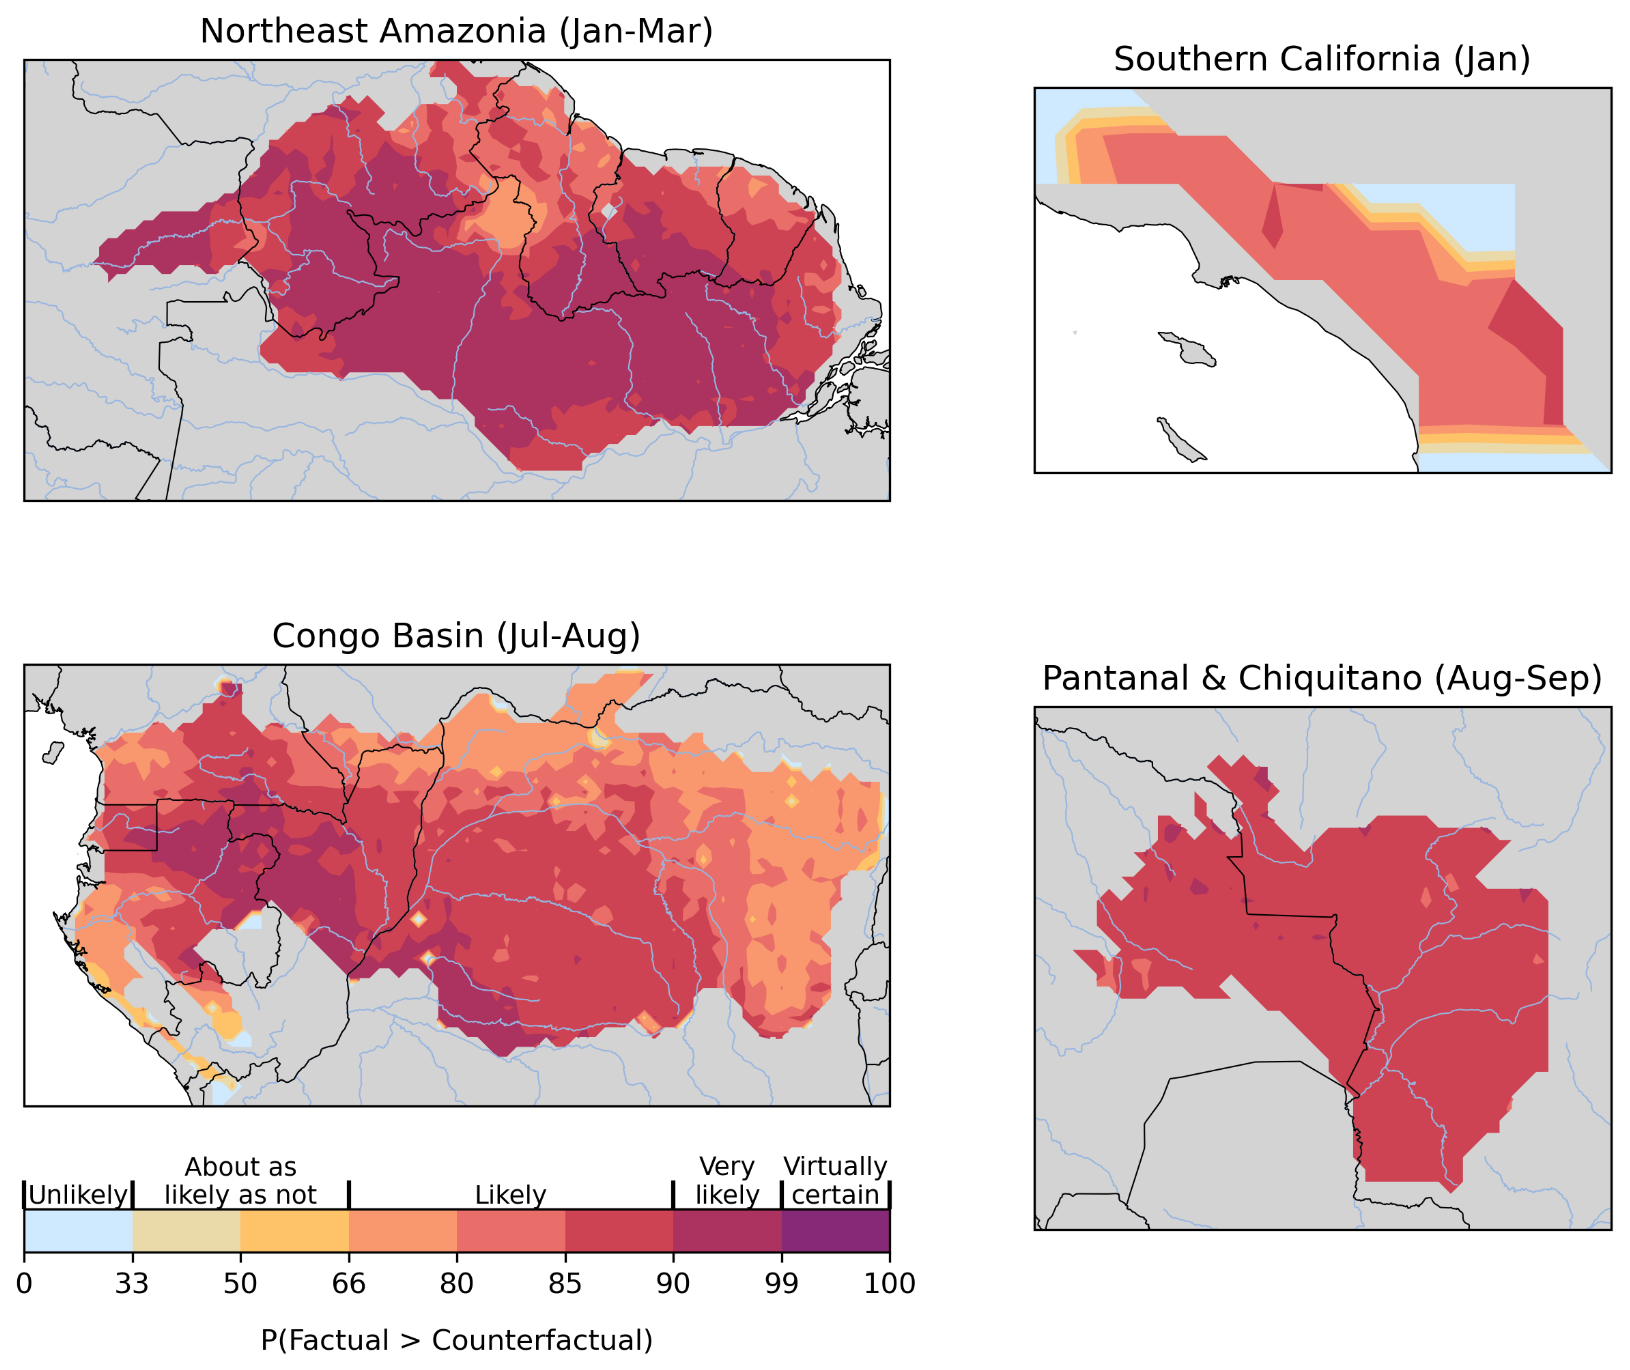
Figure 15Regions where anthropogenic climate forcing most likely influenced fire activity during the 2024–2025 fire season, based on the ConFLAME near-real-time setup. Maps show the probability that burned area (BA) was higher in the factual (climate-change-influenced) scenario compared to the counterfactual (no climate change) scenario based on the proportion of ensemble members where BA was greater in the factual than in the counterfactual scenario. Results are shown for focal fire periods in each region: January–March 2024 for Northeast Amazonia; August–September 2024 for the Pantanal and Chiquitano; June-August 2024 for the Congo Basin; and January 2025 for Southern California. Colour bar descriptive labels are based on IPCC uncertainty definitions (Mastrandrea et al., 2010).
Southern California
Anthropogenic climate forcing likely contributed to the high levels of BA observed in Southern California in January 2025, with a likelihood of increased burning of 89 %. The amplification factor (AF) was estimated at 24.8, though with a wide uncertainty range (90 % confidence interval 0.89 to 100), indicating that the influence could have ranged from negligible to extremely large. Despite this spread, the ensemble-mean counterfactual results largely agree, reinforcing confidence that anthropogenic climate forcing increased the likelihood of the event. The risk ratio of 2.3 suggests that similar fire weather conditions are more than twice as likely in the present-day climate compared to a scenario without climate change. This elevated risk was in January, outside the region's typical peak fire season, suggesting that anthropogenic forcing may be expanding the seasonal window during which large fire events can occur.
There is no clear evidence from our analysis that socioeconomic factors occurring on the landscape increased the likelihood of January 2025-like regional BA in Southern California during 2002–2019. The estimated likelihood of an increase is 55 %, with a highly uncertain amplification factor (AF = 1.04 [0.17–85.58]). As with the climate attribution, this likely reflects the small size of the region and limited signal in long-term data.
Congo Basin
Anthropogenic climate forcing likely increased the total area burned across the Congo Basin during June to August 2024. The likelihood of an increase is estimated at 92 %, with an amplification factor (AF) of 2.69, meaning the event-scale BA was nearly 3 times higher than it would have been without forcing. However, there remains some uncertainty: while the best estimate points to a substantial increase, the range spans a very small influence to a more than 30-fold increase (90 % confidence range of 0.96 to 33.96).
When we account for internal climate variability by averaging across all ensemble simulations (rather than using only the observed event conditions), the signal strengthens substantially. In this case, anthropogenic climate change appears to have increased BA by a factor of 15 (90 % confidence range: 0.97 to over 100), with a risk ratio of 2.6, which shows a more consistent pattern of increased fire risk due to long-term warming and drying trends. Unlike other regions, where most of the uncertainty stems from how fire responds to environmental conditions, in the Congo Basin uncertainty in the meteorological response to climate change itself plays a larger role.
The influence of climate change also varied significantly within the region. The strongest signal appears in the southern parts of the Congo Basin, particularly the Southern Moist Forests, where our modelling frameworks suggest that climate change very likely (90 %–95 % likelihood, using IPCC definitions; see Fig. 15) increased BA. Further north, in the DRC's northern moist forests, the likelihood was lower (50 %–80 %), and in the Southern Gabon transition forests, there was little to no signal. These spatial differences may reflect varying sensitivities to rainfall patterns, fuel conditions, or other landscape features and highlight the importance of region-specific analysis.
There is no clear signal in our indicators (population density and land-use change) that socioeconomic factors increased BA during the June–August 2024 fires in the Congo Basin. The likelihood of increased burning was 26 % regionally (AF = 0.94, 90 % CI: 0.70–1.17), suggesting a small or even slightly dampening influence. At the sub-regional level, attribution remains uncertain, with estimates of 62 % likelihood of increased BA in the most affected grid cells (AF = 1.00 [0.68–1.69]). These results should be interpreted cautiously, as our indicators cannot capture the full dynamics of the region. For instance, population density alone does not represent how local conflicts (Meddour-Sahar et al., 2013; Trigg et al., 2011) shifting cultivation practices vary with fallow length or sedenterisation (Molinario et al., 2020). Agricultural land-use fractions capture broad changes in cover but not day-to-day fire use for field preparation, and land-cover change highlights large-scale transitions but not how governance or local management influences burning (Tyukavina et al., 2018; Perkins et al., 2024). In the Congo, these processes interact in complex and sometimes opposing ways; shorter fallow periods can increase fire use, while sedenterisation can reduce it (Perkins et al., 2024). Incorporating such dynamics into future frameworks will be important for improving and tightening socioeconomic attribution in this region.
Table 5Summary of attribution results for burned area (BA) and fire weather indices during key fire events across Northeast Amazonia (January–March 2024), Pantanal–Chiquitano (August–September 2024), Congo Basin (July 2024), and Southern California (January 2025). Values are reported for both burned area (BA) across the full region and sub-regional extremes – the areas that saw the most burning (see Fig. 5). Metrics include the amplification factor (AF; the ratio of BA under the influence of the assessed factor relative to the counterfactual), risk ratio (RR) of Fire Weather Index during the events, and percent change in annual mean (background) BA. Results are shown for different configurations: anthropogenic meteorological forcing (using near-real-time and ensemble-mean setups), total climate forcing, and socioeconomic factors. Values are reported as median [5th–95th percentile] ranges, with likelihoods indicating the confidence that the factor contributed to increased burning or extreme fire weather. Colours indicate IPCC-defined confidence or likelihood categories (Mastrandrea et al., 2010). Where likelihoods are not explicitly provided, colours reflect the lowest plausible category based on the reported confidence range.
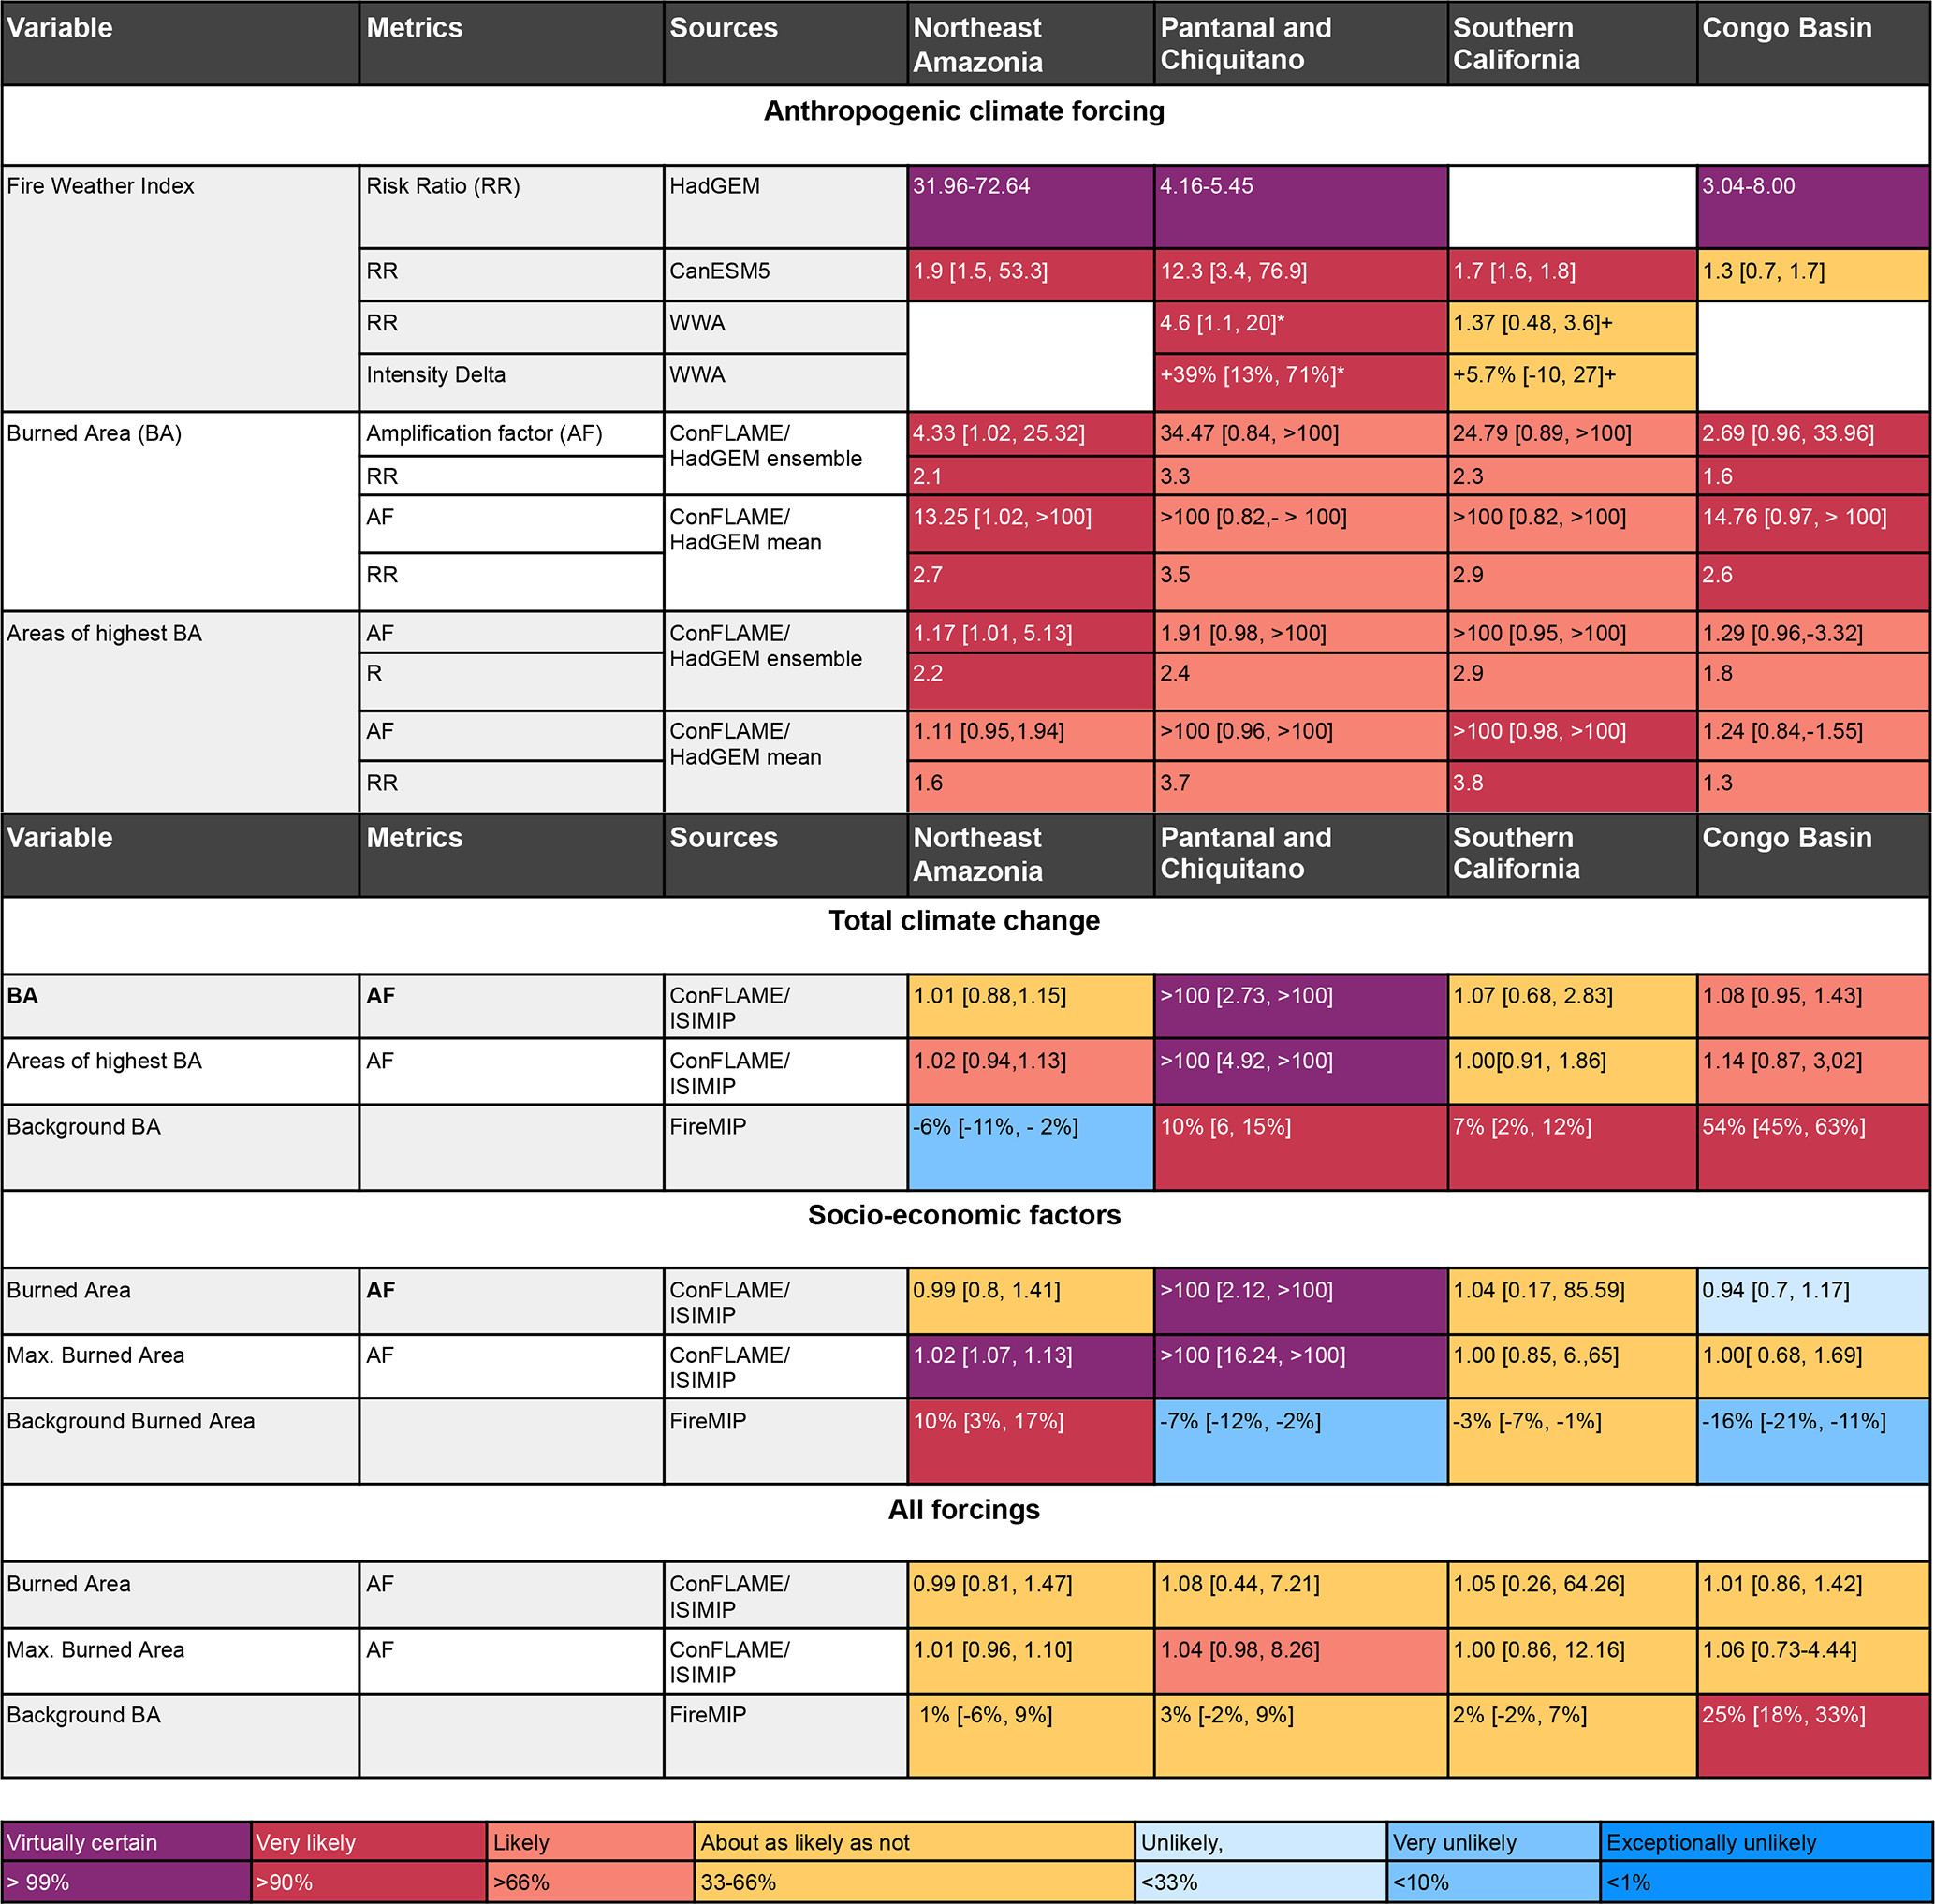
* WWA results for June DSR and + January max FWI.
5.2.3 Background changes in burned area this century
We assess how climate and socioeconomic drivers have influenced changes in background levels of BA for each focus region using the global fire model attribution framework introduced by Burton et al. (2024b), adapted this year to match the specific geographic areas analysed in this report (see methods in Sect. 5.1.4). Results represent the change in median monthly BA during 2003–2019 compared to a counterfactual scenario in which anthropogenic climate change or changes in socioeconomic factors were removed. This is distinct from our analyses focussing on the attribution of individual focal events in Sect. 5.2.1 and 5.2.2.
Northeast Amazonia
Total climate forcing led to a modest but consistent decrease in background BA between 2003–2019, with a median change of −6 % [−11 %, −2 %] compared to a counterfactual without climate change. Unlike the earlier attribution method (Sect. 5.2.2), which focused on extreme 2024-like events, this model captures long-term, background fire activity, including broader fuel–climate interactions.
The reduction in BA may reflect increased moisture or changes in vegetation structure that reduce flammability, though the exact mechanism is unclear. Recent observational analyses suggest a rise in wet-season (December to May) rainfall and a reduction in dry days in northern Amazonia over the past 2 decades (Barichivich et al., 2018; Almeida et al., 2017), which could contribute to these trends if captured in the climate inputs. The underlying models used here in this attribution framework also feature tighter coupling between vegetation, climate, and fire than the event-based approach, which may explain some of the differences, though it remains difficult to determine whether these are due to improved fuel representation or simply reflect a contrast between background and extreme conditions.
Socioeconomic changes are estimated to have increased the background BA in Northeast Amazonia by +10 % [3 %, 17 %] in 2003–2019 compared to 1901–1917. This signal aligns well with the earlier analysis of 2024-like events (Sect. 5.2.2) but is more narrowly constrained, reinforcing the role of human-driven changes as a key influence on regional fire activity, as identified in many previous studies. For instance, recent studies on land use and fire dynamics in the Amazonia region point to rising fire activity associated with expanding agricultural areas, secondary vegetation, and newly deforested areas (Silveira et al., 2022). Human activities remain the primary source of ignition, mainly through practices such as deforestation, pasture maintenance, and crop field burning, often intensified under dry conditions (Lapola et al., 2023).
Pantanal and Chiquitano
We find a modest but robust signal of climate-driven change in background fire activity. Between 2003 and 2019, total climate forcing is estimated to have increased the average BA by 10 % [6 %, 15 %]. The relatively narrow confidence range suggests strong model agreement and indicates that the region's area burned has already been measurably affected by long-term climatic shifts. This aligns with broader lines of evidence that highlight the Pantanal's vulnerability to changes in rainfall patterns and dry season intensity, which influence both fuel availability and flammability (Sect. 4.2). These findings are also consistent with attribution results for extreme events in 2024 (Sect. 5.2.2), which also showed a high likelihood of increased burning, albeit with greater uncertainty.
We estimate that socioeconomic drivers contributed a reduction in background BA of 7 % [−12 %, −2 %] compared to pre-industrial conditions. This suggests that long-term changes in land use and management, including shifts in agricultural practices, may have contributed to a modest but consistent suppression of average fire activity over the past 2 decades. The attribution of socioeconomic influence on BA in the Pantanal presents an interesting contrast with the attribution of focal event BA in the previous section, which suggests that socioeconomic factors very likely increased BA (Sect. 5.2.2). This contrast may point to important temporal and functional differences, explained in the following.
We estimate that socioeconomic drivers, mainly represented here by land use, contributed a modest reduction in background BA of 7 % [−12 %, −2 %] compared to pre-industrial conditions. This suggests that long-term changes in land use may have contributed to a slight suppression of average fire activity over the past 2 decades. It is important to stress that our analysis is limited to land-cover change and population density proxies and does not capture the full spectrum of socioeconomic drivers such as ignition practices, fire suppression, or governance, which may also influence fire activity. The contrast with focal-event BA attribution, which indicates that socioeconomic factors very likely increased BA (Sect. 5.2.2), may therefore reflect differences in timescale, the specific processes captured by our indicators, or areas where our representation of human influence is incomplete. Region-wide BA attribution above, for example, also incorporates land-use change and locally optimised, more detailed population-density-based representations. However, as noted in Sect. 5.2.2, even there we miss crucial aspects of local human agency, which can vary substantially in space and time across the region (Perkins et al., 2024).
This disagreement raises a cautionary flag. While the two methods target different timescales and use different models, their confidence intervals do not fully overlap, suggesting that at least one framework may be underestimating uncertainty or missing key processes. There is a need for caution in interpreting long-term trends: while our framework provides internally consistent estimates within its scope, it cannot fully resolve the broader socioeconomic influences on fire. It also reinforces the importance of using multiple, independent lines of evidence in attribution work and, specifically for the Pantanal, shows that more work is needed to assess the balance between human impact on background and extreme BA, along with the modelling techniques used to assess this.
Southern California
In Southern California, the models attribute a +7 % [2 %, 12 %] increase in median background BA to total climate forcing. This is consistent with the attribution results for 2025-like events (Sect. 5.2.2), though with higher confidence. The agreement across these distinct approaches, despite targeting different fire outcomes (seasonal extremes vs general background activity), provides additional confidence that long-term climate change is influencing baseline fire conditions in the region.
Socioeconomic influences contributed a −3 % change in background BA, with an uncertainty range of [−7 %, 1 %]. While not statistically significant, this result is more tightly constrained than those from the earlier analysis of 2025-like events. The modest downward influence may reflect intensifying suppression capacity, declines in human-caused fires due to fire-prevention policies including those targeted to electrical utilities (Jorge et al., 2025; Abatzoglou et al., 2020), or other urban interface factors, though uncertainty remains high.
Congo Basin
In the Congo Basin, we estimate that total climate change has driven an increase in mean annual BA of 54 %, with a tight confidence range of [45 %, 63 %]. This makes it one of the most robust signals of climate influence across the background fire analyses. These results are consistent with, though slightly stronger and more confident than, the attribution using 2024-like extreme events. The agreement between methods strengthens confidence that climate change is already amplifying baseline fire activity in the region.
This signal likely reflects a clear climate influence on fire-conducive weather, particularly in the southern part of the basin (Sect. 4.2.2). While fuel limitations played a role in moderating fire spread (Fig. 12), the background increase in BA appears strongly tied to meteorological shifts linked to climate change.
Socioeconomic influences appear to have played a moderating role in background fire activity across the Congo Basin. In our process-based model analysis, socioeconomic drivers, including changes in land use, land cover, and population, led to a 16 % reduction in background BA between 2003–2019, with a 90 % confidence range of −21 % to −11 %. This suggests a consistent and substantial dampening effect on fire, possibly reflecting a combination of land fragmentation, land-use conversion, or reduced fire use. These results are broadly in line with, though more confidently constrained than, the amplification factor estimated for 2024-like events in the previous attribution method, which indicated limited influence from socioeconomic factors.
6.1 Methods
6.1.1 Seasonal forecasts
Fire Weather Index
In Sect. 4, we introduced the use of seasonal forecasts of FWI and examined how they performed during the focal events of the 2024–2025 fire season. In this section, we present global FWI forecasts from the ECMWF's SEAS5 seasonal prediction system for the months June–August 2025, extending the same approach employed in Sect. 4 throughout the boreal summer months of 2025 (see “Subseasonal to seasonal forecast” in Sect. 4.1.1 for methods).
Burned area
In Sect. 4, we introduced the use of seasonal forecasts of burned areas using a combination of weather drivers and machine learning and examined how they performed during the focal events of the 2024–2025 fire season. In this section, we present global BA forecasts from the same system for the months July–September 2025, extending the same approach employed in Sect. 4 throughout the boreal summer months of 2025 (see “Subseasonal to seasonal forecast” in Sect. 4.1.1 for methods).
6.1.2 Multi-decadal projections
Fire Weather Index at future global warming levels
To calculate how the risk of fire weather extremes might evolve with future warming, we apply the same framework described in Sect. S5.1.1, but instead of comparing recent climate to the past, we compare it to a set of global warming levels: 1.5, 2.0, 3.0, and 4.0 °C above recent past climate (2016–2025).
For each level of warming, we identify years in the CanESM5 ensemble where the smoothed 11-year running global mean temperature aligns with the target level and then assess the frequency of extreme 7 d FWI events in those years, as per Liu et al. (2023b) and similar to Otto et al. (2018a). Comparing this to the 2016–2025 climate baseline gives us a forward-looking set of risk ratios (RRs) – RR1.5, RR2.0, etc. These indicate how much more likely such extremes become as the planet warms.
As with the attribution to past climate (Sect. S5.1.1), uncertainties are captured through bootstrapped confidence intervals, enabling meaningful comparison of future risks even when rare extremes are involved.
Burned area in future emissions scenarios
In order to project future changes in BA, we extended the ConFLAME ISIMIP3a modelling approach used in Sect. 5.1.3 to future decades under Shared Socioeconomic Pathway (SSP) scenarios SSP126, SSP370, and SSP585, following a similar protocol to United Nations Environment Programme (2022). We use the same optimised model as in Sect. 5.1.3, but here we employ bias-corrected global climate model (GCM) outputs from ISIMIP3b (Frieler et al., 2025) for prediction. While ISIMIP3a uses reanalysis data for historical analysis, ISIMIP3b employs GCM data to project future climates and is designed for usage cases requiring a seamless continuation of the historical period into future scenarios.
ISIMIP3b utilises five bias-corrected GCMs, including historical model output up to 2014 and future scenarios from 2015–2100 under the three SSPs. ISIMIP3b uses surface-based meteorological outputs from ScenarioMIP simulations, which include future forcings from greenhouse gases, aerosols, land-use change, and short-lived climate forcers. The five GCMs used are GFDL-ESM4 (Held et al., 2019), IPSL-CM6A-LR (Boucher et al., 2020), MPI-ESM1-2-HR (Mauritsen et al., 2019), MRI-ESM2-0 (Yukimoto et al., 2019), and UKESM1-0-LL (Tang et al., 2019; Sellar et al., 2019). As part of ISIMIP3b, each GCM is bias-corrected as described in Lange (2019).
Future ISIMIP3b projections for socioeconomic drivers such as population density or land-use change were not available at the time of analysis. As such, our simulations exclude future changes in ignition sources or direct land-use modification on both fire and vegetation. To simulate vegetation structure and fuel availability, the JULES-ES dynamic vegetation model was run offline, driven by surface climate variables from each of the five bias-corrected GCMs under each SSP scenario and scenario-specific CO2 concentrations to represent CO2 fertilisation, along with prescribed nitrogen deposition but excluding changes in fertiliser application, along with prescribed nitrogen deposition but excluding changes in fertiliser application. The land-cover output from JULES-ES was then bias-corrected (using the same mapping procedure as Sect. 5.1.3, based on biases between JULES-ES driven by reanalysis and VCF observations) to maintain consistency with the GCM bias-correction procedures. Our approach provides a probability distribution of future BA representing the uncertainty range from cross-model (GCM) spread in the response of climate and vegetation to emissions for each scenario and year in the period 2010–2100. Years 2010–2014 were adopted from the historical experiment for each GCM and post-2014 from branched SSP and model specific projections. We describe future changes as significant if the range across GCM projections for a future period does not overlap with the range given by the GCMs for 2010s.
Using these driving data, we generate 1000-member ensembles for each region and each GCM–SSP combination, using the trained ConFLAME-ISIMIP model described in Sect. 5.1.3. For each 10-year period, we calculate the likelihood of extreme fires by determining the fraction of years within each ensemble member where burned area during the event months exceeds that of the observed focal event. We then average this exceedance fraction across all 1000 ensemble members to estimate the likelihood for that decade. This process is repeated for each GCM and SSP.
For decades beyond 2010s, we then calculate the increase in the likelihood of 2024-/2025-like events by taking the ratio of the exceedance frequency in each future decade relative to the 2010s baseline. This is analogous to the risk ratio used in Sect. 4, where the future period acts as the “factual” and 2010s as the “counterfactual” baseline. Following methods outlined in Sect. 4, we perform this analysis for the entire region and for “sub-regional extremes” – the grid cells with the top 5 % of BA.
Lastly, we calculated the integrated probability of experiencing a fire event of similar magnitude to our target region within the expected lifespan of a citizen born in 2023 (the year of the latest estimate). According to UN population statistics (United Nations Population Division, 2023), life expectancy at birth is 75.8 years for Brazil, 79.3 years for the United States, and 61.9 years for the Democratic Republic of the Congo (DRC). While the Northeast Amazonia and Congo Basin regions span multiple countries, most fire anomalies in these regions occurred in Brazil and the DRC, respectively (Fig. 5). To account for years beyond 2100 in the life expectancy of Brazil and the United States, we extrapolated the annual trend in event probabilities. The integrated probability is calculated as 1 minus the product of the annual probabilities of not experiencing a fire event like the focal event, across each year from 2025.
6.2 Results
6.2.1 Seasonal forecasts of Fire Weather Index and burned area anomalies
As of mid-2025, neither La Niña nor El Niño conditions are present in the tropical Pacific. Instead, the climate system has entered an ENSO-neutral phase, according to the latest report from the National Oceanic and Atmospheric Administration (NOAA, 2025). This neutral phase is expected to persist through the remainder of summer and into at least early autumn. While neutral ENSO conditions typically indicate a reduced influence of Pacific sea surface temperature anomalies on global weather patterns, the persistence of anomalously warm ocean conditions and other climate drivers may continue to exert significant influence on regional and global climate variability in the months ahead (Frölicher and Laufkötter, 2018).
May 2025 was the second-warmest May on record globally, with an average temperature of 15.79 °C, 0.53 °C above the 1991–2020 climate and 1.4 °C above pre-industrial levels (Copernicus Climate Changes Service, 2025). While this marked a brief drop below recent consecutive months exceeding 1.5 °C from the pre-industrial record, it still reflects the persistent trend of global climate warming (Horton, 2025). Unusually low rainfall and soil moisture across northwestern Europe, including the UK, reached their lowest levels since 1871. This raises serious concerns about crop failures, potential water shortages, and wildfire risk (European Commission Joint Research Centre, 2025; UK Environment Agency, 2025). Similar conditions were reported in the United States, particularly across Arizona and Texas, where exceptional drought levels led to reservoir depletion, strict water restrictions, and increased wildfire activity (National Centers for Environmental Information, 2025; National Interagency Fire Center, 2025).
Starting from May, and according to the outlook for the Northern Hemisphere boreal summer of 2025 (June–July–August), anomalous fire weather conditions are anticipated across several key regions with high levels of confidence (in places reaching 80 %). Anomalous fire danger season is expected in Canada, US western states (also see National Interagency Fire Center, 2025), northeast Europe (notably the UK), and parts of Siberia (Fig. 16). In the equatorial zone, persistent dryness and hydroclimatic anomalies are expected to increase fire danger (confidence level of 60 % and higher) in Northeast Amazonia, the Congo Basin, and the Himalayan foothills (affecting areas of India and Nepal). In contrast, a relatively quiet fire season is projected for the Southern Hemisphere, with only Chile and southern Australia showing fire-prone conditions at a moderate level of confidence (> 50 %).
The BA anomaly forecast (bottom panel of Fig. 16) displays a distinct pattern from that of FWI, as it models the expected fire response conditioned on both coincident and antecedent climate variables, based on region-specific statistical relationships. For instance, elevated probabilities of above-median BA are projected in the western part of South America, Southern California, localised areas of Central America, and central North America. In central Asia, medium to high probabilities emerge, particularly in the eastern regions. In Africa, significant signals are observed over the central continent, while in Australia, elevated probabilities are mainly found in the northern regions. Over central Europe, despite a high FWI forecast, limited historical fire activity prevents reliable calibration of the climate–fire model, and therefore no BA forecast is issued for this region.
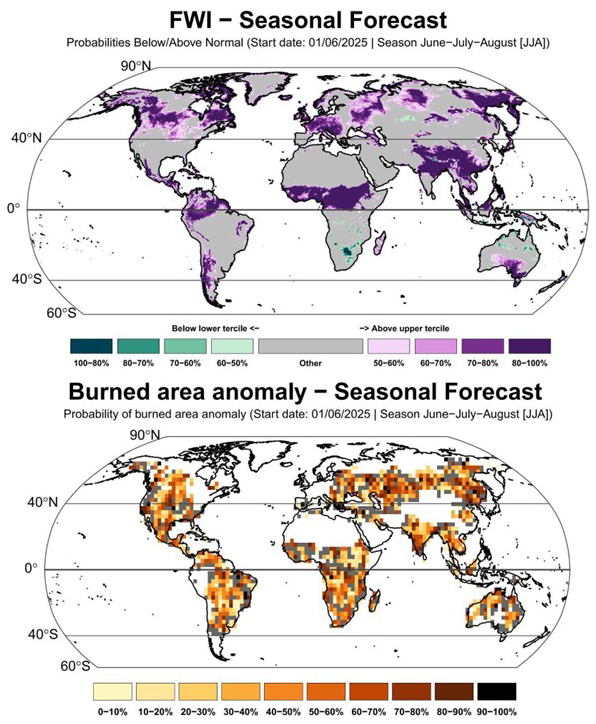
Figure 16Seasonal prediction of FWI and BA anomalies for the boreal summer of 2025 (June–July–August). Both forecasts are issued in June 2025 and are presented in probabilistic terms: FWI prediction shows the likelihood for increased (above the upper tercile) or decreased (below the lower tercile) fire-weather conditions, whereas BA prediction shows the probability of BA anomalies being above the climatological median. Grey areas are masked where insufficient BA statistics are available to perform the predicted mean.
6.2.2 Future changes in likelihood of extreme fire weather events
In three of the focal regions where climate change significantly increased the likelihood of a 2024–2025-level fire weather event (Sect. 5.2.1), even greater increases are projected under future warming levels of 1.5, 2, 3, and 4 °C (Fig. 17).
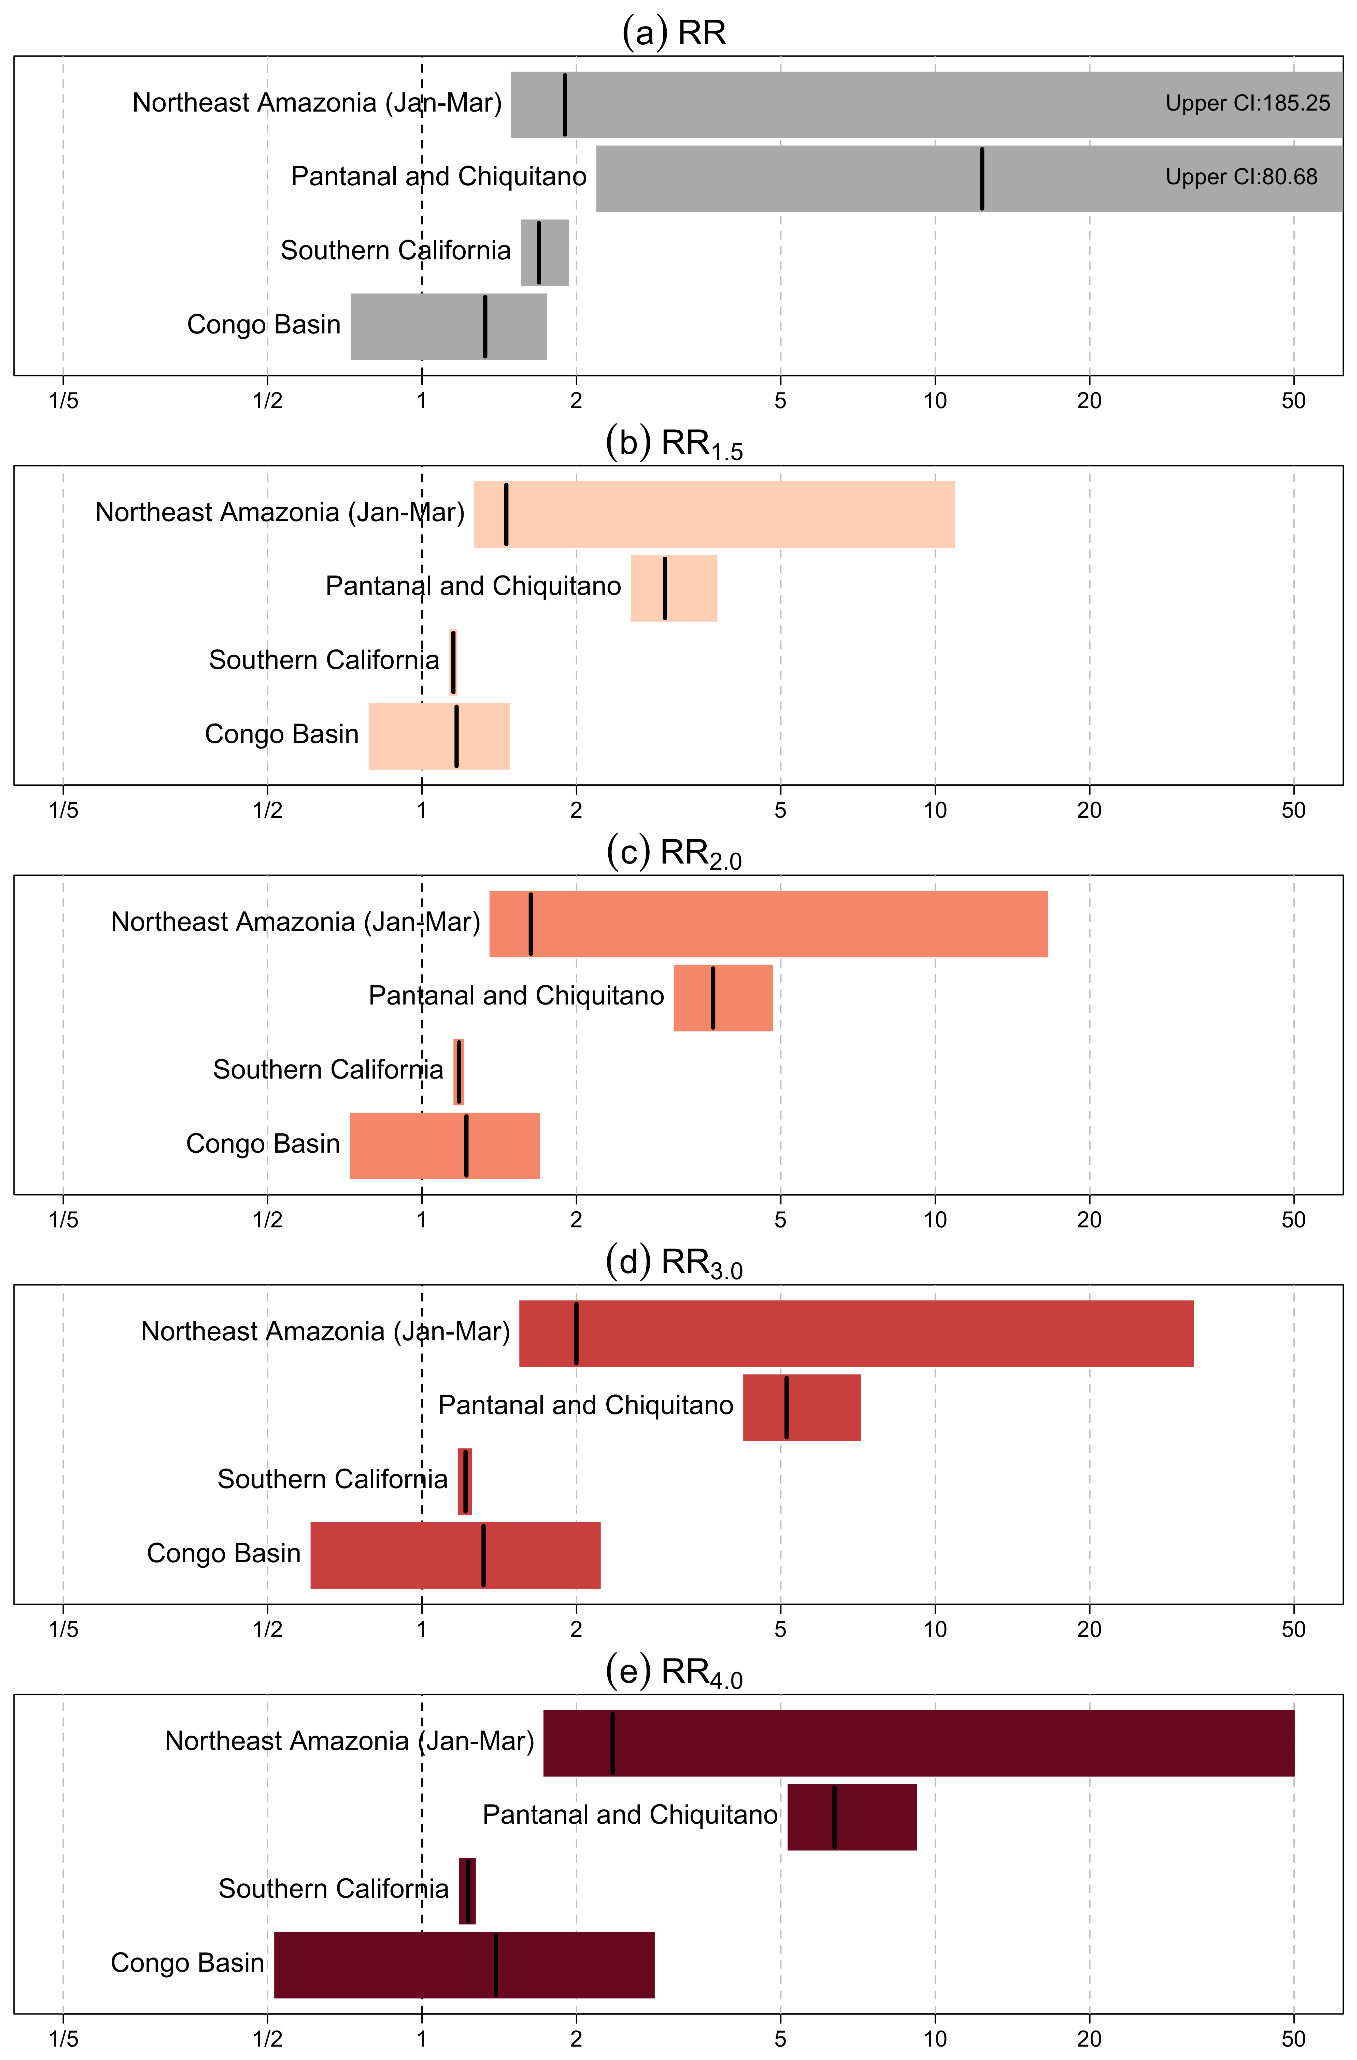
Figure 17Risk ratio (RR) estimates based on the comparison between (a) the past climate of 1850–1859 and the recent climate of 2016–2025, the recent climate of 2016–2025 and the period that global mean surface temperature (GMST) reached (b) 1.5 °C, (c) 2 °C, (d) 3 °C, and (e) 4 °C for the four extreme wildfire events between 2024 and early 2025 using CanESM5. Bars show 95 % confidence intervals (CIs), and central values are shown in bold.
Northeast Amazonia
In Northeast Amazonia the increased fire weather risk found in Sect. 5.2.1 during January–March is projected to continue rising under future warming, with increases in probability of 1.5 (95 % CI: 1.3–10.8), 1.6 (1.4–16.3), 2.0 (1.6–31.4), and 2.4 (1.7–49.5) at 1.5, 2, 3, and 4 °C of warming, respectively. Compared to southern Amazonia, fires in Northeast Amazonia have gathered less attention from the scientific community, and little is known about how future changes in fire weather conditions may impact this region.
Amazonia spans multiple countries, making coordinated fire governance particularly challenging. These countries often have differing political priorities and economic interests, which shape land-use policies, enforcement capacity, and investment in fire monitoring and response systems. Such disparities can hinder the implementation of integrated fire management strategies, especially in border regions where transboundary fires may occur but fall under fragmented jurisdictional and institutional frameworks. These institutional and policy asymmetries introduce further uncertainty about how fire risk will evolve in a warming climate. As fire weather intensifies, the region's unique fire season and cross-border governance dynamics should be explicitly considered in fire risk assessments and regional adaptation strategies.
Pantanal and Chiquitano
The Pantanal and Chiquitano region, which showed the largest historical increase with 4.75 (95 % CI. 4.2–5.5, Sect. 5.2.1), is set to continue to increase with global warming, with projected increases in probability of 3.0 (95 % CI: 2.6–3.6), 3.7 (3.2–4.6), 5.1 (4.4–6.5), and 6.4 (5.4–8.3) at 1.5, 2, 3, and 4 °C of warming, respectively (Fig. 17b–e). This is especially concerning for the Pantanal and Chiquitano, where fires are strongly driven by climate, particularly through extreme (Silva et al., 2022; Barbosa et al., 2022) and compound events (Ribeiro et al., 2022; Libonati et al., 2022). The ongoing reduction of wetlands in the Pantanal, often replaced by flammable grasslands (Damasceno-Junior et al., 2021), combined with the projected increase of fire weather conditions (Feron et al., 2024), may indicate a permanent shift in the landscape and its fire regime. This increases the vulnerability of fire-sensitive vegetation and wildlife habitats, while also threatening economic activities that rely on seasonal flooding.
Southern California
Southern California shows a similar pattern, with the likelihood of 2024–2025 extreme fire weather being about 1.7 times higher (95 % CI: 1.6–1.8) than in the past and projected increases in likelihood ranging from 1.1 to 1.3 with rising global temperatures.
Congo Basin
In contrast, the Congo Basin shows a more modest and statistically non-significant change, with the likelihood of a similar extreme fire weather event to events of the 2024–2025 season increasing by a factor of 1.3 from the past to the present. Future projections suggest a wide but uncertain range of change, between 0.5 and 2.7 depending on the warming level.
6.2.3 Future changes in likelihood of extreme fire events
Northeast Amazonia
By the 2040s, under SSP585, the likelihood of an event similar to those of the 2024–2025 season increases modestly but significantly to 0.12 %–0.14 %, a ∼ 17 % increase in frequency compared to the 2010s (Fig. 18; Table 6). Other scenarios show smaller or even negligible changes over this period. By the end of the century, however, all scenarios project notable increases in event frequency. SSP585 shows the largest rise, with the probability of such an event nearly doubling (up to 1.92 times more frequent). SSP370, reflecting current emissions trajectories, projects a 1.19–1.57 times increase. In contrast, SSP126 illustrates the mitigation potential of low-emission pathways, limiting increases to just 1.09 times (under 10 % increase) by 2100, significantly lower than under higher-emission scenarios. SSP370 only clearly diverges from SSP126 by late century (2090s), though the potential for larger increases appears earlier (Fig. 18). This divergence between the two scenarios is especially pronounced when focusing on areas with the highest BA (top 5 % of grid cells, Fig. S29). These regions of extreme burning could see a doubling in fire extent by mid-century and at least doubling (potentially tripling) by 2100 under SSP370, with substantial overlap with SSP585 projections (where extreme BA could almost quadruple).
By 2100, SSP126 still shows marginal increases in the likelihood of BA events such as those in 2024 (Fig. 18), though sub-regional extreme BA sees much less significant change (Table 6; Fig. S29), with frequency ranging from slight decreases (by a factor of 0.91) to modest increases (1.34).
These increases are mainly driven by projected declines in moisture availability (Figs. 18, S29). Although fuel availability is expected to decline somewhat, this only marginally offsets the rise in extreme BA likelihood across the region and has virtually no mitigating effect on the highest BA areas. No changes in fuel are statistically significant in our projections.
Most regions of Northeast Amazonia see increases in January–March (JFM) average BA by 2100 (Fig. S32). However, under SSP126, increases in the north, French Guiana, Suriname, and Guyana, are less certain and, if they occur, are smaller. This is reflected in a decreased frequency of extremes across these areas (Fig. S32). Under SSP370, climate change drives widespread increases in BA, with corresponding rises in extremes nearly everywhere except Roraima (Brazil). Most of Brazil and Venezuela are very likely to see increases in BA even under SSP126, with some moist regions showing rises in extremes under SSP126 and widespread increases under SSP370. Results for SSP585 are similar to those of SSP370, with widespread increases in BA and extremes throughout the region. Importantly, increases in extremes begin in some areas in the near future (Figs. S30–S31). By the 2030–2040s, Amapá (Brazil), northern Pará (Brazil), and southern Suriname are projected to experience more frequent extreme BA events and increased BA under the SSP585 scenario (Fig. S30). Increases in BA are less certain but still likely under SSP370, with mitigation under SSP126 helping to limit these trends.
Finally, we explored what this means for people's lived experience (Fig. 19). A person born 75.8 years ago (Brazil's current life expectancy) would have had a 33 %–36 % likelihood of witnessing a fire event like January–March 2024 during their lifetime. This suggests that, although anthropogenic changes have increased the likelihood of such fires (see Sect. 5), these events remain far from certain. Even the modest increases in frequency projected under SSP126 would raise that lifetime likelihood to 41 %–55 % for someone born today (i.e, 2025–2021). Under SSP370 (our current path), the chance rises substantially to 52 %–69 % and under SSP585 to 55 %–76 %. There is also a substantial rise in the probability of experiencing multiple such events within a lifetime; for example, under SSP370, there is a 17 %–32 % chance of seeing two such events, compared to just 6 %–8 % for those born in the 1940s.
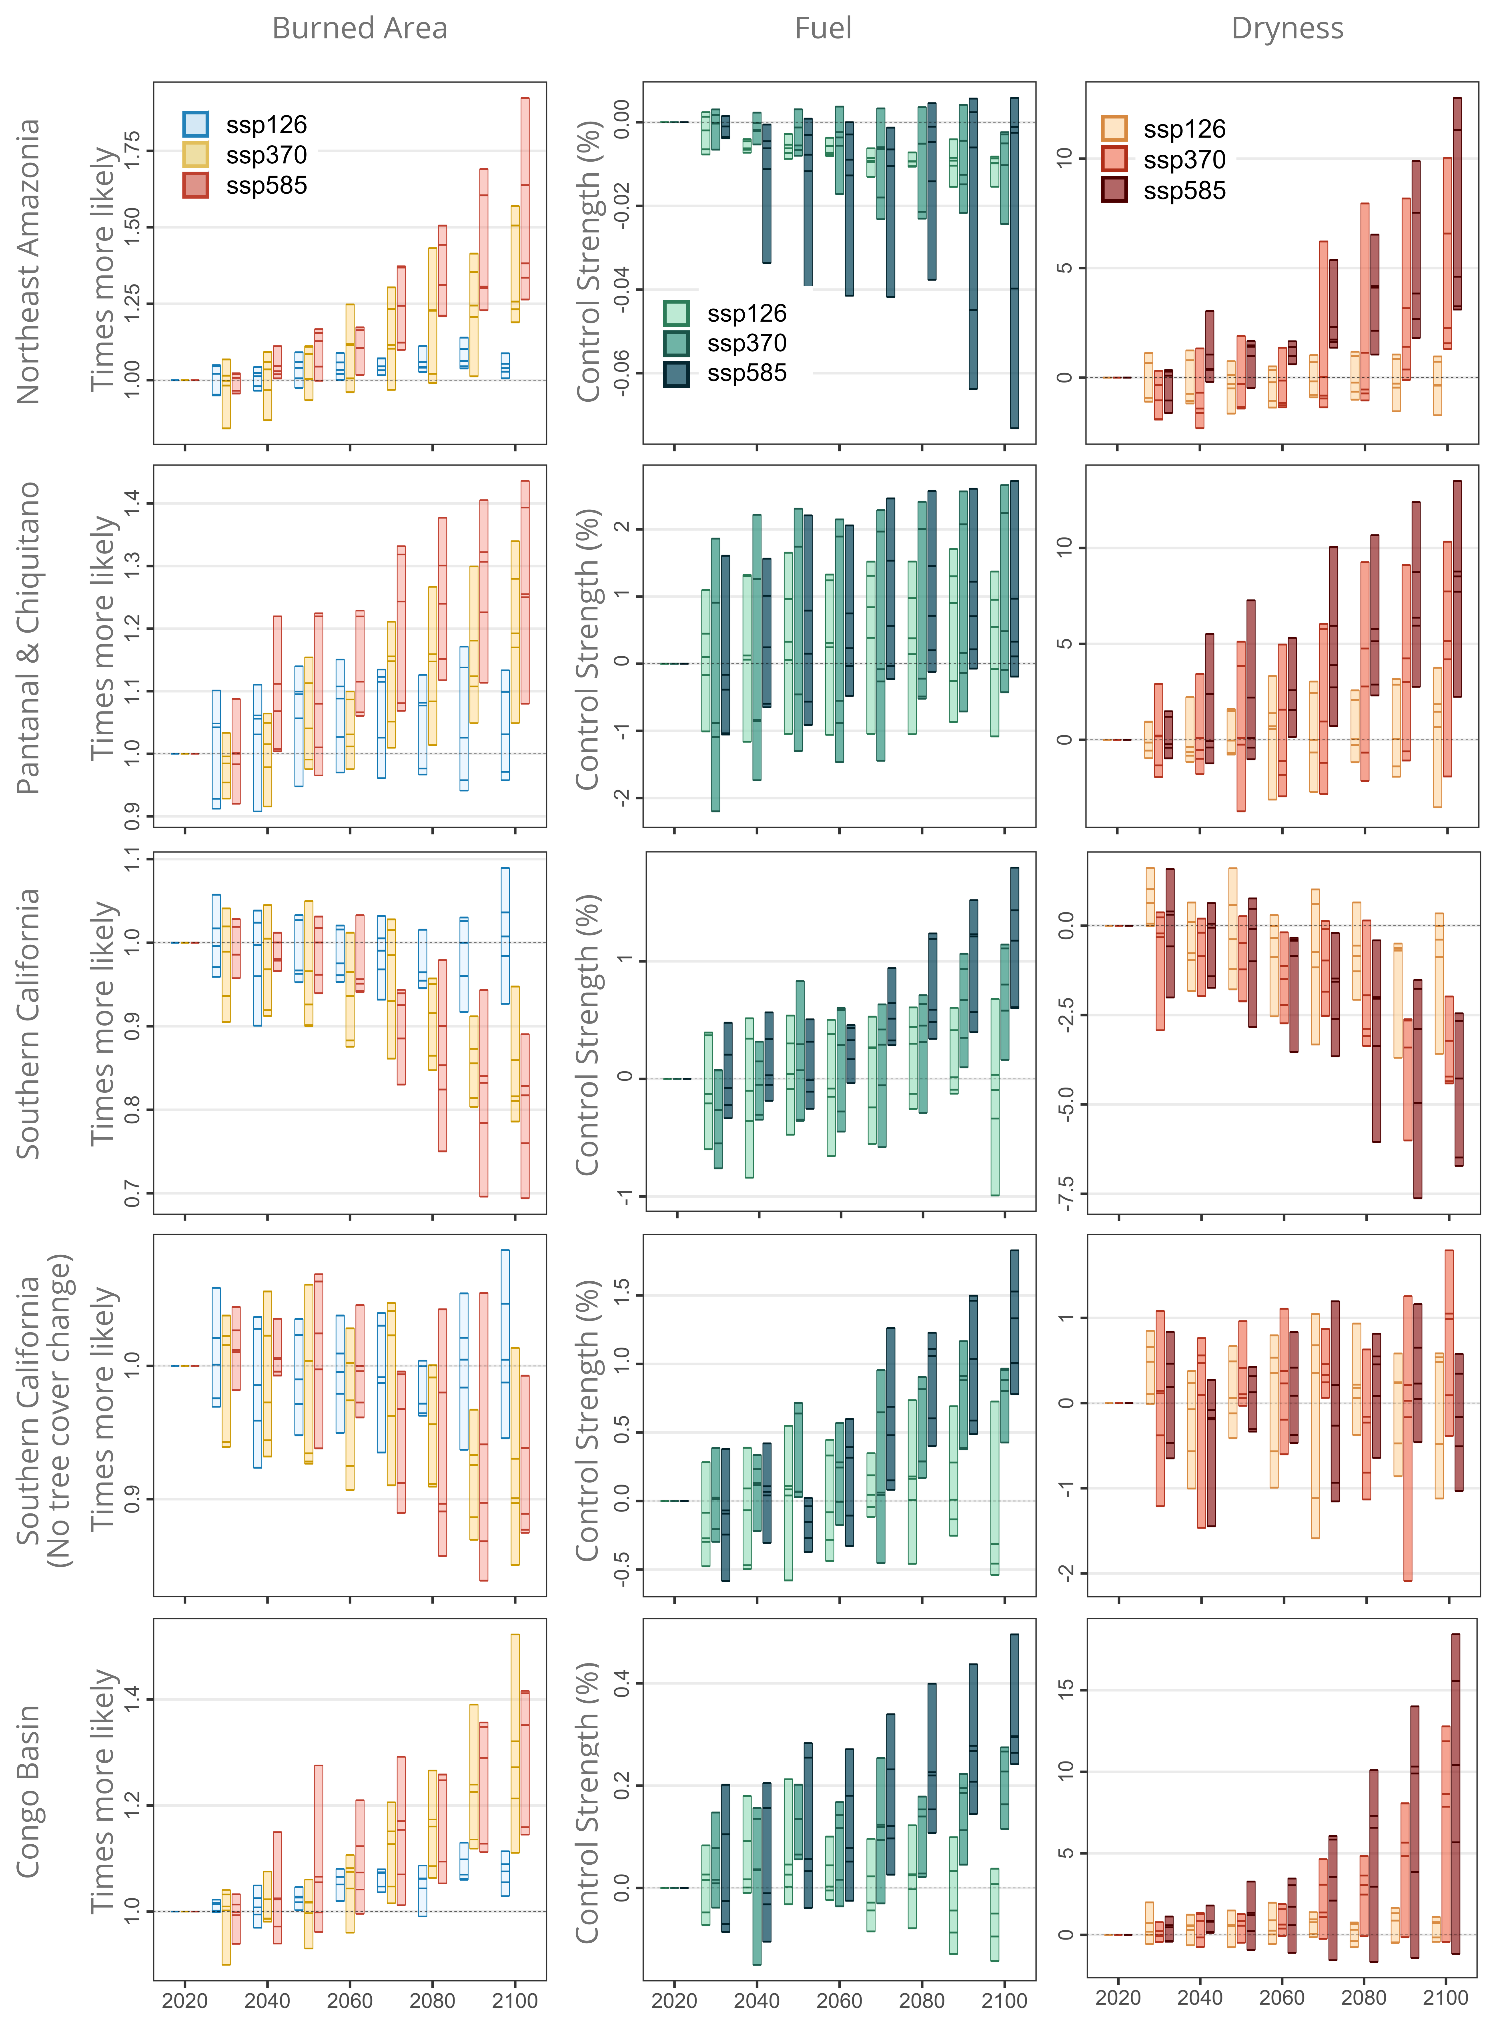
Figure 18Future projections from ConFLAME of the change in likelihood of BA extent of the magnitude seen in the 2024–2025 season, along with the contribution of fuel and moisture conditions in years in which BA exceeds the 2024–2025 thresholds. Each set of bars shows changes for each decade relative to the 2010–2020 baseline, with each bar representing a different SSP scenario and the spread of bars indicating the variation across GCMs, with individual bars representing different GCMs.
Table 6Summary of the likelihood of extreme events today using reanalysis “factual” and into the future using bias-corrected GCMs for our focal events identified in Sect. 4.4.3. Min and max report range across GCMs. We also determine how much more frequent the events will be at two different time horizons based on each model's likelihood in the future projections over likelihood during 2010–2020. Asterisks (*) indicate non-significant changes from 2010–2020 values. Colours show linear increase of likelihood (orange) and frequency (blue for less frequent, orange for more), where a darker shade indicates higher values. The top half of the table displays projections using BA over the entire region, while the bottom shows projections for sub-regional extremes (grid cells with the top 5 % BAs).
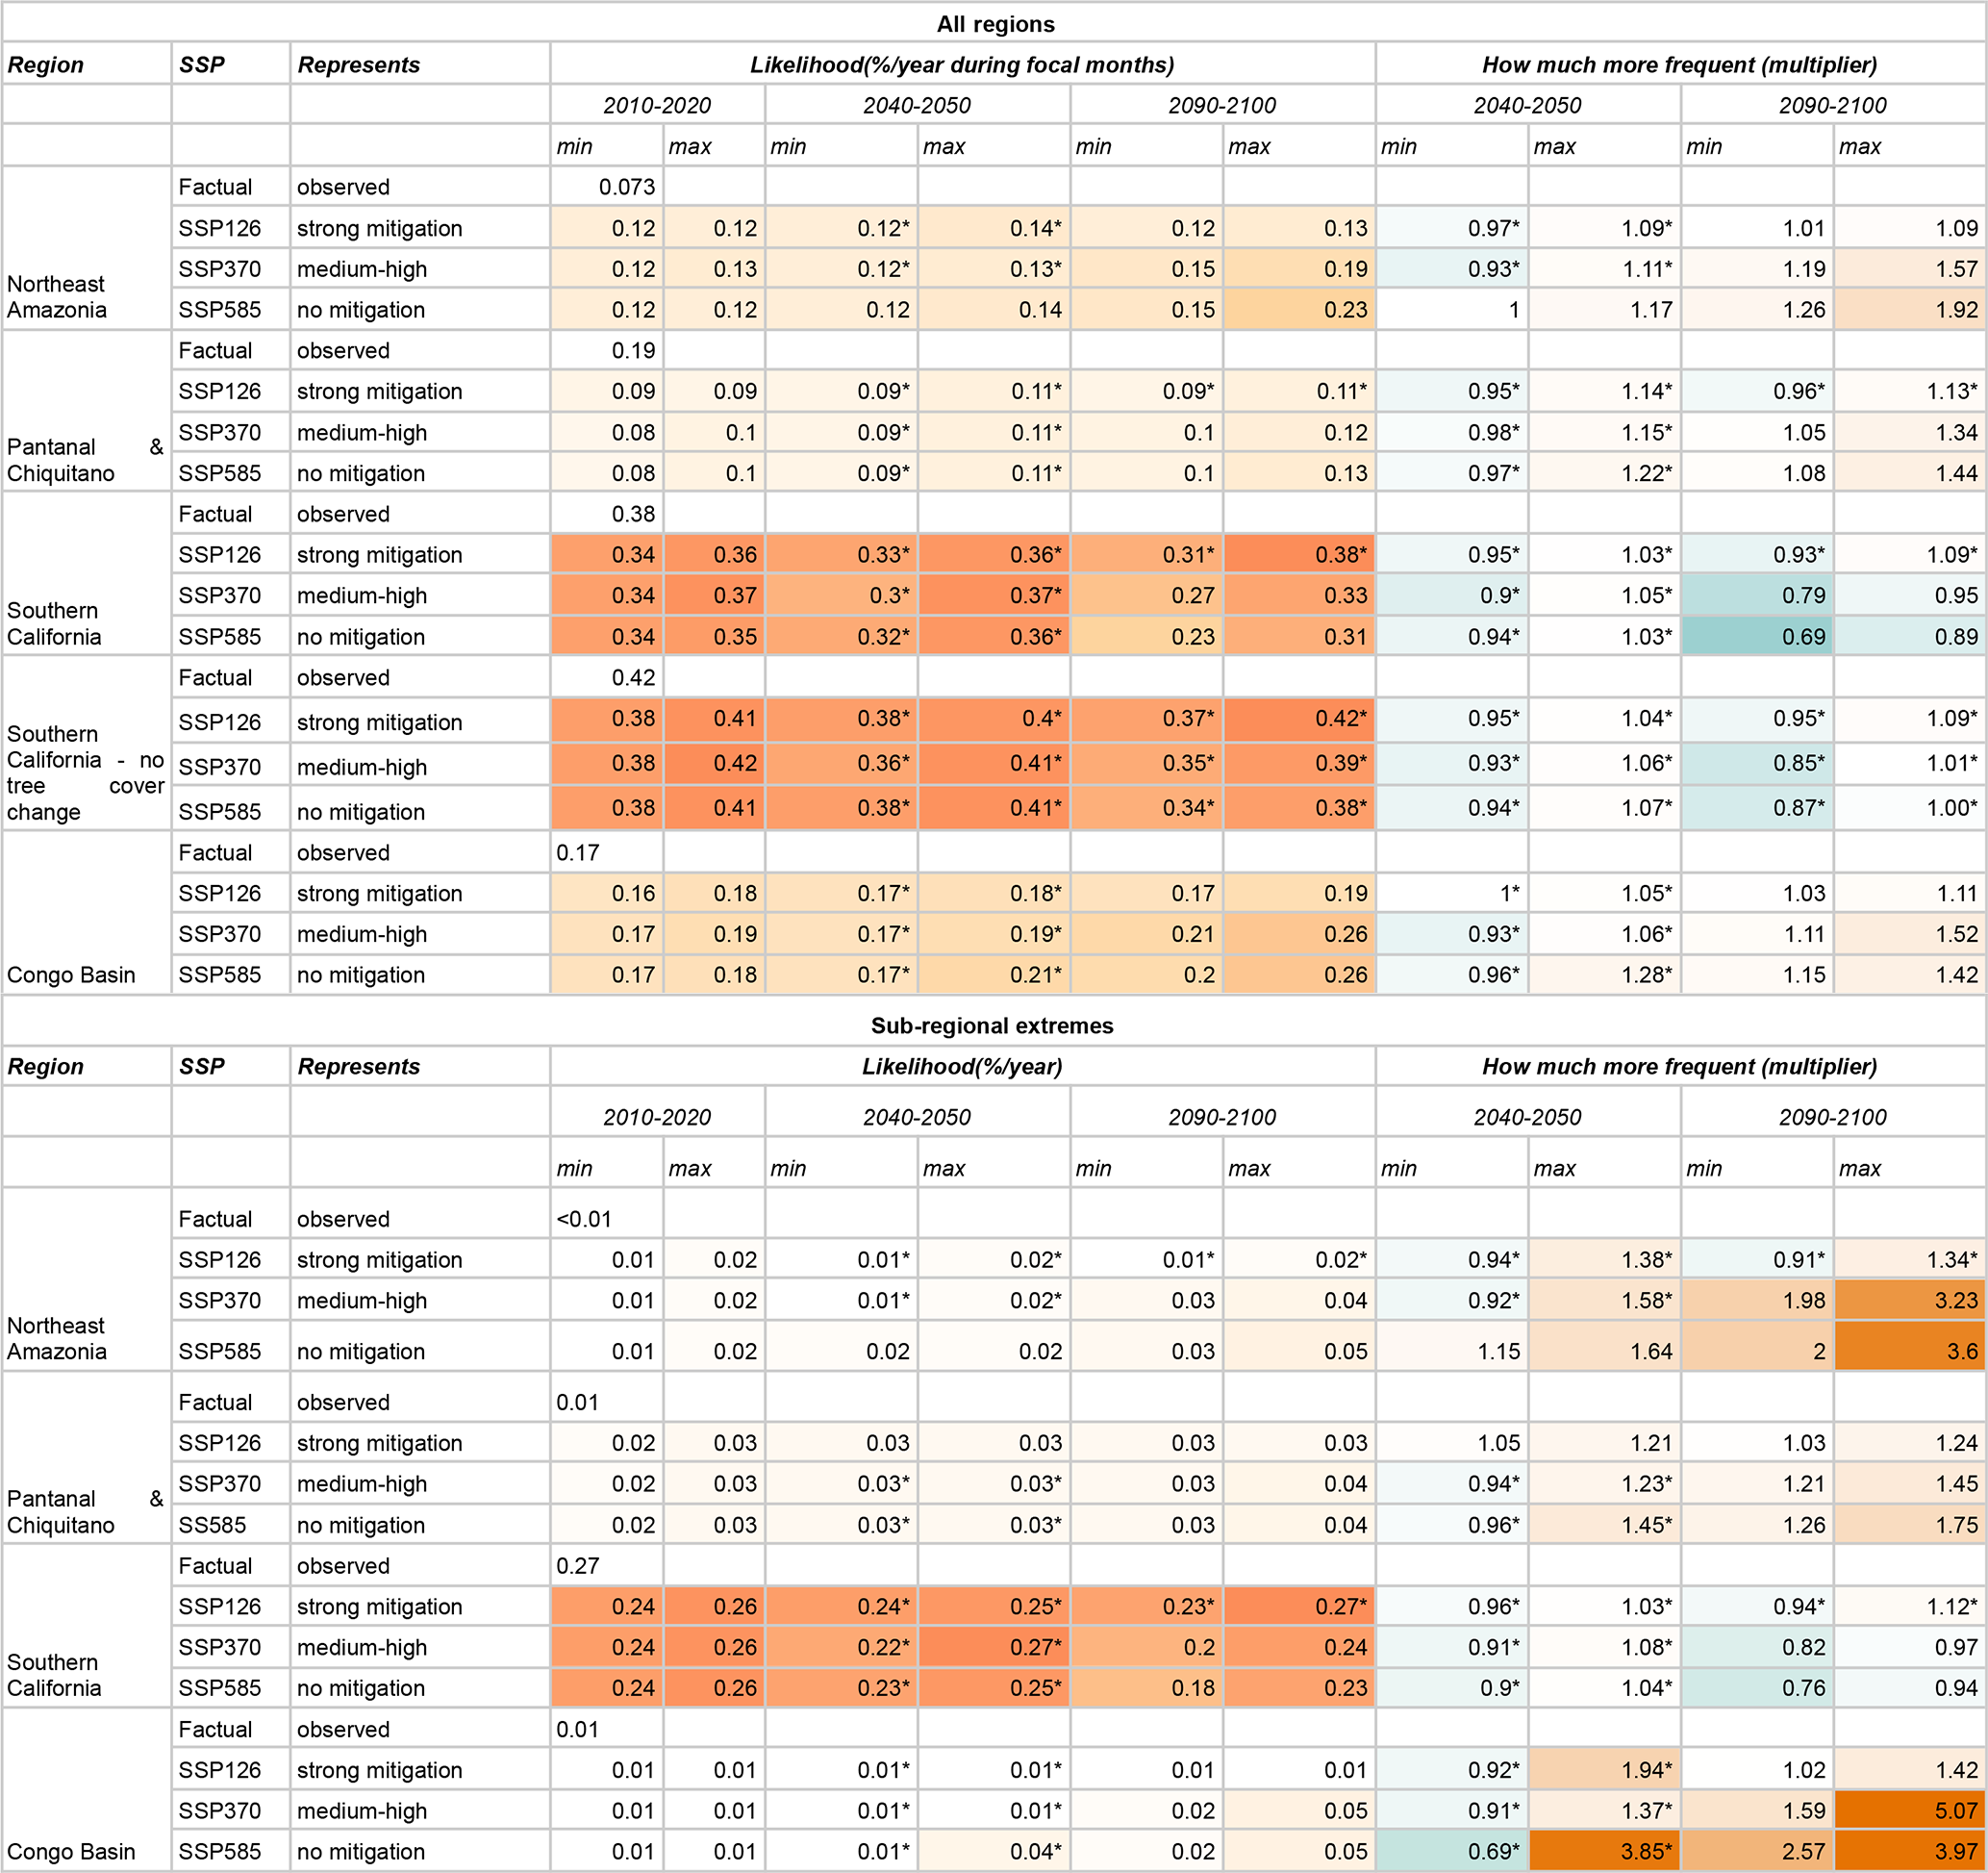
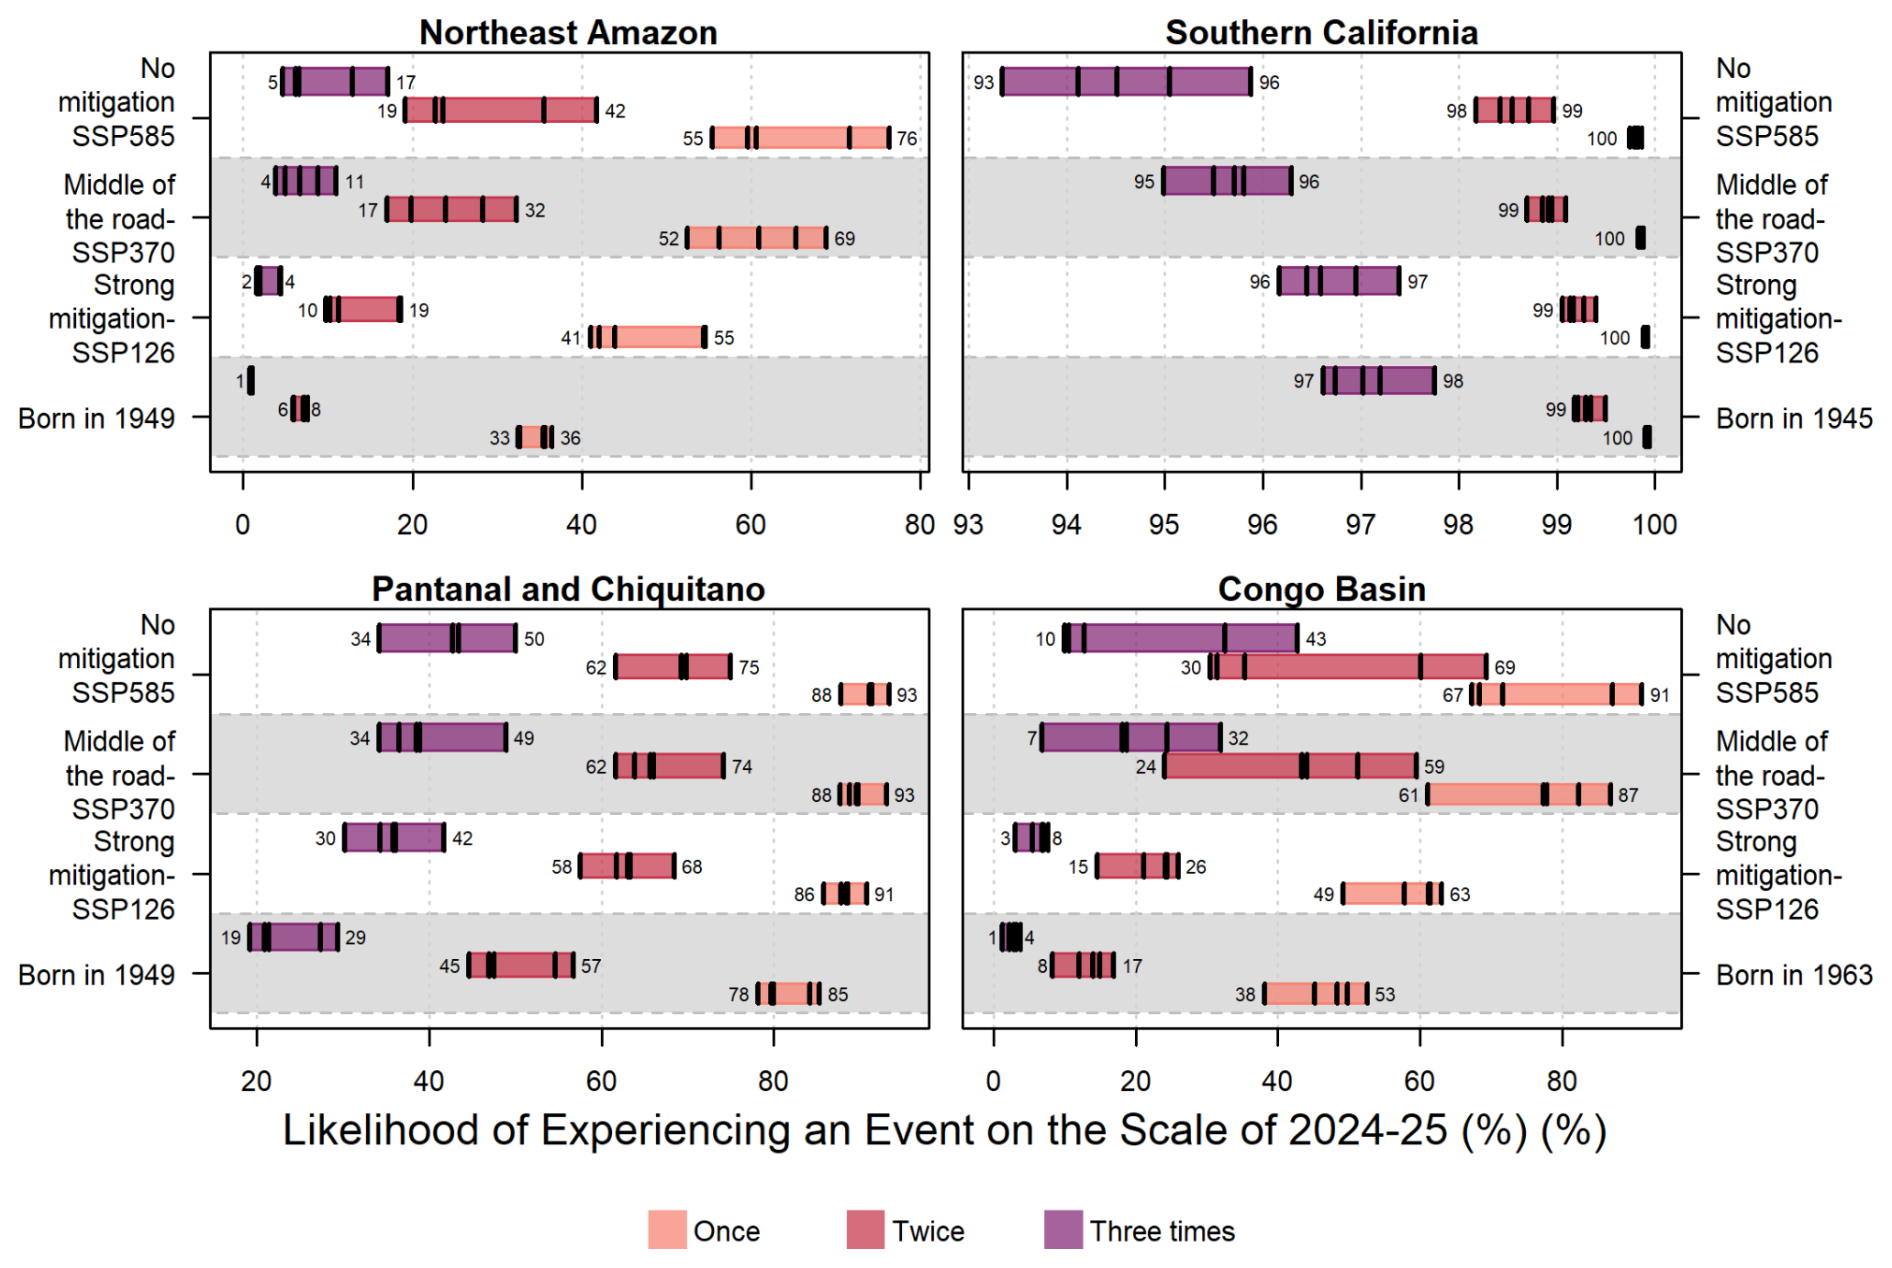
Figure 19Likelihood of experiencing extreme fire events similar to those of 2024–2025 during the average lifetime of a citizen, based on current life expectancy (2023): Brazil (75.8 years, Northeast Amazonia, the Pantanal–Chiquitano), United States (79.3 years, Southern California), and Democratic Republic of Congo (61.9 years, Congo Basin). Bars show the probability of experiencing at least one, two, or three such events if born today under different scenarios: historical climate (bottom bar in each group), SSP126, SSP370, and SSP585 (subsequent bars, bottom to top). Black vertical lines indicate individual GCM estimates; bar heights show the range across models.
Pantanal and Chiquitano
By mid-century (2050), no scenario shows significant increases in the frequency of BA levels such as 2024 at the regional scale (Table 6). All scenarios project modest increases by this point: about 1.14–1.15 times more frequent in SSP126 and SSP370, with slightly higher increases in SSP585 (up to 1.22 times). However, substantial changes emerge later in the century (Fig. 18). Under SSP370, the likelihood of these fires becomes significantly higher by the 2070s, with a 1.2-fold (20 %) increase relative to historical conditions. By 2100, SSP585 shows the greatest increases, up to 1.44 times more frequent, while SSP370 projects 1.34 times (Table 6). SSP126 demonstrates clear mitigation potential, limiting increases to about 1.13 times, with no significant change throughout the century.
For areas with the highest BA (top 5 % grid cells), future changes in the frequency of 2024-like events are significantly different from 2010–2020 for both mid-century (2050) and by 2100 (Table 6). Increases at the sub-regional level are larger than regional averages, though not as dramatic as in Northeast Amazonia: by the end of the century, events such as those from the 2024–2025 season are expected to increase 1.26 to 1.75 times under SSP585, while SSP126 keeps increases much smaller (1.03–1.24 times). SSP370 projections fall between these (1.21–1.45 times), demonstrating that mitigation could still meaningfully limit the occurrence of extreme fire. Increases in the likelihood of extreme BA in high burning cells could begin as early as the 2030s under SSP126, driven in part by potential increases in fuel availability, though this effect could level off or reverse by mid-century (Fig. S29). Under SSP370 and SSP585, increases in frequency of extreme BA start to take hold by the 2040s, though large changes may not emerge until after 2060.
These future extremes will mainly be driven by declining moisture availability over the entire region (Fig. 18). For the most extreme BA areas, this moisture signal is less certain, and changes in fuel, though uncertain, could be large enough to modulate moisture effects (Fig. S29).
Increases in BA will likely occur across the region by 2090 under all scenarios except in the wetland core of the Pantanal (Fig. S35), where responses are much more uncertain. Areas of increased extreme fire behaviour exist even under SSP126, but most of the region is projected to see reductions or little change in extremes. In contrast, SSP370 drives widespread increases in extreme BA across almost the entire region, except the wetlands. However, as Sect. 5 and other studies (e.g. Barbosa et al., 2022, 2025b) highlight, recent increases in extreme fire have been driven by the combined effects of climate change and wetland degradation, a factor not considered in the future projections. This means increases in wetland fire extremes could arise sooner, even by the 2030s or 2040s under SSP126. Under SSP585, widespread increases in extreme BA may arise as soon as 2030 (Fig. S33), and by 2040 even SSP126 shows large areas of the Pantanal and Chiquitano with much higher chances of a 1-in-100 event (Fig. S34). Under the SSP126 scenario, the lower chances of extreme events by 2100 compared to mid-century (2040–2050) reinforce how strong mitigation strategies may alter wildfire trajectory throughout the 21st century in this region.
Finally, in terms of lived experience, someone born in the 1940s would already have had a high chance (78 %–85 %) of witnessing a fire event like 2024 during their lifetime (Fig. 19), with Sect. 5 showing climate and human factors likely contributed substantially. Even under SSP126, this rises to 86 %–91 % for someone born today. The difference is most striking for multiple-event likelihoods. Historically, someone born in the 1940s would have had a 19 %–29 % chance of seeing three such events. Under SSP370, this rises sharply to 34 %–49 %, similar to SSP585 (34 %–50 %). Even under SSP126, the likelihood of seeing two such events exceeds 50 % (58 %–68 %), compared to 45 %–57 % historically.
Southern California
While January 2025 fire activity was likely influenced by anthropogenic climate change (Sect. 5.2.2), future projections suggest that similar-scale BA extremes may become less frequent (Table 6; Fig. 18). However, this depends strongly on how local vegetation responds to rising CO2 and climate change.
Looking ahead, models do not project a significant increase in the frequency of these regional-scale extremes (Fig. 18). In fact, under SSP370 – a scenario closely aligned with current emissions trajectories – the likelihood of 2025-like events in terms of January BA slightly declines by a factor of 0.79 to 0.95 by the 2090s versus 2010s. Similar trends are seen under SSP585, though with the potential for stronger decreases. SSP126, however, showed no robust change by the end of the century.
The projected decline in extreme fire activity in Southern California appears to be driven primarily by modelled increases in tree cover, which occurs even with GCMs with declining precipitation, suggesting that it is largely driven by CO2 fertilisation and enhanced water-use efficiency (Fig. S28). This effect is more pronounced in drier climates like Southern California, where rising CO2 concentrations reduce water stress on plants and promote vegetation growth. While this leads to greater fuel loads, our framework also represents tree cover influences on fuel moisture, which can suppress fire risk, tipping the balance toward fewer extreme fire events in many model simulations. CO2 concentrations are higher in SSP585 and SSP370 compared to SSP126, which explains why this effect is more pronounced in these scenarios. However, when tree cover is held constant at present-day levels, this signal weakens considerably. Under these “fixed tree” simulations, future projections of extreme fire activity become much more uncertain, with wide variation across scenarios all the way to the 2090s (Fig. 18). Climate projections themselves for the region are mixed. Some models show increases in January precipitation and fewer dry days, while others suggest drier conditions (Fig. S42). These divergent signals will further contribute to uncertainty in fuel moisture and fire behaviour over the coming decade.
Our projections, therefore, rely on modelled tree and shrub cover from a global land surface model, which, while bias-corrected using historical observation (Fig. S28), is primarily designed to capture broad-scale vegetation patterns. The model includes global plant functional types (PFTs) such as evergreen and deciduous shrubs, which encompass Mediterranean shrublands like those found in Southern California, but also represents structurally similar ecosystems in very different climatic and ecological settings (e.g. tropical savannahs, tundra scrub). As a result, while the model tends to perform reasonably well in estimating total woody cover, it may not fully capture the fine-scale ecological gradients or the dominant shrubland dynamics that drive fire activity in this region. In particular, it may miss key features of chaparral systems and their interannual variability. Future work using regionally calibrated vegetation models or integrating remote sensing estimates of fuel structure may help increase confidence in projections for fire-prone shrub-dominated systems like Southern California.
Therefore, while our models suggest a potential future decrease in large-scale fire extremes in Southern California, this outcome depends on how burned area responds to increasing tree cover and how vegetation itself responds to rising CO2 and changing climate. Both relationships remain uncertain and will require further investigation. Understanding the evolving links between fuel load, fuel moisture, and ignition risk in the region is essential to refining future fire risk projections in this region.
Congo Basin
By the 2050s, none of the emission scenarios project a significant increase in the frequency of regional-scale 2024-like fire events (Table 6). Both SSP126 and SSP370 project modest changes, ranging from slight decreases to increases of up to 1.28 times more frequent, though wide uncertainty means small decreases remain possible. Substantial increases emerge by 2100, especially under higher-emissions scenarios. Under SSP370, the likelihood of large fire events rises by 1.11–1.52 times, with SSP585 showing similar values. In contrast, SSP126 holds the increase to just 1.03–1.11 times, indicating a meaningful mitigation potential.
For the most extreme fire events (top 5 % of grid cells), projected increases in frequency are more substantial (Table 6). No scenario shows significant differences by 2050. However, significant and potentially large changes emerge by 2100. Under SSP370, the frequency of these high-BA extremes could rise by up to 5 times relative to historical conditions (range: 1.59–5.07), slightly higher than the 4-fold increase under SSP585 (2.57–3.97). SSP126 limits this increase substantially to just 1.02–1.42 times. These results show that even under a mitigation pathway, some increase in extreme BA is likely, but the scale of that increase is drastically reduced.
The primary driver of increased fire risk in the region is declining moisture availability, with drier conditions projected across much of the basin (Fig. 18). In the higher-emissions scenarios (SSP370 and SSP585), increased fuel availability may amplify this effect. For the most extreme fire-prone areas, however, fuel controls show little change, suggesting that moisture stress will be the dominant factor shaping future fire behaviour (Fig. S29).
Spatially, increases in BA are relatively uniform across the region, though some local differences emerge (Figs. S39–S41). The eastern DRC may experience small decreases in July average BA, though increases remain more likely. In contrast, Gabon, Equatorial Guinea, and central DRC (particularly south of the Congo River) are projected to see the largest increases, with BA doubling or even quadrupling in some areas. Some of these increases, particularly along the Gabonese and Equatoguinean coasts, may begin as early as the 2030s.
In terms of lived experience, someone born in the DRC in 1963, with a life expectancy of 61.9 years, would have had a 38 %–53 % chance of experiencing at least one event like that of July 2024 (Fig. 19). For those born today, this rises to 49 %–63 % under SSP126, 61 %–87 % under SSP370, and as high as 67 %–91 % under SSP585. The likelihood of experiencing multiple such events also increases markedly. Under SSP585, someone born today would have a 30 %–69 % chance of seeing two events and a 10 %–43 % chance of seeing three. In contrast, SSP126 limits this to 15 %–26 % for two events and just 3 %–8 % for three, highlighting the powerful influence of mitigation. Indeed, the chance of seeing just one event under SSP126 is comparable to seeing two under SSP585.
Section 2. BA data from NASA's MODIS BA product (MCD64A1) are extended from Giglio et al. (2018) and are available at Giglio et al. (2021, https://doi.org/10.5067/MODIS/MCD64A1.061). GFED4.1s fire C emissions data are extended from van der Werf and are available at https://globalfiredata.org/ (last access: 6 August 2025). GFAS fire C emissions data are extended from Kaiser et al. (2012) and are available at https://confluence.ecmwf.int/display/CKB/CAMS+global+biomass+burning+emissions+based+on+fire+radiative+power+%28GFAS%29%3A+data+documentation (last access: 6 August 2025). Global Fire Atlas data are extended from Andela et al. (2019b) and are available at Andela and Jones (2025, https://doi.org/10.5281/zenodo.11400061). Regional summaries of the MODIS BA, GFED4.1s, GFAS, and the Global Fire Atlas are presented here and are available at Jones et al. (2025, https://doi.org/10.5281/zenodo.15525674). Regional summaries of FWI anomalies are available from Turco et al. (2025, https://doi.org/10.5281/zenodo.15538595). Studies utilising our regional summaries should cite both the current article and the primary reference for the variable(s) of interest: Giglio et al. (2018) for the MODIS MCD64A1 BA product, Andela et al. (2019b) for the Global Fire Atlas, Giglio et al. (2016) for active fire observations of FRP from MOD14A1 and MYD14A1, Lizundia-Loiola et al. (2022) for the FireCCIS311 BA product, van der Werf et al. (2017) for GFED4.1s fire C emissions, Kaiser et al. (2012) for GFAS fire C emissions, and Vitolo et al. (2020) for FWI from the ECMWF ERA5 reanalysis. Section 3. Regional summaries of population and physical asset exposure are available from Steinmann et al. (2025, https://doi.org/10.5281/zenodo.15755007). Section 4 (and subsequent sections). The input meteorological data used for training the PoF model, listed in Table S1, are taken from the ERA5-Land dataset, openly available through the Copernicus Climate Change Service (C3S, 2019; https://doi.org/10.24381/cds.e2161bac). The fuel characteristic dataset, updated from McNorton and Di Giuseppe (2024), is available from the ECMWF (2025; https://doi.org/10.24381/378d1497). Model driving data and re-gridded BA target data for ConFLAME, for Sects. 4, 5, and 6, are available from Barbosa et al. (2025a; https://doi.org/10.5281/zenodo.15721434), with ConFLAME driver assessment data for Northeastern Amazonia and Pantanal and Chiquitano available from Barbosa et al. (2025c; https://doi.org/10.5281/zenodo.16786041) and Southern California and Congo Basin from Kelley et al. (2025a; https://doi.org/10.5281/zenodo.16789657). Data for the FWI seasonal forecast used in Sects. 4 and 6 are available from the Copernicus Emergency Management Service (CEMS, 2025; https://doi.org/10.24381/cds.b9c753f1). Section 5 (and subsequent sections). Historical (1960–2013) HadGEM3-A data are available from the Met Office (2025; http://catalogue.ceda.ac.uk/uuid/99b29b4bfeae470599fb96243e90cde3, last access: 6 August 2025). ConFLAME NRT attribution outputs are available from Kelley et al. (2025c; https://doi.org/10.5281/zenodo.15641876). FireMIP/ISIMIP driving and output data are available from the Inter-Sectoral Impact Model Intercomparison Project (ISIMIP; https://data.ISIMIP.org/, last access: 6 August 2025). Section 6 (and subsequent sections). ConFLAME future burned area projections are available from Kelley et al. (2025b; https://doi.org/10.5281/zenodo.15807587). Data and scripts used to produce Fire Weather Index (FWI) projections at different global warming levels are available from Liu and Eden (2025; https://doi.org/10.5281/zenodo.15790287.
Section 3. Code for regional summaries of population and physical asset exposure has been made available by Steinmann (2025; https://doi.org/10.5281/zenodo.15831766). Section 4 (and subsequent sections). The ConFLAME attribution and future projection framework (Kelley et al., 2021; Barbosa et al., 2025b) is available from Barbosa et al. (2025a; https://doi.org/10.5281/zenodo.16790787). The PoF model used in Sect. 4 is from ECMWF implementation. A simplified version with the main scripts for data processing, model training, and analysis is archived in a publicly accessible repository (https://doi.org/10.24433/CO.8570224.v1, Di Giuseppe, 2025) with documentation to facilitate replication of the results. Section 5 (and subsequent sections). The code used to produce the FWI attribution results is available from Kelley et al. (2024, https://doi.org/10.5281/zenodo.11460379). The FWI code used to generate the figures in Sect. 4 can be accessed via the ECMWF GitHub (https://github.com/ecmwf-projects/geff; last access: 6 August 2025, Di Giuseppe, 2025). Code used for the FireMIP attribution results, along with processed ISIMIP data, can be found at https://doi.org/10.5281/zenodo.16779167 (Lampe and Burton, 2025), with methods documented in Burton et al. (2024b). The current version of ibicus, used for JULES-ES bias correction, is available from PyPI (https://pypi.org/project/ibicus/, last access: 6 August 2025) and is described in detail in https://ibicus.readthedocs.io/en/latest/ (last access: 6 August 2025). Model code and evaluation for bias-correction of JULES-ES model output can be found at Spuler and Wessel (2025, https://doi.org/10.5281/zenodo.15792440).
9.1 Extreme wildfire events of 2024–2025
-
Global. A total of 3.7×10⁶ km2 burned globally during the 2024–2025 fire season, 9 % below the average of previous seasons (4.0×10⁶ km2), ranking 16th of all fire seasons since 2002. Despite the relatively low area burned, global fire carbon emissions were 2.2 Pg C, 9 % above average and the sixth highest on record, driven by intense and high-emission fires in South America and Canada. This pattern reinforces a trend towards growing fire impacts in carbon-rich forest ecosystems, even during years with below-average fire extent globally.
-
South America. South America experienced an unprecedented fire season, setting a new record for carbon emissions. Emissions reached 263 Tg C (84 % above average), with BA also 120 000 km2 (35 %) above average. Bolivia, Brazil, and Venezuela each saw high or record-breaking anomalies, with Bolivia setting national records for both BA and C emissions. Record fire activity occurred across multiple biomes including the Chiquitano dry forests, Pantanal wetlands, and southern and Northeast Amazonia. These fires were characterised by extremely large, fast-spreading, and intense events despite fire counts often being average or below average, highlighting a pattern of fewer but larger and more intense fires on the continent. Highlights include the following:
- –
Northeast Amazonia (focal event). Record-breaking fire activity affected the moist tropical forests north of the Amazon River and Rio Negro, including large portions of Venezuela, Guyana, Suriname, and northern Brazil. Several ecoregions experienced all-time highs in burned area or carbon emissions, with fire activity peaking March–April and again in late 2024. Air quality impacts and environmental degradation were reported across the region.
- –
Pantanal–Chiquitano (focal event). There was an extreme fire season across Bolivia and adjacent Brazil, with the Chiquitano dry forest and Pantanal wetlands (the world's largest wetlands) seeing some of the largest fires on record. Bolivia experienced the highest national carbon emissions total ever recorded (187 Tg C), with the Santa Cruz department (Bolivia) alone responsible for 157 Tg C. Fires destroyed critical habitat, caused severe air pollution, and threatened biodiversity hotspots. The Pantanal recorded PM2.5 concentrations of 903.2 µg m−3 in September 2024, 60 times the WHO daily standard.
- –
Amazonas State, Brazil. A record-breaking year for fire activity in this moist tropical forest region. Fire counts were up +154 % versus the long-term average, and BA and fire size reached record levels. The 95th percentile fire size anomaly was +60 %. This was one of the few regions in South America where high fire counts and severe individual fire behaviour co-occurred.
- –
Mato Grosso and Mato Grosso do Sul states, Brazil. Both states saw record-breaking fire intensity and rate of spread. In Mato Grosso, the 95th percentile fire size was 266 % above average, despite fire counts being 54 % below average. Mato Grosso do Sul experienced record emissions (+323 %) and fire growth rates, pointing to fast, intense fires likely driven by land-use change and drought.
- –
Pará State, Brazil. This state recorded its highest ever BA (36 000 km2) and major emissions anomalies (+61 %). Fire activity expanded deep into forested areas, likely linked to land clearing. It was among the most significant sub-national contributors to Brazil's fire totals in 2024–2025.
- –
São Paulo State, Brazil. Unusually high-intensity fires occurred despite a relatively small area burned. 95th percentile fire size and intensity both set new records. Carbon emissions were nearly double the historical average (+190 %), driven by a combination of unseasonal drought and land-use pressures.
- –
Bolívar and Delta Amacuro, Venezuela. Two states in northeast Venezuela experienced record emissions and BA, with Bolívar seeing a +133 % BA anomaly and Delta Amacuro impacted by early-season fire peaks. These fires affected swamp forests and grassland regions.
- –
Coastal and Andean Ecuador, Peru, and Colombia. Subnational analysis reveals record or high-ranking anomalies in eight provinces of Ecuador, seven regions of Peru, and multiple Colombian ecoregions. These include areas in southwestern Amazonia and the eastern Andean slopes, where record fire sizes and intensities occurred despite average fire counts.
- –
Guyana and Suriname. Six ecoregions in Guyana and two districts in Suriname experienced record fire counts and BA, contributing to the focal Northeast Amazonia event but deserving standalone mention given the extent and duration of the anomalies.
- –
-
North America. The 2024–2025 fire season was the second most severe on record for North America, with total C emissions of 194 Tg C (112 % above average) and BA of 31 000 km2 (35 % above average). Canada again saw extreme fire activity for the second year running, with 282 Tg C emitted and over 46 000 km2 burned, second only to the record-breaking 2023–2024 season. In the United States, the catastrophic Palisades and Eaton fires in California in January 2025, which killed at least 31 people, destroyed over 11 750 homes, and caused over USD 140 billion in damages. Highlights include the following:
- –
Southern California, United States (focal event). The most disastrous wildfire event in modern US history occurred in Los Angeles County in January 2025 during a severe Santa Ana wind event. The Palisades and Eaton fires severely damaged or destroyed over 11 750 homes, killed at least 31 people, displaced over 150 000, and caused economic losses exceeding USD 140 billion (including insured losses of USD 20–75 billion). Fires also severely degraded air quality, disrupted water supplies, worsened the housing crisis, and led to mass evacuations.
- –
Western Canada. Northwest Territories, British Columbia, Alberta, and Saskatchewan experienced their second-highest emissions year on record, with a combined emissions anomaly of +191 Tg C and provincial anomalies in the range of +184 %–441 %
- –
Mexico. According to national statistics, Mexico experienced its worst wildfire season on record, with over 8000 wildfires and more than 16 500 km2 burned. Particularly severe activity occurred in March–May, reportedly driven by drought and elevated temperatures. This record is not captured in our analyses based on global satellite products, warranting further investigation of the differences.
- –
Alberta, Canada. Extreme wildfires in summer 2024 destroyed 358 structures and led to USD 1.23 billion in damages, second only to the Fort McMurray fire of 2016. The town of Jasper was evacuated. Two firefighter fatalities occurred.
- –
New York, United States. In an unusual late-season outbreak, every borough experienced multiple wildfires during a 2-week span in October–November 2024, an unprecedented fire signal in a densely populated urban environment.
- –
-
Africa. For the second consecutive year, fire extent in Africa was well below average, with BA in the African savannah biome 12 % below average, the third lowest on record. However, several regions experienced notable fire anomalies, particularly the Congo Basin, northern Angola, and South Africa. Record-setting BA and C emissions were recorded in some regions of the Republic of Congo and the Democratic Republic of Congo. Despite the extent of these events, many went under-reported in the media, reinforcing the importance of Earth-observation-based monitoring. Highlights include the following:
- –
Congo Basin (focal event). There was record fire activity and C emissions in the Republic of Congo and Democratic Republic of the Congo. Fires contributed to the region's highest primary forest loss since 2015 and caused hazardous air pollution, with DRC reporting PM2.5 levels 11 times the WHO standards. Fires in western ecoregions such as the Atlantic Equatorial and Central Congolian lowland forests were particularly intense.
- –
South Africa. Fires killed 34 people, including 6 firefighters, and destroyed thousands of livestock and homes. KwaZulu-Natal Province was particularly affected. High fuel loads from previous wet years reportedly contributed to the intensity.
- –
Côte d'Ivoire. Fires in Séguéla (Worodougou region) burned 500 km2, destroyed homes and plantations, and killed 23 people. Other fatal incidents occurred in Bouna, Bongouanou, and Taabo.
- –
-
Asia. Overall, Asia experienced a below-average fire season, with BA 26 % below average and C emissions 28 % below average. However, significant regional extremes were observed. Highlights include the following:
- –
Nepal. Nepal endured its second-worst fire season since 2002, with over 1000 wildfires. Wildfires killed more than 100 people, with significant destruction of forests and homes. In the Lumbini Province, wildfires devastated 114 km2 of forests and destroyed more than 230 houses and livestock shelters.
- –
Northern India. Uttar Pradesh experienced its most severe wildfire season on record, reportedly driven by crop burning, heatwaves, and dry fuel accumulation. Regional fires contributed to severe haze episodes in New Delhi in November 2024, with PM2.5 concentrations exceeding 200 µg m−3 across large parts of northern India (13 times the WHO daily standard).
- –
Iran. It was the worst fire season since 2002. Fires burned key national parks and forest areas. Carbon emissions, fire counts, and BA all reached record highs, reportedly driven by a combination of climate stress and human pressures.
- –
South Korea and Japan. Japan's largest wildfire in over 50 years took place in Iwate Prefecture in February 2025, destroying 221 buildings. South Korea's deadliest wildfires occurred in March 2025 (just outside of the 2024–2025 fire season), killing 31 and damaging 4000 homes.
- –
Sichuan and Guizhou, China. A fire in Sichuan lasted 14 d, displacing 3000 people and impacting multiple villages. Strong winds and dry spring conditions reportedly drove unusually large wildfires.
- –
Heilongjiang and Jilin, China. Record BA occurred in both provinces. Though not widely reported, these events underscore rising fire activity in northeast Asia, which has been linked to agricultural burning and shifting policy enforcement.
- –
Republic of Sakha and Zabaikalsky krai, Russia. Fires in these regions accounted for 65 % of total forest area burned across Russia and forced 58 redeployments of firefighting resources, involving 1861 firefighters.
- –
-
Europe. Europe recorded its fourth-lowest BA since 2002, with 30 000 km2 burned (49 % below average) and C emissions 22 % below average. However, there were stark regional contrasts. Highlights include the following:
- –
Portugal. It was the most destructive fire season since 2017. Over 1370 km2 burned, with 16 fatalities and EUR 180 million in damages. Fires in September affected wildland–urban interface areas in the northwest. A 50 km2 fire in Madeira entered the laurel forest, a rare cloud forest and UNESCO World Heritage site. This incident highlighted the vulnerability of non-fire-adapted ecosystems under increasing fire pressure.
- –
Serbia, North Macedonia, and Bulgaria. It was the worst wildfire seasons in 2 decades. Large-scale fires led to EUCPM activations and widespread evacuations, including four fires > 1000 km2 (> 10 000 ha) in North Macedonia alone.
- –
Ukraine. Nearly 10 000 km2 burned during 2024–2025, mostly in conflict-affected eastern areas. Fires were likely exacerbated by warfare, with higher-than-usual forest losses reported.
- –
Romanian Danube Delta. An unusually dry winter led to 450 km2 of wetlands burning in February 2025. Though a recurring phenomenon, this was one of the most extensive burn events yet and emblematic of changing fire regimes in sensitive wetland ecosystems.
- –
Türkiye (Mardin Province). A rapidly spreading fire in June 2024 burned farmland and villages, killing 15 people and injuring at least 70. It was one of the deadliest fire events in the eastern Mediterranean this season.
- –
Austria and Germany. While central Europe had a quiet fire year overall, Austria recorded its highest number of fires and largest BA since 2012, and Germany had a slightly above-average season, consistent with a slow but steady upward trend.
- –
-
Oceania. Oceania experienced a moderate fire season overall, but numerous high-impact events were recorded. Highlights include the following:
- –
Western Australia. Over 1000 large fires burned ∼ 470 000 ha amid record heat and severe dryness between Perth and Carnarvon. The Skeleton Rocks fire (44 000 ha) impacted long fire-interval ecosystems and a lithium mine, while the largest fire near Cervantes burned 80 000 ha and disrupted regional honey production. Manjimup fires affected over 42 000 ha of native forest and required interstate response.
- –
Central Australia. Over 5.7×10⁶ ha burned by October 2024, including a 450 000 ha fire near Devil's Marbles that forced closures of major infrastructure. In January, 80 000 ha burned in the West MacDonnell Ranges, including national parks and Aboriginal land trusts.
- –
Victoria and Tasmania. Severe dry lightning outbreaks triggered major fires in culturally sensitive landscapes. Victoria's Grampians National Park saw two-thirds of its area burned, and the Little Desert fire burned 90 000 ha in under 8 h. Tasmania's northwest fires burned 100 000 ha, affecting the Tarkine and Cradle Mountain.
- –
Queensland. Firefighters responded to 40 incidents at Mount Isa, with one fire burning over 100 000 ha for nearly 2 months. Smoke exposure caused hospital admissions, and endangered species such as the Carpentarian grasswren were threatened.
- –
Aotearoa / New Zealand. Peat fires at Whangamarino Wetland and Tiwai Peninsula each burned ∼ 1000 ha, likely generating significant CO2 emissions after similar events in 2022 emitted 0.6×10⁶ t CO2.
- –
9.2 Focal regions
In this year's report, our detailed analyses target three tropical regions and Southern California. The extreme nature of events in these focal regions is given in Sect. 2.
-
Northeast Amazonia saw record forest fire activity, with burned area +332 % above average, the highest since records began. Fires severely impacted Indigenous communities, displacing thousands and degrading air and water access.
-
The Pantanal–Chiquitano experienced its worst fire season on record, with burned areas nearly triple the average and carbon emissions 6 times above average. Fires affected both the Pantanal wetlands, the world's largest tropical wetland, and the Chiquitano dry forests of Bolivia. PM2.5 pollution reached hazardous levels of 900 µg m−3, carrying strong potential for detrimental health and economic impacts.
-
Southern California recorded catastrophic wildfire losses, with 31 deaths, 11 750 homes destroyed, and USD 140 billion in total damages. PM2.5 levels peaked at 483 µg m−3, triggering a regional housing and insurance crisis.
-
The Congo Basin had its highest recorded fire activity at 28 % above the annual mean, contributing to a +150 % increase in primary forest loss in 2024 versus 2023. Fires were the main driver of deforestation but received minimal media or institutional attention, highlighting a broader lack of media coverage of fires affecting equatorial Africa.
9.3 Impact assessments
In this year's report, we incorporate new assessments of the impact of fires on society, specifically via the exposure of populations, physical assets, and carbon projects to fire and via smoke degrading air quality. Key findings from our analyses were as follows.
Population exposure
-
We estimate that ∼ 100 million people were exposed to wildfire activity globally during the 2024–2025 fire season, with the highest exposures in India and the Democratic Republic of the Congo (15 million each).
- –
Uttar Pradesh (India) recorded the highest sub-national exposure at 4.6 million people, a 146 % increase over average, followed by Heilongjiang (China, 3.7 million) and Punjab (India, 3.6 million).
- –
Despite severe fire seasons, Canada, Brazil, and Bolivia contributed modestly to global population exposure due to the remoteness of areas burned.
- –
Other countries experiencing large relative anomalies in population exposure included Jordan; Peru and Ecuador (Andes); Venezuela, Guyana, and Suriname (northern South America); Nepal; and Niger.
- –
-
20 000 people were officially displaced according to IDMC displacement records, or 0.02 % of those exposed according to our analysis. This reflects a gap between exposure and formal displacement, though true disruption is likely higher than in the IDMC records due to known issues with underreporting.
-
Exposed communities may still suffer serious health, economic, and psychological consequences (e.g. missed income, increased debt, long-term health declines), even if they are not formally displaced.
Physical asset exposure
-
According to our analysis, an estimated USD 215 billion in physical assets was exposed to wildfires in 2024–2025. Top countries by asset exposure were India (USD 44 billion), United States (USD 26 billion), China (USD 17 billion), and South Africa (USD 14 billion).
- –
Other countries with high absolute asset exposure were Mexico, Türkiye, and Russia (∼ USD 8 billion each).
- –
Other countries experiencing large relative anomalies in physical asset exposure were Pakistan, Sudan, Chad, Albania, Greece, Iraq, Syria, and Eritrea.
- –
-
USD 57 billion in direct losses was recorded in the international disaster database EM-DAT, including USD 53 billion caused by fires affecting LA and Southern California.
- –
Direct financial losses are generally smaller than our estimates of physical asset exposure (the detection of fire in proximity to the built environment) because exposure is a measure of potential for loss and not of loss itself.
- –
In the case of Southern California, recorded direct financial losses from fires were 3 times larger than our estimates of exposed physical assets due to the underestimation of asset density in our analysis. A lesson from this work is that analyses of exposure must account for the significant variation in the density of real estate value across states of the United States and likely in other countries as well.
- –
Carbon project exposure
-
The 2024 fire season saw record BA across forestry projects in the Voluntary Carbon Market (VCM): 169 of 927 projects (18 %) experienced fire, the highest on record since 2001, with burned area in 2024 affecting 1.6 % of project areas on average.
-
72 % of projects experienced above-average drought contributing to elevated risk of fire, with 13 % exceeding extreme drought thresholds (SPEI < −2).
-
The 2024 fire season had an above-average impact on carbon projects in Latin and northern America. Average BA was recorded in Eurasia and below average in Africa. In addition to climate, land-use and land-cover changes and project activities also contributed to regional differences in observed extremes.
-
Despite elevated BA in the latest fire season, 46 % of all carbon projects experienced no fire in the entire period since 2001, while 67 % experienced little fire (defined as < 0.5 % burned annually in the surrounding 50 km buffer).
-
The 2024 season underscores that while high-integrity forest carbon projects remain a key climate-change mitigation tool, the permanence of carbon stored or avoided is increasingly threatened by extreme fire years, especially under worsening climate extremes.
Air quality
-
Our analysis of air quality impact in this report focuses exclusively on the Pantanal–Chiquitano focal region, where population-weighted PM2.5 exceeded the WHO daily standard (15 µg m−3) on 43 d between July and October (over a third of all days in the period) and peaked at a regional population-weighted average of 61 µg m−3 in September, with fires accounting for ∼ 58 % of the pollution. Smoke emissions from fires were the sole cause of exceedances of the WHO daily standard on 50 d in the period July–October.
-
Wildfire smoke emissions exposed communities to extremely harmful air quality in various world regions, according to direct measurements (Appendix A). For example, communities in the Brazilian Pantanal, Southern California, Bolivia, and northern India were exposed to PM2.5 concentrations of over 60, 30, 30, and 13 times the WHO daily standard of 15 µg m−3, respectively.
9.4 Diagnosing causes and assessing predictability
-
Weather was the dominant driver of fire activity during all of the 2024–2025 focal events targeted in this report, contributing 40 % to 70 % of the explainable cause.
- –
Fuel availability and dryness increased in importance during the most severe fires (up to 40 % of explainability) and determined the final extent of BA.
-
Ignitions were consistently dominated by human influence, but they did not emerge as a primary cause of fire activity during the 2024–2025 focal events (only around 10 % of explainability).
- –
-
In Northeast Amazonia fire activity was predominantly driven by persistent, large-scale drought conditions that depleted deep soil moisture reserves. These droughts suppressed fuel moisture recovery for extended periods, even during rain periods. Soil moisture anomalies reached up to 3 standard deviations below the climatological mean, with values dropping to as little as 2 % of average. The prolonged drought significantly increased fuel dryness, and, during the period of most intense burning, fuel importance rose up to 20 % above its annual baseline. Fuel also determined the final burned area extent, contributing significantly to the observed anomalies in BA, accounting for up to 50 % in the sub-regions where BA anomalies were most extreme. Human-caused ignitions were present but did not emerge as a leading cause of fire (10 %–20 %). Their contribution remained limited and at times negative compared to what is considered usual (thus reducing the total extent), likely reflecting limited ignition opportunities or active suppression efforts to limit BA.
-
In the Pantanal–Chiquitano, extreme fire activity was primarily driven by antecedent drought persisting since 2023. Deep soil moisture remained in the driest 15 % of records, 1–2 standard deviations below average, despite wetter conditions in early 2024. Although February–April rains moistened surface fuels, they failed to recharge deeper layers. Weather dominated fire activity (71 % average contribution), with fuel importance rising to 40 % during the peak burning week in early August and explaining over 50 % of final BA anomalies. Lightning played a minimal ignition role, often occurring in association with convective downpour. Human-caused ignitions, though still dominant, were lower than in previous years and at times limited burned area extent.
-
In the Congo Basin, extreme fire activity was driven by prolonged and severe drought persisting over recent years. The usual spring wet season (March–May) failed to occur, and the second wet season later in the year provided limited relief, leaving deep soil moisture up to 2 standard deviations below climatological norms. Weather was the dominant driver of fire activity, with rainfall 67 % below and temperatures 90 % above climatological averages, placing vegetation and soil dryness among the driest 1 %–2 % of records (2003–2023). Human activity accounted for most fire ignitions, but as for the other two tropical regions, they were not the main causes of the fire severity and actually acted to reduce the final BA.
-
In Southern California, the 2024–2025 fire season was marked by atypical seasonality, with extreme fire activity occurring in January, well outside the usual summer peak. The Palisades and Eaton fires were driven by a rare convergence of weather, fuel, and ignition factors, each contributing significantly (weather: 40 %, fuel: 30 %, ignition: 20 %). Despite preceding years of exceptional wetness, a short-lived but extreme drying of surface fuels (3 standard deviations below normal) and intense winds (3 standard deviations above normal) created highly flammable conditions. These fires ignited and spread rapidly at the wildland–urban interface, highlighting how brief windows of extreme weather can override generally moist background conditions and trigger major off-season events in these parts of the world.
-
There were distinct challenges to the forecasting of all focal events:
- –
In Northeast Amazonia, our models correctly identified two high-risk fire seasons, but most of the burning occurred during the first (February–April), not the second (August–November), despite similar fire danger forecasts. This disconnect highlights a key limitation: high fire danger does not always lead to high fire activity. Human factors, such as suppression, fire bans, or shifts in land use, likely played a role and are currently underrepresented in fire prediction systems.
- –
In the Pantanal and Chiquitano, fires were closely linked to long-term drought conditions that dried out fuels months before the fire season peaked. Fire activity rose only after this slow build-up, meaning accurate forecasts required capturing both drought and fuel dynamics. While the general heightening of fire danger was picked up by the FWI, the machine-learning-based PoF model, which includes fuel conditions, better predicted when and where fires would actually occur.
- –
In Southern California, fire prediction remains difficult without accounting for the “whiplash effect” that arises from extreme fire weather following on from wet periods with high vegetation productivity. A wet period led to vegetation growth, followed by rapid drying and strong winds that enabled the January fires. As in the Pantanal–Chiquitano, including fuel information helped the PoF model identify higher-risk areas more accurately than the FWI.
- –
In the Congo Basin, both FWI and PoF tended to overpredict fire danger. While drought increased flammability, ignition remained limited, possibly due to cultural practices, suppression efforts, or fewer ignition sources (though reporting on such activities in this region is extremely limited). Here, human activity and fuel moisture, more than fire weather, shaped outcomes. The FWI system, which unlike PoF does not include these factors, was less effective in predicting fire activity in the Congo Basin.
- –
9.5 Attribution to global change
-
Climate change has increased the likelihood of extreme fire events across all focal regions studied. The high fire weather and extreme levels of burning seen in 2024–2025 were significantly more likely in a world with human-induced climate change.
-
In Northeast Amazonia, we found that the extreme fire weather during January–March 2024 was 30–70 times more likely due to anthropogenic climate forcing, while the risk of regional BA totals being as observed in the period was 2.1 times greater due to anthropogenic climate forcing, and the area burned by fires was 4 times greater.
- –
Our attribution analysis shows high confidence that climate change played a major role in Northeast Amazonia's record fire season. We are virtually certain (> 99 %) that anthropogenic climate forcing increased the risk of extreme fire weather and find it is very likely (96 %) that it amplified the area affected and likely (89 %) that it increased the chance of the extreme burned area observed.
- –
While climate change has clearly enhanced the probability of extreme events in the region, such as that seen in 2024, there was conversely no robust evidence that climate change increased average annual BA totals in Northeast Amazonia during 2003–2019.
- –
An increase in annual average BA during 2003–2019 of up to 17 % was attributed to changes in land-use changes since 1900–1917, indicating that long-term human activities have elevated typical fire levels in the region.
- –
Overall, our attribution analyses suggest that climate change has enhanced the likelihood of extreme fire events in the region, against a backdrop of increased annual BA levels driven by socioeconomic change such as land-use/land-cover change and human ignitions.
- –
-
In the Pantanal and Chiquitano, we find that the extreme fire weather in August–September 2024 was 4–5 times more likely due to anthropogenic climate forcing, while the risk of regional BA totals being as observed in the period was 3.3 times greater due to anthropogenic climate forcing, and the area burned by fires was around 34 times greater.
- –
Our attribution of extreme fire weather to climate change was virtually certain (> 99 %, IPCC definition), while the amplification of both extreme burned area and region-wide burned area extent was attributed with likely confidence (87 %). Taken together, these findings provide strong evidence that anthropogenic climate change raised the odds of the largest fire season on record in the Pantanal–Chiquitano region.
- –
In addition to the enhanced odds of extreme BA events, a 10 % increase in annual average BA during 2003–2019 was attributed to climate change.
- –
At least a 2-fold increase in BA during years with 2024-like fire conditions was attributed to socioeconomic variables, indicating that human activities may have substantially increased the risk of widespread fire under extreme conditions. However, other analyses focusing on long-term annual average burned area suggest that some human-driven changes could have reduced typical annual fire activity. While these findings are not strictly contradictory since they examine different aspects of the fire regime, the contrast between them reduces confidence in attributing overall fire trends to socioeconomic drivers alone and points to the need for further investigation. Improved confidence in socioeconomic attribution for the Pantanal–Chiquitano will require higher-resolution data on human activity, seasonal and temporal variation in land-use and fire practices, and explicit representation of water management and wetland dynamics, in combination with validation against observed extreme events
- –
Overall, extreme BA events in the Pantanal–Chiquitano, such as those seen in August–September 2024, are made more likely by climate change and are superimposed on broader background increases in fire extent related to climate change and possibly socioeconomic changes in the region.
- –
-
In Southern California, we find that the risk of regional BA totals being as observed during January 2025 was 2.3 times greater due to anthropogenic climate change, and the area burned by fires was 25 times greater.
- –
Our attributions of amplified BA extent during the event to climate change were all made with at least 89 % confidence. It is therefore likely (per IPCC definitions) that anthropogenic climate change raised the odds of the costly wildfires in Southern California during January 2025.
- –
The meteorological conditions during the event were previously studied by the World Weather Attribution (WWA) group, who reported that extreme fire weather conditions were also made more likely, by around 40 %, with other indicators such as prolonged drought and delayed seasonal drying also showing climate influence (Barnes et al., 2025). We did not perform an independent attribution of fire weather here due to a lack of data required for construction of a counterfactual scenario in our attribution protocol.
- –
In addition to the enhanced odds of extreme BA events, a 7 % increase in annual average BA during 2003–2019 was attributed to climate change.
- –
Our BA attribution approaches did not provide robust evidence that socioeconomic change affected average annual BA, though this is possibly due to the difference between the coarse model resolution and the fine scale over which effects would be expected at the wildland–urban interface in this region.
- –
Overall, extreme BA events in Southern California, such as those seen in January 2025, are made more likely by climate change and are superimposed on broader background increases in fire extent related to climate change.
- –
-
In the Congo Basin, we find that the extreme fire weather in July–August 2024 was 3–8 times more likely due to anthropogenic climate change, while the risk of regional BA totals being as observed in the period was 60 % greater due to anthropogenic climate change, and the area burned by fires was 3 times greater.
- –
It is virtually certain that anthropogenic climate change contributed to the extreme fire weather observed during the 2024 season in the Congo Basin. The widespread extent of burned area was very likely influenced by climate change (92 % likelihood), while the most extreme sub-regional burned area events were likely influenced (78 % likelihood). Together, these findings indicate that climate change increased the odds of the largest fire season on record in the region.
- –
In addition to the enhanced odds of extreme BA events, a more than 45 % increase in annual average BA during 2003–2019 was attributed to climate change.
- –
Our BA attribution approaches did not provide robust evidence that socioeconomic change affected average annual BA during 2003–2019 versus a pre-industrial counterfactual. Our BA attribution approaches did not provide robust evidence that socioeconomic change affected average annual BA during 2003–2019 versus a pre-industrial counterfactual.
- –
Overall, extreme burned area events in the Congo Basin, such as those seen in July–August 2024, are made more likely by climate change and are superimposed on broader background increases in fire extent attributable to climate change, with no robust evidence that socioeconomic changes significantly altered recent fire activity.
- –
9.6 Seasonal and multi-decadal outlook
-
Fire weather and BA forecasts for boreal summer 2025 highlight several areas with elevated probability of anomalous fire danger. Probabilities for anomalous fire prone seasons are high across Canada, northeast Europe (including the UK), and parts of Siberia. These conditions followed the second-warmest May on record globally (1.4 °C above pre-industrial levels), with exceptional dryness and the lowest northwestern European rainfall since 1871.
- –
In equatorial regions, forecasts show a more than 60 % chance of anomalous fire weather conditions in Northeast Amazonia, the Congo Basin, and the Himalayan foothills.
- –
In the United States, severe drought conditions in Arizona and Texas are already leading to elevated fire activity in line with predicted anomalies in fire weather.
- –
Seasonal outlooks of burned area anomalies coincide with fire weather anomalies in western South America, Southern California, central North America, and eastern central Asia.
- –
Chile and northern Australia stand out with > 50 % confidence for anomalous fire activity during the boreal summer of 2025.
- –
Despite high FWI in central Europe, we could not confidently predict a BA anomaly due to insufficient historical fire–climate data for reliable modelling.
- –
-
In Northeast Amazonia, our climate model projections consistently indicate a rise in extreme wildfire risk by the end of the century. Under a medium–high emissions pathway (SSP370), the frequency of regional BA totals on the scale of 2024 is projected to increase by up to 57 % by 2100.
- –
Also under SSP370, the greatest rate of increase (factor of 2–3 rise) is projected in the sub-regions that burned most extensively in the extreme event of 2024 (5 % of model cells with greatest BA).
- –
Under a no mitigation scenario (SSP585), an even sharper rise is projected, with a near-doubling of the frequency of extreme (2024-like) events at the regional scale. Greater rates of increase (up to a 4-fold rise) are projected in the sub-regions that burned most extensively in 2024.
- –
In contrast, limiting warming under a strong mitigation scenario (SSP126) effectively contains future fire risk. By 2100, the increased frequency of an extreme (2024-like) event is limited to 9 %, with the sub-regions that burned most extensively in 2024 showing no significant change. This demonstrates the strong potential of climate action to mitigate the risk of future extreme fires in Northeast Amazonia.
- –
Projections of future increased risks are not spatially uniform in any scenario. In some areas, such as Amapá and northern Pará in Brazil and southern Suriname, increased extreme fire activity is projected as early as the 2030s under higher-emissions scenarios (SSP370 and SSP585). Even under SSP126, rises in extreme BA are projected for parts of the moist forest zone.
- –
The frequency of extreme (2024-like) events is projected to rise only modestly in all scenarios through 2050; however by 2100 the increased risk under higher-emissions scenarios (SSP370 and SSP585) clearly emerges from that of SSP126.
- –
-
In the Pantanal and Chiquitano, our climate model projections indicate further increases in extreme wildfire risk by the end of the century. Under a medium–high emissions pathway (SSP370), the frequency of regional BA totals on the scale of 2024 is projected to increase by up to 34 % by 2100.
- –
Also under SSP370, the greatest rate of increase (21 %–45 % rise) is projected in the sub-regions that burned most extensively in the extreme event of 2024 (5 % of model cells with greatest BA).
- –
Under a no mitigation scenario (SSP585), an even sharper rise is projected, with a 44 % rise in the frequency of extreme (2024-like) events at the regional scale. Greater rates of increase (up to a 75 % rise) are projected in the sub-regions that burned most extensively in 2024.
- –
In contrast, limiting warming under a strong mitigation scenario (SSP126) effectively contains future fire risk. By 2100, the increased frequency of an extreme (2024-like) event is limited to 13 % and is not significant, while the sub-regions that burned most extensively in 2024 experience minimal increases in frequency (up to 24 % rise). This demonstrates the strong potential of climate action to mitigate the risk of future extreme fires in the Pantanal–Chiquitano.
- –
At the regional scale, only modest increases in the frequency of extreme (2024-like) fire seasons are projected by mid-century across all scenarios. However, by 2100, the increased risk becomes more pronounced under higher-emissions pathways, with clear divergence between scenarios.
- –
At the sub-regional level in the areas that burned most extensively, earlier increases in extreme fire risk could begin as soon as 2030.
- –
Projections of future increased risks are not spatially uniform in any scenario. Geographically, widespread increases in BA are projected across most of the Pantanal–Chiquitano by 2100, though the response is considerably more uncertain in the Pantanal than in the Chiquitano. Some areas of increased extreme (2024-like) fire frequency may still emerge in the Pantanal even under SSP126.
- –
It is important to note that these projections do not fully incorporate local in situ drivers, such as wetland degradation, which have already contributed to more frequent fires in recent years. Increases in fire activity might be expected to occur earlier than the models indicate, especially along the wetlands and adjacent drainage areas.
- –
-
In Southern California, our climate model projections of future change in extreme (2024-like) fire events are highly uncertain.
- –
While high-emissions simulations under SSP585 and SSP370 suggest that extreme fire events could become less frequent over time, this strongly depends on how vegetation responds to rising CO2 and a changing climate.
- –
In particular, simulations suggest that increased tree cover driven by CO2 fertilisation under higher-emissions scenarios (SSP585 and SSP370) may raise fuel loads while simultaneously increasing fuel moisture, with the overall effect being to reduce the likelihood of extreme fire events in our models.
- –
However, when removing changes in tree cover, the projected future frequencies of extreme (2024-like) events become highly uncertain with no consistent direction of change under future scenarios.
- –
There is a critical need for improved observation and modelling of how vegetation structure, fuel moisture, and local ecological processes shape fire behaviour in Southern California. Nonetheless, Southern California remains highly exposed to fire risk. Even under scenarios that suggest a decline in fire extremes, most residents alive today are still likely to experience multiple extreme fire seasons like 2025 in their lifetime. Stronger local adaptation and more regionally tailored research on climate–vegetation–fire interactions will be essential to manage risk in the coming decades.
- –
-
In the Congo Basin, our climate model projections indicate that further increases in extreme wildfire risk are likely by the end of the century. Under a medium–high emissions pathway (SSP370), the frequency of regional BA totals on the scale of 2024 is projected to increase by up to 50 % by 2100.
- –
Also under SSP370, far greater rates of increase (up to a 5-fold rise) are projected in the sub-regions that burned most extensively in the extreme event of 2024 (5 % of model cells with greatest BA).
- –
Projections under SSP370 and SSP585 show similar levels of elevated risk, indicating that mitigation efforts stronger than those implied by SSP370 are likely needed to meaningfully reduce future fire risk.
- –
In contrast, limiting warming under a strong mitigation scenario (SSP126) effectively contains future fire risk. By 2100, the increased frequency of an extreme (2024-like) event is limited to at most 11 %, while the sub-regions that burned most extensively in 2024 experience a far smaller increase in frequency (up to 42 % rise) than under higher-emissions scenarios. This demonstrates the strong potential of climate action to mitigate the risk of future extreme fires in the Congo Basin.
- –
Projections of future increased risks are not spatially uniform in any scenario. Some of the largest projected increases, seen in Gabon, Equatorial Guinea, and central DRC, may begin as early as the 2030s, with the frequency of extreme (2024-like) events projected to increase 2- to 4-fold by 2100. This increase is driven largely by declining fuel moisture as climate change reduces rainfall and increases dry spells across much of the region.
- –
-
Anthropogenic climate change has the potential to significantly increase future fire risk for living generations, turning previously exceptional events into events that are experienced several times in a generation.
- –
Northeast Amazonia. Our projections indicate that a person born in this region during the 1940s had a ∼ 33 %–36 % likelihood of experiencing at least one extreme fire episode on the scale of January–March 2024. For someone born today, this likelihood rises to 41 %–55 % under strong mitigation scenario (SSP126). This likelihood rises to 52 %–69 % under a medium–high scenario (SSP370 – closest tested to our current emissions pathway) and 55 %–76 % under a no mitigation scenario (SSP585). The odds of experiencing two or more such events are considerably higher under no mitigation (19 %–42 %) than under strong mitigation (10 %–19 %).
- –
Pantanal–Chiquitano. Our projections indicate that a person born in this region during the 1940s already had a ∼ 78 %–85 % likelihood of experiencing at least one extreme fire episode on the scale of August–September 2024. For someone born today, this likelihood rises to 86 %–91 %, even under SSP126. Under SSP370, the likelihood of experiencing at least two 2024-scale fire seasons rises to 62 %–74 %, compared to 45 %–57 % for someone born in the 1940s, but even under low emissions, the chance of two such events exceeds 58 %. These findings highlight that while climate-change mitigation can reduce future fire risk, it is not sufficient on its own. Early adaptation, ecosystem management, and stronger fire governance will be essential to reduce future impacts.
- –
Congo Basin. Our projections indicate that a person born in this region during the 1940s had a ∼ 38 %–53 % likelihood of experiencing at least one extreme fire episode on the scale of July 2024. For someone born today, this likelihood rises to 49 %–63 % under SSP126. This likelihood rises to 61 %–87 % under SSP370 and 67 %–91 % under SSP585. The likelihood of experiencing multiple events differs starkly across SSPs, with up to a likelihood of 43 % for three events under SSP585, compared to just 3 %–8 % under SSP126.
- –
9.7 Progress in the State of Wildfires report
This report incorporates a number of major advances in our annual reporting on the State of Wildfires in the prior fire season. In Sect. 2, we added a new analysis of fire intensity to our extreme event identification variables, and we evaluated the dependence of our extreme event identification on the source of BA observation by incorporating data for 2019–2025 from two additional BA datasets (FireCCIS311 and VIIRS VNP64A1), supplementing our consistent multi-decade analysis based on the MODIS BA dataset (MCD64A1). The contribution of regional expert knowledge was also formally recognised through the establishment of regional expert panels for each continent, with these panels consulted for their interpretation of results across all aspects of the report. We added Sect. 3, which presents an entirely new set of impact assessments relating to population exposure, asset exposure, carbon project exposure, and air quality degradation. In Sect. 4, we expanded the analysis of the predictability of the focal event to include seasonal predictions of burned area, complementing the fire danger seasonal forecasts already provided. In Sect. 5, our main advancement was a new approach to attributing both extreme regional BA totals and sub-regional BA extremes directly to the 2024–2025 focal events, made possible by developing near-real-time counterfactuals and employing methodologies for aggregating probabilities across space. This represents a step change versus our first report, which focussed on attributing sub-regional BA extremes only and substituted near-real-time counterfactuals with less targeted counterfactuals for the 2003–2019 period. By creating more robust counterfactuals with observed events, and accounting for the stochastic nature of fire anomalies locations, we were able to more directly and confidently assess whether human influence made these specific fires more likely on regional scales. In Sect. 6, we extended our forward-looking capabilities by providing seasonal forecasts of BA, complementing the fire danger forecasts already presented in previous reports. We also added future projections of FWI at future global warming levels of 1.5–4.0 °C, providing a clearer picture of how extreme wildfire risk may evolve in the coming decades.
This new report documents the progress made in the observation, diagnosis, modelling, and attribution of extreme wildfire events and their impacts. As a community, our work is both driving innovation in the methods under use and prompting the development of new capabilities for the routine analysis of extreme wildfire events and their impacts. This new report builds on our inaugural report (Jones et al., 2024b) and documents the progress being made by the fire science community.
By combining cutting edge techniques in fire forecasting, prediction and modelling across the sections of our report, we compile multiple lines of evidence for a clear climate signal in recent fire extremes. Our complementary analyses consistently point to a strong role of climate change in driving extreme fire conditions, showing that human influence, through both climate change and socioeconomic change factors, is increasing fire risk and producing extreme wildfires. While individual methods sometimes diverge, particularly in regions like the Pantanal, where local socioeconomic factors emerge more clearly as drivers in some analyses, the overall convergence across independent lines of evidence builds confidence in the conclusion that climate change exerts significant upwards pressure on the likelihood of extreme fire events.
These multiple lines of evidence show that human influence, often through climate change though sometimes through socioeconomic factors, is increasing fire risk and driving higher burned areas. Across every region analysed, we find clear signals that recent extreme wildfires are not purely natural events but increasingly shaped by human-driven changes to climate and ecosystems.
A key strength of this report lies in its systematic evaluation of model performance across diverse regions of the globe. In this edition, for instance, we identify limitations in the capacity of coarse-resolution air quality models to assess smoke exposure in small regions (Sect. 3) and show how projections of future fire activity can be strongly influenced by how models represent sensitive vegetation responses to uncertain climate changes (Sect. 6). In regions such as California, long-term projections are particularly sensitive to changes in tree cover, which can be affected by uncertainties in both climate inputs and modelled vegetation responses.
A rich body of observations, such as land surface and meteorological data, are available to observe and model the effects of climatic change and variability on extreme fire likelihood, in particular following important advances in the modelling of fuel load and moisture dynamics during recent decades. However, a major outstanding barrier that consistently limits the effectiveness of our analyses, and those of the broader fire science community, is a severe lack of information regarding in situ human activities. Funding of research projects that overcome this barrier is paramount and carries the greatest potential to drive a step change in performance of fire models and predictive systems. Often, prediction and modelling analyses rely on basic indicators of human effects such as population density, which cannot sufficiently represent the diversity of relationships between people, their land uses, and the outcomes for fire ignitions and spread dynamics. Our work, and that of many others, highlights the need to develop global datasets that effectively represent the range of human–fire interactions that occur on Earth but with sufficient scalability to support regional and global analyses. Inevitably, there will be a trade-off between the geographical scalability and nuance of these datasets as they are developed.
Overall, our international collaboration routinely catalogues fire extremes and annually evaluates the most extreme fire events of international relevance using state-of-the-art fire science tools. We provide a consistent stream of actional information to policymakers, disaster management services, firefighting agencies, and land managers, informing action on enhancing society's resilience to wildfires through investment in preparedness, mitigation, and adaptation.
This appendix includes the review completed by regional expert panels to supplement our quantitative analyses of extremes in the 2024–2025 fire season (Sect. 2). Details of the assembled panel are provided in Table A1.
Table A1Experts contributing to the identification of extreme events and characterisation of the global fire season during March 2024–February 2025.
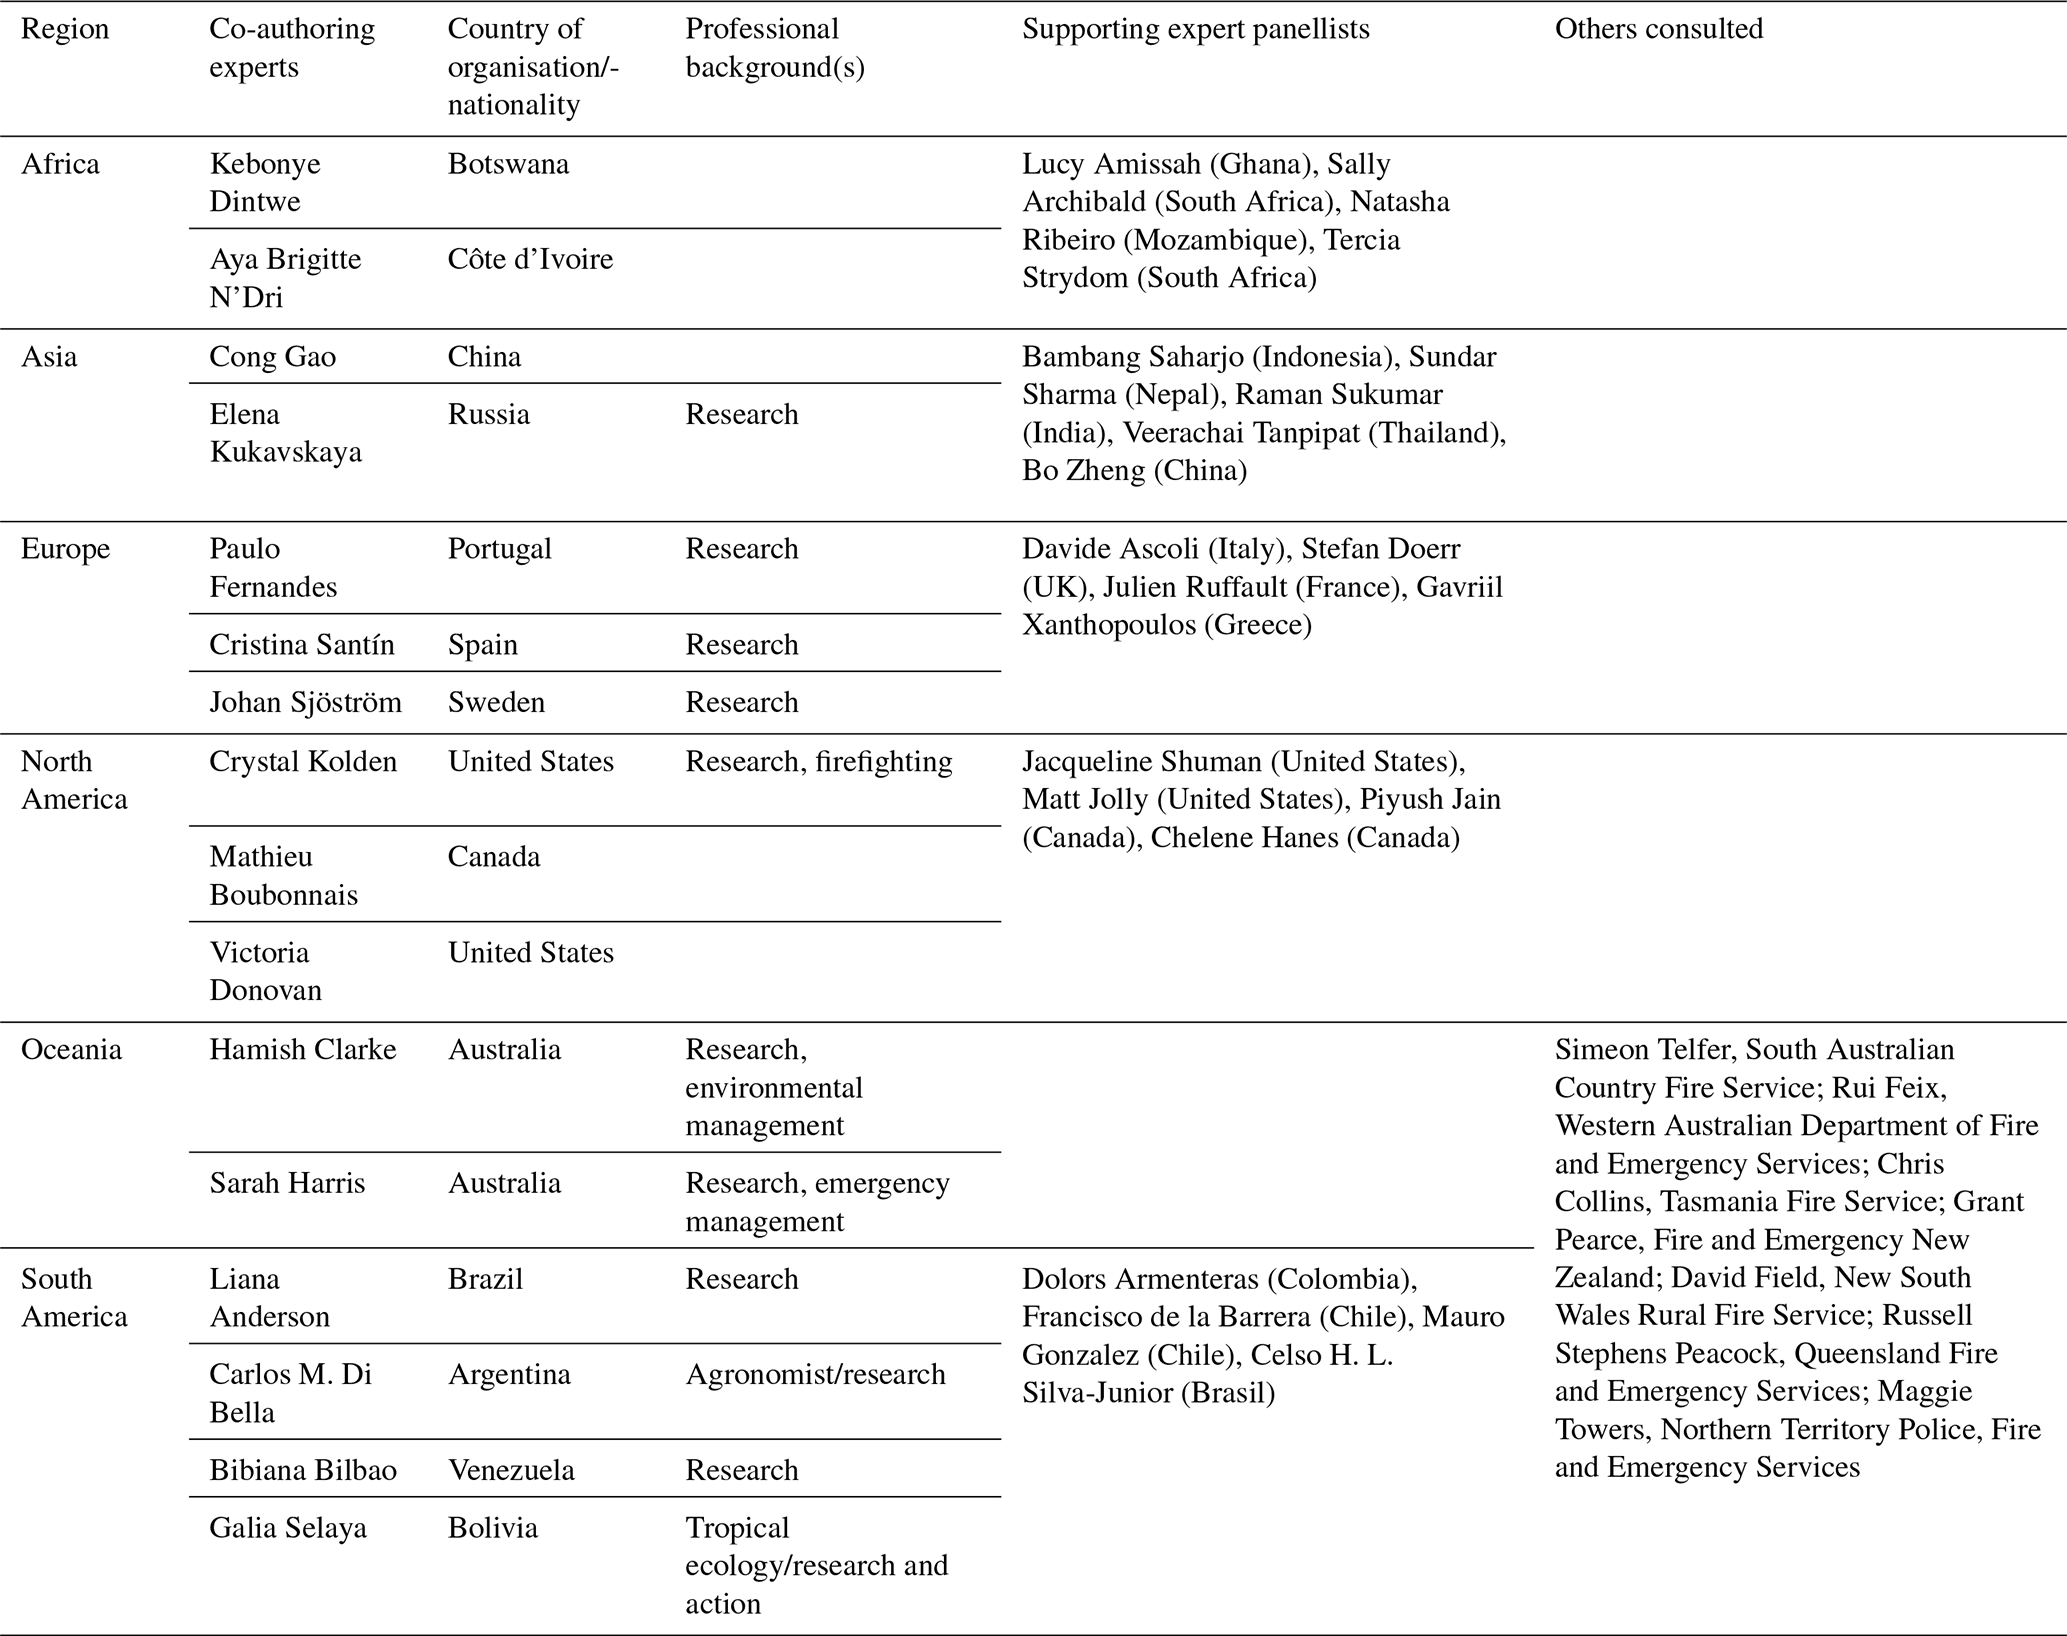
A1 Africa
National and regional fire monitoring statistics are rarely recorded or made publicly available by fire agencies in Africa, meaning that our assessment of the latest global fire season largely focuses on the insights provided by global data analyses. According to these data, the total BA in Africa was approximately 2.4×10⁶ km2 during the 2024–2025 fire season, 11.6 % below the mean annual BA since 2002 (2.7×10⁶ km2). Most of the BA occurred in non-forest (2×10⁶ km2), with the remaining portion in the forest. Non-forest and forest BAs were 12 % and 7 % lower than the mean annual BA, respectively. The BA anomaly was notably larger in Northern Hemisphere Africa (NHA) (−14.6 %) than in Southern Hemisphere Africa (SHA) (−9.1 %). The relatively low BA in many parts of the continent could be a result of a combination of factors, though it aligns with a trend that has been attributed to the continued suppression of fire from expanding croplands (Andela et al., 2017) and to changing rainfall patterns across the continent (Zubkova et al., 2019).
Africa's most pronounced positive anomalies in BA and fire C emissions of the 2024–2025 fire season were seen in the Congo Basin and northern parts of Angola (Figs. 1, 2; Tables 2, 3). BA in the Republic of Congo was 25 % above average, the highest on record, and similarly fire C emissions were 25 % above average (Tables 2, 3, Fig. S43). In the Democratic Republic of the Congo, the Mai-Ndombe and Sankuru provinces each experienced record levels of BA or fire C emissions with anomalies in the range of 36 %–58 % (Tables 2, 3). These anomalies were centred on several western ecoregions of the Congo Basin, including the Atlantic Equatorial coastal forests where BA was more than triple the annual mean, Western Congolian swamp forests where BA was twice the annual average, the Central Congolian lowland forests where BA was 77 % above average, and the Northwestern Congolian lowland forests where BA was 55 % above average. These results align with the recent report of the Global Forest Watch (World Resources Institute, 2025) which found that the Democratic Republic of the Congo (DRC) and the Republic of the Congo experienced their highest rates of primary forest loss since 2015. While loss to wildfire is a minor component of overall forest loss in the region (below 15 %), for instance compared to the expansion of shifting cultivation, wildfires were the major explanation for the more than double (+150 %) increase in forest loss in 2024 versus 2023.
The uptick in fires in the Congo Basin can be linked in part to the enabling effect of record-breaking fire weather caused by drought in the region (Sect. 2.2.2); however a range of socioeconomic changes have also been underway and likely influenced the events of last year. Use and degradation of the forests for resources, often linked to an increase in related wildfire ignitions, is growing due to the extraction of timber to produce charcoal, clearing of land for the expansion of cash crops, and shortening or cessation of fallow periods in smallholder shifting cultivation systems (World Resources Institute, 2025). The potential effects of fires in this region on forest carbon stocks are globally significant (though they are yet to be quantified), with the region's swamp forests harbouring 30×109 t of C in peat (Garcin et al., 2022). The 2024 IQAir World Air Quality Report highlighted that the Democratic Republic of the Congo had an annual average PM2.5 concentration of 58.2 µg m−3, over 11 times higher than the World Health Organization's annual standard (IQAir, 2025). This indicates hazardous air quality levels, due in part to the effects of elevated wildfire smoke emissions (IQAir, 2025). Despite the potentially large impacts on society and the environment, there was very limited news coverage on the impacts of these fires by national news outlets across the region. This underscores the importance of projects such as ours and the Global Forest Watch (World Resources Institute, 2025), using Earth observations to routinely trace environmental extremes and highlighting events that would otherwise have gone under-reported.
The high BA in the Congo Basin during 2024–2025 has implications for various initiatives supported by non-governmental organisations in the region, which aim to promote protection and sustainable management of tropical forests. For example, UNEP's Congo Basin Sustainable Landscapes Programme (Green Policy Platform, 2025) supports action in Cameroon, Central African Republic (CAR), the Democratic Republic of the Congo (DRC), Equatorial Guinea, Gabon, and Republic of the Congo. In programmes such as this, wildfire can sometimes be considered a secondary disturbance factor compared to other factors such as clear-cut deforestation, but years such as 2024 demonstrate that large-scale intermittent fires in the region can have lasting consequences for forest loss.
In Angola, BA and fire C emissions were 15 %–49 % above average in the provinces of Moxico, Huíla, and Bié and were either record-setting or high-ranking (Figs. S44, 2, 3; Table 2). As discussed in Sect. 2.2.2 and investigated formally for the Congo Basin in Sect. 4, a particularly hot and dry fire season elevated the risk of fire in these regions and coincided with broader social and economic factors promoting fire ignitions. The poor economic situation in Angola over the past 3 years has prompted deregulation of the charcoal industry and the harvesting of trees for charcoal production has risen, driving up fire activity (Valor Económico, 2024; VisiteHuila, 2024). In addition, the government has been promoting agriculture through financial programmes, leading to the clearing of land through shifting agriculture in Miombo woodlands (World Bank, 2024b). In certain provinces, particularly Moxico in Angola, burning for hunting purposes is also widespread, and declining populations of prey have been linked to increased burning of areas that were previously hunted less regularly (Papelo, 2024). These are just some of the socioeconomic factors that may have contributed to the elevated availability of ignition sources during the 2024–2025 fire season, when fire weather was particularly conducive to fire.
In Algeria, fires have killed and injured dozens and caused significant loss of life and damage in recent years. At least 34 people were killed and several hundred were injured in Bejaia Province during the 2023–2024 fire season (Jones et al., 2024b). However, in 2024–2025, a low number of fires were recorded, and there were no casualties in Algeria, which could be attributed to various factors such as the availability of better firefighting equipment, new fire management policies, and a new law that was passed that imposes life imprisonment for those caught deliberately starting forest fires (Serrah, 2024; The Arab Weekly, 2024). Algerian authorities launched a wildfire prevention system that included 13 water-bombing aircraft and 100 drones for monitoring and tracking firefighting operations. For instance, 26 fires were extinguished within 24 hours in the central and eastern regions of Algeria, with no injuries or casualties reported (Gabriel, 2024).
In South Africa, the total BA was over 46 000 km2, which was 17 % higher than the mean annual BA. According to a report by the organisation Working on Fire (2024), the increased intensity and frequency of these fires continue to challenge firefighting resources. The 2024–2025 fire season broke records, with 2750 firefighting teams dispatched, with a record number of 34 people losing their lives, including firefighters. In KwaZulu-Natal Province, the wildfires claimed the lives of 14 people, of whom 6 were firefighters who were trapped in a blaze. In addition to the lost lives, thousands of people were displaced, over 2050 livestock destroyed, and critical infrastructure damaged. The high-intensity fires in South Africa could be due to a string of particularly high rainfall years that resulted in large accumulated grassy fuel loads.
In Côte d'Ivoire, the overall BA in 2024–2025 was lower than the historical average, contrary to what some national experts had expected following the long dry season, which began earlier than usual in the savannah areas of the country where fire is most widespread (N'Dri et al., 2018, 2024; Soro et al., 2021). Nonetheless, the fire season was marked by an above-average fire size distribution, and there were several deadly events in the country's main fire hotspots, with fires burning over 1500 km2 of forest, 28 km2 of plantations, 1 km2 of reforestation projects, and 107 properties in 2025 (Comité National de Défense de la Forêt et de lutte contre les feux de Brousse, 2025). In the department of Séguéla (Worodougou region), wildfires in February 2024 destroyed 500 km2 of natural vegetation, 3 km3 of cropland, 2 km2 of cashew plantations, and 19 homes and claimed the lives of 23 individuals across the villages of Sélakoro, Djénigbé, Touna, Djoman, and Kondogo. In Bouna (Bounkani region), fires affected around 120 km2, of which 75 km2 was forested, leading to additional humanitarian impacts. Three further fatalities were recorded between February and March 2024 in Bongouanou (Moronou region) and Taabo (Agnéby-Tiassa region). These impacts occurred despite the continued efforts of the Comité National de Défense de la Forêt et de lutte contre les feux de Brousse (CNDFB), such as the construction of firebreaks during the dry season and awareness campaigns. This reflects the challenges posed by expanding agricultural land and ignition sources, fire suppression policies that focus on fire exclusion to protect valuable crops (e.g. cashew nuts) but promote fuel build-up, and a lack of prescribed burning in Côte d'Ivoire's savannah ecosystems (Ruf et al., 2019; Soro et al., 2020; Kouassi et al., 2022). Generally, fire activity and BA have been declining across all ecoregions of Côte d'Ivoire, which has been attributed to conversion of savannahs to agricultural lands and also bush encroachment in savannah areas (N'Dri et al., 2022; Douffí et al., 2021; Kouassi et al., 2022).
A2 Asia
The 2024–2025 fire season in Asia was generally not an extreme one, with much of Asia experiencing typical or low BA. Nonetheless, there were regional extreme fire events in the fire season.
Iran emerged as a notable case, experiencing its most severe wildfire season since 2002, marked by record-breaking BA, number of fires, and carbon emissions at the national level (Figs. 2, 3). Ecologically sensitive regions were disproportionately affected, including Karkheh National Park in Khuzestan Province and the forests and rangelands of Ab Kenar and Khan Ahmad Basht in Kohgiluyeh and Boyer-Ahmad Province (Global Fire Monitoring Center, 2024). As one of the driest countries in the world, Iran experiences approximately 1500 wildfire outbreaks annually, resulting in the burning of 150 km2 of forest (Kheshti, 2020; Tavakoli Hafshejani et al., 2022). Human activities are the primary driver of wildfires nationwide, with deforestation, illegal logging, and accidental ignition contributing to the high incidence of fires (Masoudian et al., 2025). These anthropogenic pressures are compounded by systemic shortcomings against wildfires, including inadequate resource allocation and insufficient prevention measures, which challenge the protection of natural ecosystems (Iran International, 2024).
Nepal also endured its second-worst fire season since 2002 (Fig. S45), with over 5000 fires according to some sources (Bolakhe, 2024) and > 1000 individual fires in our analysis (Fig. S45), causing more than 100 fatalities (Bolakhe, 2024). In Lumbini Province, located in western Nepal, wildfires devastated 114 km2 of forests and destroyed more than 230 houses and livestock shelters (Sanju Paudel, The Kathmandu Post, 2024). These catastrophic events were driven by extreme drought, prolonged heatwaves, and frequent lightning strikes (Karuna Shechen, 2024). Concurrently, anthropogenic factors,, including agricultural residue burning, poachers' use of fires, and unintentional human negligence, have exacerbated wildfire occurrence (Shradha Khadka, Shradha and Nitu, 2024). Notably, Nepal's forest cover has doubled over the last 3 decades, increasing from 26 % to 45 % between 1992 and 2016 (Karan and Bhadra, The New York Times, 2022). While Nepal's afforestation initiatives represent a significant environmental achievement, addressing the escalating human–nature conflict and strengthening resilience to climate-induced disasters remain critical challenges for ensuring the sustainability of this fragile progress.
Northern India, bordering Nepal, also experienced extreme heatwave and drought in 2024, triggering unprecedented wildfire activity across several states (Reuters, 2024). Uttar Pradesh, for example, experienced its most severe wildfire season, marked by record-breaking BA, carbon emissions, rate of growth, and fire size (Fig. A1). Human activities, mainly land clearing and negligence, serve as the primary ignition source in northern India, leading to uncontrolled wildfires. These fires are further exacerbated by the accumulation of dry pine needles in forests, which act as a ready fuel, and the steep Himalayan slopes, which accelerate the rate of fire growth (Vivek Saini, Climate Fact Checks, 2024). Agricultural practices in northern India, a critical crop-producing region, have also contributed to the extreme wildfire season. Despite regulatory bans, post-harvest burning of crop residue has continued unabated in recent years (Arshad R. Zargar, Zargar, 2024). At the same time, temperature inversions coupled with Himalayan topographical blockages have trapped pollutants over northern India. This phenomenon culminated in severe air haze episodes in New Delhi in November 2024, with PM2.5 concentrations exceeding 200 µg m−3 across large parts of northern India (Copernicus Atmospheric Monitoring Services (CAMS), 2024b).
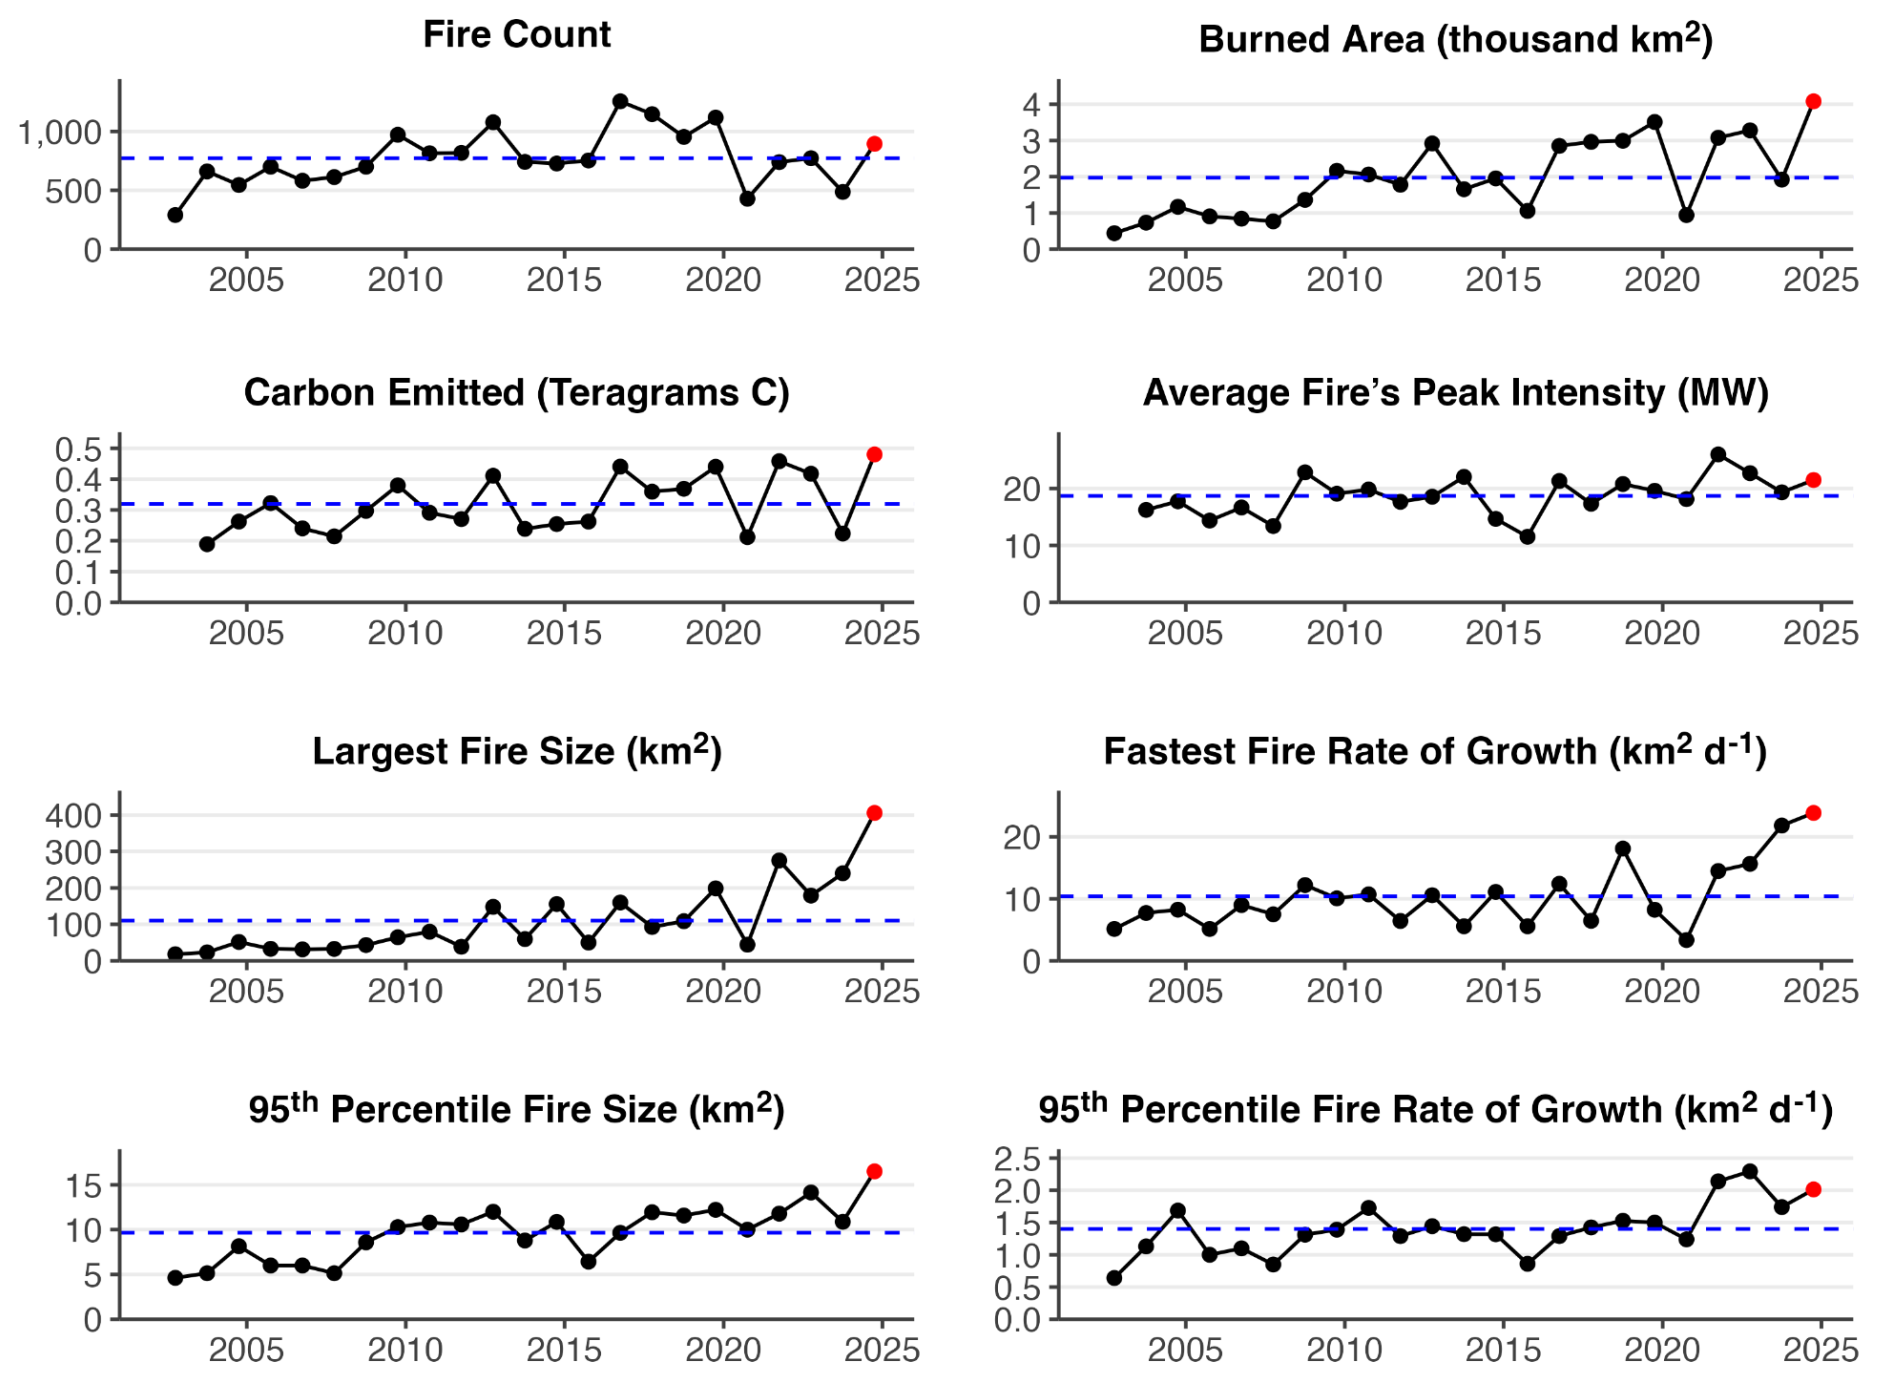
Figure A1Summary of the 2024–2025 fire season in the Indian state of Uttar Pradesh.Time series show annual fire count, BA, and C emissions totals within the region, as well as the average fire's peak fire intensity (95th percentile value of fire radiative power within fire perimeters), the 95th percentile fire size, fastest daily rate of growth, and 95th percentile fire daily rate of growth. Black dots show annual values prior to the latest fire season, red dots the values during the latest fire season, and blue dashed lines the average values across all fire seasons.
Although Russia generally experienced a typical fire season, several regions in Siberia recorded extreme fire activity. Two regions (republic of Sakha and Zabaikalsky krai) accounted for 65 % of the total forest area burned in Russia (Avialesookhrana, 2024), with 97 % of the fires recorded in hard-to-reach areas according to official data from the Federal Forestry Agency (Rosleshoz, 2024). The high fire activity was associated with intense heat, decreasing precipitation, and dry thunderstorms (Rosleshoz, 2024), which have become more frequent phenomena in Siberia in recent decades (Huang et al., 2024). Firefighting was complicated by strong winds and mountainous terrain (Rosleshoz, 2024). To attract additional firefighting forces, federal emergency regimes were introduced from 31 May to 8 November in the Zabaikalsky krai and from 28 June to 13 September in the more northern Republic of Sakha, including in the Arctic Circle. In total, 139 redeployments involving 3500 firefighters were carried out in 2024. The main causes of forest fires were lightning (48 %), local population (39 %), and fire transitions from other land categories (10 %) (Rosleshoz, 2024). While the area burned in 2024 in the Republic of Sakha was not the highest compared to fire activity in the previous years, there is an increasing trend of fire activity and severity in the region over the last decade (ISDM, 2025), associated with weather anomalies (Tomshin and Solovyev, 2022), resulting in an increase in the duration of the fire season and the average area burned (Kirillina et al., 2020; Narita et al., 2021). The estimated total emissions for June 2024 were the third highest in the past 2 decades, following those of 2019 and 2020 (AMAP, 2024). In the Zabaikalsky krai, the total area burned in 2024 was about 7 % of the area of the region, which is the highest value since 2010 (ISDM, 2025). Overall, both regions are considered hotspot areas of fire-induced change, where anthropogenic patterns and climate change are increasing ecosystem damage from wildfires and inhibiting recovery of natural ecosystems (Kukavskaya et al., 2016; Burrell et al., 2022).
Persistent dry and warm spring conditions in southwest China, particularly in Sichuan and Guizhou provinces, resulted in high-ranking BA anomalies (Fig. 2). Strong winds exacerbated fire risks by increasing regional fire size and rate of spread, leading to large and fast-moving wildfires (Global Times, 2024). One of the most severe wildfires in Sichuan lasted 14 d, displacing more than 3000 civilians across 11 villages and one community (Dou et al., 2024). Northeast China, including Heilongjiang and Jilin provinces, also experienced widespread wildfire anomalies during the spring season (Fig. 2; Table 2). Contrary to the climate-driven wildfires in southwest China, these wildfires were predominantly anthropogenic originating from crop residue burning. The Chinese government implemented policies in 2013 and 2018 to control straw burning, a major contributor to air pollution, which initially achieved measurable success (Huang et al., 2021; Song et al., 2024). However, due to financial strain on rural communities and administrative pressures on local officials, recent policy adjustments have shifted from a zero-tolerance approach to a more flexible framework. This revised strategy permits controlled crop residue burning in designated areas during periods of low air pollution risk (Ding, Sixth Tone, 2025).
Earth observation data showed high-ranking BA anomalies, frequent fires, fires with large sizes, and rates of growth during 2024–2025 in several regions of Lebanon, Palestine, Jordan, Iraq, Syria, United Arab Emirates, Philippines, and Laos (Figs. 2, 4), consistent with reports of persistent heatwave in these regions (Zachariah et al., 2024).
A drought that persisted from the 2024–2025 fire season to the 2025–2026 fire season has resulted in several highly impactful events in Asia (Faranda et al., 2025). Thus, from 21 March 2025, South Korea experienced its deadliest wildfires on record with very strong wind, burning across 11 regions and resulting in 31 deaths, 44 injuries, more than 3300 displaced people, and at least 4000 homes damaged (Yonhap News Agency, 2025). The wildfire in Iwate Prefecture, Japan, which started on February 26th 2025, was the country's largest wildfire in over 50 years, killing one person, destroying 221 buildings, and forcing evacuation of over 4500 people (NHK, 2025). These events are not reviewed at length here; however they will be featured in future editions of the State of Wildfires report.
A3 Europe
In 2024, wildfire activity in the European Union was close to the long-term average in terms of total BA but characterised by strong regional contrasts; approximately 4200 km2 was burned, slightly above the 18-year average (San-Miguel-Ayanz et al., 2025), with some countries experiencing record-breaking seasons and others seeing minimal fire activity. Across the continent, including in Türkiye and Ukraine, a total of 18 000 km2 burned from March 2024 to February 2025, as recorded by the European Forest Fire Information System (2025), of which 48 % pertains to large (> 5 km2) fires. The EU Civil Protection Mechanism (EUCPM) was activated 16 times in response to wildfires, providing international assistance to Greece, Portugal, Cyprus, Bulgaria, Albania, and North Macedonia (European Commission Emergency Response Coordination Centre, 2025).
The 2024 wildfire season in the Nordic and Baltic countries was the calmest in recent decades. While spring was drier and warmer than average in some areas, abundant summer precipitation limited fire spread. No major wildfire events were reported, and most incidents were confined to small wildfires caused by land-management activities (Persson, 2024). Likewise, wildfire activity in western Europe during 2024 and early 2025 was subdued, as precipitation during spring and summer limited fire occurrence and spread across the region. France experienced one of its quietest seasons in recent decades, and similar conditions were observed in Belgium, the Netherlands, Ireland, and the UK (Global Wildfire Information System, 2025). The fire season was insignificant in central Europe, because of wetter-than-average conditions during spring, especially in the Czech Republic and in Slovakia. However, Austria saw the highest number of fires and the largest BA since 2012 (Global Wildfire Information System, 2025), and Germany experienced a slightly above-average fire season, consistent with the trend of the previous 5 years. The most notable incident was a wildfire in Harz National Park in July, which led to the evacuation of approximately 500 people and involved 150 firefighters (Deutsche Welle, 2024).
In southern Europe fire activity varied widely depending on seasonal precipitation and fire weather, with notable peaks in July–August (Balkans) and September (Portugal). In Portugal (Fig. S46), 2024 was the most impactful year since 2017: 1400 000 km2 burned on the mainland, around 20 % above the past decade's average, with 25 fires exceeding 10 km2, 8 of which surpassed 50 km2 (Instituto da Conservação da Natureza e das Florestas, 2024). Most of these fires occurred as a sudden burst in mid-September in the northwest and under exceptional fire weather conditions (Instituto Português do Mar e Atmosfera, 2024). The Sever do Vouga complex and other major fires affected wildland–urban interface areas, resulting in 16 fatalities (Agência para a Gestão Integrada de Fogos Rurais, 2025) and EUR 180 million in estimated losses across housing, infrastructure, forestry, and agriculture (Centro de Coordenação Regional Centro, 2024; Centro Pinus, 2024). Additionally, 480 km2 of protected areas and Natura 2000 habitats burned (Gonçalves and Marcos, 2024). On the island of Madeira, a fire burned over 50 km2, entering the non-fire-adapted laurel forest, a UNESCO World Heritage Site (Ferreira, 2024).
BA in Spain, Italy, and Greece was respectively 41 %, 51 %, and 73 % of the 2012–2023 average (Global Wildfire Information System, 2025). In Greece, the drought lasted until mid-November, lengthening the fire season and enabling unusual high-elevation fires in the north. Nonetheless, strengthened preparedness and fire suppression hindered the spread of many potentially large fires. The most destructive fire occurred near Varnavas in August, entering the NE suburbs of Athens and killing one person (Giannaros et al., 2025).
The 2024 fire season in the Balkans and Southeastern Europe was among the most severe in recent decades for several countries. Wildfire activity was substantial in North Macedonia, Serbia, Albania, Kosovo, and Bulgaria, including multiple large-scale events requiring international firefighting assistance. In Albania, the largest wildfire surpassed 40 km2 in the Dropull i Poshtë m region, and the EU Civil Protection Mechanism was activated in response, with aerial support from Greece and Italy (Directorate-General for European Civil Protection and Humanitarian Aid Operations, 2024). Evacuations were carried out near the coastal town of Shengjin. Bulgaria experienced its worst fire season since 2007, with two wildfires in July destroying houses, the Sakar Mountain fire (Radio Bulgaria, 2024) and the Gorska Polyana fire (Novinite, 2024). North Macedonia (Fig. A2) and Serbia faced their worst fire seasons in over 2 decades, and a state of emergency was declared in the former (Euronews, 2024), where four fires larger than 100 km2 (10 000 ha) were recorded (European Forest Fire Information System, 2025). On 16 August, Serbian authorities reported 135 active wildfires within 24 h (N1info, 2024). Other countries in the region, such as Croatia and Montenegro, had seasons closer to the norm. In the Romanian Danube delta, and during an unusually dry winter, 450 km2 of wetlands burned in February 2025, a recurring phenomenon with increasing extent (Volodymyr and Andiy, 2025).
BA in Türkiye reached 2700 km2, about 65 % of the previous 12-years average (Global Wildfire Information System, 2025) but with noticeable societal consequences. Most large fires (up to 70 km2) occurred in the province of Mardin (European Forest Fire Information System, 2025), including a rapidly spreading fire that burned farmland and impacted villages on 20 June, killing 15 and additionally injuring at least 70 people (The Nation, 2024). A fire that started near the coastal city of İzmir on 15 August brought havoc to the wildland–urban interface and ended up burning houses and injuring 78 people (Ozerkan, 2024).
Long periods of high fire danger combined with intensified aggression and scarcity of firefighting resources set the scene in Ukraine. The fire season was severe in extent, and nearly 10 000 km2 burned between March 2024 and February 2025 (European Forest Fire Information System, 2025). This is larger than the combined BA in all of Europe, the Middle East, and North Africa (San-Miguel-Ayanz et al., 2025). As the majority of these fires are located near the front line in the eastern part of the country, warfare was presumably a major driver of their ignition, with forests seemingly accounting for a larger share of BA than in the recent past (Gayle, 2025). Nonetheless, higher BA had been recorded in the past, namely > 20 000 km2 in both 2014 and 2015 (Global Wildfire Information System, 2025).
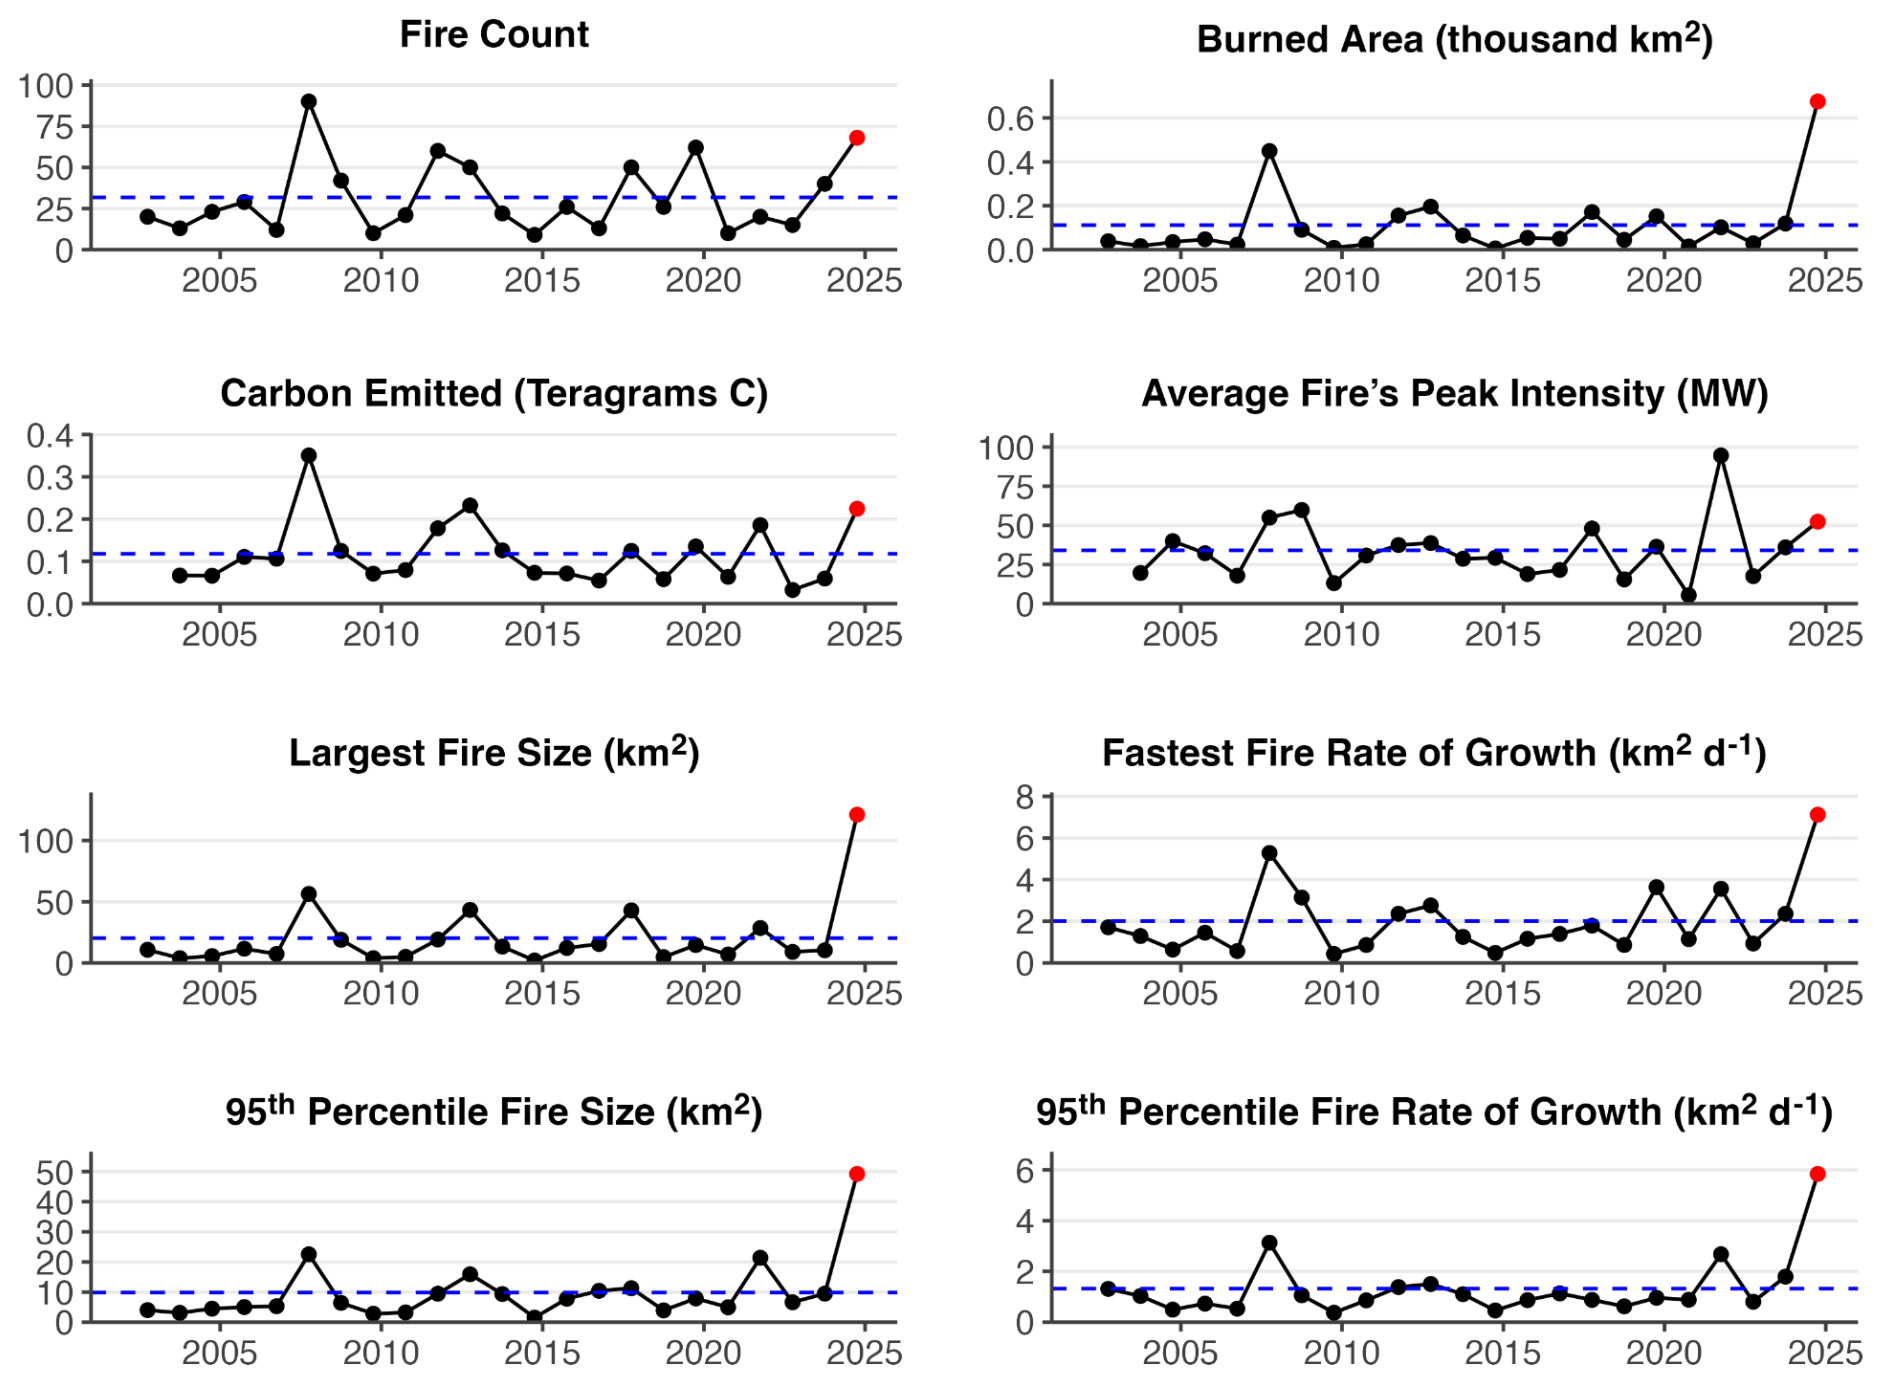
A4 North America
Wildfires across North America were characterised by above-average activity in Canada and the United States and a record-breaking season in Mexico in 2024–2025. This included multiple wildfires that resulted in substantial impacts to human communities, including the Eaton and Palisades wildfires, which are among the most destructive in California (United States) history. Following a record-breaking 2023 wildfire year, during which almost 150 000 km2 burned, Canada once again experienced an above-average wildfire season in 2024. A total of 5686 wildfires burned approximately 46 000 km2, marking the six-highest area burned since 1972 based on national records (Skakun et al., 2024). In the United States, over 64 000 wildfires burned over 36 000 km2 in 2024, exceeding both the previous 5- and 10-year averages (National Interagency Coordination Center, 2024). The United States also recorded the second-highest number of Level 4 and 5 National Fire Preparedness days since 1990, reflecting elevated national fire suppression resource commitment associated with high potential for continued emerging wildfires (National Interagency Coordination Center, 2024). National fire records for Mexico suggest that the country experienced more that 8000 wildfires in 2024, setting a record for area burned – over 16 500 km2 – since record keeping began in 1998 (Comisión Nacional Forestal, 2025), though this record is not reflected in the global datasets compiled as part of this report.
Much of Canada experienced earlier-than-normal snowmelt in 2024, resulting in an early onset of the wildfire season. For example, parts of Alberta experienced snowmelt up to 30 d earlier than average. Drought conditions, which were prevalent across the country in 2023, persisted into 2024 in much of western Canada. Holdover fires from 2023, which smouldered through the winter in northern British Columbia, Alberta (Fig. A3), and parts of the Northwest Territories, reignited in early spring due to warm and dry conditions (Kolden et al., 2025). This contributed to above-average area burned and wildfire emissions in May (Copernicus Atmosphere Monitoring Service, 2024). Wildfires in May led to evacuations of Fort Nelson, British Columbia, and Fort McMurray, Alberta – an area previously affected by Canada's costliest wildfire in 2016 (Canadian Forest Service, 2025).
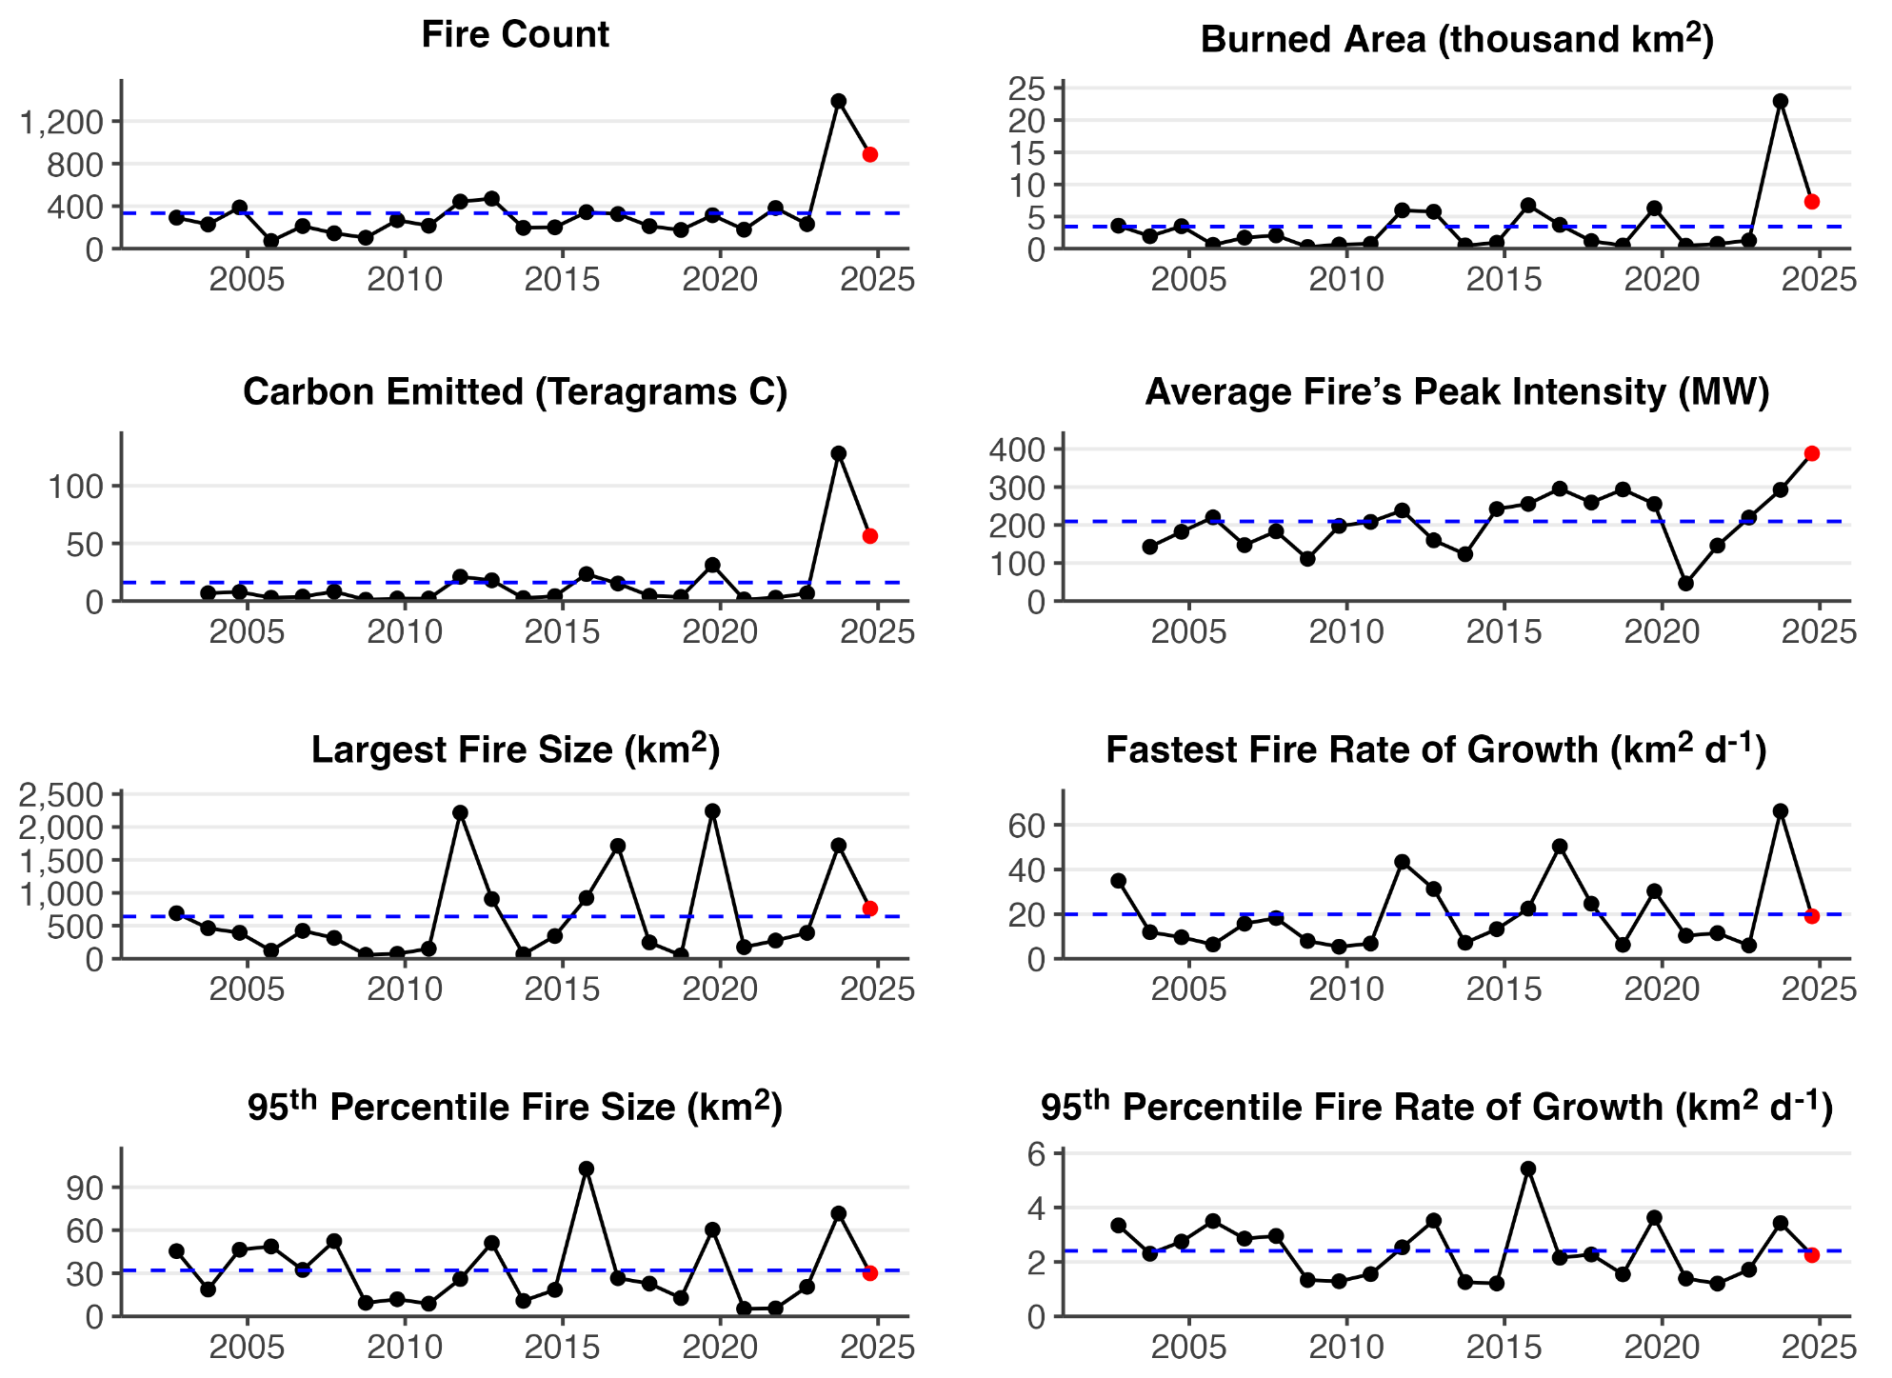
Most of the United States was characterised by normal to high precipitation at the start of 2024, with minimal wildfire activity (National Interagency Coordination Center, 2024). A heatwave at the end of February 2024 in the southern plains combined with strong winds and high fine fuel loads led to multiple large wildfires, including the record-breaking Smokehouse Creek Wildfire in the Texas Panhandle and western Oklahoma that burned over 4000 km2 and resulted in two fatalities before reaching 100 % containment in March (Texas House of Representatives Investigative Committee on the Panhandle Wildfires, 2024). Wildfire risk in the southern plains remained elevated for several weeks. Warm and dry conditions in March led to an increase in activity in the central Appalachians region of the eastern United States, with the Virginia Department of Forestry reporting over 100 wildfires in 48 h. By early April, fire activity peaked for the spring fire season in the southern and eastern United States. Dry and windy conditions prompted significant growth of large wildfires burning in New Mexico; however, fire activity remained below average in the United States in May (National Interagency Coordination Center, 2024).
Wildfires in Mexico started increasing in March during Mexico's typical wildfire season. Warm and dry conditions helped to fuel hundreds of wildfires (Comisión Nacional Forestal, 2025; NASA Earth Observatory, 2024b), contributing to Mexico's record-breaking wildfire season with anomalously high carbon emissions. Wildfire numbers peaked by mid-March through early May (Comisión Nacional Forestal, 2025).
Wildfire activity remained high across Canada during the summer of 2024, with many regions experiencing above-average area burned. Areas including New Brunswick in the east, and the Northwest Territories, recorded area burned totals among the top five highest since 1972 (Skakun et al., 2024). Hot and dry conditions in July resulted in wildfires forcing the evacuation of Labrador City in Newfoundland and Labrador and John D'Or Prairie and Fox Lake in Alberta (Canadian Forest Service, 2025). In late July during a period of extreme 99th percentile fire weather, a fast-moving wildfire resulted in the evacuation of the town of Jasper, Alberta, and destroyed 358 structures resulting in an estimated USD 1.23 billion in damages – the second costliest wildfire in Canadian history (Kolden et al., 2025; Insurance Bureau of Canada, 2025). There were two fatalities in July related to fire suppression operations in Alberta and the Yukon.
Large fires continued to burn in northern regions of British Columbia and Alberta and throughout the Northwest Territories throughout August and into the autumn, resulting in the fourth-, sixth-, and fifth-highest area burned for these areas, respectively, since 1972 (Skakun et al., 2024). Significant fire activity also developed in Saskatchewan, Manitoba, and Ontario in August, and New Brunswick experienced the second-highest area burned since 1972 (Skakun et al., 2024). In total, 91 wildfire-related evacuations took place across Canada during the 2024 season, affecting 56 000 people (Canadian Forest Service, 2025). According to estimates from the Copernicus Atmosphere Monitoring System, the 2024 wildfire season in Canada produced the second-highest total emissions recorded since 2003 – surpassed only by the record-breaking 2023 season (Parrington and Di Tomaso, 2024).
Wildfire activity began to pick up in the United States during the later part of June, with multiple fires in New Mexico resulting in several hundred structures burned (National Interagency Coordination Center, 2024), two fatalities, and over USD 1 billion in damages (National Centers for Environmental Information, 2025). By July, an extreme and long-lasting heatwave across the western United States brought about numerous large wildfires, including the Park Fire in Northern California that drove thousands to evacuate and destroyed over 700 structures (CALFIRE, 2025). Record-breaking dry conditions in Oregon and Washington led to over 100 human-caused wildfires by early July (US Forest Service, 2024), contributing to a record setting year in BA and anomalously high carbon emissions in Oregon (Fig. S47). Through July and August, hot and dry weather drove numerous large wildfires in the northwestern front range, including the Stone Canyon wildfire in Colorado that resulted in one fatality and multiple burned homes and the Remington wildfire in Wyoming that killed hundreds of cattle. During September, numerous dry lightning strike wildfires occurred in the northwestern United States, along with multiple wildfires in Southern California associated with extreme heat, including the Airport Fire that resulted in 22 injuries and 194 damaged structures (CALFIRE, 2025).
Autumn was anomalously warm and dry across much of the continental United States, with 87 % classified as abnormally dry or in drought by early November (National Interagency Coordination Center, 2024). The northeast United States experienced hundreds of wildfires that interacted with densely populated regions in October and November coincident with record-dry conditions and warm temperatures across multiple states. For instance, New York City experienced its highest number of recorded wildfires during a 2-week period, with every borough experiencing multiple wildfires. The conditions were unseasonable, with Connecticut, Massachusetts, and Rhode Island setting record red flag days, despite typical peaks for red flag days occurring in spring (Thiem, 2024). Massachusetts experienced its most active autumn fire season in over 40 years (Thiem, 2024). Two fatalities and hundreds of structures were destroyed before rainfall associated with an extratropical cyclone halted the autumn fire season in the northeast in late November.
Wildfire activity remained low at the end of 2024 and beginning of 2025, except in Southern California. Southern California is climatically prone to experiencing a downslope (katabatic) wind during the late autumn and winter months known locally as Santa Ana winds. Historically, the most devastating wildfires in California have occurred when a delayed onset of autumn precipitation coincides with a Santa Ana wind event (Kolden and Abatzoglou, 2018), but such concurrences are increasing in frequency with climate change (Goss et al., 2020). In November and December, Santa Ana wind events produced wildfires that burned nearly 100 km2 (10 000 ha) and destroyed over 250 structures; however, this was just a precursor. In January 2025, the most disastrous wildfire event in modern US history occurred in Los Angeles County, California. Prolonged drought conditions, unseasonably warm winter temperatures, and exceptionally powerful Santa Ana winds exceeding 140 km h−1 created extreme fire weather conditions (Barnes et al., 2025; Garrett, 2025). Fire potential was also exacerbated by anomalously wet winters for 2 years prior, which increased the fine fuel load in the region. The potential for extreme wildfires to develop under dry downslope winds was predicted several days in advance, including by the National Interagency Fire Center (NIFC), the National Weather Service (NWS), and the Storm Prediction Center (SPC; see summary by Wikipedia, 2025), as well as by specialist commentators (e.g. Swain, 2025).
The two most destructive fires – Palisades and Eaton – that burned during the event occurred in the same general locations as destructive fires in 1961 and 1993 during other Santa Ana wind events. These two fires resulted in numerous outcomes with widespread and severe consequences. Among the most devastating were the high fatalities and extensive structure loss. Over 11 750 homes were severely damaged or destroyed across Los Angeles County, and at least 31 lives were lost, according to the County of Los Angeles Medical Examiner (2025). Specifically, the Palisades Fire severely damaged or destroyed nearly 5614 homes, while the Eaton Fire impacted over 10 000 (CALFIRE, 2025; Wikipedia, 2025). The fires also triggered mass evacuations. At the peak of the crisis, at least 153 000 people were forced to evacuate, with up to 200 000 under evacuation warnings or orders (USGS, 2025b; Kim et al., 2025; Wikipedia, 2025).
In addition to human displacement and infrastructure damage, the fires severely affected both air and water quality. Air pollution reached hazardous levels, contributing to negative health outcomes for thousands. During the fires, peak PM2.5 levels reached 483 µg m−3, an order of magnitude greater than the 35 µg m−3 daily standard set by the US Environmental Protection Agency, resulting in a prolonged period of hazardous air quality (California Air Resources Board, 2025). Over 400 excess deaths in Los Angeles County have since been attributed to exposure to poor air quality during January 2025, including due to lung or heart conditions, exacerbated by smoke or stress, or to indirect causes (e.g. disruptions to health systems or mental health impacts; Paglino et al., 2025). Municipal water supplies were similarly impacted, with water considered unsafe for tens of thousands of residents in the burned areas for several weeks following the fires and eight water districts in LA county issuing “do-not-use” or “do-not-drink” warnings (Pasadena Office of the City Manager, 2025). Beyond Los Angeles, the political fallout from the crisis led to federal orders to release over 8.3×10⁶ m3 of water from federal reservoirs further north in California. However, this water did not flow to Southern California and was instead vital for irrigating crops in the state's heavily agricultural Central Valley (Levin et al., 2025).
The economic consequences were equally severe. Total economic losses were estimated at USD 140 billion, factoring in property destruction, health costs, business disruption, and infrastructure damage, making this one of the most costly wildfire events in US history (Los Angeles County Economic Development Corporation, 2025; Li and Yu, 2025). Wider economic disruption is also projected, with estimated losses of USD 4.6–8.9 billion in economic output over 5 years, 25 000–50 000 job years lost, and reductions in labour income of USD 1.9–3.7 billion (Los Angeles County Economic Development Corporation, 2025). The Palisades and Eaton fires directly affected nearly 2000 businesses (Los Angeles County Economic Development Corporation, 2025). Moreover, as Los Angeles hosts the largest port on the US Pacific coast, these fires disrupted broader supply chains connected to the Port of LA (Terrill, 2025).
Insured losses added another layer of financial strain, with industry estimates ranging from USD 20 to USD 75 billion (PreventionWeb, 2025; Morningstar DBRS, 2025; Dalton et al., 2025; Li and Yu, 2025). This placed substantial pressure on the already volatile home insurance market in California, as well as on most global re-insurers.
The fires also deepened Southern California's ongoing housing and affordability crisis. Thousands of affordable housing units were lost, worsening the existing housing shortage, displacing large numbers of low-income residents, and exacerbating the region's homelessness problem (Urban Land Institute, 2025; Li and Yu, 2025; Booth, 2025). This led to ripple effects, with mass displacement into surrounding communities and beyond in the months that followed (New York Times, 2025).
Finally, the aftermath of the fires brought additional physical hazards in the form of debris flows. Given Southern California's geology, the region is highly susceptible to erosion and debris flows following wildfires. Several such events occurred after high-intensity rainfall in the weeks following the fires, causing further damage and prompting hundreds of additional evacuations in and near the recently burned areas (USGSa, 2025).
A5 Oceania
Oceania experienced relatively moderate levels of fire during the 2024–2025 fire season, although there were still a series of high profile and high impact events across the region. Overall, however, the season did not reach the magnitude of the previous year, which ranked among the top 5 years for BA in Australia since 2002. Where fires occurred and had impacts, lightning and sustained dryness were prominent drivers (Bureau of Meteorology, 2024; Dowdy and Brown, 2025).
The 2024–2025 fire season in Western Australia was characterised by record-high temperatures, variable rainfall, and significant soil moisture deficits in coastal areas of the south, southwest, and west. Over 1000 large fires burned about 4700 km2, many in coastal shrubland and woodland over the ∼ 800 km stretch from Gingin, north of Perth, to Carnarvon. The largest fire by area burned occurred near Cervantes in November, where fire ignited by a car crash went on to burn more than 800 km2 and severely impact local honey production. In the inland Goldfields region at Skeleton Rocks, more than 440 km2 of Mallee-heath vegetation of the Great Western Woodlands was burned (according to the Department of Fire Emergency Services (DFES), Rui Feix, personal communication, 2025). This fire reached extreme intensity, impacting fire-sensitive species and post-fire regeneration cycles in an ecosystem that requires long intervals to recover. A lithium mine in the area was also directly impacted by the fire. Four other large incidents were recorded in the shrublands of the Great Western Woodlands, further affecting these vulnerable ecosystems. Between December and March, numerous fires occurred in the grasslands of the Wheatbelt and Esperance, as well as in the forests of the Perth Hills. These included fires that collectively destroyed seven residential properties in areas east of Mundaring, Arthur River, Wooroloo, and Waroona. In February and March, lightning ignited several large bushfires in native forests and coastal shrubland around Manjimup. Some of these fires burned for up to 5 weeks and affected more than 420 km2, including areas of Shannon and D'Entrecasteaux national parks (DFES, Rui Feix, personal communication, 2025). These incidents required significant aerial support and personnel deployments, including interstate assistance.
Above-average rainfall was recorded in Central Australia, leading to expectations of strong grass fuel growth and another period of increased fire activity, after last year's above average season (Verhoeven et al., 2020; Ruscalleda-Alvarez et al., 2023). By the end of October 2024, over 57 000 km2 had burned, much of it stemming from an intense band of dry lightning stretching from the Northern Territory into Queensland in October (according to Northern Territory Fire and Emergency Services, Maggie Towers, personal communication, 2025). Many of these fires combined with a particularly large fire complex near Devil's Marbles Conservation Reserve (4500 km2) (NTFES, Maggie Towers, personal communication, 2025). The fire threatened hotels and other infrastructure and caused temporary closure of a major highway. In late January 2025, a bushfire swept through the West MacDonnell Ranges, affecting approximately 800 km2 across the Tjoritja/West MacDonnell National Park, Standley Chasm, and the Tyurretye and Iwupataka Aboriginal Land Trusts, as well as nearby pastoral properties (NTFES, Maggie Towers, personal communication, 2025). Standley Chasm and sections of the Larapinta Trail were closed for several days while a 10 d multi-agency effort worked to contain the fire.
Queensland's northwest saw heightened fire activity during spring, with fire fighters responding to 40 incidents in Mount Isa alone. One of these fires burned for nearly 2 months, reaching over 1000 km2 according to Queensland Fire Department (Russell Stephens-Peacock, personal communication, 2025). The fires caused an increase in hospital admissions due to respiratory illnesses and impacted mining operations, pastoral property, and Lawn Hill National Park. The fires affected the habitat and food sources of endangered species such as the Carpentarian grasswren, found only in northwestern Queensland.
In 2024–2025, eastern Australia, comprising southern Queensland, New South Wales (NSW), and the Australian Capital Territory (ACT), experienced a notably warm period, with significant rainfall variation across regions and seasons. Although temperatures were above average in the austral spring, many areas received above-average rainfall, thereby reducing fire occurrence and impacts. Repeated dry lightning started a number of complexes of fires in remote and difficult-to-access terrain across NSW, including areas like Lithgow, the Hawkesbury, Bulga, and around Tamworth. Despite the number of fires, NSW saw more moderate fire weather than other parts of the country, and emergency warnings were only issued for three fires (according to New South Wales Rural Fire Service, David Field, personal communication, 2025).
The south to southeast of Australia (including the states of South Australia, Victoria, and Tasmania) experienced record dryness in the lead-up to the fire season. Fires in Chappelvale and Casterton-Edenhope in late spring signalled an early start to the fire season in Victoria. In December a band of dry lightning ignited a number of fires including several in the Grampians National Park. About 750 km2 burned in the Grampians, affecting culturally and ecologically sensitive areas. The coincidence of the fire with Christmas and the peak holiday season led to major tourism losses and extensive community evacuations. This fire was contained by 6 January, but later in January another band of dry lightning passed through the west of the state, this time affecting the western side of the Grampians and burning another almost 600 km2 (according to Country Fire Authority, Sarah Harris, personal communication, 2025). By the season's end, over two-thirds of this important national park was impacted by fire. Another significant fire occurred on 26 December, a public holiday, in Little Desert National Park in the state's west. This fire was an extremely fast-moving fire with approximately 650 km2 burning in less than 8 h and a final area burned of 900 km2 (according to Country Fire Authority, Sarah Harris, personal communication, 2025). These fires required interstate deployments to assist in the fire fight. The fire season concluded with challenging fires that burned through rugged terrain in the Gippsland area, impacting the World Heritage-listed Budjim National Park with its significant cultural heritage. Several planned burns escaped during the season, highlighting the significant dryness of the area.
In South Australia dry lightning storms in early February combined with severe drought conditions to cause the Wilmington fire, which burned approximately half of Mount Remarkable National Park. Firefighting efforts reduced the impact to human, ecological, and cultural assets. Lightning storms in February and March also caused an above-average number of fires in eastern parts of South Australia. While impacts were limited, firefighting resources were strained (South Australia, Country Fire Service, Simeon Telfer, personal communication, 2025).
Tasmania faced a significant bushfire season, with up to 1000 km2 burned in the state's northwest, including sensitive ecosystems such as the Tarkine rainforest and the alpine vegetation around Cradle Mountain (according to Tasmania Fire Service, Chris Collins, personal communication, 2025). Sparked by intense lightning storms in remote and rugged terrain, the fires required interstate support to assist with firefighting efforts. The blazes led to evacuations, threatened heritage sites, and caused major disruptions to local businesses and the tourism industry.
In Aotearoa / New Zealand the 2024–2025 fire season was moderate, with a couple of minor fires at the end of the 2023/24 fire season (March–June 2024) and a few more significant fires during the 2024/25 fire season (July 2024–February 2025). A key feature was the occurrence of a couple of significant wetland fires that burned large areas of peatland (23 km2) and damaged flora and fauna habitat. These fires occurred at Whangamarino Wetland, Waikato (central North Island) in October 2024 and Tiwai Peninsula, Murihiku / Southland (southern South Island), in late January 2025, with both fires just over 10 km2. The fires followed two major peatland fires in 2022 at Kaimaumau in the far north (24 km2) and Awarua in the south (9 km2 and close to this season's Tiwai fire) (according to Fire and Emergency New Zealand, Grant Pearce, personal communication, 2025). Carbon emissions are likely to be high, given that the 2022 fires were estimated to release more than 620 000 t CO2 (Pronger et al., 2024). There were a number of other noted fires in a mixture of vegetation types including in Waitaha / Canterbury, Te Tai Tokerau / Northland, and North Otago. However, unlike recent years, there were no major house loss incidents, with just a few homes and outbuildings lost across the multiple fires.
A6 South America
The 2024–2025 fire season was a remarkable year for fire in South America, with 7 of its 13 countries reaching new records in BA since 2002 and widespread records in the fire size, growth rate, and intensity distributions (Figs. 3, 4). Anomalies in BA commenced early in 2024 and persisted through November in some regions (Fig. S4). As discussed in Sect. 2.2.2 and Sects. 4–6, intense drought and fire weather affected much of South America during the 2024–2025 fire season, and this drought occurred at a time when socioeconomic factors are increasingly cited as drivers of shifting fire regimes and timing. The event is part of a trend towards an earlier onset of the fire season since 2020, with new record fire counts set for the months of March to May in 2020 and for January in 2022, based on monitoring by Brazil's National Institute for Space Research (INPE) since 1998 (INPE, 2025). During 2024, January, February, and June presented the second-highest value on record (previous record during 2003 for January and 2007 for the other months, respectively). Fires have expanded into new territories, driven by a combination of climate variability, shifting land-use practices, and governance challenges, as discussed in the study cases below.
Across South America, the number of fire hotspots recorded by the Queimadas/INPE system (511 000 hotspots in 2024) rivalled the previous record set in 2010 (523 000 hotspots) (INPE, 2025). Compounding climate and human drivers likely led to a widespread extreme fire year across the continent in 2024–2025. The land-use fire-dependent practices, associated with new deforestation frontiers during an extreme drought year, amplified the fire crisis. Amidst rising socioeconomic and environmental impacts of fires in the region, researchers have been calling on governments across the globe to rethink strategies for combating the root causes of extreme wildfires, from climate change to fire-free agricultural practices (UNEP, 2022). Increases in extreme droughts with already vulnerable forest due to extreme climatological events are expected, and therefore controlling ignition sources is the only immediate measure for preventing 2024-like scenarios. In this context, major fire events in terms of largest fire size emerged in many parts of Brazil, Peru, Ecuador, and Bolivia during the 2024–2025 fire season, with unprecedented levels of BA and exceptional fire weather (Fig. S2).
In Brazil, one of the most intense droughts in decades, combined with the expansion of the agricultural frontier in Amazonas and Pará states (Santos et al., 2023), caused fires to persist nearly year-round (Fig. S2.4). In northern Brazil, including much of the Amazon biome, several states such as Amazonas and Pará experienced their largest BA on record. Other states, including Mato Grosso, São Paulo, and Paraná, recorded their highest fire extent in a single year. In the Pantanal biome, Mato Grosso do Sul experienced the second-largest BA extent on record, the fourth in rank in fire size and fifth regarding the fastest growth. This resulted in estimated losses to agribusiness caused by the fires amounting to BRL 1.2 billion (∼ USD 222 million) (Câmara, 2024). In addition, Pantanal recorded a particulate matter concentration of 903.2 µg m−3 in September 2024 (Viana et al., 2024), which is 60 times higher than the World Health Organization (WHO) standards. Efforts to contain the flames lasted 78 d and involved the National Force, local communities, environmental organisations, and state fire brigades (Nunes, 2025). The response faced significant challenges, particularly in remote border areas with difficult access and complex logistics. Providing support to isolated populations was especially difficult, with reported cases of respiratory illnesses worsened by smoke exposure, as well as emotional distress, including stress and anxiety (Nunes, 2025).
São Paulo and Mato Grosso state, both centres of large-scale crop production, experienced the fourth-largest BA extent on record. Regarding fire intensity, 2024 was the record for São Paulo, Paraná, Mato Grosso do Sul, Rio de Janeiro, and Roraima and the second in the rank for Amazonas and Goias. All together, from the southeast to the north of the country, records in one or more fire metrics were observed during this period, placing Brazil in a state of fire emergency.
In general, early fire season onset and long duration occurred across most Brazilian regions, with the first month of anomalous fire starting from March in most of the Amazonian states and extending through to December. In fact, more fire hotspots were detected in February and March 2024 than in any year since 1998 (INPE, 2025). Record fire counts were observed across states covering more than half of Brazil's territory and represented a threat almost during the entire year, posing challenges for managing the wildfires response and combat. By August 2024, the National Centre for Early Warning of Natural Disasters (CEMADEN, 2024) pointed out that the drought, covering Amazonia to the southeast, initiated in the second half of 2023, was already one of the strongest in decades. Data from the National Secretariat for Civil Protection and Defence (S2ID, 2024), in December 2024, pointed out that there were 21 of the 27 states with a recognised decree either in state of emergency or calamity due to the drought, affecting more than 520 municipalities in the country. These conditions brought widespread devastation across Brazil in 2024, impacting urban and rural communities and affecting an estimated 18.9 million people nationwide (CNM, 2024). Fire disaster forced 10 700 people from their homes, resulting in housing instability and severe disruptions to livelihoods. Thousands more were affected by the breakdown of essential services, such as school closures (CNM, 2024). Although Brazil does not have an official database on wildfire-related fatalities, existing records point to a rising death toll (Béllo Carvalho et al., 2025). Estimates have identified 186 deaths between 2020 and 2024, with 38 in 2024 alone. However, the actual number is likely higher due to underreporting.
Notably, the state of São Paulo in Brazil recorded 8712 hotspot fires, the highest number since 1998 (INPE, 2025). August and September together accounted for approximately 70 % of these detections (6134), roughly 4 times the 1998–2023 August average (914 hotspot fires) and 3 times the corresponding September average (848 hotspot fires). According to a study by the Amazon Environmental Research Institute (Garrido, 2024), of the 2600 hotspot fires recorded in the state of São Paulo between August 22 % and 24 %, 81 % were in areas of agricultural use – drawing attention to the fact that the state recorded, on the 23 August alone, more hotspots than the entire Amazon biome. In an even more alarming interval, analysed images from the geostationary satellite indicate that the smoke columns in western São Paulo appeared in just 90 min, between 10:30 a.m. and 12:00 p.m. LT on 23 August, and, on that same day, the number of fires jumped from 25 to 1886 hotspot fires, reinforcing the hypothesis of orchestrated action and the unprecedented intensity of these fires.
Amazonas state, the largest of Brazil's Amazonian states, can be pointed out as an epicentre of wildfires and its impacts. During 2024, it was ranked as first in the number of fires (Fig. 4) and presented a historical record of fire occurrence in June, July and August, consecutively, since the monitoring began in 1998 (INPE, 2025). Moreover, it was the third year with the fastest fire growth rates, with a fire season lasting for 8 months. It has been estimated that fires affected around 8000 km2 of forests, approximately 39 % of the affected area, especially in the southern region of the state (Alencar et al., 2022). The Amazonas state has been facing an increase in the deforestation rate since 2021, mainly in the southern region, following the pressure and political speech of Brazil's BR-319 highway paving. The lack of governance and the associated illegal logging, land grabbing, and public lands invasion are some of the drivers of the fire peaks observed in the region (Fearnside, 2022). Moreover, it has been estimated that the population from this region has been exposed to aerosols emitted from the wildfires, causing pollution of up to 113 µg m−3, 653 % above the 15 µg m−3 standard set by the WHO, according to the data from the Atmosphere Monitoring Service (CAMS) and Copernicus Climate Change Service (C3S).
A recent report from the Global Forest Watch (World Resources Institute, 2025) also showed widespread high levels of forest loss (stand-replacing fire extent) to wildfire in 2024 in the Amazon biome (including both Brazil and neighbouring Amazonian countries). The highest rate of forest loss since 2016 was observed, with total forest loss more than doubling in 2024 versus 2023 and 60 % of this loss being attributed to wildfires. Note that Global Forest Watch data define “forest loss” as the complete removal of tree canopy, including areas affected by stand-replacing fires, but do not capture more subtle or partial fire-related degradation. As a result, the data may overestimate deforestation while underestimating degradation, limiting understanding of the broader ecological impacts of wildfires on forests. Moreover, Indigenous communities were disproportionately affected by wildfires in 2024, a year that recorded the highest number of fires in territories inhabited by isolated Indigenous peoples (COIAB, 2024). In 2024, fires in Indigenous lands in Brazil increased by 81 % compared to 2023, accounting for the largest share of Amazonia fires at 24 % (Alencar et al., 2024). In Roraima, uncontrolled fires in indigenous lands have degraded air quality, ravaged crops, homes, and native vegetation, leading to food and water insecurity (ISA, 2024). The fires have further worsened the ongoing humanitarian crisis in the Yanomami Territory, Brazil's largest Indigenous land. Local organisations estimate that at least 70 000 people across urban and rural communities were affected by the lack of access to clean water, a result of the compounded impacts of drought and fire (WWF-Brasil, 2024).
The implications of extreme fire activity in Amazonia extend beyond immediate ecological damage. As a globally significant carbon sink and a key part of the terrestrial hydrological cycle, the Amazon stores an estimated 100–120 Pg of carbon (Malhi et al., 2006). Intensified fire regimes risk accelerating forest degradation, potentially triggering a biome-scale shift from net carbon sink to a significant carbon source, releasing several petagrams of carbon and exacerbating global warming through positive feedbacks (Gatti et al., 2021). Fire-driven environmental degradation also poses public health risks and economic instability. Biomass burning increases respiratory illness, especially among populations exposed to prolonged smoke (Campanharo et al., 2019, 2021). Economically, fire reduces agricultural productivity, damages infrastructure, and undermines regional development, compounding poverty and inequality. Costs extend to firefighting programmes and personnel (Fonseca Morello et al., 2020), as well as hospitalisations from respiratory or other fire-related conditions (Machado-Silva et al., 2020). Rising fire activity may also weaken the effectiveness of forest conservation and restoration policies, including those tied to international climate agreements, threatening long-term mitigation and adaptation efforts.
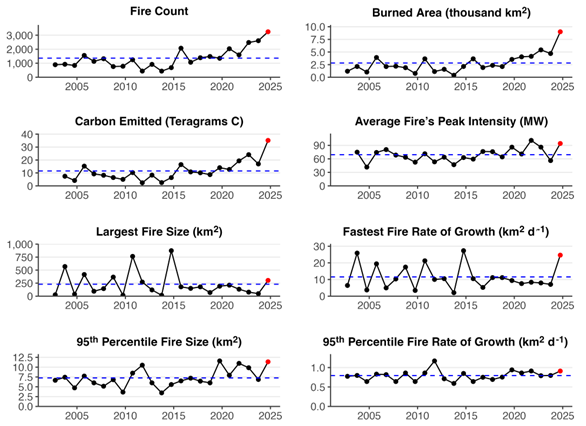
Bolivia endured one of its worst fire seasons on record by many measures, intensified by the El Niño phenomenon, record temperatures, and accelerating deforestation, contributing significant carbon emissions to the atmosphere (Fig. A5). These conditions intensified fire outbreaks, especially in ecologically vulnerable regions such as the Chiquitania and Amazonian lowlands (Ruiz, 2025). The cumulative number of fire hotspots in 2024 was 923 464, with 77 % occurring in Santa Cruz (Chiquitano dry forest), 19 % in Beni (Amazonian lowlands), 1.6 % in La Paz, and the rest in other departments including Pando (north Amazonia) (CEJIS, 2024). A recent report from Global Forest Watch (World Resources Institute, 2025) found that forest loss in Bolivia tripled in 2024 versus 2023 and was many times over the annual mean since 2002, with 60 % of this loss related to wildfires. The forest fires have been attributed to a combination of one of the most severe droughts on record and a number of socioeconomic factors and government policies that encourage agricultural expansion, such as the lifting of soy and beef export quotas and the removal of import taxes on agrochemicals and machinery (World Resources Institute, 2025).
The area burned was a contentious issue in the country. According to the NGO Fundación Tierra (2024), in September 2024, about 100 000 km2 was burned. The wildfires extended up to November. In early January 2025, an independent group of experts of the national journal (El Deber, 2025) reported that 140 000 km2 burned based on the MODIS Terra sensor. In April 2025, the Ministry of Environment officially reported 126 000 km2 burned in 2024, 12 % of the country's territory, with 57 % corresponding to primary forest and 43 % pastures and agricultural lands (Ministerio de Medio Ambiente y Agua, 2025). Although wildfires have been occurring regularly in Bolivia over the past decade, the events of 2024 have been the most catastrophic to date. The event is considered the second megafire after the one that occurred in 2019. Indigenous lands, protected areas, and fiscal lands were among the most impacted categories. The Global Forest Watch cited a lack of early warning systems and adequate firefighting resources as a factor contributing to high rural exposure to fire and urban exposure to wildfire smoke (World Resources Institute, 2025). An investigation by Fundación Tierra (2025) reports that wildfires in Bolivia are mostly intentional, with 66 % being maliciously set and 34 % resulting from out-of-control slash-and-burn agricultural practices.
The Bolivian Air Contamination Index reached 537 in the city of Cobija, northern Bolivia (Silva Trigo, 2024), corresponding to a PM2.5 concentration of over 500 µg m−3 (24 h average), a level considered extremely harmful and impactful to the health of millions of people in the region and beyond. As a result, the government declared a sanitary emergency. In addition to the extensive environmental destruction and incomparable biodiversity loss, these fires have significantly increased atmospheric carbon emissions, exacerbating regional and global climate challenges. It is important to note that laws and regulations in Bolivia encourage agricultural and livestock expansion and are lenient towards the use of fire (He et al., 2025). Encroachment and illegal land occupation are also pointed to as causes of provoked wildfires in Bolivia. Efforts in the legislative branch to prohibit or amend these regulations have not been successful thus far. Therefore, there is a looming risk that similar events may occur again in the near future.
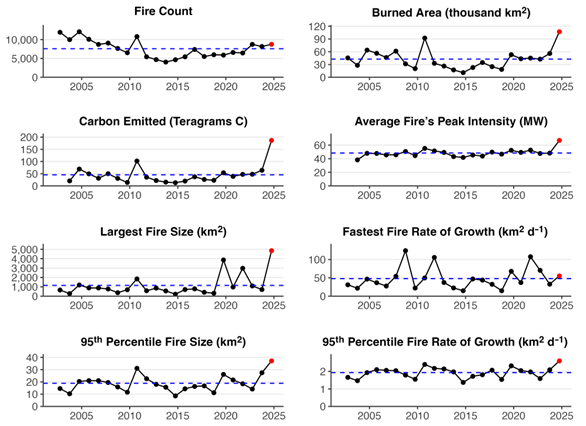
In early 2024, Venezuela experienced its most intense wildfire season on record, with over 30 000 active fires between January and March (NASA FIRMS, 2025). Unlike Brazil, Venezuela's peak fire season runs from December to April, driven by the northward shift of the Intertropical Convergence Zone (ITCZ; Katz and Giannini, 2010; Ramírez and Gómez, 2021), which was intensified by the 2023–2024 El Niño, one of the strongest in decades, creating an extreme fire weather window (NOAA CPC, 2024). Fires have historically been concentrated in the Orinoco Llanos, a savannah-dominated region covering approximately one-third of Venezuela, where fire is used for agricultural purposes and grazing (Bilbao et al., 2020). More recently, deforestation in tropical forests south of the Orinoco has fuelled large fires, like those seen in 2019 (Lizundia-Loiola et al., 2020b). In 2024, wildfires impacted nearly all ecosystems, from Amazonian humid forests in Bolívar and Amazonas (5600+ fires, including Canaima National Park) to flooded savannahs in Apure, cloud forests in Henri Pittier, and an estimated 360 km2 of Caribbean pine lost in Uverito, Latin America's largest plantation (Ciudad CCS, 2024; Lozada, 2024). Since 2019, Venezuela's National Parks Institute (INPARQUES) has promoted an intercultural Integrated Fire Management (IFM) strategy, coordinated by an intersectoral team involving government agencies, local communities, and researchers (Bilbao et al., 2022). With support from FAO and RAMIF (under ACTO), this national IFM system aims to strengthen fire management efforts in response to Venezuela's vast ecological and territorial complexity and to the increasing extreme fire weather conditions projected for the region, including higher temperatures, prolonged dryness, and lower humidity (Feron et al., 2024).
A fundamental challenge in the wildfire crisis affecting Bolivia and Venezuela is the complexity of managing fires in border regions. Many of the most affected areas are located along international boundaries, where coordination between neighbouring countries is often inadequate or inefficient. The lack of standardised protocols, difficulties in sharing real-time information, and disparities in firefighting capacities create significant logistical and operational challenges. Fires in these areas are particularly difficult to control due to overlapping jurisdictions and administrative barriers that delay response efforts. This is also the case in other regions in South America, such as the tri-national frontier with Acre, Peru, and Bolívia (Pismel et al., 2023) and the Pantanal region. Without improved cross-border collaboration, enhanced communication channels, and harmonised fire management strategies, these transboundary wildfire zones will remain highly vulnerable, exacerbating the broader crisis in South America.
Ecuador presented the peak in BA during 2024, with an anomaly of 166 %, the highest on record. It was reported that there were almost 6000 wildfires, 830 km2 of burned vegetation, 1663 affected people, 47 people hurt, 6 deaths, 45 000 animals killed, and over 5000 animals affected, according to the National Secretariat for Risk Management (SitRep, 2024). These events were attributed to the extreme drought and land-use and land-cover conversion fire-dependent practices.
In 2024, there were 13 400 hotspots in Peru, which was 1000 more than in 2023 (Cáceres et al., 2024). Of the total, 49 % were in natural areas such as forests or other natural covers, 35 % in non-forest vegetation types, and 12 % in anthropogenic areas. The maximum number of hotspots occurred in September. According to Cáceres et al. (2024), in August and September, the regions most impacted by fire were Ucayali, Madre de Dios, Huánuco, San Martín, and Loreto, all belonging to the Amazonia region. In November 2024, the number of wildfires totalled 1798; over 8000 km2 burned, and 35 people and a countless number of animals died in the events (Castillo, 2024, Informe Defensorial no. 225). The severity of the wildfires was reflected by Castillo (2024) using information from INDECI (Institute of Civil Defense).
In the extreme south of South America, fires in Patagonia started in early 2025, continuing a recent trend that aligns with an 80 % increase in BA since 2002. In Argentina, the 2024–2025 fire season was the most destructive in decades for northern Patagonia. By late February 2025, more than 3000 km2 had burned across Río Negro and Neuquén provinces, primarily affecting Lanín and Nahuel Huapi national parks (Greenpeace, 2025). Extreme fire behaviour was driven by prolonged drought, anomalously high temperatures, and intense westerly winds. Nearly all ignition sources were anthropogenic, amid conditions of critical fuel dryness (Greenpeace, 2025). The Patagonia 2024–2025 fire campaign represents the most extensive and intense in decades, underscoring the combined influence of climate extremes and human pressures.
In Chile, fire occurrence and BA were lower during the 2024–2025 fire season than in recent years. The 2024 season reached a BA of 738 km2 compared to the 4291 km2 burned in 2023. However, in February 2024, the Valparaíso region experienced a record-setting catastrophic fire associated with extreme weather conditions (high temperatures and strong winds), affecting wildland–urban interface areas with significant material losses and more than 30 deaths (González et al., 2024). Central and south-central Chile have experienced an intense and uninterrupted megadrought since 2010, which has increased the size and severity of wildfires (Garreaud et al., 2017; González et al., 2018; Bowman et al., 2019). Priority steps to advance solving this problem are restoring and managing forest vegetation and removing highly flammable forest plantations to move towards less fire-prone landscapes.
The supplement related to this article is available online at https://doi.org/10.5194/essd-17-5377-2025-supplement.
Conceptualisation and project administration: DIK, CAB, FdG, MWJ. Data curation, resources, and software: DIK, CAB, FDG, MWJ, MLFB, EBr, JRM, ZL, ASIB, EBu, AC, EDT, JE, AJH, SL, GM, YQ, FRS, CBS, MATV, DvW, JBW, EW, NA, EC, LG, MP, MT, GRvdW, SV. Formal analysis: DIK, CAB, FDG, MWJ, MLFB, EBr, JRM, ZL, KB, IJMF, LF, AJH, SL, GM, YQ, FRS, CBS, MATV, RV, DvW, JBW. Visualisation: DIK, CAB, FDG, MWJ, MLFB, JRM, ZL, KB, IJMF, LF, SL, AL, FRS, MAT-V, RV, JBW, NA. Writing (original draft preparation): DIK, CAB, FDG, MWJ, MLFB, EBr, JRM, ZL, ASIB, AC, EdT, IJMF, LF, AJH, TK, TRK, SL, YQ, PSS, FRS, CBS, MATV, RV, JBW, EW, BB, MB, GC, CMdB, KB, VMD, SHar, EAK, BN'D, CS, GS, JS, JA, NA, DSH, SHan, SM, MP, MT, LOA, HC, PMF, CAK. Writing (review and editing): all authors.
Niels Andela is an employee of BeZero Carbon Ltd., a carbon credit ratings agency for the voluntary carbon market. At least one of the (co-)authors is a member of the editorial board of Earth System Science Data. The peer-review process was guided by an independent editor.
Publisher’s note: Copernicus Publications remains neutral with regard to jurisdictional claims made in the text, published maps, institutional affiliations, or any other geographical representation in this paper. While Copernicus Publications makes every effort to include appropriate place names, the final responsibility lies with the authors. Views expressed in the text are those of the authors and do not necessarily reflect the views of the publisher.
The authors thank all contributing panellists of the regional expert panels (Table A1): Lucy Amissah, Dolors Armenteras, Davide Ascoli, Sally Archibald, Francisco de la Barrera, Stefan Doerr, Mauro Gonzalez, Chelene Hanes, Piyush Jain, Matt Jolly, Natasha Ribeiro, Julien Ruffault, Bambang Saharjo, Sundar Sharma, Celso Silva Junior, Jacqueline Shuman, Tercia Strydom, Raman Sukumar, Veerachai Tanpipat, Gavriil Xanthopoulos, and Bo Zheng. The regional panel of Oceania thank the following for their contributions to the identification and description of key events in the 2024–2025 fire season: Telmo António, Chris Collins, David Field, Rui Feix, Russell Stephens Peacock, Grant Pearce, Simeon Telfer, and Maggie Towers. We thank the working groups “FLARE: Fire science Learning AcRoss the Earth System” and “TerraFIRMA: Dummies Guide to using Fire Models” for contributing to defining the report scope and establishing contributor links. We thank Luca Minello for his assistance with the analyses of C project exposure to fire. We thank the CNDFB (Comité National de Défense de la Forêt et de lutte contre les Feux de Brousse) for their contribution to the characterisation of the fire season in West Africa. We acknowledge the use of GrammarlyGO (http://www.grammarly.com, last access: 6 August 2025) and ChatGPT-4 (https://chatgpt.com/, last access: 6 August 2025) to identify improvements in language use and writing style only of an earlier draft.
Douglas I. Kelley and Maria L. F. Barbosa were funded by the UK Natural Environment Research Council (NERC) as part of the LTSM2 TerraFIRMA project and NC-International programme (grant no. NE/X006247/1) delivering National Capability. Chantelle Burton and Emily Wright were funded by the UK Department for Science (DSIT) Met Office Hadley Centre Climate Programme and the DSIT Innovation and Technology International Science Partnerships Fund (ISPF; UK Met Office Climate Science for Service Partnership (CSSP) Brazil). Francesca Di Giuseppe and Joe R. McNorton were funded by a service contract (no. 942604) issued by the Joint Research Center on behalf of the European Commission. Matthew W. Jones was funded by the UK NERC (NE/V01417X/1). Anna S. I. Bradley was funded by the DSIT Innovation and Technology International Science Partnerships Fund (ISPF; UK Met Office Climate Science for Service Partnership (CSSP) Brazil). Carmen B. Steinmann was funded by the Swiss Innovation Agency Innosuisse (grant no. 120.464 IP-SBM). Elena A. Kukavskaya was funded by the State Assignment Project (grant no. FWES-2024-0040). Esther Brambleby was funded by the UK NERC ARIES Doctoral Training Partnership (grant no. NE/S007334/1). Guilherme Mataveli was funded by the FAPESP (grant nos. 2019/25701-8 and 2023/03206-0). Hamish Clarke was funded by the Westpac Scholars Trust via a Westpac Research Fellowship and by the Australian Research Council via an Industry Fellowship with the Victorian Department of Energy, Environment, and Climate Action, the Victorian Country Fire Authority and Natural Hazards Research Australia (grant no. IM240100046). Jakob B. Wessel was funded by the UK Engineering and Physical Sciences Research Council (EPSRC; 2696930). Liana O. Anderson was funded by the São Paulo Research Foundation (FAPESP; 2021/07660-2 and 2020/16457-3) and the Brazilian National Council for Scientific and Technological Development (CNPq; 409531/2021-9 and 314473/2020-3). Miguel Ángel Torres-Vázquez and Marco Turco were funded by the Spanish Ministry of Science and Innovation (MCIN; MCIN/AEI/10.13039/501100011033; ONFIRE PID2021-123193OB-I00) and by the European Regional Development Fund (ERDF; project “A way of making Europe”). Mark Parrington and Enza Di Tomaso are part of the Copernicus Atmosphere Monitoring Service, which is operated by the European Centre for Medium-Range Weather Forecasts (ECMWF) on behalf of the European Commission as part of the Copernicus Programme. Marco Turco was funded by the Spanish Ministry of Science, Innovation and Universities through the Ramón y Cajal (grant no. RYC2019-027115-I). Paulo M. Fernandes was supported by the Portuguese Foundation for Science and Technology (FCT; UID/04033/2025 (Centre for the Research and Technology of Agro-Environmental and Biological Sciences) and LA/P/0126/2020, https://doi.org/10.54499/LA/P/0126/2020). Renata Veiga was funded by the Brazilian National Council for Scientific and Technological Development (CNPq; #443285/2023-3) and the Brazilian Institute of Environment and Renewable Natural Resources (IBAMA)/Federal University of Rio de Janeiro (UFRJ; #968711). Sarah Meier was funded by the Dragon Capital Chair on Biodiversity Economics. Sander Veraverbeke and Yuquan Qu were funded by a European Research Council Consolidator Grant (grant no. 101000987). Theodore R. Keeping was funded by Schmidt Sciences, LLC. Galia Selaya was funded within the PRODIGY project by the BMFTR (grant no. 01LC2324) and the Fulbright Amazonia programme (sponsored by the U.S. Department of State and the Fulbright Commission in Brazil).
This paper was edited by Francesco N. Tubiello and reviewed by Oliver Perkins, Andrew Sullivan, and Olivia Haas.
Abatzoglou, J. T., Williams, A. P., and Barbero, R.: Global Emergence of Anthropogenic Climate Change in Fire Weather Indices, Geophys. Res. Lett., 46, 326–336, https://doi.org/10.1029/2018GL080959, 2019.
Abatzoglou, J. T., Smith, C. M., Swain, D. L., Ptak, T., and Kolden, C. A.: Population exposure to pre-emptive de-energization aimed at averting wildfires in Northern California, Environ. Res. Lett., 15, 094046, https://doi.org/10.1088/1748-9326/aba135, 2020.
Abatzoglou, J. T., Juang, C. S., Williams, A. P., Kolden, C. A., and Westerling, A. L.: Increasing Synchronous Fire Danger in Forests of the Western United States, Geophys. Res. Lett., 48, e2020GL091377, https://doi.org/10.1029/2020GL091377, 2021.
Abatzoglou, J. T., Kolden, C. A., Cullen, A. C., Sadegh, M., Williams, E. L., Turco, M., and Jones, M. W.: Climate change has increased the odds of extreme regional forest fire years globally, Nat. Commun., 16, 6390, https://doi.org/10.1038/s41467-025-61608-1, 2025.
Abram, N. J., Henley, B. J., Sen Gupta, A., Lippmann, T. J. R., Clarke, H., Dowdy, A. J., Sharples, J. J., Nolan, R. H., Zhang, T., Wooster, M. J., Wurtzel, J. B., Meissner, K. J., Pitman, A. J., Ukkola, A. M., Murphy, B. P., Tapper, N. J., and Boer, M. M.: Connections of climate change and variability to large and extreme forest fires in southeast Australia, Commun. Earth Environ., 2, 8, https://doi.org/10.1038/s43247-020-00065-8, 2021.
Agência para a Gestão Integrada de Fogos Rurais: Relatório de Atividades 2024 Relatório anual de atividades do Sistema de Gestão Integrada de Fogos Rurais (SGIFR), https://www.agif.pt/app/uploads/2025/06/RelatC3%B3rio-de-Atividades-2024_SGIFR_pg-34-corrigida.pdf (last access: 6 August 2025), 2025.
Aguilera, R., Corringham, T., Gershunov, A., and Benmarhnia, T.: Wildfire smoke impacts respiratory health more than fine particles from other sources: observational evidence from Southern California, Nat. Commun., 12, 1493, https://doi.org/10.1038/s41467-021-21708-0, 2021.
Alencar, A., Arruda, V., Martenexen, F., Rosa, E. R., Velez-Martin, E., Guedes Pinto, L. F., Duverger, S. G., Monteiro, N., and Silva, W.: Fogo no Brasil em 2024: o retrato fundiário da área queimada nos biomas, IPAM Amazônia, https://ipam.org.br/bibliotecas/fogo-no-brasil-em-2024-o-retrato-fundiario-da-area-queimada-nos-biomas/ (last access: 6 August 2025), 2024.
Alencar, A. A., Brando, P. M., Asner, G. P., and Putz, F. E.: Landscape fragmentation, severe drought, and the new Amazon forest fire regime, Ecol. Appl., 25, 1493–1505, https://doi.org/10.1890/14-1528.1, 2015.
Alencar, A. A. C., Arruda, V. L. S., Silva, W. V. D., Conciani, D. E., Costa, D. P., Crusco, N., Duverger, S. G., Ferreira, N. C., Franca-Rocha, W., Hasenack, H., Martenexen, L. F. M., Piontekowski, V. J., Ribeiro, N. V., Rosa, E. R., Rosa, M. R., Dos Santos, S. M. B., Shimbo, J. Z., and Vélez-Martin, E.: Long-Term Landsat-Based Monthly Burned Area Dataset for the Brazilian Biomes Using Deep Learning, Remote Sensing, 14, 2510, https://doi.org/10.3390/rs14112510, 2022.
Alho, C. J. R., Mamede, S. B., Benites, M., Andrade, B. S., and Sepúlveda, J. J. O.: Threats to the biodiversity of the Brazilian Pantanal due to land use and occupation, Ambiente Soc., 22, e01891, https://doi.org/10.1590/1809-4422asoc201701891vu2019l3ao, 2019.
Almeida, C. T., Oliveira-Júnior, J. F., Delgado, R. C., Cubo, P., and Ramos, M. C.: Spatiotemporal rainfall and temperature trends throughout the Brazilian Legal Amazon, 1973–2013, Int. J. Climatol., 37, 2013–2026, https://doi.org/10.1002/joc.4831, 2017.
Alvarado, S. T., Andela, N., Silva, T. S. F., and Archibald, S.: Thresholds of fire response to moisture and fuel load differ between tropical savannas and grasslands across continents, Global Ecol. Biogeogr., 29, 331–344, https://doi.org/10.1111/geb.13034, 2020.
Andela, N. and Jones, M. W.: Update of: The Global Fire Atlas of individual fire size, duration, speed and direction, Zenodo [data set], https://doi.org/10.5281/zenodo.11400061, 2025.
Andela, N. and van der Werf, G. R.: Recent trends in African fires driven by cropland expansion and El Niño to La Niña transition, Nat. Clim. Change, 4, 791–795, https://doi.org/10.1038/nclimate2313, 2014.
Andela, N., Morton, D. C., Giglio, L., Chen, Y., van der Werf, G. R., Kasibhatla, P. S., DeFries, R. S., Collatz, G. J., Hantson, S., Kloster, S., Bachelet, D., Forrest, M., Lasslop, G., Li, F., Mangeon, S., Melton, J. R., Yue, C., and Randerson, J. T.: A human-driven decline in global burned area, Science, 356, 1356–1362, https://doi.org/10.1126/science.aal4108, 2017.
Andela, N., Morton, D. C., Giglio, L., and Randerson, J. T.: Global Fire Atlas with Characteristics of Individual Fires, 2003–2016, ORNL DAAC, ORNL Distributed Active Archive Center [data set], https://doi.org/10.3334/ORNLDAAC/1642, 2019a.
Andela, N., Morton, D. C., Giglio, L., Paugam, R., Chen, Y., Hantson, S., van der Werf, G. R., and Randerson, J. T.: The Global Fire Atlas of individual fire size, duration, speed and direction, Earth Syst. Sci. Data, 11, 529–552, https://doi.org/10.5194/essd-11-529-2019, 2019b.
Anderegg, W. R. L., Trugman, A. T., Badgley, G., Anderson, C. M., Bartuska, A., Ciais, P., Cullenward, D., Field, C. B., Freeman, J., Goetz, S. J., Hicke, J. A., Huntzinger, D., Jackson, R. B., Nickerson, J., Pacala, S., and Randerson, J. T.: Climate-driven risks to the climate mitigation potential of forests, Science, 368, https://doi.org/10.1126/science.aaz7005, 2020.
Andreae, M. O.: Emission of trace gases and aerosols from biomass burning – an updated assessment, Atmos. Chem. Phys., 19, 8523–8546, https://doi.org/10.5194/acp-19-8523-2019, 2019.
Aragão, L. E. O. C., Anderson, L. O., Fonseca, M. G., Rosan, T. M., Vedovato, L. B., Wagner, F. H., Silva, C. V. J., Silva Junior, C. H. L., Arai, E., Aguiar, A. P., Barlow, J., Berenguer, E., Deeter, M. N., Domingues, L. G., Gatti, L., Gloor, M., Malhi, Y., Marengo, J. A., Miller, J. B., Phillips, O. L., and Saatchi, S.: 21st Century drought-related fires counteract the decline of Amazon deforestation carbon emissions, Nat. Commun., 9, 536, https://doi.org/10.1038/s41467-017-02771-y, 2018.
Archibald, S., Roy, D. P., van Wilgen, B. W., and Scholes, R. J.: What limits fire? An examination of drivers of burnt area in Southern Africa, Glob. Change Biol., 15, 613–630, https://doi.org/10.1111/j.1365-2486.2008.01754.x, 2009.
ArcGIS Hub: World Continents, ArcGIS Hub, [data set] https://hub.arcgis.com/maps/CESJ::world-continents (last access: 6 August 2025), 2024
Arctic Monitoring and Assessment Programme (AMAP): AMAP Arctic Climate Change Update 2024: Key Trends and Impacts, https://www.amap.no/documents/doc/amap-arctic-climate-change-update-2024-key-trends-and-impacts/3851 (last access: 6 August 2025), 2024.
Artés, T., Oom, D., de Rigo, D., Durrant, T. H., Maianti, P., Libertà, G., and San-Miguel-Ayanz, J.: A global wildfire dataset for the analysis of fire regimes and fire behaviour, Sci. Data, 6, 296, https://doi.org/10.1038/s41597-019-0312-2, 2019.
Atwood, E. C., Englhart, S., Lorenz, E., Halle, W., Wiedemann, W., and Siegert, F.: Detection and Characterization of Low Temperature Peat Fires during the 2015 Fire Catastrophe in Indonesia Using a New High-Sensitivity Fire Monitoring Satellite Sensor (FireBird), PLoS ONE, 11, e0159410, https://doi.org/10.1371/journal.pone.0159410, 2016.
Avialesookhrana (Aerial Forest Protection Service): Information on forest fire situation in the territory of the RF subjects as of 31.12.2024, https://aviales.ru/files/documents/2024/fds_svedenya/%D1%81%D0%B2%D0%B5%D0%B4%D0%B5%D0%BD%D0%B8%D1%8F%20%D0%BE%20%D0%BB%D0%B5%D1%81%D0%BE%D0%BF%D0%BE%D0%B6%D0%B0%D1%80%D0%BD%D0%BE%D0%B9%20%D0%BE%D0%B1%D1%81%D1%82%D0%B0%D0%BD%D0%BE%D0%B2%D0%BA%D0%B5%20%D0%BD%D0%B0%20%D1%82%D0%B5%D1%80%D1%80%D0%B8%D1%82%D0%BE%D1%80%D0%B8%D0%B8%20%D1%81%D1%83%D0%B1%D1%8A%D0%B5%D0%BA%D1%82%D0%BE%D0%B2%20%D1%80%D1%84%20%D0%BD%D0%B0%2031.12.2024.pdf (last access: 6 August 2025), 2024.
Aznar-Siguan, G. and Bresch, D. N.: CLIMADA v1: a global weather and climate risk assessment platform, Geosci. Model Dev., 12, 3085–3097, https://doi.org/10.5194/gmd-12-3085-2019, 2019.
Badgley, G., Chay, F., Chegwidden, O. S., Hamman, J. J., Freeman, J., and Cullenward, D.: California's forest carbon offsets buffer pool is severely undercapitalized, Front. For. Glob. Change, 5, https://doi.org/10.3389/ffgc.2022.930426, 2022a.
Badgley, G., Freeman, J., Hamman, J. J., Haya, B., Trugman, A. T., Anderegg, W. R. L., and Cullenward, D.: Systematic over-crediting in California's forest carbon offsets program, Glob. Change Biol., 28, 1433–1445, https://doi.org/10.1111/gcb.15943, 2022b.
Barbosa, M. L., Haddad, I., da Silva Nascimento, A. L., Máximo da Silva, G., Moura da Veiga, R., Hoffmann, T. B., Rosane de Souza, A., Dalagnol, R., Susin Streher, A., Souza Pereira, F. R., Oliveira e Cruz de Aragão, L. E., and Oighenstein Anderson, L.: Compound impact of land use and extreme climate on the 2020 fire record of the Brazilian Pantanal, Global Ecol. Biogeogr., 31, 1960–1975, https://doi.org/10.1111/geb.13563, 2022.
Barbosa, M. L. F.: Tracing the Ashes: Uncovering Burned Area Patterns and Drivers Over the Brazilian Biomes, PhD Thesis, Instituto Nacional de Pesquisas Espaciais, http://mtc-m21d.sid.inpe.br/col/sid.inpe.br/mtc-m21d/2024/04.04.17.26/doc/publicacao.pdf (last access: 6 August 2025), 2024.
Barbosa, M. L. F., Kelley, D., Moura da Veiga, R., Dong, N., and Burton, C.: State of Wildfires 2024–2025 ConFLAME: douglask3/Bayesian_fire_models Zenodo [code], https://doi.org/10.5281/ZENODO.16790787, 2025a.
Barbosa, M. L. F., Kelley, D. I., Burton, C. A., Ferreira, I. J. M., da Veiga, R. M., Bradley, A., Molin, P. G., and Anderson, L. O.: FLAME 1.0: a novel approach for modelling burned area in the Brazilian biomes using the maximum entropy concept, Geosci. Model Dev., 18, 3533–3557, https://doi.org/10.5194/gmd-18-3533-2025, 2025b.
Barbosa, M. L. F., Kelley, D., Hartley, A., Spuler, F., Wessel, J., Ciavarella, A., McNorton, J., Burton, C., Ferreira, I., and Fiedler, L.: State of Wildfires 2024/25 – ConFLAME Driver Assessment – Northeastern Amozonia/Pantanal-Chiquitano, Zenodo [data set], https://doi.org/10.5281/ZENODO.16786041, 2025c.
Barbosa, M. L. F., Kelley, D., Ciavarella, A., Hartley, A., McNorton, J., Di Giuseppe, F., Jones, M., Spuler, F., Wessel, J., and Burton, C.: State of Wildfires 2024–2025 ConFLAME driving data (v0.1.0), Zenodo [data set], https://doi.org/10.5281/ZENODO.15721434, 2025d.
Barichivich, J., Gloor, E., Peylin, P., Brienen, R. J. W., Schöngart, J., Espinoza, J. C., and Pattnayak, K. C.: Recent intensification of Amazon flooding extremes driven by strengthened Walker circulation, Sci. Adv., 4, https://doi.org/10.1126/sciadv.aat8785, 2018.
Barlow, J., Parry, L., Gardner, T. A., Ferreira, J., Aragão, L. E. O. C., Carmenta, R., Berenguer, E., Vieira, I. C. G., Souza, C., and Cochrane, M. A.: The critical importance of considering fire in REDD+ programs, Biol. Conserv., 154, 1–8, https://doi.org/10.1016/j.biocon.2012.03.034, 2012.
Barlow, J., França, F., Gardner, T. A., Hicks, C. C., Lennox, G. D., Berenguer, E., Castello, L., Economo, E. P., Ferreira, J., Guénard, B., Gontijo Leal, C., Isaac, V., Lees, A. C., Parr, C. L., Wilson, S. K., Young, P. J., and Graham, N. A. J.: The future of hyperdiverse tropical ecosystems, Nature, 559, 517–526, https://doi.org/10.1038/s41586-018-0301-1, 2018.
Barlow, J., Berenguer, E., Carmenta, R., and França, F.: Clarifying Amazonia's burning crisis, Glob. Change Biol., 26, 319–321, https://doi.org/10.1111/gcb.14872, 2020.
Barnes, C., Boulanger, Y., Keeping, T., Gachon, P., Gillett, N., Boucher, J., Roberge, F., Kew, S., Haas, O., Heinrich, D., Vahlberg, M., Singh, R., Elbe, M., Sivanu, S., Arrighi, J., van Aalst, M., Otto, F., Zachariah, M., Krikken, F., and Wang, X.: Climate change more than doubled the likelihood of extreme fire weather conditions in Eastern Canada, Centre for Environmental Policy, https://doi.org/10.25561/105981, 2023.
Barnes, C., Santos, F. L., Libonati, R., Keeping, T., Rodrigues, R., Alves, L. M., Sivanu, S., Vahlberg, M., Alcayna, T., Otto, F., Zachariah, M., Singh, R., Mugge, M., Biehl, J., Petryna, A., Dias, M., Reis, E., and Uzquiano, S.: Hot, dry and windy conditions that drove devastating Pantanal wildfires 40 % more intense due to climate change, Centre for Environmental Policy, https://doi.org/10.25561/113726, 2024.
Barnes, C., Keeping, T., Madakumbura, G., Abatzoglou, J., Williams, P., AghaKhouchak, A., Pinto, I., Thompson, V., Vautard, R., Lampe, S., Thiery, W., Pietroiusti, R., Otto, F., Vahlberg, M., Singh, R., Lambrou, N., Blakely, E., Zhu, Y., Li, J., Benmarhnia, T., Longcore, T., Marlier, M., Raju, E., Baumgart, N., and Arrighi, J.: Climate change increased the likelihood of wildfire disaster in highly exposed Los Angeles area, https://www.worldweatherattribution.org/wp-content/uploads/WWA-scientific-report-LA-wildfires-1.pdf (last access: 6 August 2025), 2025.
Bedia, J., Herrera, S., Gutiérrez, J. M., Benali, A., Brands, S., Mota, B., and Moreno, J. M.: Global patterns in the sensitivity of burned area to fire-weather: Implications for climate change, Agr. Forest Meteorol., 214–215, 369–379, https://doi.org/10.1016/j.agrformet.2015.09.002, 2015.
Bedia, J., Golding, N., Casanueva, A., Iturbide, M., Buontempo, C., and Gutiérrez, J. M.: Seasonal predictions of Fire Weather Index: Paving the way for their operational applicability in Mediterranean Europe, Climate Services, 9, 101–110, https://doi.org/10.1016/j.cliser.2017.04.001, 2018.
Béllo Carvalho, R., Oliveras Menor, I., Schmidt, I. B., Berlinck, C. N., Genes, L., and Dirzo, R.: Brazil on fire: Igniting awareness of the 2024 wildfire crisis, J. Environ. Manage., 389, 126190, https://doi.org/10.1016/j.jenvman.2025.126190, 2025.
Berenguer, E., Lennox, G. D., Ferreira, J., Malhi, Y., Aragão, L. E. O. C., Barreto, J. R., Del Bon Espírito-Santo, F., Figueiredo, A. E. S., França, F., Gardner, T. A., Joly, C. A., Palmeira, A. F., Quesada, C. A., Rossi, L. C., De Seixas, M. M. M., Smith, C. C., Withey, K., and Barlow, J.: Tracking the impacts of El Niño drought and fire in human-modified Amazonian forests, P. Natl. Acad. Sci. USA, 118, e2019377118, https://doi.org/10.1073/pnas.2019377118, 2021.
Betts, R. A., Belcher, S. E., Hermanson, L., Klein Tank, A., Lowe, J. A., Jones, C. D., Morice, C. P., Rayner, N. A., Scaife, A. A., and Stott, P. A.: Approaching 1.5 °C: how will we know we've reached this crucial warming mark?, Nature, 624, 33–35, https://doi.org/10.1038/d41586-023-03775-z, 2023.
Bilbao, B., Mistry, J., Millán, A., and Berardi, A.: Sharing Multiple Perspectives on Burning: Towards a Participatory and Intercultural Fire Management Policy in Venezuela, Brazil, and Guyana, Fire, 2, 39, https://doi.org/10.3390/fire2030039, 2019.
Bilbao, B., Steil, L., Urbieta, I. R., Anderson, L., Pinto, C., González, M. E., Millán, A., Falleiro, R. M., Morici, E., Ibarnegaray, V., Pérez-Salicrup, D. R., Pereira, J. M., and Moreno, J. M.: Wildfires. Adaptation to Climate Change Risks in Ibero-American Countries-RIOCCADAPT, ResearchGate, 435–496, ISBN 978-84-486-2166-7, 2020.
Bilbao, B. A., Millán, A., Luque, M. M., Mistry, J., Gómez-Martinez, R., Rivera-Lombardi, R., Méndez-Vallejo, C., León, E., Biskis, J., Gutiérrez, G., León, E., and Ancidey, B.: An intercultural vision for integrated fire management in Venezuela, Tropical Forest Issues, https://doi.org/10.55515/CNUU7417, 2022.
Billmire, M., French, N., Loboda, T., Owen, R., and Tyner, M.: Santa Ana winds and predictors of wildfire progression in Southern California, Int. J. Wildland Fire, 23, 1119–1129, https://doi.org/10.1071/WF13046, 2014.
Bolakhe, S.: Wildfires are raging in Nepal – climate change isn't the only culprit, Nature, https://doi.org/10.1038/d41586-024-01758-2, 2024.
Booth, R. C.: It's a make-or-break moment for housing in California, Vox, https://www.vox.com/housing/395049/california-lacounty-wildfires-altadena-pasadena-pacific-palisades-housing-homelessess-permitting-ceqa-coastal-rebuild (last access: 6 August 2025), 2025.
Borgschulte, M., Molitor, D., and Zou, E. Y.: Air Pollution and the Labor Market: Evidence from Wildfire Smoke, The Review of Economics and Statistics, 106, 1558–1575, https://doi.org/10.1162/rest_a_01243, 2024.
Boschetti, L. and Roy, D. P.: Defining a fire year for reporting and analysis of global interannual fire variability, J. Geophys. Res.-Biogeo., 113, G03020, https://doi.org/10.1029/2008JG000686, 2008.
Boucher, O., Servonnat, J., Albright, A. L., Aumont, O., Balkanski, Y., Bastrikov, V., Bekki, S., Bonnet, R., Bony, S., Bopp, L., Braconnot, P., Brockmann, P., Cadule, P., Caubel, A., Cheruy, F., Codron, F., Cozic, A., Cugnet, D., D'Andrea, F., Davini, P., de Lavergne, C., Denvil, S., Deshayes, J., Devilliers, M., Ducharne, A., Dufresne, J.-L., Dupont, E., Éthé, C., Fairhead, L., Falletti, L., Flavoni, S., Foujols, M.-A., Gardoll, S., Gastineau, G., Ghattas, J., Grandpeix, J.-Y., Guenet, B., Guez, E., Lionel, Guilyardi, E., Guimberteau, M., Hauglustaine, D., Hourdin, F., Idelkadi, A., Joussaume, S., Kageyama, M., Khodri, M., Krinner, G., Lebas, N., Levavasseur, G., Lévy, C., Li, L., Lott, F., Lurton, T., Luyssaert, S., Madec, G., Madeleine, J.-B., Maignan, F., Marchand, M., Marti, O., Mellul, L., Meurdesoif, Y., Mignot, J., Musat, I., Ottlé, C., Peylin, P., Planton, Y., Polcher, J., Rio, C., Rochetin, N., Rousset, C., Sepulchre, P., Sima, A., Swingedouw, D., Thiéblemont, R., Traore, A. K., Vancoppenolle, M., Vial, J., Vialard, J., Viovy, N., and Vuichard, N.: Presentation and Evaluation of the IPSL-CM6A-LR Climate Model, J. Adv. Model. Earth Sy., 12, e2019MS002010, https://doi.org/10.1029/2019MS002010, 2020.
Bowman, D., Williamson, G., Yebra, M., Lizundia-Loiola, J., Pettinari, M. L., Shah, S., Bradstock, R., and Chuvieco, E.: Wildfires: Australia needs national monitoring agency, Nature, 584, 188–191, https://doi.org/10.1038/d41586-020-02306-4, 2020.
Bowman, D. M. J. S., Moreira-Muñoz, A., Kolden, C. A., Chávez, R. O., Muñoz, A. A., Salinas, F., González-Reyes, Á., Rocco, R., de la Barrera, F., Williamson, G. J., Borchers, N., Cifuentes, L. A., Abatzoglou, J. T., and Johnston, F. H.: Human–environmental drivers and impacts of the globally extreme 2017 Chilean fires, Ambio, 48, 350–362, https://doi.org/10.1007/s13280-018-1084-1, 2019.
Bowman, D. M. J. S., Balch, J., Artaxo, P., Bond, W. J., Cochrane, M. A., D’Antonio, C. M., Defries, R., Johnston, F. H., Keeley, J. E., Krawchuk, M. A., Kull, C. A., Mack, M., Moritz, M. A., Pyne, S., Roos, C. I., Scott, A. C., Sodhi, N. S., Swetnam, T. W., and Whittaker, R.: The human dimension of fire regimes on Earth, J. Biogeogr., 38, 2223–2236, https://doi.org/10.1111/j.1365-2699.2011.02595.x, 2011.
Brando, P. M., Soares-Filho, B., Rodrigues, L., Assunção, A., Morton, D., Tuchschneider, D., Fernandes, E. C. M., Macedo, M. N., Oliveira, U., and Coe, M. T.: The gathering firestorm in southern Amazonia, Sci. Adv., 6, eaay1632, https://doi.org/10.1126/sciadv.aay1632, 2020.
Briscoe, T. and Rainey, J.: Hazardous wildfire smoke is making L.A. air hard to breathe, https://www.latimes.com/california/story/2025-01-08/wildfire-smoke-la-air-quality (last access: 6 August 2025), 2025.
Brunel, M., Rammig, A., Furquim, F., Overbeck, G., Barbosa, H. M. J., Thonicke, K., and Rolinski, S.: When do Farmers Burn Pasture in Brazil: A Model-Based Approach to Determine Burning Date, Rangeland Ecology & Management, 79, 110–125, https://doi.org/10.1016/j.rama.2021.08.003, 2021.
Bureau of Meteorology: Annual Australian Climate Statement 2023, Australian Government – Bureau of Meteorology, http://www.bom.gov.au/climate/current/annual/aus/2023/ (last access: 6 August 2025), 2024.
Bureau of Meteorology: Annual Australian Climate Statement 2024, Australian Government Bureau of Meteorology, http://www.bom.gov.au/climate/current/annual/aus/2024/ (last access: 6 August 2025), 2025.
Burrell, A. L., Sun, Q., Baxter, R., Kukavskaya, E. A., Zhila, S., Shestakova, T., Rogers, B. M., Kaduk, J., and Barrett, K.: Climate change, fire return intervals and the growing risk of permanent forest loss in boreal Eurasia, Sci. Total Environ., 831, 154885, https://doi.org/10.1016/j.scitotenv.2022.154885, 2022.
Burton, C., Kelley, D. I., Burke, E., Mathison, C., Jones, C. D., Betts, R. A., Robertson, E., Teixeira, J. C., Cardoso, M., and Anderson, L. O.: Fire weakens land carbon sinks before 1.5 °C, Nat. Geosci., 17, 1108–1114, https://doi.org/10.1038/s41561-024-01554-7, 2024a.
Burton, C., Lampe, S., Kelley, D. I., Thiery, W., Hantson, S., Christidis, N., Gudmundsson, L., Forrest, M., Burke, E., Chang, J., Huang, H., Ito, A., Kou-Giesbrecht, S., Lasslop, G., Li, W., Nieradzik, L., Li, F., Chen, Y., Randerson, J., Reyer, C. P. O., and Mengel, M.: Global burned area increasingly explained by climate change, Nat. Clim. Change, 14, 1186–1192, https://doi.org/10.1038/s41558-024-02140-w, 2024b.
Burton, C., Ciavarella, A., Kelley, D. I., Hartley, A., McCarthy, M., New, S., Betts, R. A., and Robertson, E.: Very high fire danger in UK in 2022 at least 6 times more likely due to human-caused climate change, Environ. Res. Lett., 20 044003, https://doi.org/10.1088/1748-9326/adb764, 2025.
Byrne, B., Liu, J., Bowman, K. W., Pascolini-Campbell, M., Chatterjee, A., Pandey, S., Miyazaki, K., van der Werf, G. R., Wunch, D., Wennberg, P. O., Roehl, C. M., and Sinha, S.: Carbon emissions from the 2023 Canadian wildfires, Nature, 633, 835–839, https://doi.org/10.1038/s41586-024-07878-z, 2024.
Cáceres, Z., Shimbo, J., Cáceres, S. R., da Silva, W. V., Arruda, V., and Alencar, A.: Nota técnica: Incendios forestales en el Perú 2002–2024, https://peru.mapbiomas.org/wp-content/uploads/sites/14/2024/11/Nota-tecnica_-Incendios-forestales-en-el-Peru-2002-2024-1.pdf (last access: 6 August 2025), 2024.
CALFIRE: California Department of Forestry and Fire Protection, https://www.fire.ca.gov/ (last access: 6 August 2025), 2025.
California Air Resources Board: 2025 Wildfire Air Monitoring, https://xappp.aqmd.gov/WildFireMonitoring (last access: 6 August 2025), 2025.
Calkin, D. E., Barrett, K., Cohen, J. D., Finney, M. A., Pyne, S. J., and Quarles, S. L.: Wildland-urban fire disasters aren't actually a wildfire problem, P. Natl. Acad. Sci. USA, 120, e2315797120, https://doi.org/10.1073/pnas.2315797120, 2023.
Câmara, J. and Moreira, R.: Pantanal em chamas: prejuízo causado pelo fogo no agronegócio de MS chega a R$ 1,2 bilhão, G1, https://g1.globo.com/ms/mato-grosso-do-sul/noticia/2024/09/18/pantanal-em-chamas-prejuizo-causado-pelo-fogo-no-agronegocio-de-ms-chega-a-r-12-bilhao-aponta-famasul.ghtml (last access: 6 August 2025), 2024.
Cammelli, F., Garrett, R. D., Barlow, J., and Parry, L.: Fire risk perpetuates poverty and fire use among Amazonian smallholders, Global Environmental Change, 63, 102096, https://doi.org/10.1016/j.gloenvcha.2020.102096, 2020.
Campanharo, W. A., Lopes, A. P., Anderson, L. O., Da Silva, T. F. M. R., and Aragão, L. E. O. C.: Translating Fire Impacts in Southwestern Amazonia into Economic Costs, Remote Sensing, 11, 764, https://doi.org/10.3390/rs11070764, 2019.
Campanharo, W. A., Morello, T., Christofoletti, M. A. M., and Anderson, L. O.: Hospitalization Due to Fire-Induced Pollution in the Brazilian Legal Amazon from 2005 to 2018, Remote Sensing, 14, 69, https://doi.org/10.3390/rs14010069, 2021.
Canadian Forest Service: Canadian Forest Service, Canadian Wildland Fire Information System (CWFIS), Natural Resources Canada, Canadian Forest Service, Northern Forestry Centre, Edmonton, Alberta, http://cwfis.cfs.nrcan.gc.ca (last access: 6 August 2025), 2025.
Canadell, J. G., Meyer, C. P., Cook, G. D., Dowdy, A., Briggs, P. R., Knauer, J., Pepler, A., and Haverd, V.: Multi-decadal increase of forest burned area in Australia is linked to climate change, Nat. Commun., 12, 6921, https://doi.org/10.1038/s41467-021-27225-4, 2021.
Cano-Crespo, A., Oliveira, P. J. C., Boit, A., Cardoso, M., and Thonicke, K.: Forest edge burning in the Brazilian Amazon promoted by escaping fires from managed pastures, J. Geophys. Res.-Biogeo., 120, 2095–2107, https://doi.org/10.1002/2015JG002914, 2015.
Carmenta, R., Cammelli, F., Dressler, W., Verbicaro, C., and Zaehringer, J. G.: Between a rock and a hard place: The burdens of uncontrolled fire for smallholders across the tropics, World Development, 145, 105521, https://doi.org/10.1016/j.worlddev.2021.105521, 2021.
Carmenta, R., Albuquerque, A., Anderson, L. A., Barlow, J., Caneiro, R., da Costa Dias, T., Ferreira, J., França, F., Nóbrega, J., Parry, L., Power, G., Steward, A. M., Taveres, P., and Estrada-Carmona, N.: Changes in forest food collection and hunter perceptions of Amazonian fire impacts, Ecology and Society, in press, 2025.
Carvalho, N. S., Anderson, L. O., Nunes, C. A., Pessôa, A. C. M., Silva Junior, C. H. L., Reis, J. B. C., Shimabukuro, Y. E., Berenguer, E., Barlow, J., and Aragão, L. E. O. C.: Spatio-temporal variation in dry season determines the Amazonian fire calendar, Environ. Res. Lett., 16, 125009, https://doi.org/10.1088/1748-9326/ac3aa3, 2021.
Castillo, G.: 2024: el año en que se incrementaron los incendios forestales en el Perú, RPP https://rpp.pe/peru/actualidad/2024-el-ano-en-que-se-incrementaron-los-incendios-forestales-en-el-peru-noticia-1606773 (last access: 6 August 2025), 2024.
CEMADEN: SEI/MCTI – 12227428 – Nota Técnica, https://www.gov.br/cemaden/pt-br/assuntos/monitoramento/monitoramento-de-seca-para-o-brasil/monitoramento-de-secas-e-impactos-no-brasil-agosto-2024/NOTATECNICAN529202SEICEMADENSECAS.pdf (last access: 6 August 2025), 2024.
Centro de Coordenação Regional Centro: Inventariação e valorização de danos e perdas decorrentes dos incêndios rurais em 2024, https://www.ccdrc.pt/pt/areas-de-atuacao/administracao-local/apoio-tecnico-e-financeiro/incendios-de-setembro-de-2024-na-regiao-centro/ (last access: 6 August 2025), 2024.
Centro Pinus: Impacto económico dos incêndios de 2024 na Fileira do Pinho, https://www.centropinus.org/files/upload/noticias/relatorio-centropinus-impacto-incendios-2024-fileira-pinho.pdf (last access: 6 August 2025), 2024.
Ceppi, P. and Nowack, P.: Observational evidence that cloud feedback amplifies global warming, P. Natl. Acad. Sci. USA, 118, e2026290118, https://doi.org/10.1073/pnas.2026290118, 2021.
Chakraborty, R. and Menghal, P. S.: Equatorial African Lightning: Past. Present and Future, arXiv [preprint], https://doi.org/10.48550/arXiv.2505.00392, 2025.
Chen, B., Wu, S., Jin, Y., Song, Y., Wu, C., Venevsky, S., Xu, B., Webster, C., and Gong, P.: Wildfire risk for global wildland–urban interface areas, Nat. Sustain., 7, 474–484, https://doi.org/10.1038/s41893-024-01291-0, 2024.
Chen, G., Guo, Y., Yue, X., Tong, S., Gasparrini, A., Bell, M. L., Armstrong, B., Schwartz, J., Jaakkola, J. J. K., Zanobetti, A., Lavigne, E., Saldiva, P. H. N., Kan, H., Royé, D., Milojevic, A., Overcenco, A., Urban, A., Schneider, A., Entezari, A., Vicedo-Cabrera, A. M., Zeka, A., Tobias, A., Nunes, B., Alahmad, B., Forsberg, B., Pan, S.-C., Íñiguez, C., Ameling, C., Valencia, C. D. la C., Åströ m, C., Houthuijs, D., Dung, D. V., Samoli, E., Mayvaneh, F., Sera, F., Carrasco-Escobar, G., Lei, Y., Orru, H., Kim, H., Holobaca, I.-H., Kyselý, J., Teixeira, J. P., Madureira, J., Katsouyanni, K., Hurtado-Díaz, M., Maasikmets, M., Ragettli, M. S., Hashizume, M., Stafoggia, M., Pascal, M., Scortichini, M., Coêlho, M. de S. Z. S., Ortega, N. V., Ryti, N. R. I., Scovronick, N., Matus, P., Goodman, P., Garland, R. M., Abrutzky, R., Garcia, S. O., Rao, S., Fratianni, S., Dang, T. N., Colistro, V., Huber, V., Lee, W., Seposo, X., Honda, Y., Guo, Y. L., Ye, T., Yu, W., Abramson, M. J., Samet, J. M., and Li, S.: Mortality risk attributable to wildfire-related PM2.5 pollution: a global time series study in 749 locations, The Lancet Planetary Health, 5, e579–e587, https://doi.org/10.1016/S2542-5196(21)00200-X, 2021.
Chen, Y., Morton, D. C., Andela, N., van der Werf, G. R., Giglio, L., and Randerson, J. T.: A pan-tropical cascade of fire driven by El Niño/Southern Oscillation, Nat. Clim. Change, 7, 906–911, https://doi.org/10.1038/s41558-017-0014-8, 2017.
Chen, Y., Hall, J., van Wees, D., Andela, N., Hantson, S., Giglio, L., van der Werf, G. R., Morton, D. C., and Randerson, J. T.: Multi-decadal trends and variability in burned area from the fifth version of the Global Fire Emissions Database (GFED5), Earth Syst. Sci. Data, 15, 5227–5259, https://doi.org/10.5194/essd-15-5227-2023, 2023.
Chuvieco, E., Roteta, E., Sali, M., Stroppiana, D., Boettcher, M., Kirches, G., Storm, T., Khairoun, A., Pettinari, M. L., Franquesa, M., and Albergel, C.: Building a small fire database for Sub-Saharan Africa from Sentinel-2 high-resolution images, Sci. Total Environ., 845, 157139, https://doi.org/10.1016/j.scitotenv.2022.157139, 2022.
Chuvieco, E., Yebra, M., Martino, S., Thonicke, K., Gómez-Giménez, M., San-Miguel, J., Oom, D., Velea, R., Mouillot, F., Molina, J. R., Miranda, A. I., Lopes, D., Salis, M., Bugaric, M., Sofiev, M., Kadantsev, E., Gitas, I. Z., Stavrakoudis, D., Eftychidis, G., Bar-Massada, A., Neidermeier, A., Pampanoni, V., Pettinari, M. L., Arrogante-Funes, F., Ochoa, C., Moreira, B., and Viegas, D.: Towards an Integrated Approach to Wildfire Risk Assessment: When, Where, What and How May the Landscapes Burn, Fire, 6, 215, https://doi.org/10.3390/fire6050215, 2023.
Ciais, P., Bastos, A., Chevallier, F., Lauerwald, R., Poulter, B., Canadell, J. G., Hugelius, G., Jackson, R. B., Jain, A., Jones, M., Kondo, M., Luijkx, I. T., Patra, P. K., Peters, W., Pongratz, J., Petrescu, A. M. R., Piao, S., Qiu, C., Von Randow, C., Regnier, P., Saunois, M., Scholes, R., Shvidenko, A., Tian, H., Yang, H., Wang, X., and Zheng, B.: Definitions and methods to estimate regional land carbon fluxes for the second phase of the REgional Carbon Cycle Assessment and Processes Project (RECCAP-2), Geosci. Model Dev., 15, 1289–1316, https://doi.org/10.5194/gmd-15-1289-2022, 2022.
Ciavarella, A., Christidis, N., Andrews, M., Groenendijk, M., Rostron, J., Elkington, M., Burke, C., Lott, F. C., and Stott, P. A.: Upgrade of the HadGEM3-A based attribution system to high resolution and a new validation framework for probabilistic event attribution, Weather and Climate Extremes, 20, 9–32, https://doi.org/10.1016/j.wace.2018.03.003, 2018.
Ciudad CCS: Venezuela combate incendios forestales sin precedentes, https://ciudadccs.info/publicacion/16957 (last access: 6 August 2025), 2024.
Clarke, B., Otto, F., Stuart-Smith, R., and Harrington, L.: Extreme weather impacts of climate change: an attribution perspective, Environ. Res. Clim., 1, 012001, https://doi.org/10.1088/2752-5295/ac6e7d, 2022.
CNM: Boletim de outubro 2024: Situação de emergência municipal por incêndios florestais Confederação Nacional de Municípios, https://cnm.org.br/storage/biblioteca/2024/Boletins/202410_BOL_DEF_outubro_2024.pdf (last access: 6 August 2025), 2024.
Comisión Nacional Forestal: Cierre Estadístico 2024: Coordinación General de Conservación y Restauración Gerencia de Manejo del Fuego 01 de enero al 31 de diciembre de 2024, https://www.gob.mx/conafor/documentos/reporte-semanal-de-incendios (last access: 6 August 2025), 2025.
Comité National de Défense de la Forêt et de lutte contre les feux de Brousse (CNDFB): Rapport 2024 et mi-2025, https://afriksoir.net/feux-de-brousse-en-cote-divoire-de-janvier-a-avril-2025-le-bilan-de-4-mois-est-sans-appel/#:~:text=Pour%20cette %20ann%C3%A9e%202025%20;%20au (last access: 6 August 2025), 2025.
Conte, M. N. and Kotchen, M. J.: EXPLAINING THE PRICE OF VOLUNTARY CARBON OFFSETS, Clim. Change Econ., 01, 93–111, https://doi.org/10.1142/s2010007810000091, 2010.
Copernicus Atmosphere Monitoring Services (CAMS): Canada wildfire season begins with major British Columbia blaze, https://atmosphere.copernicus.eu/canada-wildfire-season-begins-major-british-columbia-blaze, (last access: 6 August 2025), 2024a.
Copernicus Atmospheric Monitoring Services (CAMS): CAMS global system tracks exceptional air pollution episode in South Asia, https://atmosphere.copernicus.eu/cams-global-system-tracks-exceptional-air-pollution-episode-south-asia (last access: 6 August 2025), 2024b.
Copernicus Climate Change Service: ERA5-Land hourly data from 1950 to present, Copernicus Climate Change Service (C3S) Climate Data Store (CDS) [data set], https://doi.org/10.24381/CDS.E2161BAC, 2019.
Copernicus Climate Change Service (C3S): Surface air temperature for May 2025, https://climate.copernicus.eu/surface-air-temperature-may-2025 (last access: 6 August 2025), 2025.
County of Los Angeles Medical Examiner: WILDFIRES UPDATE | 30th Death Related to the January Wildfires Confirmed, https://me.lacounty.gov/2025/press-releases/wildfires-update-30th-death-related-to-the-january-wildfires-confirmed/ (last access: 6 August 2025), 2025.
Croker, A. R., Woods, J., and Kountouris, Y.: Community-Based Fire Management in East and Southern African Savanna-Protected Areas: A Review of the Published Evidence, Earth's Future, 11, e2023EF003552, https://doi.org/10.1029/2023EF003552, 2023.
Csiszar, I., Schroeder, W., Giglio, L., Ellicott, E., Vadrevu, K. P., Justice, C. O., and Wind, B.: Active fires from the Suomi NPP Visible Infrared Imaging Radiometer Suite: Product status and first evaluation results, J. Geophys. Res.-Atmos., 119, 803–816, https://doi.org/10.1002/2013JD020453, 2014.
Cunningham, C. X., Abatzoglou, J. T., Kolden, C. A., Williamson, G. J., Steuer, M., and Bowman, D. M. J. S.: Climate-linked escalation of societally disastrous wildfires, Science, 390, 53–58, https://doi.org/10.1126/science.adr5127, 2025.
Cunningham, C. X., Williamson, G. J., and Bowman, D. M. J. S.: Increasing frequency and intensity of the most extreme wildfires on Earth, Nat. Ecol. Evol., 1–6, https://doi.org/10.1038/s41559-024-02452-2, 2024b.
Dalton, R., Bury, L., Robertson, F., and Perkins, R.: LA wildfire insured loss estimates creep to $40bn+, https://www.insuranceinsider.com/article/2efppeiico48uc4c23xts/all-topics/catastrophe-losses/la-wildfire-insured-loss-estimates-creep-to-40bn?zephr_sso_ott=JQ2le5 (last access: 6 August 2025), 2025.
Damasceno-Junior, G. A., Pereira, A. de M. M., Oldeland, J., Parolin, P., and Pott, A.: Fire, Flood and Pantanal Vegetation, in: Flora and Vegetation of the Pantanal Wetland, edited by: Damasceno-Junior, G. A. and Pott, A., Springer International Publishing, Cham, 661–688, https://doi.org/10.1007/978-3-030-83375-6_18, 2021.
Davis, U. C.: Global Administative Areas Database [data set], https://gadm.org/download_world.html (last access: 6 August 2025), 2022.
Delforge, D., Wathelet, V., Below, R., Sofia, C. L., Tonnelier, M., van Loenhout, J. A. F., and Speybroeck, N.: EM-DAT: the Emergency Events Database, International Journal of Disaster Risk Reduction, 124, 105509, https://doi.org/10.1016/j.ijdrr.2025.105509, 2025.
Deutsche Welle: Germany: Hundreds evacuated due to Harz Mountains fire https://www.dw.com/en/germany-hundreds-evacuated-due-to-harz-mountains-fire/a-70159334 (last access: 6 August 2025), 2024.
Di Giuseppe, F.: Accounting for fuel in fire danger forecasts: the fire occurrence probability index (FOPI), Environ. Res. Lett., 18, 064029, https://doi.org/10.1088/1748-9326/acd2ee, 2023.
Di Giuseppe, F.: Global data-driven prediction of fire activity, Code Ocean [code and data set], https://doi.org/10.24433/CO.8570224.V1, 2025.
Di Giuseppe, F., Pappenberger, F., Wetterhall, F., Krzeminski, B., Camia, A., Libertá, G., and San Miguel, J.: The Potential Predictability of Fire Danger Provided by Numerical Weather Prediction, J. Appl. Meteorol. Clim., 55, 2469–2491, https://doi.org/10.1175/JAMC-D-15-0297.1, 2016.
Di Giuseppe, F., Vitolo, C., Barnard, C., Libertá, G., Maciel, P., San-Miguel-Ayanz, J., Villaume, S., and Wetterhall, F.: Global seasonal prediction of fire danger, Sci. Data, 11, 128, https://doi.org/10.1038/s41597-024-02948-3, 2024.
Di Giuseppe, F., McNorton, J., Lombardi, A., and Wetterhall, F.: Global data-driven prediction of fire activity, Nat. Commun., 16, 2918, https://doi.org/10.1038/s41467-025-58097-7, 2025.
Directorate-General for European Civil Protection and Humanitarian Aid Operations: European Civil Protection and Humanitarian Aid Operations https://civil-protection-humanitarian-aid.ec.europa.eu/index_en (last access: 6 August 2025), 2024.
Di Virgilio, G., Evans, J. P., Clarke, H., Sharples, J., Hirsch, A. L., and Hart, M. A.: Climate Change Significantly Alters Future Wildfire Mitigation Opportunities in Southeastern Australia, Geophys. Res. Lett., 47, e2020GL088893, https://doi.org/10.1029/2020GL088893, 2020.
Ding, R.: Let it burn: Why China is looking the other way on farm fires, Sixth Tone, https://www.sixthtone.com/news/1016586 (last access: 6 August 2025), 2025.
Doerr, S. H. and Santín, C.: Global trends in wildfire and its impacts: perceptions versus realities in a changing world, Phil. Trans. R. Soc. B, 371, 20150345, https://doi.org/10.1098/rstb.2015.0345, 2016.
Dou, C., Tang, Y., Jiang, N., Yan, L., and Ding, H.: Analysis of Sichuan wildfire based on the first synergetic observation from three payloads of SDGSAT-1, The Innovation, 5, 100707, https://doi.org/10.1016/j.xinn.2024.100707, 2024.
Douffı, K. G., Yao, A. C., Koffı, K. J., Traore, A. S., and Kone, M.: Afforestation in Response to Thermal Change in the Forest-Savannah Transition of the Lamto Scientific Reserve, Côte d'Ivoire, Eur. J. Forest Eng., 7, 45–56, https://doi.org/10.33904/ejfe.978520, 2021.
Dowdy, A. and Brown, A.: Broadscale thunderstorm environment dataset intended for climate analysis, Front. Clim., 7, https://doi.org/10.3389/fclim.2025.1539873, 2025.
Doxsey-Whitfield, E., MacManus, K., Adamo, S. B., Pistolesi, L., Squires, J., Borkovska, O., and Baptista, S. R.: Taking Advantage of the Improved Availability of Census Data: A First Look at the Gridded Population of the World, Version 4, Papers in Applied Geography, 1, 226–234, https://doi.org/10.1080/23754931.2015.1014272, 2015.
Driscoll, D. A., Macdonald, K. J., Gibson, R. K., Doherty, T. S., Nimmo, D. G., Nolan, R. H., Ritchie, E. G., Williamson, G. J., Heard, G. W., Tasker, E. M., Bilney, R., Porch, N., Collett, R. A., Crates, R. A., Hewitt, A. C., Pendall, E., Boer, M. M., Gates, J., Boulton, R. L., Mclean, C. M., Groffen, H., Maisey, A. C., Beranek, C. T., Ryan, S. A., Callen, A., Hamer, A. J., Stauber, A., Daly, G. J., Gould, J., Klop-Toker, K. L., Mahony, M. J., Kelly, O. W., Wallace, S. L., Stock, S. E., Weston, C. J., Volkova, L., Black, D., Gibb, H., Grubb, J. J., McGeoch, M. A., Murphy, N. P., Lee, J. S., Dickman, C. R., Neldner, V. J., Ngugi, M. R., Miritis, V., Köhler, F., Perri, M., Denham, A. J., Mackenzie, B. D. E., Reid, C. A. M., Rayment, J. T., Arriaga-Jiménez, A., Hewins, M. W., Hicks, A., Melbourne, B. A., Davies, K. F., Bitters, M. E., Linley, G. D., Greenville, A. C., Webb, J. K., Roberts, B., Letnic, M., Price, O. F., Walker, Z. C., Murray, B. R., Verhoeven, E. M., Thomsen, A. M., Keith, D., Lemmon, J. S., Ooi, M. K. J., Allen, V. L., Decker, O. T., Green, P. T., Moussalli, A., Foon, J. K., Bryant, D. B., Walker, K. L., Bruce, M. J., Madani, G., Tscharke, J. L., Wagner, B., Nitschke, C. R., Gosper, C. R., Yates, C. J., Dillon, R., Barrett, S., Spencer, E. E., Wardle, G. M., Newsome, T. M., Pulsford, S. A., Singh, A., Roff, A., Marsh, K. J., Mcdonald, K., Howell, L. G., Lane, M. R., Cristescu, R. H., Witt, R. R., Cook, E. J., Grant, F., Law, B. S., Seddon, J., Berris, K. K., Shofner, R. M., Barth, M., Welz, T., Foster, A., Hancock, D., Beitzel, M., Tan, L. X. L., Waddell, N. A., Fallow, P. M., Schweickle, L., Le Breton, T. D., Dunne, C., Green, M., Gilpin, A.-M., Cook, J. M., Power, S. A., Hogendoorn, K., Brawata, R., Jolly, C. J., Tozer, M., Reiter, N., and Phillips, R. D.: Biodiversity impacts of the 2019–2020 Australian megafires, Nature, 635, 898–905, https://doi.org/10.1038/s41586-024-08174-6, 2024.
Dwomoh, F. K., Wimberly, M. C., Cochrane, M. A., and Numata, I.: Forest degradation promotes fire during drought in moist tropical forests of Ghana, Forest Ecol. Manage., 440, 158–168, https://doi.org/10.1016/j.foreco.2019.03.014, 2019.
Eberenz, S., Stocker, D., Röösli, T., and Bresch, D. N.: Asset exposure data for global physical risk assessment, Earth Syst. Sci. Data, 12, 817–833, https://doi.org/10.5194/essd-12-817-2020, 2020.
ECMWF: Observation and ERA5-Land derived 9 km global daily fire fuel characteristics since 2003, ECMWF [data set], https://doi.org/10.24381/378D1497, 2025.
El Deber: En 2024 se quemaron 14 millones de hectáreas en el país; más de la mitad en bosque https://eldeber.com.bo/pais/en-2024-se-quemaron-14-millones-de-ha-en-el-pais-mas-de-la-mitad-en-bosque_501689 (last access: 6 August 2025), 2025.
Eschenbacher, S.: Brazil's Amazon rainforest fires in August reach 14-year high, https://www.reuters.com/world/americas/brazils-amazon-rainforest-fires-august-reach-14-year-high-2024-09-01/ (last access: 6 August 2025), 2024.
EU Eurostat: Countries – GISCO – Eurostat, https://ec.europa.eu/eurostat/web/gisco/geodata/reference-data/administrative-units-statistical-units/countries (last access: 6 August 2025), 2020
Euronews: At least 20 wildfires burn across parts of North Macedonia's south, Euronews, https://www.euronews.com/my-europe/2024/07/20/battle-against-flames-ongoing-in-north-macedonia-with-international-support (last access: 6 August 2025), 2024.
European Centre for Medium-Range Weather Forecasts (ECMWF): Copernicus Atmospheric Monitoring Service (CAMS) global biomass burning emissions based on fire radiative power (GFAS): data documentation, https://confluence.ecmwf.int/display/CKB/CAMS+global+ biomass+burning+emissions+based+on+fire+radiative+power +%28GFAS%29%3A+data+documentation (last access: 6 August 2025), 2024.
European Commission Emergency Response Coordination Centre: Maps, https://erccportal.jrc.ec.europa.eu/ECHO-Products/Maps#/maps/latest (last access date: 6 August 2025), 2025.
European Commission Joint Research Centre: Forest fires in Europe, Middle East and North Africa 2022 [JRC135226], Publications Office of the European Union, Luxembourg, https://doi.org/10.2760/348120, 2023.
European Commission Joint Research Centre: Forest fires in Europe, Middle East and North Africa 2023 [JRC139704], Publications Office of the European Union, Luxembourg, https://doi.org/10.2760/8027062, 2024.
European Commission Joint Research Centre: Drought over large parts of Europe raises concern, https://joint-research-centre.ec.europa.eu/jrc-news-and-updates/drought-over-large-parts-europe-raises-concern-2025-05-05_en (last access: 6 August 2025), 2025.
European Forest Fire Information System: European Forest Fire Information System (EFFIS), https://forest-fire.emergency.copernicus.eu/ (last access: 6 August 2025), 2025.
Fang, T., Hwang, B. C. H., Kapur, S., Hopstock, K. S., Wei, J., Nguyen, V., Nizkorodov, S. A., and Shiraiwa, M.: Wildfire particulate matter as a source of environmentally persistent free radicals and reactive oxygen species, Environ. Sci. Atmos., 3, 581–594, https://doi.org/10.1039/D2EA00170E, 2023.
Faranda, D., Alvarez-Castro, M. C., Alberti, T., and Cazzaniga, G.: March 2025 Japan and South Korea wildfires have been fueled by meteorological conditions likely strengthened by human-driven climate change, ClimaMeter, Institut Pierre Simon Laplace, CNRS, Zenodo [report], https://doi.org/10.5281/zenodo.15083384, 2025.
Fernandes, P. M. and Botelho, H. S.: A review of prescribed burning effectiveness in fire hazard reduction, Int. J. Wildland Fire, 12, 117–128, https://doi.org/10.1071/wf02042, 2003.
Fernandes, P. M., Davies, G. M., Ascoli, D., Fernández, C., Moreira, F., Rigolot, E., Stoof, C. R., Vega, J. A., and Molina, D.: Prescribed burning in southern Europe: developing fire management in a dynamic landscape, Frontiers in Ecology and the Environment, 11, e4–e14, https://doi.org/10.1890/120298, 2013.
Feron, S., Cordero, R. R., Damiani, A., MacDonell, S., Pizarro, J., Goubanova, K., Valenzuela, R., Wang, C., Rester, L., and Beaulieu, A.: South America is becoming warmer, drier, and more flammable, Commun. Earth Environ., 5, 501, https://doi.org/10.1038/s43247-024-01654-7, 2024.
Ferreira, N.: Corremos o risco de estar a fazer desaparecer espécies ainda não descritas, PÚBLICO, https://www.publico.pt/2024/08/20/azul/noticia/laurissilva-madeira-corremos-risco-estar-desaparecer-especies-nao-descritas-2101375 (last access: 6 August 2025), 2024.
Finney, D. L., Doherty, R. M., Wild, O., Stevenson, D. S., MacKenzie, I. A., and Blyth, A. M.: A projected decrease in lightning under climate change, Nat. Clim. Change, 8, 210–213, https://doi.org/10.1038/s41558-018-0072-6, 2018.
Flemming, J., Huijnen, V., Arteta, J., Bechtold, P., Beljaars, A., Blechschmidt, A.-M., Diamantakis, M., Engelen, R. J., Gaudel, A., Inness, A., Jones, L., Josse, B., Katragkou, E., Marecal, V., Peuch, V.-H., Richter, A., Schultz, M. G., Stein, O., and Tsikerdekis, A.: Tropospheric chemistry in the Integrated Forecasting System of ECMWF, Geosci. Model Dev., 8, 975–1003, https://doi.org/10.5194/gmd-8-975-2015, 2015.
Foley, J. A., DeFries, R., Asner, G. P., Barford, C., Bonan, G., Carpenter, S. R., Chapin, F. S., Coe, M. T., Daily, G. C., Gibbs, H. K., Helkowski, J. H., Holloway, T., Howard, E. A., Kucharik, C. J., Monfreda, C., Patz, J. A., Prentice, I. C., Ramankutty, N., and Snyder, P. K.: Global Consequences of Land Use, Science, 309, 570–574, https://doi.org/10.1126/science.1111772, 2005.
Fonseca Morello, T., Marchetti Ramos, R., O. Anderson, L., Owen, N., Rosan, T. M., and Steil, L.: Predicting fires for policy making: Improving accuracy of fire brigade allocation in the Brazilian Amazon, Ecological Economics, 169, 106501, https://doi.org/10.1016/j.ecolecon.2019.106501, 2020.
Food and Agriculture Organization of the United Nations: Global Fire Management Hub, https://www.fao.org/partnerships/fire-hub/en (last access: 6 August 2025), 2024.
Forster, P. M., Smith, C., Walsh, T., Lamb, W. F., Lamboll, R., Cassou, C., Hauser, M., Hausfather, Z., Lee, J.-Y., Palmer, M. D., von Schuckmann, K., Slangen, A. B. A., Szopa, S., Trewin, B., Yun, J., Gillett, N. P., Jenkins, S., Matthews, H. D., Raghavan, K., Ribes, A., Rogelj, J., Rosen, D., Zhang, X., Allen, M., Aleluia Reis, L., Andrew, R. M., Betts, R. A., Borger, A., Broersma, J. A., Burgess, S. N., Cheng, L., Friedlingstein, P., Domingues, C. M., Gambarini, M., Gasser, T., Gütschow, J., Ishii, M., Kadow, C., Kennedy, J., Killick, R. E., Krummel, P. B., Liné, A., Monselesan, D. P., Morice, C., Mühle, J., Naik, V., Peters, G. P., Pirani, A., Pongratz, J., Minx, J. C., Rigby, M., Rohde, R., Savita, A., Seneviratne, S. I., Thorne, P., Wells, C., Western, L. M., van der Werf, G. R., Wijffels, S. E., Masson-Delmotte, V., and Zhai, P.: Indicators of Global Climate Change 2024: annual update of key indicators of the state of the climate system and human influence, Earth Syst. Sci. Data, 17, 2641–2680, https://doi.org/10.5194/essd-17-2641-2025, 2025.
Freeborn, P. H., Wooster, M. J., Roy, D. P., and Cochrane, M. A.: Quantification of MODIS fire radiative power (FRP) measurement uncertainty for use in satellite-based active fire characterization and biomass burning estimation, Geophys. Res. Lett., 41, 1988–1994, https://doi.org/10.1002/2013GL059086, 2014.
Friedlingstein, P., O'Sullivan, M., Jones, M. W., Andrew, R. M., Hauck, J., Landschützer, P., Le Quéré, C., Li, H., Luijkx, I. T., Olsen, A., Peters, G. P., Peters, W., Pongratz, J., Schwingshackl, C., Sitch, S., Canadell, J. G., Ciais, P., Jackson, R. B., Alin, S. R., Arneth, A., Arora, V., Bates, N. R., Becker, M., Bellouin, N., Berghoff, C. F., Bittig, H. C., Bopp, L., Cadule, P., Campbell, K., Chamberlain, M. A., Chandra, N., Chevallier, F., Chini, L. P., Colligan, T., Decayeux, J., Djeutchouang, L. M., Dou, X., Duran Rojas, C., Enyo, K., Evans, W., Fay, A. R., Feely, R. A., Ford, D. J., Foster, A., Gasser, T., Gehlen, M., Gkritzalis, T., Grassi, G., Gregor, L., Gruber, N., Gürses, Ö., Harris, I., Hefner, M., Heinke, J., Hurtt, G. C., Iida, Y., Ilyina, T., Jacobson, A. R., Jain, A. K., Jarníková, T., Jersild, A., Jiang, F., Jin, Z., Kato, E., Keeling, R. F., Klein Goldewijk, K., Knauer, J., Korsbakken, J. I., Lan, X., Lauvset, S. K., Lefèvre, N., Liu, Z., Liu, J., Ma, L., Maksyutov, S., Marland, G., Mayot, N., McGuire, P. C., Metzl, N., Monacci, N. M., Morgan, E. J., Nakaoka, S.-I., Neill, C., Niwa, Y., Nützel, T., Olivier, L., Ono, T., Palmer, P. I., Pierrot, D., Qin, Z., Resplandy, L., Roobaert, A., Rosan, T. M., Rödenbeck, C., Schwinger, J., Smallman, T. L., Smith, S. M., Sospedra-Alfonso, R., Steinhoff, T., Sun, Q., Sutton, A. J., Séférian, R., Takao, S., Tatebe, H., Tian, H., Tilbrook, B., Torres, O., Tourigny, E., Tsujino, H., Tubiello, F., van der Werf, G., Wanninkhof, R., Wang, X., Yang, D., Yang, X., Yu, Z., Yuan, W., Yue, X., Zaehle, S., Zeng, N., and Zeng, J.: Global Carbon Budget 2024, Earth Syst. Sci. Data, 17, 965–1039, https://doi.org/10.5194/essd-17-965-2025, 2025.
Frieler, K., Volkholz, J., Lange, S., Schewe, J., Mengel, M., del Rocío Rivas López, M., Otto, C., Reyer, C. P. O., Karger, D. N., Malle, J. T., Treu, S., Menz, C., Blanchard, J. L., Harrison, C. S., Petrik, C. M., Eddy, T. D., Ortega-Cisneros, K., Novaglio, C., Rousseau, Y., Watson, R. A., Stock, C., Liu, X., Heneghan, R., Tittensor, D., Maury, O., Büchner, M., Vogt, T., Wang, T., Sun, F., Sauer, I. J., Koch, J., Vanderkelen, I., Jägermeyr, J., Müller, C., Rabin, S., Klar, J., Vega del Valle, I. D., Lasslop, G., Chadburn, S., Burke, E., Gallego-Sala, A., Smith, N., Chang, J., Hantson, S., Burton, C., Gädeke, A., Li, F., Gosling, S. N., Müller Schmied, H., Hattermann, F., Wang, J., Yao, F., Hickler, T., Marcé, R., Pierson, D., Thiery, W., Mercado-Bettín, D., Ladwig, R., Ayala-Zamora, A. I., Forrest, M., and Bechtold, M.: Scenario setup and forcing data for impact model evaluation and impact attribution within the third round of the Inter-Sectoral Impact Model Intercomparison Project (ISIMIP3a), Geosci. Model Dev., 17, 1–51, https://doi.org/10.5194/gmd-17-1-2024, 2024.
Frieler, K., Lange, S., Schewe, J., Mengel, M., Treu, S., Otto, C., Volkholz, J., Reyer, C. P. O., Heinicke, S., Jones, C., Blanchard, J. L., Harrison, C. S., Petrik, C. M., Eddy, T. D., Ortega-Cisneros, K., Novaglio, C., Heneghan, R., Tittensor, D. P., Maury, O., Büchner, M., Vogt, T., Quesada Chacón, D., Emanuel, K., Lee, C.-Y., Camargo, S. J., Jägermeyr, J., Rabin, S., Klar, J., Vega del Valle, I. D., Novak, L., Sauer, I. J., Lasslop, G., Chadburn, S., Burke, E., Gallego-Sala, A., Smith, N., Chang, J., Hantson, S., Burton, C., Gädeke, A., Li, F., Gosling, S. N., Müller Schmied, H., Hattermann, F., Hickler, T., Marcé, R., Pierson, D., Thiery, W., Mercado-Bettín, D., Ladwig, R., Ayala-Zamora, A. I., Forrest, M., Bechtold, M., Reinecke, R., de Graaf, I., Kaplan, J. O., Koch, A., and Lengaigne, M.: Scenario set-up and the new CMIP6-based climate-related forcings provided within the third round of the Inter-Sectoral Model Intercomparison Project (ISIMIP3b, group I and II), EGUsphere [preprint], https://doi.org/10.5194/egusphere-2025-2103, 2025.
Frölicher, T. L. and Laufkötter, C.: Emerging risks from marine heat waves, Nat. Commun., 9, 650, https://doi.org/10.1038/s41467-018-03163-6, 2018.
Fundación Tierra: Reporte de incendios 2024, https://www.ftierra.org/index.php/publicacion/documentos-de-trabajo/attachment/254/52 (last access: 6 August 2025), 2024.
Fundación Tierra: Incendios forestales 2024, Tras las huellas del fuego, TIERRA, https://ftierra.org/index.php/publicacion/libro/258-incendios-forestales-2024-tras-las-huellas-del-fuego (last access: 6 August 2025), 2025.
Gabriel, H.: Algeria extinguishes 26 fires in past 24 hours, Anadolu Ajansi, https://www.aa.com.tr/en/africa/algeria-extinguishes-26-fires-in-past-24-hours/3282209 (last access: 6 August 2025), 2024.
Garcin, Y., Schefuß, E., Dargie, G. C., Hawthorne, D., Lawson, I. T., Sebag, D., Biddulph, G. E., Crezee, B., Bocko, Y. E., Ifo, S. A., Mampouya Wenina, Y. E., Mbemba, M., Ewango, C. E. N., Emba, O., Bola, P., Kanyama Tabu, J., Tyrrell, G., Young, D. M., Gassier, G., Girkin, N. T., Vane, C. H., Adatte, T., Baird, A. J., Boom, A., Gulliver, P., Morris, P. J., Page, S. E., Sjögersten, S., and Lewis, S. L.: Hydroclimatic vulnerability of peat carbon in the central Congo Basin, Nature, 612, 277–282, https://doi.org/10.1038/s41586-022-05389-3, 2022.
Garnett, S. T., Burgess, N. D., Fa, J. E., Fernández-Llamazares, Á., Molnár, Z., Robinson, C. J., Watson, J. E. M., Zander, K. K., Austin, B., Brondizio, E. S., Collier, N. F., Duncan, T., Ellis, E., Geyle, H., Jackson, M. V., Jonas, H., Malmer, P., McGowan, B., Sivongxay, A., and Leiper, I.: A spatial overview of the global importance of Indigenous lands for conservation, Nat. Sustain., 1, 369–374, https://doi.org/10.1038/s41893-018-0100-6, 2018.
Garreaud, R. D., Alvarez-Garreton, C., Barichivich, J., Boisier, J. P., Christie, D., Galleguillos, M., LeQuesne, C., McPhee, J., and Zambrano-Bigiarini, M.: The 2010–2015 megadrought in central Chile: impacts on regional hydroclimate and vegetation, Hydrol. Earth Syst. Sci., 21, 6307–6327, https://doi.org/10.5194/hess-21-6307-2017, 2017.
Garrett, M. G.: Wildfires are breaking out in Southern California as the “most destructive windstorm” in over a decade hits, https://www.cnn.com/2025/01/07/weather/california-windstorm-fire-los-angeles-climate, CNN (last access: 6 August 2025), 2025.
Garrido, B.: Mais de 80 % dos focos de calor em SP foram em áreas produtivas, IPAM Amazônia, https://ipam.org.br/focos-de-calor-sp/ (last access: 6 August 2025), 2024.
Gatti, L. V., Basso, L. S., Miller, J. B., Gloor, M., Gatti Domingues, L., Cassol, H. L. G., Tejada, G., Aragão, L. E. O. C., Nobre, C., Peters, W., Marani, L., Arai, E., Sanches, A. H., Corrêa, S. M., Anderson, L., Von Randow, C., Correia, C. S. C., Crispim, S. P., and Neves, R. A. L.: Amazonia as a carbon source linked to deforestation and climate change, Nature, 595, 388–393, https://doi.org/10.1038/s41586-021-03629-6, 2021.
Gayle, D.: Forest fires push up greenhouse gas emissions from war in Ukraine, The Guardian, https://www.theguardian.com/world/2025/feb/24/forest-fires-push-up-greenhouse-gas-emissions-from-war-in-ukraine (last access: 6 August 2025), 2025.
Giannaros, T., Papavasileiou, G., Lagouvardos, K., Georgiadis, N., Athanassakis, G., and Tziritis, E.: 2024 Fire Season Report – Greece, https://wwfeu.awsassets.panda.org/downloads/202412_fire_season_annual_report_noa_wwf.pdf (last access: 6 August 2025), 2025.
Giglio, L.: VIIRS/NPP Burned Area Monthly L4 Global 500 m SIN Grid V002, NASA EOSDIS Land Processes Distributed Active Archive Center [data set], https://doi.org/10.5067/VIIRS/VNP64A1.002, 2024.
Giglio, L., van der Werf, G. R., Randerson, J. T., Collatz, G. J., and Kasibhatla, P.: Global estimation of burned area using MODIS active fire observations, Atmos. Chem. Phys., 6, 957–974, https://doi.org/10.5194/acp-6-957-2006, 2006.
Giglio, L., Randerson, J. T., and van der Werf, G. R.: Analysis of daily, monthly, and annual burned area using the fourth-generation global fire emissions database (GFED4), J. Geophys. Res.-Biogeo., 118, 317–328, https://doi.org/10.1002/jgrg.20042, 2013.
Giglio, L., Schroeder, W., and Justice, C. O.: The collection 6 MODIS active fire detection algorithm and fire products, Remote Sens. Environ., 178, 31–41, https://doi.org/10.1016/j.rse.2016.02.054, 2016.
Giglio, L., Boschetti, L., Roy, D. P., Humber, M. L., and Justice, C. O.: The Collection 6 MODIS burned area mapping algorithm and product, Remote Sens. Environ., 217, 72–85, https://doi.org/10.1016/j.rse.2018.08.005, 2018.
Giglio, L., Justice, C., Boschetti, L., and Roy, D.: MODIS/Terra+Aqua Burned Area Monthly L3 Global 500 m SIN Grid V061, NASA EOSDIS Land Processes Distributed Active Archive Center [data set], https://doi.org/10.5067/MODIS/MCD64A1.061, 2021.
Gill, B. and Britz-McKibbin, P.: Biomonitoring of smoke exposure in firefighters: A review, Current Opinion in Environmental Science and Health, 15, 57–65, https://doi.org/10.1016/j.coesh.2020.04.002, 2020.
Global Fire Emissions Database (GFED): Global Fire Emissions Database: Data Pages, https://www.globalfiredata.org/index.html (last access: 6 August 2025), 2024.
Global Fire Monitoring Center: Iran News: Wildfires ravage Iran's forests amidst drought and systemic negligence, https://gfmc.online/2024/06-2024/iran-news-wildfires-ravage-irans-forests-amidst-drought-and-systemic-negligence.html (last access: 6 August 2025), 2024.
Global Times: China initiates Level-IV emergency response to wildfire in SW China's Sichuan, https://www.globaltimes.cn/page/202403/1308958.shtml (last access: 6 August 2025), 2024.
Global Wildfire Information System: Global Wildfire Information System, https://gwis.jrc.ec.europa.eu/ (last access: 6 August 2025), 2025.
Gonçalves, J. and Marcos, B.: Análise da área ardida em Portugal continental no ano de 2024, https://severuspt.github.io/AnaliseAreaArdida2024/ (last access: 6 August 2025), 2024.
González, M. E., Gómez-González, S., Lara, A., Garreaud, R., and Díaz-Hormazábal, I.: The 2010–2015 Megadrought and its influence on the fire regime in central and south-central Chile, Ecosphere, 9, e02300, https://doi.org/10.1002/ecs2.2300, 2018.
González, M. E., Syphard, A. D., Fischer, A. P., Muñoz, A. A., and Miranda, A.: Chile's Valparaíso hills on fire, Science, 383, 1424–1424, https://doi.org/10.1126/science.ado5411, 2024.
Goss, M., Swain, D. L., Abatzoglou, J. T., Sarhadi, A., Kolden, C. A., Williams, A. P., and Diffenbaugh, N. S.: Climate change is increasing the likelihood of extreme autumn wildfire conditions across California, Environ. Res. Lett., 15, 094016, https://doi.org/10.1088/1748-9326/ab83a7, 2020.
Gould, C. F., Heft-Neal, S., Johnson, M., Aguilera, J., Burke, M., and Nadeau, K.: Health Effects of Wildfire Smoke Exposure, Annual Review of Medicine, 75, 277–292, https://doi.org/10.1146/annurev-med-052422-020909, 2024.
Grau-Andrés, R., Moreira, B., and Pausas, J. G.: Global plant responses to intensified fire regimes, Global Ecol. Biogeogr., 33, e13858, https://doi.org/10.1111/geb.13858, 2024.
Greenpeace: La Patagonia argentina sufre los peores incendios forestales de las últimas tres décadas, Fundación Greenpeace Argentina, https://www.greenpeace.org/argentina/story/problemas/bosques/la-patagonia-argentina-sufre-los-peores-incendios-forestales-de-las-ultimas-tres-decadas/ (last access: 6 August 2025), 2025.
Green Policy Platform: Congo Basin Sustainable Landscapes Programme, https://www.greenpolicyplatform.org/initiatives/GefCongoBasin/about (last access: 6 August 2025), 2025.
Hamilton, D. S., Perron, M. M. G., Bond, T. C., Bowie, A. R., Buchholz, R. R., Guieu, C., Ito, A., Maenhaut, W., Myriokefalitakis, S., Olgun, N., Rathod, S. D., Schepanski, K., Tagliabue, A., Wagner, R., and Mahowald, N. M.: Earth, Wind, Fire, and Pollution: Aerosol Nutrient Sources and Impacts on Ocean Biogeochemistry, Annu. Rev. Mar. Sci., 14, 303–330, https://doi.org/10.1146/annurev-marine-031921-013612, 2022.
Harris, S. and Lucas, C.: Understanding the variability of Australian fire weather between 1973 and 2017, PLOS ONE, 14, e0222328, https://doi.org/10.1371/journal.pone.0222328, 2019.
Harrison, S. P., Bartlein, P. J., Brovkin, V., Houweling, S., Kloster, S., and Prentice, I. C.: The biomass burning contribution to climate–carbon-cycle feedback, Earth Syst. Dynam., 9, 663–677, https://doi.org/10.5194/esd-9-663-2018, 2018.
He, Y., Czaplicki Cabezas, S., Maillard, O., Müller, R., Romero-Muñoz, A., Romero Pimentel, L. F., Vadillo, A., and Vos, V. A.: Enact reforms to protect Bolivia's forests from fire, Science, 387, 255–255, https://doi.org/10.1126/science.adt8304, 2025.
Hegerl, G. C., Hoegh-Guldberg, O., Casassa, G., Hoerling, M., Kovats, S., Parmesan, C., Pierce, D., and Stott, P.: IPCC WGI Expert Meeting on Detection and Attribution Related to Anthropogenic Climate Change: Good Practice Guidance Paper on Detection and Attribution Related to Anthropogenic Climate Change, edited by: Stocker, T., Field, C., Dahe, Q., Barros, V., Plattner, G.-K., Tignor, M., Midgley, P., and Ebi, K., Intergovernmental Panel on Climate Change, Geneva, https://archive.ipcc.ch/pdf/supporting-material/ipcc_good_practice_guidance_paper_anthropogenic.pdf (last access: 6 August 2025), 2009.
Held, I. M., Guo, H., Adcroft, A., Dunne, J. P., Horowitz, L. W., Krasting, J., Shevliakova, E., Winton, M., Zhao, M., Bushuk, M., Wittenberg, A. T., Wyman, B., Xiang, B., Zhang, R., Anderson, W., Balaji, V., Donner, L., Dunne, K., Durachta, J., Gauthier, P. P. G., Ginoux, P., Golaz, J.-C., Griffies, S. M., Hallberg, R., Harris, L., Harrison, M., Hurlin, W., John, J., Lin, P., Lin, S.-J., Malyshev, S., Menzel, R., Milly, P. C. D., Ming, Y., Naik, V., Paynter, D., Paulot, F., Ramaswamy, V., Reichl, B., Robinson, T., Rosati, A., Seman, C., Silvers, L. G., Underwood, S., and Zadeh, N.: Structure and Performance of GFDL's CM4.0 Climate Model, J. Adv. Model. Earth Sy., 11, 3691–3727, https://doi.org/10.1029/2019MS001829, 2019.
Hersbach, H., Bell, B., Berrisford, P., Biavati, G., Horányi, A., Muñoz Sabater, J., Nicolas, J., Peubey, C., Radu, R., Rozum, I., Sheppers, D., Simmons, A., Soci, C., Dee, D., and Thépaut, J.-N.: ERA5 hourly data on single levels from 1940 to present, Copernicus Climate Change Service (C3S) Climate Data Store (CDS) [data set], https://doi.org/10.24381/CDS.ADBB2D47, 2023.
Hiers, J. K., O'Brien, J. J., Varner, J. M., Butler, B. W., Dickinson, M., Furman, J., Gallagher, M., Godwin, D., Goodrick, S. L., Hood, S. M., Hudak, A., Kobziar, L. N., Linn, R., Loudermilk, E. L., McCaffrey, S., Robertson, K., Rowell, E. M., Skowronski, N., Watts, A. C., and Yedinak, K. M.: Prescribed fire science: the case for a refined research agenda, Fire Ecol., 16, 11, s42408-020-0070–8, https://doi.org/10.1186/s42408-020-0070-8, 2020.
Higuera, P. E. and Abatzoglou, J. T.: Record-setting climate enabled the extraordinary 2020 fire season in the western United States, Glob. Change Biol., 27, 1–2, https://doi.org/10.1111/gcb.15388, 2020.
Ho, A. T. Y., Huynh, K. P., Jacho-Chávez, D. T., and Vallée, G.: We didn't start the fire: Effects of a natural disaster on consumers' financial distress, Journal of Environmental Economics and Management, 119, 102790, https://doi.org/10.1016/j.jeem.2023.102790, 2023.
Holbrook, N. J., Scannell, H. A., Sen Gupta, A., Benthuysen, J. A., Feng, M., Oliver, E. C. J., Alexander, L. V., Burrows, M. T., Donat, M. G., Hobday, A. J., Moore, P. J., Perkins-Kirkpatrick, S. E., Smale, D. A., Straub, S. C., and Wernberg, T.: A global assessment of marine heatwaves and their drivers, Nat. Commun., 10, 2624, https://doi.org/10.1038/s41467-019-10206-z, 2019.
Holl, K. D. and Brancalion, P. H. S.: Tree planting is not a simple solution, Science, 368, 580–581, https://doi.org/10.1126/science.aba8232, 2020.
Horton, H.: Drought fears in Europe amid reports May was world's second hottest ever, https://www.theguardian.com/environment/2025/jun/11/drought-fears-in-europe-amid-reports-may-was-worlds-second-hottest-ever (last access: 6 August 2025), 2025.
Hsu, A., Jones, M. W., Thurgood, J. R., Smith, A. J. P., Carmenta, R., Abatzoglou, J. T., Anderson, L. O., Clarke, H., Doerr, S. H., Fernandes, P. M., Kolden, C. A., Santín, C., Strydom, T., Le Quéré, C., Ascoli, D., Castellnou, M., Goldammer, J. G., Guiomar, N. R. G. N., Kukavskaya, E. A., Rigolot, E., Tanpipat, V., Varner, M., Yamashita, Y., Baard, J., Barreto, R., Becerra, J., Brunn, E., Bergius, N., Carlsson, J., Cheney, C., Druce, D., Elliot, A., Evans, J., De Moraes Falleiro, R., Prat-Guitart, N., Hiers, J. K., Kaiser, J. W., Macher, L., Morris, D., Park, J., Robles, C., Román-Cuesta, R. M., Rücker, G., Senra, F., Steil, L., Valverde, J. A. L., and Zerr, E.: A global assemblage of regional prescribed burn records – GlobalRx, Sci. Data, 12, 1083, https://doi.org/10.1038/s41597-025-04941-w, 2025.
Huang, L., Zhu, Y., Wang, Q., Zhu, A., Liu, Z., Wang, Y., Allen, D. T., and Li, L.: Assessment of the effects of straw burning bans in China: Emissions, air quality, and health impacts, Sci. Total Environ., 789, 147935, https://doi.org/10.1016/j.scitotenv.2021.147935, 2021.
Huang, X., Xue, L., Wang, Z., Liu, Y., Ding, K., and Ding, A.: Escalating Wildfires in Siberia Driven by Climate Feedbacks Under a Warming Arctic in the 21st Century, AGU Advances, 5, e2023AV001151, https://doi.org/10.1029/2023AV001151, 2024.
Huang, Z. and Skidmore, M.: The Impact of Wildfires and Wildfire-Induced Air Pollution on House Prices in the United States, Land Economics, 100, 22–50, https://doi.org/10.3368/le.100.1.102322-0093R, 2024.
Huijnen, V., Flemming, J., Chabrillat, S., Errera, Q., Christophe, Y., Blechschmidt, A.-M., Richter, A., and Eskes, H.: C-IFS-CB05-BASCOE: stratospheric chemistry in the Integrated Forecasting System of ECMWF, Geosci. Model Dev., 9, 3071–3091, https://doi.org/10.5194/gmd-9-3071-2016, 2016.
Humphreys, A., Walker, E. G., Bratman, G. N., and Errett, N. A.: What can we do when the smoke rolls in? An exploratory qualitative analysis of the impacts of rural wildfire smoke on mental health and wellbeing, and opportunities for adaptation, BMC Public Health, 22, https://doi.org/10.1186/s12889-021-12411-2, 2022.
Huntingford, C., Kelley, D. I., and Barbosa, M. L. F.: A call to refine fire attribution: expanding the FAR statistic to capture the complexity of Los Angeles extreme fires, Environ. Res. Lett., 20, 091003, https://doi.org/10.1088/1748-9326/adf12b, 2025.
INPE: Banco de Dados de queimadas, https://terrabrasilis.dpi.inpe.br/queimadas/situacao-atual/estatisticas/estatisticas_paises/ (last access: 6 August 2025), 2025.
Instituto Brasileiro de Geografia e Estatística (IBGE): Coordenação de Recursos Naturais e Estudos Ambientais, Bacias e divisões hidrográficas do Brasil – Rio de Janeiro, Biblioteca IBGE, ISBN 9786587201801, https://biblioteca.ibge.gov.br/visualizacao/livros/liv101854.pdf (last access: 14 October 2025), 2021.
Instituto da Conservação da Natureza e das Florestas: 8° relatório provisório de incêndios frurais – 2024 – 1 de janeiro a 15 de outubro, https://www.icnf.pt/florestas/gfr/gfrgestaoinformacao/grfrelatorios/ areasardidaseocorrencias (last access: 6 August 2025), 2024.
Instituto Português do Mar e Atmosfera: Instituto Português do Mar e Atmosfera: Relatório incêndios rurais – análise meteorológica e índices de perigo, https://www.ipma.pt/resources.www/docs/im.publicacoes/ edicoes.online/20241129/IPVgKYBfuawamtSMzMgL/ met_20240901_20240930_fog_mm_co_pt.pdf (last access: 6 August 2025), 2024.
Insurance Bureau of Canada: Insurance Bureau of Canada provides Jasper wildfire recovery update, https://www.ibc.ca/news-insights/news/insurance-bureau-of-canada-provides-jasper-wildfire-recovery-update (last access: 6 August 2025), 2025.
Intergovernmental Panel on Climate Change (IPCC) (Ed.): Changing State of the Climate System, in: Climate Change 2021 – The Physical Science Basis: Working Group I Contribution to the Sixth Assessment Report of the Intergovernmental Panel on Climate Change, Cambridge University Press, Cambridge, 287–422, https://doi.org/10.1017/9781009157896.004, 2023a.
Intergovernmental Panel on Climate Change (IPCC) (Ed.): Key Risks across Sectors and Regions, in: Climate Change 2022 – Impacts, Adaptation and Vulnerability: Working Group II Contribution to the Sixth Assessment Report of the Intergovernmental Panel on Climate Change, Cambridge University Press, Cambridge, 2411–2538, https://doi.org/10.1017/9781009325844.025, 2023b.
Intergovernmental Panel on Climate Change (IPCC) (Ed.): Point of Departure and Key Concepts, in: Climate Change 2022 – Impacts, Adaptation and Vulnerability: Working Group II Contribution to the Sixth Assessment Report of the Intergovernmental Panel on Climate Change, Cambridge University Press, Cambridge, 121–196, https://doi.org/10.1017/9781009325844.003, 2023c.
Internal Displacement Monitoring Centre (IDMC): 2025 Global Report on Internal Displacement (GRID), https://doi.org/10.55363/IDMC.XTGW2833, 2025.
IQAir: 2024 World Air Quality Report, https://www.iqair.com/newsroom/waqr-2024-pr (last access: 6 August 2025), 2025.
Iran International: Fires in Iran's protected wildlife area expose governance failures, https://www.iranintl.com/en/202407110417 (last access: 6 August 2025), 2024.
ISDM (Informational System of Forest Fire Remote Monitoring): Wildfires Monitoring Information System of the Federal Forestry Agency, https://pushkino.aviales.ru/main_pages/index.shtml (last access: 6 August 2025), 2025.
Iturbide, M., Gutiérrez, J. M., Alves, L. M., Bedia, J., Cerezo-Mota, R., Cimadevilla, E., Cofiño, A. S., Di Luca, A., Faria, S. H., Gorodetskaya, I. V., Hauser, M., Herrera, S., Hennessy, K., Hewitt, H. T., Jones, R. G., Krakovska, S., Manzanas, R., Martínez-Castro, D., Narisma, G. T., Nurhati, I. S., Pinto, I., Seneviratne, S. I., van den Hurk, B., and Vera, C. S.: An update of IPCC climate reference regions for subcontinental analysis of climate model data: definition and aggregated datasets, Earth Syst. Sci. Data, 12, 2959–2970, https://doi.org/10.5194/essd-12-2959-2020, 2020.
Jain, P., Coogan, S. C. P., Subramanian, S. G., Crowley, M., Taylor, S., and Flannigan, M. D.: A review of machine learning applications in wildfire science and management, Environ. Rev., 28, 478–505, https://doi.org/10.1139/er-2020-0019, 2020.
Jain, P., Barber, Q. E., Taylor, S., Whitman, E., Castellanos Acuna, D., Boulanger, Y., Chavardès, R. D., Chen, J., Englefield, P., Flannigan, M., Girardin, M. P., Hanes, C. C., Little, J., Morrison, K., Skakun, R. S., Thompson, D. K., Wang, X., and Parisien, M.-A.: Drivers and Impacts of the Record-Breaking 2023 Wildfire Season in Canada, Nat. Commun., 15, 6764, https://doi.org/10.1038/s41467-024-51154-7, 2024.
Jakimow, B., Griffiths, P., Van Der Linden, S., and Hostert, P.: Mapping pasture management in the Brazilian Amazon from dense Landsat time series, Remote Sens. Environ., 205, 453–468, https://doi.org/10.1016/j.rse.2017.10.009, 2018.
Jiang, Y., Zhou, L., Tucker, C. J., Raghavendra, A., Hua, W., Liu, Y. Y., and Joiner, J.: Widespread increase of boreal summer dry season length over the Congo rainforest, Nat. Clim. Change, 9, 617–622, https://doi.org/10.1038/s41558-019-0512-y, 2019.
Jin, Y., Goulden, M. L., Faivre, N., Veraverbeke, S., Sun, F., Hall, A., Hand, M. S., Hook, S., and Randerson, J. T.: Identification of two distinct fire regimes in Southern California: implications for economic impact and future change, Environ. Res. Lett., 10, 094005, https://doi.org/10.1088/1748-9326/10/9/094005, 2015.
Johnson, S. J., Stockdale, T. N., Ferranti, L., Balmaseda, M. A., Molteni, F., Magnusson, L., Tietsche, S., Decremer, D., Weisheimer, A., Balsamo, G., Keeley, S. P. E., Mogensen, K., Zuo, H., and Monge-Sanz, B. M.: SEAS5: the new ECMWF seasonal forecast system, Geosci. Model Dev., 12, 1087–1117, https://doi.org/10.5194/gmd-12-1087-2019, 2019.
Johnston, F. H., Borchers-Arriagada, N., Morgan, G. G., Jalaludin, B., Palmer, A. J., Williamson, G. J., and Bowman, D. M. J. S.: Unprecedented health costs of smoke-related PM2.5 from the 2019–20 Australian megafires, Nat. Sustain., 4, 42–47, https://doi.org/10.1038/s41893-020-00610-5, 2021.
Jolly, W. M., Cochrane, M. A., Freeborn, P. H., Holden, Z. A., Brown, T. J., Williamson, G. J., and Bowman, D. M. J. S.: Climate-induced variations in global wildfire danger from 1979 to 2013, Nat. Commun., 6, https://doi.org/10.1038/ncomms8537, 2015.
Jones, M. W., Abatzoglou, J. T., Veraverbeke, S., Andela, N., Lasslop, G., Forkel, M., Smith, A. J. P., Burton, C., Betts, R. A., van der Werf, G. R., Sitch, S., Canadell, J. G., Santín, C., Kolden, C., Doerr, S. H., and Le Quéré, C.: Global and Regional Trends and Drivers of Fire Under Climate Change, Rev. Geophys., 60, e2020RG000726, https://doi.org/10.1029/2020RG000726, 2022.
Jones, M. W., Veraverbeke, S., Andela, N., Doerr, S. H., Kolden, C., Mataveli, G., Pettinari, M. L., Le Quéré, C., Rosan, T. M., van der Werf, G. R., van Wees, D., and Abatzoglou, J. T.: Global rise in forest fire emissions linked to climate change in the extratropics, Science, 386, eadl5889, https://doi.org/10.1126/science.adl5889, 2024a.
Jones, M. W., Kelley, D. I., Burton, C. A., Di Giuseppe, F., Barbosa, M. L. F., Brambleby, E., Hartley, A. J., Lombardi, A., Mataveli, G., McNorton, J. R., Spuler, F. R., Wessel, J. B., Abatzoglou, J. T., Anderson, L. O., Andela, N., Archibald, S., Armenteras, D., Burke, E., Carmenta, R., Chuvieco, E., Clarke, H., Doerr, S. H., Fernandes, P. M., Giglio, L., Hamilton, D. S., Hantson, S., Harris, S., Jain, P., Kolden, C. A., Kurvits, T., Lampe, S., Meier, S., New, S., Parrington, M., Perron, M. M. G., Qu, Y., Ribeiro, N. S., Saharjo, B. H., San-Miguel-Ayanz, J., Shuman, J. K., Tanpipat, V., van der Werf, G. R., Veraverbeke, S., and Xanthopoulos, G.: State of Wildfires 2023–2024, Earth Syst. Sci. Data, 16, 3601–3685, https://doi.org/10.5194/essd-16-3601-2024, 2024b.
Jones, M. W., Andela, N., Brambleby, E., Chuvieco, E., Giglio, L., Kaiser, J. W., Parrington, M., Qu, Y., Torres-Vázquez, M. Á., van der Werf, G. R., and Veraverbeke, S.: State of Wildfires 2024–2025: Anomalies in Burned Area, Fire Emissions, and Individual Fire Characteristics by Continent, Biome, Country, and Administrative Region, Zenodo [data set], https://doi.org/10.5281/zenodo.15525674, 2025.
Jones, R. L., Kharb, A., and Tubeuf, S.: The untold story of missing data in disaster research: a systematic review of the empirical literature utilising the Emergency Events Database (EM-DAT), Environ. Res. Lett., 18, 103006, https://doi.org/10.1088/1748-9326/acfd42, 2023.
Jorge, A. L., Abatzoglou, J. T., Fleishman, E., Williams, E. L., Rupp, D. E., Jenkins, J. S., Sadegh, M., Kolden, C. A., and Short, K. C.: COVID-19 Fueled an Elevated Number of Human-Caused Ignitions in the Western United States During the 2020 Wildfire Season, Earth's Future, 13, e2024EF005744, https://doi.org/10.1029/2024EF005744, 2025.
Kaiser, J. W., Heil, A., Andreae, M. O., Benedetti, A., Chubarova, N., Jones, L., Morcrette, J.-J., Razinger, M., Schultz, M. G., Suttie, M., and van der Werf, G. R.: Biomass burning emissions estimated with a global fire assimilation system based on observed fire radiative power, Biogeosciences, 9, 527–554, https://doi.org/10.5194/bg-9-527-2012, 2012.
Kam, P. M., Aznar-Siguan, G., Schewe, J., Milano, L., Ginnetti, J., Willner, S., McCaughey, J. W., and Bresch, D. N.: Global warming and population change both heighten future risk of human displacement due to river floods, Environ. Res. Lett., 16, 044026, https://doi.org/10.1088/1748-9326/abd26c, 2021.
Kam, P. M., Ciccone, F., Kropf, C. M., Riedel, L., Fairless, C., and Bresch, D. N.: Impact-based forecasting of tropical cyclone-related human displacement to support anticipatory action, Nat. Commun., 15, 8795, https://doi.org/10.1038/s41467-024-53200-w, 2024.
Karan, D. and Bhadra, S.: How Nepal Grew Back Its Forests, The New York Times, https://www.nytimes.com/2022/11/11/world/asia/nepal-reforestration-climate.html (last access: 6 August 2025), 2022.
Karuna Shechen: Extreme heat and wildfire in Nepal, https://karuna-shechen.org/en/extreme-heat-and-wildfires-in-nepal/ (last access: 6 August 2025), 2024.
Kasoar, M., Perkins, O., Millington, J. D. A., Mistry, J., and Smith, C.: Model fires, not ignitions: Capturing the human dimension of global fire regimes, Cell Reports Sustainability, 1, https://doi.org/10.1016/j.crsus.2024.100128, 2024.
Katz, R. W. and Giannini, A.: Climate Variability and Change in South America, in: Climate Change and Biodiversity in the Tropical Andes, Inter-American Institute for Global Change Research, ISBN 978-85-99875-05-6, 2010.
Keeley, J. E.: Native American impacts on fire regimes of the California coastal ranges, J. Biogeogr., 29, 303–320, https://doi.org/10.1046/j.1365-2699.2002.00676.x, 2002.
Keeley, J. E.: Fire intensity, fire severity and burn severity: a brief review and suggested usage, Int. J. Wildland Fire, 18, 116–126, https://doi.org/10.1071/WF07049, 2009.
Keeley, J. E. and Fotheringham, C. J.: Historic Fire Regime in Southern California Shrublands, Conserv. Biol., 15, 1536–1548, https://doi.org/10.1046/j.1523-1739.2001.00097.x, 2001.
Keeley, J. E., Fotheringham, C. J., and Morais, M.: Reexamining Fire Suppression Impacts on Brushland Fire Regimes, Science, 284, 1829–1832, https://doi.org/10.1126/science.284.5421.1829, 1999.
Kelley, D., Burton, C., Barbosa, M. L. F., Jones, M., Di Giuseppe, F., Hartley, A., McNorton, J., Spuler, F., Wessel, J., and Lampe, S.: douglask3/State_of_Wildfires_report: Final code used in published version of the first State of Wildfires report (v1.0), Zenodo [code], https://doi.org/10.5281/ZENODO.11460379, 2024.
Kelley, D., Ferreira Barbosa, M. L., Hartley, A., Spuler, F., Wessel, J., Ciavarella, A., McNorton, J., Burton, C., Ferreira, I., and Fiedler, L.: State of Wildfires 2024/25 – ConFLAME Driver Assessment – Congo Basin/Southern California, Zenodo [data set], https://doi.org/10.5281/ZENODO.16789657, 2025a.
Kelley, D., Ferreira Barbosa, M. L., Bradley, A., Burke, E., Burton, C., Hartley, A., Ferreira, I., and Hantson, S.: State of Wildfires 2024–2025: ConFLAME Future Projections, Zenodo [data set], https://doi.org/10.5281/ZENODO.15807587, 2025b.
Kelley, D., Ferreira Barbosa, M. L., Hartley, A., Spuler, F., Wessel, J., Ciavarella, A., McNorton, J., Burton, C., Ferreira, I., and Fiedler, L.: State of Wildfires 2024–2025: ConFLAME NRT Attribution Results, Zenodo [data set], https://doi.org/10.5281/ZENODO.15641876, 2025c.
Kelley, D. I., Bistinas, I., Whitley, R., Burton, C., Marthews, T. R., and Dong, N.: How contemporary bioclimatic and human controls change global fire regimes, Nat. Clim. Change, 9, 690–696, https://doi.org/10.1038/s41558-019-0540-7, 2019.
Kelley, D. I., Burton, C., Huntingford, C., Brown, M. A. J., Whitley, R., and Dong, N.: Technical note: Low meteorological influence found in 2019 Amazonia fires, Biogeosciences, 18, 787–804, https://doi.org/10.5194/bg-18-787-2021, 2021.
Kelly, L. T., Giljohann, K. M., Duane, A., Aquilué, N., Archibald, S., Batllori, E., Bennett, A. F., Buckland, S. T., Canelles, Q., Clarke, M. F., Fortin, M.-J., Hermoso, V., Herrando, S., Keane, R. E., Lake, F. K., McCarthy, M. A., Morán-Ordóñez, A., Parr, C. L., Pausas, J. G., Penman, T. D., Regos, A., Rumpff, L., Santos, J. L., Smith, A. L., Syphard, A. D., Tingley, M. W., and Brotons, L.: Fire and biodiversity in the Anthropocene, Science, 370, eabb0355, https://doi.org/10.1126/science.abb0355, 2020.
Kheshti, M.: Protect Iran's Zagros forests from wildfires, Science, 369, 1066–1066, https://doi.org/10.1126/science.abd2967, 2020.
Kim, J., Wise, A., and Bowman, E.: Strong winds pick up, increasing fire danger as firefighters battle LA blazes, https://www.npr.org/2025/01/11/g-s1-42247/la-wildfires-california-containment-evacuation (last access: 6 August 2025), 2025.
Kirillina, K., Shvetsov, E. G., Protopopova, V. V., Thiesmeyer, L., and Yan, W.: Consideration of anthropogenic factors in boreal forest fire regime changes during rapid socio-economic development: case study of forestry districts with increasing burnt area in the Sakha Republic, Russia, Environ. Res. Lett., 15, 035009, https://doi.org/10.1088/1748-9326/ab6c6e, 2020.
Kolden, C. A. and Abatzoglou, J. T.: Spatial Distribution of Wildfires Ignited under Katabatic versus Non-Katabatic Winds in Mediterranean Southern California USA, Fire, 1, 19, https://doi.org/10.3390/fire1020019, 2018.
Kolden, C. A., Abatzoglou, J. T., Jones, M. W., and Jain, P.: Wildfires in 2023, Nat. Rev. Earth Environ., 5, 238–240, https://doi.org/10.1038/s43017-024-00544-y, 2024.
Kolden, C. A., Abatzoglou, J. T., Jones, M. W., and Jain, P.: Wildfires in 2024, Nat. Rev. Earth Environ., 6, 237–239, https://doi.org/10.1038/s43017-025-00663-0, 2025.
Kouassi, J.-L., Wandan, N., and Mbow, C.: Exploring spatio-temporal trends and environmental drivers of wildfire occurrence and impacts in Côte d'Ivoire, West Africa, Afr. J. Ecol., 60, 1218–1236, https://doi.org/10.1111/aje.13066, 2022.
Kukavskaya, E. A., Buryak, L. V., Shvetsov, E. G., Conard, S. G., and Kalenskaya, O. P.: The impact of increasing fire frequency on forest transformations in southern Siberia, Forest Ecol. Manage., 382, 225–235, https://doi.org/10.1016/j.foreco.2016.10.015, 2016.
Lampe, S. and Burton, C.: State of Wildfires 2024–2025: FireMIP Burned Area Attribution, Zenodo [code], https://doi.org/10.5281/ZENODO.16779167, 2025.
Lange, S.: Trend-preserving bias adjustment and statistical downscaling with ISIMIP3BASD (v1.0), Geosci. Model Dev., 12, 3055–3070, https://doi.org/10.5194/gmd-12-3055-2019, 2019.
Lapola, D. M., Pinho, P., Barlow, J., Aragão, L. E. O. C., Berenguer, E., Carmenta, R., Liddy, H. M., Seixas, H., Silva, C. V. J., Silva-Junior, C. H. L., Alencar, A. A. C., Anderson, L. O., Armenteras, D., Brovkin, V., Calders, K., Chambers, J., Chini, L., Costa, M. H., Faria, B. L., Fearnside, P. M., Ferreira, J., Gatti, L., Gutierrez-Velez, V. H., Han, Z., Hibbard, K., Koven, C., Lawrence, P., Pongratz, J., Portela, B. T. T., Rounsevell, M., Ruane, A. C., Schaldach, R., da Silva, S. S., von Randow, C., and Walker, W. S.: The drivers and impacts of Amazon forest degradation, Science, 379, eabp8622, https://doi.org/10.1126/science.abp8622, 2023.
Latif, M., Anderson, D., Barnett, T., Cane, M., Kleeman, R., Leetmaa, A., O'Brien, J., Rosati, A., and Schneider, E.: A review of the predictability and prediction of ENSO, J. Geophys. Res.-Oceans, 103, 14375–14393, https://doi.org/10.1029/97JC03413, 1998.
Laurent, P., Mouillot, F., Yue, C., Ciais, P., Moreno, M. V., and Nogueira, J. M. P.: FRY, a global database of fire patch functional traits derived from space-borne burned area products, Sci. Data, 5, 180132, https://doi.org/10.1038/sdata.2018.132, 2018.
Lehmann, C. E. R., Anderson, T. M., Sankaran, M., Higgins, S. I., Archibald, S., Hoffmann, W. A., Hanan, N. P., Williams, R. J., Fensham, R. J., Felfili, J., Hutley, L. B., Ratnam, J., San Jose, J., Montes, R., Franklin, D., Russell-Smith, J., Ryan, C. M., Durigan, G., Hiernaux, P., Haidar, R., Bowman, D. M. J. S., and Bond, W. J.: Savanna Vegetation-Fire-Climate Relationships Differ Among Continents, Science, 343, 548–552, https://doi.org/10.1126/science.1247355, 2014.
Levin, M., Huffman, J., and Friedman, L.: Rep. Mike Levin Leads Letter Demanding Answers on US Army Corps of Engineers' Wasteful Water Release, https://levin.house.gov/media/press-releases/rep-mike-levin-leads-letter-demanding-answers-on-us-army-corps-of-engineers-wasteful-water-release (last access: 6 August 2025), 2025.
Li, S., Sparrow, S. N., Otto, F. E. L., Rifai, S. W., Oliveras, I., Krikken, F., Anderson, L. O., Malhi, Y., and Wallom, D.: Anthropogenic climate change contribution to wildfire-prone weather conditions in the Cerrado and Arc of deforestation, Environ. Res. Lett., 16, 094051, https://doi.org/10.1088/1748-9326/ac1e3a, 2021a.
Li, Y., Yuan, S., Fan, S., Song, Y., Wang, Z., Yu, Z., Yu, Q., and Liu, Y.: Satellite Remote Sensing for Estimating PM2.5 and Its Components, Curr. Pollution Rep., 7, 72–87, https://doi.org/10.1007/s40726-020-00170-4, 2021b.
Li, Y., Janssen, T. A. J., Chen, R., He, B., and Veraverbeke, S.: Trends and drivers of Arctic-boreal fire intensity between 2003 and 2022, Sci. Total Environ., 926, 172020, https://doi.org/10.1016/j.scitotenv.2024.172020, 2024.
Li, Z. and Yu, W.: Economic Impact of the Los Angeles Wildfires, https://www.anderson.ucla.edu/about/centers/ucla-anderson-forecast/economic-impact-los-angeles-wildfires (last access: 6 August 2025), 2025.
Libonati, R., Geirinhas, J. L., Silva, P. S., Russo, A., Rodrigues, J. A., Belé m, L. B. C., Nogueira, J., Roque, F. O., DaCamara, C. C., Nunes, A. M. B., Marengo, J. A., and Trigo, R. M.: Assessing the role of compound drought and heatwave events on unprecedented 2020 wildfires in the Pantanal, Environ. Res. Lett., 17, 015005, https://doi.org/10.1088/1748-9326/ac462e, 2022.
Linley, G. D., Jolly, C. J., Doherty, T. S., Geary, W. L., Armenteras, D., Belcher, C. M., Bliege Bird, R., Duane, A., Fletcher, M.-S., Giorgis, M. A., Haslem, A., Jones, G. M., Kelly, L. T., Lee, C. K. F., Nolan, R. H., Parr, C. L., Pausas, J. G., Price, J. N., Regos, A., Ritchie, E. G., Ruffault, J., Williamson, G. J., Wu, Q., and Nimmo, D. G.: What do you mean, “megafire”?, Global Ecol. Biogeogr., 31, 1906–1922, https://doi.org/10.1111/geb.13499, 2022.
Linley, G. D., Jolly, C. J., Doherty, T. S., Geary, W. L., Armenteras, D., Belcher, C. M., Bliege Bird, R., Duane, A., Fletcher, M.-S., Giorgis, M. A., Haslem, A., Jones, G. M., Kelly, L. T., Lee, C. K. F., Nolan, R. H., Parr, C. L., Pausas, J. G., Price, J. N., Regos, A., Ritchie, E. G., Ruffault, J., Williamson, G. J., Wu, Q., and Nimmo, D. G.: “Megafire” – You May Not Like It, But You Cannot Avoid It, Global Ecol. Biogeogr., 34, e70032, https://doi.org/10.1111/geb.70032, 2025.
Littell, J. S., Peterson, D. L., Riley, K. L., Liu, Y., and Luce, C. H.: A review of the relationships between drought and forest fire in the United States, Glob. Change Biol., 22, 2353–2369, https://doi.org/10.1111/gcb.13275, 2016.
Liu, Z. and Eden, J.: State of Wildfires 2024–2025 – GWL FWI projections, Zenodo [data set], https://doi.org/10.5281/ZENODO.15790287, 2025.
Liu, Z., Eden, J. M., Dieppois, B., Conradie, W. S., and Blackett, M.: The April 2021 Cape Town Wildfire: Has Anthropogenic Climate Change Altered the Likelihood of Extreme Fire Weather?, B. Am. Meteorol. Soc., 104, E298–E304, https://doi.org/10.1175/BAMS-D-22-0204.1, 2023b.
Lizundia-Loiola, J., Otón, G., Ramo, R., and Chuvieco, E.: A spatio-temporal active-fire clustering approach for global burned area mapping at 250 m from MODIS data, Remote Sens. Environ., 236, 111493, https://doi.org/10.1016/j.rse.2019.111493, 2020a.
Lizundia-Loiola, J., Pettinari, M. L., and Chuvieco, E.: Temporal Anomalies in Burned Area Trends: Satellite Estimations of the Amazonian 2019 Fire Crisis, Remote Sensing, 12, 151, https://doi.org/10.3390/rs12010151, 2020b.
Lizundia-Loiola, J., Franquesa, M., Khairoun, A., and Chuvieco, E.: Global burned area mapping from Sentinel-3 Synergy and VIIRS active fires, Remote Sens. Environ., 282, 113298, https://doi.org/10.1016/j.rse.2022.113298, 2022.
Los Angeles County Economic Development Corporation: Impact of 2025 Los Angeles Wildfires and Comparative Study, https://laedc.org/wpcms/wp-content/uploads/2025/02/LAEDC-2025-LA-Wildfires-Study.pdf (last access: 6 August 2025), 2025.
Lundberg, S. and Lee, S. I.: A Unified Approach to Interpreting Model Predictions, arXiv [preprint], https://doi.org/10.48550/arXiv.1705.07874, 2017.
Lüthi, S., Aznar-Siguan, G., Fairless, C., and Bresch, D. N.: Globally consistent assessment of economic impacts of wildfires in CLIMADA v2.2, Geosci. Model Dev., 14, 7175–7187, https://doi.org/10.5194/gmd-14-7175-2021, 2021.
Machado-Silva, F., Libonati, R., Melo De Lima, T. F., Bittencourt Peixoto, R., De Almeida França, J. R., De Avelar Figueiredo Mafra Magalhães, M., Lemos Maia Santos, F., Abrantes Rodrigues, J., and DaCamara, C. C.: Drought and fires influence the respiratory diseases hospitalizations in the Amazon, Ecological Indicators, 109, 105817, https://doi.org/10.1016/j.ecolind.2019.105817, 2020.
Malhi, Y., Wood, D., Baker, T. R., Wright, J., Phillips, O. L., Cochrane, T., Meir, P., Chave, J., Almeida, S., Arroyo, L., Higuchi, N., Killeen, T. J., Laurance, S. G., Laurance, W. F., Lewis, S. L., Monteagudo, A., Neill, D. A., Vargas, P. N., Pitman, N. C. A., Quesada, C. A., Salomão, R., Silva, J. N. M., Lezama, A. T., Terborgh, J., Martínez, R. V., and Vinceti, B.: The regional variation of aboveground live biomass in old-growth Amazonian forests, Glob. Change Biol., 12, 1107–1138, https://doi.org/10.1111/j.1365-2486.2006.01120.x, 2006.
Marques, J. F., Alves, M. B., Silveira, C. F., Amaral e Silva, A., Silva, T. A., dos Santos, V. J., and Calijuri, M. L.: Fires dynamics in the Pantanal: Impacts of anthropogenic activities and climate change, J. Environ. Manage., 299, 113586, https://doi.org/10.1016/j.jenvman.2021.113586, 2021.
Masoudian, E., Mirzaei, A., and Bagheri, H.: Assessing wildfire susceptibility in Iran: Leveraging machine learning for geospatial analysis of climatic and anthropogenic factors, Trees, Forests and People, 19, 100774, https://doi.org/10.1016/j.tfp.2025.100774, 2025.
Mastrandrea, M. D., Field, C. B., Stocker, T. F., Edenhofer, O., Ebi, K. L., Frame, D. J., Held, H., Kriegler, E., Mach, K. J., Matschoss, P. R., Plattner, G.-K., Yohe, G. W., and Zwiers, F. W.: Guidance note for lead authors of the IPCC fifth assessment report on consistent treatment of uncertainties, Intergovernmental Panel on Climate Change (IPCC), https://www.ipcc.ch/site/assets/uploads/2018/05/uncertainty-guidance-note.pdf (last access: 14 October 2025), 2010.
Mataveli, G., Jones, M. W., Carmenta, R., Sanchez, A., Dutra, D. J., Chaves, M., de Oliveira, G., Anderson, L. O., and Aragão, L. E. O. C.: Deforestation falls but rise of wildfires continues degrading Brazilian Amazon forests, Glob. Change Biol., 30, e17202, https://doi.org/10.1111/gcb.17202, 2024.
Mataveli, G., Maure, L. A., Sanchez, A., Dutra, D. J., de Oliveira, G., Jones, M. W., Amaral, C., Artaxo, P., and Aragão, L. E. O. C.: Forest Degradation Is Undermining Progress on Deforestation in the Amazon, Glob. Change Biol., 31, e70209, https://doi.org/10.1111/gcb.70209, 2025.
Mathison, C., Burke, E., Hartley, A. J., Kelley, D. I., Burton, C., Robertson, E., Gedney, N., Williams, K., Wiltshire, A., Ellis, R. J., Sellar, A. A., and Jones, C. D.: Description and evaluation of the JULES-ES set-up for ISIMIP2b, Geosci. Model Dev., 16, 4249–4264, https://doi.org/10.5194/gmd-16-4249-2023, 2023.
Mattson-Teig, B.: January 2025 Economist Snapshot: Los Angeles Wildfires Recovery Will Be Costly and Lengthy, Urban Land, https://urbanland.uli.org/capital-markets-and-finance/january-economist-snapshot-los-angeles-wildfires-recovery-will-be-costly-and-lengthy (last access: 6 August 2025), 2025.
Mauritsen, T., Bader, J., Becker, T., Behrens, J., Bittner, M., Brokopf, R., Brovkin, V., Claussen, M., Crueger, T., Esch, M., Fast, I., Fiedler, S., Fläschner, D., Gayler, V., Giorgetta, M., Goll, D. S., Haak, H., Hagemann, S., Hedemann, C., Hohenegger, C., Ilyina, T., Jahns, T., Jimenéz-de-la-Cuesta, D., Jungclaus, J., Kleinen, T., Kloster, S., Kracher, D., Kinne, S., Kleberg, D., Lasslop, G., Kornblueh, L., Marotzke, J., Matei, D., Meraner, K., Mikolajewicz, U., Modali, K., Möbis, B., Müller, W. A., Nabel, J. E. M. S., Nam, C. C. W., Notz, D., Nyawira, S.-S., Paulsen, H., Peters, K., Pincus, R., Pohlmann, H., Pongratz, J., Popp, M., Raddatz, T. J., Rast, S., Redler, R., Reick, C. H., Rohrschneider, T., Schemann, V., Schmidt, H., Schnur, R., Schulzweida, U., Six, K. D., Stein, L., Stemmler, I., Stevens, B., von Storch, J.-S., Tian, F., Voigt, A., Vrese, P., Wieners, K.-H., Wilkenskjeld, S., Winkler, A., and Roeckner, E.: Developments in the MPI-M Earth System Model version 1.2 (MPI-ESM1.2) and Its Response to Increasing CO2, J. Adv. Model. Earth Sy., 11, 998–1038, https://doi.org/10.1029/2018MS001400, 2019.
McNorton, J. R. and Di Giuseppe, F.: A global fuel characteristic model and dataset for wildfire prediction, Biogeosciences, 21, 279–300, https://doi.org/10.5194/bg-21-279-2024, 2024.
McNorton, J., Moreno, A., Turco, M., Keune, J., and Di Giuseppe, F.: Hydroclimatic Rebound Drives Extreme Fire in California's Non-Forested Ecosystems, Glob. Change Biol., 31, e70481, https://doi.org/10.1111/gcb.70481, 2025.
McNorton, J. R., Giuseppe, F. D., Pinnington, E. M., Chantry, M., and Barnard, C.: A Global Probability-of-Fire (PoF) Forecast, Geophys. Res. Lett., 51, e2023GL107929, https://doi.org/10.1029/2023GL107929, 2024.
McPhaden, M. J., Jarugula, S., Aroucha, L. C., and Lübbecke, J. F.: Indian Ocean Dipole intensifies Benguela Niño through Congo River discharge, Commun. Earth Environ., 5, 779, https://doi.org/10.1038/s43247-024-01955-x, 2024.
Meddour-Sahar, O., Lovreglio, R., Meddour, R., Leone, V., and Derridj, A.: Fire and People in Three Rural Communities in Kabylia (Algeria): Results of a Survey, Open Journal of Forestry, 3, 30–40, https://doi.org/10.4236/ojf.2013.31006, 2013.
Meier, S., Strobl, E., and Elliott, R. J. R.: The impact of wildfire smoke exposure on excess mortality and later-life socioeconomic outcomes: the Great Fire of 1910, Cliometrica, 19, 279–342, https://doi.org/10.1007/s11698-024-00297-0, 2025.
Menezes, L. S., De Oliveira, A. M., Santos, F. L. M., Russo, A., De Souza, R. A. F., Roque, F. O., and Libonati, R.: Lightning patterns in the Pantanal: Untangling natural and anthropogenic-induced wildfires, Sci. Total Environ., 820, 153021, https://doi.org/10.1016/j.scitotenv.2022.153021, 2022.
Mengel, M., Treu, S., Lange, S., and Frieler, K.: ATTRICI v1.1 – counterfactual climate for impact attribution, Geosci. Model Dev., 14, 5269–5284, https://doi.org/10.5194/gmd-14-5269-2021, 2021.
Met Office: EUCLEIA: European Climate and weather Events: Interpretation and Attribution , http://catalogue.ceda.ac.uk/uuid/99b29b4bfeae470599fb96243e90cde3, last access: 6 August 2025.
Michaelowa, A., Michaelowa, K., Shishlov, I., and Brescia, D.: Catalysing private and public action for climate change mitigation: the World Bank's role in international carbon markets, Climate Policy, 21, 120–132, https://doi.org/10.1080/14693062.2020.1790334, 2021.
Millington, J. D. A., Perkins, O., and Smith, C.: Human Fire Use and Management: A Global Database of Anthropogenic Fire Impacts for Modelling, Fire, 5, 87, https://doi.org/10.3390/fire5040087, 2022.
Ministerio de Medio Ambiente y agua: Ministerio de Medio Ambiente Lleva Adelante su Rendición Pública de Cuentas Inicial, Ministerio de Medio Ambiente y Agua, https://www.mmaya.gob.bo/2025/04/14/ministerio-de-medio-ambiente-lleva-adelante-su-rendicion-publica-de-cuentas-inicial-2025/ (last access: 6 August 2025),2025.
Molinario, G., Hansen, M. C., and Potapov, P. V.: Forest cover dynamics of shifting cultivation in the Democratic Republic of Congo: a remote sensing-based assessment for 2000–2010, Environ. Res. Lett., 10, 094009, https://doi.org/10.1088/1748-9326/10/9/094009, 2015.
Molinario, G., Hansen, M., Potapov, P., Tyukavina, A., and Stehman, S.: Contextualizing Landscape-Scale Forest Cover Loss in the Democratic Republic of Congo (DRC) between 2000 and 2015, Land, 9, 23, https://doi.org/10.3390/land9010023, 2020.
Morcrette, J.-J., Boucher, O., Jones, L., Salmond, D., Bechtold, P., Beljaars, A., Benedetti, A., Bonet, A., Kaiser, J. W., Razinger, M., Schulz, M., Serrar, S., Simmons, A. J., Sofiev, M., Suttie, M., Tompkins, A. M., and Untch, A.: Aerosol analysis and forecast in the European Centre for Medium-Range Weather Forecasts Integrated Forecast System: Forward modeling, J. Geophys. Res.-Atmos., 114, https://doi.org/10.1029/2008JD011235, 2009.
Moreira, F., Ascoli, D., Safford, H., Adams, M. A., Moreno, J. M., Pereira, J. M. C., Catry, F. X., Armesto, J., Bond, W., González, M. E., Curt, T., Koutsias, N., McCaw, L., Price, O., Pausas, J. G., Rigolot, E., Stephens, S., Tavsanoglu, C., Vallejo, V. R., Wilgen, B. W. V., Xanthopoulos, G., and Fernandes, P. M.: Wildfire management in Mediterranean-type regions: paradigm change needed, Environ. Res. Lett., 15, 011001, https://doi.org/10.1088/1748-9326/ab541e, 2020.
Morningstar DBRS: Aftermath of Los Angeles Wildfires: A Wake-Up Call for Property and Casualty Insurers and Regulators, https://dbrs.morningstar.com/research/451515/aftermath-of-los-angeles-wildfires-a-wake-up-call-for-property-casualty-insurers-and-regulators (last access: 6 August 2025), 2025.
Muñoz-Sabater, J., Dutra, E., Agustí-Panareda, A., Albergel, C., Arduini, G., Balsamo, G., Boussetta, S., Choulga, M., Harrigan, S., Hersbach, H., Martens, B., Miralles, D. G., Piles, M., Rodríguez-Fernández, N. J., Zsoter, E., Buontempo, C., and Thépaut, J.-N.: ERA5-Land: a state-of-the-art global reanalysis dataset for land applications, Earth Syst. Sci. Data, 13, 4349–4383, https://doi.org/10.5194/essd-13-4349-2021, 2021.
N1info: Serbia sees 135 wildfires in the past 24 hours, N1, https://n1info.rs/english/news/serbia-sees-135-wildfires-in-the-past-24-hours/ (last access: 6 August 2025), 2024.
Narita, D., Gavrilyeva, T., and Isaev, A.: Impacts and management of forest fires in the Republic of Sakha, Russia: A local perspective for a global problem, Polar Sci., 27, 100573, https://doi.org/10.1016/j.polar.2020.100573, 2021.
NASA Earth Observatory: Early Fires in Brazil's Pantanal, https://earthobservatory.nasa.gov/images/152925/early-fires-in-brazils-pantanal (last access: 6 August 2025), 2024a.
NASA Earth Observatory: Fire in Southern Mexico, https://earthobservatory.nasa.gov/images/152628/fire-in-southern-mexico (last access: 6 August 2025), 2024b.
NASA Earth Observatory: Intense, Widespread Drought Grips South America, https://earthobservatory.nasa.gov/images/153447/intense-widespread-drought-grips-south-america (last access: 6 August 2025), 2024c.
NASA FIRMS: Fire Information for Resource Management System. MODIS and VIIRS Fire Data [data set], https://firms.modaps.eosdis.nasa.gov/ (last access: 6 August 2025), 2025.
National Centers for Environmental Information (NCEI): U.S. Drought: Monthly Changes and Impacts for June 2025, https://www.ncei.noaa.gov/news/us-drought-monthly-report-June-2025 (last access: 6 August 2025), 2025.
National Interagency Coordination Center: National Interagency Coordination Center Wildland Fire Summary and Statistics Annual Report 2024, https://www.nifc.gov/sites/default/files/NICC/2-Predictive%20Services/Intelligence/Annual%20Reports/2024/annual_report_2024.pdf (last access: 6 August 2025), 2024.
National Interagency Fire Center (NIFC): National Significant Wildland Fire Potential Outlook, https://www.nifc.gov/nicc-files/predictive/outlooks/monthly_seasonal_outlook.pdf (last access: 6 August 2025), 2025.
N'Dri, A. B., Soro, T. D., Gignoux, J., Dosso, K., Koné, M., N'Dri, J. K., Koné, N. A., and Barot, S.: Season affects fire behavior in annually burned humid savanna of West Africa, Fire Ecology, 14, 5, https://doi.org/10.1186/s42408-018-0005-9, 2018.
N'Dri, A. B., Kpangba, K. P., Werner, P. A., Koffi, K. F., and Bakayoko, A.: The response of sub-adult savanna trees to six successive annual fires: An experimental field study on the role of fire season, J. Appl. Ecol., 59, 1347–1361, https://doi.org/10.1111/1365-2664.14149, 2022.
N'Dri, A. B., Kpré, A. J.-N., and Doumbia, A.: Managing fires in a woody encroachment context: Fine fuel load does not change across fire seasons in a Guinean savanna (West Africa), J. Environ. Manage., 371, 123236, https://doi.org/10.1016/j.jenvman.2024.123236, 2024.
New York Times: Swept by the Fires, Away From Their Lives, The New York Times, https://www.nytimes.com/2025/05/16/realestate/la-fire-victims-altadena-palisades.html (last access: 6 August 2025), 2025.
Newton, P., Kinzer, A. T., Miller, D. C., Oldekop, J. A., and Agrawal, A.: The Number and Spatial Distribution of Forest-Proximate People Globally, One Earth, 3, 363–370, https://doi.org/10.1016/j.oneear.2020.08.016, 2020.
NHK (Japan Broadcasting Corporation): Wildfire declared extinguished in Japan's Ofunato City after 40 days, https://www3.nhk.or.jp/nhkworld/en/news/20250408_01/ (last access: 6 August 2025), 2025.
NOAA Climate Prediction Center (CPC): ENSO: Recent Evolution, Current Status and Predictions, https://www.cpc.ncep.noaa.gov/ (last access: 6 August 2025), 2024.
National Oceanic and Atmospheric Administration (NOAA): Monthly Global Climate Report for Annual 2024, https://www.ncei.noaa.gov/access/monitoring/monthly-report/global/202413 (last access: 6 August 2025), 2025.
Nolan, R. H., Collins, L., Leigh, A., Ooi, M. K. J., Curran, T. J., Fairman, T. A., Resco de Dios, V., and Bradstock, R.: Limits to post-fire vegetation recovery under climate change, 2021a, Plant Cell Environ., 44, 3471–3489, https://doi.org/10.1111/pce.14176, 2021a.
Novinite: Bulgaria's Prime Minister Calls for Aid as Fires Threaten Yambol Villages, https://www.novinite.com/articles/227226/Bulgaria%27s+Prime+Minister+Calls+for+Aid+as+Fires+Threaten+Yambol+Villages (last access: 14 October 2025), 2024.
Nunes, V.: Pantanal em chamas: Incêndio na Serra do Amolar mobiliza forças e alerta sobre a preservação ambiental, Notícias de Campo Grande e MS – Capital News, https://www.capitalnews.com.br/retrospectiva/2024/pantanal-em-chamas-incendio-na-serra-do-amolar-mobiliza-forcas-e-alerta-sobre-a-preservacao-ambiental/414842 (last access: 6 August 2025), 2025.
OECD: Taming Wildfires in the Context of Climate Change, OECD, https://doi.org/10.1787/dd00c367-en, 2023.
Olson, D. M., Dinerstein, E., Wikramanayake, E. D., Burgess, N. D., Powell, G. V. N., Underwood, E. C., D'amico, J. A., Itoua, I., Strand, H. E., Morrison, J. C., Loucks, C. J., Allnutt, T. F., Ricketts, T. H., Kura, Y., Lamoreux, J. F., Wettengel, W. W., Hedao, P., and Kassem, K. R.: Terrestrial Ecoregions of the World: A New Map of Life on Earth, BioScience, 51, 933, https://doi.org/10.1641/0006-3568(2001)051[0933:TEOTWA]2.0.CO;2, 2001.
Otto, F. E. L., Philip, S., Kew, S., Li, S., King, A., and Cullen, H.: Attributing high-impact extreme events across timescales – a case study of four different types of events, Climatic Change, 149, 399–412, https://doi.org/10.1007/s10584-018-2258-3, 2018a.
Otto, F. E. L., Van Der Wiel, K., Van Oldenborgh, G. J., Philip, S., Kew, S. F., Uhe, P., and Cullen, H.: Climate change increases the probability of heavy rains in Northern England/Southern Scotland like those of storm Desmond – a real-time event attribution revisited, Environ. Res. Lett., 13, 024006, https://doi.org/10.1088/1748-9326/aa9663, 2018b.
Ozerkan, F.: Turkey battles forest fires for third day, https://phys.org/news/2024-08-turkey-forest-day.html (last access: 6 August 2025), 2024.
Paglino, E., Raquib, R. V., and Stokes, A. C.: Excess Deaths Attributable to the Los Angeles Wildfires From January 5 to February 1, 2025, JAMA, 334, 1018, https://doi.org/10.1001/jama.2025.10556, 2025.
Pai, S. J., Carter, T. S., Heald, C. L., and Kroll, J. H.: Updated World Health Organization Air Quality Guidelines Highlight the Importance of Non-anthropogenic PM2.5, Environ. Sci. Tech. Lett., 9, 501–506, https://doi.org/10.1021/acs.estlett.2c00203, 2022.
Pan, X., Chin, M., Ichoku, C. M., and Field, R. D.: Connecting Indonesian Fires and Drought With the Type of El Niño and Phase of the Indian Ocean Dipole During 1979–2016, J. Geophys. Res.-Atmos., 123, 7974–7988, https://doi.org/10.1029/2018JD028402, 2018.
Papelo, J.: Desastre ambiental: implicações das queimadas e desmatamentos no interior do País, Novo Jornal, https://novojornal.co.ao/opiniao/detalhe/desastre-ambiental-implicacoes-das-queimadas-e-desmatamentos-no-interior-do-pais-36744.html (last access: 6 August 2025), 2024.
Parks, S. A., Miller, C., Parisien, M.-A., Holsinger, L. M., Dobrowski, S. Z., and Abatzoglou, J.: Wildland fire deficit and surplus in the western United States, 1984–2012, Ecosphere, 6, 1–13, https://doi.org/10.1890/ES15-00294.1, 2015.
Parks Canada: Jasper Wildfire 2024, https://parks.canada.ca/pn-np/ab/jasper/visit/feu-alert-fire/feudeforet-jasper-wildfire (last access: 6 August 2025), 2024.
Parrington, M. and Di Tomaso, E.: Monitoring the 2024 Canada wildfires in CAMS, ECMWF, https://www.ecmwf.int/en/newsletter/181/news/monitoring-2024-canada-wildfires-cams (last access: 6 August 2025), 2024.
Parrington, M. and Di Tomaso, E.: Monitoring the 2024 Canada wildfires in CAMS, https://www.ecmwf.int/en/newsletter/181/news/monitoring-2024-canada-wildfires-cams (last access: 6 August 2025), 2025.
Pasadena Office of the City Manager: Pasadena Drinking Water System Impacted by Eaton Fire, https://www.cityofpasadena.net/city-manager/news/pasadena-drinking-water-system-impacted-by-eaton-fire/ (last access: 6 August 2025), 2025.
Pascoe, J., Shanks, M., Pascoe, B., Clarke, J., Goolmeer, T., Moggridge, B., Williamson, B., Miller, M., Costello, O., and Fletcher, M.: Lighting a pathway: Our obligation to culture and Country, Eco Management Restoration, 24, 153–155, https://doi.org/10.1111/emr.12592, 2023.
Pausas, J. G. and Keeley, J. E.: Evolutionary fire ecology: An historical account and future directions, BioScience, 73, 602–608, https://doi.org/10.1093/biosci/biad059, 2023.
Pausas, J. G., Keeley, J. E., and Bond, W. J.: The role of fire on Earth, Bioscience, biaf132, https://doi.org/10.1093/biosci/biaf132, 2025.
Perkins, O., Kasoar, M., Voulgarakis, A., Smith, C., Mistry, J., and Millington, J. D. A.: A global behavioural model of human fire use and management: WHAM! v1.0, Geosci. Model Dev., 17, 3993–4016, https://doi.org/10.5194/gmd-17-3993-2024, 2024.
Perry, M. C., Vanvyve, E., Betts, R. A., and Palin, E. J.: Past and future trends in fire weather for the UK, Nat. Hazards Earth Syst. Sci., 22, 559–575, https://doi.org/10.5194/nhess-22-559-2022, 2022.
Persson, F.: Large reduction in the number of forest fire operations in 2024, Swedish Firefighters, https://firefighters.se/2024/10/14/stor-minskning-i-antalet-skogsbrandsinsatser-2024/ (last acccess: 6 August 2025), 2024.
Peuch, V.-H., Engelen, R., Rixen, M., Dee, D., Flemming, J., Suttie, M., Ades, M., Agustí-Panareda, A., Ananasso, C., Andersson, E., Armstrong, D., Barré, J., Bousserez, N., Dominguez, J. J., Garrigues, S., Inness, A., Jones, L., Kipling, Z., Letertre-Danczak, J., Parrington, M., Razinger, M., Ribas, R., Vermoote, S., Yang, X., Simmons, A., Marcilla, J. G. de, and Thépaut, J.-N.: The Copernicus Atmosphere Monitoring Service: From Research to Operations, B. Am. Meteorol. Soc., 103, E2650–E2668, https://doi.org/10.1175/BAMS-D-21-0314.1, 2022.
Phillips, C. A., Rogers, B. M., Elder, M., Cooperdock, S., Moubarak, M., Randerson, J. T., and Frumhoff, P. C.: Escalating carbon emissions from North American boreal forest wildfires and the climate mitigation potential of fire management, Sci. Adv., 8, eabl7161, https://doi.org/10.1126/sciadv.abl7161, 2022.
Pismel, G. O., Marchezini, V., Selaya, G., de Paula, Y. A. P., Mendoza, E., and Anderson, L. O.: Wildfire governance in a tri-national frontier of southwestern Amazonia: Capacities and vulnerabilities, Int. J. Disaster Risk Reduct., 86, 103529, https://doi.org/10.1016/j.ijdrr.2023.103529, 2023.
Pivello, V. R., Vieira, I., Christianini, A. V., Ribeiro, D. B., da Silva Menezes, L., Berlinck, C. N., Melo, F. P. L., Marengo, J. A., Tornquist, C. G., Tomas, W. M., and Overbeck, G. E.: Understanding Brazil's catastrophic fires: Causes, consequences and policy needed to prevent future tragedies, Perspectives in Ecology and Conservation, 19, 233–255, https://doi.org/10.1016/j.pecon.2021.06.005, 2021.
Polade, S. D., Pierce, D. W., Cayan, D. R., Gershunov, A., and Dettinger, M. D.: The key role of dry days in changing regional climate and precipitation regimes, Sci. Rep., 4, 4364, https://doi.org/10.1038/srep04364, 2014.
PreventionWeb: The financial costs of the California wildfires, https://www.preventionweb.net/news/financial-costs-california-wildfires (last access: 6 August 2026), 2025.
Pronger, J., Price, R., Schindler, J., Robertson, H., and West, D.: Estimating carbon emissions from peatland fires at Kaimaumau–Motutangi and Awarua wetlands, Manaaki Whenua Landcare Research, https://www.doc.govt.nz/globalassets/documents/conservation/land-and-freshwater/wetlands/estimating-carbon-emissions-from-peatland-fires.pdf (last access: 6 August 2025), 2024.
Pyne, S. J.: Fire: A Brief History, University of Washington Press, https://doi.org/10.1515/9780295803272, 2011.
Radio Bulgaria: Dangerous fire near Sakar mountain now under control, combating the flames in Slavyanka continues, https://bnr.bg/en/post/102030013/dangerous-fire-near-sakar-mountain-now-under-control-combating-the-flames-in-slavyanka-continues (last access: 6 August 2025), 2024.
Reddington, C. L., Butt, E. W., Ridley, D. A., Artaxo, P., Morgan, W. T., Coe, H., and Spracklen, D. V.: Air quality and human health improvements from reductions in deforestation-related fire in Brazil, Nat. Geosci., 8, 768–771, https://doi.org/10.1038/ngeo2535, 2015.
Rémy, S., Veira, A., Paugam, R., Sofiev, M., Kaiser, J. W., Marenco, F., Burton, S. P., Benedetti, A., Engelen, R. J., Ferrare, R., and Hair, J. W.: Two global data sets of daily fire emission injection heights since 2003, Atmos. Chem. Phys., 17, 2921–2942, https://doi.org/10.5194/acp-17-2921-2017, 2017.
Rémy, S., Kipling, Z., Huijnen, V., Flemming, J., Nabat, P., Michou, M., Ades, M., Engelen, R., and Peuch, V.-H.: Description and evaluation of the tropospheric aerosol scheme in the Integrated Forecasting System (IFS-AER, cycle 47R1) of ECMWF, Geosci. Model Dev., 15, 4881–4912, https://doi.org/10.5194/gmd-15-4881-2022, 2022.
Rémy, S., Metzger, S., Huijnen, V., Williams, J. E., and Flemming, J.: An improved representation of aerosol in the ECMWF IFS-COMPO 49R1 through the integration of EQSAM4Climv12 – a first attempt at simulating aerosol acidity, Geosci. Model Dev., 17, 7539–7567, https://doi.org/10.5194/gmd-17-7539-2024, 2024.
Reuters: Forest fires raze parts of India amid heat, dry weather, Reuters, https://www.reuters.com/world/india/forest-fires-raze-parts-india-amid-heat-dry-weather-2024-04-30/ (last access: 6 August 2025), 2024.
Ribeiro, A. F. S., Brando, P. M., Santos, L., Rattis, L., Hirschi, M., Hauser, M., Seneviratne, S. I., and Zscheischler, J.: A compound event-oriented framework to tropical fire risk assessment in a changing climate, Environ. Res. Lett., 17, 065015, https://doi.org/10.1088/1748-9326/ac7342, 2022.
Riedel, L., Schmid, T., Röösli, T., Steinmann, C. B., Schmid, E., Bresch, D. N., and Kropf, C. M.: Ensemble of tragedies: Climate risk model calibration under deep uncertainty, ESS Open Archive [preprint], https://doi.org/10.22541/essoar.174786012.24238776/v1, 2025.
Roads, J., Fujioka, F., Chen, S., and Burgan, R.: Seasonal fire danger forecasts for the USA, Int. J. Wildland Fire, 14, 1–18, https://doi.org/10.1071/WF03052, 2005.
Roberts, G. and Wooster, M. J.: Development of a multi-temporal Kalman filter approach to geostationary active fire detection and fire radiative power (FRP) estimation, Remote Sens. Environ., 152, 392–412, https://doi.org/10.1016/j.rse.2014.06.020, 2014.
Roberts, G., Wooster, M. J., Lauret, N., Gastellu-Etchegorry, J.-P., Lynham, T., and McRae, D.: Investigating the impact of overlying vegetation canopy structures on fire radiative power (FRP) retrieval through simulation and measurement, Remote Sens. Environ., 217, 158–171, https://doi.org/10.1016/j.rse.2018.08.015, 2018.
Román, M. O., Wang, Z., Sun, Q., Kalb, V., Miller, S. D., Molthan, A., Schultz, L., Bell, J., Stokes, E. C., Pandey, B., Seto, K. C., Hall, D., Oda, T., Wolfe, R. E., Lin, G., Golpayegani, N., Devadiga, S., Davidson, C., Sarkar, S., Praderas, C., Schmaltz, J., Boller, R., Stevens, J., Ramos González, O. M., Padilla, E., Alonso, J., Detrés, Y., Armstrong, R., Miranda, I., Conte, Y., Marrero, N., MacManus, K., Esch, T., and Masuoka, E. J.: NASA's Black Marble nighttime lights product suite, Remote Sens. Environ., 210, 113–143, https://doi.org/10.1016/j.rse.2018.03.017, 2018.
Romero-Muñoz, A., Jansen, M., Nuñez, A. M., Toledo, M., Almonacid, R. V., and Kuemmerle, T.: Fires scorching Bolivia's Chiquitano forest, Science, 366, 1082–1082, https://doi.org/10.1126/science.aaz7264, 2019.
Romps, D. M.: Evaluating the Future of Lightning in Cloud-Resolving Models, Geophys. Res. Lett., 46, 14863–14871, https://doi.org/10.1029/2019GL085748, 2019.
Rosleskhoz: Operational data on the forest fire season in Russia, https://rosleshoz.gov.ru/news/federal/rosleskhoz-v-2024-kolichestvo-lesnykh-pozharov-sokratilos-v-1-5-raza-v-sravnenii-so-srednepyatiletnimi-znacheniyami-n11213/ (last access: 6 August 2025), 2024.
Ruf, F., Kone, S., and Bebo, B.: Le boom de l'anacarde en Côte d'Ivoire: transition écologique et sociale des systèmes à base de coton et de cacao, Cah. Agric., 28, 21, https://doi.org/10.1051/cagri/2019019, 2019.
Ruiz, F. C.: Monitoreo espacio-temporal de complejos de incendios forestales: integración de focos de calor viirs, https://proceedings.science/sbsr-2025/trabalhos/monitoreo-espacio-temporal-de-complejos-de-incendios-forestales-integracion-de-f?lang=en (last access: 6 August 2025), 2025.
Ruscalleda-Alvarez, J., Cliff, H., Catt, G., Holmes, J., Burrows, N., Paltridge, R., Russell-Smith, J., Schubert, A., See, P., and Legge, S.: Right-way fire in Australia's spinifex deserts: An approach for measuring management success when fire activity varies substantially through space and time, J. Environ. Manage., 331, 117234, https://doi.org/10.1016/j.jenvman.2023.117234, 2023.
S2ID: Sistema Integrado de Informações sobre Desastres, https://s2id.mi.gov.br/ (last access: 6 August 2025), 2024.
Saini, V.: A “Himalayan” Crisis: Understanding Wildfires in Uttarakhand and India, Climate Fact Checks, https://climatefactchecks.org/a-himalayan-crisis-understanding-wildfires-in-uttarakhand-and-india/ (last access: 6 August 2025), 2024.
Sanju, P., Gaganshila, K., and Mahesh, K.: Over 230 homes, animal sheds gutted in multiple fires across western Nepal since Saturday, The Kathmandu Post, https://kathmandupost.com/national/2024/04/22/over-230-homes-animal-sheds-gutted-in-multiple-fires-across-western-nepal-since-saturday (last access: 6 August 2025), 2024.
San-Miguel-Ayanz, J., Durrant, T., Boca, R., Maianti, P., Libertà, G., Jacome Felix Oom, D., Branco, A., De Rigo, D., Suarez-Moreno, M., Ferrari, D., Roglia, E., Scionti, N., Broglia, M., and Sedano, F.: Advance report on forest fires in Europe, Middle East and North Africa 2024, Publications Office of the European Union, https://doi.org/10.2760/1264626, 2025.
Santos, F. C., Chaves, F. M., Negri, R. G., and Massi, K. G.: Fires in Pantanal: The link to Agriculture, Conversions in Cerrado, and Hydrological Changes, Wetlands, 44, 75, https://doi.org/10.1007/s13157-024-01832-5, 2024.
Santos, J. L., Yanai, A. M., Graça, P. M. L. A., Correia, F. W. S., and Fearnside, P. M.: Amazon deforestation: simulated impact of Brazil's proposed BR-319 highway project, Environ. Monit. Assess., 195, 1217, https://doi.org/10.1007/s10661-023-11820-7, 2023.
Schleicher, J., Schaafsma, M., Burgess, N. D., Sandbrook, C., Danks, F., Cowie, C., and Vira, B.: Poorer without It? The Neglected Role of the Natural Environment in Poverty and Wellbeing, Sustainable Development, 26, 83–98, https://doi.org/10.1002/sd.1692, 2018.
Schroeder, W., Prins, E., Giglio, L., Csiszar, I., Schmidt, C., Morisette, J., and Morton, D.: Validation of GOES and MODIS active fire detection products using ASTER and ETM+ data, Remote Sens. Environ., 112, 2711–2726, https://doi.org/10.1016/j.rse.2008.01.005, 2008.
Sellar, A. A., Jones, C. G., Mulcahy, J. P., Tang, Y., Yool, A., Wiltshire, A., O'Connor, F. M., Stringer, M., Hill, R., Palmieri, J., Woodward, S., de Mora, L., Kuhlbrodt, T., Rumbold, S. T., Kelley, D. I., Ellis, R., Johnson, C. E., Walton, J., Abraham, N. L., Andrews, M. B., Andrews, T., Archibald, A. T., Berthou, S., Burke, E., Blockley, E., Carslaw, K., Dalvi, M., Edwards, J., Folberth, G. A., Gedney, N., Griffiths, P. T., Harper, A. B., Hendry, M. A., Hewitt, A. J., Johnson, B., Jones, A., Jones, C. D., Keeble, J., Liddicoat, S., Morgenstern, O., Parker, R. J., Predoi, V., Robertson, E., Siahaan, A., Smith, R. S., Swaminathan, R., Woodhouse, M. T., Zeng, G., and Zerroukat, M.: UKESM1: Description and Evaluation of the U.K. Earth System Model, J. Adv. Model. Earth Sy., 11, 4513–4558, https://doi.org/10.1029/2019MS001739, 2019.
Seneviratne, S. I., Zhang, X., Adnan, M., Badi, W., Dereczynski, C., Di Luca, A., Ghosh, S., Iskandar, I., Kossin, J., Lewis, S., Otto, F., Pinto, I., Satoh, M., Vicente-Serrano, S. M., Wehner, M., and Zhou, B.: Weather and Climate Extreme Events in a Changing Climate, in Climate Change 2021: The Physical Science Basis. Contribution of Working Group I to the Sixth Assessment Report of the Intergovernmental Panel on Climate Change, edited by: Masson-Delmotte, V., Zhai, P., Pirani, A., Connors, S. L., Péan, C., Berger, S., Caud, N., Chen, Y., Goldfarb, L., Gomis, M. I., Huang, M., Leitzell, K., Lonnoy, E., Matthews, J. B. R., Maycock, T. K., Waterfield, T., Yelekçi, O., Yu, R., and Zhou, B., Cambridge University Press, Cambridge, United Kingdom and New York, NY, USA, 1513–1766, https://doi.org/10.1017/9781009157896.013, 2021.
Serrah, M.: After years of wildfires, Algeria tames the flames, https://www.context.news/climate-risks/after-years-of-wildfires-algeria-tames-the-flames (last access: 6 August 2025), Context News, 2024.
Shapiro, A., d'Annunzio, R., Desclée, B., Jungers, Q., Kondjo, H. K., Iyanga, J. M., Gangyo, F. I., Nana, T., Obame, C. V., Milandou, C., Rambaud, P., Sonwa, D. J., Mertens, B., Tchana, E., Khasa, D., Bourgoin, C., Ouissika, C. B., and Kipute, D. D.: Small scale agriculture continues to drive deforestation and degradation in fragmented forests in the Congo Basin (2015–2020), Land Use Policy, 134, 106922, https://doi.org/10.1016/j.landusepol.2023.106922, 2023.
Shapiro, A. C., Bernhard, K. P., Zenobi, S., Müller, D., Aguilar-Amuchastegui, N., and d'Annunzio, R.: Proximate Causes of Forest Degradation in the Democratic Republic of the Congo Vary in Space and Time, Front. Conserv. Sci., 2, 690562, https://doi.org/10.3389/fcosc.2021.690562, 2021.
Shepherd, G., Warner, K., and Hogarth, N.: Forests and poverty: how has our understanding of the relationship been changed by experience?, Int. Forest. Rev., 22, 29–43, https://doi.org/10.1505/146554820829523907, 2020.
Shmuel, A., Lazebnik, T., Glickman, O., Heifetz, E., and Price, C.: Global lightning-ignited wildfires prediction and climate change projections based on explainable machine learning models, Sci. Rep., 15, 7898, https://doi.org/10.1038/s41598-025-92171-w, 2025.
Shradha, K. and Nitu, R.: Rampant forest fires ravaging Nepal, Governance Monitoring Centre Nepal, https://gmcnepal.org/publications/climate-window/rampant-forest-fires-ravaging-nepal/ (last access: 6 August 2025), 2024.
Shyamsundar, P., Springer, N. P., Tallis, H., Polasky, S., Jat, M. L., Sidhu, H. S., Krishnapriya, P. P., Skiba, N., Ginn, W., Ahuja, V., Cummins, J., Datta, I., Dholakia, H. H., Dixon, J., Gerard, B., Gupta, R., Hellmann, J., Jadhav, A., Jat, H. S., Keil, A., Ladha, J. K., Lopez-Ridaura, S., Nandrajog, S. P., Paul, S., Ritter, A., Sharma, P. C., Singh, R., Singh, D., and Somanathan, R.: Fields on fire: Alternatives to crop residue burning in India, Science, 365, 536–538, https://doi.org/10.1126/science.aaw4085, 2019.
Silva, P. S., Geirinhas, J. L., Lapere, R., Laura, W., Cassain, D., Alegría, A., and Campbell, J.: Heatwaves and fire in Pantanal: Historical and future perspectives from CORDEX-CORE, J. Environ. Manage., 323, 116193, https://doi.org/10.1016/j.jenvman.2022.116193, 2022.
Silveira, M. V. F., Petri, C. A., Broggio, I. S., Chagas, G. O., Macul, M. S., Leite, C. C. S. S., Ferrari, E. M. M., Amim, C. G. V., Freitas, A. L. R., Motta, A. Z. V., Carvalho, L. M. E., Silva Junior, C. H. L., Anderson, L. O., and Aragão, L. E. O. C.: Drivers of Fire Anomalies in the Brazilian Amazon: Lessons Learned from the 2019 Fire Crisis, Land, 9, 516, https://doi.org/10.3390/land9120516, 2020.
Silveira, M. V. F., Silva-Junior, C. H. L., Anderson, L. O., and Aragão, L. E. O. C.: Amazon fires in the 21st century: The year of 2020 in evidence, Global Ecol. Biogeogr., 31, 2026–2040, https://doi.org/10.1111/geb.13577, 2022.
SitRep: No. 77 – Informe de Situación Nacional. Incendios Forestales, https://www.gestionderiesgos.gob.ec/wp-content/uploads/2024/11/SitRep-No.-77-Incendios-Forestales-01012024-al-21112024.pdf (last access: 6 August 2025), 2024.
Skakun, R., Castilla, G., and Jain, P.: Mapping wildfires in Canada with Landsat MSS to extend the National Burned Area Composite (NBAC) time series back to 1972, Int. J. Wildland Fire, 33, https://doi.org/10.1071/WF24138, 2024.
Smith, S., Geden, O., Nemet, G., Gidden, M., Lamb, W., Powis, C., Bellamy, R., Callaghan, M., Cowie, A., Cox, E., Fuss, S., Gasser, T., Grassi, G., Greene, J., Lueck, S., Mohan, A., Müller-Hansen, F., Peters, G., Pratama, Y., Repke, T., Riahi, K., Schenuit, F., Steinhauser, J., Strefler, J., Valenzuela, J., and Minx, J.: State of Carbon Dioxide Removal – 1st Edition, OSF [data set], https://doi.org/10.17605/OSF.IO/W3B4Z, 2023.
Sofiev, M., Ermakova, T., and Vankevich, R.: Evaluation of the smoke-injection height from wild-land fires using remote-sensing data, Atmos. Chem. Phys., 12, 1995–2006, https://doi.org/10.5194/acp-12-1995-2012, 2012.
Song, Z., Zhang, L., Tian, C., Fu, Q., Shen, Z., Zhang, R., Liu, D., and Cui, S.: Development of a high-spatial-resolution annual emission inventory of greenhouse gases from open straw burning in Northeast China from 2001 to 2020, Atmos. Chem. Phys., 24, 13101–13113, https://doi.org/10.5194/acp-24-13101-2024, 2024.
Soro, T. D., N'Dri, B., Dembélé, B., Kpre, A. J. N., Kouassi, K., Kpangba, K., Kouamé, Y., and Koné, M.: Périodes des feux de végétation en fonction des secteurs phytogéographiques de Côte d'Ivoire: approche par télédétection et perceptions des populations, Research Journal of Environmental and Earth Sciences, 6, 8–17, 2020.
Soro, T. D., Koné, M., N'Dri, A. B., and N'Datchoh, E. T.: Identified main fire hotspots and seasons in Côte d'Ivoire (West Africa) using MODIS fire data, South African Journal of Science, 117, https://doi.org/10.17159/sajs.2021/7659, 2021.
Spuler, F. and Wessel, J.: State of Wildfires 2024–2025: JULES-ES bias adjustment, Zenodo [code], https://doi.org/10.5281/ZENODO.15792440, 2025.
Stalhandske, Z., Steinmann, C. B., Meiler, S., Sauer, I. J., Vogt, T., Bresch, D. N., and Kropf, C. M.: Global multi-hazard risk assessment in a changing climate, Sci. Rep., 14, 5875, https://doi.org/10.1038/s41598-024-55775-2, 2024.
Steinmann, C. B.: carmensteinmann/State-of-Wildfires_2024–2025_CLIMADA: State-of-Wildfires_2024–2025 CLIMADA v0.1.0, Zenodo [code], https://doi.org/10.5281/zenodo.15831766, 2025.
Steinmann, C. B., Meier, S., Jones, M., Koh, J., Kropf, C., Bresch, D. N., and Hantson, S.: State of Wildfires 2024–2025: Regional Summaries of Asset Exposure and Population Exposure to Burned Area by Continent, Biome, Country, and Administrative Region (2025.0), Zenodo [data set], https://doi.org/10.5281/ZENODO.15755007, 2025.
Stephens, S. L., McIver, J. D., Boerner, R. E. J., Fettig, C. J., Fontaine, J. B., Hartsough, B. R., Kennedy, P. L., and Schwilk, D. W.: The Effects of Forest Fuel-Reduction Treatments in the United States, BioScience, 62, 549–560, https://doi.org/10.1525/bio.2012.62.6.6, 2012.
Stott, P. A., Stone, D. A., and Allen, M. R.: Human contribution to the European heatwave of 2003, Nature, 432, 610–614, https://doi.org/10.1038/nature03089, 2004.
Sulla-Menashe, D., Gray, J. M., Abercrombie, S. P., and Friedl, M. A.: Hierarchical mapping of annual global land cover 2001 to present: The MODIS Collection 6 Land Cover product, Remote Sens. Environ., 222, 183–194, https://doi.org/10.1016/j.rse.2018.12.013, 2019.
Swain, D.: As extreme California precipitation dipole persists, a high-end offshore wind/fire weather event may unfold in SoCal this week, https://weatherwest.com/archives/43171 (last access: 6 August 2025), Weather West, 2025.
Swain, D. L., Langenbrunner, B., Neelin, J. D., and Hall, A.: Increasing precipitation volatility in twenty-first-century California, Nat. Clim. Change, 8, 427–433, https://doi.org/10.1038/s41558-018-0140-y, 2018.
Swain, D. L., Abatzoglou, J. T., Kolden, C., Shive, K., Kalashnikov, D. A., Singh, D., and Smith, E.: Climate change is narrowing and shifting prescribed fire windows in western United States, Commun. Earth Environ., 4, 340, https://doi.org/10.1038/s43247-023-00993-1, 2023.
Swain, D. L., Prein, A. F., Abatzoglou, J. T., Albano, C. M., Brunner, M., Diffenbaugh, N. S., Singh, D., Skinner, C. B., and Touma, D.: Hydroclimate volatility on a warming Earth, Nat. Rev. Earth Environ., 6, 35–50, https://doi.org/10.1038/s43017-024-00624-z, 2025a.
Swain, D. L., Abatzoglou, J. T., Albano, C. M., Brunner, M. I., Diffenbaugh, N. S., Kolden, C., Prein, A. F., Singh, D., Skinner, C. B., Swetnam, T. W., and Touma, D.: Increasing Hydroclimatic Whiplash Can Amplify Wildfire Risk in a Warming Climate, Glob. Change Biol., 31, e70075, https://doi.org/10.1111/gcb.70075, 2025b.
Swart, N. C., Cole, J. N. S., Kharin, V. V., Lazare, M., Scinocca, J. F., Gillett, N. P., Anstey, J., Arora, V., Christian, J. R., Hanna, S., Jiao, Y., Lee, W. G., Majaess, F., Saenko, O. A., Seiler, C., Seinen, C., Shao, A., Sigmond, M., Solheim, L., von Salzen, K., Yang, D., and Winter, B.: The Canadian Earth System Model version 5 (CanESM5.0.3), Geosci. Model Dev., 12, 4823–4873, https://doi.org/10.5194/gmd-12-4823-2019, 2019.
Tang, W., Llort, J., Weis, J., Perron, M. M. G., Basart, S., Li, Z., Sathyendranath, S., Jackson, T., Sanz Rodriguez, E., Proemse, B. C., Bowie, A. R., Schallenberg, C., Strutton, P. G., Matear, R., and Cassar, N.: Widespread phytoplankton blooms triggered by 2019–2020 Australian wildfires, Nature, 597, 370–375, https://doi.org/10.1038/s41586-021-03805-8, 2021.
Tang, Y., Rumbold, S., Ellis, R., Kelley, D., Mulcahy, J., Sellar, A., Walton, J., and Jones, C.: MOHC UKESM1.0-LL model output prepared for CMIP6 CMIP, World Data Center for Climate (WDCC) at DKRZ [data set], https://www.wdc-climate.de/ui/entry?acronym=C6_4662099 last access: 6 August 2025), 2019.
Tavakoli Hafshejani, M., Nasrollahzadeh, M., and Mirkhani, V.: Better preparation for Iran's forest fires, Science, 377, 379–379, https://doi.org/10.1126/science.add5194, 2022.
Terrill, M.: Measuring the supply chain impact of the LA fires, ASU, https://news.asu.edu/20250121-business-and-entrepreneurship-measuring-supply-chain-impact-la-fires (last access: 6 August 2025), 2025.
Texas House of Representatives: Texas House of Representatives Investigative Committee on the Panhandle Wildfires, https://www.house.texas.gov/pdfs/committees/reports/interim/88interim/House-Interim-Committee-on-The-Panhandle-Wildfires-Report.pdf (last access: 6 August 2025), 2024.
Teymoor Seydi, S., Abatzoglou, J. T., Jones, M. W., Kolden, C. A., Filippelli, G., Hurteau, M. D., AghaKouchak, A., Luce, C. H., Miao, C., and Sadegh, M.: Increasing global human exposure to wildland fires despite declining burned area, Science, 389, 826–829, https://doi.org/10.1126/science.adu6408, 2025.
The Arab Weekly: After years of wildfires, Algeria tames the flames, AW, https://thearabweekly.com/after-years-wildfires-algeria-tames-flames (last access: 6 August 2025), 2024.
The Nation: Turkey wildfire toll hits 15 as experts flag faulty wires, The Nation, https://www.nation.com.pk/25-Jun-2024/turkey-wildfire-toll-hits-15-as-experts-flag-faulty-wires (last access: 6 August 2025), 2024.
Thiem, H.: Unusual fire risk across the Northeast in fall of 2024, https://www.climate.gov/news-features/event-tracker/unusual-fire-risk-across-northeast-fall-2024 (last access: 6 August 2025), NOAA, 2024.
Tomshin, O. and Solovyev, V.: Features of the Extreme Fire Season of 2021 in Yakutia (Eastern Siberia) and Heavy Air Pollution Caused by Biomass Burning, Remote Sensing, 14, 4980, https://doi.org/10.3390/rs14194980, 2022.
Toreti, A., Bavera, D., Acosta, N. J., Acquafresca, L., Azas, K., Barbosa, P., De, J. A., Ficchi, A., Fioravanti, G., Grimaldi, S., Hrast, E. A., Magni, D., Mazzeschi, M., Mccormick, N., Salamon, P., Santos, N. S., and Volpi, D.: Global Drought Overview September 2024, Publications Office of the European Union, Luxembourg, JRC139423, https://doi.org/10.2760/7511271, 2024.
Torres-Vázquez, M. Á., Herrera, S., Gincheva, A., Halifa-Marín, A., Cavicchia, L., Di Giuseppe, F., Montávez, J. P., and Turco, M.: Enhancing seasonal fire predictions with hybrid dynamical and random forest models, npj Nat. Hazards, 2, 1–10, https://doi.org/10.1038/s44304-025-00069-4, 2025a.
Torres-Vázquez, M. Á., Di Giuseppe, F., Moreno-Torreira, A., Gincheva, A., Jerez, S., and Turco, M.: Large increase in extreme fire weather synchronicity over Europe, Environ. Res. Lett., 20, 024045, https://doi.org/10.1088/1748-9326/ada8c2, 2025b.
Trigg, S., Dempewolf, J., Elgamri, M., Justice, C., and Gorsevski, V.: Fire and land use change heighten tensions between pastoral nomads and mechanized farmers in Kordofan and White Nile States, Sudan, J. Land Use Sci., 7, 275–288, https://doi.org/10.1080/1747423X.2011.565372, 2011.
Turco, M., Jones, M. W., and Di Giuseppe, F.: State of Wildfires 2024–2025: Anomalies in Extreme Fire Weather Days by Continent, Biome, Country, and Administrative Region, Zenodo [data set], https://doi.org/10.5281/zenodo.15538595, 2025.
Tyukavina, A., Hansen, M. C., Potapov, P., Parker, D., Okpa, C., Stehman, S. V., Kommareddy, I., and Turubanova, S.: Congo Basin forest loss dominated by increasing smallholder clearing, Sci. Adv., 4, eaat2993, https://doi.org/10.1126/sciadv.aat2993, 2018.
UK Environment Agency: Water situation: May 2025 summary, https://www.gov.uk/government/publications/water-situation-national-monthly-reports-for-england-2025/water-situation-may-2025-summary (last access: 6 August 2025), 2025.
United Nations Environment Programme (UNEP): Spreading like Wildfire: The Rising Threat of Extraordinary Landscape Fires, https://www.unep.org/resources/report/spreading-wildfire-rising-threat-extraordinary-landscape-fires (last access 6 August 2025), 2022.
United Nations Population Division: World Population Prospects 2023, https://population.un.org/wpp/ (last access: 4 July 2025), 2023.
United States Geological Survey (USGS): Debris flow in the 2025 Eaton Fire burn area, California, https://www.usgs.gov/media/images/debris-flow-2025-eaton-fire-burn-area-california (last access: 6 August 2025), 2025a.
United States Geological Survey (USGS): Greater Los Angeles Wildfires – January 2025, https://www.usgs.gov/media/before-after/greater-los-angeles-wildfires-january-2025 (last access: 6 August 2025), 2025b.
Urban Land Institute: Project Recovery: Rebuilding Los Angeles after the January 2025 Wildfires, https://knowledge.uli.org/en/reports/research-reports/2025/project-recovery-rebuilding-los-angeles-after-the-january-2025-wildfires (last access: 6 August 2025), 2025.
US Environmental Protection Agency (US EPA): Air Quality System (AQS), https://www.epa.gov/aqs (last access: 6 August 2025), 2025.
US Forest Service: 2024 Wildfire Year: Record-breaking Intensity and Resilience, USDA Forest Service Pacific Northwest Region, https://www.fs.usda.gov/sites/nfs/files/legacy-media/r06/Updated%202024%20Fire%20Summary%2012032024.pdf (last access: 6 August 2025), 2024.
Valor Económico: Aumento dos custos operacionais cria barreiras no negócio do carvão vegetal, Valor Económico, https://valoreconomico.co.ao/artigo/aumento-dos-custos-operacionais-cria-barreiras-no-negocio-do-carvao-vegetal (last access: 6 August 2025), 2024.
Van Dijk, A. I. J. M., Beck, H. E., Boergens, E., de Jeu, R. A. M., Dorigo, W. A., Edirisinghe, E., Forootan, E., Guo, E., Güntner, A., Hou, J., Mehrnegar, N., Mo, S., Preimesberger, W., Rahman, J., and Rozas Larraondo, P.: Global Water Monitor 2024, Summary Report, https://www.globalwater.online/globalwater/report/index.html (last access: 6 August 2025), 2025.
Van Wagner, C. E.: Development and structure of the Canadian Forest Fire Weather Index System, Forestry Technical Report 35, Canadian Forestry Service, Ottowa, https://cfs.nrcan.gc.ca/pubwarehouse/pdfs/19927.pdf (last access: 6 August 2025), 1987.
Vautard, R., Yiou, P., Otto, F., Stott, P., Christidis, N., van Oldenborgh, G. J., and Schaller, N.: Attribution of human-induced dynamical and thermodynamical contributions in extreme weather events, Environ. Res. Lett., 11, 114009, https://doi.org/10.1088/1748-9326/11/11/114009, 2016.
Verhegghen, A., Eva, H., Ceccherini, G., Achard, F., Gond, V., Gourlet-Fleury, S., and Cerutti, P.: The Potential of Sentinel Satellites for Burnt Area Mapping and Monitoring in the Congo Basin Forests, Remote Sensing, 8, 986, https://doi.org/10.3390/rs8120986, 2016.
Verhoeven, E. M., Murray, B. R., Dickman, C. R., Wardle, G. M., and Greenville, A. C.: Fire and rain are one: extreme rainfall events predict wildfire extent in an arid grassland, Int. J. Wildland Fire, 702–711, https://doi.org/10.1071/WF19087, 2020.
Viana, C. R. S., dos Santos, M. C., Muniz, C. C., Filho, M. d S., Ignácio, A. R. A., Vitorino, B. D., da Frota, A. V. B., Bogoni, J. A., Castrillon, S. K. I., Caldas, K. A. dP, da Silva, S. A. A., Rossete, A. N., da Silva, D. J., Iocca, F. A. dS, dos Santos, F. L., Lázaro, W. L., and Oliveira Junior, E. S.: Impactos das Queimadas na Saúde da População de Cáceres, Pantanal, em 10 de Setembro de 2024. Nota Técnica Conjunta No04/2024. Universidade do Estado do Mato Grosso (UNEMAT), https://lipan.com.br/wp-content/uploads/2024/09/NOTA_TECNICA_CONJUNTA_04_20242.pdf (last access: 6 August 2025), 2024.
VisiteHuila: Desflorestação da Região Sul é Alarmante, https://visitehuila.com/en/noticias-eventos/noticias/desflorestacao-regiao-sul-alarmante.html (last access: 6 August 2025), 2024.
Vitolo, C., Di Giuseppe, F., Barnard, C., Coughlan, R., San-Miguel-Ayanz, J., Libertá, G., and Krzeminski, B.: ERA5-based global meteorological wildfire danger maps, Sci. Data, 7, 216, https://doi.org/10.1038/s41597-020-0554-z, 2020.
Wang, Z., Peñuelas, J., Tagesson, T., Smith, W. K., Wu, M., He, W., Sitch, S., and Wang, S.: Evolution of Global Terrestrial Gross Primary Productivity Trend, Ecosyst Health Sustain, 10, https://doi.org/10.34133/ehs.0278, 2024.
Ward, M., Tulloch, A. I. T., Radford, J. Q., Williams, B. A., Reside, A. E., Macdonald, S. L., Mayfield, H. J., Maron, M., Possingham, H. P., Vine, S. J., O'Connor, J. L., Massingham, E. J., Greenville, A. C., Woinarski, J. C. Z., Garnett, S. T., Lintermans, M., Scheele, B. C., Carwardine, J., Nimmo, D. G., Lindenmayer, D. B., Kooyman, R. M., Simmonds, J. S., Sonter, L. J., and Watson, J. E. M.: Impact of 2019–2020 mega-fires on Australian fauna habitat, Nat. Ecol. Evol., 4, 1321–1326, https://doi.org/10.1038/s41559-020-1251-1, 2020.
van der Werf, G. R., Randerson, J. T., Giglio, L., Collatz, G. J., Kasibhatla, P. S., and Arellano Jr., A. F.: Interannual variability in global biomass burning emissions from 1997 to 2004, Atmos. Chem. Phys., 6, 3423–3441, https://doi.org/10.5194/acp-6-3423-2006, 2006.
van der Werf, G. R., Randerson, J. T., Giglio, L., Collatz, G. J., Mu, M., Kasibhatla, P. S., Morton, D. C., DeFries, R. S., Jin, Y., and van Leeuwen, T. T.: Global fire emissions and the contribution of deforestation, savanna, forest, agricultural, and peat fires (1997–2009), Atmos. Chem. Phys., 10, 11707–11735, https://doi.org/10.5194/acp-10-11707-2010, 2010.
van der Werf, G. R., Randerson, J. T., Giglio, L., van Leeuwen, T. T., Chen, Y., Rogers, B. M., Mu, M., van Marle, M. J. E., Morton, D. C., Collatz, G. J., Yokelson, R. J., and Kasibhatla, P. S.: Global fire emissions estimates during 1997–2016, Earth Syst. Sci. Data, 9, 697–720, https://doi.org/10.5194/essd-9-697-2017, 2017.
Volodymyr, S. and Andiy, T.: Grand fire in the Danube delta biosphere reserve, in: Proceedings of Development of innovation systems: trends, challenges, prospects, 4–7 March 2025, Hamburg, Germany, 44–47, https://www.researchgate.net/publication/389592052_GRAND_FIRE_IN_THE_DANUBE_DELTA_BIOSPHERE_RESERVE (last access: 6 August 2025), 2025.
WHO: WHO global air quality guidelines: particulate matter (PM2.5 and PM10), ozone, nitrogen dioxide, sulfur dioxide and carbon monoxide, https://www.who.int/publications/i/item/9789240034228 (last access: 6 August 2025), 2021.
Wiedinmyer, C., Kimura, Y., McDonald-Buller, E. C., Emmons, L. K., Buchholz, R. R., Tang, W., Seto, K., Joseph, M. B., Barsanti, K. C., Carlton, A. G., and Yokelson, R.: The Fire Inventory from NCAR version 2.5: an updated global fire emissions model for climate and chemistry applications, Geosci. Model Dev., 16, 3873–3891, https://doi.org/10.5194/gmd-16-3873-2023, 2023.
Wikipedia: List of California wildfires, https://en.wikipedia.org/wiki/List_of_California_wildfires (last access: 6 August 2025), 2025.
Williams, A. P., Abatzoglou, J. T., Gershunov, A., Guzman-Morales, J., Bishop, D. A., Balch, J. K., and Lettenmaier, D. P.: Observed Impacts of Anthropogenic Climate Change on Wildfire in California, Earth's Future, 7, 892–910, https://doi.org/10.1029/2019EF001210, 2019.
Wimberly, M. C., Wanyama, D., Doughty, R., Peiro, H., and Crowell, S.: Increasing Fire Activity in African Tropical Forests Is Associated With Deforestation and Climate Change, Geophys. Res. Lett., 51, e2023GL106240, https://doi.org/10.1029/2023GL106240, 2024.
Woolcott, O. O.: Los Angeles County in flames: responsibilities on fire, The Lancet Regional Health – Americas, 42, https://doi.org/10.1016/j.lana.2025.101005, 2025.
Wooster, M. J., Roberts, G. J., Giglio, L., Roy, D. P., Freeborn, P. H., Boschetti, L., Justice, C., Ichoku, C., Schroeder, W., Davies, D., Smith, A. M. S., Setzer, A., Csiszar, I., Strydom, T., Frost, P., Zhang, T., Xu, W., de Jong, M. C., Johnston, J. M., Ellison, L., Vadrevu, K., Sparks, A. M., Nguyen, H., McCarty, J., Tanpipat, V., Schmidt, C., and San-Miguel-Ayanz, J.: Satellite remote sensing of active fires: History and current status, applications and future requirements, Remote Sens. Environ., 267, 112694, https://doi.org/10.1016/j.rse.2021.112694, 2021.
Working on Fire: 34 lives, 4 million hectares, billions of rands in damage: SA's deadliest wildfire season, https://workingonfire.org/34-lives-4-million-hectares-billions-of-rands-in-damage-sas-deadliest-wildfire-season/ (last access: 6 August 2025), 2024.
World Bank: Policy Note: Managing Wildfires in a Changing Climate, Washington DC, https://www.profor.info/sites/default/files/PROFOR_ManagingWildfires_2020_final.pdf (last access: 6 August 2025), 2020.
World Bank: Financially Prepared: The Case for Pre-positioned Finance in European Union Member States and Countries under EU Civil Protection Mechanism, Washington DC, https://civil-protection-knowledge-network.europa.eu/system/files/2024-05/Financially%20Prepared%20-The%20Case%20for%20Pre-positioned%20Finance.pdf (last access: 6 August 2025), 2024a.
World Bank: Priorizar a agricultura angolana para desbloquear a diversificação económica, https://www.worldbank.org/pt/news/feature/2024/03/28/prioritizing-afe-angolan-agriculture-to-unlock-economic-diversification (last access: 6 August 2025), 2024b.
World Bank: Wealth Accounting, World Bank [data set], https://datacatalog.worldbank.org/search/dataset/0042066 (last access: 6 August 2025), 2024c.
World Meteorological Organization (WMO): State of the Global Climate 2024, https://library.wmo.int/idurl/4/69455 (last access: 6 August 2025), 2025.
World Resources Institute: After Record-Breaking Fires, Can Indonesia's New Policies Turn Down the Heat?, https://www.wri.org/insights/after-record-breaking-fires-can-indonesias-new-policies-turn-down-heat (last access: 6 August 2025), 2016.
World Resources Institute: Fires Drove Record-breaking Tropical Forest Loss in 2024, https://gfr.wri.org/latest-analysis-deforestation-trends (last access: 6 August 2025), 2025.
World Wildlife Fund: Technical Note: Early Warning to Mitigate Impacts of Drought in the Pantanal, https://www.wwf.org.br/?89121/Pantanal-may-face-a-historic-water-crisis-in-2024 (last access: 6 August 2025), 2024.
Worldwide Fund for Nature (WWF-Brasil): Com mais de 4 mil focos de fogo em 2024, Roraima vive emergência humanitária, https://www.wwf.org.br/?88320/Com-mais-de-4-mil-focos-de-fogo-em-2024-Roraima-vive-emergencia-humanitaria (last access: 6 August 2025), 2024.
Xu, R., Ye, T., Yue, X., Yang, Z., Yu, W., Zhang, Y., Bell, M. L., Morawska, L., Yu, P., Zhang, Y., Wu, Y., Liu, Y., Johnston, F., Lei, Y., Abramson, M. J., Guo, Y., and Li, S.: Global population exposure to landscape fire air pollution from 2000 to 2019, Nature, 621, 521–529, https://doi.org/10.1038/s41586-023-06398-6, 2023.
Xu, R., Ye, T., Huang, W., Yue, X., Morawska, L., Abramson, M. J., Chen, G., Yu, P., Liu, Y., Yang, Z., Zhang, Y., Wu, Y., Yu, W., Wen, B., Zhang, Y., Hales, S., Lavigne, E., Saldiva, P. H. N., Coelho, M. S. Z. S., Matus, P., Roye, D., Klompmaker, J., Mistry, M., Breitner, S., Zeka, A., Raz, R., Tong, S., Johnston, F. H., Schwartz, J., Gasparrini, A., Guo, Y., and Li, S.: Global, regional, and national mortality burden attributable to air pollution from landscape fires: a health impact assessment study, The Lancet, 404, 2447–2459, https://doi.org/10.1016/S0140-6736(24)02251-7, 2024.
Yonhap News Agency: Death toll from wildfires rises to 31, https://en.yna.co.kr/view/AEN20250402001400315 (last access: 6 August 2025), 2025.
Yukimoto, S., Kawai, H., Koshiro, T., Oshima, N., Yoshida, K., Urakawa, S., Tsujino, H., Deushi, M., Tanaka, T., Hosaka, M., Yabu, S., Yoshimura, H., Shindo, E., Mizuta, R., Obata, A., Adachi, Y., and Ishii, M.: The Meteorological Research Institute Earth System Model Version 2.0, MRI-ESM2.0: Description and Basic Evaluation of the Physical Component, J. Meteorol. Soc. Jpn. Ser. II, 97, 931–965, https://doi.org/10.2151/jmsj.2019-051, 2019.
Zachariah, M., Clarke, B., Vahlberg, M., Pereira Marghidan, C., Singh, R., Sengupta, S., Otto, F., Pinto, I., Mistry, M., Arrighi, J., Gale, S., and Rodriguez, L.: Climate change made the deadly heatwaves that hit millions of highly vulnerable people across large parts of Asia more frequent and extreme, Imperial College London, https://doi.org/10.25561/111274, 2024.
Zargar, A. R.: India's worsening, “severe plus” air pollution forces even more dramatic safety measures, CBS News, https://www.cbsnews.com/news/delhi-air-pollution-smog-severe-plus-india-safety-measures-restrictions/ (last access: 6 August 2025), 2024.
Zhang, Y., Xu, R., Huang, W., Ye, T., Yu, P., Yu, W., Wu, Y., Liu, Y., Yang, Z., Wen, B., Ju, K., Song, J., Abramson, M. J., Johnson, A., Capon, A., Jalaludin, B., Green, D., Lavigne, E., Johnston, F. H., Morgan, G. G., Knibbs, L. D., Zhang, Y., Marks, G., Heyworth, J., Arblaster, J., Guo, Y. L., Morawska, L., Coelho, M. S. Z. S., Saldiva, P. H. N., Matus, P., Bi, P., Hales, S., Hu, W., Phung, D., Guo, Y., and Li, S.: Respiratory risks from wildfire-specific PM2.5 across multiple countries and territories, Nat. Sustain., 8, 474–484, https://doi.org/10.1038/s41893-025-01533-9, 2025.
Zhao, Z., Li, W., Ciais, P., Santoro, M., Cartus, O., Peng, S., Yin, Y., Yue, C., Yang, H., Yu, L., Zhu, L., and Wang, J.: Fire enhances forest degradation within forest edge zones in Africa, Nat. Geosci., 14, 479–483, https://doi.org/10.1038/s41561-021-00763-8, 2021.
Zheng, B., Ciais, P., Chevallier, F., Chuvieco, E., Chen, Y., and Yang, H.: Increasing forest fire emissions despite the decline in global burned area, Sci. Adv., 7, eabh2646, https://doi.org/10.1126/sciadv.abh2646, 2021.
Zheng, B., Ciais, P., Chevallier, F., Yang, H., Canadell, J. G., Chen, Y., Van Der Velde, I. R., Aben, I., Chuvieco, E., Davis, S. J., Deeter, M., Hong, C., Kong, Y., Li, H., Li, H., Lin, X., He, K., and Zhang, Q.: Record-high CO2 emissions from boreal fires in 2021, Science, 379, 912–917, https://doi.org/10.1126/science.ade0805, 2023.
Zubkova, M., Boschetti, L., Abatzoglou, J. T., and Giglio, L.: Changes in Fire Activity in Africa from 2002 to 2016 and Their Potential Drivers, Geophys. Res. Lett., 46, 7643–7653, https://doi.org/10.1029/2019GL083469, 2019.
Zubkova, M., Giglio, L., Boschetti, L., Roy, D., Hall, J., and Humber, M. L.: The NASA Visible Infrared Imaging Radiometer Suite (VIIRS) burned area product – VNP64A1, AGU Fall Meeting Abstracts, B13I-1644, https://ui.adsabs.harvard.edu/abs/2024AGUFMB13I.1644Z (last access: 6 August 2025), 2024.
- Abstract
- Introduction
- Extreme wildfire events of 2024–2025
- Impact assessments
- Diagnosing causes and assessing predictability
- Attribution to global change factors
- Seasonal and multi-decadal outlook
- Data availability
- Code availability
- Conclusions: summary of the state of wildfires in 2024–2025
- Appendix A: Year in review by continent
- Author contributions
- Competing interests
- Disclaimer
- Acknowledgements
- Financial support
- Review statement
- References
- Supplement