the Creative Commons Attribution 4.0 License.
the Creative Commons Attribution 4.0 License.
 | 09 Jan 2024
A synthesis of ocean total alkalinity and dissolved inorganic carbon measurements from 1993 to 2022: the SNAPO-CO2-v1 dataset
Nicolas Metzl
Jonathan Fin
Claire Lo Monaco
Claude Mignon
Samir Alliouane
David Antoine
Guillaume Bourdin
Jacqueline Boutin
Yann Bozec
Pascal Conan
Laurent Coppola
Frédéric Diaz
Eric Douville
Xavier Durrieu de Madron
Jean-Pierre Gattuso
Frédéric Gazeau
Melek Golbol
Bruno Lansard
Dominique Lefèvre
Nathalie Lefèvre
Fabien Lombard
Férial Louanchi
Liliane Merlivat
Léa Olivier
Anne Petrenko
Sébastien Petton
Mireille Pujo-Pay
Christophe Rabouille
Gilles Reverdin
Céline Ridame
Aline Tribollet
Vincenzo Vellucci
Thibaut Wagener
Cathy Wimart-Rousseau
Total alkalinity (AT) and dissolved inorganic carbon (CT) in the oceans are important properties with respect to understanding the ocean carbon cycle and its link to global change (ocean carbon sinks and sources, ocean acidification) and ultimately finding carbon-based solutions or mitigation procedures (marine carbon removal). We present a database of more than 44 400 AT and CT observations along with basic ancillary data (spatiotemporal location, depth, temperature and salinity) from various ocean regions obtained, mainly in the framework of French projects, since 1993. This includes both surface and water column data acquired in the open ocean, coastal zones and in the Mediterranean Sea and either from time series or dedicated one-off cruises. Most AT and CT data in this synthesis were measured from discrete samples using the same closed-cell potentiometric titration calibrated with Certified Reference Material, with an overall accuracy of ±4 µmol kg−1 for both AT and CT. The data are provided in two separate datasets – for the Global Ocean and the Mediterranean Sea (https://doi.org/10.17882/95414, Metzl et al., 2023), respectively – that offer a direct use for regional or global purposes, e.g., AT–salinity relationships, long-term CT estimates, and constraint and validation of diagnostic CT and AT reconstructed fields or ocean carbon and coupled climate–carbon models simulations as well as data derived from Biogeochemical-Argo (BGC-Argo) floats. When associated with other properties, these data can also be used to calculate pH, the fugacity of CO2 (fCO2) and other carbon system properties to derive ocean acidification rates or air–sea CO2 fluxes.
- Article
(15578 KB) - Full-text XML
-
Supplement
(1901 KB) - BibTeX
- EndNote


Since 1750, humans activities have added 700 (±75) PgC of anthropogenic carbon dioxide to the atmosphere by burning fossil fuels, producing cement and changing land use (Friedlingstein et al., 2022), thereby driving up the atmospheric carbon dioxide (CO2) level and leading to unequivocal global change. The ocean plays a major role in reducing the impact of climate change by absorbing more than 90 % of the excess heat in the climate system (Cheng et al., 2020; von Schuckmann et al., 2020, 2023; IPCC, 2022) and about 25 % of anthropogenic CO2 (Friedlingstein et al., 2022). However, oceanic CO2 uptake changes the chemistry of seawater, reducing its buffering capacity (Revelle and Suess, 1957; Jiang et al., 2023a) and leading to a process known as “ocean acidification”, with potential impacts on marine organisms (Fabry et al., 2008; Doney et al., 2009, 2020; Gattuso et al., 2015). Along with atmospheric CO2 concentrations, surface-ocean temperature, ocean heat content, sea level, sea ice and glaciers, ocean acidification (a decrease in pH) is now recognized by the World Meteorological Organization (WMO) as one of the seven key global climate indicators (WMO, 2018). In the framework of the 2030 Agenda for Sustainable Development, the United Nations established a set of Sustainable Development Goals (SDGs; United Nations, 2020), including a goal dedicated to the ocean (SDG 14, “Life below water”) which calls for work to “conserve and sustainably use the oceans, seas and marine resources for sustainable development”. Ocean acidification is specifically referred in the SDG indicator 14.3.1 coordinated by the Intergovernmental Oceanographic Commission (IOC) of the United Nations Educational, Scientific and Cultural Organization (UNESCO). Observing the carbonate system in the oceans and marginal seas and understanding how this system changes over time is, thus, highly relevant not only to quantify the Global Ocean carbon budget, the anthropogenic CO2 inventories or ocean acidification rates but also to understand and simulate the processes that govern the complex CO2 cycle in the ocean and to better predict the future evolution of climate and global changes (Eyring et al., 2016; Kwiatkowski et al., 2020; Jiang et al., 2023a).
The number and quality of ocean CO2 fugacity (fCO2), total alkalinity (AT), dissolved inorganic carbon (CT) and pH measurements have increased substantially over the past few decades. Quality-controlled observations are now regularly assembled in global data syntheses such as SOCAT (Surface Ocean CO2 Atlas; Pfeil et al., 2013; Bakker et al., 2014, 2016) and GLODAP (Global Ocean Data Analysis Project; Key et al., 2004; Olsen et al., 2016, 2019, 2020; Lauvset et al., 2021, 2022). These datasets allow for the evaluation of properties' trends in the Global Ocean, including the change in the ocean CO2 sink (e.g., Wanninkhof et al., 2013; Friedlingstein et al., 2022; Watson et al., 2020), anthropogenic CO2 inventories (e.g., Sabine et al., 2004; Khatiwala et al., 2013; Gruber et al., 2019) and ocean acidification (Lauvset et al., 2015, 2020; Jiang et al., 2019; Feely et al., 2023; Ma et al., 2023). Thanks to publicly available, consistent and quality-controlled databases, new methods have been recently developed (Carter et al., 2016; Sauzède et al., 2017; Bittig et al., 2018) to reproduce AT and CT distributions from other properties, like temperature, salinity and oxygen, that are more often observed in the water column, especially by autonomous floats (Claustre et al., 2020; Mignot et al., 2023). These methods (named CANYON-B and CONTENT; Bittig et al., 2018) are now also used to help inform decisions regarding GLODAP data quality control or to fill in observational gaps (Olsen et al., 2019, 2020; Tanhua et al., 2019, 2021). The GLODAP data products have also been successfully used to construct new Global Ocean AT and CT climatological monthly fields at the surface and in the water column using neural network methods (e.g., Broullón et al., 2019, 2020).
Following pioneer works that produced various global-ocean climatologies of the sea-surface carbonate system (Millero et al., 1998; Lee et al., 2000, 2006; Takahashi et al., 2002, 2009, 2014; Sasse et al., 2013; Jiang et al., 2019), the coupling of fCO2 data (from SOCAT) and AT data (from GLODAP) now enables reconstruction of the full carbonate system in the surface ocean at a monthly timescale to investigate temporal trends at a decadal timescale (e.g., Gregor and Gruber, 2021; Keppler et al., 2023).
International projects such as SOCAT and GLODAP offer an important way to synthesize ocean carbon data. In these projects, each observation is quality controlled, offering users high-quality observations for regional or global analysis, either for process analysis or to constrain or validate ocean and coupled climate–carbon models (Coupled Model Intercomparison Project Phase 6 – CMIP6, e.g., Lerner et al., 2021). SOCAT is a publicly available synthesis product initiated in 2007 (Metzl et al., 2007) for quality-controlled surface-ocean fCO2 observations made by the international marine carbon research community (Bakker et al., 2016). The first SOCAT version was released in 2011 (Pfeil et al., 2013; Sabine et al., 2013), followed by six SOCAT versions (Bakker et al., 2014, 2016). The last version in 2023 included more than 40 million fCO2 data with an accuracy better than 5 µatm (Bakker et al., 2023). One important component of SOCAT is the use of data to estimate global air–sea CO2 fluxes based on reconstructed pCO2 fields (e.g., Surface Ocean pCO2 Mapping Intercomparison – SOCOM; Rödenbeck et al., 2015). Since 2015, these results have been included in the estimate of the global carbon budget each year (Le Quéré et al., 2015; Friedlingstein et al., 2022).
On the other hand, following the World Ocean Circulation Experiment (WOCE) and Joint Global Ocean Flux Study (JGOFS) era in the 1990s, when almost all observations were started to be synthesized in a specific recommended format (Joyce and Corry, 1994), GLODAP focused on water-column carbon observations (and other properties). Following the original GLODAP data product (Key et al., 2004), the project accumulated many new quality-controlled observations. One important achievement of GLODAP has been the use of data to estimate the anthropogenic CO2 inventory or its change over decades (Sabine et al., 2004; Gruber et al., 2019). Both products, SOCAT and GLODAP, are relevant tools to detect oceanic acidification rates (Lauvset et al., 2015; Jiang et al., 2019; Feely et al., 2023; Ma et al., 2023).
Although these projects include many international ocean observations, there are ocean-CO2-related observations all around the world (published or unpublished), such as total alkalinity and dissolved inorganic carbon, that are not included in SOCAT nor GLODAP. This is because SOCAT accepts and controls only fCO2 data, whereas GLODAP includes and controls water-column data, mainly from WOCE, Global Ocean Ship-based Hydrographic Investigations Program (GO-SHIP), and Climate Variability and Predictability Experiment (CLIVAR) cruises. It should be noted that many ocean carbon observations in various formats can be also found in dedicated database, such as the National Centers for Environmental Information (NCEI) Ocean Carbon and Acidification Data System (OCADS) (formerly CDIAC-Ocean; Jiang et al., 2023b, https://www.ncei.noaa.gov/products/ocean-carbon-acidification-data-system, last access: 22 December 2023), PANGAEA (https://www.pangaea.de/, last access: 22 December 2023) or SEANOE (https://www.seanoe.org/, last access: 22 December 2023). In this context, progress in the data synthesis of ocean carbon observations that would offer new high-quality products for the community (e.g., for GOA-ON, http://www.goa-on.org, last access: 22 December 2023, IOC/SDG 14.1.3, https://oa.iode.org/, last access: 22 December 2023, Tilbrook et al., 2019) is recommended.
In this work, we present a synthesis of more than 44 400 AT and CT observations obtained over the 1993–2022 period during various cruises or at time series' stations mainly supported by French projects. This dataset merges observations measured with the same instruments and is, thus, analytically coherent. Most of the data have an accuracy better than ±4 µmol kg−1, i.e., between the climate (±2 µmol kg−1) and weather (±10 µmol kg−1) goals (Newton et al., 2015; Bockmon and Dickson, 2015). Hereafter, this dataset will be referred to as SNAPO-CO2-v1. We describe the data assemblage and associated quality control and discuss some potential uses of this dataset.
The time series' projects and research cruises during which data were collated are listed in Table 1, with the corresponding references given in the Supplement (Table S1) and the sampling locations displayed in Fig. 1. Sampling was performed either from CTD-rosette casts (Niskin bottles) or from the ship's seawater supply (intake at about 5 m depth, depending on the ship and swell). Samples collected in 500 mL borosilicate glass bottles were poisoned with 100–300 µL of HgCl2 (depending on the cruise) and closed with greased stoppers (Apiezon®) that were held tight using an elastic band, following the standard operating procedure (SOP) protocol (Dickson et al., 2007). Some samples were also collected in 500 mL bottles closed with screw caps. After the completion of each cruise, discrete samples were returned back to the LOCEAN (Laboratoire d'Océanographie et du Climat: Expérimentations et Approches Numériques) laboratory (Paris, France) and stored in a dark room at 4 ∘C before analysis; analysis generally took place within 2–3 months of sampling (sometimes within a week). Some samples were also measured for specific process studies on benthic corals (e.g., Maier et al., 2012; McCulloch et al., 2012) or for mesocosm and culture experiments, but these data are not included in this synthesis because they do not represent the natural ocean state (e.g., the addition of Sahara dust during the “DUst experiment in a low-Nutrient, low-chlorophyll Ecosystem” project – DUNE; Ridame et al., 2014).
Table 1List of cruises in the SNAPO-CO2-v1 dataset. This is organized by region for the Global Ocean and coastal zones and for the Mediterranean Sea (MedSea). The reader is referred to Tables S1, S2, S4 and S4 in the Supplement for a list of the laboratories, the CRMs used, the corresponding references and the DOIs of cruises. Nb denotes the number of data for each cruise or time series.
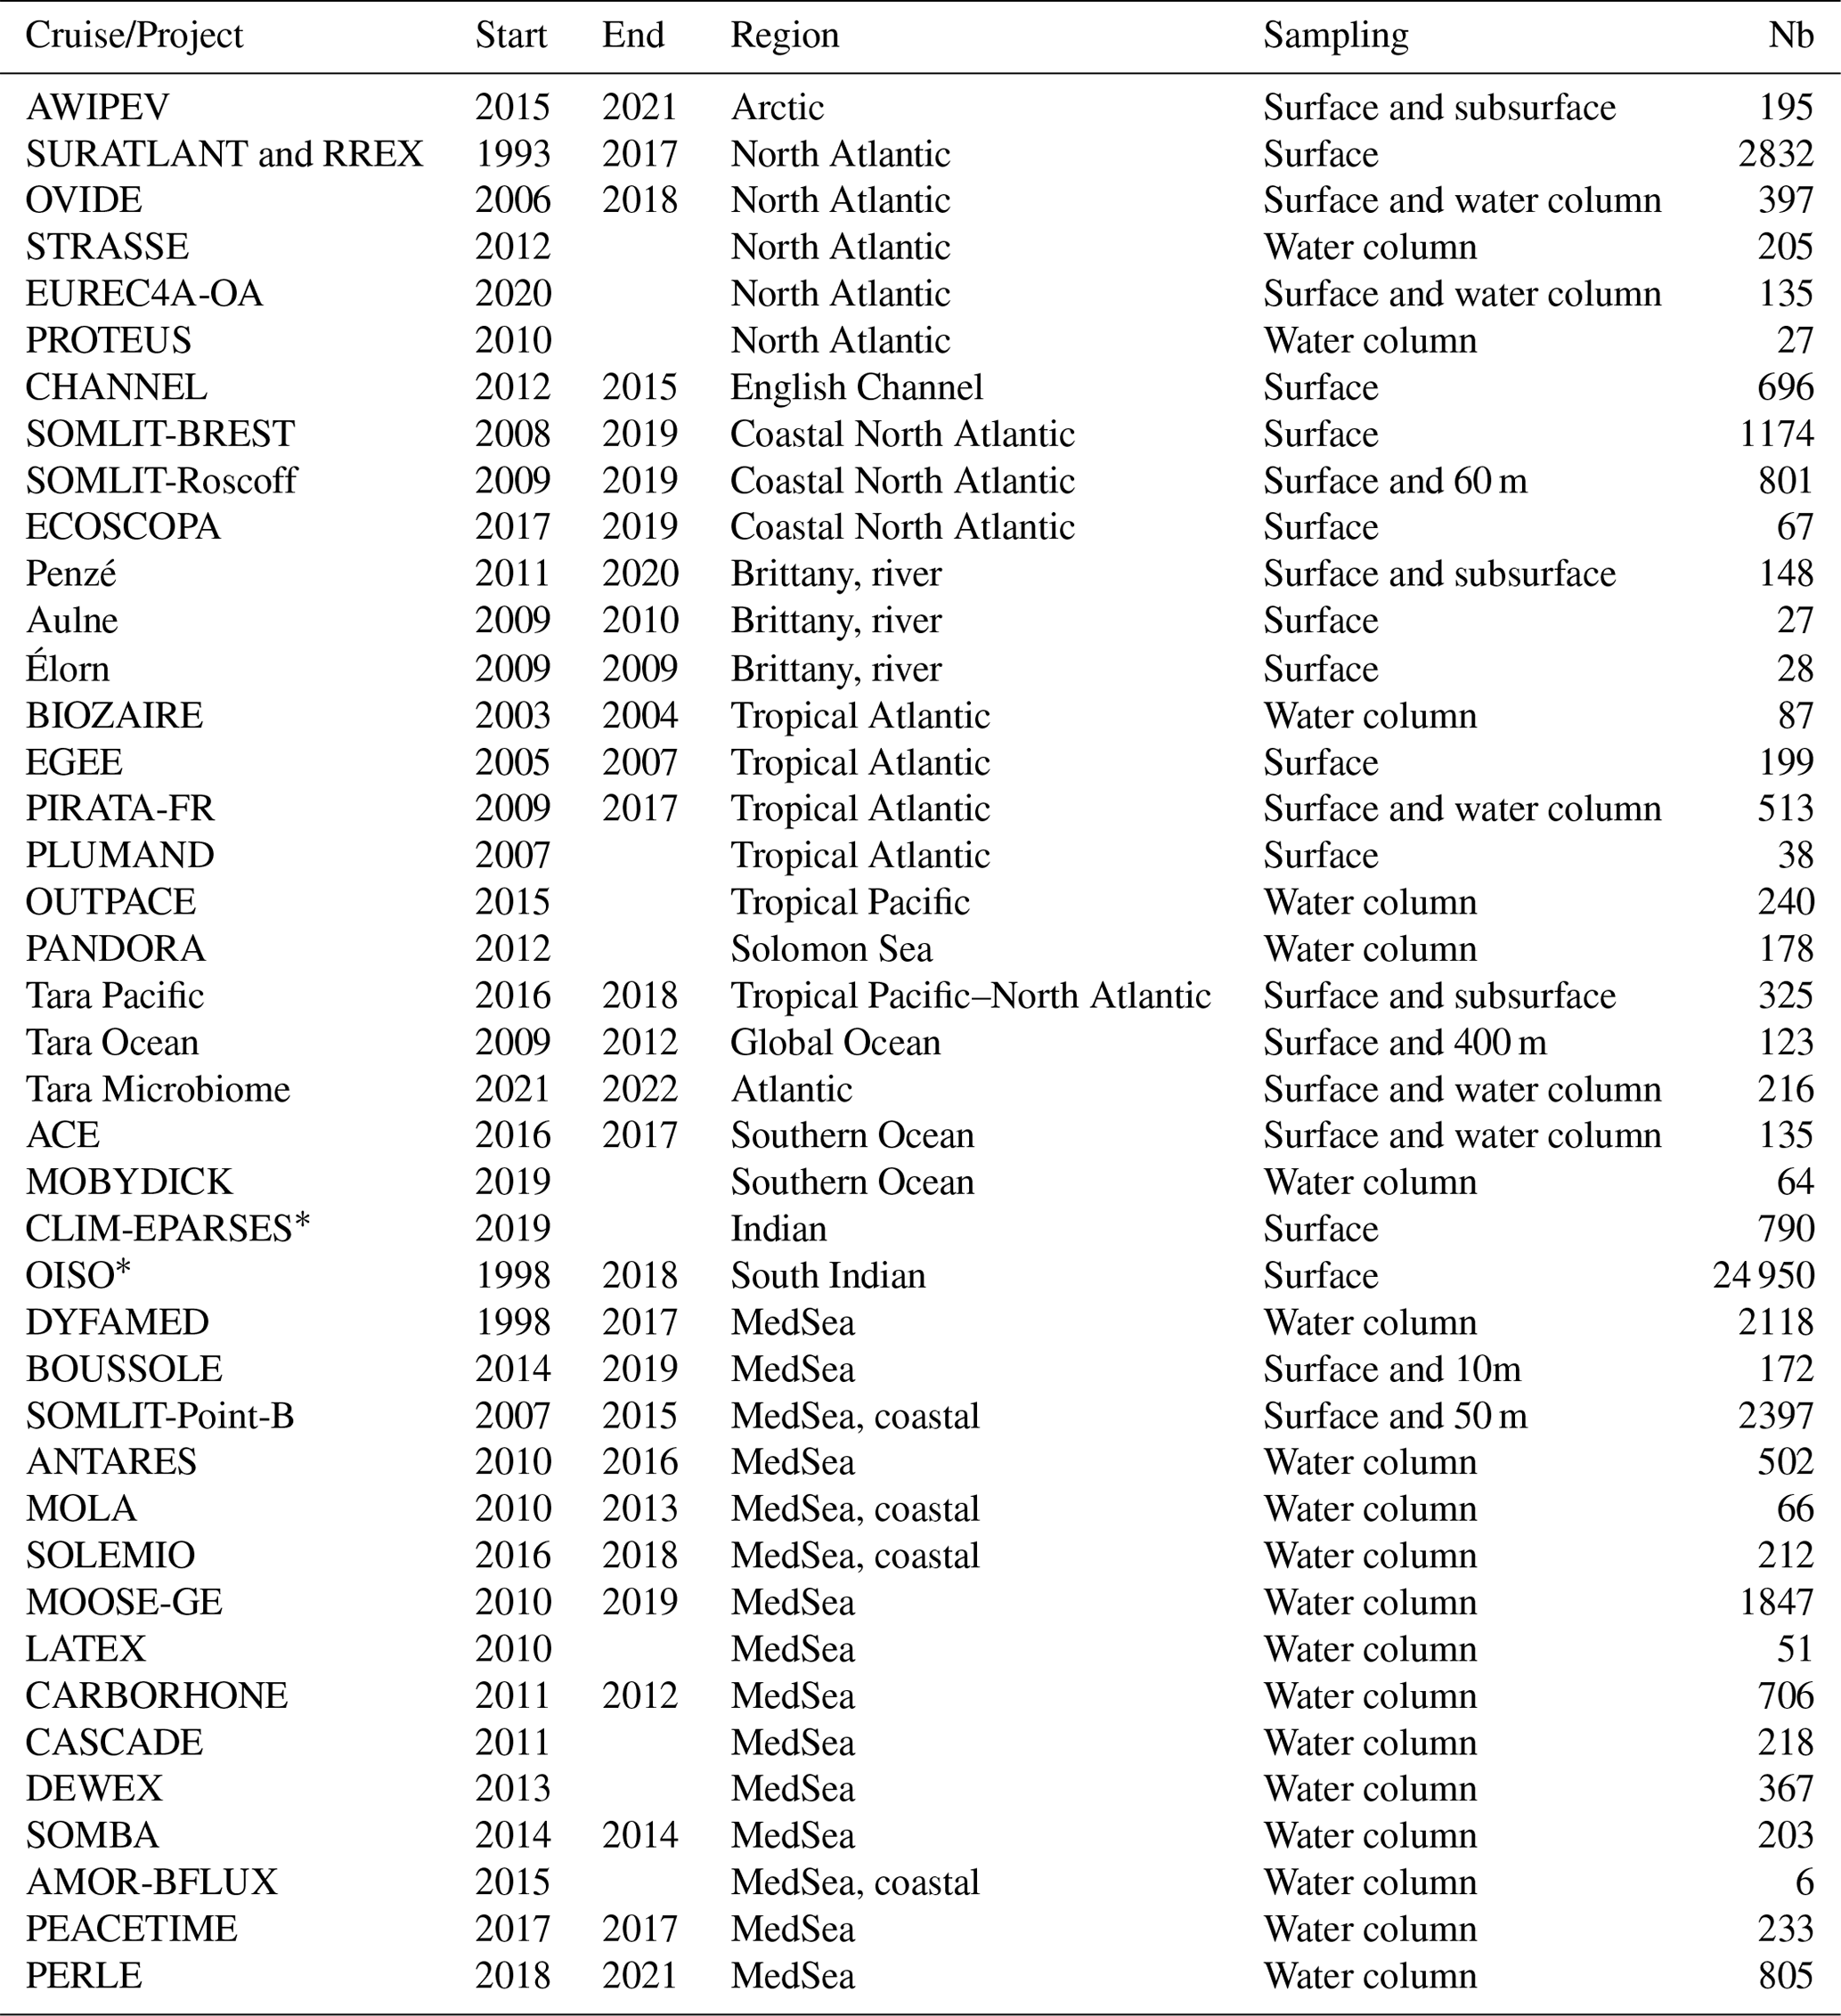
* Measurements were taken at sea (surface measurement while underway).
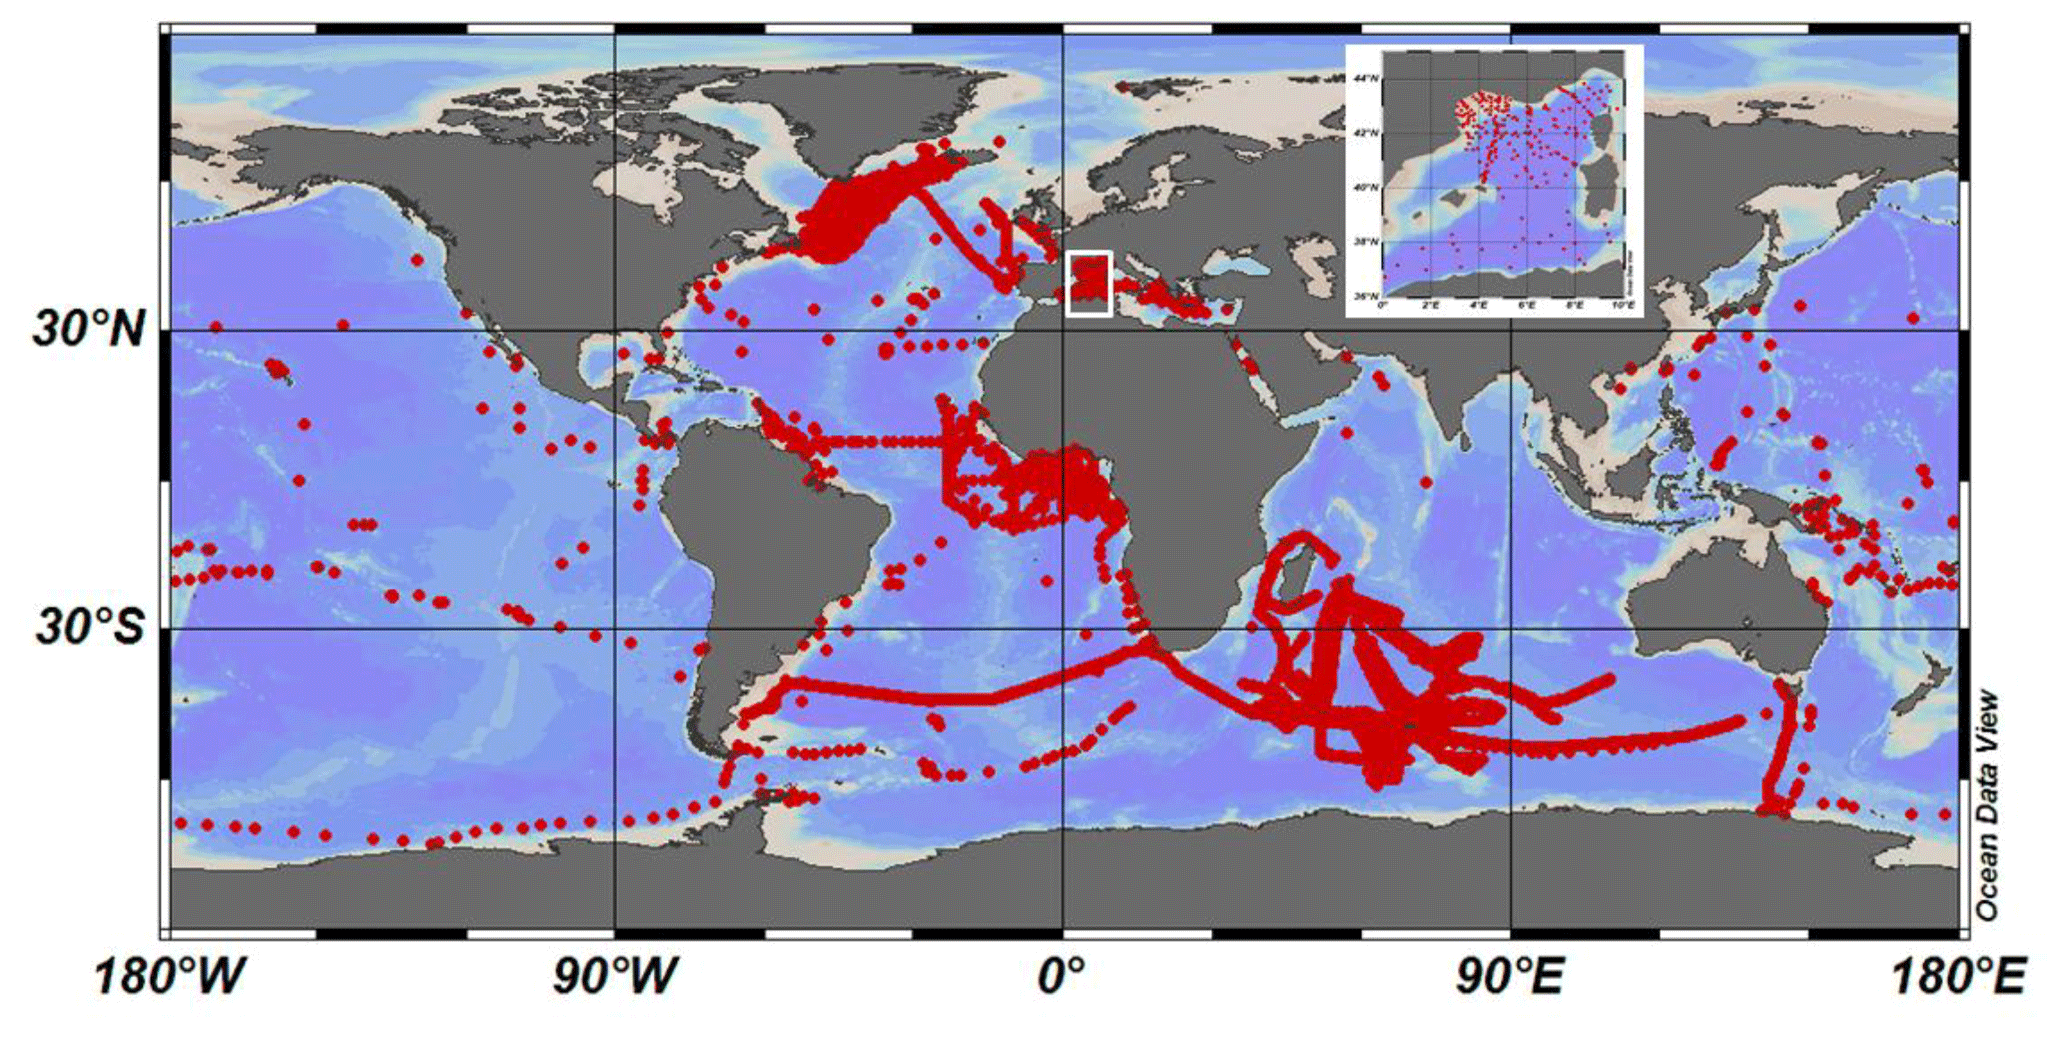
Figure 1Locations of AT and CT data (1993–2022) in the Global Ocean and the western Mediterranean Sea (white box, inset) in the SNAPO-CO2-v1 dataset. The figure was produced with Ocean Data View (ODV; Schlitzer, 2018).
As opposed to pCO2, surface AT or CT observations are generally obtained from discrete sampling (measured aboard a vessel or onshore). Few cruises offer semicontinuous sea-surface AT or CT observations (e.g., Metzl et al., 2006), but new instrumental developments (Seelmann et al., 2020) have now enabled AT measurements on Ship of Opportunity Program (SOOP) lines. In addition to discrete samples analyzed for various projects conducted mainly in the North Atlantic, tropical Atlantic, tropical Pacific, Mediterranean Sea and coastal regions (Table 1), we complemented this synthesis with AT and CT surface observations obtained in the Indian and Southern oceans during the OISO (Océan Indien Service d'Observation) cruises in 1998–2018 (Metzl et al., 2006; Leseurre et al., 2022; data also available from NCEI OCADS: https://www.nodc.noaa.gov/ocads/oceans/VOS_Program/, last access: 22 December 2023) and the recent CLIM-EPARSES cruise conducted in the Mozambique Channel in April 2019 (Lo Monaco et al., 2020, 2021). For OISO cruises, the water-column observations are part of the CARINA (CARbon IN the Atlantic) and GLODAP synthesis products (Lo Monaco et al., 2010; Olsen et al., 2016, 2019, 2020) and are not included here. Except when otherwise specified, all data in this synthesis were obtained using the same technique used in either the laboratory or at sea (for the OISO 1998–2018 and CLIM-EPARSES 2019 cruises).
3.1 Method and accuracy
Since 2003, the discrete samples returned to the SNAPO-CO2 service facilities (LOCEAN, Paris) have been simultaneously analyzed for AT and CT using potentiometric titration with a closed cell (Edmond, 1970; Goyet et al., 1991). The same technique was used at sea for underway surface water measurements during OISO and CLIM-EPARSES cruises (indicated using the footnote in Table 1). For two time series, the dataset also includes measurements obtained before 2000 using other techniques: the DYFAMED time series' observations measured between 1998 and 2000 in the Mediterranean Sea (Copin-Montégut and Bégovic, 2002; Coppola et al., 2020) and the SURATLANT time series' values acquired from 1993 to 1997 in the North Atlantic subpolar gyre (Reverdin et al., 2018). We also include AT data from the river La Penzé (Brittany) from 2019 to 2020 (Yann Bozec, Station Biologique de Roscoff – SBR, personal communication, 2020).
In the late 1980s, the so-called “JGOFS-IOC Advisory Panel on Ocean CO2” highlighted the need for standard analysis protocols and for the development of Certified Reference Materials (CRMs) for inorganic carbon measurements (Poisson et al., 1990; UNESCO, 1990, 1991). The CRMs were provided to international laboratories by Andrew Dickson (Scripps Institution of Oceanography, San Diego, USA), starting in 1990 for CT and in 1996 for AT. Thus, these CRMs were available during this work and were used to calibrate the measurements (CRM batch numbers used for each cruise are listed in Table S2 in the Supplement). The concentrations of the CRMs that we used varied between 2193 and 2426 µmol kg−1 for AT and between 1968 and 2115 µmol kg−1 for CT, corresponding to the range of concentrations observed in open-ocean water. The CRM accuracy, as indicated on the certificate for each batch, is around ±0.5 µmol kg−1 for both AT and CT (https://www.nodc.noaa.gov/ocads/oceans/Dickson_CRM/batches.html, last access: 22 December 2023).
The results of analyses performed on 965 CRM bottles (different batches) between 2013 and 2023 are presented in Fig. 2. The standard deviations of the differences in measurements were around ±3.5 µmol kg−1 on average for both AT and CT. For unknown reasons, the differences were occasionally up to 10–15 µmol kg−1 (0.8 % of the data; Fig. S2). These few CRM measurements were discarded with respect to the data processing. On average, excluding some outliers, standard deviations of the differences for 1090 CRM analyses were ±2.71 µmol kg−1 for AT and ±2.86 µmol kg−1 for CT. We did not detect any specific signal for CRM analyses (e.g., larger uncertainty depending on the batch number or temporal drifts during analyses; Fig. 2); however, for some cruises, the accuracy based on CRMs could be slightly better than 3 µmol kg−1 (e.g., Marrec et al., 2014; Touratier et al., 2016; Ganachaud et al., 2017; Wimart-Rousseau et al., 2020).
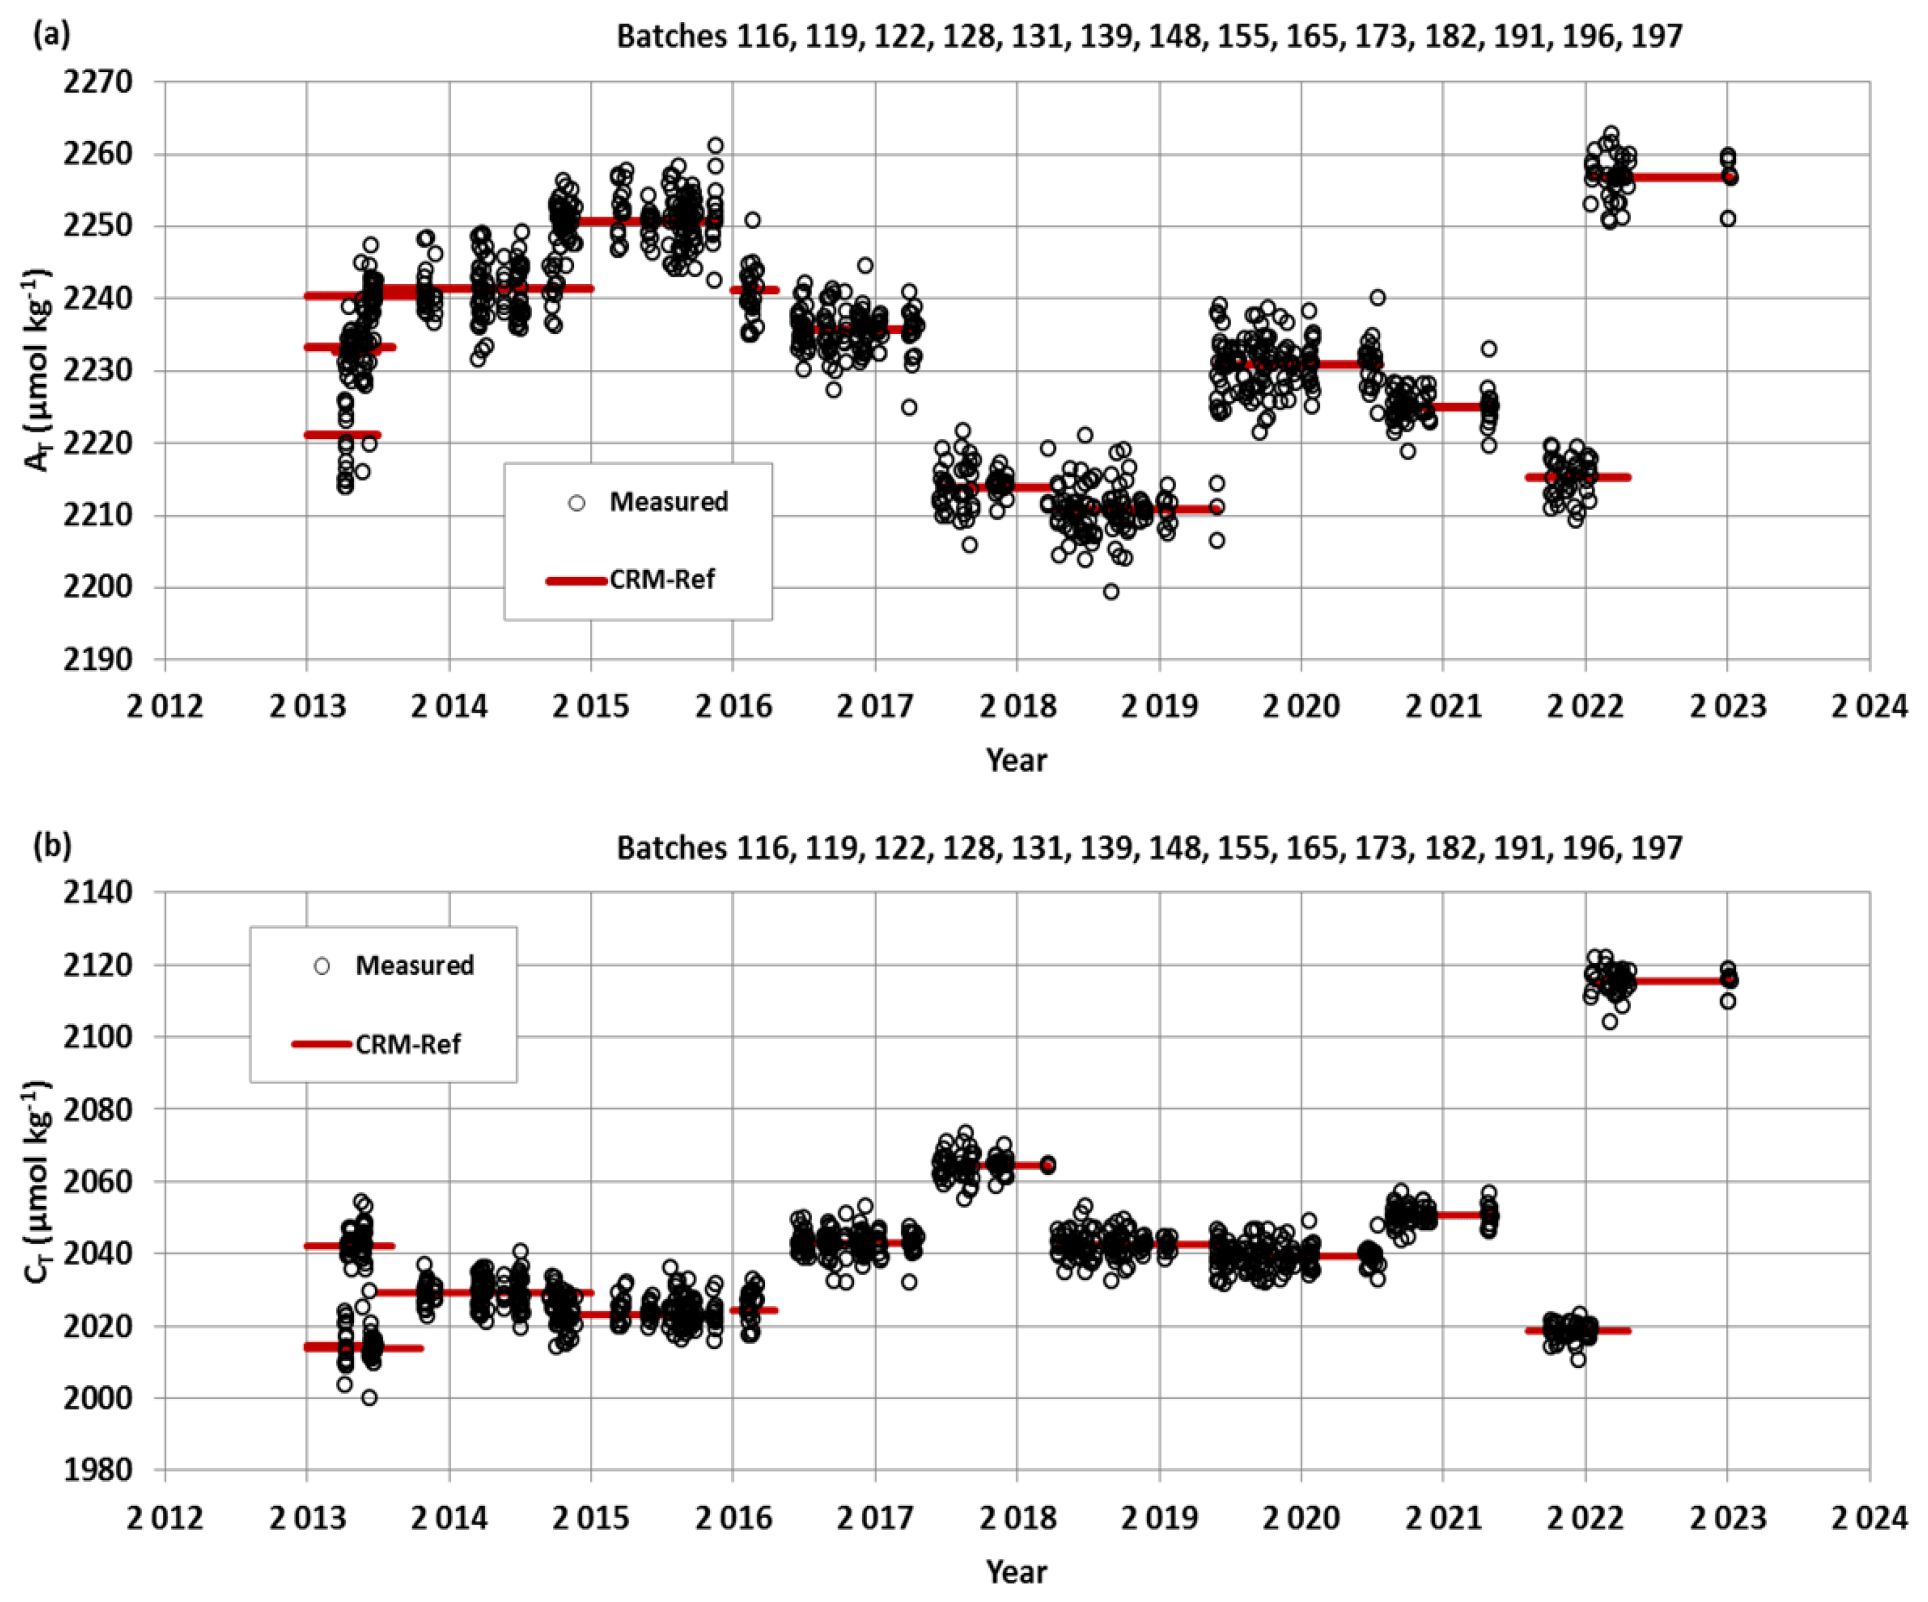
Figure 2AT (a) and CT (b) analyses for different CRM batches measured in the 2013–2023 period. For these 965 analyses, the means (standard deviations) of the differences with the CRM reference were −0.1 (±3.4) µmol kg−1 for AT and 0.1 (±3.7) µmol kg−1 for CT.
3.2 Repeatability
For some projects, duplicates have regularly been sampled (e.g., SOMLIT-Point-B, SOMLIT-BREST and BOUSSOLE/DYFAMED) or replicate bottles have been sampled at selected depths at fixed stations during the cruises (e.g., OUTPACE 2015 and SOMBA 2014). The results of AT and CT repeatability are synthesized in Table 2. Figure 3 shows an example of regular duplicates from the following times series: SOMLIT-Point-B in the coastal Mediterranean Sea, SOMLIT-BREST in the Bay of Brest in the coastal Iroise Sea and BOUSSOLE/DYFAMED in the Ligurian Sea. For the 26 OISO cruises conducted between 1998 and 2018 and the CLIM-EPARSES cruise in April 2019, the repeatability was evaluated from duplicate analyses (within 20 min) of continuous underway sea-surface samples at the same location (when the ship was stopped). Similarly to what was found for the CRM measurements (Fig. S2), differences in duplicates are occasionally higher than 10–15 µmol kg−1 (Fig. 3), although most of the duplicates for all projects are within 0–3 µmol kg−1. Based on the CRM analyses and replicates for different projects, different regions and different periods, we estimated AT and CT data to be consistent with an accuracy of better than 4 µmol kg−1.
Table 2Repeatability of the AT and CT analyses for cruises with duplicate analysis. The results are expressed as the standard deviation (SD) values of the analysis of replicated samples. Nb denotes the number of replicates for each time series or cruise (see Fig. 3 for the results of regular duplicates for three time series: SOMLIT-Point-B, SOMLIT-BREST and BOUSSOLE). For the 26 OISO cruises (1998–2018) and for simplicity, we list the mean repeatability obtained for all cruises.
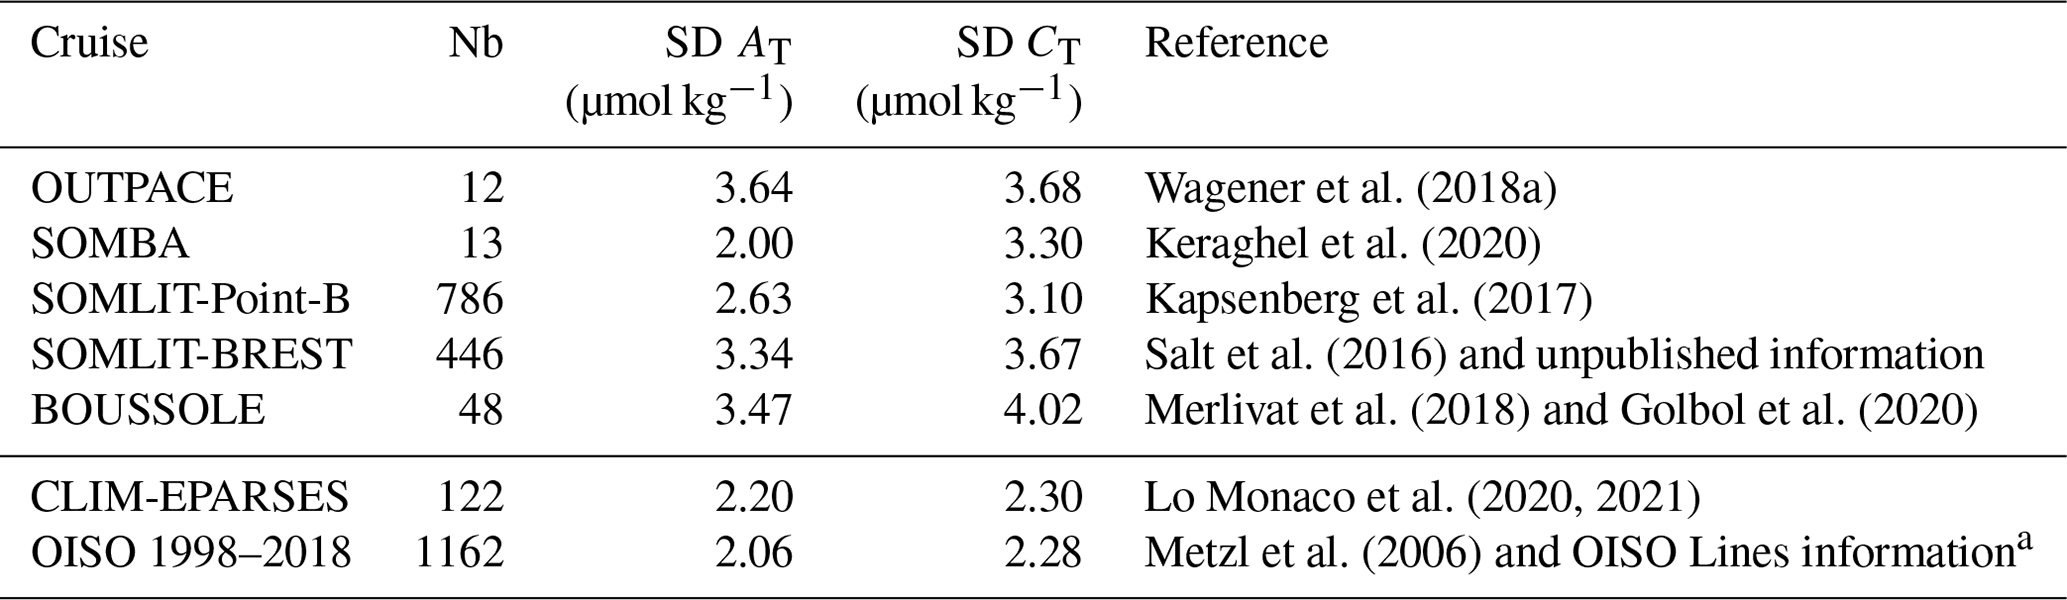
a Metadata and data available at https://www.nodc.noaa.gov/ocads/oceans/VOS_Program/OISO.html (last access: 22 December 2023).
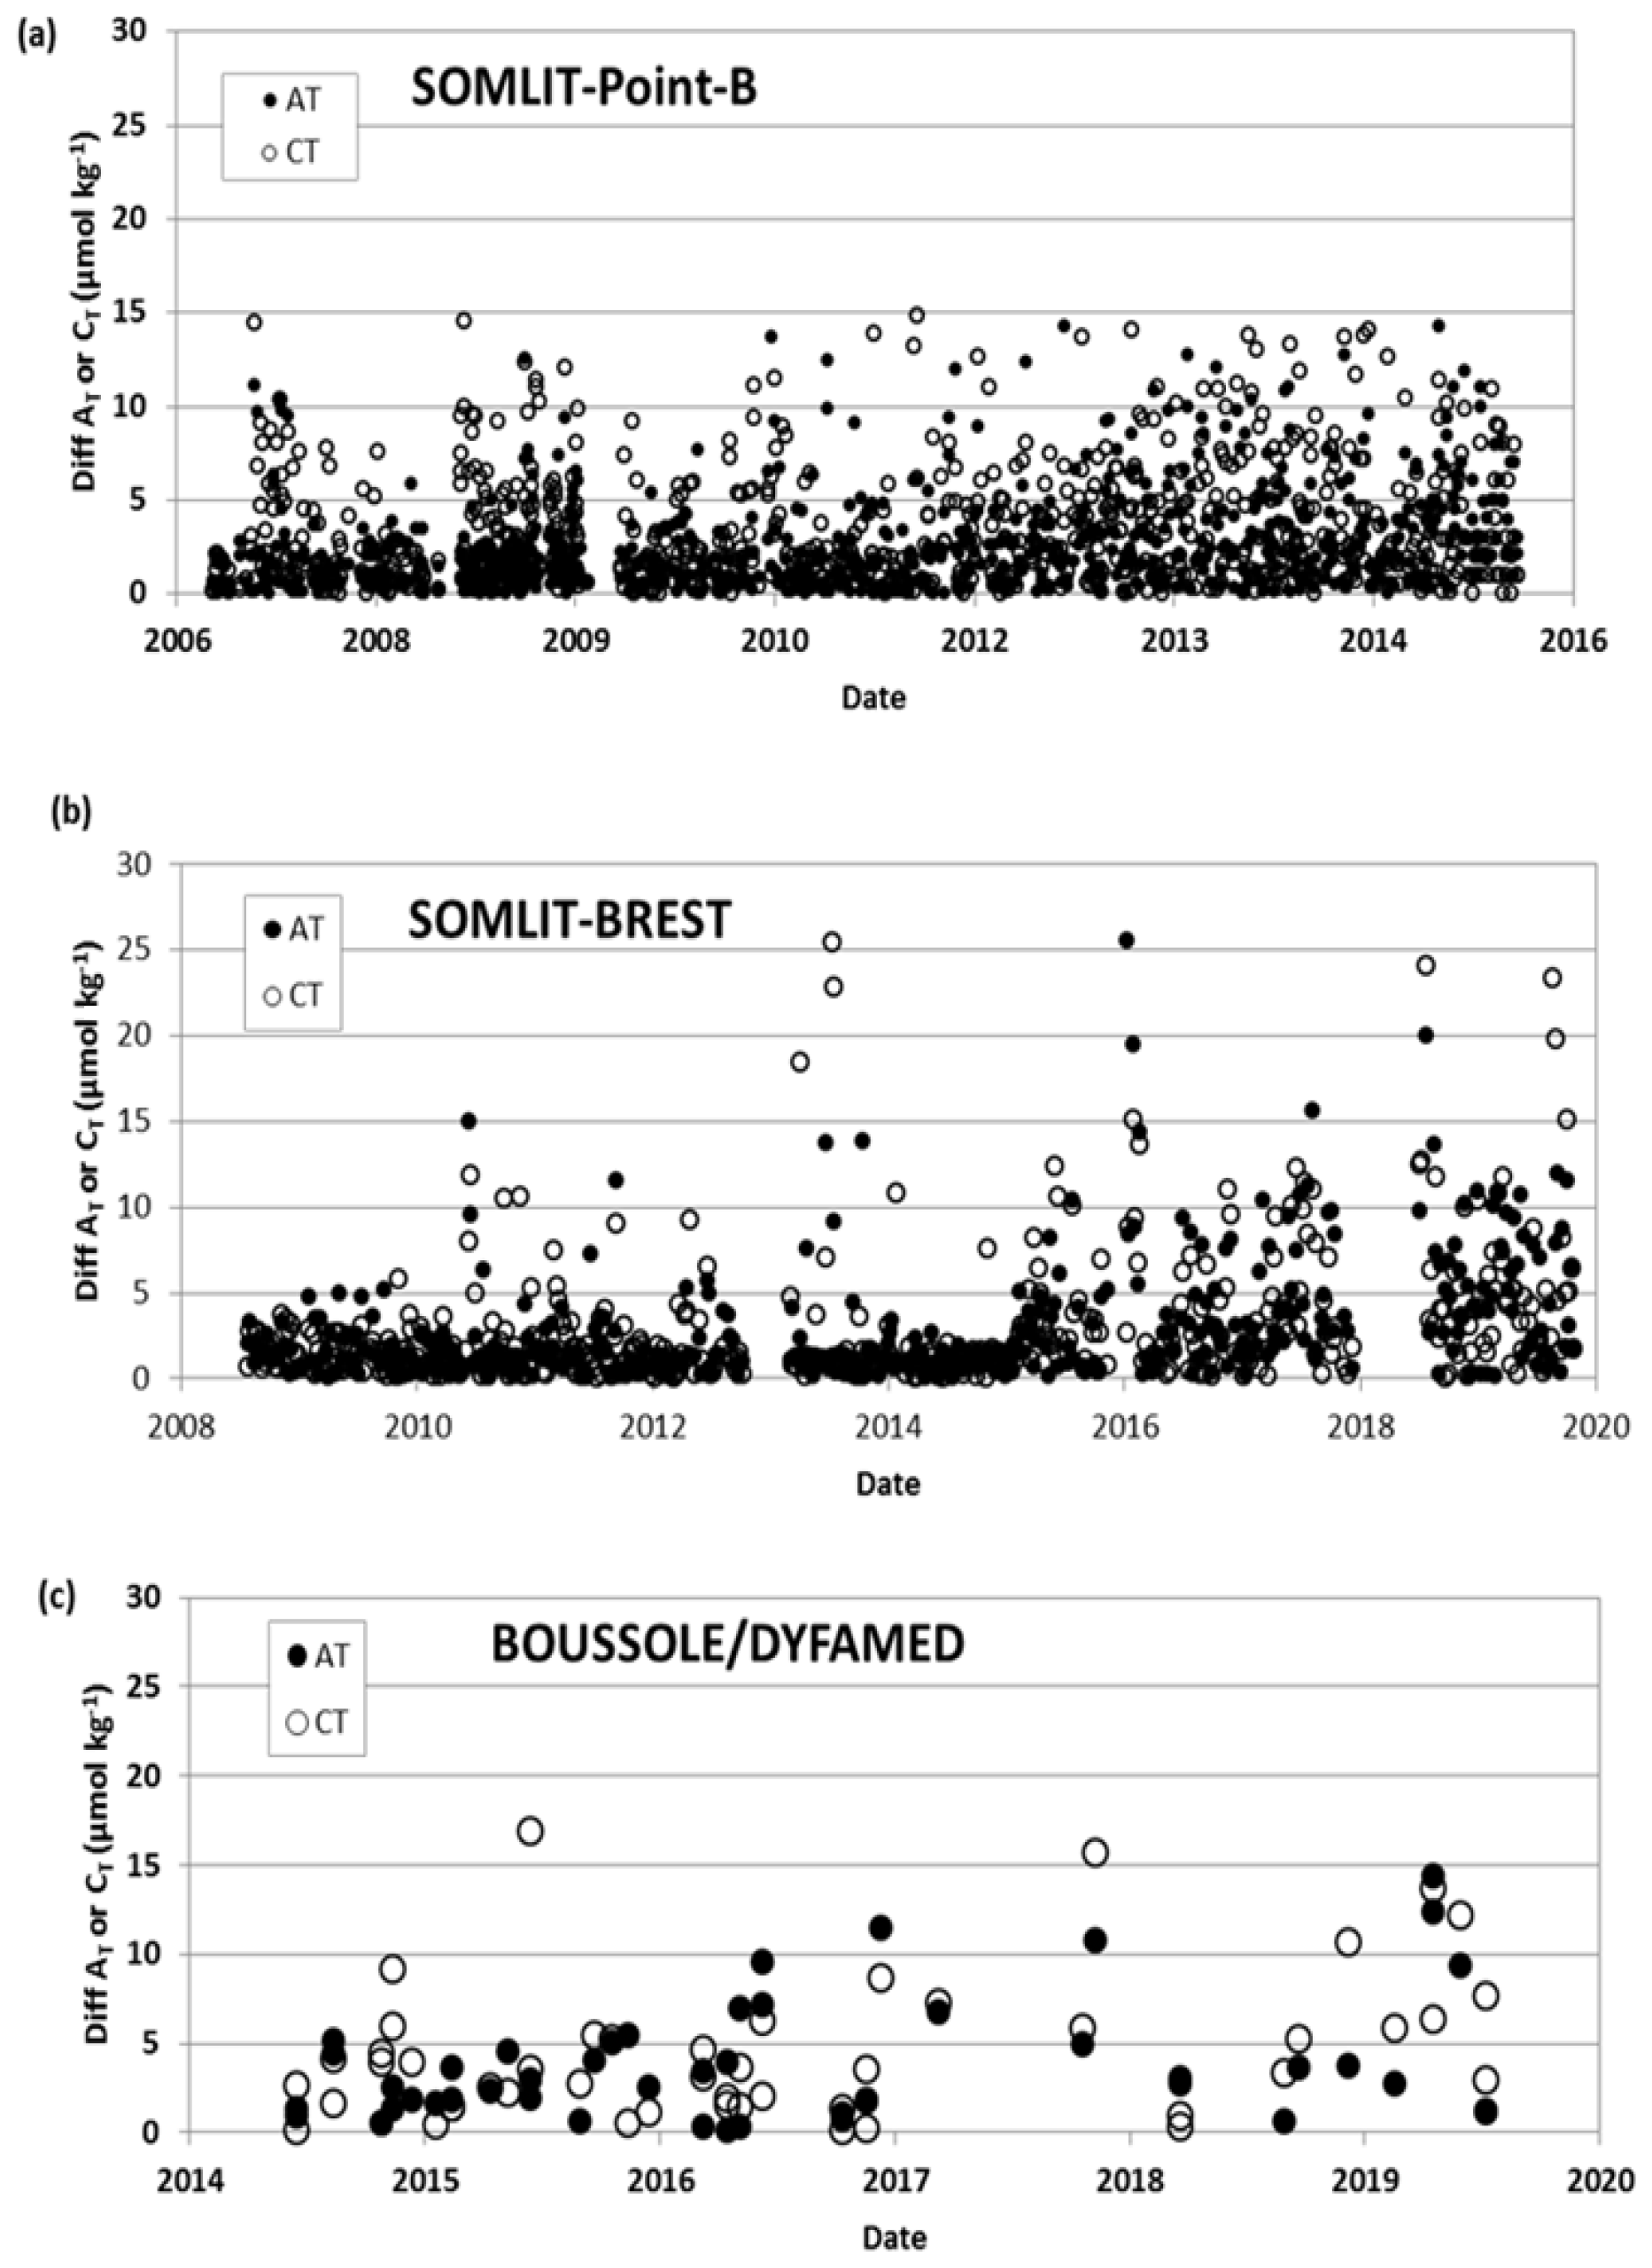
Figure 3Results of duplicate AT and CT analyses from the following time series: (a) SOMLIT-Point-B in the coastal Mediterranean Sea (Kapsenberg et al., 2017), (b) SOMLIT-BREST in the Bay of Brest in the coastal Iroise Sea (Salt et al., 2016, and unpublished information) and (c) BOUSSOLE/DYFAMED in the Ligurian Sea (Merlivat et al., 2018; Golbol et al., 2020). The plots show differences in duplicates for both AT (filled circles) and CT (open circles). SD values of these duplicates are listed in Table 2.
3.3 Intercomparisons
Intercomparisons of measurements performed with different techniques help to evaluate the quality of the data and detect potential biases when merging different laboratories' data obtained from the same region during different periods. This is especially important to interpret long-term trends in AT and CT as well as for pCO2 and pH calculated with AT–CT pairs. For ocean acidification studies, this also refers to the “climate goal”, for which an accuracy for AT and CT of better than ±2 µmol kg−1 is needed (Newton et al., 2015; Tilbrook et al., 2019). For the projects in this data synthesis, inter-laboratory comparisons were occasionally performed and are summarized below.
3.3.1 CHANNEL project
As part of the CHANNEL (2012–2015) time series in the western English Channel, Marrec et al. (2014) analyzed surface samples collected bimonthly from 2011 to 2013. AT analyses were performed with a TA-ALK-2 system (Apollo SciTech), while CT measurements were acquired with an AIRICA (Automated Infra Red Inorganic Carbon Analyzer) system (Marianda Inc.) Based on CRM analyses (batch no. 92), the accuracy was estimated to be ±3 µmol kg−1 for AT and ±1.5 µmol kg−1 for CT (Marrec et al., 2014). When undertaking a comparison with the samples measured at LOCEAN, Paris, for the year 2012, Marrec et al. (2014) concluded that the concentrations between the two methods were within ±2 and ±3 µmol kg−1 for AT and CT, respectively. This is close to the aforementioned climate goal, offering confident results for long-term trend analysis of the carbonate system in this region.
3.3.2 SURATLANT project
In the framework of the SURATLANT project in the subpolar North Atlantic gyre, some samples collected at the same time (in 2005, 2006, 2010, 2015 and 2016) were also analyzed onshore for AT and/or CT by other laboratories using different techniques (e.g., coulometric method); these results have been summarized by Reverdin et al. (2018). For CT, the mean (SD) differences between LOCEAN values and those from four other laboratories range between −0.7 (±4.6) and −6.5 (±3.4) µmol kg−1, depending on the cruise. For AT, the mean differences compared with two other laboratories range from −0.6 (±4.1) µmol kg−1 to +2.3 (±4.8) µmol kg−1.
3.3.3 OVIDE project
During OVIDE cruises, which have been conducted since 2002 in the North Atlantic along a section from Greenland to Portugal (Lherminier et al., 2007; Mercier et al., 2015), samples have been taken (since 2006) to complement (for summer) the SURATLANT time series in the North Atlantic subpolar gyre (NASPG). The OVIDE samples at the surface and along the water column at a few stations were measured back at LOCEAN for AT and CT (Metzl et al., 2018). This enabled us to compare our data with the onboard measurements performed by the IIM (Instituto de Investigaciones Marinas) group in Vigo, Spain (e.g., Pérez et al., 2010, 2013, 2018; Vazquez-Rodriguez et al., 2012). The OVIDE data have been regularly quality controlled as part of the CARINA and GLODAP data products (Velo et al., 2009; Key et al., 2010; Olsen et al., 2016, 2019, 2020). The results of intercomparisons are gathered in Table 3. For OVIDE in 2006, we identified (for unknown reason) a large difference between our original AT values and the AT data qualified in GLODAP; thus, we corrected our AT data by +7.2 µmol kg−1. However, no correction was applied to CT data. For other OVIDE cruises, differences in AT values range between −4.5 (±4.11) µmol kg−1 and −0.05 (±3.43) µmol kg−1, depending on the cruise (i.e., AT measured at LOCEAN was always slightly lower than onboard measurements). For CT, we compared our onshore measurements with CT values calculated with AT and pH measured on board. Most of the mean CT differences are slightly positive (i.e., CT measured at LOCEAN was always higher, except for 2010). Considering all errors associated with sampling, the transport of samples, the instrumentation, the data processing or the calculation of CT using AT–pH pairs (around 8.8 µmol kg−1; Orr et al., 2018), the comparisons between LOCEAN and IIM data for OVIDE cruises are deemed acceptable, and large differences in both AT and CT (>4 µmol kg−1) are far from being systematic (Table 3). The data from SURATLANT and OVIDE can then be merged to complete the time series in the NASPG in summer and to better describe the seasonality of the oceanic carbonate system. For example, in 2010, when the North Atlantic Oscillation (NAO) was strongly negative, the SURATLANT data showed a rapid decrease in CT concentrations in the NASPG between early-June and August (Fig. 4), with CT concentrations in August being much lower than other years (Racapé et al., 2014). This led to a rapid drop in fCO2 in 2009–2010, such that the NASPG was a strong CO2 sink (Leseurre et al., 2020). The winter-to-summer seasonal decrease in CT in 2010 in the northern NASPG was on average −77 µmol kg−1 (Fig. 4), much larger than in the climatology (range of −50 to −55 µmol kg−1; Takahashi et al., 2014; Reverdin et al., 2018). The OVIDE data in late June in 2010 and SURATLANT in August 2010 confirmed this signal that was linked to pronounced primary productivity in that period (Fig. 4; Henson et al., 2013; Racapé et al., 2014; McKinley et al., 2018). Note that, for this period, no fCO2 observations were available in July–September 2010 in the SOCAT data product and that the AT and CT data presented here could be used to calculate fCO2 to complement the fCO2 dataset in this region, as was done for other periods (McKinley et al., 2011).
Table 3Comparisons of AT and CT samples measured back at LOCEAN with onboard measurements by IIM laboratory (Fiz Pérez, Vigo, Spain) for OVIDE cruises in the North Atlantic. Nb denotes the number of samples and ND denotes no data. The results listed indicate the means and standard deviations of the differences (LOCEAN − IIM). For AT, IIM values were measured on board. For CT, IIM values were calculated from AT and pH, both measured on board. Here, the IIM data were quality controlled and taken from the GLODAP data products (Olsen et al., 2016, 2019).
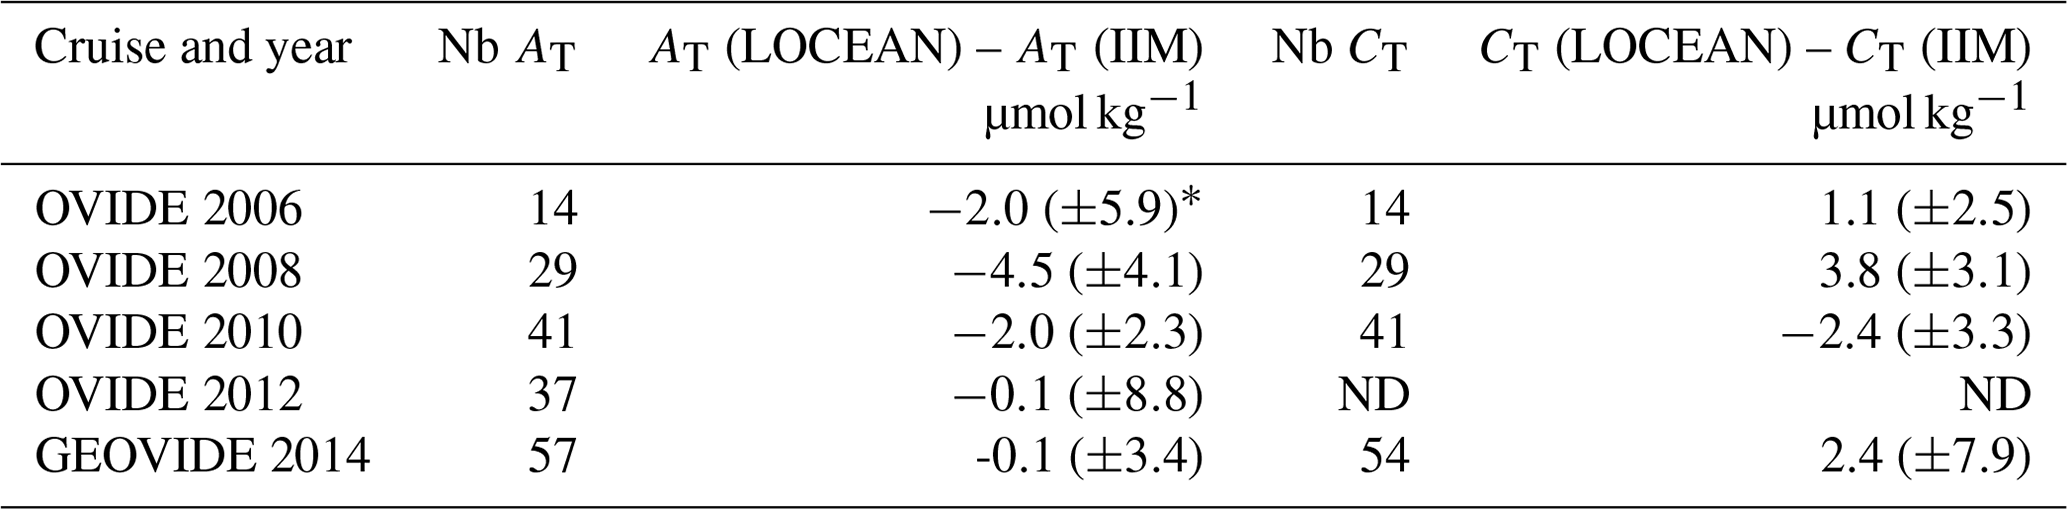
* For the OVIDE 2006 cruise, the original difference in AT was −9.0 (±5.8) µmol kg−1. LOCEAN AT data were corrected by +7.2 µmol kg−1 based on the mean concentrations in deep layers, whereas no corrections were applied for AT and CT for other cruises.
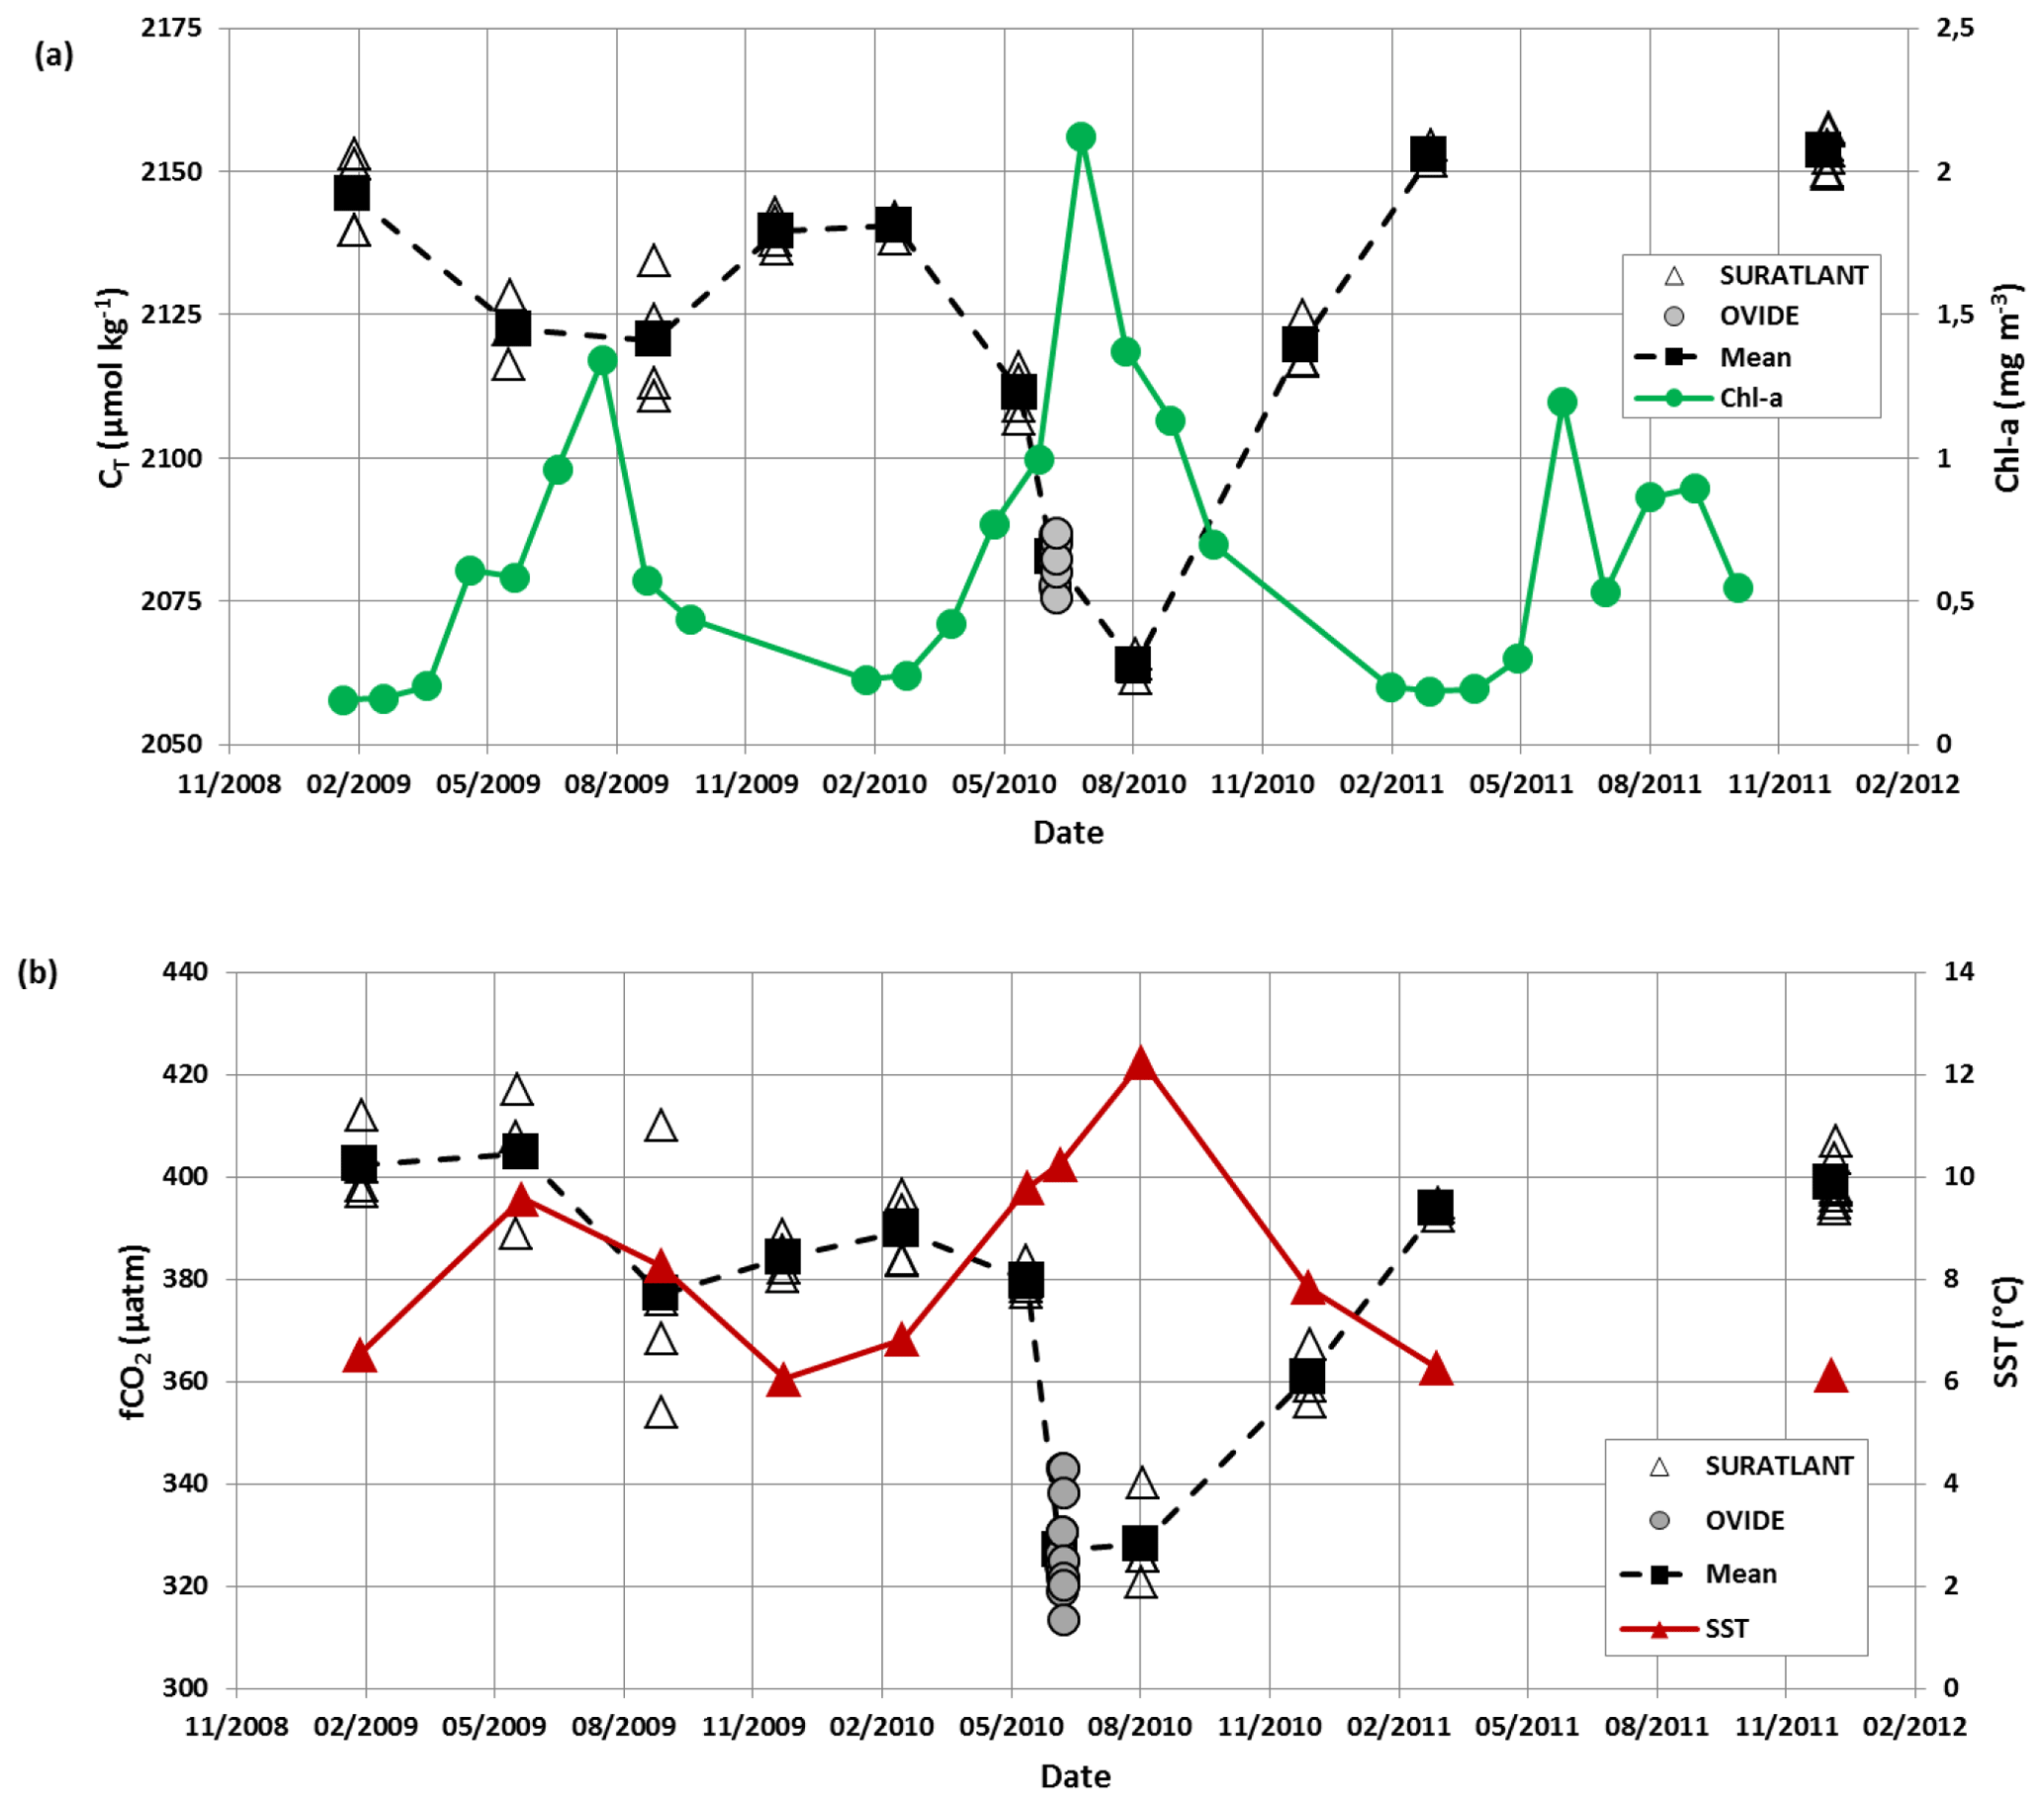
Figure 4(a) Time series of CT concentrations (µmol kg−1) for 2009–2011 in surface waters in the North Atlantic subpolar gyre (zone 59∘ N, 33∘ W) based on SURATLANT (open triangles) and OVIDE 2010 (gray circles) data. In 2009, SURATLANT data were available in February, June, September and December; in 2010, data were available in March, June, August and December; and in 2011, data were only available for March and December. The OVIDE data in late June in 2010 completed the temporal cycle and confirmed the strong seasonal signal and low CT concentrations in summer 2010 not seen in 2009 (nor in 2011, as there were no data in summer). The mean observations for each period describe the CT seasonal cycles in 2009 and 2010 (black squares, dashed line). The monthly surface chlorophyll-a (Chl-a) concentrations (mg m−3) averaged in the same region based on MODIS are also shown (green dots and line), highlighting the high productivity during the summer 2010. Chl-a monthly data were extracted from MODIS (Giovanni, NASA, last access: 3 May 2019). (b) Time series of fCO2 (µatm) for the same cruises (same symbols) were calculated with AT and CT and using the K1 and K2 constants from Lueker et al. (2000). The mean sea-surface temperature (SST, ∘C) is also indicated (red triangles). In June 2010, oceanic fCO2 decreased by 53 µatm in 2 weeks.
3.3.4 The river La Penzé
The comparisons described above concern the open-ocean region that has AT and CT concentrations in a range of concentrations close to the CRM references (used by the different laboratories). Another example of a comparison is presented here for samples obtained along a river and, thus, for waters with a low salinity and low AT concentrations (river La Penzé in northern Brittany). In 2019–2020, AT was measured at SBR laboratory using a potentiometric method (with a Titrino 847 plus Metrohm) calibrated with CRM (batch no. 131) for a final accuracy of ±2.1 µmol kg−1 (Gac et al., 2020). Although the samples were measured with different techniques, the AT–salinity relationships are very coherent for both datasets (Fig. 5). The regressions for each period for AT (in µmol kg−1) are as follows:
-
(for 78 samples in 2011);
-
(for 70 samples in 2019–2020).
Therefore, we added the AT data measured in 2019–2020 to complete the synthesis for this location (river La Penzé).
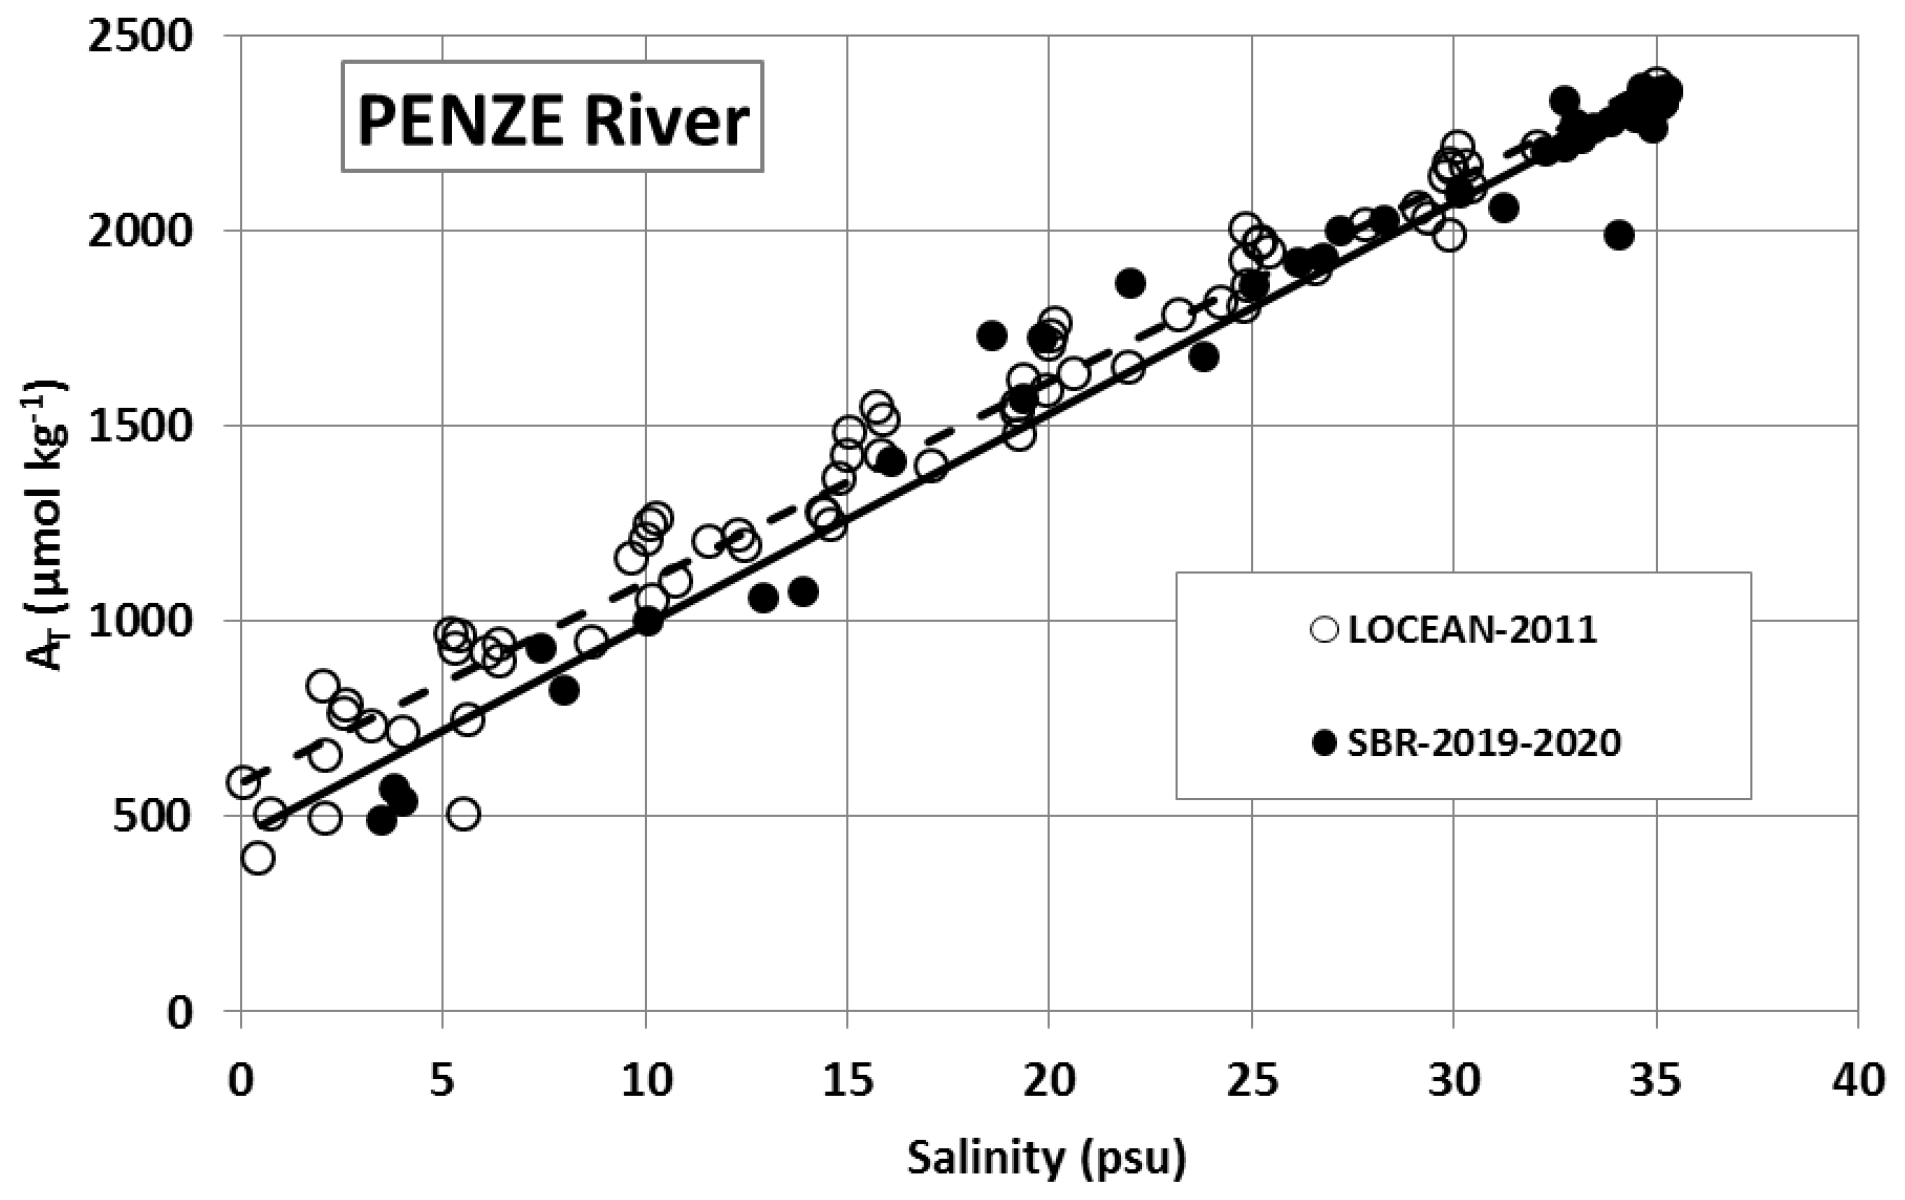
Figure 5Total alkalinity (AT) versus salinity for samples measured in 2011 and 2019 in the river La Penzé, northern Brittany (Gac et al., 2020). AT samples were measured at LOCEAN in 2011 (open circles, dashed line) and at SBR laboratory (Roscoff) in 2019 (filled circles, black line).
3.4 Assigned flags for quality control
Identifying each data point with an appropriate flag is very convenient for selecting data (good, questionable or bad data). Here, following the WOCE program, we used four flags for each property (Flag 2 – good data, Flag 3 – questionable data, Flag 4 – bad data and Flag 9 – no data), as used in other data products such as SOCAT (Bakker et al., 2016) or GLODAP (Olsen et al., 2016, 2019, 2020; Lauvset et al., 2021). During data processing, we first assigned a flag for each AT and CT data point based on the standard error in the calculation of AT and CT concentrations (nonlinear regression; Dickson et al., 2007). By default, if the standard deviation of the regression was >1 µmol kg−1, we assigned Flag 3 (questionable), although the data could be acceptable and then used for interpretations. Flag 3 was also assigned when salinity was doubtful or when differences between duplicates were large (e.g., ±20 µmol kg−1). Flag 4 (bad or certainly bad) was assigned when clear anomalies were detected for unknown reasons (e.g., a sample probably not fixed with HgCl2). A secondary quality control was performed by the principal investigator of each project based on data inspection, duplicates, the AT–salinity relationship, or the mean observations in deep layers where large variability in AT and CT is unlikely to occur from year to year. An example presents all data from the MOOSE-GE cruises conducted in 2010–2019 in the Mediterranean Sea (Coppola et al., 2020; Testor et al., 2010) where clear outliers have been identified (Fig. S3). For the 10 MOOSE-GE cruises and a total of 1847 AT and CT analyses, 26 data points were flagged as bad (Flag 4), 139 data points for AT and 141 data points for CT were listed as questionable (Flag 3), and 1682 data points for AT and 1680 data points for CT were considered to be good data (Flag 2, i.e., more than 90 %). A similar control process was performed for each project.
The synthesis of various cruises in the same region and period also offers verification and secondary control of the data. For example, several cruises were conducted in the Mediterranean Sea in 2014 (MOOSE-GE, SOMBA, ANTARES and DYFAMED). The mean values of CT and AT in the deep layers (>1800 m) for each cruise confirmed the coherence of the data (Table 4). This enabled us to merge the different datasets in order to interpret the temporal trends and processes driving the CO2 cycle (Coppola et al., 2019, 2020) or to train and validate a regional neural network to reconstruct the carbonate system (e.g., CANYON-MED; Fourrier et al., 2020, 2022).
Table 4Mean observations in the deep layers (>1800 m) of the western Mediterranean Sea for different cruises conducted in 2014. Results for deep layers (>1800 m) for the DEWEX cruise in 2013 and the PEACETIME cruise in 2017 in the same region are also listed. N-AT and N-CT are AT and CT normalized at a salinity of 38, respectively. Nb denotes the number of data (with Flag 2). Standard deviations are shown in parentheses. References for these cruises are listed in the Supplement.
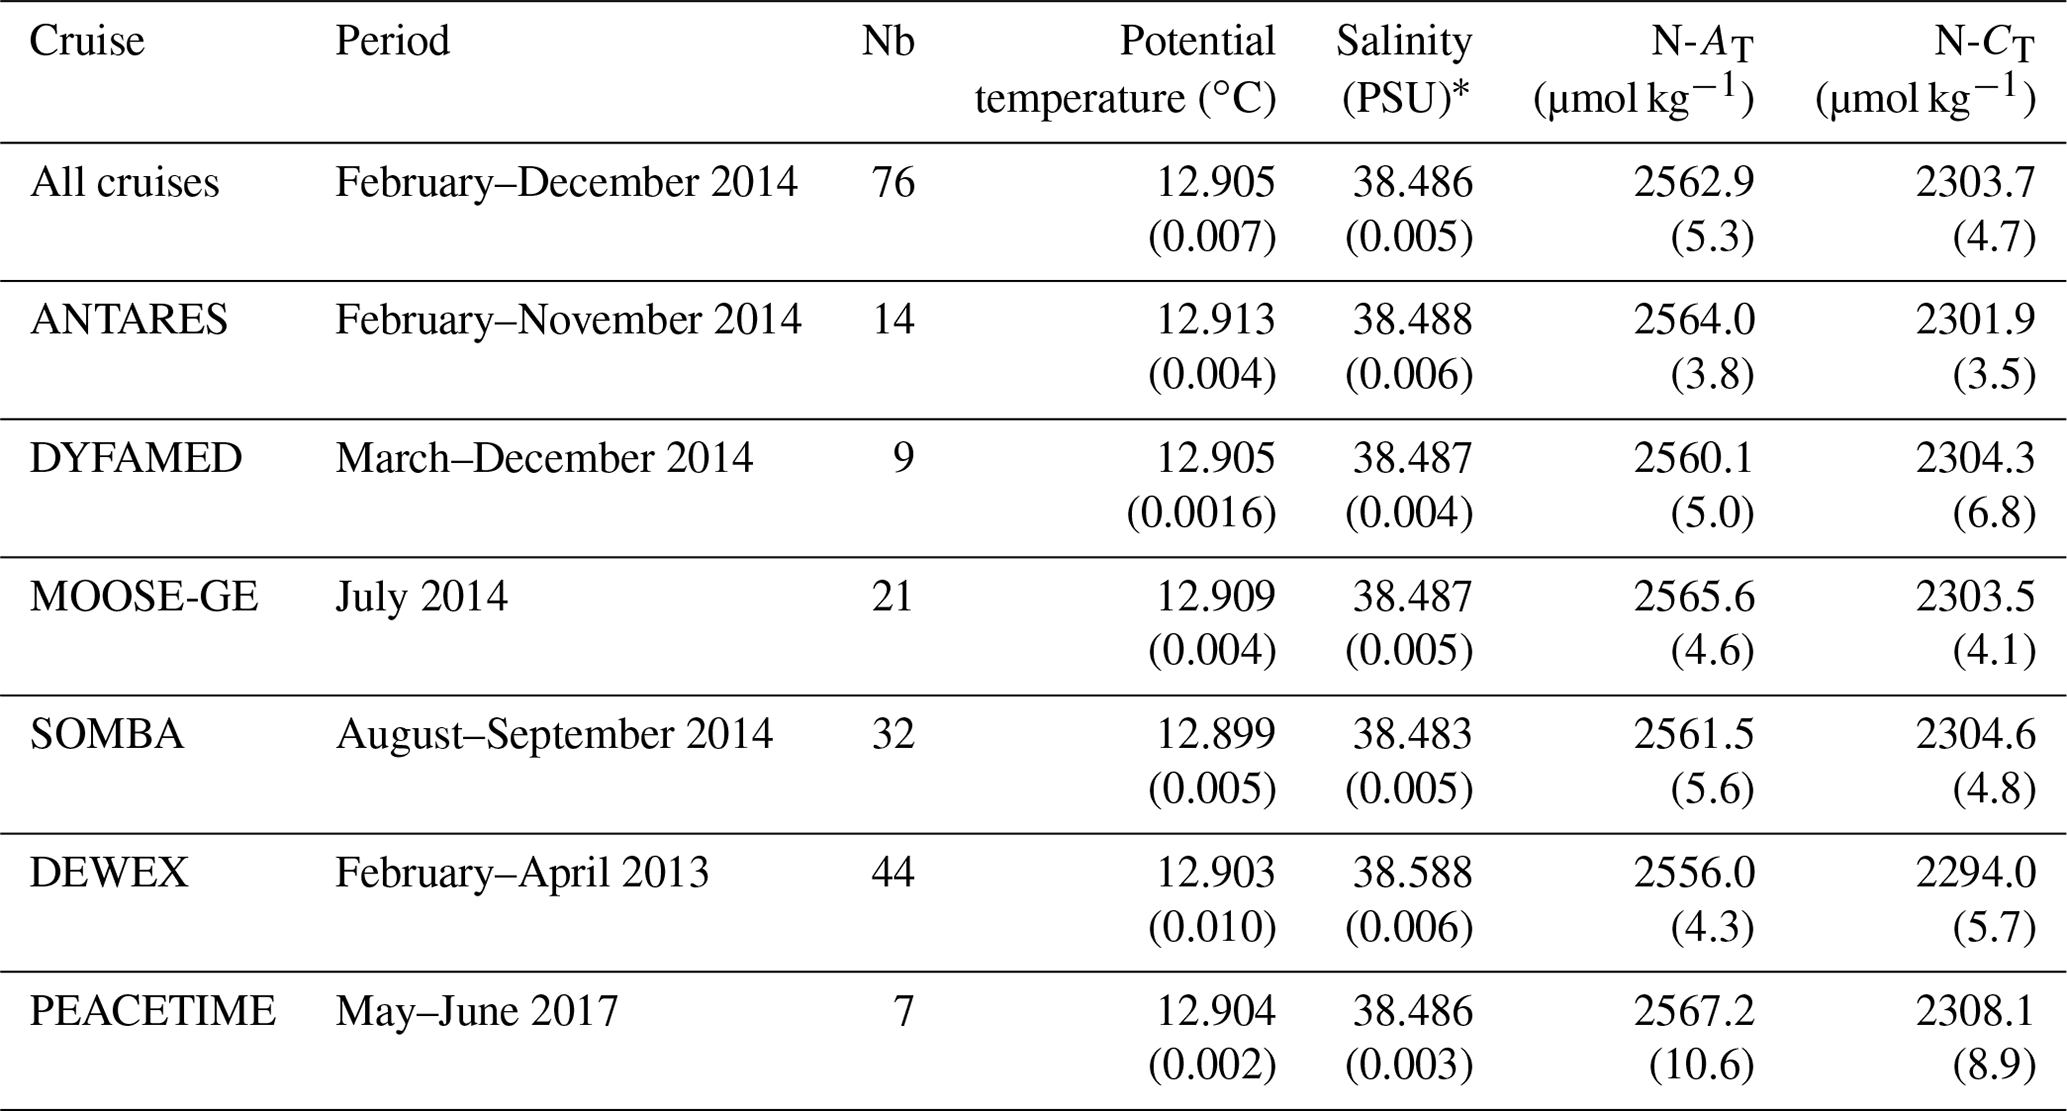
* PSU represents practical salinity units.
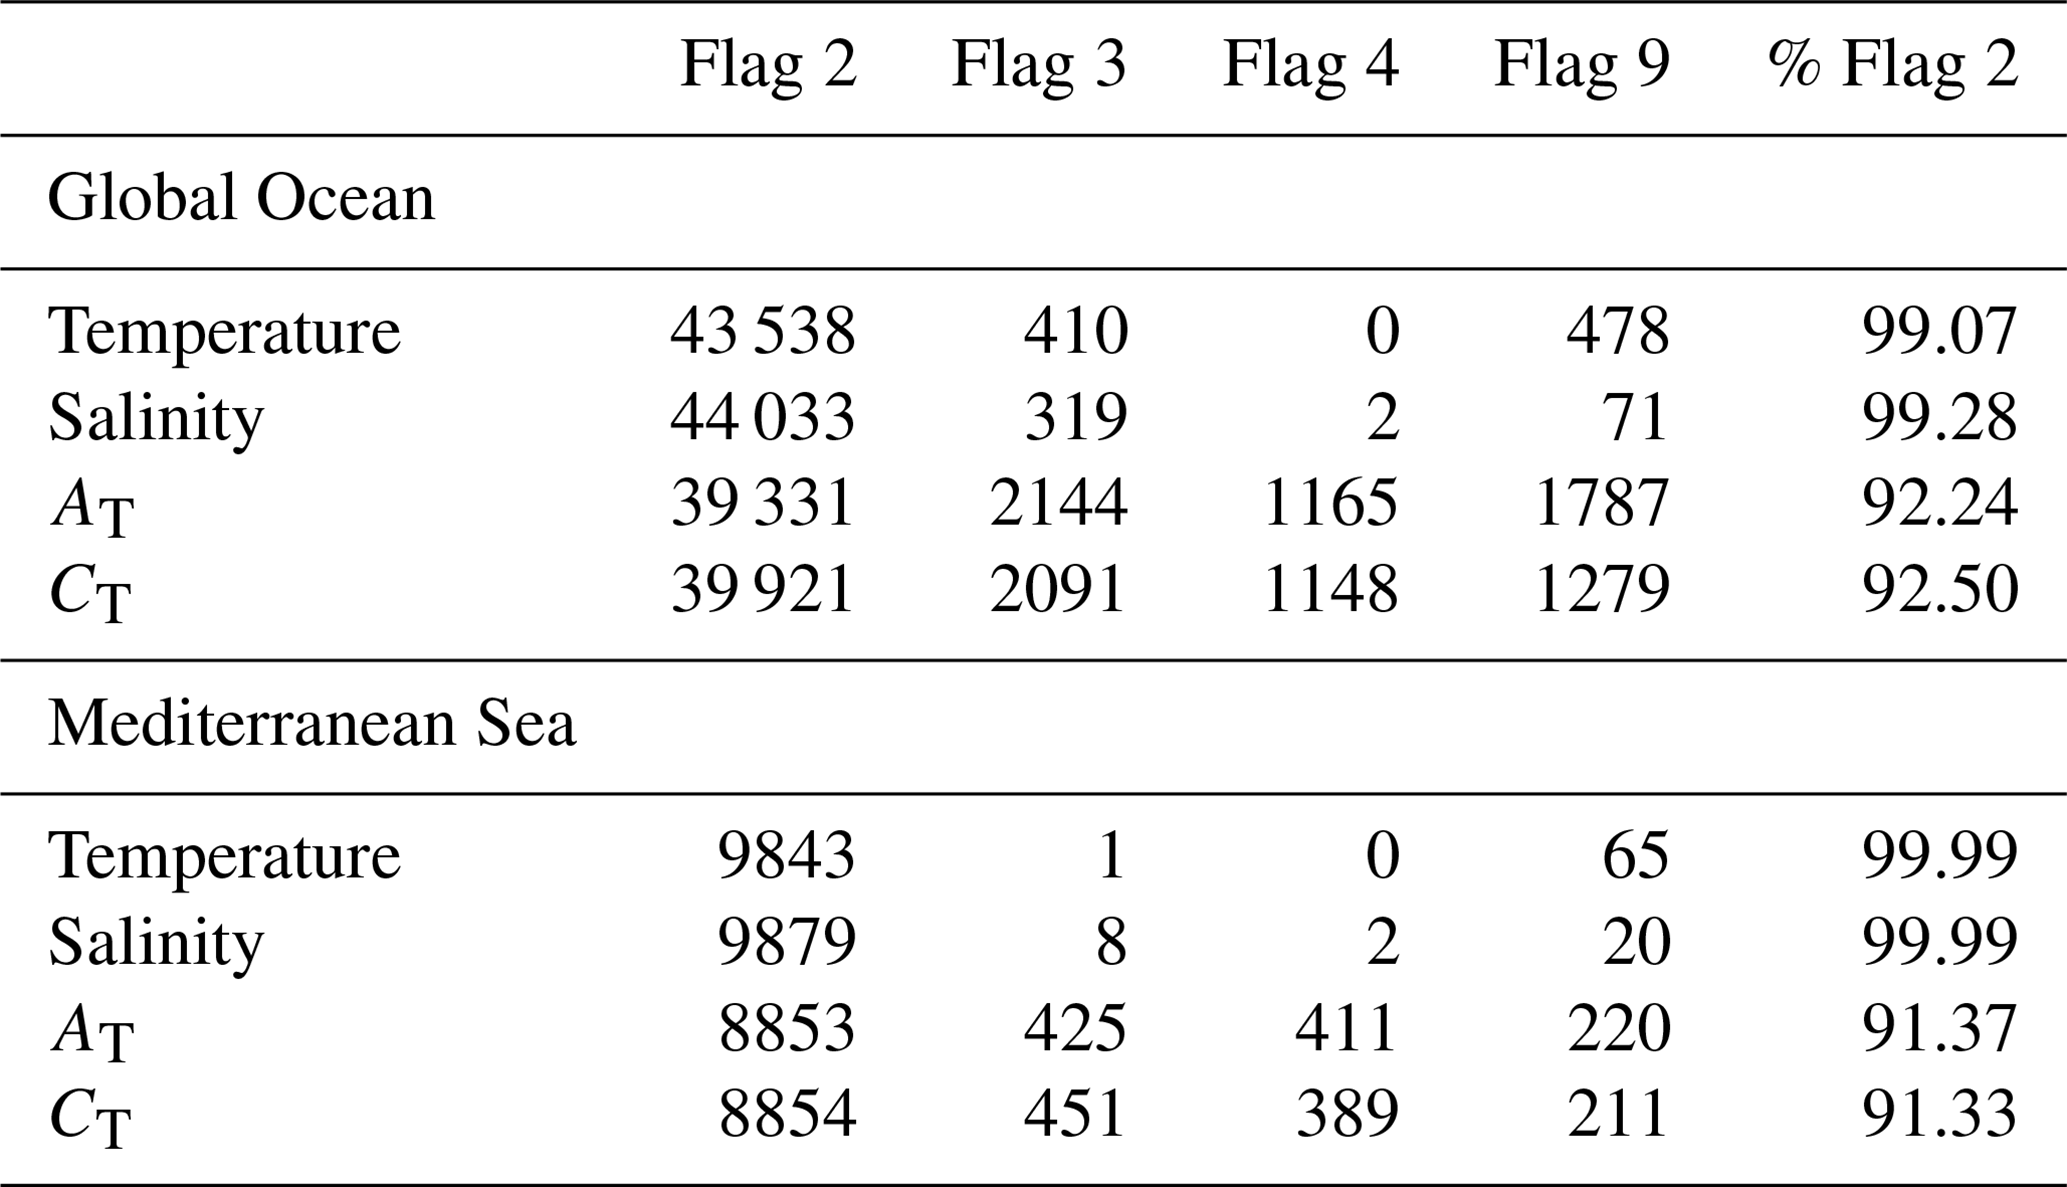
The total number of data for the Global Ocean and the Mediterranean Sea are gathered in Table 5 with the corresponding flags for each property. Overall, the synthesis includes more than 94 % of good data for both AT and CT. About 5 % of data are questionable and 2 % are likely bad. Overall, we believe that all data (with Flag 2) in this synthesis have an accuracy of better than 4 µmol kg−1 for both AT and CT, which is the same as for quality-controlled data in GLODAP (Olsen et al., 2020; Lauvset et al., 2021). The uncertainty ranges between the climate goal (2 µmol kg−1) and the “weather goal” (10 µmol kg−1) for ocean acidification studies (Newton et al., 2015; Tilbrook et al., 2019). This accuracy is also relevant to validate or constrain data-based methods that reconstruct AT and CT fields with an error of around 10–15 µmol kg−1 for both properties (Bittig et al., 2018; Broullón et al., 2019, 2020; Fourrier et al., 2020).
Table 5Number of temperature, salinity, AT and CT data in the synthesis identified for flags 2, 3, 4 and 9. The data are given for the full Global Ocean and for the Mediterranean Sea dataset. The last column is the percentage of Flag 2 (good).
3.5 Using AT and CT to calculate fCO2 and pH for comparison with fCO2 and pH measurements
For some projects, the AT and CT data presented in this synthesis were used to calibrate or validate in situ fCO2 sensors (Bozec et al., 2011; Marrec et al., 2014; Merlivat et al., 2018). The AT and CT data were also used to calculate fCO2 and to derive associated air–sea CO2 fluxes, especially during periods when no direct fCO2 measurements were available (e.g., in the North Atlantic; Fig. 4; Watson et al., 2009; McKinley et al., 2011). For example, Marrec et al. (2014) successfully used the calculated pCO2 (with AT–CT pairs) to adjust the drift of the pCO2 data recorded with a CONTROS HydroC CO2 FT sensor mounted on a FerryBox for regularly sampling the western English Channel (CHANNEL project). Here, we show the results for the 2012–2014 period (Fig. 6). In this region, the total alkalinity is relatively constant over time: the average AT for 528 samples from different seasons and years is 2334.4 (±7.2) µmol kg−1. Conversely, the CT concentrations show distinctive seasonality, with higher concentrations in winter and lower concentrations in summer when biological activity is pronounced (Marrec et al., 2013, 2014; Kitidis et al., 2019). This controls the seasonal pCO2 distribution revealed each year in both the measured and calculated pCO2 (Fig. 6). For 528 co-located samples, the mean difference between calculated and measured pCO2 is −1.9 (±11.9) µatm, with no distinct differences depending on the season and year.
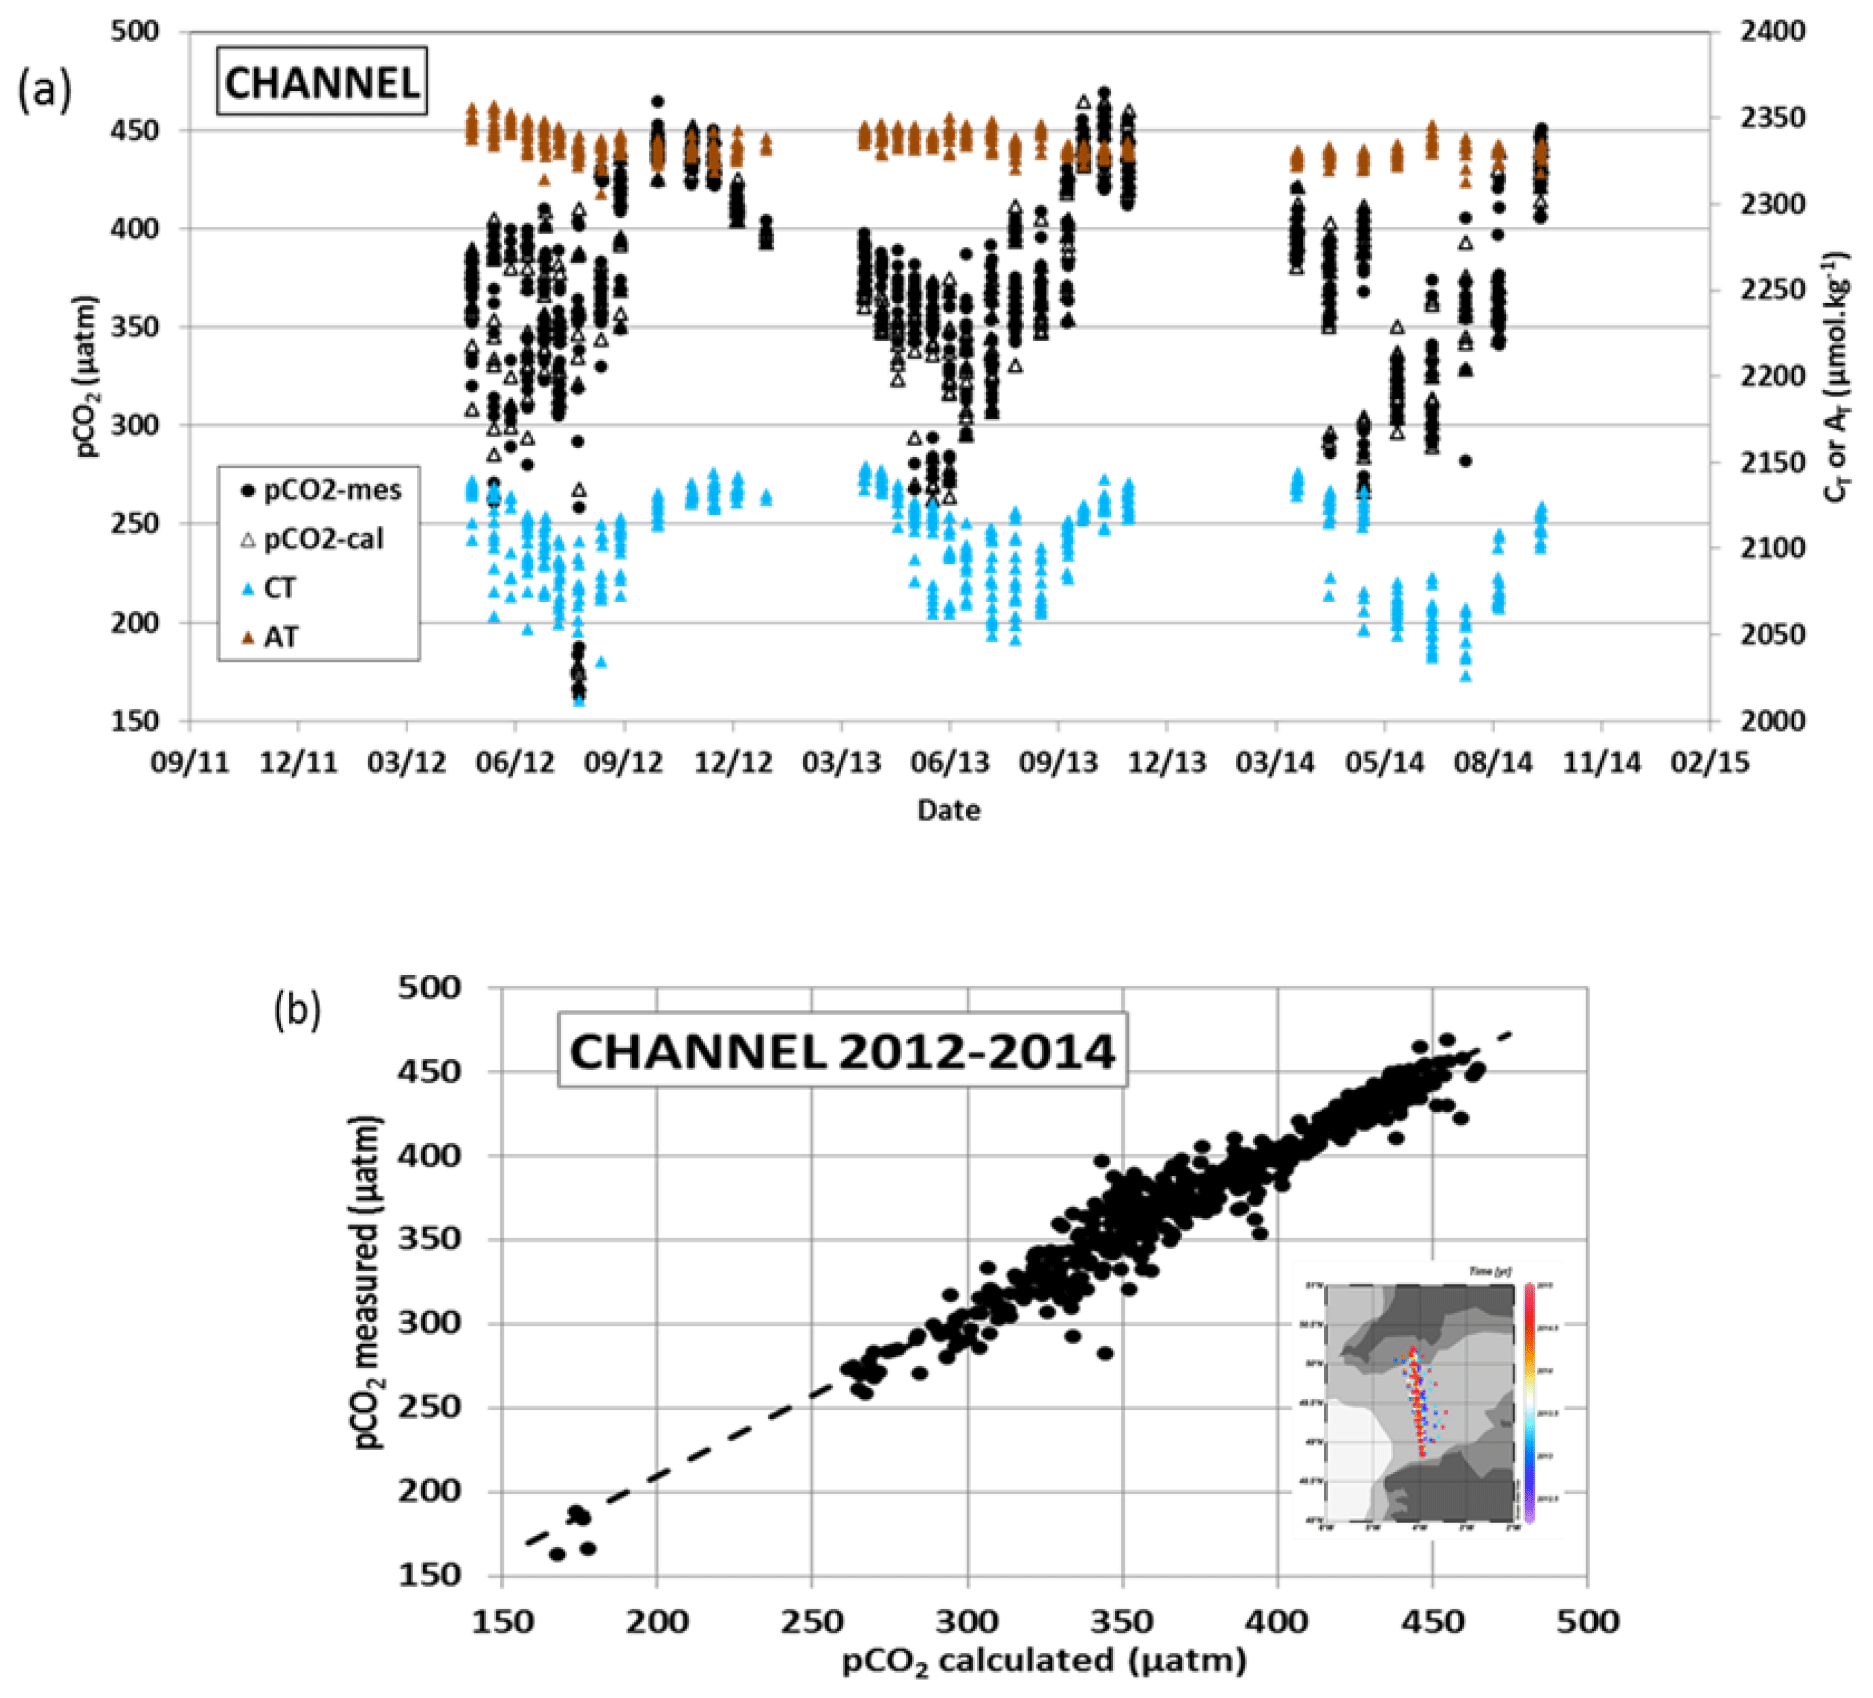
Figure 6Panel (a) presents time series of AT (brown triangles, right y axis), CT (blue triangles, right y axis), calculated pCO2 (open triangles, left y axis) and measured pCO2 (filled circles) in the western English Channel in 2012–2014 (Marrec et al., 2014). Panel (b) shows measured pCO2 versus calculated pCO2 for the same samples. The mean difference (pCO2cal−pCO2mes) for 528 samples is −1.9 (±11.9) µatm. Data are from Marrec and Bozec (2016a, b, 2017). Localization of the samples is shown in the inset map in panel (b), which was produced with ODV (Schlitzer, 2018).
In the Ligurian Sea, following the first high-frequency in situ fCO2 measurements in 1995–1997 at the DYFAMED time series' station (Hood and Merlivat, 2001), a new CARIOCA fCO2 sensor was deployed at that location in 2013 (BOUSSOLE project; Merlivat et al., 2018). The CARIOCA sensor was calibrated with regular AT and CT analyses performed at LOCEAN. Based on these data, the mean difference between CARIOCA fCO2 measurements and calculated fCO2 data was estimated to be around ±4.4 µatm for 2013–2015, i.e., of the same order as the precision of the CARIOCA sensor (±5 µatm; Merlivat et al., 2018). Here, we extend the results for the 2013–2018 period (Golbol et al., 2020; data also in SOCAT version v2021 in Bakker et al., 2016) and compared the CARIOCA fCO2 time series with AT and CT data from different cruises (BOUSSOLE, DYFAMED and MOOSE-GE) selected in the 0–20 m layer at that location (Fig. S4). For 67 co-located samples from different seasons and years, the mean difference between calculated and measured fCO2 (fCO2cal−fCO2mes) was −3.7 (±10.8) µatm where fCO2 was calculated from AT–CT pairs using the constant from Lueker et al. (2000). At the location of the BOUSSOLE mooring in the Ligurian Sea (shown in Fig. S4), the alkalinity is relatively constant over the 2013–2018 period, with an average concentration of 2569.8 (±13.2) µmol kg−1. In contrast, CT concentrations show a clear seasonality, decreasing by around 50 µmol kg−1 from winter to late summer, driving the large seasonal cycle of fCO2 (range 80 µatm) revealed in both measured and calculated values (here, fCO2 is normalized at 13 ∘C; Fig. S4). In addition to calibration purposes, a regional AT–salinity relationship was derived from the AT data measured at that location and successfully used to construct time series of CT and pH calculated from the high-frequency CARIOCA fCO2 data to investigate and interpret the long-term change in fCO2 and acidification in the Ligurian Sea (Merlivat et al., 2018; Coppola et al., 2020).
A CARIOCA sensor was also deployed in 2003 near the SOMLIT-BREST time series' site in the Bay of Brest (Bozec et al., 2011; Salt et al., 2016). As for BOUSSOLE in the Ligurian Sea, samples collected for AT and CT were used for validation of the pCO2 recorded by the CARIOCA sensor, and the comparison with calculated pCO2 showed good agreement, i.e., pCO2cal=0.98 × pCO2mes+7 µatm (Bozec et al., 2011). CARIOCA sensors were also deployed on moorings in the tropical Atlantic (PIRATA project; e.g., Lefèvre et al., 2008, 2016; Parard et al., 2010). With the discrete AT and CT data included in this synthesis (EGEE and PIRATA-FR cruises), the fCO2 data from the CARIOCA sensor associated with an adapted AT–salinity relationship were used to derive pH (Lefèvre et al., 2016) or CT time series to evaluate net community production in the eastern tropical Atlantic (Parard et al., 2010; Lefèvre and Merlivat, 2012).
Although this is not a direct instrumental intercomparison, differences between pCO2 (or fCO2) calculated using AT–CT pairs with direct pCO2 measurements provide a glimpse into the quality of AT and CT data in this synthesis, given the uncertainty attached to the pCO2 or pH calculations (Orr et al., 2015). For example, in the framework of the SURATLANT project in the North Atlantic, calculated fCO2 data were compared with co-located fCO2 measurements for different seasons and years (Fig. S5). The mean differences (fCO2cal−fCO2mes) ranged between −4.3 (±12.9) µatm (2004–2007, 74 co-located samples) and −3.0 (±12.1) µatm (2014–2015, 98 co-located samples). The differences are almost the same for different years (and seasons) and are, thus, attributed to method uncertainties (including sampling time, measurement errors and data processing). Based on these comparisons and the consistency between data, we are confident that the AT and CT data presented in this synthesis could be used to calculate fCO2 (and pH) and to interpret temporal changes and drivers of these parameters as well as to estimate air–sea CO2 fluxes in the North Atlantic (e.g., Corbière et al., 2007; Schuster et al., 2009, 2013; Watson et al., 2009; Metzl et al., 2010; McKinley et al., 2011; Reverdin et al., 2018; Kitidis et al., 2019; Leseurre et al., 2020).
The AT and CT data in this synthesis have also been successfully used for fCO2 and air–sea CO2 flux calculations in other regions: the tropical Atlantic (Koffi et al., 2010), the tropical Pacific (Moutin et al., 2018; Wagener et al., 2018a), the Solomon Sea (Ganachaud et al., 2017), or the Mediterranean Sea and coastal zones (De Carlo et al., 2013; Marrec et al., 2015; Kapsenberg et al., 2017; Coppola et al., 2020; Keraghel et al., 2020; Wimart-Rousseau et al., 2020; Gattuso et al., 2023).
In addition, AT and CT data at the surface and in the water column are also relevant to calculate pH and evaluate its rate of change in the context of addressing the topic of ocean acidification in different regions (Kapsenberg et al., 2017; Ganachaud et al., 2017; Wagener et al., 2018a; Coppola et al., 2020; Leseurre et al., 2020; Lo Monaco et al., 2021). At the ECOSCOPA time series' station in the Bay of Brest (Fleury et al., 2023; Petton et al., 2023), pH values calculated with AT and CT data were compared with direct pH measurements (Fig. S6). In 2017–2019, pH (at a standard temperature of 25 ∘C, hereafter pH-25C) was always lower than 8 and presented a large seasonal signal of 0.3 (high pH values in spring but low values in winter). The mean difference between calculated and measured pH-25C for 46 samples was equal to +0.013 (±0.010), which is in the range of the pH uncertainty evaluated by error propagation when calculated from AT–CT pairs (an AT and CT error of ±3 µmol kg−1 leads to a pH error of ±0.0144). Part of these AT and CT data used to calculate pH also helped to interpret the response of marine species to acidification, e.g., pteropodes or coccolithophores (Emiliania huxleyi), in the Mediterranean Sea (Howes et al., 2015, 2017; Meier et al., 2014) or in the Southern Ocean (Beaufort et al., 2011). The AT and CT data also supported environmental analysis in coral reef ecosystems in the tropical Pacific (Tara expedition; Douville et al., 2022; Lombard et al., 2023; Canesi et al., 2023).
The surface distribution in the Global Ocean based on the SNAPO-CO2 dataset is presented in Fig. 7 for AT and CT. In the open ocean, high AT concentrations are identified in the subtropics in all basins (Jiang et al., 2014; Takahashi et al., 2014), with the highest concentrations of up to 2484 µmol kg−1 found in the central North Atlantic (STRASSE cruise in August 2012; 26∘ N, 36∘ W). At the surface and at depth, the AT–salinity and AT–CT relationships are clearly identified and structured at the regional scale (Fig. 8).
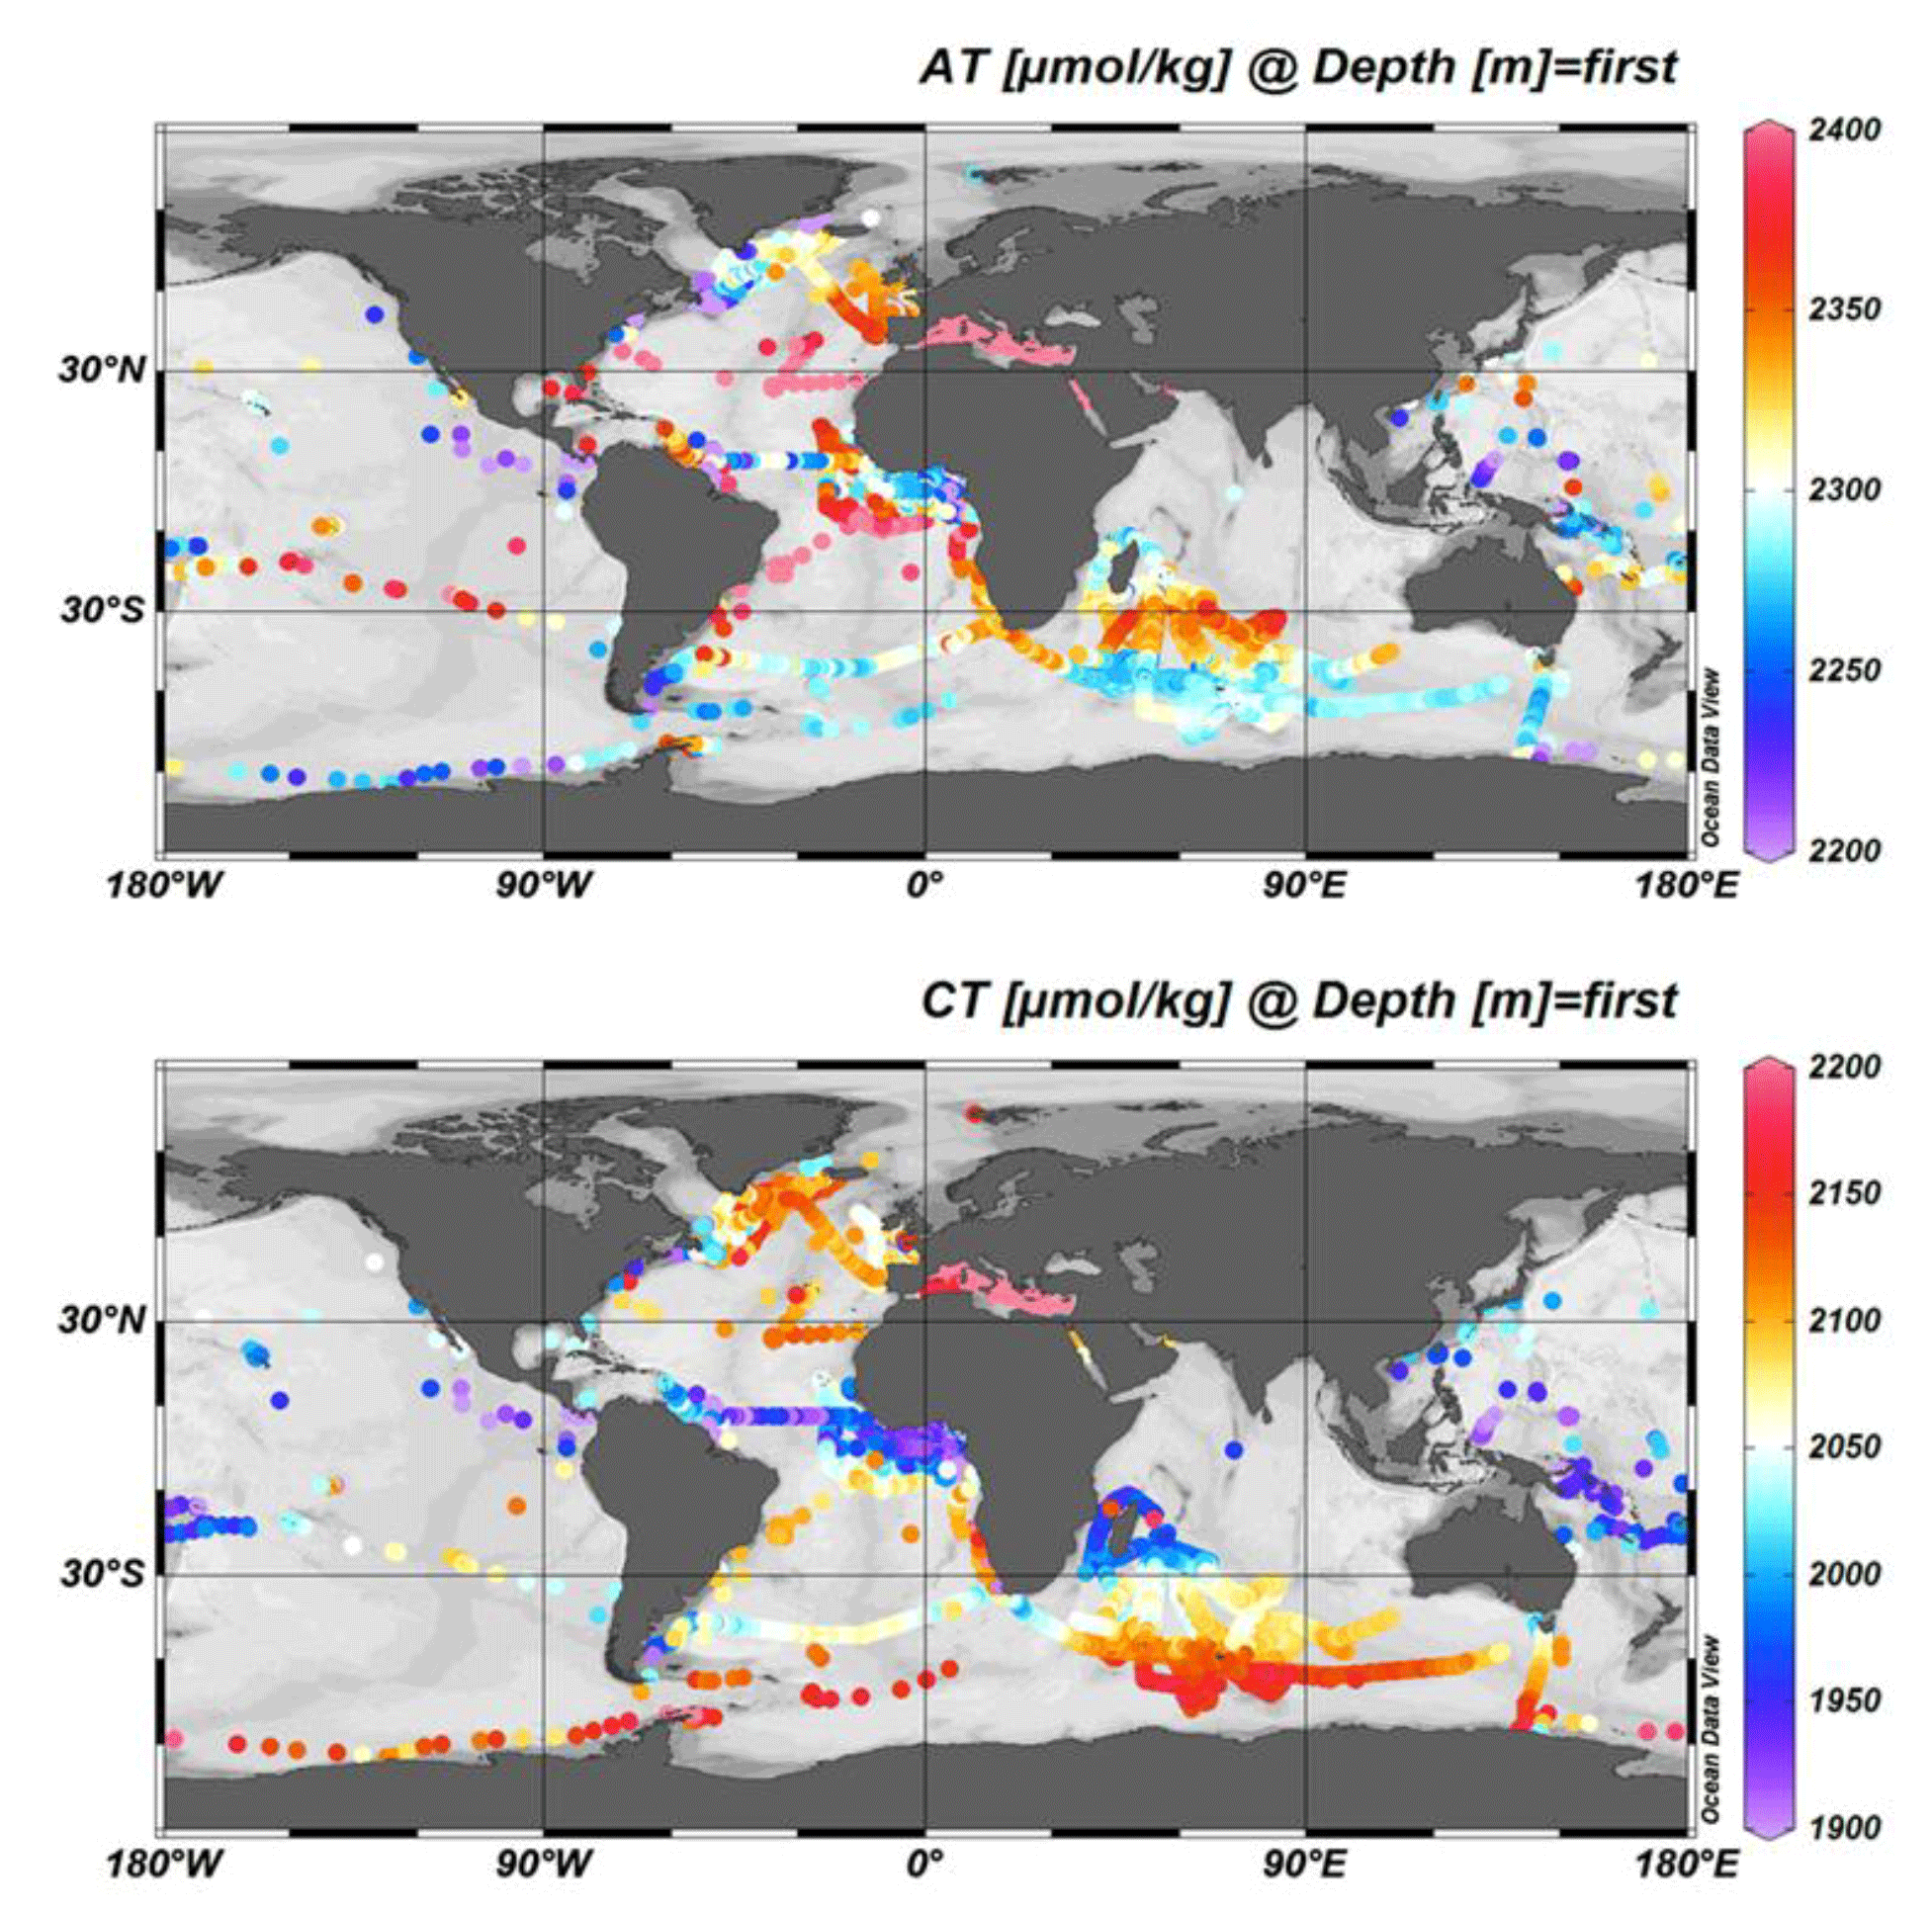
Figure 7Distribution of AT (top) and CT (bottom) concentrations (µmol kg−1) in surface waters (0–10 m). Only data with Flag 2 are presented in these figures. The figure was produced with ODV (Schlitzer, 2018).
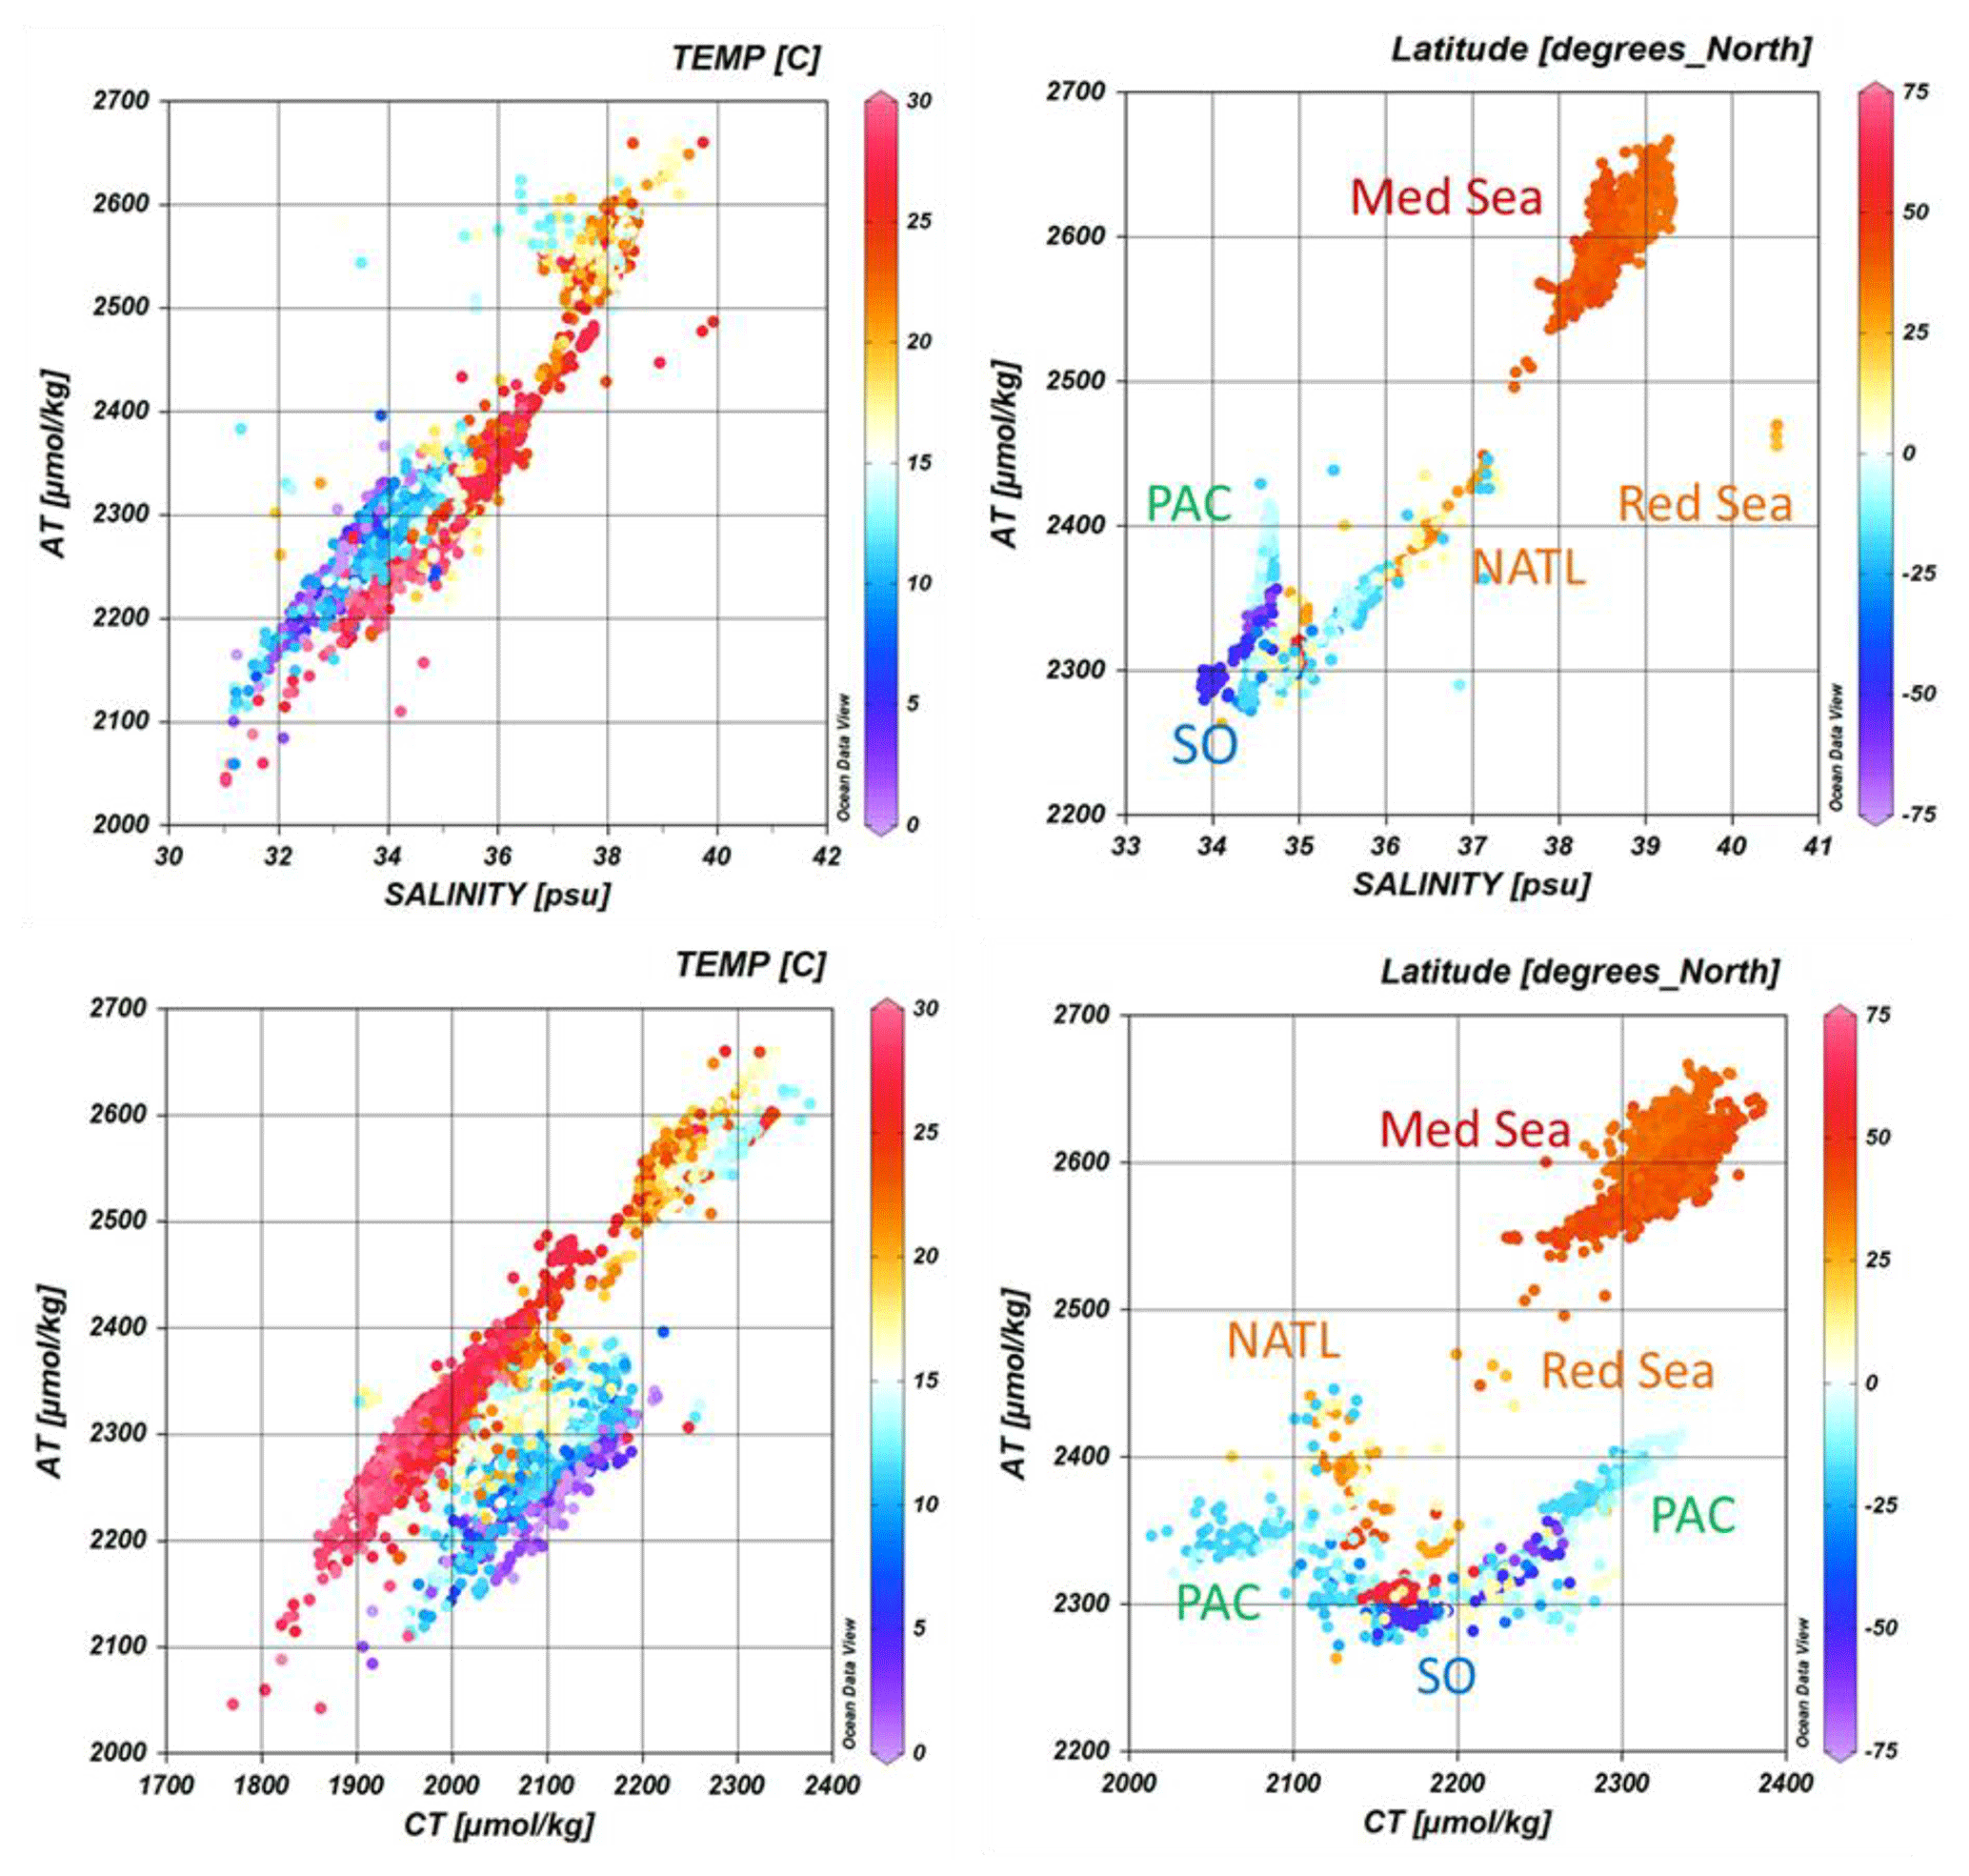
Figure 8Relationships between AT and salinity (upper panels) and between AT and CT (lower panels) for samples in surface waters (0–10 m and sea surface salinity (SSS) >31) (left) and in the water column below 100 m (right). Only data with Flag 2 are presented. The color scales correspond to the temperature (left) or the latitude (right). The following data locations are identified: Mediterranean Sea (Med Sea), Red Sea, tropical Pacific (PAC), North Atlantic (NATL) and Southern Ocean (SO). The figure was produced with ODV (Schlitzer, 2018).
In the eastern tropical Atlantic (ETA), where the Congo River impacts the salinity field (Vangriesheim et al., 2009), AT concentrations range between 2100 and 2400 µmol kg−1. The regional AT–salinity relationship in the ETA based on data from the EGEE cruises in 2005–2007 (Koffi et al., 2010) is robust and has been validated with more recent measurements from PIRATA-FR cruises in 2010–2019 (Lefèvre et al., 2021). The strong AT–salinity relationship in the ETA was also recognized using data from the Tara Microbiome cruise in May–July 2022 (Fig. S7). Low salinity (<30) and low AT (1700–2200 µmol kg−1) are also observed in the western tropical Atlantic near the Amazon River plume. The AT–salinity relationships in both river plume regions are very similar (Fig. S7).
For CT, the lowest concentrations were observed in the coastal regions of the tropical Atlantic, on the eastern side of the Gulf of Guinea (CT=1390 µmol kg−1, BIOZAIRE cruise in 2003; 6∘ S, 11∘ E; Vangriesheim et al., 2009) and on the western side of the Gulf of Guinea in the coastal zone off French Guyana (CT=1512 µmol kg−1, PLUMAND cruise in 2007; 5∘ N, 51∘ W; Lefèvre et al., 2010). Such low CT concentrations were also observed in the Amazon River plume (around 5∘ N, 51∘ W) during the recent EUREC4A-OA cruise in 2020 and the Tara Microbiome cruise in 2021 (CT=1451 µmol kg−1) leading to low oceanic fCO2 (<350 µatm) and a CO2 sink in this region (Olivier et al., 2022).
The high CT concentrations were mainly observed in the Southern Ocean (OISO and Antarctic Circumpolar Expedition, ACE, cruises), south of the polar front around 50∘ S, linked to the upwelling of CT-rich deep water (Fig. 7, Metzl et al., 2006; Wu et al., 2019; Chen et al., 2022). This leads to a high CT/AT ratio and a high Revelle factor in the Southern Ocean (Fig. 9; Fassbender et al., 2017). The high CT content and low temperature in the Southern Ocean also lead to a low calcite and aragonite saturation state (Ω) (Takahashi et al., 2014; Jiang et al., 2015). We calculate Ω from AT and CT data at in situ temperature, salinity and pressure. At present, the surface ocean is not undersaturated with regard to aragonite (Fig. 10); however, undersaturation levels (Ω-Ar <1) were found at around 500 m in the Southern Ocean (ACE cruise in 2017 and MODYDICK cruise in 2018), 1000 m in the tropical Pacific (PANDORA 2012 and OUTPACE 2015 cruises) and 2200 m in the North Atlantic (OVIDE 2012 and 2014 cruises; see also Turk et al., 2017) (Fig. 10). Samples at 400 m from the Tara Oceans cruise in 2009–2012 also indicated aragonite undersaturation in the equatorial Atlantic, equatorial Pacific and off South America (34∘ S, 73∘ W; Chile) associated with equatorial or eastern boundary upwelling systems (Feely et al., 2012; Lauvset et al., 2020).
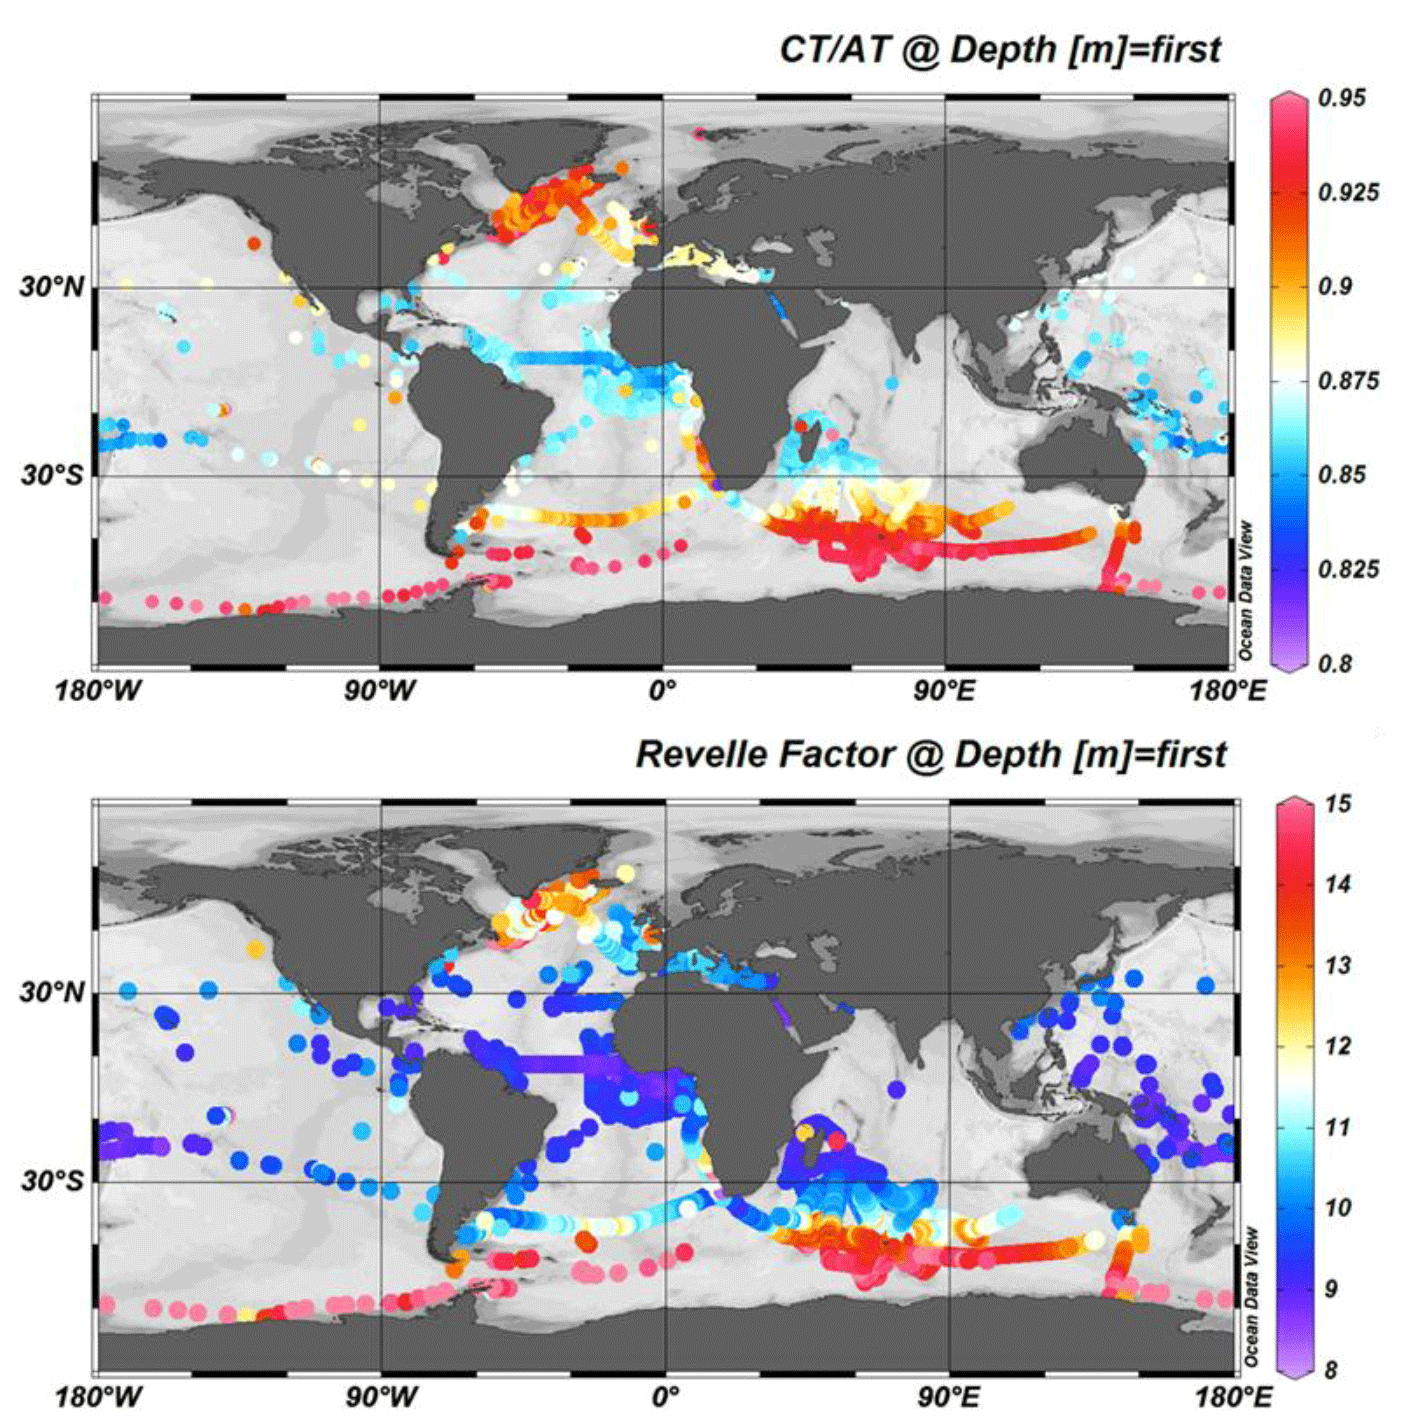
Figure 9Distribution of the CT/AT ratio (top) and the Revelle factor (bottom) in surface waters (0–10 m). Only data with Flag 2 were used. The figure was produced with ODV (Schlitzer, 2018).
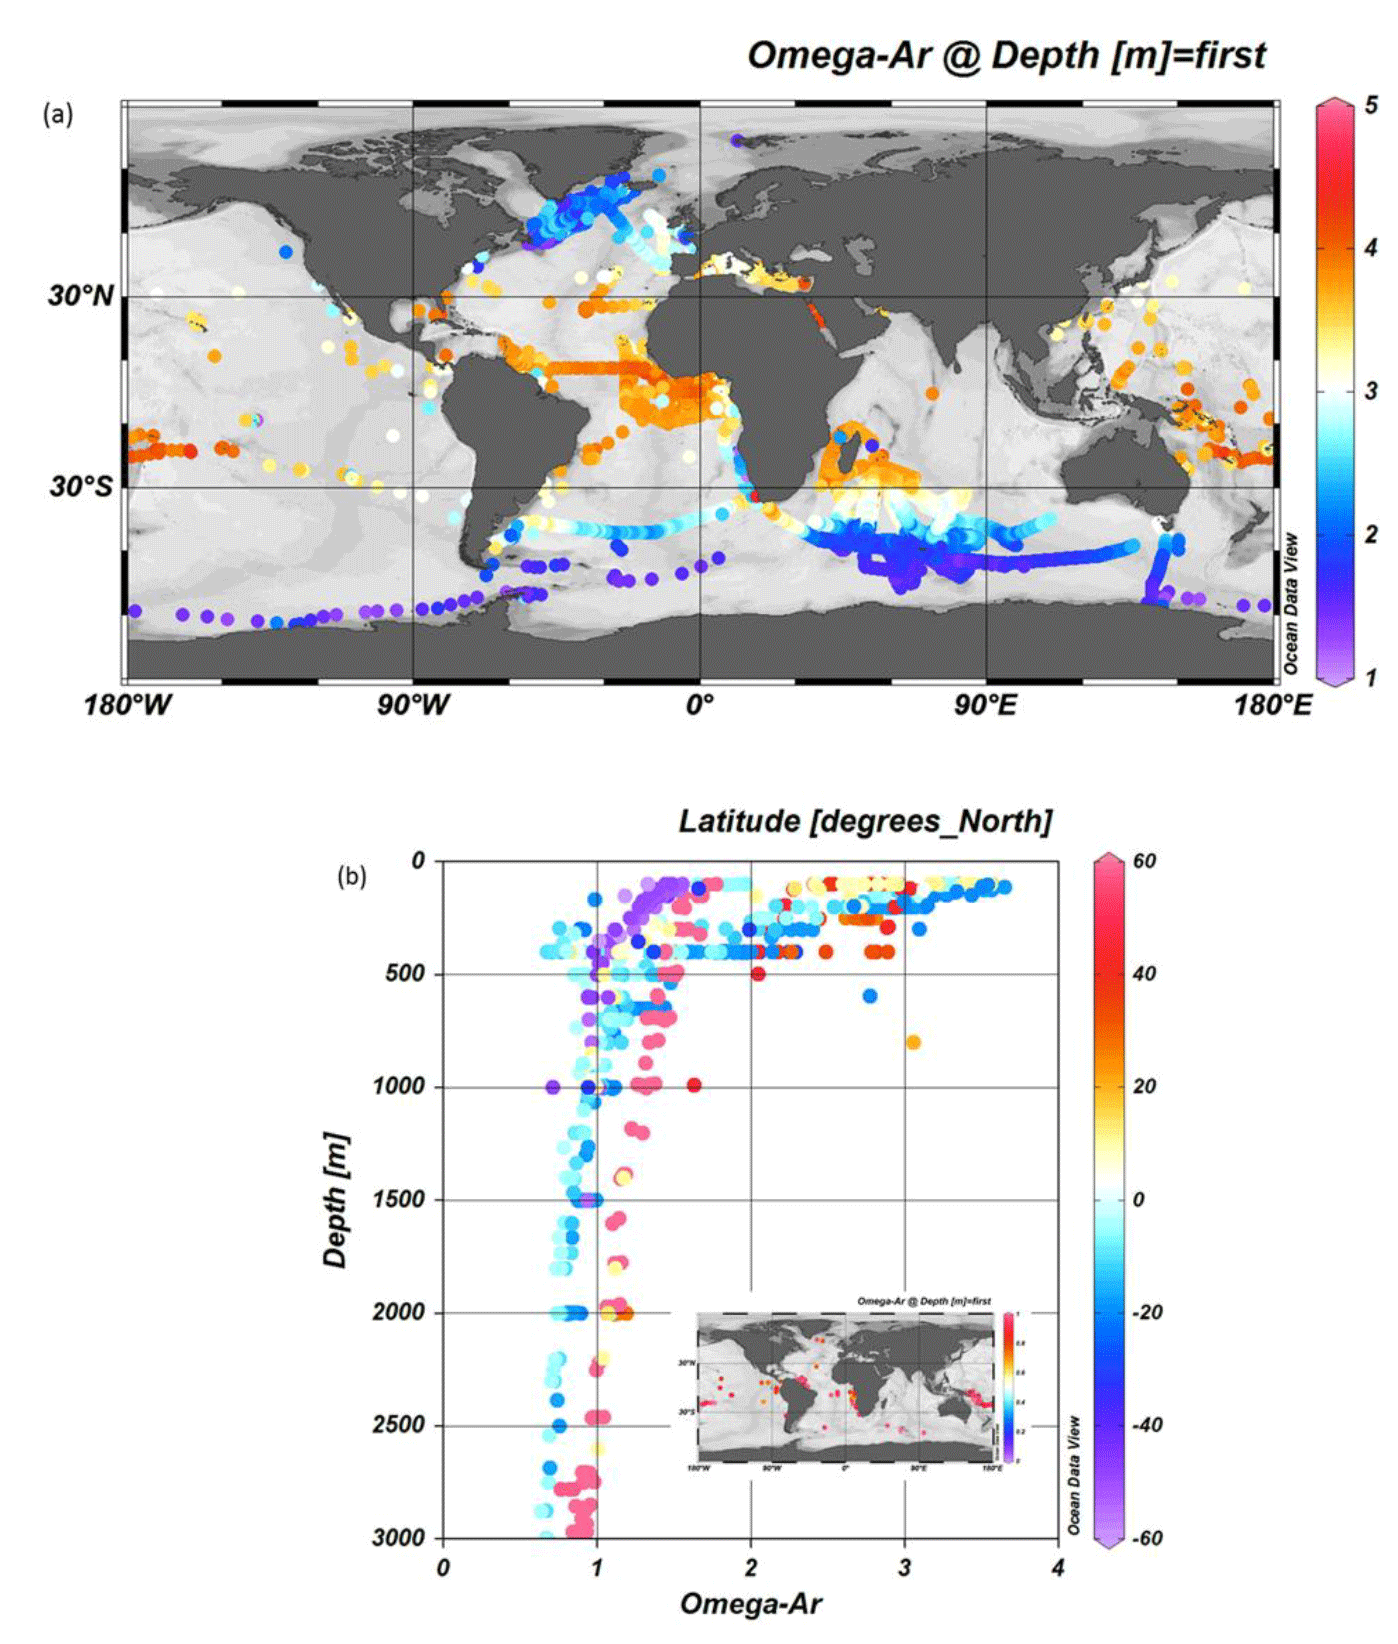
Figure 10Panel (a) shows the distribution of the aragonite saturation state (Ω-Ar) in surface waters (0–10 m). Only data with Flag 2 were used. Panel (b) presents depth profiles (100–3000 m) of Ω-Ar at few locations in the tropical Pacific, Atlantic and Southern oceans. Stations where undersaturation is detected (Ω-Ar <1) at depth are identified in the inset map. The figure was produced with ODV (Schlitzer, 2018).
At the surface, Ω-Ar >3 is found in the latitudinal band between 45∘ S and 54∘ N, whereas Ω-Ar <3 below the critical threshold of Ω-Ar = 3.25 that represents a limit for the distribution of tropical coral reefs (Hoegh-Guldberg et al., 2007) is observed at very few locations in the tropics.
Compared with the open ocean, AT concentrations are much higher in the Mediterranean Sea (Copin-Montégut, 1993; Schneider et al., 2007; Álvarez et al., 2023), with values up to 2600 µmol kg−1 (Fig. 8). The AT and CT data obtained in 1998–2019 show, on average, a clear contrast between the northern and southern regions of the western Mediterranean Sea (Fig. 11a, b), with a higher concentration in the Ligurian Sea and the Gulf of Lion (Gemayel et al., 2015). However, the basin-scale average distribution view smoothed the mesoscale signals recognized in the Mediterranean Sea (e.g., Bosse et al., 2017; Petrenko et al., 2017). In the Gulf of Lion, the synthesis of 11 cruises conducted from May 2010 to June 2011 (CARBORHONE, CASCADE, LATEX, MOLA and MOOSE-GE) highlights the contrasting distributions of AT and CT in the coastal zones and offshore (Fig. 11c, d). The averaging of all data for 1998–2019 also smoothed the seasonal signal and the interannual variability described below.
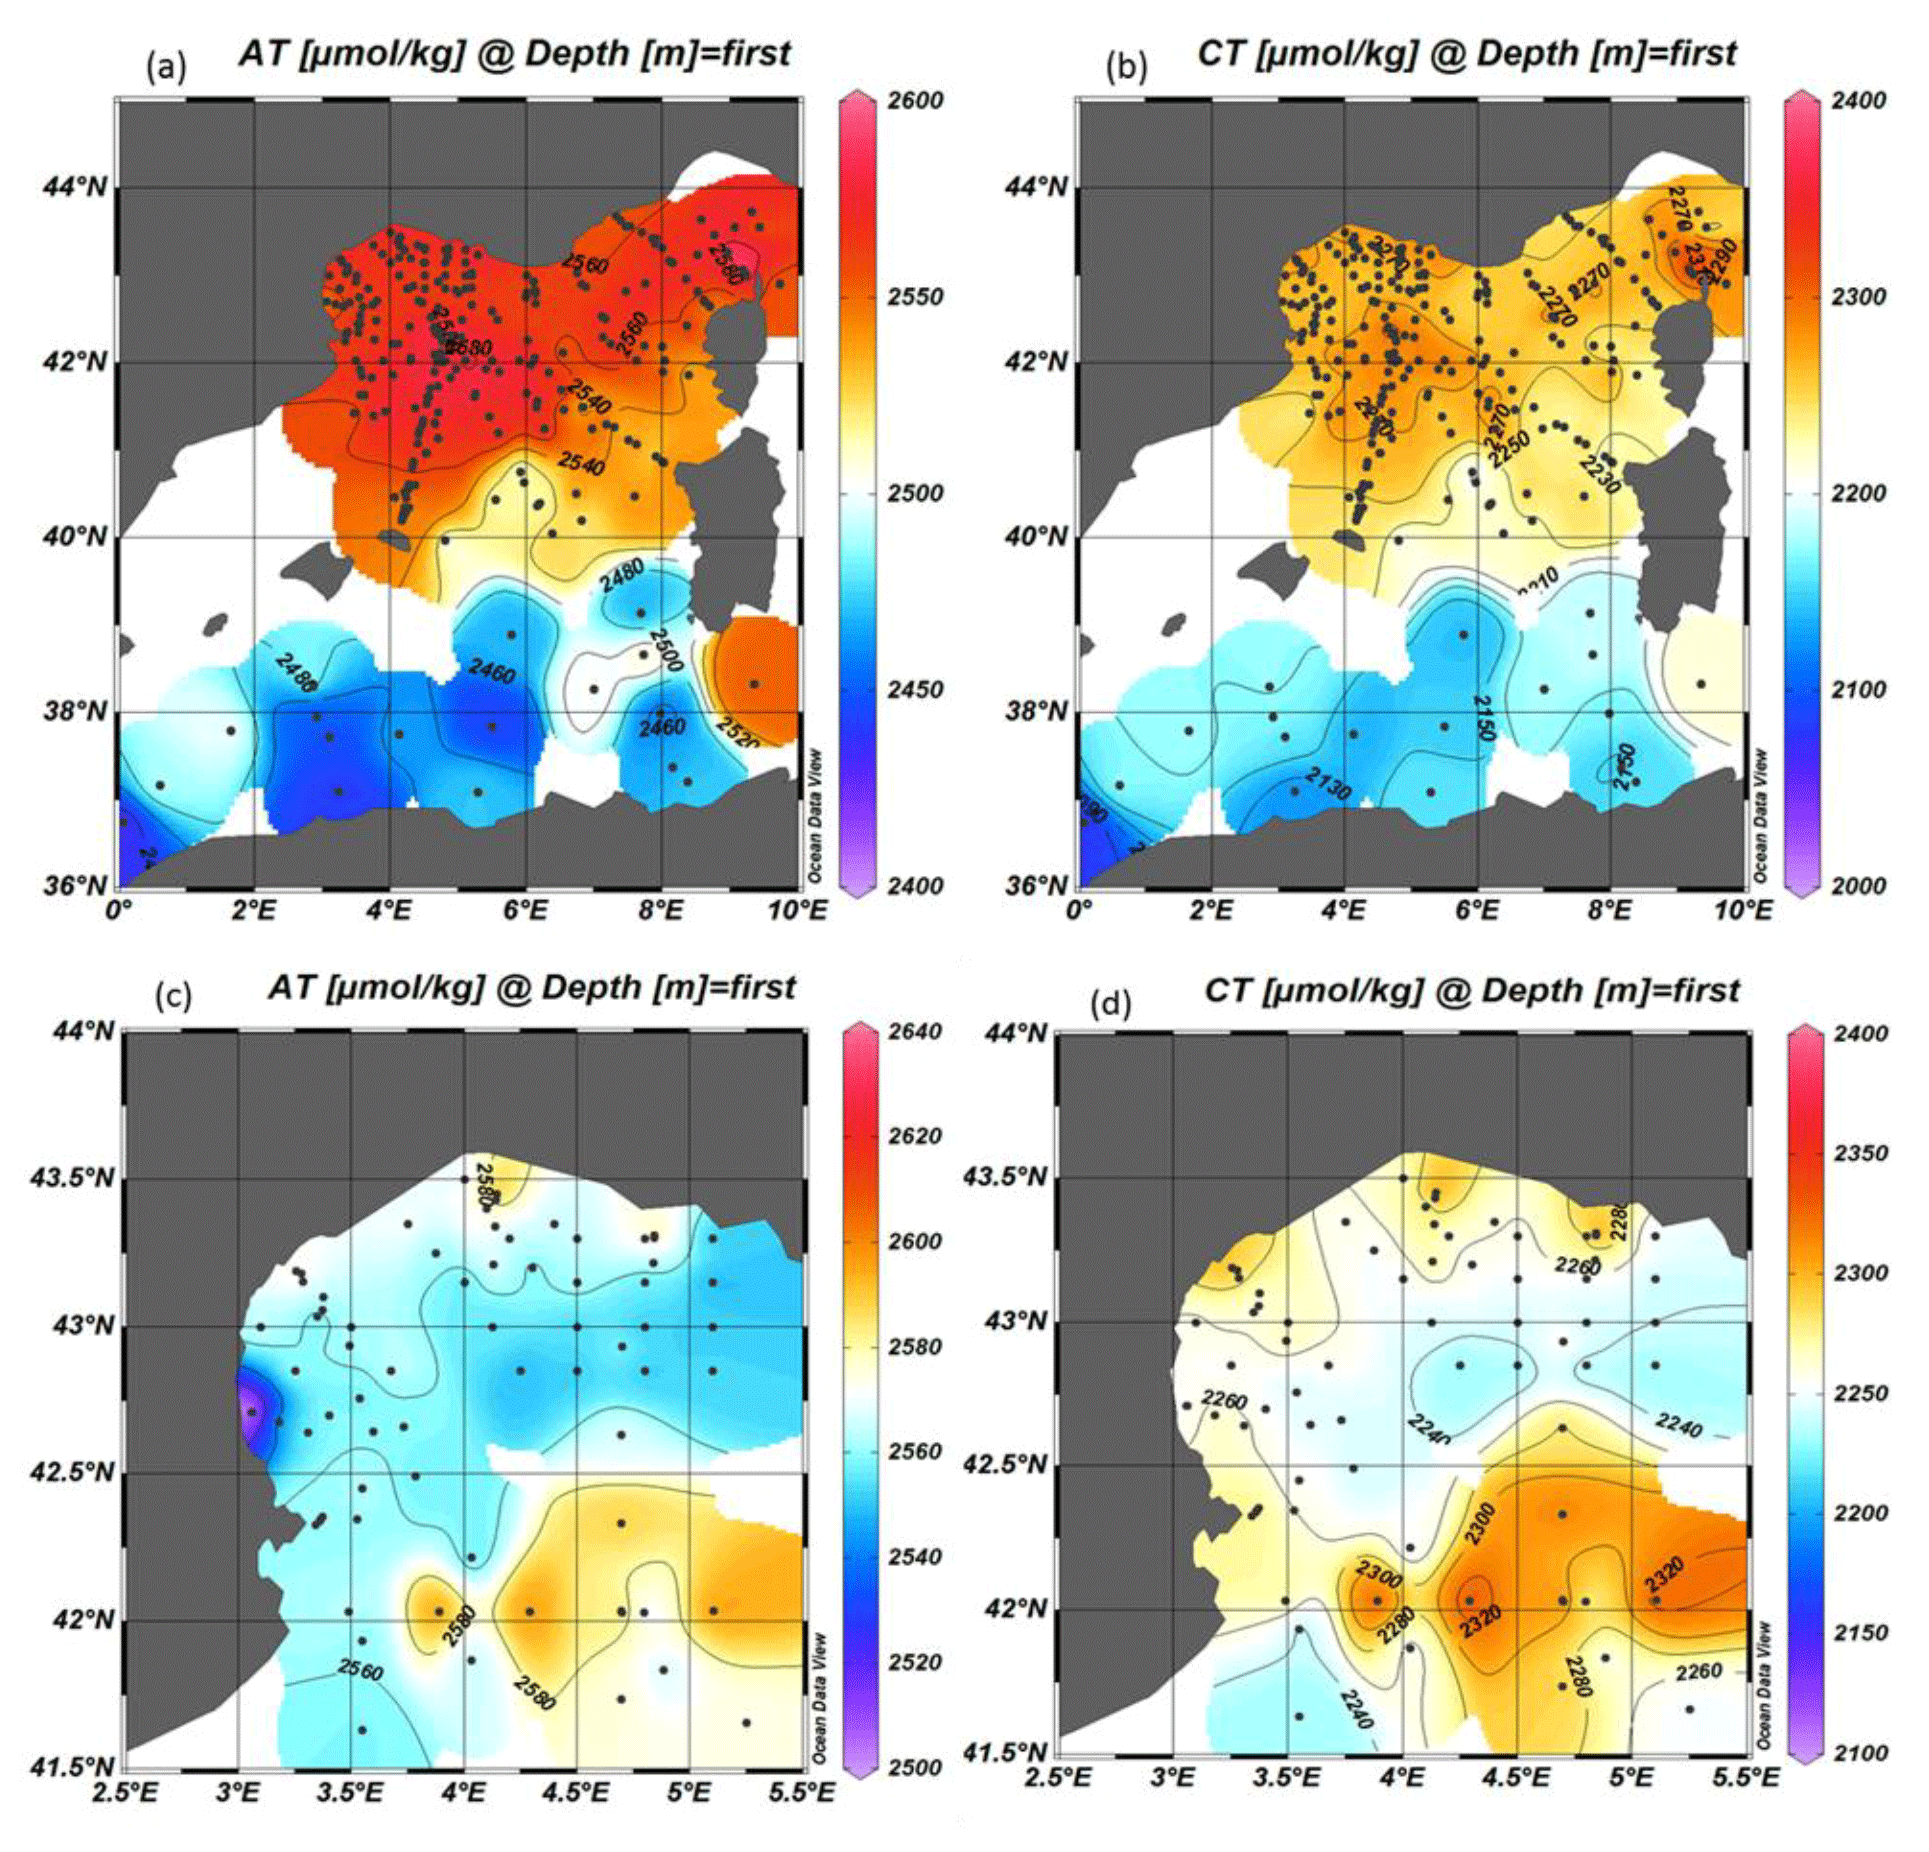
Figure 11Distribution (in µmol kg−1) of AT (a) and CT (b) in surface waters of the western Mediterranean Sea (0–10 m) from all data for 1998–2019. A detailed distribution (in µmol kg−1 ) of AT (c) and CT (d) in surface waters of the Gulf of Lion is also given for the 2010–2011 period only (the CARBORHONE, CASCADE, LATEX, MOLA and MOOSE-GE cruises). The figure was produced with ODV (Schlitzer, 2018).
Time series' stations, such as BATS, ESTOC and HOT, in the subtropics and stations in the Irminger Sea or in the Iceland Sea are the only way to detect the long-term change in the ocean carbonate system at the surface and in the water column (Bates et al., 2014). These important time series help to understand driving processes (e.g., Hagens and Middelburg, 2016) and are often used to validate the reconstructed pCO2, AT, CT or pH fields (e.g., Rödenbeck et al., 2013; Broullón et al., 2019, 2020; Keppler et al., 2020; Gregor and Gruber, 2021; Ma et al., 2023).
Here, we show examples of the temporal surface variations at locations where data were obtained for more than 10 years (Fig. 12). Thus, we selected the following contrasting regions: the North Atlantic subpolar gyre (NASPG; around 60∘ N,30∘ W; 1993–2018 period), the equatorial Atlantic (at 2∘ N–2∘ S, 12∘ W–8∘ W; 2005–2017 period), the Indian Ocean subtropical sector (26–35∘ S, 50–56∘ E; 1998–2018 period), the high-latitude Indian Ocean (54–60∘ S, 60–70∘ E; 1998–2018 period), the Ligurian Sea (around DYFAMED station; 43.5–42.5∘ N, 5.5–9∘ E; 1998–2019 period) and times series' stations in the coastal zones off Brittany (2008–2019 period).
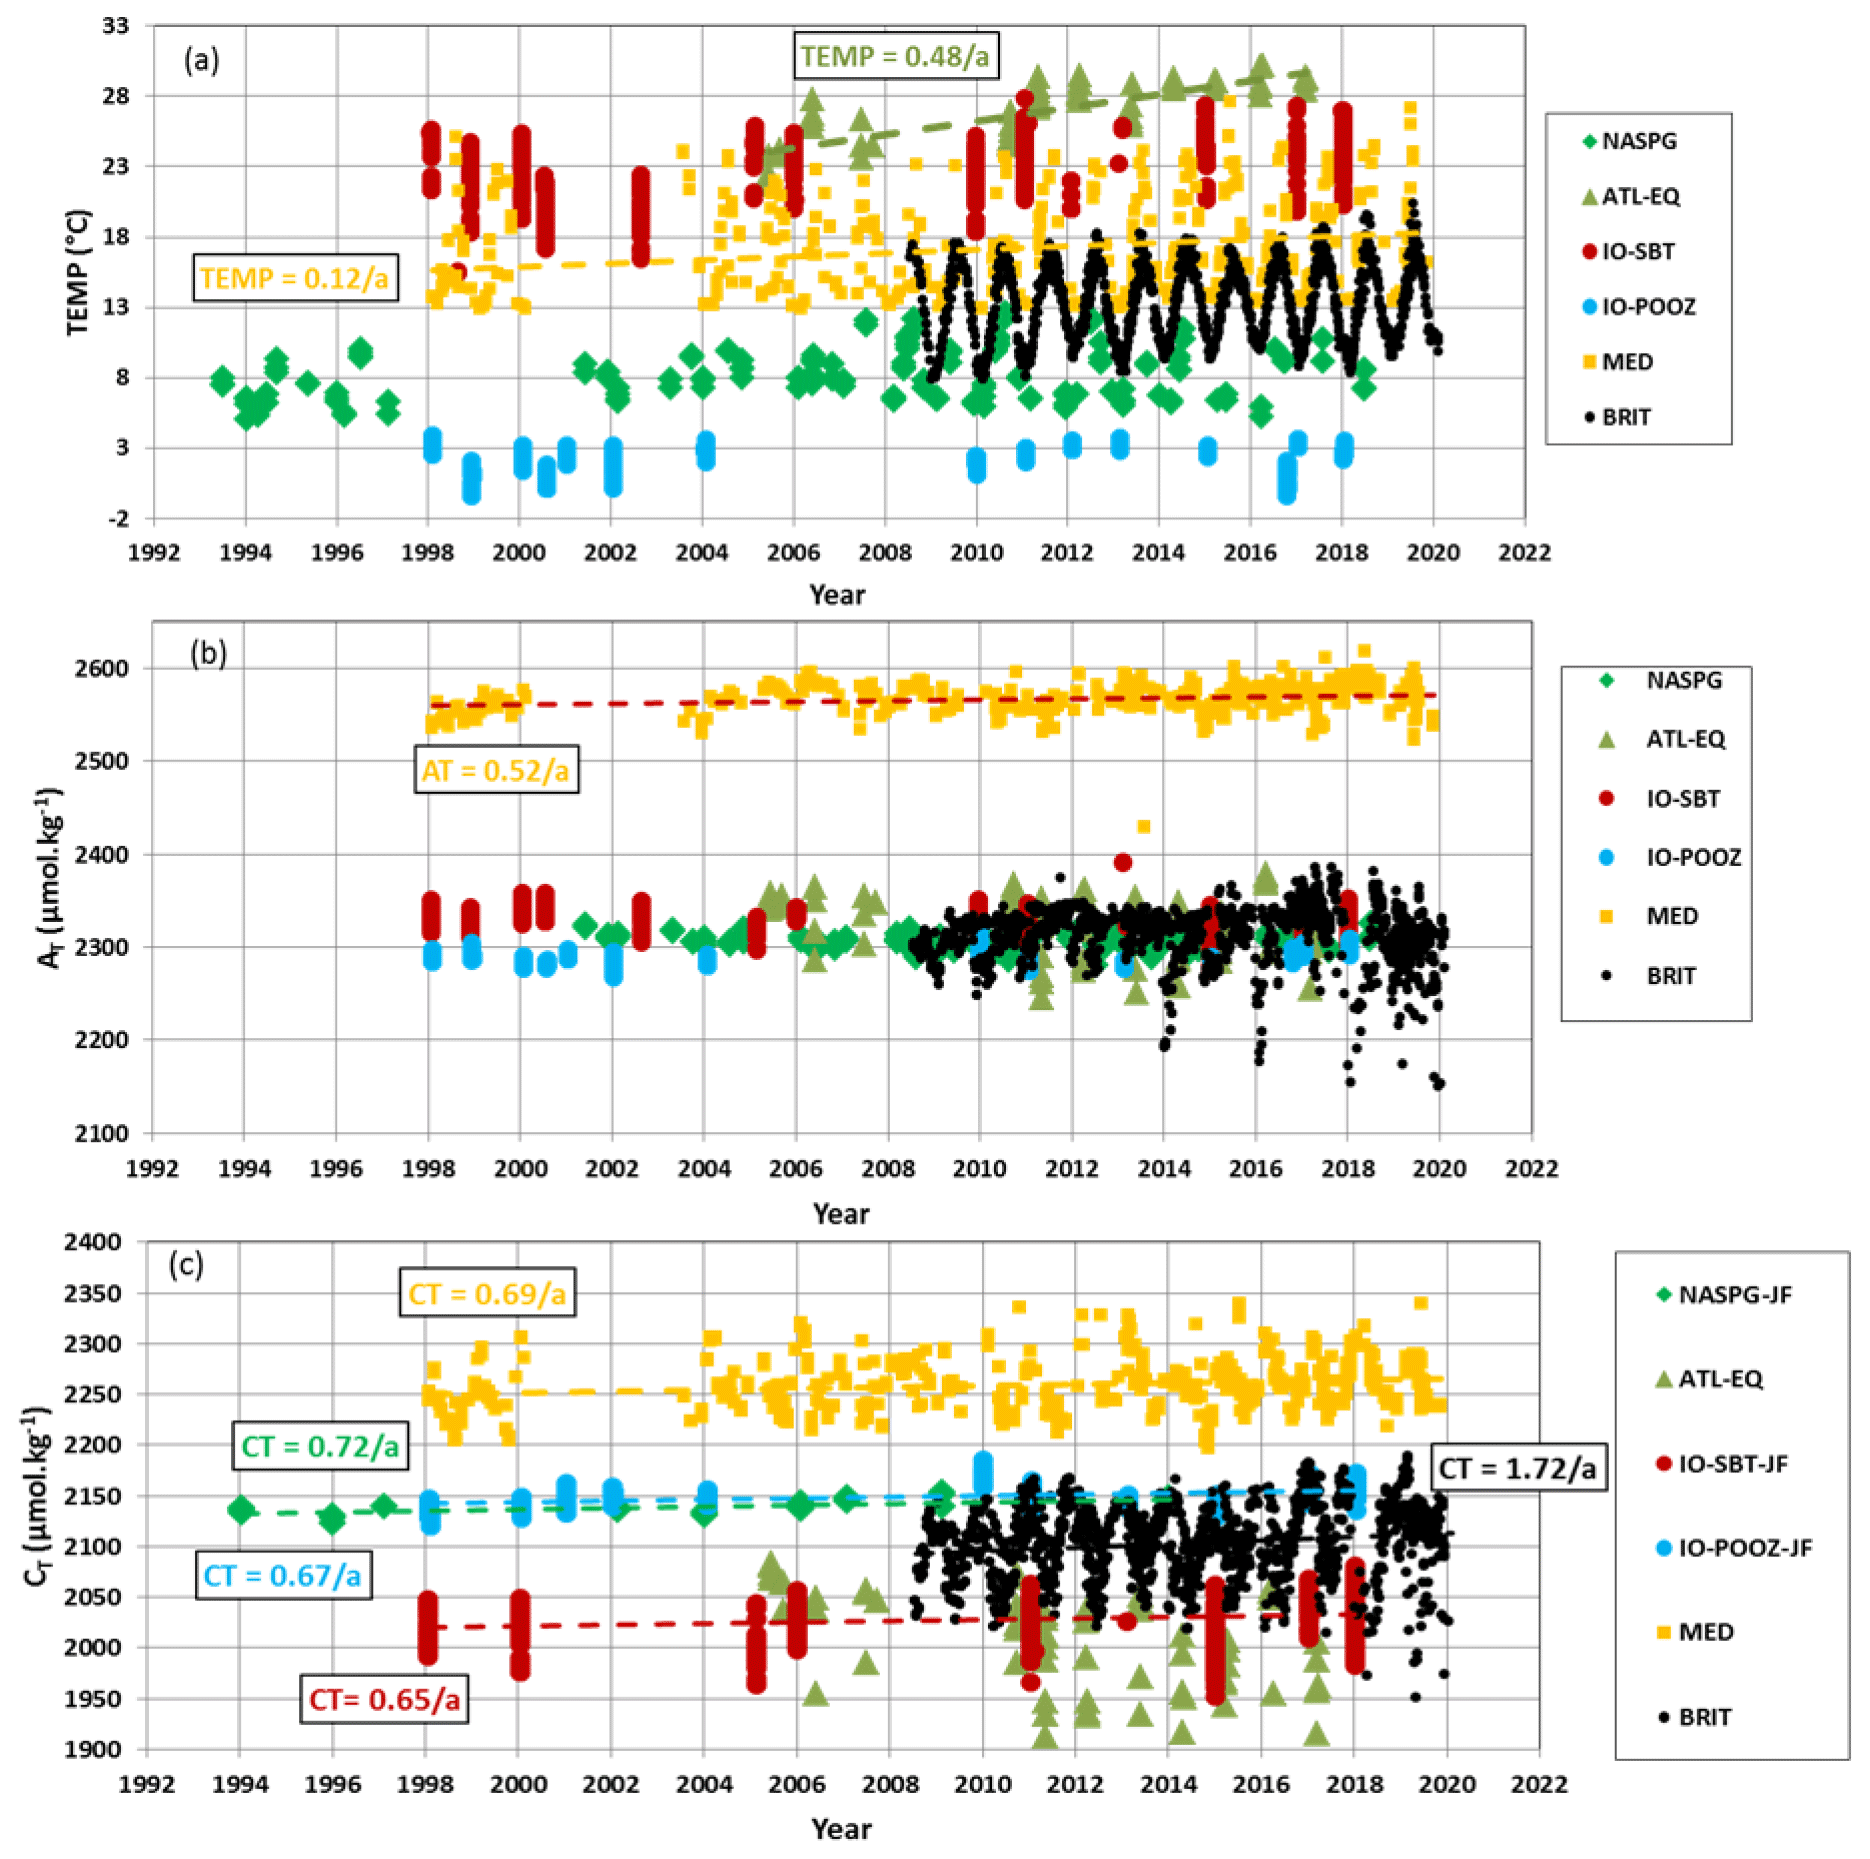
Figure 12Time series of (a) sea-surface temperature (∘C), (b) AT (µmol kg−1) and (c) CT (µmol kg−1) in six regions: the North Atlantic subpolar gyre (NASPG, 1993–2018, green diamond), the equatorial Atlantic (ATL-EQ, 2005–2017, green triangle), the Indian subtropical sector (IO-SBT, red circle) and high-latitude sector (IO-POOZ, blue circle) (1998–2018), the Ligurian Sea (MED, 1998–2019, orange square), and times series' stations in the coastal zones off Brittany (BRIT, period 2008–2019, black dots). Trends (dashed lines and values) are shown when relevant for the discussion (CT trends listed in Table 6).
In the six regions, there was a progressive warming that was most clearly detected in the Mediterranean Sea (e.g., Nykjaer, 2009). From 1998 to 2019, the warming in the Ligurian Sea was +0.1208 ∘C yr−1 (±0.0227 ∘C yr−1) (Fig. 12). In the equatorial Atlantic, the apparent rapid increase in temperature of +0.48 ∘C yr−1 (±0.04 ∘C yr−1) in 2005–2017 from the selected data indicated a change in the water masses and circulation. The colder sea surface in 2005 was associated with the so-called Atlantic cold tongue (ACT), which was one of the most intense ACTs since 1982 (Caniaux et al., 2011). The ACT also led to significant changes in oceanic fCO2 and air–sea CO2 fluxes (Parard et al., 2010; Koseki et al., 2023) and explained the high CT concentrations observed in 2005 in this region (Fig. 12, Koffi et al., 2010).
Total alkalinity presents rather homogenous concentrations in the NASPG and the southern Indian Ocean. Interannual variability in AT is pronounced in the equatorial Atlantic, ranging between 2245 and 2378 µmol kg−1. This is mainly related to salinity, as normalized AT values (N-AT, for a salinity of 35) do not show such interannual variability (mean N- µmol kg−1 and n=67 for 2005–2017; not shown). In the coastal zones off Brittany, the AT is also highly variable (Salt et al., 2016; Gac et al., 2021), ranging between 2150 and 2386 µmol kg−1 (Fig. 12).
An interesting signal is the progressive increase in AT in the Mediterranean Sea. The positive AT trend of +0.53 (±0.11) µmol kg−1 yr−1 (n=538) in 1998–2019 in the offshore region was also observed at the SOMLIT-Point-B coastal station in 2007–2015, although with a faster increase of +2.08 (±0.19) µmol kg−1 yr−1 (Kapsenberg et al., 2017). Close to the DYFAMED site, at SOMLIT-Point-B station, the AT trend was not linked to temporal salinity changes, as a positive N-AT trend was also reported, +0.52 (±0.07) µmol kg−1 yr−1 (not shown). Based on data from the PERLE cruises in 2018–2021, a significant increase in AT was also identified in the eastern Mediterranean Sea (Wimart-Rousseau et al., 2021). Along with the increase in CT and the warming, the AT increase would impact on the fCO2, the air–sea CO2 fluxes and pH temporal changes (Merlivat et al., 2018). Processes explaining the AT increase in the Mediterranean Sea are still unexplained and deserve further investigation (Coppola et al., 2019).
As expected, because of the anthropogenic CO2 uptake, the CT concentrations increased in most regions (Fig. 12, Table 6). This is identified in the Indian Ocean (in the subtropical and the high-latitude sectors), in the Mediterranean Sea and in coastal waters off Brittany. However, the signal is more complex in the NASPG. As previously shown, the CT trend in the NASPG depends on the season and decade (Metzl et al., 2010; Reverdin et al., 2018; Fröb et al., 2019; Leseurre et al., 2020). Here, we selected only the data in January–February from the SURATLANT cruises, leading to a CT trend of +0.72 (±0.17) µmol kg−1 yr−1. Compared with the regions further north, the CT trend in the NASPG is about half the CT trends of +1.44 (±0.23) µmol kg−1 yr−1 observed in the Iceland Sea (Olafsson et al., 2009) or +1.48 (±0.22) µmol kg−1 yr−1 at station M in the Norwegian Sea (Skjelvan et al., 2022).
Table 6Trend in CT (µmol kg−1 yr−1) and the corresponding standard error in five selected regions where data were available for more than 10 years (data are shown in Fig. 12). The projects/cruises for the selection of the data in each domain are indicated.
In the coastal zones off Brittany, although there are large seasonal and interannual variabilities (Gac et al., 2021), an annual CT trend of +1.72 (±0.28) µmol kg−1 yr−1 is detected over 10 years (2009–2019). The same is observed in the Mediterranean Sea, where the CT offshore trend of +0.69 (±0.18) µmol kg−1 yr−1 is low compared with what was observed in the coastal zone (SOMLIT-Point-B, +2.97 (±0.20) µmol kg−1 yr−1; Kapsenberg et al., 2017).
In the southern Indian Ocean, CT concentrations also increased in both the subtropics and at high latitudes, two regions where the primary productivity is relatively low (an oligotrophic regime in the subtropics and a high-nutrient–low-chlorophyll regime, HNLC, south of the polar front). With the data selected for austral summer (January–February), the CT trends appeared almost similar in these two regions, around +0.65 µmol kg−1 yr−1 (Table 6).
Finally, in the equatorial Atlantic, the selected data around 0∘–10∘ W highlighted the large variability linked to the oceanic circulation. Detecting a CT trend as well as a possible link to anthropogenic carbon uptake, at least with the data available in 2005–2017, appears to be intricate, as has been previously discussed for the period 2006–2013 (Lefèvre et al., 2016). However, the signal of the CT increase is better identified north or south of the Equator in the eastern tropical Atlantic sector (Lefèvre et al., 2021).
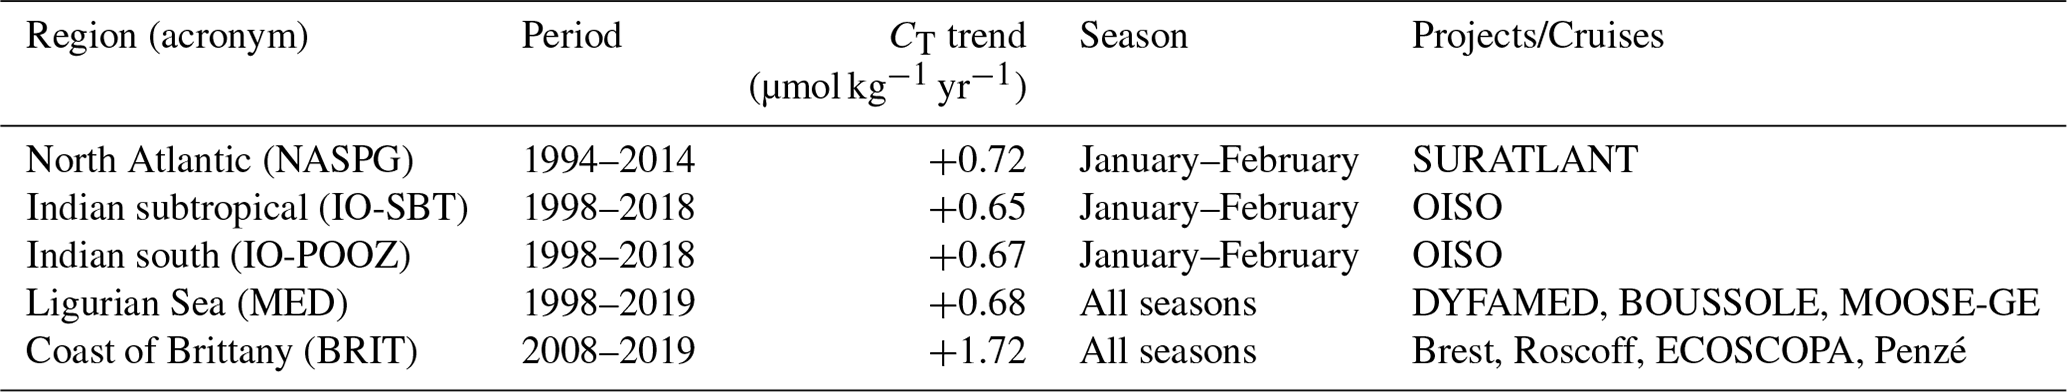
In the water column, AT and CT data from dedicated cruises were used to evaluate the anthropogenic CO2 (Cant) distribution and pH change since the preindustrial era (e.g., PANDORA cruise – Ganachaud et al., 2017; OUTPACE cruise – Wagener et al., 2018a; SOMBA cruise – Keraghel et al., 2020). Time series at DYFAMED station also enabled us to investigate the temporal variability in CT, AT and Cant in the water column (Touratier and Goyet, 2009; Coppola et al., 2020; Fourrier et al., 2022). As an example of the observed temporal variations at depth, we selected the data in the 950–1050 m layer in the Ligurian Sea from different cruises (Fig. 13). At that depth, both AT and CT present some large anomalies that were especially noticeable in 2013 (lower AT and CT in February 2013, DEWEX cruise) and in 2018 (higher AT and CT in May 2018, MOOSE-GE cruise), with the latter probably being linked to an episodic convective process that occurred in winter 2018 (Fourrier et al., 2022; Coppola et al., 2023). During the strong convection event in 2013, the positive anomalies of AT and CT were mostly identified in the upper layers (Fig. 12c).
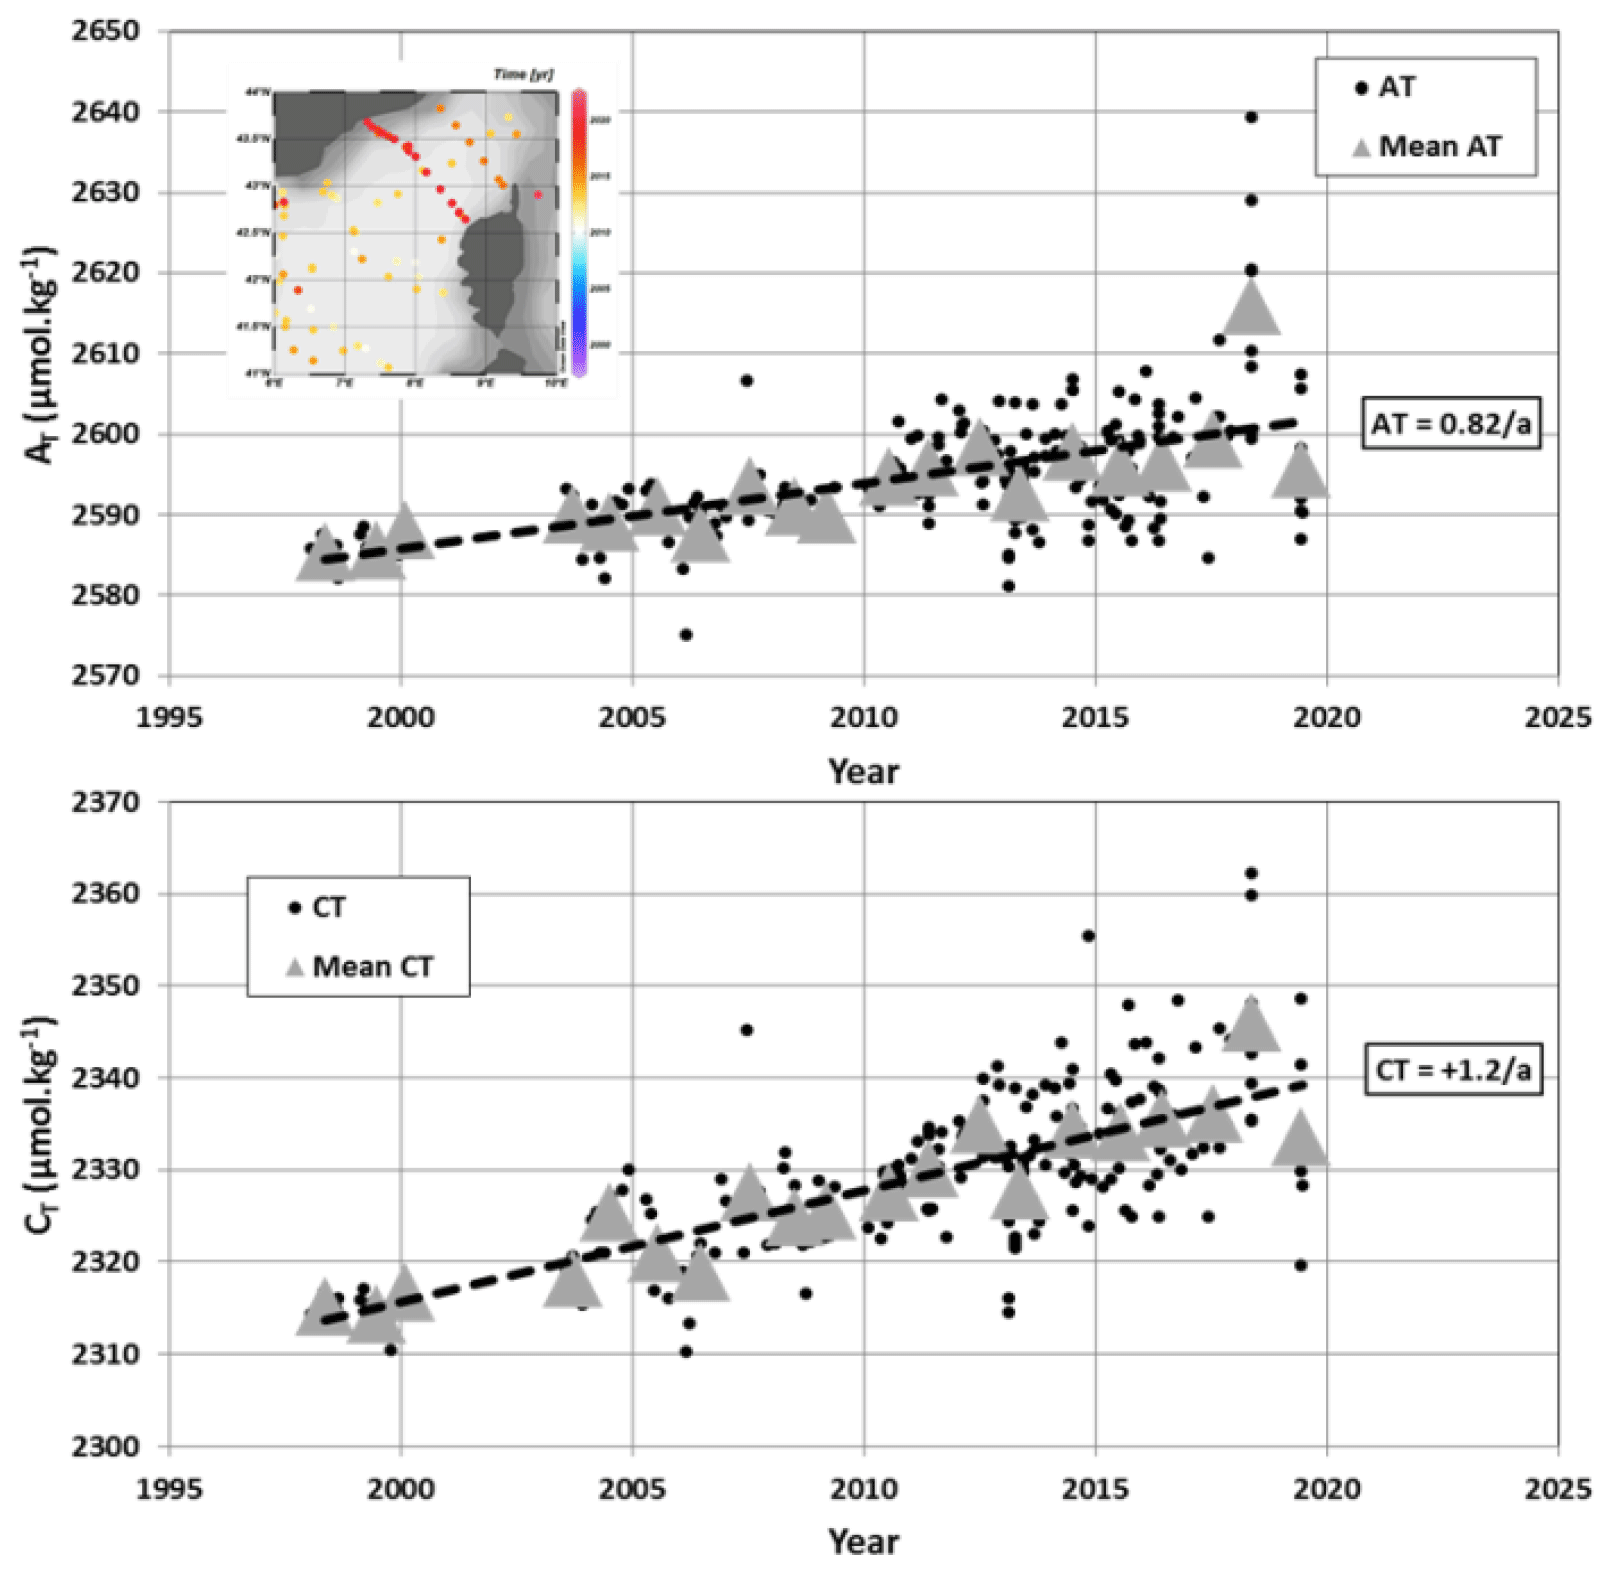
Figure 13Time series of AT (µmol kg−1) and CT (µmol kg−1) in the Ligurian Sea (1998–2019) in the 950–1050 m layer. The annual mean (gray triangles) was calculated from all data each year (black dots). The trends (dashed line) based on the annual mean are +0.82 (±0.15) µmol kg−1 yr−1 for AT and +1.20 (±0.12) µmol kg−1 yr−1 for CT. In this layer, selected data are from the ANTARES, CASCADE, DEWEX, DYFAMED, MOOSE-GE and PEACETIME cruises (location of stations shown in the inset map produced with ODV; Schlitzer, 2018).
In this region, the long-term increase in AT indicates that, in addition to the anthropogenic CO2 signal, other processes are at play to explain the rapid CT trend of +1.20 (±0.12) µmol kg−1 yr−1 at depth compared with that observed at the surface (Fig. 12). The signal at depth is probably linked to the variations in the deep convection and mixing with Levantine Intermediate Water (LIW; Margirier et al., 2020) that has higher AT and CT concentrations. The long-term increase in AT and CT at depth (here at 1000 m; Fig. 13) was also observed below 2000 m (Coppola et al., 2020); this signal should be investigated using a dedicated analysis with other properties (e.g., O2 and nutrients), following Fourrier et al. (2022) for the 2012–2020 period, and a larger dataset in the Mediterranean Sea (e.g., GLODAP).
The dataset presented in this synthesis would also offer interesting observations to validate properties (AT and CT) derived from Biogeochemical-Argo (BGC-Argo) floats equipped with pH sensors (e.g., Bushinsky et al., 2019; Mazloff et al., 2023; Mignot et al., 2023). The water-column in situ AT and CT data obtained during the Antarctic Circumpolar Expedition (ACE) in 2016–2017 were collected at a location where Southern Ocean Carbon and Climate Observations and Modeling (SOCCOM) floats were launched (Walton and Thomas, 2018). A SOCCOM float (WMO ID 5905069) was launched on 11 January 2017 at 55∘ S, 96∘ E, south of the polar front in the southern Indian Ocean. The pH, temperature and salinity data from the float were then used to derive AT and CT profiles (here using a multiple linear regression, MLR, algorithm; Williams et al., 2016, 2017). In the top layers, the discrete ACE data (Fig. 14) present large variability in the AT and CT concentrations that is not captured in the records derived from the float (the MLR method somehow smoothed the profiles). However, given the uncertainty in reconstructed AT from float data (5.6 µmol kg−1), the average values in the first 100 m were almost identical ( (±4.4) µmol kg−1 and (±0.7) µmol kg−1; (±9.2) µmol kg−1 and (±3.2) µmol kg−1). Moreover, below 200 m, profiles from the float are coherent compared to the AT and CT measurements (Fig. 14). This is encouraging with respect to using float data to explore the seasonal variability in AT and CT in the Southern Ocean (e.g., Williams et al., 2018; Johnson et al., 2022) and to estimate anthropogenic CO2 in the water column in this sector (Fig. 14). Here, the Cant concentrations were calculated below 200 m (corresponding to the temperature minimum of the winter in the Southern Ocean and using the TrOCA – Tracer combining Oxygen, inorganic Carbon and total Alkalinity – method; Touratier et al., 2007). The float data suggest that Cant concentrations are positive down to about 1000 m, with maximum values in the subsurface. In 2017, the mean Cant concentration at 200 m was 49.1 (±9.0) µmol kg−1. Below that depth, Cant decreased to +29.8 (±8.5) µmol kg−1 in the 300–400 m layer. To complement the Cant inventories based on the GLODAP data product (e.g., Gruber et al., 2019), Cant estimates derived from BGC-Argo floats, as evaluated here in the Southern Ocean, could be applied in other locations, as was previously tested in the North Pacific (Li et al., 2019).
Figure 14Profiles of (a) AT (µmol kg−1) and (b) CT (µmol kg−1) observed at station ACE-20 (55∘ S, 95∘ E; 11 January 2017, black triangles) compared with the profiles deduced from the SOCCOM float (WMO code 5905069) launched at that location (first data on 12 January 2017, gray circles). The location and drift of the float in 2017–2018 are shown on the inset map. Panel (c) presents a Hovmöller section (pressure versus time) of anthropogenic CO2 concentrations (Cant, in µmol kg−1) estimated from the float data (AT, CT, O2, T) below 200 m (period from January 2017 to February 2018). The section was produced with ODV (Schlitzer, 2018).
In surface water, as the AT derived from the float data are deduced using MLR or LIAR (locally interpolated AT regression) methods (Williams et al., 2017; Carter et al., 2016), the AT data in the SNAPO-CO2 synthesis could also be used to identify AT anomalies that are not always captured from floats. This is particularly relevant in coccolithophore bloom areas when low AT concentrations and high pCO2 are observed (e.g., Balch et al., 2016, in the Southern Ocean; Robertson et al., 1994, in the North Atlantic).
Data presented in this study are available from SEANOE: https://www.seanoe.org (last access: 22 December 2023), https://doi.org/10.17882/95414 (Metzl et al., 2023).
The ocean data synthesized in this product are based on measurements of AT and CT performed between 1993 and 2022 with an accuracy of ±4 µmol kg−1. The product offers a large dataset of AT and CT for the Global Ocean and regional biogeochemical studies. It includes more than 44 400 surface and water-column observations in all oceanic basins, in the Mediterranean Sea, in the coastal zones, near coral reefs and in rivers. For the open ocean, this complements the SOCAT and GLODAP data products (Bakker et al., 2016; Lauvset et al., 2022). For the coastal sites, this also complements the synthesis of coastal time series only done around North America (Fassbender et al., 2018; Jiang et al., 2021; OCADS, 2023).
The SNAPO-CO2 dataset enables the investigation of seasonal variations to decadal trends in AT and CT in various oceanic provinces. In regions where data are available for more than 2 decades in surface water (North Atlantic, Ligurian Sea, southern Indian Ocean and coastal regions), all time series show an increase in CT. Apart from in the Mediterranean Sea, AT appears relatively constant over time, although the AT content presents significant interannual variability, such as in the NASPG or in the coastal zones, including near the Congo and Amazon river plumes.
This dataset represents independent data for the validation of reconstructed AT or CT fields using various methods (e.g., Rödenbeck et al., 2013, 2015; Sauzède et al., 2017; Turk et al., 2017; Bittig et al., 2018; Broullón et al., 2019, 2020; Land et al., 2019; Keppler et al., 2020; Fourier et al., 2020; Gregor and Gruber, 2021; Sims et al., 2023). It is also useful to validate Earth system models (ESMs) that currently present bias with respect to the reproduction of the seasonal cycle of CT and AT due to the inadequate representation of biogeochemical cycles, including the coupling of biological and physical processes (e.g., Pilcher et al., 2015; Mongwe et al., 2018; Lerner et al., 2021). This should be resolved in order to ensure confident future projections of productivity, ocean acidification and the responses of the marine ecosystems (e.g., Kwiatowski et al., 2020). Recall that ocean biogeochemical global models (OBGMs) or ESMs calculate pCO2 from AT–CT pairs and that the simulated annual CO2 flux might be correct when compared to observations but for the wrong reasons (e.g., Goris et al., 2018; Lerner et al., 2021). For example, it has been shown that biases in AT in ESMs lead to an overestimation of the oceanic fCO2 trend and, thus, uncertainty when predicting the oceanic anthropogenic CO2 uptake (Lebehot et al., 2019). The simulated seasonal cycle of fCO2 is also uncertain in ESMs, especially at high latitudes (e.g., Joos et al., 2023). Thus, it is important to attempt to validate ESMs with AT and CT data, such as undertaken in this synthesis.
This dataset would also serve to validate autonomous platforms capable of measuring pH and fCO2 variables and, along with SOCAT and GLODAP datasets, provides an additional reference dataset for the development and validation of regional biogeochemical models for simulating air–sea CO2 fluxes. It is also essential for training and validating neural networks capable of predicting variables in the carbonate system, thereby enhancing observations of marine CO2 at different spatial and temporal scales.
The data presented here are available online on the SEANOE server (Metzl et al., 2023, https://doi.org/10.17882/95414) and are divided in two files: one for the Global Ocean and one for the Mediterranean Sea. The sources of the original datasets (DOI) and their associated references are listed in the Supplement (Tables S3, S4). We invite users to comment on any anomalies that have not been detected or to suggest any potential misqualifications of data in the present product (e.g., data probably good, although assigned Flag 3, probably wrong). The SNAPO-CO2 dataset will be regularly updated on the SEANOE data server (with new observations), controlled and archived.
The supplement related to this article is available online at: https://doi.org/10.5194/essd-16-89-2024-supplement.
NM prepared the data synthesis, the figures and wrote the draft of the manuscript with contributions from all authors. JF measured the discrete samples (from 2014 on) with help from CM and CLM and also prepared the individual reports for each project. NM and JF pre-qualified the discrete AT and CT data. CLM and NM are co-investigators of the ongoing OISO project and qualified the underway AT and CT data from OISO and CLIM-EPARSES cruises. All authors have reviewed the manuscript and contributed to one or more of the following: organizing cruises, sample collection and/or data qualification.
The contact author has declared that none of the authors has any competing interests.
Publisher’s note: Copernicus Publications remains neutral with regard to jurisdictional claims made in the text, published maps, institutional affiliations, or any other geographical representation in this paper. While Copernicus Publications makes every effort to include appropriate place names, the final responsibility lies with the authors.
The AT and CT data presented in this study were measured at the SNAPO-CO2 facility (Service National d'Analyse des Paramètres Océaniques du CO2), which is housed by the LOCEAN laboratory and part of the OSU ECCE Terra at the Sorbonne University and INSU/CNRS analytical services. Support from INSU/CNRS, OSU ECCE Terra and LOCEAN, is gratefully acknowledged as well as support from different French “Services nationaux d'Observations”, such as OISO/CARAUS, SOMLIT, PIRATA, SSS and MOOSE. We thank the research infrastructure ICOS (Integrated Carbon Observation System) France for funding a large part of the analyses. We thank the French oceanographic fleet (“Flotte océanographique française”) for financial and logistic support for most cruises listed in this synthesis and for the OISO program (https://campagnes.flotteoceanographique.fr/series/228/, last access: 22 December 2023). We acknowledge the MOOSE (Mediterranean Ocean Observing System for the Environment, https://campagnes.flotteoceanographique.fr/series/235/fr/, last access: 22 December 2023) program coordinated by CNRS-INSU and the research infrastructure ILICO (CNRS-IFREMER). AWIPEV-CO2 was supported by the Coastal Observing System for Northern and Arctic Seas (COSYNA), the two Helmholtz large-scale infrastructure projects ACROSS and MOSES, the French Polar Institute Paul-Émile Victor (IPEV), and the European Union Horizon 2020 Research and Innovation projects Jericho-Next (grant nos. 871153 and 951799), INTAROS (grant no. 727890) and FACE-IT (grant no. 869154). The BOUSSOLE project was funded by the Centre National d'Etudes Spatiales (CNES) and the European Space Agency (ESA ESRIN, contract no. 4000119096/17/I-BG), and the first 3 years of the CO2 time series at that site were funded by the French Agence Nationale de la Recherche (ANR). The EURECA4-OA cruise was also supported by the EUREC4A-OA JPI Ocean and Climate program. We thank the Tara Ocean Foundation and many institutes and funding agencies for supporting Tara cruises since 2009. The OISO program was supported by the French institutes INSU (Institut National des Sciences de l'Univers) and IPEV (Institut Polaire Paul-Émile Victor), OSU Ecce Terra (at Sorbonne Université), and the French program SOERE/Great-Gases. The CLIM-EPARSES cruise was supported by TAAF (Terres Australes et ANtarctiques Françaises), Fondation du Prince Albert II de Monaco, IRD, OSU Ecce Terra, CNRS, MNHN, LOCEAN and LSCE laboratory. Data from the float launched during the ACE cruise were made freely available by the Southern Ocean Carbon and Climate Observations and Modeling (SOCCOM) project funded by the National Science Foundation, Division of Polar Programs (NSF PLR, award no. 1425989), supplemented by NASA, and by the international Argo program and the NOAA programs that contribute to it. The Argo program is part of the Global Ocean Observing System (https://doi.org/10.17882/42182, Argo, 2023, http://argo.jcommops.org, last access: 22 December 2023). We thank Frédéric Merceur (IFREMER) for preparing the page and data availability on SEANOE. We thank Patrick Raimbault (retired, formerly at MIO, Marseille) for managing the MOOSE project until 2019. We thank all colleagues and students who participated in the cruises and carefully collected the precious seawater samples. We warmly acknowledge our colleague Christian Brunet (retired) for his supportive help with the analysis since the start of the SNAPO-CO2 service facility. We would like to pay tribute to our late colleague Frédéric Diaz who contributed to the LATEX cruise in 2010. We thank the editor Xingchen Wang for managing this manuscript and Marta Álvarez and a (more or less) anonymous reviewer for their suggestions that helped to improve this article.
This research has been supported by the Institut national des sciences de l'Univers (SA/SNAPO-CO2).
This paper was edited by Xingchen Wang and reviewed by Marta Álvarez and one anonymous referee.
Álvarez, M., Catalá, T. S., Civitarese, G., Coppola, L., Hassoun, A. E. R., Ibello, V., Lazzari, P., Lefèvre, D., Macías, D., Santinelli, C., and Ulses, C.: Chapter 11 – Mediterranean Sea general biogeochemistry, Editor(s): Katrin Schroeder, Jacopo Chiggiato, Oceanography of the Mediterranean Sea, Elsevier, 387–451, https://doi.org/10.1016/B978-0-12-823692-5.00004-2, 2023.
Argo: Argo float data and metadata from Global Data Assembly Centre (Argo GDAC), SEANOE [data set], https://doi.org/10.17882/42182, 2023.
Bakker, D. C. E., Pfeil, B., Smith, K., Hankin, S., Olsen, A., Alin, S. R., Cosca, C., Harasawa, S., Kozyr, A., Nojiri, Y., O'Brien, K. M., Schuster, U., Telszewski, M., Tilbrook, B., Wada, C., Akl, J., Barbero, L., Bates, N. R., Boutin, J., Bozec, Y., Cai, W.-J., Castle, R. D., Chavez, F. P., Chen, L., Chierici, M., Currie, K., de Baar, H. J. W., Evans, W., Feely, R. A., Fransson, A., Gao, Z., Hales, B., Hardman-Mountford, N. J., Hoppema, M., Huang, W.-J., Hunt, C. W., Huss, B., Ichikawa, T., Johannessen, T., Jones, E. M., Jones, S. D., Jutterström, S., Kitidis, V., Körtzinger, A., Landschützer, P., Lauvset, S. K., Lefèvre, N., Manke, A. B., Mathis, J. T., Merlivat, L., Metzl, N., Murata, A., Newberger, T., Omar, A. M., Ono, T., Park, G.-H., Paterson, K., Pierrot, D., Ríos, A. F., Sabine, C. L., Saito, S., Salisbury, J., Sarma, V. V. S. S., Schlitzer, R., Sieger, R., Skjelvan, I., Steinhoff, T., Sullivan, K. F., Sun, H., Sutton, A. J., Suzuki, T., Sweeney, C., Takahashi, T., Tjiputra, J., Tsurushima, N., van Heuven, S. M. A. C., Vandemark, D., Vlahos, P., Wallace, D. W. R., Wanninkhof, R., and Watson, A. J.: An update to the Surface Ocean CO2 Atlas (SOCAT version 2), Earth Syst. Sci. Data, 6, 69–90, https://doi.org/10.5194/essd-6-69-2014, 2014.
Bakker, D. C. E., Pfeil, B., Landa, C. S., Metzl, N., O'Brien, K. M., Olsen, A., Smith, K., Cosca, C., Harasawa, S., Jones, S. D., Nakaoka, S., Nojiri, Y., Schuster, U., Steinhoff, T., Sweeney, C., Takahashi, T., Tilbrook, B., Wada, C., Wanninkhof, R., Alin, S. R., Balestrini, C. F., Barbero, L., Bates, N. R., Bianchi, A. A., Bonou, F., Boutin, J., Bozec, Y., Burger, E. F., Cai, W.-J., Castle, R. D., Chen, L., Chierici, M., Currie, K., Evans, W., Featherstone, C., Feely, R. A., Fransson, A., Goyet, C., Greenwood, N., Gregor, L., Hankin, S., Hardman-Mountford, N. J., Harlay, J., Hauck, J., Hoppema, M., Humphreys, M. P., Hunt, C. W., Huss, B., Ibánhez, J. S. P., Johannessen, T., Keeling, R., Kitidis, V., Körtzinger, A., Kozyr, A., Krasakopoulou, E., Kuwata, A., Landschützer, P., Lauvset, S. K., Lefèvre, N., Lo Monaco, C., Manke, A., Mathis, J. T., Merlivat, L., Millero, F. J., Monteiro, P. M. S., Munro, D. R., Murata, A., Newberger, T., Omar, A. M., Ono, T., Paterson, K., Pearce, D., Pierrot, D., Robbins, L. L., Saito, S., Salisbury, J., Schlitzer, R., Schneider, B., Schweitzer, R., Sieger, R., Skjelvan, I., Sullivan, K. F., Sutherland, S. C., Sutton, A. J., Tadokoro, K., Telszewski, M., Tuma, M., van Heuven, S. M. A. C., Vandemark, D., Ward, B., Watson, A. J., and Xu, S.: A multi-decade record of high-quality fCO2 data in version 3 of the Surface Ocean CO2 Atlas (SOCAT), Earth Syst. Sci. Data, 8, 383–413, https://doi.org/10.5194/essd-8-383-2016, 2016.
Bakker, D. C. E., Alin, S. R., Bates, N. R., Becker, M., Feely, R. A., Gritzalis, T., Jones, S. D., Kozyr, A., Lauvset, S. K., Metzl, N., Munro, D. R., Nakaoka, S.-I., Nojiri, Y., O'Brien, K., Olsen, A., Pierrot, D., Rehder, G., Steinhoff, T., Sutton, A., Sweeney, C., Tilbrook, B., Wada, C., Wanninkhof, R., and SOCAT contributors: An alarming decline in the ocean CO2 observing capacity, https://www.socat.info (last access: 22 December 2023), 2023.
Balch, W. M., Bates, N. R., Lam, P. J., Twining, B. S., Rosengard, S. Z., Bowler, B. C., Drapeau, D. T., Garley, R., Lubelczyk, L. C., Mitchell, C., and Rauschenberg S.: Factors regulating the Great Calcite Belt in the Southern Ocean and its biogeochemical significance, Global Biogeochem. Cy., 30, 1124–1144, https://doi.org/10.1002/2016GB005414, 2016.
Bates, N., Astor, Y., Church, M., Currie, K., Dore, J., González-Dávila, M., Lorenzoni, L., Muller-Karger, F., Olafsson, J., and Santa-Casiano, M.: A Time-Series View of Changing Ocean Chemistry Due to Ocean Uptake of Anthropogenic CO2 and Ocean Acidification, Oceanography, 27, 126–141, https://doi.org/10.5670/oceanog.2014.16, 2014.
Beaufort, L., Probert, I., de Garidel-Thoron, T., Bendif, E. M., Ruiz-Pino, D., Metzl, N., Goyet, C., Buchet, N., Coupel, P., Grelaud, M., Rost, B., Rickaby, R. E. M., and de Vargas C.: Sensitivity of coccolithophores to carbonate chemistry and ocean acidification, Nature, 476, 80–83, https://doi.org/10.1038/nature10295, 2011.
Bittig, H. C., Steinhoff, T., Claustre, H., Fiedler, B., Williams, N. L., Sauzède, R., Körtzinger, A., and Gattuso, J.-P.: An Alternative to Static Climatologies: Robust Estimation of Open Ocean CO2 Variables and Nutrient Concentrations From T, S, and O2 Data Using Bayesian Neural Networks, Front. Mar. Sci., 5, 328, https://doi.org/10.3389/fmars.2018.00328, 2018.
Bockmon, E. E. and Dickson, A. G.: An inter-laboratory comparison assessing the quality of seawater carbon dioxide measurements, Mar. Chem., 171, 36–43, https://doi.org/10.1016/j.marchem.2015.02.002, 2015.
Bosse, A., Testor, P., Mayot, N., Prieur, L., D'Ortenzio, F., Mortier, L., Le Goff, H., Gourcuff, C., Coppola, L., Lavigne, H., and Raimbault, P.: A submesoscale coherent vortex in the Ligurian Sea: From dynamical barriers to biological implications, J. Geophys. Res.-Oceans, 122, 6196–6217, https://doi.org/10.1002/2016JC012634, 2017.
Bozec, Y., Merlivat, L., Baudoux, A.-C., Beaumont, L., Blain, S., Bucciarelli, E., Danguy, T., Grossteffan, E., Guillot, A., Guillou, J., Répécaud, M., and Tréguer, P.: Diurnal to inter-annual dynamics of pCO2 recorded by a CARIOCA sensor in a temperate coastal ecosystem (2003–2009), Mar. Chem., 126, 13–26, https://doi.org/10.1016/j.marchem.2011.03.003, 2011.
Broullón, D., Pérez, F. F., Velo, A., Hoppema, M., Olsen, A., Takahashi, T., Key, R. M., Tanhua, T., González-Dávila, M., Jeansson, E., Kozyr, A., and van Heuven, S. M. A. C.: A global monthly climatology of total alkalinity: a neural network approach, Earth Syst. Sci. Data, 11, 1109–1127, https://doi.org/10.5194/essd-11-1109-2019, 2019.
Broullón, D., Pérez, F. F., Velo, A., Hoppema, M., Olsen, A., Takahashi, T., Key, R. M., Tanhua, T., Santana-Casiano, J. M., and Kozyr, A.: A global monthly climatology of oceanic total dissolved inorganic carbon: a neural network approach, Earth Syst. Sci. Data, 12, 1725–1743, https://doi.org/10.5194/essd-12-1725-2020, 2020.
Bushinsky, S. M., Landschützer, P., Rödenbeck, C., Gray, A. R., Baker, D., Mazloff, M. R., Resplandy L., Johnson K. S., and Sarmiento, J. L.: Reassessing Southern Ocean air-sea CO2 flux estimates with the addition of biogeochemical float observations, Global Biogeochem. Cy., 33, 1370–1388, https://doi.org/10.1029/2019GB006176, 2019.
Canesi, M., Douville, E., Montagna, P., Taviani, M., Stolarski, J., Bordier, L., Dapoigny, A., Coulibaly, G. E. H., Simon, A.-C., Agelou, M., Fin, J., Metzl, N., Iwankow, G., Allemand, D., Planes, S., Moulin, C., Lombard, F., Bourdin, G., Troublé, R., Agostini, S., Banaigs, B., Boissin, E., Boss, E., Bowler, C., de Vargas, C., Flores, M., Forcioli, D., Furla, P., Gilson, E., Galand, P. E., Pesant, S., Sunagawa, S., Thomas, O., Thurber, R. V., Voolstra, C. R., Wincker, P., Zoccola, D., and Reynaud, S.: Differences in carbonate chemistry up-regulation of long-lived reef-building corals, Sci. Rep. 13, 11589, https://doi.org/10.1038/s41598-023-37598-9, 2023.
Caniaux, G., Giordani, H., Redelsperger, J.-L., Guichard, F., Key, E., and Wade, M.: Coupling between the Atlantic cold tongue and the West African monsoon in boreal spring and summer, J. Geophys. Res., 119, C04003, https://doi.org/10.1029/2010JC006570, 2011.
Carter, B. R., Williams, N. L., Gray, A. R., and Feely, R. A.: Locally interpolated alkalinity regression for global alkalinity estimation, Limnol. Oceanogr.-Meth., 14, 268–277, https://doi.org/10.1002/lom3.10087, 2016.
Chen, H., Haumann, F. A., Talley, L. D., Johnson, K. S., and Sarmiento, J. L.: The deep ocean's carbon exhaust, Global Biogeochem. Cy., 36, e2021GB007156, https://doi.org/10.1002/essoar.10507757.1, 2022.
Cheng, L. J., Abraham, J., Zhu, J., Trenberth, K. E., Fasullo, J., Boyer, T., Locarnini, R., Zhang, B., Yu, F. J., Wan, L. Y., Chen, X. R., Song, X. Z., Liu, Y. L., and Mann, M. E.: Record-setting ocean warmth continued in 2019, Adv. Atmos. Sci, 37, 137–142, https://doi.org/10.1007/s00376-020-9283-7, 2020.
Claustre, H., Johnson, K. S., and Takeshita, Y.: Observing the Global Ocean with Biogeochemical-Argo, Annu. Rev. Mar. Sci., 12, 23–48, https://doi.org/10.1146/annurev-marine-010419-010956, 2020.
Copin-Montégut, C.: Alkalinity and carbon budgets in the Mediterranean Sea, Global Biogeochem. Cy., 7, 915–925, 1993.
Copin-Montégut, C. and Bégovic, M.: Distributions of carbonate properties and oxygen along the water column (0–2000 m) in the central part of the NW Mediterranean Sea (Dyfamed site): influence of the winter vertical mixing on air–sea CO2 and O2 exchanges, Deep-Sea Res. Pt. II, 49, 2049–2066, https://doi.org/10.1016/S0967-0645(02)00027-9,2002.
Coppola, L., Raimbault, P., Mortier, L., and Testor, P.: Monitoring the environment in the northwestern Mediterranean Sea, Eos, 100, https://doi.org/10.1029/2019EO125951, 2019.
Coppola, L., Boutin, J., Gattuso, J.-P., Lefèvre, D., and Metzl, N.: The Carbonate System in the Ligurian Sea, in: The Mediterranean Sea in the Era of Global Change: Evidence from 30 years of multidisciplinary study of the Ligurian Sea, edited by: Migon, C., Nival, P., and Sciandra, A., vol. 1, chap. 4, ISTE Science Publishing LTD, London, UK, 79–104, ISBN 9781786304285, https://doi.org/10.1002/9781119706960.ch4, 2020.
Coppola, L., Fourrier, M., Pasqueron de Fommervault, O., Poteau, A., Riquier, E. D., and Béguery, L.: Highresolution study of the air-sea CO2 flux and net community oxygen production in the Ligurian Sea by a fleet of gliders, Front. Mar. Sci., 10, 1233845, https://doi.org/10.3389/fmars.2023.1233845, 2023.
Corbière, A., Metzl, N., Reverdin, G., Brunet, C., and Takahashi, T.: Interannual and decadal variability of the oceanic carbon sink in the North Atlantic subpolar gyre, Tellus B, 59, 168–179, https://doi.org/10.1111/j.1600-0889.2006.00232.x, 2007.
De Carlo, E. H., Mousseau, L., Passafiume, O., Drupp, P., and Gattuso J.-P.: Carbonate chemistry and air-sea CO2 flux in a NW Mediterranean bay over a four-year period: 2007–2011, Aquat. Geochem., 19, 399–442, https://doi.org/10.1007/s10498-013-9217-4, 2013.
Dickson, A. G., Sabine, C. L., and Christian, J. R.: Guide to best practices for ocean CO2 measurements, North Pacific Marine Science Organization, Sidney, British Columbia, 191, https://doi.org/10.25607/OBP-1342, 2007.
Doney, S. C., Fabry, V. J., Feely, R. A., and Kleypas, J. A.: Ocean acidification: The other CO2 problem, Annu. Rev. Mar. Sci., 1, 169–192, https://doi.org/10.1146/annurev.marine.010908.163834, 2009.
Doney, S. C., Busch, D. S., Cooley, S. R., and Kroeker, K. J.: The Impacts of Ocean Acidification on Marine Ecosystems and Reliant Human Communities, Annu. Rev. Env. Resour., 45, 83–112, https://doi.org/10.1146/annurev-environ-012320-083019, 2020.
Douville, E., Bourdin, G., Lombard, F., Gorsky, G., Fin, J., Metzl, N., Pesant, S., and Tara Pacific Consortium: Seawater carbonate chemistry dataset collected during the Tara Pacific Expedition 2016–2018, PANGAEA [data set], https://doi.org/10.1594/PANGAEA.944420, 2022.
Edmond, J. M.: High precision determination of titration alkalinity and total carbon dioxide content of sea water by potentiometric titration, Deep-Sea Res., 17, 737–750, https://doi.org/10.1016/0011-7471(70)90038-0, 1970.
Eyring, V., Righi, M., Lauer, A., Evaldsson, M., Wenzel, S., Jones, C., Anav, A., Andrews, O., Cionni, I., Davin, E. L., Deser, C., Ehbrecht, C., Friedlingstein, P., Gleckler, P., Gottschaldt, K.-D., Hagemann, S., Juckes, M., Kindermann, S., Krasting, J., Kunert, D., Levine, R., Loew, A., Mäkelä, J., Martin, G., Mason, E., Phillips, A. S., Read, S., Rio, C., Roehrig, R., Senftleben, D., Sterl, A., van Ulft, L. H., Walton, J., Wang, S., and Williams, K. D.: ESMValTool (v1.0) – a community diagnostic and performance metrics tool for routine evaluation of Earth system models in CMIP, Geosci. Model Dev., 9, 1747–1802, https://doi.org/10.5194/gmd-9-1747-2016, 2016.
Fabry, V. J., Seibel, B. A., Feely, R. A., and Orr, J. C.: Impacts of ocean acidification on marine fauna and ecosystem processes, ICES J. Mar. Sci., 65, 414–432, https://doi.org/10.1093/icesjms/fsn048, 2008.
Fassbender, A. J., Sabine, C. L., and Palevsky, H. I.: Nonuniform ocean acidification and attenuation of the ocean carbon sink, Geophys. Res. Lett., 44, 8404–8413, https://doi.org/10.1002/2017GL074389, 2017.
Fassbender, A. J., Alin, S. R., Feely, R. A., Sutton, A. J., Newton, J. A., Krembs, C., Bos, J., Keyzers, M., Devol, A., Ruef, W., and Pelletier, G.: Seasonal carbonate chemistry variability in marine surface waters of the US Pacific Northwest, Earth Syst. Sci. Data, 10, 1367–1401, https://doi.org/10.5194/essd-10-1367-2018, 2018.
Feely, R. A., Sabine, C. L., Byrne, R. H., Millero, F. J., Dickson, A. G., Wanninkhof, R., Murata, A., Miller, L. A., and Greeley, D.: Decadal changes in the aragonite and calcite saturation state of the Pacific Ocean, Global Biogeochem. Cy., 26, GB3001, https://doi.org/10.1029/2011GB004157, 2012.
Feely, R. A., Jiang, L.-Q., Wanninkhof, R., Carter, B. R., Alin, S. R., Bednaršek, N., and Cosca, C. E.: Acidification of the global surface ocean: What we have learned from observations, Oceanography, 36, 120–129, https://doi.org/10.5670/oceanog.2023.222, 2023.
Fleury, E., Petton, S., Benabdelmouna, A., and Pouvreau, S., (coord.): Observatoire national du cycle de vie de l'huître creuse en France, Rapport annuel ECOSCOPA 2022, R.INT.BREST RBE/PFOM/PI 2023-1, https://archimer.ifremer.fr/doc/00840/95240/102991.pdf, last access: 22 December 2023.
Fourrier, M., Coppola, L., Claustre, H., D'Ortenzio, F., Sauzède, R., and Gattuso, J.-P.: A regional neural network approach to estimate water-column nutrient concentrations and carbonate system variables in the Mediterranean Sea: CANYON-MED, Front. Mar. Sci., 7, 620, https://doi.org/10.3389/fmars.2020.00620, 2020.
Fourrier, M., Coppola, L., D'Ortenzio, F., Migon, C., and Gattuso, J.-P.: Impact of intermittent convection in the northwestern Mediterranean Sea on oxygen content, nutrients, and the carbonate system, J. Geophys. Res.-Oceans, 127, e2022JC018615, https://doi.org/10.1029/2022JC018615, 2022.
Friedlingstein, P., O'Sullivan, M., Jones, M. W., Andrew, R. M., Gregor, L., Hauck, J., Le Quéré, C., Luijkx, I. T., Olsen, A., Peters, G. P., Peters, W., Pongratz, J., Schwingshackl, C., Sitch, S., Canadell, J. G., Ciais, P., Jackson, R. B., Alin, S. R., Alkama, R., Arneth, A., Arora, V. K., Bates, N. R., Becker, M., Bellouin, N., Bittig, H. C., Bopp, L., Chevallier, F., Chini, L. P., Cronin, M., Evans, W., Falk, S., Feely, R. A., Gasser, T., Gehlen, M., Gkritzalis, T., Gloege, L., Grassi, G., Gruber, N., Gürses, Ö., Harris, I., Hefner, M., Houghton, R. A., Hurtt, G. C., Iida, Y., Ilyina, T., Jain, A. K., Jersild, A., Kadono, K., Kato, E., Kennedy, D., Klein Goldewijk, K., Knauer, J., Korsbakken, J. I., Landschützer, P., Lefèvre, N., Lindsay, K., Liu, J., Liu, Z., Marland, G., Mayot, N., McGrath, M. J., Metzl, N., Monacci, N. M., Munro, D. R., Nakaoka, S.-I., Niwa, Y., O'Brien, K., Ono, T., Palmer, P. I., Pan, N., Pierrot, D., Pocock, K., Poulter, B., Resplandy, L., Robertson, E., Rödenbeck, C., Rodriguez, C., Rosan, T. M., Schwinger, J., Séférian, R., Shutler, J. D., Skjelvan, I., Steinhoff, T., Sun, Q., Sutton, A. J., Sweeney, C., Takao, S., Tanhua, T., Tans, P. P., Tian, X., Tian, H., Tilbrook, B., Tsujino, H., Tubiello, F., van der Werf, G. R., Walker, A. P., Wanninkhof, R., Whitehead, C., Willstrand Wranne, A., Wright, R., Yuan, W., Yue, C., Yue, X., Zaehle, S., Zeng, J., and Zheng, B.: Global Carbon Budget 2022, Earth Syst. Sci. Data, 14, 4811–4900, https://doi.org/10.5194/essd-14-4811-2022, 2022.
Fröb, F., Olsen, A., Becker, M., Chafik, L., Johannessen, T., Reverdin, G., and Omar, A.: Wintertime fCO2 variability in the subpolar North Atlantic since 2004, Geophys. Res. Lett., 46, 1580–1590, https://doi.org/10.1029/2018GL080554, 2019.
Gac, J.-P., Marrec, P., Cariou, T., Guillerm, C., Macé, E., Vernet, M., and Bozec, Y.: Cardinal buoys: An opportunity for the study of air-sea CO2 fluxes in coastal ecosystems, Front. Mar. Sci., 7, 712, https://doi.org/10.3389/fmars.2020.00712, 2020.
Gac, J.-P., Marrec, P., Cariou, T., Grosstefan, E., Macé, E., Rimmelin-Maury, P., Vernet, M., and Bozec, Y.: Decadal Dynamics of the CO2 System and Associated Ocean Acidification in Coastal Ecosystems of the North East Atlantic Ocean, Front. Mar. Sci., 8, 688008, https://doi.org/10.3389/fmars.2021.688008, 2021.
Ganachaud, A., Cravatte, S., Sprintall, J., Germineaud, C., Alberty, M., Jeandel, C., Eldin, G., Metzl, N., Bonnet, S., Benavides, M., Heimburger, L.-E, Lefèvre, J., Michael, S., Resing, J., Quéroué, F., Sarthou, G., Rodier, M., Berthelot, H., Baurand, F., Grelet, J., Hasegawa, T., Kessler, W., Kilepak, M., Lacan, F., Privat, E., Send, U., Van Beek, P., Souhaut, M., and Sonke, J. E.:. The Solomon Sea: its circulation, chemistry, geochemistry and biology explored during two oceanographic cruises, Elem. Sci. Anth., 5, 33, https://doi.org/10.1525/elementa.221, 2017.
Gattuso, J.-P., Magnan, A., Billé, R., Cheung, W. W. L., Howes, E. L., Joos, F., Allemand, D., Bopp, L., Cooley, S., Eakin, M., Hoegh-Guldberg, O., Kelly, R. P., Pörtner, H.-O., Rogers, A. D., Baxter, J. M., Laffoley, D., Osborn, D., Rankovic, A., Rochette, J., Sumaila, U. R., Treyer, S., and Turley, C.: Contrasting futures for ocean and society from different anthropogenic CO2 emissions scenarios, Science, 349, aac4722, https://doi.org/10.1126/science.aac4722, 2015.
Gattuso, J.-P., Alliouane, S., and Fischer, P.: High-frequency, year-round time series of the carbonate chemistry in a high-Arctic fjord (Svalbard), Earth Syst. Sci. Data, 15, 2809–2825, https://doi.org/10.5194/essd-15-2809-2023, 2023.
Gemayel, E., Hassoun, A. E. R., Benallal, M. A., Goyet, C., Rivaro, P., Abboud-Abi Saab, M., Krasakopoulou, E., Touratier, F., and Ziveri, P.: Climatological variations of total alkalinity and total dissolved inorganic carbon in the Mediterranean Sea surface waters, Earth Syst. Dynam., 6, 789–800, https://doi.org/10.5194/esd-6-789-2015, 2015.
Golbol M., Boutin J., Merlivat L., Vellucci, V., and Antoine, D.: Dissolved Inorganic Carbon and Total Alkalinity sampled at Boussole site in the Medditerranean Sea, SEANOE [data set], https://doi.org/10.17882/71911, 2020.
Goris, N., Tjiputra, J. F., Olsen, A., Schwinger, J., Lauvset, S. K., and Jeansson, E.: Constraining projection-based estimates of the future North Atlantic carbon uptake, J. Climate, 31, 3959–3978, https://doi.org/10.1175/JCLI-D-17-0564.1, 2018.
Goyet, C., Beauverger, C., Brunet, C., and Poisson, A.: Distribution of carbon dioxide partial pressure in surface waters of the Southwest Indian Ocean, Tellus B, 43, 1–11, https://doi.org/10.3402/tellusb.v43i1.15242, 1991.
Gregor, L. and Gruber, N.: OceanSODA-ETHZ: a global gridded data set of the surface ocean carbonate system for seasonal to decadal studies of ocean acidification, Earth Syst. Sci. Data, 13, 777–808, https://doi.org/10.5194/essd-13-777-2021, 2021.
Gruber, N., Clement, D., Carter, B. R., Feely, R. A., van Heuven, S., Hoppema, M., Ishii, M., Key, R. M., Kozyr, A., Lauvset, S. K., Lo Monaco, C. , Mathis, J. T., Murata, A., Olsen, A., Perez, F. F., Sabine, C. L., Tanhua, T., and Wanninkhof, R.: The oceanic sink for anthropogenic CO2 from 1994 to 2007, Science, 363, 1193–1199, https://doi.org/10.1126/science.aau5153, 2019.
Hagens, M. and Middelburg, J. J.: Attributing seasonal pH variability in surface ocean waters to governing factors, Geophys. Res. Lett., 43, 12528–12537, https://doi.org/10.1002/2016GL071719, 2016.
Henson, S. A., Painter, S. C., Holliday, N. P., Stinchcombe, M. C., and Giering, S. L. C.: Unusual subpolar North Atlantic phytoplankton bloom in 2010: Volcanic fertilization or North Atlantic Oscillation?, J. Geophys. Res.-Oceans, 118, 4771–4780, https://doi.org/10.1002/jgrc.20363, 2013.
Hoegh-Guldberg, O., Mumby, P. J., Hooten, A. J., Steneck, R. S., Greenfield, P., Gomez, E., Harvell, C. D., Sale, P. F., Edwards, A. J., Caldeira, K., Knowlton, N., Eakin, C. M., Iglesias-Prieto, R., Muthiga, N., Bradbury, R. H., Dubi, A., and Hatziolos, M. E.: Coral reefs under rapid climate change and ocean acidification, Science, 14, 1737–1742, https://doi.org/10.1126/science.1152509, 2007.
Hood, E. M. and Merlivat, L.: Annual to interannual variations of fCO2 in the northwestern Mediterranean Sea: Results from hourly measurements made by CARIOCA buoys, 1995–1997, J. Mar. Res., 59, 113–131, https://elischolar.library.yale.edu/journal_of_marine_research/2386 (last access: 22 December 2023), 2001.
Howes, E., Stemmann, L., Assailly, C., Irisson, J.-O., Dima, M., Bijma, J., and Gattuso, J.-P.: Pteropod time series from the North Western Mediterranean (1967–2003): impacts of pH and climate variability, Mar. Ecol. Prog. Ser., 531, 193–206, https://doi.org/10.3354/meps11322, 2015.
Howes, E. L., Eagle, R., Gattuso, J.-P., and Bijma, J.: Comparison of Mediterranean pteropod shell biometrics and ultrastructure from historical (1910 and 1921) and present day (2012) samples provides baseline for monitoring effects of global change, PLoS ONE, 12, e0167891, https://doi.org/10.1371/journal.pone.0167891, 2017.
IPCC: Changing Ocean, Marine Ecosystems, and Dependent Communities, in: The Ocean and Cryosphere in a Changing Climate, Cambridge University Press, 447–588, https://doi.org/10.1017/9781009157964.007, 2022.
Jiang, L.-Q., Feely, R. A., Carter, B. R., Greeley, D. J., Gledhill, D. K., and Arzayus K. M.: Climatological distribution of aragonite saturation state in the global oceans, Global Biogeochem. Cy., 29, 1656–1673, https://doi.org/10.1002/2015GB005198, 2015.
Jiang, L.-Q., Carter, B. R., Feely, R. A., Lauvset, S. K., and Olsen, A.: Surface ocean pH and buffer capacity: past, present and future, Sci. Rep., 9, 18624, https://doi.org/10.1038/s41598-019-55039-4, 2019.
Jiang, L.-Q., Feely, R. A., Wanninkhof, R., Greeley, D., Barbero, L., Alin, S., Carter, B. R., Pierrot, D., Featherstone, C., Hooper, J., Melrose, C., Monacci, N., Sharp, J. D., Shellito, S., Xu, Y.-Y., Kozyr, A., Byrne, R. H., Cai, W.-J., Cross, J., Johnson, G. C., Hales, B., Langdon, C., Mathis, J., Salisbury, J., and Townsend, D. W.: Coastal Ocean Data Analysis Product in North America (CODAP-NA) – an internally consistent data product for discrete inorganic carbon, oxygen, and nutrients on the North American ocean margins, Earth Syst. Sci. Data, 13, 2777–2799, https://doi.org/10.5194/essd-13-2777-2021, 2021.
Jiang, L.-Q., Dunne, J., Carter, B. R., Tjiputra, J. F., Terhaar, J., Sharp, J. D., Olsen, A., Alin, S., Bakker, D. C. E., Feely, R. A., Gattuso, J.-P., Hogan, P., Ilyina, T., Lange, N., Lauvset, S. K., Lewis, E. R., Lovato, T., Palmieri, J., Santana-Falcón, Y., Schwinger, J., Séférian, R., Strand, G., Swart, N., Tanhua, T., Tsujino, H., Wanninkhof, R., Watanabe, M., Yamamoto, A., and Ziehn, T.: Global surface ocean acidification indicators from 1750 to 2100, J. Adv. Model. Earth Sy., 15, e2022MS003563, https://doi.org/10.1029/2022MS003563, 2023a.
Jiang, L. Q., Kozyr, A., Relph, J. M., Ronje, E. I., Kamb, L., Burger, E., Myer, J., Nguyen, L., and Arzayus, K. M.: The Ocean Carbon and Acidification Data System, Sci. Data, 10, 136, https://doi.org/10.1038/s41597-023-02042-0, 2023b.
Jiang, Z.-P., Tyrrell, T., Hydes, D. J., Dai, M., and Hartman, S. E.: Variability of alkalinity and the alkalinity-salinity relationship in the tropical and subtropical surface ocean, Global Biogeochem. Cy., 28, 729–742, https://doi.org/10.1002/2013GB004678, 2014.
Johnson, K. S., Mazloff, M. R., Bif, M. B., Takeshita, Y., Jannasch, H. W., Maurer, T. L., Plant, J. N., Verdy, A., Walz, P. M., Riser, S. C., and Talley, L. D.: Carbon to nitrogen uptake ratios observed across the Southern Ocean by the SOCCOM profiling float array, J. Geophys. Res.-Oceans, 127, e2022JC018859, https://doi.org/10.1029/2022JC018859, 2022.
Joos, F., Hameau, A., Frölicher, T. L., and Stephenson, D. B.: Anthropogenic attribution of the increasing seasonal amplitude in surface ocean pCO2, Geophys. Res. Lett., 50, e2023GL102857, https://doi.org/10.1029/2023GL102857, 2023.
Joyce, T. and Corry, C. (Eds.): Requirements for WOCE Hydrographic Programme Data Reporting, WHPO Publication 90-1 Revision 2, WOCE Report 67/91, Woods Hole, Mass., USA, https://cchdo.github.io/hdo-assets/documentation/manuals/pdf/90_1/title.pdf (last access: 22 December 2023), 1994.
Kapsenberg, L., Alliouane, S., Gazeau, F., Mousseau, L., and Gattuso, J.-P.: Coastal ocean acidification and increasing total alkalinity in the northwestern Mediterranean Sea, Ocean Sci., 13, 411–426, https://doi.org/10.5194/os-13-411-2017, 2017.
Keppler, L., Landschützer, P., Gruber, N., Lauvset, S. K., and Stemmler, I.: Seasonal carbon dynamics in the near-global ocean, Global Biogeochem. Cy., 34, e2020GB006571, https://doi.org/10.1029/2020GB006571, 2020.
Keppler, L., Landschützer, P., Lauvset, S. K., and Gruber, N.: Recent trends and variability in the oceanic storage of dissolved inorganic carbon, Global Biogeochem. Cy., 37, e2022GB007677, https://doi.org/10.1029/2022GB007677, 2023.
Keraghel, M. A., Louanchi, F., Zerrouki, M., Kaci, M. A., Aït-Ameur, N., Labaste, M., Legoff, H., Taillandier, V., Harid, R., and Mortier, L.: Carbonate system properties and anthropogenic carbon inventory in the Algerian Basin during SOMBA cruise (2014): Acidification estimate, Mar. Chem., 221, 103783, https://doi.org/10.1016/j.marchem.2020.103783, 2020.
Key, R. M., Kozyr, A., Sabine, C. L., Lee, K., Wanninkhof, R., Bullister, J. L., Feely, R. A., Millero, F. J., Mordy, C., and Peng, T. H.: A global ocean carbon climatology: Results from Global Data Analysis Project (GLODAP), Global Biogeochem. Cy., 18, GB4031, https://doi.org/10.1029/2004GB002247, 2004.
Key, R. M., Tanhua, T., Olsen, A., Hoppema, M., Jutterström, S., Schirnick, C., van Heuven, S., Kozyr, A., Lin, X., Velo, A., Wallace, D. W. R., and Mintrop, L.: The CARINA data synthesis project: introduction and overview, Earth Syst. Sci. Data, 2, 105–121, https://doi.org/10.5194/essd-2-105-2010, 2010.
Khatiwala, S., Tanhua, T., Mikaloff Fletcher, S., Gerber, M., Doney, S. C., Graven, H. D., Gruber, N., McKinley, G. A., Murata, A., Ríos, A. F., and Sabine, C. L.: Global ocean storage of anthropogenic carbon, Biogeosciences, 10, 2169–2191, https://doi.org/10.5194/bg-10-2169-2013, 2013.
Kitidis, V., Shutler, J. D., Ashton, I., Warren, M., Brown, I., Findlay, H., Hartman, S. E., Sanders, R., Humphreys, M., Kivimäe, C., Greenwood, N., Hull, T., Pearce, D., McGrath, T., Stewart, B. M., Walsham, P., McGovern, E., Bozec, Y., Gac, J.-P., van Heuven, S., Hoppema, M., Schuster, U., Johannessen, T., Omar, A., Lauvset, S. K., Skjelvan, I., Olsen, A., Steinhoff, T., Körtzinger, A., Becker, M., Lefèvre, N., Diverrès, D., Gkritzalis, T., Cattrijsse, A., Petersen, W., Voynova, Y., Chapron, B., Grouazel, A., Land, P. E., Sharples, J., and Nightingale, P. D.: Winter weather controls net influx of atmospheric CO2 on the north-west European shelf, Sci. Rep., 9, 20153, https://doi.org/10.1038/s41598-019-56363-5, 2019.
Koffi, U., Lefèvre, N., Kouadio, G., and Boutin, J.: Surface CO2 parameters and air-sea CO2 fluxes distribution in the eastern equatorial Altantic Ocean, J. Marine Syst., 82, 135–144, https://doi.org/10.1016/j.jmarsys.2010.04.010, 2010.
Koseki, S., Tjiputra, J., Fransner, F., Crespo, Lander R., and Keenlyside, N. S.: Disentangling the impact of Atlantic Niño on sea-air CO2 flux, Nat. Commun., 14, 3649, https://doi.org/10.1038/s41467-023-38718-9, 2023.
Kwiatkowski, L., Torres, O., Bopp, L., Aumont, O., Chamberlain, M., Christian, J. R., Dunne, J. P., Gehlen, M., Ilyina, T., John, J. G., Lenton, A., Li, H., Lovenduski, N. S., Orr, J. C., Palmieri, J., Santana-Falcón, Y., Schwinger, J., Séférian, R., Stock, C. A., Tagliabue, A., Takano, Y., Tjiputra, J., Toyama, K., Tsujino, H., Watanabe, M., Yamamoto, A., Yool, A., and Ziehn, T.: Twenty-first century ocean warming, acidification, deoxygenation, and upper-ocean nutrient and primary production decline from CMIP6 model projections, Biogeosciences, 17, 3439–3470, https://doi.org/10.5194/bg-17-3439-2020, 2020.
Land, P. E., Findlay, H. S., Shutler, J. D., Ashton, I. G., Holding, T., Grouazel, A., Girard-Ardhuin, F., Reul, N., Piolle, J. F., Chapron, B., and Quilfen, Y.: Optimum satellite remote sensing of the marine carbonate system using empirical algorithms in the global ocean, the Greater Caribbean, the Amazon Plume and the Bay of Bengal, Remote Sens. Environ., 235, 111469, https://doi.org/10.1016/j.rse.2019.111469, 2019.
Lauvset, S. K., Gruber, N., Landschützer, P., Olsen, A., and Tjiputra, J.: Trends and drivers in global surface ocean pH over the past 3 decades, Biogeosciences, 12, 1285–1298, https://doi.org/10.5194/bg-12-1285-2015, 2015.
Lauvset, S. K., Carter, B. R., Perez, F. F., Jiang, L.-Q., Feely, R. A., Velo, A., and Olsen, A.: Processes Driving Global Interior Ocean pH Distribution, Global Biogeochem. Cy., 34, e2019GB006229, https://doi.org/10.1029/2019GB006229, 2020.
Lauvset, S. K., Lange, N., Tanhua, T., Bittig, H. C., Olsen, A., Kozyr, A., Álvarez, M., Becker, S., Brown, P. J., Carter, B. R., Cotrim da Cunha, L., Feely, R. A., van Heuven, S., Hoppema, M., Ishii, M., Jeansson, E., Jutterström, S., Jones, S. D., Karlsen, M. K., Lo Monaco, C., Michaelis, P., Murata, A., Pérez, F. F., Pfeil, B., Schirnick, C., Steinfeldt, R., Suzuki, T., Tilbrook, B., Velo, A., Wanninkhof, R., Woosley, R. J., and Key, R. M.: An updated version of the global interior ocean biogeochemical data product, GLODAPv2.2021, Earth Syst. Sci. Data, 13, 5565–5589, https://doi.org/10.5194/essd-13-5565-2021, 2021.
Lauvset, S. K., Lange, N., Tanhua, T., Bittig, H. C., Olsen, A., Kozyr, A., Alin, S., Álvarez, M., Azetsu-Scott, K., Barbero, L., Becker, S., Brown, P. J., Carter, B. R., da Cunha, L. C., Feely, R. A., Hoppema, M., Humphreys, M. P., Ishii, M., Jeansson, E., Jiang, L.-Q., Jones, S. D., Lo Monaco, C., Murata, A., Müller, J. D., Pérez, F. F., Pfeil, B., Schirnick, C., Steinfeldt, R., Suzuki, T., Tilbrook, B., Ulfsbo, A., Velo, A., Woosley, R. J., and Key, R. M.: GLODAPv2.2022: the latest version of the global interior ocean biogeochemical data product, Earth Syst. Sci. Data, 14, 5543–5572, https://doi.org/10.5194/essd-14-5543-2022, 2022.
Lebehot, A. D., Halloran, P. R., Watson, A. J., McNeall, D., Ford, D. A., Landschützer, P., Lauvset, S. K., and Schuster, U.: Reconciling Observation and Model Trends in North Atlantic Surface CO2, Global Biogeochem. Cy., 33, 1204–1222, https://doi.org/10.1029/2019GB006186, 2019.
Lee, K., Wanninkhof, R., Feely, R. A., Millero, F. J., and Peng, T.-H.: Global relationships of total inorganic carbon with temperature and nitrate in surface seawater, Global Biogeochem. Cy., 14, 979–994, https://doi.org/10.1029/1998GB001087, 2000.
Lee, K., Tong, L. T., Millero, F. J., Sabine, C. L., Dickson, A. G., Goyet, C., Park, G. H., Wanninkhof, R., Feely, R. A., and Key, R. M.: Global relationships of total alkalinity with salinity and temperature in surface waters of the world's oceans, Geophys. Res. Lett., 33, L19605, doi10.1029/2006GL027207, 2006.
Lefèvre, N. and Merlivat, L.: Carbon and oxygen net community production in the eastern tropical Atlantic estimated from a moored buoy, Global Biogeochem. Cy., 26, GB1009, https://doi.org/10.1029/2010GB004018, 2012.
Lefèvre, N., Guillot, A., Beaumont, L., and Danguy, T.: Variability of fCO2 in the Eastern Tropical Atlantic from a moored buoy, J. Geophys. Res.-Oceans, 113, C01015, https://doi.org/10.1029/2007JC004146, 2008.
Lefèvre, N., Diverres, D., and Gallois, F.: Origin of CO2 undersaturation in the western tropical Atlantic, Tellus B, 62, 595–607, https://doi.org/10.1111/j.1600-0889.2010.00475.x, 2010.
Lefèvre, N., Veleda, D., Araujo, M., and Caniaux, G.: Variability and trends of carbon parameters at a time series in the eastern tropical Atlantic, Tellus B, 68, 30305, https://doi.org/10.3402/tellusb.v68.30305, 2016.
Lefèvre, N., Mejia, C., Khvorostyanov, D., Beaumont, L., and Koffi, U.: Ocean Circulation Drives the Variability of the Carbon System in the Eastern Tropical Atlantic, Oceans, 2021, 126–148, https://doi.org/10.3390/oceans2010008, 2021.
Le Quéré, C., Moriarty, R., Andrew, R. M., Canadell, J. G., Sitch, S., Korsbakken, J. I., Friedlingstein, P., Peters, G. P., Andres, R. J., Boden, T. A., Houghton, R. A., House, J. I., Keeling, R. F., Tans, P., Arneth, A., Bakker, D. C. E., Barbero, L., Bopp, L., Chang, J., Chevallier, F., Chini, L. P., Ciais, P., Fader, M., Feely, R. A., Gkritzalis, T., Harris, I., Hauck, J., Ilyina, T., Jain, A. K., Kato, E., Kitidis, V., Klein Goldewijk, K., Koven, C., Landschützer, P., Lauvset, S. K., Lefèvre, N., Lenton, A., Lima, I. D., Metzl, N., Millero, F., Munro, D. R., Murata, A., Nabel, J. E. M. S., Nakaoka, S., Nojiri, Y., O'Brien, K., Olsen, A., Ono, T., Pérez, F. F., Pfeil, B., Pierrot, D., Poulter, B., Rehder, G., Rödenbeck, C., Saito, S., Schuster, U., Schwinger, J., Séférian, R., Steinhoff, T., Stocker, B. D., Sutton, A. J., Takahashi, T., Tilbrook, B., van der Laan-Luijkx, I. T., van der Werf, G. R., van Heuven, S., Vandemark, D., Viovy, N., Wiltshire, A., Zaehle, S., and Zeng, N.: Global Carbon Budget 2015, Earth Syst. Sci. Data, 7, 349–396, https://doi.org/10.5194/essd-7-349-2015, 2015.
Lerner, P., Romanou, A., Kelley, M., Romanski, J., Ruedy, R., and Russell, G.: Drivers of Air-Sea CO2 Flux Seasonality and its Long-Term Changes in the NASA-GISS model CMIP6 submission, J. Adv. Model. Earth Sy., 13, e2019MS002028, https://doi.org/10.1029/2019MS002028, 2021.
Leseurre, C., Lo Monaco, C., Reverdin, G., Metzl, N., Fin, J., Olafsdottir, S., and Racapé, V.: Ocean carbonate system variability in the North Atlantic Subpolar surface water (1993–2017), Biogeosciences, 17, 2553–2577, https://doi.org/10.5194/bg-17-2553-2020, 2020.
Leseurre, C., Lo Monaco, C., Reverdin, G., Metzl, N., Fin, J., Mignon, C., and Benito, L.: Summer trends and drivers of sea surface fCO2 and pH changes observed in the southern Indian Ocean over the last two decades (1998–2019), Biogeosciences, 19, 2599–2625, https://doi.org/10.5194/bg-19-2599-2022, 2022.
Lherminier, P., Mercier, H., Gourcuff, C., Alvarez, M., Bacon, S., and Kermabon, C.: Transports across the 2002 Greenland-Portugal OVIDE section and comparison with 1997, J. Geophys. Res., 112, C07003, https://doi.org/10.1029/2006JC003716, 2007.
Li, B. F., Watanabe, Y. W., Hosoda, S., Sato, K., and Nakano, Y.: Quasireal-time and high-resolution spatiotemporal distribution of ocean anthropogenic CO2, Geophys. Res. Lett., 46, 4836–4843, https://doi.org/10.1029/2018GL081639, 2019.
Lombard, F., Bourdin, G., Pesant, S., Agostini, S., Baudena, A., Boissin, E., Cassar, N., Clampitt, M., Conan, P., Da Silva, O., Dimier, C., Douville, E., Elineau, A., Fin, J., Flores, J.-M., Ghiglione, J.-F., Hume, B. C. C., Jalabert, L., John, S. G., Kelly, R. L., Koren, I., Lin, Y., Marie, D., McMinds, R., Mériguet, Z., Metzl, N., Paz-García, D. A., Luiza Pedrotti, M., Poulain, J., Pujo-Pay, M., Ras, J., Reverdin, G., Romac, S., Röttinger, E., Vardi, A., Voolstra, C. R., Moulin, C., Iwankow, G., Banaigs, B., Bowler, C., de Vargas, C., Forcioli, D., Furla, P., Galand, P. E., Gilson, E., Reynaud, S., Sunagawa, S., Thomas, O., Troublé, R., Vega Thurber, R., Wincker, P., Zoccola, D., Allemand, D., Planes, S., Boss, E., and Gorsky, G.: Open science resources from the Tara Pacific expedition across the surface ocean and coral reef ecosystems, Sci. Data, 10, 324, https://doi.org/10.1038/s41597-022-01757-w, 2023.
Lo Monaco, C., Álvarez, M., Key, R. M., Lin, X., Tanhua, T., Tilbrook, B., Bakker, D. C. E., van Heuven, S., Hoppema, M., Metzl, N., Ríos, A. F., Sabine, C. L., and Velo, A.: Assessing the internal consistency of the CARINA database in the Indian sector of the Southern Ocean, Earth Syst. Sci. Data, 2, 51–70, https://doi.org/10.5194/essd-2-51-2010, 2010.
Lo Monaco, C., Metzl, N., Fin, J., and Tribollet, A.: Sea surface measurements of dissolved inorganic carbon (DIC) and total alkalinity (TALK), temperature and salinity during the R/V Marion-Dufresne cruise CLIM-EPARSES (EXPOCODE 35MV20190405) in the Indian Ocean and Mozambique Channel from 2019-04-04 to 2019-04-30, NCEI Accession 0212218, NOAA National Centers for Environmental Information [data set] https://doi.org/10.25921/26rw-w185, 2020.
Lo Monaco, C., Metzl, N., Fin, J., Mignon, C., Cuet, P., Douville, E., Gehlen, M., Trang Chau, T. T., and Tribollet, A.: Distribution and long-term change of the sea surface carbonate system in the Mozambique Channel (1963–2019), Deep-Sea Res. Pt. II, 186–188, 104936, https://doi.org/10.1016/j.dsr2.2021.104936, 2021.
Lueker, T. J., Dickson, A. G., and Keeling, C. D.: Ocean pCO2 calculated from dissolved inorganic carbon, alkalinity, and equations for K1 and K2: validation based on laboratory measurements of CO2 in gas and seawater at equilibrium, Mar. Chem., 70, 105–119, https://doi.org/10.1016/S0304-4203(00)00022-0, 2000.
Ma, D., Gregor, L., and Gruber, N: Four decades of trends and drivers of global surface ocean acidification, Global Biogeochem. Cy., 37, e2023GB007765, https://doi.org/10.1029/2023GB007765, 2023.
Maier, C., Watremez, P., Taviani, M., Weinbauer, M. G., and Gattuso, J.-P.: Calcification rates and the effect of ocean acidification on Mediterranean cold-water corals, P. Roy. Soc. B-Biol. Sci., 279, 1716–1723, https://doi.org/10.1098/rspb.2011.1763, 2012.
Margirier, F., Testor, P., Heslop, E. Mallil, K., Bosse, A., Houpert, L., Mortier, L., Bouin, M.-N., Coppola, L., D’Ortenzio, F., Durrieu de Madron, X., Mourre, B., Prieur, L., Raimbault, P., and Taillandier, V.: Abrupt warming and salinification of intermediate waters interplays with decline of deep convection in the Northwestern Mediterranean Sea, Sci. Rep., 10, 20923, https://doi.org/10.1038/s41598-020-77859-5, 2020.
Marrec, P., Cariou, T., Collin, E., Durand, A., Latimier, M., Macé, E., Morin, P., Raimund, S., Vernet, M., and Bozec, Y.: Seasonal and latitudinal variability of the CO2 system in the western English Channel based on Voluntary Observing Ship (VOS) measurements, Mar. Chem., 155, 29–41, 2013.
Marrec, P., Cariou, T., Latimier, M., Macé, E., Morin, P., Vernet, M., and Bozec, Y.: Spatio-temporal dynamics of biogeochemical processes and air–sea CO2 fluxes in the Western English Channel based on two years of FerryBox deployment, J. Marine Syst., 140, 26–38, https://doi.org/10.1016/j.jmarsys.2014.05.010, 2014.
Marrec, P., Cariou, T., Macé, E., Morin, P., Salt, L. A., Vernet, M., Taylor, B., Paxman, K., and Bozec, Y.: Dynamics of air–sea CO2 fluxes in the northwestern European shelf based on voluntary observing ship and satellite observations, Biogeosciences, 12, 5371–5391, https://doi.org/10.5194/bg-12-5371-2015, 2015.
Marrec, P. and Bozec, Y.: Partial pressure (or fugacity) of carbon dioxide, dissolved inorganic carbon, alkalinity and salinity collected from Surface underway observations using Carbon dioxide (CO2) gas analyzer and other instruments from ARMORIQUE in the English Channel from 2012-04-25 to 2013-01-03 (NCEI Accession 0157472), Version 1.1, NOAA National Centers for Environmental Information [data set], https://doi.org/10.3334/CDIAC/OTG.COAST_FERRYBOX_ROSCOFF_PLYMOUTH_2012, 2016a.
Marrec, P. and Bozec, Y.: Partial pressure (or fugacity) of carbon dioxide, dissolved inorganic carbon, alkalinity and salinity collected from Surface underway observations using Carbon dioxide (CO2) gas analyzer and other instruments from ARMORIQUE in the English Channel from 2013-03-15 to 2013-12-22 (NCEI Accession 0157444), Version 1.1, NOAA National Centers for Environmental Information [data set], https://doi.org/10.3334/CDIAC/OTG.COAST_FERRYBOX_ROSCOFF_PLYMOUTH_2013, 2016b.
Marrec, P. and Bozec, Y.: Partial pressure (or fugacity) of carbon dioxide, dissolved inorganic carbon, alkalinity and salinity collected from surface underway observations using Carbon dioxide (CO2) gas analyzer and other instruments from ARMORIQUE in the English Channel from 2014-03-18 to 2014-10-09 (NCEI Accession 0163193), Version 1.1, NOAA National Centers for Environmental Information [data set], https://doi.org/10.3334/CDIAC/OTG.COAST_FERRYBOX_ROSCOFF_PLYMOUTH_2014, 2017.
Mazloff, M. R., Verdy, A., Gille, S. T., Johnson, K. S., Cornuelle, B. D., and Sarmiento, J.: Southern Ocean acidification revealed by biogeochemical-Argo floats, J. Geophys. Res.-Oceans, 128, e2022JC019530, https://doi.org/10.1029/2022JC019530, 2023.
McCulloch, M., Trotter, J., Montagna, P., Falter, J., Dunbar, R., Freiwald, A., Försterra, G., López Correa, M., Maier, C., Rüggeberg, A., and Taviani, M.: Resilience of cold-water scleractinian corals to ocean acidification: Boron isotopic systematics of pH and saturation state up-regulation, Geochim. Cosmochim. Ac., 87, 21–34, https://doi.org/10.1016/j.gca.2012.03.027, 2012.
McKinley, G. A., Fay, A. R., Takahashi, T., and Metzl, N.: Convergence of atmospheric and North Atlantic carbon dioxide trends on multidecadal timescales, Nat. Geosci., 4, 606–610, https://doi.org/10.1038/NGEO1193, 2011.
McKinley, G. A., Ritzer, A. L., and Lovenduski, N. S.: Mechanisms of northern North Atlantic biomass variability, Biogeosciences, 15, 6049–6066, https://doi.org/10.5194/bg-15-6049-2018, 2018.
Meier, K. J. S., Beaufort, L., Heussner, S., and Ziveri, P.: The role of ocean acidification in Emiliania huxleyi coccolith thinning in the Mediterranean Sea, Biogeosciences, 11, 2857–2869, https://doi.org/10.5194/bg-11-2857-2014, 2014.
Mercier, H., Lherminier, P., Sarafanov, A., Gaillard, F., Daniault, N., Desbruyères, D., Falina, A., Ferron, B., Huck, T., and Thierry, V.: Variability of the meridional overturning circulation at the Greenland-Portugal Ovide section from 1993 to 2010, Prog. Oceanogr., 132, 250–261, https://doi.org/10.1016/j.pocean.2013.11.001, 2015.
Merlivat, L., Boutin, J., Antoine, D., Beaumont, L., Golbol, M., and Vellucci, V.: Increase of dissolved inorganic carbon and decrease in pH in near-surface waters in the Mediterranean Sea during the past two decades, Biogeosciences, 15, 5653–5662, https://doi.org/10.5194/bg-15-5653-2018, 2018.
Metzl, N., Brunet, C., Jabaud-Jan, A., Poisson, A., and Schauer, B.: Summer and winter air-sea CO2 fluxes in the Southern Ocean, Deep-Sea Res. Pt. I, 53, 1548–1563, https://doi.org/10.1016/j.dsr.2006.07.006, 2006.
Metzl, N., Tilbrook, B., Bakker, D., Le Quéré, C., Doney, S., Feely, R., Hood M., and Dargaville, R.: Global Changes in Ocean Carbon: Variability and Vulnerability, Eos, 88, 286–287, https://doi.org/10.1029/2007EO280005, 2007.
Metzl, N., Corbière, A., Reverdin, G., Lenton, A., Takahashi, T., Olsen, A., Johannessen, T., Pierrot, D., Wanninkhof, R., Ólafsdóttir, S. R., Olafsson, J., and Ramonet, M.: Recent acceleration of the sea surface fCO2 growth rate in the North Atlantic subpolar gyre (1993–2008) revealed by winter observations, Global Biogeochem. Cy., 24, GB4004, https://doi.org/10.1029/2009GB003658, 2010.
Metzl, N., Ferron, B., Lherminier, P., Sarthou, G., and Thierry, V.: Discrete profile measurements of dissolved inorganic carbon (DIC), total alkalinity (TALK), temperature and salinity during the multiple ships Observatoire de la variabilité interannuelle et décennale en Atlantique Nord (OVIDE) project, OVIDE-2006, OVIDE-2008, OVIDE-2010, OVIDE-2012, OVIDE-2014 cruises in the North Atlantic Ocean from 2006-05-23 to 2014-06-30 (NCEI Accession 0177219), Version 1.1, NOAA National Centers for Environmental Information [data set], https://doi.org/10.25921/v0qt-ms48, 2018.
Metzl, N., Fin, J., Lo Monaco, C., et al.: A synthesis of total alkalinity and dissolved inorganic carbon measurements in the global ocean (1993–2022) SNAPO-CO2-V1 dataset, SEANOE [data set], https://doi.org/10.17882/95414, 2023.
Mignot, A., Claustre, H., Cossarini, G., D'Ortenzio, F., Gutknecht, E., Lamouroux, J., Lazzari, P., Perruche, C., Salon, S., Sauzède, R., Taillandier, V., and Teruzzi, A.: Using machine learning and Biogeochemical-Argo (BGC-Argo) floats to assess biogeochemical models and optimize observing system design, Biogeosciences, 20, 1405–1422, https://doi.org/10.5194/bg-20-1405-2023, 2023.
Millero, F. J., Lee, K., and Roche, M.: Distribution of alkalinity in the surface waters of the major oceans, Mar. Chem., 60, 111–130, https://doi.org/10.1016/S0304-4203(97)00084-4, 1998.
Mongwe, N. P., Vichi, M., and Monteiro, P. M. S.: The seasonal cycle of pCO2 and CO2 fluxes in the Southern Ocean: diagnosing anomalies in CMIP5 Earth system models, Biogeosciences, 15, 2851–2872, https://doi.org/10.5194/bg-15-2851-2018, 2018.
Moutin, T., Wagener, T., Caffin, M., Fumenia, A., Gimenez, A., Baklouti, M., Bouruet-Aubertot, P., Pujo-Pay, M., Leblanc, K., Lefevre, D., Helias Nunige, S., Leblond, N., Grosso, O., and de Verneil, A.: Nutrient availability and the ultimate control of the biological carbon pump in the western tropical South Pacific Ocean, Biogeosciences, 15, 2961–2989, https://doi.org/10.5194/bg-15-2961-2018, 2018.
Newton, J. A., Feely, R. A., Jewett, E. B., Williamson, P., and Mathis, J.: Global Ocean Acidification Observing Network: Requirements and Governance Plan. Second Edition, GOA-ON, https://www.iaea.org/sites/default/files/18/06/goa-on-second-edition-2015.pdf (last access: 22 December 2023), 2015.
Nykjaer, L.: Mediterranean Sea surface warming 1985–2006, Clim. Res., 39, 11–17, https://doi.org/10.3354/cr00794, 2009.
OCADS: Coastal Carbon Data, https://www.ncei.noaa.gov/access/ocean-carbon-acidification-data-system/oceans/coastal_carbon_data.html, last access: 22 December 2023.
Olafsson, J., Olafsdottir, S. R., Benoit-Cattin, A., Danielsen, M., Arnarson, T. S., and Takahashi, T.: Rate of Iceland Sea acidification from time series measurements, Biogeosciences, 6, 2661–2668, https://doi.org/10.5194/bg-6-2661-2009, 2009.
Olivier, L., Boutin, J., Reverdin, G., Lefèvre, N., Landschützer, P., Speich, S., Karstensen, J., Labaste, M., Noisel, C., Ritschel, M., Steinhoff, T., and Wanninkhof, R.: Wintertime process study of the North Brazil Current rings reveals the region as a larger sink for CO2 than expected, Biogeosciences, 19, 2969–2988, https://doi.org/10.5194/bg-19-2969-2022, 2022.
Olsen, A., Key, R. M., van Heuven, S., Lauvset, S. K., Velo, A., Lin, X., Schirnick, C., Kozyr, A., Tanhua, T., Hoppema, M., Jutterström, S., Steinfeldt, R., Jeansson, E., Ishii, M., Pérez, F. F., and Suzuki, T.: The Global Ocean Data Analysis Project version 2 (GLODAPv2) – an internally consistent data product for the world ocean, Earth Syst. Sci. Data, 8, 297–323, https://doi.org/10.5194/essd-8-297-2016, 2016.
Olsen, A., Lange, N., Key, R. M., Tanhua, T., Álvarez, M., Becker, S., Bittig, H. C., Carter, B. R., Cotrim da Cunha, L., Feely, R. A., van Heuven, S., Hoppema, M., Ishii, M., Jeansson, E., Jones, S. D., Jutterström, S., Karlsen, M. K., Kozyr, A., Lauvset, S. K., Lo Monaco, C., Murata, A., Pérez, F. F., Pfeil, B., Schirnick, C., Steinfeldt, R., Suzuki, T., Telszewski, M., Tilbrook, B., Velo, A., and Wanninkhof, R.: GLODAPv2.2019 – an update of GLODAPv2, Earth Syst. Sci. Data, 11, 1437–1461, https://doi.org/10.5194/essd-11-1437-2019, 2019.
Olsen, A., Lange, N., Key, R. M., Tanhua, T., Bittig, H. C., Kozyr, A., Álvarez, M., Azetsu-Scott, K., Becker, S., Brown, P. J., Carter, B. R., Cotrim da Cunha, L., Feely, R. A., van Heuven, S., Hoppema, M., Ishii, M., Jeansson, E., Jutterström, S., Landa, C. S., Lauvset, S. K., Michaelis, P., Murata, A., Pérez, F. F., Pfeil, B., Schirnick, C., Steinfeldt, R., Suzuki, T., Tilbrook, B., Velo, A., Wanninkhof, R., and Woosley, R. J.: An updated version of the global interior ocean biogeochemical data product, GLODAPv2.2020, Earth Syst. Sci. Data, 12, 3653–3678, https://doi.org/10.5194/essd-12-3653-2020, 2020.
Orr, J. C., Epitalon, J.-M., and Gattuso, J.-P.: Comparison of ten packages that compute ocean carbonate chemistry, Biogeosciences, 12, 1483–1510, https://doi.org/10.5194/bg-12-1483-2015, 2015.
Orr, J. C., Epitalon, J.-M., Dickson, A. G., and Gattuso, J.-P.: Routine uncertainty propagation for the marine carbon dioxide system, Mar. Chem., 207, 84–107, https://doi.org/10.1016/j.marchem.2018.10.006, 2018.
Parard, G., Lefèvre, N., and Boutin, J.: Sea water fugacity of CO2 at the PIRATA mooring at 6∘ S, 10∘ W, Tellus B, 62, 636–648, https://doi.org/10.1111/j.1600-0889.2010.00503.x, 2010.
Pérez, F. F., Vázquez-Rodríguez, M., Mercier, H., Velo, A., Lherminier, P., and Ríos, A. F.: Trends of anthropogenic CO2 storage in North Atlantic water masses, Biogeosciences, 7, 1789–1807, https://doi.org/10.5194/bg-7-1789-2010, 2010.
Pérez, F. F., Mercier, H., Vazquez-Rodriguez, M., Lherminier, P., Velo, A., Pardo, P., Roson, G., and Rios, A.: Reconciling air-sea CO2 fluxes and anthropogenic CO2 budgets in a changing North Atlantic, Nat. Geosci., 6, 146–152, https://doi.org/10.1038/ngeo1680, 2013.
Pérez, F., Fontela, M., García-Ibáñez, M., Mercier, H., Velo, A., Lherminier, P., Zunino, P., de la Paz, M., Alonso-Pérez, F., Guallart, E. F., and Padin, X. A.: Meridional overturning circulation conveys fast acidification to the deep Atlantic Ocean, Nature, 554, 515–518, https://doi.org/10.1038/nature25493, 2018.
Petrenko, A. A., Doglioli, A. M., Nencioli, F., Kersalé, M., Hu, Z., and d'Ovidio, F.: A review of the LATEX project: mesoscale to submesoscale processes in a coastal environment, Ocean Dynam., 67, 513–533, https://doi.org/10.1007/s10236-017-1040-9, 2017.
Petton, S., Pouvreau, S., and Fleury, E.: ECOSCOPA network: high frequency environmental databasem SEANOE [data set], https://doi.org/10.17882/86131, 2023.
Pfeil, B., Olsen, A., Bakker, D. C. E., Hankin, S., Koyuk, H., Kozyr, A., Malczyk, J., Manke, A., Metzl, N., Sabine, C. L., Akl, J., Alin, S. R., Bates, N., Bellerby, R. G. J., Borges, A., Boutin, J., Brown, P. J., Cai, W.-J., Chavez, F. P., Chen, A., Cosca, C., Fassbender, A. J., Feely, R. A., González-Dávila, M., Goyet, C., Hales, B., Hardman-Mountford, N., Heinze, C., Hood, M., Hoppema, M., Hunt, C. W., Hydes, D., Ishii, M., Johannessen, T., Jones, S. D., Key, R. M., Körtzinger, A., Landschützer, P., Lauvset, S. K., Lefèvre, N., Lenton, A., Lourantou, A., Merlivat, L., Midorikawa, T., Mintrop, L., Miyazaki, C., Murata, A., Nakadate, A., Nakano, Y., Nakaoka, S., Nojiri, Y., Omar, A. M., Padin, X. A., Park, G.-H., Paterson, K., Perez, F. F., Pierrot, D., Poisson, A., Ríos, A. F., Santana-Casiano, J. M., Salisbury, J., Sarma, V. V. S. S., Schlitzer, R., Schneider, B., Schuster, U., Sieger, R., Skjelvan, I., Steinhoff, T., Suzuki, T., Takahashi, T., Tedesco, K., Telszewski, M., Thomas, H., Tilbrook, B., Tjiputra, J., Vandemark, D., Veness, T., Wanninkhof, R., Watson, A. J., Weiss, R., Wong, C. S., and Yoshikawa-Inoue, H.: A uniform, quality controlled Surface Ocean CO2 Atlas (SOCAT), Earth Syst. Sci. Data, 5, 125–143, https://doi.org/10.5194/essd-5-125-2013, 2013.
Pilcher, D. J., Brody, S. R., Johnson, L., and Bronselaer, B.: Assessing the abilities of CMIP5 models to represent the seasonal cycle of surface ocean pCO2, J. Geophys. Res.-Oceans, 120, 4625–4637, https://doi.org/10.1002/2015JC010759, 2015.
Poisson, A., Culkin, F., and Ridout, P.: Intercomparison of CO2 measurements, Deep-Sea Res. Pt. I, 37, 1647–1650, https://doi.org/10.1016/0198-0149(90)90067-6, 1990.
Racapé, V., Metzl, N., Pierre, C., Reverdin, G., Quay, P. D., and Olafsdottir, S. R.: The seasonal cycle of δ3CDIC in the North Atlantic subpolar gyre, Biogeosciences, 11, 1683–1692, https://doi.org/10.5194/bg-11-1683-2014, 2014.
Revelle, R. and Suess, H. E.: Carbon dioxide exchange between atmosphere and ocean and the question of an increase of atmospheric CO2 during the past decades, Tellus, 9, 18–27, https://doi.org/10.1111/j.2153-3490.1957.tb01849.x, 1957.
Reverdin, G., Metzl, N., Olafsdottir, S., Racapé, V., Takahashi, T., Benetti, M., Valdimarsson, H., Benoit-Cattin, A., Danielsen, M., Fin, J., Naamar, A., Pierrot, D., Sullivan, K., Bringas, F., and Goni, G.: SURATLANT: a 1993–2017 surface sampling in the central part of the North Atlantic subpolar gyre, Earth Syst. Sci. Data, 10, 1901–1924, https://doi.org/10.5194/essd-10-1901-2018, 2018.
Ridame, C., Dekaezemacker, J., Guieu, C., Bonnet, S., L'Helguen, S., and Malien, F.: Contrasted Saharan dust events in LNLC environments: impact on nutrient dynamics and primary production, Biogeosciences, 11, 4783–4800, https://doi.org/10.5194/bg-11-4783-2014, 2014.
Robertson, J. E., Robinson, C., Turner, D. R., Holligan, P., Watson, A. J., Boyd, P., Fernandez, E., and Finch, M.: The impact of a coccolithophore bloom on oceanic carbon uptake in the northeast Atlantic during summer 1991, Deep-Sea Res. Pt. I, 41, 297–314, 1994.
Rödenbeck, C., Keeling, R. F., Bakker, D. C. E., Metzl, N., Olsen, A., Sabine, C., and Heimann, M.: Global surface-ocean pCO2 and sea–air CO2 flux variability from an observation-driven ocean mixed-layer scheme, Ocean Sci., 9, 193–216, https://doi.org/10.5194/os-9-193-2013, 2013.
Rödenbeck, C., Bakker, D. C. E., Gruber, N., Iida, Y., Jacobson, A. R., Jones, S., Landschützer, P., Metzl, N., Nakaoka, S., Olsen, A., Park, G.-H., Peylin, P., Rodgers, K. B., Sasse, T. P., Schuster, U., Shutler, J. D., Valsala, V., Wanninkhof, R., and Zeng, J.: Data-based estimates of the ocean carbon sink variability – first results of the Surface Ocean pCO2 Mapping intercomparison (SOCOM), Biogeosciences, 12, 7251–7278, https://doi.org/10.5194/bg-12-7251-2015, 2015.
Sabine, C. L., Feely, R. A., Gruber, N., Key, R. M., Lee, K., Bullister, J. L., Wanninkhof, R., Wong, C. S., Wallace, D. W. R., Tilbrook, B., Millero, F. J., Peng, T.-H., Kozyr, A., Ono, T., and Rios, A. F.: The Oceanic Sink for Anthropogenic CO2, Science, 305, 367–371, https://doi.org/10.1126/science.1097403, 2004.
Sabine, C. L., Hankin, S., Koyuk, H., Bakker, D. C. E., Pfeil, B., Olsen, A., Metzl, N., Kozyr, A., Fassbender, A., Manke, A., Malczyk, J., Akl, J., Alin, S. R., Bellerby, R. G. J., Borges, A., Boutin, J., Brown, P. J., Cai, W.-J., Chavez, F. P., Chen, A., Cosca, C., Feely, R. A., González-Dávila, M., Goyet, C., Hardman-Mountford, N., Heinze, C., Hoppema, M., Hunt, C. W., Hydes, D., Ishii, M., Johannessen, T., Key, R. M., Körtzinger, A., Landschützer, P., Lauvset, S. K., Lefèvre, N., Lenton, A., Lourantou, A., Merlivat, L., Midorikawa, T., Mintrop, L., Miyazaki, C., Murata, A., Nakadate, A., Nakano, Y., Nakaoka, S., Nojiri, Y., Omar, A. M., Padin, X. A., Park, G.-H., Paterson, K., Perez, F. F., Pierrot, D., Poisson, A., Ríos, A. F., Salisbury, J., Santana-Casiano, J. M., Sarma, V. V. S. S., Schlitzer, R., Schneider, B., Schuster, U., Sieger, R., Skjelvan, I., Steinhoff, T., Suzuki, T., Takahashi, T., Tedesco, K., Telszewski, M., Thomas, H., Tilbrook, B., Vandemark, D., Veness, T., Watson, A. J., Weiss, R., Wong, C. S., and Yoshikawa-Inoue, H.: Surface Ocean CO2 Atlas (SOCAT) gridded data products, Earth Syst. Sci. Data, 5, 145–153, https://doi.org/10.5194/essd-5-145-2013, 2013.
Salt, L. A., Beaumont, L., Blain, S., Bucciarelli, E., Grossteffan, E., Guillot, A., L'Helguen, S., Merlivat, L., Répécaud, M., Quéméner, L., Rimmelin-Maury, P., Tréguer, P., and Bozec, Y.: The annual and seasonal variability of the carbonate system in the Bay of Brest (Northwest Atlantic Shelf, 2008–2014), Mar. Chem., 187, 1–15, https://doi.org/10.1016/j.marchem.2016.09.003, 2016.
Sasse, T. P., McNeil, B. I., and Abramowitz, G.: A novel method for diagnosing seasonal to inter-annual surface ocean carbon dynamics from bottle data using neural networks, Biogeosciences, 10, 4319–4340, https://doi.org/10.5194/bg-10-4319-2013, 2013.
Sauzède, R., Claustre, H., Pasqueron de Fommervault, O., Bittig, H., Gattuso, J.-P., Legendre, L., and Johnson, K. S.: Estimates of water-column nutrients and carbonate system parameters in the global ocean: A novel approach based on neural networks, Front. Mar. Sci., 4, 128, https://doi.org/10.3389/fmars.2017.00128, 2017.
Schlitzer, R.: Ocean Data View, http://odv.awi.de (last access: 13 March 2019), 2018.
Schneider, A., Wallace, D. W. R., and Körtzinger, A.: Alkalinity of the Mediterranean Sea, Geophys. Res. Lett., 34, L15608, https://doi.org/10.1029/2006GL028842, 2007.
Schuster, U., Watson, A. J., Bates, N., Corbière, A., Gonzalez-Davila, M., Metzl, N., Pierrot, D., and Santana-Casiano, M.: Trends in North Atlantic sea surface pCO2 from 1990 to 2006, Deep-Sea Res. Pt. II, 56, 620–629, https://doi.org/10.1016/j.dsr2.2008.12.011, 2009.
Schuster, U., McKinley, G. A., Bates, N., Chevallier, F., Doney, S. C., Fay, A. R., González-Dávila, M., Gruber, N., Jones, S., Krijnen, J., Landschützer, P., Lefèvre, N., Manizza, M., Mathis, J., Metzl, N., Olsen, A., Rios, A. F., Rödenbeck, C., Santana-Casiano, J. M., Takahashi, T., Wanninkhof, R., and Watson, A. J.: An assessment of the Atlantic and Arctic sea–air CO2 fluxes, 1990–2009, Biogeosciences, 10, 607–627, https://doi.org/10.5194/bg-10-607-2013, 2013.
Seelmann, K., Steinhoff, T., Aßmann, S., and Körtzinger, A.:. Enhance Ocean Carbon Observations: Successful Implementation of a Novel Autonomous Total Alkalinity Analyzer on a Ship of Opportunity, Front. Mar. Sci., 7, 571301, https://doi.org/10.3389/fmars.2020.571301, 2020.
Sims, R. P., Holding, T. M., Land, P. E., Piolle, J.-F., Green, H. L., and Shutler, J. D.: OceanSODA-UNEXE: a multi-year gridded Amazon and Congo River outflow surface ocean carbonate system dataset, Earth Syst. Sci. Data, 15, 2499–2516, https://doi.org/10.5194/essd-15-2499-2023, 2023.
Skjelvan, I., Lauvset, S. K., Johannessen, T., Gundersen, K., and Skagseth, Ø.: Decadal trends in Ocean Acidification from the Ocean Weather Station M in the Norwegian Sea, J. Marine Syst., 234, 103775, https://doi.org/10.1016/j.jmarsys.2022.103775, 2022.
Takahashi, T., Sutherland, S. C., Sweeney, C., Poisson, A., Metzl, N., Tilbrook, B., Bates, N., Wanninkhof, R., Feely, R. A., Sabine, C., Olafsson, J., and Nojiri, Y.: Global Sea-Air CO2 Flux Based on Climatological Surface Ocean pCO2, and Seasonal Biological and Temperature Effect, Deep-Sea Res. Pt. II, 49, 1601–1622, https://doi.org/10.1016/S0967-0645(02)00003-6, 2002.
Takahashi, T., Sutherland, S. C., Wanninkhof, R., Sweeney, C., Feely, R. A., Chipman, D. W., Hales, B., Friederich, G., Chavez, F., Sabine, C., Watson, A. J., Bakker, D. C., Schuster, U., Metzl, N., Yoshikawa-Inoue, H., Ishii, M., Midorikawa, T., Nojiri, Y., Körtzinger, A., Steinhoff, T., Hoppema, M., Olafsson, J., Arnarson, T. S., Tilbrook, B., Johannessen, T., Olsen, A., Bellerby, R., Wong, C., Delille, B., Bates, N., and de Baar, H. J.: Climatological mean and decadal change in surface ocean pCO2, and net sea air CO2 flux over the global oceans, Deep-Sea Res. Pt. II, 56, 554–577, https://doi.org/10.1016/j.dsr2.2008.12.009, 2009.
Takahashi, T., Sutherland, S. C., Chipman, D. W., Goddard, J. G., Ho, C., Newberger, T., Sweeney, C., and Munro, D. R.: Climatological distributions of pH, pCO2, total CO2, alkalinity, and CaCO3 saturation in the global surface ocean, and temporal changes at selected locations, Mar. Chem., 164, 95–125, https://doi.org/10.1016/j.marchem.2014.06.004, 2014.
Tanhua, T., Pouliquen, S., Hausman, J., O'Brien, K., Bricher, P., de Bruin, T., Buck, J. J. H., Burger, E. F., Carval, T., Casey, K. S., Diggs, S., Giorgetti, A., Glaves, H., Harscoat, V., Kinkade, D., Muelbert, J. H., Novellino, A., Pfeil, B., Pulsifer, P. L., Van de Putte, A., Robinson, E., Schaap, D., Smirnov, A., Smith, N., Snowden, D., Spears, T., Stall, S., Tacoma, M., Thijsse, P., Tronstad, S., Vandenberghe, T., Wengren, M., Wyborn, L., and Zhao, Z.: Ocean FAIR Data Services, Front. Mar. Sci., 6, 440, https://doi.org/10.3389/fmars.2019.00440, 2019.
Tanhua, T., Lauvset, S. K., Lange, N. et al.: A vision for FAIR ocean data products, Commun. Earth Environ., 2, 136, https://doi.org/10.1038/s43247-021-00209-4, 2021.
Testor, P., Bosse, A., and Coppola, L.: MOOSE-GE, https://doi.org/10.18142/235, 2010.
Tilbrook, B., Jewett, E. B., DeGrandpre, M. D., Hernandez-Ayon, J. M., Feely, R. A., Gledhill, D. K., Hansson, L., Isensee, K., Kurz, M. L., Newton, J. A., Siedlecki, S. A., Chai, F., Dupont, S., Graco, M., Calvo, E., Greeley, D., Kapsenberg, L., Lebrec, M., Pelejero, C., Schoo, K. L., and Telszewski, M.: An Enhanced Ocean Acidification Observing Network: From People to Technology to Data Synthesis and Information Exchange, Front. Mar. Sci., 6, 337, https://doi.org/10.3389/fmars.2019.00337, 2019.
Touratier, F., and Goyet, C.: Decadal evolution of anthropogenic CO2 in the north western Mediterranean Sea from the mid-1990's to the mid-2000's, Deep-Sea Res. Pt I, 56, 1708–1716, https://doi.org/10.1016/j.dsr.2009.05.015, 2009.
Touratier, F., Azouzi, L., and Goyet, C.: CFC-11, Δ14C and 3H tracers as a means to assess anthropogenic CO2 concentrations in the ocean, Tellus B, 59, 318–325, https://doi.org/10.1111/j.1600-0889.2006.00247.x, 2007.
Touratier, F., Goyet, C., Houpert, L., Durrieu de Madron, X., Lefèvre, D., Stabholz, M., and Guglielmi, V.: Role of deep convection on anthropogenic CO2 sequestration in the Gulf of Lions (northwestern Mediterranean Sea), Deep-Sea Res. Pt. I, 113, 33–48, https://doi.org/10.1016/j.dsr.2016.04.003, 2016.
Turk, D., Dowd, M., Lauvset, S. K., Koelling, J., Alonso-Pérez, F., and Pérez, F. F.: Can Empirical Algorithms Successfully Estimate Aragonite Saturation State in the Subpolar North Atlantic?, Front. Mar. Sci., 4, 385, https://doi.org/10.3389/fmars.2017.00385, 2017.
UNESCO: Intercomparison of total alkalinity and total inorganic carbon determinations in seawater, UNESCO Tech. Pap. Mar. Sci., 59, https://www.jodc.go.jp/jodcweb/info/ioc_doc/UNESCO_tech/090199eb.pdf (last access: 22 December 2023), 1990.
UNESCO: Reference materials for oceanic carbon dioxide measurements, UNESCO Tech. Pap. Mar. Sci., 60, https://www.jodc.go.jp/jodcweb/info/ioc_doc/UNESCO_tech/090200eb.pdf (last access: 22 December 2023), 1991.
United Nations: The Sustainable Development Goals 2020, 68 pp. https://unstats.un.org/sdgs/report/2020/ (last access: 22 December 2023), 2020.
Vangriesheim A., Pierre, C., Aminot, A., Metzl, N., Baurand, F., and Caprais, J.-C.: The influence of Congo river discharges in the surface and deep layers of the Gulf of Guinea, Deep-Sea Res. Pt. II, https://doi.org/10.1016/j.dsr2.2009.04.002, 2009.
Vázquez-Rodríguez, M., Pérez, F. F., Velo, A., Ríos, A. F., and Mercier, H.: Observed acidification trends in North Atlantic water masses, Biogeosciences, 9, 5217–5230, https://doi.org/10.5194/bg-9-5217-2012, 2012.
Velo, A., Perez, F. F., Brown, P., Tanhua, T., Schuster, U., and Key, R. M.: CARINA alkalinity data in the Atlantic Ocean, Earth Syst. Sci. Data, 1, 45–61, https://doi.org/10.5194/essd-1-45-2009, 2009.
von Schuckmann, K., Cheng, L., Palmer, M. D., Hansen, J., Tassone, C., Aich, V., Adusumilli, S., Beltrami, H., Boyer, T., Cuesta-Valero, F. J., Desbruyères, D., Domingues, C., García-García, A., Gentine, P., Gilson, J., Gorfer, M., Haimberger, L., Ishii, M., Johnson, G. C., Killick, R., King, B. A., Kirchengast, G., Kolodziejczyk, N., Lyman, J., Marzeion, B., Mayer, M., Monier, M., Monselesan, D. P., Purkey, S., Roemmich, D., Schweiger, A., Seneviratne, S. I., Shepherd, A., Slater, D. A., Steiner, A. K., Straneo, F., Timmermans, M.-L., and Wijffels, S. E.: Heat stored in the Earth system: where does the energy go?, Earth Syst. Sci. Data, 12, 2013–2041, https://doi.org/10.5194/essd-12-2013-2020, 2020.
von Schuckmann, K., Minière, A., Gues, F., Cuesta-Valero, F. J., Kirchengast, G., Adusumilli, S., Straneo, F., Ablain, M., Allan, R. P., Barker, P. M., Beltrami, H., Blazquez, A., Boyer, T., Cheng, L., Church, J., Desbruyeres, D., Dolman, H., Domingues, C. M., García-García, A., Giglio, D., Gilson, J. E., Gorfer, M., Haimberger, L., Hakuba, M. Z., Hendricks, S., Hosoda, S., Johnson, G. C., Killick, R., King, B., Kolodziejczyk, N., Korosov, A., Krinner, G., Kuusela, M., Landerer, F. W., Langer, M., Lavergne, T., Lawrence, I., Li, Y., Lyman, J., Marti, F., Marzeion, B., Mayer, M., MacDougall, A. H., McDougall, T., Monselesan, D. P., Nitzbon, J., Otosaka, I., Peng, J., Purkey, S., Roemmich, D., Sato, K., Sato, K., Savita, A., Schweiger, A., Shepherd, A., Seneviratne, S. I., Simons, L., Slater, D. A., Slater, T., Steiner, A. K., Suga, T., Szekely, T., Thiery, W., Timmermans, M.-L., Vanderkelen, I., Wjiffels, S. E., Wu, T., and Zemp, M.: Heat stored in the Earth system 1960–2020: where does the energy go?, Earth Syst. Sci. Data, 15, 1675–1709, https://doi.org/10.5194/essd-15-1675-2023, 2023.
Wagener, T., Metzl, N., Caffin, M., Fin, J., Helias Nunige, S., Lefevre, D., Lo Monaco, C., Rougier, G., and Moutin, T.: Carbonate system distribution, anthropogenic carbon and acidification in the western tropical South Pacific (OUTPACE 2015 transect), Biogeosciences, 15, 5221–5236, https://doi.org/10.5194/bg-15-5221-2018, 2018a.
Wagener, T., Metzl, N., Caffin, M., Fin, J., Helias Nunige, S., Lefèvre, D., Lo Monaco, C., Rougier, G., and Moutin, T.: Discrete profile measurements of dissolved inorganic carbon (DIC), total alkalinity (TALK), temperature, salinity and other parameters during the R/V L'Atalante “Oligotrophy from Ultra-oligoTrophy PACific Experiment” (OUTPACE) cruise (EXPOCODE 35A320150218) in the South Pacific Ocean from 2015-02-18 to 2015-04-03 (NCEI Accession 0177706), Version 1.1, NOAA National Centers for Environmental Information [data set], https://doi.org/10.25921/wbkb-0q19, 2018b.
Walton, D. W. H. and Thomas, J.: Cruise Report – Antarctic Circumnavigation Expedition (ACE) 20th December 2016–19th March 2017 (1.0), Zenodo [data set], https://doi.org/10.5281/zenodo.1443511, 2018.
Wanninkhof, R., Park, G.-H., Takahashi, T., Sweeney, C., Feely, R., Nojiri, Y., Gruber, N., Doney, S. C., McKinley, G. A., Lenton, A., Le Quéré, C., Heinze, C., Schwinger, J., Graven, H., and Khatiwala, S.: Global ocean carbon uptake: magnitude, variability and trends, Biogeosciences, 10, 1983–2000, https://doi.org/10.5194/bg-10-1983-2013, 2013.
Watson, A. J., Schuster, U., Bakker, D. C. E., Bates, N., Corbiere, A., Gonzalez-Davila, M., Freidrich, T., Hauck, J., Heinze, C., Johannessen, T., Koertzinger, A., Metzl, N., Olafsson, J., Olsen, A., Oschlies, A., Padin, X., Pfeil, B., Rios, A., Santana-Casiano, M, Steinhoff, T., Telszewski, M., Wallace, D. W. R., and Wanninkhof, R.: Tracking the variable North Atlantic sink for atmospheric CO2, Science, 326, 1391, https://doi.org/10.1126/science.1177394, 2009.
Watson, A. J., Schuster, U., Shutler, J. D., Holding, T., Ashton, I. G. C., Landschützer, P., Woolf, D. K., and Goddijn-Murphy, L.: Revised estimates of ocean-atmosphere CO2 flux are consistent with ocean carbon inventory, Nat. Commun., 11, 4422, https://doi.org/10.1038/s41467-020-18203-3, 2020.
Williams, N. L., Juranek, L. W., Johnson, K. S., Feely, R. A., Riser, S. C., Talley, L. D., Russell, J. L., Sarmiento, J. L., and Wanninkhof, R.: Empirical algorithms to estimate water column pH in the Southern Ocean, Geophys. Res. Lett., 43, 3415–3422, https://doi.org/10.1002/2016GL068539, 2016.
Williams, N. L., Juranek, L. W., Feely, R. A., Johnson, K. S., Sarmiento, J. L., Talley, L. D., Dickson, A. G., Gray, A. R., Wanninkhof, R., Russell, J. L., Riser, S. C., and Takeshita, Y.: Calculating surface ocean pCO2 from biogeochemical Argo floats equipped with pH: An uncertainty analysis, Global Biogeochem. Cy., 31, 591–604, https://doi.org/10.1002/2016GB005541, 2017.
Williams, N. L., Juranek, L. W., Feely, R. A., Russell, J. L., Johnson, K. S., and Hales, B.: Assessment of the carbonate chemistry seasonal cycles in the Southern Ocean from persistent observational platforms, J. Geophys. Res.-Oceans, 123, 4833–4852, https://doi.org/10.1029/2017JC012917, 2018.
Wimart-Rousseau, C., Lajaunie-Salla, K., Marrec, P., Wagener, T., Raimbault, P., Lagadec, V., Lafont, M., Garcia, N., Diaz, F., Pinazo, C., Yohia, C., Garcia, F., Xueref-Remy, I., Blanc, P.-E., Armengaud, A., and Lefèvre, D.: Temporal variability of the carbonate system and air-sea CO2 exchanges in a Mediterranean human-impacted coastal site, Estuar. Coast. Shelf S., 236, 106641, https://doi.org/10.1016/j.ecss.2020.106641, 2020.
Wimart-Rousseau, C., Wagener, T., Álvarez, M., Moutin, T., Fourrier, M., Coppola, L., Niclas-Chirurgien, L., Raimbault, P., D'Ortenzio, F., Durrieu de Madron, X., Taillandier, V., Dumas, F., Conan, P., Pujo-Pay, M., and Lefèvre, D.: Seasonal and Interannual Variability of the CO2 System in the Eastern Mediterranean Sea: A Case Study in the North Western Levantine Basin, Front. Mar. Sci., 8, 649246, https://doi.org/10.3389/fmars.2021.649246, 2021.
WMO/GCOS: Global Climate Indicators, https://gcos.wmo.int/en/global-climate-indicators (last access: 22 December 2023), 2018.
Wu, Y., Hain, M. P., Humphreys, M. P., Hartman, S., and Tyrrell, T.: What drives the latitudinal gradient in open-ocean surface dissolved inorganic carbon concentration?, Biogeosciences, 16, 2661–2681, https://doi.org/10.5194/bg-16-2661-2019, 2019.
- Abstract
- Introduction
- Data collection
- Method, accuracy, repeatability, intercomparison and quality control
- Global distribution and relationships from AT and CT based on the SNAPO-CO2 dataset
- Temporal variations in AT and CT: examples from the SNAPO-CO2 dataset
- Using AT and CT data to validate observations from autonomous instruments
- Data availability
- Summary and suggestions
- Author contributions
- Competing interests
- Disclaimer
- Acknowledgements
- Financial support
- Review statement
- References
- Supplement