the Creative Commons Attribution 4.0 License.
the Creative Commons Attribution 4.0 License.
 | 07 Feb 2024
A 2020 forest age map for China with 30 m resolution
Kai Cheng
Yuling Chen
Tianyu Xiang
Haitao Yang
Weiyan Liu
Yu Ren
Hongcan Guan
Tianyu Hu
Qin Ma
Qinghua Guo
A high-resolution, spatially explicit forest age map is essential for quantifying forest carbon stocks and carbon sequestration potential. Prior attempts to estimate forest age on a national scale in China have been limited by sparse resolution and incomplete coverage of forest ecosystems, attributed to complex species composition, extensive forest areas, insufficient field measurements, and inadequate methods. To address these challenges, we developed a framework that combines machine learning algorithms (MLAs) and remote sensing time series analysis for estimating the age of China's forests. Initially, we identify and develop the optimal MLAs for forest age estimation across various vegetation divisions based on forest height, climate, terrain, soil, and forest-age field measurements, utilizing these MLAs to ascertain forest age information. Subsequently, we apply the LandTrendr time series analysis to detect forest disturbances from 1985 to 2020, with the time since the last disturbance serving as a proxy for forest age. Ultimately, the forest age data derived from LandTrendr are integrated with the result of MLAs to produce the 2020 forest age map of China. Validation against independent field plots yielded an R2 ranging from 0.51 to 0.63. On a national scale, the average forest age is 56.1 years (standard deviation of 32.7 years). The Qinghai–Tibet Plateau alpine vegetation zone possesses the oldest forest with an average of 138.0 years, whereas the forest in the warm temperate deciduous-broadleaf forest vegetation zone averages only 28.5 years. This 30 m-resolution forest age map offers crucial insights for comprehensively understanding the ecological benefits of China's forests and to sustainably manage China's forest resources. The map is available at https://doi.org/10.5281/zenodo.8354262 (Cheng et al., 2023a).
- Article
(8432 KB) - Full-text XML
-
Supplement
(722 KB) - BibTeX
- EndNote


Forest age is crucial for gaining insights into forest ecosystem succession and condition, thereby playing a pivotal role in comprehending the ecological benefits of forests (Lin et al., 2023). China's forests have undergone significant disruptions due to natural disasters and human activities over the past few decades, leading to notable changes in the forest age structure (Niu et al., 2023). Consequently, this scenario presents considerable challenges in accurately assessing forest ecosystem carbon storage (Pan et al., 2011; Tong et al., 2020). The complexity of species composition, extensive forest areas, limited field measurements, and ineffective methods have led to existing national-scale estimates of China's forest age focusing on either sparse resolution (Zhang et al., 2017) or partial forest ecosystem coverage (Xiao et al., 2023). This has resulted in significant uncertainties in evaluating the carbon sources and sinks within China's forest ecosystem (Piao et al., 2022; Wang et al., 2022). Therefore, there is an urgent requirement for time-efficient, high-resolution mapping of forest age across China.
At present, China's forest age data are primarily obtained through the national forest inventory with its high accuracy (Xiao et al., 2023), but this method requires extensive labor and material resources, making it time-consuming and costly (Liu et al., 2022). Additionally, most of China's forests are rugged mountainous areas that are difficult to access (Cheng et al., 2023b), which limits the survey range and uneven distribution of field samples, making it difficult to estimate the age of China's forests on a national scale. Thus, the traditional forest inventory method struggles to accurately and timely capture the complete age distribution and spatial characteristics of China's forests.
Remote sensing technology has demonstrated effectiveness in estimating forest cover (Su et al., 2020; Tubiello et al., 2023) and forest structure (Yu et al., 2020; Maltman et al., 2023) across various scales. The availability and sharing of Landsat time series data, along with the development of Google Earth Engine (GEE) cloud-processing platform, have significantly facilitated the application of remote sensing in forest age estimation. Several studies have been conducted to map China's forest age. Xiao et al. (2023) mapped the age of China's young forests at 30 m resolution using time series Landsat imagery. Yu et al. (2020) produced a 1 km resolution map of the age for planted forests in China. Zhang et al. (2017) developed a 1 km stand age map using climate and forest height data. Zhang et al. (2014) mapped a national forest age map with 1 km resolution by using remote-sensing forest height and forest type data. However, the existing China's forest age maps are typically undertaken at coarser spatial resolutions (e.g., 1 km), with finer resolutions (e.g., 30 m) being limited to young forests. There remains a lack of high-resolution forest age spatial dataset covering the entire forest region of China.
Statistical models and disturbance detection approaches are two common methods utilized in remote-sensing-based forest age estimations. Statistical models deduce forest age by establishing a coherent relationship between remote sensing features and field-collected empirical samples, including parametric regression approaches (Maltamo et al., 2020; Schumacher et al., 2020) and nonparametric machine learning algorithms (MLAs). Growth models represent one of the most widely used parametric models for estimating forest age (Zhang et al., 2014, 2017; Yu et al., 2020). However, this type of model relies on tree species information, posing challenges in forest age derivation when such data are lacking, particularly at large scales. MLAs have been employed for forest age estimation, owing to their flexibility in addressing complex problems (Alerskans et al., 2022). For example, Huang et al. (2023) integrated random forest (RF) to derived forest age. Chen et al. (2016) mapped forest stand age dynamics using RF and Landsat imagery. Nevertheless, the application of MLAs to estimate national forest age has not been deeply explored. Most previous studies used a single MLA, such as RF (Besnard et al., 2021), to estimate forest age. The extensive distribution of forests, diverse forest types, and varying terrain and climate conditions in China make it difficult in using a single model for accurately forest age determination on a national scale. Therefore, exploring the applicability of MLAs for forest age estimation in various regions of China is essential.
Disturbance detection approaches, capable of identifying the time of the most recent stand-replacing disturbance, have been proven accurate in forest age estimation (Li et al., 2024). These approaches mainly include Landsat-based Detection of Trends in Disturbance and Recovery (LandTrendr) (Kennedy et al., 2010), Continuous Change Detection and Classification (CCDC) (Zhu and Woodcock, 2014), the Vegetation Change Tracker (VCT) (Huang et al., 2010), and Breaks for Additive Season and Trend (BFAST) (Verbesselt et al., 2010a, b). Among these algorithms, LandTrendr has been recognized for its efficiency in detecting forest disturbances such as fire, deforestation, and urban expansion (de Jong et al., 2021; Rodman et al., 2021). For instance, Li et al. (2024) mapped planted forest age using the LandTrendr algorithm, demonstrating its efficiency and reliability for forest age mapping. However, these approaches are limited to obtaining forest age in areas with disturbance recorded by remote sensing, thus restricting a comprehensive understanding of forest age structures. Consequently, it is necessary to develop a framework that can provide comprehensive forest age information on a large scale.
The objective of the present study is to generate the first China forest age dataset at 30 m resolution using multisource datasets through combining remote sensing time series analysis and MLAs. This involves (1) identifying the most optimal MLAs for age estimation across various vegetation zones in China and estimating the age of China's forests, (2) utilizing the LandTrendr disturbance detection algorithm to identify the most recent forest disturbances from 1985 to 2020 and estimating the forest of these disturbed areas, and (3) using the forest age derived by the LandTrendr algorithm to update the result of MLAs to generate China's forest age map, which is then subjected to validation. The generated 30 m resolution forest age map provides critical information to quantify forest carbon storage and to sustainably manage China's forests.
2.1 Dataset and pre-processing
2.1.1 Forest inventory data
The data from China's seventh national forest inventory survey from 2004 to 2008 (http://www.forestry.gov.cn/, last access: 22 September 2023) were collected to develop models to estimate forest age. The inventory involves systematically and accurately monitoring the national forest resources based on 667 m2 sample plots covering the whole country (Ren et al., 2011). The main information collected from the sample plots are tree species, stand age, average tree height, and geographic location. The stand age is determined based on the planting time or is estimated using tree diameter at breast height (Zhang et al., 2017). We totally collected 58,033 field plots ranging in age from 1 to 480 years (Fig. 1b and c). The mean age of the samples is 34.0 years, with a standard deviation of 29.6 years. The sample plots were distributed across eight vegetation divisions (Fig. 1b) (Liu et al., 2022), each containing at least 436 sample plots for building MLAs to estimate forest age (Fig. 1d).
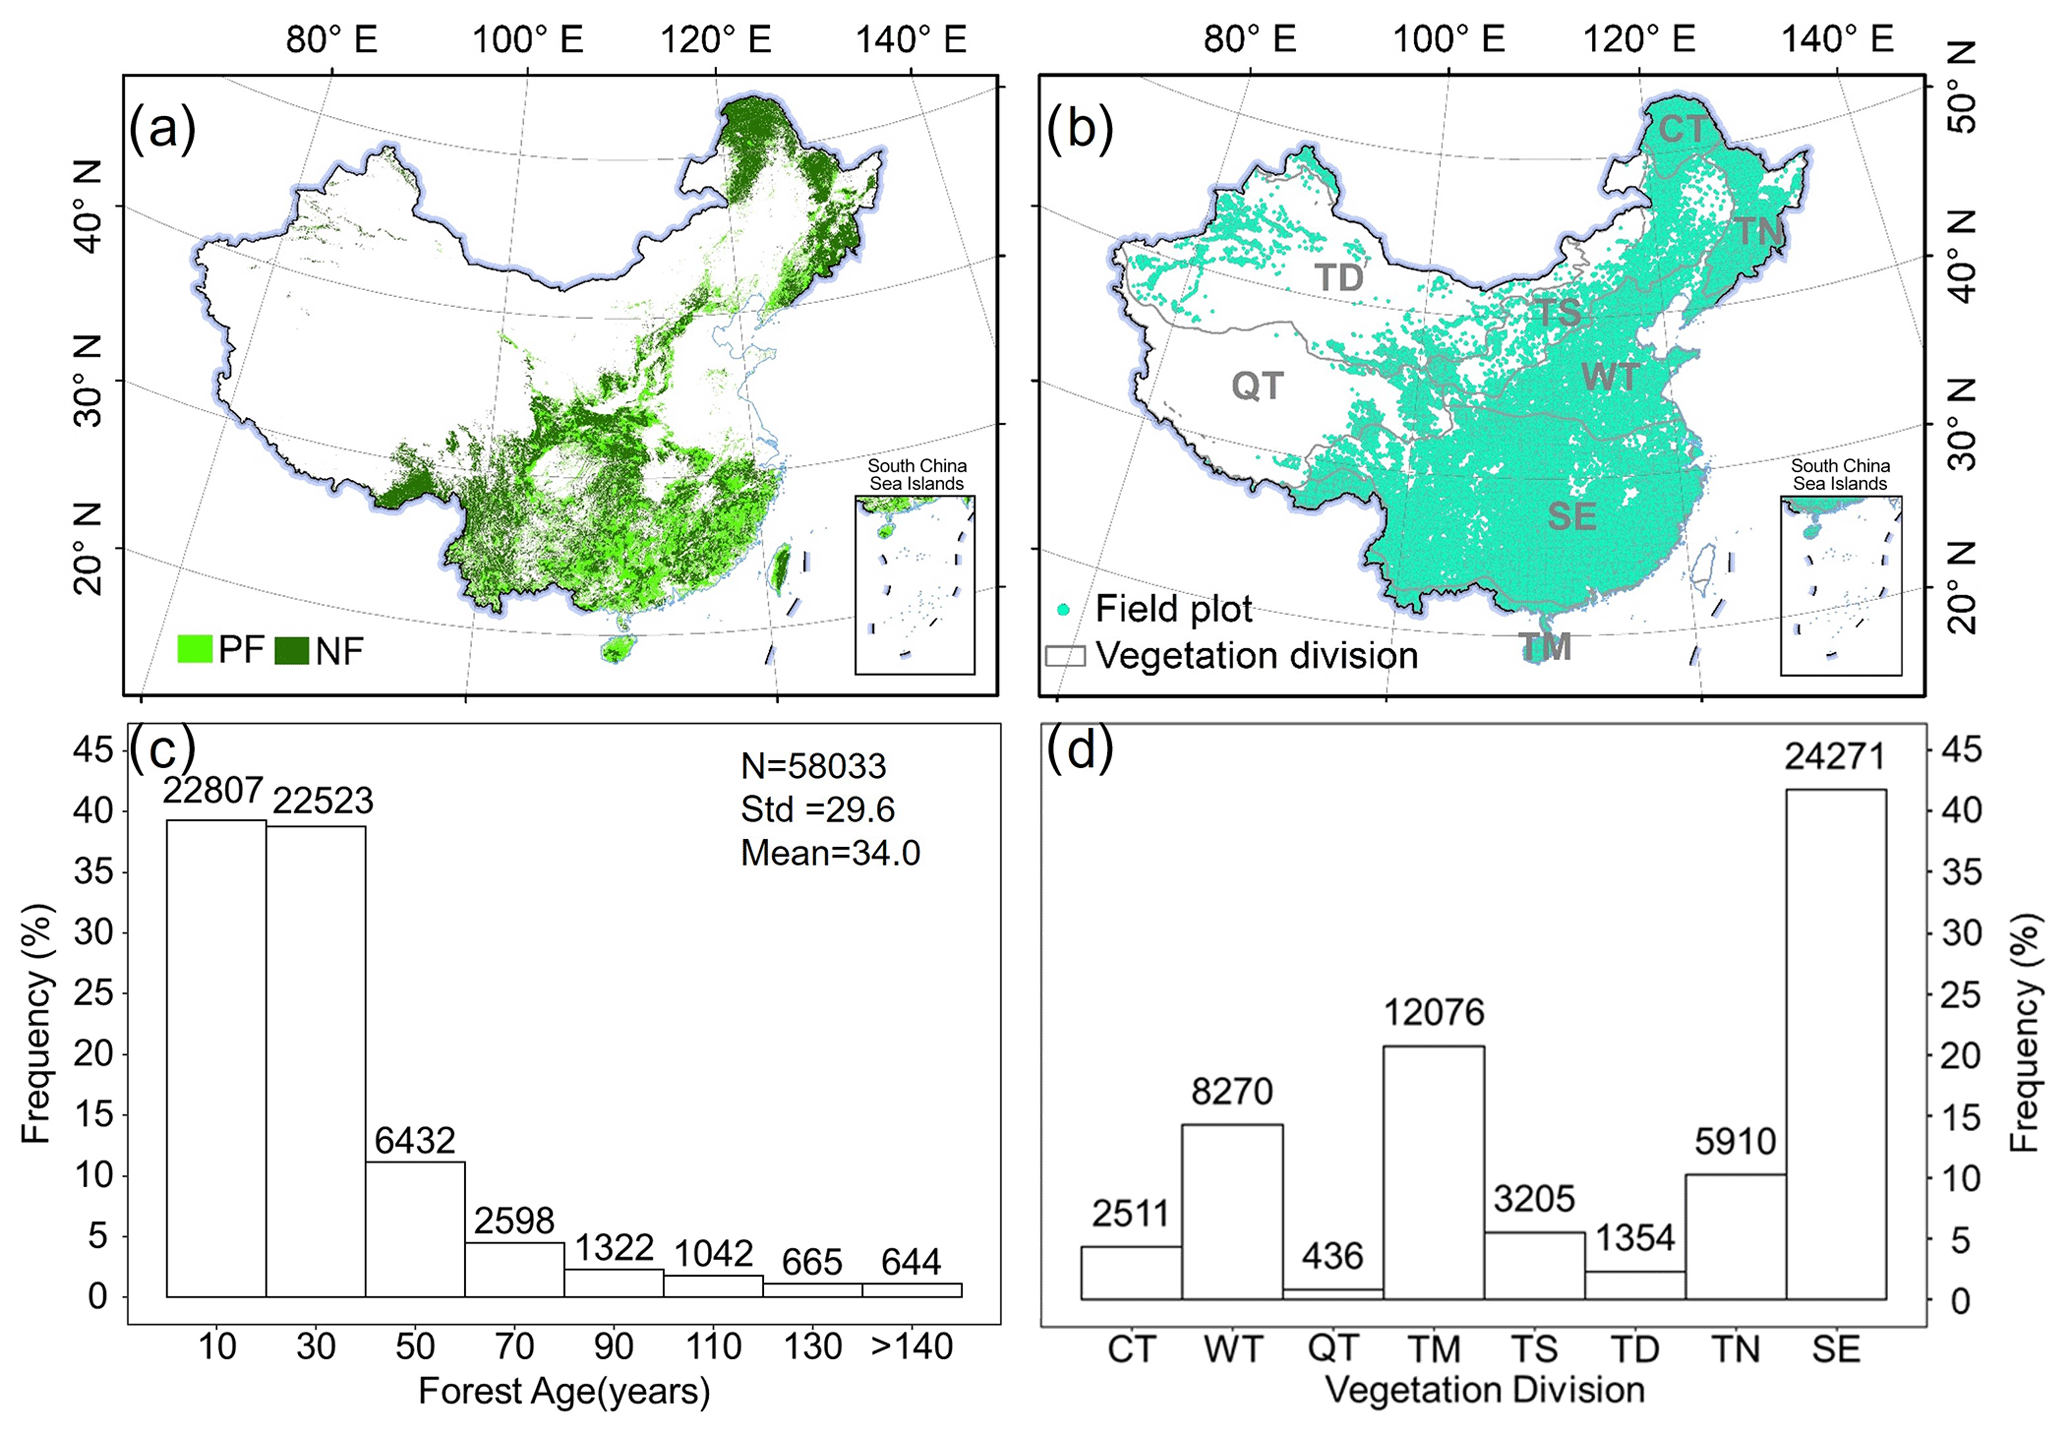
Figure 1Forest mask and field sample distribution. Panel (a) shows planted forest and natural forest mask generated by Cheng et al. (2023b). Panel (b) shows distribution of field samples over eight vegetation divisions. Panel (c) shows frequency distribution of field sample ages. Panel (d) shows frequency distribution of field samples for eight vegetation divisions. PF: planted forest, NF: natural forest, CT: cold temperate needleleaf forest, WT: warm temperate deciduous-broadleaf forest, QT: Qinghai–Tibet Plateau alpine vegetation, TM: tropical monsoon forest–rainforest, TS: temperate steppe, TD: temperate desert, TN: temperate needleleaf–broadleaf mixed forest, SE: subtropical evergreen broadleaf forest, N: the number of plots, Std: standard deviation, Mean: mean age. Publisher's remark: please note that the above figure contains disputed territories.
2.1.2 Landsat time series data
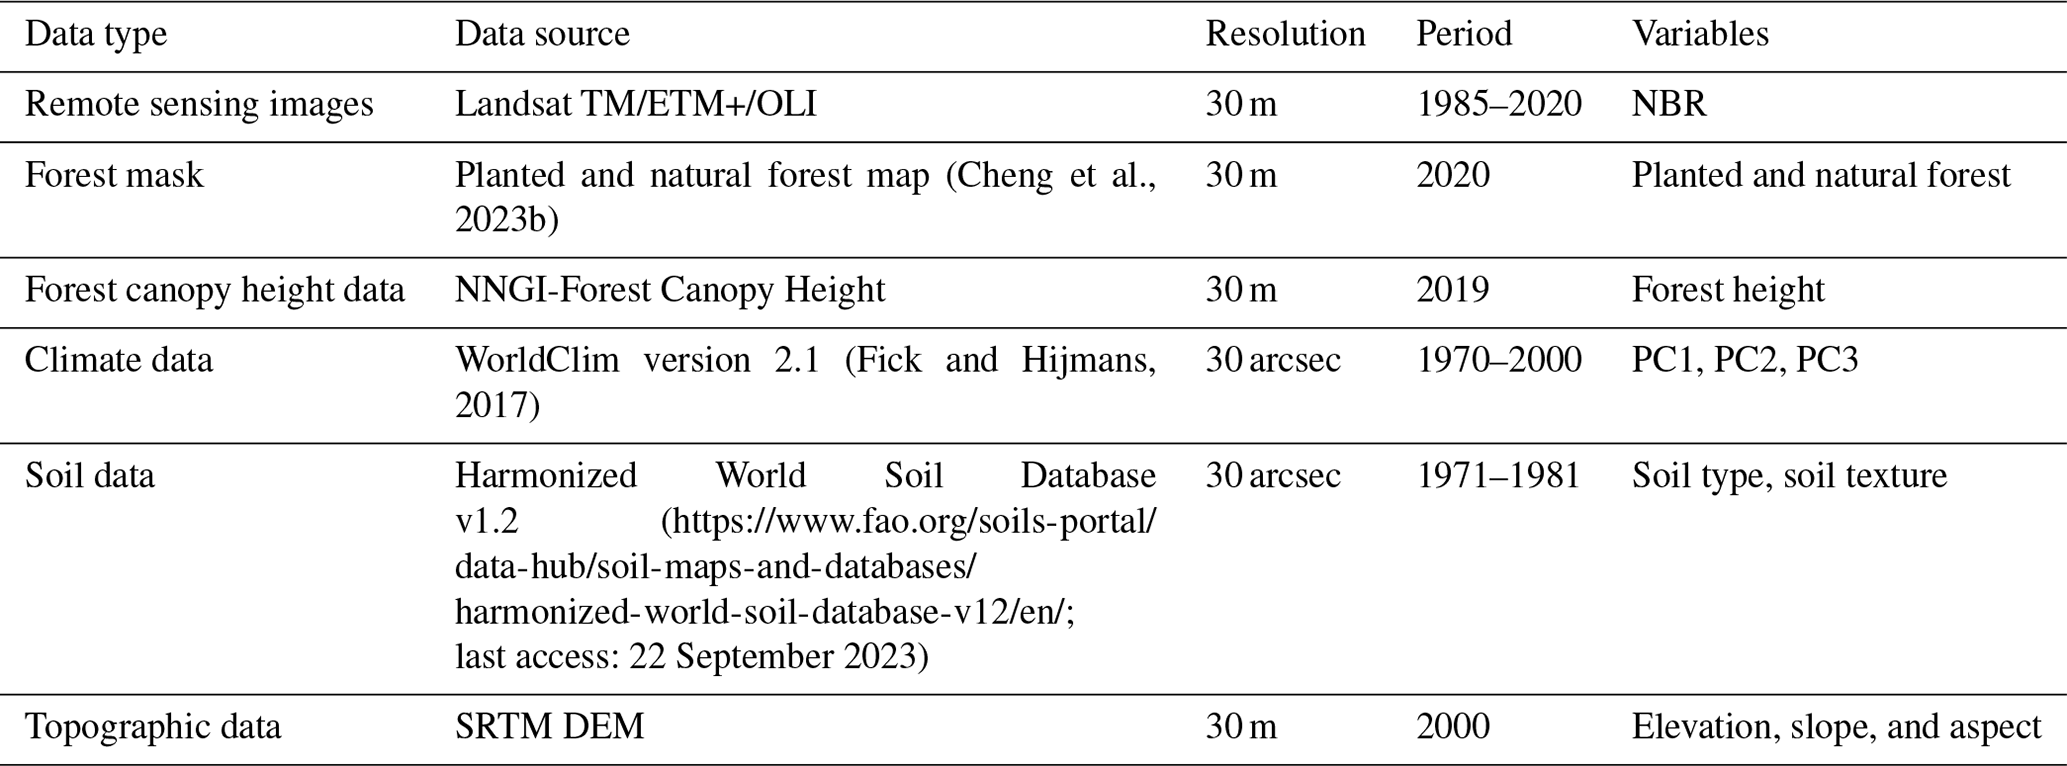
From the GEE platform, we collected Landsat TM, ETM+, OLI Tier 1 surface reflectance images dating from 1985 to 2020 to estimate forest age for disturbed forest regions. All data were atmospherically corrected and processed by the Land Surface Reflectance Code and the Landsat Ecosystem Disturbance Adaptive Processing System algorithms. We removed the clouds or cloud shadows using the C function of the mask algorithm (Du et al., 2023), then we created composited images using a median compositing method for forest regions. Finally, we calculated the normalized burn ratio (NBR) to detect forest disturbance. NBR has been proven effective in numerous studies detecting forest disturbance (e.g., Du et al., 2023; Tian et al., 2023). It is calculated as follows by using the near-infrared (NIR) and shortwave infrared (SWIR) bands:
2.1.3 Forest mask
This study uses the 2020 dataset of planted and natural forests at 30 m resolution in China (Fig. 1a) as a mask for forest age mapping. This dataset is produced by integrating multisource remote-sensing data and a large number of crowdsourced samples, with an overall accuracy of over 80 % (Cheng et al., 2023b). In this study, we employ this dataset as a forest mask and utilize a combination of time series change detection algorithms and MLAs to trace the age of these planted and natural forests.
2.1.4 Forest height data
The canopy height data for China was downloaded from https://3decology.org/ (last access: 22 September 2023), which was generated based on deep learning by integrating Global Ecosystem Dynamics Investigation and Ice, Cloud and Land Elevation Satellite-2 data. This dataset has a spatial resolution of 30 m and corresponds to 2019. The accuracy of this national forest canopy height data was assessed by comparing three independent validation datasets, indicating high accuracy for the canopy height product by neural network guided interpolation (R2≥0.55; RMSE ≤5.5 m) (Liu et al., 2022). Notably, the forest extent used in this dataset is consistent with the forest extent mentioned earlier for planted and natural forests, ensuring spatial consistency when estimating forest age.
2.1.5 Climate data
Climate data were acquired from WorldClim 2.1 (https://worldclim.org/; last access: 22 September 2023), which offers 19 bioclimatic variables, including temperature and precipitation, with 30 arcsec resolution. The 19 bioclimatic variables include annual trends, seasonality, and extreme environmental factors in temperature and precipitation. We resampled the 19 GeoTiff (.tif) files to 30 m resolution using a nearest-resampling method for spatial resolution consistency. To reduce the dimension of bioclimatic variables, we applied a principal component analysis to map the 19 bioclimatic variables into a new principal component (PC) space. We use the first three components PC1, PC2, PC3 to represent the climate factors. According to the results of the analysis, PC1 gives annual trends in temperature and precipitation, PC2 gives seasonal variations in temperature and precipitation, and PC3 gives precipitation and temperature extremes (Table S1 in the Supplement).
2.1.6 Soil data
Soil data with a resolution of 30 arcsec were extracted from the Harmonized World Soil Database v1.2, developed jointly by the Food and Agriculture Organization of the United Nations, the International Institute for Applied Systems, the ISRIC-World Soil Information, the Institute of Soil Science, the Chinese Academy of Sciences, and the Joint Research Centre of the European Commission. As per previous studies, soil type and texture were selected from the soil dataset in this study to construct the model to estimate forest age (Besnard et al., 2021). We also resampled the soil data to 30 m using a nearest-resampling method.
2.1.7 Topographic data
The Shuttle Radar Topography Mission (SRTM) V3 provides global digital elevation data at 30 m resolution and was used in this study to extract topographic variables (Su et al., 2020). Three topographic features – elevation, slope, and aspect – were calculated to estimate forest ages.
Table 1Descriptions of variables used to estimate forest ages in China.
2.2 Forest age estimation
To generate China's forest age map and explore the performance of MLAs to retrieve forest age, we applied two approaches to estimate forest age in China: the MLA approach and the LandTrendr disturbance detection approach. First, the MLA approach estimates ages for forest regions using forest inventory and multisource remote sensing data. Second, the LandTrendr algorithm is applied to detect stand-replacing disturbances based on the Landsat time series images. Third, we use the forest age map detected by LandTrendr to update the forest age map derived using the MLA approach and generate China's forest age map with 30 m resolution. Figure 2 shows a detailed framework for the forest age estimation proposed in this study.
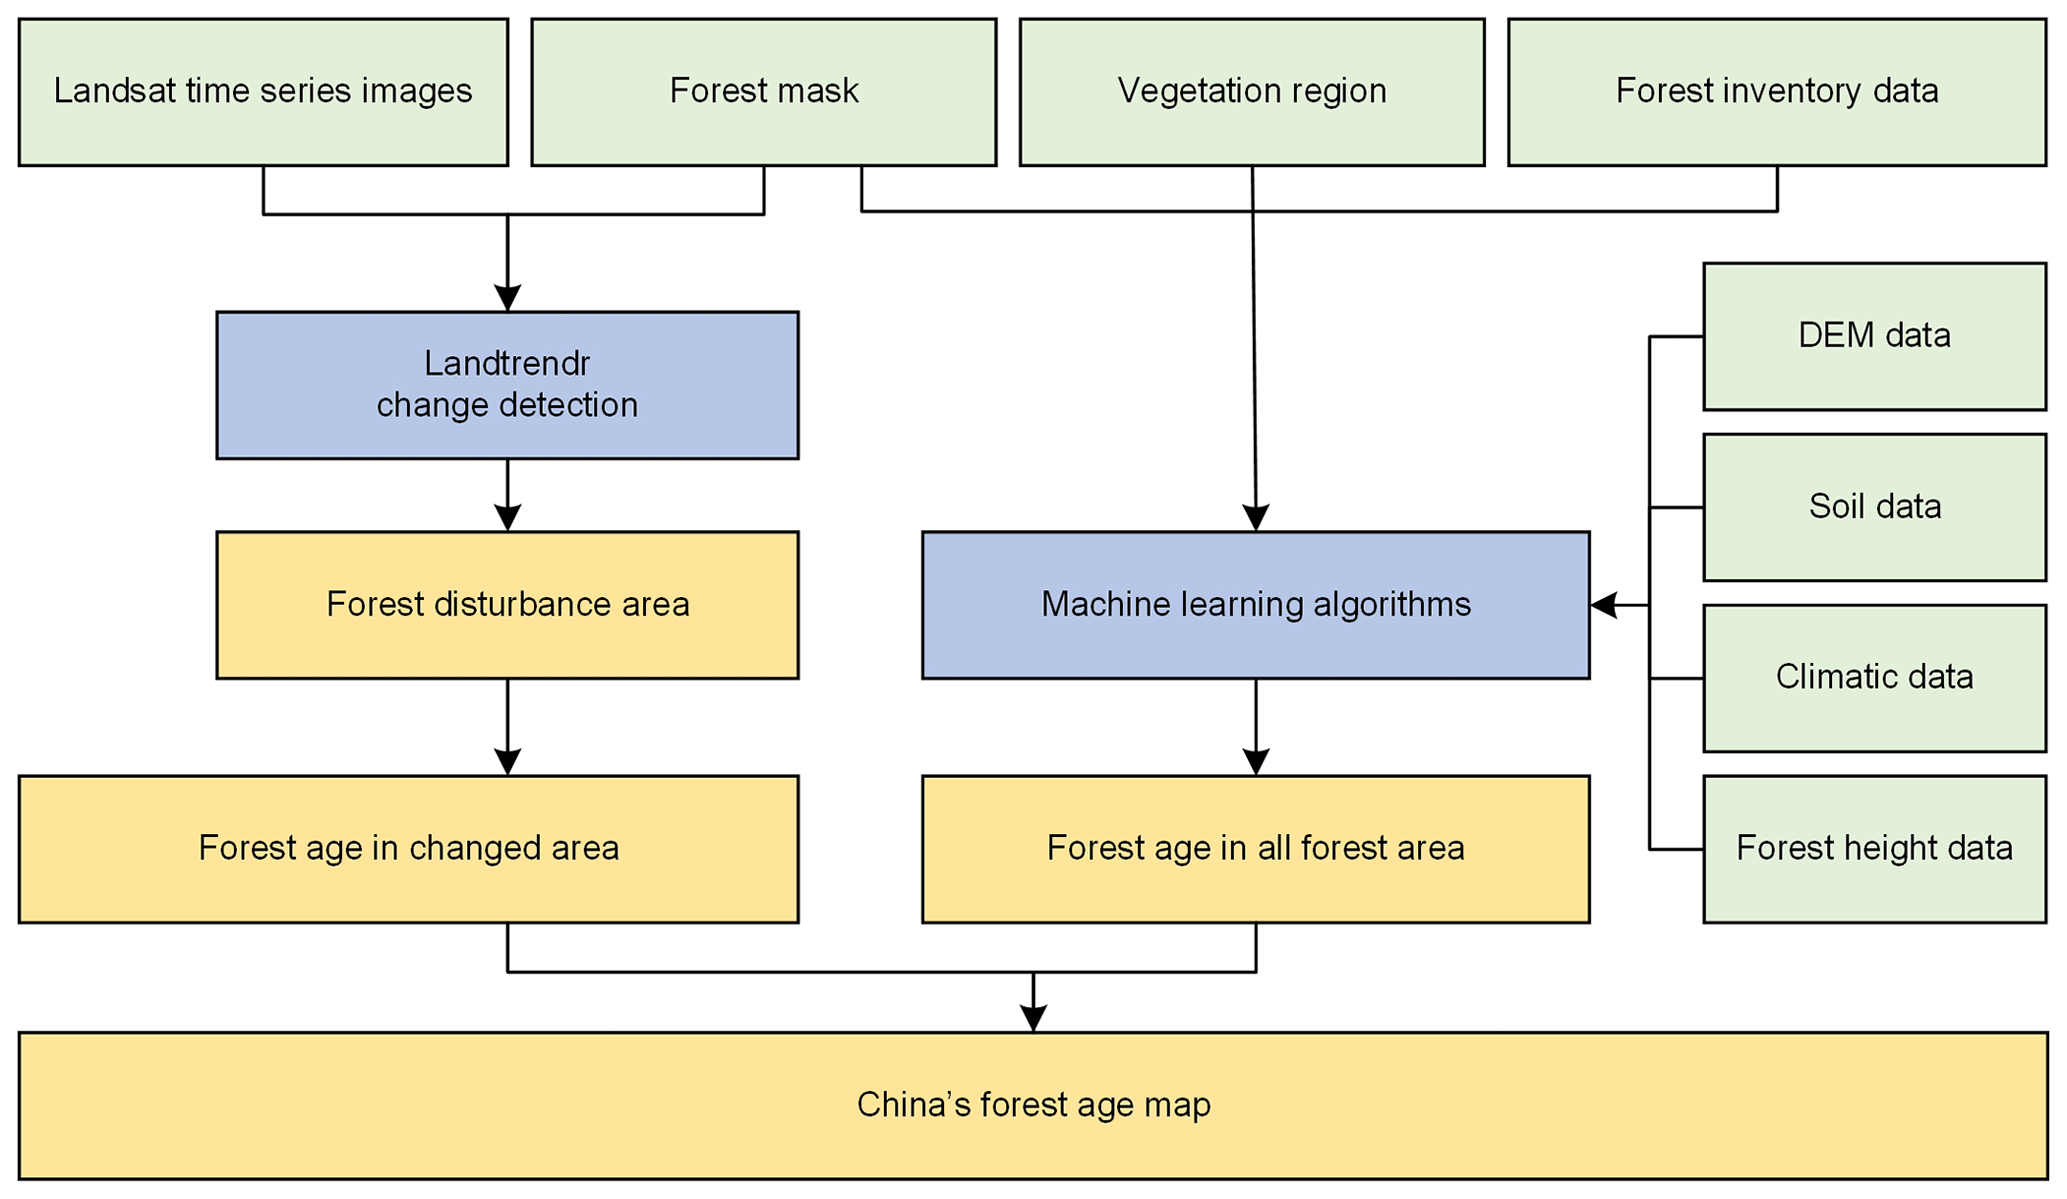
Figure 2Framework of China's forest age estimation (green boxes represent data, blue boxes represent methods, and yellow boxes represent results).
2.2.1 Machine learning approach
The MLA employed in this study comprised the steps described below.
-
MLA selection.
This study used the following model-screening procedure to explore which model works best for each vegetation division: first, we used the automated machine learning (Auto-ML) open-source Python library LazyPredict to filter for alternative models. LazyRegressor (including 40 MLAs) was used to build stand-age estimation models based on all data, which helps to understand which MLA works well without tuning parameters. The performing models with R2 greater than 0.60 in each vegetation division were concentrated in 13 MLAs (Table S2). Second, by splitting training data and testing data, the top three MLAs for each vegetation division were determined (Table S2). It can be found that the potential optimal models of eight vegetation divisions were concentrated in RF, Gradient Boosting Decision Tree (GBDT), Histogram Gradient Boosting (HistGradientBoost), Light Gradient Boosting Machine (LightGBM), and Categorical Boosting (CatBoost).
RF is an ensemble learning method that combines multiple decision trees (Breiman, 2001; Dutta et al., 2020). It leverages the wisdom of crowds to make accurate predictions. RF mitigates overfitting and provides robust results by training each tree on a random subset of the data and features (Lavanya et al., 2017; Guo et al., 2019). GBDT is an ensemble technique that builds a strong predictive model by sequentially training decision trees (Jerome, 2001). Each tree corrects the errors of its predecessor (Wei et al., 2019), resulting in a highly accurate and robust model. HistGradientBoost is a variant of GBDT that employs histogram-based techniques. It efficiently approximates data distributions and reduces memory consumption during training. This algorithm is particularly beneficial when dealing with large datasets and complex features (Tesfagergish et al., 2022). LightGBM is a gradient-boosting framework that prioritizes speed and efficiency. It employs a histogram-based approach and parallel computing, making it suitable for large datasets. CatBoost, as a new modification gradient boosting algorithm, is designed specifically for handling categorical features. It automatically encodes categorical variables, simplifying the data pre-processing stage. CatBoost is known for its robustness and efficiency, and it can achieve high accuracy on a small-scale dataset.
We implemented RF, GBDT, and HistGradientBoost by using the Scikit-learn package, while the LightGBM and CatBoost algorithms were constructed by using the lightgbm and catboost packages in Python 3.9.11.
-
Hyperparameter tuning.
Hyperparameter tuning of MLAs is critical in the ML model training process because it significantly enhances the model's performance, generalization capability, and adaptability (Sandha et al., 2020). Bayesian optimization has been selected for hyperparameter tuning due to its complicated derivative evaluation and non-convex-function-related features (Mekruksavanich et al., 2022). It is implemented by using Optuna, an open source hyperparameter optimization framework to automate hyperparameter searches (Akiba et al., 2019). The hyperparameters and their searching range in MLAs are listed in Table S3.
-
Model interpretation.
We used Shapley Additive explanations (SHAP) values (Lundberg and Lee, 2017; Lundberg et al., 2019), a model-agnostic technique for interpreting ML models, to explore functional correlations between the variables and forest age (Besnard et al., 2021). SHAP derives the Shapely additive contribution values from coalitional game theory (Kim et al., 2023). By examining the contribution of each input variable to the model's output, SHAP can identify the primary drivers of the model's predictions and provide insights into the underlying causes that influence forest age (Sun et al., 2023). The higher the SHAP value, the larger the contribution of the variable. Here SHAP value was calculated through shap package in Python 3.9.11.
2.2.2 LandTrendr disturbance detection approach
LandTrendr was designed to detect and analyze changes in surface features, particularly disturbances and recovery processes, and is commonly applied to multispectral remote sensing imagery from the Landsat satellite series to capture long-term forest disturbances (Du et al., 2022). Using LandTrendr to detect forest age involves the following steps:
-
Time series data transformation.
LandTrendr transforms multiple temporal remote-sensing image datasets into a series of indices, such as the NBR.
-
Breakpoint detection.
Using the generated time series indices, LandTrendr retraces from the 2020 state to search breakpoints in the time series. These breakpoints represent transition points in the time series, indicating instances of surface disturbance or recovery.
-
Age estimation.
By pinpointing breakpoints, the time of occurrence for each breakpoint is established. Forest age estimates for the current location are accomplished by subtracting the breakpoint time from the latest time.
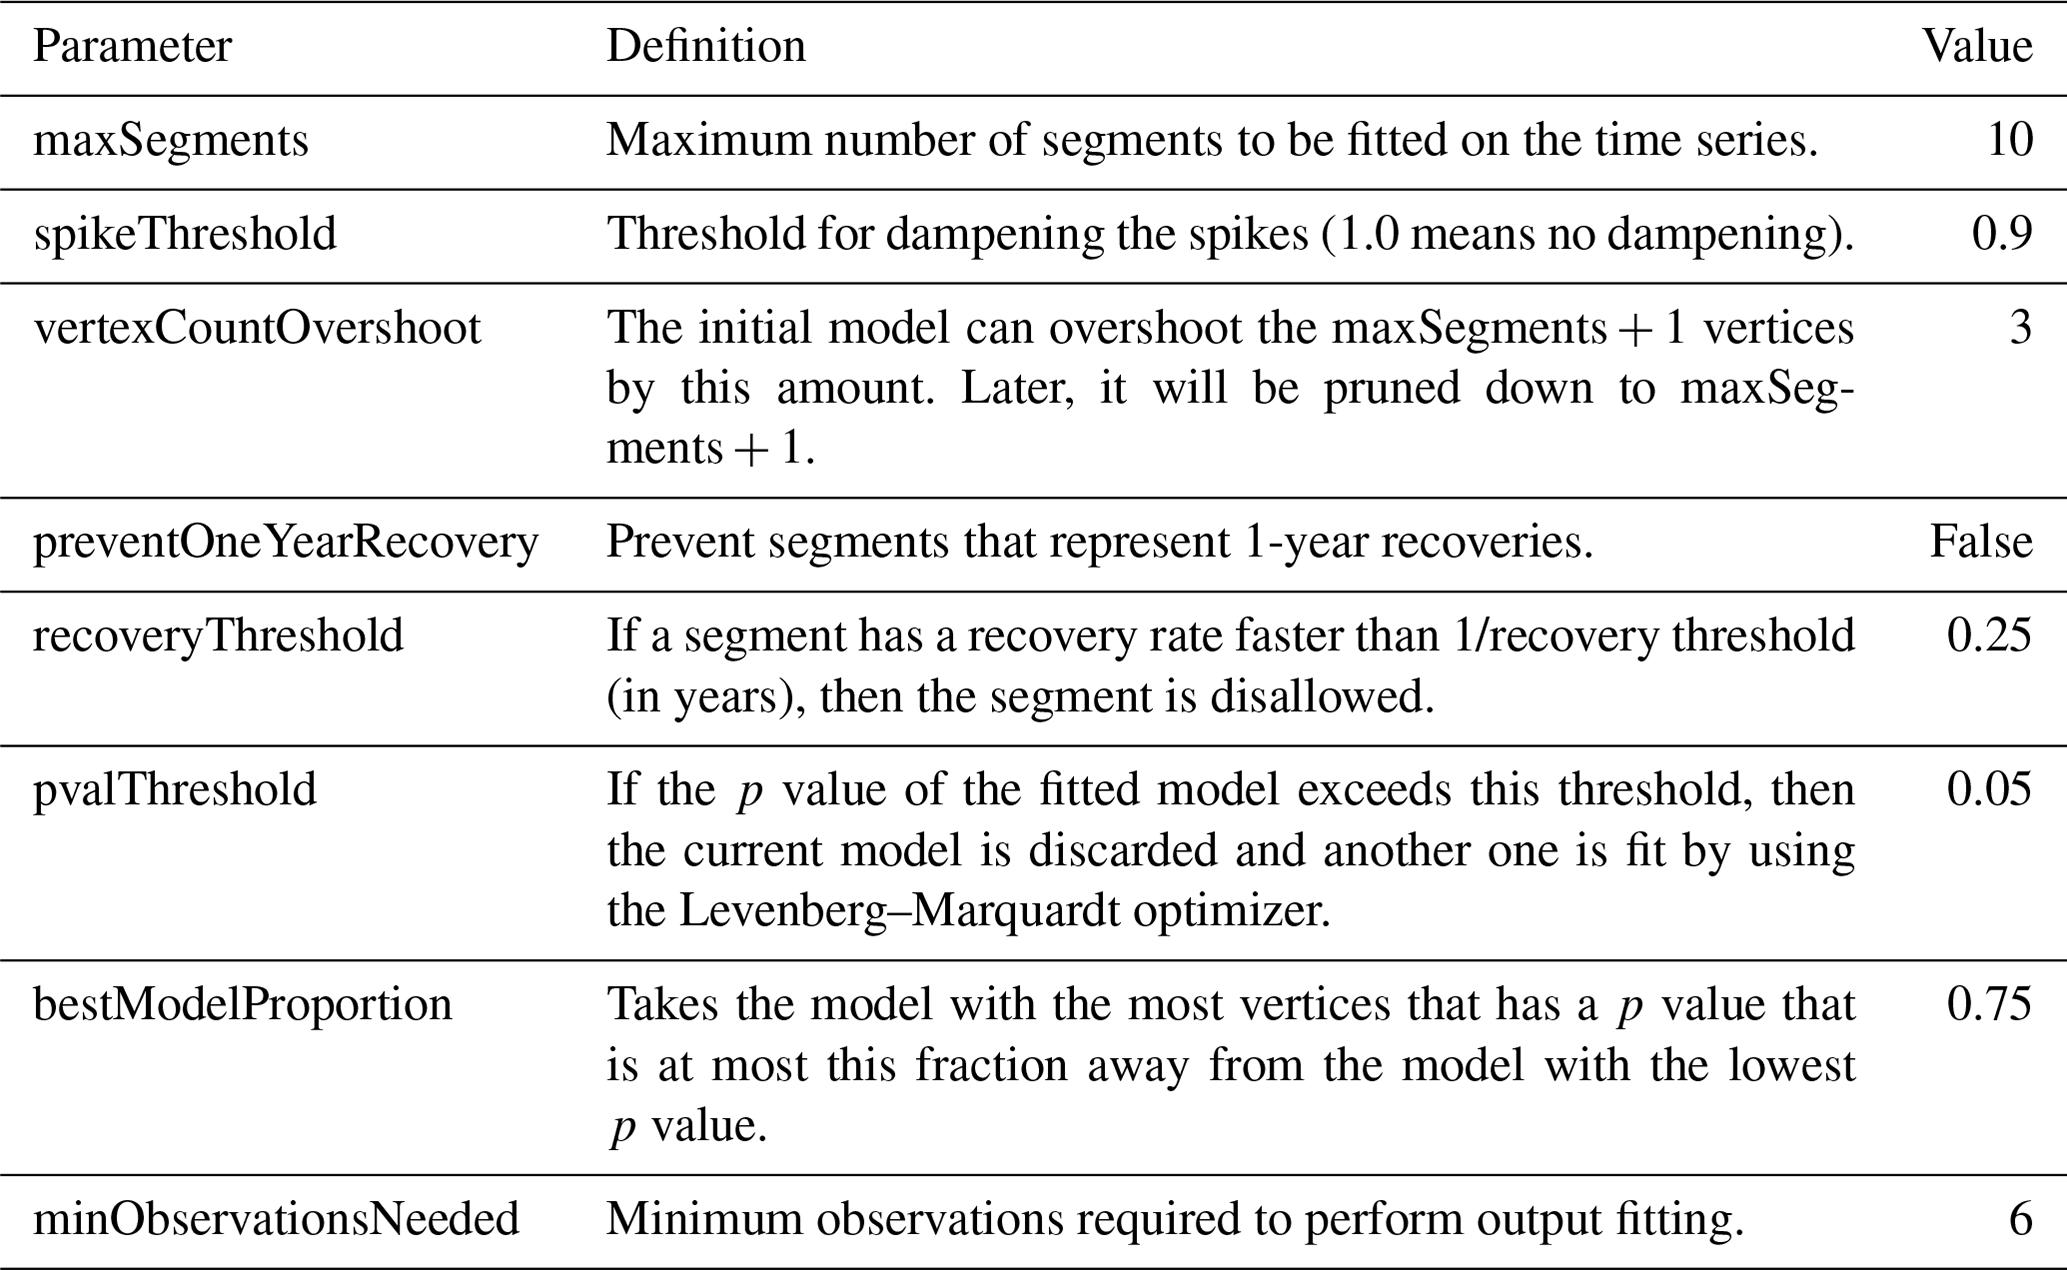
LandTrendr was implemented on the GEE platform by using the function of runLT() provided by the LT_GEE API (Kennedy et al., 2018). Table 2 lists the main input parameters.
2.2.3 Mapping China's forest age
Given the extensive forest coverage in China, it is challenging to handle such large forest area for ML and the LandTrendr algorithm to estimate forest age, even with our vegetation zoning efforts. To enhance the efficiency of forest age estimation and conserve computational resources, we have divided China into 1∘ × 1∘ grids (see Fig. S2 in the Supplement), limiting ML and LandTrendr algorithms to estimate forest age within each grid. Subsequently, we merge the predictive results from each grid using the Mosaic New Raster tool in ArcGIS Pro 3.0 to obtain a nationwide forest age map. Finally, the forest age map estimated through the LandTrendr algorithm is applied to update the ML-based results to produce China's forest age data.
2.3 Accuracy assessment
2.3.1 Comparison with field samples
We collected field samples through two sources to validate the generated final forest age map. The first source is the forest inventory samples independent of training data. The second source involves validation samples obtained from the literature. To ensure that the samples collected were representative, we excluded samples dated before 2010. As validation metrics, we used the coefficient of determination (R2), the root mean square error (RMSE), the mean absolute error (MAE), and the mean error (ME). These metrics are calculated as
where yi is the observed value for the ith analytic tree, is the predicted value of the ith observed value, n is the number of trees, and is the mean of the observed value.
2.3.2 Comparison with existing forest age data
To make our forest age map more reliable and comparable, we also downloaded a global forest age data product produced by Besnard et al. (2021), which is the only forest age map that is publicly accessible covering all of China's forests. Then, we resampled our result to the same resolution as this global map and compared our resultant forest age map with it by assessing their differences in each cell. Additionally, we collected estimated average forest ages in China from previous studies, using these statistical numbers to further validate our estimation.
3.1 MLA performance for China's forest age estimation
Through a rigorous hyperparameter-optimization process and independent validation, four distinct MLAs (RF, GBDT, LightGBM, and CatBoost) were selected across eight different vegetation divisions (Table 3). GBDT performed exceptionally well for estimating the forest age of cold temperate needleleaf forest (CT) vegetation zone, producing an R2 of 0.47 and an RMSE of 4.95 years (MAE = 17.99; ME ). RF excelled at estimating the forest age of warm temperate deciduous-broadleaf forest (WT) vegetation zone, producing an independent validation an R2 of 0.61 and an RMSE of 3.47 years (MAE = 9.13; ME ). CatBoost consistently demonstrated strong performance for the Qinghai–Tibet Plateau alpine vegetation (QT), tropical monsoon forest–rainforest (TM), temperate steppe (TS), temperate desert (TD), and subtropical evergreen broadleaf forest (SE) zones, with R2 values ranging from 0.57 to 0.85 and RMSE values from 2.04 to 7.65 years. LGBMRegressor was the preferred choice in the temperate needleleaf–broadleaf mixed forest (TN) vegetation division, yielding an R2 of 0.63 and an RMSE of 4.14 years.
Table 3MLAs for eight vegetation divisions and their validation metrics.
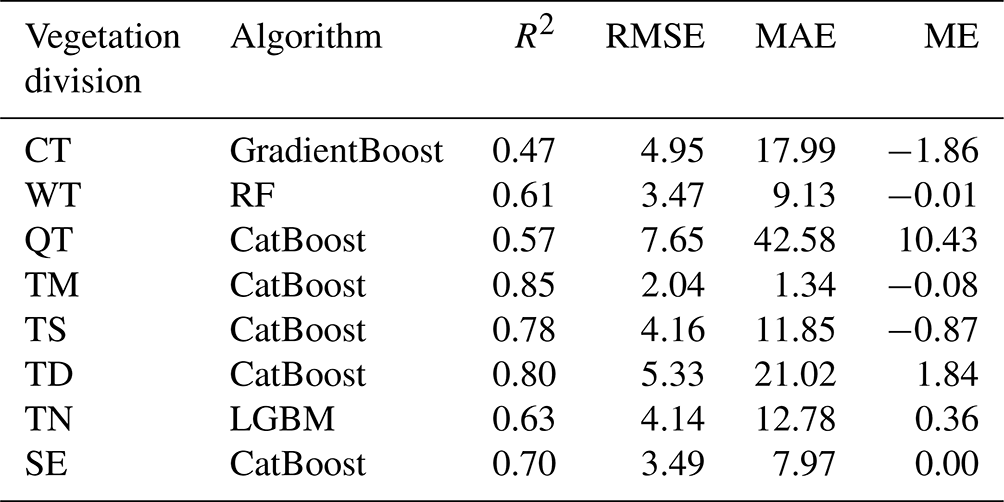
CT: cold temperate needleleaf forest, WT: warm temperate deciduous-broadleaf forest, QT: Qinghai–Tibet Plateau alpine vegetation, TM: tropical monsoon forest-rainforest, TS: temperate steppe, TD: temperate desert, TN: temperate needleleaf-broadleaf mixed forest, SE: subtropical evergreen broadleaf forest.
We further analyzed the factors influencing the forest age estimation in each vegetation division, and the findings are illustrated in Fig. 3. While the prioritization of factors affecting forest age estimation varies across different vegetation divisions, canopy height is unquestionably the predominant factor influencing this estimation. Its absolute value is the highest of the CT, WT, TN, TS, and TM vegetation zones (Fig. 3). Moreover, it is among the top three most influential factors in all the remaining vegetation zones. Subsequently, topographical conditions assume prominence, with elevation consistently featuring among the top three factors in the SHAP value across all vegetation divisions. In the TD vegetation division, elevation becomes the most influential factor. Climate factors earn third-tier consideration, particularly in the SE vegetation zone, where the impact of PC2 of the climate factors surpasses that of both canopy height and topographical conditions. In the other vegetation divisions, the influence of climate factors generally falls to the mid-range. In contrast, across all eight vegetation divisions, factors related to soil, such as soil type and soil texture, do not exert a pronounced influence on forest age estimation.
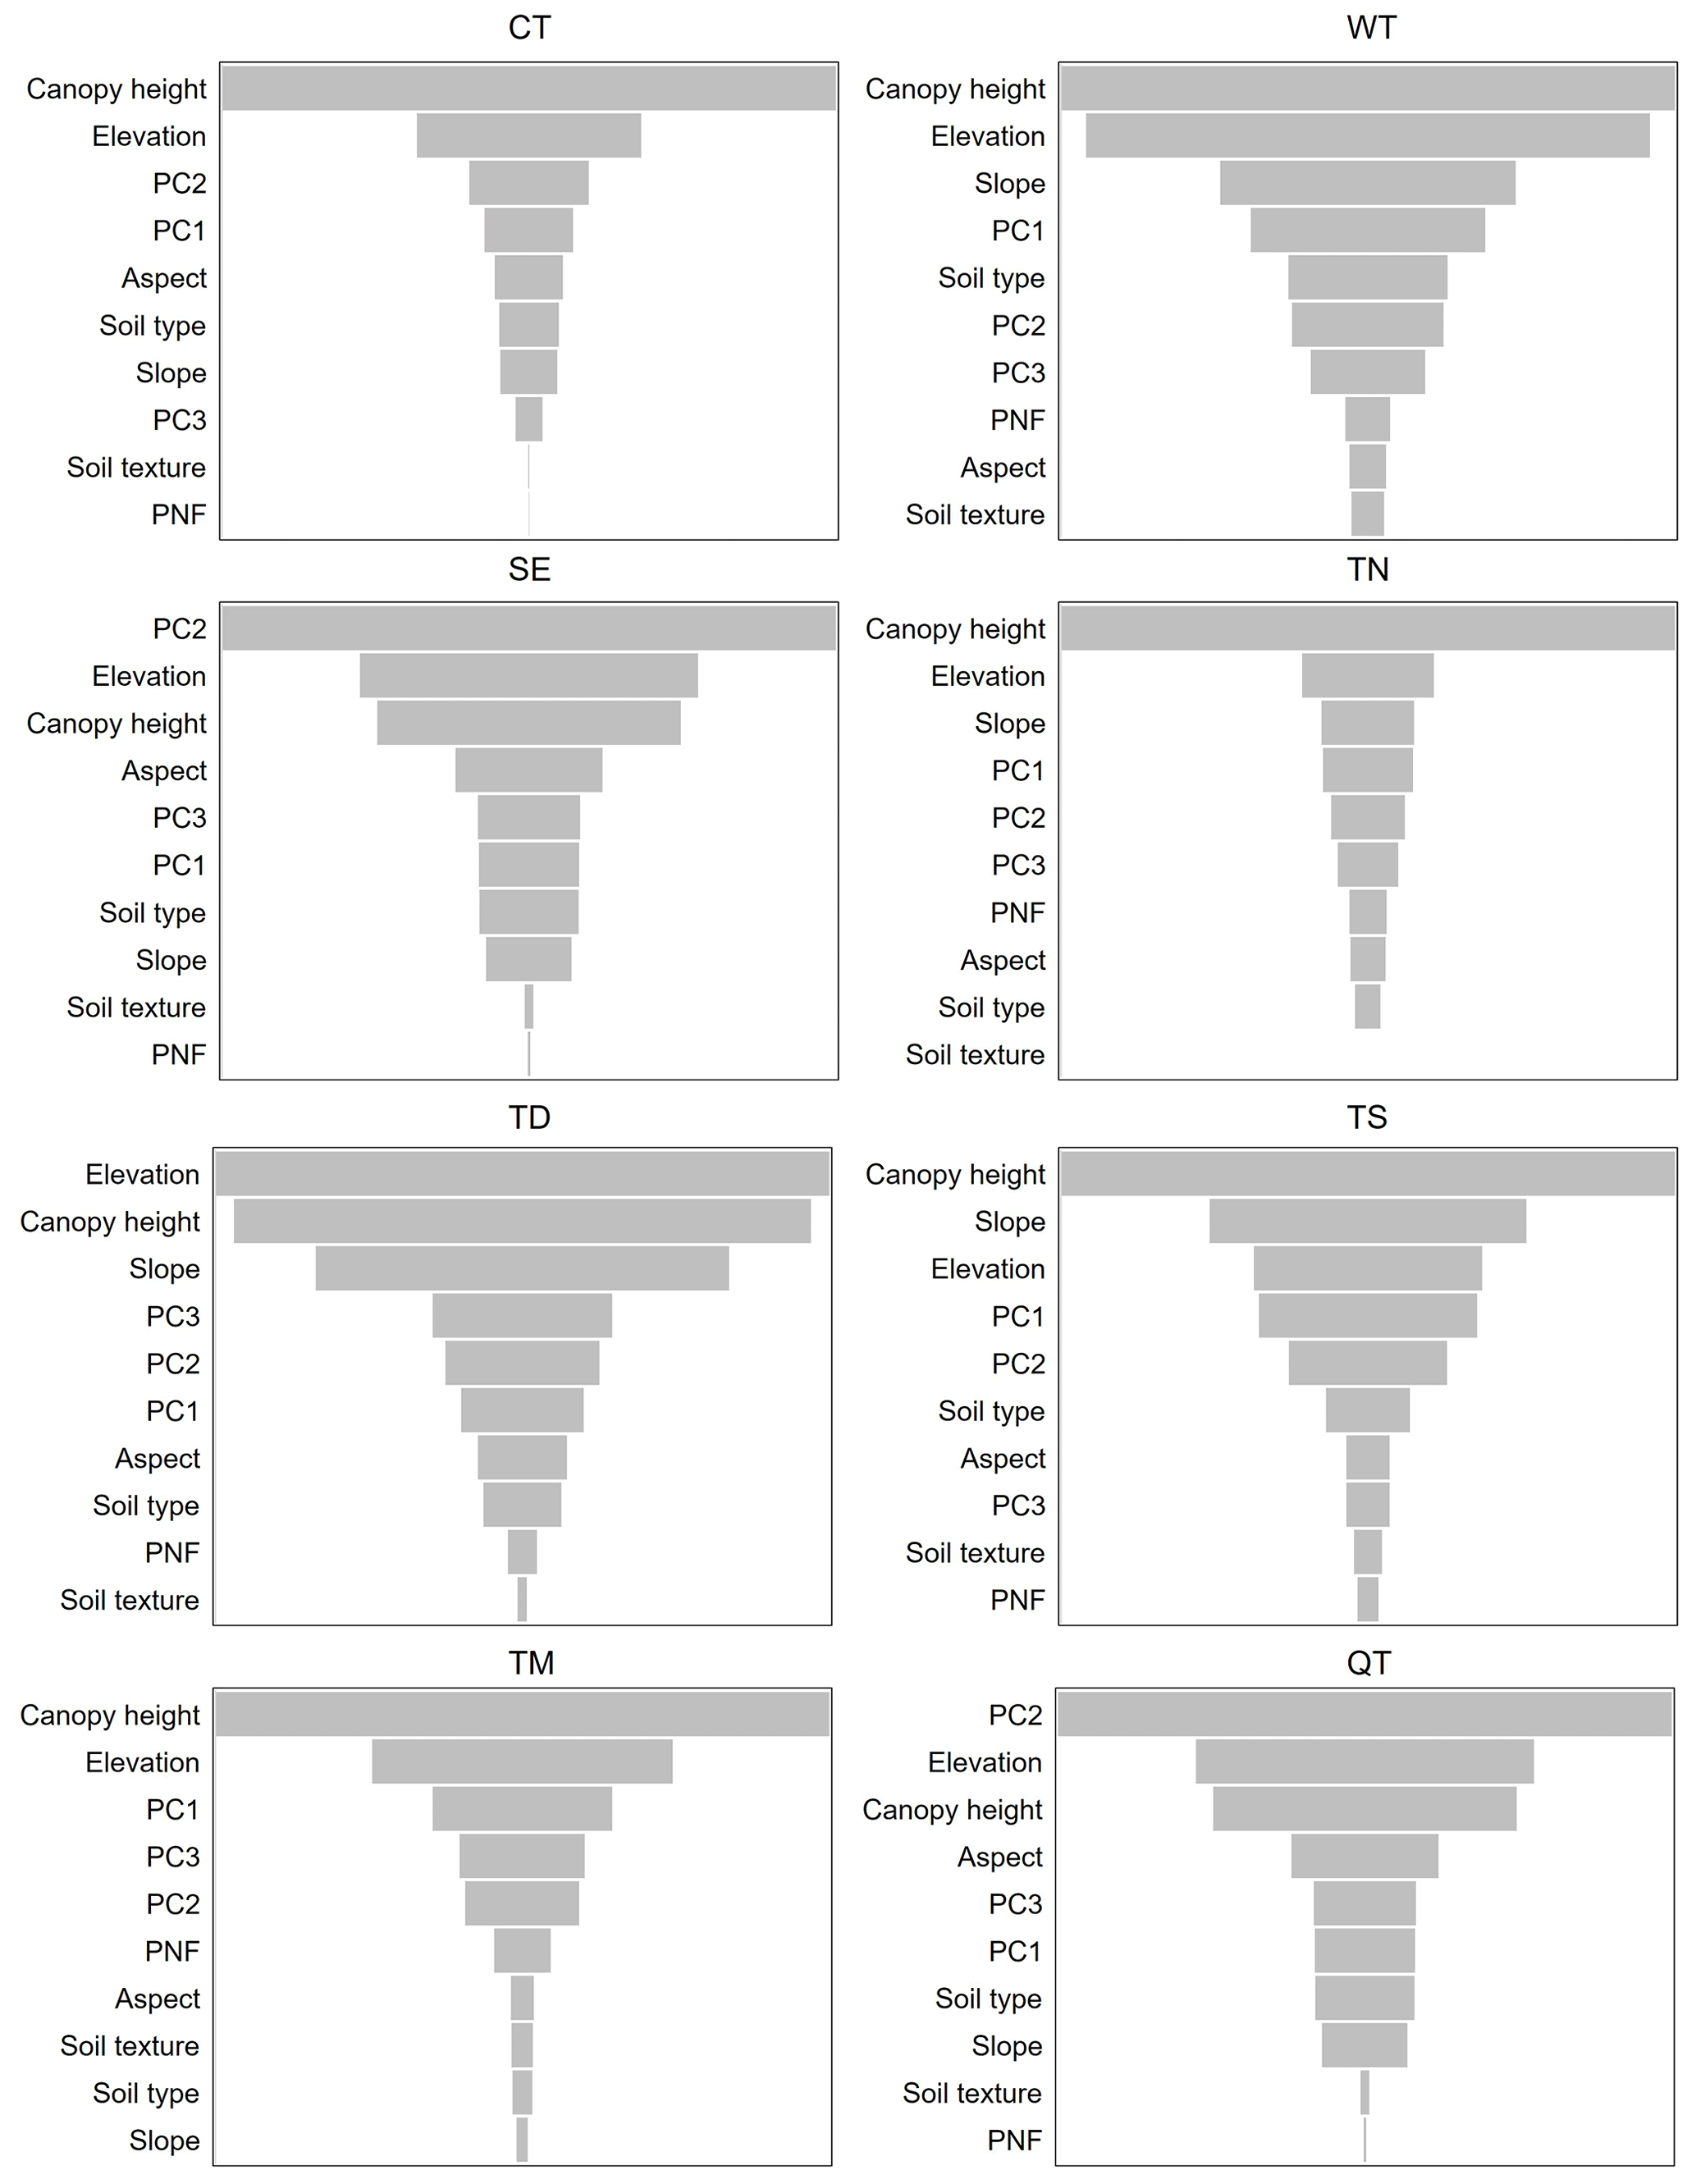
Figure 3Order of shape values of factors affecting the estimation of forest age in different vegetation zones.
3.2 China's forest age map
Based on the optimal MLAs and the LandTrendr change detection algorithm, we have obtained forest age data for China as shown in Fig. 4. Figure 4a presents the nationwide distribution of forest age as estimated by MLAs, whereas Fig. 4b displays the age distribution from 1985 and 2020 as determined through change detection. The results reveal that reforestation activities from 1985 and 2020 are primarily situated in southern, southeastern, and northern China, aligning with the findings of Xiao et al. (2023). Furthermore, estimates derived from MLAs indicate that old-growth forests are primarily located in the northeast and southwest regions of China.
The final forest age map for China obtained in this study is depicted in Fig. 4c. Statistically, the mean of the estimated China's forest age is 56.11 years with a standard deviation of 32.67 years. Geographically, forests in northeast and southwest China are relatively older than those in other regions (Fig. 4c). At the provincial scale, the average forest age ranges from 3.9 to 116.8 years (Fig. 5a; Table S6), whereas Qinghai Province has the highest mean forest age and Hong Kong has the lowest mean forest age. Forest ages in Sichuan Province are more varied than in other provinces (Fig. 5a). On the regional scale, the QT vegetation zones have the oldest forests with an average of 138.0 years, followed by CT (107.6 years), TS (107.0 years), TN (68.3 years), TD (60.3 years), TM (53.0 years), and SE (49.2 years) (Fig. 5b; Table S7). The WT vegetation zones have the youngest forests (28.5 years).
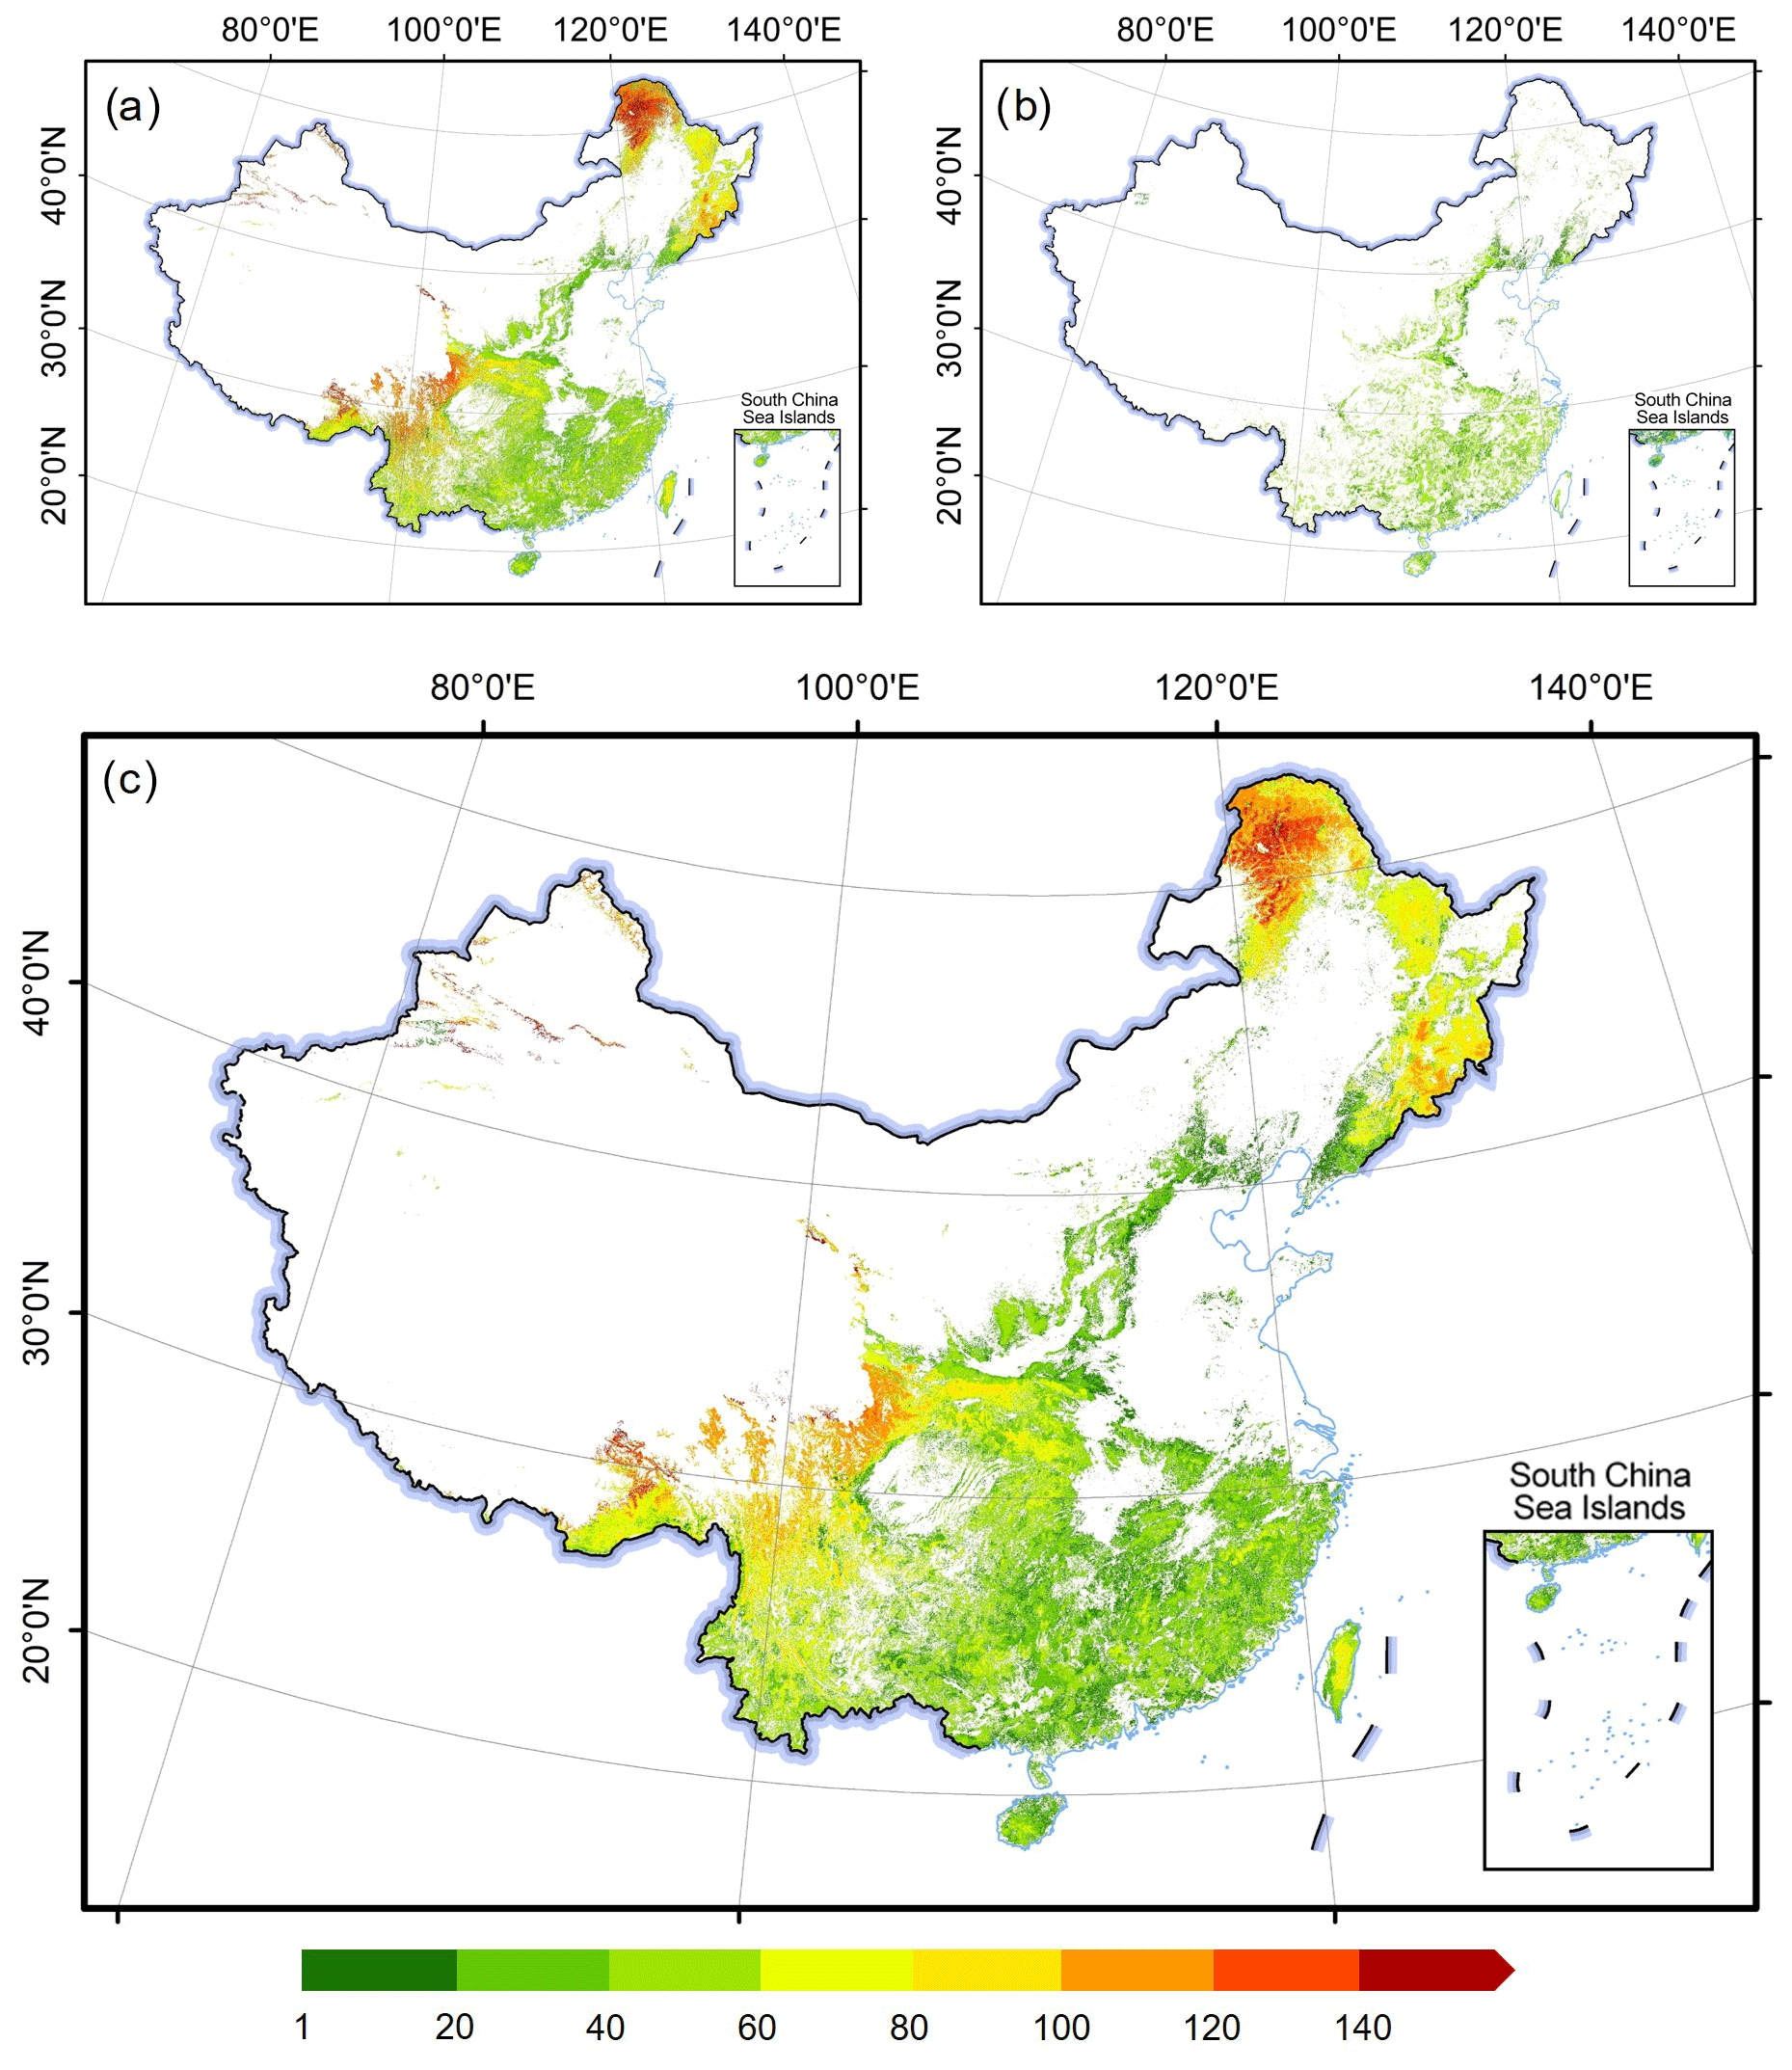
Figure 4Forest age with 30 m resolution estimated from LandTrendr (a), MLAs (b), and China's final forest age distribution (c). Publisher's remark: please note that the above figure contains disputed territories.
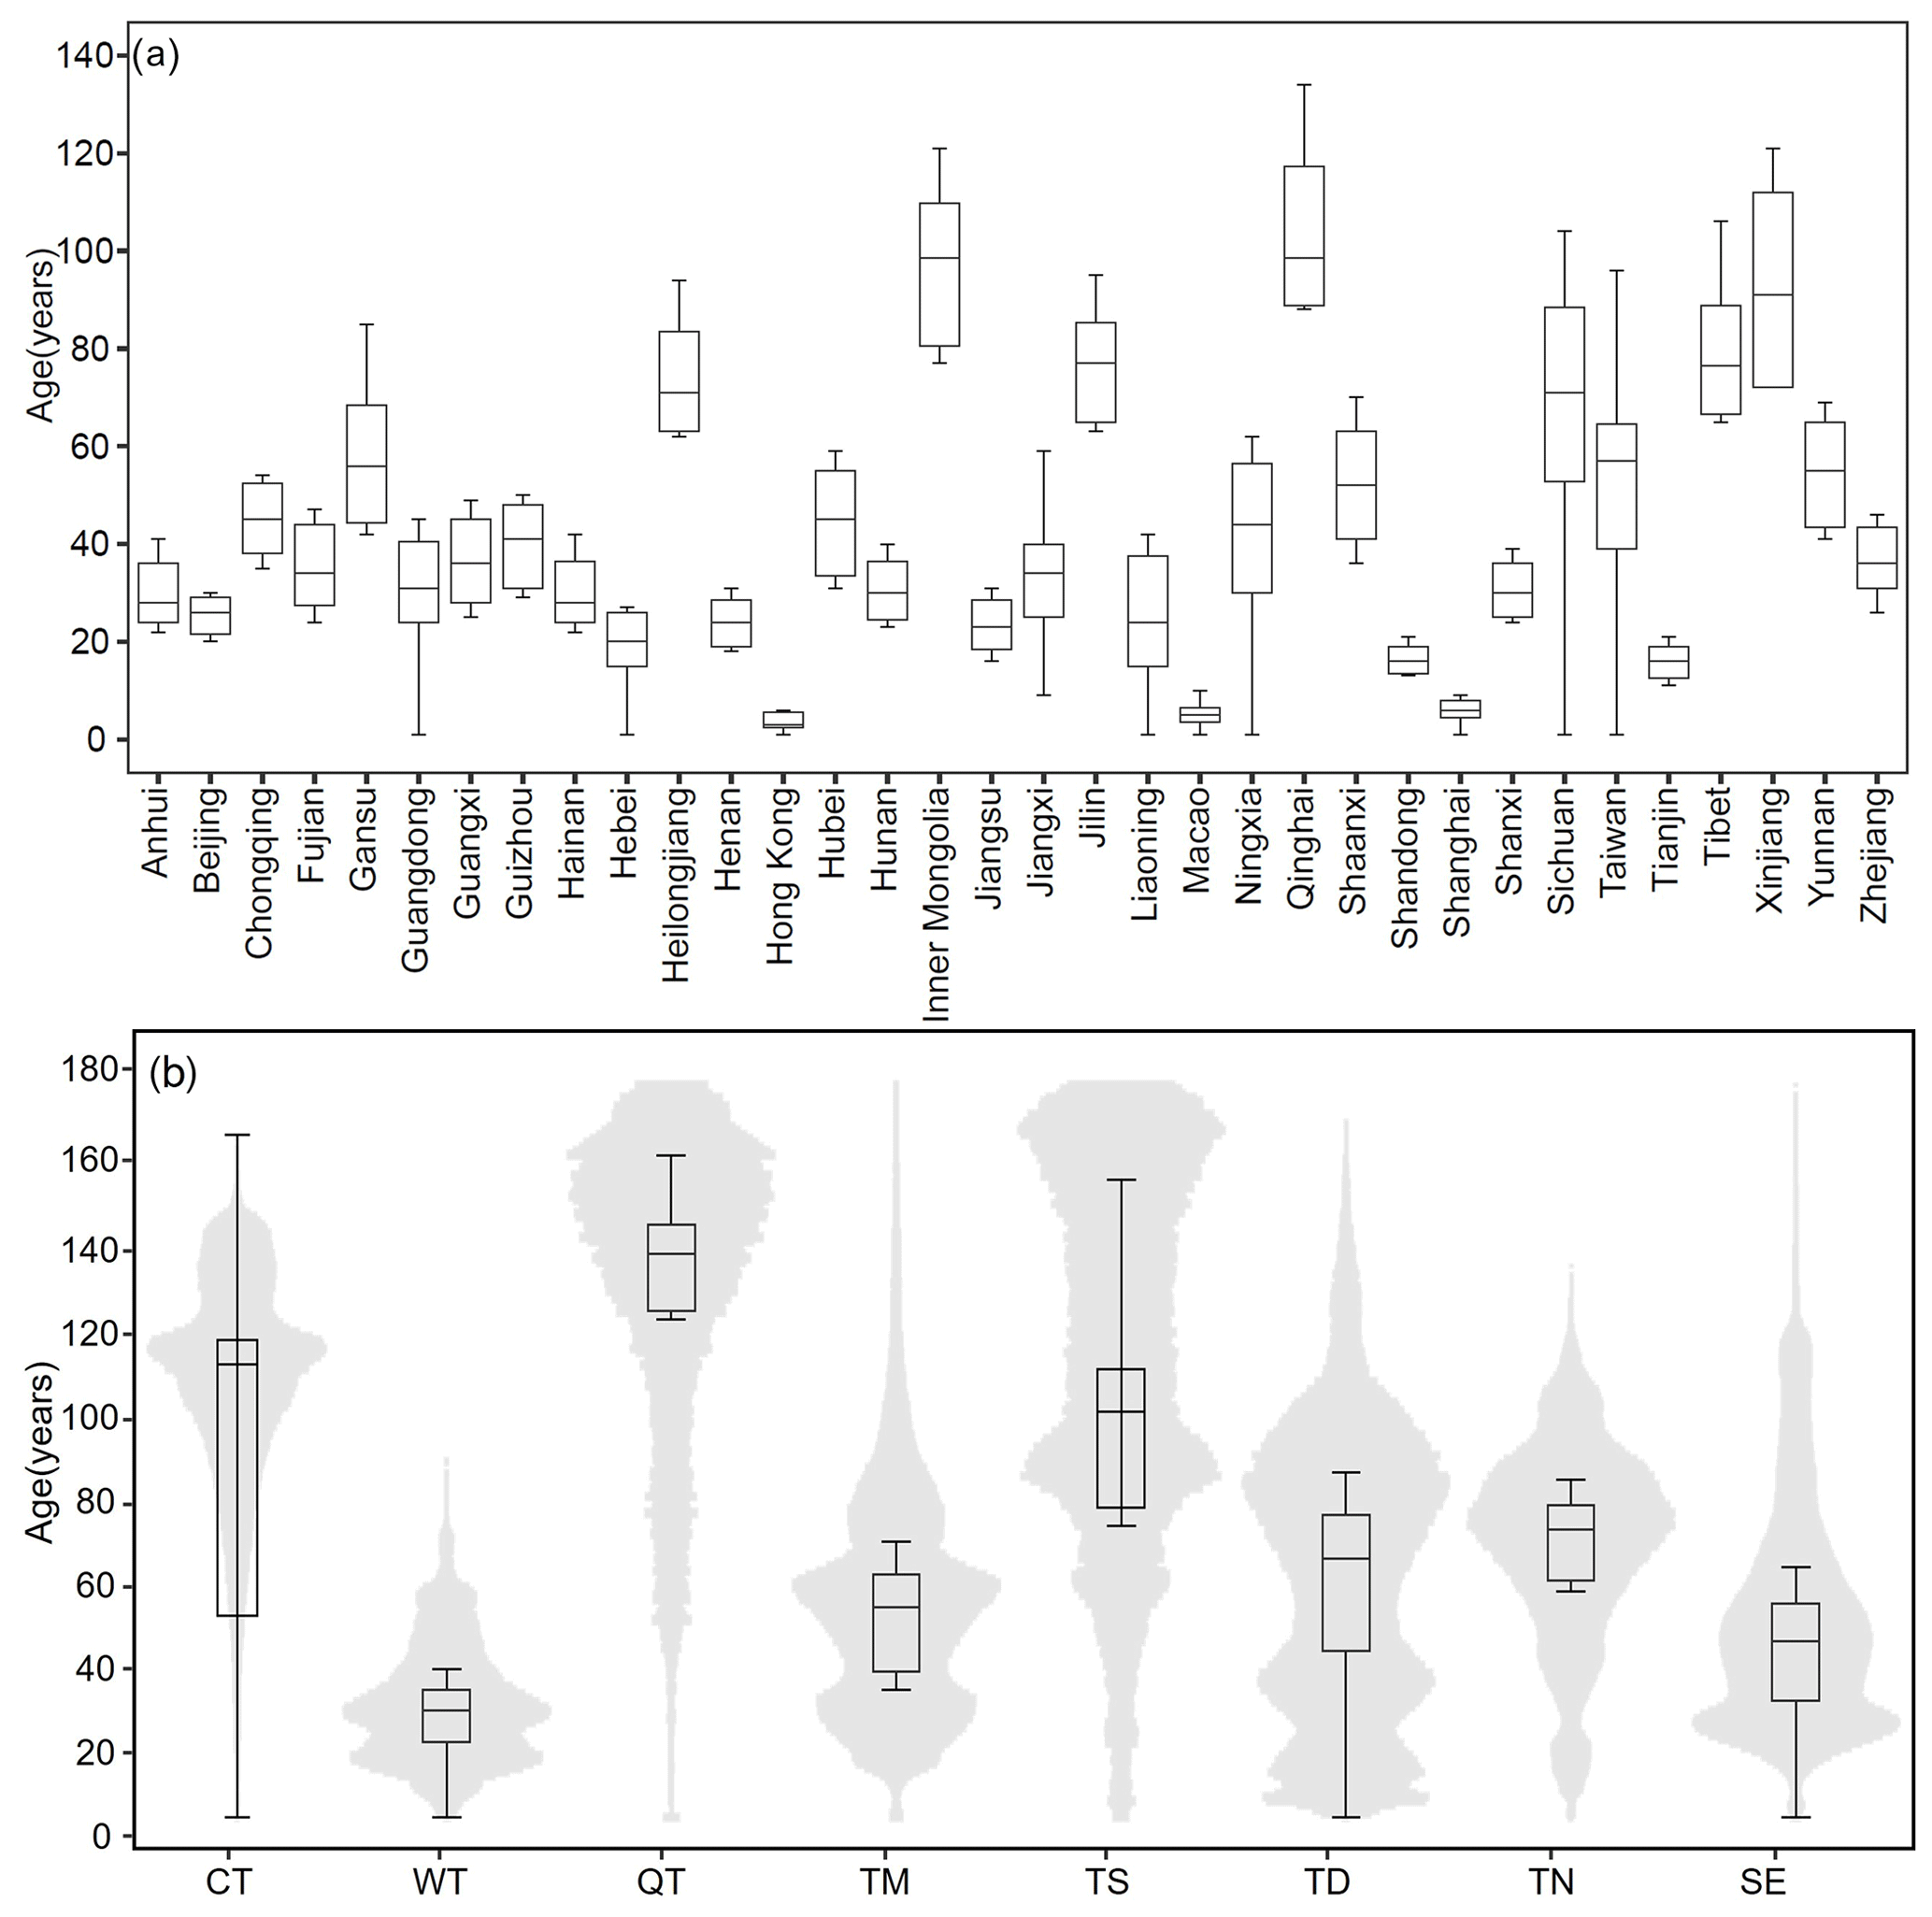
Figure 5Panel (a) is a box plot of China's forest age grouped by provinces and (b) is a violin plot of the forest age grouped by vegetation divisions.
3.3 Evaluation
3.3.1 Comparison with field samples
We initially validated the forest age estimations by using forest inventory data. The forest inventory samples were acquired from 2004 to 2008. To align with the time frame of the forest age data obtained in this study, we shifted the predicted values corresponding to each sample forward by ∼16 years. This strategy allows us to compare them with the inventory-measured forest ages. Figure 6a shows the comparison, which suggests that they have a significant linear relationship with R2=0.51 (Fig. 6a). We collected 99 field measurements of mean forest stand age after 2010 from published papers (Table S8) and compared them with our estimated results. Figure 6b shows that the predicted forest ages also present a significant linear relationship with field measurements, with R2=0.62.
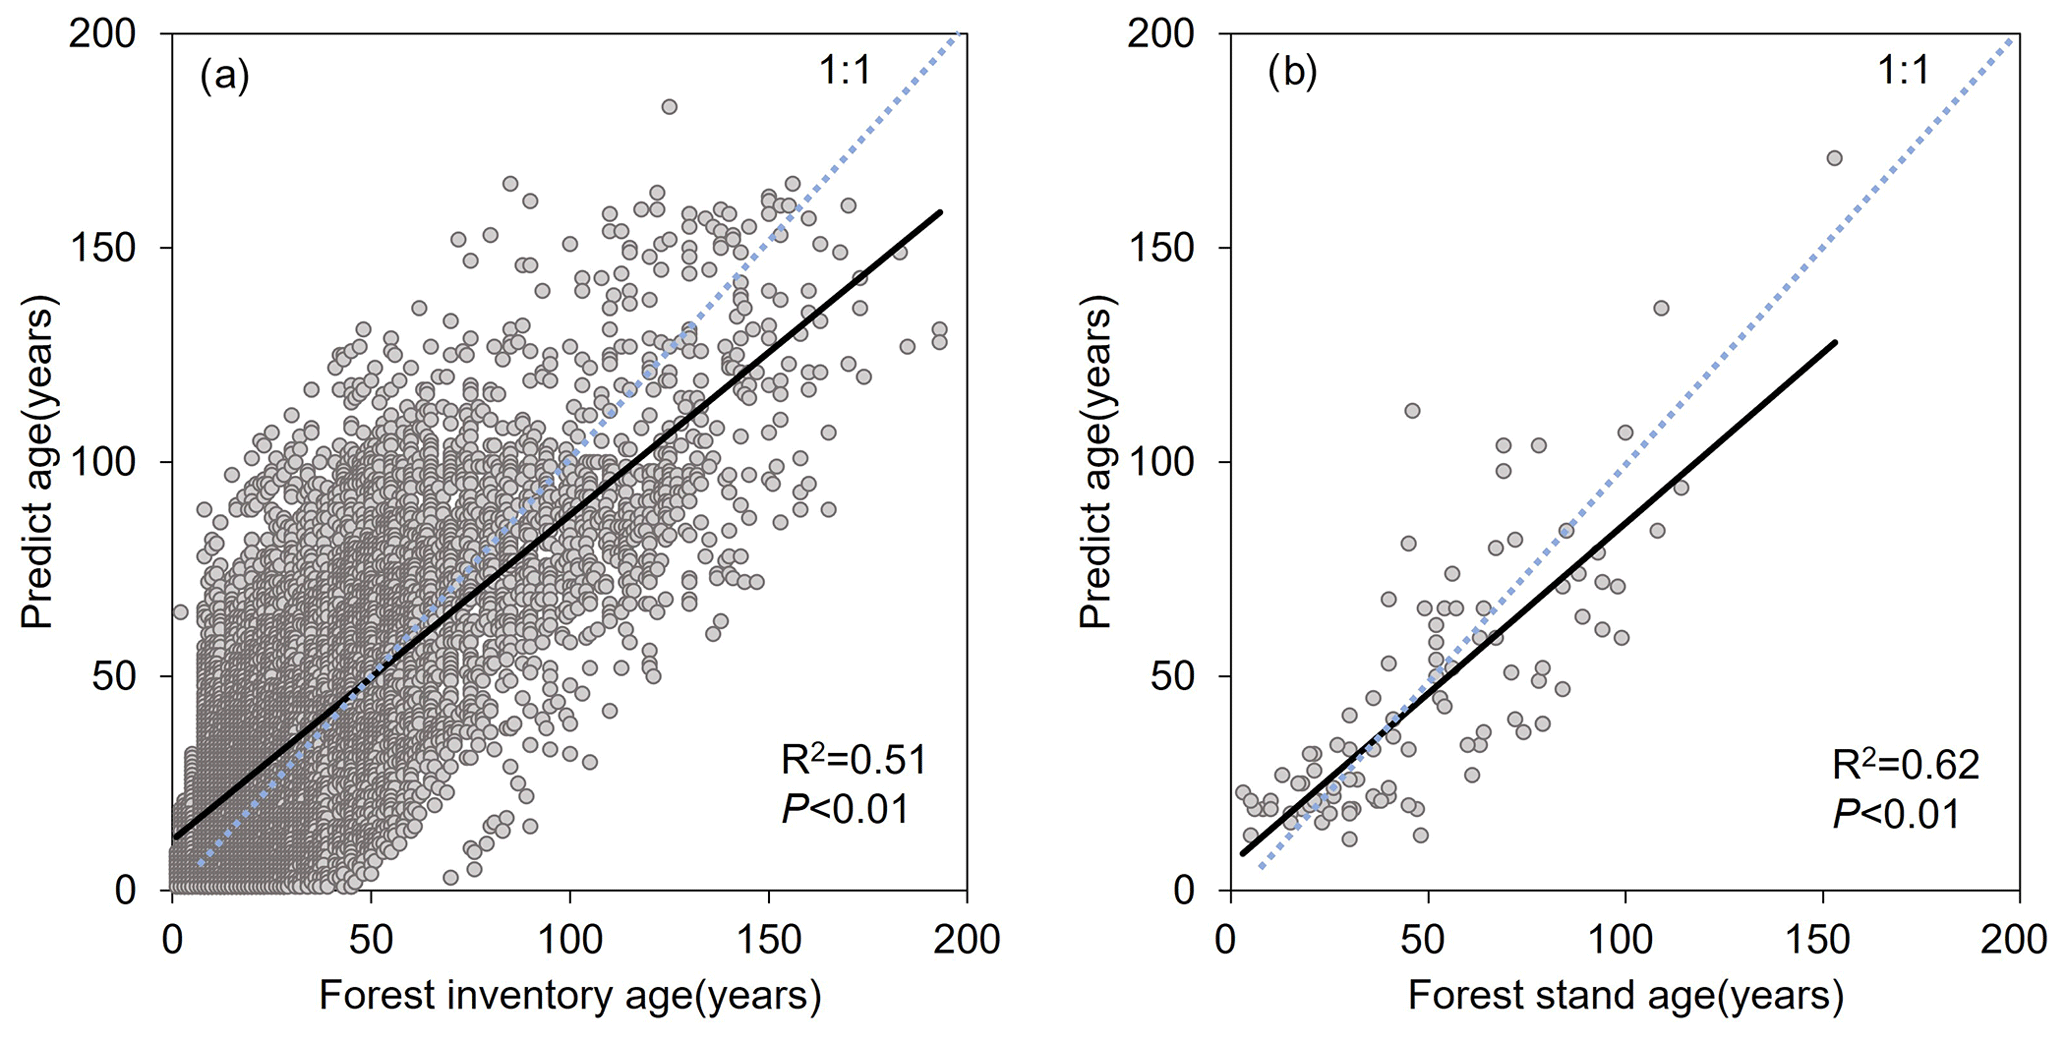
Figure 6Scatter plots of (a) forest inventory age vs. predicted forest age for this study and (b) field measurements of forest stand age collected from published papers vs. predicted forest age.
3.3.2 Comparison with existing forest age map
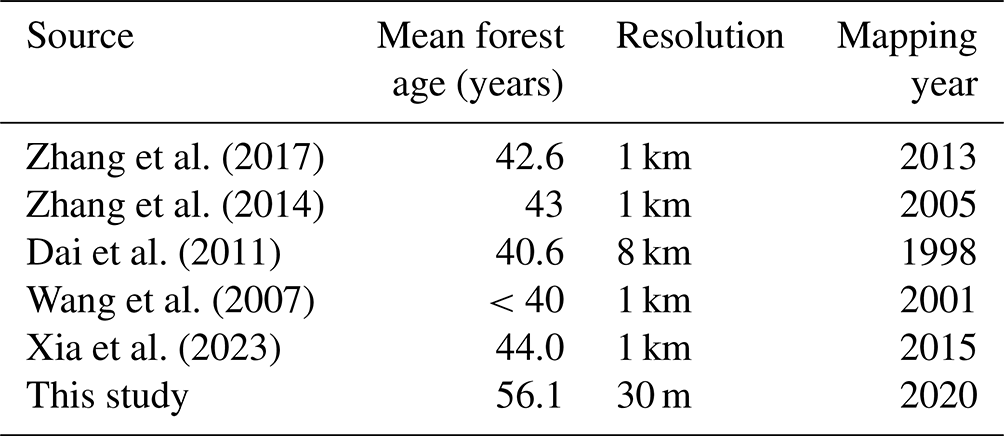
Figure 7 shows the difference between our estimation and the existing global forest age map, which suggests an average difference of 9.7 years. Our mapped forest age shows older forests in the northeast regions but younger forests in the central regions compared with the dataset from Besnard et al. (2021). In addition, we gathered the existing forest age maps over China from published datasets and compared their average forest age with our results (Table 4). According to the available data, the average forest age in China ranged from 40 to 43 years between 2000 and 2013, corresponding to approximately 50–53 years in 2020. This aligns with the average forest age of 56.1 years obtained in this study for the year 2020, further underscoring the reliability of the forest age mapped in this study.
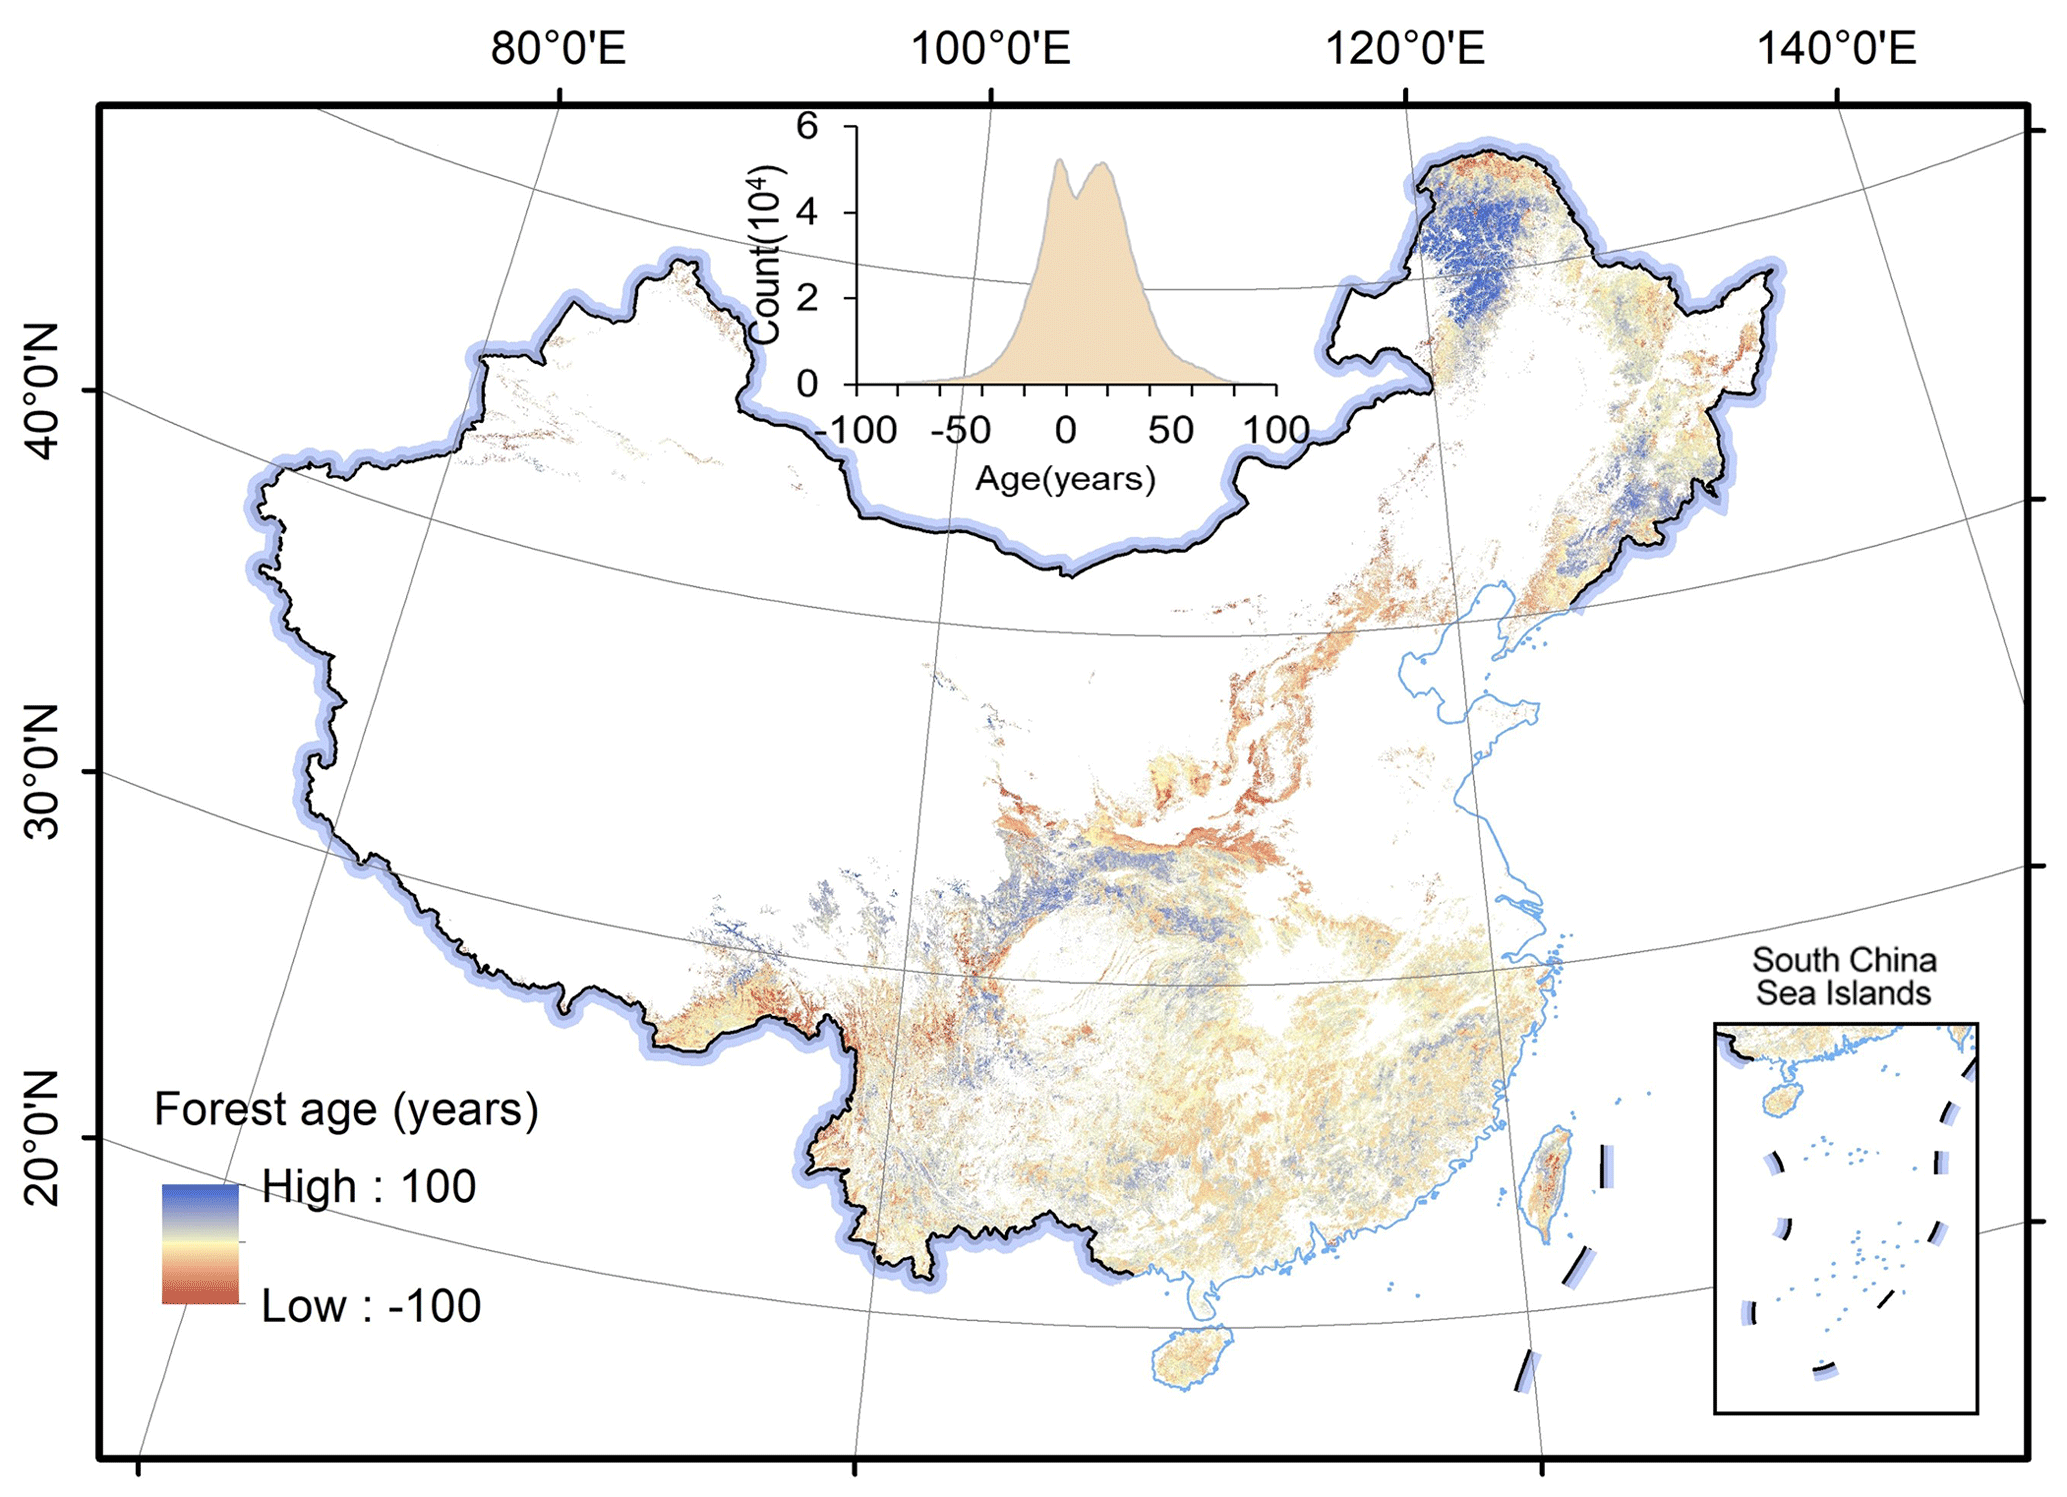
Figure 7Comparison with global forest age product. The inset at the top shows the frequency distribution of differences between the global forest age map and our estimated forest age map. Publisher's remark: please note that the above figure contains disputed territories.
Table 4China's mean forest age collected from published papers.
A high-spatial-resolution forest age map is an important input for accurately quantifying forest carbon storage and its potential. Despite the generation of several forest age maps for China in recent decades, their spatial resolution is relatively coarse, typically ranging from 1 to 8 km (e.g., Zhang et al., 2014, 2017). This resolution does not meet the application requirements for local-to-regional scales (Xiao et al., 2023). Therefore, we generated a 30 m resolution forest age map of China using remote sensing and inventory data for 2020. Validation against independent forest inventory samples, field measurements collected from published papers, and existing forest age products indicate that the estimated forest age map has an R2 of 0.51–0.62 and presented high spatial agreement with the existing forest age products. Such a high-resolution and timely forest age dataset is vital to assess ecological benefits of China's forests and to manage forest resources for sustainable development.
The generated forest age map indicates that 40.08 % of forests are younger than 40 years, 38.11 % are 41–80 years old, and 21.81 % are over 80 years old. Consistent with the findings of Zhang et al. (2014, 2017), our results show that the majority of China's forests are young, while the specific proportions exhibit some variance due to the variations in produced time. Furthermore, similar to the findings of Zhang et al. (2014, 2017), forests younger than 40 years are primarily in southern and eastern China, whereas forests older than 80 years are predominantly in northeastern and southwestern China (Fig. 4). We further analyze forest age by using China's planted and natural forest mask generated by Cheng et al. (2023b) for 2020. The results reveal that the average forest age for planted forests in China is 29.1 years with a standard deviation of 18.2 years, whereas natural forests have an average age of 69.7 years with a standard deviation of 30.6 years. This result aligns with the reported 16.5 years for China's planted forests in 2005 (which equates to approximately 31 years in 2020) by Yu et al. (2020).
This study combines two methods to estimate forest age across China. We first investigate in-depth the suitability of current mainstream MLAs for estimating forest age. For each vegetation division, we establish the optimal MLAs and its optimal parameters (Tables 3 and S4). Of the established MLAs, the ensemble learning approaches perform best for both training and evaluation compared with individual-based learners. Several previous studies support the idea that ensemble techniques have achieved better performance than that of base learners (e.g., Rodriguez et al., 2006; Banfield et al., 2007; Canul-Reich et al., 2007; Rokach, 2009; De Stefano et al., 2011; Matloob et al., 2021). Bagging and boosting are two mainstream ensemble techniques in ensemble learning that combine multiple base models to improve predictive performance. Bagging reduces variance, whereas boosting reduces bias and improves overall model performance (Abbasi et al., 2022). However, most previous studies focused on bagging-based RF models to derive forest structure parameters in remote sensing fields (Simard et al., 2011; Cartus et al., 2012; Montesano et al., 2013; Matasci et al., 2018; Luther et al., 2019; Bolton et al., 2020). The present study highlights that ensemble learning algorithms based on boosting, including GBDT, LightGBM, and CatBoost, demonstrate higher accuracy in estimating China's forest age compared with the bagging-based RF algorithm. Furthermore, within the current ensemble learning framework, the CatBoost algorithm based on boosting has a clear advantage for estimating forest age in China (Table 3). It produces optimal results in five vegetation zones and is as accurate as the best-performing algorithms in the remaining vegetation zones (Table S5). Therefore, we recommend giving priority to the utilization of the CatBoost algorithm in deriving the forest structural parameters in China.
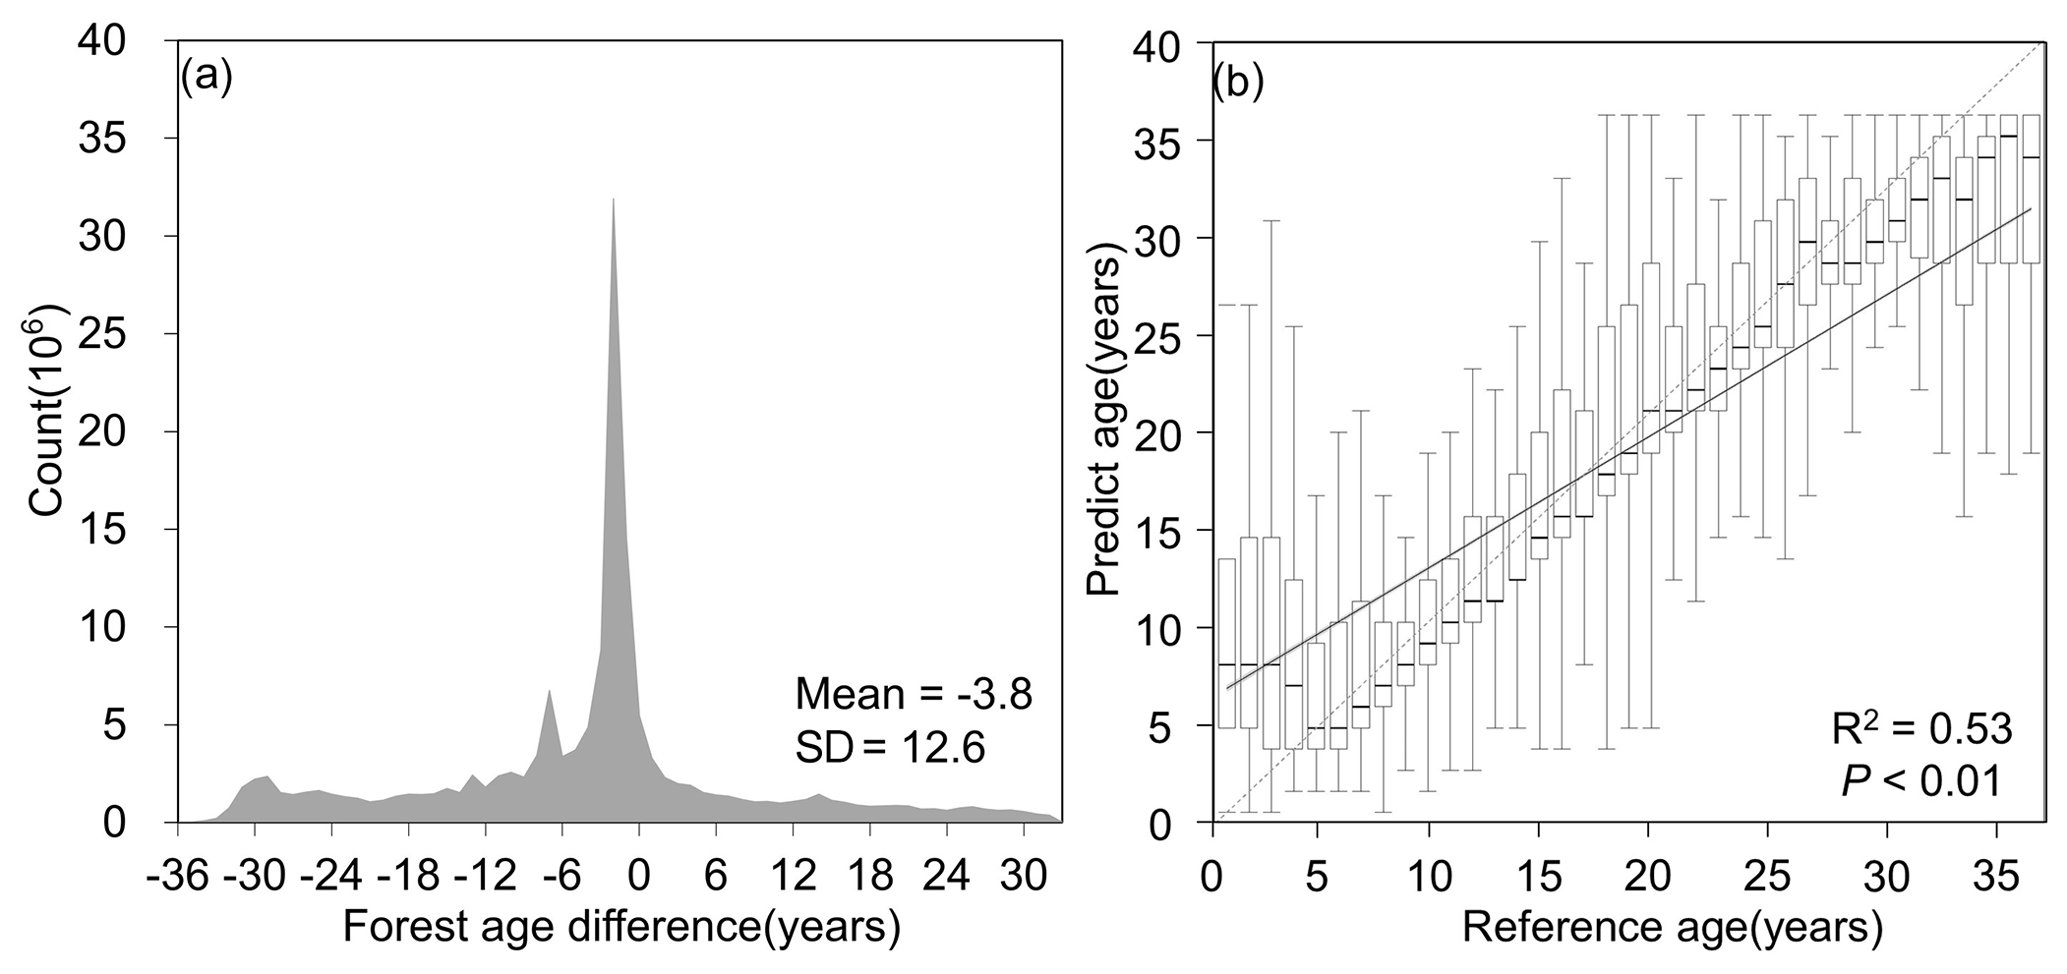
Figure 8Panel (a) shows the age difference and (b) the linear relationship between estimated forest age and China's Young Forest Age dataset generated by Xiao et al. (2023).
In the process of machine learning modeling for forest age estimation, we selected a total of 10 features, including canopy height, meteorological factors, soil factors, terrain factors, and human activities. Factor analysis indicates that canopy height has significantly influenced forest age modeling, which is consistent with previous research such as that of Zhang et al. (2017), who estimated forest age in China based on the relationship between canopy height and forest age. The main reason is that canopy height is typically correlated with the growth period (Sharma and Parton, 2007; Schumacher et al., 2020; Lin et al., 2023). Young trees usually have lower canopy height and, as trees age, canopy height gradually increases (Yu et al., 2020). Therefore, canopy height gives clues about tree age, and many age-estimation models are based on forest height (Lin et al., 2023). Terrain conditions also play important roles in all vegetation zones, especially the elevation and slope features (Fig. 2). This is mainly because terrain factors are closely related to vegetation distribution, growth conditions, and hydrological processes (Fernández-Martínez et al., 2014), as well as affecting forest age estimation (Lin et al., 2008). Climate factors, including temperature and precipitation, also play a significant role in estimating forest age and have been applied to estimate global forest age (Besnard et al., 2021). Climate elements are most pronounced in the SE and QT vegetation zones because these two zones belong to areas with extreme climates and pronounced seasonal variations (Zhang et al., 2018). The SE region has a warm and humid climate with abundant rainfall (Zhang et al., 2018), which aligns with seasonal growth, making it influential in forest age estimation. The QT region experiences extreme temperature fluctuations, with extremely cold winters and short and cool summers, significantly affecting tree growth rates and cycles (Zhang et al., 2021). Although soil and human activities seem to have a relatively smaller impact in this study, the high accuracy achieved in this study is attributed to the combined contributions of all factors.
The second method uses time series remote sensing imagery and the LandTrendr algorithm to detect pixels that changed within the forest extent from 1985 to 2020. The forest age was estimated according to the time since the last disturbance serving as a proxy for forest age. This approach has been extensively used to estimate forest age and is generally acknowledged to be accurate and reliable for detecting disturbance (Hermosilla et al., 2016). For instance, Du et al. (2022) used the LandTrendr algorithm to detect planting times of global planted forests, and Xiao et al. (2023) estimated the forest age of young forests in China since 1984 by using the CCDC time series algorithm. These successful cases validate the feasibility of using time series change-detection algorithms to estimate the age of disturbed forests. In this study, we compared our change-detection-derived forest age with the age, provided by Xiao et al. (2023), of young forests (Fig. 8). These two outcomes have a mean difference of −3.79 years (Fig. 8a) and have a significant linear relationship with R2=0.53 (Fig. 8b).
Overall, we produce a reliable forest age map for China. This forest age product has been validated by independent field samples and compared with existing datasets with an R2 ranging from 0.51 to 0.62 (Fig. 6). However, there is still a slight overestimation of younger forest and an underestimation of older forest compared with validation samples, which is mainly related to the dataset and methods used in this study. In terms of dataset, primarily, the utilization of a forest mask that delineates planted and natural forests introduces an inescapable source of uncertainty, which is particularly high (approximately 10 %) in the southern regions of China (Cheng et al., 2023b). Furthermore, the dependence on canopy-height data generated by Liu et al. (2022) as the crucial determinant in forest age estimation (Fig. 2) necessitates meticulous consideration (Zhang et al., 2017), given that the uncertainties in the canopy-height data (R2=0.55) could strongly affect the accuracy in forest age modeling. Finally, when benchmarked against extant products, conspicuous disparities in forest age estimates appear within the northeastern and southwestern regions (Fig. 7). These disparities, coupled with insights from forest inventory data, highlight the prevalence of older forests (exceeding 100 years) within these regions (Fig. 4). The unique challenge posed by estimating the age of such older forests, characterized by sluggish growth rates (Maltman et al., 2023), accentuates the sensitivity to crown height data. Consequently, the uncertainty associated with canopy height data was conspicuously accentuated in these regions. Regarding methods, we combined MLAs and our disturbance detection approach to derive forest age. For MLAs, overfitting is a common challenge in which a model learns the training data too accurately but fails to generalize it to unseen data (Belgiu and Drăguţ 2016). The results (Table S5) suggest that the constructed forest age models exhibit a certain degree of overfitting, which can cause some errors in forest age estimation. Addressing the issue of overfitting, data augmentation and exploring new deep learning algorithms may be a direction for further investigation. For the LandTrendr approach, it is affected by different parameters such as input bands, vegetation parameters (NBR index), climates, vegetation, terrain, and atmospheric conditions (Banskota et al., 2014; Hermosilla et al., 2015; Hua et al., 2021; Huang et al., 2023; Yang et al., 2018). China's unprecedented development has led to extensive land cover changes, making it one of the most intensively managed forest regions globally (Tong et al., 2020). This has resulted in significant forest fragmentation, posing challenges in using NBR and other indices for change detection (Li et al., 2024) and creating uncertainty in forest age identification. Furthermore, while the LandTrendr algorithm effectively captures sharp disturbances like fires, clearcutting, and reforestation, it falls short in detecting subtle changes such as silviculture and thinning (Huang et al., 2023; Zhu, 2017). This limitation may lead to the omission of young trees and an overestimation of forest age.
The 30 m resolution forest age map of China generated by this study is openly available at https://doi.org/10.5281/zenodo.8354262 (Cheng et al., 2023a). Please contact the authors for more detailed information.
High-resolution and spatially explicit forest age mapping for China play a crucial role in accurately quantifying the current carbon sequestration of forest ecosystems and its future potential. Currently, the available China forest age data suffer from low resolution and incomplete coverage of age ranges, making it difficult to meet the requirements of studies at various spatial scales. Therefore, this study combines time series analysis of remote sensing imagery with MLAs to create the first 30 m resolution China's forest age map for the year 2020. Validation against forest inventory data, field measurements, and existing products demonstrates the R2 values to be between 0.51 and 0.62. The estimated forest age data reveal an average forest age of 56.1 years for China, with a standard deviation of 32.7 years. This dataset holds significant importance for understanding the carbon source and sink dynamics in China's forest ecosystem.
The supplement related to this article is available online at: https://doi.org/10.5194/essd-16-803-2024-supplement.
KC, YC, and QG designed the research. KC, YC, and TX performed the analysis. QG, KC, YC, and WL collected the field measurements and existing remote sensing products. KC and YC wrote the manuscript. HG and YR reviewed the manuscript. QG, HY, and QM supervised and reviewed the paper. KC and YC contributed equally to this work.
The contact author has declared that none of the authors has any competing interests.
Publisher's note: Copernicus Publications remains neutral with regard to jurisdictional claims made in the text, published maps, institutional affiliations, or any other geographical representation in this paper. While Copernicus Publications makes every effort to include appropriate place names, the final responsibility lies with the authors.
We thank the editor and the reviewers for their valuable comments.
This research has been supported by the National Key Research and Development Program of China (grant no. 2022YFF1300203), the International Research Center of Big Data for Sustainable Development Goals (grant no. CBAS2022GSP06), the National Natural Science Foundation of China (grant nos. 42371329, 31971575, and 42201366). Qin Ma is also supported by the research fund provided by Nanjing Normal University (grant no. 184080H202B349).
This paper was edited by Zhen Yu and reviewed by two anonymous referees.
Abbasi, E., Alavi Moghaddam, M. R., and Kowsari, E.: A systematic and critical review on development of machine learning based-ensemble models for prediction of adsorption process efficiency, J. Clean. Prod., 379, 134588, https://doi.org/10.1016/j.jclepro.2022.134588, 2022.
Akiba, T., Sano, S., Yanase, T., Ohta, T., and Koyama, M.: Optuna: A Next-generation Hyperparameter Optimization Framework, Proceedings of the 25th ACM SIGKDD International Conference on Knowledge Discovery & Data Mining, 2623–2631, Association for Computing Machinery, Anchorage, AK, USA, https://doi.org/10.48550/arXiv.1907.10902, 2019.
Alerskans, E., Zinck, A.-S. P., Nielsen-Englyst, P., and Høyer, J. L.: Exploring machine learning techniques to retrieve sea surface temperatures from passive microwave measurements, Remote Sens Environ., 281, 113220, https://doi.org/10.1016/j.rse.2022.113220, 2022.
Banfield, R. E., Hall, L. O., Bowyer, K. W., and Kegelmeyer, W. P.: A Comparison of Decision Tree Ensemble Creation Techniques, IEEE T. Pattern Anal. Mach. Intell., 29, 173–180, https://doi.org/10.1109/TPAMI.2007.250609, 2007.
Banskota, A., Kayastha, N., Falkowski, M. J., Wulder, M. A., Froese, R. E., and White, J. C.: Forest Monitoring Using Landsat Time Series Data: A Review, Can. J. Remote. Sens., 40, 362–384, https://doi.org/10.1080/07038992.2014.987376, 2014.
Belgiu, M. and Drăguţ, L.: Random forest in remote sensing: A review of applications and future directions, ISPRS J. Photogramm. Remote Sens., 114, 24–31, https://doi.org/10.1016/j.isprsjprs.2016.01.011, 2016.
Besnard, S., Koirala, S., Santoro, M., Weber, U., Nelson, J., Gütter, J., Herault, B., Kassi, J., N'Guessan, A., Neigh, C., Poulter, B., Zhang, T., and Carvalhais, N.: Mapping global forest age from forest inventories, biomass and climate data, Earth Syst. Sci. Data, 13, 4881–4896, https://doi.org/10.5194/essd-13-4881-2021, 2021.
Bolton, D. K., Tompalski, P., Coops, N. C., White, J. C., Wulder, M. A., Hermosilla, T., Queinnec, M., Luther, J. E., van Lier, O. R., Fournier, R. A., Woods, M., Treitz, P. M., van Ewijk, K. Y., Graham, G., and Quist, L.: Optimizing Landsat time series length for regional mapping of lidar-derived forest structure, Remote Sens Environ., 239, 111645, https://doi.org/10.1016/j.rse.2020.111645, 2020.
Breiman, L.: Random Forests, Mach. Learn., 45, 5–32, https://doi.org/10.1023/A:1010933404324, 2001.
Canul-Reich, J., Shoemaker, L., and Hall, L. O.: Ensembles of Fuzzy Classifiers, 2007 IEEE International Fuzzy Systems Conference, London, UK, 2007, https://doi.org/10.1109/FUZZY.2007.4295345, 2007.
Cartus, O., Kellndorfer, J., Rombach, M., and Walker, W.: Mapping Canopy Height and Growing Stock Volume Using Airborne Lidar, ALOS PALSAR and Landsat ETM+, Remote Sens., 4, 3320–3345, https://doi.org/10.3390/rs4113320, 2012.
Chen, D., Loboda, T. V., Krylov, A., and Potapov, P. V.: Mapping stand age dynamics of the Siberian larch forests from recent Landsat observations, Remote Sens Environ., 187, 320–331, https://doi.org/10.1016/j.rse.2016.10.033, 2016.
Cheng, K., Chen, Y., Xiang, T., Yang, H., Liu, W., Ren, Y., Guan, H., Hu, T., Ma, Q., and Guo, Q.: 2020 forest age map for China with 30 m resolution (1.0), Zenodo [data set], https://doi.org/10.5281/zenodo.8354262, 2023a.
Cheng, K., Su, Y., Guan, H., Tao, S., Ren, Y., Hu, T., Ma, K., Tang, Y., and Guo, Q.: Mapping China's planted forests using high resolution imagery and massive amounts of crowdsourced samples, ISPRS J. Photogramm. Remote Sens., 196, 356–371, https://doi.org/10.1016/j.isprsjprs.2023.01.005, 2023b.
Dai, M., Zhou, T., Yang, L., and Jia, G.: Spatial pattern of forest ages in China retrieved from national-level inventory and remote sensing imageries, Geogr. Res., 30, 172–184, https://doi.org/10.11821/yj2011010017, 2011 (in Chinese).
de Jong, S. M., Shen, Y., de Vries, J., Bijnaar, G., van Maanen, B., Augustinus, P., and Verweij, P.: Mapping mangrove dynamics and colonization patterns at the Suriname coast using historic satellite data and the LandTrendr algorithm, Int. J. Appl. Earth Obs., 97, 102293, https://doi.org/10.1016/j.jag.2020.102293, 2021.
De Stefano, C., Fontanella, F., Folino, G., and di Freca, A. S.: A Bayesian Approach for Combining Ensembles of GP Classifiers, Springer Berlin Heidelberg, Berlin, Heidelberg, 26–35, https://doi.org/10.1007/978-3-642-21557-5_5, 2011.
Du, Z., Yu, L., Yang, J., Xu, Y., Chen, B., Peng, S., Zhang, T., Fu, H., Harris, N., and Gong, P.: A global map of planting years of plantations, Sci. Data, 9, 141, https://doi.org/10.1038/s41597-022-01260-2, 2022.
Du, Z., Yu, L., Yang, J., Coomes, D., Kanniah, K., Fu, H., and Gong, P.: Mapping Annual Global Forest Gain From 1983 to 2021 With Landsat Imagery, IEEE J.-Stars., 16, 4195–4204, https://doi.org/10.1109/JSTARS.2023.3267796, 2023.
Dutta, K. K., Dutta, K. K., Victor, A., Nathu, A. G., Habib, M. A., and Parashar, D.: Kannada Alphabets Recognition using Decision Tree and Random Forest Models, in: 2020 3rd International Conference on Intelligent Sustainable Systems (ICISS), Thoothukudi, India, 2020 , 534–541, https://doi.org/10.1109/ICISS49785.2020.9315972, 2020.
Fernández-Martínez, M., Vicca, S., Janssens, I. A., Luyssaert, S., Campioli, M., Sardans, J., Estiarte, M., and Peñuelas, J.: Spatial variability and controls over biomass stocks, carbon fluxes, and resource-use efficiencies across forest ecosystems, Trees, 28, 597–611, https://doi.org/10.1007/s00468-013-0975-9, 2014.
Fick, S. E. and Hijmans, R. J.: WorldClim 2: New 1-Km Spatial Resolution Climate Surfaces for Global Land Areas, Int. J. Climatol., 37, 4302–4315, https://doi.org/10.1002/joc.5086, 2017.
Guo, Y., Zhou, Y., Hu, X., and Cheng, W.: Research on Recommendation of Insurance Products Based on Random Forest, in: 2019 International Conference on Machine Learning, Big Data and Business Intelligence (MLBDBI), Taiyuan, China, 308–311, https://doi.org/10.1109/MLBDBI48998.2019.00069, 2019.
Hermosilla, T., Wulder, M. A., White, J. C., Coops, N. C., and Hobart, G. W.: Regional detection, characterization, and attribution of annual forest change from 1984 to 2012 using Landsat-derived time-series metrics, Remote Sens Environ., 170, 121–132, https://doi.org/10.1016/j.rse.2015.09.004, 2015.
Hermosilla, T., Wulder, M. A., White, J. C., Coops, N. C., Hobart, G. W., and Campbell, L. B.: Mass data processing of time series Landsat imagery: pixels to data products for forest monitoring, Int. J. Digit. Earth, 9, 1035–1054, https://doi.org/10.1080/17538947.2016.1187673, 2016.
Hua, J., Chen, G., Yu, L., Ye, Q., Jiao, H., and Luo, X.: Improved Mapping of Long-Term Forest Disturbance and Recovery Dynamics in the Subtropical China Using All Available Landsat Time-Series Imagery on Google Earth Engine Platform, IEEE J.-Stars., 14, 2754–2768, https://doi.org/10.1109/JSTARS.2021.3058421, 2021.
Huang, C., Goward, S. N., Masek, J. G., Thomas, N., Zhu, Z., and Vogelmann, J. E.: An automated approach for reconstructing recent forest disturbance history using dense Landsat time series stacks, Remote Sens. Environ., 114, 183–198, https://doi.org/10.1016/j.rse.2009.08.017, 2010.
Huang, Z., Li, X., Du, H., Zou, W., Zhou, G., Mao, F., Fan, W., Xu, Y., Ni, C., Zhang, B., Chen, Q., Chen, J., and Hu, M.: An Algorithm of Forest Age Estimation Based on the Forest Disturbance and Recovery Detection, IEEE T. Geosci. Remote, 61, 1–18, https://doi.org/10.1109/TGRS.2023.3322163, 2023.
Jerome, H. F.: Greedy function approximation: A gradient boosting machine, Ann. Stat., 29, 1189–1232, https://doi.org/10.1214/aos/1013203451, 2001.
Kennedy, R. E., Yang, Z., and Cohen, W. B.: Detecting trends in forest disturbance and recovery using yearly Landsat time series: 1. LandTrendr – Temporal segmentation algorithms, Remote Sens. Environ., 114, 2897–2910, https://doi.org/10.1016/j.rse.2010.07.010, 2010.
Kennedy, R. E., Yang, Z., Gorelick, N., Braaten, J., Cavalcante, L., Cohen, W. B., and Healey, S.: Implementation of the LandTrendr Algorithm on Google Earth Engine, Remote Sens., 10, 691, https://doi.org/10.3390/rs10050691, 2018.
Kim, H., Crow, W., Li, X., Wagner, W., Hahn, S., and Lakshmi, V.: True global error maps for SMAP, SMOS, and ASCAT soil moisture data based on machine learning and triple collocation analysis, Remote Sens Environ., 298, 113776, https://doi.org/10.1016/j.rse.2023.113776, 2023.
Lavanya, K., Bajaj, S., Tank, P., and Jain, S.: Handwritten digit recognition using hoeffding tree, decision tree and random forests – A comparative approach, in: 2017 International Conference on Computational Intelligence in Data Science (ICCIDS), Chennai, India, 2017, 1–6, https://doi.org/10.1109/ICCIDS.2017.8272641, 2017.
Li, P., Li, H., Si, B., Zhou, T., Zhang, C., and Li, M.: Mapping planted forest age using LandTrendr algorithm and Landsat 5–8 on the Loess Plateau, China, Agric. For. Meteorol., 344, 109795, https://doi.org/10.1016/j.agrformet.2023.109795, 2024.
Lin, G., Xia, B., Zeng, Z., and Huang, W.: The Relationship between NDVI, Stand Age and Terrain Factors of Pinus elliottii Forest, in: 2008 International Workshop on Education Technology and Training & 2008 International Workshop on Geoscience and Remote Sensing, 2008, December , 232–236, https://doi.org/10.1109/ETTandGRS.2008.302, 2008.
Lin, X., Shang, R., Chen, J. M., Zhao, G., Zhang, X., Huang, Y., Yu, G., He, N., Xu, L., and Jiao, W.: High-resolution forest age mapping based on forest height maps derived from GEDI and ICESat-2 space-borne lidar data, Agric. For. Meteorol., 339, 109592, https://doi.org/10.1016/j.agrformet.2023.109592, 2023.
Liu, X., Su, Y., Hu, T., Yang, Q., Liu, B., Deng, Y., Tang, H., Tang, Z., Fang, J., and Guo, Q.: Neural network guided interpolation for mapping canopy height of China's forests by integrating GEDI and ICESat-2 data, Remote Sens. Environ., 269, 112844, https://doi.org/10.1016/j.rse.2021.112844, 2022.
Lundberg, S. and Lee, S.-I.: A Unified Approach to Interpreting Model Predictions, arXiv [preprint], arXiv:1705.07874, https://doi.org/10.48550/arXiv.1705.07874, 2017.
Lundberg, S. M., Erion, G. G., and Lee, S.-I.: Consistent Individualized Feature Attribution for Tree Ensembles, arXiv [preprint], arXiv:1802.03888, https://doi.org/10.48550/arXiv.1802.03888, 2019.
Luther, J. E., Fournier, R. A., van Lier, O. R., and Bujold, M.: Extending ALS-Based Mapping of Forest Attributes with Medium Resolution Satellite and Environmental Data, Remote Sens., 11, 1092, https://doi.org/10.3390/rs11091092, 2019.
Maltamo, M., Kinnunen, H., Kangas, A., and Korhonen, L.: Predicting stand age in managed forests using National Forest Inventory field data and airborne laser scanning, For. Ecosyst., 7, 44, https://doi.org/10.1186/s40663-020-00254-z, 2020.
Maltman, J. C., Hermosilla, T., Wulder, M. A., Coops, N. C., and White, J. C.: Estimating and mapping forest age across Canada's forested ecosystems, Remote Sens. Environ., 290, 113529, https://doi.org/10.1016/j.rse.2023.113529, 2023.
Matasci, G., Hermosilla, T., Wulder, M. A., White, J. C., Coops, N. C., Hobart, G. W., and Zald, H. S.: Large-area mapping of Canadian boreal forest cover, height, biomass and other structural attributes using Landsat composites and lidar plots, Remote Sens. Environ., 209, 90–106, https://doi.org/10.1016/j.rse.2017.12.020, 2018.
Matloob, F., Ghazal, T. M., Taleb, N., Aftab, S., Ahmad, M., Khan, M. A., Abbas, S., and Soomro, T. R.: Software Defect Prediction Using Ensemble Learning: A Systematic Literature Review, IEEE Access, 9, 98754–98771, https://doi.org/10.1109/ACCESS.2021.3095559, 2021.
Mekruksavanich, S., Jantawong, P., Hnoohom, N., and Jitpattanakul, A.: Hyperparameter Tuning in Convolutional Neural Network for Face Touching Activity Recognition using Accelerometer Data, in: 2022 Research, Invention, and Innovation Congress: Innovative Electricals and Electronics (RI2C), Bangkok, Thailand, 2022, 101–105, https://doi.org/10.1109/RI2C56397.2022.9910262, 2022.
Montesano, P. M., Cook, B. D., Sun, G., Simard, M., Nelson, R. F., Ranson, K. J., Zhang, Z., and Luthcke, S.: Achieving accuracy requirements for forest biomass mapping: A spaceborne data fusion method for estimating forest biomass and LiDAR sampling error, Remote Sens. Environ., 130, 153–170, https://doi.org/10.1016/j.rse.2012.11.016, 2013.
Niu, Y., Squires, V., and Jentsch, A.: Jentsch. Risks of China's increased forest area, Science, 379, 447–448, https://doi.org/10.1126/science.adg0210, 2023.
Pan, Y., Birdsey, R. A., Fang, J., Houghton, R., Kauppi, P. E., Kurz, W. A., Phillips, O. L., Shvidenko, A., Lewis, S. L., Canadell, J. G., Ciais, P., Jackson, R. B., Pacala, S. W., McGuire, A. D., Piao, S., Rautiainen, A., Sitch, S., and Hayes, D.: A Large and Persistent Carbon Sink in the World, Forests, Science, 333, 988–993, https://doi.org/10.1126/science.1201609, 2011.
Piao, S., He, Y., Wang, X., and Chen, F.: Estimation of China's terrestrial ecosystem carbon sink: Methods, progress and prospects, Sci. China Earth Sci., 65, 641–651, https://doi.org/10.1007/s11430-021-9892-6, 2022.
Ren, Y., Wei, X., Zhang, L., Cui, S., Chen, F., Xiong, Y., and Xie, P.: Potential for forest vegetation carbon storage in Fujian Province, China, determined from forest inventories, Plant Soil, 345, 125–140, https://doi.org/10.1007/s11104-011-0766-2, 2011.
Rodman, K. C., Andrus, R. A., Veblen, T. T., and Hart, S. J.: Disturbance detection in landsat time series is influenced by tree mortality agent and severity, not by prior disturbance, Remote Sens. Environ., 254, 112244, https://doi.org/10.1016/j.rse.2020.112244, 2021.
Rodriguez, J. J., Kuncheva, L. I., and Alonso, C. J.: Rotation Forest: A New Classifier Ensemble Method, IEEE T. Pattern Anal. Mach. Intell., 28, 1619–1630, https://doi.org/10.1109/TPAMI.2006.211, 2006.
Rokach, L.: Taxonomy for characterizing ensemble methods in classification tasks: A review and annotated bibliography, Comput. Stat. Data Anal., 53, 4046–4072, https://doi.org/10.1016/j.csda.2009.07.017, 2009.
Sandha, S. S., Aggarwal, M., Fedorov, I., and Srivastava, M.: Mango: A Python Library for Parallel Hyperparameter Tuning, in: ICASSP 2020 – 2020 IEEE International Conference on Acoustics, Speech and Signal Processing (ICASSP), Barcelona, Spain, 2020, 3987–3991, https://doi.org/10.1109/ICASSP40776.2020.9054609, 2020.
Schumacher, J., Hauglin, M., Astrup, R., and Breidenbach, J.: Mapping forest age using National Forest Inventory, airborne laser scanning, and Sentinel-2 data, For. Ecosyst., 7, 60, https://doi.org/10.1186/s40663-020-00274-9, 2020.
Sharma, M. and Parton, J.: Height–diameter equations for boreal tree species in Ontario using a mixed-effects modelling approach, For. Ecol. Manag., 249, 187–198, https://doi.org/10.1016/j.foreco.2007.05.006, 2007.
Simard, M., Pinto, N., Fisher, J. B., and Baccini, A.: Mapping forest canopy height globally with spaceborne lidar, J. Geophys. Res.-Biogeo., 116, G04021, https://doi.org/10.1029/2011JG001708, 2011.
Su, Y., Guo, Q., Hu, T., Guan, H., Jin, S., An, S., Chen, X., Guo, K., Hao, Z., Hu, Y., Huang, Y., Jiang, M., Li, J., Li, Z., Li, X., Li, X., Liang, C., Liu, R., Liu, Q., Ni, H., Peng, S., Shen, Z., Tang, Z., Tian, X., Wang, X., Wang, R., Xie, Z., Xie, Y., Xu, X., Yang, X., Yang,Y., Yu, L., Yue, M., Zhang, F., and Ma, K.: An updated Vegetation Map of China (1:1 000 000), Sci. Bull., 65, 1125–1136, https://doi.org/10.1016/j.scib.2020.04.004, 2020.
Sun, B., Cui, W., Liu, G., Zhou, B., and Zhao, W.: A hybrid strategy of AutoML and SHAP for automated and explainable concrete strength prediction, Case Stud. Constr. Mater., 19, e02405, https://doi.org/10.1016/j.cscm.2023.e02405, 2023.
Tesfagergish, S. G., Kapočiūtė-Dzikienė, J., and Damaševičius, R.: Zero-Shot Emotion Detection for Semi-Supervised Sentiment Analysis Using Sentence Transformers and Ensemble Learning, Appl. Sci., 12, 8662, https://doi.org/10.3390/app12178662, 2022.
Tian, L., Liao, L., Tao, Y., Wu, X., and Li, M.: Forest Age Mapping Using Landsat Time-Series Stacks Data Based on Forest Disturbance and Empirical Relationships between Age and Height, Remote Sens., 15, 2862, https://doi.org/10.3390/rs15112862, 2023.
Tong, X., Brandt, M., Yue, Y., Ciais, P., Rudbeck Jepsen, M., Penuelas, J.,Wigneron, J., Xiao, X., Song, X.-P., Horion, S., Rasmussen, K., Saatchi, S., Fan, L., Wang, K., Zhang, B., Chen, Z., Wang, Y., Li, X., and Fensholt, R.: Forest management in southern China generates short term extensive carbon sequestration, Nat. Commun., 11, 129, https://doi.org/10.1038/s41467-019-13798-8, 2020.
Tubiello, F. N., Conchedda, G., Casse, L., Hao, P., De Santis, G., and Chen, Z.: A new cropland area database by country circa 2020, Earth Syst. Sci. Data, 15, 4997–5015, https://doi.org/10.5194/essd-15-4997-2023, 2023.
Verbesselt, J., Hyndman, R., Newnham, G., and Culvenor, D.: Detecting trend and seasonal changes in satellite image time series, Remote Sens Environ., 114, 106–115, https://doi.org/10.1016/j.rse.2009.08.014, 2010a.
Verbesselt, J., Hyndman, R., Zeileis, A., and Culvenor, D.: Phenological change detection while accounting for abrupt and gradual trends in satellite image time series, Remote Sens. Environ., 114, 2970–2980, https://doi.org/10.1016/j.rse.2010.08.003, 2010b.
Wang, S., Chen, J. M., Ju, W. M., Feng, X., Chen, M., Chen, P., and Yu, G.: Carbon sinks and sources in China's forests during 1901–2001, J. Environ. Manage., 85, 524–537, https://doi.org/10.1016/j.jenvman.2006.09.019, 2007.
Wang, Y., Wang, X., Wang, K., Chevallier, F., Zhu, D., Lian, J., He, Y., Tian, H., Li, J., Zhu, J., Jeong, S., and Canadell, J. G.: The size of the land carbon sink in China, Nature, 603, E7–E9, https://doi.org/10.1038/s41586-021-04255-y, 2022.
Wei, Z., Meng, Y., Zhang, W., Peng, J., and Meng, L.: Downscaling SMAP soil moisture estimation with gradient boosting decision tree regression over the Tibetan Plateau, Remote Sens Environ., 225, 30–44, https://doi.org/10.1016/j.rse.2019.02.022, 2019.
Xia, J., Xia, X., Chen, Y., Shen, R., Zhang, Z., Liang, B., Wang, J., and Yuan, W.: Reconstructing Long-Term Forest Age of China by Combining Forest Inventories, Satellite-Based Forest Age and Forest Cover Data Sets, J. Geophys. Res.-Biogeo., 128, e2023JG007492, https://doi.org/10.1029/2023JG007492, 2023.
Xiao, Y., Wang, Q., Tong, X., and Atkinson, P. M.: Thirty-meter map of young forest age in China, Earth Syst. Sci. Data, 15, 3365–3386, https://doi.org/10.5194/essd-15-3365-2023, 2023.
Yang, Y., Erskine, P. D., Lechner, A. M., Mulligan, D., Zhang, S., and Wang, Z.: Detecting the dynamics of vegetation disturbance and recovery in surface mining area via Landsat imagery and LandTrendr algorithm, J. Clean. Prod., 178, 353–362, https://doi.org/10.1016/j.jclepro.2018.01.050, 2018.
Yu, Z., Zhao, H., Liu, S., Zhou, G., Fang, J., Yu, G., Tang, X., Wang, W., Yan, J., Wang, G., Ma, K., Li, S., Du, S., Han, S., Ma, Y., Zhang, D., Liu, J., Liu, S., Chu, G., Zhang, Q., and Li, Y.: Mapping forest type and age in China's plantations, Sci. Total Environ., 744, 140790, https://doi.org/10.1016/j.scitotenv.2020.140790, 2020.
Zhang, C., Ju, W., Chen, J. M., Li, D., Wang, X., Fan, W., Li, M., and Zan, M.: Mapping forest stand age in China using remotely sensed forest height and observation data, J. Geophys. Res.-Biogeo., 119, 1163–1179, https://doi.org/10.1002/2013JG002515, 2014.
Zhang, H., Jin, Y., Shen, X., Li, G., and Zhou, D.: Rising Air Temperature and Its Asymmetry Under Different Vegetation Regions in China, Sci. Geol. Sin., 38, 272–283, https://doi.org/10.13249/j.cnki.sgs.2018.02.014, 2018.
Zhang, Y., Yao, Y., Wang, X., Liu, Y., and Piao, S.: Mapping spatial distribution of forest age in China, Earth Space Sci., 4, 108–116, https://doi.org/10.1002/2016EA000177, 2017.
Zhang, Z., Zhang, F., Wang, L., Lin, A., and Zhao, L. : Biophysical climate impact of forests with different age classes in mid- and high-latitude North America, For. Ecol. Manag., 494, 119327, https://doi.org/10.1016/j.foreco.2021.119327, 2021.
Zhu, Z.: Change detection using landsat time series: A review of frequencies, preprocessing, algorithms, and applications, ISPRS J. Photogramm. Remote, 130, 370–384, https://doi.org/10.1016/j.isprsjprs.2017.06.013, 2017.
Zhu, Z. and Woodcock, C. E.: Continuous change detection and classification of land cover using all available Landsat data, Remote Sens. Environ., 144, 152–171, https://doi.org/10.1016/j.rse.2014.01.011, 2014.