the Creative Commons Attribution 4.0 License.
the Creative Commons Attribution 4.0 License.
Global tropical cyclone size and intensity reconstruction dataset for 1959–2022 based on IBTrACS and ERA5 data
Zhiqi Xu
Guwei Zhang
Yuchen Ye
Haikun Zhao
Haishan Chen
Tropical cyclones (TCs) are powerful weather systems that can cause extreme disasters. The International Best Track Archive for Climate Stewardship (IBTrACS) dataset provides widely used data to estimate TC climatology. However, it has low data coverage, lacking intensity and outer-size data for more than half of all recorded storms, and is therefore insufficient as a reference for researchers and decision makers. To fill this data gap, we reconstruct a long-term TC dataset by integrating IBTrACS and European Centre for Medium-Range Weather Forecasts Reanalysis 5 (ERA5) data. This reconstructed dataset covers the period 1959–2022, with 3 h temporal resolution. Compared to the IBTrACS dataset, it contains approximately 3–4 times more data points per characteristic. We establish machine learning models to estimate the maximum sustained wind speed (Vmax) and radius of maximum wind (Rmax) in six basins for which TCs are generated, using ERA5-derived 10 m azimuthal mean azimuthal wind profiles as input, with Vmax and Rmax data from the IBTrACS dataset used as learning target data. Furthermore, we employ an empirical wind–pressure relationship and six wind profile models to estimate the minimum central pressure (Pmin) and outer size of the TCs, respectively. Overall, this high-resolution TC reconstruction dataset demonstrates global consistency with observations, exhibiting mean biases of <1 % for Vmax and 3 % for Rmax and Pmin in almost all basins. The dataset is publicly available from https://doi.org/10.5281/zenodo.13919874 (Xu et al., 2024) and substantially advances our understanding of TC climatology, thereby facilitating risk assessments and defenses against TC-related disasters.
- Article
(4847 KB) - Full-text XML
-
Supplement
(2040 KB) - BibTeX
- EndNote
Tropical cyclones (TCs) are powerful weather systems accompanied by gale winds, heavy rainstorms, substantial waves, and severe storm surges, which cause extensive damage in affected regions (Gray, 1968). During the 2003–2022 period, the global average of TCs is 104 annually, resulting in estimated annual economic losses of USD 95.6 billion and affecting more than 3.2 million individuals (CRED, 2023; Geiger et al., 2018). Given the considerable scale and frequency of TC-related disasters, a comprehensive understanding of TC climatology is essential for effective risk assessment, emergency planning, and community resilience enhancement.
TCs are typically characterized according to their intensity, size, location, and translation speed (Weber et al., 2014). Many studies have reported increasing TC intensity at both the basin and global scale under global warming (e.g., Webster et al., 2005; Gualdi et al., 2008; Wu et al., 2022). Vincent et al. (2014) detect a 30 % increase in high-intensity TCs at the global scale. Mei and Xie (2016) demonstrate a significant correlation between TC intensification and increasing sea surface temperatures (SSTs) in east and southeast Asia. In addition, Walsh et al. (2016) observe significant increasing trends in TC intensity in the Atlantic basin over the past few decades. However, assessments of the response of TC intensity to climate change are subject to uncertainty, partly due to the challenging and costly process of collecting observational data (Gualdi et al., 2008; Knutson et al., 2019). Furthermore, the size of TCs may significantly influence their movement (Liu and Chan, 1999), further contributing to their destructive potential (Xu et al., 2020). Similarly, a significant increase in TC size is proportional to surface latent heat flux under warmer air and ocean temperatures (Hill and Lackmann, 2009; Radu et al., 2014). Xu et al. (2020) demonstrate that TC size increases with ocean warming, based on idealized experiments. Sun et al. (2013, 2014) discover that TC size increases significantly as SST increases through a modeling analysis. However, the conclusions of these case studies are necessarily limited, and the relationships between TC size and climatology factors remain unclear due to the lack of historical records (Xu et al., 2020).
The International Best Track Archive for Climate Stewardship (IBTrACS) dataset is one of the most commonly used sources for TC data; it contains location, intensity, and size data for all known tropical and subtropical cyclones at a resolution of 3 h (Knapp et al., 2010). This dataset utilizes maximum sustained wind speed (Vmax) and minimum central pressure (Pmin) to quantify TC intensity (Simpson, 1974; Chavas et al., 2017; Casas et al., 2023). Among the several metrics that are defined to measure TC size, one of the most widely recognized is the radius of maximum wind (Rmax, Chavas et al., 2015; Ren et al., 2022). Radial distances from the cyclone center to locations where sustained wind speeds of 34, 50, and 64 kn (∼17, 26, and 33 m s−1) are observed near the surface, i.e., R34, R50, and R64, are also widely used metrics to estimate TC size (Pérez-Alarcón et al., 2021). However, reliable TC size and intensity estimates are available only from 1988 onwards (Demuth et al., 2006), and post-storm analyses of wind radii, including R34, R50, and R64, have only commenced since 2004 (Gori et al., 2023). Furthermore, more than half of all recorded storms lack intensity and size data, often with only location data provided, even during periods when post-storm analyses are conducted. Thus, constructing a TC climatology is an arduous task due to low data coverage.
Previous studies have extensively used machine learning to reconstruct TC datasets. Yang et al. (2022) divide hurricane wind fields into symmetric and asymmetric components and propose a downscaling model based on the XGBoost software library to reconstruct TC structure; however, Vmax and Rmax are the model input variables. Zhuo and Tan (2023) apply deep learning algorithms to estimate reliable TC sizes over the western North Pacific during 1981–2017, based on a homogeneous satellite database. Li et al. (2024) propose a transfer-learning-based generative adversarial network framework to derive TC wind fields from synthetic aperture radar images. Eusebi et al. (2024) demonstrate that a physics-informed neural network can produce accurate reconstructions of TC wind and pressure fields by assimilating observations in a computationally efficient manner. Nevertheless, the datasets used in these studies are generally limited to several cases or specific regions of interest, and some are not publicly available.
By contrast, reanalysis datasets such as the fifth-generation European Centre for Medium-Range Weather Forecasts (ECMWF) Reanalysis 5 (ERA5) dataset (Hersbach et al., 2020), the Japanese 55-year Reanalysis (JRA-55; Kobayashi et al., 2015), and US National Centers for Environmental Prediction and National Centre for Atmospheric Research Reanalysis products (Kistler et al., 2001), which combine past observations and model results through data assimilation, have unique advantages in terms of data availability and spatiotemporal coverage. Schenkel et al. (2017) evaluate whether reanalysis datasets can be used to derive a long-term TC size dataset utilizing QuikSCAT data. Zick and Matyas (2015) explore the impact of satellite-derived precipitation over ocean on TCs in the North American Regional Reanalysis. Gori et al. (2023) use ERA5 reanalysis data to estimate the TCs outer size and a wind model to estimate the radius of maximum wind. Thompson et al. (2024) construct a tropical cyclone (TC) size dataset using the NCEP/NCAR Reanalysis I dataset for landfalling TCs along the US coastline from 1948 to 2022. Previous studies have suggested that ERA5 products are among the most promising reanalysis data sources in terms of representing TC outer size and structure, due to their relatively fine horizontal grid spacing (Bian et al., 2021; Pérez-Alarcón et al., 2021; Dulac et al., 2024). Yeasmin et al. (2023) demonstrate that the reconstruction of TC proxies using ERA5 is a viable approach. Nevertheless, due to horizontal resolution limits and conservative physics parameterizations, reanalysis products have exhibited large underestimation and overestimation of TC Vmax and Rmax values, respectively (Hatsushika et al., 2006; Schenkel and Hart, 2012). Thus, despite the substantial body of research reconstructing the outer sizes and proxies of TCs using ERA5 data (Bian et al., 2021; Gori et al., 2023; Pérez-Alarcón et al., 2021), studies that have employed it to derive relatively accurate TC intensity data are lacking.
In this study, we exploit the advantages of the IBTrACS and ERA5 datasets to generate a reconstructed TC dataset containing all characteristics of TCs. Given the high degree of accuracy demonstrated by the ERA5 data in capturing TC structures, we employ ERA5-derived azimuthal mean azimuthal wind profiles in conjunction with a machine learning model to reduce the bias observed in the Vmax and Rmax of TCs between the ERA5 and IBTrACS datasets. In addition, we model six TC radial wind profiles to compute R34, R50, and R64. The resulting long-term TC reconstruction dataset covering the period 1959–2022 is anticipated to facilitate future TC climatology research. The generated dataset is approximately 3–4 times larger than the IBTrACS dataset in terms of the number of records per characteristic.
In the subsequent sections, we describe the IBTrACS and ERA5 datasets and the methodology used to create the novel TC reconstruction dataset. We report and discuss the findings in comparison with IBTrACS data according to a comprehensive set of statistical metrics. Finally, we consider the potential applications of the reconstructed TC dataset.
2.1 IBTrACS data
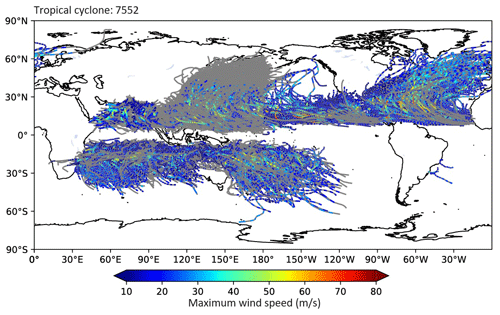
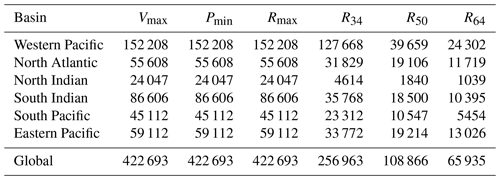
We obtain data on TC tracks, intensity, and size from the IBTrACS (version 4r01 in netCDF format), which is a unified dataset containing track estimates for all TC basins with a 3 h temporal resolution, based on data produced by tropical warning centers. As the TC Rmax data from all main TC basins are accessible from US agencies (the National Oceanic and Atmospheric Administration's National Hurricane Center for the North Atlantic and east Pacific and the military's Joint Typhoon Warning Center for the remainder of the globe), we employ these data and exclude the irregular time steps. We use all TC events in all basins, except for those over the South Atlantic, where TC generation is insufficient. A comprehensive overview of the recorded TC characteristics is presented in Table 1. The IBTrACS dataset encompasses a total of 7552 TCs on a global scale, spanning the period 1959–2022, corresponding to 423 296 individual time points. However, IBTrACS only records 125 477 Vmax, 142 430 Pmin, and 94 415 Rmax values. TC tracks and Vmax data extracted from the IBTrACS dataset are presented in Fig. 1.
2.2 ERA5 data
ERA5 is the latest ECMWF reanalysis, following a decade of developments in model physics, core dynamics, and data assimilation (Hersbach et al., 2020). We utilize the main ERA5 dataset for the period 1959–2022 to estimate the track, intensity, and size of each TC. The spatial resolution of the ERA5 dataset is 0.25°×0.25°, with a temporal resolution of 3 h, aligning with that of the IBTrACS dataset. We exclude pre-1959 ERA5 back-extension data, as some TCs in these data exhibit unrealistically high levels of tension (Bell et al., 2021). Notably, despite the higher uncertainty associated with TC intensity data derived from ERA5 for the pre-satellite time period (1959–1978), comparisons of TC intensity pre- and post-1979 reveal similar climatological distributions for both TC groups in all basins (Fig. S1 in the Supplement). We employ 10 m surface meridional and latitudinal wind speeds to obtain 10 m azimuthal–mean azimuthal wind profiles for TCs. We utilize the sea level pressure (SLP) to provide environmental pressure data for computing the TC central pressure. We derive the parameters including the SLP; relative vorticity at 700, 850, and 925 hPa; and geopotential height at 700 and 850 hPa from the ERA5 data to identify TC centers.
3.1 TC center identification and azimuthal wind profile estimation
We identify TC centers in the ERA5 data, based on the method of Schenkel et al. (2017). We initially ascertain the position of each TC within the reanalysis grid utilizing the IBTrACS position as a first guess. To remove uncertainties associated with TC centers in the reanalysis data, we obtain the centers of six reanalysis variables (SLP; relative vorticity at 700, 850, and 925 hPa; and geopotential height at 700 and 850 hPa) by calculating the centroids of positive relative vorticity values and negative other variables values over the grid near the first-guess position (±2°) using Python. Subsequently, we average the centers to adjust the position of the estimated reanalysis TC center.
We estimate azimuthal wind profiles based on the ERA5 data, as described by Chavas and Vigh (2014). First, we subtract estimated environment wind fields, which are calculated as 0.55 of the TC translation vectors rotated 20° counterclockwise (Lin and Chavas, 2012) from the meridional and latitudinal wind speeds. We determine TC translation vectors according to the TC positions at the next and current time points in the IBTrACS data. Next, we interpolate the 10 m surface meridional and latitudinal wind fields to a TC-centered polar coordinate. In contrast to the method of Chavas and Vigh, we do not exclude grid points over land to obtain the TC intensity after landfall. Then, we employ the parameter 𝒳, defined as the normalized average magnitude of all vectors from the TC center to each grid point included at a specified radius (Chavas and Vigh, 2014) to remove asymmetrical radial bins by excluding radial bins with 𝒳>0.5. Finally, we calculate the TC 10 m azimuthal–mean azimuthal wind profiles as changes in wind speed with distance from the TC center, with grid points spaced at 10 km intervals. We obtain the ERA5-derived TC Vmax (Vmax_ERA5) and Rmax (Rmax_ERA5) from the wind profiles.
3.2 Machine learning model for reconstructing TC Vmax and Rmax from ERA5 data
As shown in Fig. 2, there are discernible biases in all six TC basins between the ERA5- and IBTrACS-derived Vmax and Rmax values. The biases of Vmax are less dependent on the basin, suggesting the systematic underestimation of Vmax by the ERA5 data, partly due to the lower Pmin and the underestimation of the TC wind–pressure relation described in ERA5 (Magnusson et al., 2021). Moreover, convective-scale processes substantially influence Vmax, which cannot be adequately represented in global models, leading to an inherent tendency for underestimation. To further demonstrate the performance of ERA5-derived data, we select the Saffir–Simpson categories as the uniform scale for all the basins and analyze the differences between ERA5-derived and observed data across various wind speed ranges, following the methods in previous research (Wright, 2019; Bloemendaal et al., 2020; Mo et al., 2023). In contrast, biases are more pronounced for larger Vmax values, with underestimation detected for wind speeds exceeding 20 and 30 m s−1 for Saffir–Simpson categories 1–2 and 3–5, respectively, in all six basins. Notably, this bias even exceeds 40 m s−1 for Saffir–Simpson categories 3–5 in the east Pacific basin. In addition, ERA5-derived results overestimate Rmax by >15 km in all basins and by >80 km in the west Pacific (WP) basin. The large biases produced by ERA5 motivate us to establish a reconstructed TC dataset that is more consistent with observations.
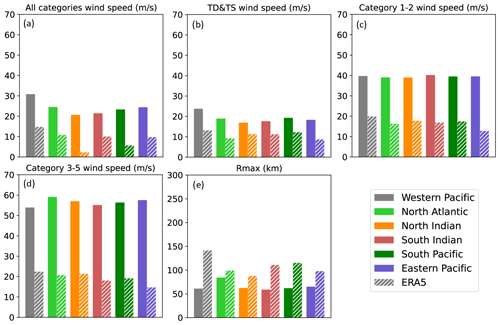
Figure 2Bar charts for comparing the mean value of the 10 m maximum wind speeds and the radii to maximum winds. Each of the colors indicates a different basin. Solid and dashed bars represent IBTrACS- and ERA5-derived data.
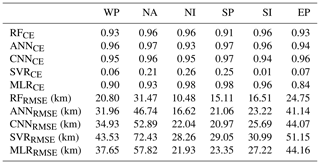
Despite the discrepancy in TC intensity, Bian et al. (2021) demonstrate that ERA-5 accurately depicts TC structural alterations. Therefore, we use the TC 10 m azimuthal-mean wind speed at radial distances from 0 to 1000 km, at 10 km intervals, as a parameter to estimate Vmax in each basin. The parameters also include the TC translation speed, given that the IBTrACS Vmax data (Vmax_IB) represent a combination of the environmental and TC wind fields. We optimize the machine learning models by randomized-search cross-validation, with the mean square error as the loss function, using Python. The models include a random forest (RF) algorithm, artificial neural network (ANN), convolutional neural network (CNN), support vector regressor (SVR), and multivariate linear regression (MLR), as detailed in Table 2. In the above-mentioned models, we incorporate data for the entire period (1959–2022) into the model training process. We randomly divide the dataset, made up of the input array and learning target, into two subsets, with 75 % allocated for training and the remaining 25 % for testing, following the methods of previous studies (e.g., Breiman, 2001; Guo et al., 2024). For a detailed account of the hyperparameter selections for each model, please refer to Sect. S1 in the Supplement. We find that RF provided the most robust predictions, as evidenced by higher correlations and smaller root mean square error (RMSE) values in most basins. Accordingly, we develop an RF regressor to predict reconstructed Vmax (Vmax_RC), as follows:
where RF and VTS are the RF regressor and TC translation speed, respectively, and refer to the 10 m azimuthal mean azimuthal wind speeds at radial distances from 0 to 1000 km. To further assess the accuracy of the RF model, we define the error rate of the RF on the training data as the absolute relative errors between the predicted and observed Vmax, normalized by the observations. The error rates are 0.11, 0.16, 0.09, 0.19, 0.16 and 0.20 for the WP, North Atlantic (NA), north Indian (NI), south Indian (SI), South Pacific (SP), and eastern Pacific (EP) basins, respectively.
Table 2Basic information on the comparison of the different model-derived with observed Vmax in western Pacific (WP), North Atlantic (NA), north Indian (NI), south Indian (SI), South Pacific (SP) and eastern Pacific (EP). CE, correlation coefficient; RMSE, root mean square error. RF, random forecast; ANN, artificial neural network; CNN, convolutional neural network; SVR, support vector regressor; MLR, multivariate linear regression.
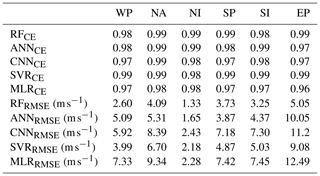
Similarly, we use variation in radial distance with azimuthal wind speed to estimate Rmax in the six basins. We also test several machine learning models (Table 3). Although the ANN-derived Rmax values exhibit stronger correlations with observations, the RMSE values of Rmax derived by RF with observations are considerably smaller than those derived by other models. Therefore, we also utilize the RF regressor to predict the reconstructed Rmax (Rmax_RC), as follows:
where represent the radial distances at which normalized wind speeds range from 0 to 1, at an interval of 0.01. In the RF models, the error rates are 0.19, 0.23, 0.14, 0.19, 0.15, and 0.23 for the WP, NA, NI, SI, SP, and EP basins, respectively. We further evaluate model performance by comparing the model-derived and observed Vmax and Rmax on the testing dataset in Sect. 4, using a comprehensive set of statistical metrics, including mean error, mean absolute error (MAE), RMSE, and Pearson correlation coefficients. We evaluate the statistical significance of Pearson correlation coefficients through the application of a t test.
3.3 Empirical wind speed–pressure relationship for determining Pmin
We model the conversion between Vmax and Pmin at a given time point during a TC using the empirical wind–pressure relationship (Atkinson and Holliday, 1977; Harper, 2002), as follows:
where Penv is the environmental pressure obtained from the mean SLP for the TC center location 1–10 d earlier based on the ERA5 data, following the method of Bloemendaal et al. (2020). We estimate a and b in each basin using a nonlinear least-squares approach, based on Vmax and the corresponding Pmin of the IBTrACS dataset. Vmax_RC is input into the fitted equation (Eq. 3) to obtain the reconstructed Pmin (Pmin_RC).
3.4 TC radial wind profile models for computing R34, R50, and R64
Previous studies have developed TC radial wind profile models for estimating TC structures (e.g., Pérez-Alarcón et al., 2021). After obtaining the reconstructed Vmax and Rmax, we utilize six widely used wind field models (Holland, 1980; DeMaria, 1987; Willoughby et al., 2006; Emanuel and Rotunno, 2011; Frisius et al., 2013; Chavas et al., 2015) to estimate the reconstructed TC R34, R50, and R64 (R34_RC, R50_RC, and R64_RC). For a detailed description of the wind profile models, please refer to Sect. S2 in the Supplement.
We evaluate the performance of each profile model by comparing R34, R50, and R64 estimates with those recorded in the IBTrACS dataset. Subsequently, we select the optimal model to generate reconstructed R34, R50, and R64, as described in detail in Sect. 4.
3.5 Flowchart for optimal wind profile model selection
After identifying the TC center, we use an RF approach to estimate Vmax and Rmax based on the ERA5-derived TC 10 m azimuthal mean azimuthal wind profiles. We evaluate model performance by comparing the model-derived and observed Vmax and Rmax on the testing dataset, using a comprehensive set of statistical metrics. Next, we estimate the parameters of the empirical wind–pressure relationship and compute TC Pmin values. Finally, we derive the TC R34, R50, and R64 by selecting the optimal wind profile model from among the six widely used models. The overall methodology is illustrated in Fig. 3.
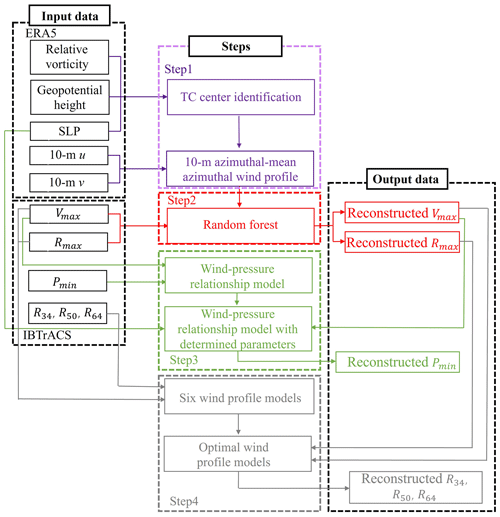
Figure 3Flowchart with the tropical cyclone center identification and wind profiles extracted from ERA5 (Step 1; in purple), the 10 m maximum wind speeds and radii to maximum winds estimated by the random forest model (Step 2; in red), the minimum central pressure estimated by empirical wind–pressure relationship (Step 3; in green), and the out size estimated by wind profile models (Step 4; in grey).
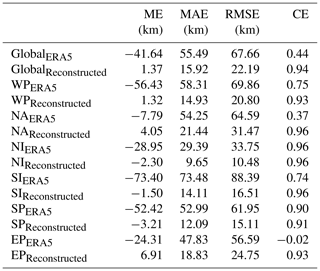
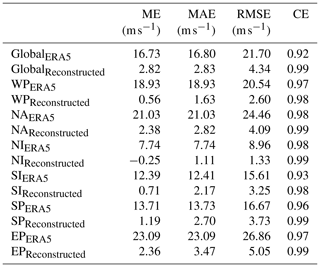
We evaluate the accuracy of the Vmax_RC model results according to various statistical metrics based on the testing datasets (Fig. 4), as prescribed by Breiman (2001). The Vmax_RC data are strongly correlated with observations, with correlation coefficients exceeding 0.98 for all six basins. The RMSE values for the WP, NA, NI, SI, SP, and EP basins are 2.60, 4.09, 1.33, 3.25, 3.73, and 5.05 m s−1, respectively. Compared to Vmax_ERA5, the reconstruction provides a reduction in the MAE of over 10 m s−1 in most basins, with a further reduction of 19.62 m s−1 in the east Pacific basin, as described in detail in Table 4. The model is more effective at reducing biases between ERA5-derived results and observations for larger Vmax values. Furthermore, given the high influence of the El Niño–Southern Oscillation (ENSO) on TC intensity (Chu, 2004), we evaluate the accuracy of Vmax_RC for moderate to strong El Niño and La Niña years (Figs. S2 and S3 in the Supplement). We also observe a high degree of correlation coefficients (>0.97) and low RMSE values (<5 m s−1) between Vmax_RC and Vmax in all six basins during ENSO years. These metrics demonstrate the better accuracy of Vmax_RC and its reduced bias compared to Vmax_ERA5.
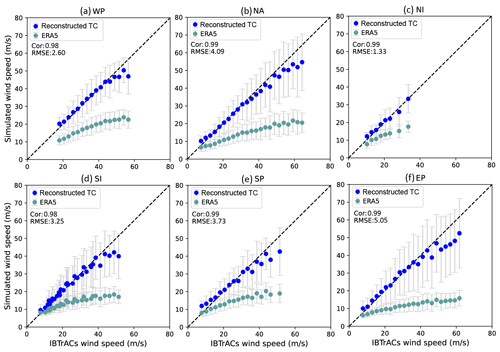
Figure 4Comparison between value-averaged maximum wind speeds (Vmax) from ERA5-derived and reconstructed (ERA5 + random forest) data and IBTrACS maximum wind speeds for tropical cyclones in the (a) western Pacific, (b) North Atlantic, (c) north Indian, (d) south Indian, (e) South Pacific, and (f) eastern Pacific basins. Grey lines represent the error bar, given as 1 standard deviation from the mean. The values with sample sizes less than 30 in IBTrACS are excluded.
Table 4Basic information on the comparison of the ERA5-derived and reconstructed with observed Vmax. ME, mean error; MAE, mean absolute error; RMSE, root mean square error; CE, correlation coefficient.
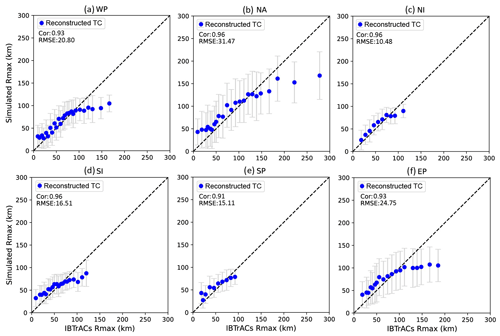
We similarly evaluate the accuracy of Rmax_RC for the six basins based on the testing datasets (Fig. 5). Correlation coefficients between Rmax_RC and Rmax recorded in IBTrACS (Rmax_IB) exceed 0.9, indicating strong correlation between the reconstructed results and observations. Moreover, the RMSEs for the WP, NA, NI, SI, SP, and EP basins are 20.80, 31.47 10.48, 16.51, 15.11, and 24.75 km, respectively. Importantly, Rmax_ERA5 exhibits a large deviation from observations, exceeding 300 km at very low Rmax_IB values. Therefore, for clarity, the Rmax_ERA5 data are not shown with the reconstructed TC results in Fig. 5. The MAE exhibits a reduction of 39.57 km on a global scale, with a further reduction of over 59.37 km in the SI basin, as described in detail in Table 5. It is noteworthy that the error bars are larger for the NA and EP basins in comparison to the other basins. This may be attributed to the low correlations between Rmax in IBTrACS and in ERA5 (NA: 0.37; EP: −0.02). Although the Rmax_RC data slightly overestimate observations at low Rmax_IB values and underestimate observations at high Rmax_IB values, they greatly reduce biases compared to the Rmax_ERA5 data and thus produce better predictions for all six basins.
We compute Pmin_RC based on an empirical wind–pressure relationship. We employ Vmax_IB and the corresponding Pmin recorded in IBTrACS (Pmin_IB) in the reconstruction, and we obtain Penv from the ERA5 dataset, following the method of Bloemendaal et al. (2020). We estimate related parameters through nonlinear fitting; the results are shown in Fig. 6. For the WP, NA, NI, SI, SP, and EP basins, we use a values of 0.118, 0.051, 0.259, 0.184, 0.325, and 0.073 and b values of 1.67, 1.692, 1.402, 1.507, 1.371, and 1.651, respectively, in Eq. (3).
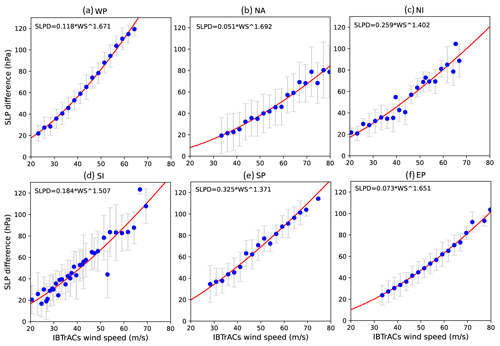
Figure 6Similar to Fig. 4 but for nonlinear regression analyses between value-averaged IBTrACS maximum wind speeds and the difference between environmental pressure and typical cyclone minimum central pressure (sea level pressure difference, SLPD).
The mean and standard deviation values of various TC characteristics based on the testing datasets are plotted in Fig. 7 to compare the overall performance of the model in reconstructing TCs. Mean biases in Rmax and Pmin between the reconstructed TC and IBTrACS datasets are both <3 % in most basins, providing compelling evidence that the predictions are in good agreement with observations. In contrast to those over the sea, the reconstructed dataset overestimate and underestimate landfall TC Vmax and Rmax in most basins, respectively, likely due to the decay of TC wind speeds after landfall, which is not considered in the RF-based models. Despite these differences, biases remain within 5 % in most basins, indicating that the reconstructed landfall TC characteristics are closely aligned with those in the IBTrACS dataset.
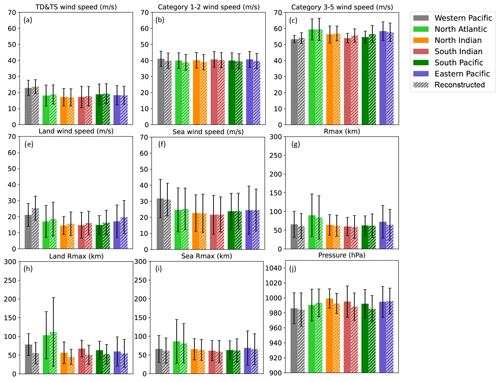
Figure 7Bar charts for comparing the mean value of the different tropical cyclone characteristics. Each of the colors indicates a different basin. Solid and dashed bars represent IBTrACS and reconstructed tropical cyclone data, respectively.
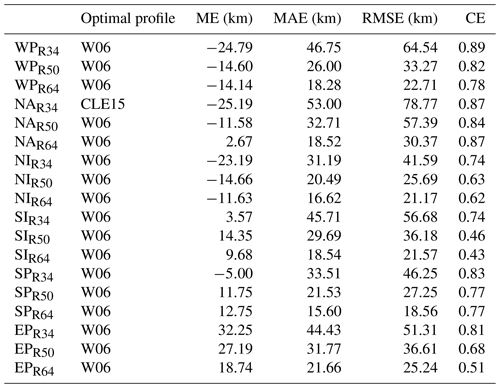
After obtaining the reconstructed TC intensity dataset, we use six widely used models to estimate R34_RC, R50_RC, and R64_RC. We conduct a comparative analysis of the model-derived results and observations to determine which radial wind profile estimate more closely approximated the TC outer radius, based on various statistical metrics (Tables S1–S6 in the Supplement). In the WP basin, the W06 model demonstrates the strongest correlation (R34: 0.89, R50: 0.82, R64: 0.78), achieving the lowest RMSE and MAE. In the NA basin, the CLE15 model outperforms others for R34, with a correlation coefficient of 0.87, RMSE of 78.77 km, and MAE of 53 km, whereas the W06 model performs better for R50 and R64. For the NI and SI basins, all models except W06 show poor correlation with observations, some even exhibiting negative correlations. In the SP and EP basins, W06 substantially surpasses other models in terms of correlation coefficient. Although other models produce slightly smaller RMSE and MAE values for R64 in the EP basin compared to W06, their correlation coefficients, which are <0.2, justify our choice of W06. Consequently, we select W06 to forecast R34_RC, R50_RC, and R64_RC for the WP, NI, SI, SP, and EP basins, whereas for the NA basin, we use CLE15 to predict R34_RC and W06 to predict R50_RC and R64_RC. The correlation coefficients are >0.75 for three outer-size metrics in most basins (Table 6).
Table 6Basic information on the comparison of the reconstructed data with the observational data for R34, R50, and R64. ME, mean error; MAE, mean absolute error; RMSE, root mean square error; CE, correlation coefficient. H80, D87, W06, E11, F13, and CLE15 refer to the wind field models proposed by Holland (1980), DeMaria (1987), Willoughby et al. (2006), Emanuel and Rotunno (2011), Frisius and Scgönemann (2013), and Chavas et al. (2015).
We use the ERA5 dataset to derive parameters characterizing TC intensity and size in creating the TC reconstruction dataset. Then, we subject these parameters to a machine learning algorithm to produce more accurate data. Notably, we acknowledge that the TC intensity and size reconstructions developed in this study may be influenced by the limitations and uncertainties inherent in the IBTrACS and ERA5 datasets. The RF models are unable to differentiate between landfall and offshore TCs due to the limited data available concerning landfall TCs in the IBTrACS dataset, which results in higher Vmax and lower Rmax values for landfall TCs. When employing this dataset for the purpose of examining the characteristics and impacts of TCs during their landfall, it is possible to overestimate their intensity while underestimating the scope of their influence. Additionally, we estimate R34, R50, and R64 using wind profile models rather than RF models due to the paucity of relevant data, which results in a lower level of accuracy than for these TC characteristics. Moreover, there is some dependency between the reconstructed and IBTrACS-derived Rmax values, likely due to the insufficient spatial resolution of the ERA5 dataset. Finally, TC positions in the IBTrACS data exhibit some degree of inaccuracy during the pre-satellite time period. Therefore, when assessing the impacts of TCs using this dataset, e.g., TC risk assessment, it is crucial to validate the results through observations from meteorological stations, buoys, and other relevant methods. Notwithstanding these limitations, the TC reconstruction dataset exhibits a markedly high degree of accuracy and extensive spatiotemporal coverage. Basic information on the reconstructed TC data is presented in Table 7.
All data have been published in the form of CSV files and are made publicly available through the Zenodo repository at https://doi.org/10.5281/zenodo.13919874 (Xu et al., 2024). ERA5 data are publicly accessible at https://doi.org/10.24381/cds.bd0915c6 (Hersbach et al., 2023b) and https://doi.org/10.24381/cds.adbb2d47 (Hersbach et al., 2023a). IBTrACS data are accessible at https://doi.org/10.25921/82ty-9e16 (Gahtan et al., 2024). The processing codes can be made available upon request to the corresponding author.
The considerable number of unrecorded TC characteristics in the IBTrACS dataset and large biases inherent in the ERA5 dataset prompt us to generate a long-term TC reconstruction dataset. We construct the dataset by integrating TC characteristics from the IBTrACS and ERA5 datasets using RF-based models, an empirical wind–pressure relationship, and six wind profiles for the period 1959–2022. The TC reconstruction dataset is approximately 3–4 times larger than the IBTrACS dataset in terms of data points per characteristic, with much higher data accuracy than shown for ERA5-derived results.
We examine six TC characteristics to evaluate the reconstructed dataset. A comparison of maximum sustained wind speeds between the IBTrACS and reconstructed TC datasets reveals that the latter underestimated observational data by approximately 2.82 m s−1, which is a considerably smaller bias than that shown by the ERA5 dataset (16.73 m s−1) on a global scale. For the radius of maximum wind (Rmax), the mean error and RMSE decrease markedly, from −41.64 and 67.66 km (IBTrACS Rmax – ERA5 Rmax) to 1.37 and 22.19 km (IBTrACS Rmax – reconstructed Rmax), respectively. In addition, the correlation coefficient for Rmax between the IBTrACS and ERA5 datasets is 0.44, which increased to 0.94 between the IBTrACS and TC reconstruction datasets. The mean bias in minimum central pressure between the IBTrACS and reconstructed TC datasets is <3 % in most basins. We use six wind profile models to compute the radii to locations with sustained wind speeds of 34, 50, and 64 kn (i.e., R34, R50, and R64; ∼17, 26, and 33 m s−1), and the selected wind profile models (CLE15 for R34 in the North Atlantic, W06 for others) show good estimates for TC outer sizes, with correlation coefficients >0.75 for three outer-size metrics in most basins. Overall, the TC reconstruction dataset agrees closely with the IBTrACS data in terms of TC intensity and size.
In conclusion, the TC reconstruction dataset may prove invaluable for advancing our understanding of TC climatology, thereby facilitating risk assessments and defenses against TC-related disasters. The future availability of reanalysis data with finer spatial resolution and longer temporal coverage, such as the in-progress ERA6, will facilitate the creation of more accurate TC reconstructions with longer time spans using the methods presented in this study.
The supplement related to this article is available online at: https://doi.org/10.5194/essd-16-5753-2024-supplement.
ZX, JG, and GZ wrote the first draft of the manuscript. ZX, JG, and YY developed the model code and conducted scientific analyses. All authors contributed to the writing and the editing of the manuscript.
The contact author has declared that none of the authors has any competing interests.
Publisher's note: Copernicus Publications remains neutral with regard to jurisdictional claims made in the text, published maps, institutional affiliations, or any other geographical representation in this paper. While Copernicus Publications makes every effort to include appropriate place names, the final responsibility lies with the authors.
This work was financially supported by the National Natural Science Foundation of China (NSFC42205040, NSFC42325501, and NSFC42205170) and the Youth Innovation Team of the China Meteorological Administration (no. CMA2024QN14).
This research has been supported by the National Natural Science Foundation of China (grant nos. NSFC42205040, NSFC42325501, and NSFC42205170) and the Youth Innovation Team of the China Meteorological Administration (grant no. CMA2024QN14).
This paper was edited by Jing Wei and reviewed by Bin Mu and one anonymous referee.
Atkinson, G. D. and Holliday, C. R.: Tropical cyclone minimum sea level pressure/maximum sustained wind relationship for the western North Pacific, Mon. Weather Rev., 105, 421–427, https://doi.org/10.1175/1520-0493(1977)105<0421:TCMSLP>2.0.CO;2, 1977.
Bell, B., Hersbach, H., Simmons, A., Berrisford, P., Dahlgren, P., Horányi, A., Muñoz-Sabater, J., Nicolas, J., Radu, R., Schepers, D., and Soci, C.: The ERA5 global reanalysis: Preliminary extension to 1950, Q. J. Roy. Meteor. Soc., 147, 4186–4227, https://doi.org/10.1002/qj.4174, 2021.
Bian, G. F., Nie, G. Z., and Qiu, X.: How well is outer tropical cyclone size represented in the ERA5 reanalysis dataset?, Atmos. Res., 249, 105339, https://doi.org/10.1016/j.atmosres.2020.105339, 2021.
Bloemendaal, N., Haigh, I. D., de Moel, H., Muis, S., Haarsma, R. J., and Aerts, J. C.: Generation of a global synthetic tropical cyclone hazard dataset using STORM, Sci. Data, 7, 40, https://doi.org/10.1038/s41597-020-0381-2, 2020.
Breiman, L.: Random forests, Mach. Learn., 45, 5–32, https://doi.org/10.1023/A:1010933404324, 2001.
Casas, E. G., Tao, D., and Bell, M. M.: An intensity and size phase space for tropical cyclone structure and evolution, J. Geophys. Res.-Atmos., 128, e2022JD037089, https://doi.org/10.1029/2022JD037089, 2023.
Chavas, D. R. and Vigh, J.: QSCAT-R: The QuikSCAT tropical cyclone radial structure dataset, NCAR Tech. Note TN-513+STR, https://doi.org/10.5065/d65b00j3, 2014.
Chavas, D. R., Lin, N., and Emanuel, K.: A model for the complete radial structure of the tropical cyclone wind field. Part I: Comparison with observed structure, J. Atmos. Sci., 72, 3647–3662, https://doi.org/10.1175/JAS-D-15-0014.1, 2015.
Chavas, D. R., Reed, K. A., and Knaff, J. A.: Physical understanding of the tropical cyclone wind-pressure relationship, Nat. Commun., 8, 1360, https://doi.org/10.1038/s41467-017-01546-9, 2017.
Chu, P. S.: ENSO and tropical cyclone activity, in: Hurricanes and typhoons: Past, present, and potential, 297–332, https://www.soest.hawaii.edu/MET/Hsco/publications/2004.2.pdf (last access: 16 December 2024), 2004.
CRED: 2023 Disasters in Numbers: A Significant Year of Disaster Impact, Université catholique de Louvain (UCL) – CRED, Brussels, Belgium, https://files.emdat.be/reports/2023_EMDAT_report.pdf (last access: 16 December 2024), 2023.
DeMaria, M.: Tropical cyclone track prediction with a barotropic spectral model, Mon. Weather Rev., 115, 2346–2357, https://doi.org/10.1175/1520-0493(1987)115<2346:TCTPWA>2.0.CO;2, 1987.
Demuth, J. L., DeMaria, M., and Knaff, J. A.: Improvement of Advanced Microwave Sounding Unit tropical cyclone intensity and size estimation algorithms, J. Appl. Meteorol. Clim., 45, 1573–1581, https://doi.org/10.1175/JAM2429.1, 2006.
Dulac, W., Cattiaux, J., Chauvin, F., Bourdin, S., and Fromang, S.: Assessing the representation of tropical cyclones in ERA5 with the CNRM tracker, Clim. Dynam., 62, 223–238, https://doi.org/10.1007/s00382-023-06902-8, 2024.
Emanuel, K. and Rotunno, R.: Self-stratification of tropical cyclone outflow. Part I: Implications for storm structure, J. Atmos. Sci., 68, 2236–2249, https://doi.org/10.1175/JAS-D-10-05024.1, 2011.
Eusebi, R., Vecchi, G. A., Lai, C. Y., and Tong, M.: Realistic tropical cyclone wind and pressure fields can be reconstructed from sparse data using deep learning, Commun. Earth Environ., 5, 8, https://doi.org/10.1038/s43247-023-01144-2, 2024.
Frisius, T., Schönemann, D., and Vigh, J.: The impact of gradient wind imbalance on potential intensity of tropical cyclones in an unbalanced slab boundary layer model, J. Atmos. Sci., 70, 1874–1890, https://doi.org/10.1175/JAS-D-12-0160.1, 2013.
Gahtan, J., Knapp, K. R., Schreck, C. J., Diamond, H. J., Kossin, J. P., and Kruk, M. C.: International Best Track Archive for Climate Stewardship (IBTrACS) Project, Version 4r01, NOAA National Centers for Environmental Information, https://doi.org/10.25921/82ty-9e16, 2024.
Geiger, T., Frieler, K., and Bresch, D. N.: A global historical data set of tropical cyclone exposure (TCE-DAT), Earth Syst. Sci. Data, 10, 185–194, https://doi.org/10.5194/essd-10-185-2018, 2018.
Gori, A., Lin, N., Schenkel, B., and Chavas, D.: North Atlantic Tropical Cyclone Size and Storm Surge Reconstructions From 1950–Present, J. Geophys. Res.-Atmos., 128, e2022JD037312, https://doi.org/10.1029/2022JD037312, 2023.
Gray, W. M.: Global view of the origin of tropical disturbances and storms, Mon. Weather Rev., 96, 669–700, https://doi.org/10.1175/1520-0493(1968)096<0669:GVOTOO>2.0.CO;2, 1968.
Gualdi, S., Scoccimarro, E., and Navarra, A.: Changes in tropical cyclone activity due to global warming: Results from a high-resolution coupled general circulation model, J. Climate, 21, 5204–5228, https://doi.org/10.1175/2008JCLI1921.1, 2008.
Guo, J., Zhang, J., Shao, J., Chen, T., Bai, K., Sun, Y., Li, N., Wu, J., Li, R., Li, J., Guo, Q., Cohen, J. B., Zhai, P., Xu, X., and Hu, F.: A merged continental planetary boundary layer height dataset based on high-resolution radiosonde measurements, ERA5 reanalysis, and GLDAS, Earth Syst. Sci. Data, 16, 1–14, https://doi.org/10.5194/essd-16-1-2024, 2024.
Harper, B.: Tropical Cyclone Parameter Estimation in the Australian Region: Wind-Pressure Relationships and Related Issues for Engineering Planning and Design – A Discussion Paper, Systems Engineering Australia Pty Ltd for Woodside Energy Ltd, Perth, https://doi.org/10.13140/RG.2.2.13057.04961, 2002.
Hatsushika, H., Tsutsui, J., Fiorino, M., and Onogi, K.: Impact of wind profile retrievals on the analysis of tropical cyclones in the JRA-25 reanalysis, J. Meteorol. Soc. Jpn. Ser. II, 84, 891–905, https://doi.org/10.2151/jmsj.84.891, 2006.
Hersbach, H., Bell, B., Berrisford, P., Hirahara, S., Horányi, A., Muñoz-Sabater, J., Nicolas, J., Peubey, C., Radu, R., Schepers, D., Simmons, A., Soci, C., Abdalla, S., Abellan, X., Balsamo, G., Bechtold, P., Biavati, G., Bidlot, J., Bonavita, M., De Chiara, G., Dahlgren, P., Dee, D., Diamantakis, M., Dragani, R., Flemming, J., Forbes, R., Fuentes, M., Gebhardt, C., Haimberger, L., Healy, S., Hogan, R. J., Hólm, E., Janisková, M., Keeley, S., Laloyaux, P., Lopez, P., Lupu, C., Radnoti, G., de Rosnay, P., Rozum, I., Vamborg, F., Villaume, S., and Thépaut, J.-N.: The ERA5 global reanalysis, Q. J. Roy. Meteor. Soc., 146, 1999–2049, https://doi.org/10.1002/qj.3803, 2020.
Hersbach, H., Bell, B., Berrisford, P., Biavati, G., Horányi, A., Muñoz Sabater, J., Nicolas, J., Peubey, C., Radu, R., Rozum, I., Schepers, D., Simmons, A., Soci, C., and Dee, D.: ERA5 hourly data on single levels from 1940 to present, Copernicus Climate Change Service (C3S) Climate Data Store (CDS) [data set], https://doi.org/10.24381/cds.adbb2d47, 2023a.
Hersbach, H., Bell, B., Berrisford, P., Biavati, G., Horányi, A., Muñoz Sabater, J., Nicolas, J., Peubey, C., Radu, R., Rozum, I., Schepers, D., Simmons, A., Soci, C., Dee, D., and Thépaut, J.-N.: ERA5 hourly data on pressure levels from 1940 to present, Copernicus Climate Change Service (C3S) Climate Data Store (CDS) [data set], https://doi.org/10.24381/cds.bd0915c6, 2023b.
Hill, K. A. and Lackmann, G. M.: Influence of environmental humidity on tropical cyclone size, Mon. Weather Rev., 137, 3294–3315, https://doi.org/10.1175/2009MWR2679.1, 2009.
Holland, G. J.: An analytic model of the wind and pressure profiles in hurricanes, Mon. Weather Rev., 108, 1212–1218, https://doi.org/10.1175/1520-0493(1980)108<1212:AAMOTW>2.0.CO;2, 1980.
Kistler, R., Kalnay, E., Collins, W., Saha, S., White, G., Woollen, J., Chelliah, M., Ebisuzaki, W., Kanamitsu, M., Kousky, V., van den Dool, H., Jenne, R., and Fiorino, M.: The NCEP–NCAR 50 year reanalysis: monthly means CD-ROM and documentation, B. Am. Meteorol. Soc., 82, 247–268, https://doi.org/10.1175/1520-0477(2001)082<0247:TNNYRM>2.3.CO;2, 2001.
Knapp, K. R., Kruk, M. C., Levinson, D. H., Diamond, H. J., and Neumann, C. J.: The international best track archive for climate stewardship (IBTrACS) unifying tropical cyclone data, B. Am. Meteorol. Soc., 91, 363–376, https://doi.org/10.1175/2009BAMS2755.1, 2010.
Knutson, T., Camargo, S. J., Chan, J. C., Emanuel, K., Ho, C. H., Kossin, J., Mohapatra, M., Satoh, M., Sugi, M., Walsh, K., and Wu, L.: Tropical cyclones and climate change assessment: Part I: Detection and attribution, B. Am. Meteorol. Soc., 100, 1987–2007, https://doi.org/10.1175/BAMS-D-18-0189.1, 2019.
Kobayashi, S., Ota, Y., Harada, Y., Ebita, A., Moriya, M., Onoda, H., Onogi, K., Kamahori, H., Kobayashi, C., Endo, H., Miyaoka, K., and Takahashi, K.: The JRA-55 reanalysis: General specifications and basic characteristics, J. Meteorol. Soc. Jpn. Ser. II, 93, 5–48, https://doi.org/10.2151/jmsj.2015-001, 2015.
Li, X., Han, X., Yang, J., Wang, J., and Han, G.: Transfer learning-based generative adversarial network model for tropical cyclone wind speed reconstruction from SAR images, IEEE T. Geosci. Remote, 62, 1–16, https://doi.org/10.1109/TGRS.2024.3390392, 2024.
Lin, N. and Chavas, D.: On hurricane parametric wind and applications in storm surge modeling, J. Geophys. Res.-Atmos., 117, D09120, https://doi.org/10.1029/2011JD017126, 2012.
Liu, K. S. and Chan, J. C. L.: Size of tropical cyclones as inferred from ERS-1 and ERS-2 data, Mon. Weather Rev., 127, 2992–3001, https://doi.org/10.1175/1520-0493(1999)127<2992:SOTCAI>2.0.CO;2, 1999.
Magnusson, L., Majumdar, S., Emerton, R., Richardson, D., Alonso-Balmaseda, M., Baugh, C., Bechtold, P., Bidlot, J., Bonanni, A., Bonavita, M., Bormann, N., Brown, A., Browne, P., Carr, H., Dahoui, M., De Chiara, G., Diamantakis, M., Duncan, D., English, S., Forbes, R., Geer, A., Haiden, T., Healy, S., Hewson, T., Ingleby, B., Janousek, M., Kuehnlein, C., Lang, S., Lock, S.-J., McNally, T., Mogensen, K., Pappenberger, F., Polichtchouk, I., Prates, F., Prudhomme, C., Rabier, F., de Rosnay, P., Quintino, T., Rennie, M., Titley, H., Vana, F., Vitart, F., Warrick, F., Wedi, N., and Zsoter, E.: Tropical cyclone activities at ECMWF, ECMWF Tech. Memo., ECMWF, University of Miami, https://doi.org/10.21957/zzxzzygwv, 2021.
Mei, W. and Xie, S. P.: Intensification of landfalling typhoons over the northwest Pacific since the late 1970s, Nat. Geosci., 9, 753–757, https://doi.org/10.1038/ngeo2792, 2016.
Mo, Y., Simard, M., and Hall, J. W.: Tropical cyclone risk to global mangrove ecosystems: potential future regional shifts, Front. Ecol. Environ., 21, 269–274, https://doi.org/10.1002/fee.2650, 2023.
Pérez-Alarcón, A., Sorí, R., Fernández-Alvarez, J. C., Nieto, R., and Gimeno, L.: Comparative climatology of outer tropical cyclone size using radial wind profiles, Weather Clim. Extremes, 33, 100366, https://doi.org/10.1016/j.wace.2021.100366, 2021.
Radu, R., Toumi, R., and Phau, J.: Influence of atmospheric and sea surface temperature on the size of hurricane Catarina, Q. J. Roy. Meteor. Soc., 140, 1778–1784, https://doi.org/10.1002/qj.2232, 2014.
Ren, H., Dudhia, J., and Li, H.: The size characteristics and physical explanation for the radius of maximum wind of hurricanes, Atmos. Res., 277, 106313, https://doi.org/10.1016/j.atmosres.2022.106313, 2022.
Schenkel, B. A. and Hart, R. E.: An examination of tropical cyclone position, intensity, and intensity life cycle within atmospheric reanalysis datasets, J. Climate, 25, 3453–3475, https://doi.org/10.1175/2011JCLI4208.1, 2012.
Schenkel, B. A., Lin, N., and Chavas, D.: Evaluating outer tropical cyclone size in reanalysis datasets using QuikSCAT data, J. Climate, 30, 8745–8762, https://doi.org/10.1175/JCLI-D-17-0122.1, 2017.
Simpson, R. H.: The hurricane disaster – Potential scale, Weatherwise, 27, 169–186, https://doi.org/10.1080/00431672.1974.9931702, 1974.
Sun, Y., Zhong, Z., Ha, Y., Wang, Y., and Wang, X.: The dynamic and thermodynamic effects of relative and absolute sea surface temperature on tropical cyclone intensity, Acta Meteorol. Sin., 27, 40–49, https://doi.org/10.1007/s13351-013-0105-z, 2013.
Sun, Y., Zhong, Z., Yi, L., Ha, Y., and Sun, Y.: The opposite effects of inner and outer sea surface temperature on tropical cyclone intensity, J. Geophys. Res.-Atmos., 119, 2193–2208, https://doi.org/10.1002/2013jd021354, 2014.
Thompson, D. T., Keim, B. D., and Brown, V. M.: Construction of a tropical cyclone size dataset using reanalysis data, Int. J. Climatol., 44, 3028–3053, https://doi.org/10.1002/joc.8511, 2024.
Vincent, E. M., Emanuel, K. A., Lengaigne, M., Vialard, J., and Madec, G.: Influence of upper ocean stratification interannual variability on tropical cyclones, J. Adv. Model. Earth Sy., 6, 680–699, https://doi.org/10.1002/2014MS000327, 2014.
Walsh, K. J. E., McBride, J. L., Klotzbach, P. J., Balachandran, S., Camargo, S. J., Holland, G., Knutson, T. R., Kossin, J. P., Lee, T.-C., Sobel, A., and Sugi, M.: Tropical cyclones and climate change, WIRes Clim. Change, 7, 65–89, https://doi.org/10.1002/wcc.371, 2016.
Weber, H. C., Lok, C. C. F., Davidson, N. E., and Xiao, Y.: Objective estimation of the radius of the outermost closed isobar in tropical cyclones, Trop. Cyclone Res. Rev., 3, 1–21, https://doi.org/10.6057/2014TCRR01.01, 2014.
Webster, P. J., Holland, G. J., Curry, J. A., and Chang, H. R.: Changes in tropical cyclone number, duration, and intensity in a warming environment, Science, 309, 1844–1846, https://doi.org/10.1126/science.1116448, 2005.
Willoughby, H. E., Darling, R. W. R., and Rahn, M. E.: Parametric representation of the primary hurricane vortex. Part II: A new family of sectionally continuous profiles, Mon. Weather Rev., 134, 1102–1120, https://doi.org/10.1175/MWR3106.1, 2006.
Wright, C. J.: Quantifying the global impact of tropical cyclone-associated gravity waves using HIRDLS, MLS, SABER and IBTrACS data, Q. J. Roy. Meteor. Soc., 145, 3023–3039, https://doi.org/10.1002/qj.3602, 2019.
Wu, L., Zhao, H., Wang, C., Cao, J., and Liang, J.: Understanding of the effect of climate change on tropical cyclone intensity: A Review, Adv. Atmos. Sci., 39, 205–221, https://doi.org/10.1007/s00376-021-1026-x, 2022.
Xu, Z., Sun, Y., Li, T., Zhong, Z., Liu, J., and Ma, C.: Tropical cyclone size change under ocean warming and associated responses of tropical cyclone destructiveness: idealized experiments, J. Meteorol. Res.-PRC, 34, 163–175, https://doi.org/10.1007/s13351-020-8164-4, 2020.
Xu, Z., Guo, J., Zhang, G., Ye, Y., Zhao, H., and Chen, H.: Global tropical cyclone size and intensity reconstruction dataset for 1959–2022 based on IBTrACS and ERA5 data, Zenodo [data set], https://doi.org/10.5281/zenodo.13919874, 2024.
Yang, Q., Lee, C. Y., Tippett, M. K., Chavas, D. R., and Knutson, T. R.: Machine learning–based hurricane wind reconstruction, Weather Forecast., 37, 477–493, https://doi.org/10.1175/WAF-D-21-0077.1, 2022.
Yeasmin, A., Chand, S., and Sultanova, N.: Reconstruction of tropical cyclone and depression proxies for the South Pacific since the 1850s, Weather Clim. Extremes, 39, 100543, https://doi.org/10.1016/j.wace.2022.100543, 2023.
Zhuo, J. Y. and Tan, Z. M.: A Deep-Learning Reconstruction of Tropical Cyclone Size Metrics 1981–2017: Examining Trends, J. Climate, 36, 5103–5123, https://doi.org/10.1175/JCLI-D-22-0714.1, 2023.
Zick, S. E. and Matyas, C. J.: Tropical cyclones in the North American Regional Reanalysis: The impact of satellite-derived precipitation over ocean, J. Geophys. Res.-Atmos., 120, 8724–8742, https://doi.org/10.1002/2015JD023722, 2015.


