the Creative Commons Attribution 4.0 License.
the Creative Commons Attribution 4.0 License.
 | 25 Sep 2024
Comparison of observation- and inventory-based methane emissions for eight large global emitters
Ana Maria Roxana Petrescu
Glen P. Peters
Richard Engelen
Sander Houweling
Dominik Brunner
Aki Tsuruta
Bradley Matthews
Prabir K. Patra
Dmitry Belikov
Rona L. Thompson
Lena Höglund-Isaksson
Wenxin Zhang
Arjo J. Segers
Giuseppe Etiope
Giancarlo Ciotoli
Philippe Peylin
Frédéric Chevallier
Tuula Aalto
Robbie M. Andrew
David Bastviken
Antoine Berchet
Grégoire Broquet
Giulia Conchedda
Stijn N. C. Dellaert
Hugo Denier van der Gon
Johannes Gütschow
Jean-Matthieu Haussaire
Ronny Lauerwald
Tiina Markkanen
Jacob C. A. van Peet
Isabelle Pison
Pierre Regnier
Espen Solum
Marko Scholze
Maria Tenkanen
Francesco N. Tubiello
Guido R. van der Werf
John R. Worden
Monitoring the spatial distribution and trends in surface greenhouse gas (GHG) fluxes, as well as flux attribution to natural and anthropogenic processes, is essential to track progress under the Paris Agreement and to inform its global stocktake. This study updates earlier syntheses (Petrescu et al., 2020, 2021, 2023), provides a consolidated synthesis of CH4 emissions using bottom-up (BU) and top-down (TD) approaches for the European Union (EU), and is expanded to include seven additional countries with large anthropogenic and/or natural emissions (the USA, Brazil, China, India, Indonesia, Russia, and the Democratic Republic of the Congo (DR Congo)). Our aim is to demonstrate the use of different emission estimates to help improve national GHG emission inventories for a diverse geographical range of stakeholders.
We use updated national GHG inventories (NGHGIs) reported by Annex I parties under the United Nations Framework Convention on Climate Change (UNFCCC) in 2023 and the latest available biennial update reports (BURs) reported by non-Annex I parties. Comparing NGHGIs with other approaches highlights that different system boundaries are a key source of divergence. A key system boundary difference is whether anthropogenic and natural fluxes are included and, if they are, how fluxes belonging to these two sources are partitioned.
Over the studied period, the total CH4 emission estimates in the EU, the USA, and Russia show a steady decreasing trend since 1990, while for the non-Annex I emitters analyzed in this study, Brazil, China, India, Indonesia, and DR Congo, CH4 emissions have generally increased. Quantitatively, in the EU the mean of 2015–2020 anthropogenic UNFCCC NGHGIs (15±1.8 Tg CH4 yr−1) and the mean of the BU CH4 emissions (17.8 (16–19) Tg CH4 yr−1) generally agree on the magnitude, while inversions show higher emission estimates (medians of 21 (19–22) Tg CH4 yr−1 and 24 (22–25) Tg CH4 yr−1 for the three regional and six global inversions, respectively), as they include natural emissions, which for the EU were quantified at 6.6 Tg CH4 yr−1 (Petrescu et al., 2023). Similarly, for the other Annex I parties in this study (the USA and Russia), the gap between the BU anthropogenic and total TD emissions is partly explained by the natural emissions.
For the non-Annex I parties, anthropogenic CH4 estimates from UNFCCC BURs show large differences compared to the other global-inventory-based estimates and even more compared to atmospheric ones. This poses an important potential challenge to monitoring the progress of the global CH4 pledge and the global stocktake. Our analysis provides a useful baseline to prepare for the influx of inventories from non-Annex I parties as regular reporting starts under the enhanced transparency framework of the Paris Agreement.
By systematically comparing the BU and TD methods, this study provides recommendations for more robust comparisons of available data sources and hopes to steadily engage more parties in using observational methods to complement their UNFCCC inventories, as well as considering their natural emissions. With anticipated improvements in atmospheric modeling and observations, as well as modeling of natural fluxes, future development needs to resolve knowledge gaps in the BU and TD approaches and to better quantify the remaining uncertainty. TD methods may emerge as a powerful tool to help improve NGHGIs of CH4 emissions, but further confidence is needed in the comparability and robustness of the estimates.
The referenced datasets related to figures are available at https://doi.org/10.5281/zenodo.12818506 (Petrescu et al., 2024).
Please read the corrigendum first before continuing.
-
Notice on corrigendum
The requested paper has a corresponding corrigendum published. Please read the corrigendum first before downloading the article.
-
Article
(3306 KB)
-
The requested paper has a corresponding corrigendum published. Please read the corrigendum first before downloading the article.
- Article
(3306 KB) - Full-text XML
- Corrigendum
- Companion paper 1
- Companion paper 2
-
Supplement
(1083 KB) - BibTeX
- EndNote


In 2021, the NOAA Global Monitoring Laboratory (GML) reported the largest annual increase in atmospheric CH4 mixing ratios since records began in 1983, at 17 parts per billion (ppb) (NOAA (https://gml.noaa.gov/ccgg/trends_ch4/, last access: January 2024). In 2022, atmospheric CH4 concentrations averaged 1912 ppb yr−1, 162 % higher than pre-industrial levels. A similar, abnormally large growth rate of 14.8 ppb yr−1 was detected from total column mixing ratio measurements (XCH4) by the Greenhouse Gases Observing Satellite (GOSAT) (Peng et al., 2022).
CH4 in the atmosphere has many different sources, of both natural origin and anthropogenic origin. The natural sources of CH4 are dominated by wetlands, while anthropogenic emissions principally come from agricultural activities (livestock and rice farming); waste management (landfills and water treatment plants); and the production, transportation, and use of fossil fuels. Most of the agricultural sources are distributed sources, while the energy-related industrial sources of CH4 are a mix of large point sources, of which some are detectable by satellite (Jacob et al., 2022), and smaller point and distributed sources of fugitive emissions (e.g., leaks in pipelines and compression stations), which are more challenging to identify (Rutherford et al., 2021; Omara et al., 2022).
While anthropogenic CH4 emissions from fossil fuels, agriculture, and waste can be reduced by mitigation actions, increased natural emissions lead to different challenges. It has been suggested that the drivers of the recent growth are most likely driven primarily by biogenic emissions (Basu et al., 2022; Lan et al., 2021a, b, 2022; Nisbet et al., 2016, 2019), with smaller contributions from increased fossil fuel emissions and a reduced atmospheric sink (Nisbet, 2023). Fluctuations in natural sources – dominated by wetlands and open water bodies – were the main reasons for some of the atmospheric CH4 anomalies observed during the last decades (Rocher-Ros et al., 2023; Zhang et al., 2023; Nisbet, 2023; Lunt et al., 2019; McNorton et al., 2022). Nisbet (2023) review recent studies, including those which quantified the observed methane growth in the last years. Using a global inverse analysis of GOSAT satellite observations, increases in the range of 22–32 Tg CH4 yr−1 were detected between 2019 and 2020 and were attributed to biogenic sources, half of which took place in East Africa (∼15 Tg yr−1), and some were observed in Canada and Alaska (4.8 Tg yr−1) (Qu et al., 2022; Basu et al., 2022).
Chandra et al. (2021) identified a few main sectors that triggered increases and decreases in the anthropogenic CH4 emissions of different countries. The first is energy, with its fugitive emissions from the oil and gas industry whose decline in emissions helped stabilize CH4 concentration in the 1990s, before they contributed to the renewed CH4 growth since the late 2000s (increased emissions). The other major sectors that drove changes in the CH4 growth rate were agriculture (increase in emissions from enteric fermentation and manure management) and waste. The increase in emissions from enteric fermentation and manure management was caused primarily by increased animal numbers and, in addition, by the greater intensity of ruminant farming as estimated by the FAO and the emission inventories (e.g., EDGAR), which might take into account productivity increases (Crippa et al., 2020; Wolf et al., 2017; FAO, 2018), while inventory emissions from waste can account for up to 43 % of the linear increase in emissions for the rest of the world.
The contribution of CH4 to global warming has been estimated to be about 0.5 °C relative to the period 1850–1900 (IPCC, 2021) (Stavert et al., 2022). Methane has a relatively short perturbation lifetime (averaging 12.4 years, Balcombe et al., 2018) and a high global warming potential (86 and 34 for 20- and 100-year time horizons, respectively, compared to that of CO2 emissions, IPCC, 2021, Table 7.15). Given the short lifetime, a decline in CH4 emissions will rapidly reduce the global warming contribution from CH4 and help mitigate the impact of climate change at decadal timescale (Cain et al., 2022). However, efforts to reduce CH4 emissions require a thorough understanding of the dominant CH4 sources and sinks and their temporal and regional distribution and trends (Stavert et al., 2022).
The Paris Agreement, a milestone of the UNFCCC to combat climate change and adapt to its effects, entered into force on 4 November 2016. It asks each signatory to define and communicate its planned climate actions, known as nationally determined contributions (NDCs), and to report their progress towards their targets. Next to commitments adopted by countries at COP26, the Global Methane Pledge (GMP) was launched. The goal of the GMP is to cut anthropogenic CH4 emissions by at least 30 % by 2030 with respect to 2020 levels, it is seen as the fastest way to reduce near-term warming, and it is necessary to keep a 1.5 °C temperature limit within reach. Achieving this goal will drive significant gains through specific energy and agriculture defined pathways including innovative actions, national targeted policies, and green climate funds to help smallholder farmers (https://www.state.gov/global-methane-pledge-from-moment-to-momentum/, last access: May 2024; The Global methane Pledge, 2023). About 150 countries joined this pledge and about 50 have already developed national CH4 action plans or are doing so. As agriculture and waste are the main anthropogenic sources for CH4 emissions, a GMP food and agriculture pathway and a GMP waste pathway were launched at COP27, foreseeing actions that increase agricultural productivity while reducing emissions from dairy, food loss, and waste by supporting small farmers and innovation (https://www.state.gov/global-methane-pledge-from-moment-to-momentum/).
Starting in 2024, non-Annex I parties to the UNFCCC must – provided they have sufficient capacities – report formal inventories under the Paris Agreement's enhanced transparency framework following the same guidelines and rules as the Annex I countries (Perugini et al., 2021). Furthermore, they will undergo more stringent reviews than those that were previously looked at in the biennial update reports (BURs; UNFCCC BURs, 2024) and NDCs (UNFCCC NDCs, 2024). This will also allow strengthening the robustness of such comparison exercises when using independent atmospheric observations in estimating trends and patterns for regional and national CH4 emissions (IPCC, 2006a). The influx of new inventories will place additional demands on independent emission estimates to help improve and inform national greenhouse gas inventories (NGHGIs), particularly in countries with low capacity.
With an increased focus on CH4 in climate policy, there is a demand to ensure that planned emission reductions are realized. Further, as non-Annex I countries begin regular reporting of emission estimates under the enhanced transparency framework, there is a need to help countries improve their GHG emission estimates. This has created an active field of research comparing NGHGI and independent estimates. Our analysis builds on the 3-year EU-funded project CoCO2, which had as main objective the building of prototype systems for a European monitoring and verification support capacity for anthropogenic CO2 (and CH4) emissions (CO2MVS). In this context, one of the results of the CoCO2 project was the production of a blueprint for a decision support system to be used in an eventual CO2MVS, aiming at informing and attracting the attention of diverse climate stakeholders on the use of the results needed beyond research. Therefore, the objectives of this study reflect those of the blueprint and focus on user engagement. It builds on dialogues with a broad community of users (e.g., scientists, inventory agencies, policy makers), considering their opinions and needs when it comes to comparisons between independent approaches. Furthermore, this study expands beyond the EU to include seven countries that have large anthropogenic and/or natural CH4 emissions (the USA, Brazil, China, India, Indonesia, Russia, and the Democratic Republic of the Congo). It examines Annex I (the EU, the USA, and Russia) and non-Annex I estimates from observation-based BU process-based models and inversions-based TD approaches (using satellite observations) by identifying and explaining differences with official inventory reports submitted by parties to the UNFCCC. The seven countries were chosen based on location and the importance and/or magnitude of their anthropogenic and natural emissions. By using multiple methodologies, uncertainties can be estimated by looking at the range in both emissions and trends.
In this work we focus on comparing BU and TD emission estimates. The “reconciliation process” described in this work is the action of making one dataset comparable with another to assess their consistency. In this respect, we attempt to obtain consistent results from both BU estimates and TD estimates through the harmonization of the results, concepts, and definitions. After the reconciliation process, the estimates do not necessarily agree, representing uncertainties in the different methods and datasets. We now describe the key data and methods used in our analysis.
2.1 Verification practices in official UNFCCC NGHGIs
Quality assurance/quality control (QA/QC) is a key component of NGHGI development. Verification is an additional step and refers specifically to methods that are external to the inventory and apply independent data. There are two main methods of verification: (1) independent inventory-based estimates and (2) observation-based emission estimates.
A challenge with comparisons against independent inventory-based estimates is that none of them is truly independent as they may rely on, for example, the same activity data reported by a country (Andrew, 2020). Experience has shown that performing detailed comparisons (Petrescu et al., 2021, 2023; Lauerwald et al., 2024) can help clarify differences in system boundaries or even identify errors (Andrew, 2020). Improving independent emission inventories also has value, as these are often used in global studies where common methods across all countries are desired.
Observation-based estimates use observations of atmospheric concentrations and prior fluxes that are then coupled to a transport model. These methods are more complex and computationally expensive and can make use of both direct observations and emission inventories.
The 2019 refinement of the 2006 IPCC guidelines highlighted notable advances in the application of inverse models of atmospheric transport for estimating emissions at the national scale. Building on this progress, they extend the guidance on the use of atmospheric measurements for verification (IPCC, 2019). There are several countries that currently use atmospheric measurements for verification of parts of their inventories. Australia (Luhar et al., 2020; UNFCCC Australia NIR, 2023) and New Zealand (Geddes et al., 2021) have estimated regional CH4 emissions to help better understand the methods and their potential. Germany performs various cross-validation checks with available data (UNFCCC Germany NIR, 2023), some of which are based on observations. The UK and Switzerland (Annex 6 in UNFCCC Switzerland NIR, 2023) have developed more comprehensive methods based on inversion modeling, covering several GHGs in addition to CH4. Building on modeling experience, the country reporting confirms that most of the potential lies in using observations to verify fluorinated gases (Annex 6 in UNFCCC UK NIR, 2023), but the large uncertainty in CH4 emissions gives the potential for verification if a sufficient observation network is used in inversion modeling (Bergamaschi et al., 2018; Thompson and Stohl, 2014).
While inversions of CH4 fluxes are associated with significant uncertainty, so are NGHGI estimates of anthropogenic CH4 emissions. Furthermore, inversions can provide information on subannual and subnational variations in time and space that may indicate differences in source sector emission estimates. In geographic areas with sufficiently dense ground-based observation networks, the inversions will have more value.
2.2 Anthropogenic CH4 emissions from the NGHGIs
Annex I countries report their annual GHG emissions to the UNFCCC in the so-called common reporting format (CRFs) data tables and national inventory reports (NIRs, UNFCCC NGHGI, 2023). Here, anthropogenic CH4 emissions from the five UNFCCC sectors, including land use, land use change, and forestry (LULUCF), are grouped together. As part of the LULUCF sector, we also have the CH4 emissions from wetlands, which according to the IPCC guidelines are defined as managed “where the water table is artificially changed (i.e. lowered or raised) or those created through human activity (e.g. damming a river) and that do not fall into Forest Land, Cropland, or Grassland categories (IPCC, 2014a)”. Reporting CH4 emissions from managed wetlands is not mandatory, but if done, parties are encouraged to make use of the 2013 IPCC wetlands supplement (IPCC, 2014b). In the EU, if member states report these emissions, they report not only restored (rewetted) wetlands but also emissions from drained organic and mineral soils (e.g., peatlands and ditches). These are not large by magnitude but are large by area in the Nordic countries. According to NGHGI data, in 2021, managed wetlands in the EU, for which emissions were reported under the LULUCF (CRF Table 4(II) and summary 1.As2 accessible for each EU country), summed up to 0.21 Tg CH4 yr−1, in comparison to total emissions of ∼15 Tg CH4 yr−1. Furthermore, the NGHGIs do not include any lateral fluxes from inland waters but do include biomass burning anthropogenic emissions reported under the LULUCF sector.
The presented uncertainties in the CH4 emission levels of the individual countries and the EU are not always reported in a complete and harmonized format and therefore were calculated by applying gap-filling and harmonization procedures that are used to compile the EU GHG inventory reported under UNFCCC EU NIR (2023) (see Supplement and Appendix A1.1 in Petrescu et al., 2023). The EU uncertainty analysis reported in the bloc's national inventory report (NIR) is based on country-level, Approach 1 uncertainty estimates (IPCC, 2006b) that are reported by EU member states, previously under Article 7(1)(p) of Regulation (EU) 525/2013 (2023) and since 2023 under Article 26(3) and Annex V(Part 1)(m) of the Governance Regulation (EU) 2018/1999 (2023).
Non-Annex I countries report their updated NGHGIs to the UNFCCC, including a national inventory report and information on mitigation actions, needs, and support received in biennial update reports (BURs). In this study, Brazil, China, Indonesia, India, and the Democratic Republic of the Congo (DR Congo) were investigated. For Brazil, information from its fourth BUR (Brazil, 2020) was used, giving total and sectoral split emission values for years 1994, 2000, 2010, 2012, 2015, and 2016. For China, information from its second BUR Tables 2-10, 2-13, 2-14, 2-15, and 2-16 was used (China, 2019). The information was available for total and sectoral split emission values for 1994, 2005, 2010, and 2014. Uncertainties for 2014 are available in Table 2-12. Indonesia submitted its third BUR in 2021 (Indonesia, 2021). Indonesian total sectoral CH4 emission time series as reported by the second BUR (2001–2016) were revised in the third BUR (2000 and 2019, Table 2). For 2017 and 2018, only the agricultural CH4 emissions were detailed by the third BUR (Fig. 2-24), but the total emissions for these 2 years were not reported. Uncertainty for 2019 activity data and emission factors (EFs) are the same as reported in the second BUR (2018). The overall uncertainty of Indonesia's national GHG inventory with agriculture and LULUCF (including peat fires) for 2000 and 2019 was approximately 20.0 % and 19.9 %, respectively. A much smaller uncertainty, 10.4 % for 2000 and 13.8 % for 2019, occurred when the forestry and land use sector (including forest fires), was excluded from the analysis, pointing to the high uncertainty of emissions from forest fires in Indonesia. The DR Congo submitted its first BUR in 2022, and we used time series reported for 2000–2018 (Table 12, Congo, 2022). India has submitted three BURs, and each of them contains information on sectoral CH4 emissions only for 1 year. We compiled information for 2010 from the first BUR (India, 2016), for 2014 from the second BUR (India, 2018), and for 2016 from the third and latest BUR (India, 2021).
2.3 Other CH4 data sources and estimation approaches
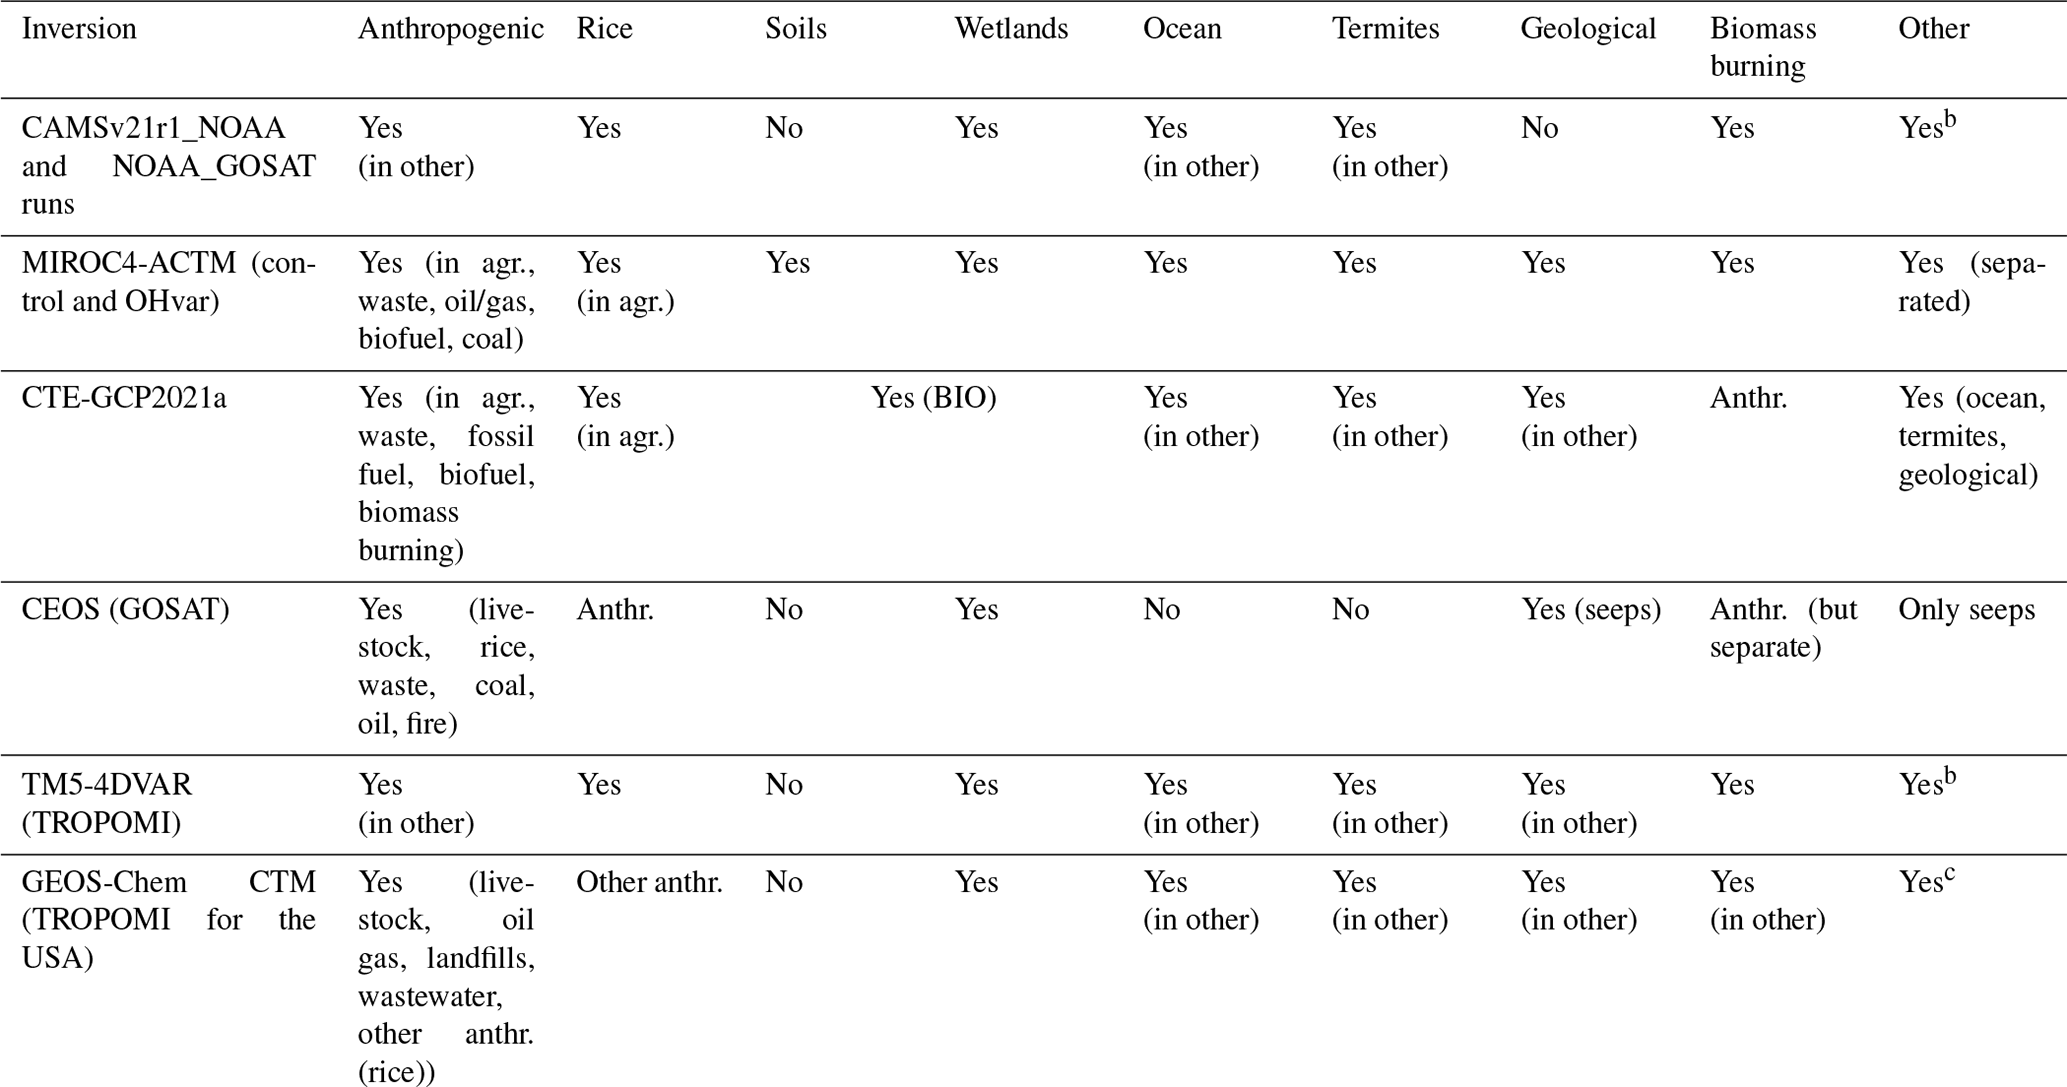
The CH4 emissions in the EU and non-Annex I countries used in the atmospheric inversions and anthropogenic and natural emission estimates from various BU approaches and inventories (i.e., UNFCCC CRFs and BURs) covering specific products, sectors, and activities are summarized in Table 1. The data and the detailed description of most products (Tables S1 and S2 in the Supplement) span the period from 1990 to 2021, with some of the data only available for shorter periods. The estimates are available both from peer-reviewed literature and from unpublished research results from the VERIFY and CoCO2 projects (Supplement), and in this work they are compared with NGHGIs reported in 2023 (time series for all (Annex I) or some years (non-Annex I) of the 1990–2021 period). The BU anthropogenic sources are from UNFCCC NGHGIs and three global inventory datasets/models: EDGAR v7.0, FAOSTAT/PRIMAP-hist 2.4, and GAINS and the TNO_CoCO2_PED18-21 priors emission datasets for 2010–2018 and 2021. In this synthesis, FAOSTAT (Tubiello et al., 2022; FAO, 2023) data include estimates for all economic sectors – energy, industrial processes and products use (IPPU), waste, and other – which are sourced from the PRIMAP-hist v2.4 dataset (Gütschow and Pflüger, 2022) to build emission indicators on agrifood systems and on the entire economy. Emission totals from the agrifood domain are computed following the Tier 1 methods of the Intergovernmental Panel on Climate Change (IPCC) guidelines for NGHGIs. Agrifood systems emissions in FAOSTAT are largely based on FAO crop, livestock, and land use statistics (Tubiello et al., 2022; FAO, 2023). They are complemented with activity data from the United Nations Statistics Division (UNSD) and the International Energy Agency (IEA), as well as with geospatial information on drained organic soils and biomass fires (Conchedda and Tubiello, 2020; Prosperi et al., 2020). The TNO CoCO2 PED datasets for 2010–2018 and 2021 are based on the UNFCCC reported data in 2020 and 2023, respectively, for the EU27 countries; on the DACCIWA v2 dataset (Keita et al., 2021) for the African continent; and on the CAMS-GLOB-ANT v5.3 dataset (Soulie et al., 2024) for all other countries (no data for COD). The methodology is detailed in the CoCO2 (2023) deliverables D2.1 Prior Emission Dataset (PED) 2016 (CoCO2 project, 2022) and D2.2 Prior Emissions data (PED) 2021 – CoCO2: Prototype system for a Copernicus CO2 service (CoCO2 project, 2023).
The analysis focuses on total and sectoral or partitioned information from BU and TD estimates. As detailed in Table 1, not all inversions distinguish between sources, but in the following sections we discuss comparability between BU and TD for total and partitioned results.
Table 1Sectors included in this study and data sources providing estimates for these sectors. CAMS stands for Copernicus Atmosphere Monitoring Service. References to data products are found in Table 2 (Petrescu et al., 2023, and Tables S1 and S2). The bold highlights the domain (global or EU) and whether or not the models provide partitioning of the fluxes.
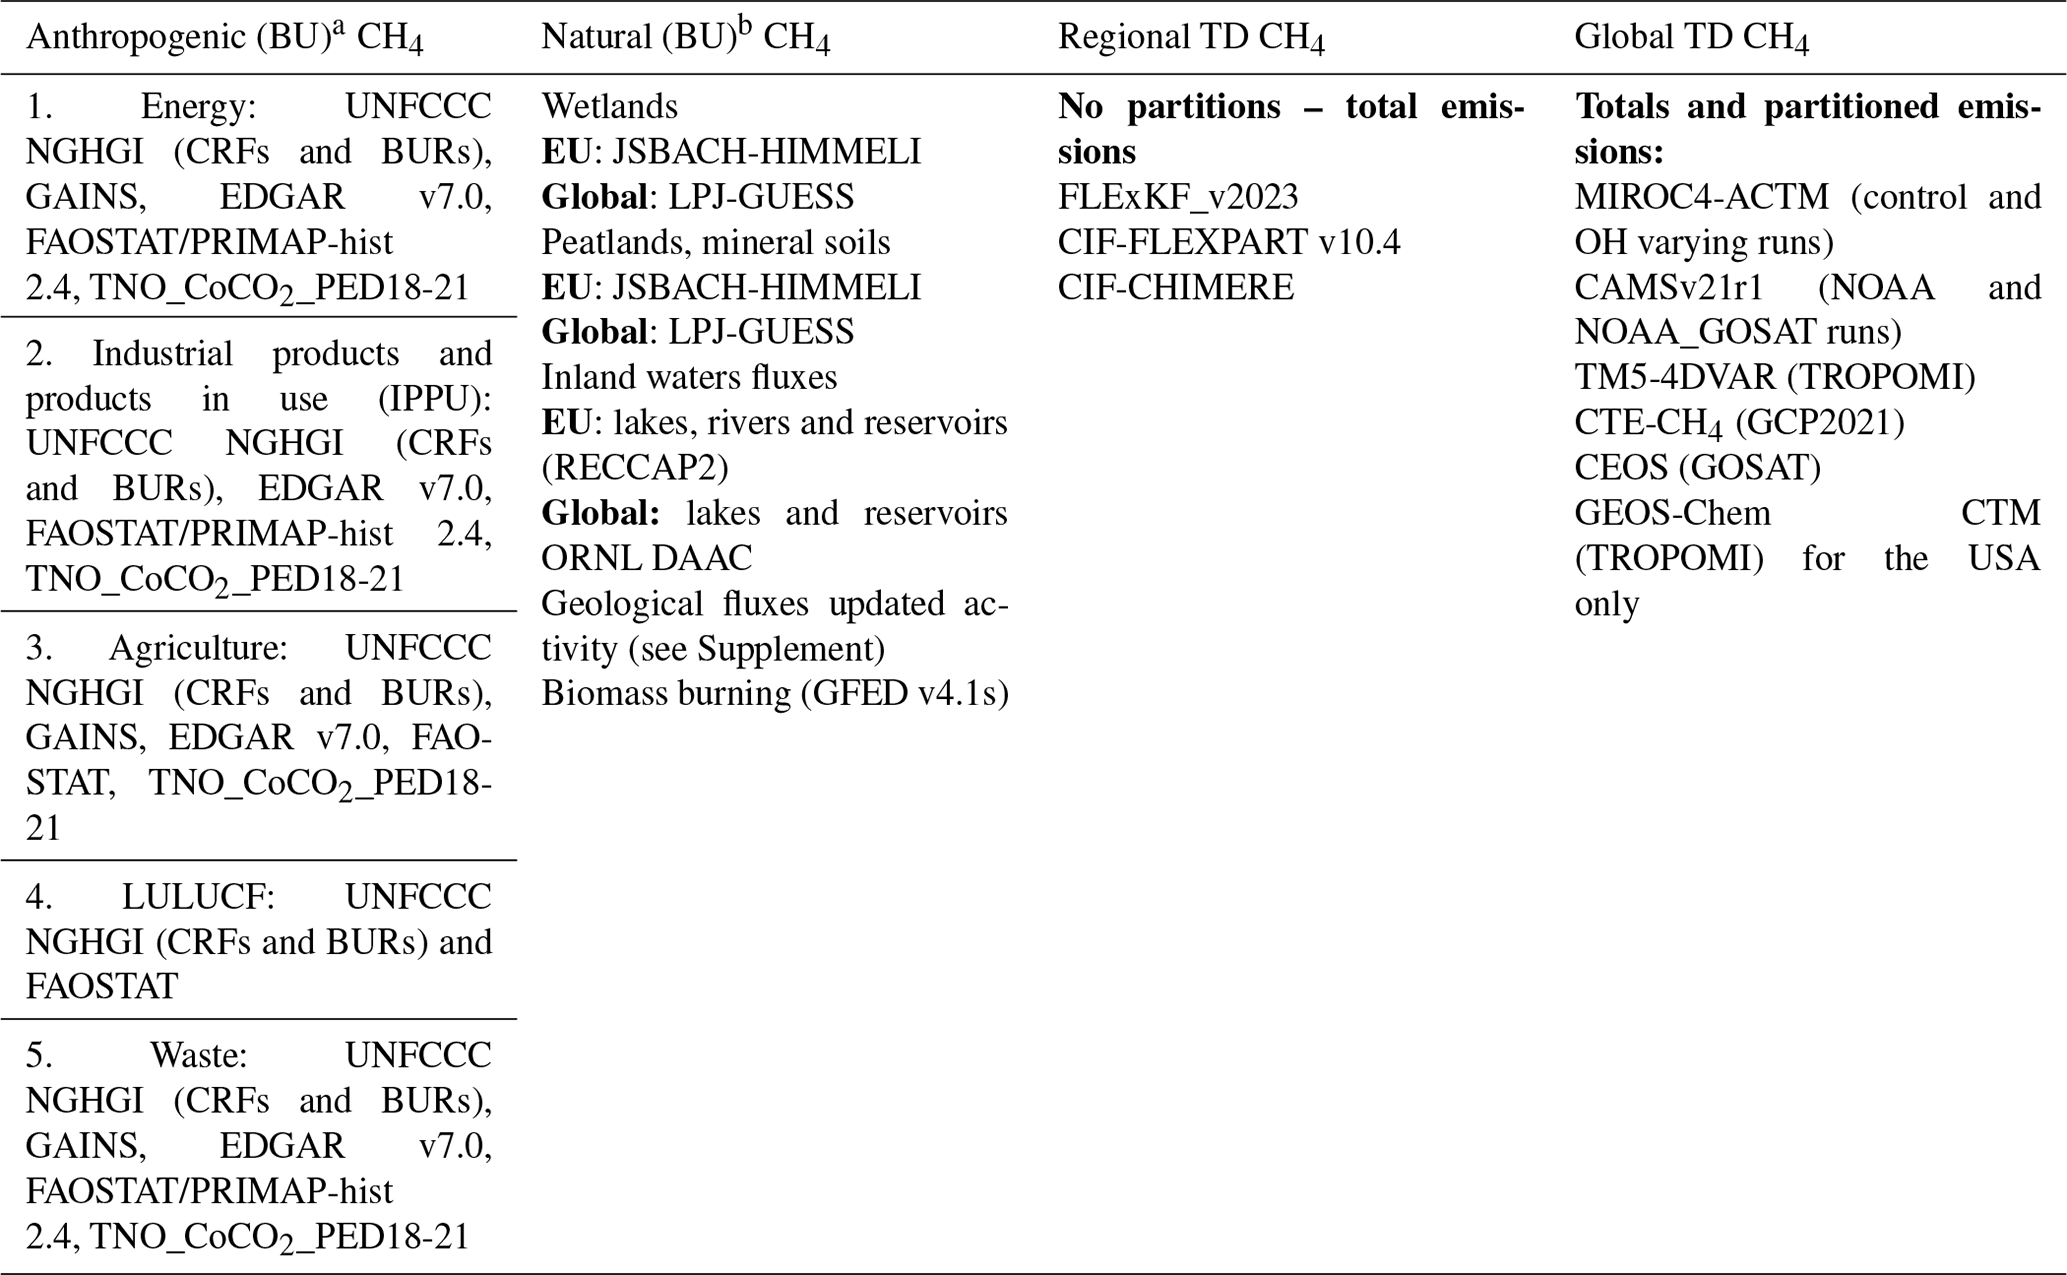
a For consistency with the NGHGI, here we refer to the five reporting sectors as defined by the UNFCCC and the Paris Agreement decision (18/CMP.1), the IPCC guidelines (IPCC, 2006a), and their refinement (IPCC, 2019), with the only exception that the latest IPCC refinement groups together agriculture and LULUCF sectors in one sector (agriculture, forestry, and other land use – AFOLU).
b The term “natural” refers here to unmanaged natural CH4 emissions (peatlands, mineral soils, geological, inland waters, and biomass burning) not reported under the anthropogenic UNFCCC LULUCF sector.
Note that not all models have a version ID. Those that have one are used in previous syntheses (Petrescu et al., 2021, 2023).
We define natural sources as all sources which do not belong to the anthropogenic partition: wetlands, geological, termites, ocean, inland waters, soils, and biomass burning (Table 2). The BU natural components for the EU were computed as the sum of the VERIFY products – biomass burning, inland waters, and undisturbed peatlands plus mineral soils (as described in Petrescu et al., 2021, 2023) and geological emissions (Etiope and Schwietzke, 2019, updated for the VERIFY H2020 Project, 2023). For the seven non-EU emitters, the BU natural fluxes are the sum of wetland emissions (LPJ-GUESS), lake and reservoir emissions (ORNL DAAC), biomass burning emissions (GFED v4.1s), and geological emissions (updated activity, Supplement). The TD natural global estimates were calculated as the sum of all natural partitions reported by the inversions. Adjustments were made to have a consistent comparison between partitions, adding the missing ones from the BU estimates (Table 4). The error bar on the TD natural global estimates represents the range of the minimum (min) and maximum (max) between inversion estimates.
The total regional TD estimates (for the EU) and their uncertainties were calculated as the mean and min/max range between FLExKF_v2023, CIF-FLEXPART, and CIF-CHIMERE inversions (see priors table in Petrescu et al., 2024). For the USA, we considered the optimized emissions from the GEOS-Chem CTM (based on TROPOMI data for 2019) from Nesser et al. (2024), with the range from the eight members of the inversion ensemble shown as uncertainty (Table 2 in Nesser et al., 2024).
For all countries, the total global TD inversion estimates (time series) and uncertainties were calculated over the period 2015–2021 using the mean and min/max between CTE-GCP2021, both MIROC4-ACTM runs, CAMSv21r1 (both runs), and TM5-4DVAR (TROPOMI based). CEOS (GOSAT) provided an estimate only for 2019.
The units used in this paper are metric tons (t) (1 kt = 109 g; 1 Mt (Tg) = 1012 g) of CH4. The referenced data for replicability purposes are available for download at https://doi.org/10.5281/zenodo.12818506 (Petrescu et al., 2024). Upon request, the computer code for plotting figures in the same style and layout can be provided. Throughout the paper and mostly for the complex figures, the following ISO3 country codes are used: USA (United States of America), BRA (Brazil), CHN (China), IDN (Indonesia), RUS (Russia), COD (DR Congo), and IND (India). Next to these we also refer to CHE (Switzerland) and AUS (Australia). The European Union consists of 27 member states, excludes the United Kingdom (UK), and is further abbreviated as EU. All abbreviations are summarized in the Supplement, Table S5.
3.1 NGHGI official reported estimates (UNFCCC)
Figure 1 presents anthropogenic CH4 emissions reported to the UNFCCC in 2023 from the NGHGI CRFs (the EU, the USA, and Russia) and BURs (Brazil (fourth in 2021), China (second in 2019), Indonesia (third in 2021), DR Congo (first in 2022), and India (all three BURs)). The following section provides additional details for all the countries.
For the EU, the total anthropogenic CH4 emissions in 2021 amount to 14.8±1.8 Tg CH4 yr−1 and represent 12.8 % of the total EU greenhouse gas emissions (in CO2 equivalents, GWP 100 years, IPCC AR51). CH4 emissions are predominantly from agriculture (Fig. 1, brown), which accounted for 8.3±0.8 Tg CH4 yr−1 or 56 % of the total EU CH4 emissions in 2021 (including LULUCF). Anthropogenic CH4 emissions from the LULUCF sector are very small for the EU: 0.5 Tg CH4 yr−1 or 3 % in 2021, including emissions from biomass burning. The EU data from Fig. 1 show steadily decreasing trends for all sectors with respect to the 1990 levels. The reduction in total CH4 emissions in 2021 with respect to 1990 is 8.9 Tg CH4 yr−1 (37 %) at an average yearly rate of −1 %.
In 2021, the USA reported anthropogenic CH4 emissions of 28.3 Tg, and, compared to 1990, the reported USA CH4 emissions show a small decrease of 4.6 Tg CH4 yr−1, which is more pronounced for the last 2 years (2020–2021), with an average reduction rate of −0.5 % per year (Fig. 1, dotted black line). In the USA, the largest share of emissions comes from the energy sector (38 %), and next to IPPU and waste, it had the highest reductions since 1990 (42 %, 34 %, and 26 %, respectively). Emissions from agriculture (35 %, the second-largest sector) and LULUCF increased 16 % and 23 %, respectively. CH4 emissions have been slowly declining since 1990 but had a notable decrease of 1.5 Tg CH4 yr−1 in 2016 compared to 2015, before increasing again, and they had a second decreasing trend in 2020 and 2021, possibly due to the COVID pandemic. Overall, reported data indicate that reductions in the USA CH4 emissions have declined more slowly than in the EU. The EU also has much lower CH4 emissions than the USA on a per capita basis (Fig. 2).
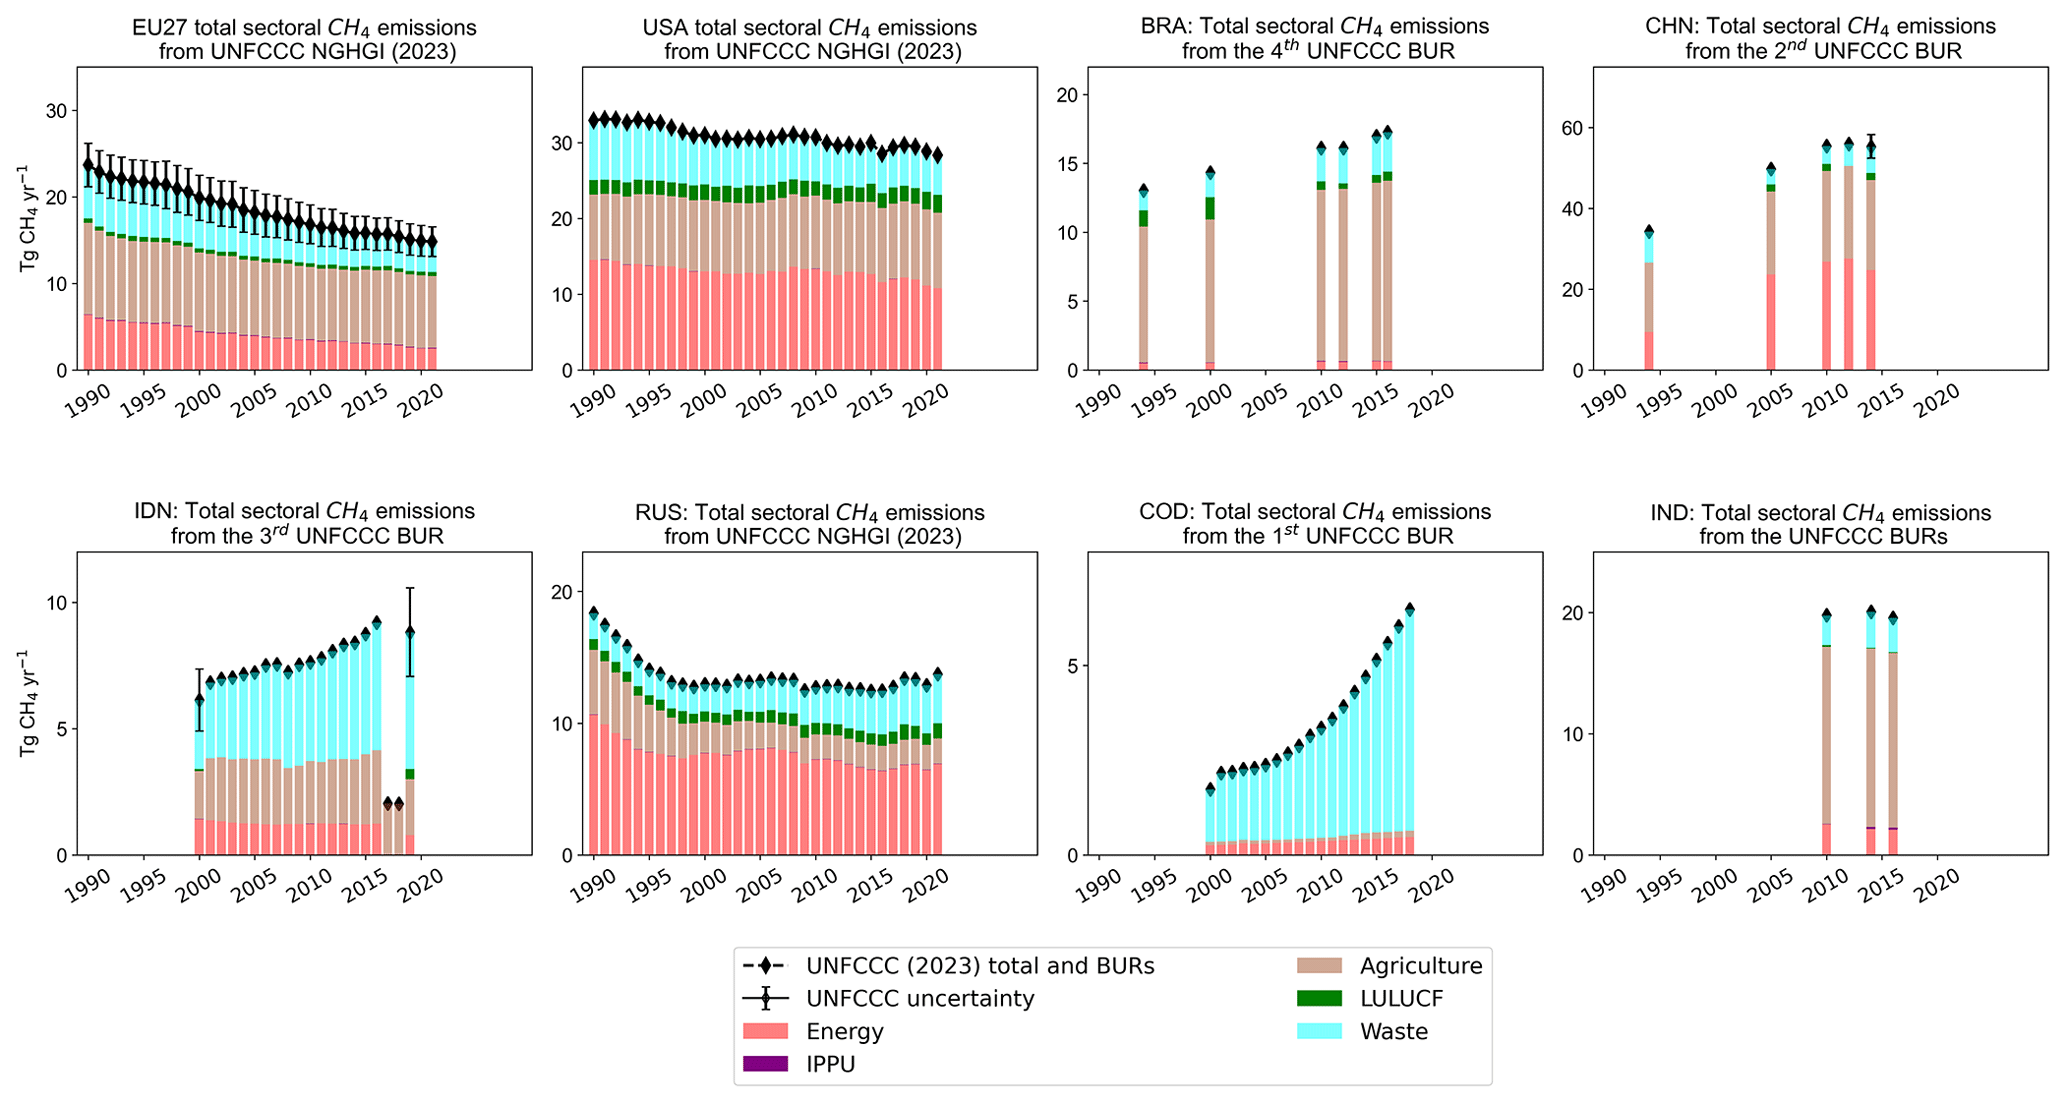
Figure 1Total and sectoral CH4 emissions (including LULUCF) from the UNFCCC NGHGI (2023) CRFs (the EU, the USA, and Russia) and BURs (https://unfccc.int/BURs, last access: May 2024) (Brazil (fourth in 2021), China (second in 2019), Indonesia (third in 2021), DR Congo (first in 2022), and India (all three BURs: 2016, 2018, and 2021)). For the EU, the relative error on the UNFCCC value represents the UNFCCC NGHGI (2023) reported uncertainties computed with the error propagation method (95 % confidence interval) and gap-filled to provide respective estimates for each year. Information on Indonesian sectoral CH4 emissions in 2017 and 2018 is only available for agriculture. The overall uncertainty of Indonesia's national GHG inventory with AFOLU (including peat fires) for 2000 and 2019 was approximately 20.0 % and 19.9 %, respectively. In 2014, China reported uncertainty as well (min 5.2 % and max 5.3 %).
The trend in total anthropogenic CH4 emissions in Brazil is strongly increasing, with 32.5 % more emissions in 2016 compared to 1994. Given that the Brazilian BUR inventory (UNFCCC 4th BUR Brazil, 2020) does not include data between 2001 and 2019, it is difficult to discuss the yearly growth rates. We can only note that the agricultural sector (76 % of the total) was the main driver of the growth, followed by the waste sector (16 % of the total). There are only small CH4 emissions from the energy sector (some oil and gas activities). The Brazilian agricultural CH4 emissions are the highest of the eight countries on a per capita basis (see Fig. 2).
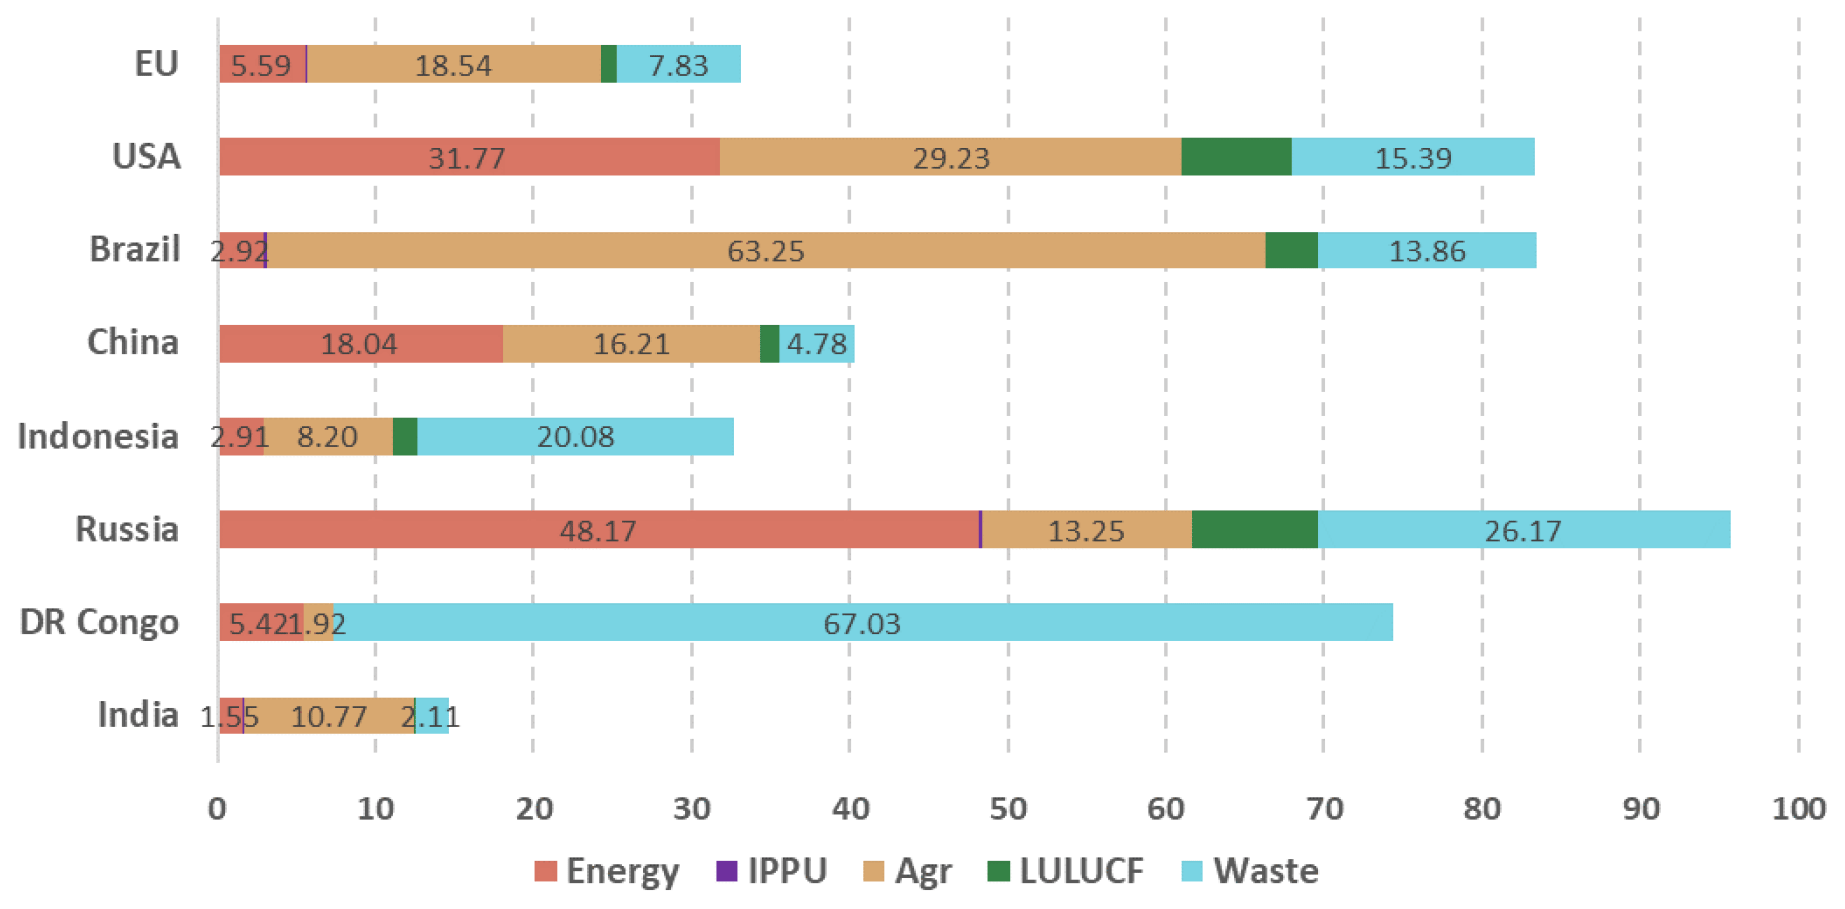
Figure 2Per capita emission (kg per person) per sector based (IPCC, 2006a) on reported emissions and population data from the last reported NIRs as follows: 2021 for the EU, the USA, and Russia; 2016 for Brazil and India; 2014 for China; 2019 for Indonesia; and 2018 for DR Congo.
China's total anthropogenic CH4 emissions are much larger than the emissions reported by many developed countries or the entire EU (see Fig. 1), but on a per capita basis it is only fifth of the eight countries considered (Fig. 2). China's CH4 emissions have grown 61 % from 1994 to 2014 (UNFCCC 2nd BUR China, 2019), when they reached 55 Tg CH4 yr−1. The highest contributions to China's CH4 emissions in 2014 are from energy (45 %) and agriculture (40 %). The rapid growth of China's coal demand has important implications for CH4 emissions from coal mines (Gao et al., 2020). The energy and agriculture sectors have respectively increased by 166 % and 30 % in 2014 compared to 1994.
The data from Indonesia's third BUR (2000 and 2019) show increasing trends in total anthropogenic CH4 emissions. The time series 2001–2006 is derived from the second BUR submitted in 2018. In 2019, Indonesian CH4 emissions had increased by +44 % compared to 2000, corresponding to 2.6 Tg CH4 yr−1, an average yearly increase of 3 %, and the sector which contributes the most to this increase is the waste sector, which nearly doubled its emissions in 2019 compared to 2000. According to Qonitan et al. (2021), the major solid waste source in Indonesia is the household sector, which contributed 44 %–75 % to total waste generated. The composition of municipal waste consists of 44 % food waste, 16 % paper, and 14 % plastics. CH4 emissions from the other sectors remained nearly constant. For 2017 and 2018 the Indonesian third BUR does not report total emissions other than agricultural emissions, which were taken from the report Figs. 2–24. The last data point (2019) shows lower total emissions because it belongs to the revised versions of the (third) BUR, while the previous data points 2000–2016 belong to the second BUR.
Russia's anthropogenic CH4 emissions have decreased by −25 % from 1990 to 2021, but most of this decrease happened during the dissolution of the Soviet Union. Since 2000, CH4 emissions have increased slightly, but they remain lower than pre-2000 levels. The decline seen between 1990 and 2000 is primarily due to the agricultural sector (−52 %) and energy (−27 %). At the same time, the waste sector started to increase its emissions (6 %). Between 2001 and 2021, the CH4 emissions from the agriculture and energy sectors continued to decrease (by 17 % and 11 %, respectively), while the emissions from the waste sector registered an additional 76 % increase. IPPU emissions increased by 85 % but remained negligible compared to other sectors. Since the 2000s, LULUCF emissions have also increased by 53 %.
For its first BUR, UNFCCC 1st BUR DR Congo (2023) submitted emissions from energy, AFOLU (agriculture plus LULUCF), and waste for 2000–2018. Since 2000, the DR Congo total anthropogenic CH4 emissions have increased by a factor of 4. Most of the CH4 emissions are reported for the waste sector and account for 90 % of the total emissions. The high percentage of waste emissions in DR Congo is also seen in the per capita emissions (Fig. 2). Assè-Wassa Sama and Berenger (2023) confirm that between 2000 and 2021, CH4 emissions, which in 2021 represent in DR Congo ∼97 % of total waste generated emissions, grew at a rate of 4 % yr−1, compared with 2.7 % yr−1 for total emissions. This increase was driven by the increase in emissions caused by solid waste disposal (+6.2 %). The CH4 waste emissions come mainly from the treatment and discharge of wastewater (69 % in 2021, compared with 80 % in 2000), followed by the elimination of solid waste (31 % in 2021, compared with 20 % in 2000). The weight of emissions caused by the elimination of solid waste in the sector's total emissions has nevertheless increased by 11 % between 2000 and 2021 (Assè-Wassa Sama and Berenger, 2023).
Each of India's BURs provides detailed information on sectoral CH4 emissions only for 1 year. Most of the emissions in India belong to the agriculture sector, amounting to almost 15 Tg CH4 yr−1 (in 2016), representing 74 % of the total anthropogenic emissions. However, with only 3 years of reported data available, no clear or notable trend is observed.
3.2 NGHGI compared to other bottom-up estimates
Figure 3 shows UNFCCC (CRFs and BURs) estimates from the EU and seven non-EU countries compared to global bottom-up inventories. The EU and the USA show decreasing trends in emissions from all datasets (except for GAINS in the USA), while all the other countries show increasing trends in all datasets. The match between UNFCCC reported emissions and all other data sources is satisfactory, with a few notable exceptions. Note that TNO_CoCO2_PED18-21 and the FAOSTAT/PRIMAP-hist have very similar trends for all countries except the EU, as both FAOSTAT/PRIMAP-hist and CAMS-GLOB-ANT (used in the TNO_CoCO2_PED18-21 dataset for countries outside the EU and Africa) are partly based on EDGAR.
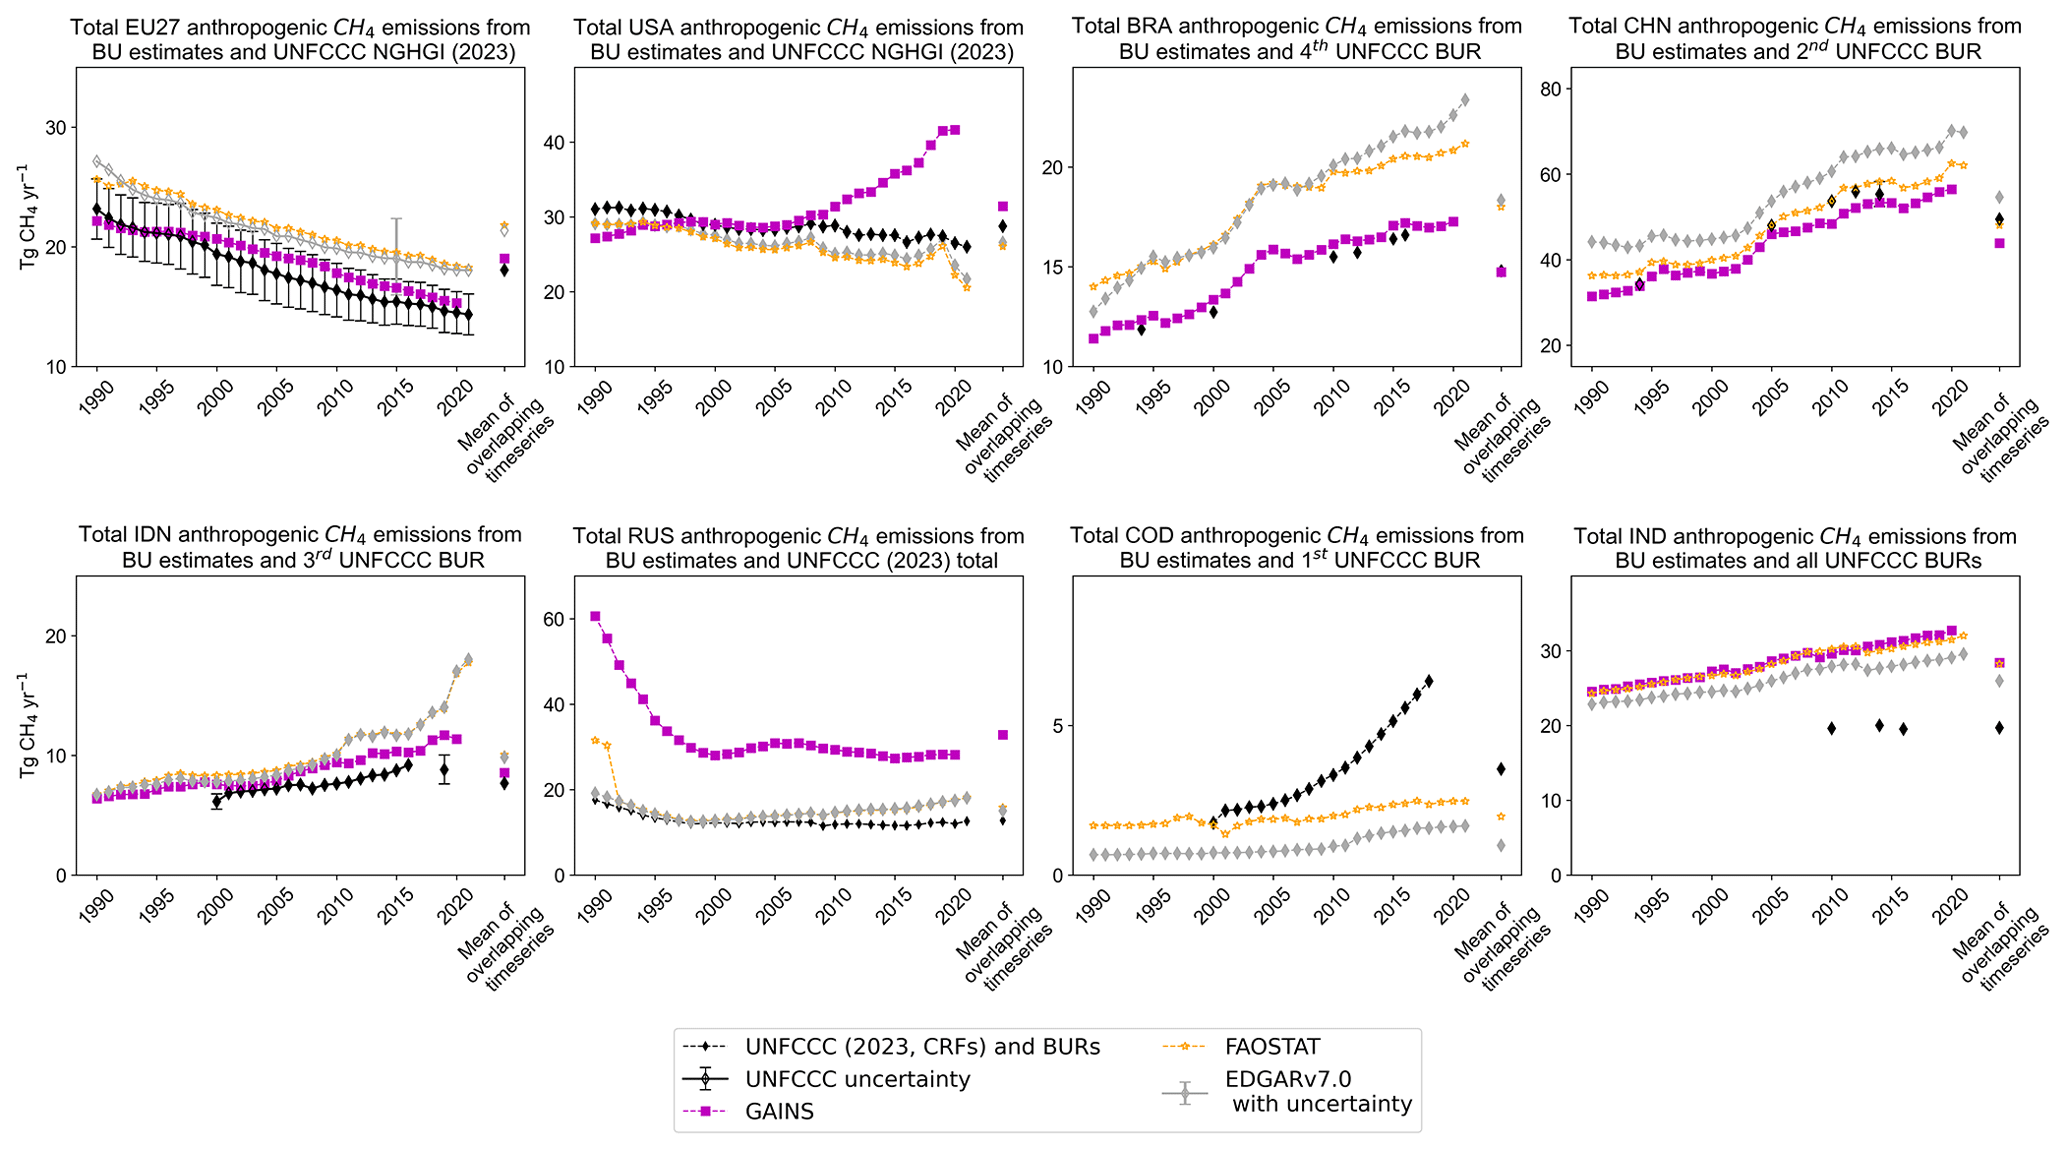
Figure 3Total anthropogenic CH4 emissions (excluding LULUCF) from bottom-up (BU) inventories, UNFCCC NGHGIs (2023) of CRFs (the EU, the USA, and Russia) and BURs (Brazil (fourth in 2021), China (second in 2019), Indonesia (third in 2021), DR Congo (first in 2022), India (all three BURs: 2016, 2018, and 2021)), and four other global datasets, EDGAR v7.0, GAINS (no IPPU), FAOSTAT/PRIMAP-hist (except for AFOLU), and TNO_CoCO2_PED18-21. For the EU, the relative error on the UNFCCC value represents the NGHGI (2023) reported uncertainties computed with the error propagation method (95 % confidence interval) and gap-filled to provide respective estimates for each year. China reports uncertainties for 2014, and Indonesia reports uncertainties for 2000 and 2019. Total COD UNFCCC BUR emissions do not include IPPU. The EDGAR v7.0 uncertainty is only for 2015 and was calculated according to Solazzo et al. (2021) for EDGAR v5.0. The mean of overlapping time series was calculated for 1990–last available year as follows: 2021 for UNFCCC NGHGI (2023), EDGAR v7.0, FAOSTAT/PRIMAP-hist, and TNO_CoCO2_PED18-21 and 2020 for GAINS.
For the EU, the difference between the UNFCCC NGHGI 1990–2020 average and the other three datasets is less than 5 %. TNO_CoCO2_PED18-21 data for the EU27 are gap-filled data based on the UNFCCC country-reported numbers; therefore, it follows closely the trend of the NGHGI data. The difference between EDGAR v7.0 and FAOSTAT/PRIMAP-hist and the other datasets originates from country-specific emission factors being used in the other three inventories for the EU, especially for fossil fuel production. As previously discussed, the inventory-based data sources are consistent with each other for capturing recent CH4 emission reductions, but they are not independent because they use a similar methodology with different versions of the same activity data (AD) (Petrescu et al., 2020, Fig. 4).
For the USA, GAINS reports high emissions after 2010, with strong growth. This divergence is largely found in the energy sector, resulting from the EFs used for conventional gas production as well as for unconventional shale gas extraction, which has increased rapidly since 2006 due to the development of hydraulic fracturing technology (supplementary Fig. S6-1 in Höglund-Isaksson et al., 2020). The high share of emissions from unconventional shale gas can be explained by the GAINS EFs which, in the absence of published factors, are derived from the residual emissions after having subtracted estimated emissions for oil production and conventional gas production from the total upstream emission estimated by Alvarez et al. (2018, Table 1). As Alvarez et al. (2018) do not specify EFs by type of gas produced, GAINS v4 splits it based on activity data from other references: International Energy Agency World Energy Outlook (IEA-WEO, 2018) and Energy Information Administration (EIA, 2019). On the other hand, the NGHGI EF seems to be too low, and this is reflected by the low oil and gas emissions reported by the Unites States Environmental Protection Agency (USEPA, 2017) for 2015, compared to Alvarez et al. (2018) (supplementary Table S6-3, Höglund-Isaksson et al., 2020). For the USA, total gas production increased by 47 % between 2006 and 2017. Revisions for the agricultural livestock emissions concern updates of AD and reported EFs to statistics from FAO (2018) and CRFs (UNFCCC, 2016, 2018), as well as a review of available technical abatement options for CH4.
For Brazil, UNFCCC and GAINS report emissions of similar magnitudes and trends. The EDGAR v7.0 and FAOSTAT/PRIMAP-hist report on average around 23 % more emissions for the 1990–2021 period but closely follow the NGHGIs trends. The similarity between trends could be explained by the use of the same EFs following Tier 1 IPCC (2006a) guidelines and UNFCCC NIRs (Janssens-Maenhout et al., 2019), while the higher emissions could appear when using different AD information.
For China the inventory estimates agree reasonably with the BUR reported data, with EDGAR v7.0 showing the highest estimates. According to both GAINS and EDGAR v7.0, the primary drivers for growth in Chinese CH4 emissions are due to a mix of sources, mainly from the IPCC (2006a) sector 1.B.1 – fugitive emissions from solid fuel activity linked to increased coal mining.
In Indonesia the three global datasets agree well up until 2010. From 2010, the third-party datasets show a continued increase in emissions, while the UNFCCC 3rd BUR Indonesia (2021) emissions suggest a decline. EDGAR v7.0 reports a large increase in emissions from fugitive emissions from solid fuels (coal mining) (IPCC, 2006a, sector 1.B.1.) at an increased average rate of 19 % per year, and it increased by a factor of 152 until 2021 compared to 1990 (Fig. 3).
For Russia, GAINS emissions are much higher than NGHGIs and the other two datasets due to the revisions of the assumptions on the average composition of the associated gas generated from oil production based on information provided in Huang et al. (2015). The higher emissions in GAINS v4 might be caused by a greater source from venting of associated gas instead of flaring. GAINS v4 estimates a decline in global CH4 emissions in the first half of the 1990s, primarily a consequence of the dissolution of the Soviet Union and the associated general decline in production levels in agriculture and fossil fuels (see regional emission illustrations in Fig. S2-1 of the SI in Höglund-Isaksson et al., 2020). In addition, as described by Evans and Roshchanka (2014) and assumed in Höglund-Isaksson (2017), venting of associated petroleum gas declined significantly in Russia due to an increase in flaring. It is unclear why this happened, but a possible explanation could be that the privatization of oil production in this period meant that the new private owners were less willing to take the security risks of venting and invested in flaring devices to avoid potential production disruptions. This hypothesis is however yet to be confirmed (Höglund-Isaksson et al., 2020). FAOSTAT data for the Russian Federation start in 1992, but the former USSR statistics were used prior to 1992 without adjustments, and this is the cause of the 1990 and 1991 outliers in time series. The slightly increasing trends observed in EDGAR v7.0 and FAOSTAT/PRIMAP-hist are set by emissions from the energy sector.
For DR Congo estimates from GAINS are not available because they only report aggregated emissions from a few African regions. Both FAOSTAT/PRIMAP-hist and EDGAR v7.0 estimates show similar slowly increasing trends, potentially indicating the use of similar prior statistics (EFs). For non-AFOLU sectors the PRIMAP-hist third-party data priority scenario used in FAOSTAT also uses EDGAR data as an input data source explaining similarities in these sectors. On the other hand, UNFCCC BUR data report a strong increase in emissions, which is due to a rapid growth of CH4 emissions from the waste sector by a factor of 4 until 2018 compared to 2000. This increase happened at an average yearly rate of +8 %, with an initial sharp increase of +30 % between 2000 and 2001. As previously discussed (Sect. 3.1), we believe that DR Congo BUR reported waste emissions are improbable and further investigation is needed.
For India, all bottom-up global inventories show similar trends and magnitudes of anthropogenic CH4 emissions. The emissions of CH4 averaged across EDGAR v7.0, GAINS, and FAOSTAT/PRIMAP-hist are 67 % (2010), 68 % (2014), and 65 % (2016) higher than the Indian BURs. All three BU inventories show an averaged steady increase of 1 % yr−1 between 1990–2020 (UNFCCC 1st BUR India, 2016; UNFCCC 2nd BUR India, 2018; UNFCCC 3rd BUR India, 2021).
3.3 NGHGIs compared to TD atmospheric CH4 estimates
In Fig. 4 we compare the reported TD anthropogenic estimates, after removing natural emissions, with the UNFCCC official reported emissions for the EU and the seven non-EU emitters. The mean column on the right of each chart represents the mean of the overlapping time series (2009–last available year, except for TROPOMI, which was available only for 2018–2020). For the EU, the three regional inversions report total emissions because they do not separate anthropogenic from natural emissions. Therefore, we subtracted from the total the natural emissions as calculated in Petrescu et al. (2023), which amount to 6.6 Tg CH4 yr−1 and are the sum of biomass burning, wetlands, geological, and inland water CH4 emissions. For the global inversions, the anthropogenic estimates were calculated by subtracting from the total fluxes the reported natural partitions as follows: for the two CAMS inversions and TM5-4DVAR (TROPOMI based) the natural partitions were the sum of biomass burning and wetland emissions; for the MIROC4-ACTM runs the natural partitions were the sum of the biomass burning, geologic, ocean, termite, soil, and wetland emissions; for CTE-GCP2021 the natural partitions were the sum of the biologic (wetland + soil) and other (ocean, termite, geological) emissions. Because not all inversions report the same partitions, we consider this a coarse comparison, and we detail the harmonization of the natural emissions in the next section (Table 4 and Fig. 7). For China, the last BUR is available for 2014, and therefore we used that value.
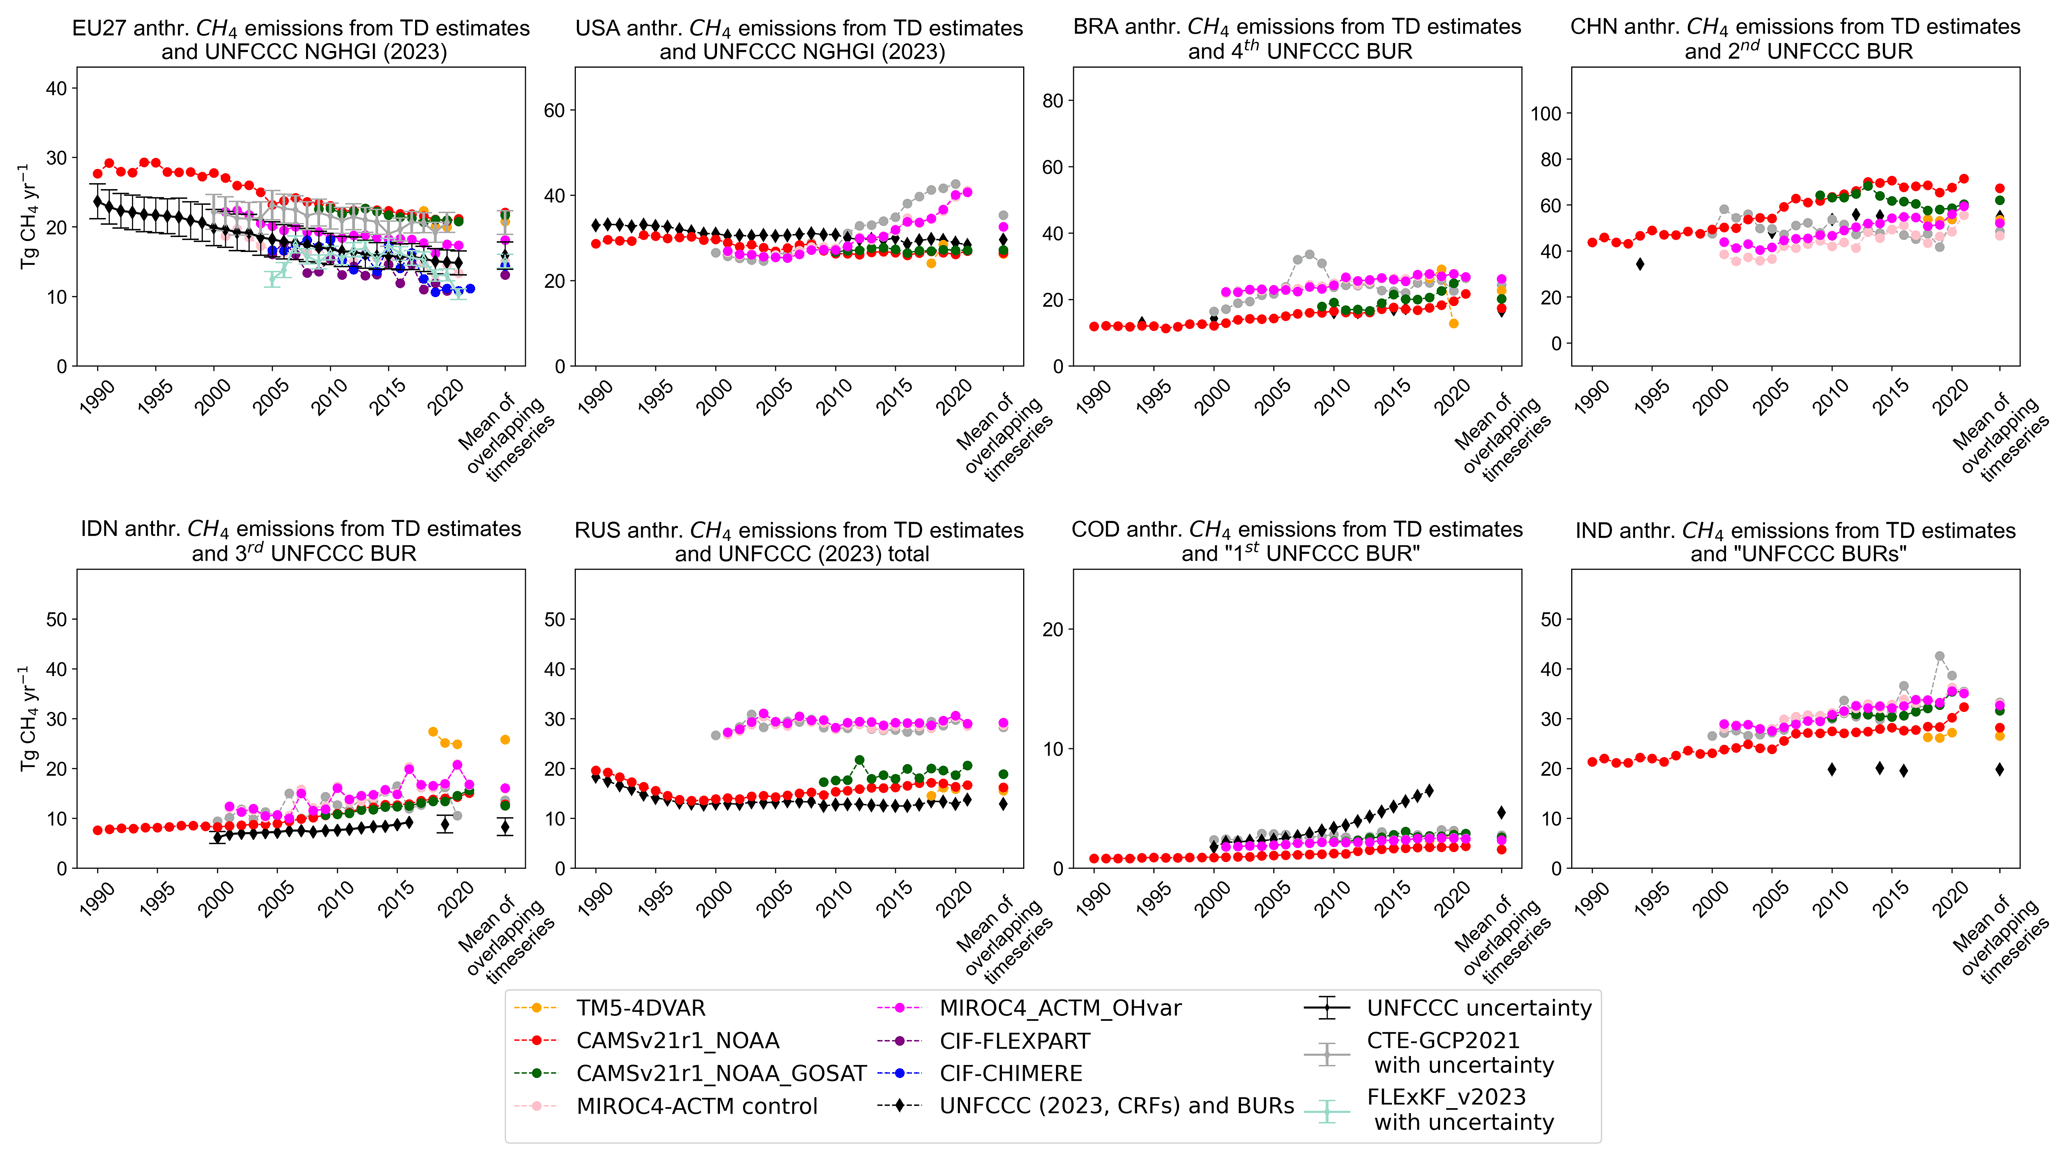
Figure 4Anthropogenic CH4 emissions from UNFCCC NGHGI (2023) CRFs (the EU, the USA, and Russia) and BURs (Brazil (fourth in 2021), China (second in 2019), Indonesia (third in 2021), DR Congo (first in 2022), India (all three BURs: 2016, 2018, and 2021)) and TD estimates as follows: for the EU anthropogenic regional inversions (FLExKF_v2023, CIF-FLEXPART, and CIF-CHIMERE) and for global inversions anthropogenic estimates calculated as total TD minus natural TD reported partitions (TM5-4DVAR, CAMSv21r1_NOAA, CAMSv21r1_NOAA_GOSAT, CTE-GCP2021, and both MIROC4-ACTM runs) products. For the EU, the relative error on the UNFCCC value represents the NGHGI (2023) reported uncertainties computed with the error propagation method (95 % confidence interval) and gap-filled to provide respective estimates for each year. China reports uncertainties for 2014 (min 5.2 %, max 5.3 %), and Indonesia reports uncertainties for 2000 and 2019 (20 % and 19.9 %, respectively). Total COD UNFCCC BUR emissions do not include IPPU. The last available years are CIF-CHIMERE (2022); TM5-4DVAR, CIF-FLEXPART, and CTE-GCP2021 (2020); and FLExKF_v2023, MIROC4-ACTM_OHvar and control, UNFCCC CRFs, and CAMSv21r1_NOAA and NOAA_GOSAT runs (2021). The mean of overlapping time series was calculated for 2009–2021, except for TM5-4DVAR (2018–2020).
In the EU, the average anthropogenic CH4 emissions from global inversions for 2009-2021 were 19 Tg CH4 yr−1 with a min–max range of 15–23 Tg CH4 yr−1, in line with previous estimates published in Petrescu et al. (2021, 2023) and the recent RECCAP2 European GHG budgets study of Lauerwald et al. (2024). This is consistent with the UNFCCC NGHGI (2023), which reports for the same period anthropogenic emissions of 15.8±1.8 Tg CH4 yr−1, noting the uncertainty ranges of both estimates overlap. There is good agreement in trends but with inversions showing a larger year-to-year variability. The regional inversions, for the same period, report averaged emissions of 14 Tg CH4 yr−1 with a min–max range of 13–20 Tg CH4 yr−1. We note that the regional inversions tend to report slightly lower emissions than the global inversions, closer to the UNFCCC estimates. One reason could be that regional inversions use better-constrained regional observations (e.g., ICOS, not just NOAA), have higher spatial resolution, and may thus better resolve the transport. However, they may still have problems with the regional boundary conditions.
For the USA, averaged over the period 2009–2021, inversions indicate anthropogenic CH4 emissions of 30 Tg CH4 yr−1 with a min–max range of 26–35 Tg CH4 yr−1, well in line with the UNFCCC NGHGIs (2023), which for the same period report anthropogenic total emissions of 29 Tg CH4 yr−1. The trends observed in TD products are slightly increasing after 2010, except for CAMS, which shows no trend (Fig. 4). The striking discrepancy between the trends from CAMS and those from MIROC4-ACTM and CTE-GCP2021 are most likely caused by the increasing oil and gas emissions from the eastern USA (Permian Basin). The same increasing trend is also captured by GAINS (Fig. 3). In their runs, both MIROC4-ACTM and CTE-GCP2021 use oil and gas priors from GAINS, while CAMS uses priors from EDGAR (Fig. 3). We discuss further differences in having CTE-GCP2021 run with EDGAR and GAINS oil and gas prior estimates in the Supplement.
For Brazil, inversions yield an average (range) of anthropogenic CH4 emissions of 23 (17–27) Tg CH4 yr−1, slightly higher than the UNFCCC estimate of 16.6 Tg CH4 yr−1. The two CAMS inversions have trends which match the trend of the UNFCCC report estimates.
For China, approximately 80 % of the CH4 emission increase (21.5 Tg yr−1) during 2000–2015 was from fugitive emissions from coal (mines), consistent with what GAINS and EDGAR report (Fig. 3). The TD estimates mostly agree with the BURs, except for CAMS inversions, which show 10 to 20 Tg CH4 yr−1 higher emissions than the other inversions. Both MIROC4-ACTM runs (the control and OH interannual variability (IAV) varying run; Patra et al., 2021) are in line with the BURs. Trendwise, all inversions agree on a slight decrease after 2013 and show increased emissions after 2018.
For Indonesia, most TD results agree on the trend and show a slight increase in emissions. A similar trend is also seen by the BURs. However, the CAMS inversions show linear increased trends while the other inversions have a more variable trend. Regarding the East Asian estimates, the MIROC4_ACTM inversion simulates higher fluxes compared to the other inversions. Only recently have they found that annual total East Asian emissions have decreased more significantly than in Patra et al. (2016) or Chandra et al. (2021); therefore, new runs with updated input setups are currently being investigated.
For Russia, the estimates from the two MIROC4-ACTM runs and CTE-GCP2021 are in the same range as the BU GAINS estimate (see Fig. 2) from 2000 onwards (between 30–40 Tg CH4 yr−1), but they do not show such a strong decrease as GAINS from 1990 to 2000, while CAMS runs report about 10 Tg CH4 yr−1 lower emissions than the other two inversions, matching the UNFCCC estimates. The reason for higher estimates reported by CTE-GCP2021 and MIROC4-ACTM is most likely the use of oil and gas priors from GAINS.
For DR Congo, inversions show the same slightly increasing trend, similar to that of UNFCCC BURs, without the abrupt increase after 2010. The inversions appear to confirm the overreported growth in emissions from waste.
For India, all the TD anthropogenic estimates agree well on increased trends and magnitudes. In contrast, UNFCCC reporting does not show any trend, but given the insufficient data from BURs, a plausible conclusion cannot be drawn.
3.4 Sectoral attribution of CH4 emissions in TD products
In some cases, inversions can be used to partition emissions to different sources. Table 2 shows the partitions as originally reported by some of the inversions, which we name here “unharmonized partitions”. A straightforward, direct comparison of the fluxes is not possible because of the different ways each inversion allocates and groups the natural/anthropogenic fluxes. For example, not all inversions report soil fluxes as done by MIROC4-ACTM and CTE-GCP2021 (together with wetlands) or report the biomass burning fluxes separately from anthropogenic emissions (MIROC4-ACTM and TM5-4DVAR). Rice is also sometimes allocated to natural emissions. Termites, oceans, and geological fluxes are sometimes reported separately (MIROC4-ACTM) or grouped as other (CTE-GCP2021, TM5-4DVAR). Regarding the anthropogenic emissions, TM5-4DVAR reports them as other, providing a separate partition for rice. Figure 5 shows the UNFCCC NGHGI anthropogenic total reported estimate (diamond) next to all TD estimates. All global inversions report total and disaggregated partitions, while the regional inversions report only the total emissions (green column).
Table 2Unharmonized partitions originally reported by inverse products.
a CTE-GCP2021 partitions refer to anthropogenic, biogenic, and other.
b In TM5-4DVAR (similar to the CAMSv20 setup and CAMSv21r1), the “other” partition includes anthropogenic sources except for the rice paddies. It also includes the small fluxes from termites, oceans, soil sink, and geological, among others. More details on priors are found in Petrescu et al. (2024), priors table.
c Named other biogenic.
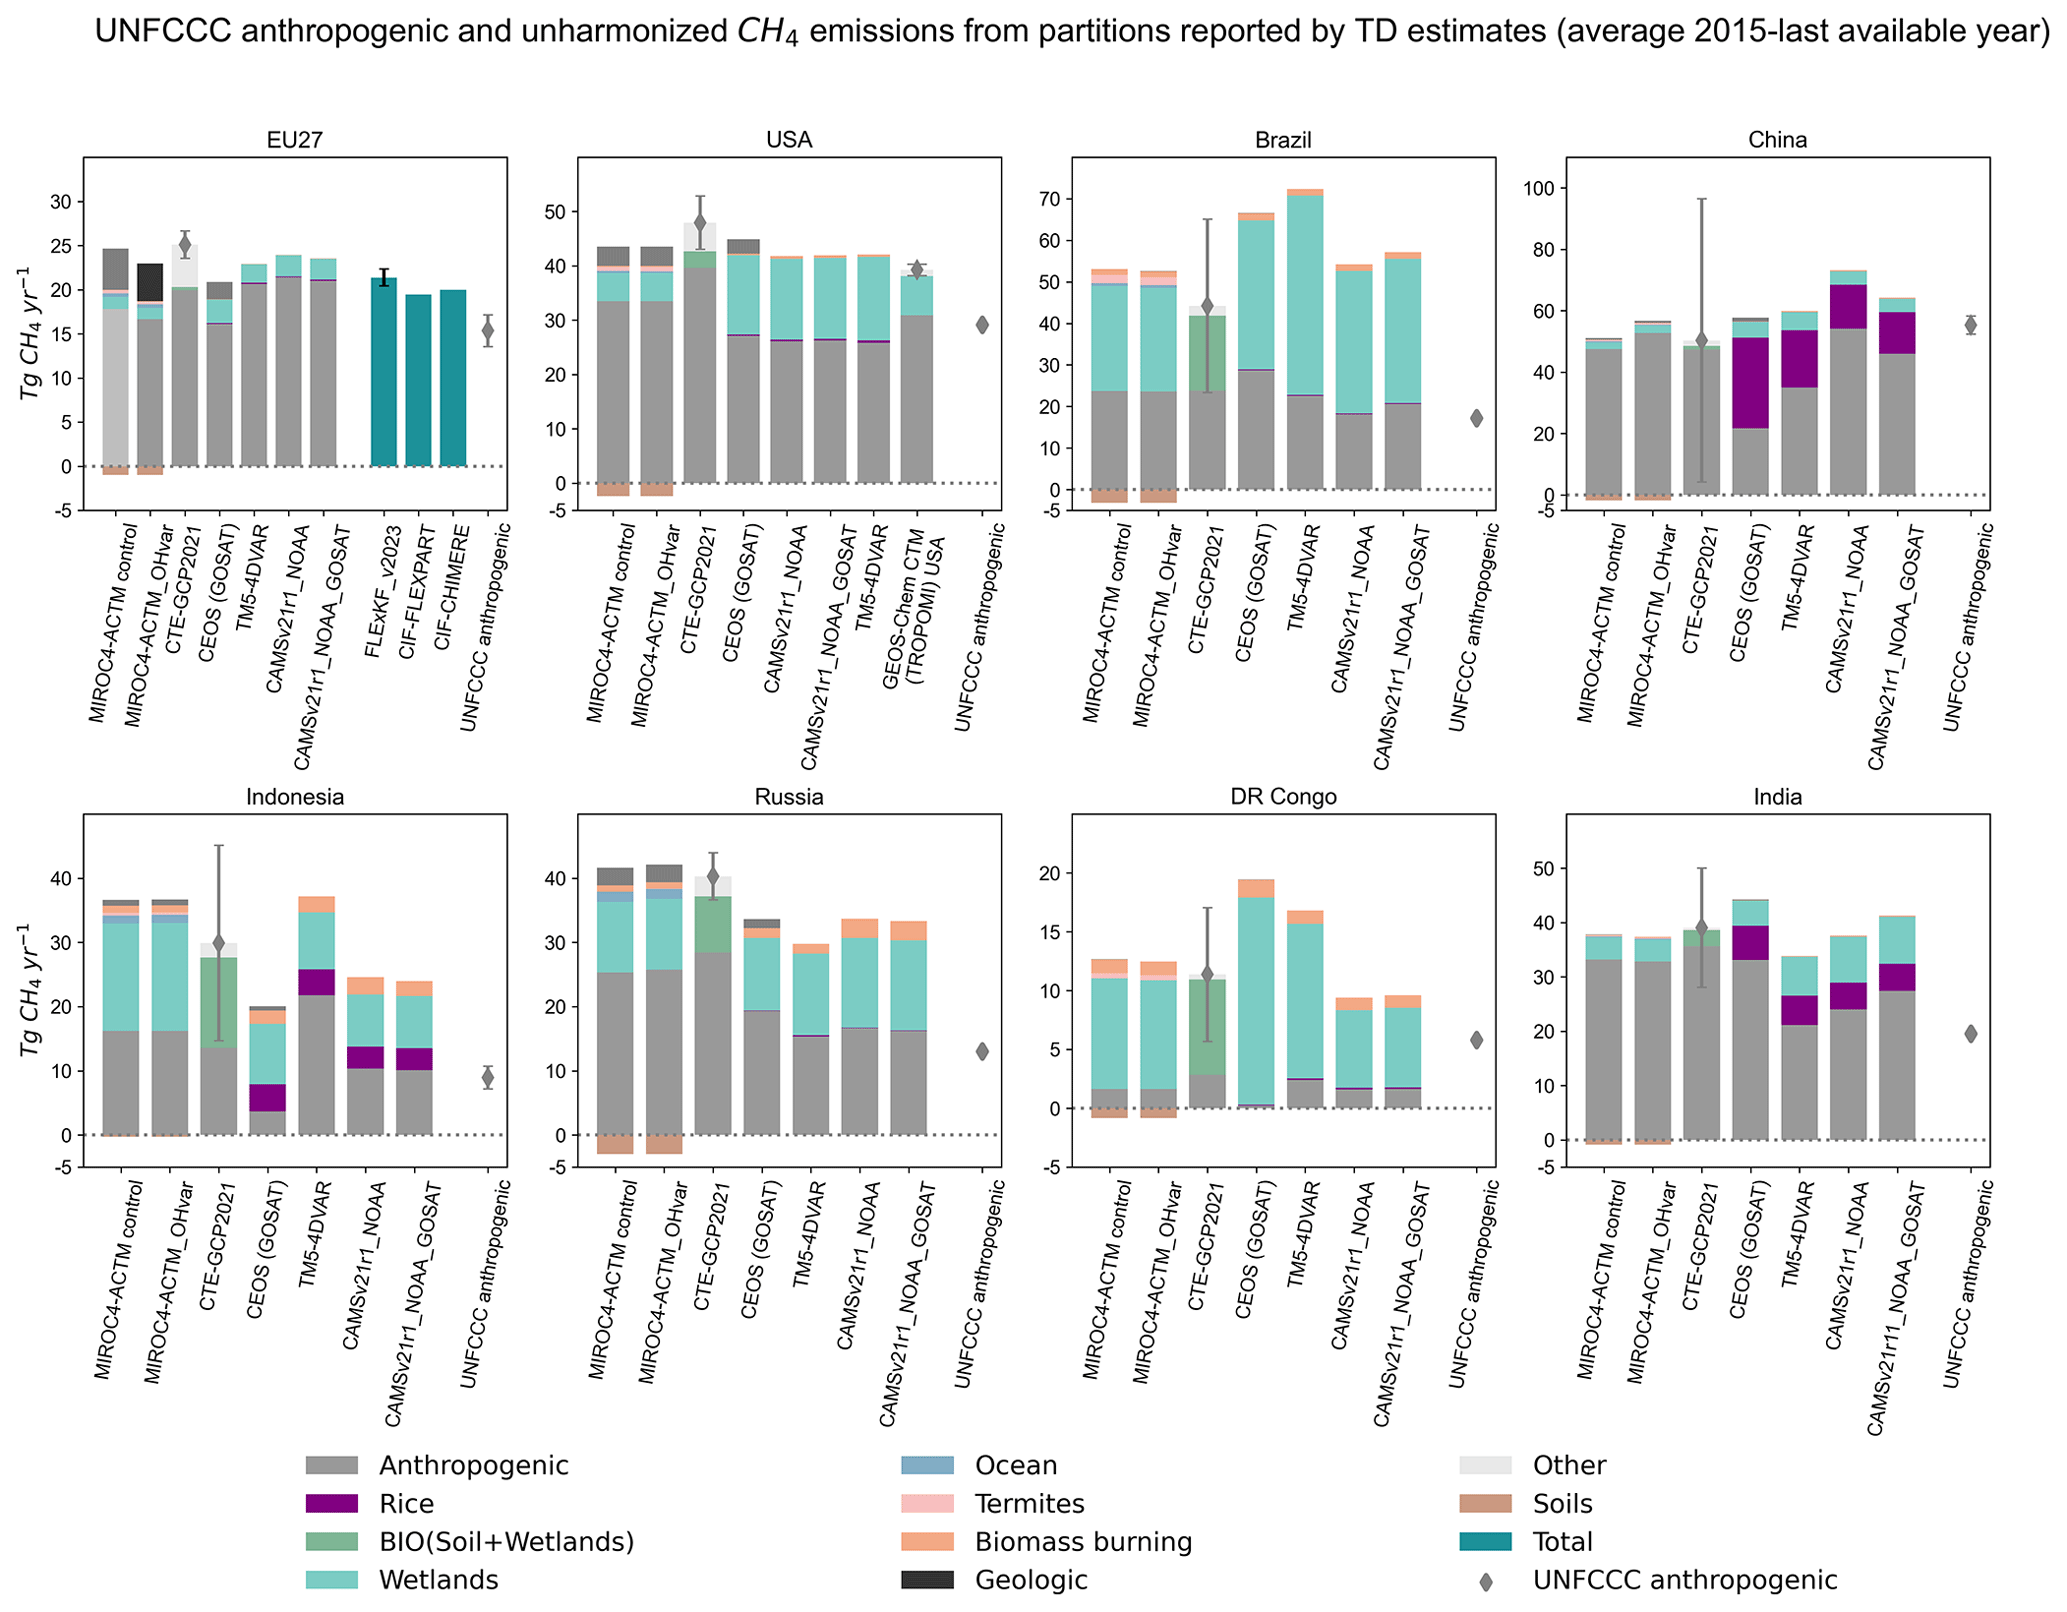
Figure 5Total (green) and disaggregated anthropogenic and natural CH4 emissions from TD estimates compared to UNFCCC NGHGI (2023) anthropogenic emissions (including LULUCF) (diamond) for the EU and seven global emitters outside the EU (the USA, Brazil, China, Indonesia, Russia, DR Congo, and India). The UNFCCC anthropogenic value represents the sum of all five IPCC sectors (energy, IPPU, agriculture, LULUCF, and waste). The partitions reported by the TD global inversions are detailed in Table 2. For the EU, the relative error on the UNFCCC value represents the NGHGI (2023) reported uncertainties computed with the error propagation method (95 % confidence interval) and gap-filled to provide respective estimates for each year (see Petrescu et al., 2023, Appendix). The China value and uncertainties (min 5.2 %, max 5.3 %) are for 2014 only, and the Indonesia uncertainties are for 2019 (19.9 %). For the USA CEOS (GOSAT) we used the Nessar et al. (2023) total uncertainty with a min–max range of 1.1–1 Tg yr−1. CTE-GCP2021 provides uncertainties for each partition, but here the uncertainty of the total flux is shown. FLExKF_v2023 reports the relative uncertainty (%) of the posterior emissions. The plotted data represent the average between 2015 and the last available year as follows: CIF-CHIMERE (2022); TM5-4DVAR, CIF-FLEXPART, and CTE-GCP2021 (2020); and FLExKF_v2023, MIROC4-ACTM_OHvar and control, UNFCCC CRFs, and CAMSv21r1_NOAA and NOAA_GOSAT runs (2021). GEOS-Chem CTM (TROPOMI) USA reports only for 2019 (Nesser et al., 2024).
Since the different models define sectors differently, also whether they are natural or anthropogenic, harmonization is required to make them comparable. CTE-GCP2021 reports the net natural land–biosphere flux “bio flux” (soil + wetlands), while other inversions report wetlands and soil separately. Rice emissions are sometimes a part of the agriculture component (anthropogenic partition) (MIROC4-ACTM, CTE-GCP2021), CEOS (GOSAT) and GEOS-Chem CTM (USA TROPOMI) report separate partitions for rice in anthropogenic emissions, and CAMS reports rice separate from anthropogenic and natural. Same for the biomass burning – CTE-GCP2021 and CEO report it as part of anthropogenic emissions, while GEOS-Chem CTM report it as part of other. The rest of the inversions report it separately; this different allocation makes comparisons for these two sources challenging. To facilitate comparisons between all TD products, we aggregated and harmonized the partitions in three main categories, as summarized in Table 3 and Fig. 6. The dark green columns in Fig. 6 show the total flux for regional EU inversions which did not report partitions.
Table 3Harmonized partitions from inverse products.
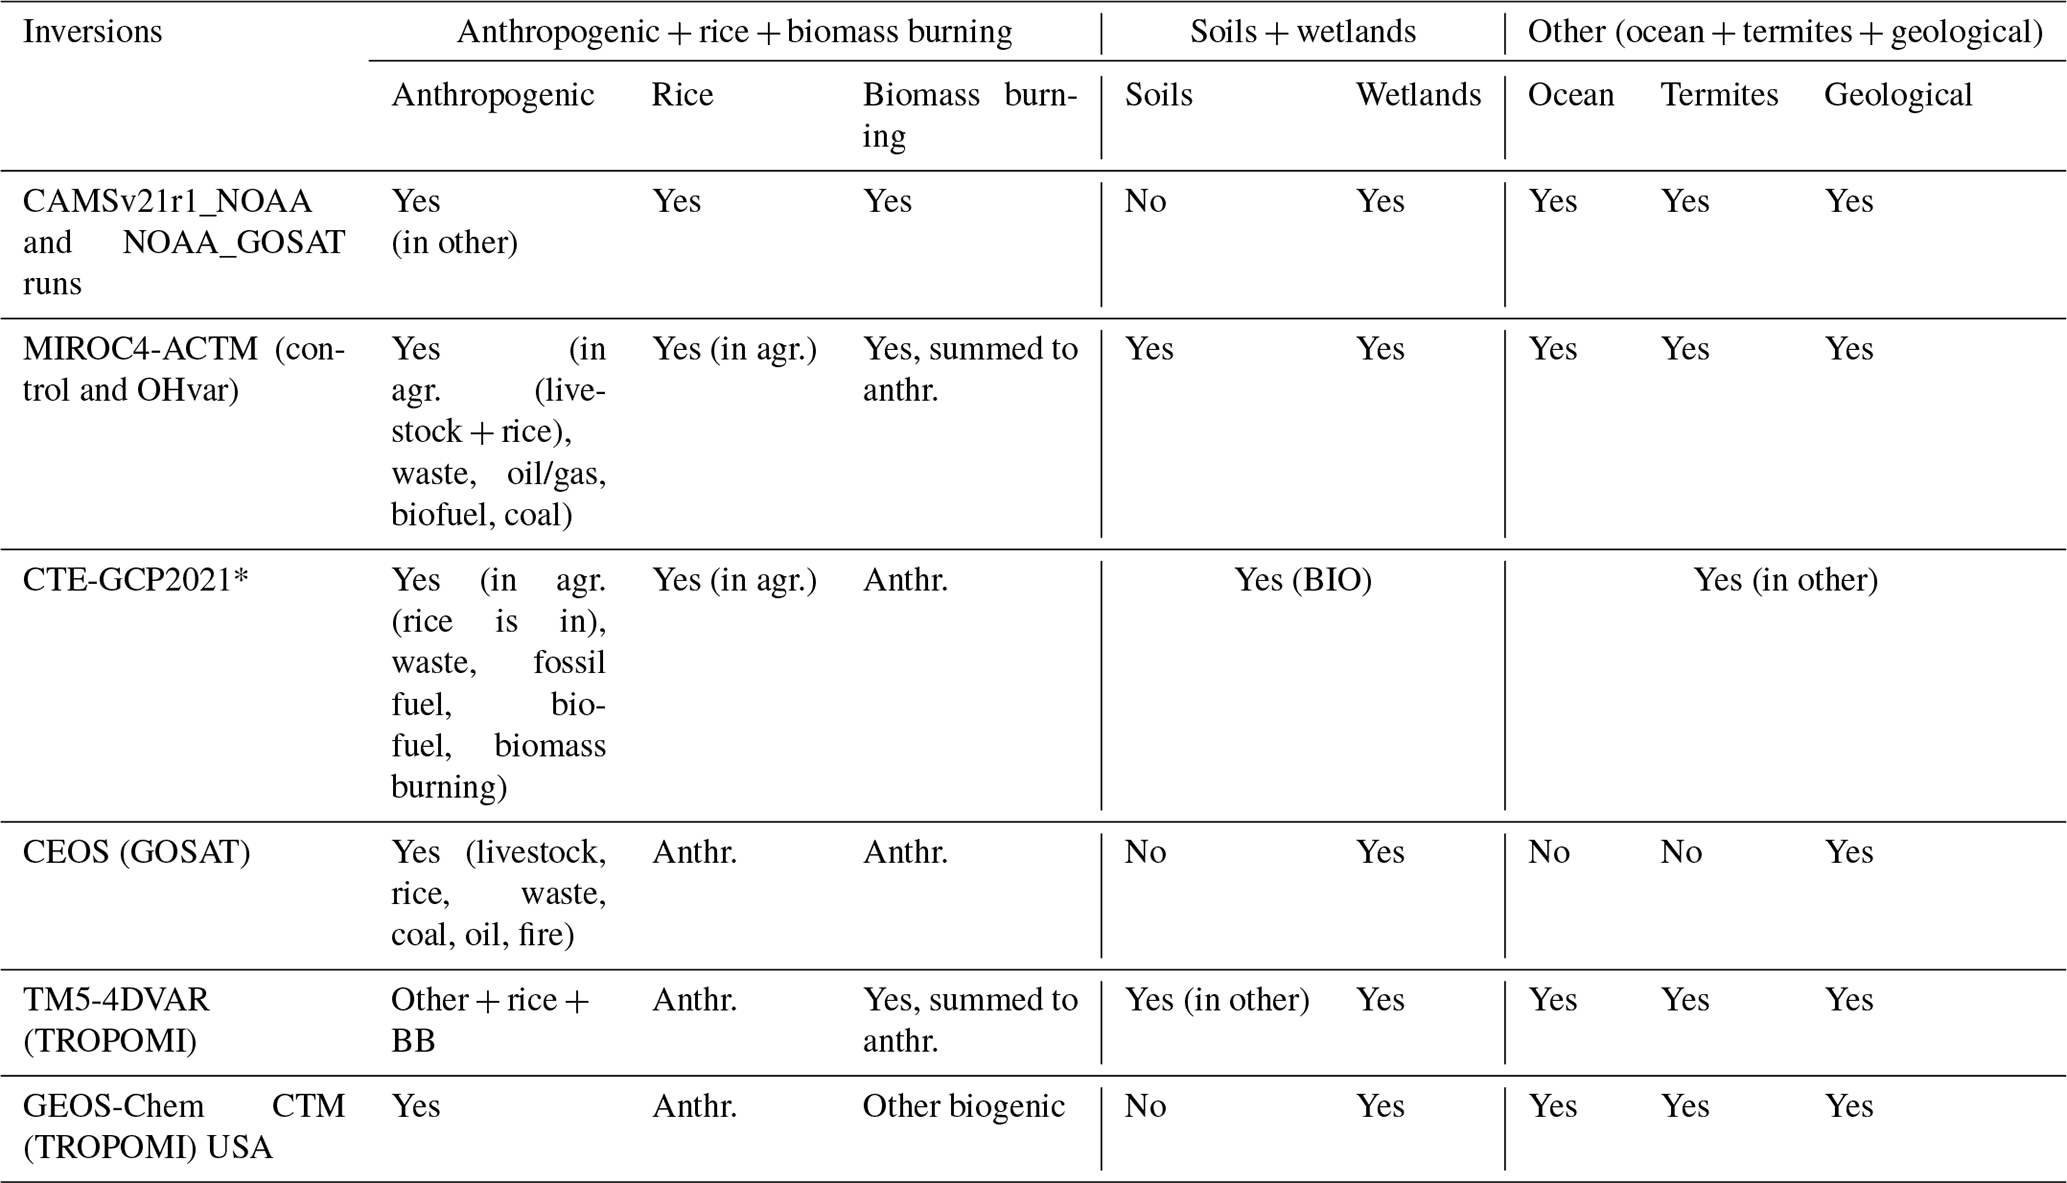
* CTE-GCP2021 partitions refer to anthropogenic, biogenic, and other. Other fluxes are imposed.
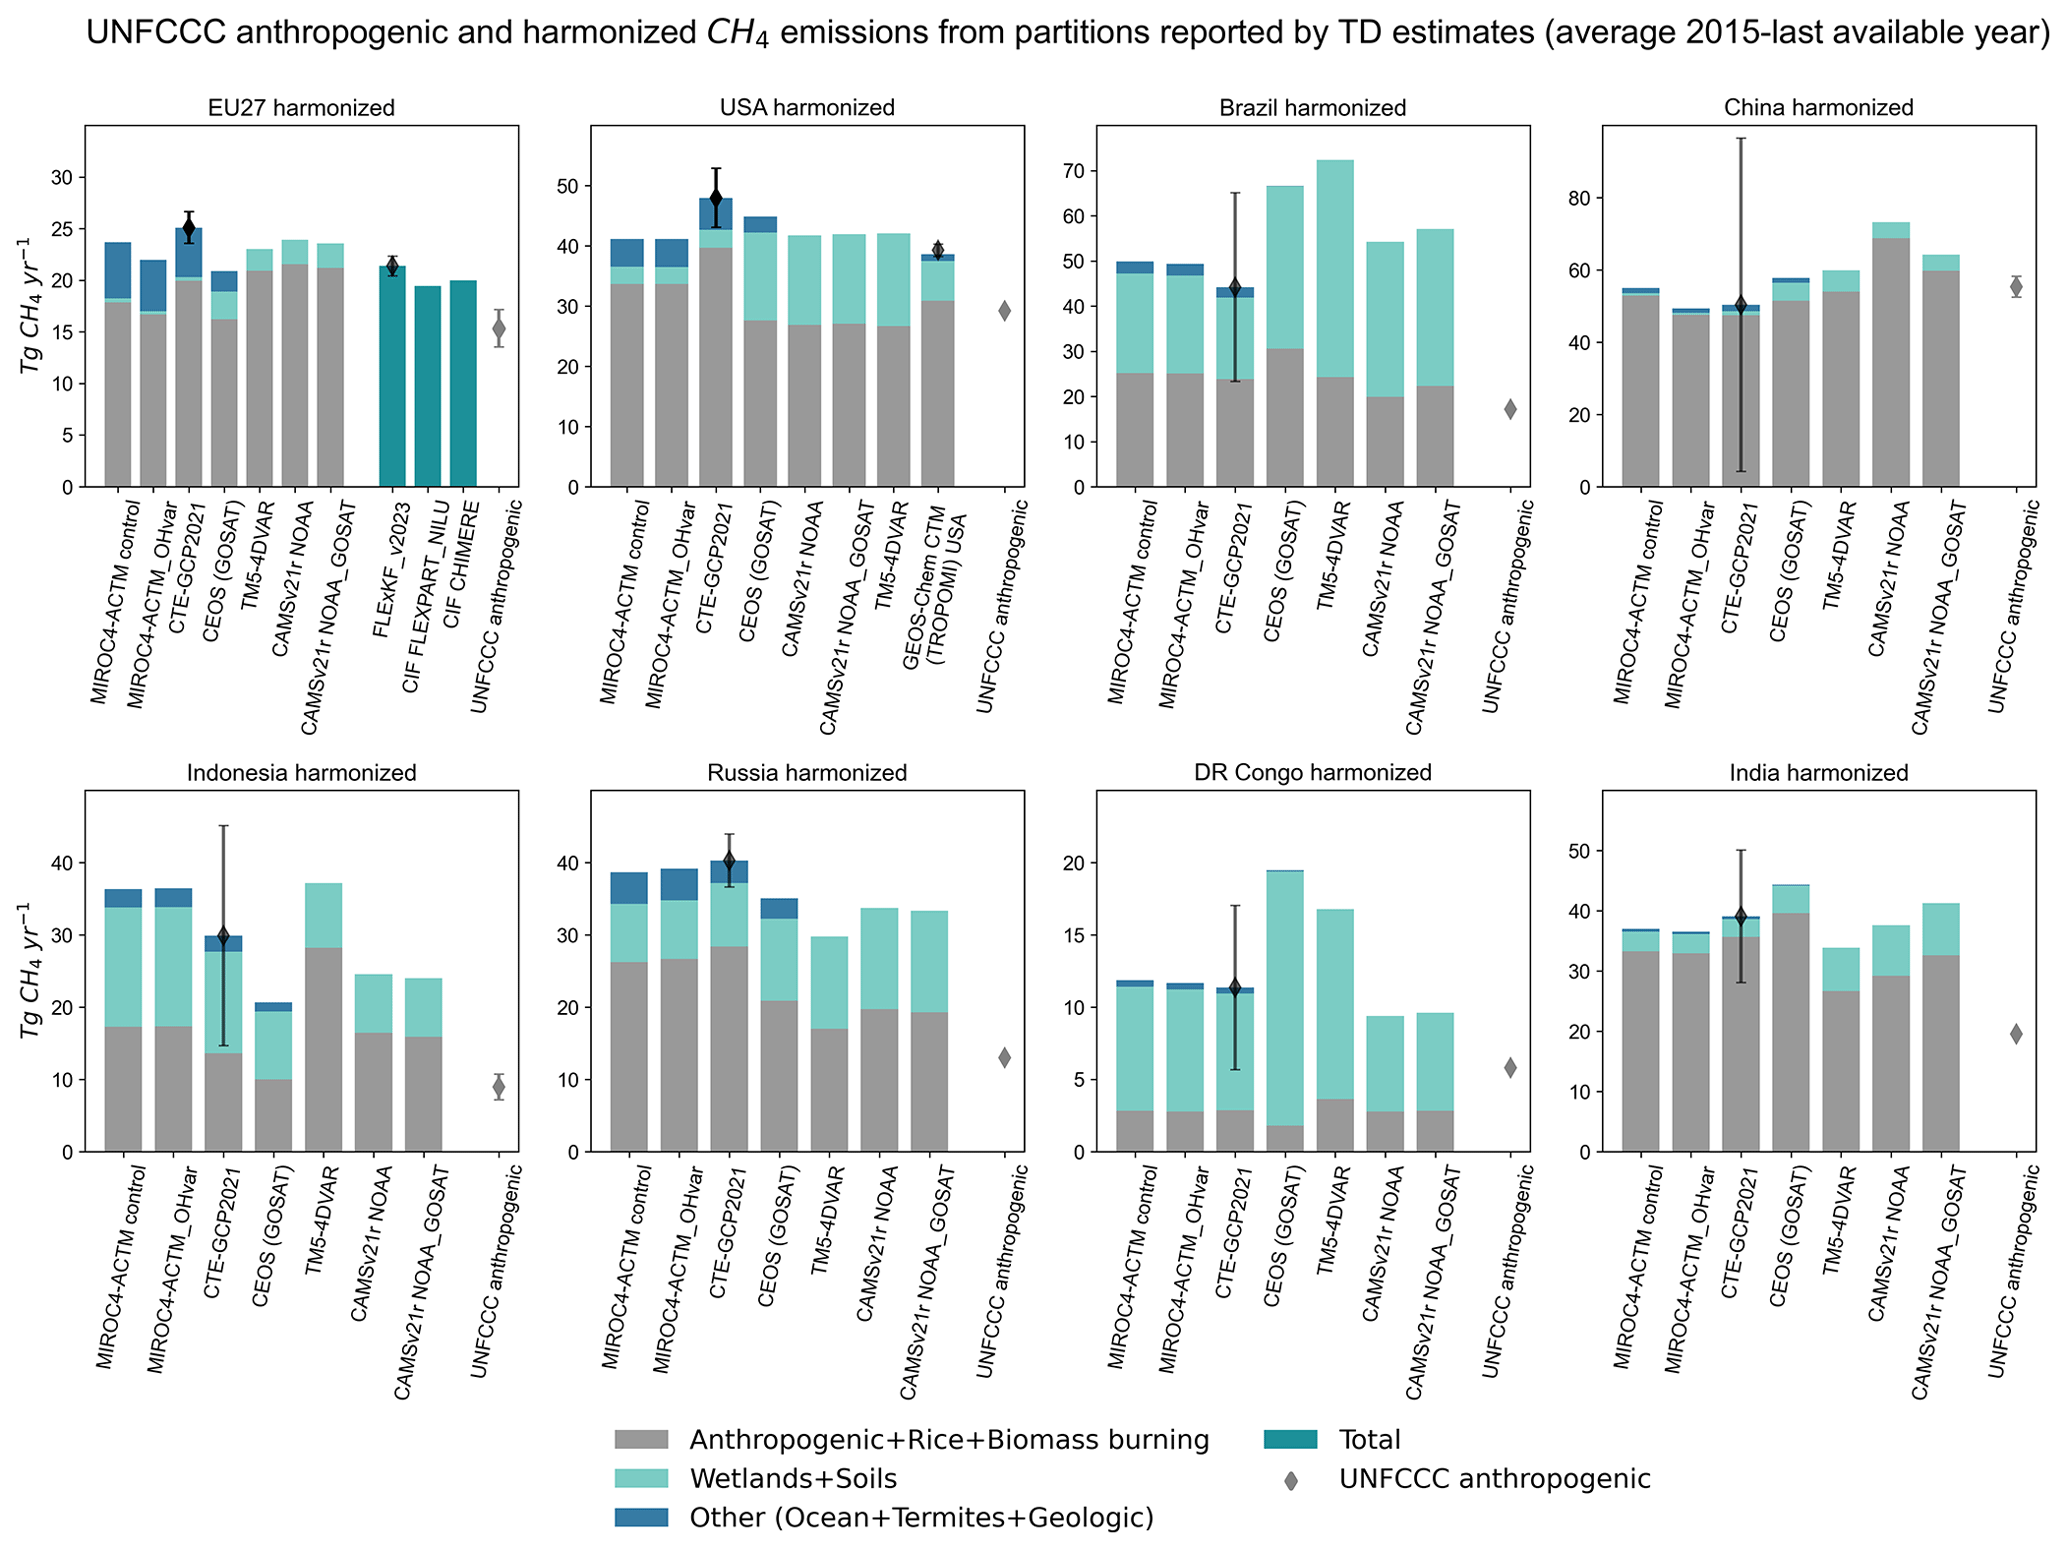
Figure 6Total (green) and disaggregated anthropogenic and natural CH4 emissions from TD estimates compared to UNFCCC NGHGI (2023) anthropogenic emissions (including LULUCF) for the EU and seven global emitters (the USA, Brazil, China, Indonesia, Russia, and DR Congo). The UNFCCC anthropogenic value represents the sum of all five IPCC sectors (energy, IPPU, agriculture, LULUCF, and waste). The partitions reported by the TD global inversions are harmonized and detailed in Table 3. For the EU, the relative error on the UNFCCC value represents the NGHGI (2023) reported uncertainties computed with the error propagation method (95 % confidence interval) and gap-filled to provide respective estimates for each year (see Petrescu et al., 2023, Appendix). In 2014, the China UNFCCC value and reported uncertainties (min 5.2 % and max 5.3 %) are for 2014, while the Indonesia reported uncertainties are for 2019 (19.9 %). The India UNFCCC value is for 2016. CTE-GCP2021 provides uncertainties for each partition, but here we plotted the uncertainty of the total flux. FLExKF_v2023 reports the relative uncertainty (%) of the posterior emissions. The plotted data represent the average between 2015 and the last available reported year as follows: CIF-CHIMERE (2022); UNFCCC CRFs, TM5-4DVAR, CIF-FLEXPART, and CTE-GCP2021 (2020); and FLExKF_v2023, both MIROC4-ACTM runs, and both CAMSv21r1 runs (2021). GEOS-Chem CTM (TROPOMI) USA reports only for 2019 (Nesser et al., 2024).
3.5 Comparison of BU and TD CH4 estimates
Figure 7 summarizes the total CH4 fluxes for the EU and the seven global emitters as follows: BU anthropogenic sources disaggregated per sector, BU natural emissions, TD natural emissions from regional and global inversions, and total emissions from global TD estimates (see Sect. 2.3 and Supplement for a description of all data products). This figure brings all the estimates together to demonstrate the reconciliation process.
Inversions currently report in a way that makes comparison between BU natural and TD natural sources difficult. TD products differ in the sources they report (Table 2) or they allocate them to different categories. We consider the following sources to be natural: biomass burning, soils, oceans, and termites (often reported by inversions under the category other), wetlands, geological, and lakes and reservoirs (or fresh waters). Due to the lack of information, biomass burning emissions were considered among the natural sources, recognizing that in regions like tropical forests some of these events are influenced by human intervention. To make the products from Fig. 7 comparable, we added the missing BU information from TD and vice versa, presented in hatched pattern. In this way, comparison between BU and TD natural emission estimates is consistent regarding the apples-to-apples comparison but became “apples of different flavors” (see Table 4).
Table 4BU and TD natural partitions as presented in Fig. 7.
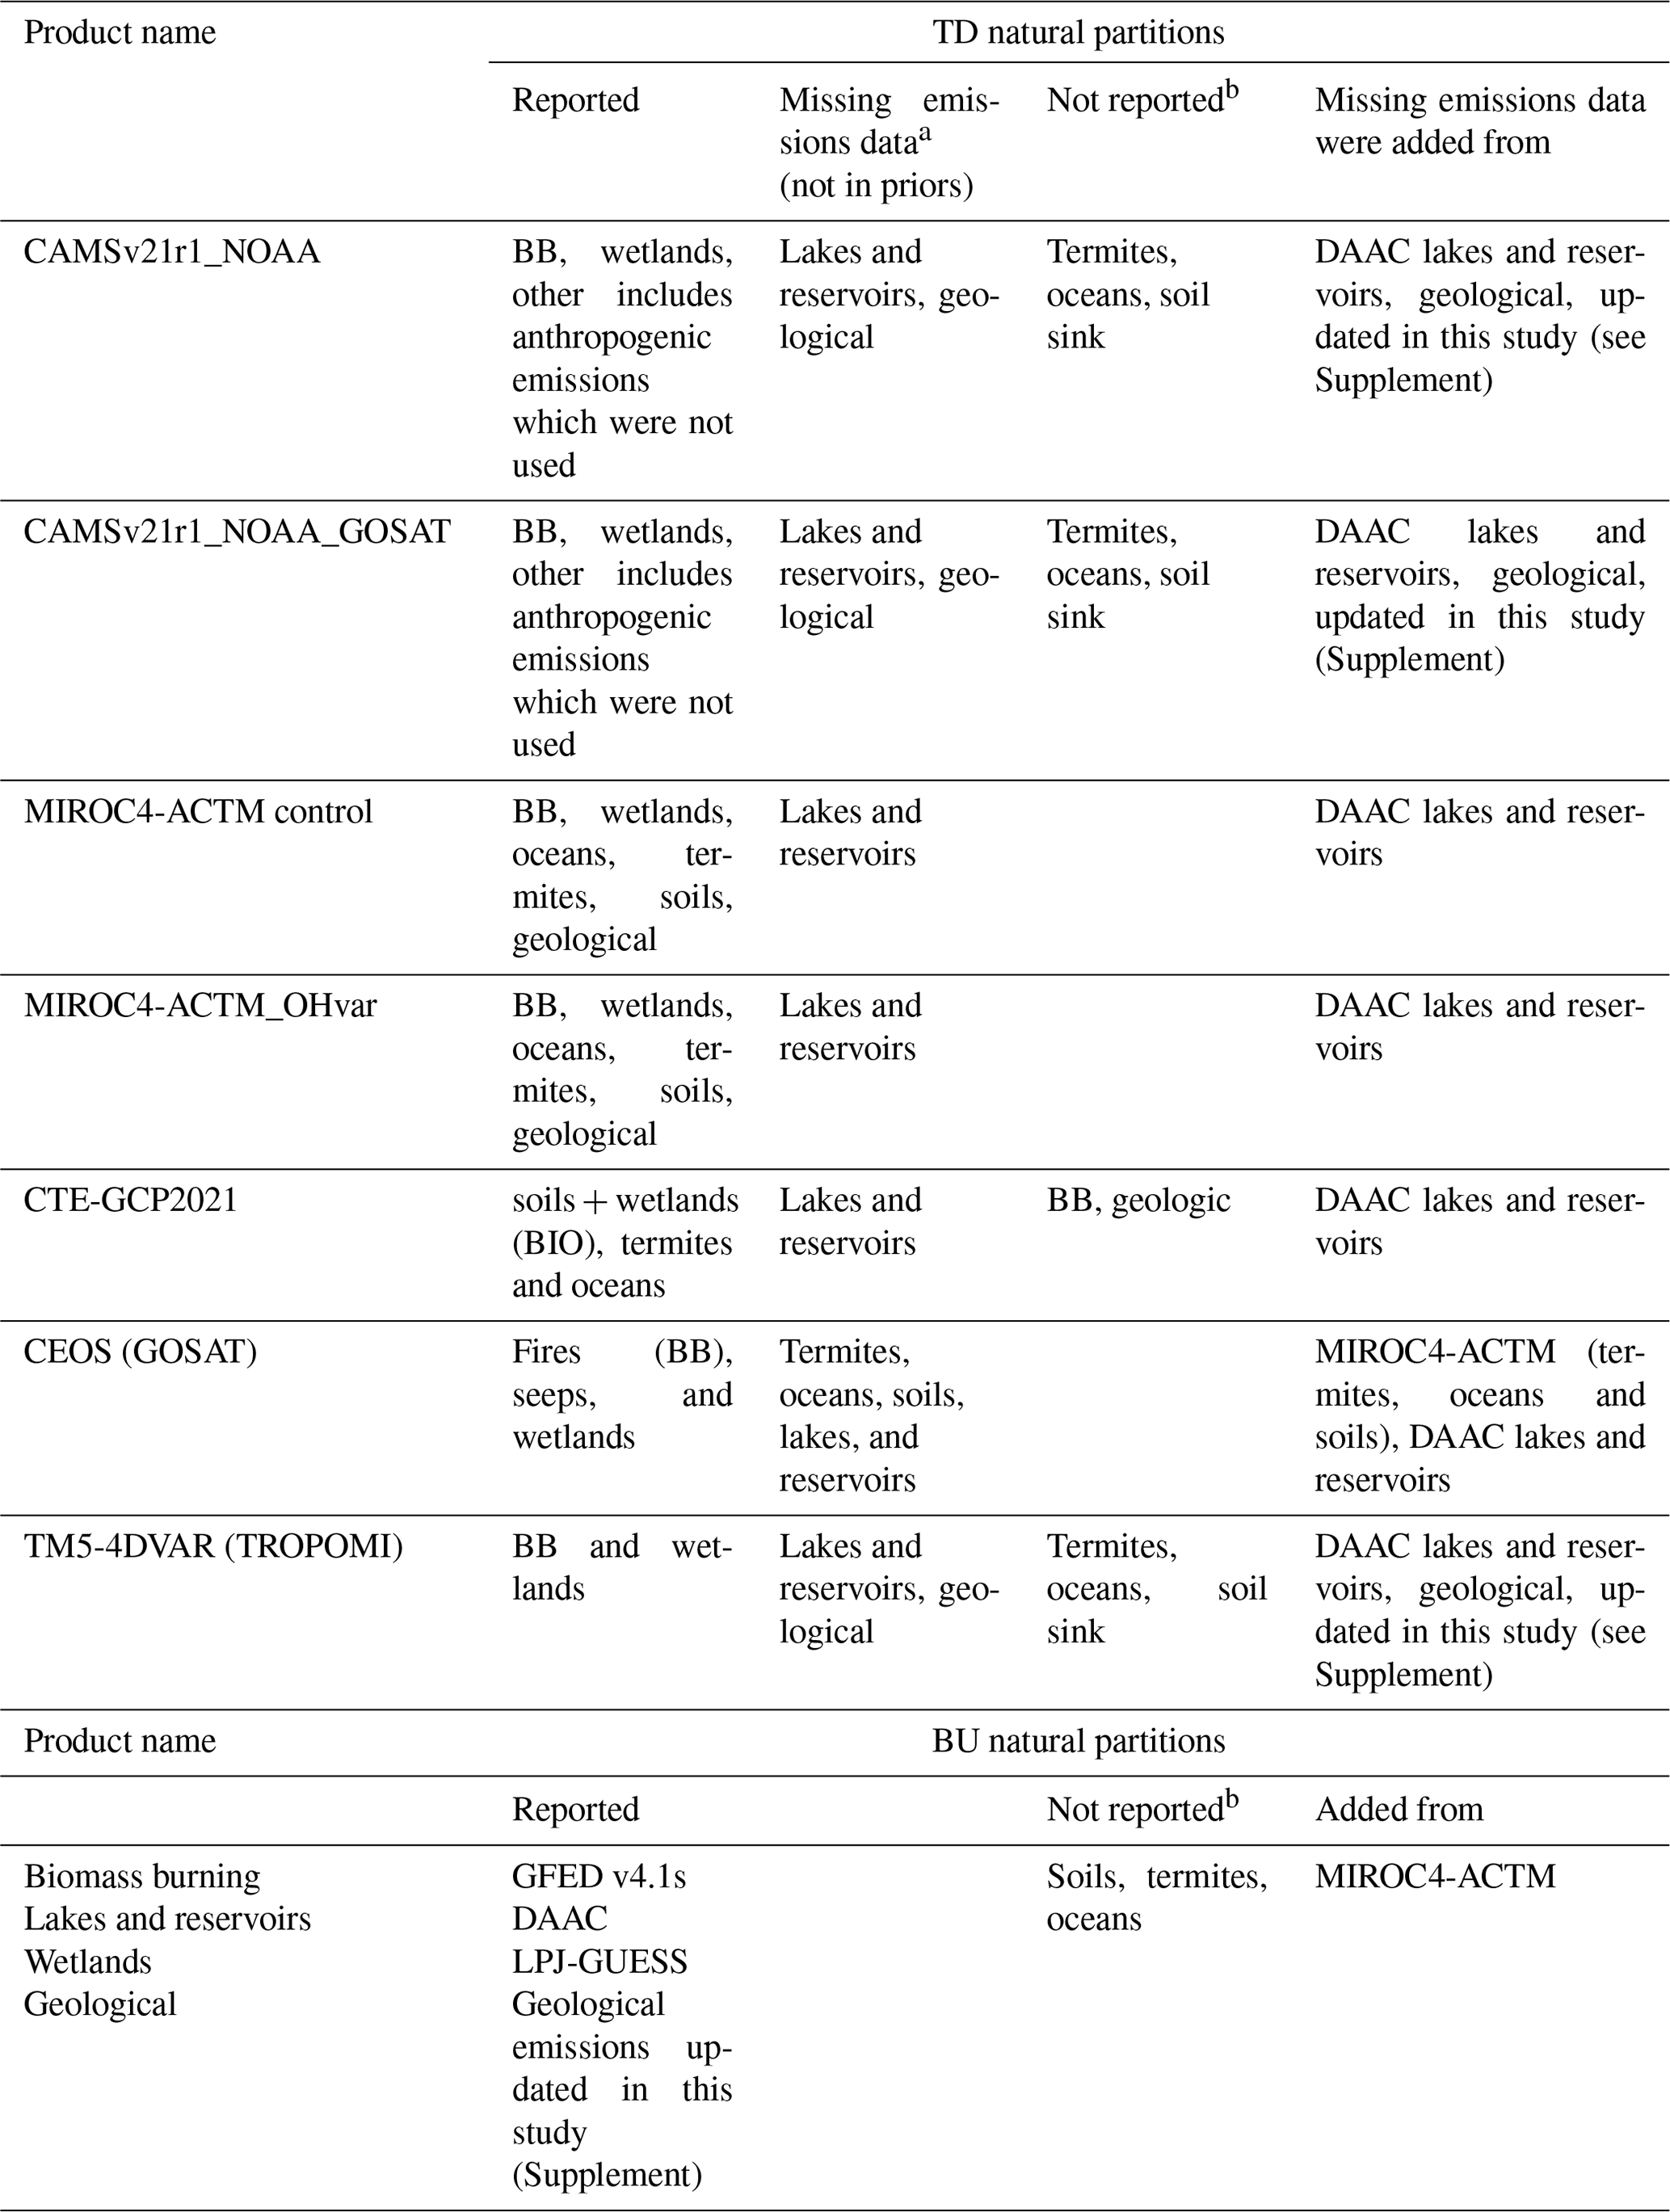
In TD products termites and ocean emissions are imposed from existing literature.
a Missing: not in the priors; presented as a hatched pattern in the figure “”.
b Not reported: data not available; presented as a hatched pattern in the figure “///”.
For an easier visual comparison and reconciliation between BU and TD estimates, we added the mean of the BU anthropogenic estimates (off-white) underneath the BU and TD natural estimates. Note that for some countries (e.g., Russia, DR Congo) this area might look like it was subtracted from the BU natural estimates, but this is due to the sign convention used in this study (sink is negative and source is positive). In most cases, the missing soil sink emissions are represented as a downward area.
We note that for most countries, the sum of the anthropogenic and natural components matches those of the TD global total estimates. This gives confidence that, to a certain extent and albeit with inconsistencies between products, BU anthropogenic emission estimates are accurate and consistent with the observation-based estimates and can be used to reconcile with the atmospheric estimates. We note from Fig. 7 that in all Annex I countries (the EU, the USA, Russia) and China, TD and BU natural emissions are consistent with each other, after including the missing sources, as detailed in Table 4. For Brazil and DR Congo, the gap between the two natural components is highly significant, while it is less significant for Indonesia and India. We hypothesize that mapping of the wetland extent might cause these inconsistencies.
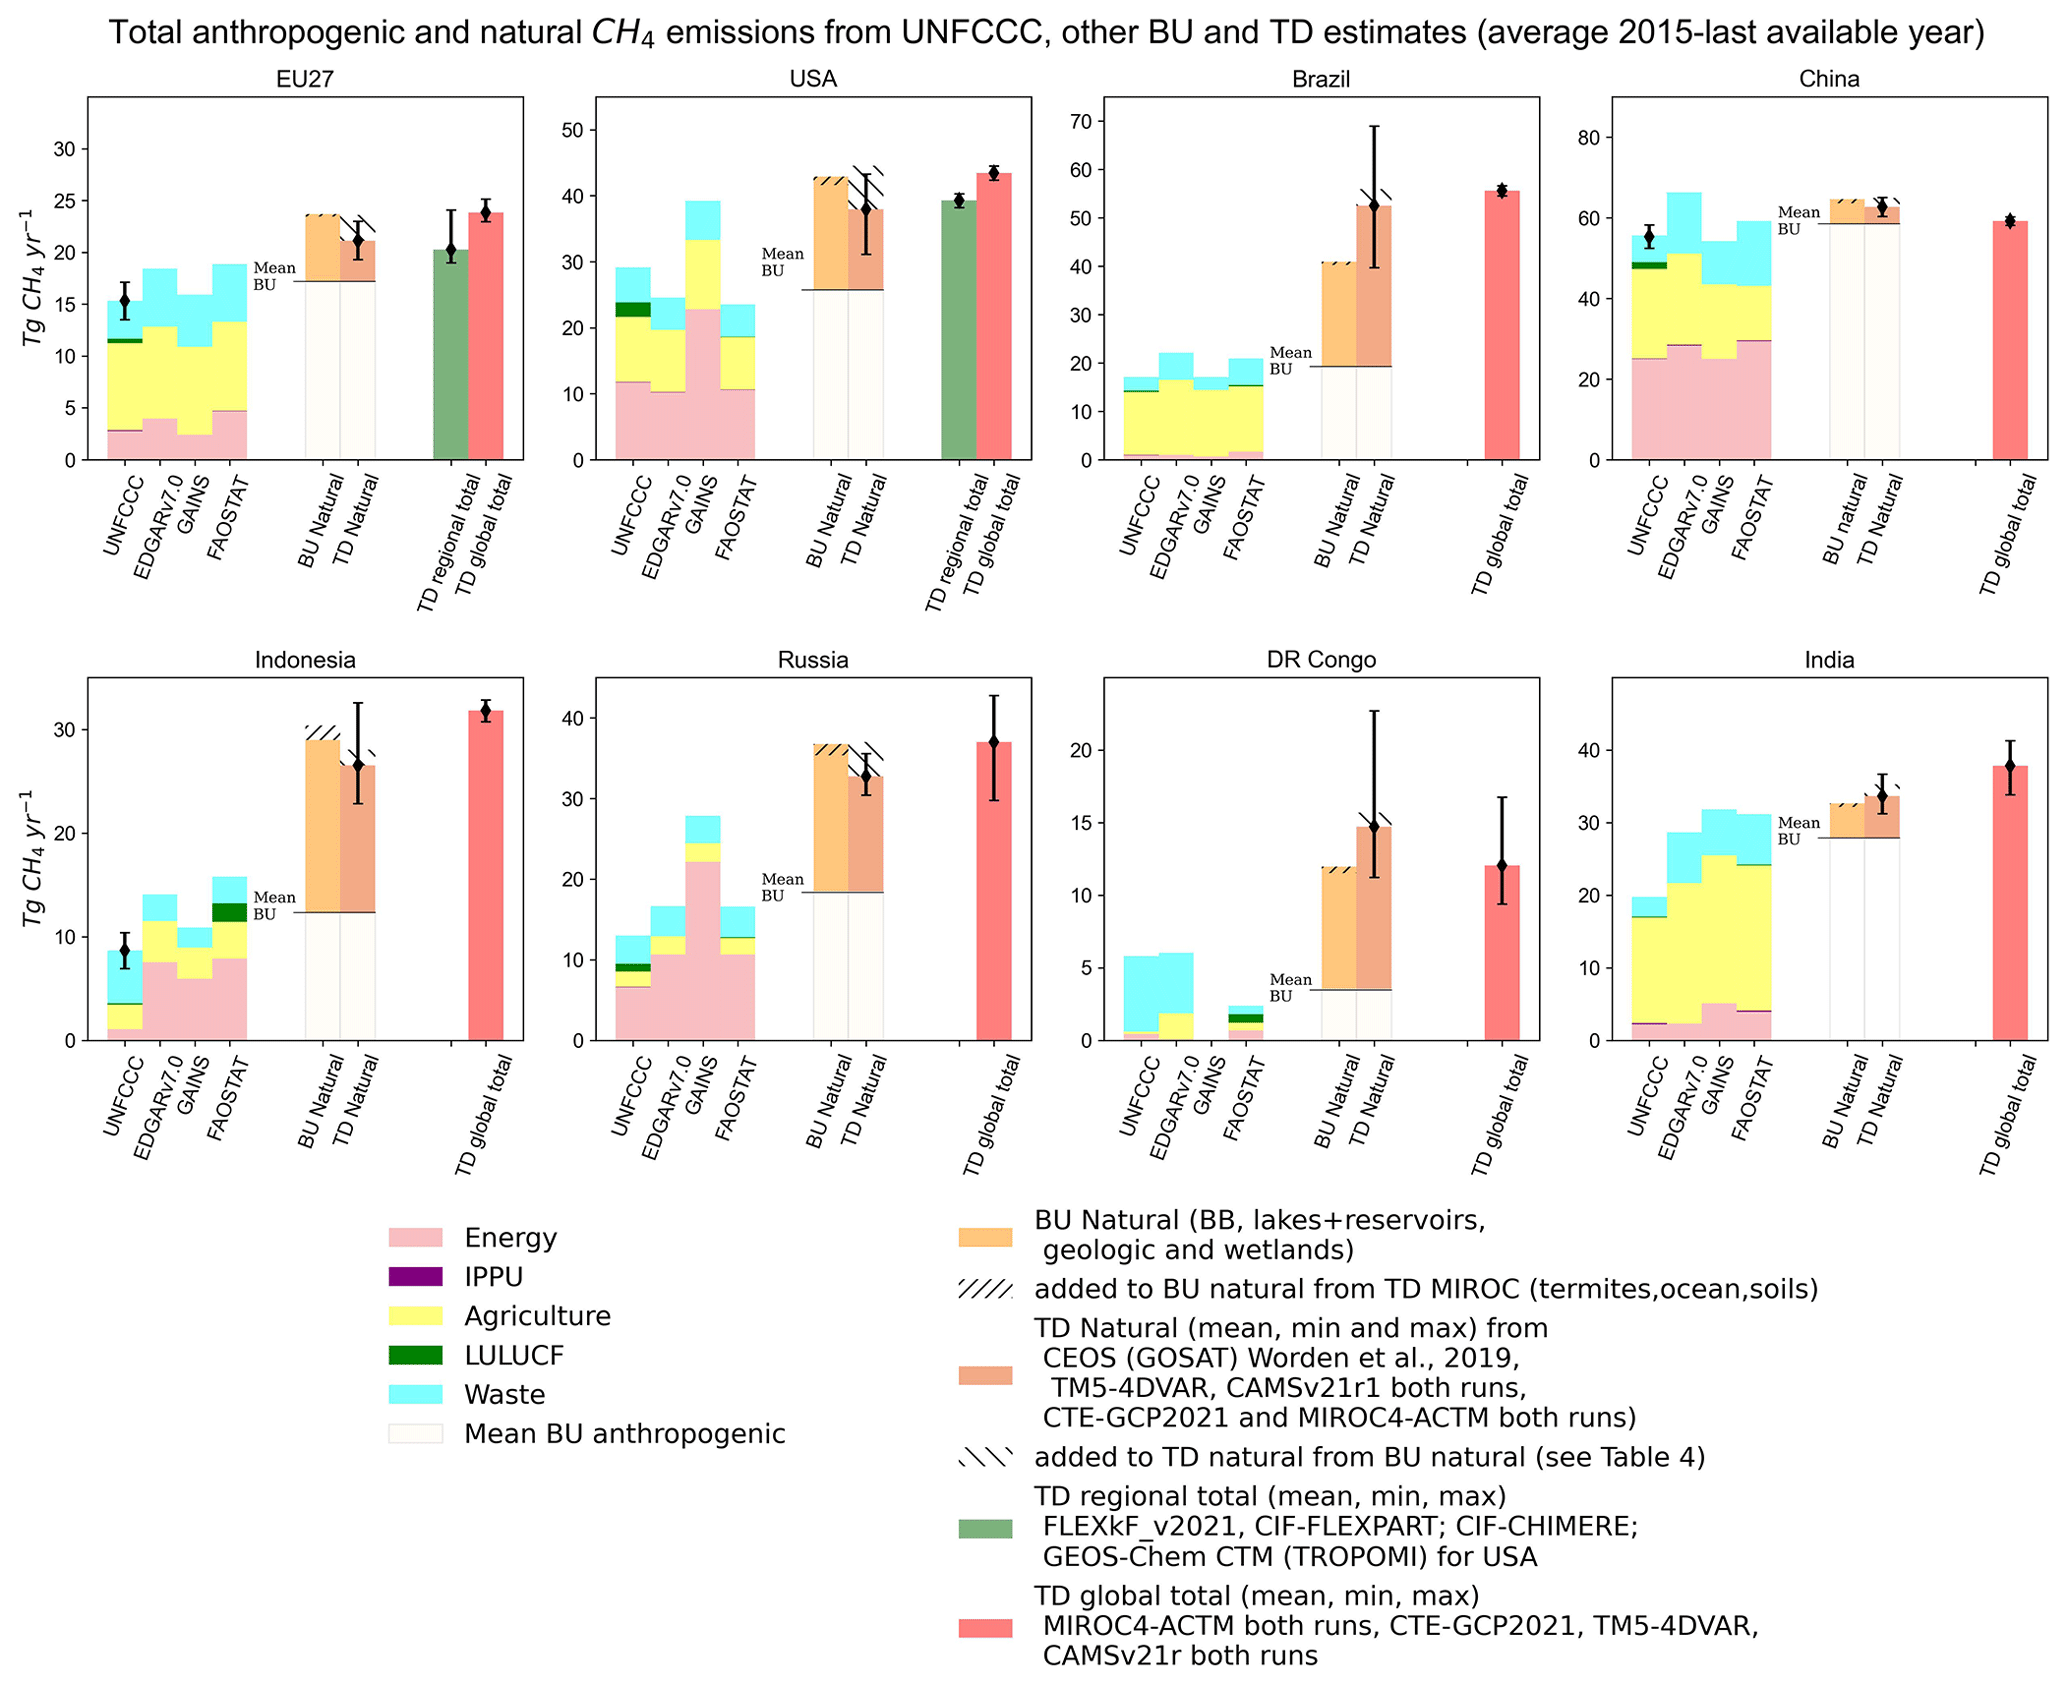
Figure 7Total anthropogenic and natural CH4 emissions from BU and TD estimates presented as the average of 2015–last available year for the EU and seven global emitters (the USA, Brazil, China, Indonesia, Russia, DR Congo, and India). The BU anthropogenic estimates belong to UNFCCC NGHGI (2023) CRFs and BURs (including LULUCF) as sectoral shares, EDGAR v7.0, GAINS, and FAOSTAT/PRIMAP-hist. For the EU, the relative error on the UNFCCC value represents the NGHGI (2023) reported uncertainties computed with the error propagation method (95 % confidence interval) and gap-filled to provide respective estimates for each year (see Petrescu et al., 2023, Appendix). In 2014, China reported uncertainties of min 5.2 % to max 5.3 %. The BU natural emissions for the EU are the sum of the VERIFY products (biomass burning, inland waters, geological, and peatlands plus mineral soils as described in Petrescu et al., 2021, 2023, Appendix A2.1). For the seven non-EU emitters, the BU natural fluxes are the sum of wetland emissions (LPJ-GUESS), lakes and reservoirs fluxes (ORNL DAAC, Johnson et al., 2022), geological (updated activity in the Supplement), and biomass burning emissions (GFED v4.1s). The TD natural global estimates are presented in Table 1. The uncertainty on the TD natural emissions is the min/max of all estimates. To BU and TD estimates, data in the format of “not reported” or “missing emissions data (not in priors)” were added as explained in Table 4. The natural emissions have been plotted starting at the mean of the BU anthropogenic estimates to retain comparability across the natural emission estimates but also to compare with the total TD estimates. The total regional TD estimates (for the EU) belong to the mean and min/max of FLExKF_v2023, CIF-FLEXPART, and CIF-CHIMERE and for the USA GEOS-Chem CTM (TROPOMI) for the year 2019 (Nesser et al., 2024). The total global TD inversions represent the average of 2015–last available year of the mean and min/max of CTE-GCP2021, both MIROC4-ACTM runs, both CAMSv21r runs, and TM5-4DVAR. The last available years are 2022 for CIF-CHIMERE; 2021 for EDGAR v7.0, FAOSTAT/PRIMAP-hist, both MIROC4-ACTM runs, UNFCCC CRFs, and both CAMSv21r1 runs; and 2020 for CIF-FLEXPART and CTE-GCP2021. TM5-4DVAR partitioned data are only available between 2018 and 2020.
However, Fig. 7 should be interpreted with caution because in Europe natural emission priors come from regional ecosystem model simulations, where drained peatland, drainage ditch areas, and pristine areas are lumped together. Therefore, if LULUCF sector and natural BU emissions are included in the total budget estimation, there is some overlap and possible double counting. In particular, ecosystem model estimates of soil sink or inundated soil emissions may overlap with the NGHGI managed peatland forest soil category (or agricultural soils). The separation of emissions into different categories requires further clarification together with inventory makers. Furthermore, it should be assessed which emissions should be called natural and which anthropogenic (e.g., LULUCF, agriculture) by inversions.
An off-the-shelf comparison of BU and TD estimates is not possible, with a variety of adjustments needed for comparability, often without the necessary data. Broadly speaking, inversions have not necessarily been designed to compare directly to NGHGIs. A valid comparison should have consistent system boundaries and perform a full uncertainty analysis to determine whether differences between estimates are statistically significant given the constraining observational data.
The two most common issues limiting comparability are geographic scope and system boundaries (Petrescu et al., 2021, 2023; McGrath et al., 2023; Andrew, 2020; Grassi et al., 2018). The geographical scope of inverse modeling versus inventory estimates should be controllable, but it can be challenging for small countries or coarse inversions. Inversions are generally performed on a spatial grid and require aggregation, in line with how official NGHGIs are reported (EEA, 2013). Inconsistent system boundaries have implications for comparing the inventory-based estimates with inversions-based estimates for source attribution, e.g., anthropogenic vs. natural. Most emission inventories aim at estimating anthropogenic emissions, while most inversions estimate anthropogenic and natural emissions. This is a particularly important issue for CH4, where, globally, natural emissions are of similar magnitude to anthropogenic emissions, with larger variations at regional scales, mainly due to seasonality (i.e., wetlands). Thus, methods are needed to separate the anthropogenic flux from the total flux (Deng et al., 2022, and above Sect. 3.4). Similar issues arise with fossil CO2 (Andrew, 2020) as different datasets can report different emission sources. Standardization procedures, such as the Community Inversion Framework (CIF; Berchet et al., 2021), may help resolve some of these issues.
When comparing inventory- and inversion-based emissions, there are difficulties in analyzing trends due to different timescale variability. Inventory-based approaches report emissions at the annual level but often do not consider interannual variations. Further, the Paris Agreement is set around 5-yearly global stocktakes, which indicates a desire to average trends, prioritizing the multi-annual trend over IAV and canceling out extremes from weather and socio-economic fluctuations. Inversion models, on the other hand, include variations over a wide range of timescales, but in particular for IAV (e.g., OH and weather) that remains challenging to assess. For an effective comparison, inversion-based estimates need to have IAVs statistically removed to make comparisons with NGHGIs easier (e.g., 5-year or 10-year averages or trend analysis). Additionally, averages of ensembles of inversions may mask underlying differences and trends in individual inversions. Many research projects make use of multi-model ensembles (Saunois et al., 2020; Deng et al., 2022; Lauerwald et al., 2024; Zhang et al., 2024). From a scientific perspective, the model ensemble is often considered a more robust estimate of the mean and uncertainty, as often individual estimates make errors due to some limitations and biases, while in an ensemble these errors are averaged out. From an inventory perspective, individual model comparisons may be more efficient, as various input variables or processes can be compared directly to the inventory. Currently, most inventory comparisons in UNFCCC NGHGI (e.g., UK, Switzerland) use single-model comparisons.
A strength of inversions is that they provide high temporal and spatial resolutions, which are not directly capitalized on when comparing with inventories. CH4 from the fossil fuel industry can contribute to large releases to the atmosphere over a short period of time, given the large number of uncontrolled emission point sources in oil and gas (O&G) and coal production areas worldwide (Jackson et al., 2020). Such processes include leakage from landfills, spontaneous events from oil and gas production activities, and so-called uncontrolled gas well blasts, among others (Jacob et al., 2016, 2022). These uncontrolled events are difficult to include in the national inventories, leading to a potential underestimate of emissions (Massakkers et al., 2016, 2022). Recently, under the CoCO2 project (https://coco2-project.eu/) a hot-spot satellite detection interactive map (published studies on hot-spot detection (CO2, CH4) – uMap; http://openstreetmap.fr, last access: February 2024) was released as a user-centric interface featuring published studies on hot-spot detection between 2010 and 2021. It allows for advanced filtering by year, gas, activity, geographical zone, and country.
A key challenge when comparing inversions with NGHGIs is ensuring independence from the assumed prior emissions. A more valid comparison between inversions is made when all inversions use the same priors. In this context, we define as priors input data in the form of atmospheric observations (e.g., satellite retrievals, ground-based observation networks (ICOS)) and/or bottom-up emission datasets (e.g., EDGAR, GAINS) used as input parameters to the inverse models. A key issue is the prior emission estimate. Theoretically, a constant emission prior could be used, but this would require a dense observational network. Because of sparse observations, inversion modelers assess how far observations have shifted the prior emissions to the posterior emissions, preferably incorporating a full uncertainty analysis. The posterior emissions depend to a varying extent on the prior that was used; the extent of this dependency is determined by the number of observations used in the inversion, by how the observations relate to the emissions (governed by atmospheric transport), and by the uncertainties assigned to the prior emissions and the observations. Thus, better quantified uncertainties for the prior emissions would lead to more robust inversions. This stresses the need for more systematic in situ data to produce adequate prior data (Bastviken et al., 2022) and synthesized atmospheric observations with their uncertainties to robustly constrain the inversions.
It is not generally clear how inventory uncertainties can be compared to inversion uncertainties; however, it is important that both methods provide comprehensive uncertainty estimates. The prior emissions used as input into an inversion model should have robust uncertainty estimates, particularly with correlations in space and time. This allows a full inversion system to better characterize how observations reduce uncertainty when estimating the posterior estimate. Very few inversions routinely report this information. The inventory-based emission estimate will additionally have uncertainty estimates, though these statistics may not be sufficiently robust for verification purposes (National Academies of Sciences, Engineering, and Medicine, 2022). There are often offsets in inversion models, because of systematic inconsistencies between observations and chemistry-transport models, which may make trends more robust than instantaneous estimates. Although, estimating uncertainty in trends also requires understanding the correlation structure in time.
A key challenge for comparisons between NGHGI and independent estimates is understanding the reasons for differences. In the case of BU comparisons, obtaining sufficient activity data and emission factors should enable an accurate reconciliation of different estimates. However, in practice, it is often not possible to obtain the necessary data. For inversions it is more complex. Often a close collaboration may be needed between the inversion modeler and NGHGI team (e.g., UK NIR). If an inversion indicated a different trend in agricultural CH4 emissions, it is necessary to track down if this is a real difference or artifact of the inversion system. After this, the spatial and temporal data in the inversion could be useful to the NGHGI team to locate what is causing the difference. Many of the comparisons we show in this article ultimately remain comparisons, with detailed reconciliations likely requiring intensive country-level case studies.
Data files reported in this work which were used for calculations and figures are available for public download at https://doi.org/10.5281/zenodo.12818506 (Petrescu et al., 2024). The data are accessible with one click (without the need for entering login and password), with a second click to download the data, consistent with the two-click-access principle for data published in Earth System Science Data (Carlson and Oda, 2018). The data and the DOI number are subject to future updates and only refer to this version of the paper. The raw gridded data are available upon request, directly from the data providers, as detailed in Table S2.
We analyzed data from anthropogenic and natural CH4 fluxes from BU and TD observation-based estimates (Table 1). BU estimates show that the largest sectors depend on the country: agriculture (EU, Brazil, India), energy (the USA, China, Russia), and waste (Indonesia, DR Congo). The inversions attribute most of the fluxes to the anthropogenic emissions, with tropical countries having a larger share of natural emissions (wetlands). The EU and the seven other large emitters analyzed here contribute anthropogenic emissions of 173 Tg CH4 yr−1 (sum of the last UNFCCC reported year, Figs. 1, 2), representing roughly half of the total global anthropogenic emissions (386 Tg CH4 yr−1) reported by EDGAR v7.0 in 2021. For comparison, the average of the anthropogenic component from the atmospheric global inversions (MIROC booth runs, CTE-GCP2021, CEOS, and CAMS booth runs) is 181 Tg CH4 yr−1 (Fig. 5).
We performed comparisons to the UNFCCC NGHGIs using the BU and TD data. Comparisons between UNFCCC and BU products (Fig. 3) reveal some deviations, particularly related to assumptions on gas/oil emissions (e.g., GAINS for Russia and the USA) and waste (e.g., Indonesia, DR Congo). It is more challenging to compare BU and TD estimates due to different attribution to source activities (Table 2 and Fig. 5) and different priors used in the simulations (Petrescu et al., 2024, priors table). The comparison between UNFCCC and the TD estimates (Fig. 4) agrees largely with the findings of Deng et al. (2022), who applied different methodologies to calculate natural emissions. In most cases, the gap between the anthropogenic BU fluxes from inventories and total TD fluxes can be largely explained by the natural fluxes (Fig. 7). It is difficult to draw definitive conclusions on emission trends seen by inversions, as the adjustments for natural emissions and IAV and seasonal variability might strongly influence trends. Despite this, given that in most cases the UNFCCC BURs reports are incomplete for the non-Annex I parties (China, Indonesia, DR Congo), it is important to acknowledge that the TD estimates might become a useful way to complement inventories and play a role in the validation of the BU estimates.
There is still a pressing need for reporting of uncertainties in prior and posterior emissions, even if some TD inversions do report it as the standard deviation of ensemble members (CTE-GCP2021 and FLExKF_v2023, Fig. 4). The use of a variety of priors across different inversion systems can also inhibit comparability with inventories and between inversions. Generally, inversions are still ill-constrained by observations (only 60 sites globally plus satellites), and the prior flux uncertainty for each of the 54 regions is large. Therefore, the monthly results could be more ill-constrained than the annual totals. Even if comparisons between CH4 inversion estimates and NGHGIs are currently uncertain because of the spread in the inversion results, TD inversions inferred from atmospheric observations represent partly independent data against which inventory totals and trends can be compared, considering the most encountered issues discussed in Sect. 4.
All the information regarding model/method descriptions is available in the Supplement. Appendices A1 and A2 in Petrescu et al. (2023) contain detailed information about the Table 1 products. Further information on new products together with references and contact details are found in Tables S1 and S2 in the Supplement.
The tables with priors used by all the products and the matrix highlighting the comparability issues identified in Sect. 4 are found on the Zenodo data repository, Petrescu et al. (2024).
The supplement related to this article is available online at: https://doi.org/10.5194/essd-16-4325-2024-supplement.
The first 17 authors are the core group, followed by data providers in alphabetical order. AMRP designed the research and led the discussions; AMRP wrote the initial draft of the paper and edited all the following versions; GPP drafted the initial version of Sect. 4, edited the final version of this paper, contributed to the revised version, and advised on the context; PP processed all the original EU data submitted to the VERIFY portal; RLT, SH, BM, DaB, RL, PKP, AT, RMA, LHI, FNT, GC, and JG edited and gave consistent comments and suggestions on the initial manuscript; DaB, RL, and RMA provided input to the final revised version; all co-authors are data providers and contributed to the subsequent versions of the manuscript by providing specific comments and information related to their data in the main text, as well as product descriptions for the Supplement.
At least one of the (co-)authors is a member of the editorial board of Earth System Science Data. The peer-review process was guided by an independent editor, and the authors also have no other competing interests to declare.
The views expressed in this publication are those of the author(s) and do not necessarily reflect the views or policies of FAO.
Publisher's note: Copernicus Publications remains neutral with regard to jurisdictional claims made in the text, published maps, institutional affiliations, or any other geographical representation in this paper. While Copernicus Publications makes every effort to include appropriate place names, the final responsibility lies with the authors.
The lead author would like to thank former colleagues, Chunjing Qiu and Matthew McGrath, for previous work done for the EU-funded VERIFY project. FAOSTAT statistics are produced and disseminated with the support of its member countries to the FAO regular budget. We acknowledge the work of current and former members of the EDGAR group (Marilena Muntean, Diego Guizzardi, Monica Crippa, Edwin Schaaf, Efisio Solazzo, Gabriel David Orreggioni, and Jos Olivier). Claire Granier, Sekou Keito, and Antonin Soulie from Laboratoire d'Aérologie, CNRS, Toulouse, France, are acknowledged for their work and support in the construction of the TNO_CoCO2_PED18-21.
This research has been supported by the European Commission's Horizon 2020 Framework Programme (CoCO2, grant no. 958927).
Part of Glen P. Peters' work was supported by the European Union's Horizon Europe Research and Innovation program (grant no. 101081395 (EYE-CLIMA)). Development of MIROC4-ACTM is supported by the Environment Research and Technology Development Fund (grant no. JP-MEERF21S20800) and the Arctic Challenge for Sustainability phase II (ArCS-II; grant no. JP-MXD1420318865) project. Dominik Brunner was supported by FORMAS (grant no. 2018-01794), the European Union (H2020, grant no. 101015825; TRIAGE), and the Swedish Research Council (VR; grant no. 2022-03841). Pierre Regnier received funding from the European Union's Horizon 2020 Research and Innovation program (grant no. 101003536 (ESM2025 – Earth System Models for the Future)) and from the FRS-FRNS PDR project T.0191.23 CH4-lakes. Annual, gap-filled, and harmonized NGHGI uncertainty estimates for the EU were provided by the EU GHG inventory team (European Environment Agency and its European Topic Centre on Climate Change Mitigation). Ronny Lauerwald received funding from French state aid, managed by ANR under the Investissements d'Avenir program (ANR-16-CONV-0003). Wenxin Zhang was supported by grants from the Swedish Research Council (2020-05338) and Swedish National Space Agency (grant no. 209/19). Part of John R. Worden's work was carried out at the Jet Propulsion Laboratory, California Institute of Technology, under contract with the National Aeronautics and Space Administration (NASA). Part of Philippe Peylin's work was supported by the European Commission H2020 Framework Programme (grant no. 776810 (VERIFY)). Part of Stijn N. C. Dellaert's and Hugo Denier van der Gon's work was also supported by European Union's Horizon Europe Research and Innovation program (grant no. 101081322 (AVENGERS)).
This paper was edited by Bo Zheng and reviewed by two anonymous referees.
Alvarez, R. A., Zavala-Araiza, D., Lyon, D. R., Allen, D. T., Barkley, Z. R., Brandt, A. R., Davis, K. J., Herndon, S. C., Jacob, D. J., Karion, A., Kort, E. A., Lamb, B. K., Lauvaux, T., Maasakkers, J. D., Marchese, A. J., Omara, M., Pacala, S. W., Peischl, J., Robinson, A. L., Shepson, P. B., Sweeney, C., Townsend-Small, A., Wofsy, S. C., and Hamburg, S. P.: Assessment of methane emissions from the U.S. oil and gas supply chain, Science, 361, 186–188, https://doi.org/10.1126/science.aar7204, 2018.
Andrew, R. M.: A comparison of estimates of global carbon dioxide emissions from fossil carbon sources, Earth Syst. Sci. Data, 12, 1437–1465, https://doi.org/10.5194/essd-12-1437-2020, 2020.
Assè-Wassa Sama, M. and Berenger, V.: In Africa, Greenhouse gas emissions from the waste sector increase, despite efforts from local actors, Observatory op Climate Action in Africa report, https://www.climate-chance.org/wp-content/uploads/2023/06/obsaf_emag6_note-economie-circulaire-et-dechets_eng-2.pdf (last access: November 2023), 2023.
Balcombe, P., Speirs, J. F., Brandon, N. P., and Hawkes, A. D.: Methane emissions: Choosing the right climate metric and time horizon, Environ. Sci.-Processes Impacts, 20, 1323, https://doi.org/10.1039/C8EM00414E, 2018.
Bastviken, D., Wilk, J., Duc, N. T., Gålfalk, M., Karlson, M., Neset, T.-S., Neset, Opach, T., Enrich-Prast, A., and Sundgren, I.: Critical method needs in measuring greenhouse gas fluxes, Environ. Res. Lett., 17, 104009, https://doi.org/10.1088/1748-9326/ac8fa9, 2022.
Basu, S., Lan, X., Dlugokencky, E., Michel, S., Schwietzke, S., Miller, J. B., Bruhwiler, L., Oh, Y., Tans, P. P., Apadula, F., Gatti, L. V., Jordan, A., Necki, J., Sasakawa, M., Morimoto, S., Di Iorio, T., Lee, H., Arduini, J., and Manca, G.: Estimating emissions of methane consistent with atmospheric measurements of methane and δ13C of methane, Atmos. Chem. Phys., 22, 15351–15377, https://doi.org/10.5194/acp-22-15351-2022, 2022.
Berchet, A., Sollum, E., Thompson, R. L., Pison, I., Thanwerdas, J., Broquet, G., Chevallier, F., Aalto, T., Berchet, A., Bergamaschi, P., Brunner, D., Engelen, R., Fortems-Cheiney, A., Gerbig, C., Groot Zwaaftink, C. D., Haussaire, J.-M., Henne, S., Houweling, S., Karstens, U., Kutsch, W. L., Luijkx, I. T., Monteil, G., Palmer, P. I., van Peet, J. C. A., Peters, W., Peylin, P., Potier, E., Rödenbeck, C., Saunois, M., Scholze, M., Tsuruta, A., and Zhao, Y.: The Community Inversion Framework v1.0: a unified system for atmospheric inversion studies, Geosci. Model Dev., 14, 5331–5354, https://doi.org/10.5194/gmd-14-5331-2021, 2021.
Bergamaschi, P., Karstens, U., Manning, A. J., Saunois, M., Tsuruta, A., Berchet, A., Vermeulen, A. T., Arnold, T., Janssens-Maenhout, G., Hammer, S., Levin, I., Schmidt, M., Ramonet, M., Lopez, M., Lavric, J., Aalto, T., Chen, H., Feist, D. G., Gerbig, C., Haszpra, L., Hermansen, O., Manca, G., Moncrieff, J., Meinhardt, F., Necki, J., Galkowski, M., O'Doherty, S., Paramonova, N., Scheeren, H. A., Steinbacher, M., and Dlugokencky, E.: Inverse modelling of European CH4 emissions during 2006–2012 using different inverse models and reassessed atmospheric observations, Atmos. Chem. Phys., 18, 901–920, https://doi.org/10.5194/acp-18-901-2018, 2018.
Cain, M., Jenkins, S., Allen, M. R., Lynch, J., Frame, D. J., Macey, A. H., and Peters, G. P.: Methane and the Paris Agreement temperature goals, Phil. T. Roy. Soc. A., 380, 2020045620200456, https://doi.org/10.1098/rsta.2020.0456, 2022.
Carlson, D. and Oda, T.: Editorial: Data publication – ESSD goals, practices and recommendations, Earth Syst. Sci. Data, 10, 2275–2278, https://doi.org/10.5194/essd-10-2275-2018, 2018.
Chandra, N., Patra, P. K., Bisht, J. S. H., Ito, A., Umezawa, T., Saigusa, N., Morimoto, S., Aoki, S., Janssens-Maenhout, G., Fujita, R., Takigawa, M., Watanabe, S., Saitoh, N., and Canadell, J. G.: Emissions from the Oil and Gas Sectors, Coal Mining and Ruminant Farming Drive Methane Growth over the Past Three Decades, J. Meteorol. Soc. Japan. Ser. II, 99, 2021–015, https://doi.org/10.2151/jmsj.2021-015, 2021.
CoCO2 project: TNO_PED D2.1 Prior Emission Dataset (PED) 2016: https://coco2-project.eu/index.php/node/327 (last access: June 2024), 2022.
CoCO2 project: TNO PED D2.2 Prior Emissions data 2021: https://coco2-project.eu/node/365 (last access: June 2024), 2023.
CoCO2 project: https://coco2-project.eu/, last access: June 2024.
Conchedda, G. and Tubiello, F. N.: Drainage of organic soils and GHG emissions: validation with country data, Earth Syst. Sci. Data, 12, 3113–3137, https://doi.org/10.5194/essd-12-3113-2020, 2020.
Crippa, M., Solazzo, E., Huang, G., Guizzardi, D., Koffi, E., Muntean, M., Schieberle, C., Friedrich, R., and Janssens-Maenhout, G.: High resolution temporal profiles in the Emissions Database for Global Atmospheric Research, Sci. Data, 17, 121, https://doi.org/10.1038/s41597-020-0462-2, 2020.
Deng, Z., Ciais, P., Tzompa-Sosa, Z. A., Saunois, M., Qiu, C., Tan, C., Sun, T., Ke, P., Cui, Y., Tanaka, K., Lin, X., Thompson, R. L., Tian, H., Yao, Y., Huang, Y., Lauerwald, R., Jain, A. K., Xu, X., Bastos, A., Sitch, S., Palmer, P. I., Lauvaux, T., d'Aspremont, A., Giron, C., Benoit, A., Poulter, B., Chang, J., Petrescu, A. M. R., Davis, S. J., Liu, Z., Grassi, G., Albergel, C., Tubiello, F. N., Perugini, L., Peters, W., and Chevallier, F.: Comparing national greenhouse gas budgets reported in UNFCCC inventories against atmospheric inversions, Earth Syst. Sci. Data, 14, 1639–1675, https://doi.org/10.5194/essd-14-1639-2022, 2022.
EEA: Technical report No 20/2013 European Union CO2 emissions: different accounting perspectives, https://www.eea.europa.eu/publications/european-union-co2-emissions-accounting/download&sa=D&source=docs&ust=1700125746315585&usg=AOvVaw1scG2zBViuEOMu3YxdnJGZ (last access October 2023), 2013.
EIA: https://inis.iaea.org/search/search.aspx?orig_q=RN:50064205 (last access: March 2024), 2019.
Etiope, G. and Schwietzke, S.: Global geological methane emissions: an update of top-down and bottom-up estimates, Elem. Sci. Anth., 7, 47, https://doi.org/10.1525/elementa.383, 2019.
Evans, M. and Roshchanka, V.: Russian policy on methane emissions in the oil and gas sector: a case study on opportunities and challenges in reducing short-lived forcers, Atmos. Environ., 92 199–206, 2014.
FAO: FAOSTAT, Statistics Division of the Food and Agricultural Organisation of the UN, http://fao.org/faostat/en/#home (last access: November 2023), 2018.
FAO: FAOSTAT, Statistics Division of the Food and Agricultural Organisation of the UN, Emissions statistics till 2021, https://www.fao.org/faostat/en/#data/GT (last access: February 2024), 2023.
Gao, J., Guan, C., and Zhang, B.: China's CH4 emissions from coal mining: a review of current bottom-up inventories, Sci. Total Environ., 725, 138295, https://doi.org/10.1016/j.scitotenv.2020.138295, 2020.
Geddes, A., Mikaloff-Fletcher, S., Schaefer, H., Smale, D., and Brailsford, G., Law, R., Ausseil, A-G.: Atmospheric Methane Modelling: Evaluating Regional Methane Emission Using Inverse Modelling, MPI Technical Paper No: 2021/02, https://www.mpi.govt.nz/dmsdocument/46222/direct (last access: November 2023), 2021.
Grassi, G., House, J., Kurz, W. A., Cescatti, A., Houghton, R. A., Peters, G. P., Sanz, M. J., Vinas, R. A., Alkama, R., Arneth, A., Bondeau, A., Dentener, F., Fader, M., Federici, S., Friedlingstein, P., Jain, A. K., Kato, E., Koven, C. D., Lee, D., Nabel, J. E. M. S., Nassikas, A. A., Perugini, L., Rossi, S., Sitch, S., Viovy, N., Wiltshire, A., and Zaehle, S.: Reconciling global-model estimates and country reporting of anthropogenic forest CO2 sinks, Nat. Clim. Change, 8, 914–920, https://doi.org/10.1038/s41558-018-0283-x, 2018.
Gütschow, J. and Pflüger, M.: The PRIMAP-hist national historical emissions time series (1750–2021) v2.4, Zenodo [data set], https://doi.org/10.5281/zenodo.7179775, 2022.
Höglund-Isaksson, L.: Bottom-up simulations of methane and ethane from global oil and gas systems, Environ. Res. Lett., 12, 024007, https://doi.org/10.1088/1748-9326/aa583e, 2017.
Höglund-Isaksson L., Gómez-Sanabria, A., Klimont, Z., Rafaj, P., and Schöpp, W.: Technical potentials and costs for reducing global anthropogenic methane emissions in the 2050 timeframe – results from the GAINS model, Environ. Res. Commun., 2, 025004, https://doi.org/10.1088/2515-7620/ab7457, 2020.
Huang, K., Fu, J. S., Prikhodko, V. Y., Storey, J. M., Romanov, A., Hodson, E. L., Cresko, J., Morozova, I., Ignatieva, Y., and Cabaniss, J.: Russian anthropogenic black carbon: Emission reconstruction and Arctic black carbon simulation, J. Geophys. Res.-Atmos., 120, 11306–11333, https://doi.org/10.1002/2015JD023358, 2015.
IEA-WEO: https://www.iea.org/reports/world-energy-outlook-2018 (last access: March 2024), 2018.
IPCC: Guidelines for National Greenhouse Gas Inventories (NGHGI), https://www.ipcc-nggip.iges.or.jp/public/2006gl/ (last access: January 2020), 2006a.
IPCC: vol. 1, chap. 3, https://www.ipcc-nggip.iges.or.jp/public/2006gl/pdf/1_Volume1/V1_3_Ch3_Uncertainties.pdf (last access: June 2022), 2006b.
IPCC: Climate Change 2014: Synthesis Report, Contribution of Working Groups I, II and III to the Fifth Assessment Report of the Intergovernmental Panel on Climate Change, edited by: Core Writing Team, Pachauri, R. K., and Meyer, L. A., IPCC, Geneva, Switzerland, 151 pp., 2014a.
IPCC: Supplement to the 2006 IPCC Guidelines for National Greenhouse Gas Inventories: Wetlands, edited by: Hiraishi, T., Krug, T., Tanabe, K., Srivastava, N., Baasansuren, J., Fukuda, M., and Troxler, T. G., IPCC, Switzerland, 2014b.
IPCC: 2019 Refinement to the 2006 IPCC Guidelines for National Greenhouse Gas Inventories, https://www.ipcc.ch/report/2019-refinement-to-the-2006-ipcc-guidelines-for-national-greenhouse-gas-inventories (last access: January 2020), 2019.
IPCC: Climate Change 2021: The Physical Science Basis. Contribution of Working Group I to the Sixth Assessment Report of the Intergovernmental Panel on Climate Change, edited by: Masson-Delmotte, V., Zhai, P., Pirani, A., Connors, S. L., Péan, C., Berger, S., Caud, N., Chen, Y., Goldfarb, L., Gomis, M. I., Huang, M., Leitzell, K., Lonnoy, E., Matthews, J. B. R., Maycock, T. K., Waterfield, T., Yelekçi, O., Yu, R., and Zhou, B., Cambridge University Press, Cambridge, United Kingdom and New York, NY, USA, in press, https://doi.org/10.1017/9781009157896, 2021.
Jackson, R. B., Saunois, M., Bousquet, P., Canadell, J. G., Pulter, B., Stavert, A. R., Bergamaschi, P., Niwa, Y., Segers, A., and Tsutra, A.: Increasing anthropogenic methane emissions arise equally from agricultural and fossil fuel sources, Environ. Res. Lett., 15, 071002, https://doi.org/10.1088/1748-9326/ab9ed2, 2020.
Jacob, D. J., Turner, A. J., Maasakkers, J. D., Sheng, J., Sun, K., Liu, X., Chance, K., Aben, I., McKeever, J., and Frankenberg, C.: Satellite observations of atmospheric methane and their value for quantifying methane emissions, Atmos. Chem. Phys., 16, 14371–14396, https://doi.org/10.5194/acp-16-14371-2016, 2016.
Jacob, D. J., Varon, D. J., Cusworth, D. H., Dennison, P. E., Frankenberg, C., Gautam, R., Guanter, L., Kelley, J., McKeever, J., Ott, L. E., Poulter, B., Qu, Z., Thorpe, A. K., Worden, J. R., and Duren, R. M.: Quantifying methane emissions from the global scale down to point sources using satellite observations of atmospheric methane, Atmos. Chem. Phys., 22, 9617–9646, https://doi.org/10.5194/acp-22-9617-2022, 2022.
Janssens-Maenhout, G., Crippa, M., Guizzardi, D., Muntean, M., Schaaf, E., Dentener, F., Bergamaschi, P., Pagliari, V., Olivier, J. G. J., Peters, J. A. H. W., van Aardenne, J. A., Monni, S., Doering, U., Petrescu, A. M. R., Solazzo, E., and Oreggioni, G. D.: EDGAR v4.3.2 Global Atlas of the three major greenhouse gas emissions for the period 1970–2012, Earth Syst. Sci. Data, 11, 959–1002, https://doi.org/10.5194/essd-11-959-2019, 2019.
Johnson, M. S., Matthews, E., Du, J., Genovese, V., and Bastviken, D.: Methane Emission From Global Lakes: New Spatiotemporal Data and Observation-Driven Modeling of Methane Dynamics Indicates Lower Emissions, J. Geophys. Res.-Biogeo., 127, e2022JG006793, https://doi.org/10.1029/2022JG006793, 2022.
Keita, S., Liousse, C., Assamoi, E.-M., Doumbia, T., N'Datchoh, E. T., Gnamien, S., Elguindi, N., Granier, C., and Yoboué, V.: African anthropogenic emissions inventory for gases and particles from 1990 to 2015, Earth Syst. Sci. Data, 13, 3691–3705, https://doi.org/10.5194/essd-13-3691-2021, 2021.
Lan, X., Basu, S., Schwietzke, S., Bruhwiler, L. M. P., Dlugokencky, E. J., Michel, S. E., Sherwood, O. A., Tans, P. P., Thoning, K., Etiope, G., Zhuang, Q., Liu, L., Oh, Y., Miller, J. B., Pétron, G., Vaughn, B. H., and Crippa, M.: Improved Constraints on Global Methane Emissions and Sinks Using δ13C-CH4, Global Biogeochem. Cy., 35, e2021GB007000, https://doi.org/10.1029/2021GB007000, 2021a.
Lan, X., Nisbet, E. G., Dlugokencky, E. J., and Michel, S. E.: What do we know about the global methane budget? Results from four decades of atmospheric CH4 observations and the way forward, Phil. T. Roy. Soc. A., 379, 2020044020200440, https://doi.org/10.1098/rsta.2020.0440, 2021b.
Lan, X., Dlugokencky, E., Englund Michel, S., Basu, S., Schuldt, K., Mund, J., Aoki, S., di Sarra, A., Vermeulen, A., Andrews, A., Jordan, A., Baier, B., Labuschagne, C., Lund Myhre, C., Sweeney, C., Kubistin, D., Smale, D., Worthy, D., Cuevas, E., Apadula, F., Brailsford, G., Lee, H., Moosen, H., Schaefer, H., Jui, H., Necki, J., Arduini, J., Miller, J., Moncrieff, J., Hatakka, J., Uhse, K., McKain, K., Haszpra, L., Gatti, L., Ries, L., Steinbacher, M., Schmidt, M., Ramonet, M., Arshinov, M., Sasakawa, M.,Paramonova, N., Bergamaschi, P., Langenfelds, R., Kim, S.-Y., Morimoto, S., Takatsuji, S., Nichol, S., Umezawa, T., Di Iorio, T., and Kawasaki, T.: Database of methane (CH4) abundance and its stable carbon isotope (δ13CH4) composition from atmospheric measurements, NOAA Global Monitoring Laboratory [data set], https://doi.org/10.15138/64w0-0g71, 2022.
Lauerwald, R., Bastos, A., McGrath, M. J., Petrescu, A. M. R., Ritter, F., Andrew, R. M., Berchet, A., Broquet, G., Brunner, D., Chevallier, F., Cescatti, A., Filipek, S., Fortems-Cheiney, A., Forzieri, G., Friedlingstein, P., Fuchs, R., Gerbig, C., Houweling, S., Ke, P., Lerink, B. J. W., Li, W., Li, W., Li, X., Luijkx, I. T., Monteil, G., Munassar, S., Nabuurs, G.-J., Patra, P. K., Peylin, P., Pongratz, J., Regnier, P., Saunois, M., Schelhaas, M.-J., Scholze, M., Sitch, S., Thompson, R. L., Tian, H., Tsuruta, A., Wilson, C., Wigneron, J.-P., Yao, Y., Zaehle, S., and Ciais, P.: Carbon and greenhouse gas budgets of Europe: trends, interannual and spatial variability, and their drivers, ESS Open Archive [data set], https://doi.org/10.22541/essoar.171320253.37867733/v1, 2024.
Luhar, A. K., Etheridge, D. M., Loh, Z. M., Noonan, J., Spencer, D., Smith, L., and Ong, C.: Quantifying methane emissions from Queensland's coal seam gas producing Surat Basin using inventory data and a regional Bayesian inversion, Atmos. Chem. Phys., 20, 15487–15511, https://doi.org/10.5194/acp-20-15487-2020, 2020.
Lunt, M. F., Palmer, P. I., Feng, L., Taylor, C. M., Boesch, H., and Parker, R. J.: An increase in methane emissions from tropical Africa between 2010 and 2016 inferred from satellite data, Atmos. Chem. Phys., 19, 14721–14740, https://doi.org/10.5194/acp-19-14721-2019, 2019.
Maasakkers, J. D., Jacob, D. J., Sulprizio, M. P., Turner, A. J., Weitz, M., Wirth, T., Hight, C., DeFigueiredo, M., Desai, M., and Schmeltz, R.: Gridded national inventory of US methane emissions, Environ. Sci. Technol., 50, 13123–13133, 2016.
Maasakkers, J. D., Varon, D. J., Elfarsdóttir, A., McKeever, J., Jervis, D., Mahapatra, G., Pandey, S., Lorente, A., Borsdorff, T., Foorthuis, L. R., Schuit, B. J., Tol, P., van Kempen, T. A., van Hees, R., and Aben, I.: Using satellites to uncover large methane emissions from landfills, Sci. Adv., 8, eabn9683, https://doi.org/10.1126/sciadv.abn9683, 2022.
McGrath, M. J., Petrescu, A. M. R., Peylin, P., Andrew, R. M., Matthews, B., Dentener, F., Balkovič, J., Bastrikov, V., Becker, M., Broquet, G., Ciais, P., Fortems-Cheiney, A., Ganzenmüller, R., Grassi, G., Harris, I., Jones, M., Knauer, J., Kuhnert, M., Monteil, G., Munassar, S., Palmer, P. I., Peters, G. P., Qiu, C., Schelhaas, M.-J., Tarasova, O., Vizzarri, M., Winkler, K., Balsamo, G., Berchet, A., Briggs, P., Brockmann, P., Chevallier, F., Conchedda, G., Crippa, M., Dellaert, S. N. C., Denier van der Gon, H. A. C., Filipek, S., Friedlingstein, P., Fuchs, R., Gauss, M., Gerbig, C., Guizzardi, D., Günther, D., Houghton, R. A., Janssens-Maenhout, G., Lauerwald, R., Lerink, B., Luijkx, I. T., Moulas, G., Muntean, M., Nabuurs, G.-J., Paquirissamy, A., Perugini, L., Peters, W., Pilli, R., Pongratz, J., Regnier, P., Scholze, M., Serengil, Y., Smith, P., Solazzo, E., Thompson, R. L., Tubiello, F. N., Vesala, T., and Walther, S.: The consolidated European synthesis of CO2 emissions and removals for the European Union and United Kingdom: 1990–2020, Earth Syst. Sci. Data, 15, 4295–4370, https://doi.org/10.5194/essd-15-4295-2023, 2023.
McNorton, J., Bousserez, N., Agustí-Panareda, A., Balsamo, G., Cantarello, L., Engelen, R., Huijnen, V., Inness, A., Kipling, Z., Parrington, M., and Ribas, R.: Quantification of methane emissions from hotspots and during COVID-19 using a global atmospheric inversion, Atmos. Chem. Phys., 22, 5961–5981, https://doi.org/10.5194/acp-22-5961-2022, 2022.
National Academies of Sciences, Engineering, and Medicine: Greenhouse Gas Emissions Information for Decision Making: A Framework Going Forward, The National Academies Press, Washington, DC, https://doi.org/10.17226/26641, 2022.
Nesser, H., Jacob, D. J., Maasakkers, J. D., Lorente, A., Chen, Z., Lu, X., Shen, L., Qu, Z., Sulprizio, M. P., Winter, M., Ma, S., Bloom, A. A., Worden, J. R., Stavins, R. N., and Randles, C. A.: High-resolution US methane emissions inferred from an inversion of 2019 TROPOMI satellite data: contributions from individual states, urban areas, and landfills, Atmos. Chem. Phys., 24, 5069–5091, https://doi.org/10.5194/acp-24-5069-2024, 2024.
Nisbet, E. G.: Climate change feedback on methane emissions from global wetlands, Nat. Clim. Change, 13, 421–422, https://doi.org/10.1038/s41558-023-01634-3, 2023.
Nisbet, E. G., Dlugokencky, E. J., Manning, M. R., Lowry, D., Fisher, R. E., France, J. L., Michel, S. E., Miller, J. B., White, J. W. C., Vaughn, B., Bousquet, P., Pyle, J. A., Warwick, N. J., Cain, M., Brownlow, R., Zazzeri, G., Lanoisellé, M., Manning, A. C., Gloor, E., Worthy, D. E. J., Brunke, E.-G., Labuschagne, C., Wolff, E. W., and Ganesan, A. L.: Rising Atmospheric Methane: 2007–2014 Growth and Isotopic Shift, Global Biogeochem. Cycles, 30, 1356–1370, https://doi.org/10.1002/2016GB005406, 2016.
Nisbet, E. G., Manning, M. R., Dlugokencky, E. J., Fisher, R. E., Lowry, D., Michel, S. E., Myhre, C. L., Platt, S. M., Allen, G., Bousquet, P., Brownlow, R., Cain, M., France, J. L., Hermansen, O., Hossaini, R., Jones, A. E., Levin, I., Manning, A. C., Myhre, G., Pyle, J. A., Vaughn, B. H., Warwick, N. J., and White, J. W. C.: Very Strong Atmospheric Methane Growth in the 4 Years 2014–2017: Implications for the Paris Agreement, Global Biogeochem. Cycles, 33, 318–342, https://doi.org/10.1029/2018GB006009, 2019.
NOAA: Atmospheric data, https://www.esrl.noaa.gov/gmd/ccgg/trends_ch4/, last access: June 2023.
Omara, M., Zavala-Araiza, D., Lyon, D.R., Hmiel, B., Roberts, K. A., and Hamburg, S. P.: Methane emissions from US low production oil and natural gas well sites, Nat. Commun., 13, 2085, https://doi.org/10.1038/s41467-022-29709-3, 2022.
Patra, P. K., Saeki, T., Dlugokencky, E. J., Ishijima, K., Umezawa, T., Ito, A., Aoki, S., Morimoto, S., Kort, E. A., Crotwell, A., Ravikumar, K., and Nakazawa, T.: Regional methane emission estimation based on observed atmospheric concentrations (2002–2012), J. Meteorol. Soc. Jpn., 94, 91–113, 2016.
Patra, P. K., Krol, M. C., Prinn, R. G., Takigawa, M., Muhle, J., Montzka, S., Lal, S., Yamashita, Y., Naus, S., Chandra, N., Weiss, R. F., Krummerl, P. B., Fraser, P. J., O'Doherty, S., and Elkins, J. W.: Methyl Chloroform Continues to Constrain the Hydroxyl (OH) Variability in the Troposphere, J. Geophys. Res.-Atmos., 126, e2020JD033862, https://doi.org/10.1029/2020jd033862, 2021.
Peng, S., Lin, X., Thompson, R. L., Xi, Y., Liu, G., Hauglustaine, D., Lan, X., Poulter, B., Ramonet, M., Saunois, M., Yin, Y., Zhang, Z., Zheng, B., and Ciais, P.: Wetland emission and atmospheric sink changes explain methane growth in 2020, Nature, 612, 477–482, https://doi.org/10.1038/s41586-022-05447-w, 2022.
Perugini, L., Pellis, G., Grassi, G., Ciais, P., Dolman, H., House, J. I., Peters, G. P., Smith, P., Günther, D., and Peylin, P.: Emerging reporting and verification needs under the Paris Agreement: How can the research community effectively contribute?, Environ. Sci. Policy, 122, 116–126, https://doi.org/10.1016/j.envsci.2021.04.012, 2021.
Petrescu, A. M. R., Peters, G. P., Janssens-Maenhout, G., Ciais, P., Tubiello, F. N., Grassi, G., Nabuurs, G.-J., Leip, A., Carmona-Garcia, G., Winiwarter, W., Höglund-Isaksson, L., Günther, D., Solazzo, E., Kiesow, A., Bastos, A., Pongratz, J., Nabel, J. E. M. S., Conchedda, G., Pilli, R., Andrew, R. M., Schelhaas, M.-J., and Dolman, A. J.: European anthropogenic AFOLU greenhouse gas emissions: a review and benchmark data, Earth Syst. Sci. Data, 12, 961–1001, https://doi.org/10.5194/essd-12-961-2020, 2020.
Petrescu, A. M. R., Qiu, C., Ciais, P., Thompson, R. L., Peylin, P., McGrath, M. J., Solazzo, E., Janssens-Maenhout, G., Tubiello, F. N., Bergamaschi, P., Brunner, D., Peters, G. P., Höglund-Isaksson, L., Regnier, P., Lauerwald, R., Bastviken, D., Tsuruta, A., Winiwarter, W., Patra, P. K., Kuhnert, M., Oreggioni, G. D., Crippa, M., Saunois, M., Perugini, L., Markkanen, T., Aalto, T., Groot Zwaaftink, C. D., Tian, H., Yao, Y., Wilson, C., Conchedda, G., Günther, D., Leip, A., Smith, P., Haussaire, J.-M., Leppänen, A., Manning, A. J., McNorton, J., Brockmann, P., and Dolman, A. J.: The consolidated European synthesis of CH4 and N2O emissions for the European Union and United Kingdom: 1990–2017, Earth Syst. Sci. Data, 13, 2307–2362, https://doi.org/10.5194/essd-13-2307-2021, 2021.
Petrescu, A. M. R., Qiu, C., McGrath, M. J., Peylin, P., Peters, G. P., Ciais, P., Thompson, R. L., Tsuruta, A., Brunner, D., Kuhnert, M., Matthews, B., Palmer, P. I., Tarasova, O., Regnier, P., Lauerwald, R., Bastviken, D., Höglund-Isaksson, L., Winiwarter, W., Etiope, G., Aalto, T., Balsamo, G., Bastrikov, V., Berchet, A., Brockmann, P., Ciotoli, G., Conchedda, G., Crippa, M., Dentener, F., Groot Zwaaftink, C. D., Guizzardi, D., Günther, D., Haussaire, J.-M., Houweling, S., Janssens-Maenhout, G., Kouyate, M., Leip, A., Leppänen, A., Lugato, E., Maisonnier, M., Manning, A. J., Markkanen, T., McNorton, J., Muntean, M., Oreggioni, G. D., Patra, P. K., Perugini, L., Pison, I., Raivonen, M. T., Saunois, M., Segers, A. J., Smith, P., Solazzo, E., Tian, H., Tubiello, F. N., Vesala, T., van der Werf, G. R., Wilson, C., and Zaehle, S.: The consolidated European synthesis of CH4 and N2O emissions for the European Union and United Kingdom: 1990–2019, Earth Syst. Sci. Data, 15, 1197–1268, https://doi.org/10.5194/essd-15-1197-2023, 2023.
Petrescu, A. M. R., Peters, G. P., Engelen, R., Houweling, S., Brunner, D., Tsuruta, A., Matthews, B., Patra, P. K., Belikov, D., Thompson, R. L., Höglund-Isaksson, L., Zhang, W., Segers, A. J., Etiope, G., Ciotoli, G., Peylin, P., Chevallier, F., Aalto, T., Andrew, R. M., Bastviken, D., Berchet, A., Broquet, G., Conchedda, Dellaert, S. N. C., Denier van der Gon, H., G., Gütschow, J., Haussaire, J.-M., Lauerwald, R., Markkanen, T., van Peet, J. C. A., Pison, I., Regnier, P., Solum, E., Scholze, M., Tenkanen, M., Tubiello, F. N., van der Werf, G. R., and Worden, J. R.: Comparison of observation- and inventory-based CH4 emissions for eight large global emitters, version 3, Zenodo [data set], https://doi.org/10.5281/zenodo.12818506, 2024.
Prosperi, P., Bloise, M., Tubiello, F. N., Conchedda, G., Rossi, S., Boschetti, L., Salvatore, M., and Bernoux, M.: New estimates of greenhouse gas emissions from biomass burning and peat fires using MODIS Collection 6 burned areas, Clim. Change, 161, 415–432, https://doi.org/10.1007/s10584-020-02654-0, 2020.
Qonitan, F. D., Wayan, I., Suryawan, K., and Rahman, A.: Overview of Municipal Solid Waste Generation and Energy Utilization Potential in Major Cities of Indonesia, J. Phys. Conf. Ser., 1858, 012064, https://doi.org/10.1088/1742-6596/1858/1/012064, 2021.
Qu, Z., Jacob, D. J., Zhang, Y., Shen, L., Varon, D. J., Lu, X., Scarpelli, T., Bloom, A., Worden, J., and Parker, R. J.: Attribution of the 2020 surge in atmospheric methane by inverse analysis of GOSAT observations, Environ. Res. Lett., 17, 094003, https://doi.org/10.1088/1748-9326/ac8754, 2022.
Regulation (EU) 2018/1999 (European Climate Law): Amended proposal for a regulation of the European parliament and of the council on establishing the framework for achieving climate neutrality, https://ec.europa.eu/clima/sites/clima/files/eu-climate-action/docs/prop_reg_ecl_en.pdf, last access: October 2023.
Regulation (EU) 525/2013 of the European Parliament and of the Council: https://eur-lex.europa.eu/legal-content/EN/TXT/PDF/?uri=CELEX:32013R0525&from=EN, last access: November 2022.
Rocher-Ros, G., Stanley, E. H., Loken, L. C., Casson, N. J., Raymond, P. A., Liu, S., Amatulli, G., and Sponseller, A. R.: Global methane emissions from rivers and streams, Nature, 621, 530–535, https://doi.org/10.1038/s41586-023-06344-6, 2023.
Rutherford, J. S., Sherwin, E. D., Ravikumar, A. P., Heath, G. A., Englander, J., Cooley, D., Lyon, D., Omara, M., Langfitt, Q., and Brandt, A. R.: Closing the methane gap in US oil and natural gas production emissions inventories, Nat. Commun., 12, 4715, https://doi.org/10.1038/s41467-021-25017-4, 2021.
Saunois, M., Stavert, A. R., Poulter, B., Bousquet, P., Canadell, J. G., Jackson, R. B., Raymond, P. A., Dlugokencky, E. J., Houweling, S., Patra, P. K., Ciais, P., Arora, V. K., Bastviken, D., Bergamaschi, P., Blake, D. R., Brailsford, G., Bruhwiler, L., Carlson, K. M., Carrol, M., Castaldi, S., Chandra, N., Crevoisier, C., Crill, P. M., Covey, K., Curry, C. L., Etiope, G., Frankenberg, C., Gedney, N., Hegglin, M. I., Höglund-Isaksson, L., Hugelius, G., Ishizawa, M., Ito, A., Janssens-Maenhout, G., Jensen, K. M., Joos, F., Kleinen, T., Krummel, P. B., Langenfelds, R. L., Laruelle, G. G., Liu, L., Machida, T., Maksyutov, S., McDonald, K. C., McNorton, J., Miller, P. A., Melton, J. R., Morino, I., Müller, J., Murguia-Flores, F., Naik, V., Niwa, Y., Noce, S., O'Doherty, S., Parker, R. J., Peng, C., Peng, S., Peters, G. P., Prigent, C., Prinn, R., Ramonet, M., Regnier, P., Riley, W. J., Rosentreter, J. A., Segers, A., Simpson, I. J., Shi, H., Smith, S. J., Steele, L. P., Thornton, B. F., Tian, H., Tohjima, Y., Tubiello, F. N., Tsuruta, A., Viovy, N., Voulgarakis, A., Weber, T. S., van Weele, M., van der Werf, G. R., Weiss, R. F., Worthy, D., Wunch, D., Yin, Y., Yoshida, Y., Zhang, W., Zhang, Z., Zhao, Y., Zheng, B., Zhu, Q., Zhu, Q., and Zhuang, Q.: The Global Methane Budget 2000–2017, Earth Syst. Sci. Data, 12, 1561–1623, https://doi.org/10.5194/essd-12-1561-2020, 2020.
Solazzo, E., Crippa, M., Guizzardi, D., Muntean, M., Choulga, M., and Janssens-Maenhout, G.: Uncertainties in the Emissions Database for Global Atmospheric Research (EDGAR) emission inventory of greenhouse gases, Atmos. Chem. Phys., 21, 5655–5683, https://doi.org/10.5194/acp-21-5655-2021, 2021.
Soulie, A., Granier, C., Darras, S., Zilbermann, N., Doumbia, T., Guevara, M., Jalkanen, J.-P., Keita, S., Liousse, C., Crippa, M., Guizzardi, D., Hoesly, R., and Smith, S. J.: Global anthropogenic emissions (CAMS-GLOB-ANT) for the Copernicus Atmosphere Monitoring Service simulations of air quality forecasts and reanalyses, Earth Syst. Sci. Data, 16, 2261–2279, https://doi.org/10.5194/essd-16-2261-2024, 2024.
Stavert, A. R., Saunois, M., Canadell, J. G., Poulter, B., Jackson, R. B., Regnier, P., Lauerwald, R., Raymond, P. A., Allen, G. H., Patra, P. K., Bergamaschi, P., Bousquet, P., Chandra, N., Ciais, P., Gustafson, A., Ishizawa, M., Ito, A., Kleinen, T., Maksyutov, S., Joe McNorton, J., Melton, J.R., Müller, J., Niwa, J., Peng, S., Riley, W.J., Segers, A., Tian, H., Tsuruta, A., Yin, Y., Zhang, Z., Zheng, B., and Zhuang, Q.: Regional trends and drivers of the global methane budget, Global Change Biol., 28, 182–200, https://doi.org/10.1111/gcb.15901, 2022.
The Global methane Pledge: From Moment to Momentum, https://www.state.gov/global-methane-pledge-from-moment-to-momentum/, last access: September 2023.
Thompson, R. L. and Stohl, A.: FLEXINVERT: an atmospheric Bayesian inversion framework for determining surface fluxes of trace species using an optimized grid, Geosci. Model Dev., 7, 2223–2242, https://doi.org/10.5194/gmd-7-2223-2014, 2014.
Tubiello, F. N., Karl, K., Flammini, A., Gütschow, J., Obli-Laryea, G., Conchedda, G., Pan, X., Qi, S. Y., Halldórudóttir Heiðarsdóttir, H., Wanner, N., Quadrelli, R., Rocha Souza, L., Benoit, P., Hayek, M., Sandalow, D., Mencos Contreras, E., Rosenzweig, C., Rosero Moncayo, J., Conforti, P., and Torero, M.: Pre- and post-production processes increasingly dominate greenhouse gas emissions from agri-food systems, Earth Syst. Sci. Data, 14, 1795–1809, https://doi.org/10.5194/essd-14-1795-2022, 2022.
UNFCCC: Common Reporting Formats (CRFs) of the National Inventory Reports Unpublished to the UNFCCC by various Annex-1 countries (Bonn: United Nations Framework Convention on Climate Change). https://unfccc.int/process/transparency-and-reporting/reporting-and-review-under-the-convention/greenhouse-gas-inventories/submissions-of-annual-greenhouse-gas-inventories-for-2017/submissions-of-annual-ghg-inventories-2016 (last access: May 2024), 2016.
UNFCCC: Common Reporting Formats (CRFs) of the National Inventory Reports Unpublished to the UNFCCC by various Annex-1 countries (Bonn: United Nations Framework Convention on Climate Change), https://unfccc.int/process-and-meetings/transparency-and-reporting/reporting-and-review/reporting-and-review-under-the-convention/greenhouse-gas-inventories-annex-i-parties/submissions/national-inventory-submissions-2018 (last access: May 2024), 2018.
UNFCCC 1st BUR DR Congo: https://unfccc.int/documents/624762 (last access: February 2024), 2023.
UNFCCC 2nd BUR China: https://unfccc.int/documents/197666 (last access: April 2023), 2019.
UNFCCC 1st BUR India: https://unfccc.int/documents/180646 (last access: February 2024), 2016.
UNFCCC 2nd BUR India: https://unfccc.int/documents/192316 last access: February 2024), 2018.
UNFCCC 3rd BUR India: https://unfccc.int/documents/268470 (last access: February 2024), 2021.
UNFCCC 3rd BUR Indonesia: https://unfccc.int/documents/403577 (last access: February 2024), 2021.
UNFCCC 4th BUR Brazil: https://unfccc.int/documents/267661 (last access: February 2024), 2020.
UNFCCC Australia NIR: https://unfccc.int/documents/627765, last access: November 2023.
UNFCCC BURs: https://unfccc.int/BURs, last access: May 2024.
UNFCCC EU NIR: https://unfccc.int/documents/627851, last access: April 2023.
UNFCCC Germany NIR: https://unfccc.int/documents/627785, last access: April 2023.
UNFCCC NDCs: https://unfccc.int/NDCREG, last access: April 2024.
UNFCCC NGHGI: https://unfccc.int/ghg-inventories-annex-i-parties/2023 (last access: May 2024), 2023.
UNFCCC Switzerland NIR: Annex 6, https://unfccc.int/documents/627731, last access: April 2023.
UNFCCC UK NIR: Annex 6, https://unfccc.int/documents/627789, last access: April 2023.
USEPA: https://www.epa.gov/air-emissions-inventories/2017-national-emissions-inventory-nei-data (last access: January 2024), 2017.
VERIFY H2020 Project: https://verify.lsce.ipsl.fr/, last access: May 2023.
Wolf, J., Asrar, G. R., and West, T. O.: Revised methane emissions factors and spatially distributed annual carbon fluxes for global livestock, Carbon Balance Manage., 12, 16, https://doi.org/10.1186/s13021-017-0084-y, 2017.
Zhang, X., Waugh, D. W., and Orbe, C.: Dependence of Northern Hemisphere tropospheric transport on the midlatitude jet under abrupt CO2 increase, J. Geophys. Res.-Atmos., 128, e2022JD038454, https://doi.org/10.1029/2022JD038454, 2023.
Zhang, Z., Poulter, B., Melton, J. R., Riley, W. J., Allen, G. H., Beerling, D. J., Bousquet, P., Canadell, J. G., Fluet-Chouinard, E., Ciais, P., Gedney, N., Hopcroft, P. O., Ito, A., Jackson, R. B., Jain, A. K., Jensen, K., Joos, F., Kleinen, T., Knox, S., Li, T., Li, X., Liu, X., McDonald, K., McNicol, G., Miller, P. A., Müller, J., Patra, P. K., Peng, C., Peng, S., Qin, Z., Riggs, R. M., Saunois, M., Sun, Q., Tian, H., Xu, X., Yao, Y., Yi, X., Zhang, W., Zhu, Q., Zhu, Q., and Zhuang, Q.: Ensemble estimates of global wetland methane emissions over 2000–2020, EGUsphere [preprint], https://doi.org/10.5194/egusphere-2024-1584, 2024.
IPCC AR4 GWP 100 values are still used by the member states in their NGHGI reporting to the UNFCCC.
The requested paper has a corresponding corrigendum published. Please read the corrigendum first before downloading the article.
- Article
(3306 KB) - Full-text XML