the Creative Commons Attribution 4.0 License.
the Creative Commons Attribution 4.0 License.
 | 14 Aug 2024
State of Wildfires 2023–2024
Matthew W. Jones
Chantelle A. Burton
Francesca Di Giuseppe
Maria Lucia F. Barbosa
Esther Brambleby
Andrew J. Hartley
Anna Lombardi
Guilherme Mataveli
Joe R. McNorton
Fiona R. Spuler
Jakob B. Wessel
John T. Abatzoglou
Liana O. Anderson
Niels Andela
Sally Archibald
Dolors Armenteras
Eleanor Burke
Rachel Carmenta
Emilio Chuvieco
Hamish Clarke
Stefan H. Doerr
Paulo M. Fernandes
Louis Giglio
Douglas S. Hamilton
Stijn Hantson
Sarah Harris
Piyush Jain
Crystal A. Kolden
Tiina Kurvits
Seppe Lampe
Sarah Meier
Stacey New
Mark Parrington
Morgane M. G. Perron
Yuquan Qu
Natasha S. Ribeiro
Bambang H. Saharjo
Jesus San-Miguel-Ayanz
Jacquelyn K. Shuman
Veerachai Tanpipat
Guido R. van der Werf
Sander Veraverbeke
Gavriil Xanthopoulos
Climate change contributes to the increased frequency and intensity of wildfires globally, with significant impacts on society and the environment. However, our understanding of the global distribution of extreme fires remains skewed, primarily influenced by media coverage and regionalised research efforts. This inaugural State of Wildfires report systematically analyses fire activity worldwide, identifying extreme events from the March 2023–February 2024 fire season. We assess the causes, predictability, and attribution of these events to climate change and land use and forecast future risks under different climate scenarios. During the 2023–2024 fire season, 3.9×10⁶ km2 burned globally, slightly below the average of previous seasons, but fire carbon (C) emissions were 16 % above average, totalling 2.4 Pg C. Global fire C emissions were increased by record emissions in Canadian boreal forests (over 9 times the average) and reduced by low emissions from African savannahs. Notable events included record-breaking fire extent and emissions in Canada, the largest recorded wildfire in the European Union (Greece), drought-driven fires in western Amazonia and northern parts of South America, and deadly fires in Hawaii (100 deaths) and Chile (131 deaths). Over 232 000 people were evacuated in Canada alone, highlighting the severity of human impact. Our analyses revealed that multiple drivers were needed to cause areas of extreme fire activity. In Canada and Greece, a combination of high fire weather and an abundance of dry fuels increased the probability of fires, whereas burned area anomalies were weaker in regions with lower fuel loads and higher direct suppression, particularly in Canada. Fire weather prediction in Canada showed a mild anomalous signal 1 to 2 months in advance, whereas events in Greece and Amazonia had shorter predictability horizons. Attribution analyses indicated that modelled anomalies in burned area were up to 40 %, 18 %, and 50 % higher due to climate change in Canada, Greece, and western Amazonia during the 2023–2024 fire season, respectively. Meanwhile, the probability of extreme fire seasons of these magnitudes has increased significantly due to anthropogenic climate change, with a 2.9–3.6-fold increase in likelihood of high fire weather in Canada and a 20.0–28.5-fold increase in Amazonia. By the end of the century, events of similar magnitude to 2023 in Canada are projected to occur 6.3–10.8 times more frequently under a medium–high emission scenario (SSP370). This report represents our first annual effort to catalogue extreme wildfire events, explain their occurrence, and predict future risks. By consolidating state-of-the-art wildfire science and delivering key insights relevant to policymakers, disaster management services, firefighting agencies, and land managers, we aim to enhance society's resilience to wildfires and promote advances in preparedness, mitigation, and adaptation. New datasets presented in this work are available from https://doi.org/10.5281/zenodo.11400539 (Jones et al., 2024) and https://doi.org/10.5281/zenodo.11420742 (Kelley et al., 2024a).
-
Please read the editorial note first before accessing the article.
-
Article
(19217 KB)
-
Supplement
(35662 KB)
-
Please read the editorial note first before accessing the article.
- Article
(19217 KB) - Full-text XML
-
Supplement
(35662 KB) - BibTeX
- EndNote


1.1 Background
The potential for wildfires is growing under climate change, with increases in the frequency and intensity of drought and periods of fire-favourable weather driving reductions in vegetation (fuel) moisture and priming landscapes to burn more regularly, severely, and intensely (Seneviratne et al., 2022; UNEP, 2022a; Jones et al., 2022; Abatzoglou et al., 2019; Cunningham et al., 2024a). Additionally, human activities and land-use change can contribute to or exacerbate the risk of extremely large, fast-moving or intense fires, especially in tropical forests where people are the primary cause of ignition and forest degradation (Lapola et al., 2023). Recent years have been marked by a series of extreme wildfire events spanning the globe, with record levels of burned area (BA) occurring in the 2019–2020 Australian “Black Summer” bushfires (Abram et al., 2021) and a series of high-ranking wildfire seasons occurring in quick succession in the western United States (2020 and 2021; Higuera and Abatzoglou, 2021), Siberia (2020 and 2021; Zheng et al., 2023), Europe (2022; European Commission Joint Research Centre, 2023), and South America (2019, 2020; Kelley et al., 2021; Ferreira Barbosa et al., 2022; Silveira et al., 2020). The 2023–2024 fire season was marked by unprecedented fire extent and emissions in Canada; deadly fast-moving fires in Hawaii and Chile; the largest individual wildfires on record in the European Union and Canada; and widespread fires in northwestern South America including parts of Amazonia such as Brazil, Bolivia, Colombia, and Venezuela (Mataveli et al., 2024; Kolden et al., 2024; European Commission EU Science Hub, 2023). The prominence of recent extreme wildfires and wildfire seasons notably contrasts with overall trends in the area burned by fires globally. Due mostly to a reduction in the global savannahs tied to landscape fragmentation and changing rainfall patterns, global BA has fallen since the beginning of this century by around one-quarter (Andela et al., 2017; Jones et al., 2022; Chen et al., 2024). Critically, this decline in fire extent masks major shifts in the distribution of fires globally, with regions such as eastern Siberia and the western United States and Canada experiencing a more than 40 % increase in BA since 2000 (Jones et al., 2022; Zheng et al., 2021) and regions such as southeast Australia also showing significant increases over longer periods (Canadell et al., 2021). Likewise, there have been shifts in the global distribution of BA and fire carbon (C) emissions from non-forests to forests globally and from the tropics to the extratropics (Kelley et al., 2019). Hence, focussing on global aggregated BA extent underplays the scale and magnitude of changes in wildfire activity and impact on regional levels. An increase in forest and peatland burning is particularly concerning due to the rich ecosystem services that these regions provide, including C storage and biodiversity (UNEP, 2022b). The intensification of fire regimes in environments that are less fire-adapted is particularly important because these ecosystems are expected to be least resilient to such changes (Grau-Andrés et al., 2024).
The extreme wildfire events of recent years have significantly impacted society and ecosystems across the globe (Cunningham et al., 2024a). Since 1990, wildfire disasters have directly killed or injured at least ∼ 18 000 people, a conservative measure based on incomplete records and reporting biased to the global northern countries (updated from Jones et al., 2022; Centre for Research on the Epidemiology of Disasters, 2024). In 2023, 232 000 people were evacuated due to wildfires in Canada alone (Jain et al., 2024; Kolden et al., 2024). Also, since 1990, fires are estimated to have caused on the order of 10 million premature deaths globally through degraded air quality (Johnston et al., 2012). Degraded air quality related to fires is experienced most strongly in the tropics (Pai et al., 2022) and often disproportionately affects Traditional communities with poor public services or means of protection (Carmenta et al., 2021). Yet, images of North American cities blanketed in smoke during the 2023 fire season highlight the global nature of this problem.
As anthropogenic emissions of CO2 remain persistently high, the world's natural C sinks in forests, peatlands, and other ecosystems are increasingly pivotal to moderating increases in atmospheric CO2 concentration (Friedlingstein et al., 2023). Intact forests are often relied upon for delivering national plans for reaching net zero (Smith et al., 2023) and offering sites for nature-based solutions. Yet, massive wildfire emissions from boreal forests and soils in Siberia and Canada across the years 2020, 2021, and 2023 amount to over 1×10⁹ t C, a gross flux comparable in magnitude to annual CO2 emissions from fossil fuel combustion in India, the EU27 or the United States (Friedlingstein et al., 2023; Zheng et al., 2023). While in a natural fire regime these gross emissions should be recuperated through post-fire recovery, the greater vegetation mortality and loss of ecosystem function associated with more widespread and severe fires can also contribute to shifts in local to regional terrestrial C budgets from sinks to sources (Zheng et al., 2021; Gatti et al., 2021; Nolan et al., 2021a; Phillips et al., 2022; Harrison et al., 2018; Cunningham et al., 2024b). Loss of vegetation during extreme fire seasons can also have wider lasting effects on ecosystems, for instance by reducing the habitat area available to endemic species (Ward et al., 2020).
Extreme fires can moreover impact the livelihoods of various communities and landowners who depend on intact natural landscapes. For example, the lands and territories of Traditional communities and Indigenous peoples can be degraded and transformed by wildfires, raising climate justice issues (Garnett et al., 2018; Barlow et al., 2018; Lapola et al., 2023). Further, conflating the detrimental impacts of wildfires types has also stigmatised small-scale intergenerational fire use and led to prohibitive fire governance that affects local communities (Carmenta et al., 2021; Barlow et al., 2020).
Mitigating and adapting to increases in wildfire potential are growing priorities of policymakers and require coordination with many other stakeholders. National and international disaster management centres are seeking to enhance predictive capacity, while fire management agencies are expanding or re-allocating their resources to rapidly suppress fires to avoid them becoming too large, fast, or intense. A number of international organisations such as the UN Environment Programme (UNEP, 2022a), the World Bank (2020, 2024), and the Organisation for Economic Co-operation and Development (OECD, 2023) as well as a range of other inter- or non- governmental organisations are producing reports that consolidate evidence on the changing risk of extreme fires and identify best practices for mitigating their impacts, including through land management and urban/rural planning. Many land managers are developing and implementing approaches such as fuel reduction, a process subject to permit systems issued by regional fire management agencies in some countries (Fernandes and Botelho, 2003; Stephens et al., 2012; Moreira et al., 2020; Chuvieco et al., 2023). Wildfire response agencies are exploring innovative approaches to detecting and responding to fires, and there is rising interest in the prospect of integrated fire management around the world (Food and Agriculture Organization of the United Nations, 2024). Operators of C market projects and forest carbon-conservation initiatives, such as REDD+, are particularly wary of the risks that wildfires present to the permanence of C offsets, which often feature as a key tool in national policies and international initiatives for achieving net zero emissions (Barlow et al., 2012; Smith et al., 2023).
Amidst extreme wildfires and wildfire seasons, stakeholders increasingly turn to scientists for answers to pressing questions that naturally arise. How extreme was this fire event in a historical context? Is climate change to blame? Will we see more wildfires like this in the future? Did land management exacerbate or ameliorate the problem? Can we predict events like this in future to improve early warning? What is the role of climate policy in reducing risk of extreme wildfires in future?
While observational, statistical, and modelling tools for assessing extreme wildfire drivers and predicting wildfire occurrence are advancing rapidly, their application to studying extreme wildfire seasons or events on timescales relevant to public and political interest remains limited. The State of Wildfires report represents a new initiative to routinely catalogue extreme wildfire events at annual frequency and explain their occurrence and relation to climate change. The report incorporates recent methodological advances in disentangling the drivers of selected extreme wildfire events to fuel dryness, fuel load, and weather, and ignition and suppression factors. By applying these methodological advances in conjunction with models of global change, we quantify the change in likelihood of the past year's events under climate and land-use changes. Observable fire metrics (e.g. burned area) are the target variable of our causal inference and attribution work, which thereby advances on more common climate attribution studies that attribute change in fire-favourable meteorological conditions to climate change. Overall, this report capitalises on recent advances in the study of extreme fire events and seasons to provide timely information about shifting fire regimes and their causes. The findings of the report are relevant to policymakers, the media, and the wider public.
1.2 Objectives of this report
This inaugural edition of the State of Wildfires report aims to stimulate development of tools for understanding and predicting extreme fires and to deliver actionable information to policy and practice stakeholders and wider society. In this edition, we do the following:
-
regionally identify extreme individual wildfires or extreme wildfire seasons of the period March 2003–February 2024 and place them in the context of recent trends;
-
shortlist a selective number of extremes (extreme individual wildfires or extreme wildfire seasons) with notable impacts on society or the environment, which we term the “focal events” in this report;
-
diagnose the contributions of fuel dryness, fuel load, ignitions, and suppression to the occurrence of each focal event;
-
assess the capacity of operational predictive systems to predict each focal event;
-
attribute each focal event to anthropogenic factors including climate change and land use;
-
provide an outlook on the probability of extreme events in the coming fire season (that commenced on March 2024); and
-
project future changes in the probability of each focal event under future climate scenarios.
Key methodologies used to achieve the above objectives are summarised as follows. To address objectives 1 and 2, we build a comprehensive dataset of fire metrics including BA, fire counts, fire C emissions, and individual fire properties (size and rate of growth) for consistent world regions, and we quantitatively identify anomalies in these metrics during the past fire season (Giglio et al., 2018; van der Werf et al., 2017; Andela et al., 2019). To address objective 3 and 4, we leverage seasonal to sub-seasonal forecasts of fire weather from the European Centre for Medium-Range Weather Forecasts (ECMWF) and additionally employ two state-of-the-art fire models, “Controls on Fire” (ConFire) and “Probability of Fire” (PoF) (Kelley et al., 2019; McNorton et al., 2024) to pinpoint the causes of the extreme fire events of 2023–2024. To address objective 5, we employ projections of fire weather from the Hadley Centre Large Ensemble to attribute change in the Fire Weather Index (FWI) to climate change, and we drive ConFire (Kelley et al., 2019) with outputs from the Joint UK Land Environment Simulator Earth System model (JULES-ES; Mathison et al., 2023) to attribute extreme BA to climate and land-use changes (Burton et al., 2024). To address objective 6, we consult predictions of the state of climate modes relevant to fire and present seasonal predictions of the FWI from the ECMWF (Di Giuseppe et al., 2024). To address objective 7, we again pair ConFire (Kelley et al., 2019) with JULES-ES (Mathison et al., 2023) to project future changes in BA under several future climate and land-use scenarios and provide comprehensive assessment of past and future extreme wildfire events.
The State of Wildfires report will be an annually recurring report that can harness and adopt new methodologies brought forward by the scientific community between the annual iterations of the report. Over the coming years and decades, we aim to enhance the tools presented in this report for application in near-real time, thus enhancing our capacity to transfer key insights to decision-makers at the time they most need it.
2.1 Methods
We catalogued the extreme regional wildfire events or annual fire seasons in the period March 2023–February 2024 based on a combination of anomalies in the distribution of several observable fire metrics from Earth observations (Sect. 2.1.1). In this work, the global fire season is defined as occurring in March–February windows oriented around the annual minima of global fire activity in boreal spring (see further details in “Uncertainties” in Sect. 2.1.1).
Due to the diversity of environmental settings in which fires occur and the range of ecological, economic, or societal impacts caused, defining an extreme fire or an extreme fire season remains inherently challenging. To date, extreme fires have commonly been defined by their BA extent, by their feedback on the global climate, and by their socio-economic impact. While an extreme fire event or extreme fire season may be visible as a significant anomaly against historical Earth observations, the scientific community seeks to apply a more comprehensive definition of extreme fire, including its impacts on society and the environment. To catalogue extreme events that were not necessarily visible in Earth observations, regional expert panels were constructed and given responsibility for identifying extreme events of the past fire season (Sect. 2.1.3). The expert panels were given flexibility to identify and catalogue wildfire characteristics or impacts that are considered regionally extreme but are not necessarily captured by Earth observations. Examples of extremes that can be captured by expert assessment (but not by Earth observations) include suppression challenge; fatalities and structure loss; impacts on human health and wellbeing; impacts on agricultural and other economic sectors; impacts on biodiversity; and impacts on diverse ecosystem services such as recreation, tourism, or other cultural values. Hence, Sect. 2.2 identifies a variety of impactful events displaying a broad range of characteristics and impacts that can occur across diverse fire regimes (e.g. Archibald et al., 2009; Cunningham et al., 2024b; Keeley, 2009).
2.1.1 Earth observations of fire
Input datasets
We assembled observations of burned area (BA), synonymous with fire extent, for the period March 2002–February 2024 from the National Aeronautics and Space Administration (NASA) product MCD64A1 (collection 6.1). MCD64A1 provides daily BA observations at 500 m spatial resolution with global coverage and is based on retrievals from the Moderate Resolution Imaging Spectroradiometer (MODIS) sensors mounted to the Terra and Aqua satellites (Giglio et al., 2018, 2021).
We also produced a global record of individual fires for the period March 2002–February 2024 by updating the Global Fire Atlas (Andela et al., 2019; Andela and Jones, 2024) through February 2024, driven by the 500m MODIS BA data. The Global Fire Atlas algorithm clusters burned cells into individual fires, tracks their daily progression, and logs attributes such as fire size and mean daily rate of growth. Our updates are provided by Andela and Jones (2024). The Global Fire Atlas is one of several products tracking daily fire progression and identifying individual fires at global scale based on moderate resolution satellite data (Andela et al., 2019; Laurent et al., 2018; Artés et al., 2019). The product uses the MODIS BA product, the smallest unit of disaggregation is 500 m, and the shortest time step on which the expansion of a fire can be observed is daily. Given its resolution, the Global Fire Atlas is expected to represent the dynamics of large fires better than small, fast-moving fires.
Uncertainties
In addition, we gathered estimates of fire carbon (C) emissions for the period March 2023–February 2024 from two models driven by Earth observations of active fires or burned area: firstly, the Global Fire Assimilation System (GFAS) product, provided operationally by the Copernicus Atmospheric Monitoring Service (CAMS) at 0.1° spatial resolution and daily temporal resolution (Kaiser et al., 2012; European Centre for Medium-Range Weather Forecasts, 2024), and, secondly, the Global Fire Emissions Database (GFED; version 4.1s) product at 0.25° spatial resolution and daily temporal resolution (van der Werf et al., 2017). GFAS is driven by the fire radiative power (FRP) retrievals in the MODIS active fire product MCD14A1 and biome-level relationships between FRP and biomass consumed based on GFED3 (Kaiser et al., 2012). For the 1997–2016 period, GFED4s is driven by MODIS BA data (MCD64A1 collection 5) supplemented with small fire BA based on MODIS active fire data and a model for biomass productivity and fuel consumption (van der Werf et al., 2017). For the post-2016 period, emissions are based on active fire detections scaled to emissions using pixel-based scaling factors derived from the 2003–2016 overlapping period. We note that the MODIS BA product data used in our analyses of anomalies in BA and individual fire properties (via the Global Fire Atlas) are known to be conservative due to the limitations to detecting small fires (e.g. agricultural fires) based on surface spectral changes at 500 m resolution. Recent work has shown that including detections of small active fires increases global BA estimates by 93 % (Chen et al., 2023). However, variability and trends in regional BA totals using datasets that include small fires do not differ significantly from the variability and trends present in the MODIS BA product (Chen et al., 2023). Hence, inclusion or exclusion of small fires tends to generate biases in central estimates of BA in one direction or the other, in line with the sensitivity of different sensors to different fire types. Uncertainty in the detection of small fires is larger than in the case of fires detected in the MODIS BA product, due to limited validation (van der Werf et al., 2017). The MODIS BA product with resolution of 500 m is deemed highly suitable for addressing the research questions of this report, which focus on more impactful fires that tend to burn larger areas.
Uncertainties in fire carbon emissions estimates from GFED4.1s are on the order of ±20 %–25 % at 1 SDfor global totals (van der Werf et al., 2017, 2010). Uncertainties in GFED4.1s are made up of uncertainties in BA, the amount of biomass consumed per unit BA, and the carbon emitted per unit biomass burned. Revisions to BA input data, discussed above, have tended to influence GFED central estimates of fire C emissions to a greater degree than the uncertainties around central estimates (van der Werf et al., 2017; Chen et al., 2023). Uncertainties in fire carbon emissions estimates from GFAS are on the order of approximately ±25 % at 1 standard deviation for global totals. Uncertainties are introduced by missed active fire detections, either below the detection threshold of the MODIS instruments or not observed during the limited diurnal coverage of low-Earth-orbiting satellites, assumptions made for biome classifications, coefficients used to convert observed thermal anomalies to consumed dry matter, and emission factors used to estimate emitted quantities of carbon and pyrogenic pollutants. Variation in C emissions estimates on the order of approximately 20 %–60 % has been observed in studies comparing multiple emissions products (Wiedinmyer et al., 2023).
Regional burned area, carbon emissions, and fire count totals
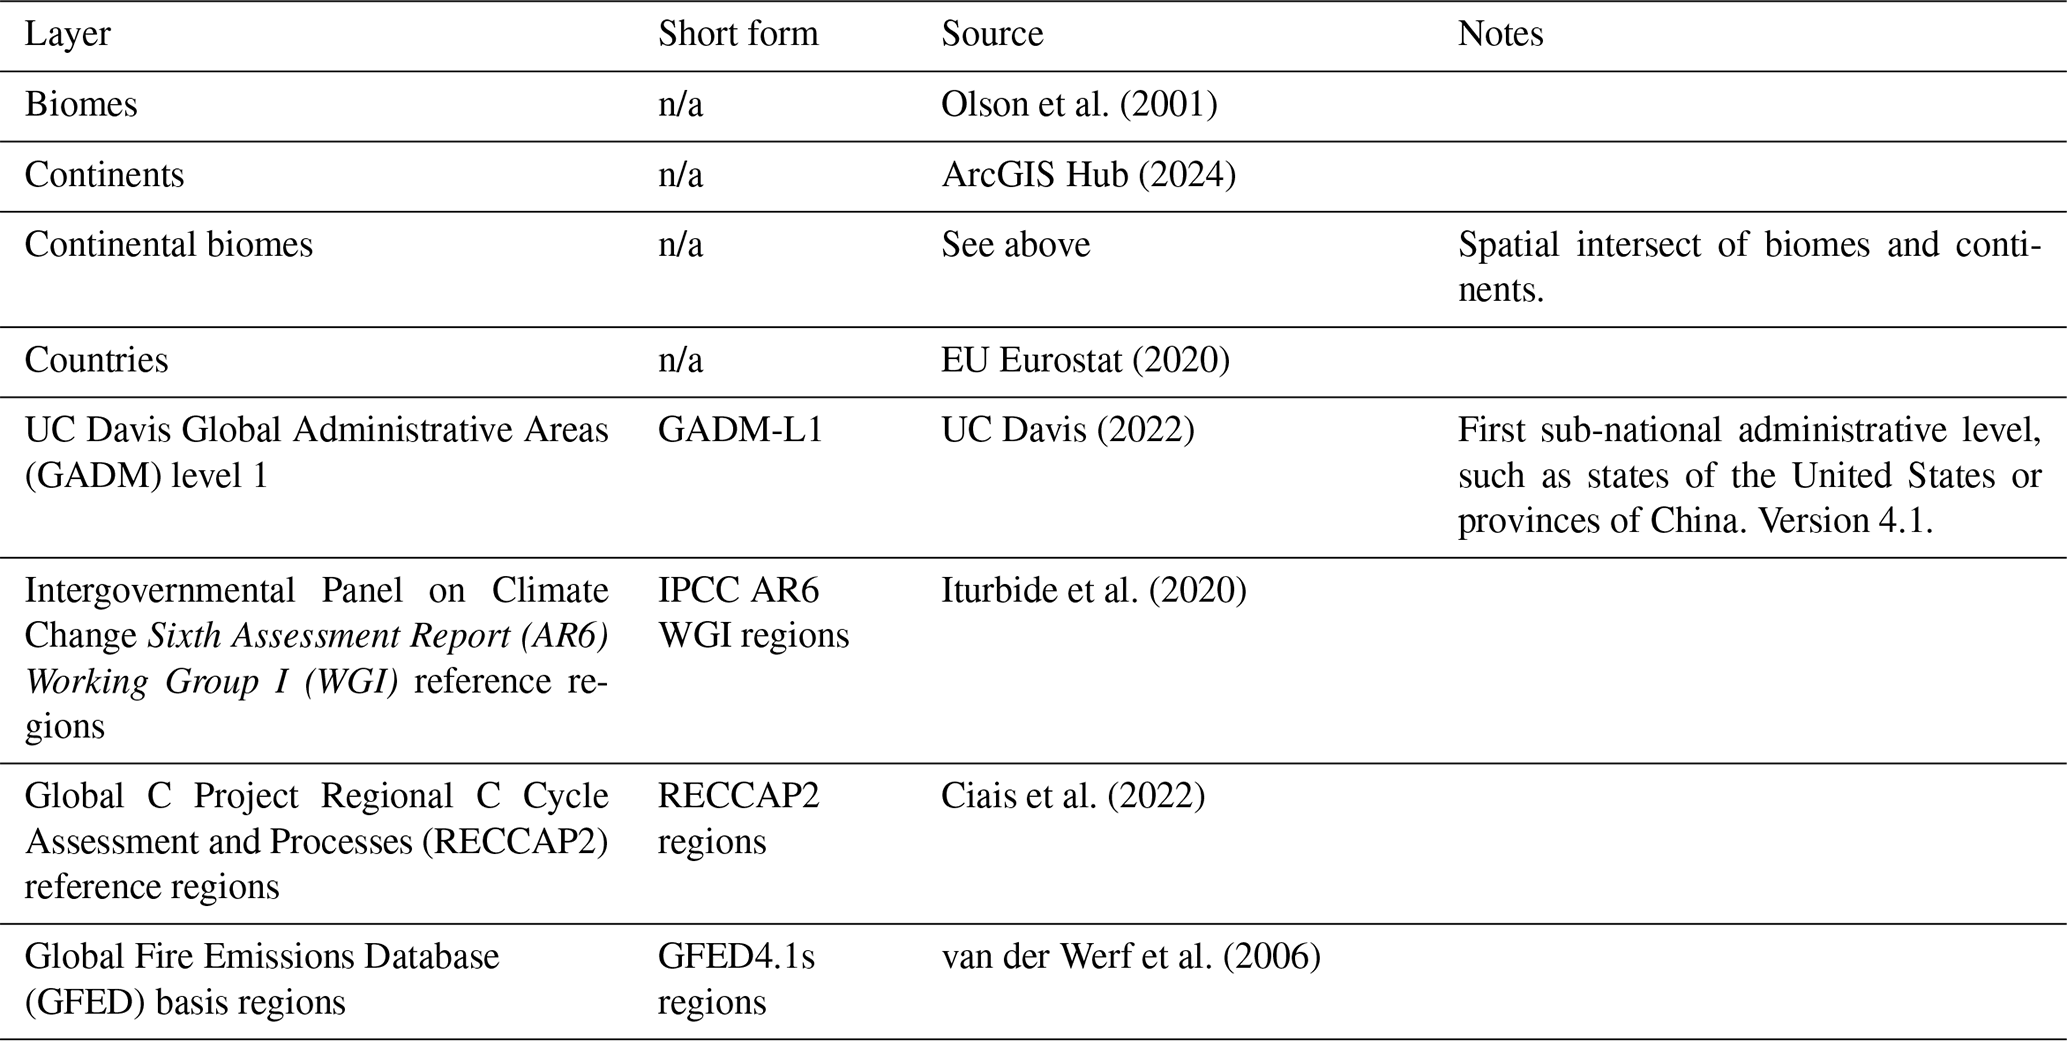
We calculated regional totals of BA and C emissions based on a variety of regional layers defined in Table 1. The regional layers represent a range of biogeographical boundaries (e.g. biomes), geopolitical boundaries (e.g. countries), and values used in scientific reports (e.g. by the Intergovernmental Panel on Climate Change, IPCC). We calculated monthly totals of BA and fire C emissions for each region by aggregating monthly BA and daily C emissions data and summing the data from the input datasets both spatially and temporally as required. In the case of fire C emissions, we also calculated the mean estimate of fire C emissions from GFED4.1s and GFAS, regionally.
We adopt a March–February definition of the global fire season (e.g. the latest global fire season spans March 2023–February 2024). Due to an annual lull in the global fire calendar in the boreal spring months, fire season BA totals are least sensitive to the shifts in fire season cutoffs of 1–2 months if the fire season centres on spring (Boschetti and Roy, 2008). This makes the global fire season centred on spring a pragmatic option for the study of interannual variability or trends in fire extent (Boschetti and Roy, 2008). The period March–February is specifically oriented at the end of the austral fire season and before widespread fires have begun in the boreal extratropics. The regions where this global definition of the fire season is most problematic are northern hemispheric South America, southeast Asia, and central America (Giglio et al., 2013).
In addition, we calculated totals of regional fire counts for each global fire season based on the number of individual fire ignition points present within each region, using ignition point vectors from the Global Fire Atlas. The resolution of the MODIS data supplied to the Global Fire Atlas algorithm is 500 m, and hence fires that are smaller in scale are omitted. Regional or national systems may record greater fire counts due to the inclusion of smaller fires.
Table 1Regional layers to which global Earth observations were disaggregated and used to define regions with extreme wildfire seasons or extreme individual wildfire attributes. Regional layers are available from Jones et al. (2024). n/a – not applicable
2.1.2 Identifying extreme fire seasons and events from Earth observations
Regions with extreme wildfire seasons
Anomalies in BA, fire C emissions, and fire counts in the latest global fire season (March 2023–February 2024) were calculated in several ways:
- i.
as relative anomalies (expressed in %) from the annual mean during all previous March–February periods since 2002 (2003 for fire C emissions);
- ii.
as standardised anomalies (standard deviations) from the annual mean during all previous March–February periods since 2002 (2003 for C emissions);
- iii.
as a rank amongst all March–February periods since 2002 (2003 for fire C emissions) and March 2023–February 2024 inclusive.
In this report, anomalies in fire C emissions are reported based on the two-model mean estimate from GFED4.1s and GFAS; however anomalies based on the GFED4.1s or GFAS estimates individually are also available via Jones et al. (2024).
We identified regions in which the latest fire season was potentially classifiable as “extreme” based on the rank of BA, C emissions and fire count amongst all fire seasons. For visualisation purposes, we identified regions in which the latest fire season ranked in the top five of all annual fire seasons on record (see Sect. 2.2.1). The BA data for the period March 2002–February 2024 include 23 fire seasons, while the C emissions data for the period March 2003–February 2024 include 21 fire seasons. Hence, a top-five ranking translates approximately to a fire season in the upper quartile of those on record.
We further characterised the onset, peak, and cessation of anomalous monthly BA in March 2023–February 2024. First, we identified the month of the event's peak as the maximum difference between monthly BA values in March 2023–February 2024 and the climatological mean monthly values from the prior March–February periods. Thereafter, the event's onset and cessation were defined as the bounds of consecutive months with above-average BA prior to and following the peak but limited to the March 2023–February 2024 period.
Regions with extreme individual wildfire attributes
We identified regions in which large or fast-moving fires occurred in the latest fire season based on records of individual fires from the Global Fire Atlas. For each region (Table 1) and year, we estimated the size of the largest fire, the daily rate of growth of the fire that spread most rapidly, the size of the 95th percentile fire, and the daily rate of growth of the 95th percentile fire. In the Global Fire Atlas, the daily rate of growth for any given fire is determined by calculating the average daily rate of growth at which the fire advanced across all its constituent cells. This method includes cells burned by the head, flank, and backfire and produces lower spread rates than if the calculation were based solely on the cells burned by the head fire.
Anomalies in each fire attribute were calculated using the same metrics as for BA (see (i)–(iii) above), and we identified regions in which the latest fire season featured fires with potentially extreme attributes based on the rank of BA and fire C emissions amongst all fire seasons.
2.1.3 Identifying extreme fire seasons and events by expert consultation
We assembled a panel of regional experts (two from each continent, Table A1), to contribute to the identification, description, and characterisation of extreme wildfire seasons or impactful events in the latest fire season. A key role of the expert panel was to catalogue regional events that significantly impacted society or the environment but which may not have been detected by Earth-observing satellites due to issues such as scale, short duration, timing of overpass, and cloud or canopy cover. This includes (but is not limited to) wildfires that impacted society by causing fatalities, evacuations, displacement (e.g. homelessness), direct structure or infrastructure loss or damage, degradation of air or water quality, loss of livelihood, cultural practice or other ways of life, and loss of economic productivity. This definition also includes (but is not limited to) wildfires that impact the environment via disturbance to vulnerable ecosystems, biodiverse areas, or ecosystem services such as C storage. This approach recognises that Earth observations do not provide a complete record of all impactful fires. We do not define ubiquitous quantitative thresholds of impact by any of the measures outlined above but rather invite in-region experts to identify events that triggered impacts that were sufficient in magnitude to infiltrate public and political discourse. The sources of information available for cataloguing regional events include national/regional fire records, fire service reports, disaster management reports, news reports, and social media. A second key role of our expert panel was to describe and contextualise the impacts of the fire seasons highlighted as extreme by Earth observations or regional assessment (see Sect. 2.2.3).
The year in review by continent, produced by the expert panel, is presented in Appendix A.
2.1.4 Context of recent extremes: regional trends in burned area
To place recent extremes in the context of fire trends of the past 2 decades, we update our regional analyses of trends in annual BA from Jones et al. (2022). In contrast to Jones et al. (2022), we present trends that align more closely with global fire seasons, spanning the period March 2002–February 2024 rather than trends over calendar years. We quantified trends using the Theil–Sen slope estimator, which is useful when data may contain outliers or be non-normally distributed, making it less sensitive to outliers than a standard least-squares regression slope. Changes were calculated by multiplying trends (per year, yr−1) by the number of fire seasons in the period of coverage for each variable (Sect. “Uncertainties”). Relative changes were calculated as the absolute changes divided by the mean annual BA during the period following Jones et al. (2022) and Andela et al. (2017). The significance of trends was evaluated using the Mann–Kendall test, with a confidence level set at 95 %.
In addition to reporting trends in total BA, we also present trends in forest BA as these regularly diverge from total BA trends (see Sect. 2.2.2). Forest BA is calculated as described in Sect. 2.1.1 but after isolating burned cells in areas with tree cover exceeding 30 % in NASA's annual MODIS MOD44B collection 6.0 Continuous Vegetation Field product (250 m) (DiMiceli et al., 2015). The 30 % threshold is widely used amongst studies of forest cover change (e.g. Li et al., 2017; Cunningham et al., 2020; Sexton et al., 2016).
2.1.5 Shortlisting of focal events
In later sections of this report, we conducted various analyses to understand the causes and predictability of a selection of extreme wildfire seasons or events during March 2023–February 2024 (see Sects. 3–5). We limited the number of analyses to three globally prominent focal events of the 2023–2024 global fire season because the approaches used are not operational, and time is required to train and optimise our models regionally.
In discussion with our expert panel, we prioritised the three events studied in this report by weighing up the anomalies in Earth observations during the latest fire season as well as the impacts that these extremes had on people and the environment. The focal events are notable for their international significance, attracting attention from the media and policymakers both within and beyond their region.
2.2 Results
2.2.1 Extreme fire seasons and events of 2023–2024
Extreme fire seasons from Earth observations
According to the MODIS BA product, 3.9×10⁶ km2 burned globally during the 2023–2024 global fire season (March 2023–February 2024), slightly below the average of previous fire seasons (4.0×10⁶ km2) and overall ranking 12th of all fire seasons since 2002 (Jones et al., 2024). Despite this, fire C emissions were 16 % above average at 2.4 Pg C during the 2023–2024 global fire season, which ranks seventh amongst all fire seasons since 2003 (based on annual averages of GFED4.1s and GFAS estimates; see Methods; Jones et al., 2024).
Stark regional contrasts in the anomalies in BA, fire C emissions and individual fire properties are visible in the Earth observations on various regional scales (Figs. 1, 2, 3). Figure 1 shows the strongest BA and fire C emissions anomalies of 2023–2024 at continental biome scale versus previous fire seasons. BA was around 300 000 km2 (13 %) below the average of previous fire seasons in the African grassland, savannah, and shrubland biome, which is globally significant because the continental biome contributes 58 % towards the global total BA in the average year up to February 2023 (Jones et al., 2024). BA was also around 17 % below average in the South American grassland, savannah, and shrubland biome in 2023–2024 and in Asian non-forest biomes. In contrast, BA was 26 % above the average of fire seasons since 2002 in the Australian grassland, savannah, and shrubland biome (Figs. 1, 2). Collectively, these three biomes contributed 71 % of total BA in the global total BA in the average fire season between March 2002 and February 2023, and so departures from average values are particularly impactful on global BA totals.
The North American boreal forests experienced a record-breaking fire season, with BA reaching 6 times the average since 2002 and fire C emissions reaching over 9 times the average since 2003 (Fig. 1; Jones et al., 2024). This strong regional signal primarily explains the above-average global C emissions total of 2023–2024, with the high rates of fire emissions per unit area in boreal forests aggregating to override the reduced emissions totals in African and South American savannahs. Record levels of fire C emissions were also seen across the global pan-boreal forest biome, with fire C emissions surpassing the pan-boreal record set in 2021 by more than 60 %. This is despite a below-average fire season for BA and fire C emissions in boreal Asia during 2023–2024, in contrast to the 2021–2022 fire season, when there was a synchronous peak in BA in both the Eurasian and North American boreal regions (Zheng et al., 2021). According to the Global Fire Atlas, new records for individual fire size and rate of spread were also set in the North American boreal forests during 2023–2024, while 95th percentile fire size and rate of growth in 2023–2024 were in the top 2 and 3 years on record since 2002, respectively (Jones et al., 2024). Overall, the Canadian boreal forests contributed 24 % towards total fire C emissions in the 2023–2024 fire season, up from 3 % in an average fire season since 2003.
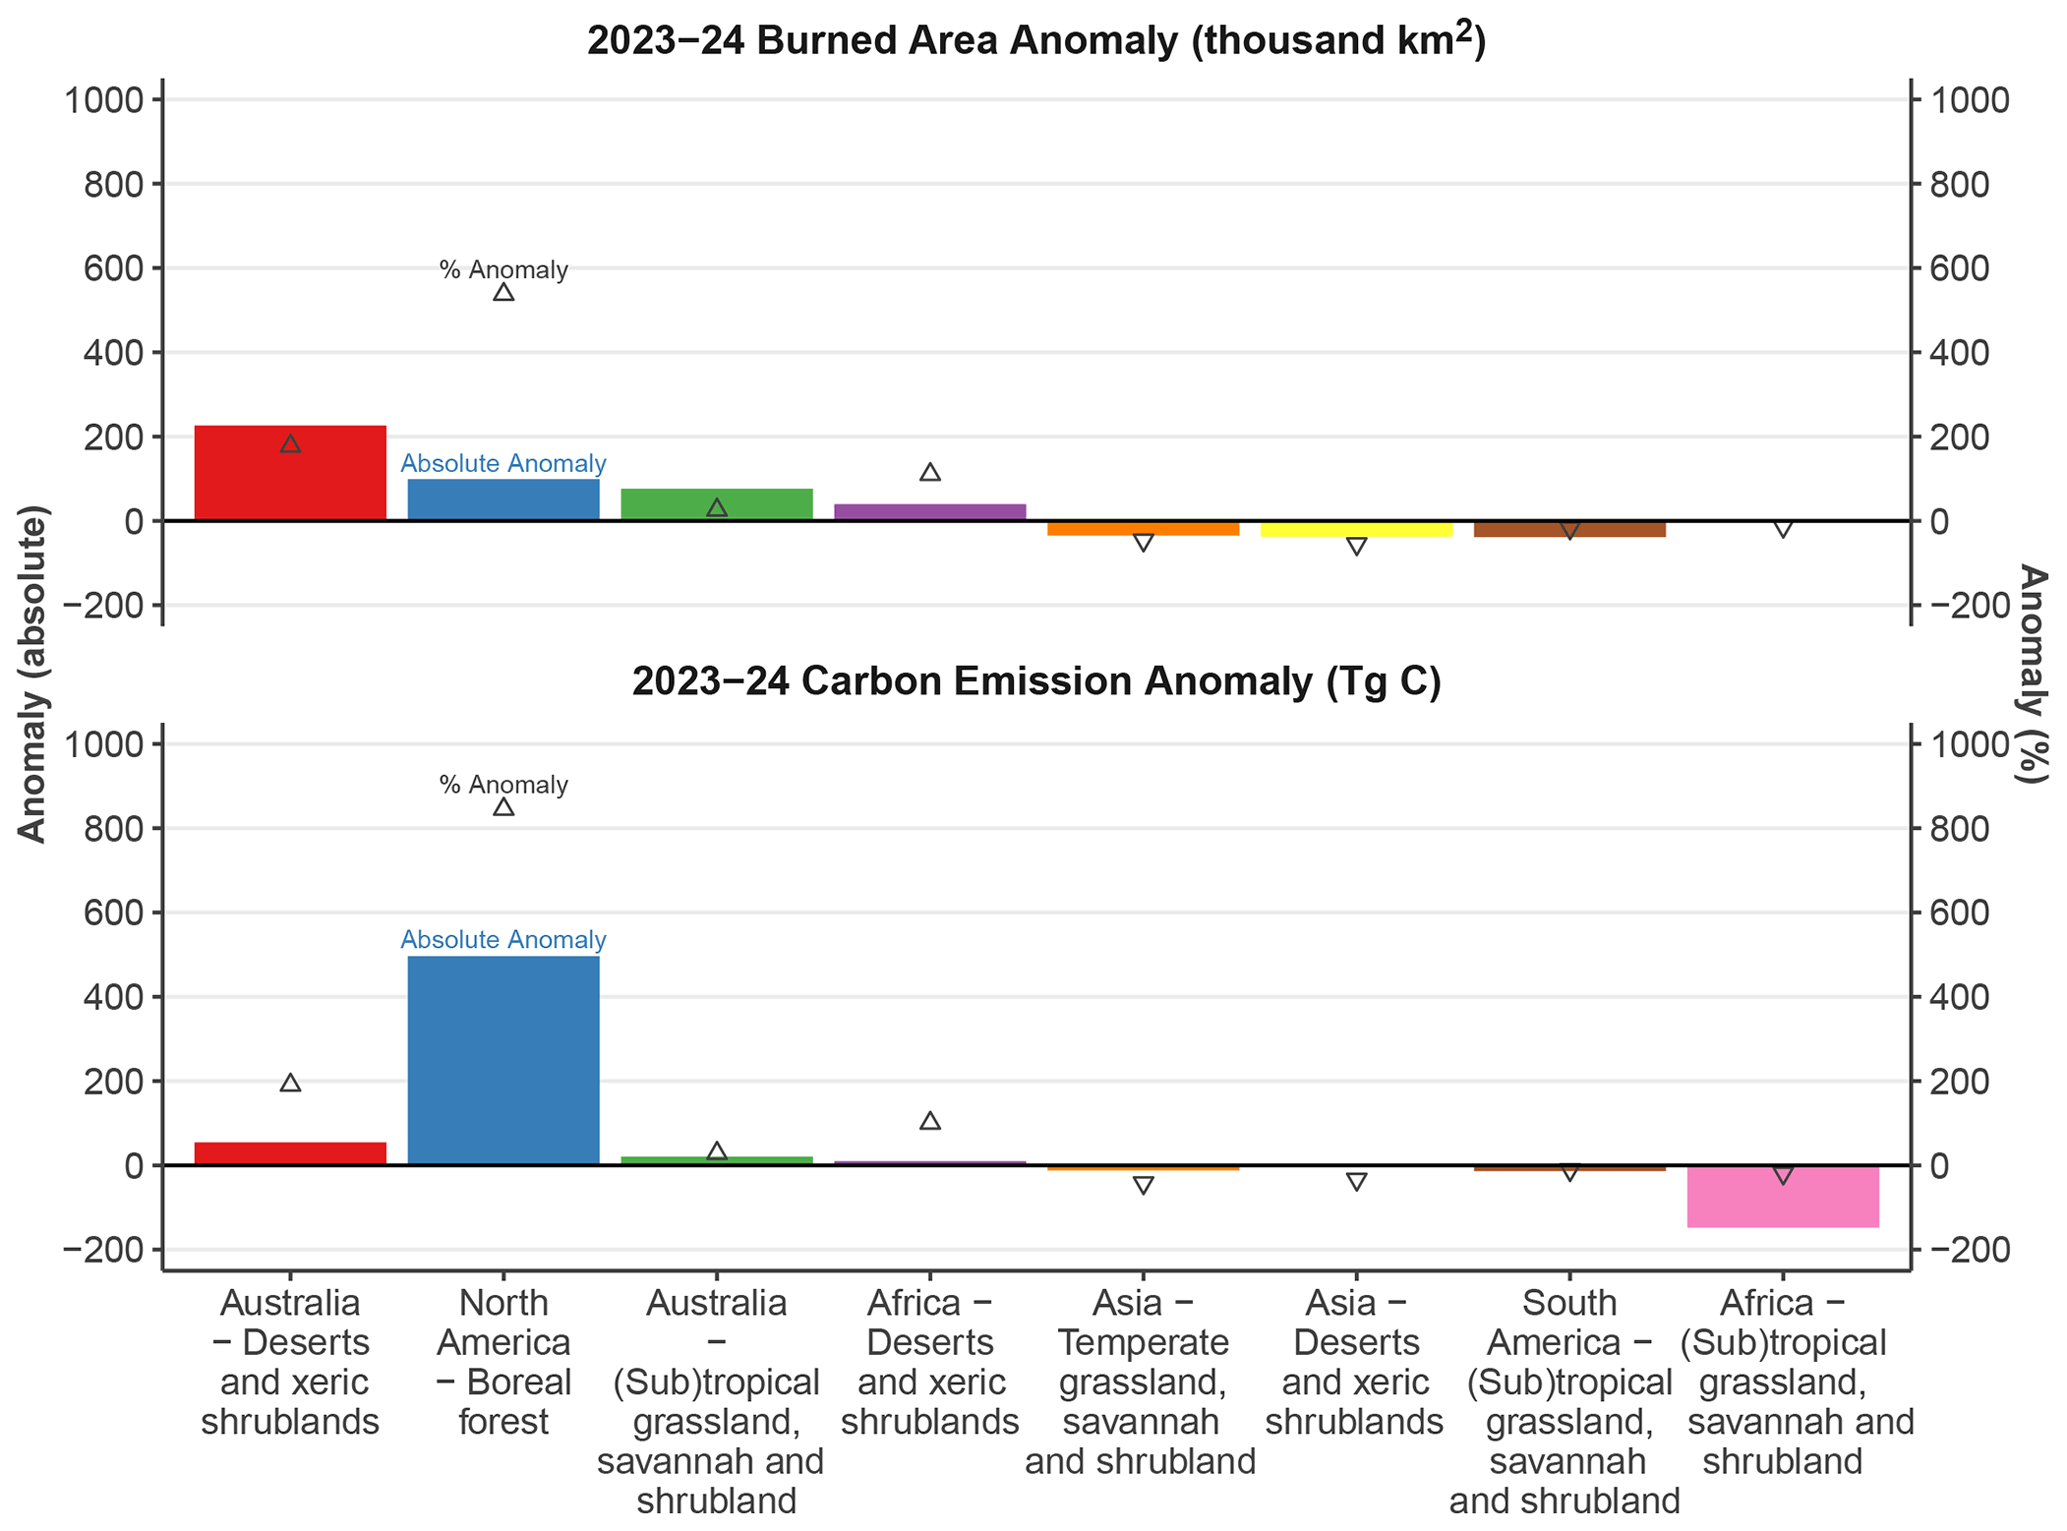
Figure 1Anomalies in BA and C (C) emissions for selected continental biomes in the 2023–2024 global fire season (March 2023–February 2024) versus the average of prior fire seasons since 2002. The selected regions all contribute at least 0.1 % towards global mean annual BA and experienced BA anomalies of over ±30 000 km2 in the 2023–2024 global fire season. Relative changes (%) are also marked by triangular symbols and can be read on the same scale as the absolute values.
Anomalies in the African (sub-)tropical grasslands, savannahs and shrublands strongly drive inter-annual variability in global fire C emissions because this biome contributes on average 40 % towards total global fire C emissions (Jones et al., 2024). If fire C emissions from African (sub-)tropical grasslands, savannahs and shrublands had been around average fire season in 2023–2024, then global fire C emissions would have been the greatest of any fire season on record since 2003.
Elsewhere at the biome scale, BA extent was in the top 3 years on record in the South American broadleaf and mixed forests; the African xeric shrublands; the Australian xeric shrublands; and the Australian (sub-)tropical grasslands, savannahs, and shrublands (Fig. 1). In contrast, BA or fire C emissions were the lowest on record in the European temperate broadleaf and mixed forests and Asian xeric shrublands and in the bottom 3 years on record in the African savannahs, Asian montane grasslands and shrublands, and European tropical grasslands and shrublands.
On national levels, the most prominent global anomaly of the 2023–2024 fire season occurred in Canada, where BA reached 6 times the average of previous fire seasons and fire C emissions reached 9 times the average of previous fire seasons. Across the Canadian provinces and territories, the highest BA or fire C emissions on record were observed in Northwest Territories, British Columbia, Alberta, and Quebec, while Yukon, New Brunswick, and Ontario also experienced high-ranking years (Figs. 2, 3). The positive BA anomalies in Canada were visible in the MODIS BA dataset from as early as April 2023 in most provinces and persisted throughout summer through to October and even through to December 2023 and January 2024 in British Columbia and Alberta (Fig. S2). Peak anomalies were observed in eastern Canada in June 2023, arriving later in western Canada (August–September). Data on individual fire characteristics from the Global Fire Atlas further reveal new record fire counts in many Canadian provinces and high-ranking anomalies in fire count and daily rate of growth across Canada, as well as new records for fire size and rate of spread in provinces of both eastern and western Canada (Fig. 4; Jones et al., 2024). Appendix A discusses the unprecedented Canadian fire season of 2023–2024 in greater detail, including its impacts and regional context.
A second prominent regional feature of the 2023–2024 global fire season, visible in Earth observations, is a cluster of administrative regions with positive BA and C emissions anomalies in the north and west of tropical South America (Figs. 2, 3). Bolivia, Guyana, Suriname, French Guiana, Honduras, Nicaragua, and Belize all experienced a high-ranking fire season at a national level in 2023–2024. In addition, BA or fire emissions were ranked in the top 3 years in western parts of Amazonia including in the State of Amazonas of Brazil, the Loreto Department of Peru, and the La Paz and Beni departments of Bolivia. Anomalies in the western Amazon spanned June 2023–January 2024, peaking in August-October 2023. In the north of South America, high-ranking fire seasons were seen in Venezuela; in various subdivisions of Guyana, Suriname, and French Guiana; and in the State of Amapá in Brazil. The anomalies in northern South America spanned May 2023–February 2024, peaking in November 2023–February 2024 (Fig. S2). The Global Fire Atlas data suggest that South American anomalies in BA during the 2023–2024 fire season were principally driven by a large number of fires, whereas anomalies in fire size or rate of growth were uncommon in most of South America (Fig. 4). Appendix A discusses the 2023–2024 fire season of tropical South America and its impacts and regional context in greater detail.
Several parts of south and southeast Asia experienced high-ranking anomalies in BA or fire C emissions during the 2023–2024 fire season, including various neighbouring administrative zones of Lao People's Democratic Republic (PDR), Thailand, and Vietnam. The temporal peak of these anomalies was broadly in March–May 2023. Data on individual fire characteristics indicate that high-ranking fire counts, rather than anomalies in fire size, were the primary driver of the regional BA anomalies (Fig. 4). Appendix A discusses these anomalies and their impacts in greater detail.
The anomalies observed in xeric biomes of Oceania are also apparent as high-ranking BA or C emissions in the 2023–2024 fire season in western parts of Australia, particularly in Western Australia and the Northern Territory (Figs. 2, 3). Fires tended to affect more remote areas, and so the impacts on society were muted in comparison to the Black Summer events affecting southeast Australia in 2019–2020 (Abram et al., 2021); however, Appendix A discusses some notable exceptions.
Other regional pockets of high-ranking BA anomalies or C emissions anomalies were observed in various dry zones of Africa and the Middle East, including the Sahel, northern Africa and the Horn of Africa, southern Africa (specifically South Africa and Botswana, where a period of 3 high rainfall years has resulted in grass fuel accumulation), parts of Iran and Iraq, parts of the Levant region, and parts of the Arabian Peninsula (Figs. 2, 3). Although various aspects of the fire season ranked highly in these regions, they are also fuel-limited with a generally a low baseline for BA and fire C emissions and the wildfire season. Nonetheless, regionally impactful wildfires were reported for Algeria, Tunisia, and Morocco as well as coastal regions of South Africa and Pakistan, and are discussed further in Appendix A.
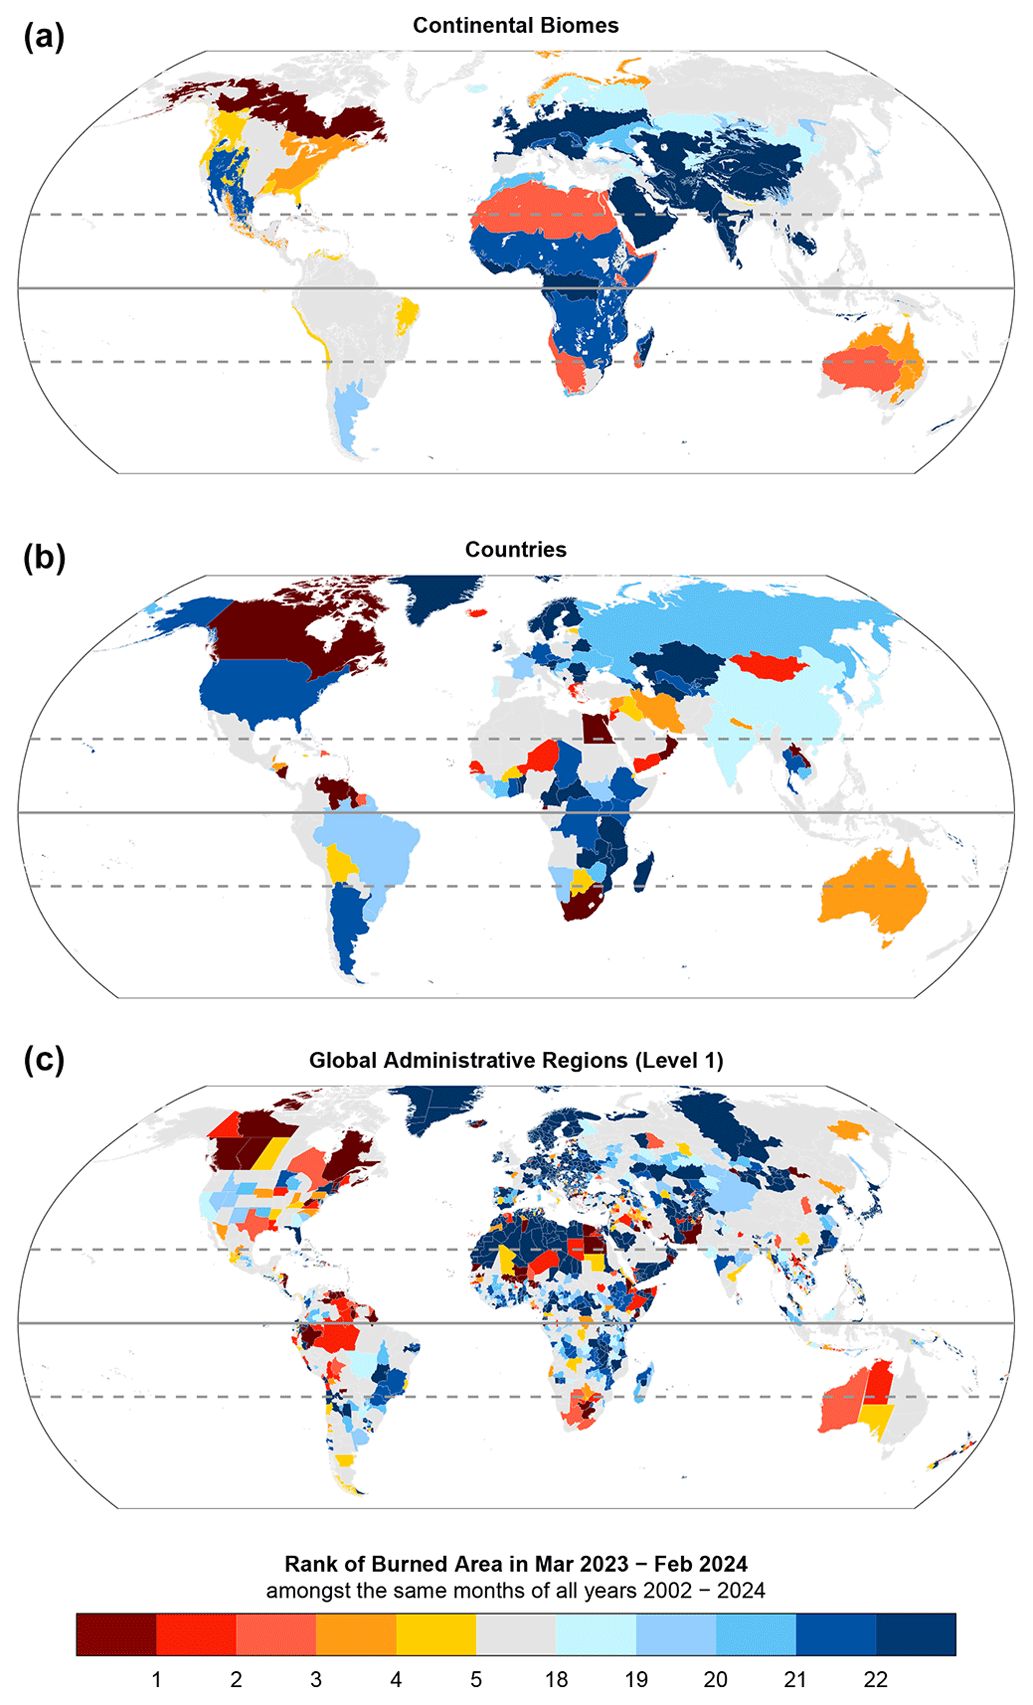
Figure 2Ranks of BA during March 2023–February 2024 versus previous March–February periods (n=23 global fire seasons) for three regional layers: (a) continental biomes, (b) countries, and (c) states or provinces. Results for regions with high-ranking (top 5 years) or low-ranking (bottom 5 years) events are highlighted. The timing of BA anomalies is shown in Fig. S2 in the Supplement.
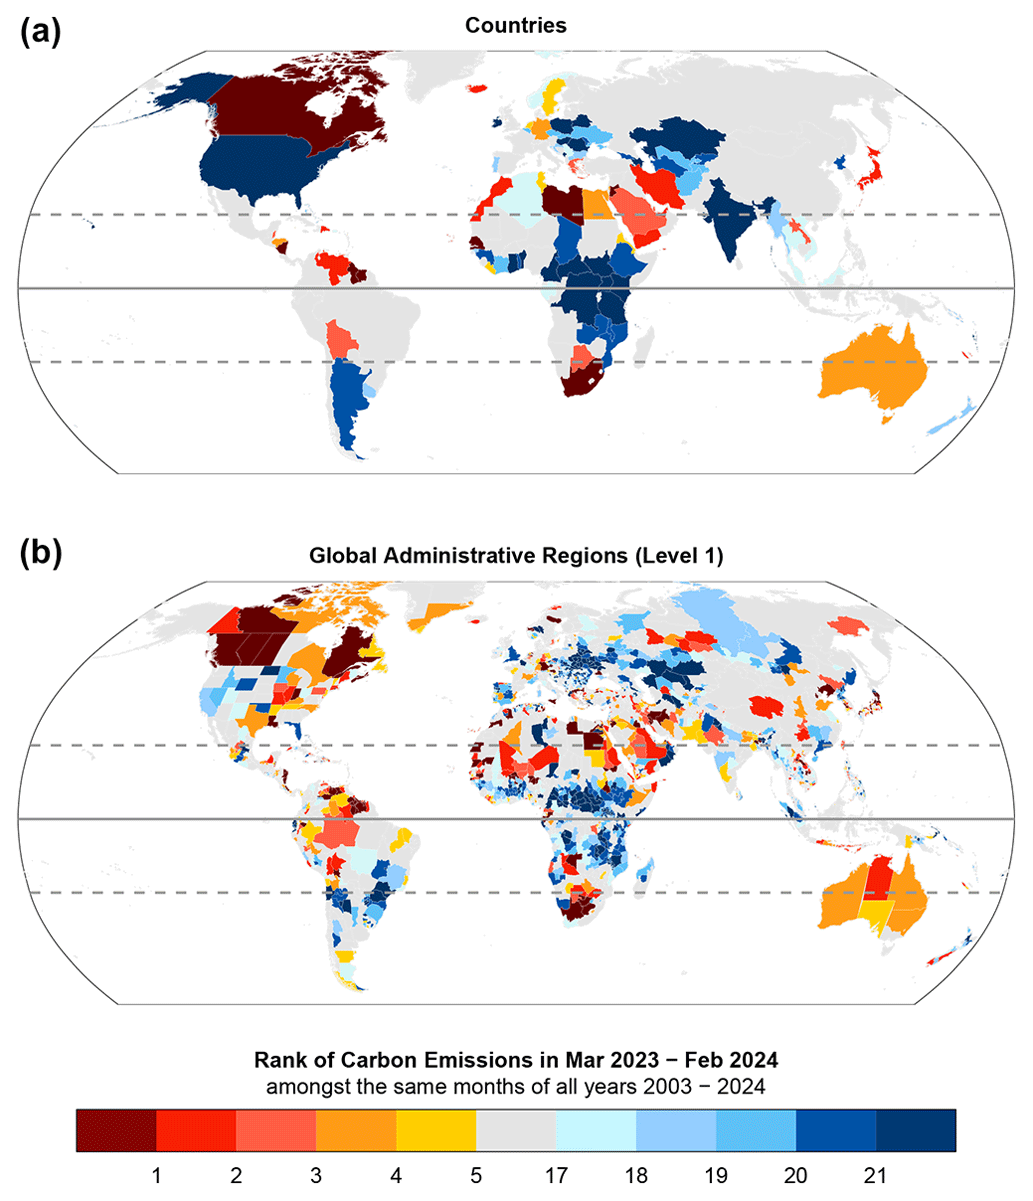
Figure 3Rank of fire C emissions during March 2023–February 2024 versus all March–January periods since 2003 (n=21 global fire seasons), at the scale of (a) countries and (b) level 1 administrative regions. We consider C emissions estimates from two products (GFAS and GFED), first calculating the mean emissions value from the two products and then ranking the values.
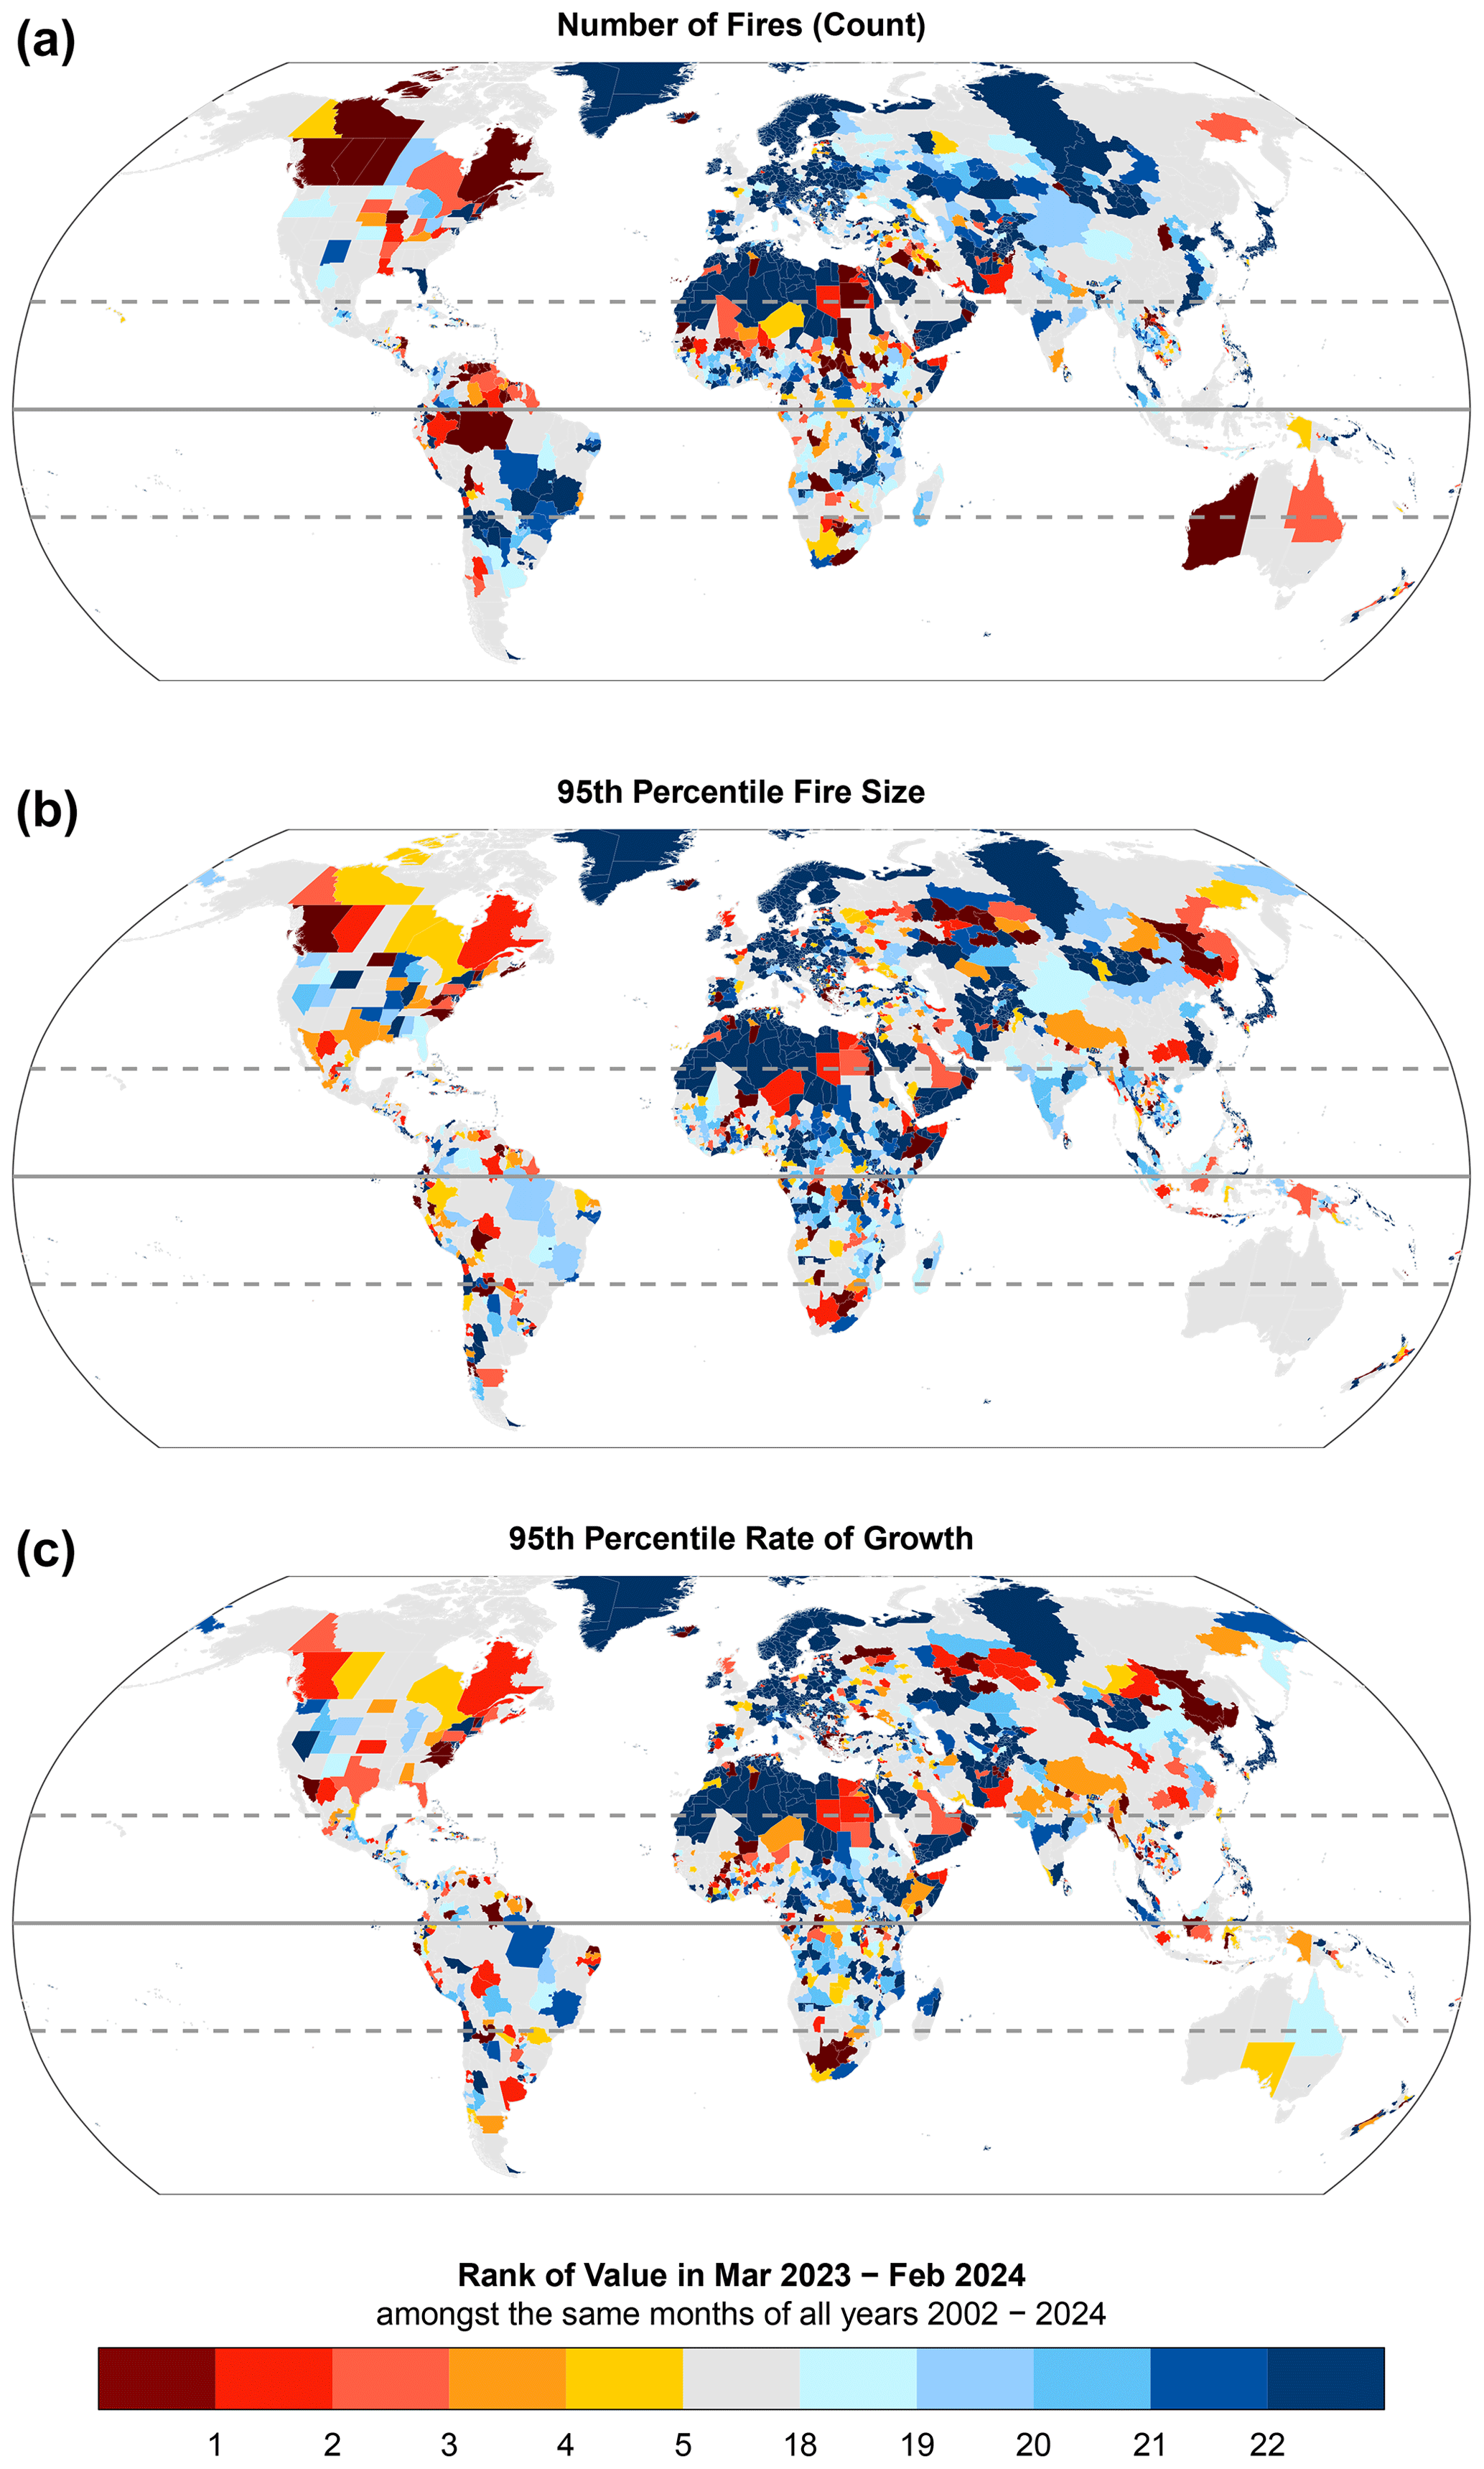
Figure 4Ranks of (a) fire count, (b) 95th percentile fire size, and (c) 95th percentile daily rate of growth during March 2023–February 2024 versus all March–February periods since 2002, at the scale of states or provinces (GADM administrative level 1 regions).
Extreme individual fires from Earth observations
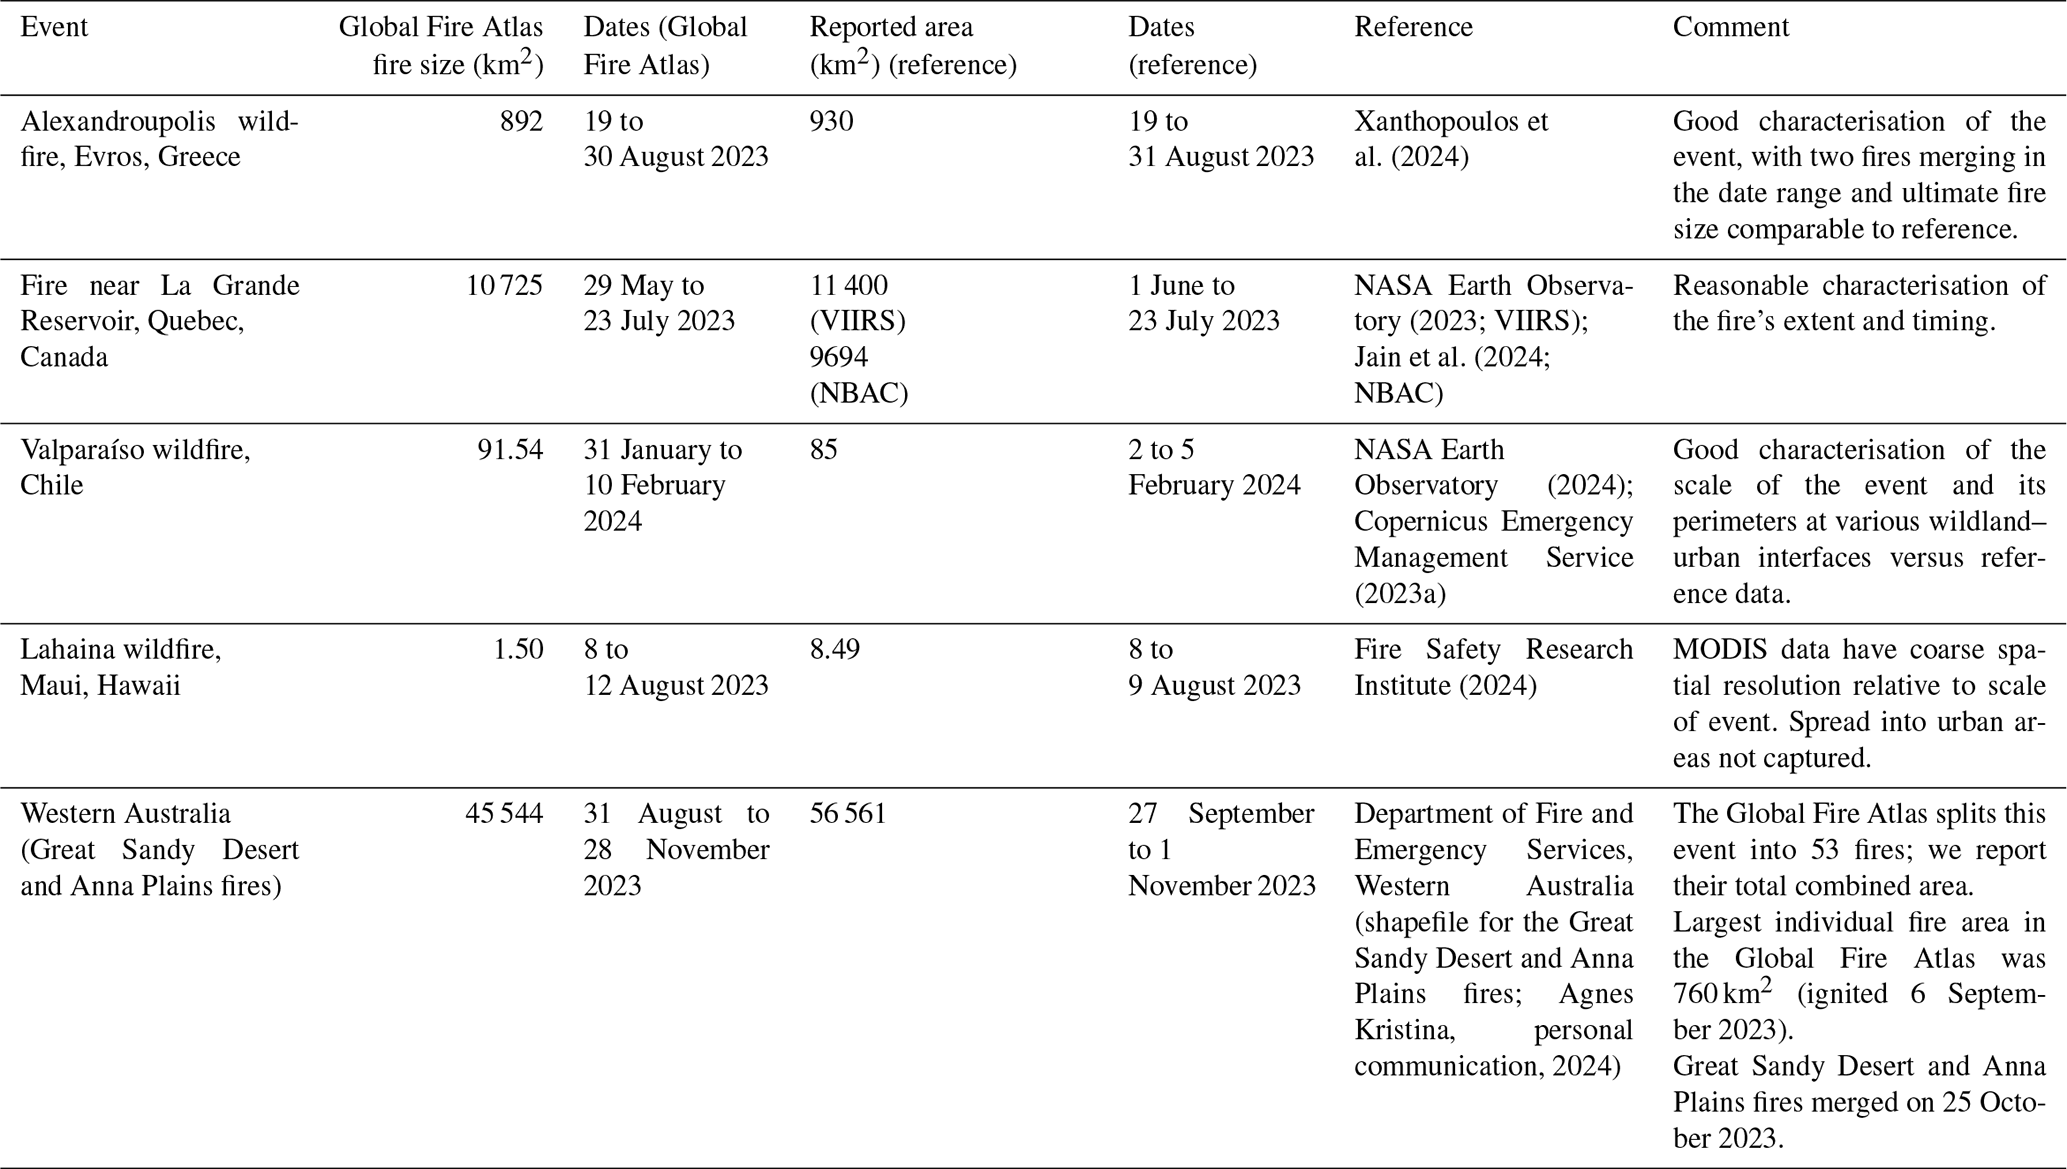
To support our analyses of anomalies in individual fire properties and provide insights into the limitations and uncertainties inherent in global-scale analysis of individual fires, we provide a brief assessment of the skills with which the Global Fire Atlas represents some of the most impactful individual fires of 2023–2024. The Global Fire Atlas represents some of the most impactful individual fire events in 2023–2024 with varying skill (Table 2; Figs. S3, S4, S5). For example, the Evros fire that occurred in the Decentralised Administration of Macedonia and Thrace, Greece, in late August was captured reasonably well. The Global Fire Atlas identifies two fires that ignited on 19 August and merged to form one contiguous burned unit with an area of approximately 900 km2. Alignment of the fire's timing, size, and perimeter with high-resolution satellite imagery (Fig. S3) and detailed reports (Xanthopoulos et al., 2024) suggest an overall reliable representation of this particular event by the Global Fire Atlas. The impacts of this fire are discussed in detail in Appendix A.
A deadly fire near Valparaíso, Chile, is also captured with reasonable skill in the Global Fire Atlas (Fig. S4). Around 90 km2 was burned, with the fire skirting the city of Placilla de Peñuelas and encroaching upon Viña del Mar and Quilpué (Appendix A). The timing, extent, and perimeter of the fire as recorded by the Global Fire Atlas compare well with those reported by other sources (Table 2).
Among the largest fires to occur in Canada during 2023–2024 happened near the La Grande Reservoir in Quebec, Canada. According to both the Global Fire Atlas and a separate NASA fire tracking product based on the Visible Infrared Imaging Radiometer Suite (VIIRS) sensor, the fire's extent was around 11 000 km2, whereas the National BA Composite (NBAC; Skakun et al., 2022) shows a similar extent of 10 000 km2. The timing of the fire also showed high correspondence across the products.
The Lahaina wildfire in Maui, Hawaii, is an example of an event that was captured poorly by the Global Fire Atlas (GFA). Issues relating to the small scale of this fire relative to the resolution of the MODIS BA data are evident in Fig. S4. As the MODIS BA algorithm is focussed on the detection of wildland fire, its effectiveness in tracking fires at the wildland–urban interface is limited. In this case, burned areas were not detected in cells in urban areas or at the wildland–urban interface, and hence the size of the fire was under-estimated significantly (Table 2). The timing of the fire on vegetation land adjacent Lahaina was compatible with reference reports.
Another example of the challenges of defining individual fire extent and applying global algorithms to do so comes from Western Australia (Fig. S5). Two fires recorded by the Department of Fire and Emergency Services, Western Australia (the Great Sandy Desert and Anna Plains fires) totalled 57 000 km2 in extent. In the Global Fire Atlas, the burned cells detected by MODIS were instead dissected into 53 separate fires, with the largest unit burning 560 km2. The date ranges were also rather different, with the first record of fires logged in agency data 1 month later than in the Global Fire Atlas and the final record logged 1 month earlier.
Table 2Representation of selected individual fire events in the MODIS BA product (Giglio et al., 2018) and the Global Fire Atlas (Andela et al., 2019).
2.2.2 Context of recent extremes: regional trends in burned area
The anomalies of 2023–2024 occur against a backdrop of trends in BA this century that point towards shifts in fire regime. Figure 5 shows significant trends in BA and forest BA across the fire seasons in the period March 2002–February 2024 derived from MODIS BA data. While many world regions are experiencing declines in total BA, increases in forest BA are far more prevalent than declines at the scale of continental biomes, countries, and administrative regions.
Northern hemispheric extratropical biomes in North America and Asia have shown a clear signal towards increased forest BA since 2002, which are also visible on national and provincial scales in Canada, the United States, and Russia and on provincial scales in various states of western and eastern Canada, the western United States, and Siberia. These trends occasionally propagate to trends in total BA, for example in western and northern Canada and in the Sakha Republic (eastern Siberia). The large 2023–2024 anomalies in BA in Canada align with the doubling of forest BA in Canada across fire seasons that have occurred since 2002 (a significant trend, p<0.05) and a 23 % increase in total BA in Canada (marginally significant at p<0.1). Three Canadian provinces showed significant increases in both total and forest BA this century: British Columbia (+35 %–42 %), Northwest Territories (+55 %–68 %), and Yukon (+60 %–135 %). No Canadian provinces experienced a significant decline in forest BA or total BA. More widely, there has been a 58 % increase in forest BA in the North American boreal forest biome since 2002 and a 134 % increase across the pan-boreal forest biome of North America and Eurasia. The succession of events affecting boreal forests in Canada in 2023, Siberia in 2020, and both North America and Asia during 2021 appears to be part of a continued trend towards rising fire extent in the high latitudes this century.
Elsewhere in the southern hemispheric extratropics, significant rises in forest BA have been seen in Chile since 2002 (+87 %), including in the central regions of Araucanía, Biobío, Maule, Ñuble, and Valparaíso, ranging from 35 to 109 %. Extreme fires in Valparaíso during 2023–2024 and in Araucanía, Biobío, and Ñuble in the 2022–2023 fire season follow an extreme 2022–2023 fires season in Maule, Nũble, Biobío, and Araucanía (Appendix A), consistent with a longer-term rise in BA in central Chile (Fig. 5). Increases in BA are not generally significant in fire-prone parts of the southern hemisphere extratropics, such as Africa or Australia.
In the tropics, trends in total and forest BA show a variety of patterns. While total BA has reduced across much of the savannah-occupied regions of South America, Africa, and northern Australia, trends in forest BA (> 30 % tree cover) are far more varied (Fig. 5). Hence, fires in woody tropical vegetation show a less consistent global trend. In addition, exceptions to the general decline in total BA across the tropics are seen in the Brazilian State of Amazonas and the Congo basin and across much of India (Fig. 5). The trend in Amazonas, among the most pristine parts of Amazonia, contrasts with other states of Brazil such as Mato Grosso and Pará, where deforestation rates and deforestation-related fires have fallen since their peak during the early 2000s (Silva Junior et al., 2020 ). The anomalous fire activity and C emissions in the State of Amazonas during the 2023–2024 fire season (but not other states of Brazil) thus appear to be consistent with the emerging pattern of increased fire in the region. Meanwhile, the 2023–2024 anomalies in BA and other fire properties in the Bolivian, Peruvian, Colombian, and Venezuelan parts of Amazonia (Appendix A) typically occurred against a backdrop of reduced BA or no significant trend in recent decades (Fig. 5).
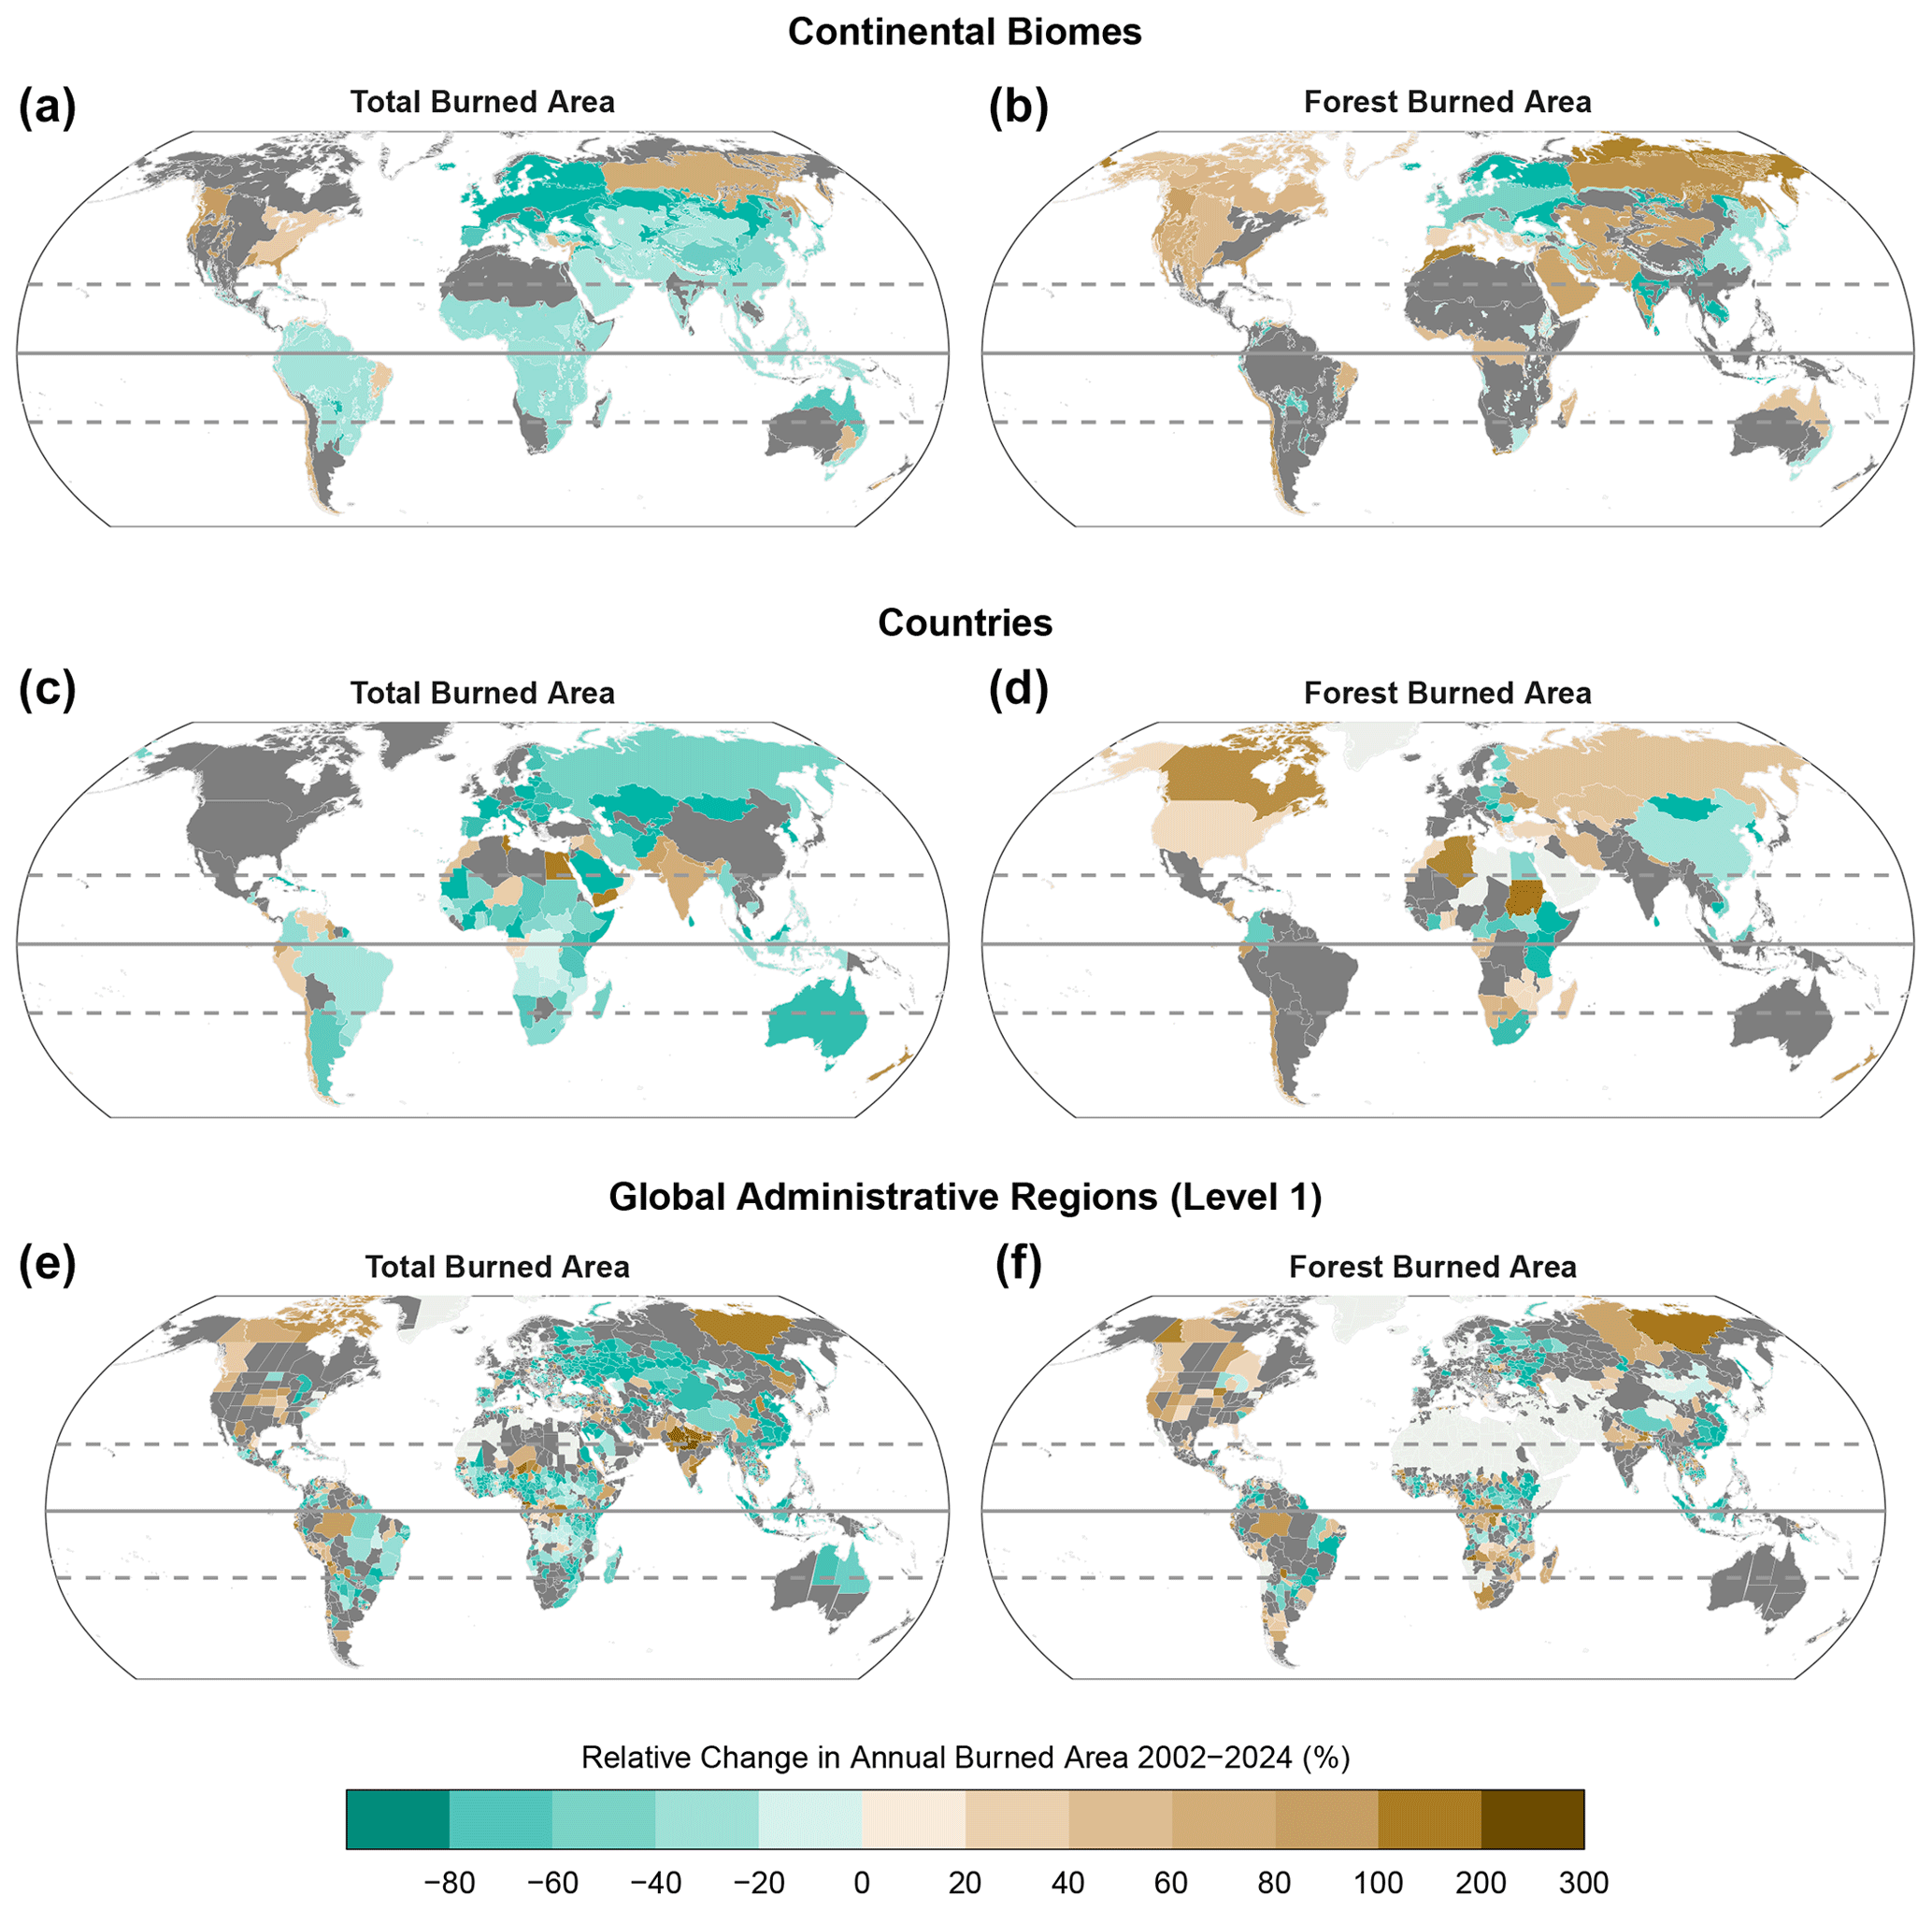
Figure 5Relative changes (%) in (a, c, e) total annual BA and (b, d, f) forest BA across March–February fire seasons during 2002–2024 for three regional layers: (a, b) continental biomes, (c, d) countries, and (e, f) level 1 administrative regions (e.g. states or provinces). Forest BA only considers areas with tree cover over 30 % at the native (500 m) resolution of the BA observations. Relative changes are calculated as the trend in BA across fire seasons March 2002–February 2022 through March 2023–February 2024 multiplied by the number of years in the time series and divided by the mean annual BA during the period. Trends in BA are derived using the Theil–Sen slope estimator. Only significant trends in BA are shown (dark-grey fill signifies no significant trend).
2.2.3 Focal events of this report
Canada
In this year's report, the extreme wildfire season in Canada is selected as one of our focal events. It emerges as a major event of global relevance for the following reasons (see Sect. 2.2.1 and the results of the expert consultation presented in Appendix A):
-
Record-breaking burned area. The North American boreal forests, particularly in Canada, experienced an unprecedented fire season. The BA reached 6 times the average since 2001.
-
High C emissions. Fire C emissions in Canada were over 9 times the average since 2003, contributing significantly to global C emission totals for the year. Canadian boreal forests contributed 24 % towards the total above-average global fire C emissions in 2023–2024, up from 3 % in an average year.
-
Early and persistent fires. Positive BA anomalies were visible from April 2023 (Fig. S9) and persisted through to October, with some regions experiencing fires until January 2024. The fire season lasted nearly a month longer than normal, with the largest 1 d BA total ever recorded in Canada occurring on 22 September 2023.
-
Regional anomalies. Peak fire anomalies were observed in eastern Canada in June 2023 and later in western Canada (August–September), indicating widespread and prolonged fire activity across the country.
-
Record fire size and spread. New records for individual fire size and rate of spread were set, with many provinces experiencing high-ranking anomalies in fire count and daily growth rates.
-
Extensive impact across provinces. The highest BA or fire C emissions on record were observed in Northwest Territories, British Columbia, Alberta, and Quebec, with other provinces like Yukon, New Brunswick, and Ontario also experiencing significant fire activity.
-
Air quality impact. Smoke from these fires led to severe air quality issues, affecting major cities in North America, including New York, which experienced its worst air quality in half a century.
-
Firefighting challenges. Canada was at its highest national preparedness level for an unprecedented 120 continuous days, indicating the significant resource sharing and international assistance required to manage the fires.
-
Human and economic toll. Over 232 000 people were evacuated across various regions, and despite the extreme fire activity, no civilian deaths were directly attributed to the fires, showcasing the effective, albeit strained, emergency response efforts.
To assess the causes of specific regional BA anomalies, four anomalous BA regions–month combinations were chosen across Canada: western Taiga Shield and Taiga boreal plains for May and June (includes Alberta and British Columbia boreal plains and the Montane Cordillera); and eastern Taiga Shield in Quebec for June and July. Figure 6 maps the magnitude of anomalies in these regions and months. Though note that the size and long period of this protracted event mean that even these regions and months do not capture all the anomalous BA over Canada in 2023 (Fig. S9).
Greece
In this year's report, the extreme wildfire season in Greece is selected as one of our focal events. It emerges as a major event of global relevance for the following reasons (see Sect. 2.2.1 and the results of expert consultation provided in Appendix A):
-
Second-highest BA on record. Greece experienced its second-worst fire season in terms of total area burned, with 1727 km2 affected, despite recent efforts to strengthen firefighting mechanisms. The 2023 fire season was notably more severe than typical years, with the total BA significantly exceeding the country's historical averages and recent challenging fire seasons.
-
Multiple large fires. From mid-July to late August, Greece faced numerous large fires that overwhelmed firefighting capabilities. Key fires included those on the island of Rhodes, which burned 207 km2, and the massive Evros fire, which reached 938 km2.
-
Evros fire disaster. The Evros fire became the largest on record in recent European history, significantly impacting both forested and agricultural areas. It also led to the tragic deaths of 19 immigrants, who were trapped by the flames.
-
Urban and infrastructural impact. Fires near populated areas necessitated large-scale evacuations, including 20 000 tourists on Rhodes and multiple settlements around Mount Parnis in Attica. The Evros fire also caused a powerful explosion at an air force base, resulting in damage to the town of Nea Anchialos.
-
Significant evacuations. Numerous evacuations took place, highlighting the severity of the situation. These included evacuations in Alexandroupolis and its surrounding villages due to the Evros fire.
-
Economic and environmental damage. The fires caused extensive damage to properties, infrastructure, and natural reserves, with significant impacts on biodiversity and local economies.
-
Firefighting challenges. The simultaneous spread of multiple fires stretched firefighting resources to their limits, with a notable focus on evacuations rather than fire suppression in some instances.
Abnormally highly burned areas were reported around Alexandroupolis in August and extended further west across the administrative region of Macedonia and Thrace. Anomalies were also present in central Greece and around Athens in July and August (Fig. S10). Figure 6 maps the magnitude of the anomalies for August.
Western Amazonia
Our final focal event of 2023–2024 is a box drawn in western Amazonia with bounding coordinates 2.25° N, −56.00° E and −9.75° S, −77.75° W. It includes Amazonas (Brazil); Loreto (Peru); and La Paz and Beni (Bolivia), where peak fire anomalies occurred simultaneously. It emerges as a major event of global relevance for the following reasons (see Sect. 2.2.1 and the results of expert consultation provided in Appendix A):
-
Record-setting fire activity. The 2023 fire season in western Amazonia saw unprecedented fire counts, with new records set across the State of Amazonas in Brazil, Loreto Department in Peru, and La Paz and Beni departments in Bolivia.
-
Severe air quality degradation. Smoke from widespread fires led to significantly degraded air quality across the region, impacting millions of people and posing serious public health risks.
-
Broad socio-economic and health impacts. The fires caused extensive socio-economic disruptions, including health issues from poor air quality; legal action for inadequate fire prevention; and impacts on livelihoods, particularly for Indigenous and Traditional communities.
-
Widespread environmental degradation. The fires contributed to significant C emissions and environmental degradation, affecting forest ecosystems and increasing the region's vulnerability to future climatic extremes. Western Amazonia has global significance due to its critical role in C storage and biodiversity and relatively low levels of disturbance.
-
Impact on Indigenous and Traditional communities. Fires had potential to significantly disrupt the lives and livelihoods of Indigenous and Traditional populations, exacerbating their vulnerabilities due to isolation and reduced access to resources.s
Abnormally highly burned areas were reported in western Amazonia during September and October. Figure 6 maps the magnitude of these anomalies. The most widespread BA anomalies emerged in August 2023 and extended through to November 2023 (Fig. S11).
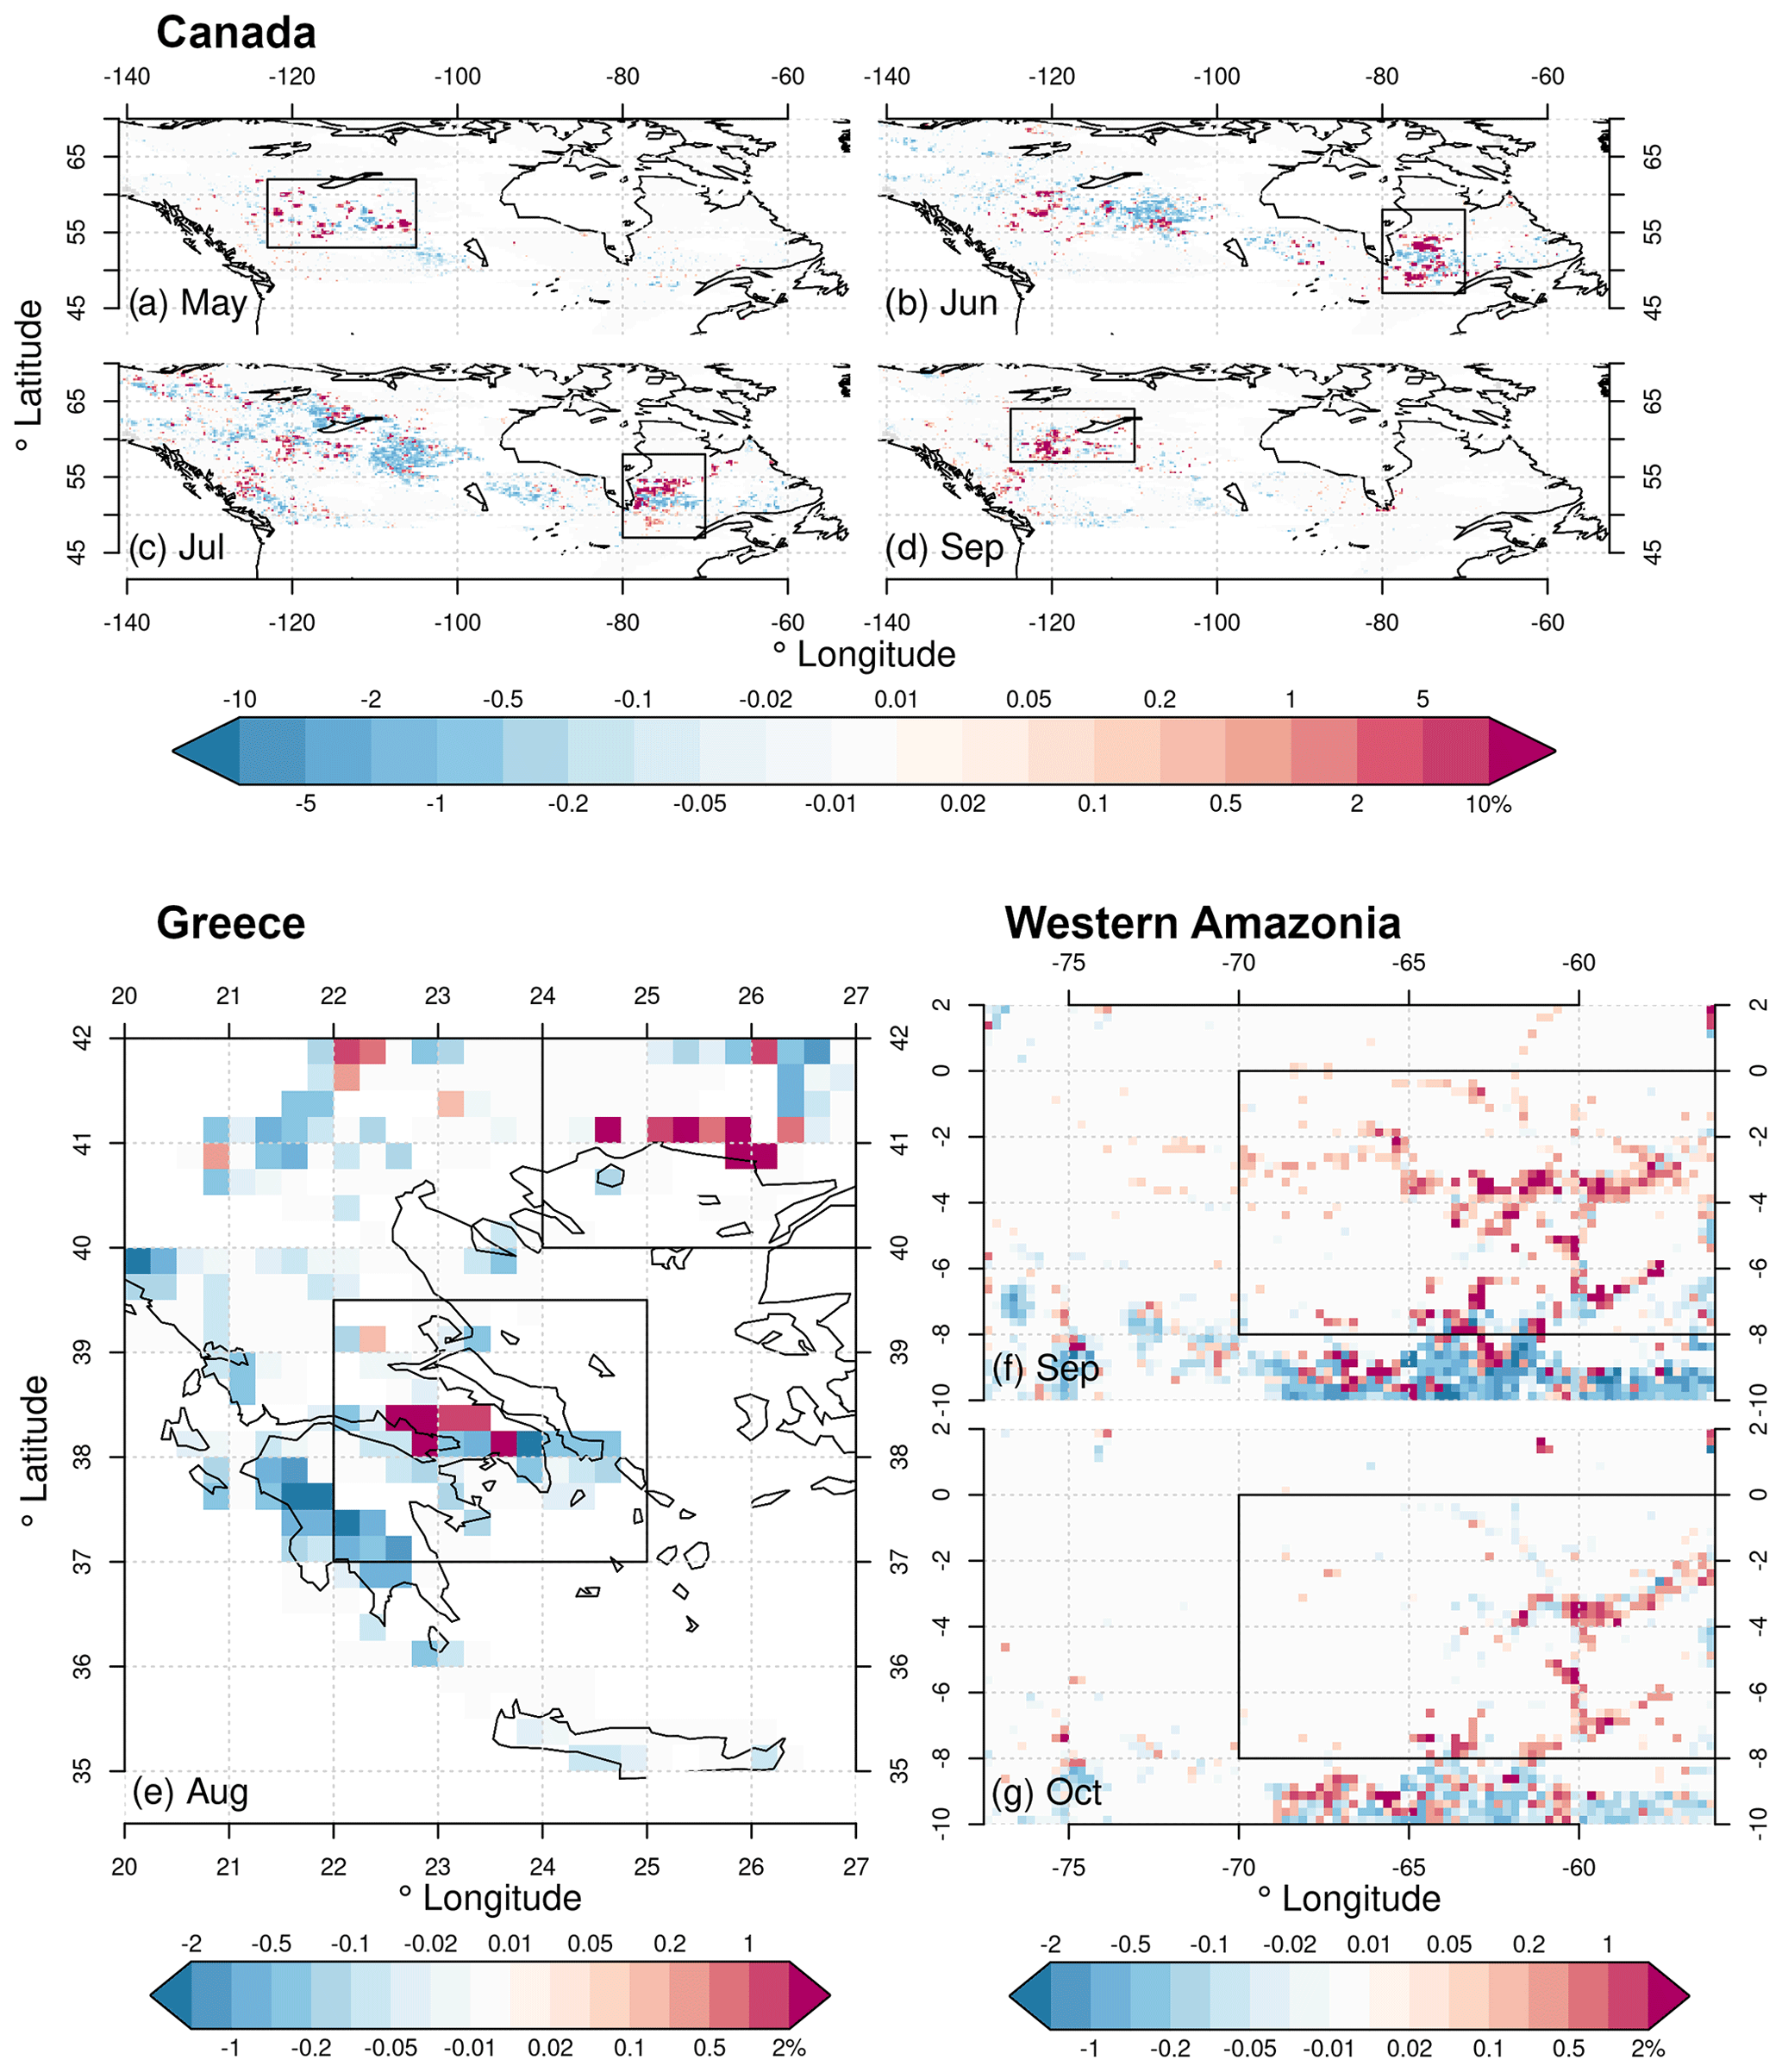
Figure 6Spatially explicit anomalies in BA fraction (%) during key months for focal events in (a) Canada, (b) Greece, and (c) western Amazonia. Plotted data are the absolute change from the climatological mean BA fraction for the month (%), based on the MODIS BA product aggregated to 0.25°. Red indicates higher BA in that month of 2023 vs the 2002–2022 climatological average for that month. Boxes indicate focus events for our analyses in this report. The top panels show anomalies in Canada for various months, the lower-left panel shows anomalies in Greece for August, and the lower-right panel shows anomalies in western Amazonia during September and August.
3.1 Methods
3.1.1 Predictability of focal extremes
We evaluated the time frame over which extreme events could have been forecasted using a common metric of fire danger, the Fire Weather Index (FWI). Developed by the Canadian Forest Service as part of the Canadian Forest Fire Danger Rating System (CFFDRS; van Wagner, 1987), the FWI comprises various components that consider the influence weather on fire danger, with 2 m temperature, 10 m wind speed, precipitation, and 2 m relative humidity as prerequisite variables. The FWI combines three sub-indices, which are fuel moisture codes representing vegetation moisture state at different layers in the forest floor, as well as a spread index influenced by fuel moisture state and wind speed (van Wagner, 1987). A higher FWI indicates fire weather conditions more conducive to wildfires in environments with sufficient fuel load.
Owing to its original design for use in forest ecosystems, the FWI is especially useful for predicting the likelihood and severity of extreme events in ecosystems where weather is the primary limitation to fire (i.e. those mainly limited by moisture or temperature); its accuracy in forecasting BA in fuel-limited ecosystems is more limited (Carvalho et al., 2008; Bedia et al., 2015; Abatzoglou et al., 2018; Jones et al., 2022). Its applications encompass early warning systems, pre-suppression and suppression planning, prescribed burn planning, and effective alerting of authorities and the public to abnormal fire danger conditions. The FWI is extensively used in operational global information platforms such as the European Forest Fire Information System (EFFIS; https://forest-fire.emergency.copernicus.eu/, last access: 9 July 2024), the Global Wildfire Information System (GWIS; https://gwis.jrc.ec.europa.eu/, last access: 9 July 2024), and the Canadian Wildland Fire Information System (CWFIS; http://cwfis.cfs.nrcan.gc.ca/, last access: 9 July 2024). The FWI is not the only index for fire danger, and other fire danger systems or sub-indices of this system may correlate more strongly with BA or fire behaviour metrics in some environments. Nonetheless, the FWI is widely applied due to its good performance across a range of environments (Di Giuseppe et al., 2016; Jones et al., 2022), and so we adopt it in the current work.
In addition to well-established fire danger forecasts with lead times of a few days, skilful predictions of fire danger can be made on sub-seasonal to seasonal timescales (S2S) for Mediterranean Europe (Bedia et al., 2015), United States (Roads et al., 2010), and Asia (Spessa et al., 2015). Drought and fire weather conditions throughout the world have been found to correlate with large-scale climate patterns such as the El Niño–Southern Oscillation (ENSO) (Field et al., 2016; Chen et al., 2017) and the Indian Ocean Dipole (Cai et al., 2009) for which current numerical weather prediction systems showcase a predictive skills. Other climate modes such as the Atlantic Multidecadal Oscillation and the Pacific Decadal Oscillation have been shown to influence fire-favourable weather conditions for some seasons and regions (Aragão et al., 2018; Turco et al., 2018). However, due to the larger uncertainties in their predictions, they are not considered here.
Following the concept of seamless prediction of fire weather on S2S timescales (Wetterhall and Di Giuseppe, 2018; Di Giuseppe et al., 2020, 2024; Dowdy, 2020), we collated FWI data from reanalyses and forecasts designed to operate on S2S lead times of 10 d to 7 months. Here, we take FWI estimates from the ERA5-Land reanalysis product (Muñoz-Sabater et al., 2021) as a proxy for the observed FWI. Forecasts at different lead times are taken from the operational high-resolution ECMWF weather system, and seasonal predictions are sourced from ECMWF's seasonal forecasting system, ECMWF-SEAS5 (Johnson et al., 2019; Di Giuseppe et al., 2020, 2024). A comparison between reanalysis and forecast provides an indication of how weather forecast errors translate into FWI uncertainties (predictability). Additionally, the predictions are compared to recorded peaks in fire activity, in terms of both burned areas and active fires as observed by the MODIS satellites to provide a qualitative assessment (skill) of the correlations between landscape flammability and actual fire events.
The prediction systems utilised here vary in their spatial and temporal resolutions. Short- to medium-range FWI forecasts (up to 10 d) are available daily at a resolution of 9 km with 50 ensemble members, while the FWI seasonal forecast is available monthly at a resolution of approximately 25 km; however seasonal skill is limited to 1–2 months in normal conditions (Di Giuseppe et al., 2024). All prediction systems include a measure of uncertainties through the provision of ensemble simulation (Figs. S24, S25, S26 in the Supplement). Variance across the ensemble was previously estimated to be on the order of 10 %–15 % (Vitolo et al., 2020).
Here, the predictive skill of the models is assessed qualitatively by visually examining the extent to which the extreme FWI (specifically the ensemble mean) was a precursor of several focal events, replicating the use of this indicator by fire agencies during the fire season. The approach is designed to partially replicate the interpretation and application of the FWI by fire management agencies. Most fire agencies would have local information on fuel conditions and would thus be able to interpret FWI values in a more informed manner, reducing the dependence of decisions on FWI anomalies alone. The FWI should not be evaluated using traditional skill scores, as these would be dominated by false alarms. We maintain that the FWI is an index representing flammability and, therefore, cannot be fairly validated against fire activities.
3.1.2 Identifying key drivers of focal events
Modelling systems
We used two modelling systems with similar fire predictors to diagnose the drivers of each focal event. The models are the PoF model (McNorton et al., 2024) and the ConFire attribution framework (Kelley et al., 2019, 2021). The PoF model diagnoses the drivers of active fire (AF) observations from the MODIS MCD14ML active fire product (collection 6.1; 1 km resolution; Giglio et al., 2016; ASA Earth Science Data Systems, 2020) using Shapley values (Lundberg and Lee, 2017), while ConFire diagnoses drivers of BA from the MODIS BA product (Giglio et al., 2018; regridded to 0.5°). Fires flagged as low confidence in the AF product were not used. Although AF and BA have been used widely in global and regional scientific studies, there are substantial differences between the two branches of fire observation as reviewed extensively elsewhere (Roy et al., 2008; Di Giuseppe et al., 2021; Chuvieco et al., 2019), and the strength of the relationship between them can vary regionally (van der Werf et al., 2017; Hantson et al., 2013). Our use of two observational fire products and two distinct model approaches provides a way to account for inherent uncertainties in the observability of different fire events and the uncertainties in the methodologies.
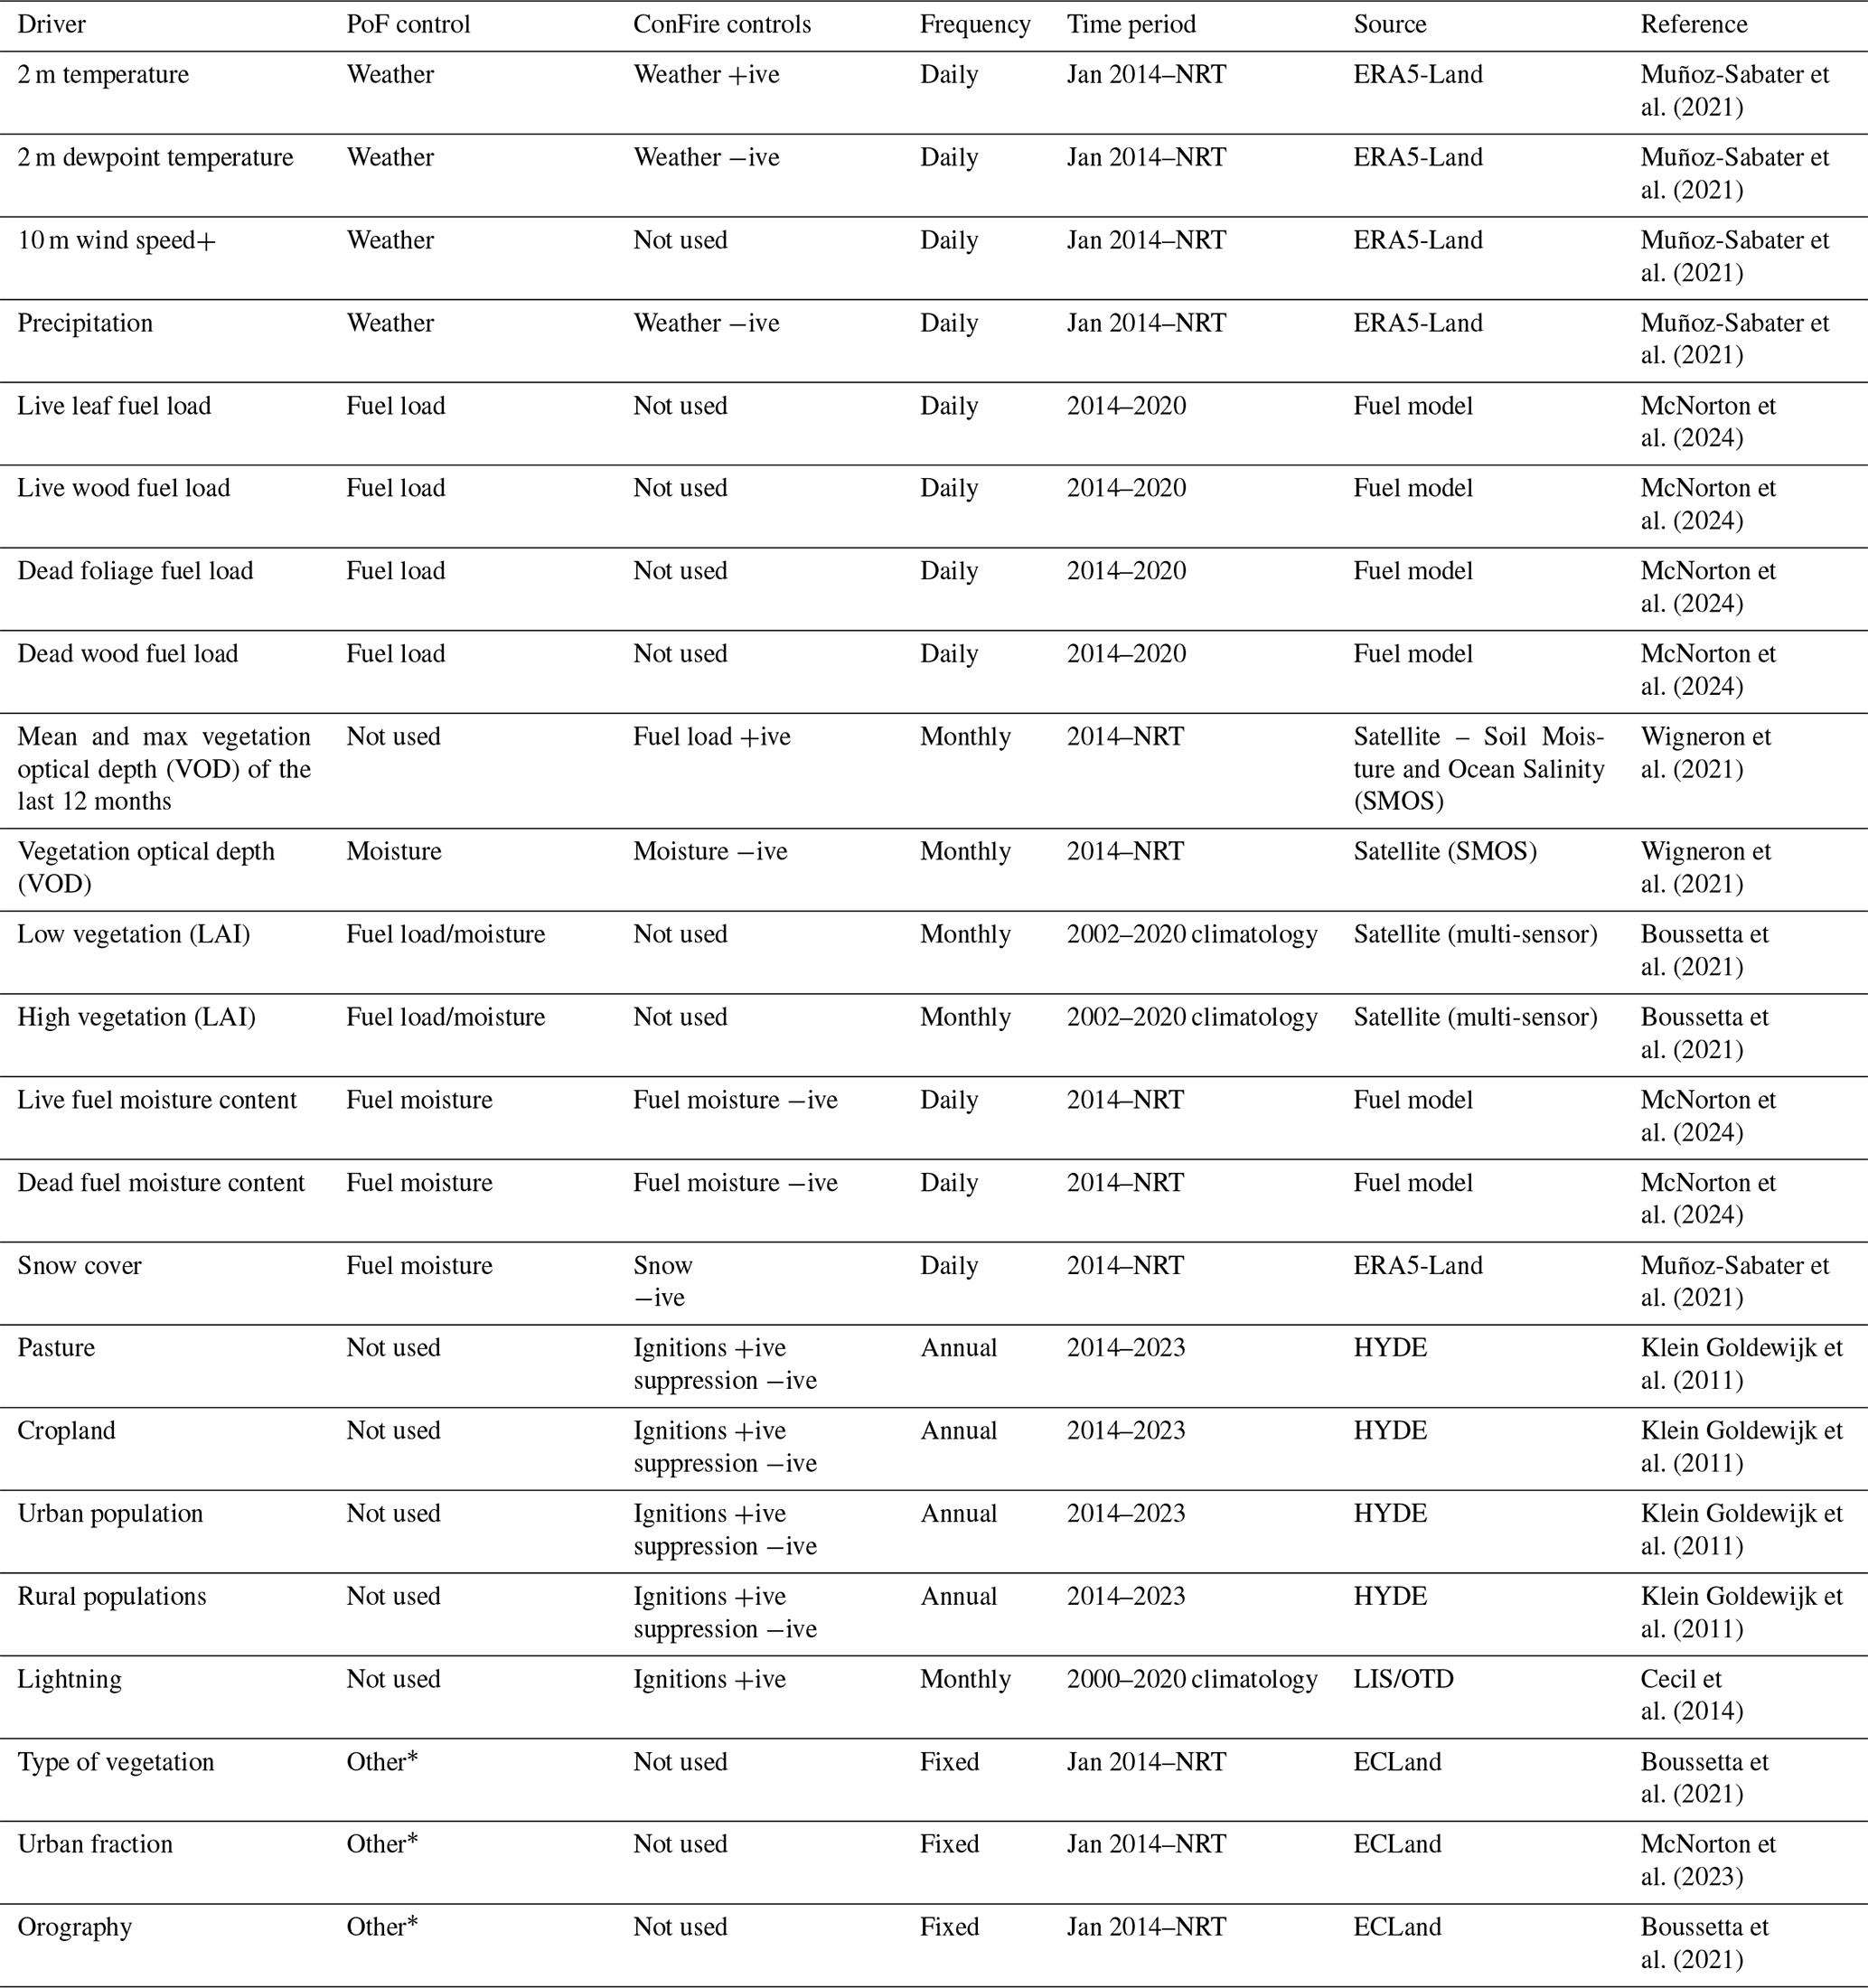
Both modelling approaches use a number of individual predictors of AF or BA, which we refer to as “drivers”. The drivers are grouped into four main categories, which we refer to as the controls. PoF and ConFire both include weather, fuel abundance, and fuel moisture as controls on fire. In addition, PoF (but not ConFire) includes an “Other” category of controls, and ConFire (but not PoF) includes a “human” category of controls, as per Table 3. PoF drivers in Other include ignition and suppression effects as well as the residual error between predicted and observed fire activity. Grouping the set of drivers between the four identified controls – weather, fuel moisture, fuel load, and human/other – is not always straightforward, as fuel moisture and weather variables are strongly correlated, and fuel load is also related to weather conditions. Hence, some drivers can be associated with more than one control (Table 3). The categorisation stems mostly from the way the driving datasets have been obtained and their underlying resolutions. We have also considered the traditional approach of assessing fire weather in isolation within most fire danger assessment metrics. We believe that grouping these metrics under the umbrella term “control weather” offers a concise way to reference the drivers of the Fire Weather Index (Matthews, 2009). Despite this, it is important to note that the techniques employed ensure contribution from specific variables cannot be double-counted between categories. Both ConFire and PoF are capable of disentangling the contributions of individual drivers within the same control category (for example, the separate contributions of dead or live vegetation) and quantifying these contributions (Kelley et al., 2019; McNorton et al., 2024). However, we will focus our analysis on the impact of the controls.
Drivers and controls used in fire event analysis
For our assessment of the contribution of weather and fuel moisture to the anomalous events, we take several predictors from ERA5-Land (9 km resolution; Muñoz-Sabater et al., 2021), specifically variables that are known to correlate with AF or BA (Bistinas et al., 2014; Haas et al., 2022). The drivers considered for each control are listed in Table 3. For the weather component in isolation, we use 2 m temperature, 2 m dewpoint temperature, 10 m wind speed, and daily total precipitation (note that these are the prerequisite variables used in the formulation of the FWI; van Wagner, 1987). We use a fuel characteristic model to estimate the fuel load and fuel moisture components following McNorton and Di Giuseppe (2024), with model estimates of fuel moisture constrained by estimates of leaf area index (LAI) from the ECMWF's Integrated Forecast System (IFS) and model estimates of fuel loads constrained by aboveground biomass estimates from the ESA CCI (Santoro and Cartus, 2021) and net ecosystem exchange estimates from the Copernicus Atmosphere Monitoring Service (CAMS; Agustí-Panareda et al., 2019). Additional predictors regarding fuel load and state include vegetation cover and type (Table 3). Proxies for ignition and suppression controls, placed within the “Other” set of controls, are more challenging to establish. Currently, we use population density, urban fraction, cropland fraction, pasture fraction, lightning, and orography (Table 3). For consistency all variables are interpolated to 9 km resolution. The “Other” category not only includes factors related to ignitions but also the fraction of predictions missed by the models. This is important because this category weights the importance of unaccounted-for factors.
Another important aspect is that models do not assume a specific direction for each factor's influence on fire activity. Consequently, wetness can correlate with increased fire likelihood in some locations and reduced fire likelihood in others. This aligns with established theory in our field: in fuel-limited regions where grass and herbaceous fuels dominate, high rainfall promotes fuel accumulation and increases fire extent. Conversely, in fuel-rich regions with high tree cover, high rainfall increases fuel moisture and reduces fire extent. See Sect. S1.2.1 in the Supplement for a detailed description. See Sect. S2.1 for detailed evaluation.
Table 3Drivers of fire and their parent control group included in the event fire analyses using ConFire and PoF. Drivers are individual variables, which serve as proxies for the influence of weather, fuel load, fuel moisture, or other controls on BA. * The “Other” category includes proxies for ignition and suppression controls and the missed prediction. Note that for ConFire, explanatory variables can be associated with multiple controls (Kelley et al., 2019). Positive (+ive) or negative (−ive) under “ConFire control” describes if a driver increases or decreases BA in ConFire. NRT: near-real time.
Analysis of fire drivers
The PoF system uses gradient-boosted decision trees from the XGBoost library on detected AF (McNorton et al., 2024). The training iteratively adds decision trees to an ensemble of models to correct for errors made by previous iterations, resulting in a computationally efficient optimisation (Chen and Guestrin, 2016). The system training uses a classifier approach which defines a positive hit as an AF detection within the grid cell on a given day. The driver attribution is performed using the SHapley Additive exPlanations (SHAP) method taken from the SHAP library (Lundberg and Lee, 2017). These are then combined to provide overall attribution to one of the four controls for AF predictions.
ConFire uses Bayesian inference to assess fire behaviour uncertainty by evaluating control strengths' impact on BA. Instead of a single output, it produces a probability distribution based on data in a simplified fire model. Variables like weather and fuel moisture contribute simultaneously to the prediction of monthly BA. Monthly averages of daily values are aggregated using the Fogo Local Analisado pela Máxima Entropia (FLAME) system (Barbosa, 2024). Each control combines drivers using logistic functions. Bayesian inference optimises driver contributions and accounts for stochasticity, capturing fire unpredictability under similar conditions (Kelley et al., 2021). The mean logit-transformed BA distance with and without this term measures additional uncertainty. The model was trained, and it ran from 2014 to 2023 using driving datasets common across this period. Initially trained on 50 % of BA, it is then applied predictively to the full dataset. A separate evaluation is conducted, training on data from 2014 to 2018 and testing against 2019 to 2023, following the protocol employed by Barbosa (2024). See Sect. S1.2.2 for a detailed description and Sect. S2.2.1 for evaluation.
For both models, we include an estimate of uncertainty. ConFire is designed as an uncertainty quantification model, providing BA probabilities and their likelihoods for each region. Results in this report are based on 5 %–95 % confidence intervals or likelihoods, supporting central (median) estimates. ConFire uses Bayesian inference to quantify how various factors impact fire occurrence, assuming that fuel increases BA, moisture decreases it, ignitions increase it, and suppression decreases it. The model trains on historical data to determine influence levels and accounts for uncertainties from fire stochasticity and unconsidered factors. Its probability distribution is a logit zero-inflated function, assessing changes in extreme fires even with small observed areas. ConFire manages uncertainties from unpredictable weather and vegetation responses. ConFire quantifies uncertainty estimates from different drivers by constraining them with observations and addresses structural uncertainties, such as missing explanatory variables and errors in mechanistic relationships. While it represents one relationship of control to BA, the probability distribution accounts for uncertainty across various potential relationships. Noise is considered, with the stochasticity of burned area accounted for both in areas with no fire and in the probability of different potential levels of burning where fire does occur. We test ConFire's uncertainty quantification using Bayesian inference evaluation techniques. However, ConFire does not account for some uncertainties, such as potential changes in feedbacks between fire and vegetation when transitioning to a new fire regime out of sample. The model assumes the accuracy of one bias-corrected model for fuel load (JULES-ES), neglecting uncertainty from dynamic global vegetation models (DGVMs). While BA anomalies are used to reduce observational bias, any disagreements in bias across space or time are not included in ConFire's training.
Meanwhile, PoF outputs are provided in terms of probabilities calculated using ensemble predictions from weather forecasts each to generate a set of binary classifiers. The probabilities are therefore based on a wide parameter space, taking into account uncertainties in both the input parameters and the stochasticity of the classification algorithm itself.
3.2 Results
3.2.1 Predictability of focal events using fire weather forecasts
Canada
The early establishment of fire weather conditions as well as the late cessation of the fire season is well captured in the FWI reanalysis in Canada (Fig. 7). The FWI also captures the intermittent pattern of fire danger and its correlation to actual fire activity. However, at the seasonal timescale, the signal is weakened, and there were no prior indications that the upcoming season would have been as extreme as it was with respect to fire activity (Fig. 7). For the most part of 2023, Canada was in drought. The weather-limited nature of the Canadian fire season means that the FWI modelling framework serves as an essential indicator of anomalous conditions, acting as a prerequisite for the intensity and spread of fires. It provides valuable insights into the sequence and extent of extreme fire weather days during such events. Notably, in this region, peaks of fire activity correspond to peaks of landscape flammability, and there is a good correlation between observed fire activity and predicted fire danger.
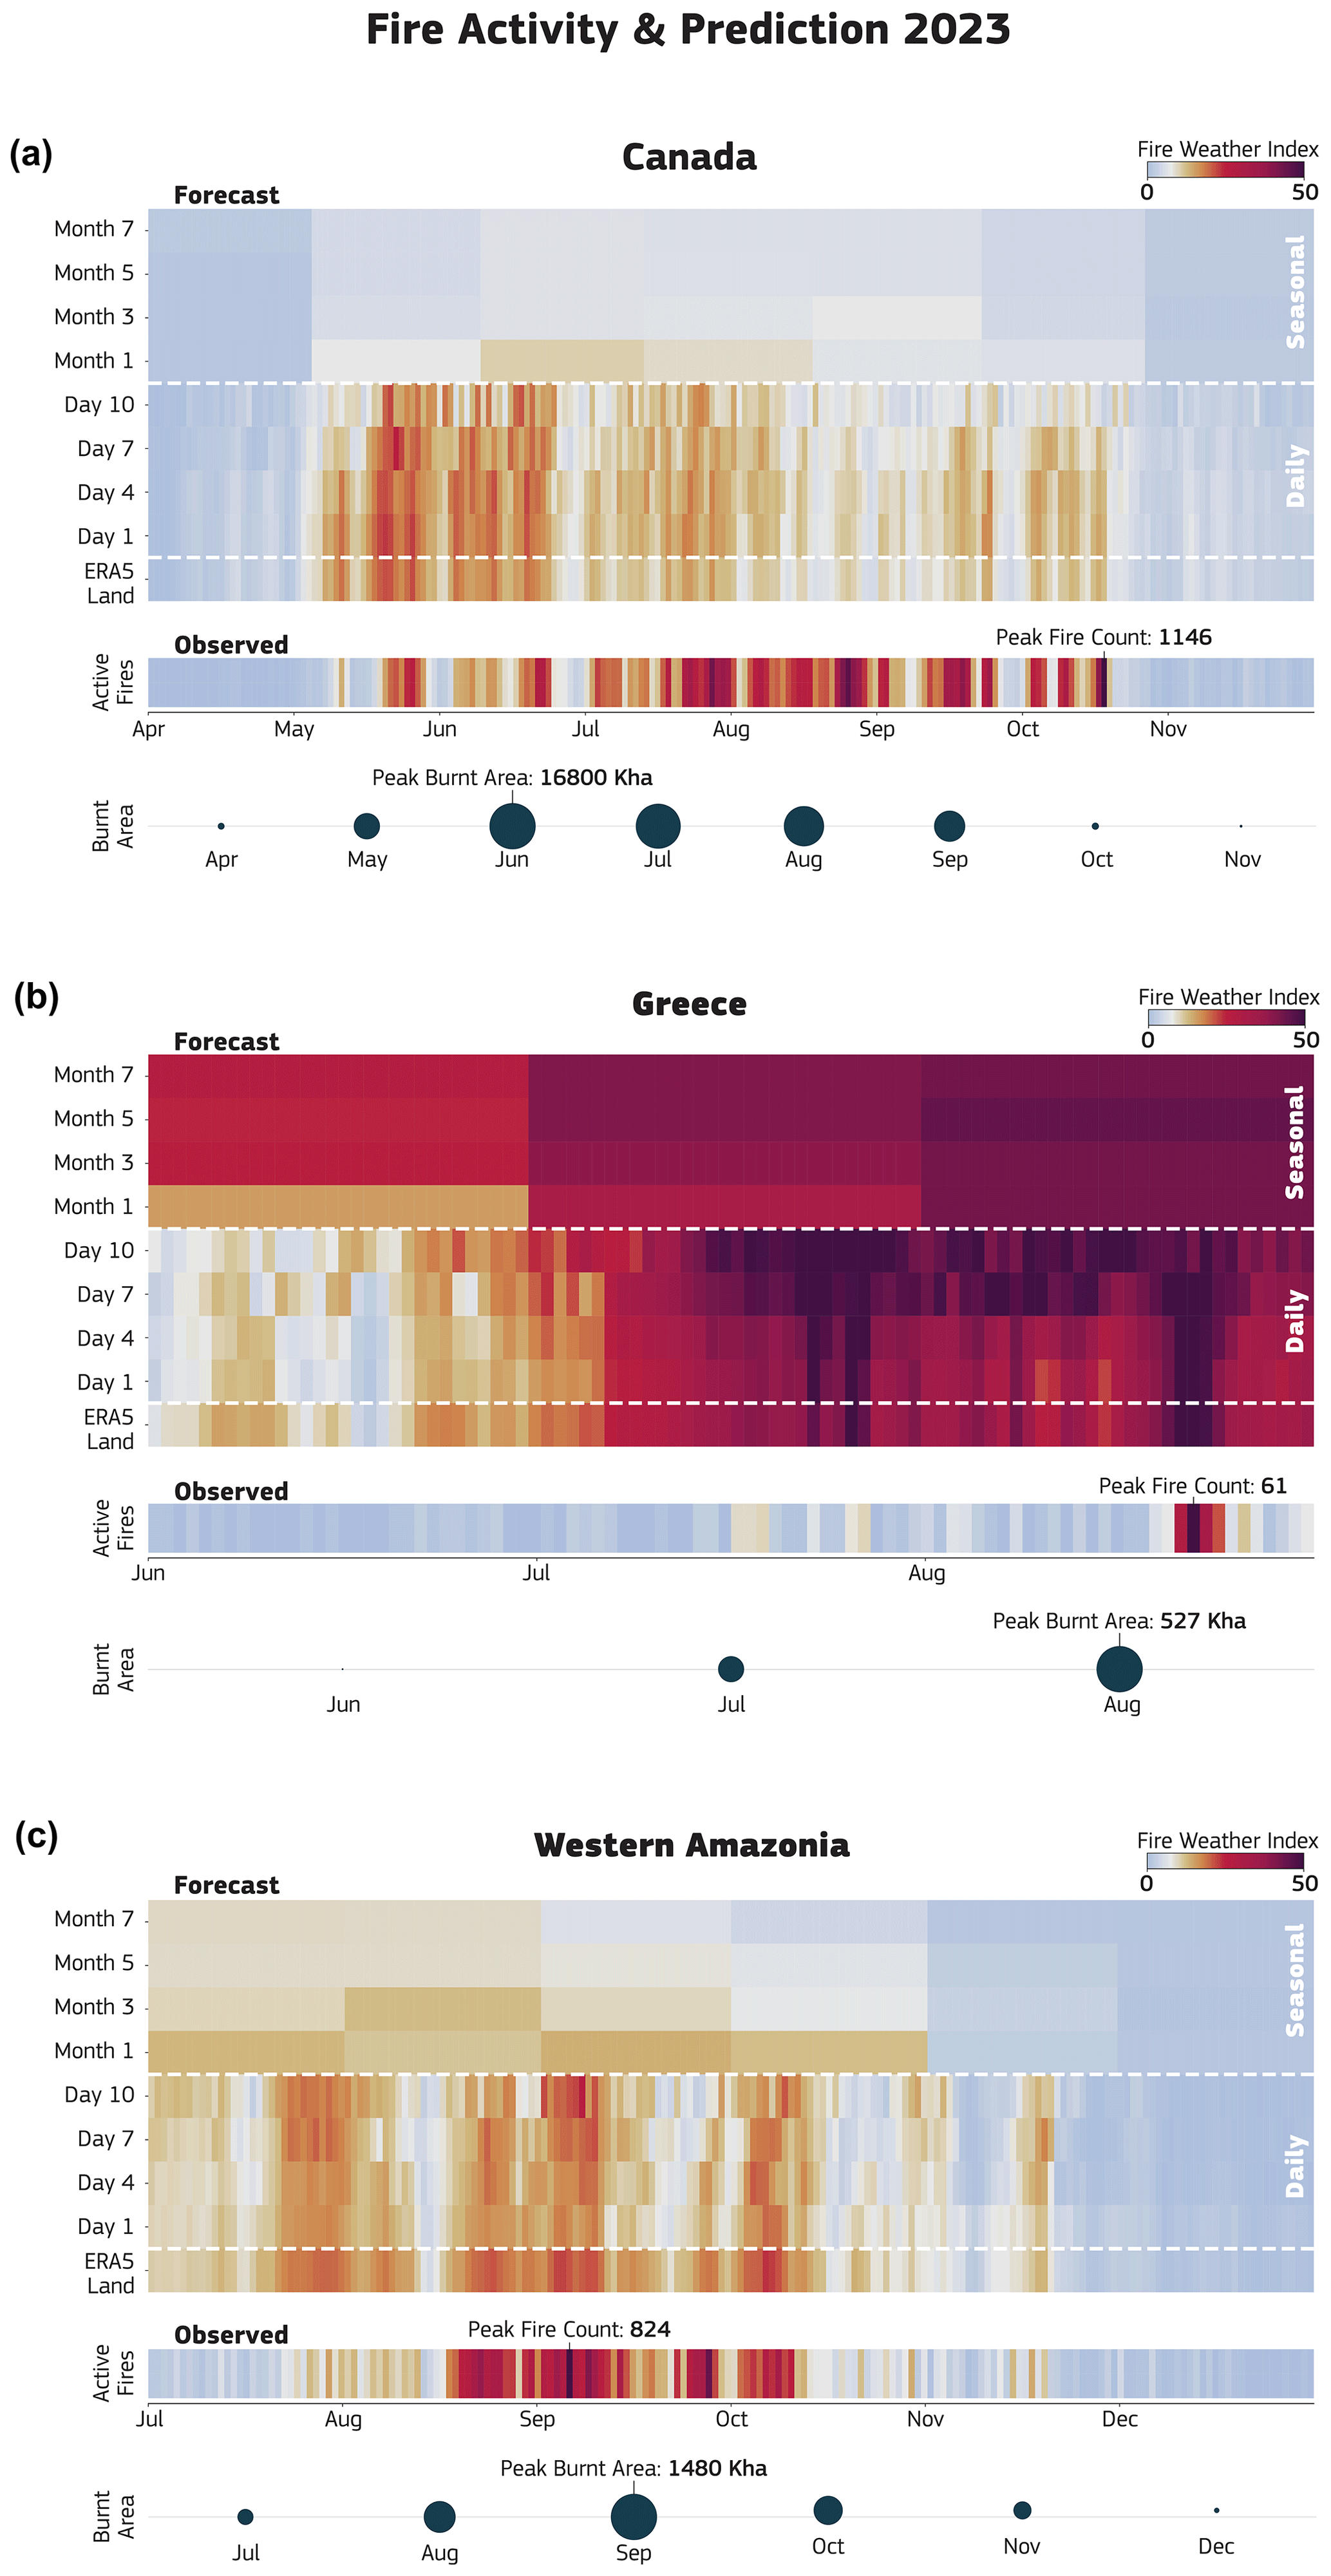
Figure 7Chicklet plots displaying seamless FWI predictions over time from various forecasting systems of the ECMWF (see Methods). The x axis corresponds to specific dates throughout the year, while the y axis denotes either observations or the time leading up to the date when a forecast was generated. The vertical colour coherence allows for quick identification of the time windows of predictability associated with the observed fire activity provided in terms of both the number of detected active fires in a day and the total burned area in a month (circles).
Greece
The establishment of fire-prone conditions in the Mediterranean, particularly in Greece, is part of the region's seasonal weather cycle (Fig. 7). In 2023, this pattern persisted, and extreme landscape flammability could be forecasted well in advance. In arid and semi-arid regions, fire occurrence is driven not solely by weather but also by fuel availability and its intermittent short-term drying. In these regions, the FWI often reaches extreme levels for much of the summer. However, fires do not always occur even when the FWI is extreme, as ignition and early suppression play a crucial role. The anomalous fire extent in Alexandroupolis, including the large Evros fire, highlights the limitations of relying solely on fire weather indices in these areas. There were no discernible indications in the FWI records that the particular day would be more extreme than the days before or afterwards, emphasising the need for a more holistic approach to fire risk assessment in regions where fuel is a limiting factor or live fuel moisture plays a crucial role in the extent of the fires (Di Giuseppe, 2023).
Western Amazonia
The correlation between the FWI and fire activity in the western Amazonia region at the shorter lead times is generally poor, primarily due to the strong dependency on either lightning or human ignitions (Kelley et al., 2021). In 2023, this pattern persisted (Fig. 7), with the onset of fire weather following the seasonal pattern well ahead of the time where fires were triggered. Seasonal predictions indicated high fire danger during the summer period, probably driven by El Niño conditions.
3.2.2 Identifying key drivers of focal events
Weather, fuel moisture, fuel abundance, and ignitions are the four primary controls identified as influencing the occurrence and intensity of the focal fire events. Anomalies in individual drivers of these controls, such as temperature or soil moisture, are calculated by comparing regional daily 2023 averages with the average for 2003–2022. Dead fuel, with its lower moisture content and higher combustibility, often plays a significant role in determining fire ignition. During extreme events, it is the dry live fuel that burns, contributing to the overall severity and intensity of the fire.
Analysing the time series of key drivers contextualises the conditions under which events occurred (see Fig. 8). However, leveraging the PoF and ConFire models allows for a statistical causality attribution of the four controls for observed fire occurrence (see Fig. 9). These models will provide control attribution even if no fire event is recorded, with a low probability across all controls indicating an accurate prediction. High fire probability without recorded fire activity could indicate successful suppression or fire-prevention policies. Unaccounted human influence is categorised under “Other”, encompassing variables not forecasted by the models. This analysis enhances our understanding of fire activity controls and helps identify missing information that degrades the quality of the prediction.
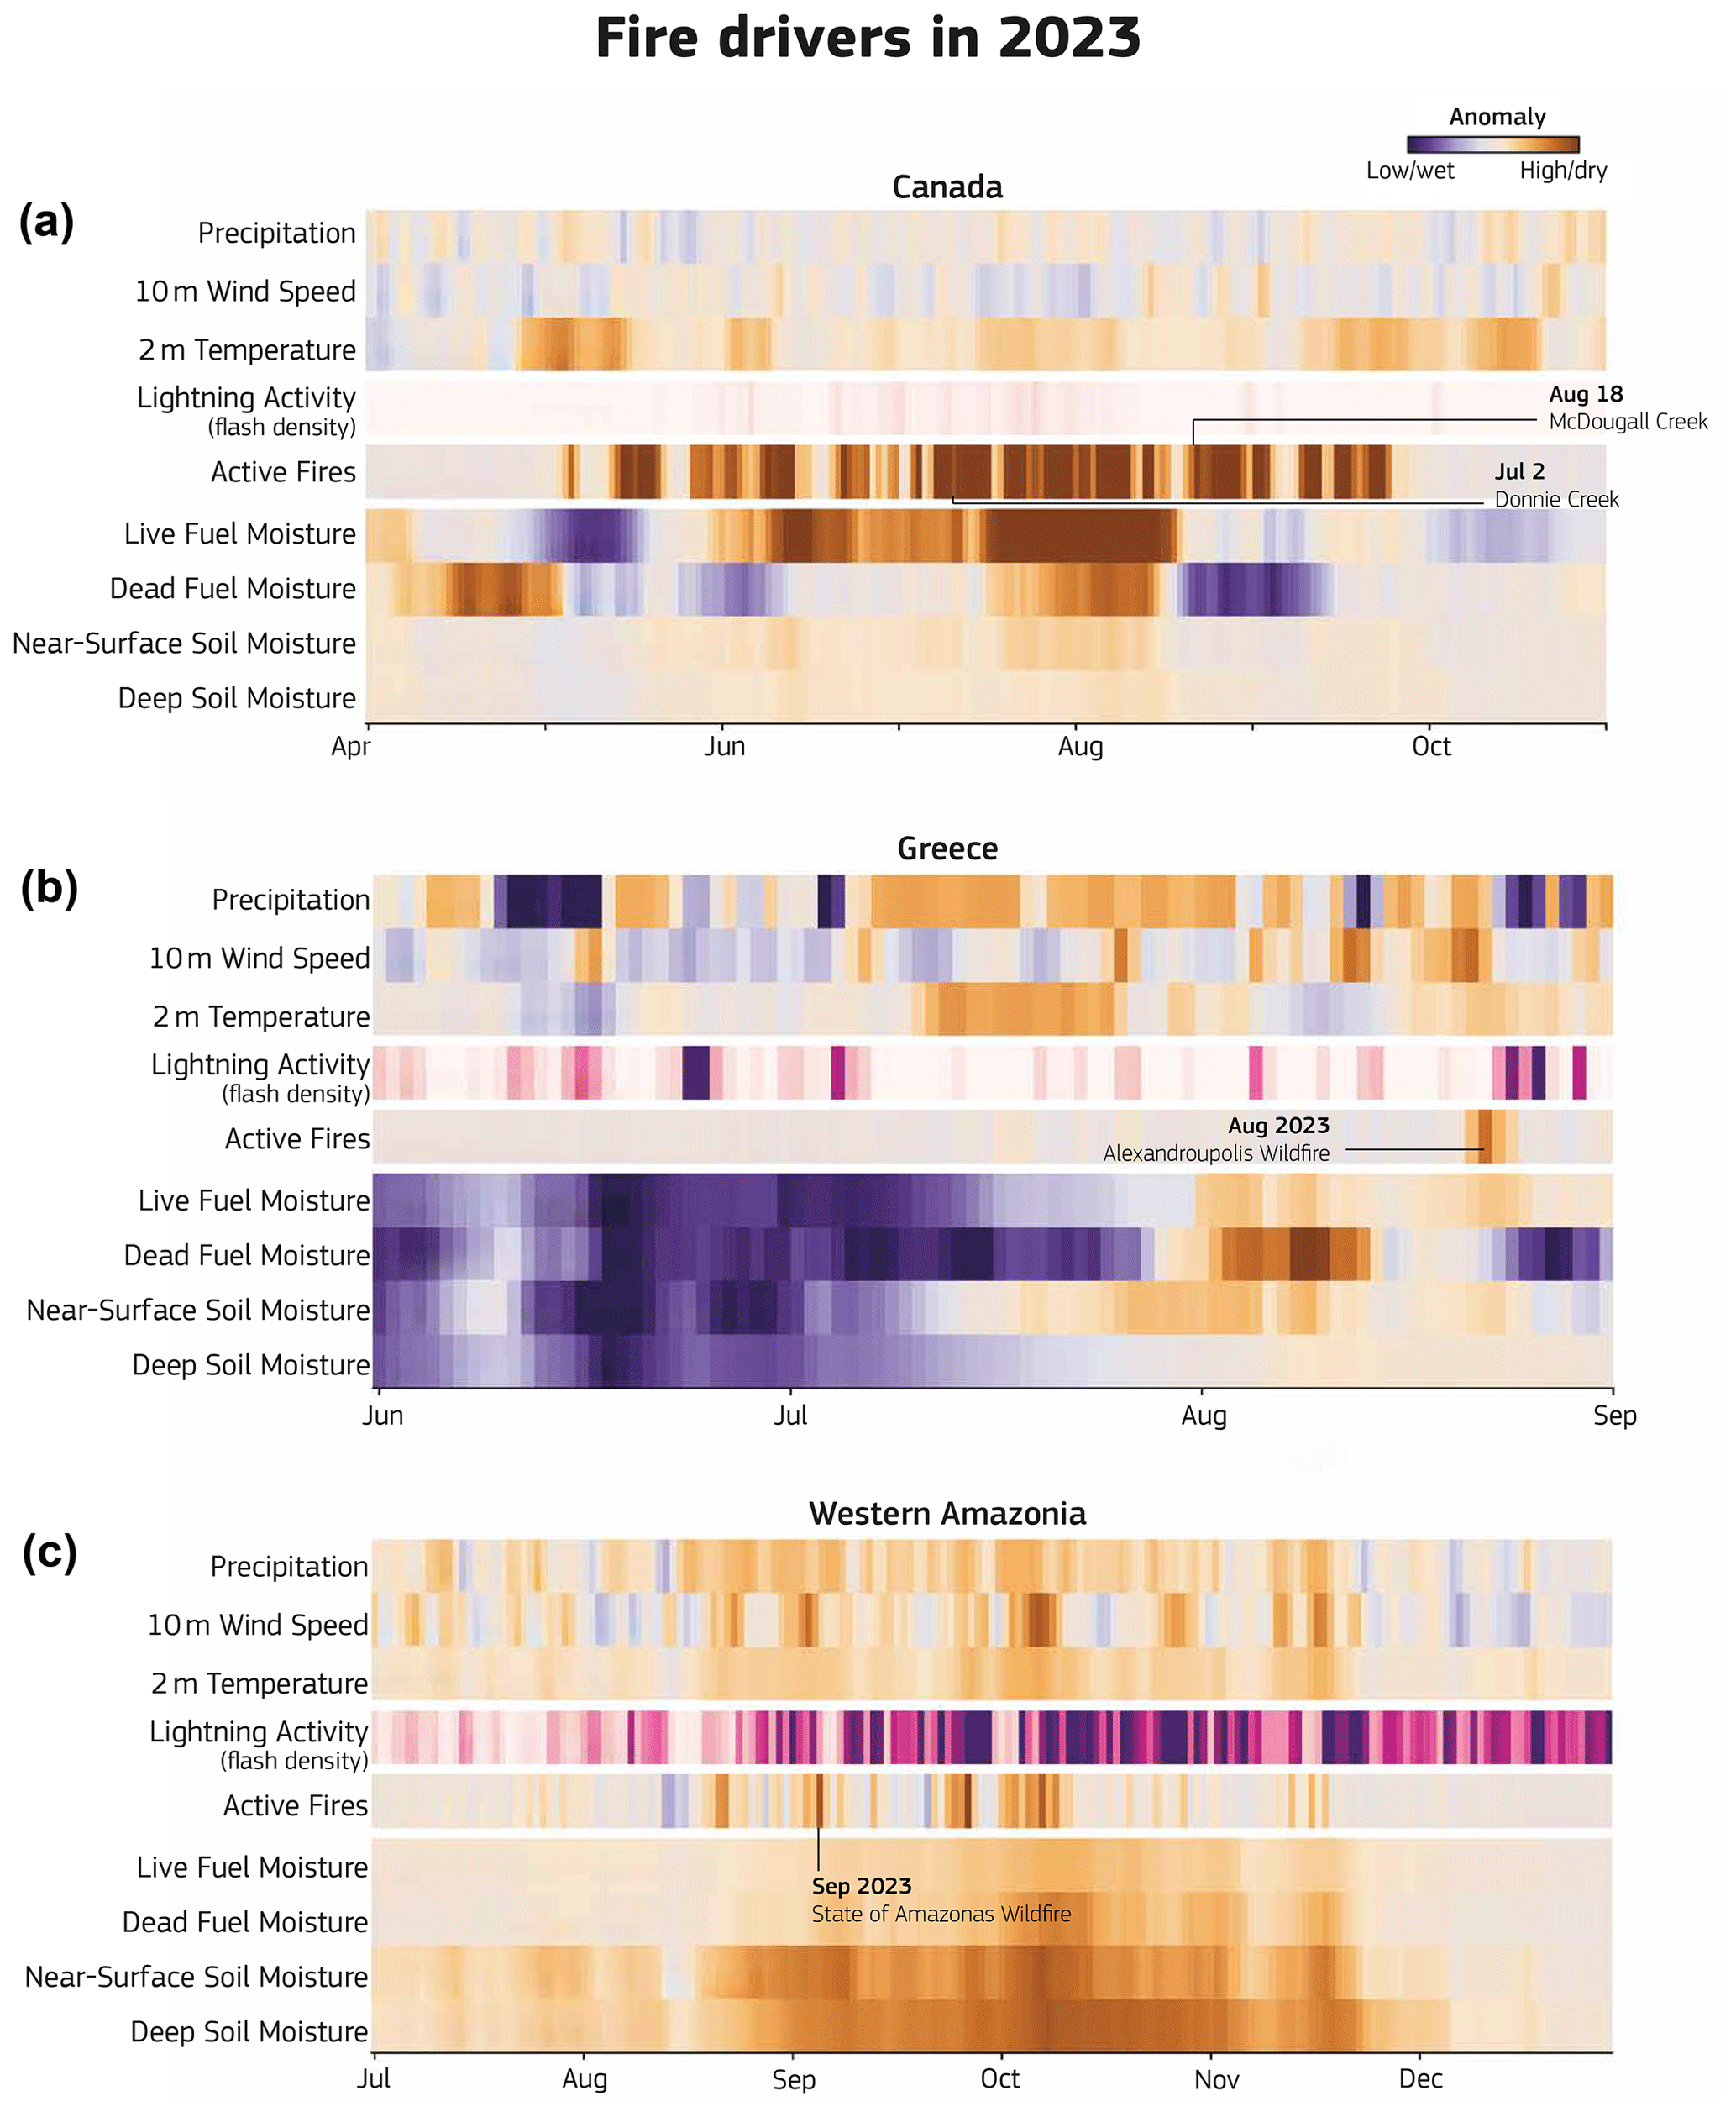
Figure 8Anomaly driver stripes for the three focal events. The drivers are selected to contextualise the conditions under which the examined events took place. All values are expressed as anomalies compared to the 2003–2021 climatology with the exception of lighting activity, which is expressed as absolute flash density.
3.2.3 Drivers of active fire extremes
Canada
Persistent fire-favourable weather conditions played a crucial role in controlling the extent of active fires in Canada during the summer of 2023. Dry weather contributed to extensive drying of both live and dead vegetation, further exacerbating fire risk (Figs. 8, 13). Most of the explainability of the Canada event comes from anomalous weather conditions. Increased lightning activity often coincides with or precedes significant fire periods, indicating lightning as a key source of ignitions in the region given the contribution of the cloud-to-ground flashes to the total predicted lightning activity. This is in agreement with the attribution of 59 % of wildfires and 93 % of total BA to lightning ignition sources in Canada during 2023 (Jain et al., 2024). Adverse weather conditions in mid-May in western Canada were identified as influential factors in shaping fire events. However, multiple instances of intense burning events, notably in mid-July, early August, and late September, fall into the “Other” category, heavily contributing to the total number of events for which there is no attribution among the controls. The fact that clusters of events were not predicted suggests potential inadequacies in accounting for some ignition sources or accurately representing fire propagation across these landscapes.
Greece
The driver anomalies (Fig. 8) and control attribution (Fig. 9) did not suggest an abnormally fire-prone year in Greece, failing to explain the large fire extent around the time of the Evros fire near Alexandroupolis. An anomalously wet spring may have led to increased foliage and subsequently quick drying of plant material. A sustained dry period in late July and August further dried out new foliage, creating favourable conditions for fire activity, as indicated by the anomalously dry live and dead fuel moisture content in August. Despite these conditions, the unexpected extent and severity of fires around Alexandroupolis were not predicted, highlighting the intrinsic difficulties in forecasting isolated extreme events even when most predictors are included. Additionally, the high wind speeds at the time partially contributed to the extensive BA during the fire.
Western Amazonia
Prolonged drought conditions driven by a positive ENSO (Aragão et al., 2007; Jiménez-Muñoz et al., 2016), stemming from anomalously low rainfall and high temperatures, created favourable conditions for an active fire season in western Amazonia (Figs. 8, 9). These conditions had a significant impact on the typically wet ecosystem, affecting soil moisture as well as live and dead fuel moisture. Despite weather conditions serving as a persistent control for fire activity, several intense active fire periods in late August and throughout September were not predicted, possibly due to unrepresented ignition sources. Additionally, fire activity from September onwards was intensified by intense lightning activity, characteristic of the region, which substantially contributed to ignitions.
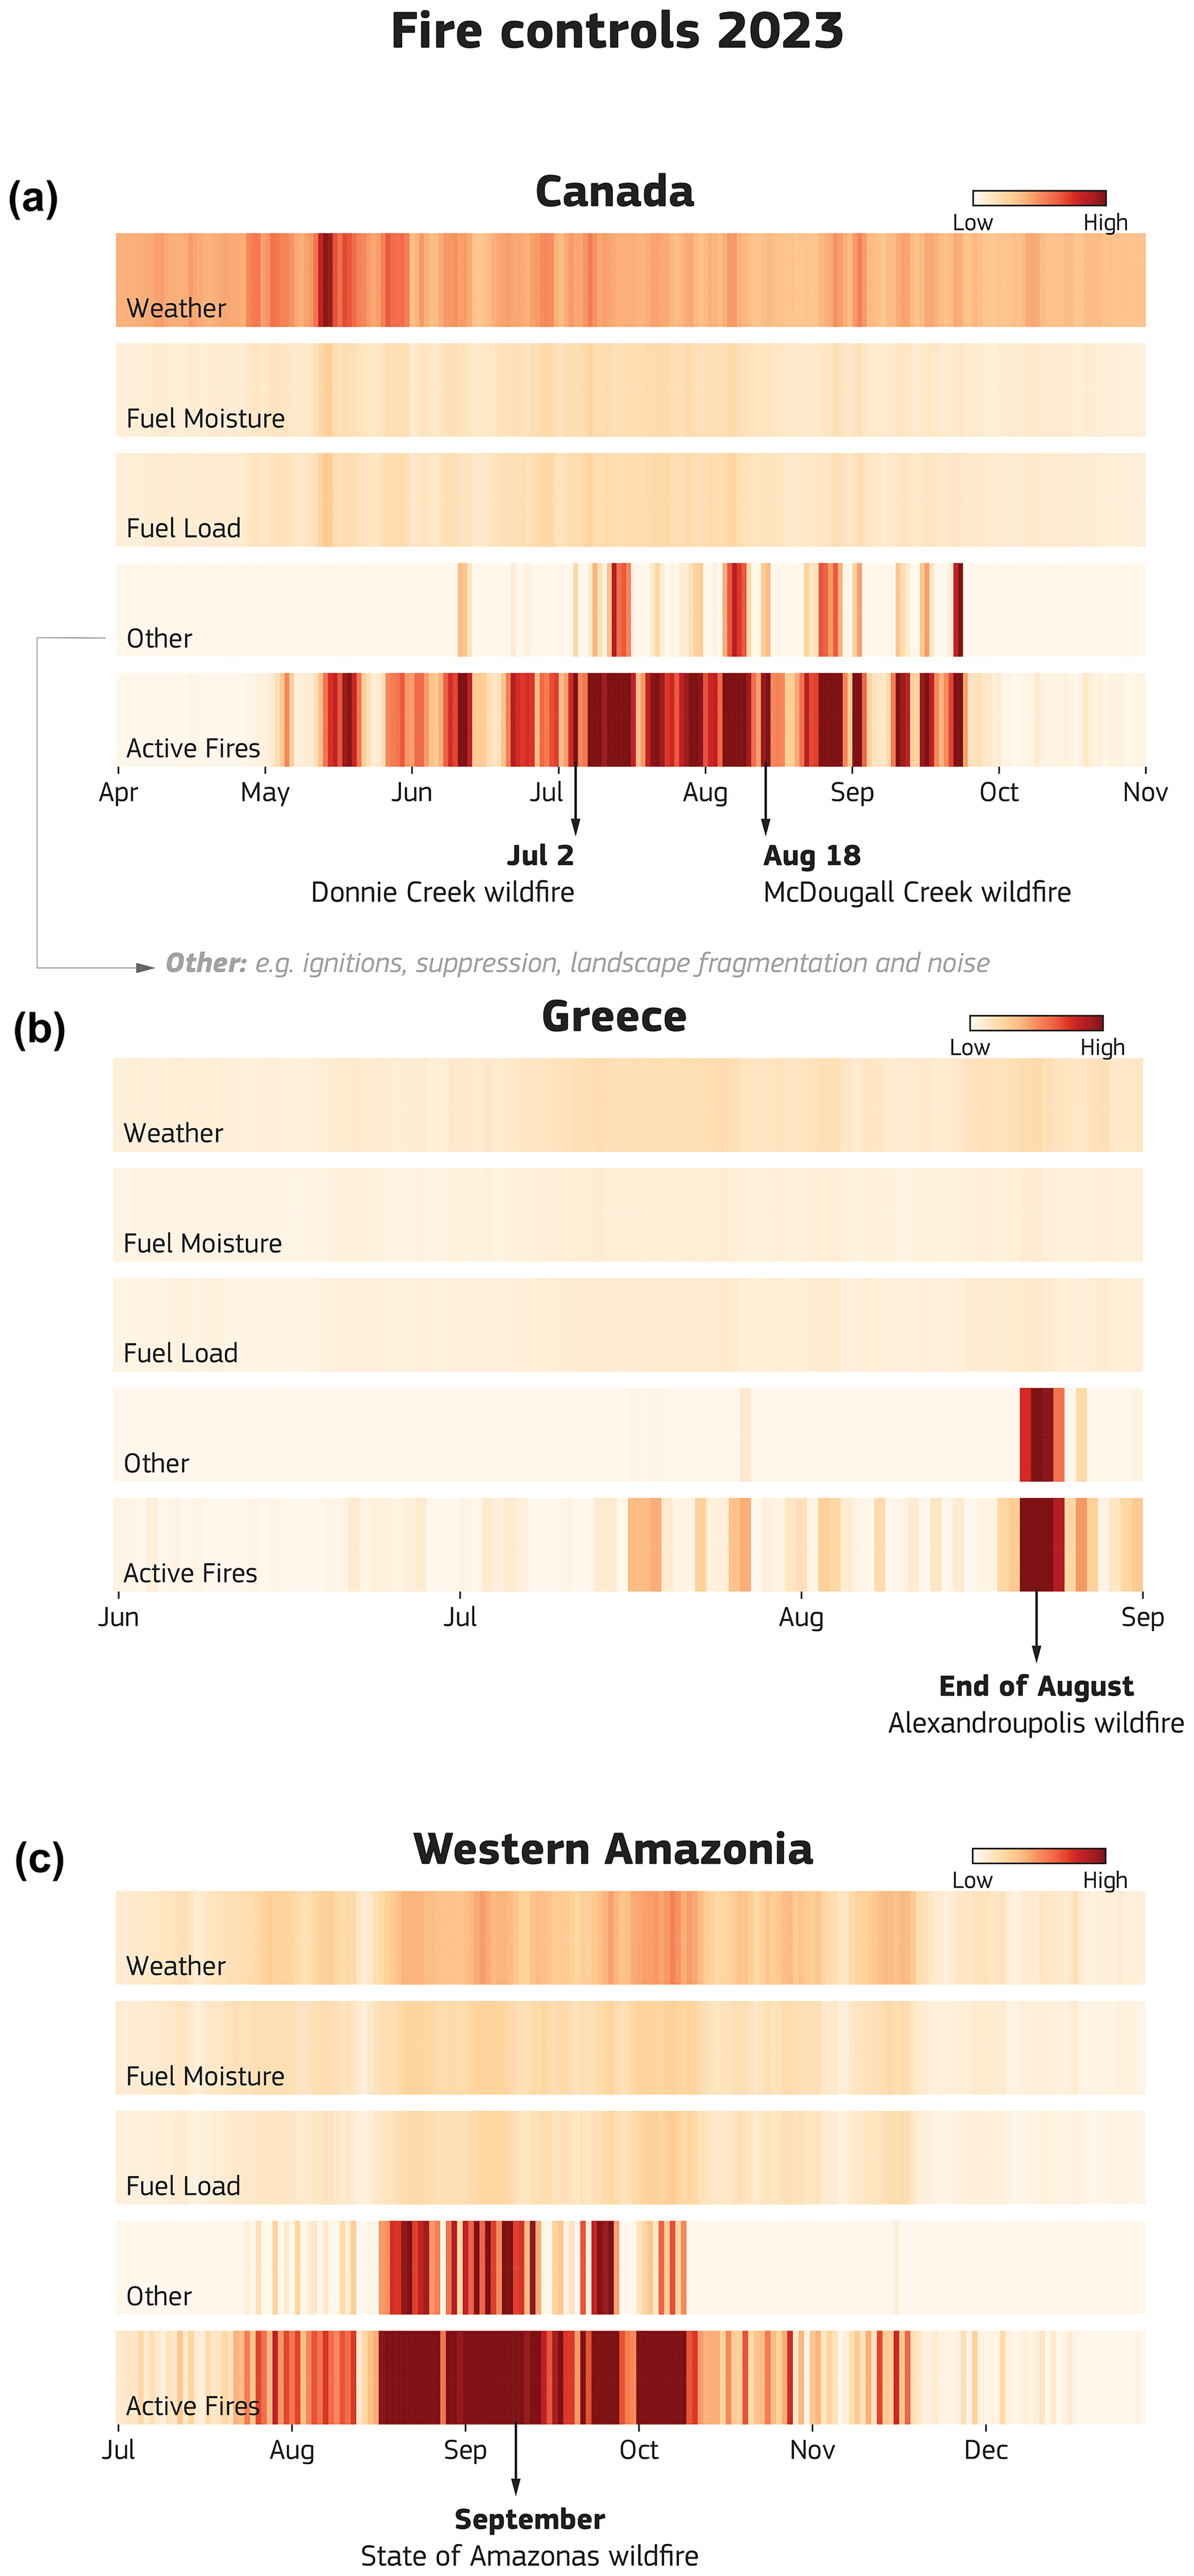
Figure 9Contributions of different fire controls to daily active fire anomalies in our focal events. All values are scaled to the observed daily fire anomaly such that the sum of the four daily control values matches the total observed anomaly (see Table S1).
3.2.4 Drivers of regional burned area extremes
Canada
ConFire detected a significant anomaly in BA starting in late April, as seen in the observations (Fig. S9) with very high confidence between May (99.2 % likelihood) and June 2023 (> 99.9 % likelihood; Fig. 10). While less confident in a positive anomaly in September and August (71 % likelihood), ConFire detects the possibility of much higher burning in August and September, corresponding with the increase in burning in the western Taiga Shield (Fig. S9). Figure 10 shows the controls that contribute to these anomalies. Our analysis indicates a > 99.9 % likelihood that elevated fire weather conditions persisting throughout the 2023 fire season led to a notable increase in burning, explaining 19 [4.6–45] % of the BA anomaly in May and 13 [1–110] % in June (median estimates, with 5th–95th percentile range in square brackets). Anomalous weather conditions subsided in May through the early summer, though by September there was an increased likelihood of contributing to the increase in BA anomaly seen in the late fire season. Drier fuel conditions could have contributed significantly to the increase in BA (up to 65 % of the BA anomaly in May and 45 % in June), though with low confidence (60.5 % in May and 61.3 % in June), and wetter fuels exerting a suppressive effect on fire spread was also possible, suggesting their potential role in mitigating fire severity. A small but confident suppressive effect (100 % likelihood in May, 64.8 % likelihood in June) from fuel load was observed, reducing relative increases in BA by 1.4 [0.17–7.1] % in May. Direct human-induced landscape changes exhibited a small impact on the extent of burned areas (likelihood of 97.4 % in May), explaining between 5.4 [1.2–22] % of the anomaly in BA in May and 5.2 [0.6–24] % in June.
Greece
The analysis reveals an anomalously high BA, particularly from mid-August onwards, though with a lower confidence level compared to the Canadian case (69.9 % likelihood; Fig. 10). Figure 10 shows the controls that contribute to these anomalies. With very high confidence, our findings demonstrate the presence of anomalously high fire weather conditions during the 2023 fire season in Greece (98.3 % in July and > 99.9 % in August and September). In August, these conditions explained 24 [4.3–140] % of the increased BA, increasing to 34 [5.6–170] % by September. Assessing the impact of fuel moisture on BA, our analysis shows a wide range of possibilities, with confidence ranging from a 21 % increase to a 180 % decrease in relative BA extent, which would have offset some of the increases from fire weather. This uncertainty underscores the complexity of the interactions between fuel moisture and fire behaviour in Greece. Although direct human-induced landscape changes exerted greater influence on BA extent in Greece than in the other focal regions, this influence remained small compared with weather factors. The analysis indicates a slightly higher-than-normal fuel load, with only a low likelihood of having a substantial influence on increased levels of burning.
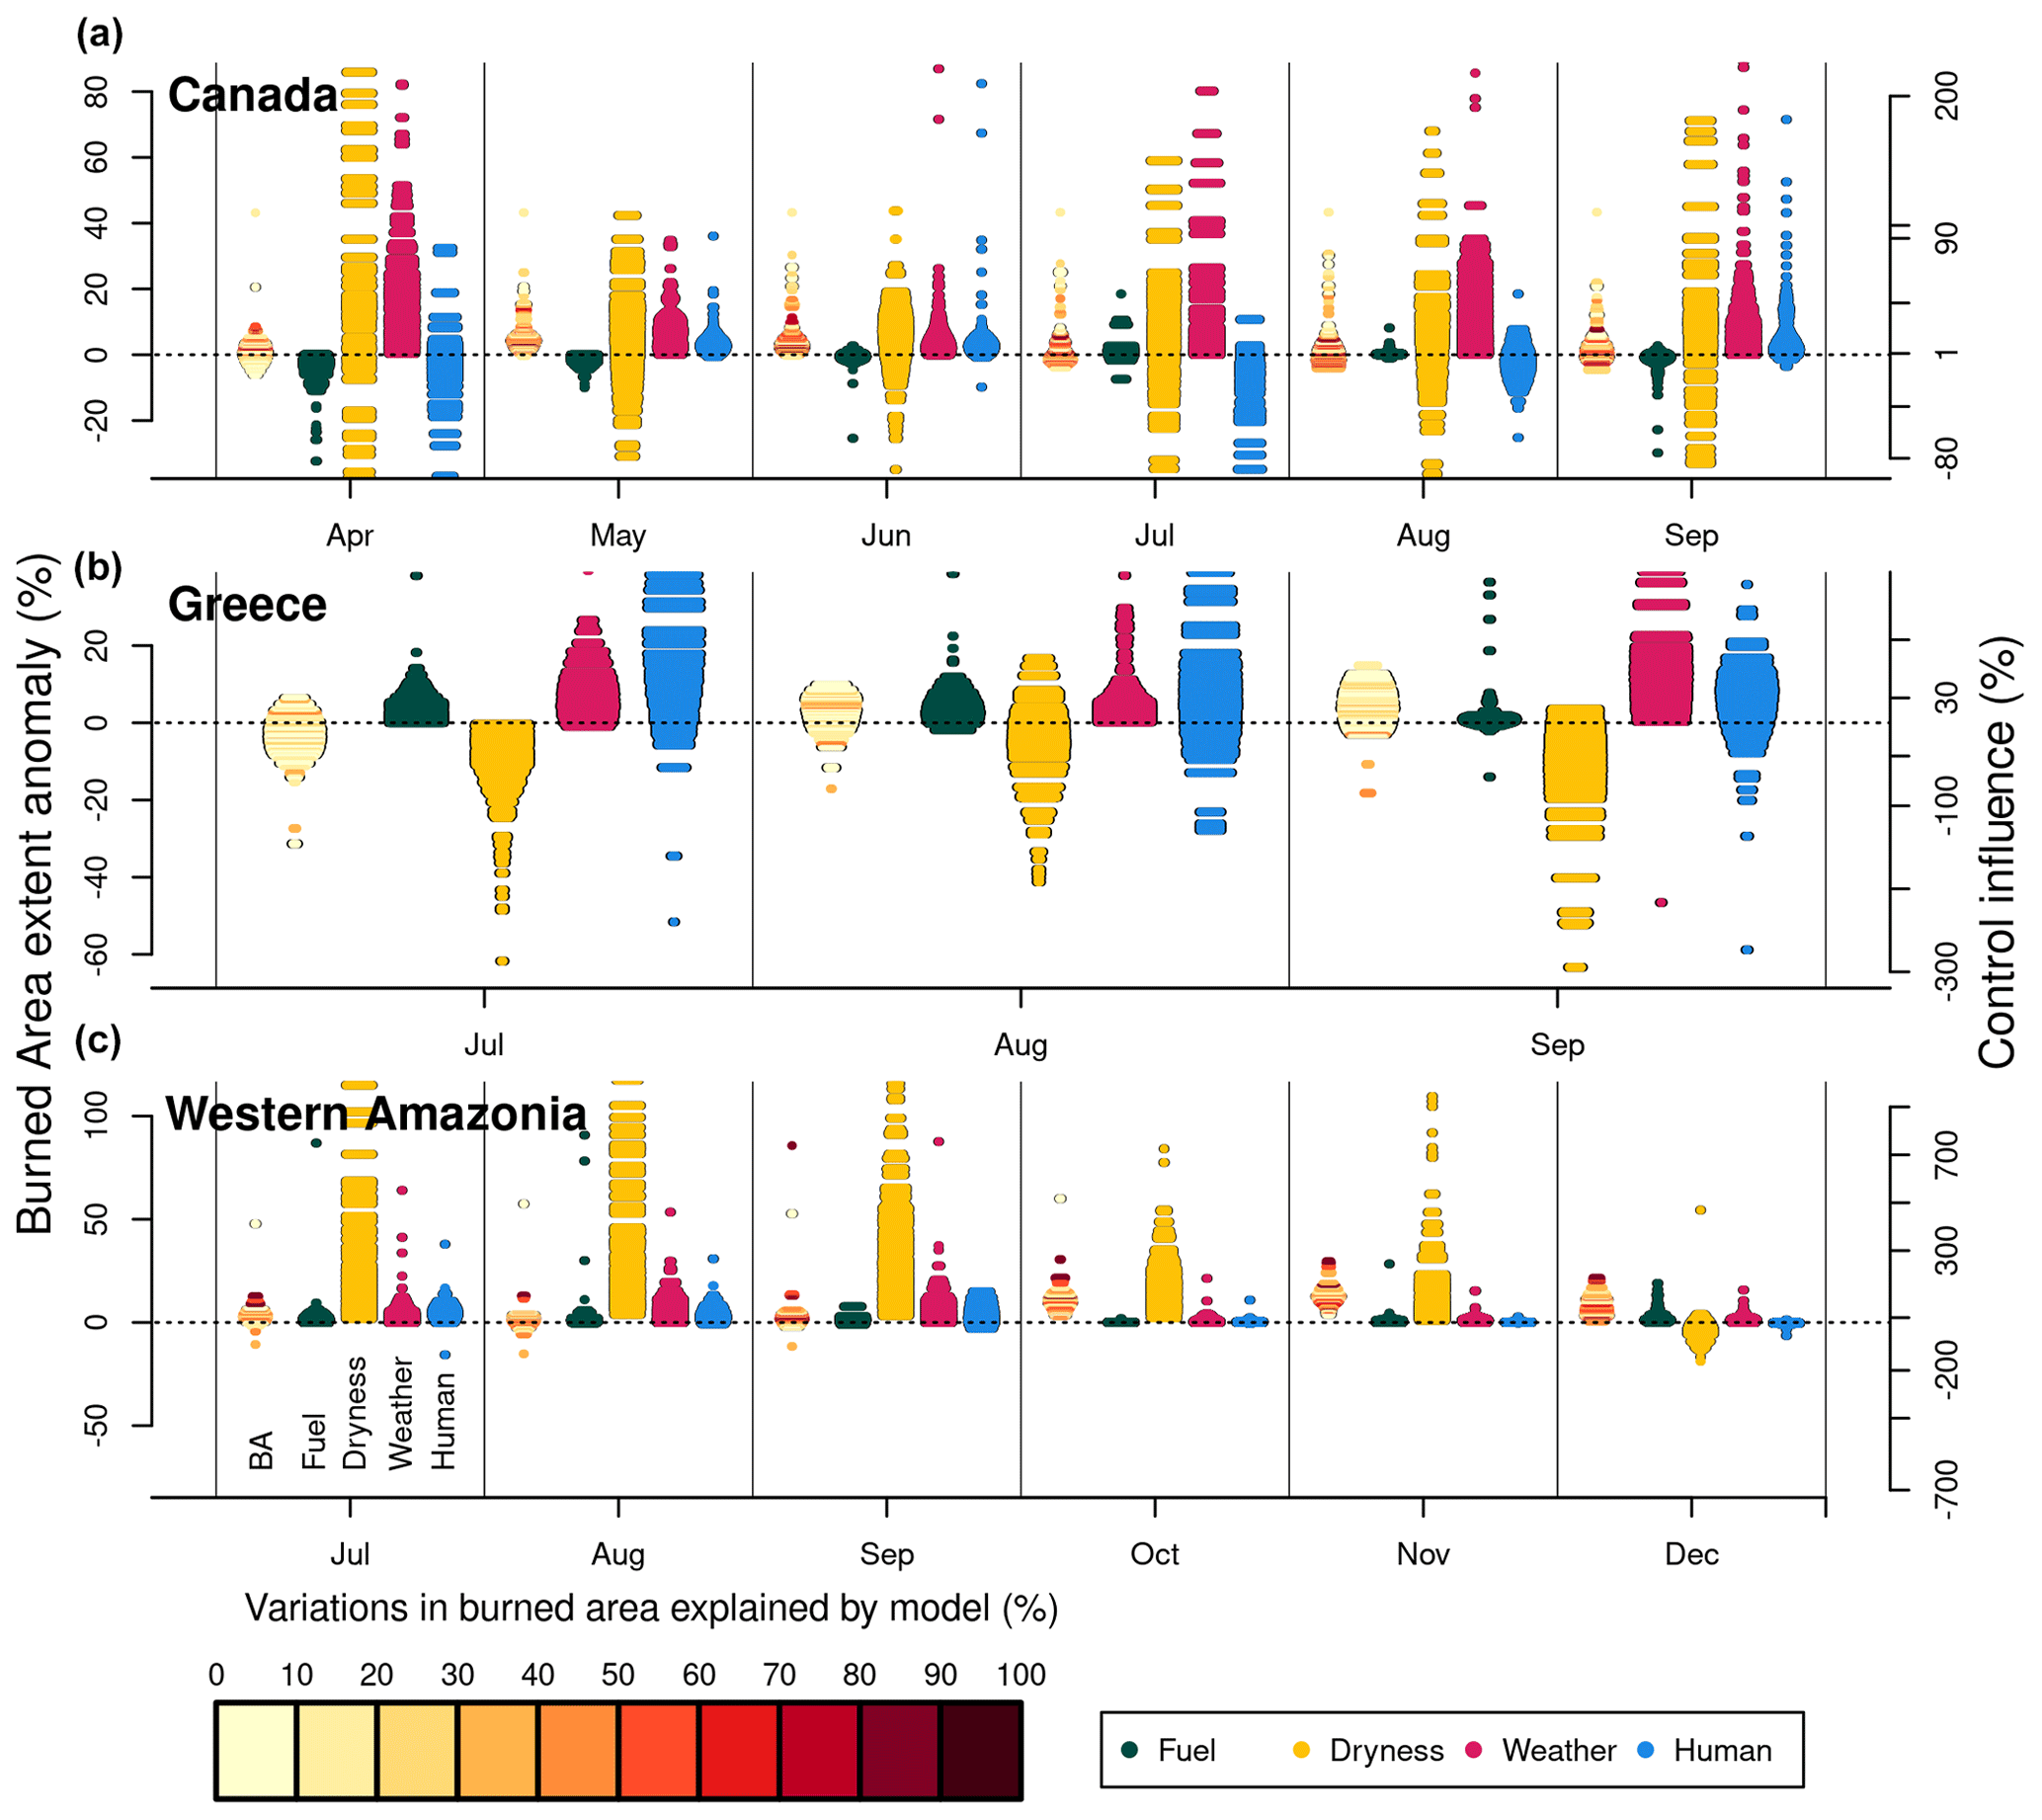
Figure 10The influence of fuel load, fuel dryness, fire weather, and human controls on burned area (BA) anomalies in 2023 for each focal region (a–c). In each month, the first column shows the BA anomaly, with the colour indicating how well each model iteration captures variations in BA (see legend “Variations in burned area explained by the model”). The green, yellow, pink, and blue columns show the percentage of the anomaly explained by fuel load, fuel dryness, fire weather, and human influence, respectively, across the full distribution of model iterations. See also Table S3 in the Supplement.
Western Amazonia
Our analysis indicates a reasonably high confidence that the considered drivers contributed to anomalous high burning during September (73.8 % likelihood), October (94.9 % likelihood), and November (96.1 % likelihood; Fig. 10). Figure 10 shows the controls that contribute to these anomalies. The primary driver of the observed BA anomaly appears to be dry fuel conditions, with a very high likelihood (99.7 %) of drier-than-normal conditions persisting through November. This led to a substantial increase in BA, explaining at least 57 % of the increase in BA. While fire weather conditions were also elevated (likelihood > 99.9 %), their impact on BA was comparatively lower, resulting in at least 2 % increase in BA during October and November, though with a small probability of contributing much more. Direct human influence was identified as a contributing factor, with a high likelihood (92.9 % in September, 94.5 % in October) of increasing burned area. However, the magnitude of this influence was approximately one-tenth of that attributed to fuel dryness. There is little confidence in the direction of the effect on BA anomaly, with potential influences ranging from a slight suppressive effect (26.5 % likelihood) to potentially explaining the majority of the increased BA in September to virtually no impact in October. This suggests that fuel dynamics played a minor role in driving the observed fire activity. The analysis reveals a higher confidence in the simulations indicating positive anomalies, indicating a robust signal in the attribution of drivers to observed BA anomalies.
3.2.5 Spatial variation in drivers of burned area extremes
Canada
In Canada, most BA anomalies were linked to widespread high fire weather, with 95 % of the country being influenced by higher-than-normal fire weather (Fig. S12). There was a tendency for fuels to dry out, although this was not as widespread. Fuel load anomalies were more scattered, but areas of low fuel anomaly did correspond to some boundaries in fire extremes (Figs. 11, S12). Increased human influence may have had some influence at suppressing fires, but this is not significant, and in some places, the model indicates a small possibility of increased fire from human activity. In the eastern Taiga Shield, fire extremes in some areas were driven by high fire weather and dry fuel, compounded with more vegetation cover and hence higher-than-normal fuel load in some places (Fig. 11). However, the borders of extreme fires corresponded to a suppressive effect from decreased fuel load. In the western Taiga Shield, dry fuel and high fire weather drove fire incidents, with high fire weather dominating in some areas. Increased suppression may have had some influence at suppressing fires, but this is not significant, and in some places, the model indicates a small possibility of increased fire from human activity.
In June, there were high anomalous burned areas in Quebec's eastern Taiga Shield, which were divided into two major fire components with a slightly reduced BA in between (Fig. 11). Both components were associated with high fire weather, but in areas where high fire weather occurred without the contribution of other controls, it tended not to cause high levels of burning. The highest burned areas were mainly found in the northern component and were associated with anomalously low levels of moisture and high fire weather. Some cells with the very highest BA also showed anomalously high fuel load (Fig. 11). In a region further north, around 56–57° N, 72–80° W, there was high fuel load, dry conditions, and high fire weather, but fire in the area was found to be highly fuel-limited and largely insensitive to even large changes in controls (Kelley et al., 2019). The southern component of high burning corresponded with high fire weather and either fire fuel or high fuel load. Additionally, any boundaries between higher and normal/lower levels of BA also saw lower-than-average fuel loads, which may have inhibited fire spread (Fig. 11).
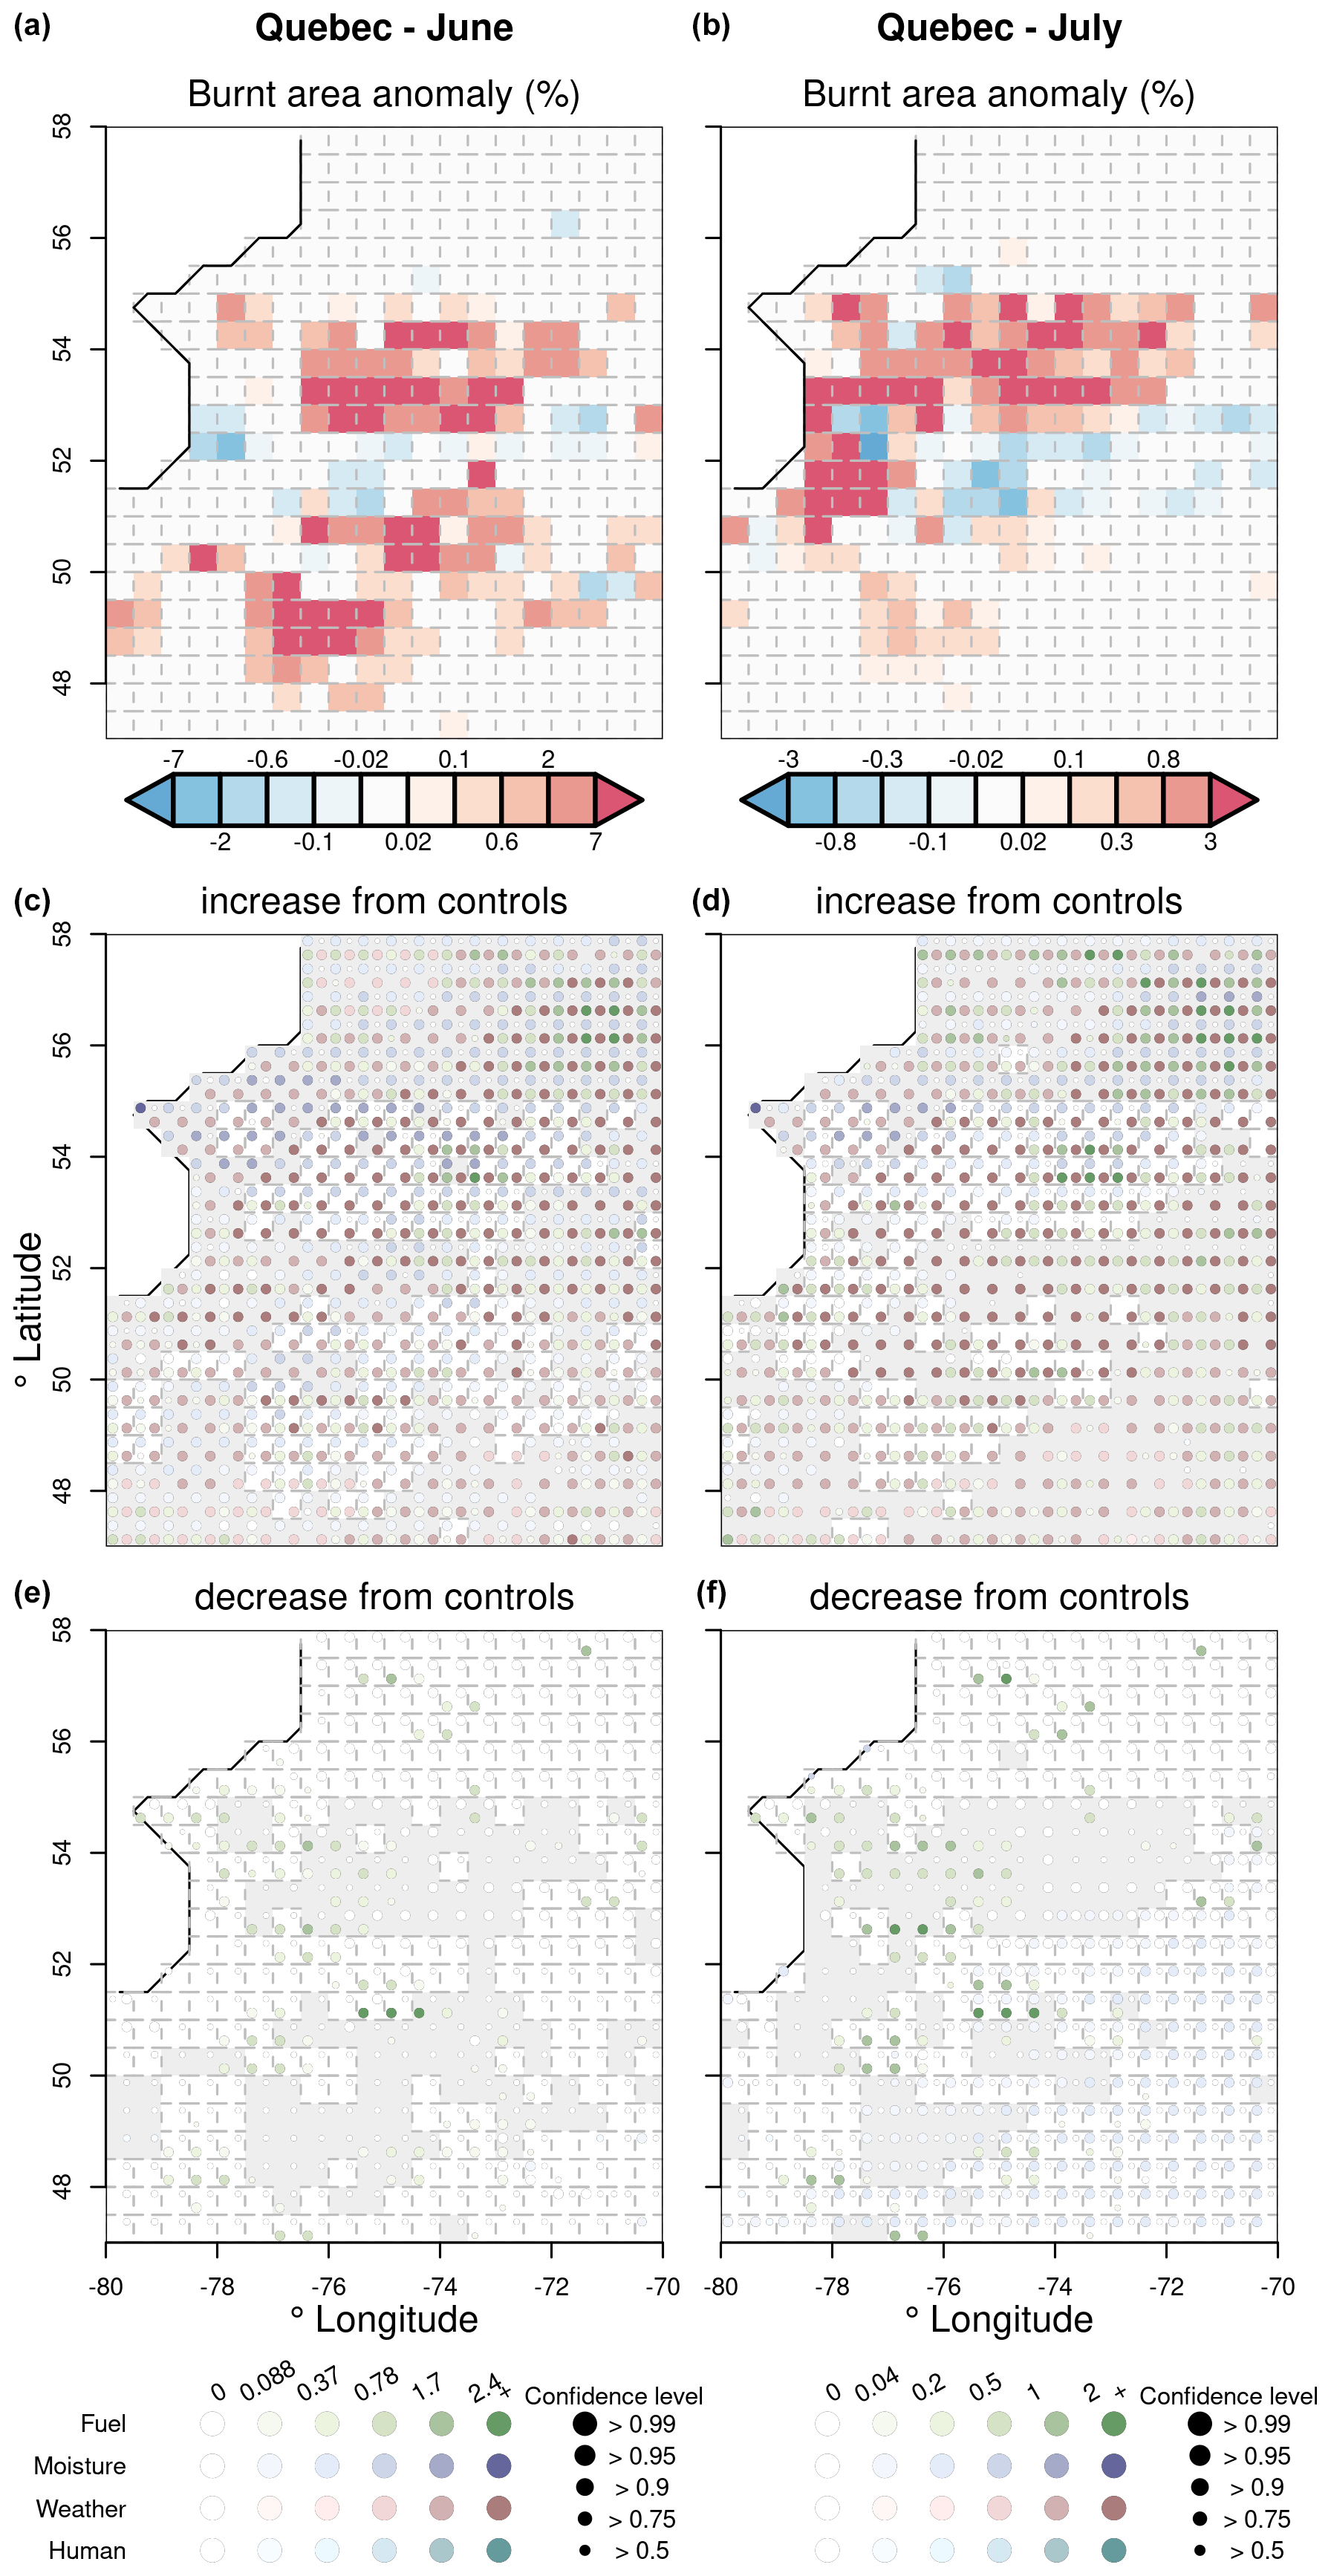
Figure 11Anomalies in controls during months and regions of high BA in Quebec. The top map of each region shows BA anomalies at 0.5° for that month in 2023 versus the 2014–2023 monthly average. The middle maps look at anomalies in controls that would cause higher BA, with areas not greyed out representing regions with greater than monthly average BA in 2023. The bottom map shows drivers that would have led to lower than normal levels of burning, with areas not greyed out showing lower or non-change from monthly average BA in 2023. Each grid cell has four points: green points show anomalies in fuel load, purple in fuel moisture, red in fire weather, and cyan in humans. This way, we can see if controls acted in unison to cause extreme levels of burning or prevent extreme fires from extending further. The shade of the point shows the most likely expected level of anomaly in that control, while the size shows how confident we are in the direction of the anomaly.
In May, the western Taiga Shield, Taiga Plains, and boreal plains experienced higher-than-normal fire weather across the region (Fig. S13). The increased burned areas in the west were due to extreme low fuel moisture and high fire weather, as well as higher fuel loads. In contrast, areas to the south experienced high fire weather without the extreme burned areas. Additionally, anomalies in fuel loads and burning levels became more evident in September, with some areas displaying lower-than-average fuel and burning (Fig. S13). These anomalies persisted, with regions still experiencing high fire weather and variations in fuel moisture levels. Furthermore, the eastern areas with higher fire weather also showed higher fuel loads, while drier fuel moisture was observed in less extreme regions to the east. Additionally, specific locations saw higher fire weather and above-average fuel moisture, while areas just north of the extreme fires experienced wetter-than-normal fuel moisture (Fig. S13).
Greece
Interestingly, most of Greece showed a tendency towards less suppression from people (Fig. S12). However, the dominant driver over most (73 %) of Greece was high fire weather, with some areas in central Greece showing notably low fire weather. These areas do not correspond to a fire anomaly, though higher fuel loads were detected. Except for central Greece, other areas of lower-than-average BA correspond to lower-than-average fuel loads (Fig. 12). There was no significant anomaly in fuel moisture across Greece, though the northeastern fire extreme does correspond to a joint increase in fire weather and decrease in fuel moisture. Extremes in eastern coastal Greece correspond to anomalies in fuel load, fuel dryness, and heightened fire weather (Fig. 12).
In August, northern Greece experienced high fire weather and low fuel moisture, particularly around Alexandroupolis in Macedonia and Thrace (Fig. 12). The region extended further east, experiencing extreme fires that reached into central Macedonia. Unlike Canada, the framework in north Greece did not show the same level of detail in the boundaries around extreme levels of burning. However, the transition to less burning in the south of west Macedonia did correspond to reduced fuel load. Areas around Athens and central Greece that saw unusually high levels of burning also experienced decreased fuel moisture and increased fuel load (Fig. 12). In contrast, areas in southern Thessaly and central Greece that did not experience highly burned areas saw lower-than-normal fire weather. In the Peloponnese region, there was either high fire weather or reduced fuel moisture, but these conditions rarely occurred together, which might explain the lack of increased BA throughout the region (Fig. 12).
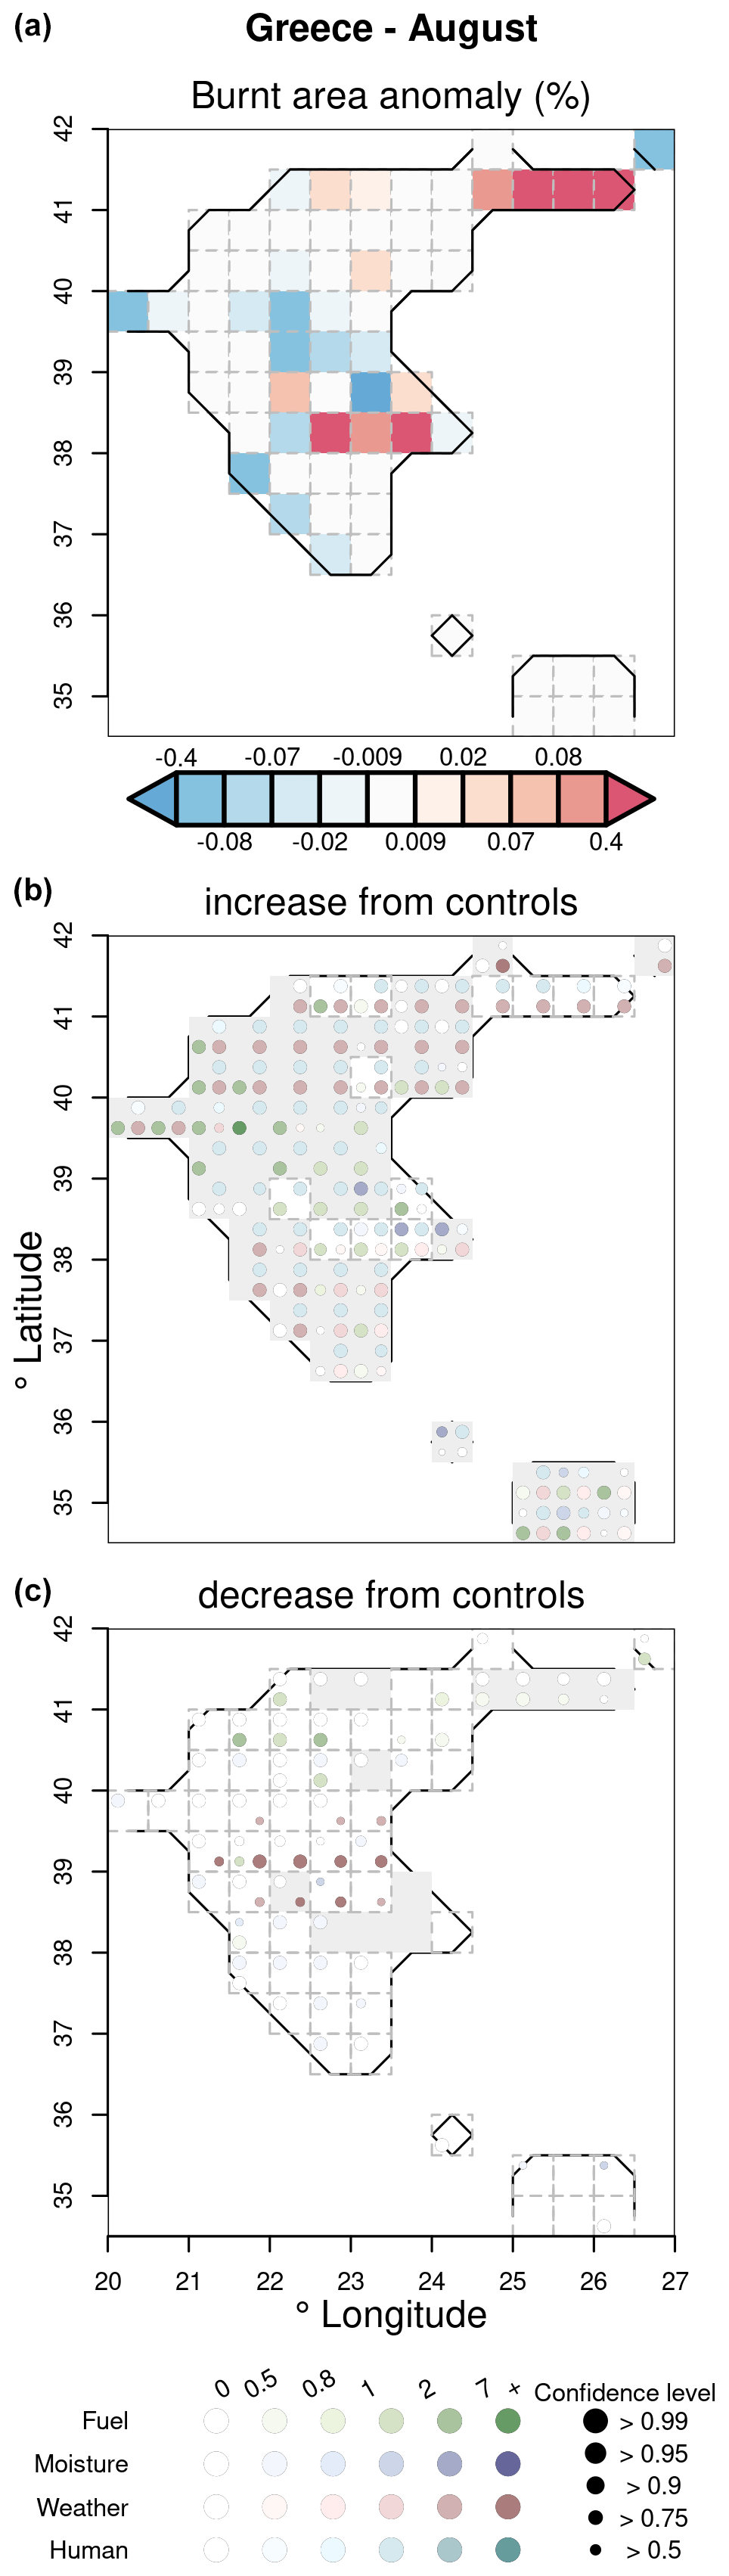
Figure 12Same as Fig. 11 but for Greece.
Western Amazonia
High fire weather anomalies were almost universal across our western Amazonia region (Fig. S12). However, anomalies in other controls varied widely across the region, which appears to modulate the occurrence of areas with above-average BA (Figs. S12, S14). In September, the regions of high burning in the western Amazon all exhibited higher-than-average fire weather, with the highest BA anomalies associated with the highest fire weathers. The areas with the highest BA anomalies along the Amazon River were located around Manaus and also showed lower-than-average fuel moisture and higher-than-average fuel load. The very highest pixels exhibited the anomaly in increased fuel loads. In the southern and central part of the region (65 to 62° west, 7/8° south), near Porto Velho, BA anomalies were associated with extremely high fire weather and higher fuel loads. The areas of highest burning also showed an increase in human-driven burning. Further east (59° west, 7° south), the highest fire weather and decreased fuel moisture occurred alongside higher burning. Areas of higher BA in the north (63° west, 0° north) were associated with extreme fire weather, though they were offset by below-average fuel loads. This may explain why they were not as extreme as the fires around Manaus, though the area is not generally considered fuel-limited (Kelley et al., 2019), and fuel had little overall impact across the region Fig. 10).
4.1 Methods
Many of the direct drivers and controls on fire events, outlined in the Sect. 3 (e.g. weather, fuel, moisture, ignition and suppression), are influenced by global change factors such as climate and land-use change. Since the pre-industrial era, global mean temperature has increased by between 1.1–1.3 °C (Betts et al., 2023; Forster et al., 2024), with greater rates of warming at higher latitudes, adding potential for fuel drying. Climate change has also resulted in altered precipitation patterns, with total rainfall and dry season length increasing or decreasing variably across regions (Polade et al., 2014; Swain et al., 2018; IPCC, 2023a). Meanwhile, changes to fuel load and ignition rates are driven by climate change and anthropogenic land use, with varying effects regionally (Finney et al., 2018; Romps, 2019). For example, in fuel-limited savannah biomes, land-use change can drive more fragmented fuel loads and a reduction in fire (or an increase in fire resulting from land abandonment), whereas in forest ecosystems, fragmentation provides more potential for ignition and leads to increases in fire occurrence (Andela et al., 2017; Rosan et al., 2022).
4.1.1 Overview of attribution approaches
In this report, we apply various modelling techniques for each focal region to attribute (i) regional changes in the probability of high fire weather to anthropogenic forcing (Sect. 4.1.2) and (ii) changes in monthly BA to total climate forcing, socio-economic change, and all forcing (Sect. 4.1.3).
The types of forcing considered vary across the attribution techniques applied, and so here we define the terminology used throughout the paper when describing attribution results (summarised in Table 4).
Our attribution to anthropogenic forcing explicitly targets the changes driven by anthropogenic greenhouse gas emissions and land-use change, following the IPCC WGI definition (Hegerl et al., 2009; Mengel et al., 2021). We prescribe these emissions in a model to specifically isolate human forcing from natural variability (Sect. 4.1.2).
Our attribution to total climate forcing considers changes driven by climate change since the pre-industrial period, including both anthropogenic forcing and natural variability in line with the IPCC WGII and the Inter-Sectoral Impact Model Intercomparison Project 3a (ISIMIP3a) definition of climate change impact attribution (IPCC, 2023b, c; Mengel et al., 2021). This involves comparing simulations driven with historical reanalysis to a detrended counterfactual simulation with the historical warming signal removed (with both simulations including historical transient land-use change), and therefore only the impacts of climate change are attributed, not distinguishing between anthropogenic or natural causes (Mengel et al., 2021; Burton et al., 2024).
Our attribution to socio-economic factors is applied via the same set of simulations as our attribution to total climate forcing. The role of socio-economic factors is isolated by comparing the early industrial period to the late industrial period in the counterfactual scenario, in which only land use and population density are allowed to change (Burton et al., 2024).
Finally, attribution to all forcing compares the early industrial period in the counterfactual scenario to the last industrial period in the factual scenario, which gives the net effect of all forcings combined. These are summarised in the Table 4 below.
Table 4Summary of the attribution approaches used in this report.
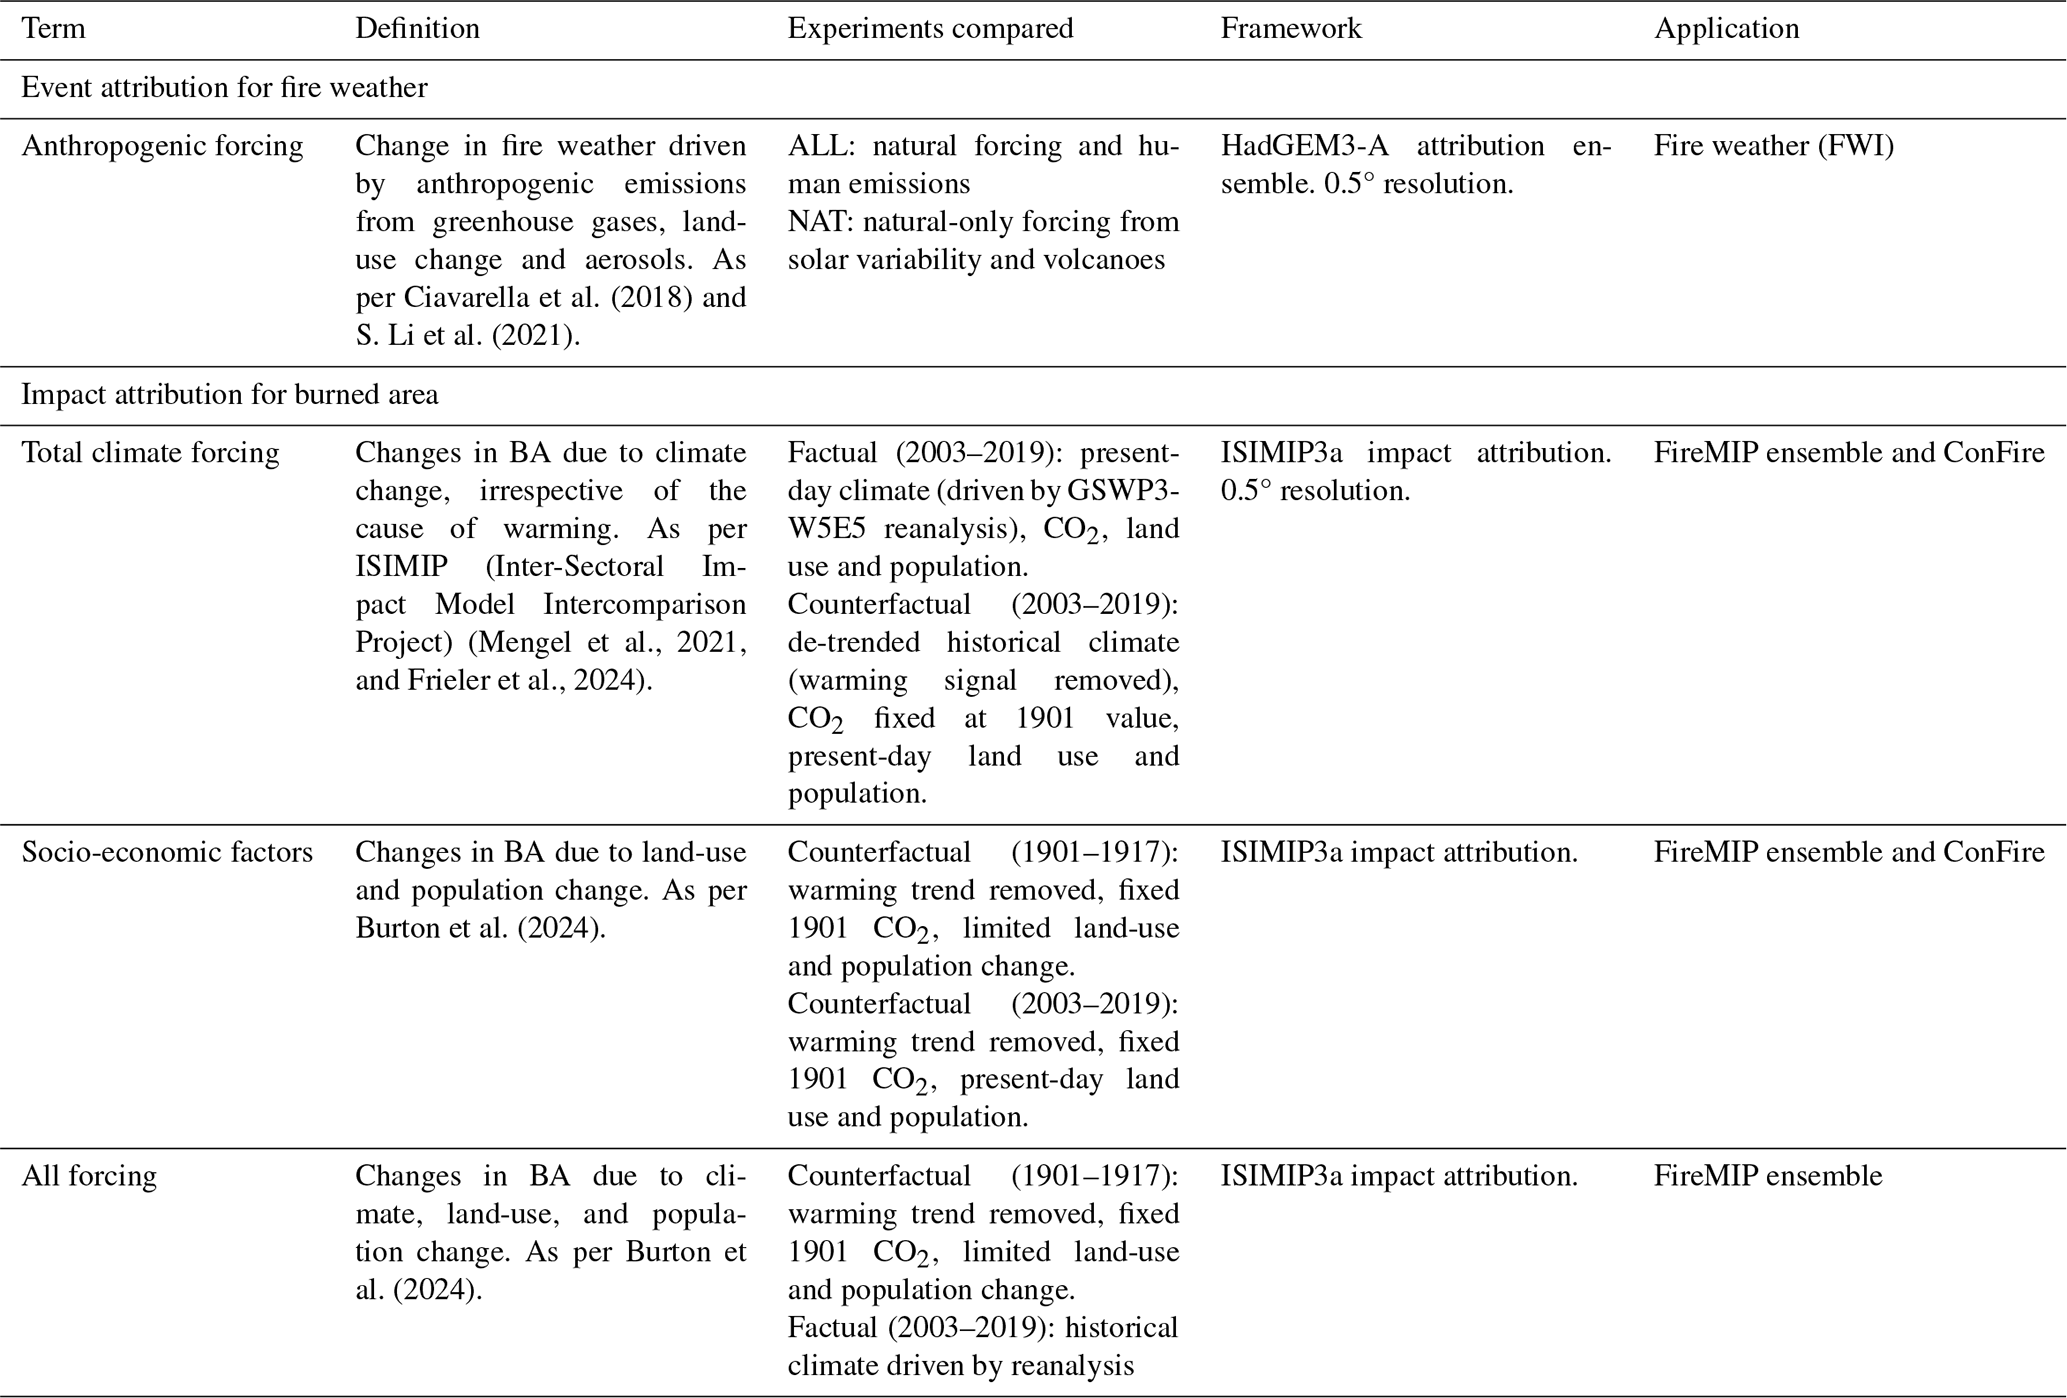
The tools described here enable us to assess the influence of climate and socio-economic forcing on fire with respect to three different target variables. We use the FWI to assess how the probability of high (90th percentile) fire danger has changed as a result of anthropogenic forcing. As climate change has a direct impact on fire weather, this approach enables us to isolate its effects without confounding factors of land-use change and ignitions and reveals how a fire might develop once ignited.
In a second branch of analyses, we attribute the change in BA to total climate forcing, socio-economic factors, and all forcing, specifically targeting the observed month of peak burning in the 2023–2024 fire season for each focal event. We use ConFire to assess the change in likelihood of a BA fraction (BA divided by the total area available to burn) that lies in the 90th or 95th percentiles of observations from the 2023–2024 fire season (percentile thresholds vary regionally due to differing domain sizes).
Separately, we attribute change in the monthly median BA in the present day using simulations from fire-enabled dynamic global vegetation models (DGVMs) contributing to the Fire Model Intercomparison Project (FireMIP). Each of these methods is described in more detail below.
In each approach we include an explicit estimate of uncertainty. We use bootstrapping to give uncertainty estimates for the FWI risk ratios. ConFire is designed as an uncertainty quantification model (see Sect. 3.2.4), giving the likelihood of all possible burned areas for each region based on a probabilistic analysis of past burn patterns and environmental conditions. We combine the information from the FireMIP models in a weighted multi-model ensemble to give uncertainty ranges across the models. Each result therefore presents a 5–95th percentile probability estimate.
4.1.2 Attributing change in likelihood of fire weather to anthropogenic forcing
We use an established approach to attribute change in probability of high (90th percentile) fire weather conditions to anthropogenic forcing. The approach uses estimates of the FWI, as used in previous studies from the World Weather Attribution (Barnes et al., 2023), using outputs from the HadGEM3-A large ensemble (Christidis et al., 2013; Ciavarella et al., 2018). It follows the approach introduced by Stott et al. (2004) for attributing extreme weather events, and it has been employed in other attribution studies targeting fire weather, such as S. Li et al. (2021).
As outlined in Sect. 3.1.1, the FWI is used operationally and in research contexts to rate fire danger based on meteorological conditions. Due to the availability of model output variables, we use maximum daily temperature at 1.5 m as a proxy for noon values, total daily precipitation, mean daily relative humidity at 1.5 m, and mean daily wind speed at 10 m, following Perry et al. (2022). We calculate the daily FWI for the month of 2023–2024 peak BA anomaly for each focus region, using the same month and region for validation over the historical time series (1960–2013).
We validate and bias-adjust the model estimates of the high FWI for the period 1960–2013 by comparing a 15-member HadGEM3-A ensemble with ERA5 reanalysis data (C3S, 2024) representing the “observed” FWI. The 0.25° resolution observed FWI from ERA5 was coarsened by linear interpolation (calculated by extending the gradient of the closest two points) to match the 0.5° model grid. We compare the time series of individual components of the FWI (Fig. S40) and the distribution of the modelled and observed FWI (Supplement Figs. S41–S43) and apply a simple linear regression to find the bias correction required for the 2023 model output. See Supplement Sect. S1.2.3 for detail. Before bias adjustment, the modelled FWI is generally higher than the observed FWI, and some regions (e.g. Greece) require a larger correction than others. The correction adjusts the trend and absolute value while maintaining variability, and the model successfully reproduces the observed distribution after applying the correction in each region (see Supplement Sect. S2.3 for full evaluation).
For the events occurring in the 2023–2024 fire season, we calculate the FWI from the HadGEM3-A model simulations comprising two experiments of 525 members each, one driven by all forcings including historical greenhouse gas emissions, aerosols, zonal-mean ozone concentrations, land-use change and natural forcing (ALL), and a second counterfactual simulation with natural-only forcing from solar variability and volcanic emissions and 1850 land use (NAT) (see Table 4). By applying the bias adjustment from the previous step and comparing the fire weather in the two simulations to the 2023-observed FWI from ERA5, we calculate the change in probability of high (90th percentile) fire weather due to anthropogenic forcing.
4.1.3 Attributing change in regional burned area to total climate forcing, socio-economic factors, and all forcing
Peaks in burned area during 2023–2024
We use the ConFire attribution framework to attribute anomalies in BA fraction in the month of peak burning during the 2023–2024 fire season to total climate forcing and socio-economic factors using the Inter-Sectoral Impact Model Intercomparison Project (ISIMIP) 3a attribution protocol (see Table 4). For Canada and western Amazonia, the attribution approaches are applied to cells with BA fractions in the 95th percentile of the BA fraction distribution during 2023–2024. For Greece, the attribution approaches are applied to cells with BA fractions in the 90th percentile of the BA fraction distribution during 2023–2024, with the lower percentile threshold selected due to the smaller domain size of Greece.
We trained ConFire on observed monthly BA from the MODIS BA product during 2003–2019 at 0.5° across the entire region. For model training, we drive ConFire with Global Soil Wetness Project Phase 3 (GSWP3-W5E5) forcings provided at a 0.5° spatial resolution by ISIMIP3a (Table 5). The land surface information (tree cover and non-tree vegetated cover) is derived from the JULES-ES ISIMIP configuration (Mathison et al., 2023) driven by GSWP3-W5E5. This model includes dynamic vegetation, i.e changing vegetation cover in response to climate variables, growth, plant competition, and mortality. So as not to double-count the impact of fire, we turn the interactive vegetation–fire model off. The bias in this land surface information is adjusted to the MODIS Vegetation Continuous Fields collection 6.1 remotely sensed data for < 60° N (DiMiceli et al., 2022) and collection 6 for > 60° N (DiMiceli et al., 2015) using a trend-preserving empirical quantile mapping bias adjustment method. This method significantly reduces the model bias in the JULES-ES output for most regions and variables, ensuring accurate means and distribution while preserving trends between historical and future periods (Fig. S22). See Supplement Sect S1.1.1 for details.
We ran ConFire in predictive mode on monthly time steps with a structure similar to that used in Sect. 3.1.2, again grouping specific drivers into controls (Table 5). However, specific driving variables differed for this application: fuel load controls were represented by total vegetation cover and tree cover; fuel moisture controls were represented by mean consecutive dry days within each month, the fraction of dry days within the month, daily mean precipitation, mean and maximum monthly temperature, and mean and maximum vapour pressure deficit (VPD); ignition controls were represented by climatological lightning, pasture, crop, and population density; and suppression controls were represented by pasture, crop, and population density. ConFire's Bayesian inference procedure proved useful because it allowed us to discern individual driver contributions (Gelman et al., 2013; Kelley et al., 2023). These modified ConFire simulations applied to all data in each of three experiments (see “Simulation framework” in the Supplement).
To determine the impact of total climate forcing and socioeconomic factors on the increased BA during our focal events, we conducted a paired sampling of monthly BA in the target months (see Table 4). As there is no climate influence in the early industrial simulation, we first adjusted the target event (a monthly regional BA value) to that expected without climate change. For this adjustment, we find the percentile of the observed BA in the factual scenario and find the BA at the same percentile in the counterfactual scenario. We used paired samples to account for the uncertainty in the underlying mechanisms relating our drivers to BA, which would co-vary between experiments as per Kelley et al. (2021). In total, we took 200 samples over the 17 years of each simulation, resulting in 3400 pairs.
The likelihood was then simply determined by the number of ensemble members in the factual scenario that predicted greater BA than the counterfactual scenario for total climate forcing or the counterfactual scenario predicting greater BA than the early industrial scenario for socioeconomic factors. The relative increase in BA extent is the BA in factual over counterfactual (total climate forcing) or counterfactual over early industrial (socioeconomic).
As per Sect. 3.1.2, we evaluated the model following Barbosa (2024). We separately train ConFire on 50 % of the data between 2003–2011 and perform evaluation for the years 2012–2019. Further details of the model fitting and validation can be found in the Supplement Sect. S2.2.2.
Table 5Explanatory variables used for attributing extreme BA (Sect. 4.1.3) and for the multidecadal outlook (Sect. 5.1.2). The explanatory variables are forcing data from the Inter-Sectoral Impact Model Intercomparison Project (ISIMIP) protocols, ISIMIP3a and ISIMIP3b (Frieler et al., 2024). Positive (+ive) or negative (−ive) under “Controls” describes if a driver increases or decreases BA.
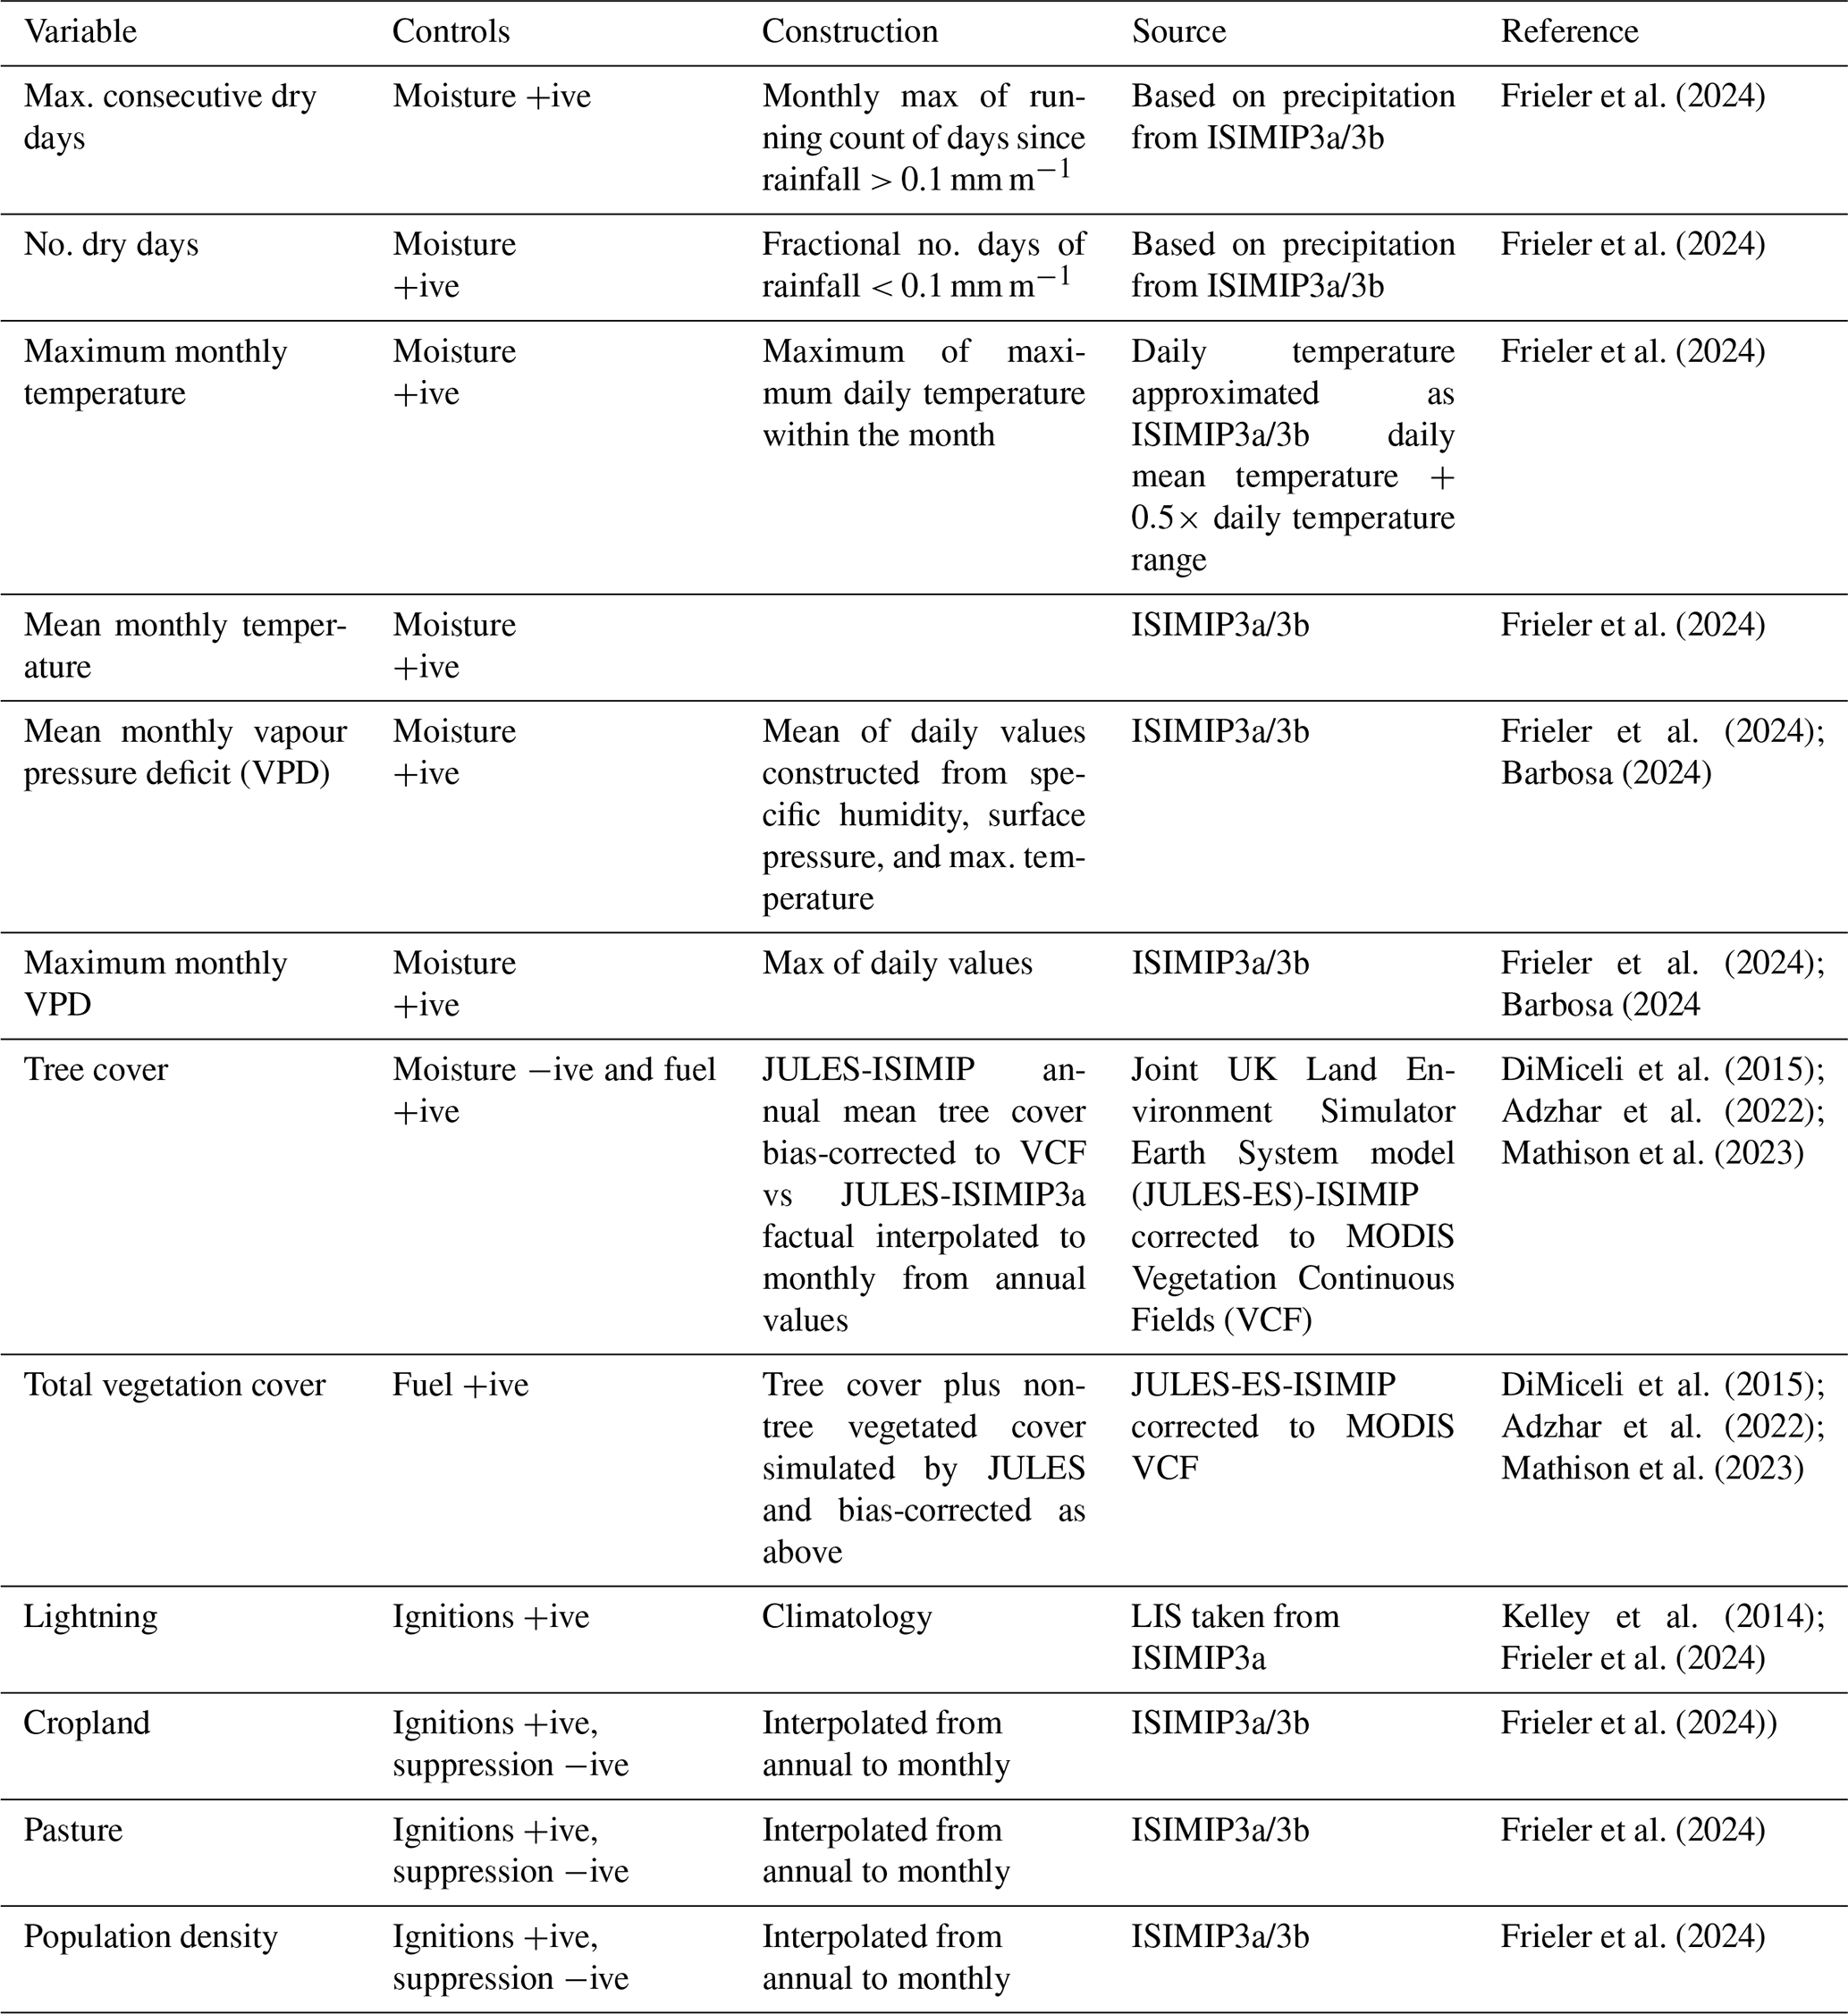
Background changes in burned area during 2003-2019
Finally, we attribute changes in median monthly BA across all months in 2003–2019 to total climate forcing, socio-economic factors, and all forcings, using the novel attribution method developed using state-of-the-art global fire models from the FireMIP (Burton et al., 2024). This represents an assessment of how BA has changed during the 2003–2019 period versus counterfactual scenarios. Our method employs the same ISIMIP3a simulation framework outlined above with seven fire-enabled DGVMs (see Table S3 in the Supplement) for the period 1901–2019 for the factual and counterfactual experiments (see Table 4 for descriptions). ConFire was not used in this element of our attribution approaches; rather, the native fire modelling scheme of each fire-enabled DGVM was employed. Model fire schemes are described in Burton et al. (2024).
A weighted ensemble of the monthly outputs of BA, based on the regional performance of the unweighted models against observational data from GFED5 and FireCCI, is used for the analysis. Due to large differences in absolute values of BA between the GFED5 and FireCCI observational datasets and across the models, the weightings in the ensemble are based on model capability to capture relative anomalies present in the observational datasets on a regional basis, and all changes are reported as relative anomalies. We focus on the change in median monthly BA across all months in 2003–2019 because the fire models underpredict the high tails of the distribution. The weighted models are randomly resampled to generate uncertainty estimates for each region. The method and results are reported in full for all 43 IPCC AR6 regions in Burton et al. (2024), and in the current report we select the IPCC regions that align most closely with our focus regions defined in Sect. 3.2.
4.2 Results
4.2.1 Change in the likelihood of high fire weather in 2023–2024
Canada
The fire weather conditions in Canada during June 2023 were 2.9–3.6 times more likely due to anthropogenic forcing. Here we assess the 95th percentile of the FWI over the country during the month of peak anomaly in BA (June) in the ALL and NAT HadGEM3 simulations. More of the ALL distribution lies above the observed 95th percentile of the FWI from ERA5 compared to the NAT distribution (Fig. 13), and we therefore conclude that the probability of experiencing the high fire weather observed during June 2023 is more likely in a climate forced with anthropogenic emissions.
Greece
The high fire weather conditions experienced during the peak anomaly in BA in August 2023 were 1.9–4.1 times more likely due to anthropogenic forcing (Fig. 13). In this case the 95th percentile of the FWI is outside of the distribution, so instead we assess the 90th percentile of the FWI over the country. This is likely a result of our linear inference of 2023 for the bias correction based on the 1960–2013 period, where in fact 2023 was so anomalous that it does not fit this trend. The 2023 event threshold here also lies at the very high end of simulated fire weather, meaning it was very unusual in the model simulations. The result range here is also larger than for Canada, meaning there is less certainty about how much human influence has increased the probability, although it does highlight at least a 50 % increase in likelihood of high fire weather.
Western Amazonia
High fire weather in western Amazonia during September–October 2023 was 20.0–28.5 times more likely due to anthropogenic forcing (Fig. 13). In this region there is a large shift in the ALL forcing distribution compared to the NAT only forcing for the 95th percentile of the FWI, and the high risk ratio shows a strong anthropogenic signal in driving the meteorological conditions that led to high fires over this period.
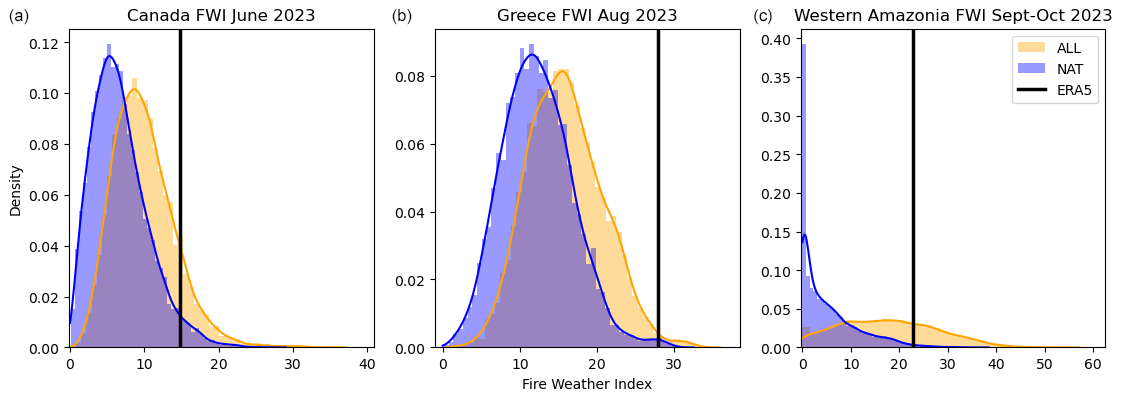
Figure 13The high FWI in 2023: (a) 95th percentile FWI in June over Canada, (b) 90th percentile FWI in August over Greece, and (c) 95th percentile FWI in September–October over western Amazonia in the HadGEM3 ensemble of ALL (anthropogenic and natural forcing, orange) and NAT (natural-only forcing, blue) bias-adjusted simulations and ERA5 reanalysis (black line).
4.2.2 Change in the likelihood of peaks in burned area in 2023–2024
Canada
We show that total climate forcing was virtually certain (99.9 % confidence) to have led to greater BA in Canada during June 2023 (Fig. 14). Our attribution results indicate that total climate forcing increased BA extent by 4.1 [2.3–7.8] % during the month of June across the period 2003–2019. Additionally, considering the anomalies in fire drivers during 2023, we estimate an additional 5.7 [1–30] % absolute increase in BA extent during June 2023, on top of the 2003–2019 period (Fig. 10). The impact of socio-economic factors is less certain, with only a 64.8 % likelihood of decreasing burning, affecting BA extent by between −22.5 % and 6.6 % during 2003–2019.
Overall, we estimate that BA in Canada in June 2023 was 10.1 [3.3–40.1] % greater due to total climate forcing in the 2003–2019 period combined with this year's anomaly in the climatic variables. As a caveat, we note that this is not a formal attribution of the 2023 anomaly because no counterfactual exists for the year but rather an attribution of the change in BA in 2003–2019 with the additional influence of climate factors on BA in 2023 superimposed (this caveat also applies to the other focal regions). For Canada, the BA attribution targets cells in the 95th percentile of the BA fraction distribution.
Greece
Total climate forcing caused a change in the likelihood of high BA in Greece of 2.7 [−0.2 to 6.0] % in the period 2003–2019 in the cells with the greatest BA fraction (90th percentile), with 90 % confidence (Fig. 14). In this case we use the 90th percentile to represent high BA over the region for the month of August, over 2003–2019. This increase is likely a conservative figure given the additional warming since 2019, and estimating the additional burning that might have been experienced during the anomalous conditions of 2023, we find an additional change of 1.3 [−9.3–11] % (Fig. 10). Socioeconomic factors likely (79.9 %) caused a decrease in burning, though they could have caused an increase, affecting BA extent by −3.1 [−10.9 to 5.1] %.
Overall we estimate that BA in Greece in August 2023 was increased by 4 [−9.5 to 17.7] % due to total climate forcing in the 2003–2019 period combined with this year's anomaly in the climatic variables. In the case of Greece, uncertainties around the influence of total climate forcing and socioeconomic factors are greater because the smaller region size limits information available for model optimisation. For Greece, the BA attribution targets cells in the 90th percentile of the BA fraction distribution.
Western Amazonia
Over the period 2003–2019, total climate forcing was virtually certain to have caused an increase in burned areas like the one experienced in western Amazonia in September and October 2023 (> 99.9 % likelihood), with a likely range of increase in extent of 3.5 [1.4–9.9] % (Fig. 14). Here we assess the change in BA due to total climate forcing in the cells that burn most regularly (95th percentile) of our defined region of western Amazonia over September and October 2003–2019. Extending our analysis to the 2023 anomaly, we estimate that additional burning could have been up to 7.4 [0.8–36.2] % on top of the 2003–2019 levels. Despite finding little influence of humans specifically in 2023 compared to the previous 10 years in Fig. 10, since the early industrial, we show socioeconomic factors have had a large influence on the occurrence of extreme levels of burning. Events similar to 2023 were very likely exacerbated by socioeconomic conditions (92.0 % likelihood) increasing BA by 2.9 [0.1–7.8] %.
Overall, we estimate that BA in western Amazonia in September–October 2023 was increased by 11.1 [2.2–49.7] % due to total climate forcing in the 2003–2019 period combined with this year's anomaly in the climatic variables. For western Amazonia, the BA attribution targets cells in the 95th percentile of the BA fraction distribution.
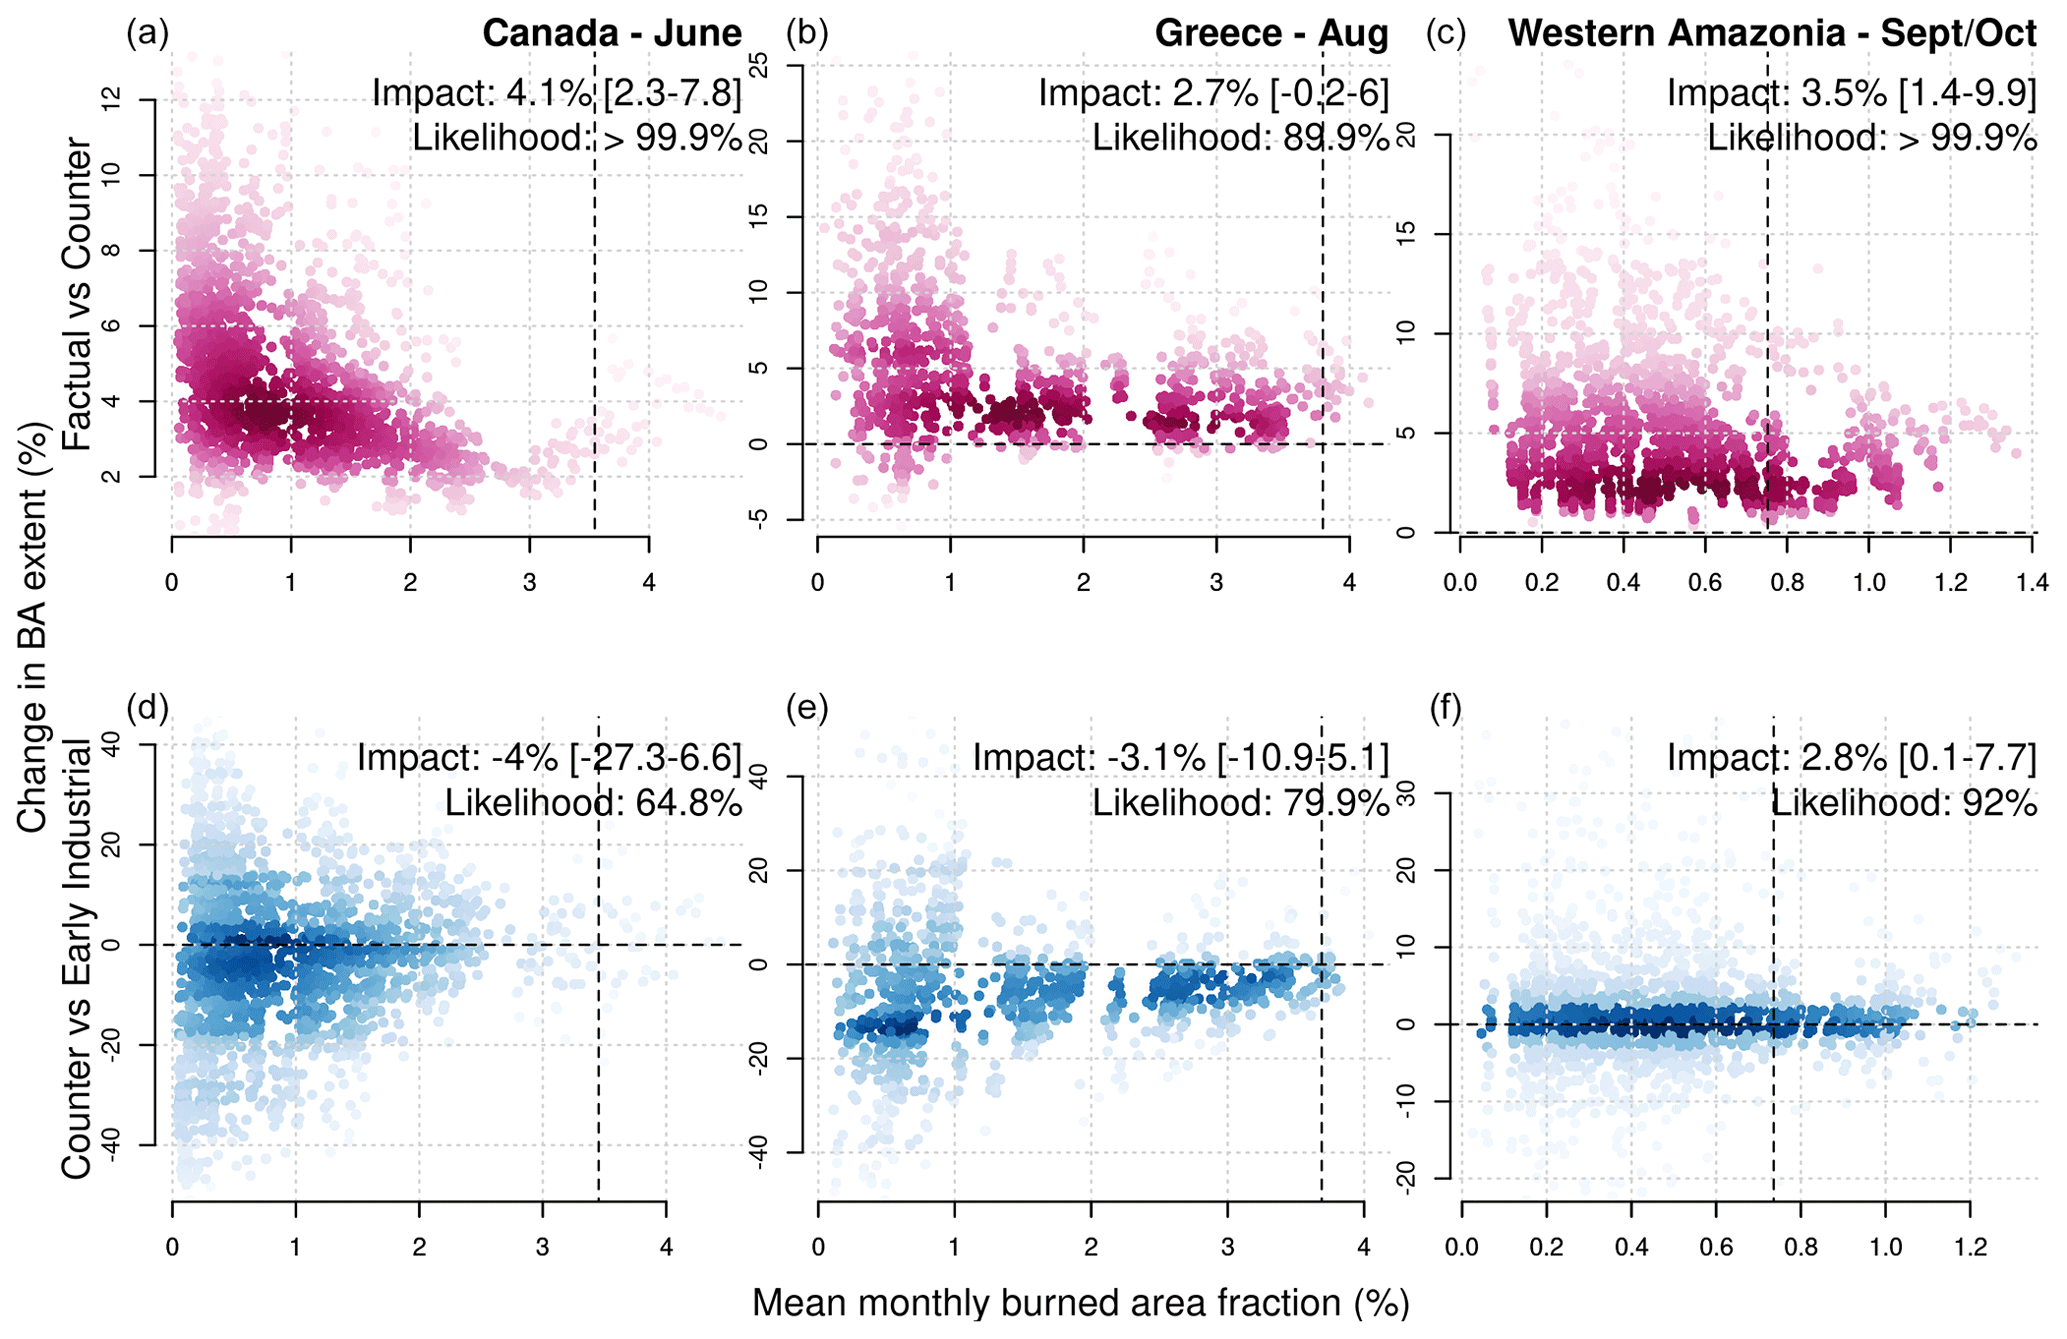
Figure 14Estimated change in BA in selected months in the period 2003–2019 (e.g. 17 months of June for Canada) as modelled by ConFire when driven by the ISIMIP3a reanalysis versus counterfactual scenarios. The panels shows the change in BA extent (%) due to (a, b, c) total climate forcing versus a scenario without climate forcing and (d, e, f) socioeconomic forcing versus a scenario without socioeconomic forcing. Results are shown for (a, d) Canada, (b, e) Greece, and (c, f) western Amazonia. Many points are plotted because each point represents a posterior estimate of change in BA for a month, and there are 1000 iterations of ConFire to explore the effect of uncertainty in input parameters and structural relationships between BA and input variables. Impact values are the central (median) and 5th–95th percentile range of the estimated values of change in BA (%). The likelihoods shown are the probability of the change being significant, measured as the percentage of the posterior estimates being above/below zero when the median is above/below zero.
4.2.3 Background changes in burned area due to total climate forcing, socioeconomic factors, and all forcing
Canada
As reported in Burton et al. (2024), we also show how background levels of fire extent, represented by the modelled median BA for months of interest, have changed overall in Canada due to total climate forcing (Fig. 15), socioeconomic forcing (Fig. S15), and all forcings (Fig. S16). Using AR6 regions that best match our focus areas, we show that BA has increased by 1.9 % [0.1, 3.6] in northwest North America (NWN) due to total climate forcing but reduced by −0.2 % [−1.7, 1.3] in northeast North America (NEN) (Fig. 15). In these regions, socioeconomic forcing has dampened the effects of climate change, by reducing BA by −9.5 % [−13.6, −6.3] in NWN and −8.5 % [−12.5, −5.7] in NEN (see Fig. S15). All forcings combined have led to an overall reduction in BA of −8.3 % [−12.5, −4.9] in NWN and −8.7 % [−12.8, −5.8] in NEN (Fig. S16).
Greece
Burton et al. (2024) find a larger increase in median BA for months of interest due to total climate forcing in the Mediterranean region (MED), with an increase of 14.5 % [11.5, 18.1] today compared to the counterfactual (Fig. 15). This is particularly the case for the highly burned areas, where the increase is larger compared to the lower end of the distribution. However, socioeconomic factors have largely offset this by reducing BA by −10.2 % [−13.6, −6.6] (see Fig. S15). All forcings combined have led to an overall regional increase in BA of 0.5 % [−3.5, 5.5] (see Fig. S16).
Western Amazonia
As per Burton et al. (2024), total climate forcing has increased median BA for months of interest by 11.5 % [5.4, 18.4] in northwest South America (NWS) today compared to the counterfactual (Fig. 15). Again, this increase is mostly impacting the BA at the higher end of the distribution. This is mostly offset by socioeconomic factors (−9.0 % [−18.9, 1.2]), although all forcings combined have still led to an overall increase in BA of 1.5 % [−6.9, 10.5] in the region (see Supplement).
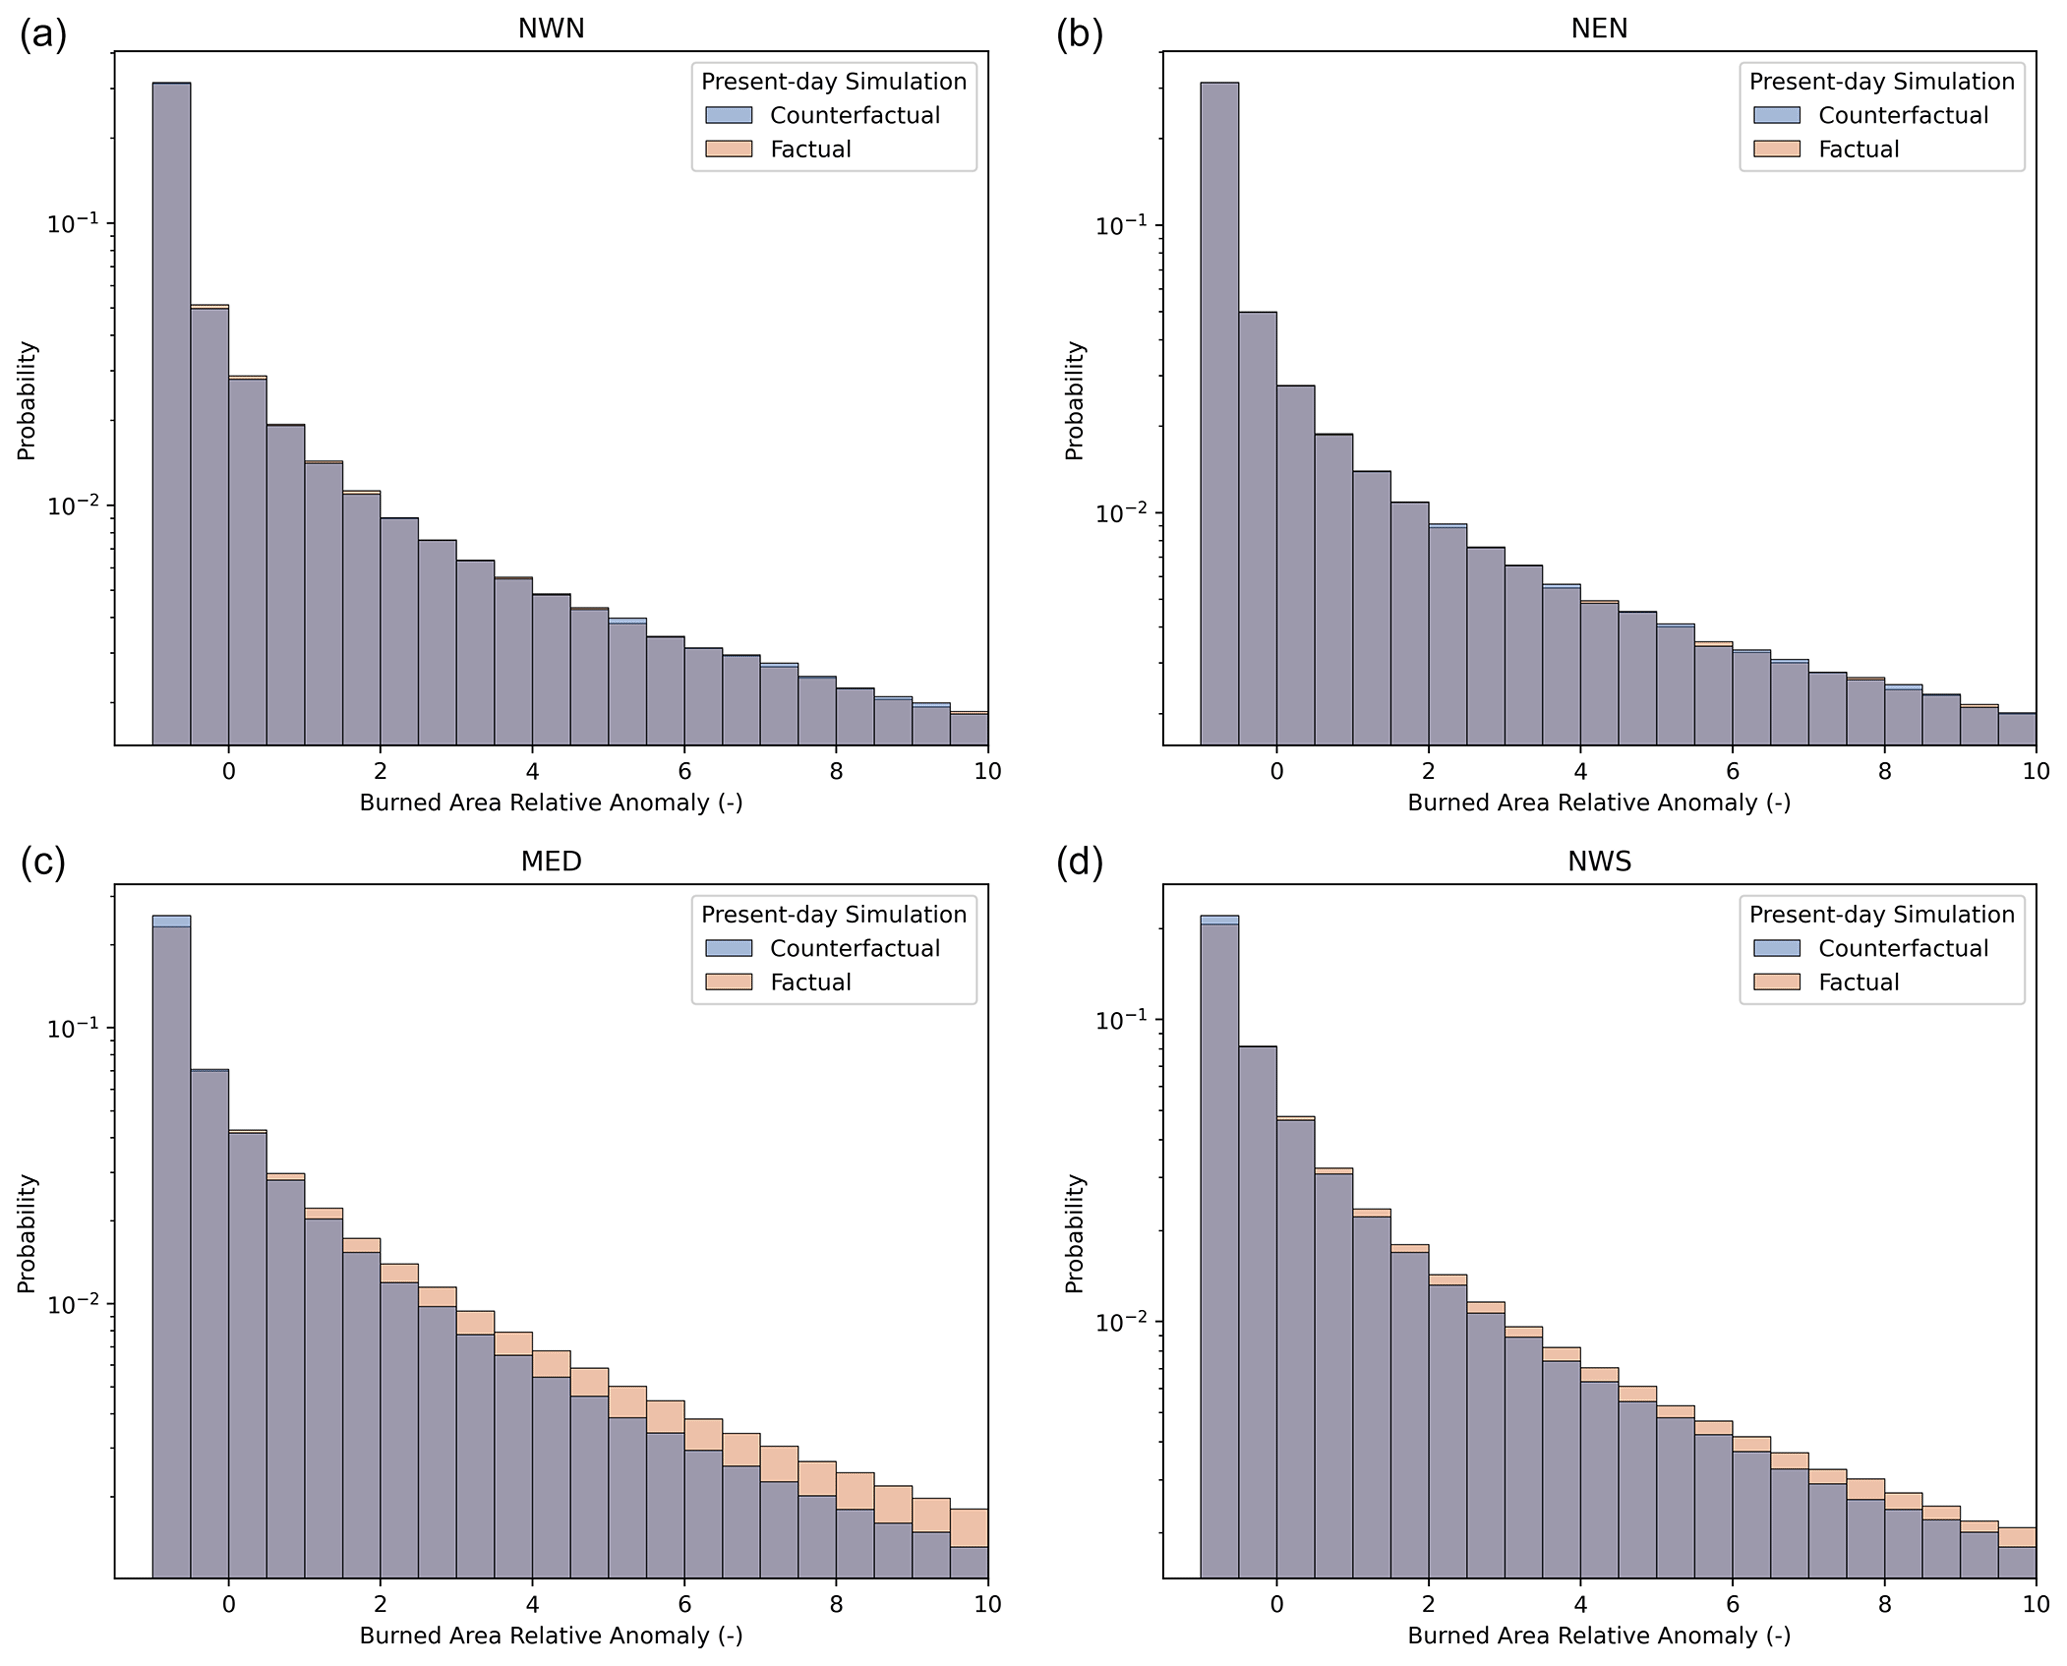
Figure 15Change in median BA due to total climate forcing from FireMIP. Present-day BA (2003–2019) for factual (historical forcing, orange) and counterfactual (detrended climate, blue), for AR6 regions. Panels show (a) northwest North America (NWN), (b) northeast North America (NEN), (c) Mediterranean (MED), and (d) northwest South America (NWS). Probability is shown on a log scale.
5.1 Methods
5.1.1 Seasonal forecasts
Among the modes of variability in the climate system most relevant to wildfire activity globally is the El Niño–Southern Oscillation (ENSO) (Mariani et al., 2016; Fuller and Murphy, 2006; Cardil et al., 2023). Numerous studies have demonstrated that there is a predictable cascade of fire across tropical continents during ENSO events, highlighting staggered responses of wildfire to ENSO (Chen et al., 2017). The utility of using ENSO as a predictor of fire is highlighted by its application in Indonesia, where severe fires during the 2015 El Niño led to hazardous haze in Singapore and diplomatic tensions in the region, prompting better regional cooperation and enforcement of anti-burning laws (Field et al., 2016; Forsyth, 2014; Carmenta et al., 2021). Consequently, Indonesia now implements preemptive bans on agricultural burning based solely on ENSO predictions, a measure that proved successful in 2023 when no significant fire anomalies were recorded despite a strong positive ENSO event (Lin et al., 2020; Sloan et al., 2022).
Another phenomenon demonstrably linked to global fire activity is the Indian Ocean Dipole (IOD), which occurs in the Indian Ocean. There is ongoing debate regarding the direct influence of the IOD on Australian fires, for example as the signal is often modulated by changes in land management practices (Harris and Lucas, 2019). Other atmospheric modes of variability in the Southern and Northern Hemisphere and in the Arctic regions can also have influence on interannual BA patterns, and Fig. S1 in the Supplement shows the climate modes with strongest influence on regional BA globally.
Outputs available from the Copernicus Climate Change Service (C3S) multi-model seasonal prediction system are used to evaluate large-scale climate modes with the most proven links to variation in fire activity: ENSO and IOD (Hersbach et al., 2023). As not all regions display similar seasonal direct correlations between fire activity and ENSO, we also use seasonal outlooks of the FWI from one of the models, ECMWF-SEAS5, to identify probabilities for the establishment of anomalous landscape flammability in the next season. This is done using a 51-member forecast ensemble and a 24-year model climatological distribution (derived from a 25-member ensemble re-forecast) covering the period 1993–2016. The probability of exceedance is determined based on the proportion of forecast members meeting an distributional threshold at any given geographical point. We consider the 75th percentile threshold indicative of moderate anomalous conditions and the 95th percentile indicative of extreme anomalous conditions.
5.1.2 Decadal projections of burned area
In order to project future changes in BA, we utilised the same modelling approach detailed in Sect. 4.1.3, “Peaks in burned area during 2023–2024”, following a similar protocol to UNEP (2022a). We drive the ConFire model with ISIMIP3a and bias-corrected JULES-ES data. For predictive mode, we used bias-corrected global climate model (GCM) outputs from ISIMIP3b. While ISIMIP3a provides reanalysis datasets to drive models for impact assessments, ISIMIP3b provides driving data from five bias-corrected GCMs, including historical data up to 2014 and future scenarios from 2015–2100 under Shared Socioeconomic Pathway (SSP) scenarios SSP126, SSP370, and SSP585. Each SSP represents future socio-economic pathways and includes greenhouse gas (GHG) emissions to drive the GCMs. The five GCMS used are GFDL-ESM4 (Held et al., 2019), IPSL-CM6A-LR (Boucher et al., 2020), MPI-ESM1-2-HR (Mauritsen et al., 2019), MRI-ESM2-0 (Yukimoto et al., 2019), and UKESM1-0-LL (Good et al., 2019; Sellar et al., 2019). As part of ISIMIP3b, each GCM is bias-corrected as described in Lange (2019).
At present, future projections for land use and population density forcing were not available for ISIMIP3b, so we only considered the influence of climate and vegetation fuel loads (related to land cover) on fire and not changes in ignitions or land use. We used JULES-ES land cover outputs as per the previous section but this time with JULES driven by each of the five different bias-corrected GCMs and for the three different SSP scenarios instead of historical reanalysis. The land cover output was then bias-corrected (using the same mapping procedure as Sect. “Peaks in burned area during 2023–2024”, based on biases between JULES-ES driven by reanalysis and VCF observations) to maintain consistency with the GCM bias correction procedures. We apply an additional bias correction to preserve the trend in vegetation cover from the historical period and to smooth the transition between the historical and future periods (see Supplement Sect. 1.1.1 for details). The results in Sect. 5.2.2 are for the months June–August for Canada, July–September for Greece, and August–October for western Amazonia, corresponding to those regions' fire seasons today.
Our approach provides a probability distribution of future BA representing the uncertainty range from cross-model (GCM) spread in the response of climate and vegetation to emissions for each scenario and year in the period 2010–2100. The years 2010–2014 were consistently adopted from the historical experiment.
For the western Amazonia focal event, we additionally tested a 1-in-100-year event under 2010–2020 climate, defined as the BA at the 99th percentile ConFire distribution. We also use the 1-in-100 definition at a grid cell level to determine spatial variations in the change in extreme fire for each region.We then calculated decadal average likelihoods of the regions' event in each decade up to 2100. Return times are 1 over the likelihood. The change in likelihood of an event occurring on a given return time was calculated relative to the 2010–2020 baseline period.
For the Canada focal event, we also calculated the integrated probability of an event with similar magnitude to 2023 within the expected lifespan of a Canadian citizen. According to UN population statistics, the average life expectancy of a Canadian citizen born today is 83 years (United Nations Population Division, 2022). In order to cover the 7-year period after 2100, we extrapolated the annual trend in probabilities. The integrated probability is calculated as 1 minus the product of the annual probability of not seeing a fire event like 2023, for each year between 2023 and 2106.
5.2 Results
5.2.1 Seasonal outlook for 2024
The 2023–2024 El Niño event emerged as the fourth most powerful on record, causing widespread droughts, floods, and other anomalous conditions worldwide. Officially declared by the World Meteorological Organization (WMO) on 4 July 2023, its meteorological impacts unfolded between November 2023 and April 2024 (Joshi, 2023). Climate scientists have found that the 2023–2024 El Niño event, superimposed on climate change signal, has elevated global temperatures beyond the records set during the 2016 El Niño event. Global mean surface temperatures in 2023 were 1.31 °C above pre-industrial levels of 1850–1900 (Forster et al., 2024).
As of mid-June 2024, El Niño conditions have transitioned toward neutral conditions, which are forecasted to persist during the boreal summer. The Indian Ocean Dipole (IOD) index is currently positive, and forecasts indicate that it will remain in a positive state for the next season. Connections are established between a positive IOD phase and fire risk in Indonesia and parts of Australia, though outcomes generally depend on interactions with the ENSO phase (Pan et al., 2018; Ren et al., 2024; Abram et al., 2021). Similarly, the positive phase of the IOD is linked with heightened fire risk in South America, particularly in the Amazon basin, where it can interact with other climate teleconnections to exacerbate droughts (Cardil et al., 2023; Dong et al., 2021).
Figure 16 shows the predicted probabilities of the monthly average FWI exceeding moderate (75th percentile) or high (95th percentile) thresholds of the monthly climatology. Most areas in southeast Asia and South America were predicted to experience a decrease in the likelihood of anomalous conditions over May, June, and July 2024. Parts of Canada are predicted to reach moderate anomalous conditions once again in early summer, and this combined with overwintering fires could promote a second consecutive high fire season, as has already been reported in the media (BBC News, 2024, Austen, New York Times, 2024). Predictions also suggest that the moderate FWI threshold will be exceeded in southeast, central, and western Brazil, with the high threshold exceeded in southern and western parts. In parts of Africa, moderate FWI anomalies may be experienced throughout June–August.
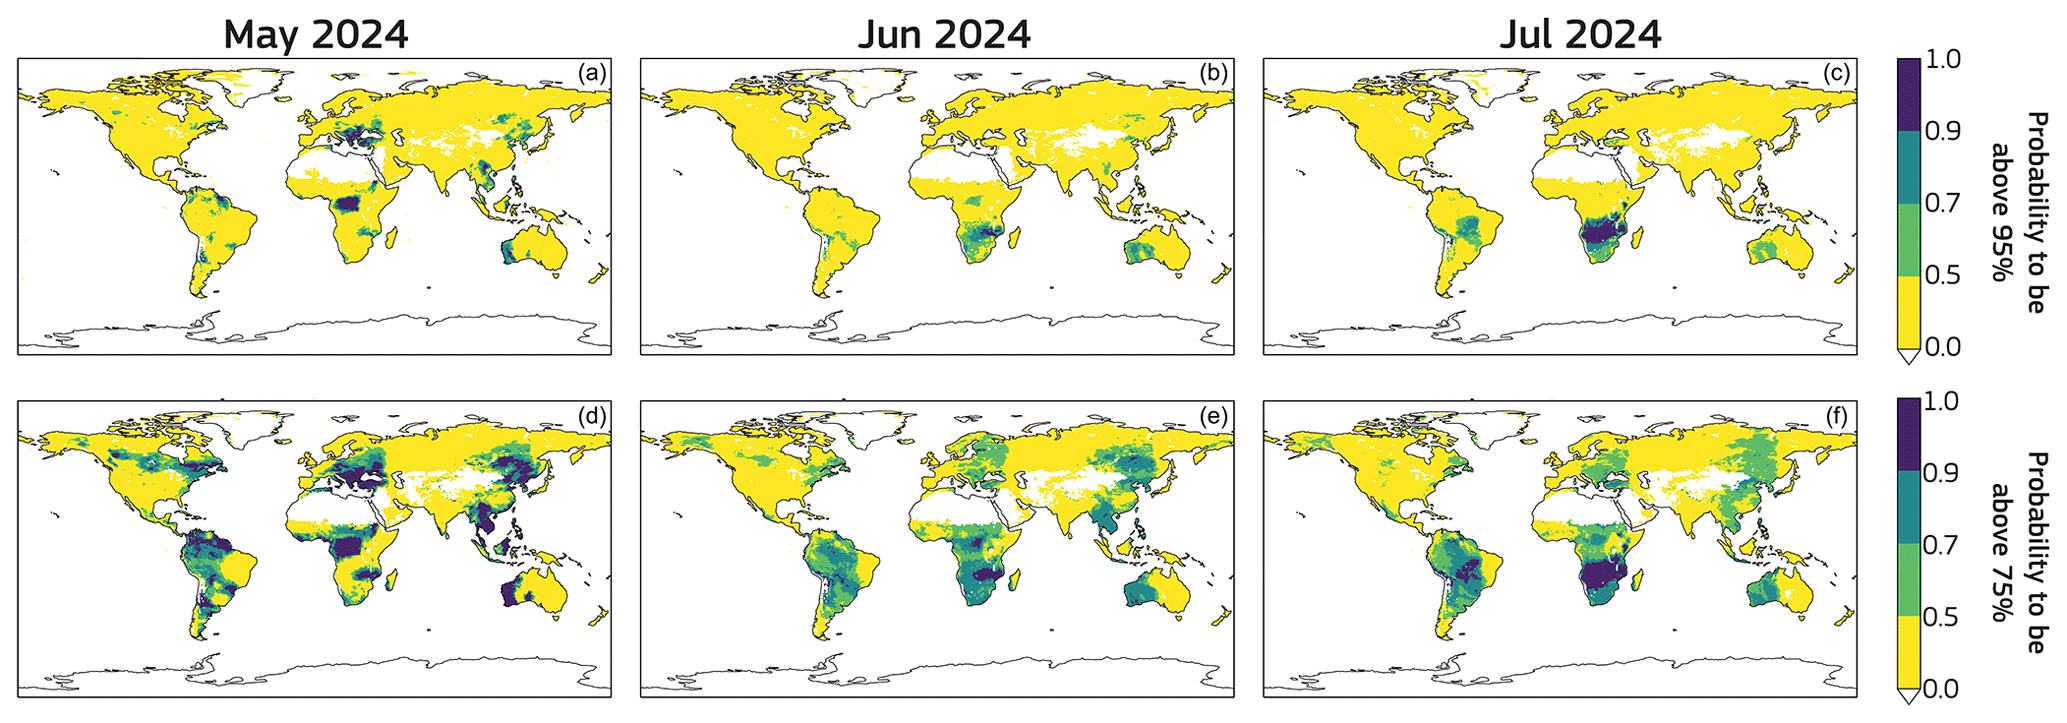
Figure 16Probability for the monthly average FWI exceeding the (a–c) 95th percentile threshold (anomalous conditions) and (d–f) 75th percentile threshold (extremely anomalous conditions) of the monthly climatological distributions. The probability is calculated using the 51-ensemble-member realisation from ECMWF's long-range forecasting system, ECMWF-SEAS5 FWI, and comparing it with the 1991–2016 climatology (Copernicus Emergency Management Service, 2019).
5.2.2 Future changes in likelihood of extreme fire events
Canada
The probability of Canada experiencing BA extent similar to June 2023 (specifically, for cells with BA fraction in the 95th percentile in that month) is estimated to be 0.15 % in any given year under the climate conditions of 2010–2020, according to estimates made using reanalysis data (Table 6; Fig. 17). Bias correction did not fully resolve all discrepancies between the GCMs and reanalysis data, and the GCMs gave a range of likelihoods spanning 0.02 % to 0.71 % for any given year under the climate conditions of 2010–2020. We describe future changes as significant if the range across GCM projections for a future period does not overlap with the range given by the GCMs for 2010–2020.
By the 2040s, the likelihood of an event like 2023 increases significantly to 0.42 %–2.2 % across scenarios, which is 2–6 times as likely as in the 2010s (Table 6; Fig. 17). While the likelihood of an event like 2023 occurring in the 2040s is slightly higher in SSP585 (0.6 %–2.2 %) than other scenarios (0.41 %–1.6 % for SSP126 and 0.5 %–1.7 % for SSP370), differences between future scenarios are not significant at the mid-century point.
The SSP126 scenario diverges significantly from SSP370 and SSP585 after 2070. Under SSP126, the likelihood of an event like 2023 stabilises at 0.3 %–0.8 % in the 2070s and remains largely unchanged until the 2090s (Fig. 17). In contrast, the likelihood of an event like 2023 continues to rise to 2.1 %–3.7 % in the 2090s under SSP585 (Table 6, Fig. 17). Under SSP126, the probability of at least one event like 2023 recurring in any year (of any decade) between 2024 and 2100 is estimated to be 18 %–73 %, compared with 59 %–87 % under SSP585. Hence, the probability of an event like 2023 recurring by the 2090s is estimated to be 2 times greater in SSP585 than in SSP126.
Someone born in Canada in the current decade, with a life expectancy of 83 years (United Nations Population Division, 2022), has a 65 %–90 % probability of seeing a similar event in their lifetimes under SSP585, compared with only an 12 % likelihood of someone who reached 83 years old in the 2010s. Someone born in Canada today would also have a 42 %–80 % probability of seeing an event of similar magnitude twice under SSP585. Under SSP370, a citizen has a 48 %–84 % probability of seeing a similar event once and 29 %–76 % probability of seeing a similar event twice. This reduces to 19 %–76 % for one occurrence and 4 %–58 % for two occurrences under SSP126.
These differences outlined above highlight the divergence in future likelihood of a 2023-like event in Canada between high-mitigation (SSP126) and no-mitigation (SSP585) scenarios. The divergence of likelihoods between the two scenarios is associated with increases in both fuel load and fuel dryness (Fig. 17).
Future changes in probability of an event like 2030 under the SSP370 lie closer to those of SSP585 than SSP126 (Table 6; Fig. 17). For example, the probability of an event like 2023 occurring at least once by the 2090s is estimated to be between 48 % and 84 % under SSP370, only slightly below the range projected under SSP585. This highlights that high-mitigation, low emissions pathways are required to limit future increases in the potential for high-impact events in Canada this century.
Figure 18 shows the spatial variability of changes in summer BA and 1-in-100-year BA events in Canada. While some areas see increases in BA and fire extremes in all scenarios, the greatest rates of change are projected in southern Alberta and Saskatchewan and under SSP585. These patterns emerge as early as 2030 (Fig. S17). Meanwhile, the Yukon and Northwest Territories are projected to see increased BA from 2040 in all scenarios, with 1-in-100-year BA events becoming around twice as likely in parts of these provinces (Fig. S18). By the end of the century, a larger increase in BA is seen under SSP585 and SSP370 than in SSP126, with 1-in-100-year BA events becoming up to 5 times more likely in parts of Yukon and Northwest Territories. Uniquely under SSP585, factor 2 increases in BA and 1-in-100-year BA events extend into British Columbia.
Table 6Summary of the likelihood of extreme events today using reanalysis “factual” and today and into the future using bias-corrected GCMs for our three focal regions. “2023” events focuses on the BA extreme identified in Sect. 3.4.3. 1-in-100 for western Amazonia additionally looks at the likelihood of a 1-in-100 event under present-day climate conditions, following the definition of extreme in UNEP (2022a). We also determine how much more frequent the events will be at two different time horizons based on each models likelihood in the future projections over likelihood during 2010–2020. Asterisks (*) indicate non-significant changes from 2010–2020 values. Colours show linear increase in likelihood (red) and frequency (orange), where darker shade indicates higher values.
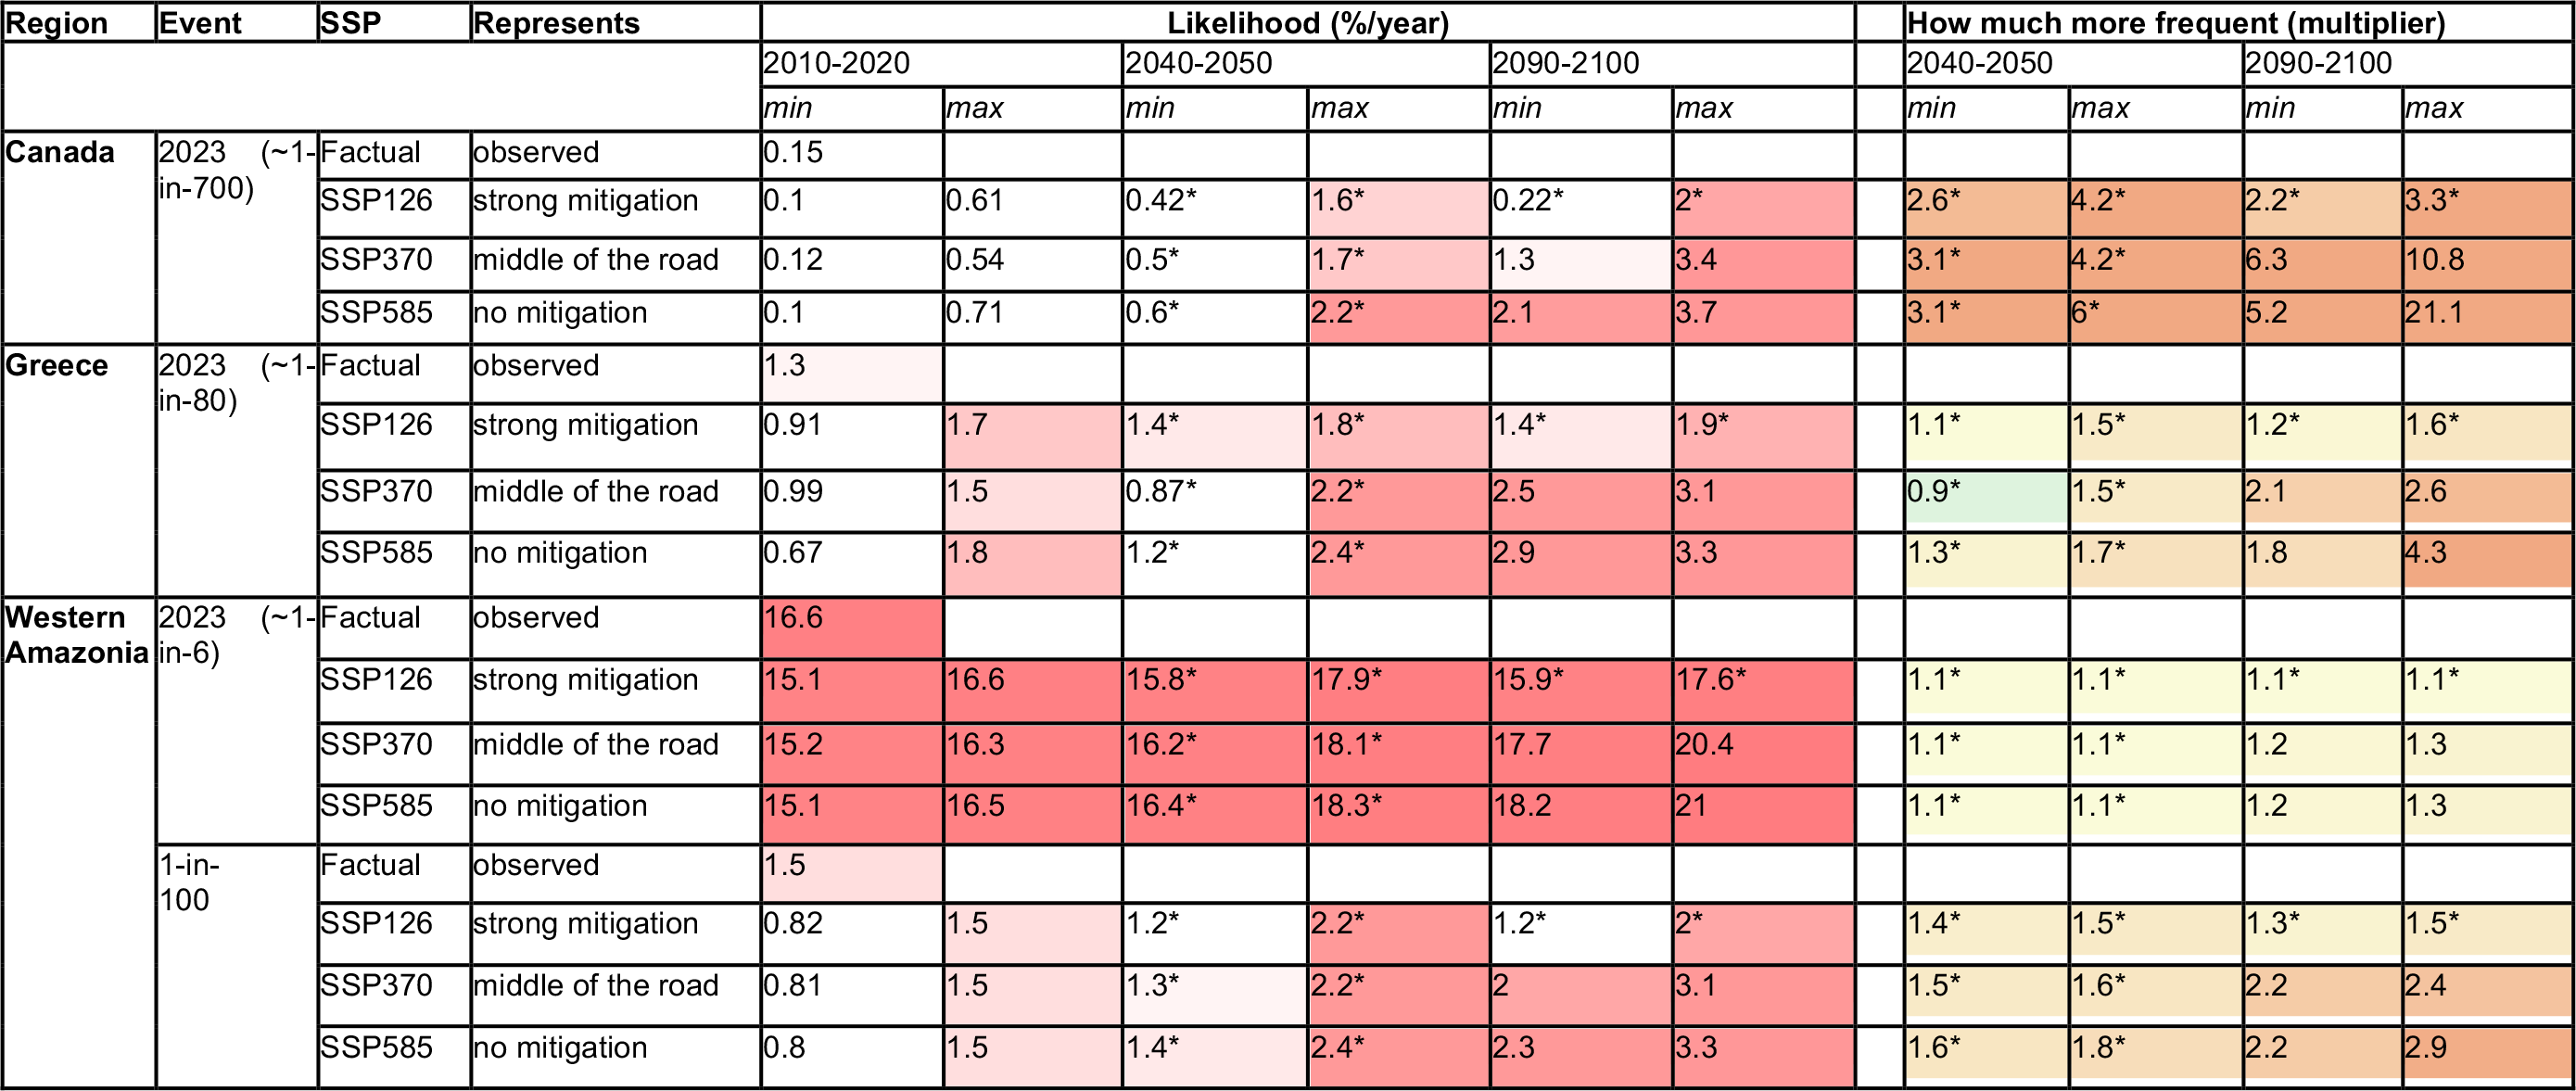
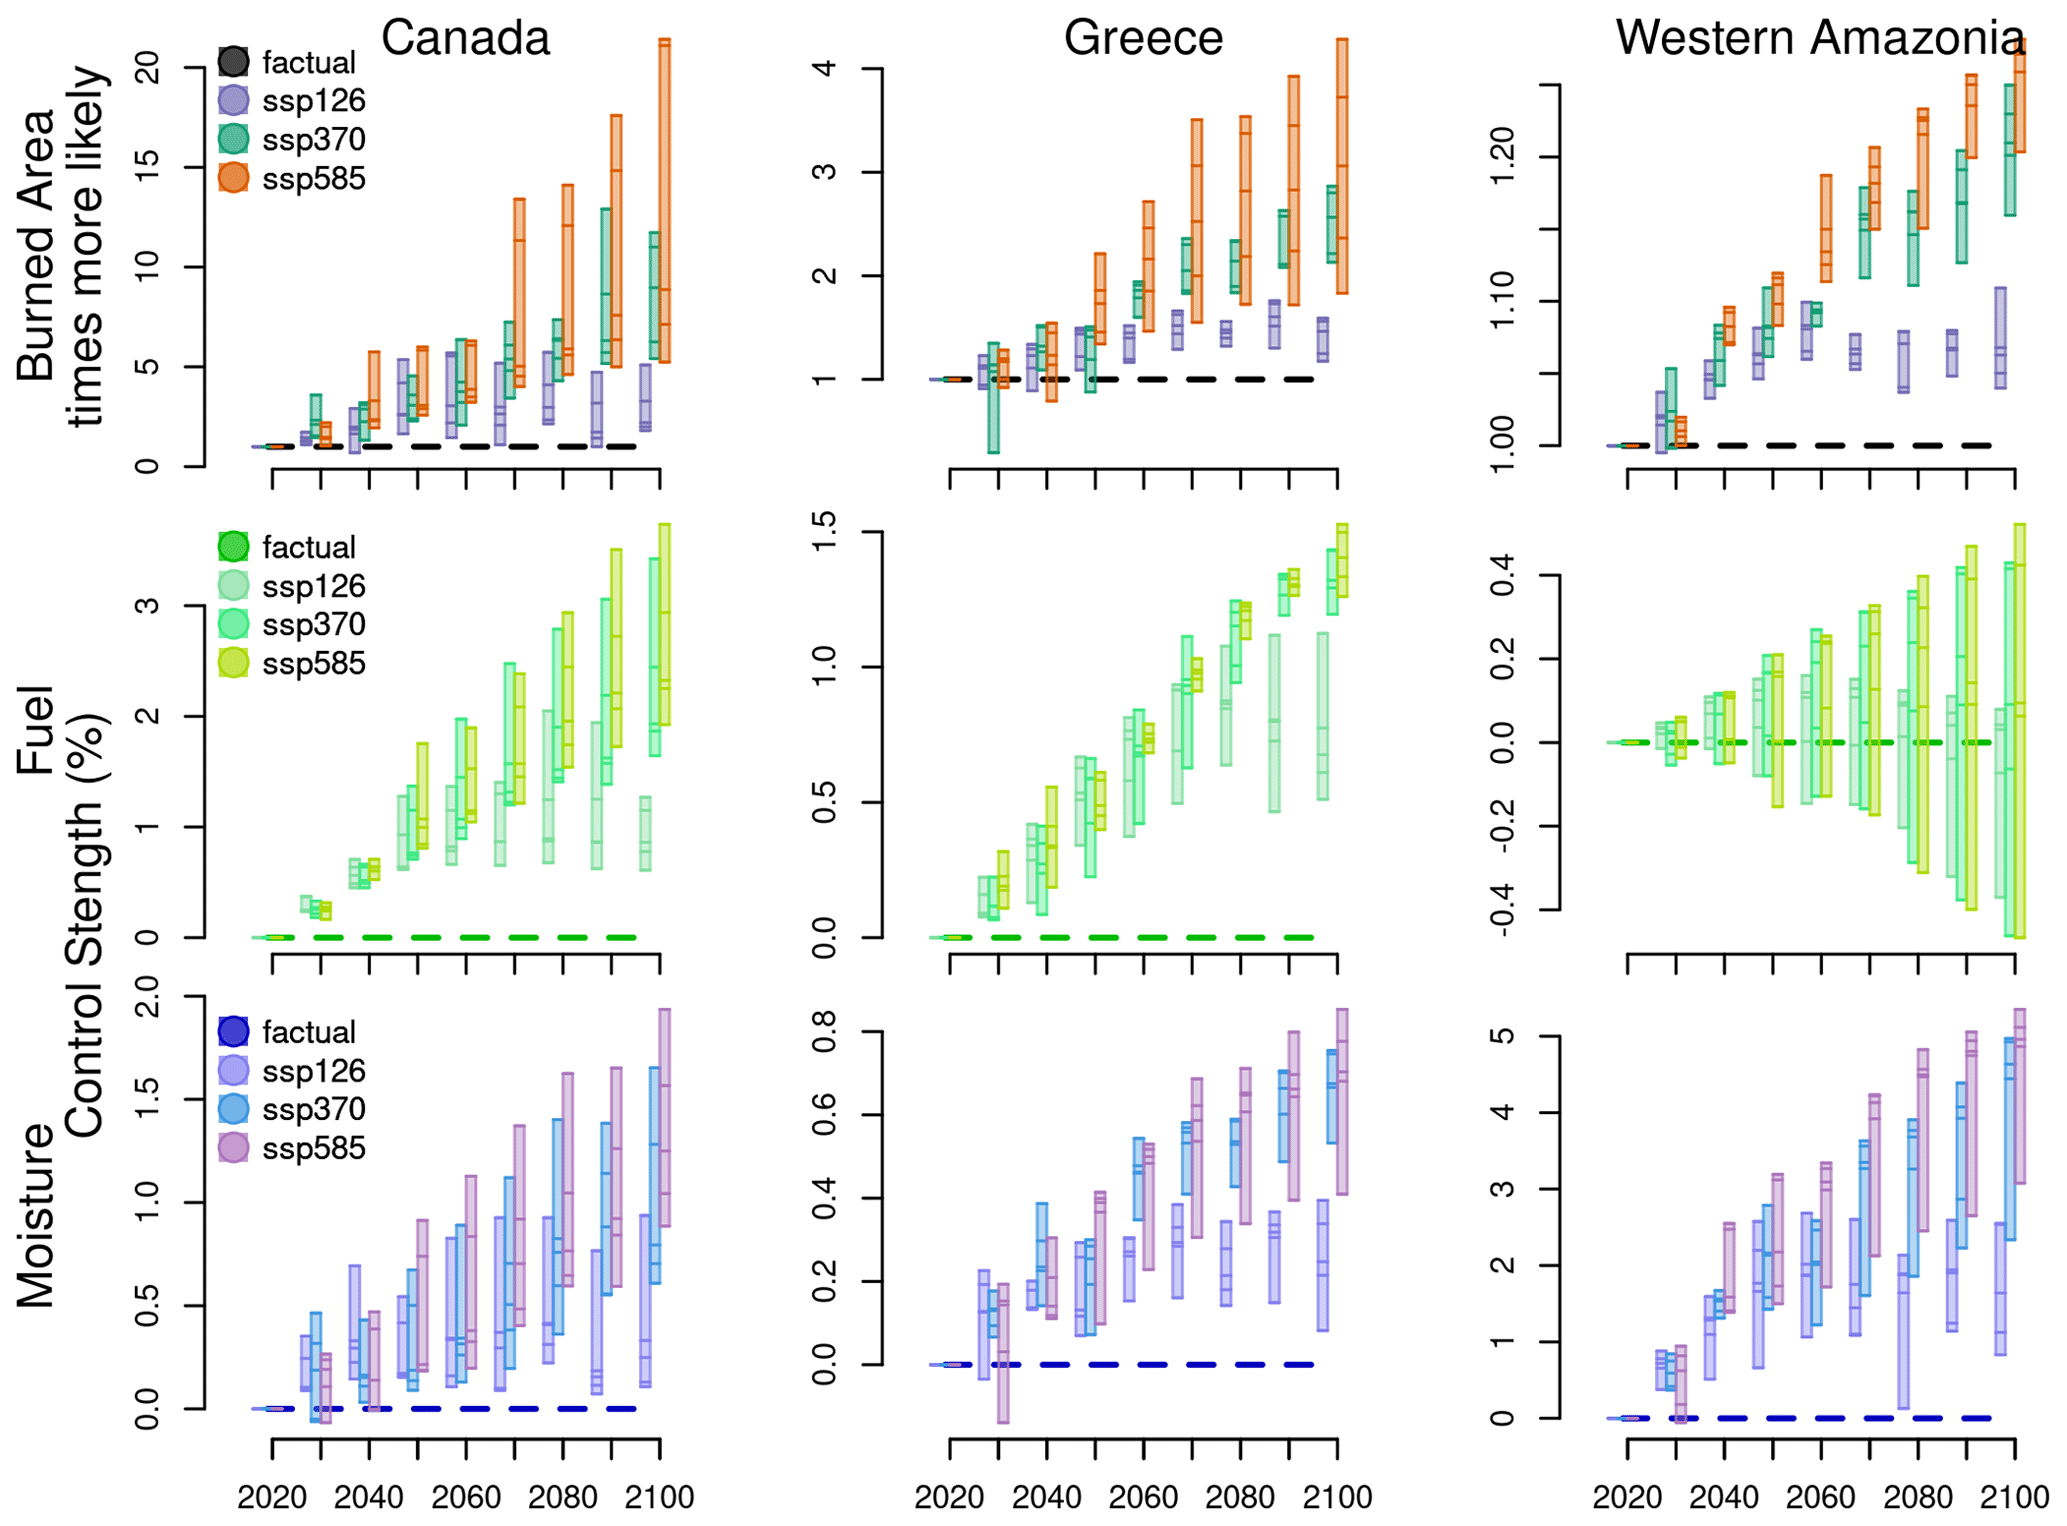
Figure 17Future projections from ConFire of the change in likelihood of BA extent of the magnitude seen in 2023–2024 and the contribution of fuel and moisture controls towards those changes. Each set of bars shows changes for each decade relative to the 2010–2020, with each bar representing a different SSP scenario and the spread of bars indicating the variation across GCMs, with individual bars representing different GCMs.
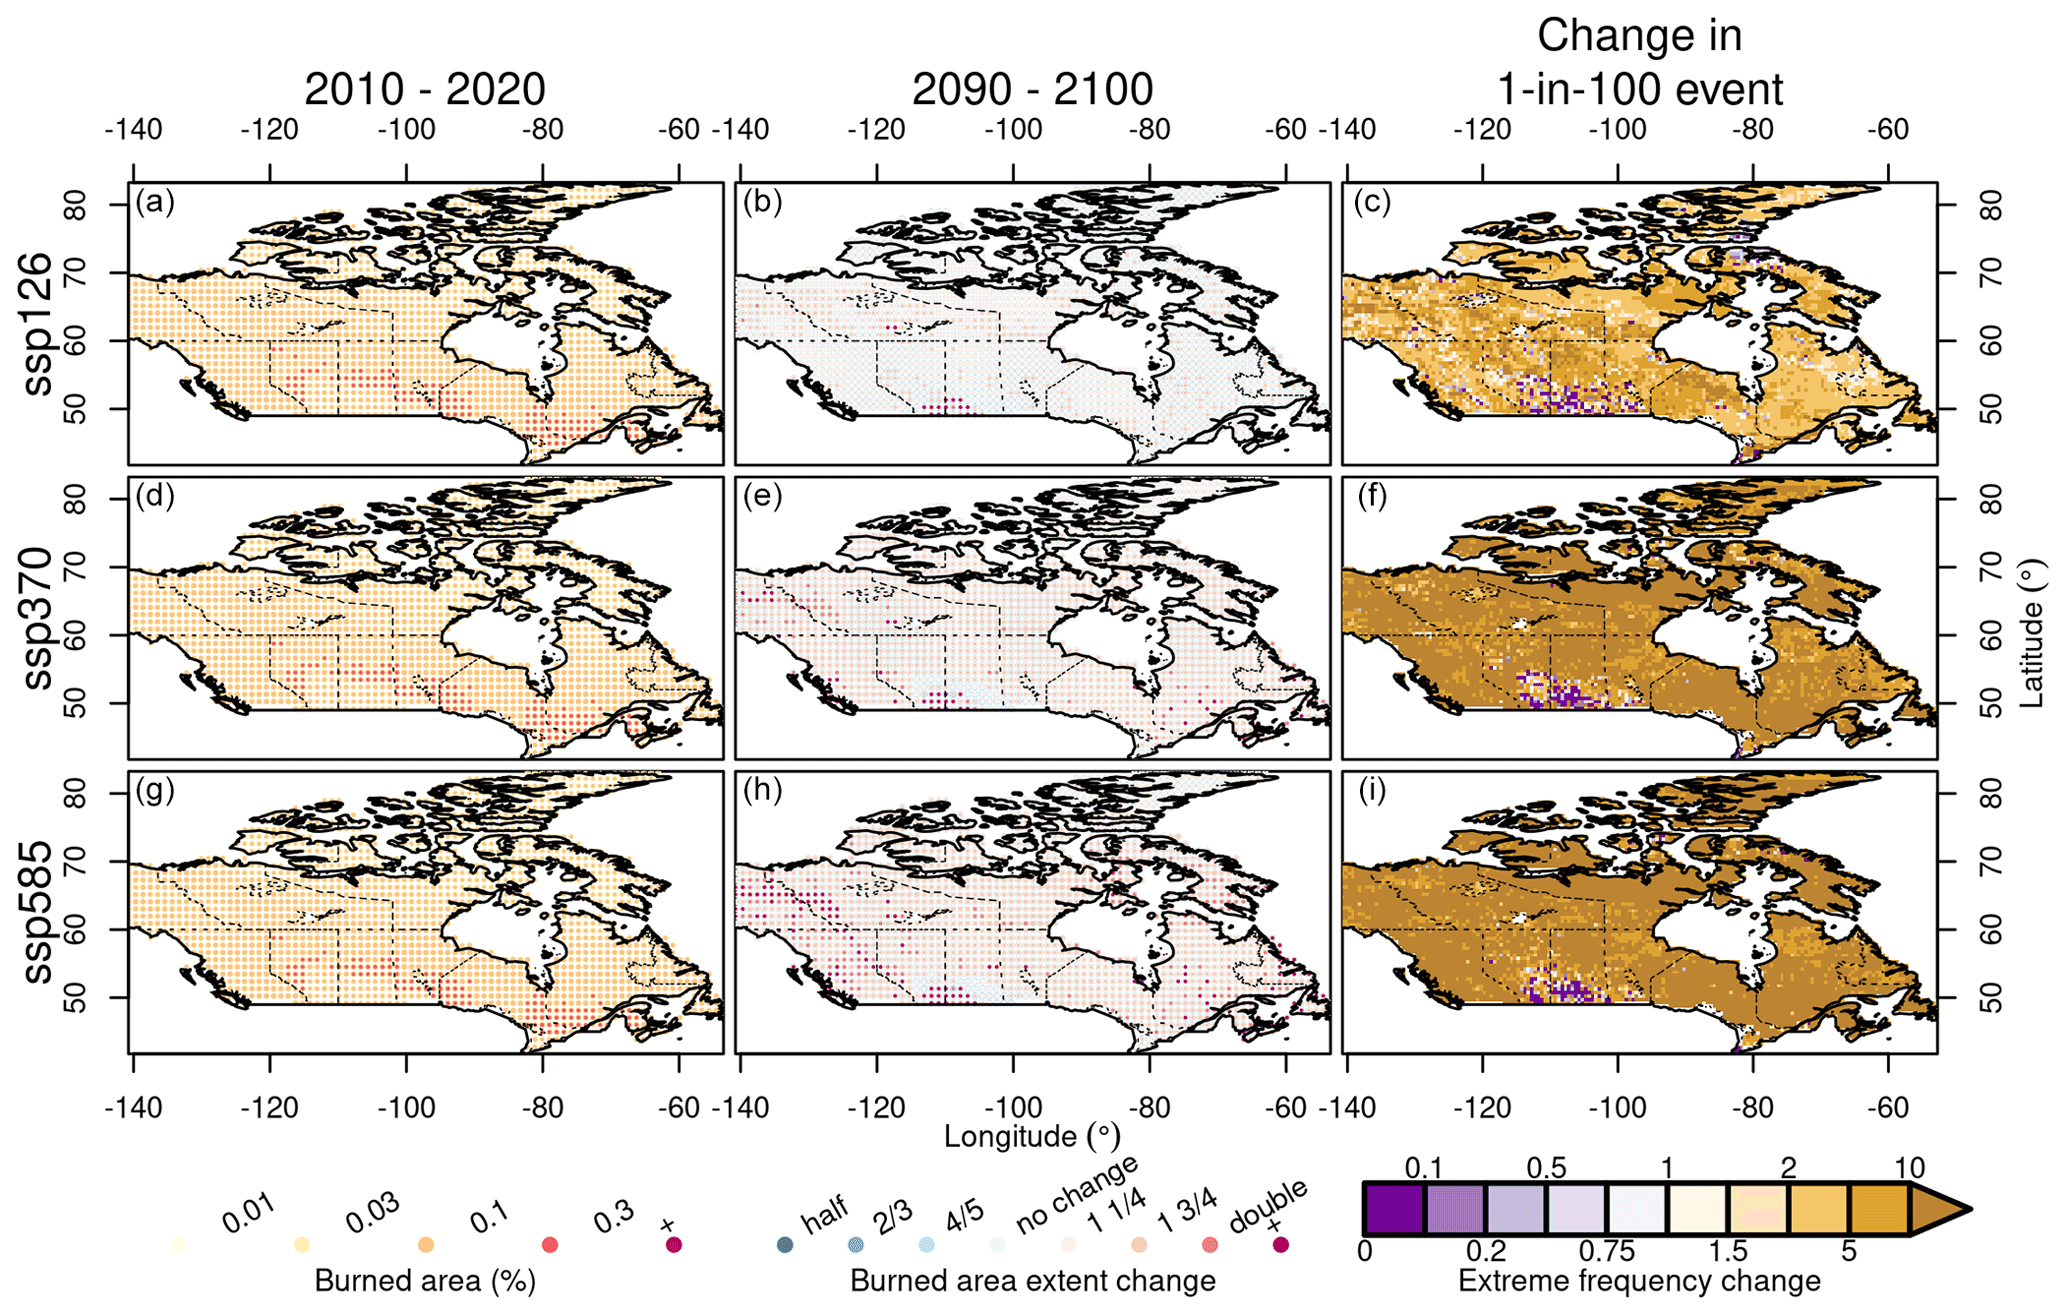
Figure 18Projected changes in June–August BA over Canada by 2090–2100 under three SSP scenarios, with BA simulated by ConFire. (a, d, g) Average June–August BA fraction (%) for 2010–2020. (b, e, h) Relative change in June–August BA extent projected for 2090–2100 period, expressed as a multiplier of 2010–2020 values. (c, f, i) Increased (or decreased) frequency in the 2090–2100 period of a 1-in-100-year event defined for the period 2010–2020, expressed as a multiplier of 2010–2020 values. In the left column, the size of the dot in each grid cell indicates the likelihood (larger means a higher likelihood) of a BA fraction (or being greater than the threshold indicated by the coloured dot; see legend at the base). Likewise, the size of the dot varies with likelihood that the BA fraction exceeds the threshold indicated by the coloured dot (see legend at the base). For example, a large, pale-orange dot in the left column indicates a high likelihood of the BA fraction exceeding 0.05 %, whereas a small, dark-red dot indicates a small (but non-zero) likelihood of the BA fraction exceeding 0.5 %.
Greece
The probability of Greece experiencing BA extent similar to August 2023 (specifically, for cells with BA fraction in the 90th percentile in that month) is estimated to be 1.3 % in any given year under the climate conditions of 2010–2020, according to estimates made using reanalysis data (Table 6; Fig. 17). Bias correction did not fully resolve all discrepancies between the GCMs and reanalysis data, and the GCMs gave a range of likelihoods spanning 0.7 %–1.8 % for any given year under the climate conditions of 2010–2020.
In SSP126, no significant increase in likelihood of an event like 2023 is projected for any decade through 2100 (i.e. beyond the range of 0.7 %–1.8 % for the 2010s). This is despite the likelihood of a 2023-like event in some decades being as high as 2.3 times more likely than in the 2010s under SSP126 (Fig. 17). The lack of significance in these changes may in part reflect our strict definition of significance (i.e. no overlap with the range of the 2010s). When likelihoods vary considerably across models due to the incomplete resolution of biases, the thresholds for significance are high. The small number of observations available for model training in Greece is due to its small domain size, which likely contributes to wider uncertainty bounds and higher biases than in the other, larger focal regions. Overall, Greece could see large increases in the occurrence of extreme BAs even under strong mitigation (SSP126), but uncertainties are large.
SSP350 and SSP585 show significant increases in the likelihood of an event like 2023 by the 2070s (relative to the 2010s) and also diverge significantly beyond SSP126 in the 2080s. SSP585 and SSP370 do not diverge from one another throughout this century, and, in 2100, both scenarios give a likelihood of an event like 2023 of 2.5 %–3.3 %. This range is equivalent to a 1.8-to-4.3-fold increase of the values of the 2010s and an average return time of 31–39 years. The divergence of likelihoods between SSP126 and the two other scenarios (SSP350 and SSP585) is associated with increases in both fuel load and fuel dryness, with particularly striking differences in the latter across the scenarios (Fig. 17).
There are some spatial patterns in the future trajectory of summer BA and the likelihood of future 1-in-100-year BA events in Greece by the 2090s (Fig. 19). Interior parts of Greece tend to see a decline in BA, while coastal parts see an increase in BA, and this pattern broadly holds for 1-in-100-year events. Across scenarios with increasingly low levels of climate change mitigation, there is an expansion to the portion of Greece's total area that experiences increased summer BA and increased frequency of 1-in-100-year events.
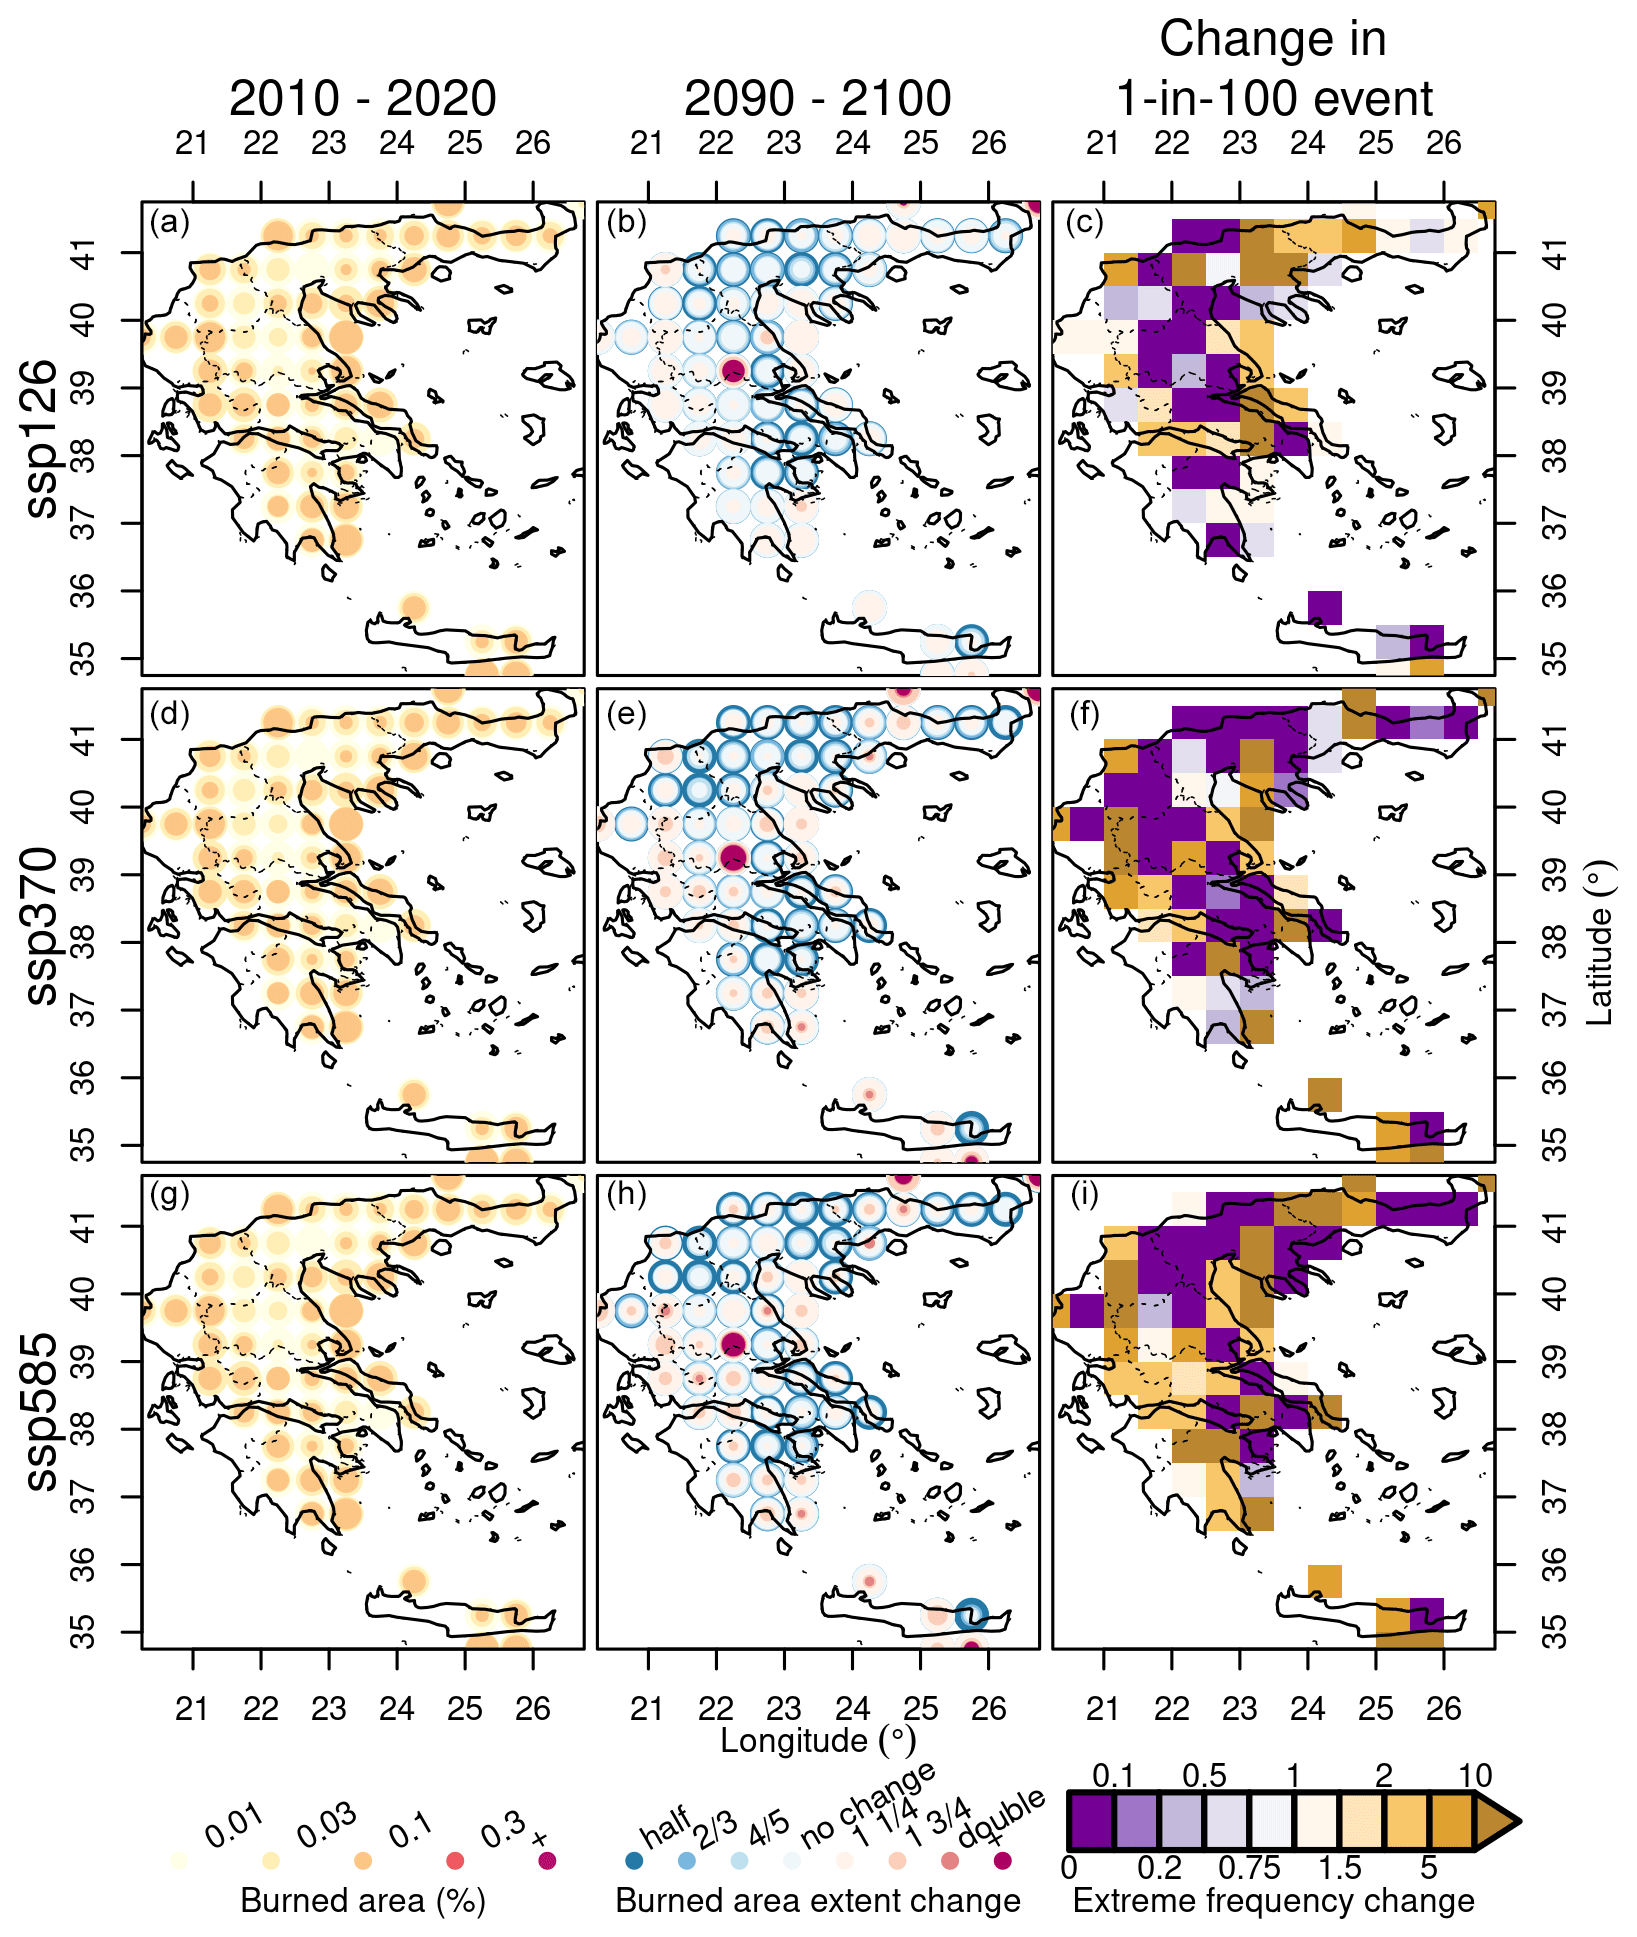
Figure 19Same as Fig. 18 but for Greece and the months July–September.
Western Amazonia
The probability of western Amazonia experiencing BA extent similar to September–October 2023 (specifically, for cells with BA fraction in the 95th percentile in that month) is estimated to be 16.58 % in any given year under the climate conditions of 2010–2020, according to estimates made using reanalysis data (Table 6; Fig. 17). Bias correction did not fully resolve all discrepancies between the GCMs and reanalysis data, and the GCMs gave a range of likelihoods spanning 15.1 %–16.6 % for any given year under the climate conditions of 2010–2020. As expected, these results suggest that the events observed in Amazonia in 2023 were not as extreme as those in Canada and Greece, with returns times of around 6–7 years.
We note that spatial patterns of fire are highly dependent on patterns of land use and human ignition sources in Amazonia (e.g. Fig. S14), and an important caveat is that the BA responses to future climate and land cover change, presented below, are likely to be highly modulated by socioeconomic factors (Lapola et al., 2023; Kelley et al., 2021; Silveira et al., 2020).
Under the SSP585 scenario, the likelihood of an event like 2023 increases significantly in the 2090s to 18.2 %–21.0 %, representing a factor 1.2–1.3 increase versus the 2010s. This increase is primarily attributed to lower fuel moisture, in line with declines in fire weather in this region (Sect. 4.2.1). On the other hand, in the SSP126 scenario representing strong climate change mitigation, the likelihood of an event like 2023 does not change significantly at any point this century (Table 6).
The likelihood of an event like in 2023 increases substantially in the centre of the region by the 2030s under SSP370 and SSP585 (Fig. S21), and the affected area expands through 2100 (Fig. S22). Southern regions with greater population and infrastructure densities see lesser increases in likelihood. Perhaps more important for the region's fire-sensitive forests is the projected increase in BA in SSP370 and SSP585 across forests in the north of the region, which would be expected to impact some of Earth's most remote and pristine forests by the end of this century (Fig. S23).
The 2023 event in Amazonia had a relatively high return interval compared with other focal regions. Hence we tested for change in likelihood of a rarer, 1-in-100-year event in western Amazonia. Under SSP585, we found that the likelihood of a 1-in-100-year event increased significantly by the end of the century to 2.3 %–3.3 % in the 2090s (representing a factor 2.2–2.9 increase in likelihood). The likelihood of a 1-in-100-year event also increased significantly under SSP370 towards the end of this century, but under SSP126 no significant change occurred this century.
Our results show that SSPs associated with lesser climate change mitigation (SSP585 and SSP370) promote more frequent extreme BA in western Amazonia, irrespective of change in land use and human ignition factors, with potential to strongly modulate the BA response to climate. There is greater potential for compounding effects of human factors and climate-driven increases in extreme BA likelihood under scenarios with no or low climate change mitigation than in the case of scenarios with high climate mitigation (such as SSP126).
BA data from NASA's MODIS BA product (MCD64A1) are extended from Giglio et al. (2018) and are available at Giglio et al. (2021, https://lpdaac.usgs.gov/products/mcd64a1v061/, last access: 9 July 2024). GFED4.1s fire C emissions data are extended from van der Werf and are available at https://globalfiredata.org/ (GFED, 2024). GFAS fire C emissions data are extended from Kaiser et al. (2012) and are available at https://confluence.ecmwf.int/display/CKB/CAMS+global+biomass+burning+emissions+based+on+fire+radiative+power+%28GFAS%29%3A+data+documentation (ECMWF, 2024). The Global Fire Atlas data are extended from Andela et al. (2019) and are available from Andela and Jones (2024, https://doi.org/10.5281/zenodo.11400062). Regional summaries of the MODIS BA, GFED4.1s, GFAS, and the Global Fire Atlas presented here are available from Jones et al. (2024, https://doi.org/10.5281/zenodo.11400539). Studies utilising our regional summaries should cite both the current article and the primary reference for the variable(s) of interest: Giglio et al. (2018) for BA; van der Werf et al. (2017) for GFED4.1s fire C emissions; Kaiser et al. (2012) for GFAS fire C emissions; Andela et al. (2019) for the Global Fire Atlas.
Driving data and re-gridded BA target data for ConFire and ConFire outputs are available from Kelley et al. (2024a, https://doi.org/10.5281/zenodo.11420742). Historical (1960–2013) HadGEM3-A data are available through the Centre for Environmental Data Analysis (CEDA) archive of the NERC's Environmental Data Service (EDS) at http://catalogue.ceda.ac.uk/uuid/99b29b4bfeae470599fb96243e90cde3 (Met Office, 2016). FireMIP and ISIMIP driving and output data are available from the Inter-Sectoral Impact Model Intercomparison Project (ISIMIP) repository at https://data.ISIMIP.org/ (ISIMIP, 2024).
ConFire attribution framework code (Kelley et al., 2021; Barbosa, 2024) was incorporated into the FLAME repository (https://github.com/douglask3/Bayesian_fire_models/tree/ConFire, last access: 9 July 2024) and is archived at Zenodo (https://doi.org/10.5281/zenodo.11460232, Barbosa et al., 2024). Configuration settings for Sect. 3 are in namelists/nrt.ini, while settings for Sects. 4 and 5 are in namelists/ISIMIP.ini. Scripts for reproducing plots can be found in the State of Wildfires GitHub repository (https://github.com/douglask3/State_of_Wildfires_report (last access: 9 July 2024) and https://doi.org/10.5281/zenodo.11460379, Kelley et al., 2024b).
The code used to produce the FWI attribution results is available in the State of Wildfires GitHub repository (https://github.com/douglask3/State_of_Wildfires_report (last access: 9 July 2024) and https://doi.org/10.5281/zenodo.11460379, Kelley et al., 2024b). FWI code can be accessed via the ECMWF GitHub (https://github.com/ecmwf-projects/geff, Di Giuseppe and Maciel, 2022). All details of the data and code used for the FireMIP attribution results are documented in Burton et al. (2024).
The current version of ibicus, used for JULES-ES bias correction, is available from PyPI (https://pypi.org/project/ibicus/, Spuler and Wessel, 2024a) under the Apache License version 2.0 and is described in detail at https://ibicus.readthedocs.io/en/latest/ (Spuler et al., 2024b). Ibicus is also archived on Zenodo by Spuler and Wessel (2023; https://doi.org/10.5281/zenodo.8101898). Model code and evaluation for bias correction of JULES-ES model output can be found on the State of Wildfires GitHub repository (https://github.com/jakobwes/State-of-Wildfires---Bias-Adjustment (last access: 9 July 2024), with an archived DOI available at https://doi.org/10.5281/zenodo.13255783, Spuler and Wessel, 2024b).
8.1 Summary of the state of wildfires in 2023–2024
8.1.1 Extreme wildfire events of 2023–2024
-
Global. A total of 3.9×10⁶ km2 burned globally during the 2023–2024 fire season, slightly below the average of previous seasons (4.0×10⁶ km2 ) and ranking 13th since 2002. Despite the lower BA, fire C emissions were 16 % above average, totalling 2.4 Pg C, ranking seventh highest since 2003. Global C emissions were pushed up by record emissions in Canadian boreal forests and pulled down by below-average fire activity in the African savannahs (significant because fires in the African savannahs make, on average, the largest contribution of any continental biome to global mean annual BA and emissions). If global savannah fire emissions had been in line with their average in 2023–2024, global fire C emissions would have been the highest on record.
-
North America. There was record fire activity in Canada's boreal forests, with BA reaching 6 times the average and fire C emissions over 9 times the average and contributing significantly towards global C emissions (24 %, up from a mean value of 3 % from prior fire seasons). Canada experienced extreme and widespread fires, with over 150 000 km2 burned, prompting evacuations of 232 000 people. Eight firefighters lost their lives. Fires in Canada led to a significant degradation of air quality, with populations living in the United States and Canada exposed to atmospheric concentrations of PM2.5 over daily standards for periods of 2 weeks to multiple months. The United States saw generally below-average fire activity, but the Lahaina wildfire in Maui, Hawaii, resulted in 100 civilian deaths, destroyed 2000 homes, and displaced 10 000 people. Texas recorded its largest ever single fire, which destroyed 130 homes and killed two civilians.
-
South America. South America experienced somewhat below-average fire extent overall, but notable exceptions included significant anomalies in the northwest of the continent. In Brazil's State of Amazonas, fire counts reached record highs amidst drought conditions, severely impacting air quality in Manaus. In neighbouring parts of Bolivia, Peru, Venezuela, and Guyana, also affected by regional drought, record or high-ranking levels of fire counts, extent, and carbon emissions were observed. In Chile, the Valparaíso wildfire in February 2024 killed 131 people and caused widespread property destruction.
-
Europe. Europe experienced low fire extent in 2023–2024; however the Evros fire in Greece set a new EU record for individual fire size (around 900 km2) and killed 19 people. Individual fires in Greece, Spain, Italy, Portugal, France, and Scotland led to a range of impacts including large-scale evacuations, significant suppression costs, disruption of water supplies, damage to infrastructure or agricultural lands, impacts on tourism and local economies, and destruction of properties (see Appendix A).
-
Oceania. Above-average fire activity and extent were observed in the savannahs, grasslands, and shrublands of Western Australia and the Northern Territory of Australia. Although less impactful than the 2019–2020 Black Summer fires due to their remoteness, wildfires near Perth resulted in property destruction. The Tara and Mount Isa fires in Queensland destroyed 65 homes and claimed two lives. In Victoria, fires destroyed over 40 homes and injured five firefighters. In New South Wales, forest fires caused widespread smoke-related damages.
-
Asia. Most parts of Asia saw low fire activity. Lao PDR, Thailand, and Vietnam experienced high fire counts amidst reported heatwave conditions and a possible uptick in agricultural fire use, leading to regional haze and air quality issues. In Mongolia's Dornod Province, wildfires burned large parts of the Daurian steppe, and firefighting was required to stop fires crossing the border into Russia.
-
Africa. Africa experienced low fire extent in general during 2023–2024, with BA 13 % below average in the African grassland, savannah, and shrubland biome. However, extreme fires in northern Africa, particularly Algeria and Tunisia, prompted significant emergency responses including assistance from the EU. In Algeria, wildfires occurring in temperatures around 50 °C resulted in 34 deaths and over 1500 evacuations, with over 8000 personnel deployed to combat the fires. Tunisia faced similar challenges with strong winds exacerbating wildfires, leading to evacuations in the northwestern region. In coastal South Africa, fires in the Western Cape caused structure damage and evacuations.
8.1.2 Diagnosing drivers and assessing predictability
-
In Canada, fire weather conditions were the primary drivers of the record-breaking fire activity and extent during 2023. However, there were notable contributions from other drivers, such as upticks in ignitions or human factors that were not explicitly represented in our analyses. This highlights potential inadequacies in predicting some ignition sources or accurately representing fire propagation in current forecasting systems.
-
The exceptional nature of the Evros fire in Alexandroupolis, Greece, could not have been predicted using fire weather forecasts. While there were discernible indications in the Fire Weather Index (FWI) records that the days around the event were more extreme than most days in the fire season, similar conditions were also observed in other periods without resulting in the same catastrophic impacts. This highlights the intrinsic difficulties in forecasting isolated extreme fire events and underscores the need to advance early warning systems beyond fire weather to consider fuel availability and ignition variability.
-
The extreme fire season in western Amazonia was driven by prolonged drought conditions linked to the strong El Niño. Many fires developed, triggered by lightning ignitions early in the season amidst high fire weather anomalies. Other than weather conditions that acted as persistent controls for fire activity, several periods with high active fire counts were not predicted in late August and throughout September, likely due to the result of unrepresented ignition sources.
-
In all focal events, extreme burned areas were driven by anomalies in multiple controls on fire. Weather, fuel moisture, and fuel abundance were all critical factors. The synchronous occurrence of anomalies in fire weather, high fuel load, and low fuel moisture created the conditions leading to the anomalous burned areas recorded in all three events. This underscores the fact that no single bioclimatic factor can explain the most severe fires. Instead, multiple contributing controls must coincide for the most extreme events to arise. Factors such as ignitions, suppression, and landscape fragmentation, related to human activities, likely played important roles in modulating the western Amazonian and Greece events.
-
Fuel load is an important modulator of the relationship between fire extent and fire weather. Higher and/or drier fuel loads combined with high fire weather conditions caused the unprecedented extent of burning in Canada and western Amazonia. The boundaries (extinction points) of extreme fires in Canada and Greece often corresponded to areas with lower fuel loads, demonstrating that discontinuity in fuel availability constrained fire spread.
8.1.3 Attribution to global change
-
In Canada, anthropogenic forcing increased the chance of high fire weather in 2023. Total climate forcing led to higher BA, whereas socio-economic factors may have decreased burning. Anthropogenic forcing (resulting from greenhouse gas emissions and land-use change) increased the probability of experiencing high fire weather in June 2023 3-fold. It is virtually certain that total climate forcing (resulting from climate change since the pre-industrial period) increased the BA in Canada by up to 40.1 %. Socioeconomic factors related to land use, ignitions and suppression may have reduced burning, though with low confidence.
-
In Greece, anthropogenic forcing increased the chance of high fire weather in 2023. Total climate forcing led to higher BA, and socio-economic factors may have increased or decreased BA. Anthropogenic forcing increased the probability of experiencing high fire weather in August 2023 by 1.9–4.1 times. It is likely that total climate forcing increased the BA in Greece by up to 17.7 %, whereas socio-economic factors could have led to an increase or decrease. Climate change has increased average BA in the wider Mediterranean region, but this has been mainly offset by socio-economic factors.
-
In western Amazonia, anthropogenic forcing has greatly increased the chance of high fire weather in 2023. It is virtually certain that total climate forcing led to higher BA, and very likely that socio-economic factors also contributed. Anthropogenic forcing increased the probability of experiencing high fire weather by more than a factor of 20. It is virtually certain that total climate forcing increased BA in western Amazonia by up to 49.7 %, and very likely that socio-economic factors exacerbated the increase. Climate change has increased today's average BA in the region, and all forcings have led to an overall increase in burning.
8.1.4 Seasonal and multidecadal outlook
-
While the positive El Niño phase of ENSO is subsiding towards a neutral phase in 2024, the Indian Ocean Dipole is persisting in its positive phase, with potential to influence global fire patterns. The 2023–2024 El Niño event emerged as the fourth-largest positive anomaly on record; however most simulations forecast a transition to ENSO-neutral conditions in 2024. Positive IOD phases are associated with elevated BA Amazonia, Indonesia, and parts of Australia, though these tend to depend on interactions with ENSO.
-
Seasonal predictions of fire weather through August 2024 highlight moderate positive anomalies (75th percentile) in parts of Canada and much of South America including Amazonia, as well as in central Africa, southern Africa, southeast Europe, western Australia, southeast Asia, and northeast Asia. Extreme (95th percentile) anomalies are rare in the forecast through August 2024.
-
In Canada, the future likelihood of events like in 2023 is increased by rising fuel load and dryness, with high mitigation pathways significantly reducing these risks. The likelihood of extreme fire events similar to those in June 2023 is currently low (0.15 % for any given year in the 2010s or 1 in 700 years). The likelihood is expected to increase to 0.42 %–2.2 % by the 2040s and thereafter continue to increase under high emissions scenarios (SSP585) reaching 2.1 %–3.7 % by the 2090s. The probability of experiencing such events at least once by the 2090s is estimated to be 65 %–90 % under SSP585, compared to 19 %–76 % under SSP126. Individuals born in Canada during the current decade have a 48 %–84 % likelihood of witnessing an event on the scale of 2023 again in their lifetime under SSP370 (a scenario close to present-day trajectories without additional mitigation efforts).
-
In Greece, high mitigation scenarios result in no significant change in the likelihood of an event like 2023 through 2100, whereas scenarios without mitigation lead to significant increases. The current likelihood of extreme fire events like those in August 2023 is around 1.3 % annually for any given year in the 2010s (or roughly 1 in 100 years). Under SSP126, there is no significant increase projected through 2100, whereas significant increases in likelihood (to up to 3.3 %) are projected under SSP585 and SSP370 by the 2090s, implying more frequent extreme fire events. Coastal areas of Greece are expected to experience the greatest increases in risk, whereas interior regions may experience declines.
-
In western Amazonia, the effects of climate change on extreme fire likelihood in future scenarios are chiefly governed by fuel moisture effects, which are likely to be strongly modulated by local changes in land use and human ignition sources. The potential for compounding effects between fuel dryness and local stress factors is minimised in high-mitigation scenarios. The current likelihood of extreme fire events like those in September–October 2023 is 16.6 % (or roughly 1 in 6 years). Under SSP585, the likelihood of such events increases significantly to 18.2 %–21.0 % by the 2090s. In addition, there is a significant rise in the probability of 1-in-100-year events by the end of the century under SSP585 and SSP370. No significant rise in probability of 1-in-6 or 1-in-100 events is seen under SSP126. Hence, while increased fire risks related to climate change in the Amazon can be compounded by human activities, this is least likely under SSP126. The impact of extreme fire events is expected to be severe in pristine northern forests, emphasising the need for strong climate change mitigation.
-
Overall, high-emissions scenarios (e.g. SSP585, SSP370) lead to significantly increased likelihood of major events like those seen in the 2023–2024 fire seasons in future, highlighting the critical importance of strong climate change mitigation efforts (e.g. SSP126) to reduce the future likelihood of extreme fire events. Even though SSP370 and SSP585 scenarios suggest significant increases in extreme events, the confidence that strong mitigation (SSP126) can avoid significant portions of increased risk is a major promising outcome of this work. Our findings emphasise the importance of continued and enhanced mitigation efforts.
8.2 Roadmap for the State of Wildfires report
The report successfully achieved its primary objectives, which included identifying and contextualising extreme wildfires and wildfire seasons over the past year, selecting focal events with significant societal and environmental impacts, and diagnosing the factors contributing to these events. The report also assessed the predictive capabilities of existing systems, highlighting their strengths and limitations, and attributed the occurrence of focal events to anthropogenic factors, including climate change and land use. Additionally, it provided an outlook for future wildfire probabilities, emphasising the limitations of current long-term forecasting tools and the increasing likelihood of extreme fire events under future climate scenarios, particularly highlighting the need for improved accuracy in regional projections.
The fire science community is currently navigating several research frontiers to improve prediction of extreme fires and understanding of their causes, with the view to enhance preparedness, response, mitigation, and adaptation to wildfires in wider society. The field is advancing its ability to observe individual fires, assess conditions leading to extreme fires, and predict their occurrence on timescales ranging from hours to decades. Additionally, there is increasing focus on monitoring and modelling the diverse impacts of extreme fires on society, the environment, and the economy.
As part of this inaugural edition of the State of Wildfires report, we present, in Appendix B, a stocktake of current capabilities, challenges, and emerging opportunities in the observation and modelling of extreme fires and their impacts. Appendix B is intended for the interdisciplinary community of fire scientists and represents a contribution to agenda-setting within this field of research. It will not be revised annually but may be revisited in future to serve as a stocktake of progress in this field. Here, we briefly summarise the specific role that the State of Wildfires report should serve as advances in the observation, prediction, and modelling of extreme fires and their impacts come to fruition.
8.2.1 Definition
The State of Wildfires report will facilitate a community effort on a protocol for defining extreme fire events or fire seasons.
This report emphasises important issues in the definition of extreme fires, a problem that affects the definition of many terms used in fire science including “wildfire” and “megafire” (Appendix B; e.g. Shuman et al., 2022; Linley et al., 2022). Definition is complicated by the impact of fires on society and the environment across many impact sectors, with the magnitude of impact not necessarily correlating with observable fire traits such as BA (Appendix B). In future years, regional experts would benefit from a protocol or guidelines that can be used for categorising extreme fire events or seasons. To support future iterations of the State of Wildfires report, we will coordinate workshops with broader sections of the fire science community with the aim to produce guidance for future years. Central to this task is the inclusion of communities from broad geographies so that any output respects fire impacts that are considered to be regionally significant.
8.2.2 Observation
The State of Wildfires report will advocate for and utilise new harmonised fire observation products.
Consistent, long-term records of fire extent and properties are fundamental for studying extremes, which cannot be characterised without reference to historical ranges (Appendix B). The MODIS instrument has been crucial in tracking global fire progression and emissions over 2 decades, but its continuity is threatened as the Terra satellite nears decommissioning, necessitating harmonisation with newer datasets like VIIRS, Landsat, and Sentinel with MODIS records for consistent fire observation.
The State of Wildfires report further underscores the critical strategic need for a continuous and harmonised dataset of fire observations beyond the MODIS era (Appendix B). To support future iterations of the report, we will advocate for the provision of harmonised products within the Earth observations communities. In addition, regional products often provide scope to characterise the extremity of events over multidecadal timescales and are now being provided in globally harmonised formats compatible with global analyses such as ours. These regional datasets should be utilised in future iterations of the State of Wildfires report.
The State of Wildfires report will stimulate progress on combining multiple fire observation streams to better identify and characterise extreme fire.
This report highlights the need to advance our capacity to observe fires that are impactful in diverse ways (Appendix B). In particular, there is a growing need to move “beyond burned area” and towards a wider set of intensity, severity, and behaviour metrics that often relate more strongly to impacts on society and the environment than BA. The integration of individual fire data from the Global Fire Atlas in this iteration of the State of Wildfires report is one example of including wider fire parameters such as size and rate of growth. Further applications of the dataset or other individual fire atlases (e.g. Laurent et al., 2018; Artés et al., 2019) could include assessing days with many synchronous large fires, which challenge fire management (e.g. Abatzoglou et al., 2021), and identifying impactful fires by their intersection with population centres (e.g. Modaresi Rad et al., 2023). Combining individual fire behaviour data with fire radiative power and biomass combustion estimates might better identify intense or severe fires with significant consequences for ecosystems and society (e.g. Nolan et al., 2021a).
Overall, the State of Wildfires report must stimulate progress on moving beyond burned area and combining diverse observational capacities to better identify and characterise extreme fire events, and we intend to expand our use of such insights in future iterations. Likewise, the report must be poised to adopt any emerging datasets that quantify fire impacts on the various impact sectors outlined in Appendix B into its definition of extreme fires.
8.2.3 Prediction
The State of Wildfires report will advocate for the use of extended range forecast to identify early onset of fire weather conditions.
Global fire danger monitoring systems currently use short- to medium-range weather forecasts, typically up to 10 d (Appendix B). However, state-of-the-art seasonal forecasting systems can predict fire-conducive conditions up to 1 month in advance and, in some regions, up to 2 months. Longer-term predictability is achievable in regions where fire activity corresponds strongly with climate modes such as ENSO.
By presenting an annual opportunity to take stock of current capabilities in forecasting horizons for significant global fire events, the State of Wildfires report will continue to showcase and advocate for advances in the forecasting window for extreme fire potential on subseasonal to seasonal timescales.
The State of Wildfires report will stimulate progress on the use of AI and informatics methods to aid the forecast of fire activity globally.
There is strong potential for data-driven applications, such as machine learning, to improve predictions of extreme fire occurrence and move beyond traditional prediction systems based on meteorological indices such as the FWI (Appendix B). These methods can incorporate diverse data inputs representing the influence of fuel loads, fuel moisture, ignition opportunities, and suppression on fire likelihood, therefore improving upon indices that are mostly a function of weather conditions. Tools used in this report, such as ConFire, are structured to harness new data as they become available, including near-real-time data, improved fuel observations, and detailed human–fire interaction data. ConFire is also being developed to optimise its representation of extreme fire events by incorporating more flexible response curves into its BA predictions (Barbosa, 2024). The State of Wildfires report will showcase the benefits of these emerging technologies in enhancing fire prediction and management.
8.2.4 Attribution
The State of Wildfires report will promote the enhancement of low-latency attribution approaches.
Fire attribution techniques are relatively novel compared with more established approaches for extremes such as heatwaves. Part of the challenge in attributing fire is that it is a complex hazard comprising multiple compound risks across both meteorological and human drivers, all of which must be represented in the driving data sets used by models (Appendix B). A particular challenge that we faced in our current work was latency in the reanalysis datasets used to drive our model for novel attribution of fire extent. Our working group will therefore engage with the ISIMIP project to promote the creation of low-latency reanalysis products to support responsive attribution assessment in future State of Wildfires reports and in other near real-time applications. An additional avenue for enhancement of future reports is to include a greater number of climate models in the attribution work by widening the participation of other groups working on attribution internationally.
The State of Wildfires report will support the expansion of attribution methods that target a range of extreme fire metrics.
Extending attribution approaches to a broader range of extreme fire properties (e.g. aspects of the fire size or fire behaviour distributions) is increasingly possible as observations of individual fire characteristics and behaviour avail (Appendix B). Capacity to attribute individual fire properties can be built by coupling the ConFire model with process-based models within attribution frameworks, allowing attribution of specific extreme fire characteristics to climate change and other forms of global change.
8.2.5 Projection
The State of Wildfires report will harness projections from multi-model ensembles.
In the coming years, FireMIP and ISIMIP will provide ensembles of model projections of future BA for the first time (Appendix B). The State of Wildfires report will make use of these simulations as soon as they are available, thus improving upon the single model (ConFire) employed in the current edition and improving characterisation of uncertainty in the projections.
The State of Wildfires report will support the expansion of projection methods to target a range of extreme fire metrics.
An ambition for the State of Wildfires report is to provide projections of future fire properties that are beyond burned area, such as the fire size and behaviour distribution (Appendix B). This capacity can be built by combining the ConFire model with multiple process-based models from FireMIP and ISIMIP. Advances in this area have particular societal relevance in resource planning, as changes in fire behaviour (not only fire extent) are likely to factor into decision-making around future suppression resource requirements.
This appendix includes the review completed by an expert panel to supplement our quantitative analyses of extremes in the 2023–2024 fire season (see Sect. 2.1). Details of the assembled panel are provided in Table A1.
Table A1Experts contributing to the identification of extreme events and characterisation of the global fire season during March 2023–February 2024.
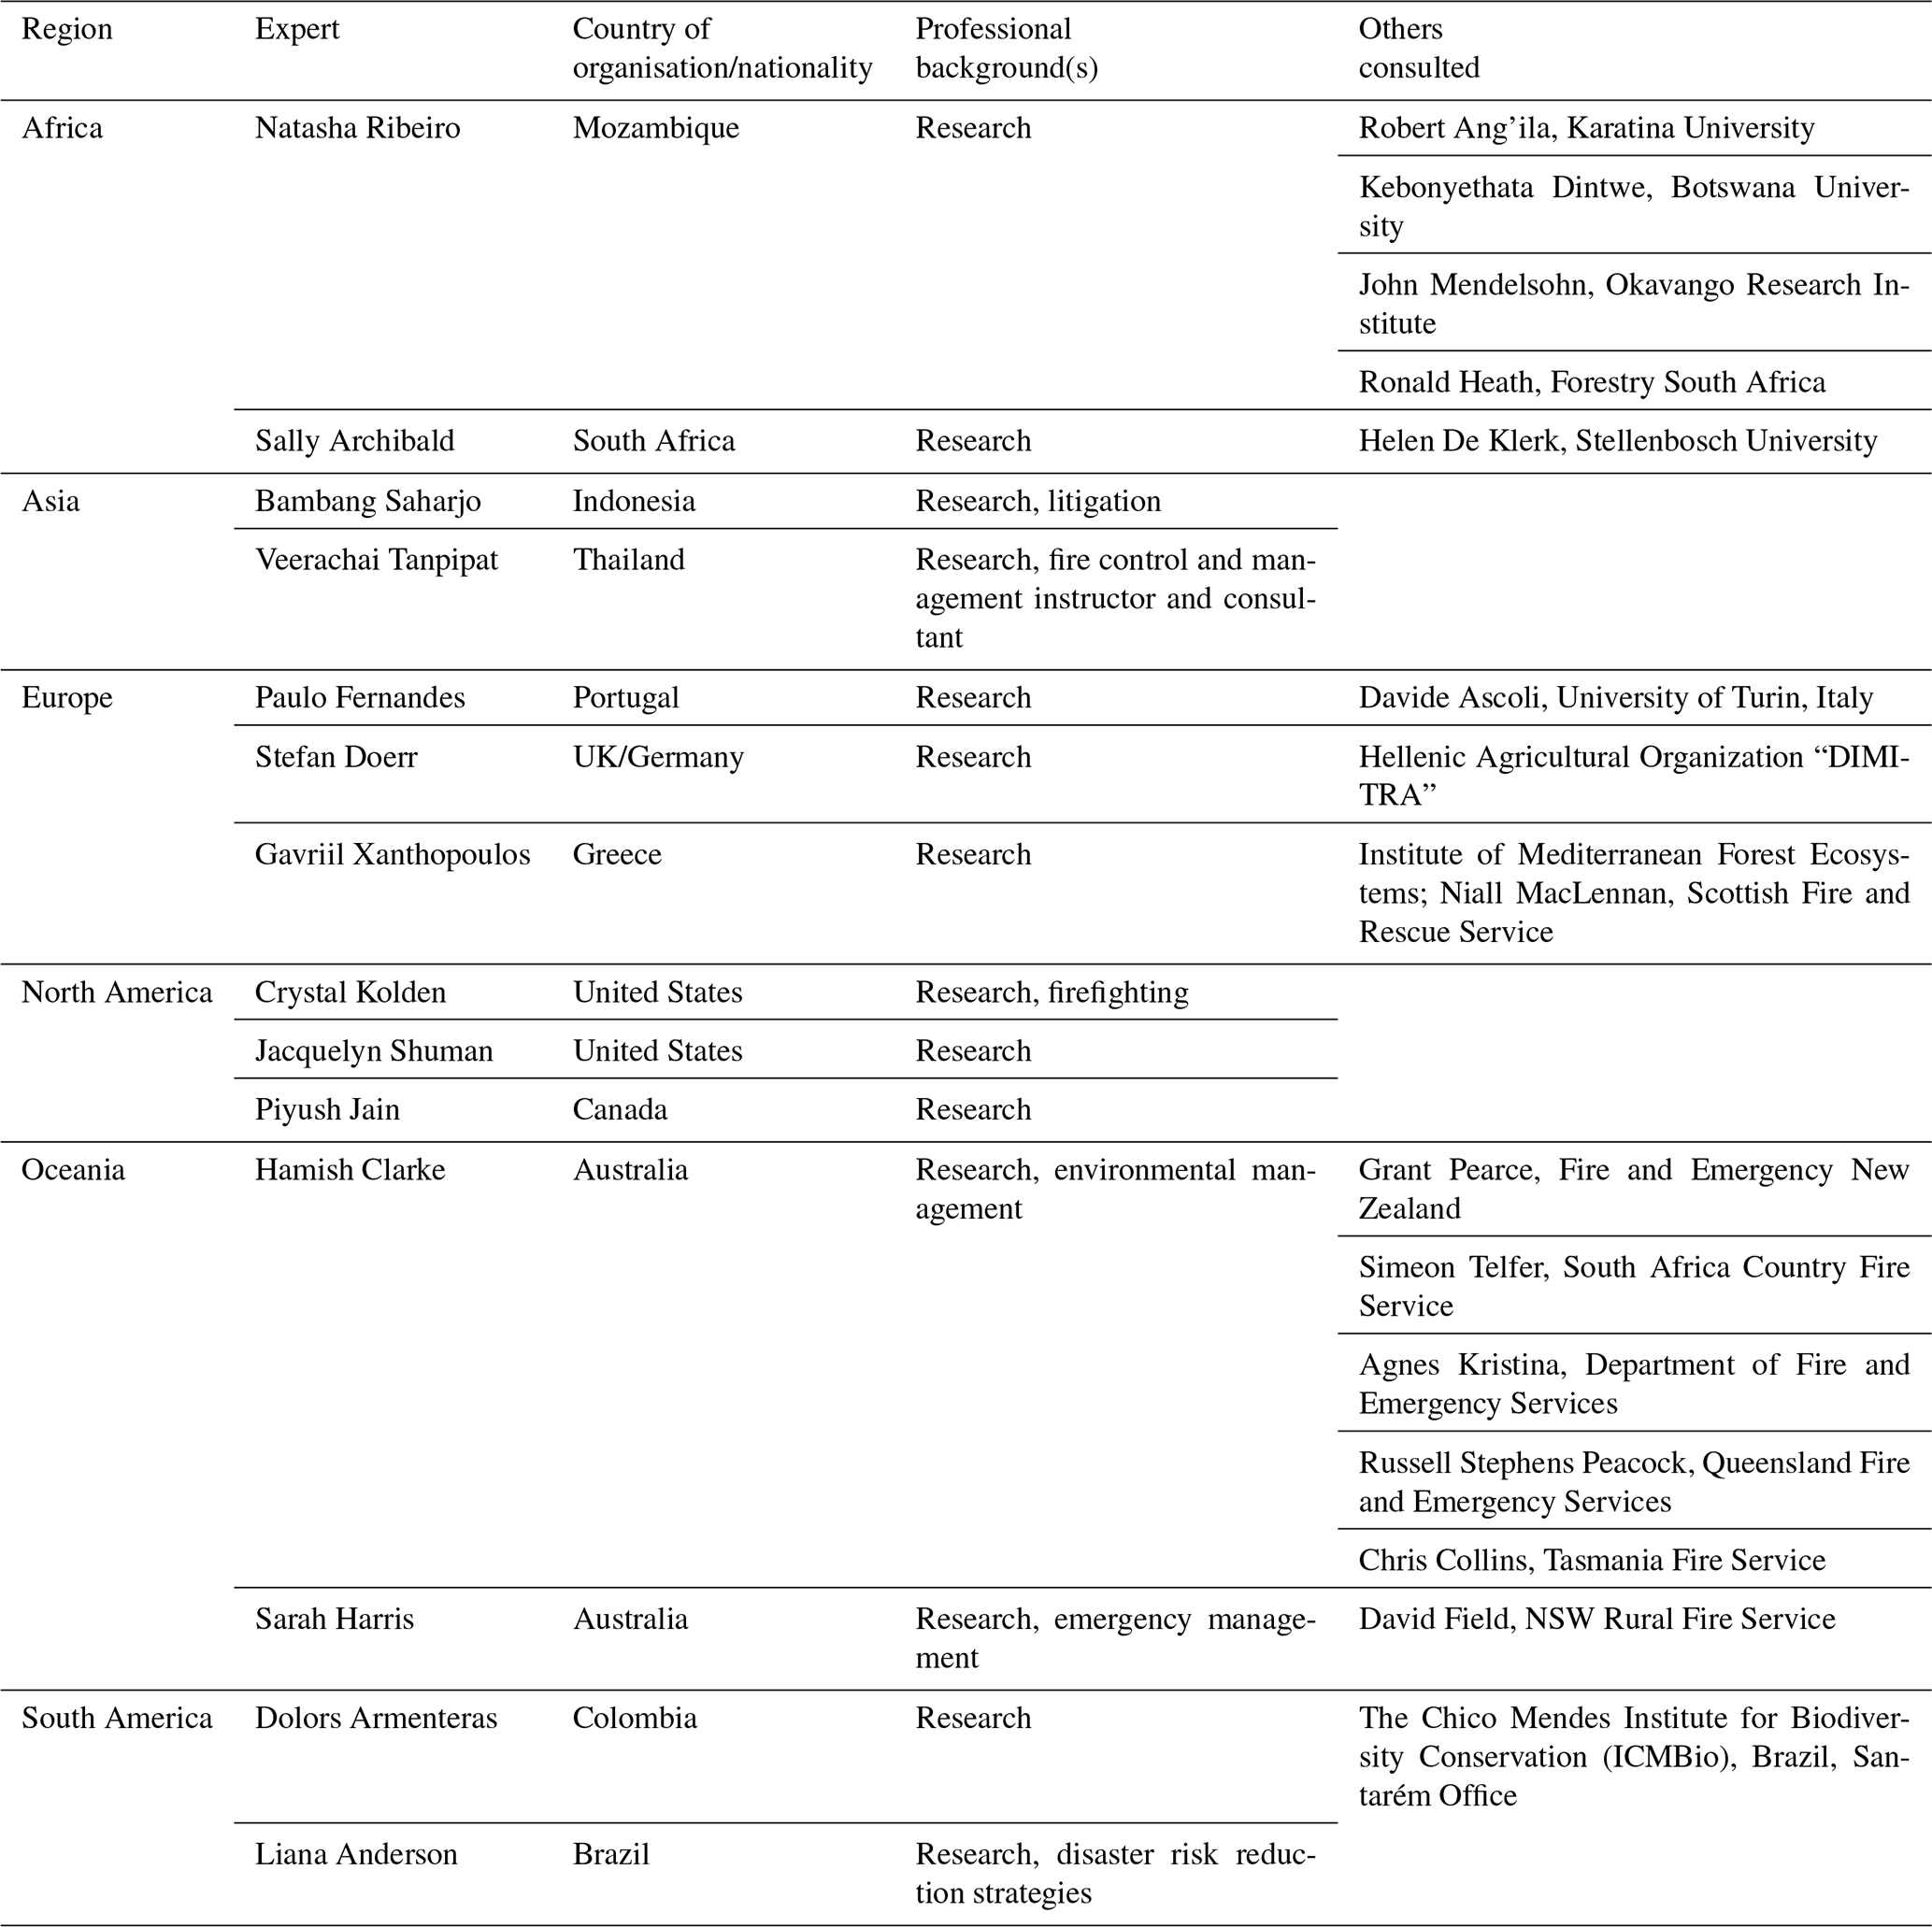
A1 Africa
South Africa and Botswana experienced higher-than-average BA and fire size (Figs. 2, 4) in 2023–2024, which some regional experts had expected following three consecutive years of above-average rainfall that increased grassy fuel loads in the fuel-limited savannas and grasslands. This has potentially been exacerbated by a lack of prescribed burning and active fire suppression in the privately held land and conservancies in the region, which likewise would have resulted in fuel build-up (Atlas of Namibia, 2021). The socio-economic impacts of these large fires were minimal (extensive grassland fires linked to high rain years are expected due to periodic 7–20-year wet–dry cycles in these ecosystems).
In east Africa, the area burned was extremely low in 2023–2024. This was in line with the expectations of regional experts given the effects of a triple La Niña in this region, which causes droughts in east Africa (in contrast to southern Africa). This multi-year drought meant that there were limited grass fuels to burn, and it reduced the likelihood of spread of accidental ignitions in many of the east African rangelands. However, the extreme fire weather enabled fires to burn through upland forests, which are not normally flammable. This included a regionally significant fire in Aberdare Forest, Nyeri County, Kenya, which reportedly burned 160 km2 on 17 February 2023 (Citizen Digital, 2023).
The 2023 heatwave in North Africa exacerbated fire behaviour in the region (Al Jazeera, 2023a). Algeria recorded significant fires in the latter half of July, facilitated by high temperatures that reached upwards of 48 °C (Al Jazeera, 2023b). Over 8000 personnel, including firefighters and the military, were deployed to combat rapidly spreading fires across 15 provinces (South African Broadcasting Corporation, 2023). These efforts were critical in managing fires that forced over 1500 people from their homes (euronews, 2023). Despite these efforts, the wildfires claimed the lives of at least 34 individuals, including 10 soldiers (Al Jazeera, 2023b).
Neighbouring Tunisia also faced wildfire outbreaks, exacerbated by strong winds that carried fires across the national border from Algeria, leading to the closure of two border crossings (Reuters, 2023a). The Tunisian wildfires prompted evacuations in the northwestern region of Tabarka, affecting at least 300 people and extending firefighting efforts to Bizerte, Siliana, and Beja (Sullivan and Tondo, The Guardian, 2023). Resources such as firefighting aircraft and personnel were sent from EU nations to help tackle the fires, despite the challenging conditions imposed by near-record temperatures of 49 °C (Gauldie, AirMedandRescue, 2024). In August, forest fires in mountainous regions of Morocco were also fanned by strong winds and facilitated by protracted hot spring and summer temperatures (Erraji, Morocco World News, 2023; Copernicus Climate Change Service, 2024a).
During December 2023–January 2024, the Western Cape of South Africa experienced wildfires related to prolonged hot and windy conditions, causing substantial damage and prompting widespread evacuations. In the Overstrand Local Municipality, which includes coastal towns like Pringle Bay and Betty's Bay, multiple fires necessitated evacuations and destroyed properties. The Hangklip area between Pringle Bay and Betty's Bay was particularly affected, with the fires destroying properties in the Sea Farm Private Nature Reserve. On 29 January, a “code red” status was declared, indicating a serious threat to residential areas, and evacuations were advised for communities including Silversands and Seafarms (Crisis24, 2024; AfricaNews, 2024). A wildfire swept from Simonstown to Scarborough in Cape Town, necessitating large-scale evacuation (Hough, IOL News, 2023). This fire was challenging due to its rapid spread fuelled by strong southeasterly winds and high temperatures. The firefighting efforts were supported by multiple helicopters and ground teams (South African Broadcasting Corporation, 2023). The most extensive damage was reported from the Kluitjieskraal fire near Wolseley, where over 220 km2 was burned, and more than 40 structures were destroyed. This fire also prompted evacuations and remained uncontained for several days due to its size and complex terrain that hindered ground access (Crisis24, 2024). Despite these extreme wildfires, the plantation forestry industry was not affected, with relatively low losses due to fire.
A2 Asia
The 2023–2024 fire season in Asia was generally not an extreme one, with much of central Asia experiencing low BA. Siberia, which has seen several record-breaking fire seasons since 2020, resulting in globally significant fire emissions (Zheng et al., 2021), also experienced a somewhat typical year for BA and fire C emissions. Likewise, most provinces of China and states of India experience a fairly typical fire season.
Nonetheless, there were regional examples of high fire activity in the 2023–2024 fire season. The Dornod Province of eastern Mongolia, near the borders with Russia and China, experienced several extreme fires during April 2023 that are also visible as anomalies in the global fire observations (Figs. 2, 4). Over 15 % of the area of Dornod Aimag burned in 2023–2024 in contrast to the 23-year average of below 5 %. The province includes the Mongolian part of the Daurian steppe, notable for being one of the last remaining undisturbed steppes in the world (UNESCO World Heritage Centre, 2017). Unusually dry and warm conditions in eastern Mongolia during spring led to severe wildfires. A notable wildfire spread into Dornod from the neighbouring Sükhbaatar Province, fanned by windy, dry conditions (Borneo Bulletin, 2023). The National Emergency Management Agency mobilised over 250 individuals, including firefighters and local residents, and helicopters were deployed to manage the fast-spreading fires (Borneo Bulletin, 2023). The effects of these wildfires were on herder and nomadic populations, and the Mongolian Red Cross has provided aid to 4800 herder households (International Federation of Red Cross and Red Crescent Societies, 2023).
Although BA extent and fire counts were overall below the 2002–2023 average along the southern border regions of Russia during 2023–2024 (Figs. 2, 4), a number of disruptive wildfires fanned by strong winds broke out during April and May and affected regions bordering Kazakhstan, such as in the Tyumenskaya, Omskaya, and Amurskaya oblasts and Mongolia, such as in Irkutsk and Krasny Yar, where at least one fatality was recorded (Le Monde, 2023). As well as detecting anomalies in fire size and rate of spread in these areas, the Global Fire Atlas also identified regionally large and fast-moving wildfires in the Russia–China border zone of Manchuria (Fig. 4); however these were not widely reported on by media outlets or local authorities.
Lao People's Democratic Republic (PDR) experienced a notable fire season in 2023–2024, marked by record-setting BA at national level since 2002 in the MODIS BA data (Figs. 2, S6). The fires were widespread, affecting various provinces from the south to the north, including Attapu, Khammouan, Louangphabang, Xaignabouli, and Bokeo. In Attapeu, BA in 2023–2024 was over 2 times the average of prior fire seasons since 2002. The fires in 2023–2024 were generally small in scale but anomalously numerous, consistent with the widespread use of slash-and-burn agricultural fires in these regions that have been problematic for regional air quality in this region during recent years (Meadley, Laotian Times, 2024). The uptick in fire counts in 2023–2024 has been attributed in part to economic factors such as the high price of cassava and demand for greater corn supplies to supply animal feed, which act as incentives for farmers to clear forests for additional planting (Bhandari, Radio Free Asia, 2024). On top of economic factors, a heatwave that spanned south and southeast Asia in April 2023 was reported to have been an enabling driver (Zachariah et al., 2023). The persistent smoke from these fires worsened air quality significantly in southeast Asia, where efforts to manage transboundary haze have been challenging during regional droughts, despite a new transboundary agreement being signed in 2023 (Antara News, 2023). Differences in fire management between Thailand and Lao PDR were evident during the 2023 event, with authorities intensifying patrols and seeking to control forest fires and agricultural burning for improved air quality in Thailand (Meadley, Laotian Times, 2024). Conversely, deforestation remains a critical issue in Lao PDR, with the Laotian government facing challenges in gaining local community support for the prevention of agricultural expansion and logging.
Earth observation data showed high-ranking BA anomalies and fires with a large size and rate of growth during 2023–2024 in several regions of Pakistan, Iran, and Iraq and parts of the Levant region (Fig. 4), consistent with reports of extreme drought-driven wildfires in some of these regions (Reuters, 2023b).
A3 Europe
Overall, fires burned 8400 km2 in Europe from March 2023 to February 2024 according to the European Forest Fire Information System (EFFIS, 2024), of which 64.5 % was from July to September and 18.1 % was in March and April. Large fires (> 5 km2) amounted to 53.4 % of the total BA, and those particularly large (> 100 km2, n=5) accounted for 17.7 % of the total burned area. More than half (52.6 %) of the BA corresponded to transitional woodland, with forests, shrublands and grasslands, and agriculture respectively amounting to 19.1 %, 13.2 %, and 14.4 %. At least 44 people died as a direct result of wildfires (Copernicus Climate Change Service, 2024a; Centre for Research on the Epidemiology of Disasters, 2024).
Most countries in the Mediterranean Basin experienced mild to typical fire seasons in general, with variable timing but affecting mostly non-forest (open) vegetation types (European Forest Fire Information System (EFFIS), 2024). In the Balkans, fire activity varied among countries but was mostly very low by historical patterns such as in Croatia; however, a major exception was Greece, described in more detail below (Figs. 2, 4, A1). The other exceptions were North Macedonia, with a typical fire year, and Bulgaria, the worst year in a decade, with fire activity extending into October in both countries, and Bosnia and Herzegovina and Serbia and Montenegro, where collectively ∼ 270 km2 burned in January–February 2024.
Greece's 2023 fire season was reviewed at length by Xanthopoulos et al. (2024). It was the second worst on record regarding total area burned (1727 km2), despite recent efforts to strengthen the firefighting mechanism of the country with more aerial resources and new personnel, after another challenging fire season in 2021. The situation was kept under control until mid-July, but in the period 13–27 July, maximum temperature in many parts of the country exceeded the average for the 2010–2019 period by as much as 10 °C, according to the records of the National Observatory of Athens. This resulted in multiple fire starts pushing the limits of firefighting, which relies heavily on the aerial resources. The fires starting 18 July on the tourist island of Rhodes grew rapidly on the second day, finally burning 207 km2 and stopping at the sea. About 20 000 tourists had to be evacuated from hotels along the coast. While the fire on Rhodes was still burning, three forest fires started on 3 July near the city of Aigio, in the north Peloponnese; on the island of Corfu; and near the town of Karystos in the south of Evia island. On 25 July, a Canadair CL-215 crashed near the village of Platanistos while fighting this last fire. Then, on 26 July, the tail of a cold front that passed over Greece, with the characteristic wind direction change that accompanies it, created further challenges, as a number of fire starts in central Greece and Thessaly spread fast, burning mostly in light fuels, challenged firefighters and threatened inhabited areas. The fast-spreading fire in Thessaly entered an air force base and caused a powerful explosion, resulting in damage to the nearby town of Nea Anchialos. By the end of July, the BA across the country had reached 550 km2.
The next wave of multiple challenging fires in Greece began on 19 August. A lightning-caused fire that started before dawn NE of Alexandroupolis in the prefecture of Evros received limited attention at first and was destined to become the largest fire in recent European history. The fact that firefighting resources were focused on evacuation of the villages in the path of the fire rather than fire suppression may have contributed to its eventual size. On 21 August, a second fire started to the north of the first one, near the village of Dadia. Fanned by a strong NE wind, it spread quickly, and within a few hours it reached the rear of the first one. On that day fire behaviour in terms of both spread and intensity was extreme (Athanasiou, 2024). A total of 19 migrants were trapped by the flames and were found dead on the 22 August. Another group was saved by the firefighters at the last moment. The authorities emphasised safety and evacuated the hospital in the outskirts of Alexandroupolis.
On 22 August, while the Evros fire was the focus of attention, a fire originating at more than one point near the village of Phyli, south of mount Parnis in Attica, at the outskirts of Athens started growing against the strong NE wind. Once more, many settlements were evacuated, and firefighting attention focused on protecting homes, as the fire moved slowly up the mountain slopes, finally burning 62 km2 in 3 d. The Evros fire kept growing at various rates for the next 15 d, finally reaching 938 km2 and becoming the largest on record in recent history in Europe. The simultaneous spread of the Evros fire, the fire in Attica, and a number of smaller fires is likely to have increased the growth rate statistics (km d−1) for fires in the region (Figs. 4 and A1).
The BA of the Evros fire included 258 km2 of deciduous oak forest and 218 km2 of oak forest mixed with other species (Konstantinos Kaoukis, personal communication, 2024). The usually most challenging forest types regarding fire behaviour contributed less to burned area: 128 km2 forest and 152 km2 of evergreen shrubs. The fire was mostly only brought into control when it reached agricultural areas and barren lands. The final size of the Evros fire may not be solely attributed to adverse meteorological conditions. One aggregating factor may have been the recent shift in directing firefighting personnel more strongly from suppression towards evacuation and another the emphasis on aerial firefighting resources (Xanthopoulos et al., 2024). The latter was not effective once the extreme fire behaviour commenced (21 to 23 August). Deep-forest litter layers further hampered fire suppression in some areas, although a group of local forest workers working with hand tools were credited by the local forest service officers with control of a large part of the fire perimeter to the north, saving an estimated 100 ha of forest (Athanasiou, 2024).
Italy was the second-most-affected country after Greece, with continuous fire activity from July to October. More than 1000 km2 burned in the country, of which 69 % was in Sicily (including 17 fires > 10 km2), although the largest fire (31 km2) occurred in the nearby region of Calabria (Istituto Superiore per la Protezione e la Ricerca Ambientale, 2023). A defining characteristic of these large fires was the importance (42 % overall) of agricultural land in the BA composition. The outskirts of Palermo and the Madonie Natural Regional Park were impacted by multiple wildfires in late September, causing one fatality and affecting wildland–urban interfaces, farms, and tourism.
Fire activity was insignificant in France, except for benign mountain burning (175 km2) in March–April and then in January–February, mostly in the western Pyrenees. Like in France, the north of Spain (Asturias–Cantabria) experienced unusual Spring burning activity, amounting to 423 km2 during late March and early April (Educación Forestal, 2023a). In particular, the Foyedo wildfire (27 March 2023) was the largest on record for Asturias, burning 101 km2 across variable vegetation but with the predominance of conifer plantations, mostly Pinus pinaster. It was a wind- and spot-driven fire, but its soil and overstorey burn severity were respectively low and mostly moderate, as more slowly drying fuels were not available to burn (Cátedra Cambio Climático de la Universidad de Oviedo, 2023).
Only two other notable large wildfires occurred in 2023 in continental Spain and again were unusual in that they happened in spring rather than summer. The Villanueva de Viver wildfire (23 March 2023, Castellón and Teruel) burned around 50 km2 and was driven by abnormal seasonally dry conditions, combined with a shift in wind direction. It mostly burned naturally regenerated continuous pine forest of Pinus halepensis. Canopy fire severity was heterogeneous, with 39 % of the wildfire area being classified as high to very high severity (Mediterranean Center for Environmental Studies, 2023). The cost of fire suppression was EUR 2 million, and 1800 people were evacuated (Las Provincias, 2023).
At over 100 km2, the Pinofranqueado wildfire (17 May 2023, Cáceres) was the largest fire in the Iberian Peninsula in 2023 (Copernicus Emergency Management Service, 2023b). The BA was 90 % forest, mostly pine (Pinus pinaster; Juntaex.es, 2023). It was a wind-driven fire, and the Canadian FWI indicates that all fine fuel was available to burn and extreme fire behaviour (FWI > 50). The fire significantly impacted the nesting of protected bird species and rainfall shortly after the wildfire caused important runoff, erosion, and disruption of water supply to the local population (Armero, Hoy, 2023).
The two other significant fires in Spain happened in the Canary Islands, the Puntagorda wildfire (14 July 2023, La Palma, 32 km2) and the Arafo–Candelaria wildfire (15 August 2023, Tenerife, 123 km2; Copernicus Emergency Management Service, 2023c). The latter spread for 9 d, and 94 % of its area had the status of “forest under conservation”, mostly Canary pine (Pinus canariensis). The fire was exacerbated by local topography and mostly low to moderate severity (Educación Forestal, 2023b). Nonetheless, 26 000 people were evacuated, 364 farms and 246 buildings (none residential) were affected, smoke impacts were substantial, and damage was estimated at EUR 80.4 million.
Like in Spain, winter shrubland burning was relevant in continental Portugal (∼ 50 km2 in February), but subsequent significant wildfire activity was restricted to two fires. The Sarzedas (66 km2 ha) and Baiona (75 km2) wildfires started on 5 August under extreme fire weather (FWI > 50) and burned mostly (∼ 70 %) forest, respectively, of pine (P. pinaster) and eucalypt (Eucalyptus globulus) stands (Direção Nacional de Gestão do Programa de Fogos Rurais, 2023). Prevailing burn severity was moderate, and damage to infrastructure and emergency restoration amounted to EUR 6.4 million cost for the Sarzedas fire and a forest value loss of EUR 1.4 million (Instituto da Conservação da Natureza e das Florestas, 2023). The major run of the Baiona wildfire was on 7 August, corresponding to 73 % of the total BA, when it threatened wildland–urban interfaces and damaged several buildings and one camping park, and 20 small villages were evacuated (Economia Online, 2023). Moderate- to high-burn severity classes were dominant, and costs were estimated at EUR 2.7 million (tourism) and EUR 7 million (houses), as well as EUR 1.4 million in forest value loss and EUR 2.9 million for emergency stabilisation (Rádio e Televisão de Portugal, 2023; SIC Notícias, 2023). Finally, on 12 October, and under anomalously extreme fire weather for the time of the year, the Ponta do Pargo wildfire burned 48 km2 on the island of Madeira, with an estimated agriculture-related cost of EUR 3 million (Rádio e Televisão de Portugal, 2023).
The year was also mild in other European countries, where burned areas can be extensive, namely Romania, Hungary, and Poland, which collectively summed only ∼ 210 km2 burned. EFFIS recorded 2461 km2 burned in Ukraine, the largest fire attaining 42 km2, but these figures are far from those registered in recent years. In northern Europe, a notable fire occurred in Scotland near Cannich, during the spring, the primary fire season in the humid Atlantic climate of the UK (Belcher et al., 2021). It started on 19 April and burned ∼ 33 km2 of mainly moorland, making it one of the largest fires in the UK in recent history (Sabljak, The Herald, 2023; personal communication Niall MacLennan, Scottish Fire and Rescue Service, 2024).
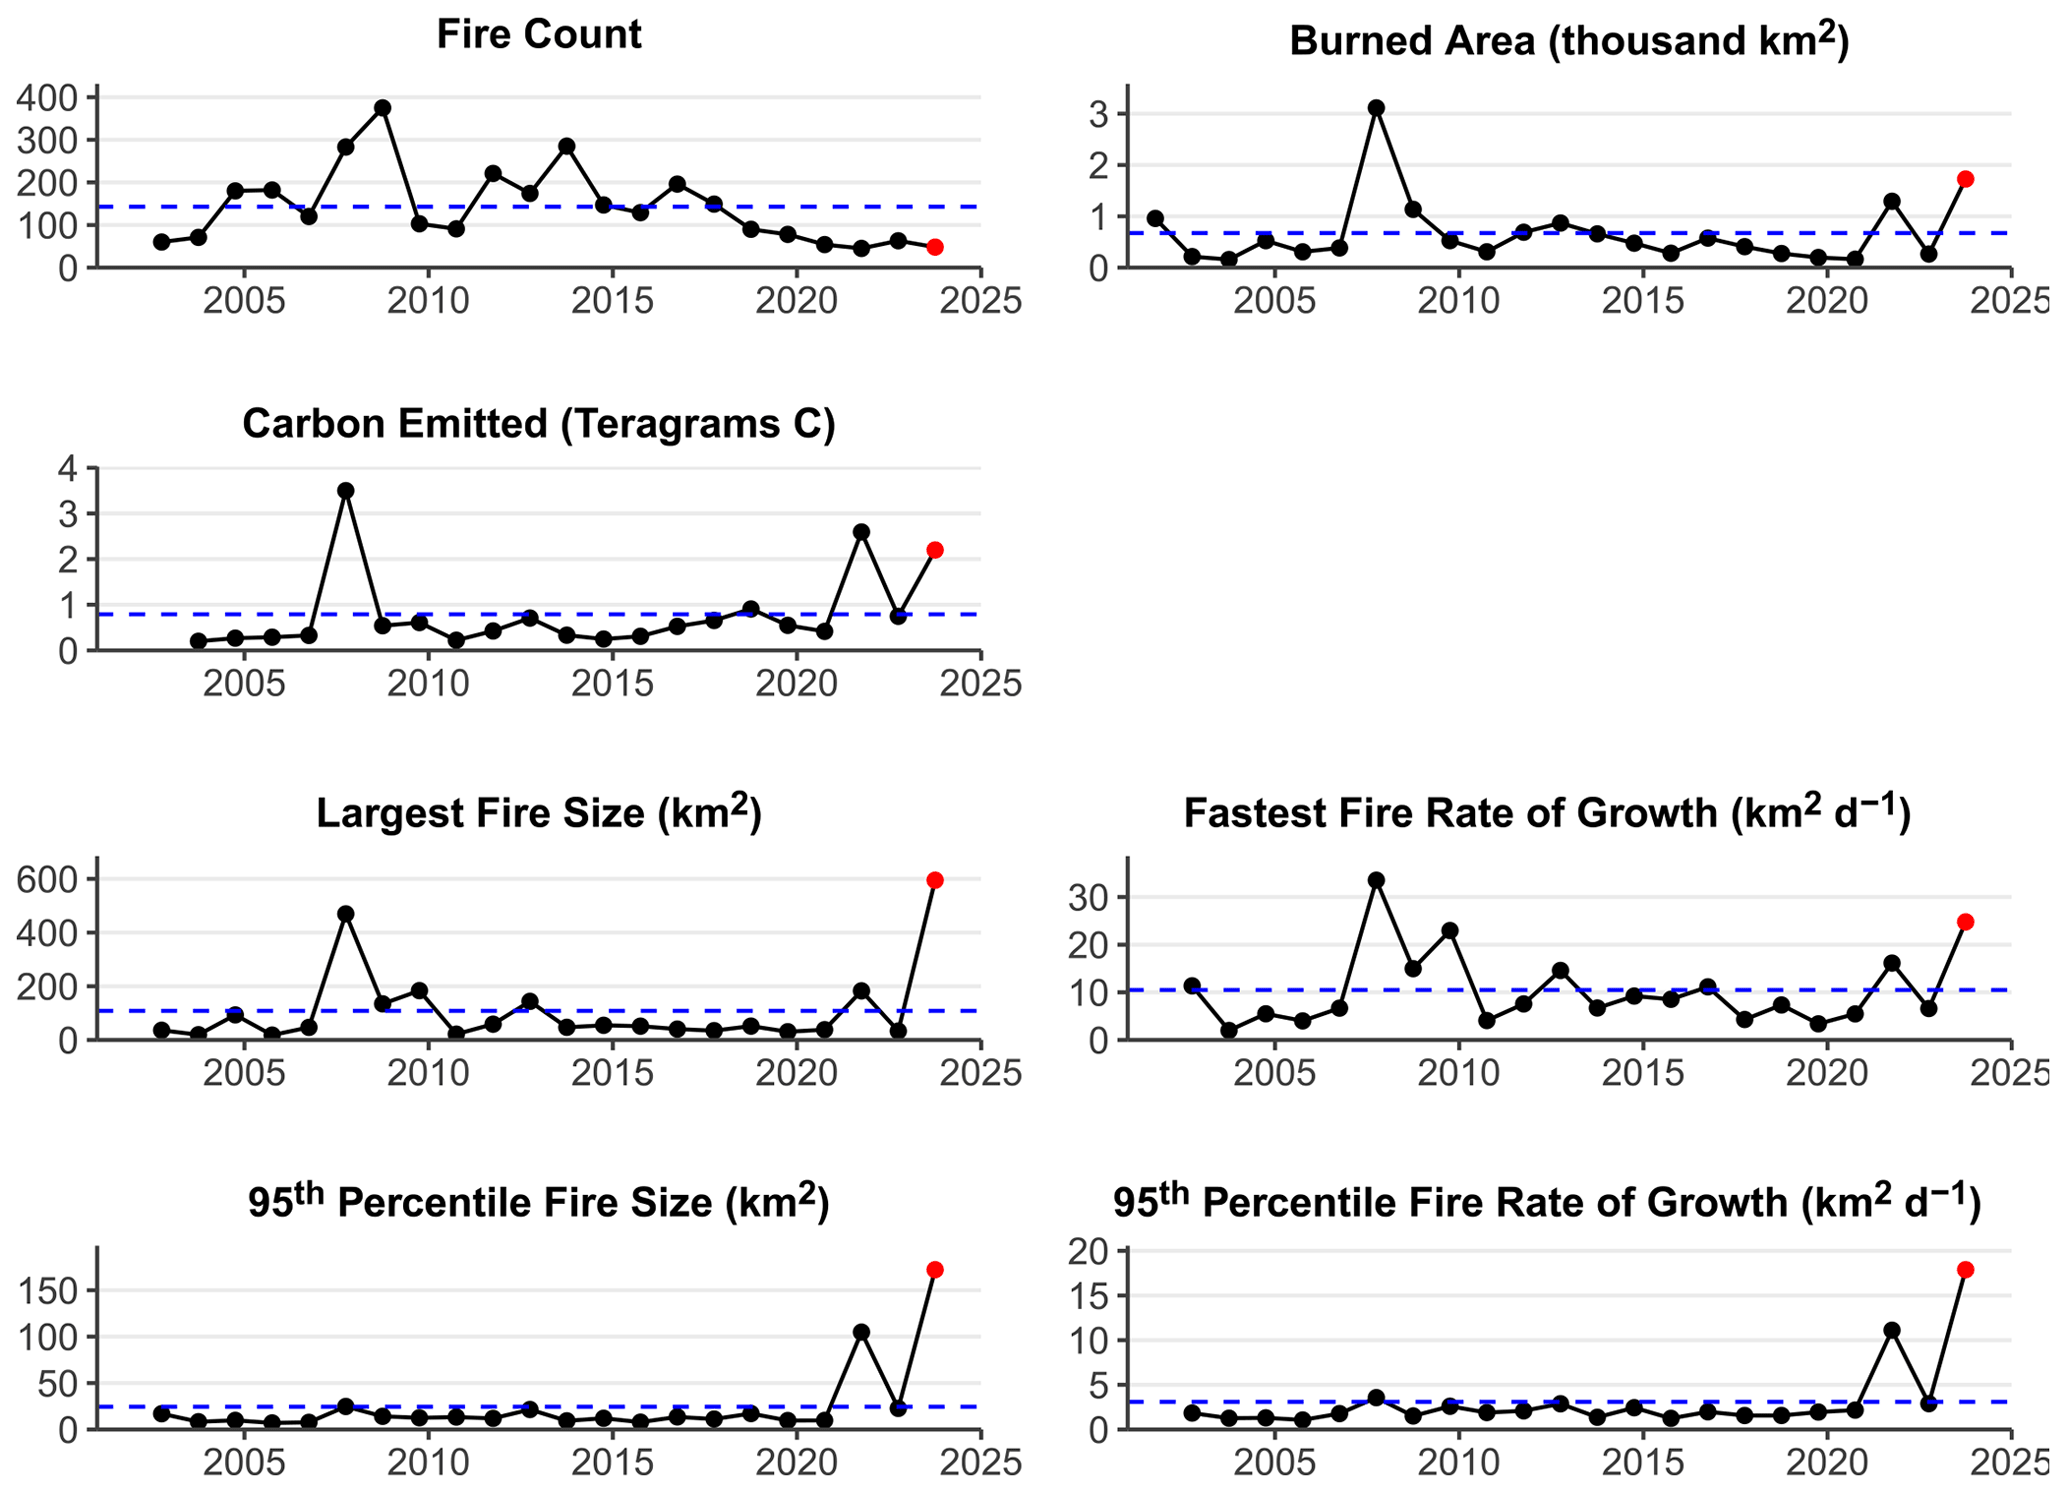
Figure A1Summary of the 2023–2024 fire season in Greece. Time series of annual fire count, BA, C emissions, PM2.5 emissions, 95th percentile fire size, fastest daily rate of growth, and 95th percentile fire daily rate of growth. Black dots show annual values prior to the latest fire season, red dots the values during the latest fire season, and dashed blue lines the average values across all fire seasons.
A4 North America
Wildfire across North America in 2023–2024 was characterised by record fire activity across Canada, lower-than-normal BA in the most flammable regions of the western United States, near-average fire activity across Mexico, and several extreme events that resulted in disastrous impacts to human communities (Kolden et al., 2024). Over 150 000 km2 burned in Canada in 2023 according to national statistics, over twice the previous record and over 7 times the annual average (Jain et al., 2024). The United States burned 10 900 km2 in 2023, well below the long-term annual average (National Interagency Fire Center (NIFC), 2024a). Mexico has a relatively short national wildfire recording system, but March 2023–February 2024 saw among the highest area burned in the last decade (10 000 km2), and this has been associated with ongoing drought conditions (Comisión Nacional Forestal, 2024).
The fire season began earlier than normal in Canada, which regional experts have linked to early snowmelt across much of the country and persistent drought conditions in the west. Abnormally high temperatures and lack of rainfall also saw forested regions of eastern Canada, including Quebec, transition rapidly to drought conditions at the end of May. The province of British Columbia recorded its first wildfire evacuation in mid-April, and in late May, over 16 000 people were evacuated from Halifax, the capital city of Nova Scotia, which saw its largest ever wildfire in 2023 (Jain et al., 2024). In June, two lightning outbreaks in Quebec initiated several hundred new fires in what would eventually become a record BA year for the province (4300 km2) (Boulanger et al., 2024). While the majority of the Quebec fires were in remote regions, the smoke they generated was carried to several major cities in eastern North America, including New York, which experienced its worst air quality in half a century as the observed daily mean PM2.5 concentration rose to 148.3 µg m−3, over 4 times the recommended daily limit (Wang et al., 2024). In total, over 50 million people were exposed to high levels of PM2.5 for several days (Yu et al., 2024). This situation was further exacerbated in New York City by several wildfires in the nearby New Jersey pine barrens, a fire-prone dry pine forest that sees large fires during periods of drought.
The year started with low fire activity across the United States. In the High Plains of the central United States, an outbreak of large wildfires occurred coincident with dry conditions and strong winds in March–April 2023. One wind-driven wildfire started by power lines in Oklahoma destroyed several dozen homes (Oklahoma Department of Emergency Management, 2023). Outside of the High Plains, dry conditions also elevated fire activity across the southern, eastern, and New England regions of the United States. Mexico saw slightly above-average fire activity during spring, which is the peak period of the fire season as debris burning and field clearing activities provide ignitions for predominantly shrubland and grassland wildfires.
As summer arrived in Canada, the western and boreal provinces and territories saw extreme and widespread fire activity, even as Quebec continued to burn. By the end of the year, record area had burned in British Columbia (2300 km2), Alberta (2700 km2), and the Northwest Territories (3500 km2), accompanied by evacuations of 232 000 people in numerous rural villages and large cities such as Yellowknife, NT, and Kelowna and West Kelowna, BC, where a wildfire jumped the 2 km wide Okanagan Lake (Jain et al., 2024; CBC News, 2023). The extreme behaviour of these fires not only shrouded large swaths of North America in smoke but also generated an unprecedented 140 pyrocumulonimbus clouds (Jain et al., 2024). Eight firefighters were killed during summer 2023 in Canada (Jain et al., 2024), but miraculously no civilians died directly in the fires. Canada was at the highest national preparedness level (i.e. 5) for an unprecedented 120 continuous days starting on 11 May, indicative of the significant resource sharing required by fire management; in all, over 5500 international personnel from 12 countries and the EU were deployed to Canada during the 2023 fire season (Canadian Interagency Forest Fire Centre, 2023).
In the United States, a relatively low activity fire season became deadly in August, owing to unusual weather conditions facilitating extreme fire behaviour in multiple areas around the country. On 8 August, a pressure-gradient-induced katabatic wind event fanned several small wildfires in Hawaii, and 101 civilians died as the town of Lahaina on the island of Maui was consumed in the worst wildfire disaster in the United States in a century (Pyne, 2017). Over 2000 homes were destroyed, and over 10 000 people were displaced as a result. Fires with extreme behaviour killed five additional civilians in the US states of Washington (two fatalities), Louisiana (two fatalities), and California (Crystal Kolden, unpublished data). These extreme events stood in contrast to overall low fire activity and were notable for where they occurred. Washington does not typically see many extreme, wind-driven wildfires, and Louisiana is one of the wettest states in the United States. By the end of August, the US BA was only 40 % of normal levels and was the lowest since at least 2000 (NIFC, 2023; National Oceanic and Atmospheric Administration (NOAA), 2023).
As North America transitioned to autumn and then winter, Canada continued to burn nearly a month longer than normal, with the last large fires not controlled until late October. On 22 September, remarkably late in the fire season, Canada saw its largest ever 1 d total for BA at approximately 4400 km2 (Jain et al., 2024). While many of the Canadian fires were fully extinguished by winter, others simply smouldered into the deep peat layers, aided by a warmer-than-normal winter with a reduced snowpack. At the end of February 2024, spaceborne thermal sensors detected several dozen fires in northern Alberta and British Columbia that were overwintering fires, likely sustained by peat smouldering (Shingler, CBC News, 2024; Scholten et al., 2021).
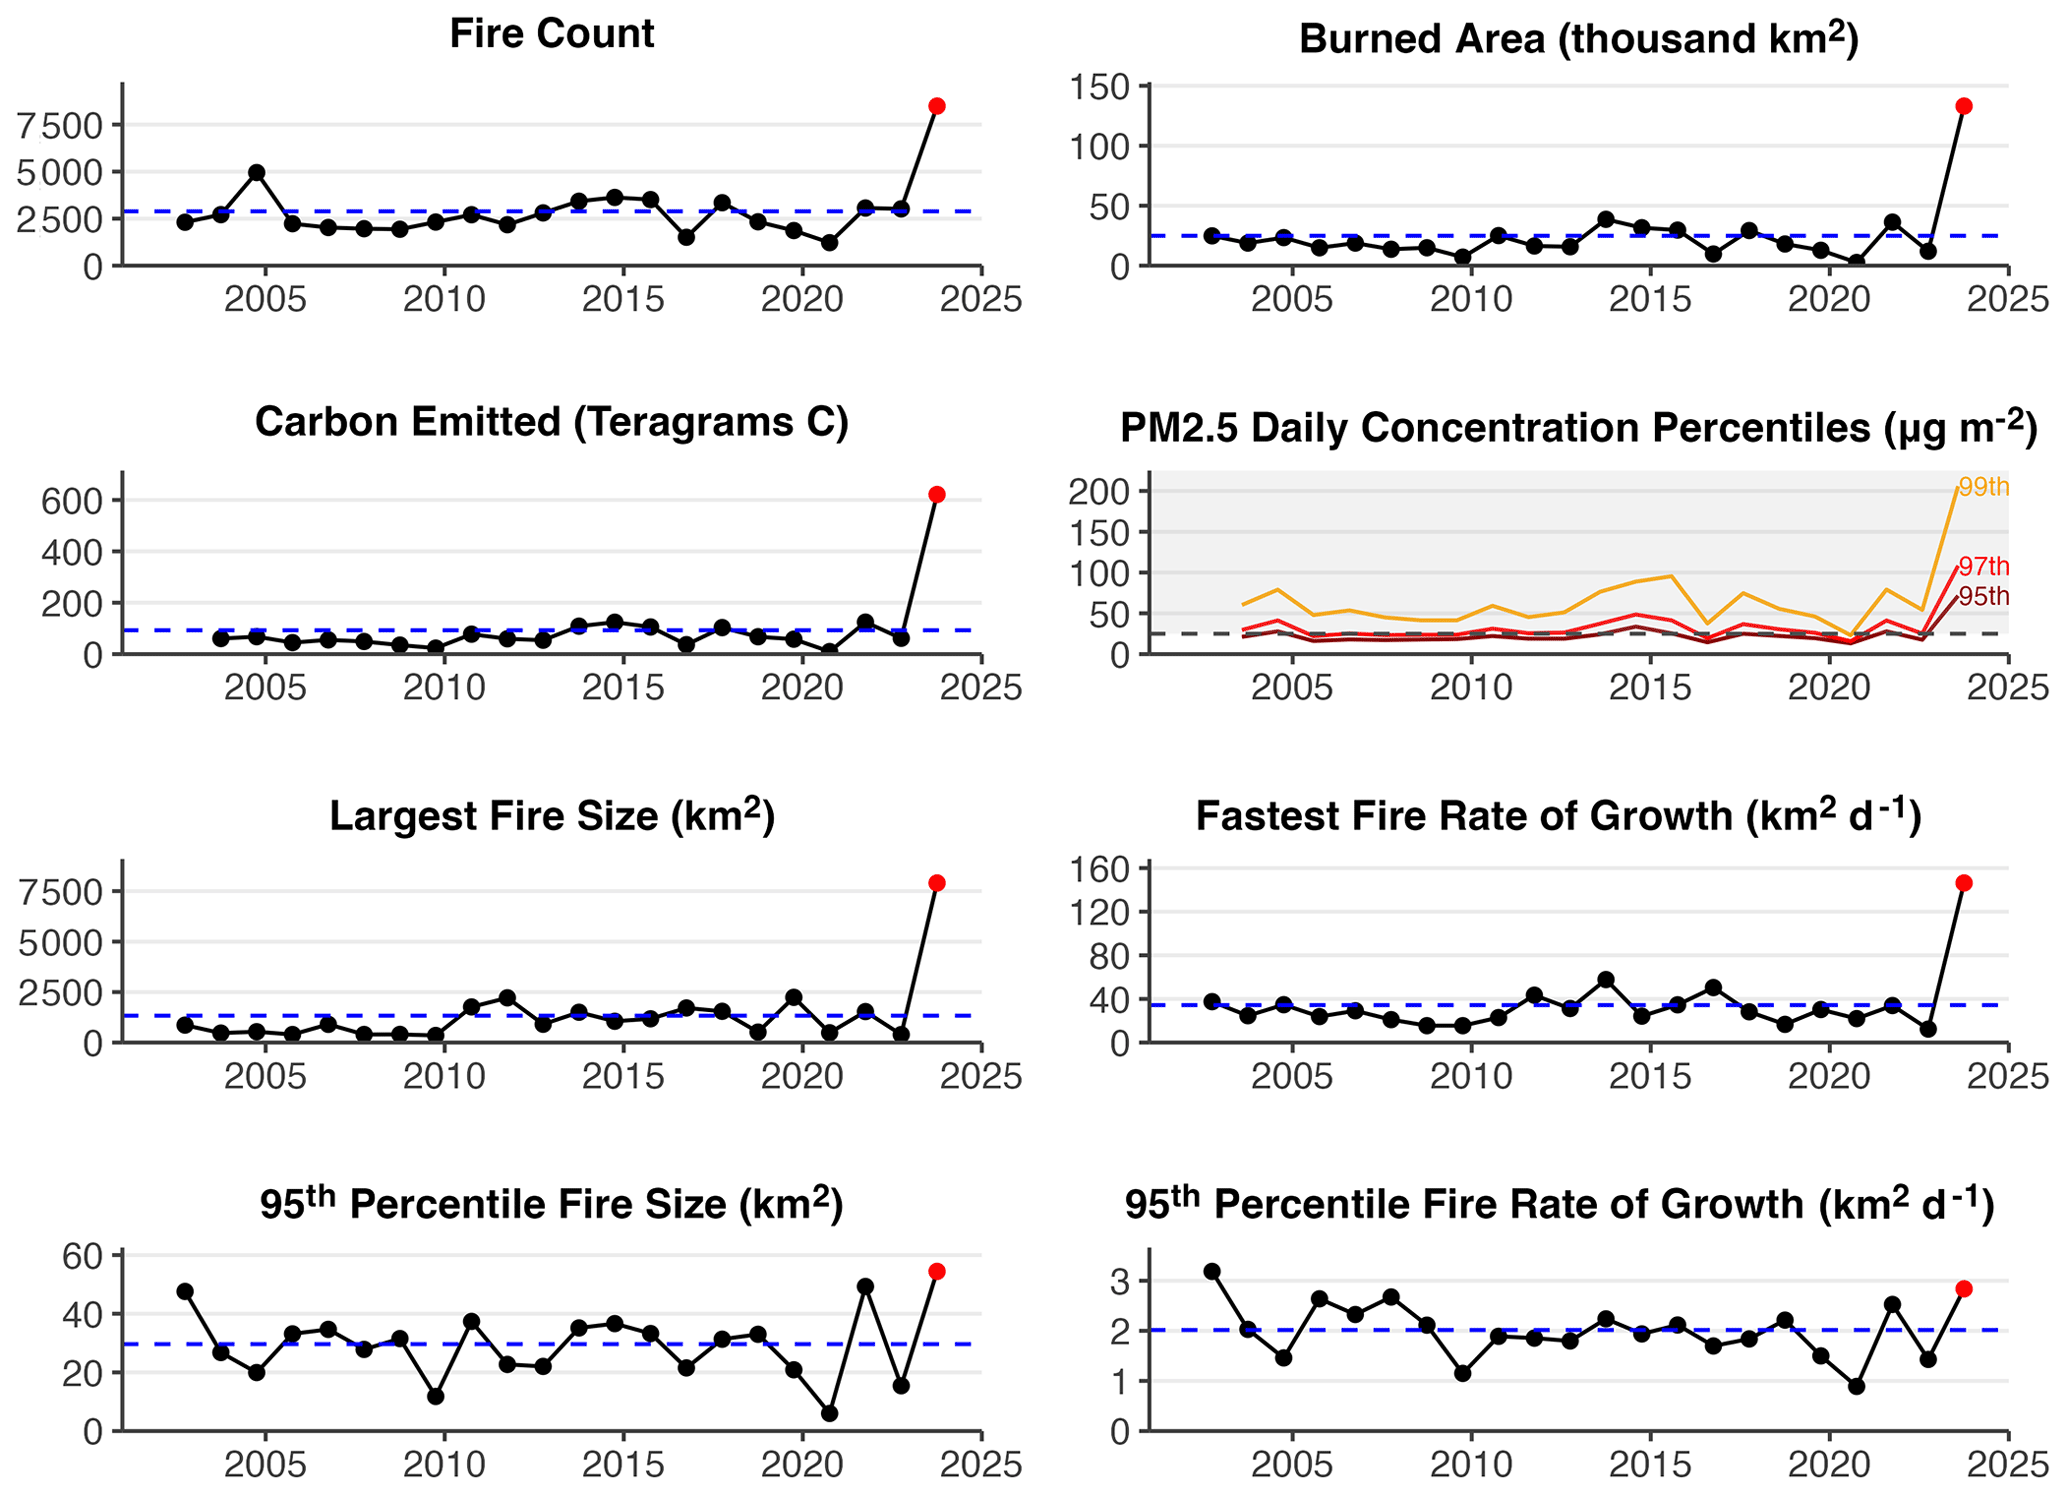
Figure A2Summary of the 2023–2024 fire season in Canada. Time series of annual fire count, BA, C emissions, PM2.5 daily concentration percentiles (95th, 97th, and 99th), 95th percentile fire size, fastest daily rate of growth, and 95th percentile fire daily rate of growth. Black dots show annual values prior to the latest fire season, red dots the values during the latest fire season, and dashed blue lines the average values across all fire seasons. The PM2.5 daily concentration percentiles are based on area-weighted daily mean surface PM2.5 concentrations within each year across Canada from the CAMS atmospheric reanalysis (Inness et al., 2019). The grey zone marks concentrations exceeding reference levels for 24 h mean PM2.5 concentration in Canada (25 µg m−3) Canadian Environmental Protection Act Federal-Provincial Working Group on Air Quality, 1998).
US fire agencies recorded just over 10 900 km2 burned in 2023, just over half of the 20-year mean of 29 000 km2 (NIFC, 2024a). Notably, over half of the BA was associated with higher fire activity in the central plains grasslands and the southeastern United States, while below-normal fire activity characterised California and the western United States throughout 2023 as the region exited a multi-year drought. However, the number of fires recorded was only slightly lower than average. This quiet pattern broke in February 2024, however, when drought conditions from the High Plains region of the United States down into north central Mexico coupled with strong winds to produce massive, fast-moving wildfires across multiple states on both sides of the US–Mexico border. The US state of Texas recorded its largest ever single fire at over 4000 km2 (Smokehouse Creek fire) in late February and early March that destroyed 130 homes across the High Plains region of the central United States (NIFC, 2024b). Two civilians were killed by the flames in the relatively rural area dominated by ranching, over 10 000 head of cattle died, and damages are estimated to be at least USD 4.6 million (National Oceanic and Atmospheric Administration (NOAA), 2024).
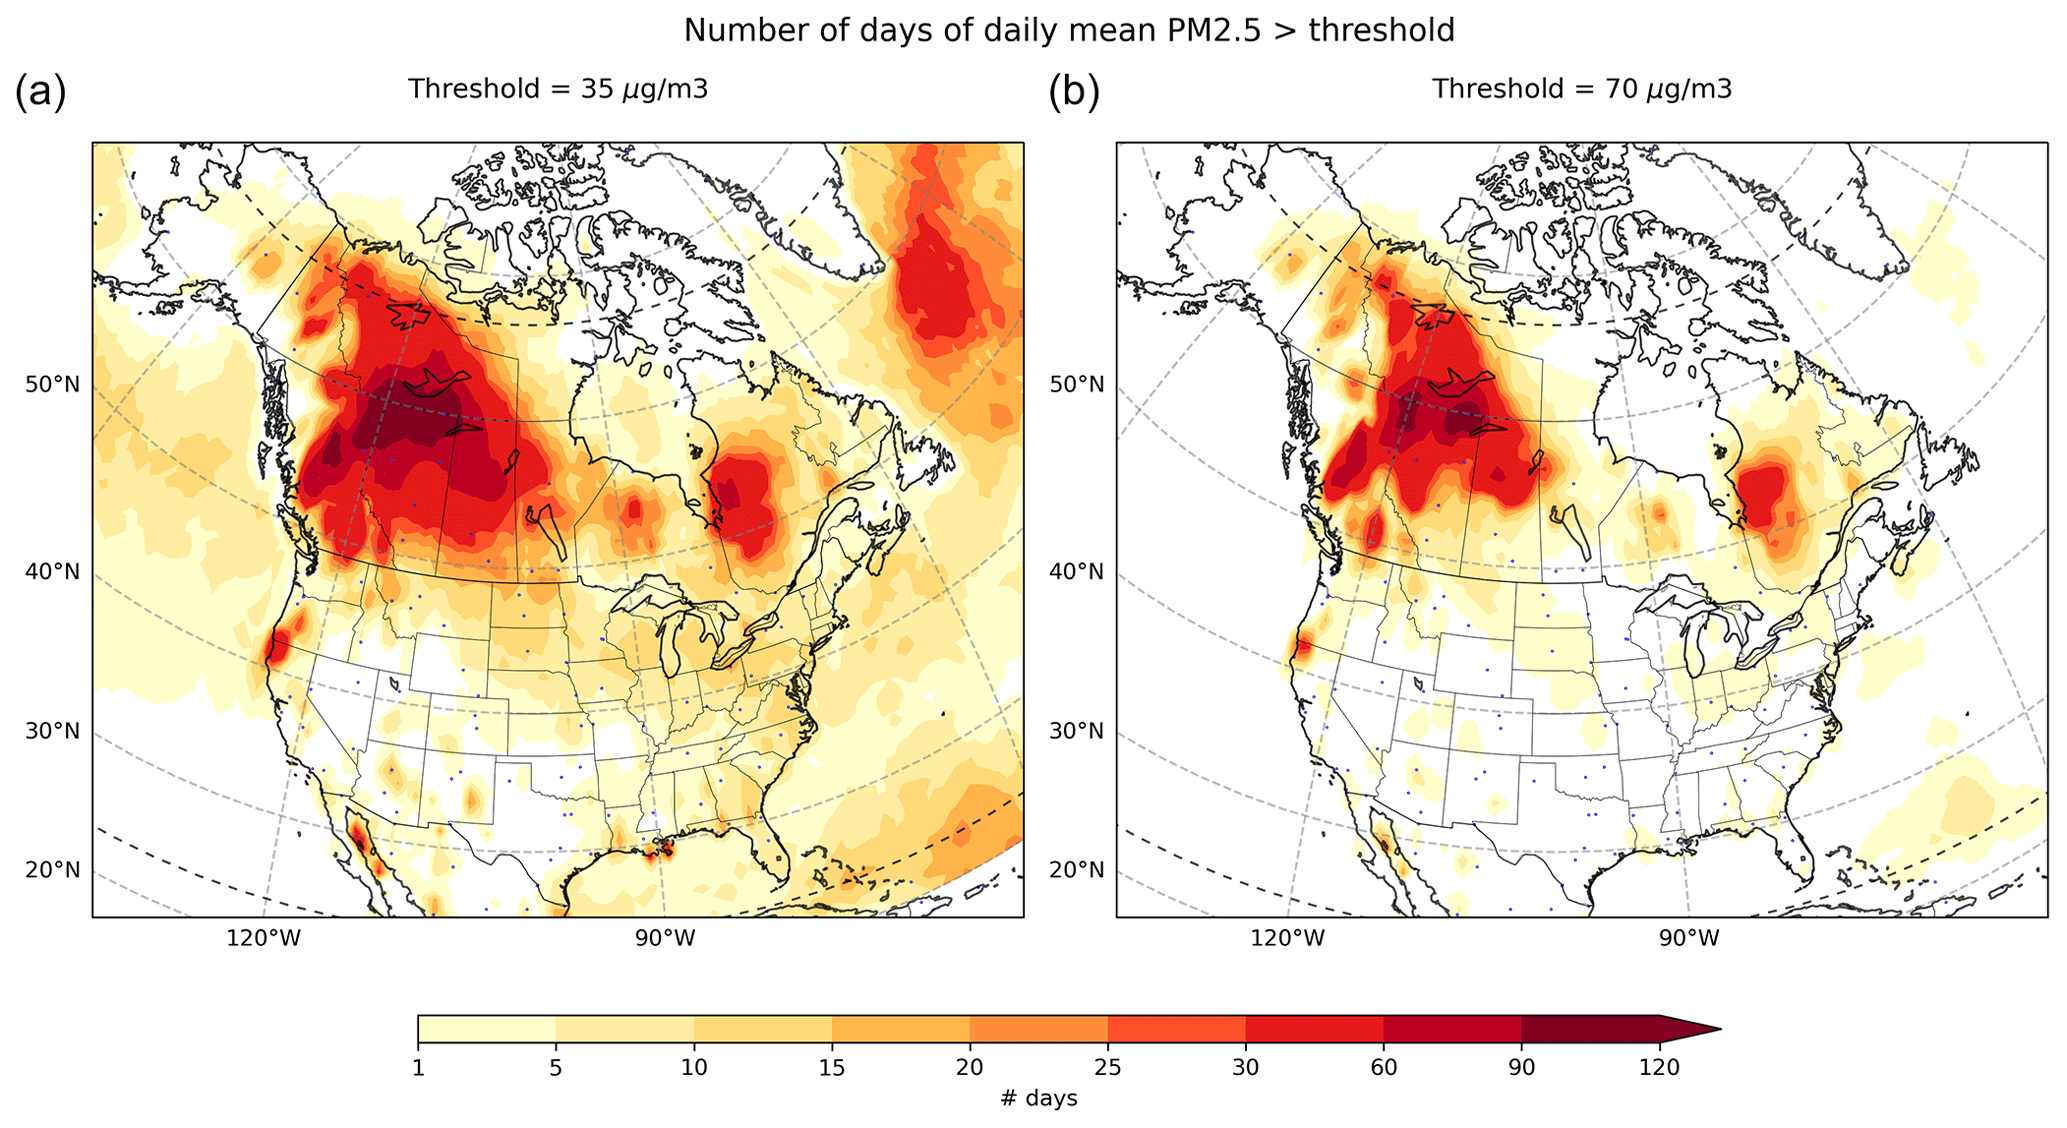
Figure A3Impact of Canadian wildfires visible in air quality metrics for North America. Panels show the number of days in 2023 with mean PM2.5 concentration over a threshold of (a) 35 µg m−3 and (b) 70 µg m−3. Both the National Ambient Air Quality Standards (NAAQS) in the United States and the Canadian Ambient Air Quality Standards (CAAQS) have exposure targets of 35 µg m−3 on average within a single day.
The impact of North American fires on air quality is significant, with half of the PM2.5 in America suggested to originate from fires (O'Dell et al., 2019). An exceptional fire season, such as seen in Canada in 2023, therefore poses an elevated level of health risk. Canada's wildfires produced levels of PM2.5 across the country that were well in excess of the last 20 years (Fig. A2). Additionally, long-range transport of pollution from Canada affected the Pacific Northwest, northern Midwest, and many eastern states (Fig. A3). According to the National Ambient Air Quality Standards (NAAQS) in the United States, the threshold for PM2.5 exposure is not to exceed 35 µg m−3 on average within a single day. CAMS analysis suggests that people living within over half of US states experienced up to 2 weeks of exposure at or above this level. In Canada, the safe limit for PM2.5 exposure, as defined by the Canadian Ambient Air Quality Standards (CAAQS), is also 35 µg m−3 over a 24 h period. However, the situation was worse in Canada due to closer proximity to fires, with many territories along the border experiencing up to a month of degraded air quality that exceeded national recommended exposure limits, British Columbia possibly facing twice the number of days at up to 2 months, and the Northern Territories potentially with 3 to 4 months of exposure.
The scale of the impact becomes particularly evident when comparing the number of days at double the exceedance level (70 µg m−3) due to short-range versus long-range transport of pollutants. In Canada, where the pollution sources were more localised, the number of days above this higher level remains substantial, ranging from a week along the border to months still at the fire epicentres. In contrast, the United States, affected primarily by long-range transport from Canada, experienced approximately half the number of such high-pollution days. It is also important to consider the context of interannual variability in fire occurrence. Last year, the United States experienced its lowest number of fires in 2 decades (Fig. 4), so most of the pollution impact came from Canada.
A5 Oceania
As is commonly the case, there was a marked latitudinal difference in wildfire patterns in Oceania in 2023–2024. Fire activity was above average in the savannahs, grasslands, and shrublands of tropical, subtropical, and arid northern Australia. In contrast, fire activity in the southern states of Australia was generally below average and well below the levels seen during the high-impacting Black Summer fires of 2019–2020. In New Zealand and the Pacific Islands, fire activity was relatively low compared to the preceding 2 decades.
Given the vast scale of savannah fires, 2023–2024 ranked among the top 5 years in BA for Australia as a whole since 2002 (Fisher, 2024; Fig. 2). Fire in tropical and arid areas is tightly linked to rainfall in the preceding season (Alvarado et al., 2020). The above-average fire seasons in the Northern Territory and northern Western Australia were driven to a large extent by elevated fuel growth associated with the La Niña conditions of the previous 3 years. These fires represented the vast majority of areas burned across the country in 2023–2024 (Fig. S7).
In the monsoonal north, savannah fires follow a strong seasonal pattern, with regular summer rain predictably followed by fire in the dry winter and spring months. In arid regions further south, fire remains tightly coupled to rain, but the seasonality is less pronounced. Anomalously, large fires began as early as May and June in Western Australia and the Northern Territory respectively, continuing to as late as January.
The year was also marked by a series of early-season, high-impact fires in populated areas of southwestern Western Australia, southeast Queensland, New South Wales, Victoria, and Tasmania. Hot, dry, windy conditions and extended dry periods are a major driver of forest, woodland, and shrubland fires of the subtropical and temperate south of Australia (Collins et al., 2022). In addition to 2023 being the eighth-warmest year on record, the 3 months from August to October was the driest in over 100 years of records (Bureau of Meteorology, 2024).
From October to January a string of fire events led to loss of life and property and a range of other human and environmental impacts throughout the country's southeast and southwest. In some cases, significant fire activity was observed in areas impacted by the 2019–2020 fire season. Despite these impacts, average rain in southern and eastern parts of Australia tempered fire activity for the austral summer. In Queensland and NSW, large fires in remote areas pushed the total BA in line with the long term mean, but this figure was well below average in Victoria, the Australian Capital Territory, and Tasmania.
In the southwest of Australia, a volunteer firefighter was killed while responding to a fire near Esperance. The Kings Park fire in October occurred in a popular tourist area containing vulnerable flora and threatened Perth Children's Hospital. Perth was again affected by fires in December, with several injured and five homes lost. A further two homes were lost in the region in mid-January from fires that burned 60 km2 . A similar sized fire burned through rugged terrain in the Gammon Ranges 600 km north of Adelaide, threatening highly significant cultural and ecological values.
A large number of significant fires affected the eastern States of Australia in October. The Tara and Mount Isa fires in Queensland burned well over 400 km2 combined, destroying 65 homes and claiming the lives of two people. International and interstate support teams were deployed from New Zealand and Victoria to respond to the fires. Further south in New South Wales, significant fires included the Coolagolite Rd fire in Bega (over 70 km2, two houses destroyed), the Willi Willi Rd fire in Kempsey (over 290 km2, eight houses destroyed, one person killed), and large fires around Tenterfield (approximately 300 km2, four homes destroyed). In November the Hudson Fire burned 228 km2; destroyed four properties; and led to the death of a volunteer fire fighter, who was killed by a falling tree while fighting the fire. In December, the Duck Creek Pilliga Forest fire burned 1385 km2 and initiated three documented fire-generated thunderstorms, with smoke impacts extending 500 km away and reaching Sydney.
In neighbouring Victoria, the fire season was bookended by high-impact events in October and then in February and March. Fires in Gippsland during October totalled 120 km2 and exhibited some overnight fire runs that were regarded as unusual (Mills et al., 2022). An extended dry period saw fires impacting towns in central and western parts of the state in late February and early March. Over 40 homes were lost, and five firefighters were injured fighting two fires that originated in the Grampians National Park and burned 60 km2. Interactions with the atmosphere and topography were suggested to explain extreme behaviour that was reported. This fire was followed by another near Ballarat, affecting grass, forest, and a pine plantation. Despite several extreme fire weather days and evacuation advice, a significant suppression effort aided by interstate deployments minimised impacts. The fire burned over 200 km2.
In the island state of Tasmania, the fire season began early with the Coles Bay bushfire burning 27 km2 of both private land and national park in September and then fires on Flinders Island in October. Other impactful fires that occurred during the season include the Dolphin Sands fire on the east coast of Tasmania that destroyed two homes and burned 2.5 km2 and the multiple fires in the Brady lake area (Tasmania's central highlands) in February that destroyed two homes and burned up to 100 km2 and a fire in the Waterhouse Conservation Area that required campers to evacuate.
New Zealand experienced a normal fire season after three prior seasons well below average under La Niña conditions. The fire season began early with a relatively large fire in September on the western side of Lake Pukaki in the central Te Waipounamu / South Island in wilding pines. This fire totalled 29 km2, and this was the third major wildfire event in recent years in this area at an earlier-than-normal stage of the fire season, following the 2020 Pukaki (August) and Ohau (October) fires. New Zealand then experienced a spate of fires around Waitaha / Canterbury in the Te Waipounamu / South Island between late January and mid-February 2024, with several houses burned and farmlands affected.
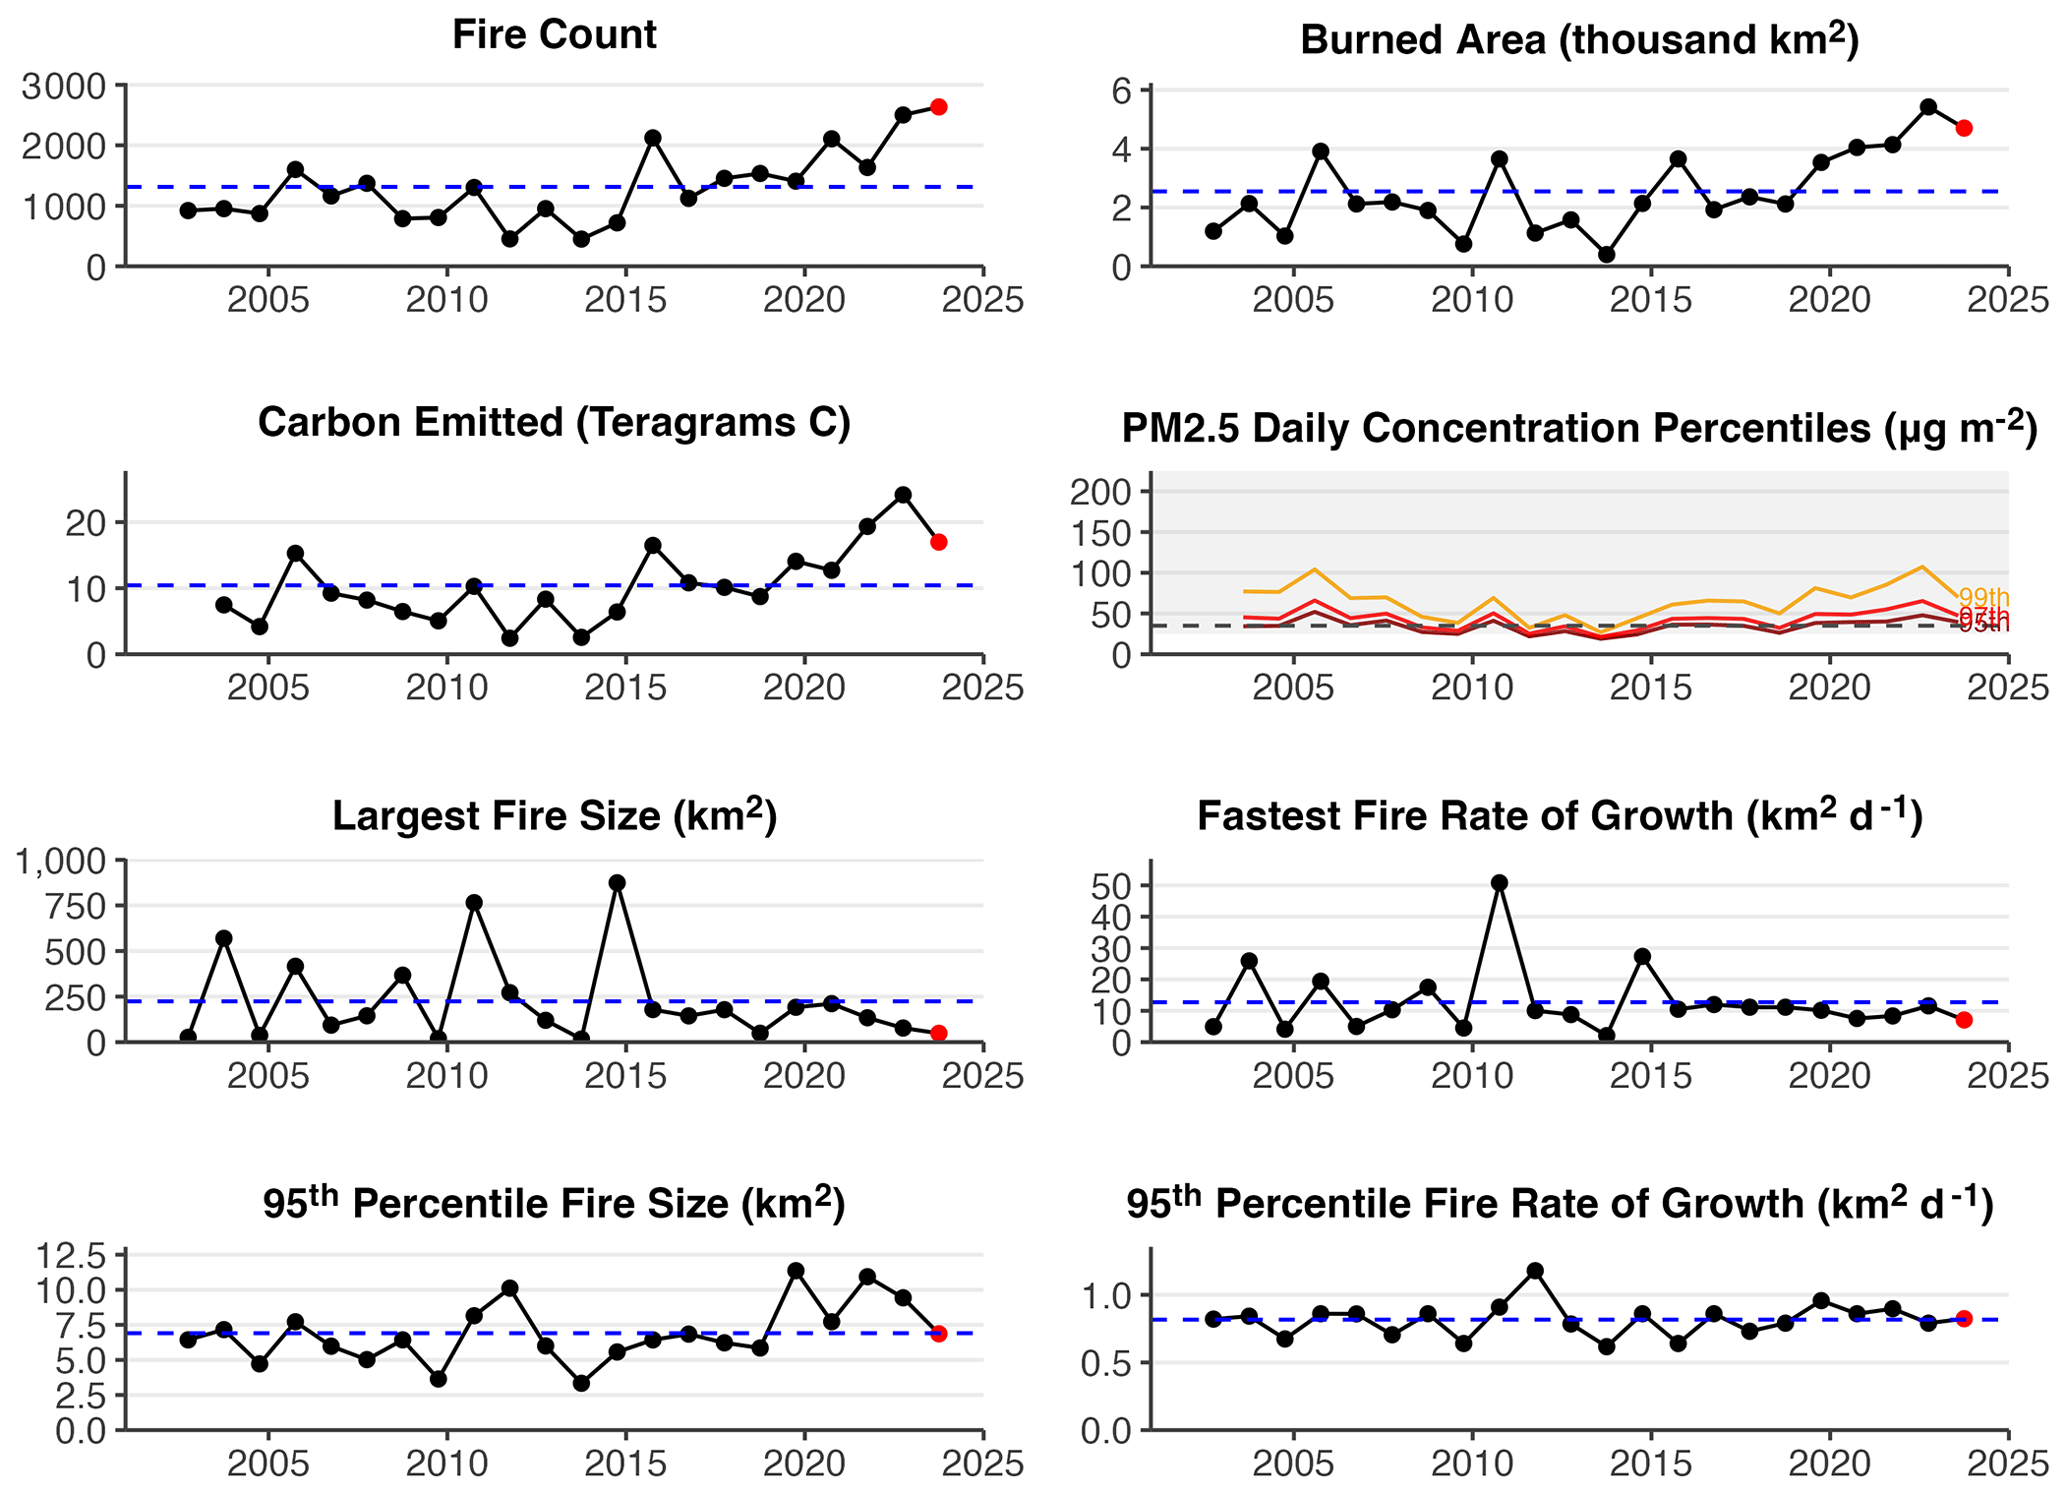
Figure A4Summary of the 2023–2024 fire season in the Brazilian State of Amazonas. Time series of annual fire count, BA, C emissions, PM2.5 emissions, 95th percentile fire size, fastest daily rate of growth, and 95th percentile fire daily rate of growth. Black dots show annual values prior to the latest fire season, red dots the values during the latest fire season, and dashed blue lines the average values across all fire seasons. The PM2.5 daily concentration percentiles are based on area-weighted daily mean surface PM2.5 concentrations within each year across Amazonas from the CAMS atmospheric reanalysis (Inness et al., 2019). The grey zone marks concentrations exceeding the reference level for 24 h mean PM2.5 concentration in Brazil's National Air Quality Guidelines (25 µg m−3; Siciliano et al., 2020).
A6 South America
The 2023–2024 fire season in South America was characterised by a moderately below average fire activity but with positive wildfire anomalies in specific regions, which were reportedly exacerbated by extended periods of drought and heatwave across the continent (Clarke et al., 2024; Figs. 2, 3, 4). In the Brazilian State of Amazonas, which features the largest extent of preserved old growth forests in Amazonia, June and October 2023 saw the highest fire counts since records began in 1998 (National Institute for Space Research, 2024; see also Fig. A4). This continues a recent trend towards record-setting months for fire in the State of Amazonas, with new maxima being set in 7 months of the year since 2019 (National Institute for Space Research, 2024). Recent changes in deforestation and land-use patterns are contributing to elevated fire ignitions in the state, reportedly compounded in 2023 by a historic drought and heatwave driven by El Niño (Espinoza et al., 2024; Clarke et al., 2024). Due to emissions of wildfire smoke, many areas of Amazonas experienced poor air quality from September to December 2023, including in the state capital, Manaus, where over 2 million people were exposed to the second-worst air quality in the world in October (Ministério Público Federal, 2023). The event was so severe that, in November 2023, the Federal Public Ministry opened a civil action case against the State of Amazonas, demanding evidence that the state was investing in fire prevention and combat in line with the “Plan for the Prevention and Control of Deforestation and Fires” (Estado do Amazonas, 2020). This procedure evaluates whether Amazonas authorities are accountable for environmental damage causing severe air pollution, reflecting the Public Ministry's growing involvement at both federal and state levels in monitoring environmental degradation and seeking to make authority figures accountable (Ministério Público Federal, 2023).
National fire monitoring systems in Brazil indicate that some areas of Amazonia experienced anomalies in BA at the sub-state level. For example, BA in the municipality of Santarém in the State of Pará rose from an average of 70 km2 in 2019 to 2022 to over 1000 km2 in 2023 and has already exceeded 250 km2 in 2024 (MapBiomas Brasil, 2024). Similarly, in the neighbouring Belterra municipality, BA extent was more than 3 times greater during the year 2023 than in 2019–2022 (MapBiomas Brasil, 2024). In Floresta Nacional do Tapajós, one of the most studied forest sites in the Amazon, which spans Satarém and Belterra, forest fires accounted for more than 60 % of the burned areas (MapBiomas Brasil, 2024). A total of 4000 people live in 24 communities of Traditional and Indigenous populations in the region and depend on protected forest resources for their cultural heritage, food security, economy, and livelihood in Floresta Nacional do Tapajós and Reserva Extrativista Tapajós-Arapiuns (Instituto Chico Mendes de Conservação da Biodiversidade, 2019). Fires in 2023 compounded the challenges faced by these communities, who were already isolated by low river levels resulting from the drought that severely reduced their mobility and fishing, impacting food security and enhancing socio-economic vulnerabilities.
In Chile, the 2023–2024 fire season was marked by a significant escalation in both the number and size of wildfires, especially in the central and southern regions (Fig. 4). Chile experienced its second-highest BA in the past 20 years (> 4000 km2; Jones et al., 2024). The peaks in BA at national scale were accompanied by peaks in the 95th percentile of fire size and daily rate of growth in highly populated regions such as Valparaíso (Figs. 2, 4), indicating unusually large and fast-moving fires. These fires drew international attention due to their deadly impacts on society. In February 2024, severe wildfires struck the Valparaíso region in Chile, particularly affecting Viña del Mar and other surrounding areas (NASA Earth Observatory, 2024). These fires resulted in the deaths of at least 131 people and destroyed thousands of homes, leaving at least 1600 people homeless (UN Resident Coordinator in Chile, 2024; Al Jazeera, 2024; El Disconcierto, 2024). The fires impacted the Lago Peñuelas National Reserve, where more than 60 km2 of forest was affected (Oberholtz, Fox Weather, 2024). The National System for Disaster Prevention, Mitigation and Attention (SENAPRED) issued a red alert and ordered the evacuation of over 18 nearby towns (Oberholtz, Fox Weather, 2024). The February 2024 wildfires in Valparaíso followed other major disruptive wildfires in February 2023, which affected nearby regions of central Chile including Maule, Nũble, Bio bío, La Araucanía, and Los Rios.
Several countries with territory in the west of Amazonia experienced anomalies in BA and fire behaviour during the 2023–2024 fire season, which coincided with drought conditions. Peru's Loreto region, which neighbours the Brazilian State of Amazonas, faced its highest BA on record in the 2023–2024 fire season, signalling the wider impacts of drought conditions in western Amazonia (Fig. 2). The timing of peak anomalies in BA also coincided with those in Amazonas, around September–October 2023 (Fig. S2). The northern Bolivian departments of La Paz and Beni experienced similarly timed anomalies in BA. Remote parts of the Colombian Amazon also saw a significant uptick in BA since November 2023, which peaked in January 2024 (Mongabay, 2024). As a result of months of record-high temperatures and drought conditions since the beginning of El Niño, the region recorded higher C emissions, reflecting the severity of the burning at the end of the studied fire season. While the direct impacts on society throughout these regions was not as pointed as in the case of fires in Chile, the events are likely to have contributed to reductions in regional air quality and also impacted forest ecosystems and raised C emissions from fires in South America. At the end of January there was a wildfire in the mountains surrounding Bogotá that affected the air quality that affected thousands of citizens of the capital of Colombia (France-Presse, VOA News, 2024).
In 2023-2024, Venezuela experienced its highest level of fire activity on record, particularly in January and February 2024 (ALER, 2024; Tiempo, 2024; Figs. 4, S2, S8), notably affecting the states of Anzoátegui, Cojedes, Guárico, and Monagas, areas of which dominant land cover primarily consists of savannas and extensive grasslands. This surge in fires during the dry season was intensified by unusually warm and dry conditions in the preceding months. These conditions, likely a result of global warming and changes in circulation and rainfall patterns associated with El Niño, make the landscapes more vulnerable to fires.
This appendix summarises current challenges in the observation and modelling of extreme fire events or seasons and identifies new technological and methodological advances that are raising opportunities to overcome such challenges. The section begins with a review of the study of extreme fire occurrence and then focuses on the study of extreme fire impacts across seven impact sectors. Advances in the study of both fire occurrence and fire impact are required because the impacts of extreme fires on society and the environment do not necessarily scale with observable fire properties (see Sect. 6.2).
B1 Occurrence
B1.1 Definition of extreme fire events
Studying impactful fires or unusual fire seasons is crucial for understanding changes in exposure and vulnerability to fire. However, defining “extreme” events presents several challenges. These challenges can be categorised here.
Data-oriented challenges are as follows:
-
Lack of consensus on quantitative criteria. Variability in measurable criteria, such as fire size, across different studies hinders consistent classification. No statistical threshold is universally established to define outliers.
-
Geographic variability. Regional differences complicate universal definitions. Size thresholds vary widely, influenced by local fire regimes.
-
Evolving definitions. The term “extreme fire” has expanded over time, encompassing more fire types and behaviours. Climate change increases fire severity, suggesting definitions need flexibility.
-
Context dependence. Definitions vary with ecosystem types and fire histories, lacking standardisation on baselines such as fire return intervals or ecosystem damage.
Knowledge-oriented challenges are as follows:
-
Lack of consensus on qualitative criteria. Variability in criteria-like fire behaviour and impacts reflects differing expert opinions. The subjective nature of significant impact complicates a clear definition.
-
Terminological overlap and redundancy. Terms like “catastrophic fire” and “megafire” overlap, causing confusion due to unclear or interchangeable usage.
-
Influence of language and culture. Interpretations differ across languages and cultures, affecting global reporting and definitions.
-
Societal influence on scientific terminology. Scientific terminology evolves with societal context. Language in scientific communication must remain adaptable and relevant to non-scientific audiences.
-
Scientific rigour and clarity. Clear, consistent, and scientifically rigorous definitions are needed for standardised measurements. Existing definitions often fall short.
Defining “extreme fire” requires a significant and inclusive effort across the fire science community. We avoided a strict definition here, instead adopting a broad and flexible definition as discussed in Sect. 2.1. To support a formal definition for future iterations of this report, standardised criteria and protocols should be developed through transdisciplinary approaches, such as through workshops involving input from scientists, fire practitioners, legislators, and communities (Chu et al., 2023; Linley et al., 2022; Shuman et al., 2022).
B1.2 Observation of extreme fire events
Global-scale data for characterising extreme fire events are primarily sourced from satellite observations, notably active fire detections, BA maps, and tracking of smoke plumes. However, to accurately define how extreme a fire event is, it is crucial to contextualise present-day observations within historical data. Unfortunately, the historical records of satellite-derived active fire and BA products are relatively short. The longest coherent observations on a global scale are derived from the MODIS instruments on board the Aqua and Terra satellites, launched in 1999 and 2002 respectively. Various global BA products, such as the MCD64 product family (Giglio et al., 2018) and FireCCI51 (Lizundia-Loiola et al., 2020), as well as active fire data like the MCD14 product family (Giglio et al., 2016), have been generated based on imagery acquired by MODIS. Although these time series now span more than 2 decades, they are still relatively short when compared to the decadal to centurial fire return intervals observed in many ecosystems.
Pre-MODIS satellite data, like those from the AVHRR programme, exist and provide a continuous imagery archive from 1982 onwards. Although efforts are ongoing to generate a coherent BA product from AVHRR data (Otón et al., 2021), there are limits to the global applicability of these products. For example, unresolved challenges stemming from coherence issues between imagery from different AVHRR sensors result in artefacts and spurious trends in various regions worldwide (Giglio and Roy, 2022), although this has been debated by other authors (Pullabhotla et al., 2023).
Efforts are ongoing to extend the MODIS time series by incorporating active fire data from ATSR and VIRS with BA data (e.g. Chen et al., 2023). However, due to the different characteristics of these data, creating a coherent, multi-satellite time series of active fire data and/or BA is not straightforward. Concerns also arise with the impending decommissioning of MODIS-Terra, raising doubts about the continuity of existing long-term fire records. However, operational satellite sensors such as VIIRS on board NOAA's series of satellites and SLSTR on board the Sentinel-3 satellites offer promising capabilities for medium-resolution BA mapping (e.g. Román et al., 2024; Lizundia-Loiola et al., 2022). Urgent attention should be directed towards developing methodologies to integrate these new datasets into a coherent, long-term BA dataset. Furthermore, advancements in medium-resolution satellite data availability and revisit times, particularly from Landsat and Sentinel-2, now enable global BA mapping at spatial resolutions as fine as 20–30 m (e.g. Roteta et al., 2021; Chuvieco et al., 2022), suggesting a potential future direction for coherent long-term global BA monitoring.
While BA is a key variable to characterise extreme fire occurrence, multiple other aspects of extreme fires can be characterised using satellite data. BA products can be used to cluster burned pixels in burned patches to obtain the number and size of individual fires (Archibald and Roy, 2009). Furthermore, the daily fire rate of spread, length of the active fire line, and spread direction can be extracted from the daily fire expansion (Andela et al., 2019). These algorithms, such as the Global Fire Atlas used in this study, give global scale and coherent estimates of patterns and trends in fire number, fire size, and rate of spread. However, these algorithms are sensitive to the temporal accuracy of the per-pixel burned date detection, the spatial resolution of the BA product, and any errors within each product. Recent advances focussing on clustering VIIRS thermal anomalies and extracting fire rate of spread, fire expansion, and length of the active fire line show promising results (Andela et al., 2022; Hantson et al., 2022; Chen et al., 2022) but have so far not been developed globally. Future development towards a global product should allow for a more detailed characterisation of fire characteristics in near-real time, well-suited for detection and quantification of fire extremes.
Active fire detections also record the amount of radiation emitted by the fire at the moment of satellite overpass (fire radiative power, FRP), within the pixel detected by the satellite. While this information is related to the intensity of the fire, the usage of FRP has been difficult as a low-intensity fire burning a large extent of the pixel can have a higher FRP than a high-intensity fire burning a small fraction of a pixel. These complications have limited a more standardised and operational usage of FRP for quantifying fire extremes. Advances in active fire detection from higher-resolution sensors may allow for a more comprehensive estimate of fire intensity when combined with FRP estimates from coarse resolution sensors (Schroeder et al., 2014, 2016).
A natural starting point for this global assessment of the 2023–2024 fire season was global data provided by the MODIS BA dataset, though we note that various national-, state-, or regional-level systems exist and can add longer-term context to the extremity of fire seasons (e.g. Canadell et al., 2021; Short, 2014; Gincheva et al., 2024). Regional datasets generally depend on manual logging of fires via field approaches or desk-based identification with high-resolution imagery or alternatively harness different blends of satellite observation with fire detection algorithms that can be regionally optimised. These approaches carry their own uncertainties and are limited by design to targeted regions, however their major advantage is multidecadal coverage. Advances in compiling regional datasets into gridded records with global coverage are bringing these advantages to formats compatible with global-scale analysis (Gincheva et al., 2024) and will thus be explored in future efforts to characterise regional extremes at scale.
B1.3 Prediction of extreme fire events
Since the 1970s, fire predictions have relied on empirical fire behaviour models tailored to specific ecosystems (Bradshaw et al., 1984; Noble et al., 1980; Stocks et al., 1989; van Wagner, 1987), becoming pivotal tools for fire management agencies (San-Miguel-Ayanz et al., 2013). The ease of implementation and the availability of weather data have contributed significantly to their widespread adoption. However, despite their utility, several studies have highlighted the limited effectiveness of the FWI and similar metrics in fuel-limited ecosystems, where fires are driven by the short-term superficial drying of intermittently available biomass (Yebra et al., 2013). The absence of consideration for actual fuel availability presents a constraint to the meaningful application of the FWI in savanna-type ecosystems. Likewise, the response of fuel moisture to meteorological factors can be influenced by external factors that are challenging to observe and model at scale, such as mortality triggered by insect infestation or disease (Canelles et al., 2021). Beyond weather conditions, the remaining prerequisites for fire activity – namely, fuel and ignitions – are intricately linked to vegetation state, lightning activity, and human behaviours. Improving fire forecasts beyond solely considering fire weather could be achievable by accurately describing these components. This has been widely recognised in the global vegetation–fire community for several decades (Hantson et al., 2016), and consequently great advances have been made to address this through the development of fire-enabled DGVMs, as used in this report. However, explicit representation of these processes introduces biases and instabilities that, when used in isolation, limits their utilisation for assessing climate and human drivers of BA extremes (Hantson et al., 2020; Burton et al., 2024).
The availability of remote observations for fuel, either independently (Yebra et al., 2018) or supported by modelling frameworks (McNorton and Di Giuseppe, 2024), has demonstrated potential in aiding the development of new fire models and indices that partially incorporate fuel considerations into their formulation (Di Giuseppe, 2023; Hantson et al., 2016). However, it is the emergence of the data-driven revolution that holds the promise of significantly enhancing our predictive capabilities for extreme fires (McNorton et al., 2024). This has driven the development of semi-empirical tools at regional and global scales that could improve fire predictions, and their effectiveness will be assessed in the next edition of the report. Not only can these tools enhance predictive capability for extreme fires, but they also present an opportunity to disentangle the drivers of the prediction, giving us the capability to address or at least understand the causes of the event, as demonstrated by the PoF and ConFire frameworks used here. The coupling of FireMIP models with observational data (Burton et al., 2024, and used here), also showcases the potential to bridge the advanced modelling capabilities of FireMIP with application-specific approaches such as ConFire and PoF.
Despite these technological advancements, widespread adoption is unlikely to occur suddenly, as there typically exists a delay between the creation of new indices, their operationalisation, and operational implementation by those responsible for fire prevention and control. There are also likely to be some stubborn issues with the detail provided large-scale observational data available to predictive systems, particularly in the case of fuel loads and fuel state (e.g. living versus dead). New global biomass observations, such as those from airborne and spaceborne light detection and ranging (lidar) and synthetic aperture radar (SAR), provide insights into fuel loading, but they are not currently providing information regarding fuel state that would be useful for modelling fuel moisture response to meteorological conditions (Santoro et al., 2022; Hunka et al., 2023).
Another emerging element is the recent availability of fire danger predictive systems at the seasonal and subseasonal timescales (Di Giuseppe et al., 2024). Currently, there is limited evidence on how these longer-range tools could contribute to prevention planning and adaptation strategies. While they exhibit minimal skill beyond 2 months, they may offer valuable pre-seasonal warnings under specific conditions established during important atmospheric modes of variability.
The current report does not include hybrid models for seasonal fire risk, fire propagation models, or fire susceptibility/risk mapping tools. Incorporating these approaches could offer valuable insights and will be considered in future reports. These advanced models and tools, which account for both past and present weather conditions as well as other critical factors such as soil moisture and vegetation dryness, can enhance our understanding of fire dynamics and improve predictive capabilities. By exploring these methods, future editions of the report could provide a more comprehensive overview of fire risk assessment and management strategies.
B1.4 Attribution extreme fires to global change
The prediction and management of extreme fire events have become increasingly complex due to the multifaceted impacts of global change. Climate change exacerbates fire risks through rising temperatures, altered precipitation patterns, and more frequent and severe droughts, as shown in Canada and western Amazonia in this report. These climatic shifts affect vegetation productivity, with elevated CO2 levels potentially increasing biomass and thereby providing more fuel for fires. Nutrient deposition and other environmental changes influence ecosystem responses, further altering fire potential. Land use changes and management practices also significantly influence fire dynamics. For example, human activities such as deforestation, urban expansion, and agricultural practices can both mitigate and exacerbate fire risks, with socioeconomic factors shown to have a strong influence on overall extreme fire likelihood in western Amazonia, and potentially contributing to increases in BA in 2023 in some areas of Greece. Effective land management strategies, including prescribed burns and forest thinning, are crucial for reducing fuel loads and minimising fire impacts. While climate-driven estimates of extreme behaviour are plentiful, few modelling frameworks take into account most of these dynamic factors and their interactions (Rabin et al., 2017).
We have used model–data fusion techniques that account for these factors in this report and have been able to attribute some of their influences in certain places. This report utilises semi-empirical models that blend empirical data with process-based understanding to better predict fire behaviour. Quantifying uncertainty in these models is essential, especially when dealing with extremes. By generating probability distributions, researchers can better understand the likelihood of various fire scenarios, informing more effective management and policy decisions.
Through uncertainty quantification techniques, we have been able to ascertain where we are confident in our attributions. However, uncertainties still remain, many from not considering the complex interactions and feedback onto fire, some from fire itself as it consumes fuel and some from effects of weather. Coupled vegetation–fire models explicitly represent many of these feedbacks. However, current FireMIP models struggle to accurately simulate extreme fire events (Hantson et al., 2020). One key factor hampering improvements in model development is our limited understanding of factors driving fire extinguishers in a natural setting. While much process-based knowledge exists on the factors influencing fire start and fire spread, only limited knowledge exists on the myriad of factors that can stop a fire, from changes in fuel moisture, structure, and heterogeneity to landscape fragmentation and fire fighting and how these interact (e.g. Finney et al., 2012). Without a strong theoretical understanding of these factors, process-based modelling of extremes at a global scale might be limited in the near future. For the 2023 focal events, we have shown that low fuel loads and variations in human modification of the landscape can limit fuel spread (Figs. 11, 12, S13, S14). However, we only look at a handful of events, and further examples are required at larger scales to inform improvement of process-based rates of spread in fire models.
To move forward, we need to combine these concepts in attribution techniques and quantifying uncertainty with coupled vegetation fire models, such as in FireMIP. Early attempts of this are promising – ConFire (used in Sects. 3, 4 and 5) borrows many of the modelling concepts from FireMIP, though it still lacks many feedbacks from fire itself. We have also used the latest FireMIP models coupled to an uncertainty framework for broad-scale, uncertainty-based attribution (obtained from Burton et al., 2024). But they struggle at reproducing the tails of distributions where extreme events are found. Another way to develop these techniques is to move towards an integrated system that would inform both attribution and future projections in a seamless way. We make some progress in this direction here using tools such as ConFire, using the information gained from fire drivers to build future projections; however there is more work to do to link statistical approaches for today's fires to future projections.
The human role in driving fire and extremes is hard to represent. Despite the often-reported influences people have on both increasing extreme burning and causing the observed decline in global BA, the role of humans in the landscape remains hard to capture and, on the whole, remains one of the most uncertain aspects of this report. Agent-based modelling (ABM) is trying to address this by simulating the behaviours and interactions of individual human entities (e.g. deforestation, crop residue burning, and suppression) within a given environment (Ford et al., 2021). This approach provides a dynamic representation of how different factors contribute to fire risk and links well with subsequent sections of the report. These approaches could be a major contributor to subsequent issues of this report. However, the integration of these advanced modelling techniques into operational use faces challenges, as there is often a delay between the development of new approaches and their widespread adoption by fire management agencies. This underscores the need for continuous improvement and adoption of innovative modelling approaches to address the growing threat of extreme fire events effectively.
In addition to Fire Weather Index (FWI) and BA projections, it is crucial to go beyond these metrics to consider wider impacts such as intensity and emissions. Understanding the intensity of fires helps in assessing their destructive potential and the severity of their ecological and societal impacts. Emissions from fires, including C dioxide and other greenhouse gases, contribute to climate change and air quality issues. Finally, evaluating the broader impacts of fires, such as on biodiversity, human health, and economic stability, is essential for developing comprehensive adaptation and mitigation strategies. Quantifying and understanding the uncertainty in these projections is crucial for developing adaptive strategies that can effectively respond to the evolving fire risks posed by global change.
B1.5 Projection of fire extremes
Projections of extreme fire events under future climate scenarios indicate a significant increase in their frequency and intensity. Semi-empirical models used in this report project that extreme BA events, currently rare, are likely to become more common by the end of the century. These projections highlight the urgent need for robust fire management strategies and policies to mitigate the impacts of these increasingly severe fire events on ecosystems, communities, and global C dynamics. Quantifying and understanding the uncertainty in these projections is crucial for developing adaptive strategies that can effectively respond to the evolving fire risks posed by global change. In our ConFire uncertainty quantification framework, we have been able to make some confident inferences about the potential state of wildfires in the coming decades. However, we have also identified that there is a significant amount of crucial information that is currently beyond our reach due to the uncertainties involved. Our ability to forecast for the upcoming season, as well as for the next 2–3 decades, requires further refinement as we are observing mixed and uncertain responses. Beyond that, we still show similar uncertainties in responses of Canada and western Amazonia under different scenarios as highlighted by UNEP (2022a), which uses the previous generation of climate models from CMIP5, which shows a large overlap in the potential range of changes in the occurrence of fire extremes between SSP370 and SSP585. This does not imply that mitigation efforts for one scenario will be ineffective compared to another but rather indicates a lack of understanding regarding the response of extremes to these scenarios. By narrowing down the uncertainty ranges, we can better target adaptation efforts and evaluate the effectiveness of mitigation strategies. The reduced likelihood of extreme event recurrence in our high mitigation, however, does show that we can start separating out how mitigation efforts might affect fire extremism, though not in the level of detail needed for policy.
There are three main ways we may be able to constrain uncertainties in the coming reports. The first is development of the underlying GCMs that project future change in the drivers of BA. For individual models, this is a slow process and, beyond informing CMIP model development, is outside what the State of Wildfires can contribute to. However, bringing in more models, including having another model to incorporate any remaining biases in simulated fire from the correct models into our uncertainty projection, will help us constrain uncertainties more (Kelley et al., 2023). The second is obtaining more information and understanding of how fire drivers relate to fire extremes as outlined in the previous section.
Better ways of describing the statistical relationship between observed and modelled climate, land surface and fire today is a third approach. Investigating the dynamical climatic drivers of extreme fire conditions in different regions can help to physically disentangle and potentially constrain sources of uncertainty in future climate projections, for example, by constructing physical storylines (Shepherd et al., 2018; Mindlin et al., 2023). These storylines of plausible future change, or other similar approaches to quantify and explain uncertainty in projections, provide critical information for communities to develop robust adaptation strategies (Lemos et al., 2012) and prepare for future losses and damage caused by evolving fire risks posed by global change. Next to understanding future uncertainty, further insights into these dynamical drivers can support the development of improved physics-informed bias adjustment of climate models (Maraun et al., 2017). Currently available methods to bias-adjust climate models for their use in fire models, such as the ISIMIP3BASD method, have been shown to modify the climate change trend, particularly in extreme threshold indices (Casanueva et al., 2020; Spuler et al., 2024a) or increase spread in climate model projections (Lafferty and Sriver, 2023). Bias adjustment methods should therefore be evaluated carefully and leave scope for future method development that physically links present-day biases to future uncertainty.
B2 Impact
B2.1 Direct exposure of people and the built environment
The direct exposure of people and the built environment could be studied at scale; however these analyses have not been performed routinely and have thus far tended to focus on specific regions. The wildland urban interface (WUI) has been the focus of direct fire exposure to populations, particularly in urban conflagrations like the Lahaina fire in August 2023. Efforts to reduce fire losses in the WUI through prevention, fuel reduction, and mitigation (Calkin et al., 2023) are crucial due to increased populations in these areas (Radeloff et al., 2018) and rising fire potential, accelerating community impacts (Higuera et al., 2023). US studies showed a doubling of direct population exposure to large fires during 2000–2019, mainly due to fires encroaching on the WUI (Modaresi Rad et al., 2023). Similar increases were noted in wildfires, affecting roads and energy infrastructure and complicating transportation and energy reliability. Most structure losses in the United States occurred in grasslands and shrublands, not forests, highlighting the need to look beyond traditional forest-centric assessments. Global WUI mapping efforts (Schug et al., 2023) offer opportunities to identify vulnerable areas and characterise fire exposure trends (Chen et al., 2024; Tang et al., 2024).
Understanding fire characteristics that result in direct exposure, structure loss, and fatalities is essential. For instance, Abatzoglou et al. (2023) found that fires driven by strong downslope winds in the western United States caused most structure losses and fatalities from 1999–2020, despite being only 12 % of all fires. These winds push fires downhill into WUI communities, overwhelming suppression efforts and fuel treatments. The 2023 fires in Hawaii, Greece, and Chile were driven by such conditions (Synolakis and Karagiannis, 2024). The diagnosis of characteristics of extreme fires, including meteorological conditions (Van Wagtendonk, 2006; Lareau et al., 2018) and pre-existing vegetation conditions (Stephens et al., 2022), provides insights into fires likely to cause significant impacts, helping prioritise mitigation efforts.
A significant gap in characterising extreme fires and their human impacts (fatalities; evacuations; structure loss; secondary morbidity; economic losses; and impacts on food, water, energy, and transportation) is the lack of comprehensive national-to-global data. Wildfire morbidity data are collected in few countries due to the infrequency of fatal wildfires and unclear cataloguing responsibilities (Haynes et al., 2019). Smoke-induced morbidity estimates rely on spikes in hospital visits linked to specific events (Johnston et al., 2021). California pioneered systematic cataloguing of structure losses in 2013, yielding significant insights (Kolden and Henson, 2019; Syphard and Keeley, 2019), but this model has not been widely adopted. Canada now catalogues wildfire evacuations, but complexities remain in characterising these events (Beverly and Bothwell, 2011). Global insurance records document insured losses but do not represent broader losses due to high rates of uninsured property (Hazra and Gallagher, 2022).
Databases like EM-DAT have attempted to fill this gap but often overgeneralise wildfire impacts, relying on variable accuracy news reporting. Expanding and improving quantification of wildfire impacts on humans is critical to overcoming the “burned area fallacy” and developing effective mitigation models (Kolden, 2020). Remote sensing for documenting structure loss and fire incursion into the WUI, combined with high-resolution sensors and air quality monitors, can facilitate interdisciplinary research on wildfire smoke and medical morbidity (Liang et al., 2021).
B2.2 Air quality and health impacts
The impacts of fire on air quality and health could be studied routinely at scale using atmospheric models; however these analyses face several challenges. Exposure to outdoor pollution is a major global health risk (GBD 2019 Risk Factors Collaborators, 2020). Fine particles with a diameter of less than 2.5 µm (PM2.5) are particularly concerning due to their link to cardiovascular diseases. Fire smoke is increasingly impacting air quality and is considered more toxic per unit of PM exposure than other pollution sources (Aguilera et al., 2021). The World Health Organization (WHO) has reduced the annual mean exposure limit for PM2.5 from 10 to 5 µg m−3. With 95 % of the world's population exposed to PM2.5 concentrations of at least 10 µg m−3 (Shaddick et al., 2018), the rise in severe wildfire pollution poses an elevated health risk.
Issues contributing to the challenge of quantifying the impact of fire pollution on human health are the same as those for other pollution sources, including, but not limited to, a lack of ground-based measurements in many regions of the world, a need for more pollution dispersion and transport studies, a deeper understanding of plume dynamics and chemistry, and a partial reliance on animal-based human exposure–response models (e.g. Fiore et al., 2012; Fuzzi et al., 2015). These issues contribute to three of the major challenges in quantifying the impact of extreme fire pollution on human health. The first is accurately measuring the amount of pollution that a wide variety of communities are exposed to and then attributing the contribution of a wildfire event, which could be hundreds or thousands of kilometres away, to the measured concentration. The second is that PM2.5 is not the only pollutant of concern (the EPA regulates six pollutants of concern for American citizens, and a wildfire produces them all). The third is accurately linking exposure to a wide range of pollutants to their associated short-term and long-term health impacts.
Tools to assess air quality primarily consist of ground-based measurements and modelling. Ground-based observations provide an accurate measurement of pollution at their location. However, measurement locations are spatially sparse. Ongoing efforts to increase spatial coverage include deployment of small relatively affordable particulate matter sensors, such as the PurpleAir network, by a wide range of communities (not just scientists), and efforts to relate surface PM concentrations to measured aerosol optical depth from satellites (Y. Li et al., 2021). One additional constraint of observations is that they cannot differentiate pollution sources, but modelling can.
Dispersion modelling uses emission estimates, reanalysis meteorology, and topography to provide estimates of ambient pollutant concentrations at varying spatiotemporal scales. A challenge for models currently lies in the large uncertainty in fire emissions (Reddington et al., 2016; Carter et al., 2020; Pan et al., 2020). Emission data will therefore require calibration against observations and adjusting before the contribution of fire to pollution can be quantified. Improved emission datasets will increase confidence in these assessments.
Environmental and personal factors both influence cardiovascular health, making it challenging to isolate the effects of fire smoke. Impacts may also not be immediate; some effects can be acute, such as exacerbation of asthma, while others emerge over a longer period, like the development of cardiovascular disease, and are thus much more difficult to directly connect to a specific extreme fire event. Conducting epidemiological studies that link fire smoke exposure to specific health outcomes requires comprehensive data collection and follow-up. These studies are resource-intensive, time consuming, and subject to potential limitations in data.
B2.3 Impacts on Indigenous and Traditional communities
The impacts of fire on Indigenous and Traditional communities are not studied routinely and at scale, typically focussing on isolated regions and specific communities. Indigenous peoples and local communities (IPandLC) are disproportionately exposed to extreme fire impacts because of their proximity to the land and resources from which their cultures, livelihoods, and often food and medicines derive. Once landscapes are degraded through fire, the access and abundance of various resources can be shifted. At the same time, these communities are often less supported by the state due to access and their political and economic marginalisation, linked to systemic socioeconomic disadvantages. These communities not only suffer post-fire impacts but can also be disincentivised from particular land- and resource-use activities because of the increasing threat of forthcoming wildfires. Whilst the multiple important values (e.g. instrumental, intrinsic, and relational) associated with landscapes by IPandLCs are threatened by fire, there is a lack of systematic pre- and post-fire assessment of these impacts (van Leeuwen and Miller-Sabbioni, 2023).
Historically, fire governance has added an additional burden to IPandLC, often prohibiting cultural fire use and management to the detriment of local knowledge and values and in some cases also increasing the propensity of wildfire in tropical systems as well as savannahs (Carmenta et al., 2019; Daeli et al., 2021; Croker et al., 2023). In some contexts there is a shift towards correcting these issues and renewed interest in and support for cultural burning and Indigenous approaches to land management. For example, integrated fire management is gaining traction globally and sits at the heart of a number of interventions and international policy efforts (e.g. Fire Hub, 2023). The premise of integrated fire management (IFM) is to maximise the “good” fire and minimise the occurrence of wildfire often through an approach of connecting knowledge (i.e. expert and place-based or Indigenous). Whilst nations sit at different stages of development in respect to IFM, and many IPandLC feel there is a long way to go, the growing interest is promising (Bilbao et al., 2019; Luque et al., 2020; Rodríguez-Trejo et al., 2022). Research is needed to better understand the effectiveness of IFM and what mechanisms and processes work best for rebalancing the influence of various forms of knowledge on fire management. For instance, in North America, fire use is considered a form of medicine to the land and anointed to particular patches of the landscape for care (Palmer, 2021). These approaches are perceived as potentially more, just as they allow for the many meanings and uses of fire to exist and persist. For example, in Australia, the term “country” is used to convey the cultural and spiritual connection of Aboriginal peoples to the land and water in specific regions. This link profoundly colours Indigenous peoples' experience of extreme fire events such as the Black Summer fires of 2019–2020 (Nolan et al., 2021b).
B2.4 Economic impacts
The economic impacts of fire are generally not studied routinely and at scale but rather focus on individual regions and fire seasons and arrive some time after the event occurs. Extreme wildfires cause economic disturbances worldwide, with impacts varying across regions due to different economic structures, environmental conditions, and response strategies. These impacts include property and infrastructure loss, business downtime, supply chain disruptions, decreased tourism, health costs, reduced productivity, and damages to ecosystem services. While tangible costs (e.g. insured property losses) are easier to measure, intangible costs (e.g. lives lost, health impacts from smoke exposure, damage to species and habitats) are harder to quantify due to data availability and varying temporal and spatial scales. Consequently, assessing the true economic costs of extreme wildfires is challenging. Additionally, some sectors may benefit economically from post-fire reconstruction and suppression efforts (Nielsen-Pincus et al., 2014; Meier et al., 2023a).
Research on the economic impacts of wildfires has mainly focused on developed economies in Europe, the United States, and Australia. For instance, Meier et al. (2023b) estimated economic losses from a 1-in-10-year extreme wildfire in Mediterranean Europe: EUR 162–439 million in Portugal, EUR 81–219 million in Spain, EUR 41–290 million in Greece, and EUR 18–78 million in Italy. California's 2018 and 2020 wildfire seasons resulted in approximately USD 150 billion and USD 19 billion in economic damages, respectively (Wang et al., 2021; Safford et al., 2022). Australia's 2019–2020 fire season was the costliest natural disaster in the country's history, with an estimated GDP decrease of USD 10 billion (Wittwer and Waschik, 2021).
While satellite data can provide proxies for economic impact shortly after events, traditional economic indicators such as sectoral GDP, employment, hospitalisations, suppression spending, house prices, and tourism revenues are often not publicly available, not harmonised, or unable to capture long-term effects. Thus, the full economic costs may only become apparent years later.
Econometric analysis of wildfires is more challenging than for other natural hazards because wildfire occurrence is largely influenced by human activity, land-use choices, and socioeconomic factors. While earthquakes are non-human-induced, making causal analysis easier, wildfires correlate with many economic outcome variables. Despite these challenges, counterfactual analyses or econometric approaches like instrumental variables can provide reliable causal estimates of wildfire impacts. These methods promise to enhance understanding and mitigation of wildfire economic consequences through more accurate analyses, helping target suppression policies and allocate resources effectively.
B2.5 Loss of biodiversity, ecosystem function, and carbon storage
Impacts of extreme fires on biodiversity and rates of post-fire recovery have tended to require field-based approaches and are therefore not conducted routinely and at scale. Climate change, altered ignition, and suppression patterns are reshaping fire regimes and ecosystem functions, impacting biodiversity, ecosystem services, and C storage. Reduced seed quality, resprouting exhaustion, organic soil burning, and misaligned reproductive processes hinder post-fire regeneration (Burrell et al., 2022; Nolan et al., 2021a; Johnstone et al., 2016). Other disturbances like drought and insect infestations compound these effects. For example, increased fire activity in boreal forests is reducing fire-adapted species like black spruce, favouring deciduous species, and altering forest structure and C dynamics (Baltzer et al., 2021). In western North America, high-severity fires and warmer, drier conditions lead to poor forest recovery and transitions to shrublands or grasslands, affecting habitat, water regulation, and C storage (Coop et al., 2020). Similarly, in tropical savannas and forests, fire frequency can cause ecosystem transitions that are detrimental for C storage and biodiversity (Staver et al., 2011). Furthermore, release of ozone and particulate matter from fires including PM2.5 negatively impacts plant and ecosystem health (Anand et al., 2022) and reduces leaf area index through drought induced by aerosol radiative effects, leading to reduced carbon uptake (Tian et al., 2023).
Observing and modelling shifting fire regimes face challenges due to variability, inconsistent historical data, and complex ecosystem responses. Short-term observations often miss long-term trends, and species-specific reactions are influenced by fire-adaptive traits and genetic variability (Grau-Andrés et al., 2024). Fire regimes respond to multiple disturbances, complicating analysis (Nolan et al., 2021a; Coop et al., 2020).
Researchers are using new technologies to address these challenges. Advanced remote sensing, including satellite imagery and drones, provides detailed data on fire extent and severity (Burrell et al., 2022; Baltzer et al., 2021). Improved modelling techniques, such as process-based simulation models and machine learning, enhance predictive capabilities (Coop et al., 2020; Nolan et al., 2021a). Long-term monitoring networks and citizen science initiatives contribute to comprehensive datasets (Baltzer et al., 2021; Coop et al., 2020). Advances in genomic tools, climate-adaptive management frameworks, and AI further improve fire impact predictions (Nolan et al., 2021a; Coop et al., 2020; Grau-Andrés et al., 2024). In all cases, efforts to harmonise local to regional-scale observations of impact are required, in a similar manner to emerging compilations of regional fire monitoring systems (e.g. Gincheva et al., 2024).
A good example of emerging opportunities stemming from the assemblage of large datasets and application of AI is the comprehensive meta-analysis by Grau-Andrés et al. (2024), which analysed data from published studies to find that intensified fire regimes reduce plant abundance, diversity, and health globally. Increased fire severity has stronger effects than frequency, with forests, especially conifer and mixed forests being more negatively impacted than open-canopy ecosystems. Woody plants are more susceptible than herbs due to slower growth and recovery rates. Arid and cold climates exacerbate these impacts, and transitions from surface to crown fires significantly reduce plant abundance, diversity, and health.
B2.6 Nature-based solutions and net zero
The impacts of extreme fire on nature-based solutions such as reforestation projects are known to be of potential high importance, yet studies of these effects remain rare. Terrestrial ecosystems remove about 30 % of annual anthropogenic C emissions through enhanced growth and ecosystem recovery, but land-use change offsets this by increasing annual C emissions by about 12 % (Friedlingstein et al., 2023). Nature-based solutions, including forestry projects for planting, restoration, or conservation, are prominent in net zero strategies (Seddon et al., 2020). However, these projects are at risk from fires, leading to inaccurate C accounting and reversal risks. The spatial clustering of C projects in specific areas can exacerbate risk due to climate variability, such as El Niño impacts. In C markets, projects often allocate a portion of their credits to a buffer pool to account for reversal risks, but this may not be sufficient in regions facing increasing wildfire extremes (Badgley et al., 2022; Anderegg et al., 2024).
Despite these challenges, C markets offer opportunities to fund improved management of fire-prone ecosystems like savannas (Russell-Smith et al., 2015) and temperate forests (Nikolakis et al., 2022), benefiting ecosystems, climate, and local communities. Effective and scalable C markets require accurate and transparent monitoring systems for science-based fire management, precise C loss accounting from fires, and assessment of reversal risks. Novel satellite-based monitoring can provide early warnings, response to wildfire activity, and better estimates of ecosystem C stocks. Field studies remain essential for understanding the immediate and long-term impacts of fire on ecosystems (Silva et al., 2020), and new models forecasting fire risk over decades are needed to improve management strategies and support credible C claims.
B2.7 Water quality and other aquatic impacts
Impacts of extreme fires on water quality and other aquatic properties have tended to require field-based approaches and are therefore not conducted routinely and at scale. Fire impacts freshwater ecosystems mainly through (i) the loss of vegetation and litter cover and (ii) the enhanced input of soil, sediment, and ash. This leads to reduced rainfall interception; increased runoff; and greater rainfall reaching streams, lakes, and reservoirs (Smith et al., 2011). Increased runoff from burned hillslopes can cause erosion, debris flows, and localised flooding (Shakesby and Doerr, 2006).
Wildfire ash, enriched in nutrients and contaminants (e.g. metals, polycyclic aromatic hydrocarbons) compared to vegetation and soil (Bodí et al., 2014; Sánchez-García et al., 2023), affects water quality by increasing turbidity, temperature, nutrient, and toxin content and decreasing dissolved oxygen. These changes can cause increased mortality in freshwater ecosystems, algal blooms, and water quality issues for supply catchments (Smith et al., 2011). For example, the 2016 Horse River Fire in Canada led to USD 9 million in additional water treatment costs (Pomeroy et al., 2019). The impacts depend on the burned ecosystem type, fire size and severity, vegetation recovery rate, and post-fire rainfall patterns (Shakesby and Doerr, 2006; Nunes et al., 2018).
Fire emissions to the atmosphere contain compounds that can enrich or toxify aquatic ecosystems (Hamilton et al., 2022; Perron et al., 2022). While 2023 fire impacts on marine ecosystems are not yet well-documented, past extreme fires have disturbed ocean productivity far from the fire source. For instance, large Siberian fires in 2014 boosted Arctic phytoplankton blooms by adding reactive nitrogen (Ardyna et al., 2022). Similarly, 2019–2020 Eurasian fires increased East Siberian Sea productivity by over 200 % through nutrient deposition and ice melting (Seok et al., 2024). The 2017 Thomas fires in California and the 2019–2020 Black Summer fires in Australia also caused significant changes in marine productivity and coastal ecosystems (Kramer et al., 2020; Ladd et al., 2023; Tang et al., 2021). The latter fuelled a large phytoplankton bloom, temporarily offsetting the carbon emitted by the fires (Tang et al., 2021), though this effect fluctuates with each fire season (Hamilton et al., 2022; Wang et al., 2022).
The supplement related to this article is available online at: https://doi.org/10.5194/essd-16-3601-2024-supplement.
Conceptualisation: MWJ, DIK, CAB, FDG.
Project administration: MWJ, DIK, CAB, FDG.
Data curation: MWJ, DIK, CAB, FDG, MLFB, EB, SL, GM, JM, FS, JW, MP.
Formal analysis/validation: MWJ, DIK, CAB, FDG, MLFB, EB, AH, SL, GM, JM, FS, JW, MP, DSH.
Resources/software: NA, LG, MP, GRvdW, MLFB, EB, AH, SL, JM, FS, JW, EB, JSMA, YQ.
Visualisation: MWJ, DIK, CAB, FDG, GM, JM, YQ, AL.
Writing (original draft preparation): MWJ, DIK, CAB, FDG, JM, LA, SA, DA, HC, SD PF, SaH, PJ, CK, NR, BS, JS, VT, GX, RC, DSH, StH, SM, MMGP, MP, AJH, FS, JBW.
Writing (review and editing): all authors.
At least one of the (co-)authors is a member of the editorial board of Earth System Science Data. The peer-review process was guided by an independent editor, and the authors also have no other competing interests to declare.
Publisher's note: Copernicus Publications remains neutral with regard to jurisdictional claims made in the text, published maps, institutional affiliations, or any other geographical representation in this paper. While Copernicus Publications makes every effort to include appropriate place names, the final responsibility lies with the authors.
The authors thank the following people for their contributions to the identification and description of key events in the 2023–2024 fire season: Robert Ang'ila (Karatina University, Kenya), Miltiadis Athanasiou (Institute of Mediterranean Forest Ecosystems, Greece), Davide Ascoli (University of Turin), Chris Collins (Tasmania Fire Service, Australia), Abigail Croker (Imperial College, London), Helen De Klerk (Stellenbosch University), Kebonyethata Dintwe (University of Botswana), David Field (NSW Rural Fire Service, Australia), Ronald Heath (Forestry South Africa), Konstantinos Kaoukis (Institute of Mediterranean Forest Ecosystems, Greece), Agnes Kristina (Department of Fire and Emergency Services, Australia), Niall MacLennan (Scottish Fire and Rescue Service), John Mendelsohn (Okavango Research Institute), Grant Pearce (Fire and Emergency New Zealand, New Zealand), Galia Selaya (Ecosconsult, Bolivia), Russell Stephens Peacock (QLD Fire and Emergency Services, Australia), Simeon Telfer (SA Country Fire Service, Australia), Emmanuela Zevgoli (Agricultural University of Athens, Greece), the Hellenic Agricultural Organization “DIMITRA”, and The Chico Mendes Institute for Biodiversity Conservation (ICMBio, Brazil, Santarém Office). The authors thank Andrew Ciavarella (Met Office) for guidance on using the HadGEM3-A data for the Fire Weather Index. The authors thank Anna Bradley (UK Met Office) for JULES-ES-ISIMIP data processing and submission to the ISIMIP repository. The authors thank the working groups “FLARE: Fire science Learning AcRoss the Earth System” and “TerraFIRMA: Dummies Guide to using Fire Models” for contributing to defining the report scope and establishing contributor links.
Matthew W. Jones was funded by the UK Research and Innovation (UKRI) Natural Environment Research Council (NERC) (NE/V01417X/1). Douglas I. Kelley was supported by UKRI NERC as part of the LTSM2 TerraFIRMA project and NC-International programme (NE/X006247/1) delivering National Capability. Chantelle A. Burton was funded by the Met Office Climate Science for Service Partnership (CSSP) Brazil project, which is supported by the Department for Science, Innovation and Technology (DSIT), and by the Met Office Hadley Centre Climate Programme funded by DSIT. Paulo M. Fernandes received support from National Funds by the Fundação para a Ciência e a Tecnologia (project UIDB/04033/2020, https://doi.org/10.54499/UIDB/04033/2020). Francesca Di Giuseppe and JMCTS70 were both funded by a service contract from the Joint Research Centre (no. 942604) issued by the Joint Research Centre on behalf of the European Commission. Liana O. Anderson was supported by the Fundação de Amparo à Pesquisa do Estado de São Paulo (FAPESP) (projects: 2021/07660-2 and 2020/16457-3) and by the Conselho Nacional de Desenvolvimento Científico e Tecnológico (CNPq), productivity scholarship (process: 314473/2020-3). Guilherme Mataveli was supported by FAPESP (grants 2019/25701-8, 2020/15230-5 and 2023/03206-0). Seppe Lampe was supported by a PhD Fundamental Research Grant by Fonds Wetenschappelijk Onderzoek – Vlaanderen (11M7723N). Sarah Meier was supported by the Dragon Capital Chair on Biodiversity Economics. Emilio Chuvieco was supported by the European Space Agency's Climate Change Initiative (ESA CCI) programme (FireCCI: contract no. 4000126706/19/I-NB). Crystal A. Kolden was supported by the USDA National Institute of Food and Agriculture (award 2022-67019-36435). Yuquan Qu was supported by the China Scholarship Council (CSC) under grant number 201906040220. Morgane M. G. Perron was supported by a HORIZON EUROPE Marie Skłodowska-Curie Actions Postdoctoral Fellowship 2021, funding number 101064063. Hamish Clarke was funded by the Westpac Scholars Trust via a Westpac Research Fellowship (HamishClarkeFellowship). Stefan H. Doerr was supported by UKRI NERC (grant NE/X005143/1) and the FirEUrisk project, which has received funding from the European Union's Horizon 2020 Research and Innovation programme under grant agreement no. 101003890. Esther Brambleby was supported by the UKRI NERC ARIES Doctoral Training Partnership (grant number NE/S007334/1). Jacquelyn K. Shuman was supported by the National Aeronautics and Space Administration (NASA) FireSense project. Niels Andela was supported by the Sense4Fire project as part of the European Space Agency C Cycle Cluster (ESA contract numbers: 4000134840/21/I-NB). Maria Lucia F. Barbosa was supported by the Coordenação de Aperfeiçoamento de Pessoal de Nível Superior (CAPES), FinanceCode001. The contribution of Sander Veraverbeke was funded by a Consolidator grant from the European Research Council (grant agreement no. 101000987). Rachel Carmenta was financially supported by the Tyndall Centre for Climate Change Research.
This paper was edited by Francesco N. Tubiello and reviewed by David Carlson, Piers M. Forster, and Marco Turco.
Abatzoglou, J. T., Williams, A. P., Boschetti, L., Zubkova, M., and Kolden, C. A.: Global patterns of interannual climate–fire relationships, Glob. Change Biol., 24, 5164–5175, https://doi.org/10.1111/gcb.14405, 2018.
Abatzoglou, J. T., Williams, A. P., and Barbero, R.: Global Emergence of Anthropogenic Climate Change in Fire Weather Indices, Geophys. Res. Lett., 46, 326–336, https://doi.org/10.1029/2018GL080959, 2019.
Abatzoglou, J. T., Juang, C. S., Williams, A. P., Kolden, C. A., and Westerling, A. L.: Increasing Synchronous Fire Danger in Forests of the Western United States, Geophys. Res. Lett., 48, e2020GL091377, https://doi.org/10.1029/2020GL091377, 2021.
Abatzoglou, J. T., Kolden, C. A., Williams, A. P., Sadegh, M., Balch, J. K., and Hall, A.: Downslope Wind-Driven Fires in the Western United States, Earth's Future, 11, e2022EF003471, https://doi.org/10.1029/2022EF003471, 2023.
Abram, N. J., Henley, B. J., Sen Gupta, A., Lippmann, T. J. R., Clarke, H., Dowdy, A. J., Sharples, J. J., Nolan, R. H., Zhang, T., Wooster, M. J., Wurtzel, J. B., Meissner, K. J., Pitman, A. J., Ukkola, A. M., Murphy, B. P., Tapper, N. J., and Boer, M. M.: Connections of climate change and variability to large and extreme forest fires in southeast Australia, Commun. Earth Environ., 2, 8, https://doi.org/10.1038/s43247-020-00065-8, 2021.
Adzhar, R., Kelley, D. I., Dong, N., George, C., Torello Raventos, M., Veenendaal, E., Feldpausch, T. R., Phillips, O. L., Lewis, S. L., Sonké, B., Taedoumg, H., Schwantes Marimon, B., Domingues, T., Arroyo, L., Djagbletey, G., Saiz, G., and Gerard, F.: MODIS Vegetation Continuous Fields tree cover needs calibrating in tropical savannas, Biogeosciences, 19, 1377–1394, https://doi.org/10.5194/bg-19-1377-2022, 2022.
AfricaNews: Wildfires force evacuations of South African coastal towns, Africanews, https://www.africanews.com/2024/01/31/wildfires-force-evacuations-of-south-african-coastal-towns/ (last access: 9 July 2024), 31 January 2024.
Aguilera, R., Corringham, T., Gershunov, A., and Benmarhnia, T.: Wildfire smoke impacts respiratory health more than fine particles from other sources: observational evidence from Southern California, Nat. Commun., 12, 1493, https://doi.org/10.1038/s41467-021-21708-0, 2021.
Agustí-Panareda, A., Diamantakis, M., Massart, S., Chevallier, F., Muñoz-Sabater, J., Barré, J., Curcoll, R., Engelen, R., Langerock, B., Law, R. M., Loh, Z., Morguí, J. A., Parrington, M., Peuch, V.-H., Ramonet, M., Roehl, C., Vermeulen, A. T., Warneke, T., and Wunch, D.: Modelling CO2 weather – why horizontal resolution matters, Atmos. Chem. Phys., 19, 7347–7376, https://doi.org/10.5194/acp-19-7347-2019, 2019.
Al Jazeera: From Algeria to Syria, heatwaves scorch Middle East, North Africa, Al Jazeera, https://www.aljazeera.com/news/2023/7/19/from-algeria-to-syria-heatwaves-scorch-middle-east-north-africa (last access: 9 July 2024),19 July 2023a.
Al Jazeera: Wildfires in Algeria kill dozens, force hundreds to flee homes, Al Jazeera, https://www.aljazeera.com/news/2023/7/24/deadly-algeria-wildfires-amid-extreme-heat-high-winds (last access: 9 July 2024), 24 July 2023b.
Al Jazeera: More than 60 people killed as forest fires rage in Chile, Al Jazeera, https://www.aljazeera.com/news/2024/2/3/chile-declares-state-of-emergency-over-raging-forest-fires (last access: 9 July 2024), 4 February 2024.
ALER: Alarmantes cifras de incendios forestales se registran en Venezuela durante el primer trimestre de 2024 – ALER, https://aler.org/nota_informativa/alarmantes-cifras-de-incendios-forestales-se-registran-en-venezuela-durante-el-primer-trimestre-de-2024/ (last access: 9 July 2024), 2024.
Alvarado, S. T., Andela, N., Silva, T. S. F., and Archibald, S.: Thresholds of fire response to moisture and fuel load differ between tropical savannas and grasslands across continents, Global Ecol. Biogeogr., 29, 331–344, https://doi.org/10.1111/geb.13034, 2020.
Anand, P., Mina, U., Khare, M., Kumar, P., and Kota, S. H.: Air pollution and plant health response-current status and future directions, Atmos. Pollut. Res., 13, 101508, https://doi.org/10.1016/j.apr.2022.101508, 2022.
Andela, N. and Jones, M. W.: Update of: The Global Fire Atlas of individual fire size, duration, speed and direction, Zenodo [data set], https://doi.org/10.5281/zenodo.11400062, 2024.
Andela, N., Morton, D. C., Giglio, L., Chen, Y., van der Werf, G. R., Kasibhatla, P. S., DeFries, R. S., Collatz, G. J., Hantson, S., Kloster, S., Bachelet, D., Forrest, M., Lasslop, G., Li, F., Mangeon, S., Melton, J. R., Yue, C., and Randerson, J. T.: A human-driven decline in global burned area, Science, 356, 1356–1362, https://doi.org/10.1126/science.aal4108, 2017.
Andela, N., Morton, D. C., Giglio, L., Paugam, R., Chen, Y., Hantson, S., van der Werf, G. R., and Randerson, J. T.: The Global Fire Atlas of individual fire size, duration, speed and direction, Earth Syst. Sci. Data, 11, 529–552, https://doi.org/10.5194/essd-11-529-2019, 2019.
Andela, N., Morton, D. C., Schroeder, W., Chen, Y., Brando, P. M., and Randerson, J. T.: Tracking and classifying Amazon fire events in near real time, Sci. Adv., 8, eabd2713, https://doi.org/10.1126/sciadv.abd2713, 2022.
Anderegg, W. R. L., Trugman, A. T., Vargas, G., Wu, C., and Yang, L.: Current forest carbon offset buffer pools do not adequately insure against disturbance-driven carbon losses, bioRxv [preprint], https://doi.org/10.1101/2024.03.28.587000, 2024.
Antara News: ASEAN inaugurates ACC THPC to combat haze pollution, Antara News, https://en.antaranews.com/news/292902/asean-inaugurates-acc-thpc-to-combat-haze-pollution (last access: 9 July 2024), 2023.
Aragão, L. E. O. C., Malhi, Y., Roman-Cuesta, R. M., Saatchi, S., Anderson, L. O., and Shimabukuro, Y. E.: Spatial patterns and fire response of recent Amazonian droughts, Geophys. Res. Lett., 34, L07701, https://doi.org/10.1029/2006GL028946, 2007.
Aragão, L. E. O. C., Anderson, L. O., Fonseca, M. G., Rosan, T. M., Vedovato, L. B., Wagner, F. H., Silva, C. V. J., Silva Junior, C. H. L., Arai, E., Aguiar, A. P., Barlow, J., Berenguer, E., Deeter, M. N., Domingues, L. G., Gatti, L., Gloor, M., Malhi, Y., Marengo, J. A., Miller, J. B., Phillips, O. L., and Saatchi, S.: 21st Century drought-related fires counteract the decline of Amazon deforestation carbon emissions, Nat. Commun., 9, 536, https://doi.org/10.1038/s41467-017-02771-y, 2018.
ArcGIS Hub: World Continents, https://hub.arcgis.com/maps/CESJ::world-continents (last access: 9 July 2024), 2024.
Archibald, S. and Roy, D. P.: Identifying individual fires from satellite-derived burned area data, in: 2009 IEEE International Geoscience and Remote Sensing Symposium, 2009 IEEE International Geoscience and Remote Sensing Symposium, III-160-III–163, https://doi.org/10.1109/IGARSS.2009.5417974, 2009.
Archibald, S., Roy, D. P., van Wilgen, B. W., and Scholes, R. J.: What limits fire? An examination of drivers of burnt area in Southern Africa, Glob. Change Biol., 15, 613–630, https://doi.org/10.1111/j.1365-2486.2008.01754.x, 2009.
Ardyna, M., Hamilton, D. S., Harmel, T., Lacour, L., Bernstein, D. N., Laliberté, J., Horvat, C., Laxenaire, R., Mills, M. M., van Dijken, G., Polyakov, I., Claustre, H., Mahowald, N., and Arrigo, K. R.: Wildfire aerosol deposition likely amplified a summertime Arctic phytoplankton bloom, Commun. Earth Environ., 3, 1–8, https://doi.org/10.1038/s43247-022-00511-9, 2022.
Armero, A. J.: El fuego en Las Hurdes y Sierra de Gata deja a Pinofranqueado sin agua potable, Hoy, https://www.hoy.es/extremadura/fuego-hurdes-sierra-gata-deja-pinofranqueado-agua-20230624190605-nt.html (last access: 9 July 2024), 2023.
Artés, T., Oom, D., de Rigo, D., Durrant, T. H., Maianti, P., Libertà, G., and San-Miguel-Ayanz, J.: A global wildfire dataset for the analysis of fire regimes and fire behaviour, Sci. Data, 6, 296, https://doi.org/10.1038/s41597-019-0312-2, 2019.
Athanasiou, M.: Preliminary findings on the behaviour and spread of the wildfire of August 2023 in Evros, Greece. Project “Learning from the Evros wildfire: Firefighting effectiveness evaluation and proposals”, WWF Greece, Athens, 76 pp., WWF Greece, Athens, https://wwfeu.awsassets.panda.org/downloads/fire_lessons-learnt_evros.pdf (last access: 9 July 2024), 2024 (in Greek with English abstract).
Atlas of Namibia: Atlas of Namibia Chapter 8: Conservation, https://atlasofnamibia.online/chapter-8/conservation (last access: 9 July 2024), 2021.
Austen, I.: As “Zombie Fires” Smolder, Canada Braces for Another Season of Flames, New York Times, https://www.nytimes.com/2024/03/04/canada-zombie-fires-wildfire.html (last access: 9 July 2024), 4 March 2024.
Badgley, G., Chay, F., Chegwidden, O. S., Hamman, J. J., Freeman, J., and Cullenward, D.: California's forest carbon offsets buffer pool is severely undercapitalized, Front. For. Glob. Change, 5, https://doi.org/10.3389/ffgc.2022.930426, 2022.
Baltzer, J. L., Day, N. J., Walker, X. J., Greene, D., Mack, M. C., Alexander, H. D., Arseneault, D., Barnes, J., Bergeron, Y., Boucher, Y., Bourgeau-Chavez, L., Brown, C. D., Carrière, S., Howard, B. K., Gauthier, S., Parisien, M.-A., Reid, K. A., Rogers, B. M., Roland, C., Sirois, L., Stehn, S., Thompson, D. K., Turetsky, M. R., Veraverbeke, S., Whitman, E., Yang, J., and Johnstone, J. F.: Increasing fire and the decline of fire adapted black spruce in the boreal forest, P. Natl. Acad. Sci. USA, 118, e2024872118, https://doi.org/10.1073/pnas.2024872118, 2021.
Barbosa, M. L. F.: Tracing the Ashes: Uncovering Burned Area Patterns and Drivers Over the Brazilian Biomes, Instituto Nacional de Pesquisas Espaciais, São José dos Campos, PhD Thesis, http://mtc-m21d.sid.inpe.br/col/sid.inpe.br/mtc-m21d/2024/04.04.17.26/doc/publicacao.pdf (last access: 9 July 2024), 2024.
Barbosa, M. L. F., Kelley, D., Burton, C., and Anderson, L.: ConFire: State of Wildfires 2023/24 (SoW23_v0.1), Zenodo [code], https://doi.org/10.5281/zenodo.11460232, 2024.
Barlow, J., Parry, L., Gardner, T. A., Ferreira, J., Aragão, L. E. O. C., Carmenta, R., Berenguer, E., Vieira, I. C. G., Souza, C., and Cochrane, M. A.: The critical importance of considering fire in REDD+ programs, Biol. Conserv., 154, 1–8, https://doi.org/10.1016/j.biocon.2012.03.034, 2012.
Barlow, J., França, F., Gardner, T. A., Hicks, C. C., Lennox, G. D., Berenguer, E., Castello, L., Economo, E. P., Ferreira, J., Guénard, B., Gontijo Leal, C., Isaac, V., Lees, A. C., Parr, C. L., Wilson, S. K., Young, P. J., and Graham, N. A. J.: The future of hyperdiverse tropical ecosystems, Nature, 559, 517–526, https://doi.org/10.1038/s41586-018-0301-1, 2018.
Barlow, J., Berenguer, E., Carmenta, R., and França, F.: Clarifying Amazonia's burning crisis, Glob. Change Biol., 26, 319–321, https://doi.org/10.1111/gcb.14872, 2020.
Barnes, C., Boulanger, Y., Keeping, T., Gachon, P., Gillett, N., Boucher, J., Roberge, F., Kew, S., Haas, O., Heinrich, D., Vahlberg, M., Singh, R., Elbe, M., Sivanu, S., Arrighi, J., Van Aalst, M., Otto, F., Zachariah, M., Krikken, F., Wang, X., Erni, S., Pietropalo, E., Avis, A., Bisaillon, A., and Kimutai, J.: Climate change more than doubled the likelihood of extreme fire weather conditions in Eastern Canada, http://spiral.imperial.ac.uk/handle/10044/1/105981 (last access: 9 July 2024), https://doi.org/10.25561/105981, 2023.
BBC News: Why is Canada having so many wildfires this season?, BBC News, https://www.bbc.com/news/world-us-canada-69011493 (last access: 9 July 2024) 15 May 2024.
Bedia, J., Herrera, S., Gutiérrez, J. M., Benali, A., Brands, S., Mota, B., and Moreno, J. M.: Global patterns in the sensitivity of burned area to fire-weather: Implications for climate change, Agr. Forest Meteorol., 214–215, 369–379, https://doi.org/10.1016/j.agrformet.2015.09.002, 2015.
Bedia, J., Golding, N., Casanueva, A., Iturbide, M., Buontempo, C., and Gutiérrez, J. M.: Seasonal predictions of Fire Weather Index: Paving the way for their operational applicability in Mediterranean Europe, Climate Services, 9, 101–110, https://doi.org/10.1016/j.cliser.2017.04.001, 2018.
Belcher, C. M., Brown, I., Clay, G. D., Doerr, S. H., Elliott, A., Gazzard, R., Kettridge, N., Morison, J., Perry, M., Santin, C., and Smith, T. E. L.: UK Wildfires and their Climate Challenges, Expert Led Report Prepared for the Third UK Climate Change Risk Assessment (CCRA3), University of Exeter Global Systems Institute, Exeter, https://www.ukclimaterisk.org/wp-content/uploads/2021/06/UK-Wildfires-and-their-Climate-Challenges.pdf (last access: 9 July 2024), 2021.
Betts, R. A., Belcher, S. E., Hermanson, L., Klein Tank, A., Lowe, J. A., Jones, C. D., Morice, C. P., Rayner, N. A., Scaife, A. A., and Stott, P. A.: Approaching 1.5 °C: how will we know we've reached this crucial warming mark?, Nature, 624, 33–35, https://doi.org/10.1038/d41586-023-03775-z, 2023.
Beverly, J. L. and Bothwell, P.: Wildfire evacuations in Canada 1980–2007, Nat. Hazards, 59, 571–596, https://doi.org/10.1007/s11069-011-9777-9, 2011.
Bhandari, S. R.: Culprits behind dense smog in northern Thailand, Laos: corn and wildfires, Radio Free Asia, https://www.rfa.org/english/news/environment/smog-04172023135125.html (last access: 9 July 2024), 2023.
Bilbao, B., Mistry, J., Millán, A., and Berardi, A.: Sharing Multiple Perspectives on Burning: Towards a Participatory and Intercultural Fire Management Policy in Venezuela, Brazil, and Guyana, Fire, 2, 39, https://doi.org/10.3390/fire2030039, 2019.
Bistinas, I., Harrison, S. P., Prentice, I. C., and Pereira, J. M. C.: Causal relationships versus emergent patterns in the global controls of fire frequency, Biogeosciences, 11, 5087–5101, https://doi.org/10.5194/bg-11-5087-2014, 2014.
Bodí, M. B., Martin, D. A., Balfour, V. N., Santín, C., Doerr, S. H., Pereira, P., Cerdà, A., and Mataix-Solera, J.: Wildland fire ash: Production, composition and eco-hydro-geomorphic effects, Earth-Sci. Rev., 130, 103–127, https://doi.org/10.1016/j.earscirev.2013.12.007, 2014.
Borneo Bulletin: Mongolia battles wildfire in eastern region, https://borneobulletin.com.bn/mongolia-battles-wildfire-in-eastern-region/ (last access: 9 July 2024), 2023.
Boschetti, L. and Roy, D. P.: Defining a fire year for reporting and analysis of global interannual fire variability, J. Geophys. Res.-Biogeo., 113, G03020, https://doi.org/10.1029/2008JG000686, 2008.
Boucher, O., Servonnat, J., Albright, A. L., Aumont, O., Balkanski, Y., Bastrikov, V., Bekki, S., Bonnet, R., Bony, S., Bopp, L., Braconnot, P., Brockmann, P., Cadule, P., Caubel, A., Cheruy, F., Codron, F., Cozic, A., Cugnet, D., D'Andrea, F., Davini, P., de Lavergne, C., Denvil, S., Deshayes, J., Devilliers, M., Ducharne, A., Dufresne, J.-L., Dupont, E., Éthé, C., Fairhead, L., Falletti, L., Flavoni, S., Foujols, M.-A., Gardoll, S., Gastineau, G., Ghattas, J., Grandpeix, J.-Y., Guenet, B., Guez, E., Lionel, Guilyardi, E., Guimberteau, M., Hauglustaine, D., Hourdin, F., Idelkadi, A., Joussaume, S., Kageyama, M., Khodri, M., Krinner, G., Lebas, N., Levavasseur, G., Lévy, C., Li, L., Lott, F., Lurton, T., Luyssaert, S., Madec, G., Madeleine, J.-B., Maignan, F., Marchand, M., Marti, O., Mellul, L., Meurdesoif, Y., Mignot, J., Musat, I., Ottlé, C., Peylin, P., Planton, Y., Polcher, J., Rio, C., Rochetin, N., Rousset, C., Sepulchre, P., Sima, A., Swingedouw, D., Thiéblemont, R., Traore, A. K., Vancoppenolle, M., Vial, J., Vialard, J., Viovy, N., and Vuichard, N.: Presentation and Evaluation of the IPSL-CM6A-LR Climate Model, J. Adv. Model. Earth Sy., 12, e2019MS002010, https://doi.org/10.1029/2019MS002010, 2020.
Boulanger, Y., Arseneault, D., Bélisle, A. C., Bergeron, Y., Boucher, J., Boucher, Y., Danneyrolles, V., Erni, S., Gachon, P., Girardin, M. P., Grant, E., Grondin, P., Jetté, J.-P., Labadie, G., Leblond, M., Leduc, A., Puigdevall, J. P., St-Laurent, M.-H., Tremblay, J. A., and Waldron, K.: The 2023 wildfire season in Québec: an overview of extreme conditions, impacts, lessons learned and considerations for the future, bioRxiv [preprint], https://doi.org/10.1101/2024.02.20.581257, 22 February 2024.
Boussetta, S., Balsamo, G., Arduini, G., Dutra, E., McNorton, J., Choulga, M., Agustí-Panareda, A., Beljaars, A., Wedi, N., Munõz-Sabater, J., de Rosnay, P., Sandu, I., Hadade, I., Carver, G., Mazzetti, C., Prudhomme, C., Yamazaki, D., and Zsoter, E.: ECLand: The ECMWF Land Surface Modelling System, Atmosphere, 12, 723, https://doi.org/10.3390/atmos12060723, 2021.
Bradshaw, L. S., Deeming, J. E., Burgan, R. E., and Cohen, J. D.: The 1978 National Fire-Danger Rating System: technical documentation, General Technical Report INT-169, Ogden, UT: U.S. Department of Agriculture, Forest Service, Intermountain Forest and Range Experiment Station, https://doi.org/10.2737/INT-GTR-169, 1984.
Bureau of Meteorology: Annual Australian Climate Statement 2023, Australian Government – Bureau of Meteorology, http://www.bom.gov.au/climate/current/annual/aus/2023/ (last access: 9 July 2024), 2024.
Burrell, A. L., Sun, Q., Baxter, R., Kukavskaya, E. A., Zhila, S., Shestakova, T., Rogers, B. M., Kaduk, J., and Barrett, K.: Climate change, fire return intervals and the growing risk of permanent forest loss in boreal Eurasia, Sci. Total Environ., 831, 154885, https://doi.org/10.1016/j.scitotenv.2022.154885, 2022.
Burton, C., Lampe, S., Kelley, D., Thiery, W., Hantson, S., Christidis, N., Gudmundsson, L., Forrest, M., Burke, E., Chang, J., Huang, H., Ito, A., Kou-Giesbrecht, S., Lasslop, G., Li, W., Nieradzik, L., Li, F., Chen, Y., Randerson, J., Reyer, C., and Mengel, M.: Global burned area increasingly explained by climate change, Nat. Clim. Change, accepted, 2024.
Cai, W., Cowan, T., and Raupach, M.: Positive Indian Ocean Dipole events precondition southeast Australia bushfires, Geophys. Res. Lett., 36, L19710, https://doi.org/10.1029/2009GL039902, 2009.
Calkin, D. E., Barrett, K., Cohen, J. D., Finney, M. A., Pyne, S. J., and Quarles, S. L.: Wildland-urban fire disasters aren't actually a wildfire problem, P. Natl. Acad. Sci. USA, 120, e2315797120, https://doi.org/10.1073/pnas.2315797120, 2023.
Canadell, J. G., Meyer, C. P., Cook, G. D., Dowdy, A., Briggs, P. R., Knauer, J., Pepler, A., and Haverd, V.: Multi-decadal increase of forest burned area in Australia is linked to climate change, Nat. Commun., 12, 6921, https://doi.org/10.1038/s41467-021-27225-4, 2021.
Canadian Environmental Protection Act Federal-Provincial Working Group on Air Quality: National ambient air quality objectives for particulate matter. Part 1, Science assessment document: A report by the Canadian Environmental Protection Act (CEPA)/Federal-Provincial Advisory Committee (FPAC) Working Group on Air Quality Objectives and Guidelines, Health Canada, Environmental Health Directorate, Ottawa, Ontario, 25 pp., https://publications.gc.ca/collections/Collection/H46-2-98-220-1-1E.pdf (last access: 9 July 2024), 1998.
Canadian Interagency Forest Fire Centre: CIFFC Canada Report 2023 Fire Season, Canadian Interagency Forest Fire Centre, Canada, https://ciffc.ca/sites/default/files/2024-03/CIFFC_2023CanadaReport_FINAL.pdf (last access: 9 July 2024), 2023.
Canelles, Q., Aquilué, N., James, P. M. A., Lawler, J., and Brotons, L.: Global review on interactions between insect pests and other forest disturbances, Landscape Ecol., 36, 945–972, https://doi.org/10.1007/s10980-021-01209-7, 2021.
Cardil, A., Rodrigues, M., Tapia, M., Barbero, R., Ramírez, J., Stoof, C. R., Silva, C. A., Mohan, M., and de-Miguel, S.: Climate teleconnections modulate global burned area, Nat. Commun., 14, 427, https://doi.org/10.1038/s41467-023-36052-8, 2023.
Carmenta, R., Coudel, E., and Steward, A. M.: Forbidden fire: Does criminalising fire hinder conservation efforts in swidden landscapes of the Brazilian Amazon?, Geograph. J., 185, 23–37, https://doi.org/10.1111/geoj.12255, 2019.
Carmenta, R., Cammelli, F., Dressler, W., Verbicaro, C., and Zaehringer, J. G.: Between a rock and a hard place: The burdens of uncontrolled fire for smallholders across the tropics, World Development, 145, 105521, https://doi.org/10.1016/j.worlddev.2021.105521, 2021.
Carter, T. S., Heald, C. L., Jimenez, J. L., Campuzano-Jost, P., Kondo, Y., Moteki, N., Schwarz, J. P., Wiedinmyer, C., Darmenov, A. S., da Silva, A. M., and Kaiser, J. W.: How emissions uncertainty influences the distribution and radiative impacts of smoke from fires in North America, Atmos. Chem. Phys., 20, 2073–2097, https://doi.org/10.5194/acp-20-2073-2020, 2020.
Carvalho, A., Flannigan, M. D., Logan, K., Miranda, A. I., and Borrego, C.: Fire activity in Portugal and its relationship to weather and the Canadian Fire Weather Index System, Int. J. Wildland Fire, 17, 328–338, https://doi.org/10.1071/WF07014, 2008.
Casanueva, A., Herrera, S., Iturbide, M., Lange, S., Jury, M., Dosio, A., Maraun, D., and Gutiérrez, J. M.: Testing bias adjustment methods for regional climate change applications under observational uncertainty and resolution mismatch, Atmos. Sci. Lett., 21, e978, https://doi.org/10.1002/asl.978, 2020.
Cátedra Cambio Climático de la Universidad de Oviedo: Evaluación de los Impactos Medioambientales Producidos por el Incendio de Foyedo (Asturias) Ocurrido en Primavera de 2023, https://cucc-uo.es/evaluacion-de-los-impactos-medioambientales-producidos-por-el-incendio-de-foyedo-asturias-ocurrido-en-primavera-de-2023/ (last access: 9 July 2024), 2023.
CBC News: Kelowna declares state of emergency after wildfire jumps Okanagan Lake, prompting more evacuations, CBC News, https://www.cbc.ca/news/canada/british-columbia/what-you-need-to-know-about-bc-wildfires-aug-17-2023-1.6938796 (last access: 9 July 2024), 17 August 2023.
Cecil, D. J., Buechler, D. E., and Blakeslee, R. J.: Gridded lightning climatology from TRMM-LIS and OTD: Dataset description, Atmos. Res., 135–136, 404–414, https://doi.org/10.1016/j.atmosres.2012.06.028, 2014.
Centre for Research on the Epidemiology of Disasters: EM-DAT International Disaster Database, https://public.emdat.be/ (last access: 9 July 2024), 2024.
Chen, B., Wu, S., Jin, Y., Song, Y., Wu, C., Venevsky, S., Xu, B., Webster, C., and Gong, P.: Wildfire risk for global wildland–urban interface areas, Nat. Sustain., 7, 474–484, https://doi.org/10.1038/s41893-024-01291-0, 2024.
Chen, T. and Guestrin, C.: XGBoost: A Scalable Tree Boosting System, in: Proceedings of the 22nd ACM SIGKDD International Conference on Knowledge Discovery and Data Mining, New York, NY, USA, 785–794, https://doi.org/10.1145/2939672.2939785, 2016.
Chen, Y., Morton, D. C., Andela, N., van der Werf, G. R., Giglio, L., and Randerson, J. T.: A pan-tropical cascade of fire driven by El Niño/Southern Oscillation, Nat. Clim. Change, 7, 906–911, https://doi.org/10.1038/s41558-017-0014-8, 2017.
Chen, Y., Hantson, S., Andela, N., Coffield, S. R., Graff, C. A., Morton, D. C., Ott, L. E., Foufoula-Georgiou, E., Smyth, P., Goulden, M. L., and Randerson, J. T.: California wildfire spread derived using VIIRS satellite observations and an object-based tracking system, Sci. Data, 9, 249, https://doi.org/10.1038/s41597-022-01343-0, 2022.
Chen, Y., Hall, J., van Wees, D., Andela, N., Hantson, S., Giglio, L., van der Werf, G. R., Morton, D. C., and Randerson, J. T.: Multi-decadal trends and variability in burned area from the fifth version of the Global Fire Emissions Database (GFED5), Earth Syst. Sci. Data, 15, 5227–5259, https://doi.org/10.5194/essd-15-5227-2023, 2023.
Christidis, N., Stott, P. A., Scaife, A. A., Arribas, A., Jones, G. S., Copsey, D., Knight, J. R., and Tennant, W. J.: A New HadGEM3 – A-Based System for Attribution of Weather- and Climate-Related Extreme Events, J. Climate, 26, 2756–2783, https://doi.org/10.1175/JCLI-D-12-00169.1, 2013.
Chu, L., Grafton, R. Q., and Nelson, H.: Accounting for forest fire risks: global insights for climate change mitigation, Mitig. Adapt. Strat. Gl., 28, 48, https://doi.org/10.1007/s11027-023-10087-0, 2023.
Chuvieco, E., Mouillot, F., van der Werf, G. R., San Miguel, J., Tanase, M., Koutsias, N., García, M., Yebra, M., Padilla, M., Gitas, I., Heil, A., Hawbaker, T. J., and Giglio, L.: Historical background and current developments for mapping burned area from satellite Earth observation, Remote Sens. Environ., 225, 45–64, https://doi.org/10.1016/j.rse.2019.02.013, 2019.
Chuvieco, E., Roteta, E., Sali, M., Stroppiana, D., Boettcher, M., Kirches, G., Storm, T., Khairoun, A., Pettinari, M. L., Franquesa, M., and Albergel, C.: Building a small fire database for Sub-Saharan Africa from Sentinel-2 high-resolution images, Sci. Total. Environ., 845, 157139, https://doi.org/10.1016/j.scitotenv.2022.157139, 2022.
Chuvieco, E., Yebra, M., Martino, S., Thonicke, K., Gómez-Giménez, M., San-Miguel, J., Oom, D., Velea, R., Mouillot, F., Molina, J. R., Miranda, A. I., Lopes, D., Salis, M., Bugaric, M., Sofiev, M., Kadantsev, E., Gitas, I. Z., Stavrakoudis, D., Eftychidis, G., Bar-Massada, A., Neidermeier, A., Pampanoni, V., Pettinari, M. L., Arrogante-Funes, F., Ochoa, C., Moreira, B., and Viegas, D.: Towards an Integrated Approach to Wildfire Risk Assessment: When, Where, What and How May the Landscapes Burn, Fire, 6, 215, https://doi.org/10.3390/fire6050215, 2023.
Ciais, P., Bastos, A., Chevallier, F., Lauerwald, R., Poulter, B., Canadell, J. G., Hugelius, G., Jackson, R. B., Jain, A., Jones, M., Kondo, M., Luijkx, I. T., Patra, P. K., Peters, W., Pongratz, J., Petrescu, A. M. R., Piao, S., Qiu, C., Von Randow, C., Regnier, P., Saunois, M., Scholes, R., Shvidenko, A., Tian, H., Yang, H., Wang, X., and Zheng, B.: Definitions and methods to estimate regional land carbon fluxes for the second phase of the REgional Carbon Cycle Assessment and Processes Project (RECCAP-2), Geosci. Model Dev., 15, 1289–1316, https://doi.org/10.5194/gmd-15-1289-2022, 2022.
Ciavarella, A., Christidis, N., Andrews, M., Groenendijk, M., Rostron, J., Elkington, M., Burke, C., Lott, F. C., and Stott, P. A.: Upgrade of the HadGEM3-A based attribution system to high resolution and a new validation framework for probabilistic event attribution, Weather and Climate Extremes, 20, 9–32, https://doi.org/10.1016/j.wace.2018.03.003, 2018.
Citizen Digital: Wildfires ravage over 40,000 acres of Aberdare forest, Citizen Digital, https://www.citizen.digital/news/wildfires-ravage-over-40000-acres-of-aberdare-forest-n314597 (last access: 9 July 2024), 2023.
Clarke, B., Barnes, C., Rodrigues, R., Zachariah, M., Stewart, S., Raju, E., Baumgart, N., Heinrich, D., Libonati, R., Santos, D., Albuquerque, R., Alves, L., Pinto, I., Otto, F., Kimutai, J., Philip, S., Kew, S., Bazo, J., and Wynter, A.: Climate change, not El Niño, main driver of extreme drought in highly vulnerable Amazon River Basin, Imperial College London, https://doi.org/10.25561/108761, 2024.
Collins, L., Clarke, H., Clarke, M. F., McColl Gausden, S. C., Nolan, R. H., Penman, T., and Bradstock, R.: Warmer and drier conditions have increased the potential for large and severe fire seasons across south-eastern Australia, Global Ecol. Biogeogr., 31, 1933–1948, https://doi.org/10.1111/geb.13514, 2022.
Comisión Nacional Forestal: CONAFOR Reporte semanal de incendios 2024, https://www.gob.mx/conafor/documentos/reporte-semanal-de-incendios (last access: 9 July 2024), 2024.
Coop, J. D., Parks, S. A., Stevens-Rumann, C. S., Crausbay, S. D., Higuera, P. E., Hurteau, M. D., Tepley, A., Whitman, E., Assal, T., Collins, B. M., Davis, K. T., Dobrowski, S., Falk, D. A., Fornwalt, P. J., Fulé, P. Z., Harvey, B. J., Kane, V. R., Littlefield, C. E., Margolis, E. Q., North, M., Parisien, M.-A., Prichard, S., and Rodman, K. C.: Wildfire-Driven Forest Conversion in Western North American Landscapes, BioScience, 70, 659–673, https://doi.org/10.1093/biosci/biaa061, 2020.
Copernicus Climate Change Service (C3S): European State of the Climate 2023, https://climate.copernicus.eu/esotc/2023 (last access: 9 July 2024), 2024a.
Copernicus Climate Change Service (C3S): C3S Seasonal Charts, https://climate.copernicus.eu/charts/packages/c3s_seasonal/ (last access: 9 July 2024), 2024b.
Copernicus Emergency Management Service: Copernicus EMS Fire danger indices historical data from the Copernicus Emergency Management Service, Copernicus Climate Change Service (C3S) Climate Data Store (CDS) [data set], https://doi.org/10.24381/CDS.0E89C522, 2019.
Copernicus Emergency Management Service: Copernicus EMS Rapid Mapping Activation Viewer: EMSR715 – Wildfire in Valparaiso region, Chile, https://rapidmapping.emergency.copernicus.eu/EMSR715/download (last access: 9 July 2024), 2023a.
Copernicus Emergency Management Service: Copernicus EMS Rapid Mapping Activation Viewer: EMSR667 – Wildfire in Caceres, Spain, https://rapidmapping.emergency.copernicus.eu/EMSR667 (last access: 9 July 2024), 2023b.
Copernicus Emergency Management Service: Copernicus EMS Situational Reporting: EMSR685 – Fire in Tenerife, Spain, ArcGIS StoryMaps, https://storymaps.arcgis.com/stories/0f6c7842e2aa412db35d4f14ecc292ec (last access: 9 July 2024), 2023c.
Crisis24: South Africa: Emergency crews continue to respond to wildfires across parts of Western Cape as of January 30 /update 1, https://crisis24.garda.com/alerts/2024/01/south-africa-emergency-crews-continue-to-respond-to-wildfires-across-parts-of-western-cape-as-of-jan-30-update-1 (last access: 9 July 2024), 2024.
Croker, A. R., Woods, J., and Kountouris, Y.: Community-Based Fire Management in East and Southern African Savanna-Protected Areas: A Review of the Published Evidence, Earth's Future, 11, e2023EF003552, https://doi.org/10.1029/2023EF003552, 2023.
Cunningham, C. X., Williamson, G. J., and Bowman, D. M. J. S.: Increasing frequency and intensity of the most extreme wildfires on Earth, Nat. Ecol. Evol., 1–6, https://doi.org/10.1038/s41559-024-02452-2, online first, 2024a.
Cunningham, C. X., Williamson, G. J., Nolan, R. H., Teckentrup, L., Boer, M. M., and Bowman, D. M. J. S.: Pyrogeography in flux: Reorganization of Australian fire regimes in a hotter world, Glob. Change Biol., 30, e17130, https://doi.org/10.1111/gcb.17130, 2024b.
Cunningham, D., Cunningham, P., and Fagan, M. E.: Evaluating Forest Cover and Fragmentation in Costa Rica with a Corrected Global Tree Cover Map, Remote Sens., 12, 3226, https://doi.org/10.3390/rs12193226, 2020.
Daeli, W., Carmenta, R., Monroe, M. C., and Adams, A. E.: Where Policy and Culture Collide: Perceptions and Responses of Swidden Farmers to the Burn Ban in West Kalimantan, Indonesia, Hum. Ecol., 49, 159–170, https://doi.org/10.1007/s10745-021-00227-y, 2021.
Di Giuseppe, F.: Accounting for fuel in fire danger forecasts: the fire occurrence probability index (FOPI), Environ. Res. Lett., 18, 064029, https://doi.org/10.1088/1748-9326/acd2ee, 2023.
Di Giuseppe, F. and Maciel, P.: geff: CEMS-Fire Repository for utility and documentations related to the CEMS Fire forecast – The Global ECMWF Fire Forecast model, GitHub [code], https://git.ecmwf.int/projects/CEMSF/repos/geff (last access: 9 July 2024), 2022.
Di Giuseppe, F., Pappenberger, F., Wetterhall, F., Krzeminski, B., Camia, A., Libertá, G., and San Miguel, J.: The Potential Predictability of Fire Danger Provided by Numerical Weather Prediction, J. Appl. Meteorol. Clim., 55, 2469–2491, https://doi.org/10.1175/JAMC-D-15-0297.1, 2016.
Di Giuseppe, F., Vitolo, C., Krzeminski, B., Barnard, C., Maciel, P., and San-Miguel, J.: Fire Weather Index: the skill provided by the European Centre for Medium-Range Weather Forecasts ensemble prediction system, Nat. Hazards Earth Syst. Sci., 20, 2365–2378, https://doi.org/10.5194/nhess-20-2365-2020, 2020.
Di Giuseppe, F., Benedetti, A., Coughlan, R., Vitolo, C., and Vuckovic, M.: A Global Bottom-Up Approach to Estimate Fuel Consumed by Fires Using Above Ground Biomass Observations, Geophys. Res. Lett., 48, e2021GL095452, https://doi.org/10.1029/2021GL095452, 2021.
Di Giuseppe, F., Vitolo, C., Barnard, C., Libertá, G., Maciel, P., San-Miguel-Ayanz, J., Villaume, S., and Wetterhall, F.: Global seasonal prediction of fire danger, Sci. Data, 11, 128, https://doi.org/10.1038/s41597-024-02948-3, 2024.
DiMiceli, C., Carroll, M., Sohlberg, R., Kim, D.-H., Kelly, M., and Townshend, J.: MOD44B MODIS/Terra Vegetation Continuous Fields Yearly L3 Global 250m SIN Grid V006, NASA EOSDIS Land Processes Distributed Active Archive Center [data set], https://doi.org/10.5067/MODIS/MOD44B.006, 2015.
DiMiceli, C., Sohlberg, R., and Townshend, J.: MODIS/Terra Vegetation Continuous Fields Yearly L3 Global 250m SIN Grid V061, NASA EOSDIS Land Processes Distributed Active Archive Center [data set], https://doi.org/10.5067/MODIS/MOD44B.061, 2022.
Direção Nacional de Gestão do Programa de Fogos Rurais: 8.o Relatório Provisório de Incêndios Rurais – 2023, 1 de Janeiro a 15 de Outubro, https://www.icnf.pt/api/file/doc/058d65a2c60898dc (last access: 9 July 2024), 2023.
Dong, X., Li, F., Lin, Z., Harrison, S. P., Chen, Y., and Kug, J.-S.: Climate influence on the 2019 fires in Amazonia, Sci. Total. Environ., 794, 148718, https://doi.org/10.1016/j.scitotenv.2021.148718, 2021.
Dowdy, A. J.: Seamless climate change projections and seasonal predictions for bushfires in Australia, J. South. Hemisph. Earth Syst. Sci., 70, 120–138, https://doi.org/10.1071/ES20001, 2020.
Economia Online: Violento incêndio em Odemira agita turismo e economia local, ECO, https://eco.sapo.pt/2023/08/08/violento-incendio-em-odemira-agita-turismo-e-economia-local/ (last access: 9 July 2024), 2023.
Educación Forestal: Grandes Incendios Forestales en España durante 2023: Incendios en Asturias-Cantabria, Iniciado el 28/03/2023, https://edu.forestry.es/p/grandes-incendios-forestales-en-espana_23.html#03 (last access: 9 July 2024), 2023a.
Educación Forestal: Grandes Incendios Forestales en España durante 2023: Incendio de Arafo-Candelaria, Tenerife, Iniciado el 15/08/2023, https://edu.forestry.es/p/grandes-incendios-forestales-en-espana_23.html#09 (last access: 9 July 2024), 2023b.
El Disconcierto: Saldo de incendios forestales: 131 muertos, 7.000 viviendas destruidas y 5.000 damnificados, https://www.eldesconcierto.cl/nacional/2024/02/11/saldo-de-incendios-forestales-131-muertos-7-000-viviendas-destruidas-y-5-000-damnificados.html (last access: 9 July 2024), El Desconcierto / Periodismo digital independiente, 2024.
Erraji, A.: 182 Wildfires Reported Across Morocco in 2023, Morocco World News, https://www.moroccoworldnews.com/2023/07/356405/182-wildfires-reported-nationwide-in-2023 (last access: 9 July 2024), 2023.
Espinoza, J.-C., Jimenez, J. C., Marengo, J. A., Schongart, J., Ronchail, J., Lavado-Casimiro, W., and Ribeiro, J. V. M.: The new record of drought and warmth in the Amazon in 2023 related to regional and global climatic features, Sci. Rep., 14, 8107, https://doi.org/10.1038/s41598-024-58782-5, 2024.
Estado do Amazonas: Plano Estadual de Prevenção e Controle do Desmatamento e Queimadas do Estado do Amazonas PPCDQ-AM 2020-2022, https://www.sema.am.gov.br/plano-de-prevencao-e-controle-do-desmatamento-e-queimadas-no-amazonas-ppcdq-am/ (last access: 9 July 2024), 2020.
EU Eurostat: Countries – GISCO – Eurostat, https://ec.europa.eu/eurostat/web/gisco/geodata/reference-data/administrative-units-statistical-units/countries (last access: 9 July 2024), 2020.
euronews: Wildfires tear through Algeria and Tunisia as temperatures near 50C, euronews, https://www.euronews.com/green/2023/07/25/north-africa-heatwave-wildfires-kill-dozens-and-force-over-1500-people-to-evacuate (last access: 9 July 2024),2023.
European Centre for Medium-Range Weather Forecasts (ECMWF): Copernicus Atmospheric Monitoring Service (CAMS) global biomass burning emissions based on fire radiative power (GFAS): data documentation, https://confluence.ecmwf.int/display/CKB/CAMS+global+biomass+burning+emissions+based+on+fire+radiative+power+%28GFAS%29%3A+data+documentation (last access: 9 July 2024), 2024.
European Commission EU Science Hub: Wildfires in the Mediterranean: EFFIS data reveal extent this summer, https://joint-research-centre.ec.europa.eu/jrc-news-and-updates/wildfires-mediterranean-effis-data-reveal-extent-summer-2023-09-08_en (last access: 9 July 2024), 2023.
European Commission Joint Research Centre: Forest fires in Europe, Middle East and North Africa 2022, Publications Office, LU, https://publications.jrc.ec.europa.eu/repository/handle/JRC133215 (last access: 9 July 2024), 2023.
European Forest Fire Information System (EFFIS): EFFIS – Statistics Portal, Copernicus Forest Fire, https://forest-fire.emergency.copernicus.eu/apps/effis.statistics/ (last access: 9 July 2024), 2024.
Fernandes, P. M. and Botelho, H. S.: A review of prescribed burning effectiveness in fire hazard reduction, Int. J. Wildland Fire, 12, 117–128, https://doi.org/10.1071/wf02042, 2003.
Ferreira Barbosa, M. L., Haddad, I., da Silva Nascimento, A. L., Máximo da Silva, G., Moura da Veiga, R., Hoffmann, T. B., Rosane de Souza, A., Dalagnol, R., Susin Streher, A., Souza Pereira, F. R., Oliveira e Cruz de Aragão, L. E., and Oighenstein Anderson, L.: Compound impact of land use and extreme climate on the 2020 fire record of the Brazilian Pantanal, Global Ecol. Biogeogr., 31, 1960–1975, https://doi.org/10.1111/geb.13563, 2022.
Field, R. D., van der Werf, G. R., Fanin, T., Fetzer, E. J., Fuller, R., Jethva, H., Levy, R., Livesey, N. J., Luo, M., Torres, O., and Worden, H. M.: Indonesian fire activity and smoke pollution in 2015 show persistent nonlinear sensitivity to El Niño-induced drought, P. Natl. Acad. Sci. USA, 113, 9204–9209, https://doi.org/10.1073/pnas.1524888113, 2016.
Finney, D. L., Doherty, R. M., Wild, O., Stevenson, D. S., MacKenzie, I. A., and Blyth, A. M.: A projected decrease in lightning under climate change, Nat. Clim. Change, 8, 210–213, https://doi.org/10.1038/s41558-018-0072-6, 2018.
Finney, M. A., Cohen, J. D., McAllister, S. S., and Jolly, W. M.: On the need for a theory of wildland fire spread, Int. J. Wildland Fire, 22, 25–36, https://doi.org/10.1071/WF11117, 2012.
Fiore, A. M., Naik, V., Spracklen, D. K., Steiner, A., Unger, N., Prather, M., Bergmann, D., Cameron-Smith, P. J., Cionni, I., Collins, W. J., Dalsøren, S., Eyring, V., Folberth, G. A., Ginoux, P., Horowitz, L. W., Josse, B., Lamarque, J.-F., A. MacKenzie, I., Nagashima, T., O'Connor, F. M., Righi, M., Rumbold, S. T., Shindell, D. T., Skeie, R. B., Sudo, K., Szopa, S., Takemura, T., and Zeng, G.: Global air quality and climate, Chem. Soc. Rev., 41, 6663–6683, https://doi.org/10.1039/C2CS35095E, 2012.
Fire Hub – The Global Fire Management Hub: 1st Technical Workshop – Summary Report, FAO Headquarters, https://openknowledge.fao.org/server/api/core/bitstreams/491e9112-8106-4b02-97f1-0a27f3e1f6d6/content (last access: 9 July 2024), 2023.
Fire Safety Research Institute, Kerber, S., and Alkonis, D.: Lahaina Fire Comprehensive Timeline Report, UL Research Institutes, https://fsri.org/research-update/lahaina-fire-comprehensive-timeline-report-released-attorney-general-hawaii (last access: 9 July 2024), https://doi.org/10.54206/102376/VQKQ5427, 2024.
Fisher, R.: Vastly bigger than the Black Summer: 84 million hectares of northern Australia burned in 2023, The Conversation, http://theconversation.com/vastly-bigger-than-the-black-summer-84-million-hectares-of-northern-australia-burned-in-2023-227996 (last access: 9 July 2024), 2024.
Food and Agriculture Organization of the United Nations: Global Fire Management Hub, https://www.fao.org/forestry-fao/firemanagement/101248/en/ (last access: 9 July 2024), 2024.
Ford, A. E. S., Harrison, S. P., Kountouris, Y., Millington, J. D. A., Mistry, J., Perkins, O., Rabin, S. S., Rein, G., Schreckenberg, K., Smith, C., Smith, T. E. L., and Yadav, K.: Modelling Human-Fire Interactions: Combining Alternative Perspectives and Approaches, Front. Environ. Sci., 9, 418, https://doi.org/10.3389/fenvs.2021.649835, 2021.
Forster, P. M., Smith, C., Walsh, T., Lamb, W. F., Lamboll, R., Hall, B., Hauser, M., Ribes, A., Rosen, D., Gillett, N. P., Palmer, M. D., Rogelj, J., von Schuckmann, K., Trewin, B., Allen, M., Andrew, R., Betts, R. A., Borger, A., Boyer, T., Broersma, J. A., Buontempo, C., Burgess, S., Cagnazzo, C., Cheng, L., Friedlingstein, P., Gettelman, A., Gütschow, J., Ishii, M., Jenkins, S., Lan, X., Morice, C., Mühle, J., Kadow, C., Kennedy, J., Killick, R. E., Krummel, P. B., Minx, J. C., Myhre, G., Naik, V., Peters, G. P., Pirani, A., Pongratz, J., Schleussner, C.-F., Seneviratne, S. I., Szopa, S., Thorne, P., Kovilakam, M. V. M., Majamäki, E., Jalkanen, J.-P., van Marle, M., Hoesly, R. M., Rohde, R., Schumacher, D., van der Werf, G., Vose, R., Zickfeld, K., Zhang, X., Masson-Delmotte, V., and Zhai, P.: Indicators of Global Climate Change 2023: annual update of key indicators of the state of the climate system and human influence, Earth Syst. Sci. Data, 16, 2625–2658, https://doi.org/10.5194/essd-16-2625-2024, 2024.
Forsyth, T.: Public concerns about transboundary haze: A comparison of Indonesia, Singapore, and Malaysia, Global Environ. Change, 25, 76–86, https://doi.org/10.1016/j.gloenvcha.2014.01.013, 2014.
France-Presse, A.: Colombia Declares Emergency Over Forest Fires, Voice of America, https://www.voanews.com/a/colombia-declares-emergency-over-forest-fires/7456551.html (last access: 9 July 2024), 2024.
Friedlingstein, P., O'Sullivan, M., Jones, M. W., Andrew, R. M., Bakker, D. C. E., Hauck, J., Landschützer, P., Le Quéré, C., Luijkx, I. T., Peters, G. P., Peters, W., Pongratz, J., Schwingshackl, C., Sitch, S., Canadell, J. G., Ciais, P., Jackson, R. B., Alin, S. R., Anthoni, P., Barbero, L., Bates, N. R., Becker, M., Bellouin, N., Decharme, B., Bopp, L., Brasika, I. B. M., Cadule, P., Chamberlain, M. A., Chandra, N., Chau, T.-T.-T., Chevallier, F., Chini, L. P., Cronin, M., Dou, X., Enyo, K., Evans, W., Falk, S., Feely, R. A., Feng, L., Ford, D. J., Gasser, T., Ghattas, J., Gkritzalis, T., Grassi, G., Gregor, L., Gruber, N., Gürses, Ö., Harris, I., Hefner, M., Heinke, J., Houghton, R. A., Hurtt, G. C., Iida, Y., Ilyina, T., Jacobson, A. R., Jain, A., Jarníková, T., Jersild, A., Jiang, F., Jin, Z., Joos, F., Kato, E., Keeling, R. F., Kennedy, D., Klein Goldewijk, K., Knauer, J., Korsbakken, J. I., Körtzinger, A., Lan, X., Lefèvre, N., Li, H., Liu, J., Liu, Z., Ma, L., Marland, G., Mayot, N., McGuire, P. C., McKinley, G. A., Meyer, G., Morgan, E. J., Munro, D. R., Nakaoka, S.-I., Niwa, Y., O'Brien, K. M., Olsen, A., Omar, A. M., Ono, T., Paulsen, M., Pierrot, D., Pocock, K., Poulter, B., Powis, C. M., Rehder, G., Resplandy, L., Robertson, E., Rödenbeck, C., Rosan, T. M., Schwinger, J., Séférian, R., Smallman, T. L., Smith, S. M., Sospedra-Alfonso, R., Sun, Q., Sutton, A. J., Sweeney, C., Takao, S., Tans, P. P., Tian, H., Tilbrook, B., Tsujino, H., Tubiello, F., van der Werf, G. R., van Ooijen, E., Wanninkhof, R., Watanabe, M., Wimart-Rousseau, C., Yang, D., Yang, X., Yuan, W., Yue, X., Zaehle, S., Zeng, J., and Zheng, B.: Global Carbon Budget 2023, Earth Syst. Sci. Data, 15, 5301–5369, https://doi.org/10.5194/essd-15-5301-2023, 2023.
Frieler, K., Volkholz, J., Lange, S., Schewe, J., Mengel, M., del Rocío Rivas López, M., Otto, C., Reyer, C. P. O., Karger, D. N., Malle, J. T., Treu, S., Menz, C., Blanchard, J. L., Harrison, C. S., Petrik, C. M., Eddy, T. D., Ortega-Cisneros, K., Novaglio, C., Rousseau, Y., Watson, R. A., Stock, C., Liu, X., Heneghan, R., Tittensor, D., Maury, O., Büchner, M., Vogt, T., Wang, T., Sun, F., Sauer, I. J., Koch, J., Vanderkelen, I., Jägermeyr, J., Müller, C., Rabin, S., Klar, J., Vega del Valle, I. D., Lasslop, G., Chadburn, S., Burke, E., Gallego-Sala, A., Smith, N., Chang, J., Hantson, S., Burton, C., Gädeke, A., Li, F., Gosling, S. N., Müller Schmied, H., Hattermann, F., Wang, J., Yao, F., Hickler, T., Marcé, R., Pierson, D., Thiery, W., Mercado-Bettín, D., Ladwig, R., Ayala-Zamora, A. I., Forrest, M., and Bechtold, M.: Scenario setup and forcing data for impact model evaluation and impact attribution within the third round of the Inter-Sectoral Impact Model Intercomparison Project (ISIMIP3a), Geosci. Model Dev., 17, 1–51, https://doi.org/10.5194/gmd-17-1-2024, 2024.
Fuller, D. O. and Murphy, K.: The ENSO-Fire Dynamic in Insular Southeast Asia, Climatic Change, 74, 435–455, https://doi.org/10.1007/s10584-006-0432-5, 2006.
Fuzzi, S., Baltensperger, U., Carslaw, K., Decesari, S., Denier van der Gon, H., Facchini, M. C., Fowler, D., Koren, I., Langford, B., Lohmann, U., Nemitz, E., Pandis, S., Riipinen, I., Rudich, Y., Schaap, M., Slowik, J. G., Spracklen, D. V., Vignati, E., Wild, M., Williams, M., and Gilardoni, S.: Particulate matter, air quality and climate: lessons learned and future needs, Atmos. Chem. Phys., 15, 8217–8299, https://doi.org/10.5194/acp-15-8217-2015, 2015.
Garnett, S. T., Burgess, N. D., Fa, J. E., Fernández-Llamazares, Á., Molnár, Z., Robinson, C. J., Watson, J. E. M., Zander, K. K., Austin, B., Brondizio, E. S., Collier, N. F., Duncan, T., Ellis, E., Geyle, H., Jackson, M. V., Jonas, H., Malmer, P., McGowan, B., Sivongxay, A., and Leiper, I.: A spatial overview of the global importance of Indigenous lands for conservation, Nat. Sustain., 1, 369–374, https://doi.org/10.1038/s41893-018-0100-6, 2018.
Gatti, L. V., Basso, L. S., Miller, J. B., Gloor, M., Gatti Domingues, L., Cassol, H. L. G., Tejada, G., Aragão, L. E. O. C., Nobre, C., Peters, W., Marani, L., Arai, E., Sanches, A. H., Corrêa, S. M., Anderson, L., Von Randow, C., Correia, C. S. C., Crispim, S. P., and Neves, R. A. L.: Amazonia as a carbon source linked to deforestation and climate change, Nature, 595, 388–393, https://doi.org/10.1038/s41586-021-03629-6, 2021.
Gauldie, R.: Coming to the rescEU: European firefighting, AirMedandRescue, https://www.airmedandrescue.com/latest/long-read/coming-resceu-european-firefighting (last access: 9 July 2024), 2024.
Gelman, A., Carlin, J. B., Stern, H. S., Dunson, D. B., Vehtari, A., and Rubin, D. B.: Bayesian Data Analysis, Chapman and Hall/CRC, https://doi.org/10.1201/b16018, 2013.
Giglio, L. and Roy, D. P.: Assessment of satellite orbit-drift artifacts in the long-term AVHRR FireCCILT11 global burned area data set, Sci. Remote Sens., 5, 100044, https://doi.org/10.1016/j.srs.2022.100044, 2022.
Giglio, L., Randerson, J. T., and van der Werf, G. R.: Analysis of daily, monthly, and annual burned area using the fourth-generation global fire emissions database (GFED4), J. Geophys. Res.-Biogeo., 118, 317–328, https://doi.org/10.1002/jgrg.20042, 2013.
Giglio, L., Schroeder, W., and Justice, C. O.: The collection 6 MODIS active fire detection algorithm and fire products, Remote Sens. Environ., 178, 31–41, https://doi.org/10.1016/j.rse.2016.02.054, 2016.
Giglio, L., Boschetti, L., Roy, D. P., Humber, M. L., and Justice, C. O.: The Collection 6 MODIS burned area mapping algorithm and product, Remote Sens. Environ., 217, 72–85, https://doi.org/10.1016/j.rse.2018.08.005, 2018.
Giglio, L., Justice, C., Boschetti, L., and Roy, D.: MODIS/Terra+Aqua Burned Area Monthly L3 Global 500m SIN Grid V061, NASA EOSDIS Land Processes Distributed Active Archive Center [data set], https://doi.org/10.5067/MODIS/MCD64A1.061, 2021.
Gincheva, A., Pausas, J. G., Edwards, A., Provenzale, A., Cerdà, A., Hanes, C., Royé, D., Chuvieco, E., Mouillot, F., Vissio, G., Rodrigo, J., Bedía, J., Abatzoglou, J. T., Senciales González, J. M., Short, K. C., Baudena, M., Llasat, M. C., Magnani, M., Boer, M. M., González, M. E., Torres-Vázquez, M. Á., Fiorucci, P., Jacklyn, P., Libonati, R., Trigo, R. M., Herrera, S., Jerez, S., Wang, X., and Turco, M.: A monthly gridded burned area database of national wildland fire data, Sci. Data, 11, 352, https://doi.org/10.1038/s41597-024-03141-2, 2024.
Global Fire Emissions Database (GFED): Global Fire Emissions Database: Data Pages, https://www.globalfiredata.org/index.html (last access: 9 July 2024), 2024.
Good, P., Sellar, A., Tang, Y., Rumbold, S., Ellis, R., Kelley, D., and Kuhlbrodt, T.: MOHC UKESM1.0-LL model output prepared for CMIP6 ScenarioMIP ssp126, ssp245, ssp370, and ssp585, WDC-Climate [data set], https://doi.org/10.22033/ESGF/CMIP6.6333, 2019.
Grau-Andrés, R., Moreira, B., and Pausas, J. G.: Global plant responses to intensified fire regimes, Global Ecol. Biogeogr., 33, e13858, https://doi.org/10.1111/geb.13858, 2024.
Haas, O., Prentice, I. C., and Harrison, S. P.: Global environmental controls on wildfire burnt area, size, and intensity, Environ. Res. Lett., 17, 065004, https://doi.org/10.1088/1748-9326/ac6a69, 2022.
Hamilton, D. S., Perron, M. M. G., Bond, T. C., Bowie, A. R., Buchholz, R. R., Guieu, C., Ito, A., Maenhaut, W., Myriokefalitakis, S., Olgun, N., Rathod, S. D., Schepanski, K., Tagliabue, A., Wagner, R., and Mahowald, N. M.: Earth, Wind, Fire, and Pollution: Aerosol Nutrient Sources and Impacts on Ocean Biogeochemistry, Annu. Rev. Mar. Sci., 14, 303–330, https://doi.org/10.1146/annurev-marine-031921-013612, 2022.
Hantson, S., Padilla, M., Corti, D., and Chuvieco, E.: Strengths and weaknesses of MODIS hotspots to characterize global fire occurrence, Remote Sens. Environ., 131, 152–159, https://doi.org/10.1016/j.rse.2012.12.004, 2013.
Hantson, S., Arneth, A., Harrison, S. P., Kelley, D. I., Prentice, I. C., Rabin, S. S., Archibald, S., Mouillot, F., Arnold, S. R., Artaxo, P., Bachelet, D., Ciais, P., Forrest, M., Friedlingstein, P., Hickler, T., Kaplan, J. O., Kloster, S., Knorr, W., Lasslop, G., Li, F., Mangeon, S., Melton, J. R., Meyn, A., Sitch, S., Spessa, A., van der Werf, G. R., Voulgarakis, A., and Yue, C.: The status and challenge of global fire modelling, Biogeosciences, 13, 3359–3375, https://doi.org/10.5194/bg-13-3359-2016, 2016.
Hantson, S., Kelley, D. I., Arneth, A., Harrison, S. P., Archibald, S., Bachelet, D., Forrest, M., Hickler, T., Lasslop, G., Li, F., Mangeon, S., Melton, J. R., Nieradzik, L., Rabin, S. S., Prentice, I. C., Sheehan, T., Sitch, S., Teckentrup, L., Voulgarakis, A., and Yue, C.: Quantitative assessment of fire and vegetation properties in simulations with fire-enabled vegetation models from the Fire Model Intercomparison Project, Geosci. Model Dev., 13, 3299–3318, https://doi.org/10.5194/gmd-13-3299-2020, 2020.
Hantson, S., Andela, N., Goulden, M. L., and Randerson, J. T.: Human-ignited fires result in more extreme fire behavior and ecosystem impacts, Nat. Commun., 13, 2717, https://doi.org/10.1038/s41467-022-30030-2, 2022.
Harris, S. and Lucas, C.: Understanding the variability of Australian fire weather between 1973 and 2017, PLOS ONE, 14, e0222328, https://doi.org/10.1371/journal.pone.0222328, 2019.
Harrison, S. P., Bartlein, P. J., Brovkin, V., Houweling, S., Kloster, S., and Prentice, I. C.: The biomass burning contribution to climate–carbon-cycle feedback, Earth Syst. Dynam., 9, 663–677, https://doi.org/10.5194/esd-9-663-2018, 2018.
Haynes, K., Short, K., Xanthopoulos, G., Viegas, D., Ribeiro, L. M., and Blanchi, R.: Wildfires and WUI Fire Fatalities, in: Encyclopedia of Wildfires and Wildland-Urban Interface (WUI) Fires, edited by: Manzello, S. L., Springer International Publishing, Cham, 1–16, https://doi.org/10.1007/978-3-319-51727-8_92-1, 2019.
Hazra, D. and Gallagher, P.: Role of insurance in wildfire risk mitigation, Econ. Model., 108, 105768, https://doi.org/10.1016/j.econmod.2022.105768, 2022.
Hegerl, G. C., Hoegh-Guldberg, O., Casassa, G., Hoerling, M., Kovats, S., Parmesan, C., Pierce, D., and Stott, P.: IPCC WGI Expert Meeting on Detection and Attribution Related to Anthropogenic Climate Change: Good Practice Guidance Paper on Detection and Attribution Related to Anthropogenic Climate Change, edited by: Stocker, T., Field, C., Dahe, Q., Barros, V., Plattner, G.-K., Tignor, M., Midgley, P., and Ebi, K., Intergovernmental Panel on Climate Change, Geneva, https://archive.ipcc.ch/pdf/supporting-material/ipcc_good_practice_guidance_paper_anthropogenic.pdf (last access: 9 July 2024), 2009.
Held, I. M., Guo, H., Adcroft, A., Dunne, J. P., Horowitz, L. W., Krasting, J., Shevliakova, E., Winton, M., Zhao, M., Bushuk, M., Wittenberg, A. T., Wyman, B., Xiang, B., Zhang, R., Anderson, W., Balaji, V., Donner, L., Dunne, K., Durachta, J., Gauthier, P. P. G., Ginoux, P., Golaz, J.-C., Griffies, S. M., Hallberg, R., Harris, L., Harrison, M., Hurlin, W., John, J., Lin, P., Lin, S.-J., Malyshev, S., Menzel, R., Milly, P. C. D., Ming, Y., Naik, V., Paynter, D., Paulot, F., Ramaswamy, V., Reichl, B., Robinson, T., Rosati, A., Seman, C., Silvers, L. G., Underwood, S., and Zadeh, N.: Structure and Performance of GFDL's CM4.0 Climate Model, J. Adv. Model. Earth Sy., 11, 3691–3727, https://doi.org/10.1029/2019MS001829, 2019.
Hersbach, H., Bell, B., Berrisford, P., Biavati, G., Horányi, A., Muñoz Sabater, J., Nicolas, J., Peubey, C., Radu, R., Rozum, I., Schepers, D., Simmons, A., Soci, C., Dee, D., Thépaut, J.-N.: ERA5 hourly data on single levels from 1940 to present, Copernicus Climate Change Service (C3S) Climate Data Store (CDS) [data set], https://doi.org/10.24381/cds.adbb2d47, 2023.
Higuera, P. E. and Abatzoglou, J. T.: Record-setting climate enabled the extraordinary 2020 fire season in the western United States, Glob. Change Biol., 27, 1–2, https://doi.org/10.1111/gcb.15388, 2021.
Higuera, P. E., Cook, M. C., Balch, J. K., Stavros, E. N., Mahood, A. L., and St. Denis, L. A.: Shifting social-ecological fire regimes explain increasing structure loss from Western wildfires, PNAS Nexus, 2, pgad005, https://doi.org/10.1093/pnasnexus/pgad005, 2023.
Hough, A.: The battle for Scarborough, IOL News, https://www.iol.co.za/capetimes/news/the-battle-for-scarborough-f9d4ce5c-223e-4fd9-97e3-ce23c58b12b9 (last access: 9 July 2024), 2023.
Hunka, N., Santoro, M., Armston, J., Dubayah, R., McRoberts, R. E., Næsset, E., Quegan, S., Urbazaev, M., Pascual, A., May, P. B., Minor, D., Leitold, V., Basak, P., Liang, M., Melo, J., Herold, M., Málaga, N., Wilson, S., Montesinos, P. D., Arana, A., Paiva, R. E. D. L. C., Ferrand, J., Keoka, S., Guerra-Hernández, J., and Duncanson, L.: On the NASA GEDI and ESA CCI biomass maps: aligning for uptake in the UNFCCC global stocktake, Environ. Res. Lett., 18, 124042, https://doi.org/10.1088/1748-9326/ad0b60, 2023.
Iturbide, M., Gutiérrez, J. M., Alves, L. M., Bedia, J., Cerezo-Mota, R., Cimadevilla, E., Cofiño, A. S., Di Luca, A., Faria, S. H., Gorodetskaya, I. V., Hauser, M., Herrera, S., Hennessy, K., Hewitt, H. T., Jones, R. G., Krakovska, S., Manzanas, R., Martínez-Castro, D., Narisma, G. T., Nurhati, I. S., Pinto, I., Seneviratne, S. I., van den Hurk, B., and Vera, C. S.: An update of IPCC climate reference regions for subcontinental analysis of climate model data: definition and aggregated datasets, Earth System Science Data, 12, 2959–2970, https://doi.org/10.5194/essd-12-2959-2020, 2020.
Inness, A., Ades, M., Agustí-Panareda, A., Barré, J., Benedictow, A., Blechschmidt, A.-M., Dominguez, J. J., Engelen, R., Eskes, H., Flemming, J., Huijnen, V., Jones, L., Kipling, Z., Massart, S., Parrington, M., Peuch, V.-H., Razinger, M., Remy, S., Schulz, M., and Suttie, M.: The CAMS reanalysis of atmospheric composition, Atmos. Chem. Phys., 19, 3515–3556, https://doi.org/10.5194/acp-19-3515-2019, 2019.
Instituto Chico Mendes de Conservação da Biodiversidade: Plano de Manejo Floresta Nacional do Tapajós, https://www.gov.br/icmbio/pt-br/assuntos/biodiversidade/unidade-de-conservacao/unidades-de-biomas/amazonia/lista-de-ucs/flona-do-tapajos/arquivos/plano_de_manejo_flona_do_tapajos_2019_vol2.pdf (last access: 9 July 2024), 2019.
Instituto da Conservação da Natureza e das Florestas: IR de Carrascal (Sarzedas) Castelo Branco – Proença-a-Nova Relatório de Estabilização de Emergência Pós-Incêndio, https://www.icnf.pt/api/file/doc/058d65a2c60898dc (last access: 9 July 2024), 2023.
Intergovernmental Panel on Climate Change (IPCC): Changing State of the Climate System, in: Climate Change 2021 – The Physical Science Basis: Working Group I Contribution to the Sixth Assessment Report of the Intergovernmental Panel on Climate Change, Cambridge University Press, Cambridge, 287–422, https://doi.org/10.1017/9781009157896.004, 2023a.
Intergovernmental Panel on Climate Change (IPCC): Key Risks across Sectors and Regions, in: Climate Change 2022 – Impacts, Adaptation and Vulnerability: Working Group II Contribution to the Sixth Assessment Report of the Intergovernmental Panel on Climate Change, Cambridge University Press, Cambridge, 2411–2538, https://doi.org/10.1017/9781009325844.025, 2023b.
Intergovernmental Panel on Climate Change (IPCC): 2023c Point of Departure and Key Concepts, in: Climate Change 2022 – Impacts, Adaptation and Vulnerability: Working Group II Contribution to the Sixth Assessment Report of the Intergovernmental Panel on Climate Change, Cambridge University Press, Cambridge, 121–196, https://doi.org/10.1017/9781009325844.003, 2023c.
International Federation of Red Cross and Red Crescent Societies: Mongolia: IFRC network mid-year report, January–June 2023 (14 December 2023), Mongolia, https://reliefweb.int/report/mongolia/mongolia-ifrc-network-mid-year-report-january-june-2023-14-december-2023 (last access: 9 July 2024), 2023.
Inter-Sectoral Impact Model Intercomparison Project (ISIMIP): ISIMIP Repository, https://data.ISIMIP.org/ (last access: 9 July 2024), 2024.
Istituto Superiore per la Protezione e la Ricerca Ambientale (ISPRA): Gli incendi boschivi in Italia: stagione degli incendi 2023, Roma, https://www.isprambiente.gov.it/files/temi/rischio-ed-emergenze-ambientali/si2023_csa_ispra.pdf (last access: 9 July 2024), 2023.
Jain, P., Barber, Q. E., Taylor, S., Whitman, E., Castellanos Acuna, D., Boulanger, Y., Chavardès, R. D., Chen, J., Englefield, P., Flannigan, M., Girardin, M. P., Hanes, C. C., Little, J., Morrison, K., Skakun, R. S., Thompson, D. K., Wang, X., and Parisien, M.-A.: Canada Under Fire – Drivers and Impacts of the Record-Breaking 2023 Wildfire Season, ESS Open Archive, https://doi.org/10.22541/essoar.170914412.27504349/v1, 2024.
Jiménez-Muñoz, J. C., Mattar, C., Barichivich, J., Santamaría-Artigas, A., Takahashi, K., Malhi, Y., Sobrino, J. A., and Schrier, G. van der: Record-breaking warming and extreme drought in the Amazon rainforest during the course of El Niño 2015–2016, Sci. Rep, 6, 33130, https://doi.org/10.1038/srep33130, 2016.
Johnson, S. J., Stockdale, T. N., Ferranti, L., Balmaseda, M. A., Molteni, F., Magnusson, L., Tietsche, S., Decremer, D., Weisheimer, A., Balsamo, G., Keeley, S. P. E., Mogensen, K., Zuo, H., and Monge-Sanz, B. M.: SEAS5: the new ECMWF seasonal forecast system, Geosci. Model Dev., 12, 1087–1117, https://doi.org/10.5194/gmd-12-1087-2019, 2019.
Johnston, F. H., Henderson, S. B., Chen, Y., Randerson, J. T., Marlier, M., DeFries, R. S., Kinney, P., Bowman, D. M. J. S., and Brauer, M.: Estimated Global Mortality Attributable to Smoke from Landscape Fires, Environ. Health Persp., 120, 695–701, https://doi.org/10.1289/ehp.1104422, 2012.
Johnston, F. H., Borchers-Arriagada, N., Morgan, G. G., Jalaludin, B., Palmer, A. J., Williamson, G. J., and Bowman, D. M. J. S.: Unprecedented health costs of smoke-related PM2.5 from the 2019–20 Australian megafires, Nat. Sustain., 4, 42–47, https://doi.org/10.1038/s41893-020-00610-5, 2021.
Johnstone, J. F., Allen, C. D., Franklin, J. F., Frelich, L. E., Harvey, B. J., Higuera, P. E., Mack, M. C., Meentemeyer, R. K., Metz, M. R., Perry, G. L., Schoennagel, T., and Turner, M. G.: Changing disturbance regimes, ecological memory, and forest resilience, Front. Ecol. Environ., 14, 369–378, https://doi.org/10.1002/fee.1311, 2016.
Jones, M. W., Abatzoglou, J. T., Veraverbeke, S., Andela, N., Lasslop, G., Forkel, M., Smith, A. J. P., Burton, C., Betts, R. A., van der Werf, G. R., Sitch, S., Canadell, J. G., Santín, C., Kolden, C., Doerr, S. H., and Le Quéré, C.: Global and Regional Trends and Drivers of Fire Under Climate Change, Rev. Geophys., 60, e2020RG000726, https://doi.org/10.1029/2020RG000726, 2022.
Jones, M. W., Brambleby, E., Andela, N., van der Werf, G. R., Parrington, M., and Giglio, L.: State of Wildfires 2023-24: Anomalies in Burned Area, Fire Emissions, and Individual Fire Characteristics by Continent, Biome, Country, and Administrative Region, Zenodo [data set], https://doi.org/10.5281/zenodo.11400539, 2024.
Joshi, M.: El Niño could push global warming past 1.5 °C – but what is it and how does it affect the weather in Europe?, The Conversation, http://theconversation.com/el-nino-could-push-global-warming-past-1-5-but-what-is-it-and-how-does-it-affect-the-weather-in-europe-208412 (last access: 9 July 2024), 2023.
Juntaex.es: El incendio de Pinofranqueado y Gata ha afectado a 10.863 hectáreas según las primeras estimaciones, Juntaex.es, https://www.juntaex.es/w/superficie-incendio-hurdes-gata (last access: 9 July 2024), 2023.
Kaiser, J. W., Heil, A., Andreae, M. O., Benedetti, A., Chubarova, N., Jones, L., Morcrette, J.-J., Razinger, M., Schultz, M. G., Suttie, M., and van der Werf, G. R.: Biomass burning emissions estimated with a global fire assimilation system based on observed fire radiative power, Biogeosciences, 9, 527–554, https://doi.org/10.5194/bg-9-527-2012, 2012.
Keeley, J. E.: Fire intensity, fire severity and burn severity: a brief review and suggested usage, Int. J. Wildland Fire, 18, 116–126, https://doi.org/10.1071/WF07049, 2009.
Kelley, D., Gerard, F., Dong, N., Burton, C., Argles, A., Li, G., Whitley, R., Marthews, T., Roberston, E., Weedon, G., Lasslop, G., Ellis, R., Bistinas, I., and Veendendaal, E.: Observational constraints of fire, environmental and anthropogenic on pantropical tree cover, Research Square [preprint], https://doi.org/10.21203/rs.3.rs-3413013/v1, 16 October 2023.
Kelley, D. I., Ferreira Barbosa, M. L., Burke, E., Burton, C. A., Bradley, A., Jones, M. W., Spuler, F., Wessel, J., McNorton, J., and Di Giuseppe, F.: State of Wildfires 2023-24: ConFire data, Zenodo [data set], https://doi.org/10.5281/zenodo.11420742, 2024a.
Kelley, D. I., Burton, C., Barbosa, M. L. F., Jones, M., Di Giuseppe, F., Hartley, A., McNorton, J., Spuler, F., Wessel, J., and Lampe, S.: State of Wildfires report 2023/24 Analysis code (SoW2_v0.1), Zenodo [code], https://doi.org/10.5281/zenodo.11460379, 2024b.
Kelley, D. I., Harrison, S. P., and Prentice, I. C.: Improved simulation of fire–vegetation interactions in the Land surface Processes and eXchanges dynamic global vegetation model (LPX-Mv1), Geosci. Model Dev., 7, 2411–2433, https://doi.org/10.5194/gmd-7-2411-2014, 2014.
Kelley, D. I., Bistinas, I., Whitley, R., Burton, C., Marthews, T. R., and Dong, N.: How contemporary bioclimatic and human controls change global fire regimes, Nat. Clim. Chang., 9, 690–696, https://doi.org/10.1038/s41558-019-0540-7, 2019.
Kelley, D. I., Burton, C., Huntingford, C., Brown, M. A. J., Whitley, R., and Dong, N.: Technical note: Low meteorological influence found in 2019 Amazonia fires, Biogeosciences, 18, 787–804, https://doi.org/10.5194/bg-18-787-2021, 2021.
Klein Goldewijk, K., Beusen, A., Van Drecht, G., and De Vos, M.: The HYDE 3.1 spatially explicit database of human-induced global land-use change over the past 12,000 years: HYDE 3.1 Holocene land use, Global Ecol. Biogeogr., 20, 73–86, https://doi.org/10.1111/j.1466-8238.2010.00587.x, 2011.
Kolden, C.: Wildfires: count lives and homes, not hectares burnt, Nature, 586, p. 9, https://doi.org/10.1038/d41586-020-02740-4, 2020.
Kolden, C. A. and Henson, C.: A Socio-Ecological Approach to Mitigating Wildfire Vulnerability in the Wildland Urban Interface: A Case Study from the 2017 Thomas Fire, Fire, 2, 9, https://doi.org/10.3390/fire2010009, 2019.
Kolden, C. A., Abatzoglou, J. T., Jones, M. W., and Jain, P.: Wildfires in 2023, Nat. Rev. Earth Environ., 5, 238–240, https://doi.org/10.1038/s43017-024-00544-y, 2024.
Kramer, S. J., Bisson, K. M., and Fischer, A. D.: Observations of Phytoplankton Community Composition in the Santa Barbara Channel During the Thomas Fire, J. Geophys. Res.-Oceans, 125, e2020JC016851, https://doi.org/10.1029/2020JC016851, 2020.
Ladd, T. M., Catlett, D., Maniscalco, M. A., Kim, S. M., Kelly, R. L., John, S. G., Carlson, C. A., and Iglesias-Rodríguez, M. D.: Food for all? Wildfire ash fuels growth of diverse eukaryotic plankton, P. Roy. Soc. B, 290, 20231817, https://doi.org/10.1098/rspb.2023.1817, 2023.
Lafferty, D. C. and Sriver, R. L.: Downscaling and bias-correction contribute considerable uncertainty to local climate projections in CMIP6, npj Clim. Atmos. Sci., 6, 1–13, https://doi.org/10.1038/s41612-023-00486-0, 2023.
Lange, S.: Trend-preserving bias adjustment and statistical downscaling with ISIMIP3BASD (v1.0), Geosci. Model Dev., 12, 3055–3070, https://doi.org/10.5194/gmd-12-3055-2019, 2019.
Lapola, D. M., Pinho, P., Barlow, J., Aragão, L. E. O. C., Berenguer, E., Carmenta, R., Liddy, H. M., Seixas, H., Silva, C. V. J., Silva-Junior, C. H. L., Alencar, A. A. C., Anderson, L. O., Armenteras, D., Brovkin, V., Calders, K., Chambers, J., Chini, L., Costa, M. H., Faria, B. L., Fearnside, P. M., Ferreira, J., Gatti, L., Gutierrez-Velez, V. H., Han, Z., Hibbard, K., Koven, C., Lawrence, P., Pongratz, J., Portela, B. T. T., Rounsevell, M., Ruane, A. C., Schaldach, R., da Silva, S. S., von Randow, C., and Walker, W. S.: The drivers and impacts of Amazon forest degradation, Science, 379, eabp8622, https://doi.org/10.1126/science.abp8622, 2023.
Lareau, N. P., Nauslar, N. J., and Abatzoglou, J. T.: The Carr Fire Vortex: A Case of Pyrotornadogenesis?, Geophys. Res. Lett., 45, 13107–13115, https://doi.org/10.1029/2018GL080667, 2018.
Las Provincias: Las terribles cifras del incendio de Villanueva de Viver, https://www.lasprovincias.es/sucesos/terribles-cifras-incendio-villanueva-viver-20230602133033-nt.html (last access: 9 July 2024), 2023.
Laurent, P., Mouillot, F., Yue, C., Ciais, P., Moreno, M. V., and Nogueira, J. M. P.: FRY, a global database of fire patch functional traits derived from space-borne burned area products, Sci. Data, 5, 180132, https://doi.org/10.1038/sdata.2018.132, 2018.
Le Monde: Russia: Forest fires break out in Siberia amid heatwave, Le Monde.fr, https://www.lemonde.fr/en/russia/article/2023/05/08/russia-forest-fires-break-out-in-siberia-amid-heatwave_6025902_140.html (last access: 9 July 2024), 8 May 2023.
Lemos, M. C., Kirchhoff, C. J., and Ramprasad, V.: Narrowing the climate information usability gap, Nat. Clim. Change, 2, 789–794, https://doi.org/10.1038/nclimate1614, 2012.
Li, S., Sparrow, S. N., Otto, F. E. L., Rifai, S. W., Oliveras, I., Krikken, F., Anderson, L. O., Malhi, Y., and Wallom, D.: Anthropogenic climate change contribution to wildfire-prone weather conditions in the Cerrado and Arc of deforestation, Environ. Res. Lett., 16, 094051, https://doi.org/10.1088/1748-9326/ac1e3a, 2021.
Li, Y., Sulla-Menashe, D., Motesharrei, S., Song, X.-P., Kalnay, E., Ying, Q., Li, S., and Ma, Z.: Inconsistent estimates of forest cover change in China between 2000 and 2013 from multiple datasets: differences in parameters, spatial resolution, and definitions, Sci. Rep., 7, 8748, https://doi.org/10.1038/s41598-017-07732-5, 2017.
Li, Y., Yuan, S., Fan, S., Song, Y., Wang, Z., Yu, Z., Yu, Q., and Liu, Y.: Satellite Remote Sensing for Estimating PM2.5 and Its Components, Curr. Pollut. Rep., 7, 72–87, https://doi.org/10.1007/s40726-020-00170-4, 2021.
Liang, Y., Sengupta, D., Campmier, M. J., Lunderberg, D. M., Apte, J. S., and Goldstein, A. H.: Wildfire smoke impacts on indoor air quality assessed using crowdsourced data in California, P. Natl. Acad. Sci. USA, 118, e2106478118, https://doi.org/10.1073/pnas.2106478118, 2021.
Lin, Y. C., Jenkins, S. F., Chow, J. R., Biass, S., Woo, G., and Lallemant, D.: Modeling Downward Counterfactual Events: Unrealized Disasters and why they Matter, Front. Earth Sci., 8, 575048, https://doi.org/10.3389/feart.2020.575048, 2020.
Linley, G. D., Jolly, C. J., Doherty, T. S., Geary, W. L., Armenteras, D., Belcher, C. M., Bliege Bird, R., Duane, A., Fletcher, M.-S., Giorgis, M. A., Haslem, A., Jones, G. M., Kelly, L. T., Lee, C. K. F., Nolan, R. H., Parr, C. L., Pausas, J. G., Price, J. N., Regos, A., Ritchie, E. G., Ruffault, J., Williamson, G. J., Wu, Q., and Nimmo, D. G.: What do you mean, “megafire”?, Global Ecol. Biogeogr., 31, 1906–1922, https://doi.org/10.1111/geb.13499, 2022.
Lizundia-Loiola, J., Otón, G., Ramo, R., and Chuvieco, E.: A spatio-temporal active-fire clustering approach for global burned area mapping at 250 m from MODIS data, Remote Sens. Environ., 236, 111493, https://doi.org/10.1016/j.rse.2019.111493, 2020.
Lizundia-Loiola, J., Franquesa, M., Khairoun, A., and Chuvieco, E.: Global burned area mapping from Sentinel-3 Synergy and VIIRS active fires, Remote Sens. Environ., 282, 113298, https://doi.org/10.1016/j.rse.2022.113298, 2022.
Lundberg, S. M. and Lee, S.-I.: A unified approach to interpreting model predictions, in: Proceedings of the 31st International Conference on Neural Information Processing Systems, Red Hook, NY, USA, 4768–4777, https://proceedings.neurips.cc/paper_files/paper/2017/file/8a20a8621978632d76c43dfd28b67767-Paper.pdf (last access: 9 July 2024), 2017.
Luque, M. A. M., Leon, E., Ardila, J. G. B., Gutiérrez, G., Bilbao, B., Rivera-Lombardi, R., and Milán, A.: Community Forest Brigades and their implementation as part of a new vision in the integrated fire management in the Bolivarian Republic of Venezuela, Biodiversidade Brasileira, 10, 49–49, https://doi.org/10.37002/biodiversidadebrasileira.v10i1.1624, 2020.
MapBiomas Brasil: Plataforma – Monitor do Fogo, https://plataforma.brasil.mapbiomas.org/monitor-do-fogo (last access: 9 July 2024), 2024.
Maraun, D., Shepherd, T. G., Widmann, M., Zappa, G., Walton, D., Gutiérrez, J. M., Hagemann, S., Richter, I., Soares, P. M. M., Hall, A., and Mearns, L. O.: Towards process-informed bias correction of climate change simulations, Nat. Clim. Change, 7, 764–773, https://doi.org/10.1038/nclimate3418, 2017.
Mariani, M., Fletcher, M.-S., Holz, A., and Nyman, P.: ENSO controls interannual fire activity in southeast Australia, Geophys. Res. Lett., 43, 10891–10900, https://doi.org/10.1002/2016GL070572, 2016.
Mataveli, G., Jones, M. W., Carmenta, R., Sanchez, A., Dutra, D. J., Chaves, M., de Oliveira, G., Anderson, L. O., and Aragão, L. E. O. C.: Deforestation falls but rise of wildfires continues degrading Brazilian Amazon forests, Glob. Change Biol., 30, e17202, https://doi.org/10.1111/gcb.17202, 2024.
Mathison, C., Burke, E., Hartley, A. J., Kelley, D. I., Burton, C., Robertson, E., Gedney, N., Williams, K., Wiltshire, A., Ellis, R. J., Sellar, A. A., and Jones, C. D.: Description and evaluation of the JULES-ES set-up for ISIMIP2b, Geosci. Model Dev., 16, 4249–4264, https://doi.org/10.5194/gmd-16-4249-2023, 2023.
Matthews, S.: A comparison of fire danger rating systems for use in forests, Austr. Meteoro. Oceanogr. J., 58, 41–48, https://doi.org/10.22499/2.5801.005, 2009.
Mauritsen, T., Bader, J., Becker, T., Behrens, J., Bittner, M., Brokopf, R., Brovkin, V., Claussen, M., Crueger, T., Esch, M., Fast, I., Fiedler, S., Fläschner, D., Gayler, V., Giorgetta, M., Goll, D. S., Haak, H., Hagemann, S., Hedemann, C., Hohenegger, C., Ilyina, T., Jahns, T., Jimenéz-de-la-Cuesta, D., Jungclaus, J., Kleinen, T., Kloster, S., Kracher, D., Kinne, S., Kleberg, D., Lasslop, G., Kornblueh, L., Marotzke, J., Matei, D., Meraner, K., Mikolajewicz, U., Modali, K., Möbis, B., Müller, W. A., Nabel, J. E. M. S., Nam, C. C. W., Notz, D., Nyawira, S.-S., Paulsen, H., Peters, K., Pincus, R., Pohlmann, H., Pongratz, J., Popp, M., Raddatz, T. J., Rast, S., Redler, R., Reick, C. H., Rohrschneider, T., Schemann, V., Schmidt, H., Schnur, R., Schulzweida, U., Six, K. D., Stein, L., Stemmler, I., Stevens, B., von Storch, J.-S., Tian, F., Voigt, A., Vrese, P., Wieners, K.-H., Wilkenskjeld, S., Winkler, A., and Roeckner, E.: Developments in the MPI-M Earth System Model version 1.2 (MPI-ESM1.2) and Its Response to Increasing CO2, J. Adv. Model. Earth Sy., 11, 998–1038, https://doi.org/10.1029/2018MS001400, 2019.
McNorton, J., Agustí-Panareda, A., Arduini, G., Balsamo, G., Bousserez, N., Boussetta, S., Chericoni, M., Choulga, M., Engelen, R., and Guevara, M.: An Urban Scheme for the ECMWF Integrated Forecasting System: Global Forecasts and Residential CO2 Emissions, J. Adv. Model. Earth Sy., 15, e2022MS003286, https://doi.org/10.1029/2022MS003286, 2023.
McNorton, J. R. and Di Giuseppe, F.: A global fuel characteristic model and dataset for wildfire prediction, Biogeosciences, 21, 279–300, https://doi.org/10.5194/bg-21-279-2024, 2024.
McNorton, J. R., Di Giuseppe, F., Pinnington, E., Chantry, M., and Barnard, C.: A Global Probability-Of-Fire (PoF) Forecast, Geophys. Res. Lett., 51, e2023GL107929, https://doi.org/10.1029/2023GL107929, 2024.
Meadley, J.: Thailand Enhances Measures Against Forest Fires, Encroachment Increases in Laos, Laotian Times, https://laotiantimes.com/2024/01/31/thailand-enhances-measures-against-forest-fires-encroachment-increases-in-laos/ (last access: 9 July 2024), 2024.
Mediterranean Center for Environmental Studies: Postfire/Informes de Impacto: Informe sobre el impacto del incendio forestal de Villanueva de Viver, 2023, https://www.ceam.es/es/news/postfire-informes-de-impacto-informe-sobre-el-impacto-del-incendio-forestal-de-villanueva-de-viver-2023/ (last access: 9 July 2024), 2023.
Meier, S., Elliott, R. J. R., and Strobl, E.: The regional economic impact of wildfires: Evidence from Southern Europe, J. Environ. Econ. Manag., 118, 102787, https://doi.org/10.1016/j.jeem.2023.102787, 2023a.
Meier, S., Strobl, E., Elliott, R. J. R., and Kettridge, N.: 2023b Cross-country risk quantification of extreme wildfires in Mediterranean Europe, Risk Anal., 43, 1745–1762, https://doi.org/10.1111/risa.14075, 2023b.
Mengel, M., Treu, S., Lange, S., and Frieler, K.: ATTRICI v1.1 – counterfactual climate for impact attribution, Geosci. Model Dev., 14, 5269–5284, https://doi.org/10.5194/gmd-14-5269-2021, 2021.
Met Office: EUCLEIA: European Climate and weather Events: Interpretation and Attribution, Centre for Environmental Data Analysis [data set], http://catalogue.ceda.ac.uk/uuid/99b29b4bfeae470599fb96243e90cde3 (last access: 9 July 2024), 2016.
Mills, G., Salkin, O., Fearon, M., Harris, S., Brown, T., and Reinbold, H.: Meteorological drivers of the eastern Victorian Black Summer (2019–2020) fires, J. South. Hemisph. Earth Syst. Sci., 72, 139–163, https://doi.org/10.1071/ES22011, 2022.
Mindlin, J., Vera, C. S., Shepherd, T. G., and Osman, M.: Plausible Drying and Wetting Scenarios for Summer in Southeastern South America, J. Climate, 36, 7973–7991, https://doi.org/10.1175/JCLI-D-23-0134.1, 2023.
Ministério Público Federal: Procuradoria da República no Amazonas. Reference: PA-PPB no 1.13.000.001219/2021-55, https://www.mpf.mp.br/am/sala-de-imprensa/docs/acao-queimadas (last access: 9 July 2024), 2023.
Modaresi Rad, A., Abatzoglou, J. T., Kreitler, J., Alizadeh, M. R., AghaKouchak, A., Hudyma, N., Nauslar, N. J., and Sadegh, M.: Human and infrastructure exposure to large wildfires in the United States, Nat. Sustain., 6, 1343–1351, https://doi.org/10.1038/s41893-023-01163-z, 2023.
Mongabay: Gobierno colombiano declara situación de desastre y calamidad en el país ante el grave impacto de incendios forestales, Noticias ambientales, https://es.mongabay.com/2024/01/gobierno-colombiano-declara-situacion-de-desastre-y-calamidad-en-el-pais-ante-el-grave-impacto-de-incendios-forestales/ (last access: 9 July 2024), 2024.
Moreira, F., Ascoli, D., Safford, H., Adams, M. A., Moreno, J. M., Pereira, J. M. C., Catry, F. X., Armesto, J., Bond, W., González, M. E., Curt, T., Koutsias, N., McCaw, L., Price, O., Pausas, J. G., Rigolot, E., Stephens, S., Tavsanoglu, C., Vallejo, V. R., Wilgen, B. W. V., Xanthopoulos, G., and Fernandes, P. M.: Wildfire management in Mediterranean-type regions: paradigm change needed, Environ. Res. Lett., 15, 011001, https://doi.org/10.1088/1748-9326/ab541e, 2020.
Muñoz-Sabater, J., Dutra, E., Agustí-Panareda, A., Albergel, C., Arduini, G., Balsamo, G., Boussetta, S., Choulga, M., Harrigan, S., Hersbach, H., Martens, B., Miralles, D. G., Piles, M., Rodríguez-Fernández, N. J., Zsoter, E., Buontempo, C., and Thépaut, J.-N.: ERA5-Land: a state-of-the-art global reanalysis dataset for land applications, Earth Syst. Sci. Data, 13, 4349–4383, https://doi.org/10.5194/essd-13-4349-2021, 2021.
GBD 2019 Risk Factors Collaborators: Global burden of 87 risk factors in 204 countries and territories, 1990–2019: a systematic analysis for the Global Burden of Disease Study 2019, The Lancet, 396, 1223–1249, https://doi.org/10.1016/S0140-6736(20)30752-2, 2020.
NASA Earth Observatory: Tracking Canada's Extreme 2023 Fire Season, https://earthobservatory.nasa.gov/images/151985/tracking-canadas-extreme-2023-fire-season (last access: 9 July 2024), 2023.
NASA Earth Observatory: Fires Rage in Central Chile, https://earthobservatory.nasa.gov/images/152411/fires-rage-in-central-chile (last access: 9 July 2024), 2024.
NASA Earth Science Data Systems: MODIS/Aqua+Terra Thermal Anomalies/Fire locations 1km FIRMS V006 and V0061 (Vector data), https://www.earthdata.nasa.gov/learn/find-data/near-real-time/firms/mcd14ml (last access: 9 July 2024), 2020.
National Institute for Space Research: INPE Programa Queimadas – Banco de Dados de Queimadas, https://terrabrasilis.dpi.inpe.br/queimadas/portal/ (last access: 9 July 2024), 2024.
National Interagency Fire Center: National Interagency Fire Center Situation Report for August 31, 2023, National Interagency Fire Center, https://www.nifc.gov/sites/default/files/NICC/1-Incident\,%20Information/IMSR/2023/August/IMSR_CY23_08_31_23_0.pdf (last access: 9 July 2024), 2023.
National Interagency Fire Center: 2024a Statistics – Current National Statistics, https://www.nifc.gov/fire-information/statistics (last access: 9 July 2024), 2024a.
National Interagency Fire Center: 2024b InciWeb Information, https://www.nifc.gov/fire-information/pio-bulletin-board/inciweb (last access: 9 July 2024), 2024b.
National Oceanic and Atmospheric Administration: National Centers for Environmental Information, Monthly Wildfires Report, National Oceanic and Atmospheric Administration, https://www.ncei.noaa.gov/access/monitoring/monthly-report/fire/202308 (last access: 9 July 2024), 2023.
National Oceanic and Atmospheric Administration: Fires Rage Across Texas Panhandle, National Environmental Satellite, Data, and Information https://www.nesdis.noaa.gov/news/fires-rage-across-texas-panhandle (last access: 9 July 2024), Service, 2024.
Neris, J., Santin, C., Lew, R., Robichaud, P. R., Elliot, W. J., Lewis, S. A., Sheridan, G., Rohlfs, A.-M., Ollivier, Q., Oliveira, L., and Doerr, S. H.: Designing tools to predict and mitigate impacts on water quality following the Australian 2019/2020 wildfires: Insights from Sydney's largest water supply catchment, Integr. Environ. Assess., 17, 1151–1161, https://doi.org/10.1002/ieam.4406, 2021.
Nielsen-Pincus, M., Moseley, C., and Gebert, K.: Job growth and loss across sectors and time in the western US: The impact of large wildfires, Forest Policy Econ., 38, 199–206, https://doi.org/10.1016/j.forpol.2013.08.010, 2014.
Nikolakis, W., Welham, C., and Greene, G.: Diffusion of indigenous fire management and carbon-credit programs: Opportunities and challenges for “scaling-up” to temperate ecosystems, Front. For. Glob. Change, 5, 967653, https://doi.org/10.3389/ffgc.2022.967653, 2022.
Noble, I. R., Gill, A. M., and Bary, G. A. V.: McArthur's fire-danger meters expressed as equations, Austr. J. Ecol., 5, 201–203, https://doi.org/10.1111/j.1442-9993.1980.tb01243.x, 1980.
Nolan, R. H., Collins, L., Leigh, A., Ooi, M. K. J., Curran, T. J., Fairman, T. A., Resco de Dios, V., and Bradstock, R.: Limits to post-fire vegetation recovery under climate change, Plant Cell Environ., 44, 3471–3489, https://doi.org/10.1111/pce.14176, 2021a.
Nolan, R. H., Bowman, D. M. J. S., Clarke, H., Haynes, K., Ooi, M. K. J., Price, O. F., Williamson, G. J., Whittaker, J., Bedward, M., Boer, M. M., Cavanagh, V. I., Collins, L., Gibson, R. K., Griebel, A., Jenkins, M. E., Keith, D. A., Mcilwee, A. P., Penman, T. D., Samson, S. A., Tozer, M. G., and Bradstock, R. A.: What Do the Australian Black Summer Fires Signify for the Global Fire Crisis?, Fire, 4, 97, https://doi.org/10.3390/fire4040097, 2021b.
Nunes, J. P., Doerr, S. H., Sheridan, G., Neris, J., Santín, C., Emelko, M. B., Silins, U., Robichaud, P. R., Elliot, W. J., and Keizer, J.: Assessing water contamination risk from vegetation fires: Challenges, opportunities and a framework for progress, Hydrol.l Process., 32, 687–694, https://doi.org/10.1002/hyp.11434, 2018.
Oberholtz, C.: Drone video shows wildfire devastation in Chile as death toll soars to 112 with hundreds still missing, FOX Weather, https://www.foxweather.com/weather-news/valparaiso-chile-forest-fires-evacuations-damage (last access: 9 July 2024), 2024.
O'Dell, K., Ford, B., Fischer, E. V., and Pierce, J. R.: Contribution of Wildland-Fire Smoke to US PM2.5 and Its Influence on Recent Trends, Environ. Sci. Technol., 53, 1797–1804, https://doi.org/10.1021/acs.est.8b05430, 2019.
OECD: Taming Wildfires in the Context of Climate Change, OECD, https://doi.org/10.1787/dd00c367-en, 2023.
Oklahoma Department of Emergency Management: April 1 Situation Update 2 Wildfires Impacting State, Oklahoma Department of Emergency Management, https://oklahoma.gov/oem/emergencies-and-disasters/2023/march-31-wildfire-event/april-1-situation-update-2.html (last access: 9 July 2024), 2023.
Olson, D. M., Dinerstein, E., Wikramanayake, E. D., Burgess, N. D., Powell, G. V. N., Underwood, E. C., D'amico, J. A., Itoua, I., Strand, H. E., Morrison, J. C., Loucks, C. J., Allnutt, T. F., Ricketts, T. H., Kura, Y., Lamoreux, J. F., Wettengel, W. W., Hedao, P., and Kassem, K. R.: Terrestrial Ecoregions of the World: A New Map of Life on Earth, BioScience, 51, 933, https://doi.org/10.1641/0006-3568(2001)051[0933:TEOTWA]2.0.CO;2, 2001.
Otón, G., Lizundia-Loiola, J., Pettinari, M. L., and Chuvieco, E.: Development of a consistent global long-term burned area product (1982–2018) based on AVHRR-LTDR data, Int. J. Appl. Earth Obs., 103, 102473, https://doi.org/10.1016/j.jag.2021.102473, 2021.
Pai, S. J., Carter, T. S., Heald, C. L., and Kroll, J. H.: Updated World Health Organization Air Quality Guidelines Highlight the Importance of Non-anthropogenic PM 2.5, Environ. Sci. Technol. Lett., 9, 501–506, https://doi.org/10.1021/acs.estlett.2c00203, 2022.
Palmer, J.: Fire as Medicine: Learning from Native American Fire Stewardship, Eos, http://eos.org/features/fire-as-medicine-learning-from-native-american-fire-stewardship (last access: 9 July 2024), 2021.
Pan, X., Chin, M., Ichoku, C. M., and Field, R. D.: Connecting Indonesian Fires and Drought With the Type of El Niño and Phase of the Indian Ocean Dipole During 1979–2016, J. Geophys. Res.-Atmos., 123, 7974–7988, https://doi.org/10.1029/2018JD028402, 2018.
Pan, X., Ichoku, C., Chin, M., Bian, H., Darmenov, A., Colarco, P., Ellison, L., Kucsera, T., da Silva, A., Wang, J., Oda, T., and Cui, G.: Six global biomass burning emission datasets: intercomparison and application in one global aerosol model, Atmos. Chem. Phys., 20, 969–994, https://doi.org/10.5194/acp-20-969-2020, 2020.
Perron, M. M. G., Meyerink, S., Corkill, M., Strzelec, M., Proemse, B. C., Gault-Ringold, M., Sanz Rodriguez, E., Chase, Z., and Bowie, A. R.: Trace elements and nutrients in wildfire plumes to the southeast of Australia, Atmos. Res., 270, 106084, https://doi.org/10.1016/j.atmosres.2022.106084, 2022.
Perry, M. C., Vanvyve, E., Betts, R. A., and Palin, E. J.: Past and future trends in fire weather for the UK, Nat. Hazards Earth Syst. Sci., 22, 559–575, https://doi.org/10.5194/nhess-22-559-2022, 2022.
Phillips, C. A., Rogers, B. M., Elder, M., Cooperdock, S., Moubarak, M., Randerson, J. T., and Frumhoff, P. C.: Escalating carbon emissions from North American boreal forest wildfires and the climate mitigation potential of fire management, Sci. Adv., 8, eabl7161, https://doi.org/10.1126/sciadv.abl7161, 2022.
Polade, S. D., Pierce, D. W., Cayan, D. R., Gershunov, A., and Dettinger, M. D.: The key role of dry days in changing regional climate and precipitation regimes, Sci. Rep., 4, 4364, https://doi.org/10.1038/srep04364, 2014.
Pomeroy, J. W., DeBeer, C. M., Adapa, P., Phare, M. A., Overduin, N., Miltenberger, M., Maas, M., Pentland, R., Brandes, O. M., and Sandford, R. W.: Water Security for Canadians: Solutions for Canada's Emerging Water Crisis, https://landusekn.ca/resource/water-security-canadians-solutions-canada%E2%80%99s-emerging-water-crisis (last access: 9 July 2024), 2019.
Pullabhotla, H., Zahid, M., Heft-Neal, S., Rathi, V., and Burke, M.: Reply to Giglio and Roy: Aggregate infant mortality estimates robust to choice of burned area product, P. Natl. Acad. Sci. USA, 120, e2318188120, https://doi.org/10.1073/pnas.2318188120, 2023.
Pyne, S. J.: Fire in America: A Cultural History of Wildland and Rural Fire, University of Washington Press, ISBN 0295805218, 2017.
Rabin, S. S., Melton, J. R., Lasslop, G., Bachelet, D., Forrest, M., Hantson, S., Kaplan, J. O., Li, F., Mangeon, S., Ward, D. S., Yue, C., Arora, V. K., Hickler, T., Kloster, S., Knorr, W., Nieradzik, L., Spessa, A., Folberth, G. A., Sheehan, T., Voulgarakis, A., Kelley, D. I., Prentice, I. C., Sitch, S., Harrison, S., and Arneth, A.: The Fire Modeling Intercomparison Project (FireMIP), phase 1: experimental and analytical protocols with detailed model descriptions, Geosci. Model Dev., 10, 1175–1197, https://doi.org/10.5194/gmd-10-1175-2017, 2017.
Radeloff, V. C., Helmers, D. P., Kramer, H. A., Mockrin, M. H., Alexandre, P. M., Bar-Massada, A., Butsic, V., Hawbaker, T. J., Martinuzzi, S., Syphard, A. D., and Stewart, S. I.: Rapid growth of the US wildland-urban interface raises wildfire risk, P. Natl. Acad. Sci. USA, 115, 3314–3319, https://doi.org/10.1073/pnas.1718850115, 2018.
Rádio e Televisão de Portugal: Prejuízos dos incêndios no Porto Moniz e Calheta rondam os 3 milhões de euros (áudio), https://madeira.rtp.pt/politica/prejuizos-dos-incendios-no-porto-moniz-e-calheta-rondam-os-3-milhoes-de-euros-audio/ (last access: 9 July 2024), 2023.
Reddington, C. L., Spracklen, D. V., Artaxo, P., Ridley, D. A., Rizzo, L. V., and Arana, A.: Analysis of particulate emissions from tropical biomass burning using a global aerosol model and long-term surface observations, Atmos. Chem. Phys., 16, 11083–11106, https://doi.org/10.5194/acp-16-11083-2016, 2016.
Ren, X., Zhang, L., Cai, W., and Wu, L.: Moderate Indian Ocean Dipole Dominates Spring Fire Weather Conditions in Southern Australia, Environ. Res. Lett., 19, 064056, https://doi.org/10.1088/1748-9326/ad4fa5, 2024.
Reuters: Deadly fires rage along Algeria coast, spread to Tunisia, https://www.reuters.com/world/africa/deadly-fires-rage-along-algeria-coast-spread-tunisia-2023-07-25/ (last access: 9 July 2024), 25 July 2023a.
Reuters: Syria struggles to contain wildfires as temperatures rise, https://www.reuters.com/world/middle-east/syria-struggles-contain-wildfires-temperatures-rise-2023-07-18/ (last access: 9 July 2024), 18 July 2023b.
Roads, J., Tripp, P., Juang, H., Wang, J., Fujioka, F., and Chen, S.: NCEP-ECPC monthly to seasonal US fire danger forecasts, Int. J. Wildland Fire 19, 399–414, https://doi.org/10.1071/WF07079, 2010.
Rodríguez-Trejo, D. A., Ponce-Calderón, L. P., Tchikoué, H., Martínez-Domínguez, R., Martínez-Muñoz, P., and Pulido-Luna, J. A.: Towards integrated fire management in Mexico's Megalopolis region: a diagnosis, Tropical Forest Issues, 61, 80–86, https://doi.org/10.55515/NWAM8441, 2022.
Román, M. O., Justice, C., Paynter, I., Boucher, P. B., Devadiga, S., Endsley, A., Erb, A., Friedl, M., Gao, H., Giglio, L., Gray, J. M., Hall, D., Hulley, G., Kimball, J., Knyazikhin, Y., Lyapustin, A., Myneni, R. B., Noojipady, P., Pu, J., Riggs, G., Sarkar, S., Schaaf, C., Shah, D., Tran, K. H., Vermote, E., Wang, D., Wang, Z., Wu, A., Ye, Y., Shen, Y., Zhang, S., Zhang, S., Zhang, X., Zhao, M., Davidson, C., and Wolfe, R.: Continuity between NASA MODIS Collection 6.1 and VIIRS Collection 2 land products, Remote Sens. Environ., 302, 113963, https://doi.org/10.1016/j.rse.2023.113963, 2024.
Romps, D. M.: Evaluating the Future of Lightning in Cloud-Resolving Models, Geophys. Res. Lett., 46, 14863–14871, https://doi.org/10.1029/2019GL085748, 2019.
Rosan, T. M., Sitch, S., Mercado, L. M., Heinrich, V., Friedlingstein, P., and Aragão, L. E. O. C.: Fragmentation-Driven Divergent Trends in Burned Area in Amazonia and Cerrado, Front. For. Glob. Change, 5, https://doi.org/10.3389/ffgc.2022.801408, 2022.
Roteta, E., Bastarrika, A., Ibisate, A., and Chuvieco, E.: A Preliminary Global Automatic Burned-Area Algorithm at Medium Resolution in Google Earth Engine, Remote Sens., 13, 4298, https://doi.org/10.3390/rs13214298, 2021.
Roy, D. P., Boschetti, L., Justice, C. O., and Ju, J.: The collection 5 MODIS burned area product – Global evaluation by comparison with the MODIS active fire product, Remote Sens. Environ., 112, 3690–3707, https://doi.org/10.1016/j.rse.2008.05.013, 2008.
Russell-Smith, J., Yates, C. P., Edwards, A. C., Whitehead, P. J., Murphy, B. P., and Lawes, M. J.: Deriving Multiple Benefits from Carbon Market-Based Savanna Fire Management: An Australian Example, PLoS ONE, 10, e0143426, https://doi.org/10.1371/journal.pone.0143426, 2015.
Sabljak, E.: Scotland's wildfires in maps and charts across all councils, https://www.heraldscotland.com/news/23498843.scotlands-wildfires-maps-charts-across-councils/ (last access: 9 July 2024), 2023.
Safford, H. D., Paulson, A. K., Steel, Z. L., Young, D. J. N., and Wayman, R. B.: The 2020 California fire season: A year like no other, a return to the past or a harbinger of the future?, Global Ecol. Biogeogr., 31, 2005–2025, https://doi.org/10.1111/geb.13498, 2022.
Sánchez-García, C., Santín, C., Neris, J., Sigmund, G., Otero, X. L., Manley, J., González-Rodríguez, G., Belcher, C. M., Cerdà, A., Marcotte, A. L., Murphy, S. F., Rhoades, C. C., Sheridan, G., Strydom, T., Robichaud, P. R., and Doerr, S. H.: Chemical characteristics of wildfire ash across the globe and their environmental and socio-economic implications, Environ. Int., 178, 108065, https://doi.org/10.1016/j.envint.2023.108065, 2023.
San-Miguel-Ayanz, J., Schulte, E., Schmuck, G., and Camia, A.: The European Forest Fire Information System in the context of environmental policies of the European Union, Forest Policy Econ., 29, 19–25, https://doi.org/10.1016/j.forpol.2011.08.012, 2013.
Santoro, M. and Cartus, O.: ESA Biomass Climate Change Initiative (Biomass_cci): Global datasets of forest above-ground biomass for the years 2010, 2017 and 2018, v3, CEDA Archive [data set], https://doi.org/10.5285/5F331C418E9F4935B8EB1B836F8A91B8, 2021.
Santoro, M., Cartus, O., Wegmüller, U., Besnard, S., Carvalhais, N., Araza, A., Herold, M., Liang, J., Cavlovic, J., and Engdahl, M. E.: Global estimation of above-ground biomass from spaceborne C-band scatterometer observations aided by LiDAR metrics of vegetation structure, Remote Sens. Environ., 279, 113114, https://doi.org/10.1016/j.rse.2022.113114, 2022.
Scholten, R. C., Jandt, R., Miller, E. A., Rogers, B. M., and Veraverbeke, S.: Overwintering fires in boreal forests, Nature, 593, 399–404, https://doi.org/10.1038/s41586-021-03437-y, 2021.
Schroeder, W., Oliva, P., Giglio, L., and Csiszar, I. A.: The New VIIRS 375 m active fire detection data product: Algorithm description and initial assessment, Remote Sens. Environ., 143, 85–96, https://doi.org/10.1016/j.rse.2013.12.008, 2014.
Schroeder, W., Oliva, P., Giglio, L., Quayle, B., Lorenz, E., and Morelli, F.: Active fire detection using Landsat-8/OLI data, Remote Sens. Environ., 185, 210–220, https://doi.org/10.1016/j.rse.2015.08.032, 2016.
Schug, F., Bar-Massada, A., Carlson, A. R., Cox, H., Hawbaker, T. J., Helmers, D., Hostert, P., Kaim, D., Kasraee, N. K., Martinuzzi, S., Mockrin, M. H., Pfoch, K. A., and Radeloff, V. C.: The global wildland–urban interface, Nature, 621, 94–99, https://doi.org/10.1038/s41586-023-06320-0, 2023.
Seddon, N., Chausson, A., Berry, P., Girardin, C. A. J., Smith, A., and Turner, B.: Understanding the value and limits of nature-based solutions to climate change and other global challenges, Philos. T. Roy. Soc. B, 375, 20190120, https://doi.org/10.1098/rstb.2019.0120, 2020.
Sellar, A. A., Jones, C. G., Mulcahy, J. P., Tang, Y., Yool, A., Wiltshire, A., O'Connor, F. M., Stringer, M., Hill, R., Palmieri, J., Woodward, S., de Mora, L., Kuhlbrodt, T., Rumbold, S. T., Kelley, D. I., Ellis, R., Johnson, C. E., Walton, J., Abraham, N. L., Andrews, M. B., Andrews, T., Archibald, A. T., Berthou, S., Burke, E., Blockley, E., Carslaw, K., Dalvi, M., Edwards, J., Folberth, G. A., Gedney, N., Griffiths, P. T., Harper, A. B., Hendry, M. A., Hewitt, A. J., Johnson, B., Jones, A., Jones, C. D., Keeble, J., Liddicoat, S., Morgenstern, O., Parker, R. J., Predoi, V., Robertson, E., Siahaan, A., Smith, R. S., Swaminathan, R., Woodhouse, M. T., Zeng, G., and Zerroukat, M.: UKESM1: Description and Evaluation of the U.K. Earth System Model, J. Adv. Model. Earth Sy., 11, 4513–4558, https://doi.org/10.1029/2019MS001739, 2019.
Seneviratne, S. I., Zhang, X., Adnan, M., Badi, W., Dereczynski, C., Luca, A. D., Ghosh, S., Iskandar, I., Kossin, J., Lewis, S., Otto, F., Pinto, I., Satoh, M., Vicente-Serrano, S. M., Wehner, M., Zhou, B., and Allan, R.: Weather and climate extreme events in a changing climate, in: Climate Change 2021: The Physical Science Basis: Working Group I contribution to the Sixth Assessment Report of the Intergovernmental Panel on Climate Change, edited by: Masson-Delmotte, V. P., Zhai, A., Pirani, S. L., and Connors, C., Cambridge University Press, Cambridge, UK, 1513-1766, https://doi.org/10.1017/9781009157896.013, 2021.
Seok, M.-W., Ko, Y. H., Park, K.-T., and Kim, T.-W.: Possible enhancement in ocean productivity associated with wildfire-derived nutrient and black carbon deposition in the Arctic Ocean in 2019–2021, Mar. Pollut. Bull., 201, 116149, https://doi.org/10.1016/j.marpolbul.2024.116149, 2024.
Sexton, J. O., Noojipady, P., Song, X.-P., Feng, M., Song, D.-X., Kim, D.-H., Anand, A., Huang, C., Channan, S., Pimm, S. L., and Townshend, J. R.: Conservation policy and the measurement of forests, Nat. Clim. Change, 6, 192–196, https://doi.org/10.1038/nclimate2816, 2016.
Seneviratne, S. I., Zhang, X., Adnan, M., Badi, W., Dereczynski, C., Di Luca, A., Ghosh, S., Iskandar, I., Kossin, J., Lewis, S., Otto, F., Pinto, I., Satoh, M., Vicente-Serrano, S. M., Wehner, M., and Zhou, B.: Weather and Climate Extreme Events in a Changing Climate, in Climate Change 2021: The Physical Science Basis. Contribution of Working Group I to the Sixth Assessment Report of the Intergovernmental Panel on Climate Change, edited by: Masson-Delmotte, V., Zhai, P., Pirani, A., Connors, S. L., Péan, C., Berger, S., Caud, N., Chen, Y., Goldfarb, L., Gomis, M. I., Huang, M., Leitzell, K., Lonnoy, E., Matthews, J. B. R., Maycock, T. K., Waterfield, T., Yelekçi, O., Yu, R., and Zhou, B., Cambridge University Press, Cambridge, United Kingdom and New York, NY, USA, 1513–1766, https://doi.org/10.1017/9781009157896.013, 2021.
Shaddick, G., Thomas, M. L., Amini, H., Broday, D., Cohen, A., Frostad, J., Green, A., Gumy, S., Liu, Y., Martin, R. V., Pruss-Ustun, A., Simpson, D., van Donkelaar, A., and Brauer, M.: Data Integration for the Assessment of Population Exposure to Ambient Air Pollution for Global Burden of Disease Assessment, Environ. Sci. Technol., 52, 9069–9078, https://doi.org/10.1021/acs.est.8b02864, 2018.
Shakesby, R. A. and Doerr, S. H.: Wildfire as a hydrological and geomorphological agent, Earth-Sci. Rev., 74, 269–307, https://doi.org/10.1016/j.earscirev.2005.10.006, 2006.
Shepherd, T. G., Boyd, E., Calel, R. A., Chapman, S. C., Dessai, S., Dima-West, I. M., Fowler, H. J., James, R., Maraun, D., Martius, O., Senior, C. A., Sobel, A. H., Stainforth, D. A., Tett, S. F. B., Trenberth, K. E., van den Hurk, B. J. J. M., Watkins, N. W., Wilby, R. L., and Zenghelis, D. A.: Storylines: an alternative approach to representing uncertainty in physical aspects of climate change, Climatic Change, 151, 555–571, https://doi.org/10.1007/s10584-018-2317-9, 2018.
Shingler, B.: It's the middle of winter, and more than 100 wildfires are still smouldering, CBC News, https://www.cbc.ca/news/climate/wildfires-zombie-fires-canada-bc-alberta-1.7119851 (last access: 9 July 2024), 21 February 2024.
Short, K. C.: A spatial database of wildfires in the United States, 1992-2011, Earth Syst. Sci. Data, 6, 1–27, https://doi.org/10.5194/essd-6-1-2014, 2014.
Shuman, J. K., Balch, J. K., Barnes, R. T., Higuera, P. E., Roos, C. I., Schwilk, D. W., Stavros, E. N., Banerjee, T., Bela, M. M., Bendix, J., Bertolino, S., Bililign, S., Bladon, K. D., Brando, P., Breidenthal, R. E., Buma, B., Calhoun, D., Carvalho, L. M. V., Cattau, M. E., Cawley, K. M., Chandra, S., Chipman, M. L., Cobian-Iñiguez, J., Conlisk, E., Coop, J. D., Cullen, A., Davis, K. T., Dayalu, A., De Sales, F., Dolman, M., Ellsworth, L. M., Franklin, S., Guiterman, C. H., Hamilton, M., Hanan, E. J., Hansen, W. D., Hantson, S., Harvey, B. J., Holz, A., Huang, T., Hurteau, M. D., Ilangakoon, N. T., Jennings, M., Jones, C., Klimaszewski-Patterson, A., Kobziar, L. N., Kominoski, J., Kosovic, B., Krawchuk, M. A., Laris, P., Leonard, J., Loria-Salazar, S. M., Lucash, M., Mahmoud, H., Margolis, E., Maxwell, T., McCarty, J. L., McWethy, D. B., Meyer, R. S., Miesel, J. R., Moser, W. K., Nagy, R. C., Niyogi, D., Palmer, H. M., Pellegrini, A., Poulter, B., Robertson, K., Rocha, A. V., Sadegh, M., Santos, F., Scordo, F., Sexton, J. O., Sharma, A. S., Smith, A. M. S., Soja, A. J., Still, C., Swetnam, T., Syphard, A. D., Tingley, M. W., Tohidi, A., Trugman, A. T., Turetsky, M., Varner, J. M., Wang, Y., Whitman, T., Yelenik, S., and Zhang, X.: Reimagine fire science for the anthropocene, PNAS Nexus, 1, pgac115, https://doi.org/10.1093/pnasnexus/pgac115, 2022.
Siciliano, B., Dantas, G., Silva, C. M. da, and Arbilla, G.: The Updated Brazilian National Air Quality Standards: A Critical Review, J. Braz. Chem. Soc., 31, 523–535, https://doi.org/10.21577/0103-5053.20190212, 2020.
SIC Notícias: Incêndio em Odemira causou prejuízos de sete milhões de euros em habitações, https://sicnoticias.pt/especiais/incendios-em-portugal/2023-09-08-Incendio-em-Odemira-causou-prejuizos-de-sete-milhoes-de-euros-em-habitacoes-c3204bcb (last access: 9 July 2024), 2023.
Silva, C. V. J., Aragão, L. E. O. C., Young, P. J., Espirito-Santo, F., Berenguer, E., Anderson, L. O., Brasil, I., Pontes-Lopes, A., Ferreira, J., Withey, K., França, F., Graça, P. M. L. A., Kirsten, L., Xaud, H., Salimon, C., Scaranello, M. A., Castro, B., Seixas, M., Farias, R., and Barlow, J.: Estimating the multi-decadal carbon deficit of burned Amazonian forests, Environ. Res. Lett., 15, 114023, https://doi.org/10.1088/1748-9326/abb62c, 2020.
Silva Junior, C. H. L., Pessôa, A. C. M., Carvalho, N. S., Reis, J. B. C., Anderson, L. O., and Aragão, L. E. O. C.: The Brazilian Amazon deforestation rate in 2020 is the greatest of the decade, Nat. Ecol. Evol., 5, 144–145, https://doi.org/10.1038/s41559-020-01368-x, 2021.
Silveira, M. V. F., Petri, C. A., Broggio, I. S., Chagas, G. O., Macul, M. S., Leite, C. C. S. S., Ferrari, E. M. M., Amim, C. G. V., Freitas, A. L. R., Motta, A. Z. V., Carvalho, L. M. E., Silva Junior, C. H. L., Anderson, L. O., and Aragão, L. E. O. C.: Drivers of Fire Anomalies in the Brazilian Amazon: Lessons Learned from the 2019 Fire Crisis., Land, 9, 516, https://doi.org/10.3390/land9120516, 2020.
Skakun, R., Castilla, G., Metsaranta, J., Whitman, E., Rodrigue, S., Little, J., Groenewegen, K., and Coyle, M.: Extending the National Burned Area Composite Time Series of Wildfires in Canada, Remote Sens., 14, 3050, https://doi.org/10.3390/rs14133050, 2022.
Sloan, S., Locatelli, B., Andela, N., Cattau, M. E., Gaveau, D., and Tacconi, L.: Declining severe fire activity on managed lands in Equatorial Asia, Commun. Earth Environ., 3, 1–12, https://doi.org/10.1038/s43247-022-00522-6, 2022.
Smith, H. G., Sheridan, G. J., Lane, P. N. J., Nyman, P., and Haydon, S.: Wildfire effects on water quality in forest catchments: A review with implications for water supply, J. Hydrol., 396, 170–192, https://doi.org/10.1016/j.jhydrol.2010.10.043, 2011.
Smith, S., Geden, O., Nemet, G., Gidden, M., Lamb, W., Powis, C., Bellamy, R., Callaghan, M., Cowie, A., Cox, E., Fuss, S., Gasser, T., Grassi, G., Greene, J., Lueck, S., Mohan, A., Müller-Hansen, F., Peters, G., Pratama, Y., Repke, T., Riahi, K., Schenuit, F., Steinhauser, J., Strefler, J., Valenzuela, J., and Minx, J.: State of Carbon Dioxide Removal – 1st Edition, OSF, https://doi.org/10.17605/OSF.IO/W3B4Z, 2023.
South African Broadcasting Corporation: Wildfire scorches 1140 hectares in Simon's Town, https://www.sabcnews.com/sabcnews/wildfire-scorches-1140-hectares-in-simons-town/ (last access: 9 July 2024), 2023.
Spessa, A. C., Field, R. D., Pappenberger, F., Langner, A., Englhart, S., Weber, U., Stockdale, T., Siegert, F., Kaiser, J. W., and Moore, J.: Seasonal forecasting of fire over Kalimantan, Indonesia, Nat. Hazards Earth Syst. Sci., 15, 429–442, https://doi.org/10.5194/nhess-15-429-2015, 2015.
Spuler, F. and Wessel, J.: ibicus v1.0.1, Zenodo [code], https://doi.org/10.5281/ZENODO.8101898, 2023.
Spuler, F. and Wessel J.: ibicus, PyPi The Python Package Index [code], https://pypi.org/project/ibicus/ (last access: 9 July 2024), 2024a.
Spuler, F. and Wessel, J.: State of Wildfires 2023/24 – JULES Bias adjustment, Zenodo [code], https://doi.org/10.5281/zenodo.13255783, 2024b.
Spuler, F. R., Wessel, J. B., Comyn-Platt, E., Varndell, J., and Cagnazzo, C.: ibicus: a new open-source Python package and comprehensive interface for statistical bias adjustment and evaluation in climate modelling (v1.0.1), Geosci. Model Dev., 17, 1249–1269, https://doi.org/10.5194/gmd-17-1249-2024, 2024a.
Spuler, F. R., Wessel, J. B., and Comyn-Platt, E., Varndell: ibicus documentation, https://ibicus.readthedocs.io/en/latest/ (last access: 9 July 2024), 2024b.
Staver, A. C., Archibald, S., and Levin, S. A.: The Global Extent and Determinants of Savanna and Forest as Alternative Biome States, Science, 334, 230–232, https://doi.org/10.1126/science.1210465, 2011.
Stephens, S. L., McIver, J. D., Boerner, R. E. J., Fettig, C. J., Fontaine, J. B., Hartsough, B. R., Kennedy, P. L., and Schwilk, D. W.: The Effects of Forest Fuel-Reduction Treatments in the United States, BioScience, 62, 549–560, https://doi.org/10.1525/bio.2012.62.6.6, 2012.
Stephens, S. L., Bernal, A. A., Collins, B. M., Finney, M. A., Lautenberger, C., and Saah, D.: Mass fire behavior created by extensive tree mortality and high tree density not predicted by operational fire behavior models in the southern Sierra Nevada, Forest Ecol. Manage., 518, 120258, https://doi.org/10.1016/j.foreco.2022.120258, 2022.
Stocks, B. J., Lawson, B. D., Alexander, M. E., Wagner, C. E. V., McAlpine, R. S., Lynham, T. J., and Dubé, D. E.: The Canadian Forest Fire Danger Rating System: An Overview, Forest. Chron., 65, 450–457, https://doi.org/10.5558/tfc65450-6, 1989.
Stott, P. A., Stone, D. A., and Allen, M. R.: Human contribution to the European heatwave of 2003, Nature, 432, 610–614, https://doi.org/10.1038/nature03089, 2004.
Sullivan, H. and Tondo, L.: “Like a blowtorch”: Mediterranean on fire as blazes spread across nine countries, The Guardian, https://www.theguardian.com/environment/2023/jul/26/northern-hemisphere-heatwaves-mediterranean-fires-croatia-portugal (last access: 9 July 2024), 26 July 2023.
Swain, D. L., Langenbrunner, B., Neelin, J. D., and Hall, A.: Increasing precipitation volatility in twenty-first-century California, Nat. Clim. Change, 8, 427–433, https://doi.org/10.1038/s41558-018-0140-y, 2018.
Synolakis, C. E. and Karagiannis, G. M.: Wildfire risk management in the era of climate change, PNAS Nexus, 3, pgae151, https://doi.org/10.1093/pnasnexus/pgae151, 2024.
Syphard, A. and Keeley, J.: Factors Associated with Structure Loss in the 2013–2018 California Wildfires, Fire, 2, 49, https://doi.org/10.3390/fire2030049, 2019.
Tang, W., Llort, J., Weis, J., Perron, M. M. G., Basart, S., Li, Z., Sathyendranath, S., Jackson, T., Sanz Rodriguez, E., Proemse, B. C., Bowie, A. R., Schallenberg, C., Strutton, P. G., Matear, R., and Cassar, N.: Widespread phytoplankton blooms triggered by 2019–2020 Australian wildfires, Nature, 597, 370–375, https://doi.org/10.1038/s41586-021-03805-8, 2021.
Tang, W., He, C., Emmons, L., and Zhang, J.: Global expansion of wildland-urban interface (WUI) and WUI fires: insights from a multiyear worldwide unified database (WUWUI), Environ. Res. Lett., 19, 044028, https://doi.org/10.1088/1748-9326/ad31da, 2024.
Tian, Y., Ghausi, S. A., Zhang, Y., Zhang, M., Xie, D., Cao, Y., Mei, Y., Wang, G., Zhong, D., and Kleidon, A.: Radiation as the dominant cause of high-temperature extremes on the eastern Tibetan Plateau, Environ. Res. Lett., 18, 074007, https://doi.org/10.1088/1748-9326/acd805, 2023.
Tiempo: Venezuela se llena de nubes de humos por incendios forestales y una estación muy seca, Tiempo.com | Meteored, https://www.tiempo.com/ram/venezuela-humos-incendios-forestales.html (last access: 9 July 2024), 2024.
Turco, M., Jerez, S., Doblas-Reyes, F. J., AghaKouchak, A., Llasat, M. C., and Provenzale, A.: Skilful forecasting of global fire activity using seasonal climate predictions, Nat. Commun., 9, 2718, https://doi.org/10.1038/s41467-018-05250-0, 2018.
UC Davis: Global Administrative Regions Data, https://gadm.org/download_world.html (last access: 9 July 2024), 2022.
UN Resident Coordinator in Chile: Chile: Incendios forestales, 2024 Sistema de Naciones Unidas, Reporte de Situación No. 3 – Chile, https://reliefweb.int/report/chile/chile-incendios-forestales-2024-sistema-de-naciones-unidas-reporte-de-situacion-no-3 (last access: 9 July 2024), 2024.
UNESCO World Heritage Centre: Landscapes of Dauria, https://whc.unesco.org/en/list/1448/ (last access: 9 July 2024), 2017.
United Nations Environment Programme: Spreading like Wildfire – The Rising Threat of Extraordinary Landscape Fires. A UNEP Rapid Response Assessment, Nairobi, Kenya, https://www.unep.org/resources/report/spreading-wildfire-rising-threat-extraordinary-landscape-fires (last access: 9 July 2024), 2022a.
United Nations Environment Programme: Global Peatlands Assessment: The State of the World's Peatlands, Nairobi, Kenya, https://www.unep.org/resources/global-peatlands-assessment-2022 (last access: 9 July 2024), 2022b.
United Nations Population Division: World Population Prospects 2022, https://population.un.org/wpp/ (last access: 9 July 2024), 2022.
Van Wagner, C. E.: Development and structure of the Canadian Forest Fire Weather Index System, Forestry Technical Report 35, Canadian Forestry Service, Ottowa, https://cfs.nrcan.gc.ca/pubwarehouse/pdfs/19927.pdf (last access: 9 July 2024), 1987.
Van Wagtendonk, J. W.: Fire as a Physical Process, in: Fire in California's Ecosystems, edited by: Sugihara, N., University of California Press, 38–57, https://doi.org/10.1525/california/9780520246058.003.0003, 2006.
van der Werf, G. R., Randerson, J. T., Giglio, L., Collatz, G. J., Kasibhatla, P. S., and Arellano Jr., A. F.: Interannual variability in global biomass burning emissions from 1997 to 2004, Atmos. Chem. Phys., 6, 3423–3441, https://doi.org/10.5194/acp-6-3423-2006, 2006.
van der Werf, G. R., Randerson, J. T., Giglio, L., Collatz, G. J., Mu, M., Kasibhatla, P. S., Morton, D. C., DeFries, R. S., Jin, Y., and van Leeuwen, T. T.: Global fire emissions and the contribution of deforestation, savanna, forest, agricultural, and peat fires (1997–2009), Atmos. Chem. Phys., 10, 11707–11735, https://doi.org/10.5194/acp-10-11707-2010, 2010.
van der Werf, G. R., Randerson, J. T., Giglio, L., van Leeuwen, T. T., Chen, Y., Rogers, B. M., Mu, M., van Marle, M. J. E., Morton, D. C., Collatz, G. J., Yokelson, R. J., and Kasibhatla, P. S.: Global fire emissions estimates during 1997–2016, Earth Syst. Sci. Data, 9, 697–720, https://doi.org/10.5194/essd-9-697-2017, 2017.
van Leeuwen, S. and Miller-Sabbioni, C.: Australia's Megafires: Biodiversity Impacts and Lessons from 2019–2020, in: Australia's Megafires: Biodiversity Impacts and Lessons from 2019–20, edited by: Rumpff, L., Legge, S. M., van Leeuwen, S., Wintle, B. A., and Woinarski, J. C. Z., CSIRO Publishing, ISBN 9781486316663, 2023.
Vitolo, C., Di Giuseppe, F., Barnard, C., Coughlan, R., San-Miguel-Ayanz, J., Libertá, G., and Krzeminski, B.: ERA5-based global meteorological wildfire danger maps, Sci. Data, 7, 216, https://doi.org/10.1038/s41597-020-0554-z, 2020.
Wang, D., Guan, D., Zhu, S., Kinnon, M. M., Geng, G., Zhang, Q., Zheng, H., Lei, T., Shao, S., Gong, P., and Davis, S. J.: Economic footprint of California wildfires in 2018, Nat. Sustain., 4, 252–260, https://doi.org/10.1038/s41893-020-00646-7, 2021.
Wang, Y., Chen, H.-H., Tang, R., He, D., Lee, Z., Xue, H., Wells, M., Boss, E., and Chai, F.: Australian fire nourishes ocean phytoplankton bloom, Sci. Total. Environ., 807, 150775, https://doi.org/10.1016/j.scitotenv.2021.150775, 2022.
Wang, Z., Wang, Z., Zou, Z., Chen, X., Wu, H., Wang, W., Su, H., Li, F., Xu, W., Liu, Z., and Zhu, J.: Severe Global Environmental Issues Caused by Canada's Record-Breaking Wildfires in 2023, Adv. Atmos. Sci., 41, 565–571, https://doi.org/10.1007/s00376-023-3241-0, 2024.
Ward, M., Tulloch, A. I. T., Radford, J. Q., Williams, B. A., Reside, A. E., Macdonald, S. L., Mayfield, H. J., Maron, M., Possingham, H. P., Vine, S. J., O'Connor, J. L., Massingham, E. J., Greenville, A. C., Woinarski, J. C. Z., Garnett, S. T., Lintermans, M., Scheele, B. C., Carwardine, J., Nimmo, D. G., Lindenmayer, D. B., Kooyman, R. M., Simmonds, J. S., Sonter, L. J., and Watson, J. E. M.: Impact of 2019–2020 mega-fires on Australian fauna habitat, Nat. Ecol. Evol., 4, 1321–1326, https://doi.org/10.1038/s41559-020-1251-1, 2020.
Wetterhall, F. and Di Giuseppe, F.: The benefit of seamless forecasts for hydrological predictions over Europe, Hydrol. Earth Syst. Sci., 22, 3409–3420, https://doi.org/10.5194/hess-22-3409-2018, 2018.
Wiedinmyer, C., Kimura, Y., McDonald-Buller, E. C., Emmons, L. K., Buchholz, R. R., Tang, W., Seto, K., Joseph, M. B., Barsanti, K. C., Carlton, A. G., and Yokelson, R.: The Fire Inventory from NCAR version 2.5: an updated global fire emissions model for climate and chemistry applications, Geosci. Model Dev., 16, 3873–3891, https://doi.org/10.5194/gmd-16-3873-2023, 2023.
Wigneron, J.-P., Li, X., Frappart, F., Fan, L., Al-Yaari, A., De Lannoy, G., Liu, X., Wang, M., Le Masson, E., and Moisy, C.: SMOS-IC data record of soil moisture and L-VOD: Historical development, applications and perspectives, Remote Sens. Environ., 254, 112238, https://doi.org/10.1016/j.rse.2020.112238, 2021.
Wittwer, G. and Waschik, R.: Estimating the economic impacts of the 2017–2019 drought and 2019–2020 bushfires on regional NSW and the rest of Australia, Aus. J. Agr. Res. Econ., 65, 918–936, https://doi.org/10.1111/1467-8489.12441, 2021.
World Bank: World Bank Policy Note: Managing Wildfires in a Changing Climate, Washington DC, https://www.profor.info/sites/default/files/PROFOR_ManagingWildfires_2020_final.pdf (last access: 9 July 2024), 2020.
World Bank: Financially Prepared: The Case for Pre-positioned Finance in European Union Member States and Countries under EU Civil Protection Mechanism, Washington DC, https://civil-protection-knowledge-network.europa.eu/system/files/2024-05/Financially Prepared -The Case for Pre-positioned Finance.pdf (last access: 9 July 2024), 2024.
Xanthopoulos, G., Zevgoli, E., Kaoukis, K., and Athanasiou, M.: Greece – Lessons not learned, Wildfire, 2023, https://issuu.com/wildfiremagazine-iawf/docs/wildfire_magazine_q4_2023_-_web (last access: 9 July 2024), 2024.
Yebra, M., Dennison, P. E., Chuvieco, E., Riaño, D., Zylstra, P., Hunt, E. R., Danson, F. M., Qi, Y., and Jurdao, S.: A global review of remote sensing of live fuel moisture content for fire danger assessment: Moving towards operational products, Remote Sens. Environ., 136, 455–468, https://doi.org/10.1016/j.rse.2013.05.029, 2013.
Yebra, M., Quan, X., Riaño, D., Rozas Larraondo, P., van Dijk, A. I. J. M., and Cary, G. J.: A fuel moisture content and flammability monitoring methodology for continental Australia based on optical remote sensing, Remote Sens. Environ., 212, 260–272, https://doi.org/10.1016/j.rse.2018.04.053, 2018.
Yu, M., Zhang, S., Ning, H., Li, Z., and Zhang, K.: Assessing the 2023 Canadian wildfire smoke impact in Northeastern US: Air quality, exposure and environmental justice, Sci. Total. Environ., 926, 171853, https://doi.org/10.1016/j.scitotenv.2024.171853, 2024.
Yukimoto, S., Kawai, H., Koshiro, T., Oshima, N., Yoshida, K., Urakawa, S., Tsujino, H., Deushi, M., Tanaka, T., Hosaka, M., Yabu, S., Yoshimura, H., Shindo, E., Mizuta, R., Obata, A., Adachi, Y., and Ishii, M.: The Meteorological Research Institute Earth System Model Version 2.0, MRI-ESM2.0: Description and Basic Evaluation of the Physical Component, J. Meteor. Soc. Jpn. Ser. II, 97, 931–965, https://doi.org/10.2151/jmsj.2019-051, 2019.
Zachariah, M., Vautard, R., Chandrasekaran, R., Chaithra, S., Kimutai, J., Arulalan, T., AchutaRao, K., Barnes, C., Singh, R., Vahlberg, M., Arrgihi, J., Raju, E., Sharma, U., Ogra, A., Vaddhanaphuti, C., Bahinipati, C., Tschakert, P., Pereira Marghidan, C., Mondal, A., Schwingshackl, C., Philip, S., and Otto, F.: Extreme humid heat in South Asia in April 2023, largely driven by climate change, detrimental to vulnerable and disadvantaged communities, Imperial College London, https://doi.org/10.25561/104092, 2023.
Zheng, B., Ciais, P., Chevallier, F., Chuvieco, E., Chen, Y., and Yang, H.: Increasing forest fire emissions despite the decline in global burned area, Sci. Adv., 7, eabh2646, https://doi.org/10.1126/sciadv.abh2646, 2021.
Zheng, B., Ciais, P., Chevallier, F., Yang, H., Canadell, J. G., Chen, Y., Van Der Velde, I. R., Aben, I., Chuvieco, E., Davis, S. J., Deeter, M., Hong, C., Kong, Y., Li, H., Li, H., Lin, X., He, K., and Zhang, Q.: Record-high CO2 emissions from boreal fires in 2021, Science, 379, 912–917, https://doi.org/10.1126/science.ade0805, 2023.
- Abstract
- Introduction
- Extreme wildfire events of 2023–2024
- Diagnosing drivers and assessing predictability
- Attribution to global change factors
- Seasonal and multidecadal outlook
- Data availability
- Code availability
- Conclusions
- Appendix A: Year in review by continent
- Appendix B: Frontiers in observing and modelling extreme fire occurrence and impact
- Author contributions
- Competing interests
- Disclaimer
- Acknowledgements
- Financial support
- Review statement
- References
- Supplement
Please read the editorial note first before accessing the article.
- Article
(19217 KB) - Full-text XML
-
Supplement
(35662 KB) - BibTeX
- EndNote
- Abstract
- Introduction
- Extreme wildfire events of 2023–2024
- Diagnosing drivers and assessing predictability
- Attribution to global change factors
- Seasonal and multidecadal outlook
- Data availability
- Code availability
- Conclusions
- Appendix A: Year in review by continent
- Appendix B: Frontiers in observing and modelling extreme fire occurrence and impact
- Author contributions
- Competing interests
- Disclaimer
- Acknowledgements
- Financial support
- Review statement
- References
- Supplement