the Creative Commons Attribution 4.0 License.
the Creative Commons Attribution 4.0 License.
 | 05 Jun 2024
Indicators of Global Climate Change 2023: annual update of key indicators of the state of the climate system and human influence
Chris Smith
Tristram Walsh
William F. Lamb
Robin Lamboll
Bradley Hall
Mathias Hauser
Aurélien Ribes
Debbie Rosen
Nathan P. Gillett
Matthew D. Palmer
Joeri Rogelj
Karina von Schuckmann
Blair Trewin
Myles Allen
Robbie Andrew
Richard A. Betts
Alex Borger
Tim Boyer
Jiddu A. Broersma
Carlo Buontempo
Samantha Burgess
Chiara Cagnazzo
Lijing Cheng
Pierre Friedlingstein
Andrew Gettelman
Johannes Gütschow
Masayoshi Ishii
Stuart Jenkins
Colin Morice
Jens Mühle
Christopher Kadow
John Kennedy
Rachel E. Killick
Paul B. Krummel
Jan C. Minx
Gunnar Myhre
Vaishali Naik
Glen P. Peters
Anna Pirani
Julia Pongratz
Carl-Friedrich Schleussner
Sonia I. Seneviratne
Sophie Szopa
Peter Thorne
Mahesh V. M. Kovilakam
Elisa Majamäki
Jukka-Pekka Jalkanen
Margreet van Marle
Rachel M. Hoesly
Robert Rohde
Dominik Schumacher
Guido van der Werf
Russell Vose
Kirsten Zickfeld
Xuebin Zhang
Valérie Masson-Delmotte
Panmao Zhai
Intergovernmental Panel on Climate Change (IPCC) assessments are the trusted source of scientific evidence for climate negotiations taking place under the United Nations Framework Convention on Climate Change (UNFCCC). Evidence-based decision-making needs to be informed by up-to-date and timely information on key indicators of the state of the climate system and of the human influence on the global climate system. However, successive IPCC reports are published at intervals of 5–10 years, creating potential for an information gap between report cycles.
We follow methods as close as possible to those used in the IPCC Sixth Assessment Report (AR6) Working Group One (WGI) report. We compile monitoring datasets to produce estimates for key climate indicators related to forcing of the climate system: emissions of greenhouse gases and short-lived climate forcers, greenhouse gas concentrations, radiative forcing, the Earth's energy imbalance, surface temperature changes, warming attributed to human activities, the remaining carbon budget, and estimates of global temperature extremes. The purpose of this effort, grounded in an open-data, open-science approach, is to make annually updated reliable global climate indicators available in the public domain (https://doi.org/10.5281/zenodo.11388387, Smith et al., 2024a). As they are traceable to IPCC report methods, they can be trusted by all parties involved in UNFCCC negotiations and help convey wider understanding of the latest knowledge of the climate system and its direction of travel.
The indicators show that, for the 2014–2023 decade average, observed warming was 1.19 [1.06 to 1.30] °C, of which 1.19 [1.0 to 1.4] °C was human-induced. For the single-year average, human-induced warming reached 1.31 [1.1 to 1.7] °C in 2023 relative to 1850–1900. The best estimate is below the 2023-observed warming record of 1.43 [1.32 to 1.53] °C, indicating a substantial contribution of internal variability in the 2023 record. Human-induced warming has been increasing at a rate that is unprecedented in the instrumental record, reaching 0.26 [0.2–0.4] °C per decade over 2014–2023. This high rate of warming is caused by a combination of net greenhouse gas emissions being at a persistent high of 53±5.4 Gt CO2e yr−1 over the last decade, as well as reductions in the strength of aerosol cooling. Despite this, there is evidence that the rate of increase in CO2 emissions over the last decade has slowed compared to the 2000s, and depending on societal choices, a continued series of these annual updates over the critical 2020s decade could track a change of direction for some of the indicators presented here.
-
Please read the editorial note first before accessing the article.
-
Article
(6203 KB)
- Version 2022
- Version 2024
-
Supplement
(2150 KB)
-
Please read the editorial note first before accessing the article.
- Article
(6203 KB) - Full-text XML
- Version 2022
- Version 2024
-
Supplement
(2150 KB) - BibTeX
- EndNote


The IPCC Sixth Assessment Report (AR6) provided an assessment of human influence on key indicators of the state of climate grounded in data up to the year 2019 (IPCC, 2021a, Supplement Sect. S1). The next IPCC assessment report, AR7, is due towards the end of the decade. Given the speed of recent change, and the need for updated climate knowledge to inform evidence-based decision-making, the Indicators of Global Climate Change (IGCC) was initiated to provide policymakers with annual updates of the latest scientific understanding on the state of selected critical indicators of the climate system and of human influence.
This second annual update follows broadly the format of last year (Forster et al., 2023), focussing on indicators related to heating of the climate system, building from greenhouse gas emissions towards estimates of human-induced warming and the remaining carbon budget. Figure 1 presents an overview of the aspects assessed and their interlinkages from cause (emissions) through effect (changes in physical indicators) to climatic impact drivers. It also provides a visual roadmap as to the structure of remaining sections in this paper to guide the reader.
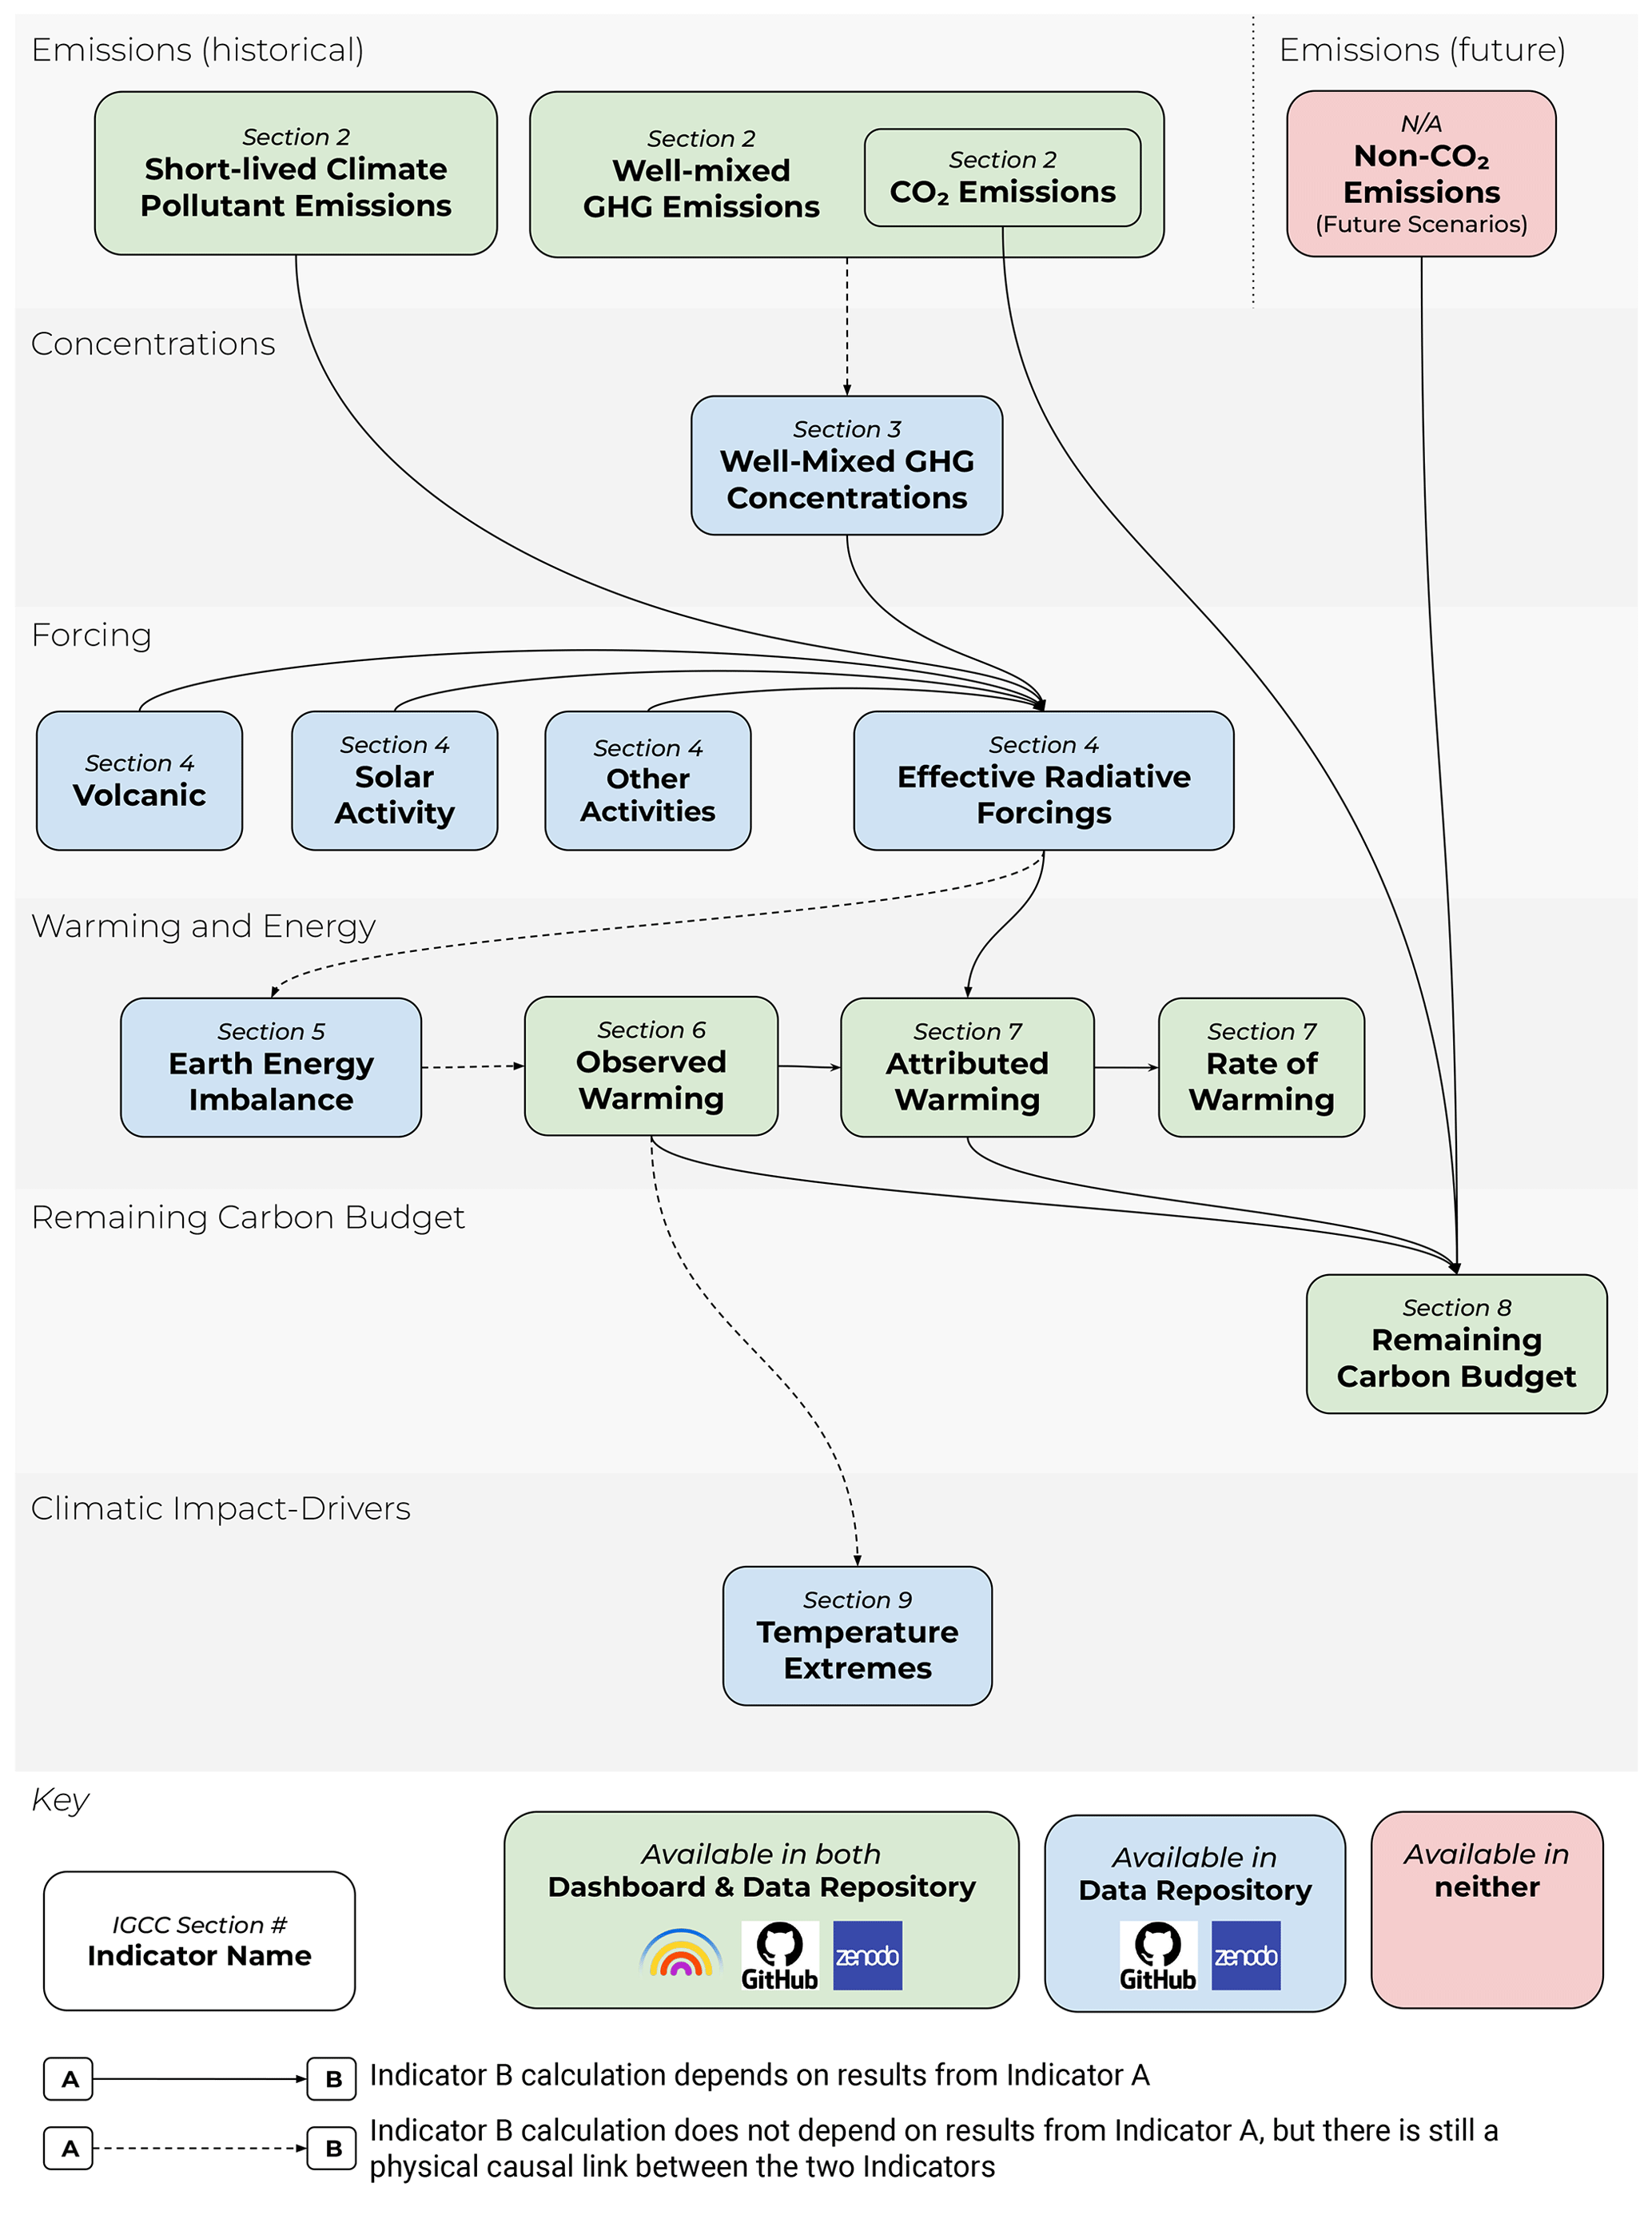
Figure 1The flow chart of data production from emissions to human-induced warming and the remaining carbon budget, illustrating both the rationale and workflow within the paper production.
The update is based on methodologies assessed by the IPCC Sixth Assessment Report (AR6) of the physical science basis of climate change (Working Group One (WGI) report; IPCC, 2021a) as well as Chap. 2 of the WGIII report (Dhakal et al., 2022) and is aligned with the efforts initiated in AR6 to implement FAIR (Findable, Accessible, Interoperable, Reusable) principles for reproducibility and reusability (Pirani et al., 2022; Iturbide et al., 2022). IPCC reports make a much wider assessment of the science and methodologies – we do not attempt to reproduce the comprehensive nature of these IPCC assessments here. As such, we do not consider adopting fundamentally different approaches to AR6. Rather, our aim is to rigorously track both climate system change and evolving methodological improvements between IPCC report cycles, thereby achieving transparency and consistency in between successive reports.
The update is organised as follows: emissions (Sect. 2) and greenhouse gas (GHG) concentrations (Sect. 3) are used to develop updated estimates of effective radiative forcing (Sect. 4). Earth's energy imbalance (Sect. 5) and observations of global surface temperature change (Sect. 6) are key global indicators of a warming world. The contributions to global surface temperature change from human and natural influences are formally attributed in Sect. 7, which tracks the level and rate of human-induced warming. Section 8 updates the remaining carbon budget to policy-relevant temperature thresholds. Section 9 gives an example of global-scale indicators associated with climate extremes of maximum land surface temperatures. An important purpose of the exercise is to make these indicators widely available and understood. Code and data availability is given in Sect. 10, and conclusions are presented in Sect. 11. Data are available at https://doi.org/10.5281/zenodo.11388387 (Smith et al., 2024a).
Historic emissions from human activity were assessed in both AR6 WGI and WGIII. Chapter 5 of WGI assessed CO2 and CH4 emissions in the context of the carbon cycle (Canadell et al., 2021). Chapter 6 of WGI assessed emissions in the context of understanding the climate and air quality impacts of short-lived climate forcers (Szopa et al., 2021). Chapter 2 of WGIII, published 1 year later (Dhakal et al., 2022), assessed the sectoral sources of emissions and gave the most up-to-date understanding of the current level of emissions. This section bases its methods and data on those employed in this WGIII chapter.
2.1 Methods of estimating greenhouse gas emissions changes
Like in AR6 WGIII, net GHG emissions in this paper refer to releases of GHGs from anthropogenic sources minus removals by anthropogenic sinks, for greenhouse gases reported under the common reporting format of the UNFCCC. This includes CO2 emissions from fossil fuels and industry (CO2-FFI); net CO2 emissions from land use, land-use change and forestry (CO2-LULUCF); CH4; N2O; and fluorinated gas (F-gas) emissions. CO2-FFI mainly comprises fossil-fuel combustion emissions, as well as emissions from industrial processes such as cement production. This excludes biomass and biofuel use. CO2-LULUCF is mainly driven by deforestation but also includes anthropogenic removals on land from afforestation and reforestation, emissions from logging and forest degradation, and emissions and removals in shifting cultivation cycles, as well as emissions and removals from other land-use change and land management activities, including peat burning and drainage. The non-CO2 GHGs – CH4, N2O and F-gas emissions – are linked to the fossil-fuel extraction, agriculture, industry and waste sectors.
Global regulatory conventions have led to a twofold categorisation of F-gas emissions (also known as halogenated gases). Under UNFCCC accounting, countries record emissions of hydrofluorocarbons (HFCs), perfluorocarbons (PFCs), sulfur hexafluoride (SF6) and nitrogen trifluoride (NF3) – hereinafter “UNFCCC F-gases”. However, national inventories tend to exclude halons, chlorofluorocarbons (CFCs) and hydrochlorofluorocarbons (HCFCs) – hereinafter “ODS (ozone-depleting substance) F-gases” – as they have been initially regulated under the Montreal Protocol and its amendments. In line with the WGIII assessment, ODS F-gases and other substances are not included in our GHG emissions reporting but are included in subsequent assessments of concentration change (including compounds formed in the atmosphere as ozone), effective radiative forcing, human-induced warming, carbon budgets and climate impacts in line with the WGI assessment.
There are also varying conventions used to quantify CO2-LULUCF fluxes. These include the use of bookkeeping models, dynamic global vegetation models (DGVMs) and aggregated national inventory reporting (Pongratz et al., 2021). Each differs in terms of their applied system boundaries and definitions, and they are not directly comparable. However, efforts to “translate” between bookkeeping estimates and national inventories using DGVMs have demonstrated a degree of consistency between the varying approaches (Friedlingstein et al., 2022; Grassi et al., 2023).
Each category of GHG emissions included here is covered by varying primary sources and datasets. Although many datasets cover individual categories, few extend across multiple categories, and only a minority have frequent and timely update schedules. The Global Carbon Budget (GCB; Friedlingstein et al., 2023) covers CO2-FFI and CO2-LULUCF. The Emissions Database for Global Atmospheric Research (EDGAR; Crippa et al., 2023) and the Potsdam Real-time Integrated Model for probabilistic Assessment of emissions Paths (PRIMAP-hist; Gütschow et al., 2016, 2024) cover CO2-FFI, CH4, N2O and UNFCCC F-gases. The Community Emissions Data System (CEDS; Hoesly et al., 2018; Hoesly and Smith, 2024) covers CO2-FFI, CH4 and N2O. The Global Fire Emissions Database (GFED; van der Werf et al., 2017) version 4.1s covers CO2, CH4 and N2O. As detailed below, for various reasons, not all these datasets were employed in this update.
In AR6 WGIII, total net GHG emissions were calculated as the sum of CO2-FFI, CH4, N2O and UNFCCC F-gases from EDGAR and net CO2-LULUCF emissions from the GCB. Net CO2-LULUCF emissions followed the GCB convention and were derived from the average of three bookkeeping models (Hansis et al., 2015; Houghton and Nassikas, 2017; Gasser et al., 2020). Version 6 of EDGAR was used (with a fast-track methodology applied for the final year of data – 2019), alongside the 2020 version of the GCB (Friedlingstein et al., 2020). CO2-equivalent (CO2e) emissions were calculated using global warming potentials with a 100-year time horizon (GWP100 henceforth) from AR6 WGI Chap. 7 (Forster et al., 2021). Uncertainty ranges were based on a comparative assessment of available data and expert judgement, corresponding to a 90 % confidence interval (Minx et al., 2021): ±8 % for CO2-FFI, ±70 % for CO2-LULUCF, ±30 % for CH4 and F-gases, and ±60 % for N2O (note that the GCB assesses 1 standard deviation uncertainty for CO2-FFI as ±5 % and for CO2-LULUCF as ±2.6 Gt CO2; Friedlingstein et al., 2022). The total uncertainty was summed in quadrature, assuming independence of estimates per species/source. Reflecting these uncertainties, AR6 WGIII reported emissions to two significant figures only. Uncertainties in GWP100 metrics of roughly ±10 % were not applied (Minx et al., 2021).
This analysis tracks the same compilation of GHGs as in AR6 WGIII. We follow the same approach for estimating uncertainties and CO2e emissions. We also use the same type of data sources but make important changes to the specific selection of data sources to further improve the quality of the data, as suggested in the knowledge gap discussion of the WGIII report (Dhakal et al., 2022). Instead of using EDGAR data (which are now available as version 8), we use GCB data for CO2-FFI, PRIMAP-hist CR (country-reported) data for CH4 and N2O, and atmospheric concentrations with best-estimate lifetimes for UNFCCC F-gas emissions (Hodnebrog et al., 2020). As in AR6 WGIII we use GCB for net CO2-LULUCF emissions, taking the average of three bookkeeping models (BLUE by Hansis et al., 2015; H&C by Houghton and Castanho, 2023; OSCAR by Gasser et al., 2020). The GCB methodology includes CO2 emissions from deforestation and forest degradation fires but excludes wildfires, which are assumed to be natural even if climate change affects their intensity and frequency. Bunker emissions are included but military emissions excluded (e.g. Bun et al., 2024). For more completeness, this year we also include estimates of N2O and CH4 emissions from global biomass fires, sourced from GFED4.1s.
There are three reasons for these specific data choices. First, national greenhouse gas emissions inventories tend to use improved, higher-tier methods for estimating emissions fluxes than global inventories such as EDGAR (Dhakal et al., 2022; Minx et al., 2021). As GCB and PRIMAP-hist CR integrate the most recent national inventory submissions to the UNFCCC, selecting these databases makes best use of country-level improvements in data-gathering infrastructures. It is important to acknowledge, however, that national inventories differ substantially with respect to reporting intervals, applied methodologies and emissions factors (Minx et al., 2021). Notably, the PRIMAP-hist CR dataset has significantly lower total CH4 emissions relative to both the other datasets reported here and the global atmospheric inversion estimates evaluated in this paper. A substantive body of literature has evaluated national-level CH4 inversions versus inventories, finding a tendency for the former to exceed the latter (Deng et al., 2022; Tibrewal et al., 2024; Janardanan et al., 2024; Scarpelli et al., 2022). Compared to the median of reported inversion models from Deng et al. (2022), PRIMAP-Hist CR reports lower CH4 emissions for India, the EU27 + UK, Brazil, Russia and Indonesia but not in the case of China and the United States (see Fig. S1).
Second, comprehensive reporting of F-gas emissions has remained challenging in national inventories and may exclude some military applications (see Minx et al., 2021; Dhakal et al., 2022). However, F-gases are entirely anthropogenic substances, and their concentrations can be measured effectively and reliably in the atmosphere. We therefore follow the AR6 WGI approach in making use of direct atmospheric observations.
Third, the choice of GCB data for CO2-FFI means we can integrate its projection of that year's CO2 emissions at the time of publication (i.e. for 2023). No other dataset except GCB provides projections of CO2 emissions in this time frame. At this point in the publication cycle (mid-year), the other chosen sources provide data points with a 2-year time lag (i.e. for 2022). While these data choices inform our overall assessment of GHG emissions, we provide a comparison across datasets for each emissions category, as well as between our estimates and an estimate derived from AR6 WGIII-like databases (i.e. EDGAR for CO2-FFI and non-CO2 GHG emissions and GCB for CO2-LULUCF).
2.2 Updated greenhouse gas emissions
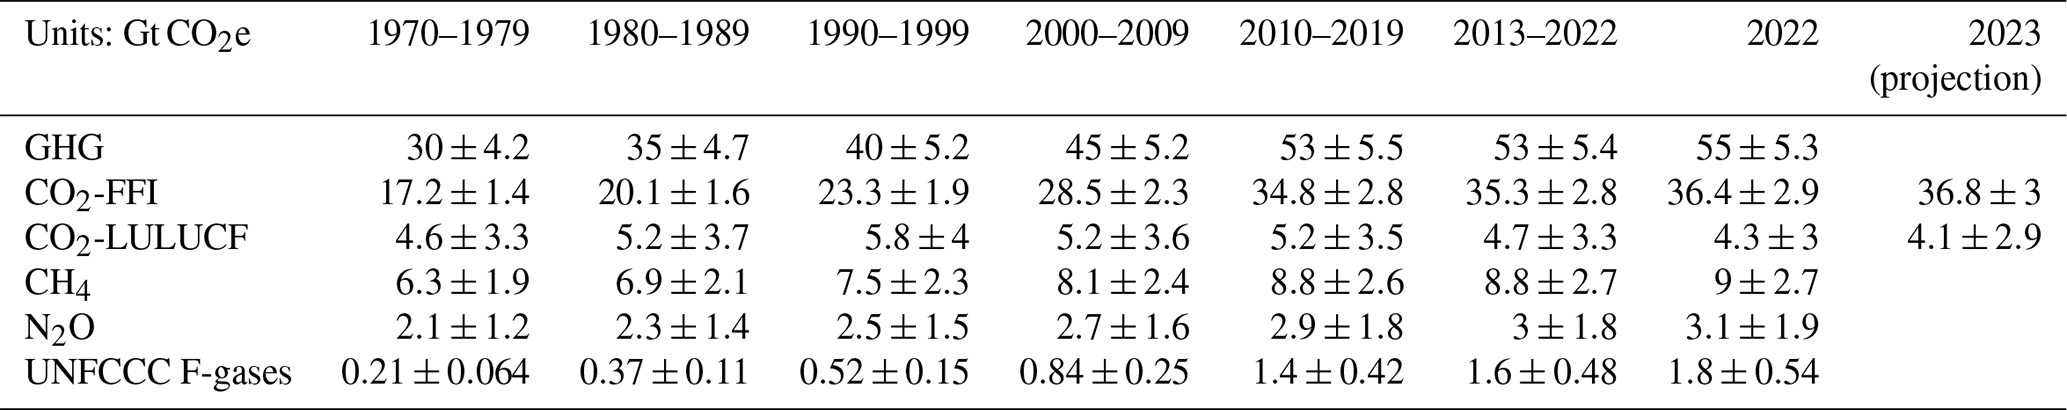
Updated GHG emission estimates are presented in Fig. 2 and Table 1. Total global GHG emissions were 55±5.3 Gt CO2e in 2022, the same as previous high levels in 2019 and 2021. Of this total, CO2-FFI contributed 36.4±2.9 Gt CO2, CO2-LULUCF contributed 4.3±3 Gt CO2, CH4 contributed 9±2.7 Gt CO2e, N2O contributed 3.1±1.9 Gt CO2e and F-gas emissions contributed 1.8±0.54 Gt CO2e. Initial projections indicate that total CO2 emissions remained similar in 2023, with emissions from fossil fuel and industry at 36.8±3 and from land-use change at 4.1±2.9 Gt CO2 (Friedlingstein et al., 2023; see also Liu et al., 2024; IEA, 2023). Note that ODS F-gases such as chlorofluorocarbons and hydrochlorofluorocarbons are excluded from national GHG emissions inventories. For consistency with AR6, they are also excluded here. Including them here would increase total global GHG emissions by 1.5 Gt CO2e in 2022.
Average annual GHG emissions for the decade 2013–2022 were 53±5.4 Gt CO2e, which is the same as the estimate from last year for 2012–2021. Average decadal GHG emissions have increased steadily since the 1970s across all major groups of GHGs, driven primarily by increasing CO2 emissions from fossil fuel and industry but also rising emissions of CH4 and N2O. Stratospheric ozone-depleting F-gases are regulated under the Montreal Protocol and its amendments, and their emissions have declined substantially since the 1990s, whereas emissions of other F-gases, regulated under the UNFCCC, have grown more rapidly than other greenhouse gas emissions but from low levels. Both the magnitude and trend of CO2 emissions from land-use change remain highly uncertain, with the latest data indicating an average net flux between 4 and 5 Gt CO2 yr−1 for the past few decades.
AR6 WGIII reported total net anthropogenic emissions of 59±6.6 Gt CO2e in 2019 and decadal average annual emissions of 56±6.0 Gt CO2e from 2010–2019. By comparison, our estimates here for the AR6 period sum to 55±5.5 Gt CO2e in 2019 and an annual average of 53±5.5 Gt CO2e for the same decade (2010–2019). The difference between these figures, including the reduced relative uncertainty range, is partly driven by the substantial revision in GCB CO2-LULUCF estimates between the 2020 version (used in AR6 WGIII) of 6.6 Gt CO2 and the 2022 version (used here) of 4.6 Gt CO2. The main reason for this downward revision comes from updated estimates of agricultural areas by the FAO, which uses multi-annual land-cover maps from satellite remote sensing, leading to lower emissions from cropland expansion, particularly in the tropical regions. It is important to note that this change is not a reflection of changed and improved methodology per se but an update of the resulting estimation due to updates in the available input data. Second, there are relatively small changes resulting from improvements in datasets since AR6, including the new addition of global biomass burning (landscape fire) emissions. Dataset impacts are largest for CH4, where the emission estimate had reduced by 1.6 Gt CO2e in 2019. This is related to the switch from EDGAR in AR6 to PRIMAP-hist CR in this study. EDGAR estimates considerably higher CH4 emissions – from fugitive fossil sources, as well as the livestock, rice cultivation and waste sectors – compared to country-reported data using higher-tier methods, as compiled in PRIMAP-hist CR (see Sect. 2.1). The estimate for CO2-FFI is also 1.6 Gt CO2e lower for 2019 in this study due to the switch from EDGAR to GCB, as the latter includes a cement carbonation sink not considered in EDGAR. Differences in the remaining gases for 2019 are relatively small in magnitude (increases in N2O (+0.42 Gt CO2e) and UNFCCC-F-gases (+0.35 Gt CO2e)).
The fossil-fuel share of global greenhouse gas emissions was approximately 70 % in 2022 (GWP100-weighted), based on the EDGAR v8 dataset (Crippa et al., 2023) and net land-use CO2 emissions from the Global Carbon Budget (Friedlingstein et al., 2023). Non-fossil-fuel emissions are mostly from land-use change, agriculture, cement production, waste and F-gas emissions.
New literature not available at the time of the AR6 suggests that increases in atmospheric CH4 concentrations are also driven by methane emissions from wetland changes resulting from climate change (e.g. Basu et al., 2022; Peng et al., 2022; Nisbet et al., 2023; Zhang et al., 2023). There is also a possible effect from CO2 fertilisation (Feron et al., 2024; Hu et al., 2023). Such carbon cycle feedbacks are not considered here as they are not a direct emission from human activity, yet they will contribute to greenhouse gas concentration rise, forcing and energy budget changes discussed in the next sections. They will become more important to properly account for in future years.
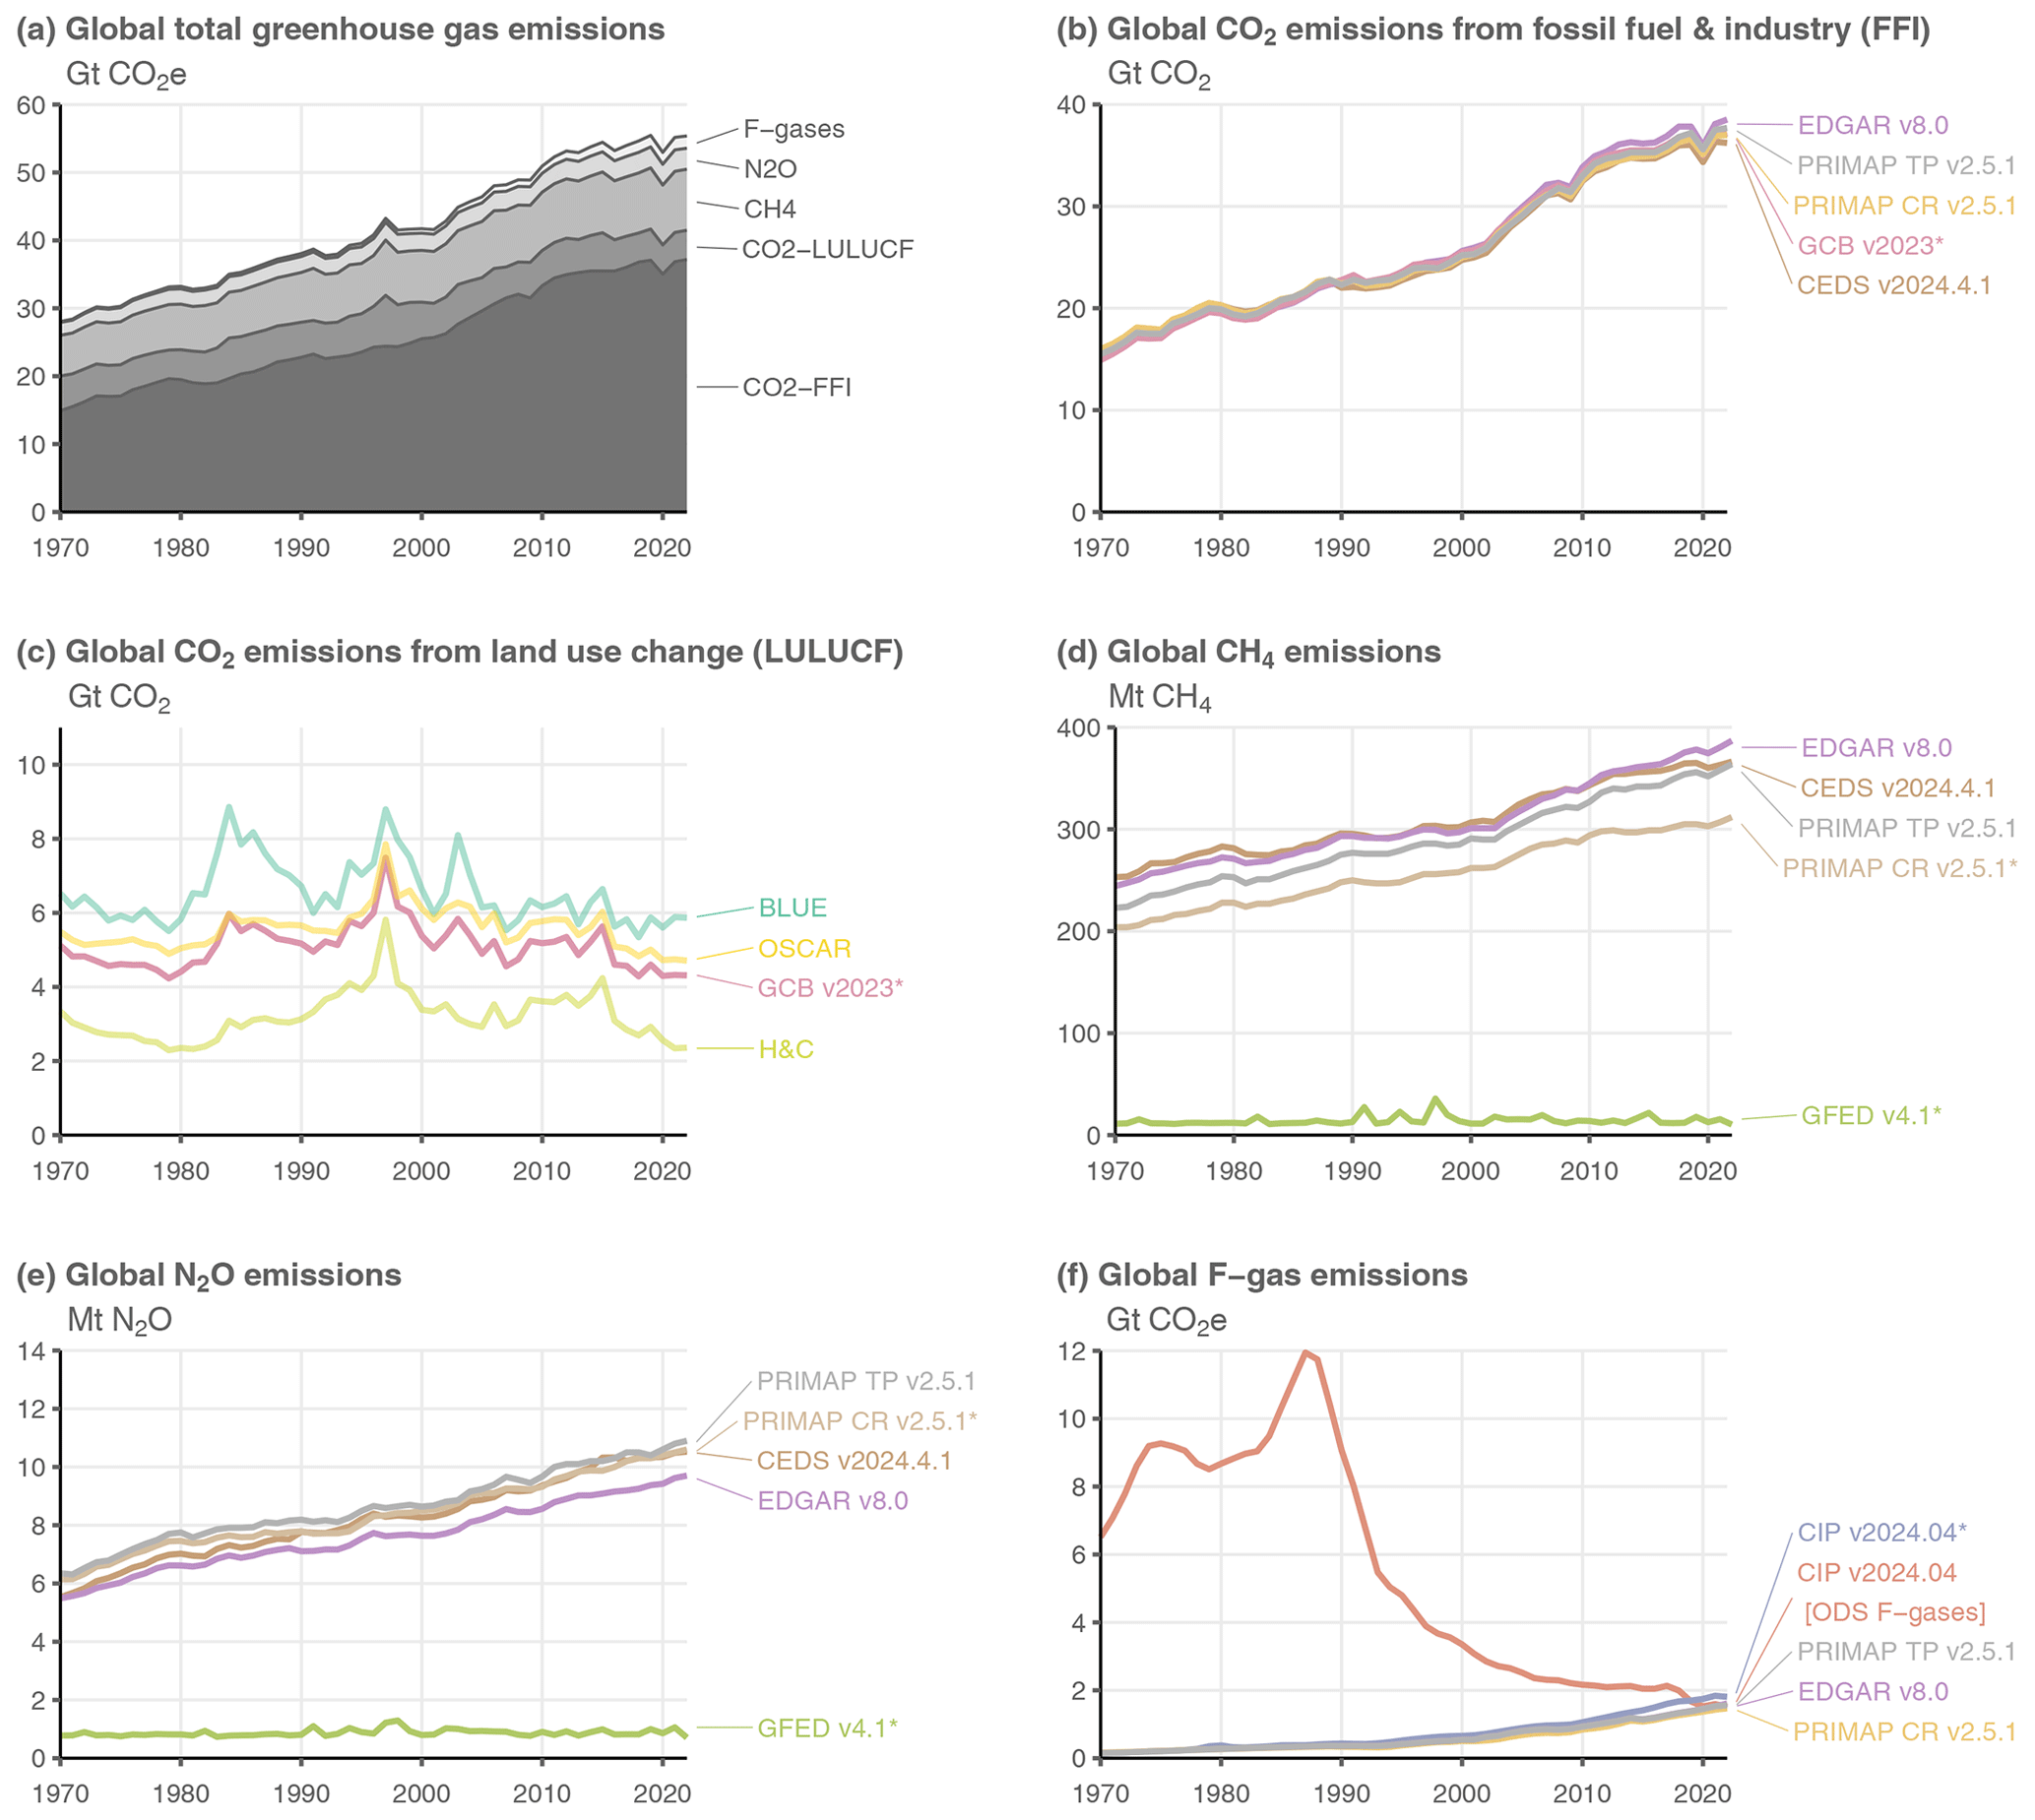
Figure 2Annual global anthropogenic greenhouse gas emissions by source, 1970–2022. Refer to Sect. 2.1 for a list of datasets. Datasets with an asterisk (*) indicate the sources used to compile global total greenhouse gas emissions in (a). CO2e emissions in (a) and (f) are calculated using GWP100 from the AR6 WGI, Chap. 7 (Forster et al., 2021). F-gas emissions in (a) only comprise UNFCCC F-gas emissions (see Sect. 2.1 for a list of species). F-gas emissions in (f) refer to UNFCCC F-gases, except for “CIP v2024.04 [ODS F-gases]”. GFED refers to CH4 and N2O emissions from global biomass fires only. The GCB v2023 dataset in (b) includes the cement carbonation sink and so is slightly lower than other estimates.
Table 1Global anthropogenic greenhouse gas emissions by source and decade. All numbers refer to decadal averages, except for annual estimates in 2022 and 2023. CO2e emissions are calculated using GWP100 from AR6 WGI Chap. 7 (Forster et al., 2021). Projections of non-CO2 GHG emissions in 2023 remain unavailable at the time of publication. Uncertainties are ±8 % for CO2-FFI, ±70 % for CO2-LULUCF, ±30 % for CH4 and F-gases, and ±60 % for N2O, corresponding to a 90 % confidence interval. ODS F-gases are excluded, as noted in Sect. 2.1. CO2-FFI includes the cement carbonation sink calculated in Friedlingstein et al. (2023).
2.3 Non-methane short-lived climate forcers
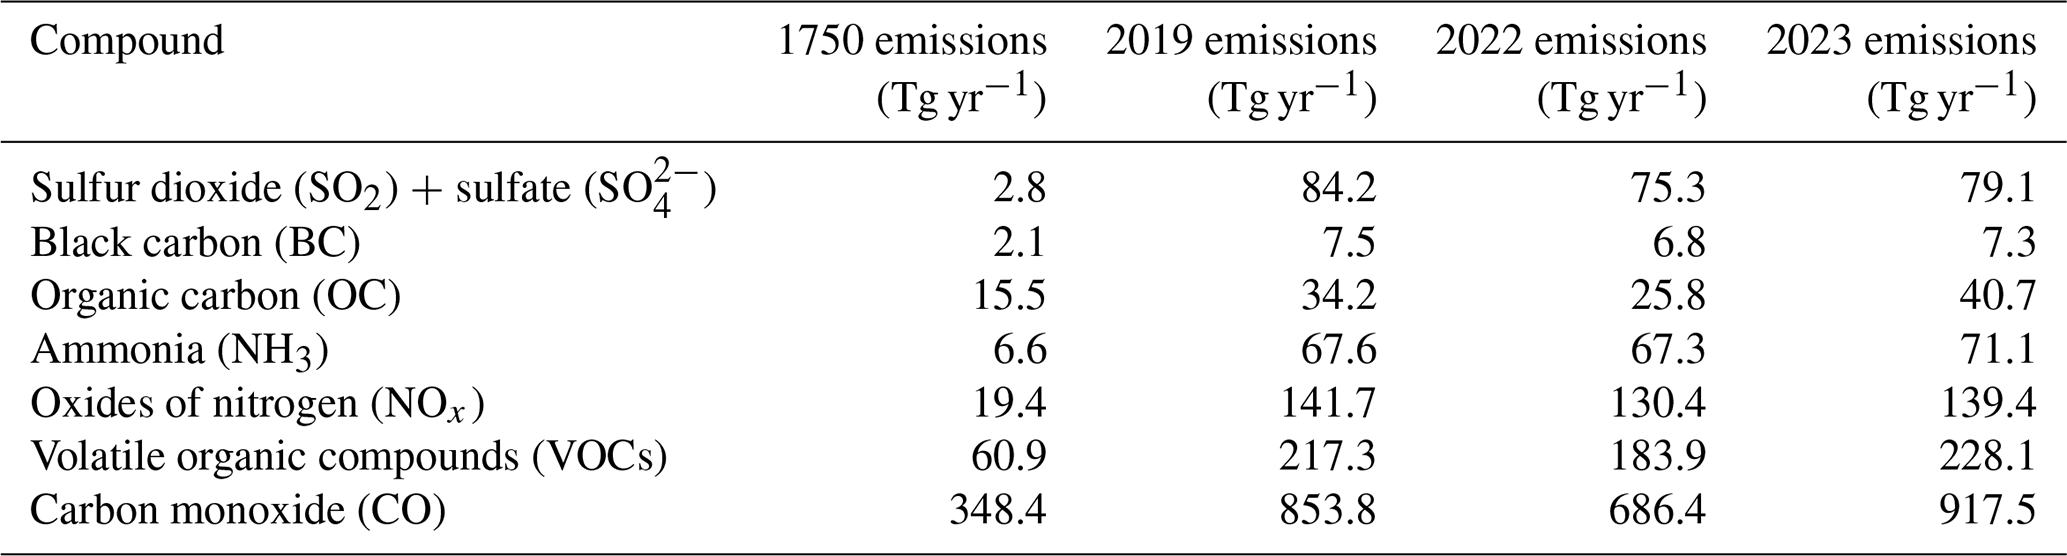
In addition to GHG emissions, we provide an update of anthropogenic emissions of non-methane short-lived climate forcers (SLCFs) (SO2, black carbon (BC), organic carbon (OC), NOx, volatile organic compounds (VOCs), CO and NH3). Data are presented in Table 2. HFCs are considered in Sect. 2.2.
Sectoral emissions of SLCFs are derived from two sources. For fossil fuel, industrial, waste and agricultural sectors, we use the CEDS dataset. CEDS provides global emissions totals from 1750 to 2022 in its most recent version (v_2024_04_01) (Hoesly et al., 2018; Hoesly and Smith, 2024). No CEDS emissions data are currently available for 2023. The estimate for 2023 was derived by assuming a scaled return to an underlying SSP2-4.5 emissions scenario, used for inputs to COVID-MIP (Forster et al., 2020; Lamboll et al., 2021). We find that the 2020-2022 emissions trends comparing CEDS and the COVID-MIP extrapolation are not substantially different (Fig. S2), so the COVID-MIP extension to 2023 is justifiable. In Forster et al. (2023), the CEDS dataset was only available to 2019, so the COVID-MIP extension was used to 2022. Therefore, emissions from 2020 have been revised in this year's paper with 2020–2022 data now arising from CEDS.
Overall, the net SO2 emissions were similar (within 2 Tg SO2; see Sect. S2) over the 2020–2022 period in the CEDS dataset than our estimate in Forster et al. (2023). The CEDS dataset accounts for the introduction of strict fuel sulfur controls brought in by the International Maritime Organization on 1 January 2020. Total SO2 emissions in 2019 were 84.2 Tg SO2 (Table 2). The SO2 emissions from international shipping declined by 7.4 Tg SO2 from 10.4 Tg SO2 in 2019 to 3.0 Tg SO2 in 2020, which is close to the expected 8.5 Tg SO2 reduction estimated by the International Maritime Organization, approximately −80 % from the 2019 number, accounting for a 3-month phase in period and COVID-19 changes. Non-shipping SO2 emissions were impacted slightly by COVID-19 but had rebounded to levels close to those of 2019 by 2022 in CEDS.
For biomass burning SLCF emissions, we follow AR6 WGIII (Dhakal et al., 2022) and use GFED (van der Werf et al., 2017) version 4 with small fires (GFED4.1s) for 1997 to 2023, with the dataset extended back to 1750 for CMIP6 (van Marle et al., 2017). Estimates from 2017 to 2023 are provisional. As demonstrated with the update to CEDS emissions, the potential for both sources of emissions data to be updated in future versions exists, for example, with a planned introduction of GFED5 in preparation for CMIP7.
Using our combined estimate of GFED and CEDS with a 2023 extrapolation, emissions of all SLCFs were reduced in 2022 relative to 2019 but rebounded again in 2023 (Table 2). The primary driver of the increase in 2023 is an anomalous biomass burning year, mostly related to the unprecedented 2023 Canadian fire season (Barnes et al., 2023), with a smaller contribution from a continued recovery from COVID-19. Under these assumptions, 2023 was a record year for emissions of organic carbon (driven again by a very active biomass burning season) and ammonia (driven by a steady background increase in agricultural sources and a contribution from biomass burning). Causes of the enhanced burning are not distinguished in the GFED data. Whether human-caused burning, a feedback due to the extreme heat or naturally occurring, we choose to include them in our tracking, as historical biomass burning emissions inventories have previously been consistently treated as anthropogenic (for example in CMIP6), though this assumption may need to be revisited in the future. This differs from the treatment of accounting for CO2 and CH4 emissions at present (Sect. 2.2), where we do not include natural emissions in the inventories. As described in Sect. 4, the treatment of all biomass burning emissions as a forcing has implications for several categories of anthropogenic radiative forcing. Trends in SLCF emissions are spatially heterogeneous (Szopa et al., 2021), with strong shifts in the locations of reductions and increases over the 2010–2019 decade (Hodnebrog et al., 2024).
Table 2Emissions of the major SLCFs in 1750, 2019, 2022 and 2023 from a combination of CEDS and GFED. Emissions of SO2+SO4 use SO2 molecular weights. Emissions of NOx use NO2 molecular weights. VOCs are for the total mass.
Uncertainties associated with these emission estimates are difficult to quantify. From the non-biomass-burning sectors they are estimated to be the smallest for SO2 (±14 %), largest for black carbon (BC) (a factor of 2) and intermediate for other species (Smith et al., 2011; Bond et al., 2013; Hoesly et al., 2018). Uncertainties are also likely to increase both backwards in time (Hoesly et al., 2018) and again in the most recent years. The estimates of non-biomass-burning emissions for 2023, especially SO2, are highly uncertain, owing to the use of proxy activity data used with a SSP2-4.5 scenario extension (see above). Future updates of CEDS are expected to include uncertainties (Hoesly et al., 2018). Even though trends over recent years are uncertain, the general decline in some SLCF emissions derived from inventories punctuated by temporary anomalous years with high biomass burning emissions including 2023 is supported by MODIS Terra and Aqua aerosol optical depth measurements (e.g. Quaas et al., 2022; Hodnebrog et al., 2024).
As in Forster et al. (2023), we report best-estimate global mean concentrations for 52 well-mixed greenhouse gases. These concentrations are updated here to 2023.
As in AR6 and Forster et al. (2023), CO2 mixing ratios were taken from the NOAA Global Monitoring Laboratory (GML) and are updated here through 2023 (Lan et al., 2023a). As in Forster et al. (2023), CO2 is reported on the WMO-CO2-X2019 scale, which differs from the WMO-CO2-X2007 scale used in AR6. Prior to the use of NOAA GML data from 1980 onwards, a conversion is applied to the AR6 CO2 time series to take into account the scale change using X2019 = 1.00079 ⋅ X2007 − 0.142 ppm. Other GHG records were compiled from NOAA and AGAGE global networks or extrapolated from literature. Averages of NOAA and AGAGE data were used for N2O, CH4, CFC-11, CFC-12, CFC-113, CCl4, HCFC-22, HFC-134a and HFC-125 (Lan et al., 2023b; Dutton et al., 2024; Prinn et al., 2018), which, along with CO2, account for over 98 % of the ERF from well-mixed greenhouse gases. In cases where no updated information is available, global estimates were extrapolated from Vimont et al. (2022), Western et al. (2023) or other literature and were scaled to be consistent with those reported in AR6. Some extrapolations are based on data from the mid-2010s (Droste et al., 2020; Laube et al., 2014; Simmonds et al., 2017; Vollmer et al., 2018) but have an imperceptible effect on the total ERF assessed in Sect. 4 and are included to maintain consistency with AR6. Mixing ratio uncertainties for 2023 are assumed to be similar to 2019, and we adopt the same uncertainties as assessed in AR6 WGI.
The global surface mean concentrations of CO2, CH4 and N2O in 2023 were 419.3 [±0.4] parts per million (ppm), 1922.5 [±3.3] parts per billion (ppb) and 336.9 [±0.4] ppb, respectively. Concentrations of all three major GHGs have increased since 2019, with CO2 increasing by 9.2 ppm, CH4 by 56 ppb and N2O by 4.8 ppb. Increases since 2019 are consistent with those from the CSIRO network (Francey at al., 1999), which are 9.3 ppm, 55 ppb and 5.0 ppb for CO2, CH4 and N2O, respectively. With few exceptions, concentrations of ozone-depleting substances, such as CFC-11 and CFC-12, continue to decline, while those of replacement compounds (HFCs) have increased. HFC-134a, for example, has increased 20 % since 2019 to 129.5 parts per trillion (ppt). Aggregated across all gases, PFCs increased from 109.7 to an estimated 115 ppt CF4-equivalent from 2019 to 2023, and HFCs increased from 237 to 301 ppt HFC-134a-equivalent, while Montreal gases declined from 1032 to 1004 ppt CFC-12-equivalent. Mixing ratio equivalents are determined by the radiative efficiencies of each greenhouse gas from Hodnebrog et al. (2020).
Ozone is an important greenhouse gas with strong regional variation in both the stratosphere and troposphere (Szopa et al., 2021). Its ERF arising from its regional distribution is assessed in Sect. 4, but following AR6 convention is not included with the GHGs discussed here. Other non-methane SLCFs are heterogeneously distributed in the atmosphere and are also not typically reported in terms of a globally averaged concentration. Globally averaged concentrations for these are normally model-derived, supplemented by local monitoring networks and satellite data (Szopa et al., 2021).
In this update we employ AR6-derived uncertainty estimates and do not perform a new assessment. Table S2 in Sect. S3 shows specific updated concentrations for all the GHGs considered.
ERFs were principally assessed in Chap. 7 of AR6 WGI (Forster et al., 2021), which focussed on assessing ERF from changes in atmospheric concentrations; it also supported estimates of ERF in Chap. 6 that attributed forcing to specific precursor emissions (Szopa et al., 2021) and also generated the time history of ERF shown in AR6 WGI Fig. 2.10 and discussed in Chap. 2 (Gulev et al., 2021). Only the concentration-based estimates are updated herein.
The ERF calculation follows the methodology used in AR6 WGI (Smith et al., 2021) as updated by Forster et al. (2023). For each category of forcing, a 100 000-member probabilistic Monte Carlo ensemble is sampled to span the assessed uncertainty range in each forcing. All uncertainties are reported as 5 %–95 % ranges and provided in square brackets. The methods are all detailed in Sect. S4.
The summary results for the anthropogenic constituents of ERF and solar irradiance in 2023 relative to 1750 are shown in Fig. 3a. In Table 3 these are summarised alongside the equivalent ERFs from AR6 (1750–2019) and last year's update of climate indicators (1750–2022). Figure 3b shows the time evolution of ERF from 1750 to 2023.
Table 3Contributions to anthropogenic effective radiative forcing (ERF) for 1750–2023 assessed in this section. Data are for single-year estimates unless specified. All values are in watts per square metre (W m−2), and 5 %–95 % ranges are in square brackets. As a comparison, the equivalent assessments from AR6 (1750–2019) and last year's climate indicators (1750–2022) are shown. Solar ERF is included and unchanged from AR6, based on the most recent solar cycle (2009–2019), thus differing from the single-year estimate in Fig. 3a. Volcanic ERF is excluded due to the sporadic nature of eruptions.
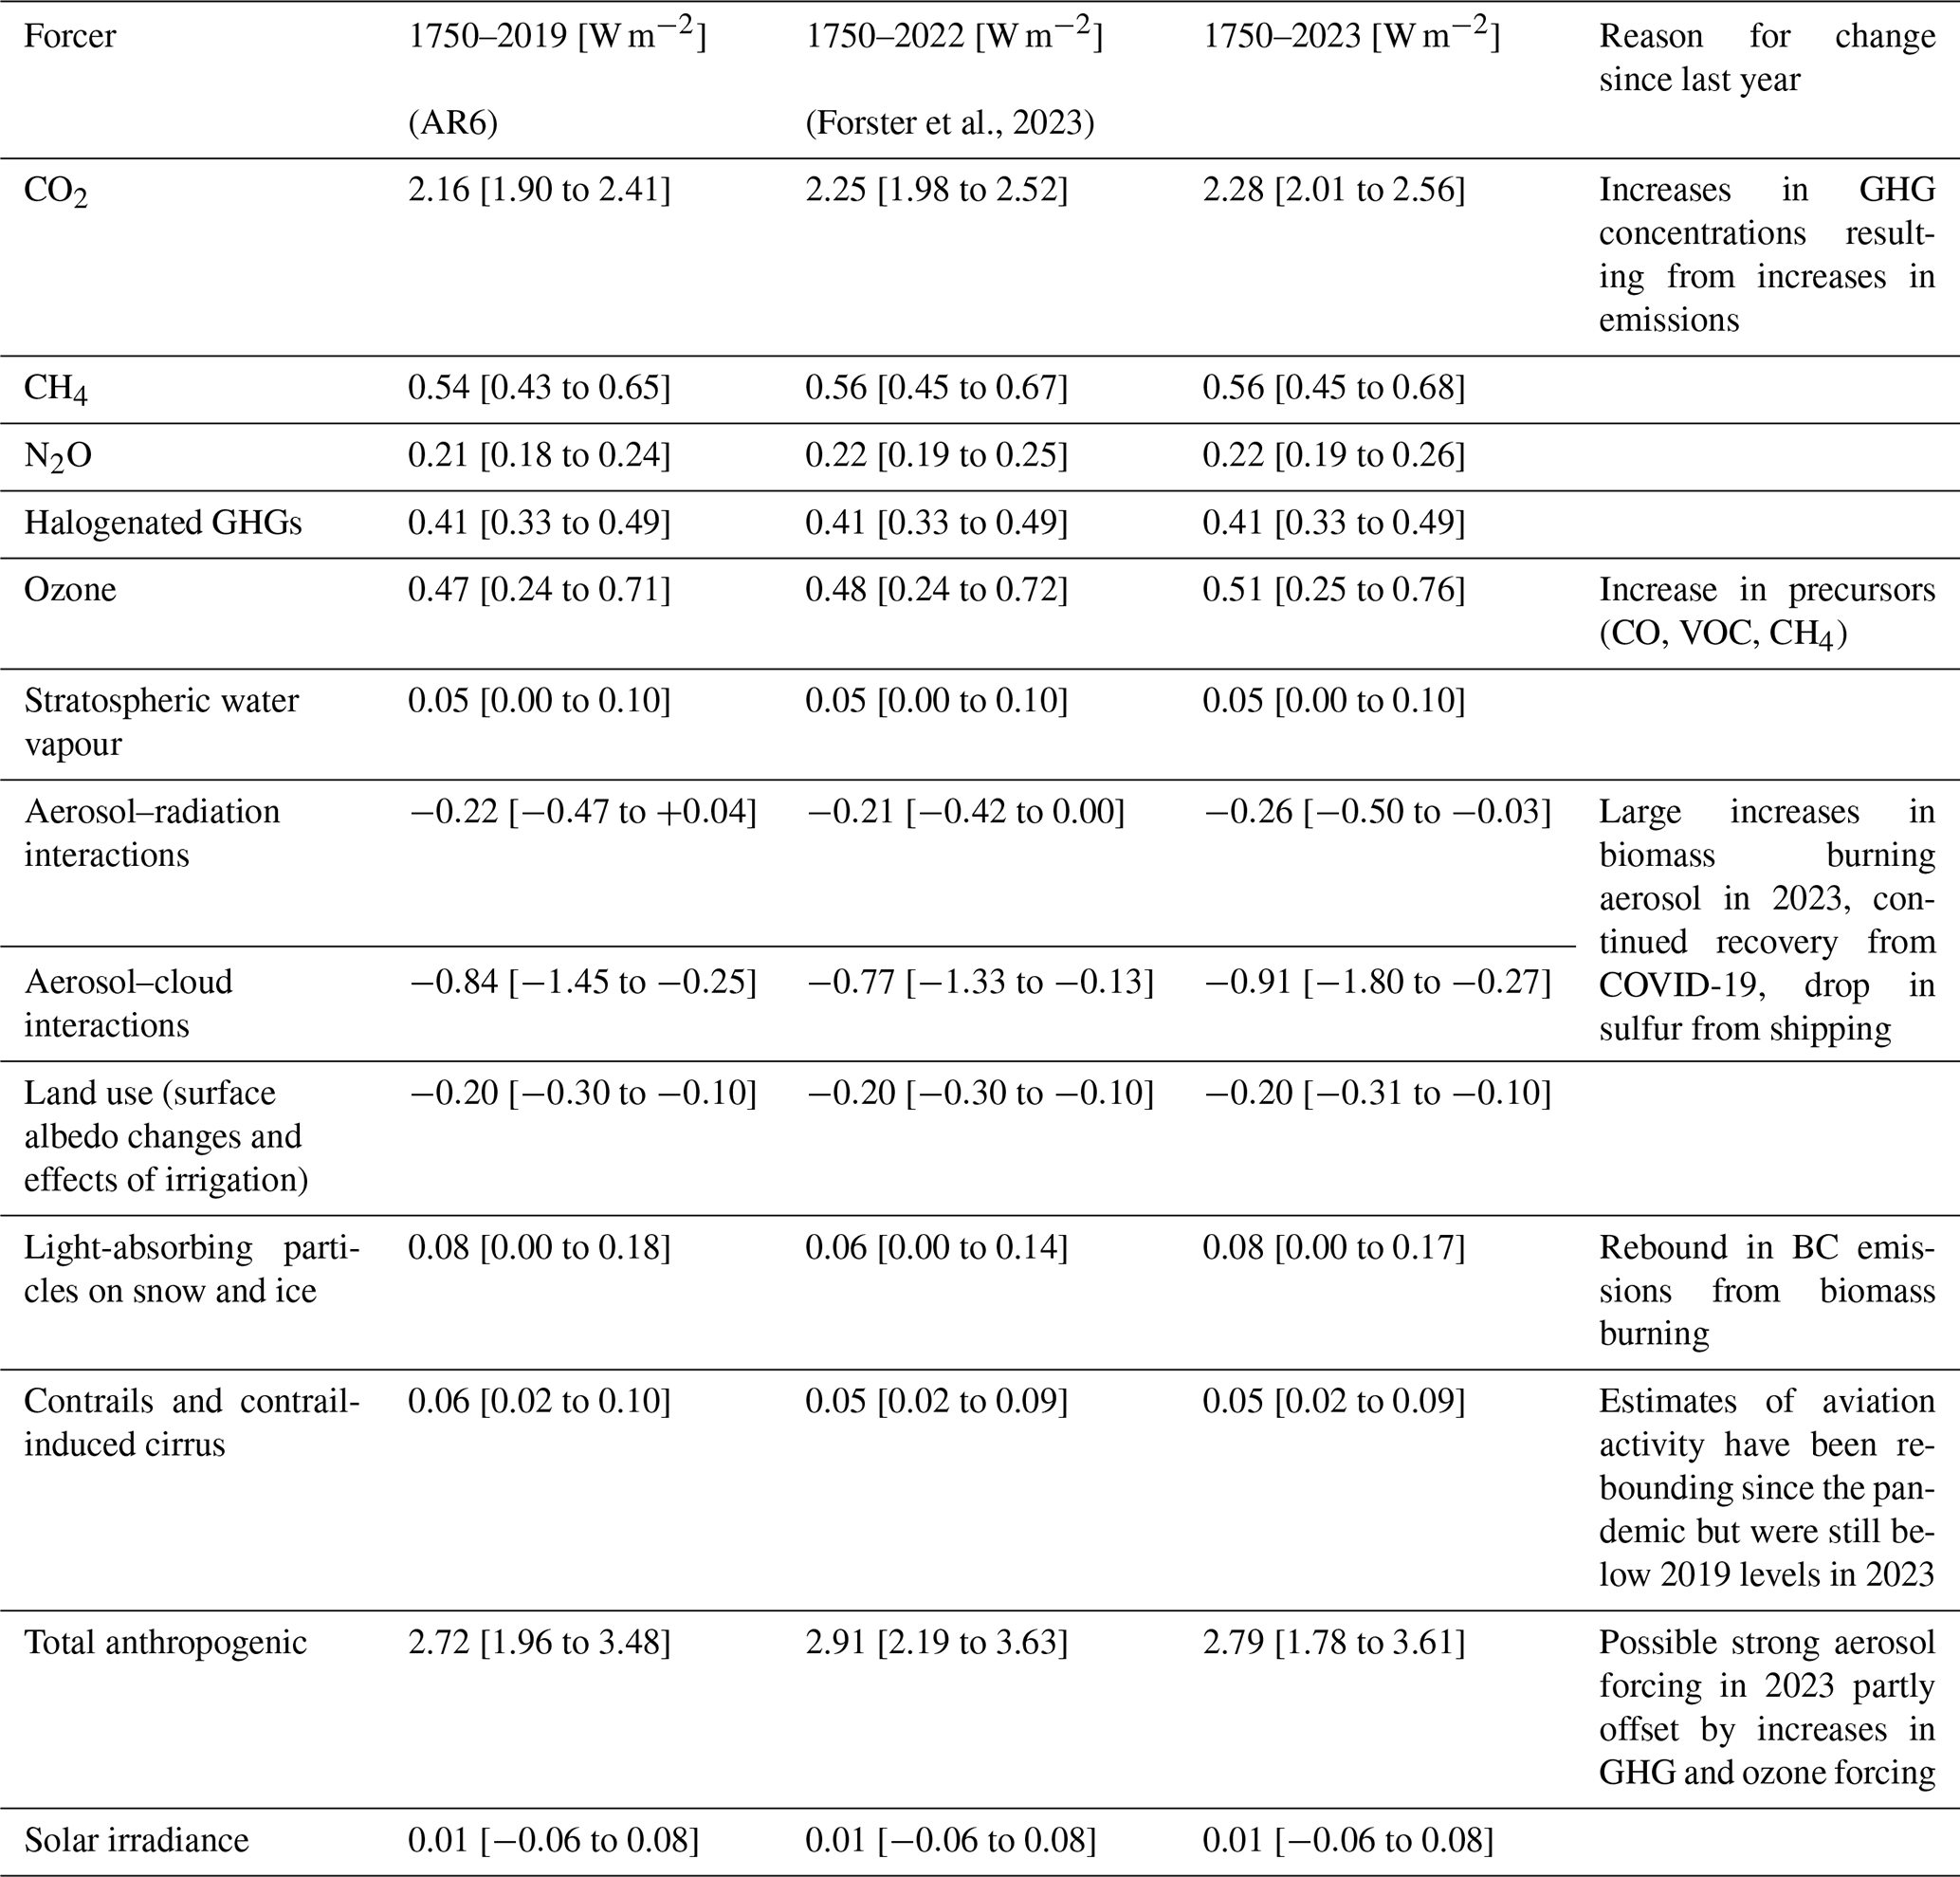
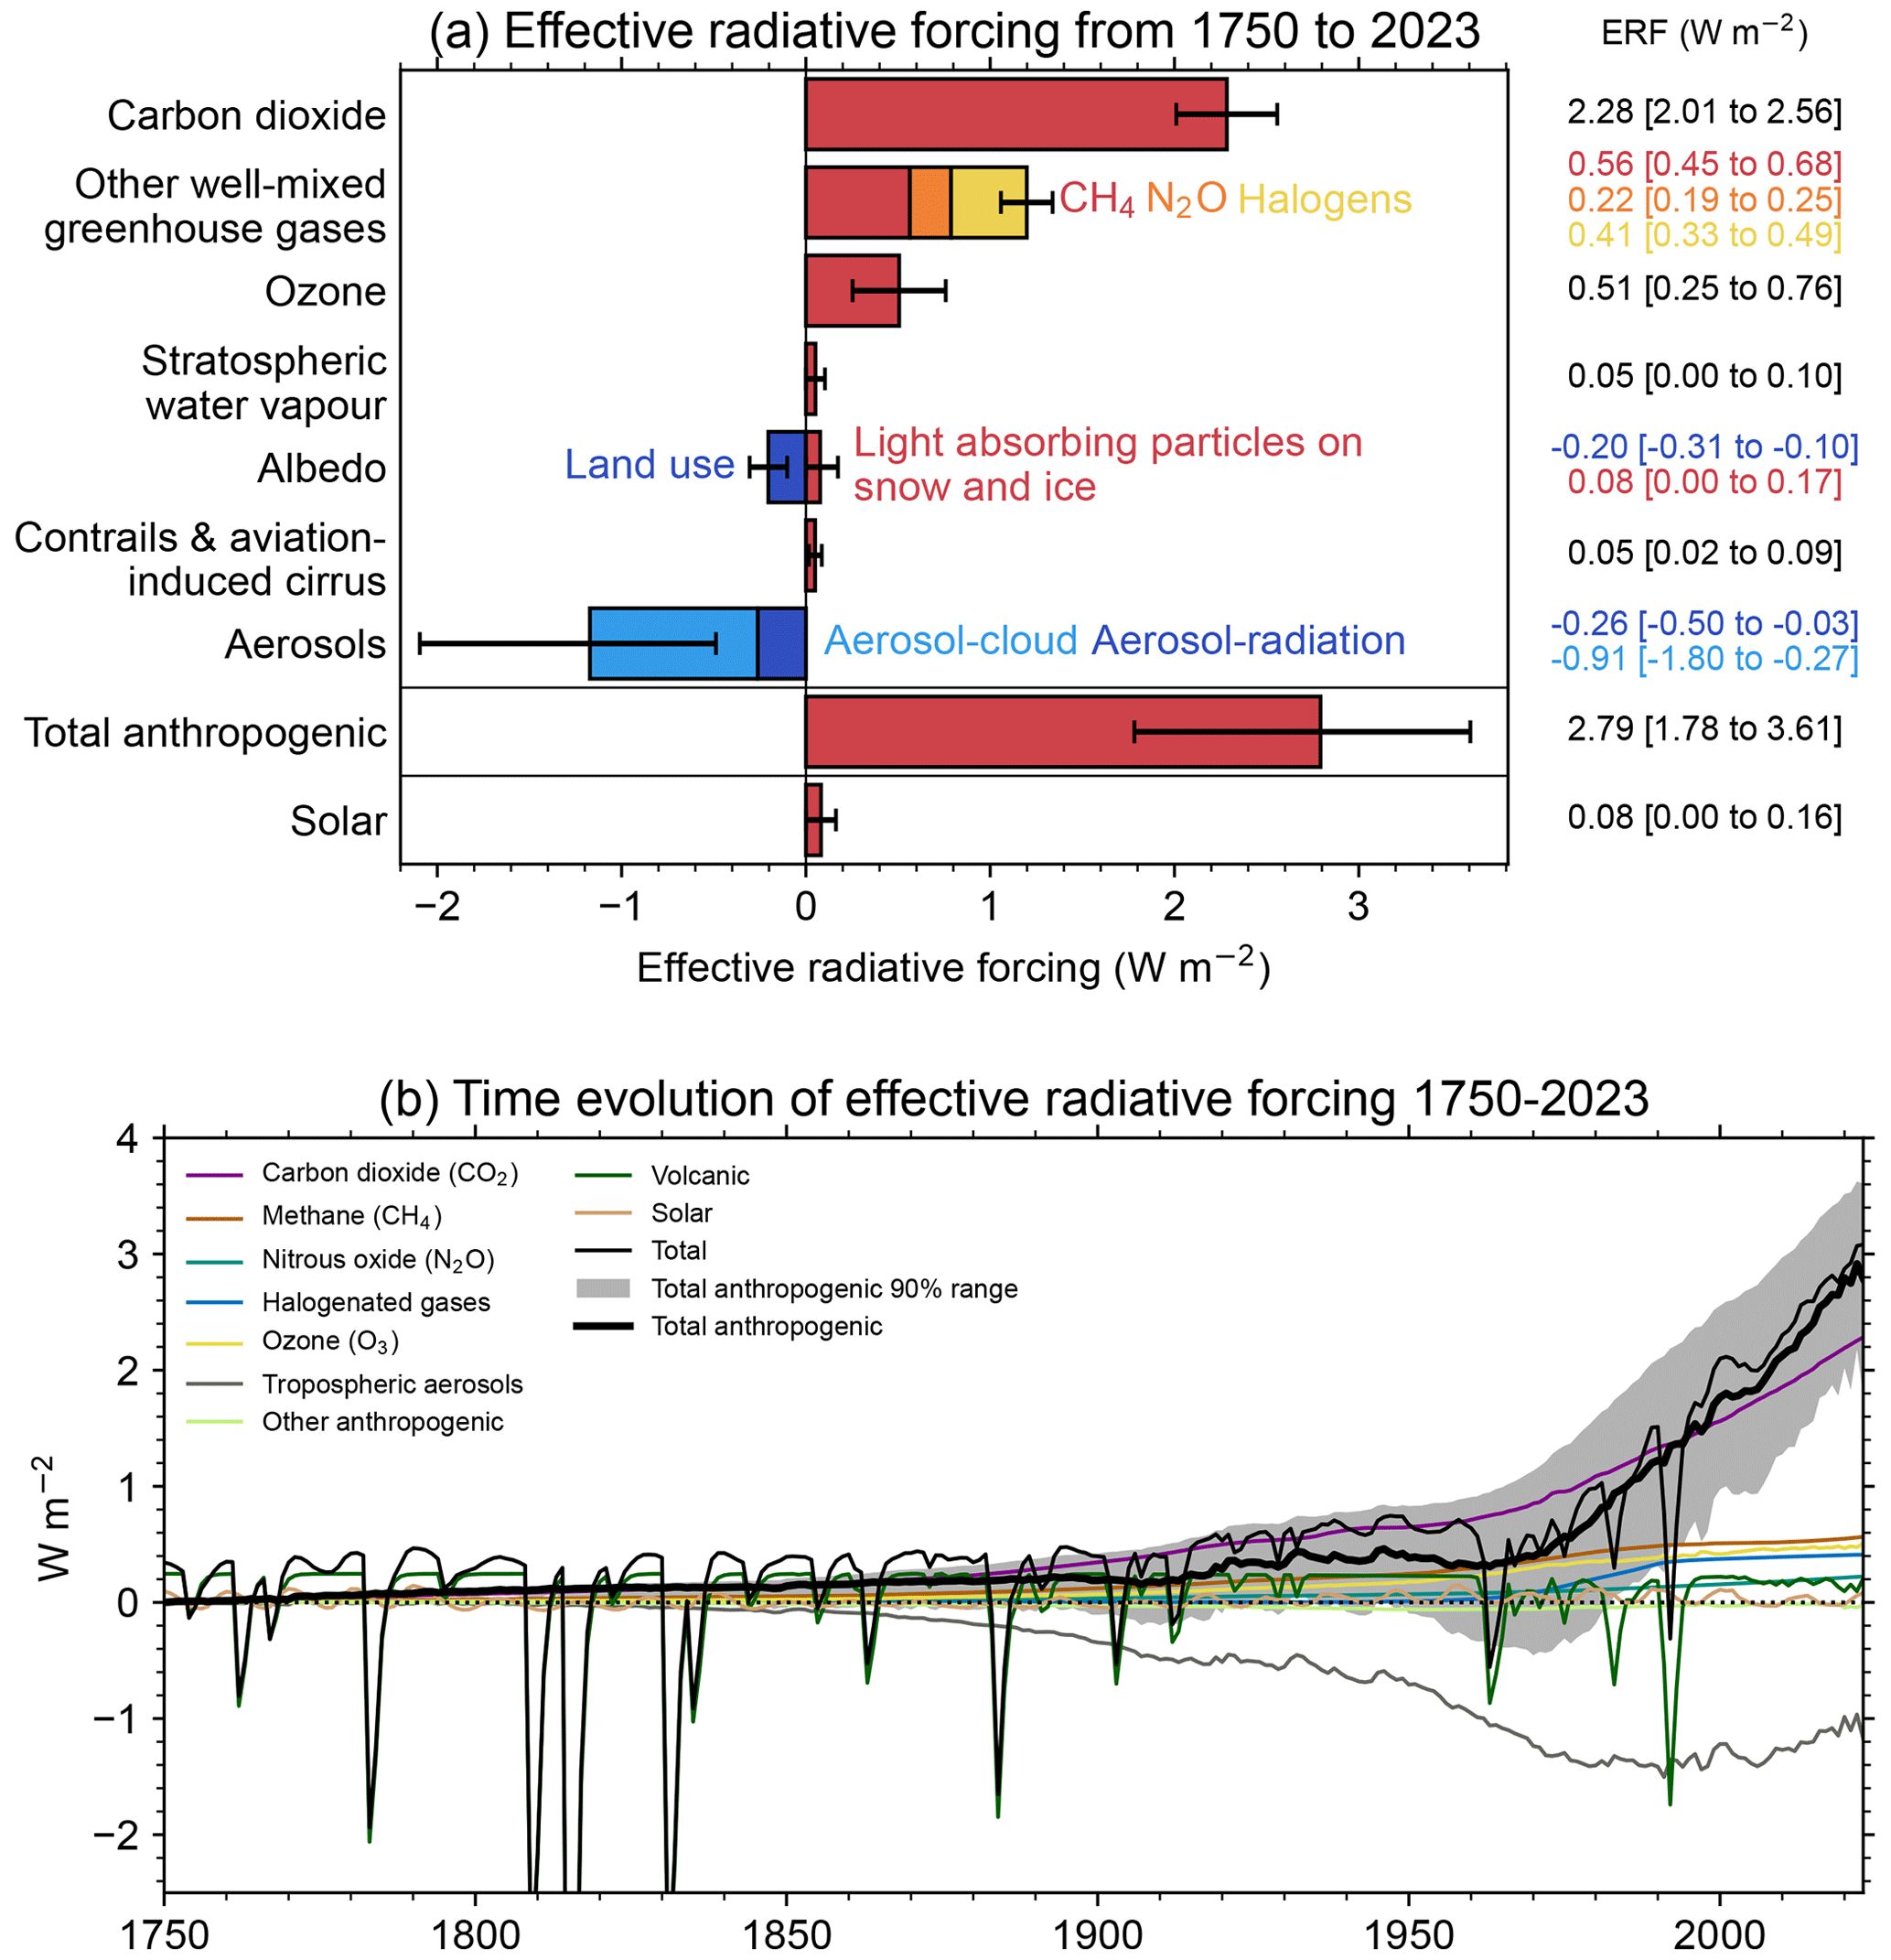
Figure 3Effective radiative forcing from 1750–2023. (a) 1750–2023 change in ERF, showing best estimates (bars) and 5 %–95 % uncertainty ranges (lines) from major anthropogenic components to ERF, total anthropogenic ERF and solar forcing. Note that solar forcing in 2023 is a single-year estimate. (b) Time evolution of ERF from 1750 to 2023. Best estimates from major anthropogenic categories are shown along with solar and volcanic forcing (thin coloured lines), total (thin black line), and anthropogenic total (thick black line). The 5 %–95 % uncertainty in the anthropogenic forcing is shown by grey shading.
Total anthropogenic ERF increased to 2.79 [1.78 to 3.61] W m−2 in 2023 relative to 1750, compared to 2.72 [1.96 to 3.48] W m−2 for 2019 relative to 1750 in AR6. The estimate of ERF for 2023 is lower than the 2.91 [2.19 to 3.63] W m−2 in 2022 evaluated in last year's indicators. The main reason for the decline in 2023 relative to 2022 is a very strong contribution from biomass burning aerosol in 2023, particularly organic carbon emissions which strengthened the negative aerosol ERF (see also Sect. 2.3). Sulfur emissions from shipping have declined since 2020, weakening the aerosol ERF and adding around +0.1 W m−2 over 2020 to 2023 (Gettelman et al., 2024; see Sect. S4.2.2). However, the strengthened negative ERF from increased biomass burning likely dominated the effect of reduced shipping emissions. As discussed in Sect. 2, it is not easy to determine how much of the biomass burning contribution is from natural wildfires in response to 2023's anomalously warm year, which would be a climate feedback rather than a forcing. We follow the convention of CMIP and count all biomass burning emissions as anthropogenic, though this assumption may need revision in future. The approach of including all biomass burning aerosols is consistent with reporting ERF based on the concentration increase in GHGs independent of whether CO2 and CH4 are caused by anthropogenic emissions or a smaller part is caused by any feedbacks such as from biomass burning fires or wetlands. However, changes in mineral dust and sea salt are not included in the ERF of aerosols, and any changes are interpreted as being yearly variations or related to feedbacks.
The relative uncertainty in the total ERF was at the lowest reported in 2022 (see Table 3), but with the strengthening of the aerosol ERF due to biomass additional burning, the relative uncertainty in total ERF for 2023 is higher than in 2019 reported in AR6 (Forster et al., 2021). Despite the strong aerosol forcing in 2023, decadal trends in anthropogenic ERF remain high and are over 0.6 W m−2 per decade. These are discussed further in Sect. 7.3.
The ERF from well-mixed GHGs is 3.48 [3.18 to 3.79] W m−2 for 1750–2023, of which 2.28 W m−2 is from CO2, 0.56 W m−2 from CH4, 0.22 W m−2 from N2O and 0.41 W m−2 from halogenated gases (contributions do not sum to total due to rounding). This is an increase from 3.32 [3.03 to 3.61] W m−2 for 1750–2019 in AR6. ERFs from CO2, CH4 and N2O have all increased since the AR6 WG1 assessment for 1750–2019, owing to increases in atmospheric concentrations.
The total aerosol ERF (sum of the ERF from aerosol–radiation interactions (ERFari) and aerosol–cloud interactions (ERFaci)) for 1750–2023 is −1.18 [−2.10 to −0.49] W m−2 compared to −0.98 [−1.58 to −0.40] W m−2 in Forster et al. (2023) and −1.06 [−1.71 to −0.41] W m−2 assessed for 1750–2019 in AR6 WG1. This counters a recent trend of reductions in aerosol forcing and is related in most part to 2023 being an extremely active biomass burning season. Most of this reduction is from ERFaci, which is determined to be −0.91 [−1.80 to −0.27] W m−2 in 2023 compared to −0.77 [−1.33 to −0.23] W m−2 for 1750–2022 (Forster et al., 2023) and −0.84 [−1.45 to −0.25] W m−2 in AR6 for 1750–2019. ERFari for 1750–2023 is −0.26 [−0.50 to −0.03] W m−2, stronger than the −0.21 [−0.42 to 0.00] W m−2 for 1750–2022 and the −0.22 [−0.47 to 0.04] W m−2 assessed for 1750–2019 in AR6 WG1 (Forster et al., 2021). The largest contributions to ERFari are from SO2 (primary source of sulfate aerosol; −0.24 W m−2), BC (+0.16 W m−2), OC (−0.11 W m−2) and NH3 (primary source of nitrate aerosol; −0.04 W m−2). ERFari also includes terms from CH4, N2O, VOCs and NOx which are small.
Ozone ERF is determined to be 0.51 [0.25 to 0.76] W m−2 for 1750–2023, slightly higher than the AR6 assessment of 0.47 [0.24 to 0.71] W m−2 for 1750–2019. This is due to the increase in emissions of some of its precursors (CO, VOC, CH4), but this result is highly uncertain since the preliminary OMI/MLS satellite data indicate tropospheric ozone burden is stable from 2020 to 2023 (meaning that the 2023 level does not reach the 2019 level), which could be partly due to the 2020–2023 levels of tropospheric NO2 being lower than the pre-COVID levels (OMI data from Krotkov et al., 2019). Land-use forcing and stratospheric water vapour from methane oxidation are unchanged (to two decimal places) since AR6. BC emissions increased between 2022 and 2023 and were similar to 2019 levels in 2023, resulting in ERF from light-absorbing particles on snow and ice being 0.08 [0.00 to 0.17] W m−2 for 1750–2023, similar to AR6. We determine from provisional data that aviation activity in 2023 had not yet returned to pre-COVID levels (IATA, 2024). Therefore, ERF from contrails and contrail-induced cirrus remains lower than AR6, at 0.05 [0.02 to 0.09] W m−2 in 2023 compared to 0.06 [0.02 to 0.10] W m−2 in 2019.
The headline assessment of solar ERF is unchanged, at 0.01 [−0.06 to +0.08] W m−2 from pre-industrial to the 2009–2019 solar cycle mean. Separate to the assessment of solar forcing over complete solar cycles, we provide a single-year solar ERF for 2023 of 0.08 [0.00 to +0.16] W m−2. This is higher than the single-year estimate of solar ERF for 2019 (a solar minimum) of −0.02 [−0.08 to 0.06] W m−2.
Volcanic ERF is included in the overall time series (Fig. 3b), but following IPCC convention, we do not provide a single-year estimate for 2023 given the sporadic nature of volcanoes. Alongside the time series of stratospheric aerosol optical depth derived from proxies and satellite products, for 2022 and 2023 we include the stratospheric water vapour contribution from the Hunga Tonga–Hunga Ha'apai (HTHH) eruption derived from Microwave Limb Sounder (MLS) data.
Stratospheric water vapour forcing is estimated to be +0.14 W m−2 in 2022 and +0.18 W m−2 in 2023 and in 2023 almost totally offsets the negative forcing from stratospheric aerosol.
The Earth energy imbalance (EEI), assessed in Chap. 7 of AR6 WGI (Forster et al., 2021), provides a measure of accumulated surplus energy (heating) in the climate system and is hence an essential indicator to monitor the current and future status of global warming. It represents the difference between the radiative forcing acting to warm the climate and Earth's radiative response, which acts to oppose this warming. On annual and longer timescales, the global Earth heat inventory changes associated with EEI are dominated by the changes in global ocean heat content (OHC), which accounts for about 90 % of global heating since the 1970s (Forster et al., 2021). This planetary heating results in changes in all components of the Earth system, such as sea level rise, ocean warming, ice loss, rise in temperature and water vapour in the atmosphere, and in changes in ocean and atmospheric circulation, ice loss and permafrost thawing (e.g. Cheng et al., 2022; von Schuckmann et al., 2023a), with adverse impacts for ecosystems and human systems (Douville et al., 2021; IPCC, 2022).
On decadal timescales, changes in global surface temperatures (Sect. 5) can become decoupled from EEI by ocean heat rearrangement processes (e.g. Palmer and McNeall, 2014; Allison et al., 2020). Therefore, the increase in the Earth heat inventory provides a robust indicator of the rate of global change on interannual-to-decadal timescales (Cheng et al., 2019; Forster et al., 2021; von Schuckmann et al., 2023a). AR6 WGI found increased confidence in the assessment of change in the Earth heat inventory compared to previous IPCC reports due to observational advances and closure of the energy and global sea level budgets (Forster et al., 2021; Fox-Kemper et al., 2021).
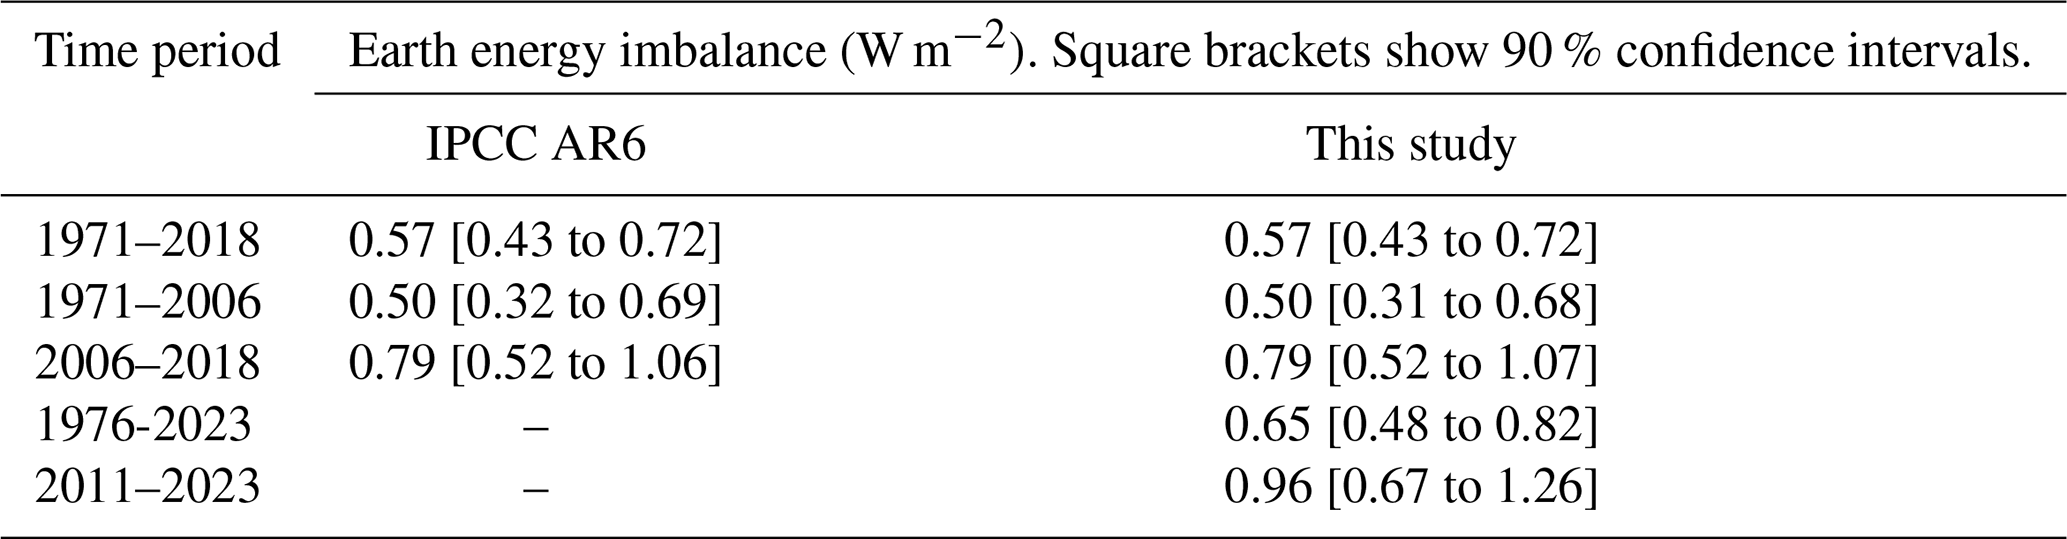
AR6 estimated that EEI increased from 0.50 [0.32–0.69] W m−2 during the period 1971–2006 to 0.79 [0.52–1.06] W m−2 during the period 2006–2018 (Forster et al., 2021). The contributions to increases in the Earth heat inventory throughout 1971–2018 remained stable: 91 % for the full-depth ocean, 5 % for the land, 3 % for the cryosphere and about 1 % for the atmosphere (Forster et al., 2021). Two recent studies demonstrated independently and consistently that since 1960, the warming of the world ocean has accelerated at a relatively consistent pace of 0.15±0.05 W m−2 per decade (Minière et al., 2023; Storto and Yang, 2024), while the land, cryosphere and atmosphere have been warming at a pace of 0.013±0.003 W m−2 per decade (Minière et al., 2023). The increase in EEI over the most recent quarter of a decade (Fig. 4) has also been reported by Cheng et al. (2019), von Schuckmann et al. (2020, 2023a), Loeb et al. (2021), Hakuba et al. (2021), Kramer et al. (2021), Raghuraman et al. (2021) and Minère et al. (2023). Drivers for the observed increase over the most recent period (i.e. past 2 decades) are discussed to be linked to rising concentrations of well-mixed greenhouse gases and recent reductions in aerosol emissions (Raghuraman et al., 2021; Kramer et al., 2021; Hansen et al., 2023) and to an increase in absorbed solar radiation associated with decreased reflection by clouds and sea ice and a decrease in outgoing longwave radiation (OLR) due to increases in trace gases and water vapour (Loeb et al., 2021) . The degree of contribution from the different drivers is uncertain and still under active investigation.
We carry out an update to the AR6 estimate of changes in the Earth heat inventory based on updated observational time series for the period 1971–2020 (Table 4 and Fig. 4). Time series of heating associated with loss of ice and warming of the atmosphere and continental land surface are obtained from the recent Global Climate Observing System (GCOS) initiative (von Schuckmann et al., 2023b; Cuesta-Valero et al., 2023; Vanderkelen and Thiery, 2022; Nitzbon et al., 2022; Kirchengast et al., 2022). We use the original AR6 time series ensemble OHC time series for the period 1971–2018 and then an updated five-member ensemble for the period 2019–2023. We “splice” the two sets of time series by adding an offset as needed to ensure that the 2018 values are identical. The AR6 heating rates and uncertainties for the ocean below 2000 m are assumed to be constant throughout the period. The time evolution of the Earth heat inventory is determined as a simple summation of time series of atmospheric heating; continental land heating; heating of the cryosphere; and heating of the ocean over three depth layers – 0–700, 700–2000 and greater than 2000 m (Fig. 4a). While von Schuckmann et al. (2023a) have also quantified heating of permafrost and inland lakes and reservoirs, these additional terms are very small and are omitted here for consistency with AR6 (Forster et al., 2021).
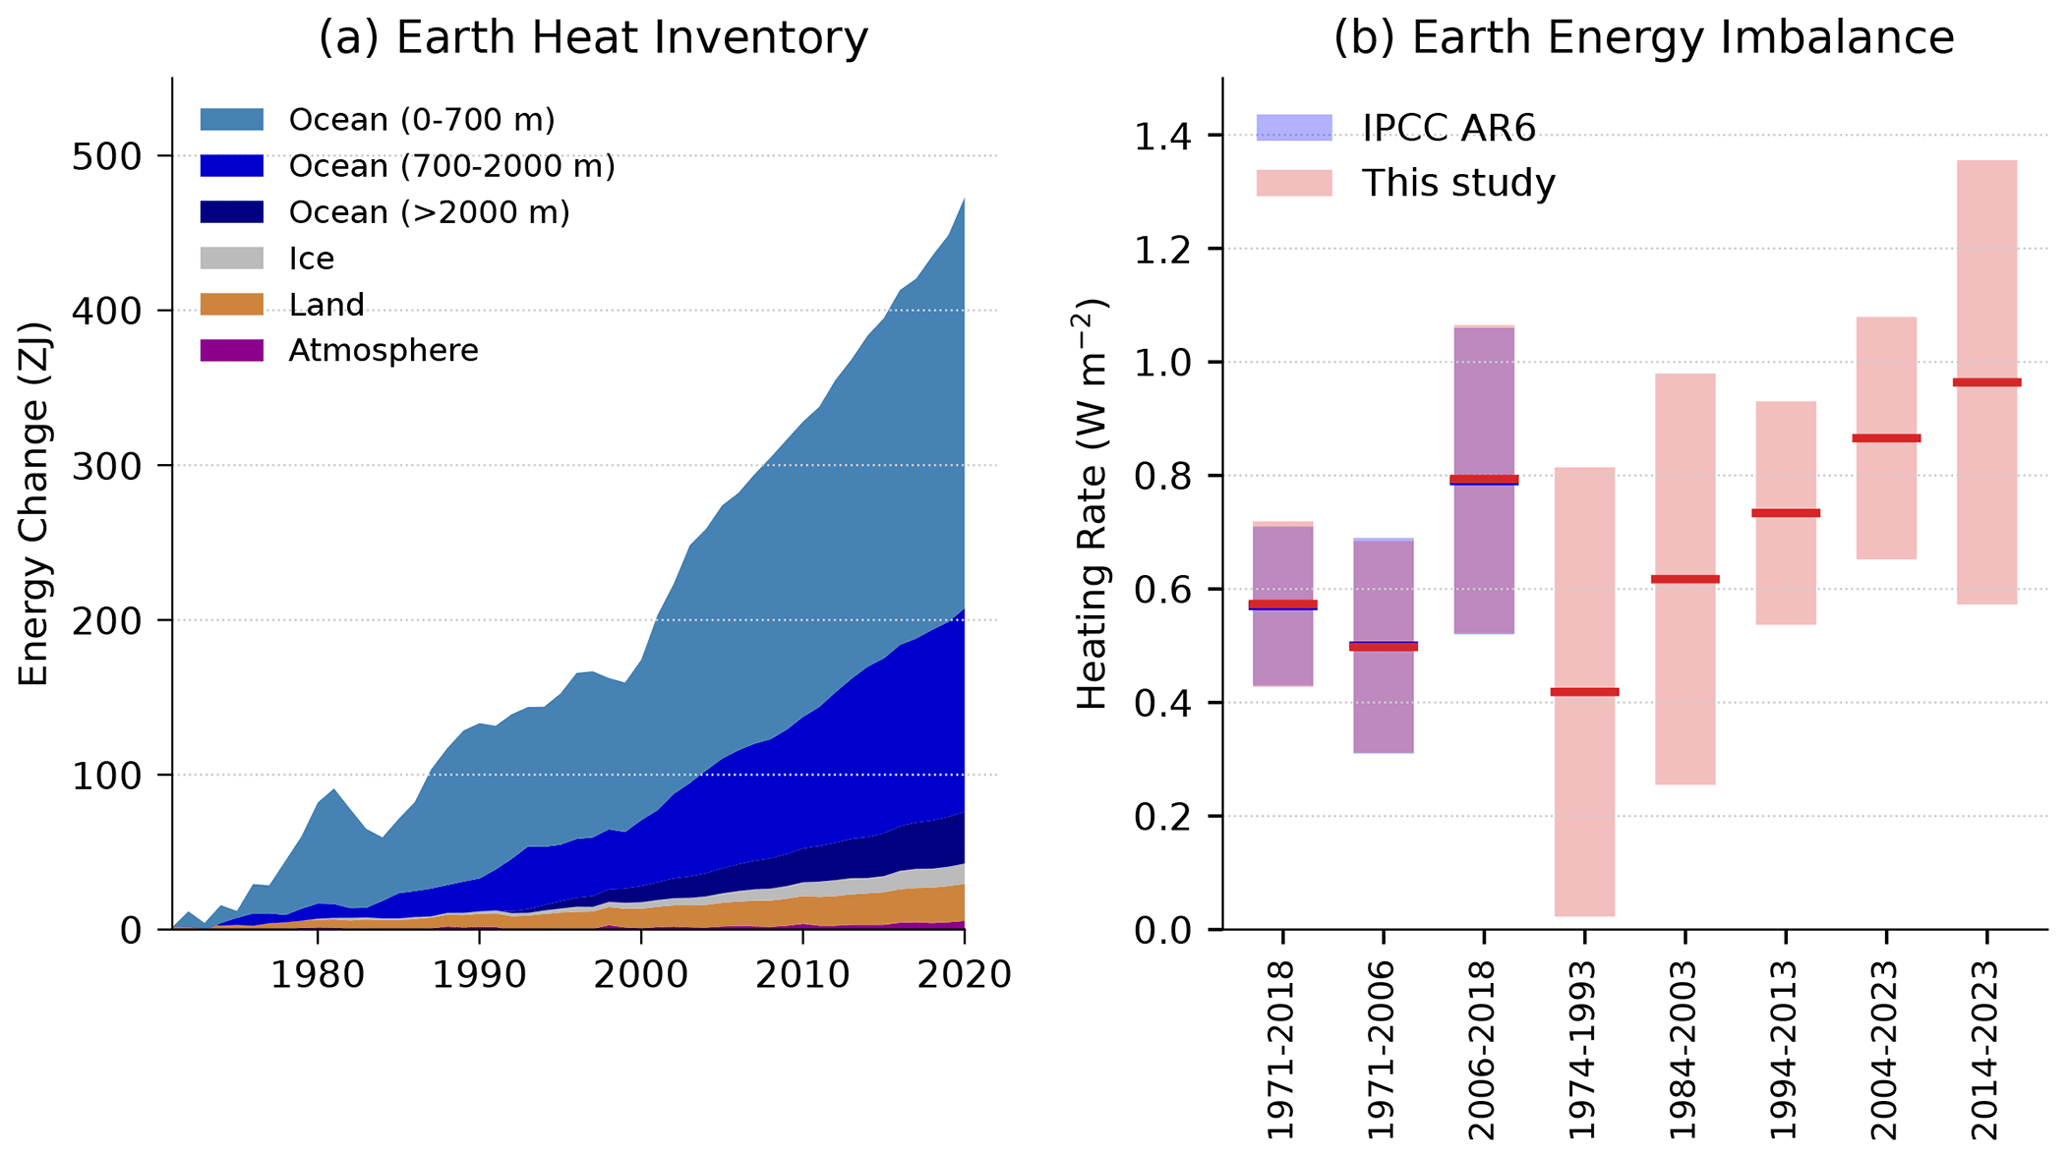
Figure 4(a) Observed changes in the Earth heat inventory for the period 1971–2020, with component contributions as indicated in the figure legend. (b) Estimates of the Earth energy imbalance for the IPCC AR6 assessment periods, for consecutive 20-year periods and the most recent decade. Shaded regions indicate the very likely range (90 % to 100 % probability). Data use and approach are based on the AR6 methods and are further described in Sect. S5 in the Supplement. For the IPCC AR6 periods, our assessment closely matches that in AR6. Note the periods in our assessment overlap with different IPCC AR6 periods.
In our updated analysis, we find successive increases in EEI for each 20-year period since 1974, with an estimated value of 0.42 [0.02 to 0.81] W m−2 during 1974–1993 that more than doubled to 0.87 [0.65 to 1.08] W m−2 during 2004–2023 (Fig. 4b). In addition, there is some evidence that the warming signal is propagating into the deeper ocean over time, as seen by a robust increase in deep (700–2000 m) ocean warming since the 1990s (von Schuckmann et al., 2020, 2023a; Cheng et al., 2019, 2022). The model simulations qualitatively agree with the observational evidence (e.g. Gleckler et al., 2016; Cheng et al., 2019), further suggesting that more than half of the OHC increase since the late 1800s occurs after the 1990s.
The update of the AR6 assessment periods to end in 2023 results in systematic increases in EEI: 0.65 W m−2 during 1976–2023 compared to 0.57 W m−2 during 1971–2018 and 0.96 W m−2 during 2011–2023 compared to 0.79 W m−2 during 2006–2018 (Table 4). The trend and interannual variability of EEI can largely be explained by a combination of surface temperature changes and radiative forcing (Hodnebrog et al., 2024), although there was a jump in 2023, which is still being investigated (Hansen et al., 2023).
Table 4Estimates of the Earth energy imbalance (EEI) for AR6 and the present study.
AR6 WGI Chap. 2 assessed the 2001–2020 globally averaged surface temperature change above an 1850–1900 baseline to be 0.99 [0.84 to 1.10] °C and 1.09 [0.95 to 1.20] °C for 2011–2020 (Gulev et al., 2021). Updated estimates to 2022 of 1.15 [1.00–1.25] °C were given in AR6 SYR (Lee et al., 2023), matching the estimate in Forster et al. (2023).
There are choices around the methods used to aggregate surface temperatures into a global average, how to correct for systematic errors in measurements, methods of infilling missing data, and whether surface measurements or atmospheric temperatures just above the surface are used. These choices, and others, affect temperature change estimates and contribute to uncertainty (IPCC AR6 WGI Chap. 2, Cross Chap. Box 2.3, Gulev et al., 2021). The methods chosen here closely follow AR6 WGI and are presented in Sect. S6. Confidence intervals are taken from AR6 as only one of the employed datasets regularly updates ensembles (see Sect. S6).
Based on the updates available as of March 2024, the change in global surface temperature from 1850–1900 to 2014–2023 is presented in Fig. 5. These data, using the same underlying datasets and methodology as AR6, give 1.19 [1.06–1.30] °C, an increase of 0.10 °C within 3 years from the 2011–2020 value reported in AR6 WGI (Table 5) and 0.09 °C from the 2011–2020 value in the most recent dataset versions. The change from 1850–1900 to 2004–2023 was 1.05 [0.90–1.16] °C, 0.07 °C higher than the value reported in AR6 WGI from 3 years earlier. These changes, although amplified somewhat by the exceptionally warm 2023, are broadly consistent with typical warming rates over the last few decades, which were assessed in AR6 as 0.76 °C over the 1980–2020 period (using ordinary-least-squares linear trends) or 0.019 °C per year (Gulev et al., 2021). They are also broadly consistent with projected warming rates from 2001–2020 to 2021–2040 reported in AR6, which are on the order of 0.025 °C per year under most scenarios (Lee et al., 2021). See Sect. 7.4 for further discussion of trends.
Table 5Estimates of global surface temperature change from 1850–1900 [very likely (90 %–100 % probability) ranges] for IPCC AR6 and the present study.
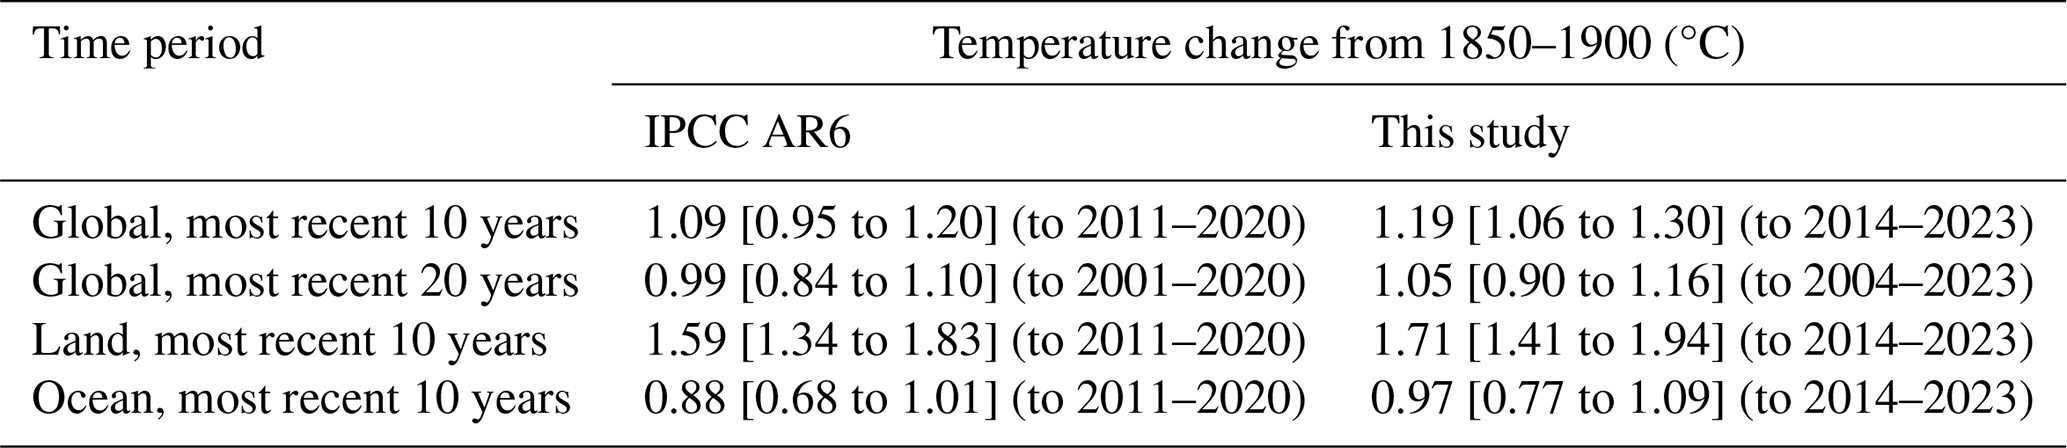
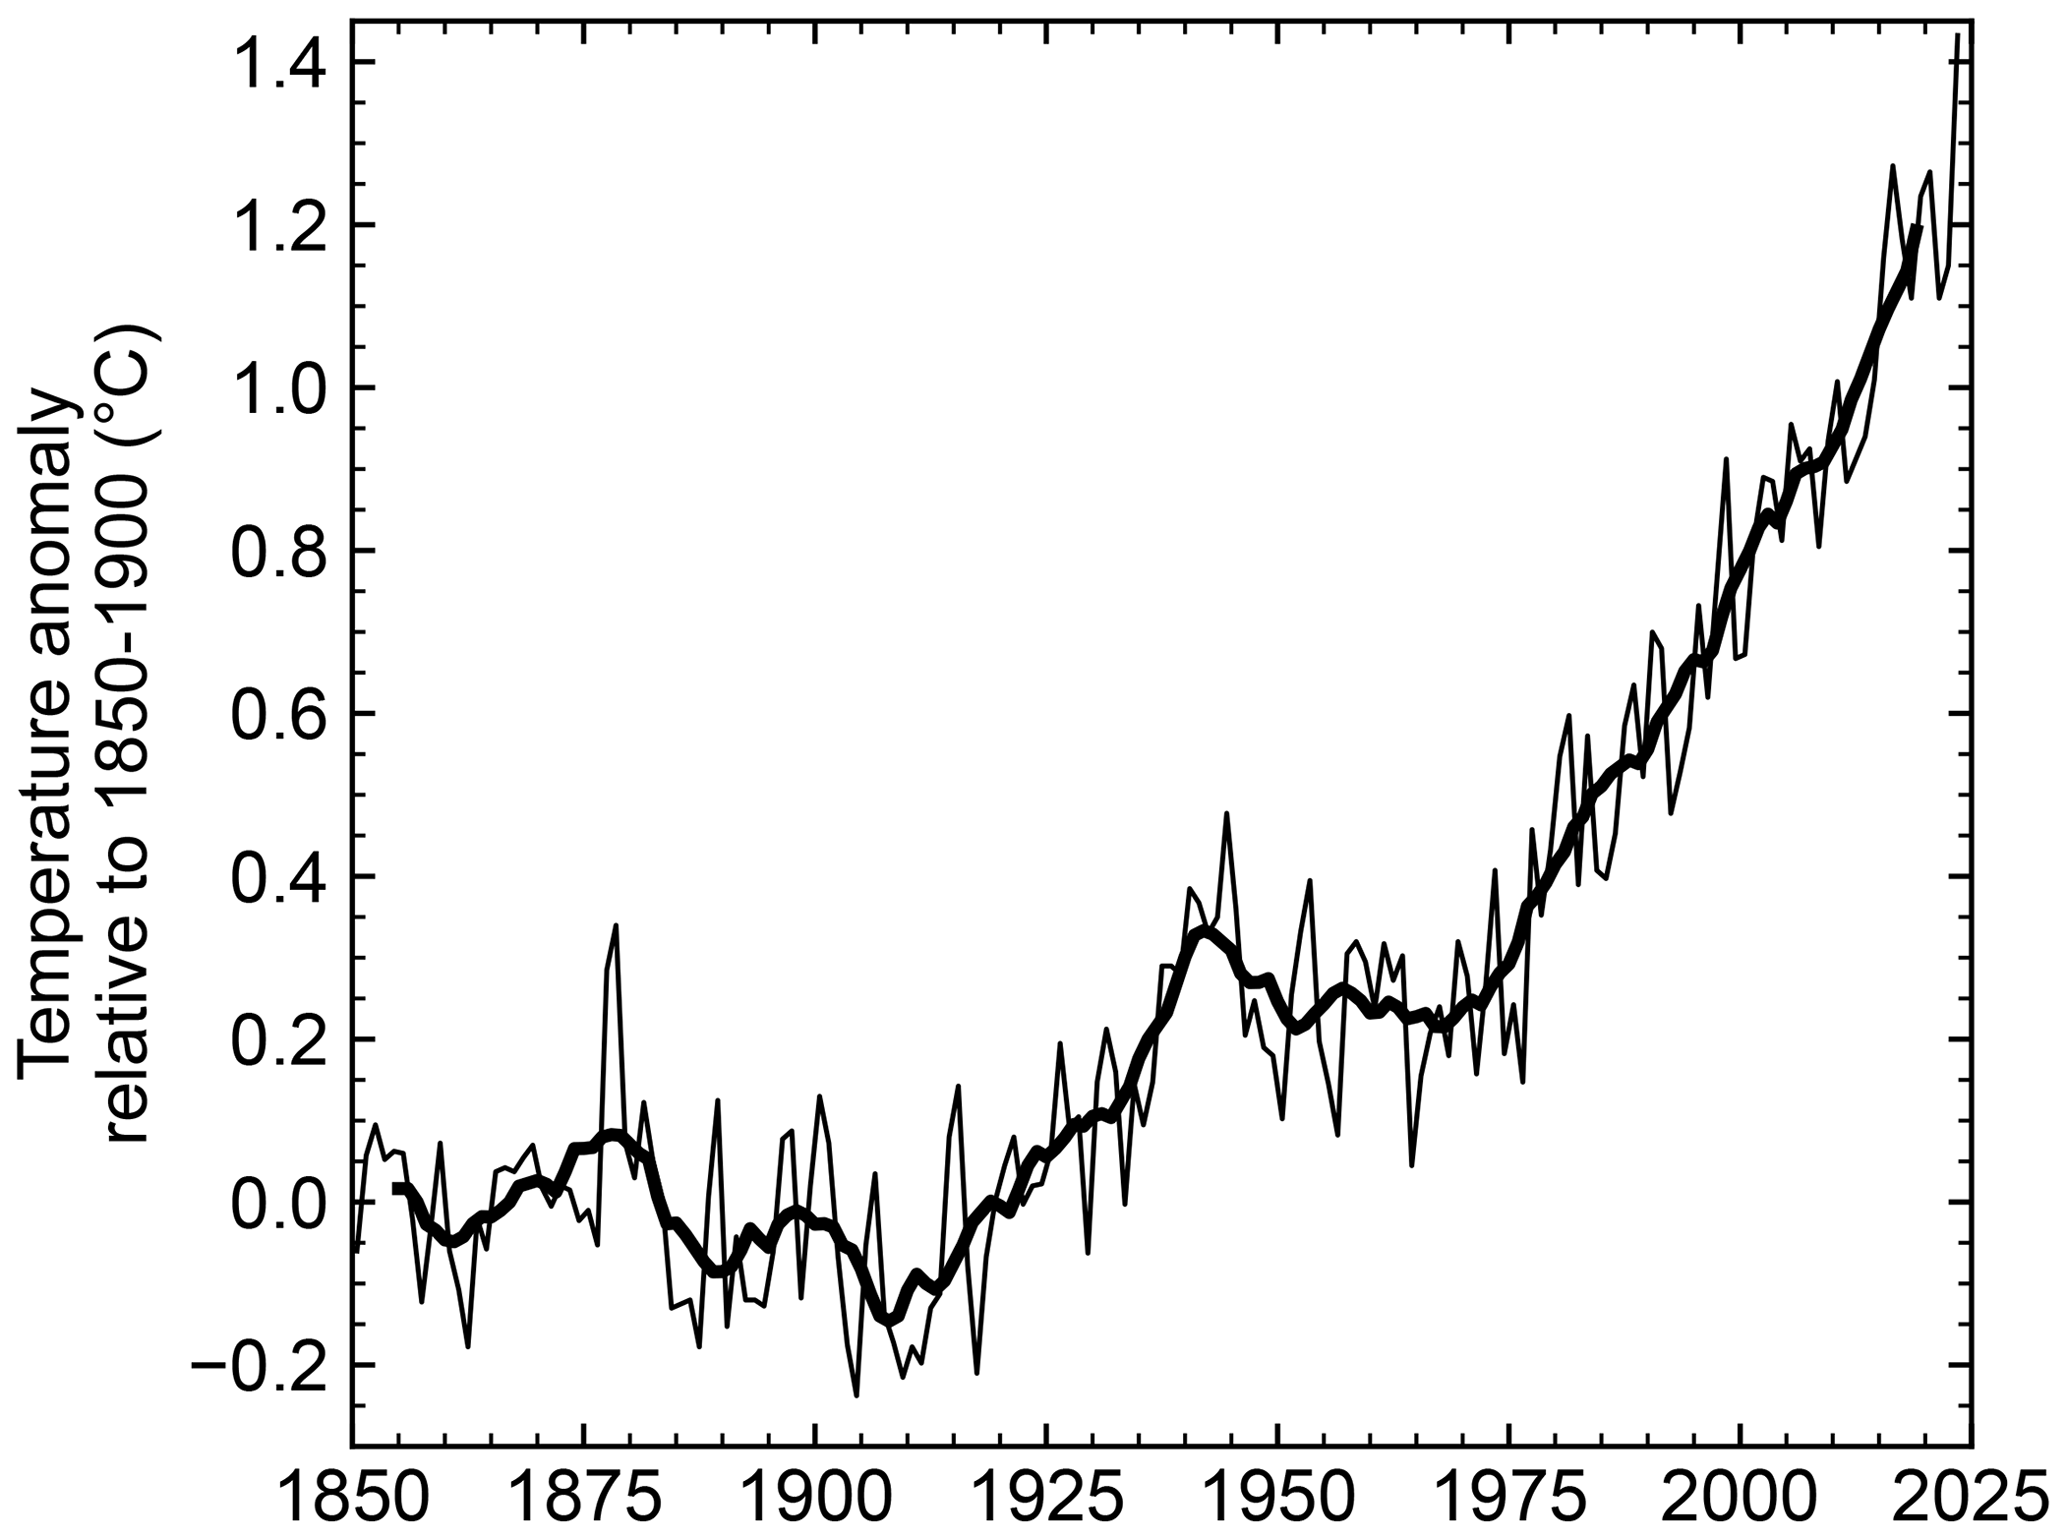
Figure 5Annual (thin line) and decadal (thick line) means of global surface temperature (expressed as a change from the 1850–1900 reference period).
The global surface temperature in 2023 was 1.43 [1.32 to 1.53] °C above the 1850–1900 average in the multi-dataset mean used here. This is similar to the combined estimate from six datasets quoted in the 2023 WMO State of the Global Climate report, 1.45 [1.33 to 1.57] °C (WMO, 2024). As seen in Fig. 5 and discussed in Sect. 7.3, this is considerably above the human-induced warming estimate, indicating a significant role of internal variability.
Human-induced warming, also known as anthropogenic warming, refers to the component of observed global surface temperature increase attributable to both the direct and indirect effects of human activities, which are typically grouped as follows: well-mixed greenhouse gases (consisting of CO2, CH4, N2O and F-gases) and other human forcings (consisting of aerosol–radiation interaction, aerosol–cloud interaction, black carbon on snow, contrails, ozone, stratospheric H2O and land use) (Eyring et al., 2021). The remaining contributors to total warming are natural: consisting of both natural forcings (such as solar and volcanic activity) and internal variability of the climate system (such as variability related to El Niño/La Nina events).
An assessment of human-induced warming was provided in two reports within the IPCC's sixth assessment cycle: first in SR1.5 in 2018 (Chap. 1 Sect. 1.2.1.3 and Fig. 1.2 (Allen et al., 2018), summarised in the Summary for Policymakers (SPM) Sect. A.1 and Fig. SPM.1 (IPCC, 2018)) and second in AR6 in 2021 (WGI Chap. 3 Sect. 3.3.1.1.2 and Fig. 3.8 (Eyring et al., 2021), summarised in the WGI Summary for Policymakers (SPM) Sect. A.1.3 and Fig. SPM.2 (IPCC, 2021b) and quoted again without any updates in SYR Sect. 2.1.1 and Fig. 2.1 (IPCC, 2023a) and SYR Summary for Policymakers (SPM) Sect. A.1.2 (IPCC 2023b)).
7.1 Warming period definitions in the IPCC sixth assessment cycle
Temperature increases are defined relative to a baseline; IPCC assessments typically use the 1850–1900 average temperature as a proxy for the climate in pre-industrial times, referred to as the period before 1750 (see AR6 WGI Cross Chapter Box 1.2).
Tracking progress towards the long-term global goal to limit warming, in line with the Paris Agreement, requires the assessment of both what the current level of global surface temperatures are and whether a level of global warming, such as 1.5 °C, is being reached. Definitions for these were not specified in the Paris Agreement, and several ways of tracking levels of global warming are in use (Betts et al. 2023); here we focus on those adopted within the IPCC's AR6 (Fig. 6). When determining whether warming thresholds have been passed, both AR6 and SR1.5 adopted definitions that depend on future warming; in practice, levels of current warming were therefore reported in AR6 and SR1.5 using additional definitions that circumvented the need to wait for observations of the future climate. AR6 defined crossing time for a level of global warming as the midpoint of the first 20-year period during which the average observed warming for that period, in GSAT, exceeds that level of warming (see AR6 WGI Chap. 2 Box 2.3). It then reported current levels of both observed and human-induced warming as their averages over the most recent decade (see AR6 WGI Chap. 3 Sect. 3.3.1.1.2). This still effectively gives the warming level with a crossing time 5 years in the past, so it would need to be combined with a projection of temperature change over the next decade to give a 20-year mean with crossing time at the current year (Betts et al., 2023); we do not focus on this here due to the need for further examination of methods and implications. SR1.5 defined the current level of warming as the average human-induced warming, in global mean surface temperature (GMST), of a 30-year period centred on the current year, extrapolating any multidecadal trend into the future if necessary (see SR1.5 Chap. 1 Sect. 1.2.1). If the multidecadal trend is interpreted as being linear, this definition of current warming is equivalent to the end point of the trend line through the most recent 15 years of human-induced warming and therefore depends only on historical warming. This interpretation produces results that are almost all identical to the present-day single-year value of human-induced warming (see Fig. 6 and results in Sects. 7.3 and S7.3), so in practice the attribution assessment in SR1.5 was based on the single-year-attributed warming calculated using the Global Warming Index, not the trend-based definition.
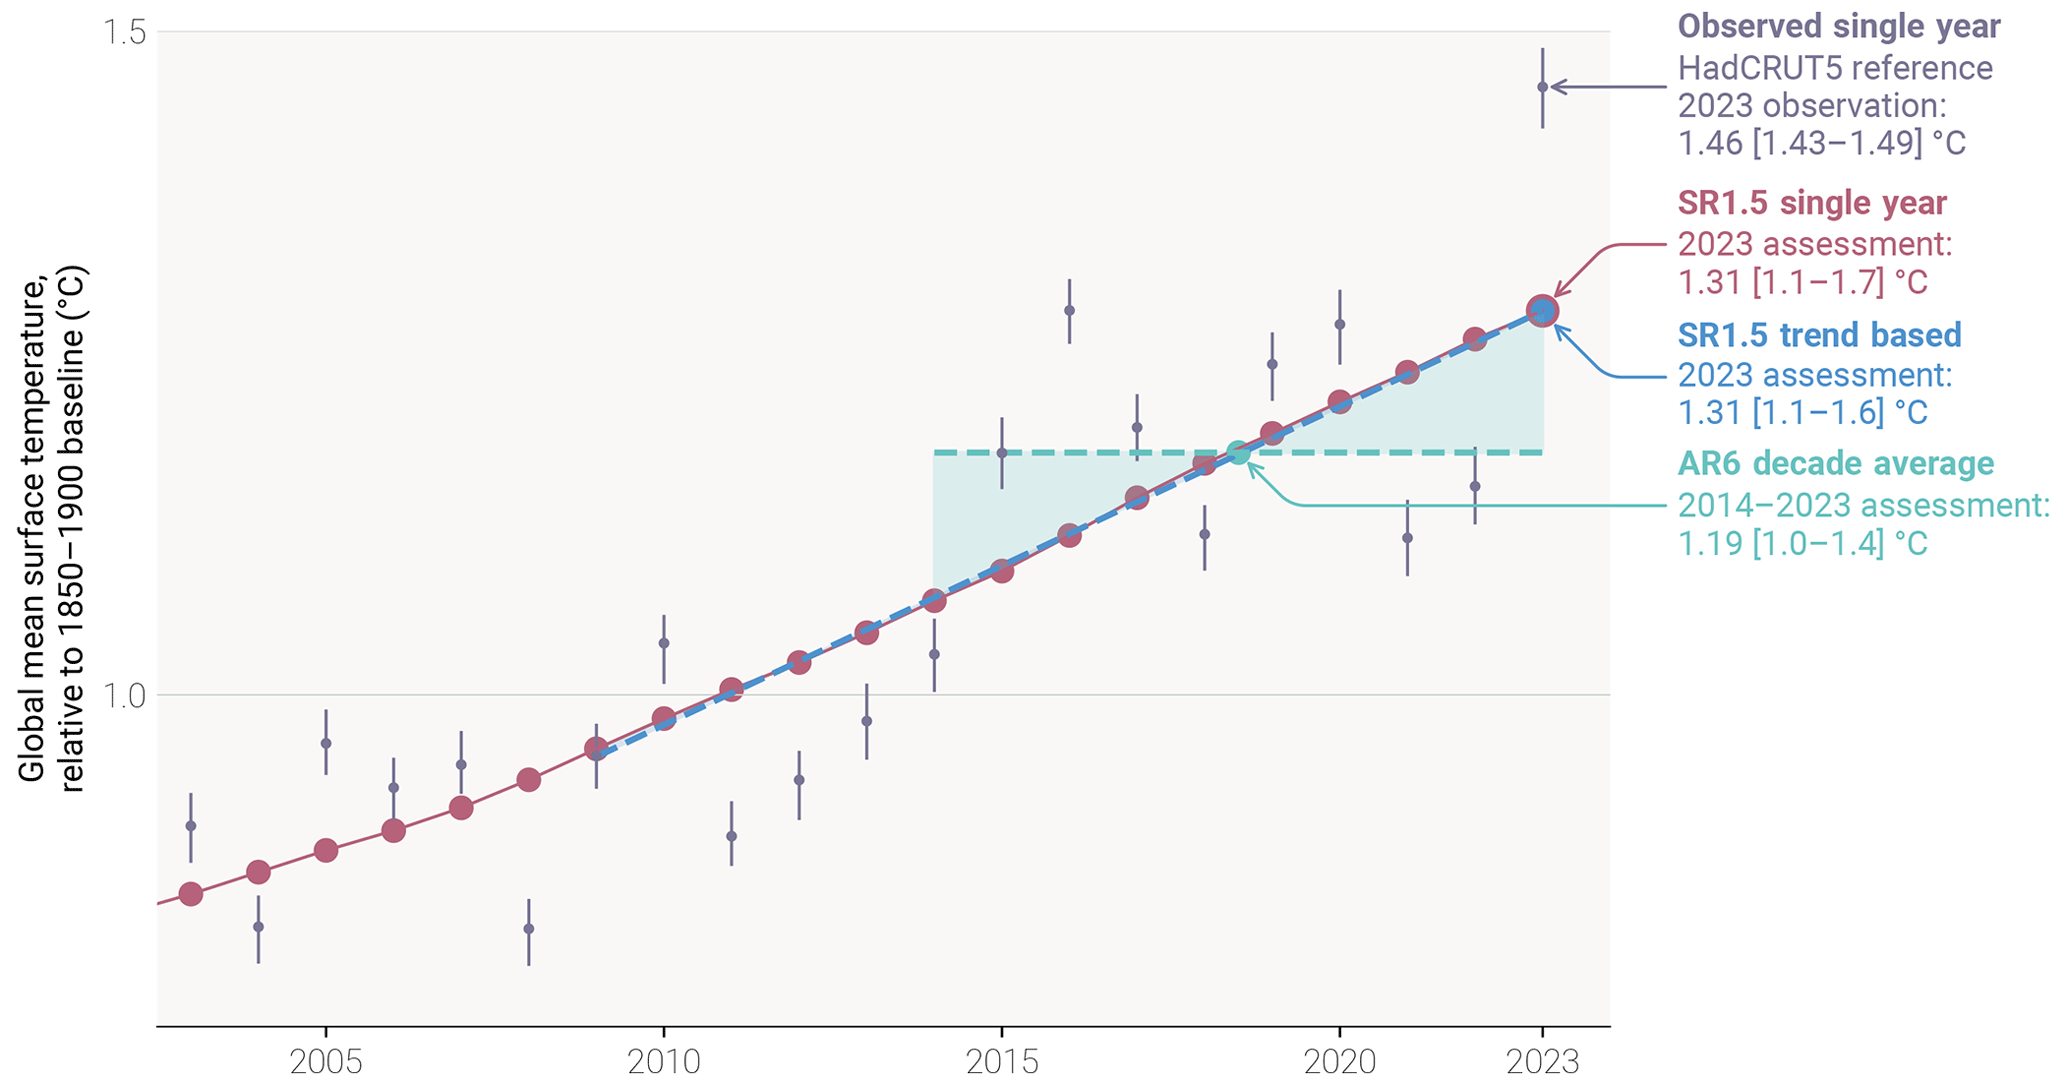
Figure 6Anthropogenic warming period definitions adopted in the IPCC sixth assessment cycle. A single sampled time series of anthropogenic warming is shown in red (in this case from the GWI method – see Sect. S7). Single-year warming is given by the annual values of this time series. The AR6 decade-average warming is given by the average of the 10 most recent single-year anthropogenic warming values; this is depicted by the dashed green line with shading between this and the red single-year values The decade-average value for 2014–2023 is given by the green dot. SR1.5 trend-based warming is given by the end point of the linear trend line through the 15 most recent single-year anthropogenic warming values; this is depicted by the dashed blue line with shading between this and the red single-year values; the trend-based value for 2023 is given by the blue dot. Reference observations of GMST are provided from HadCRUT5, with 5 %–95 % uncertainty range. The single-year, trend-based, and decade-average calculations are applied at the level of the individual ensemble members for each attribution method; percentiles of those ensemble results provide central estimates and uncertainty ranges for each method, and the multi-method assessment combines those into the final assessment results with uncertainty (as described in Sect. S7.4). For reference, the assessment results for 2023 provided in Sect. 7.3 are annotated in the figure (though the data in the figure do not correspond to the final assessment results).
7.2 Updated assessment approach of human-induced warming to date
This paper provides an update of the AR6 WGI and SR1.5 human-induced warming assessments, including, for completeness, all three definitions (AR6 decade-average, SR1.5 trend-based and SR1.5 single-year). The 2023 updates in this paper follow the same methods and process as the 2022 updates provided in Forster et al. (2023). Global mean surface temperature is adopted as the definition of global surface temperature (see Sect. S7.1). The three attribution methods used in AR6 are retained: the Global Warming Index (GWI) (building on Haustein et al., 2017), regularised optimal fingerprinting (ROF) (as in Gillett et al., 2021) and kriging for climate change (KCC) (Ribes et al., 2021). Details of each method, their different uses in SR1.5 and AR6, and any methodological changes are provided in Sect. S7.2; method-specific results are also provided in Sect. S7.3. The overall estimate of attributed global warming for each definition (decade-average, trend-based and single-year) is based on a multi-method assessment of the three attribution methods (GWI, KCC, ROF); the best estimate is given as the 0.01 °C precision mean of the 50th percentiles from each method, and the likely range is given as the smallest 0.1 °C precision range that envelops the 5th to 95th percentile ranges of each method. This assessment approach is identical to last year's update (Forster et al., 2023); it is directly traceable to and fully consistent with the assessment approach in AR6, though it has been extended in ways that are explained in Sect. S7.4.
7.3 Results
Results are summarised in Table 6 and Figs. 6 and 7. Method-specific contributions to the assessment results, along with time series, are given in Sect. S7.3. Where results reported in GSAT differ from those reported in GMST (see Sect. S7.1), the additional GSAT results are given in Sect. S7.3.
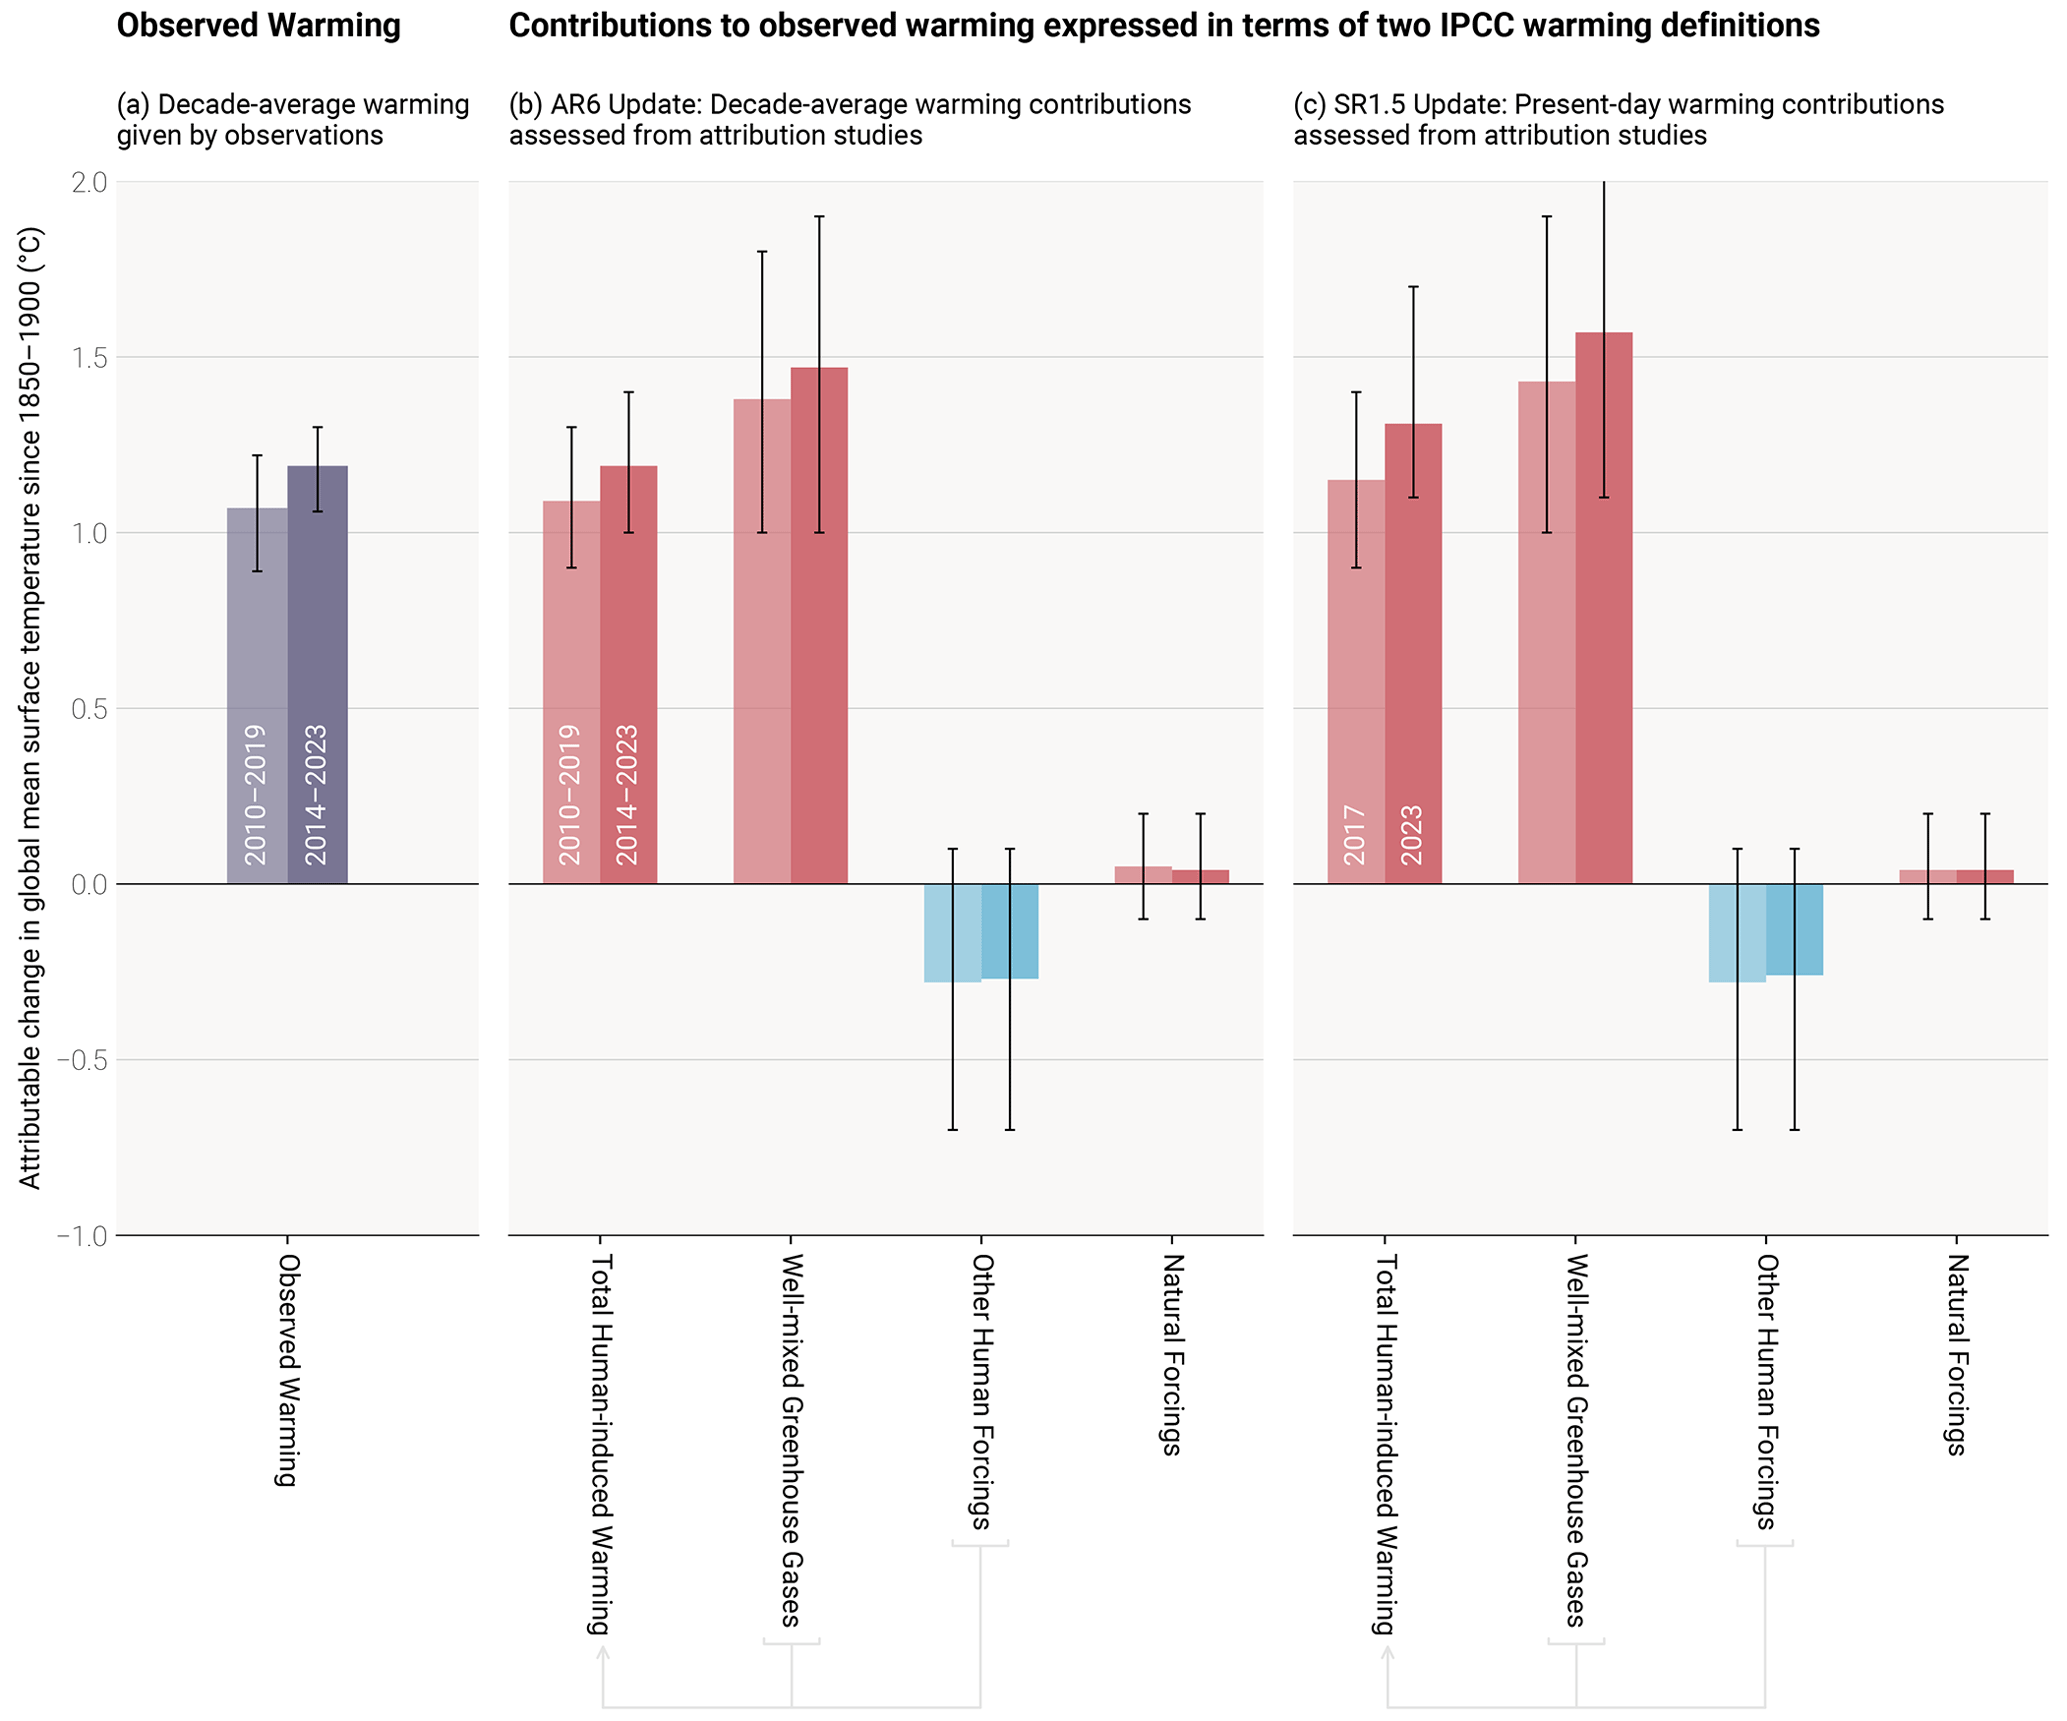
Figure 7Updated assessed contributions to observed warming relative to 1850–1900; see AR6 WGI SPM.2. Results for all time periods in this figure are calculated using updated datasets and methods. To show how these updates have affected the previous assessments, the 2010–2019 decade-average assessed results repeat the AR6 2010–2019 assessment, and the 2017 single-year assessed results repeat the SR1.5 2017 assessment. The 2014–2023 decade-average and 2023 single-year results are this year's updated assessments for AR6 and SR1.5, respectively. For each double bar, the lighter and darker shading refers to the earlier and later period, respectively. Panel (a) shows updated observed global warming from Sect. 6, expressed as total global mean surface temperature (GMST), due to both anthropogenic and natural influences. Whiskers give the very likely range. Panels (b) and (c) show updated assessed contributions to warming, expressed as global mean surface temperature (GMST), from natural forcings and total human-induced forcings, which in turn consist of contributions from well-mixed greenhouse gases and other human forcings. Whiskers give the likely range.
Table 6Updates to assessments in the IPCC sixth assessment cycle of warming attributable to multiple influences. Estimates of warming attributable to multiple influences (in °C) relative to the 1850–1900 baseline period. Results are given as best estimates, with the likely range in brackets, and are reported as global mean surface temperature (GMST). Results from the IPCC sixth assessment cycle, for both AR6 and SR1.5, are quoted in columns labelled (i) and are compared with repeat calculations in columns labelled (ii) for the same period using the updated methods and datasets in order to see how methodological and dataset updates alone would change previous assessments. Assessments for the updated periods are reported in columns labelled (iii).
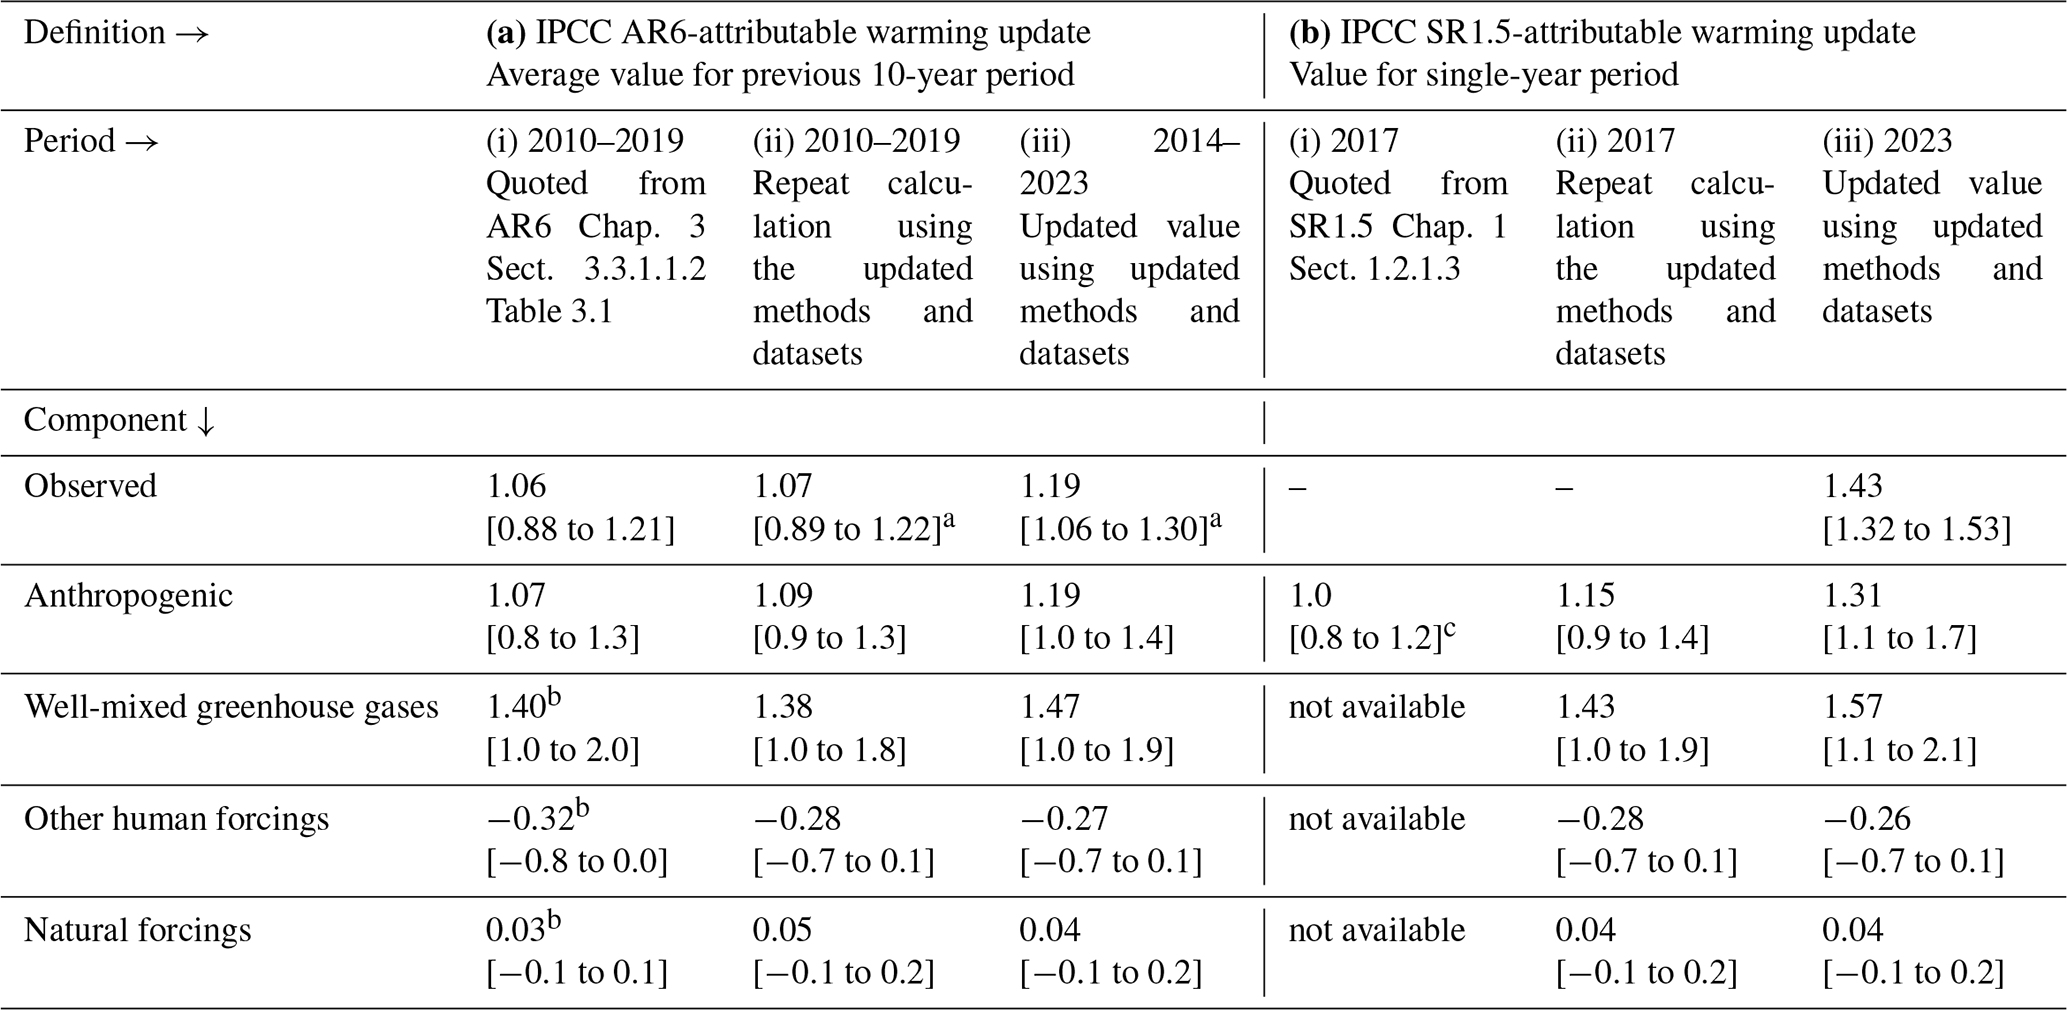
a Updated GMST observations, quoted from Sect. 6 of this update, are marked with an asterisk, with very likely ranges given in brackets. b In AR6 WGI, best-estimate values were not provided for warming attributable to well-mixed greenhouse gases, other human forcings and natural forcings (though they did receive a likely range); for comparison, best estimates (marked with two asterisks) have been retrospectively calculated in an identical way to the best estimate that AR6 provided for anthropogenic warming (see discussion in Sect. S7.4.1). c The SR1.5 assessment only drew on GWI rounded to 0.1 °C precision, whereas the repeat and updated calculations use the updated multi-method assessment approach.
The repeat calculations for attributable warming in 2010–2019 exhibit good correspondence with the results in AR6 WGI for the same period (see also Sect. S7). The repeat calculation for the level of attributable anthropogenic warming in 2017 is about 0.1 °C larger than the estimate provided in SR1.5 for the same period, resulting from changes in methods and observational data (see AR6 WGI Chap. 2 Box 2.3). The updated results for warming contributions in 2023 are higher than in 2017, also due to 6 additional years of increasing anthropogenic forcing. Note, also, that the SR1.5 assessment only used the GWI method, whereas these annual updates apply the full AR6 multi-method assessment (see Sect. S7.4 for details and rationale). A repeat assessment using the SR1.5 trend-based definition (see Sect. 7.1) leads to results that are very similar to the single-year results reported in Table 6b; best estimates across all components for single-year and trend-based definitions are identical to each other for 2023 and identical to or well within the uncertainty range for 2017 (Sect. S7.3 Table S4).
In this 2024 update, we assess the 2014–2023 decade-average human-induced warming at 1.19 [1.0 to 1.4] °C, which is 0.12 °C above the AR6 assessment for 2010–2019. The single-year-average human-induced warming is assessed to be 1.31 [1.1 to 1.7] °C in 2023 relative to 1850–1900. This best estimate for the current level of human-induced warming reaches the 1.3 °C threshold for the first time. The best estimate is below the observed temperature in 2023 (1.43 [1.32 to 1.53] °C; see Sect. 6), but note the overlap of uncertainties. These best estimates for decade-average and single-year human-induced warming are both 0.05 °C above the value estimated in the previous update for the year 2022 (Forster et al., 2023). The increase of 0.05 °C in the single-year anthropogenic warming level since last year's assessment (Forster et al., 2023) is broken down in the following way: (i) around half of the increase is due to a revision of the historical period due to the additional year of observations (i.e. the 2023 analysis of single-year warming for 2022 is 0.026 °C warmer than the 2022 analysis of single-year warming for 2022), and (ii) around half of the increase is due to the additional year itself (i.e. the 2023 analysis of the single-year warming for 2023 is 0.025 °C warmer than the 2023 analysis of the single-year warming for 2022). Therefore, the variability in human-induced warming from adding 1 particularly hot year of observations (which 2023 was; see Sect. 6) corresponded to advancing only 1 additional year at the current warming rate (0.026 °C per year; see Sect. 7.4), which is significantly smaller than other sources of uncertainty in the assessment. At the attribution level, this slightly strengthened anthropogenic warming is comprised of a slightly larger greenhouse-gas-attributable warming, partially offset by a slightly stronger aerosol-attributable cooling.
WGI AR6 found that, averaged for the 2010–2019 period, essentially all observed global surface temperature change was human-induced, with solar and volcanic drivers and internal climate variability making a negligible contribution. This conclusion remains the same for the 2014–2023 period. Generally, whatever methodology is used, on a global scale, the best estimate of the human-induced warming is (within small uncertainties) similar to the observed global surface temperature change (Table 6).
7.4 Rate of human-induced global warming
Estimates of the human-induced warming rate refer to the rate of increase in the level of attributed anthropogenic warming over time; this is distinct from the rate of increase in the observed global surface temperature (Sect. 6), which is affected by internal variability such as El Niño and natural forcings such as volcanic activity (Jenkins et al., 2023). The rate of anthropogenic warming is driven by the rate of change of anthropogenic ERF, meaning variations in the rate of climate forcing over time correlate with variations in the rate of attributed warming (see Fig. 8).
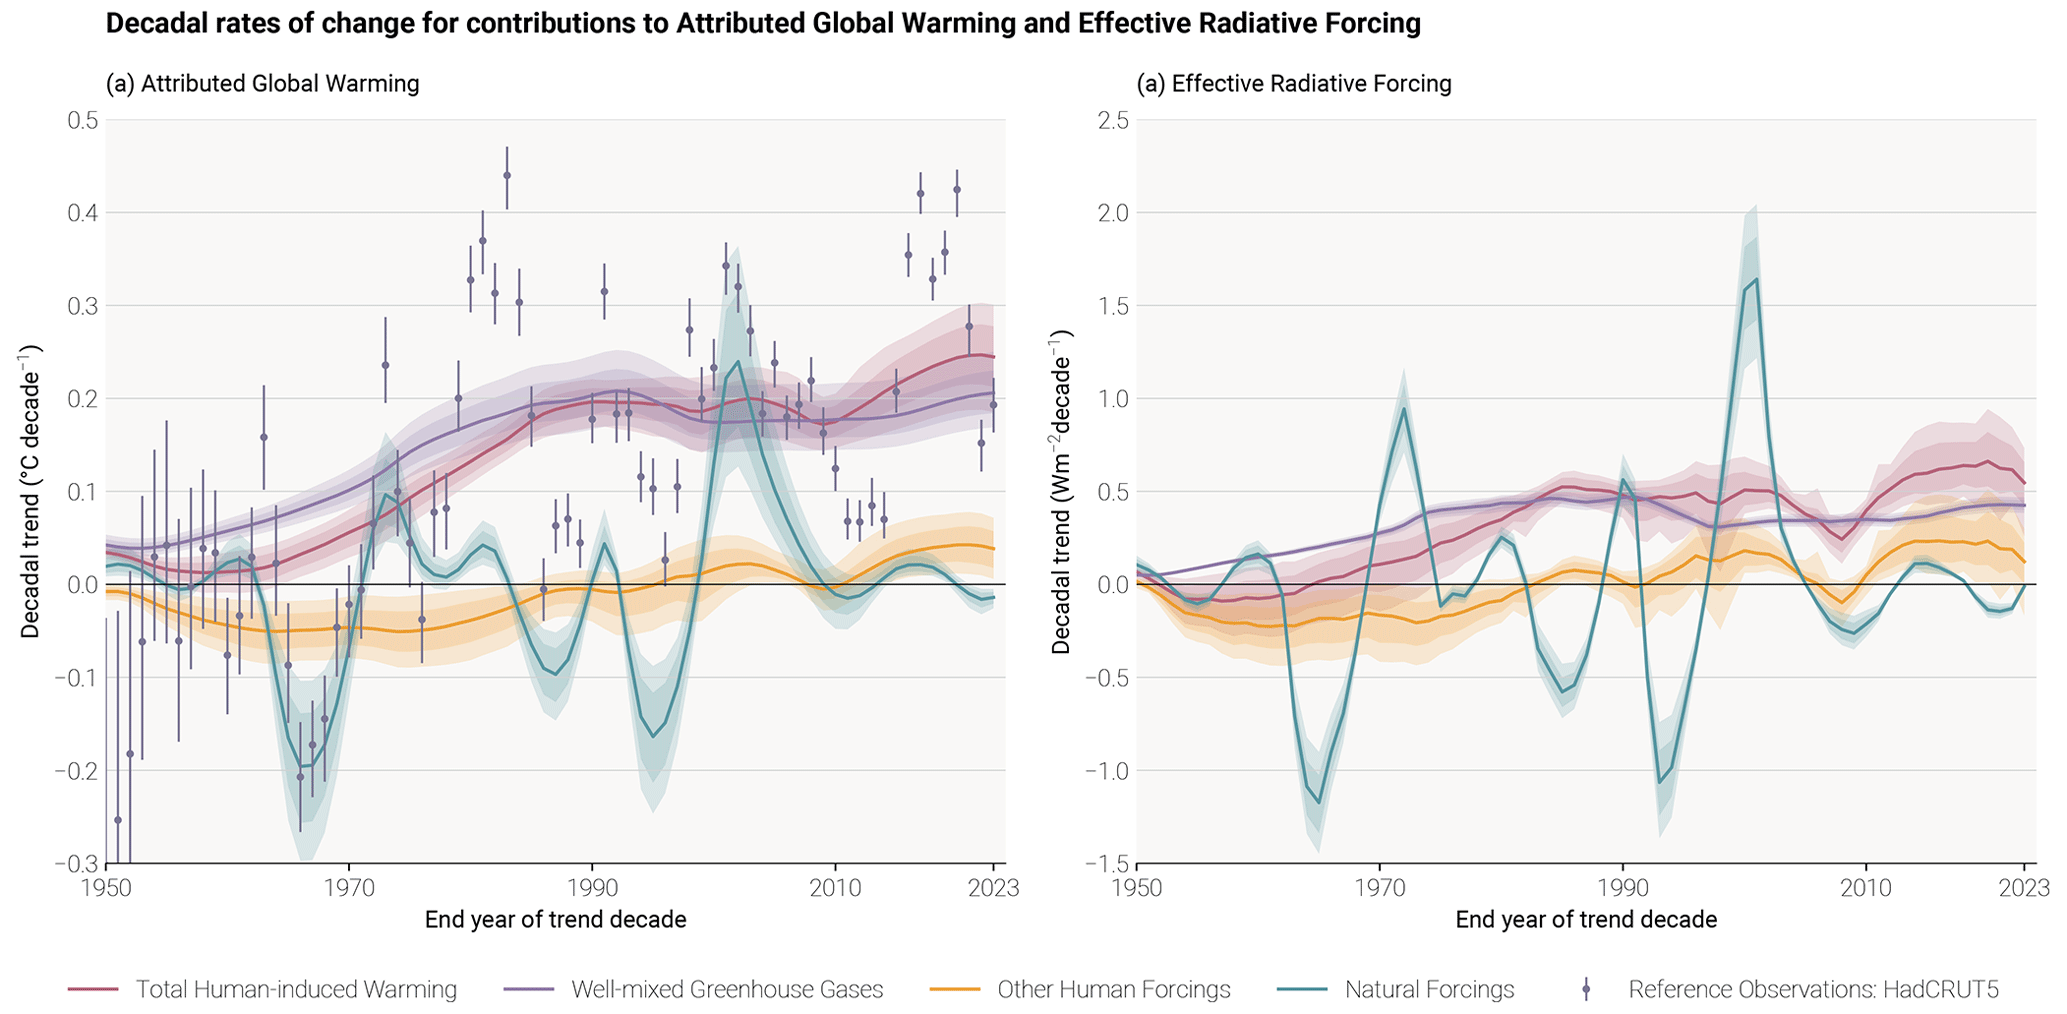
Figure 8Rates of (a) attributable warming (global mean surface temperature (GMST)) and (b) effective radiative forcing. The attributable warming rate time series are calculated using the Global Warming Index method with full ensemble uncertainty. The observed GMST rates included for reference are also calculated with uncertainty from the HadCRUT5 ensemble and, for consistency with the attributed warming rates, do not include standard regression error, which, for observed warming, would increase the size of the error bars. The effective radiative forcing rates are calculated using a representative 1000-member ensemble of the forcings provided in Sect. 4 of this paper.
A very simple estimate of the rate of human-induced warming and effective radiative forcing was made last year by Forster et al. (2023), which indicated that warming rates were unprecedented, surpassing 0.2 °C per decade (although no uncertainty range was given). That rate calculation was based on annual changes in decade-average anthropogenic warming levels from the GWI method (see Sect. S7.2). This year, attributed anthropogenic warming rates are calculated for all attribution methods using linear trends, as used in AR6, with the overall rate estimate updated in a manner that is fully traceable to and consistent with the rate assessment in AR6.
7.4.1 SR1.5 and AR6 definitions of warming rate
In recent IPCC assessments the definition of warming rate follows two approaches, both of which rely to some extent on expert judgement. In SR1.5 several studies were considered, each defining the rate of warming in various ways and over various timescales; the assessment concluded that the rate of increase in anthropogenic warming in 2017 was 0.2 °C per decade with a likely range of 0.1 to 0.3 °C per decade. In AR6 WGI, the rate of anthropogenic warming utilised three methods (GWI, KCC and ROF; see Sect. S7.2), with the rate defined consistently across all three as the linear trend in the preceding decade of attributed anthropogenic warming. While the best-estimate trends reported in AR6 were all higher than the SR1.5 assessment, Eyring et al. (2021) concluded that there was insufficient evidence to change the SR1.5 assessed anthropogenic warming trend in the AR6 WGI report, which therefore remained unchanged from SR1.5 at 0.2 °C per decade (with a likely range of 0.1 to 0.3 °C per decade). Both the SR1.5 and AR6 assessments were given to a precision of 0.1 °C per decade only.
7.4.2 Methods
Following AR6's definition, the rate of warming is defined here as the rolling 10-year linear trend in attributed anthropogenic warming, calculated using ordinary-least-squares linear regression. Note that, as with the level of anthropogenic warming, this decadal approach means the rate of warming in a given year is the trend centred on the preceding decade (i.e. it is 5 years out of date). Each of the three attribution methods used to calculate the level of warming is used again here to estimate separate anthropogenic warming rates.
Note that only the GWI methodology relies on the updated historical forcing time series presented in Sect. 4, with the other two methods (ROF and KCC) relying on CMIP6 SSP2-4.5 simulations, which are increasingly out of date (see Sect. S7.2). Very recent changes in anthropogenic forcing, for example, desulfurisation of shipping fuels or the impact of COVID-19, may therefore not be captured fully in the decade-average trend. Further, the anthropogenic forcing record used for attributing warming contains small contributions from biomass burning in the natural environment because of difficulty separating this in estimates of anthropogenic aerosol emissions. It is not expected that either of these effects substantially biases the globally averaged rate of warming estimated here.
7.4.3 Results
Estimates from the GWI (based on observed warming and forcing) and KCC (based on CMIP simulations) both report results in terms of GMST and are in close agreement across each time period. Estimates derived with the ROF method (also based on CMIP simulations) are also reported for GMST here and are more strongly influenced by residual internal variability that remains in the anthropogenic warming signal due to the limitations in size of the CMIP ensemble, as reflected in their broader uncertainty ranges. Given that the ROF results are in this sense outlying, the standard approach of taking the median result for the overall multi-method assessment is adopted.
Results for human-induced warming rate are summarised in Table 7 and Fig. 8. For the purpose of providing annual updates, we take the median estimate at a precision of 0.01 °C per decade, resulting in an overall best estimate for 2014–2023 of 0.26 °C per decade. This increased rate relative to the AR6 assessment of 0.2 °C per decade is broken down in the following way: (i) 0.03 °C per decade of the increase is from a change in rounding precision (updating the AR6 assessment for the 2010–2019 warming rate from 0.2 °C per decade to 0.23 °C per decade), (ii) 0.02 °C per decade of the increase is due to methodological and dataset updates (updating the 2010–2019 warming rate from 0.23 °C per decade to 0.25 °C per decade; this includes the effect of adding 4 additional observed years, which affects the attribution for the entire historical period), and (iii) only 0.01 °C per decade of the increase is due to a substantive increase in rate for the 2014–2023 period since the 2010–2019 period (updating 0.25 °C per decade for 2010–2019 to 0.26 °C per decade for 2014–2023). The spread of rates across the three attribution methods remains similar to their spread in AR6 and hence do not support a decrease in the uncertainty range in this update. However, to better reflect the closer agreement of the 5 % floors and the larger spread in the 95 % ceilings of the three methods, and high rate from the ROF method, we update the uncertainty range for the rate of human-induced warming from [0.1–0.3] °C per decade in AR6 to [0.2–0.4] °C per decade, leaving the precision and range unchanged, noting that this is asymmetric around the central estimate. Therefore, the rate of human-induced warming for the 2014–2023 decade is concluded to be 0.26 °C per decade with a range of [0.2–0.4] °C per decade).
Table 7Updates to the IPCC AR6 rate of human-induced warming. Results for each method are given as best estimates with 5 %–95 % confidence, as described in the main text; assessment results are given as a best estimate with likely range in brackets. Results from AR6 WGI (Chap. 3 Sect. 3.3.1.1.2 Table 3.1) are quoted in column (i), and compared with a repeat calculation using the updated methods and datasets in column (ii), and finally updated for the 2014-2023 period in column (iii). The AR6 assessment result was identical to the SR1.5 assessment result, though the latter was based on a different set of studies and time frames.
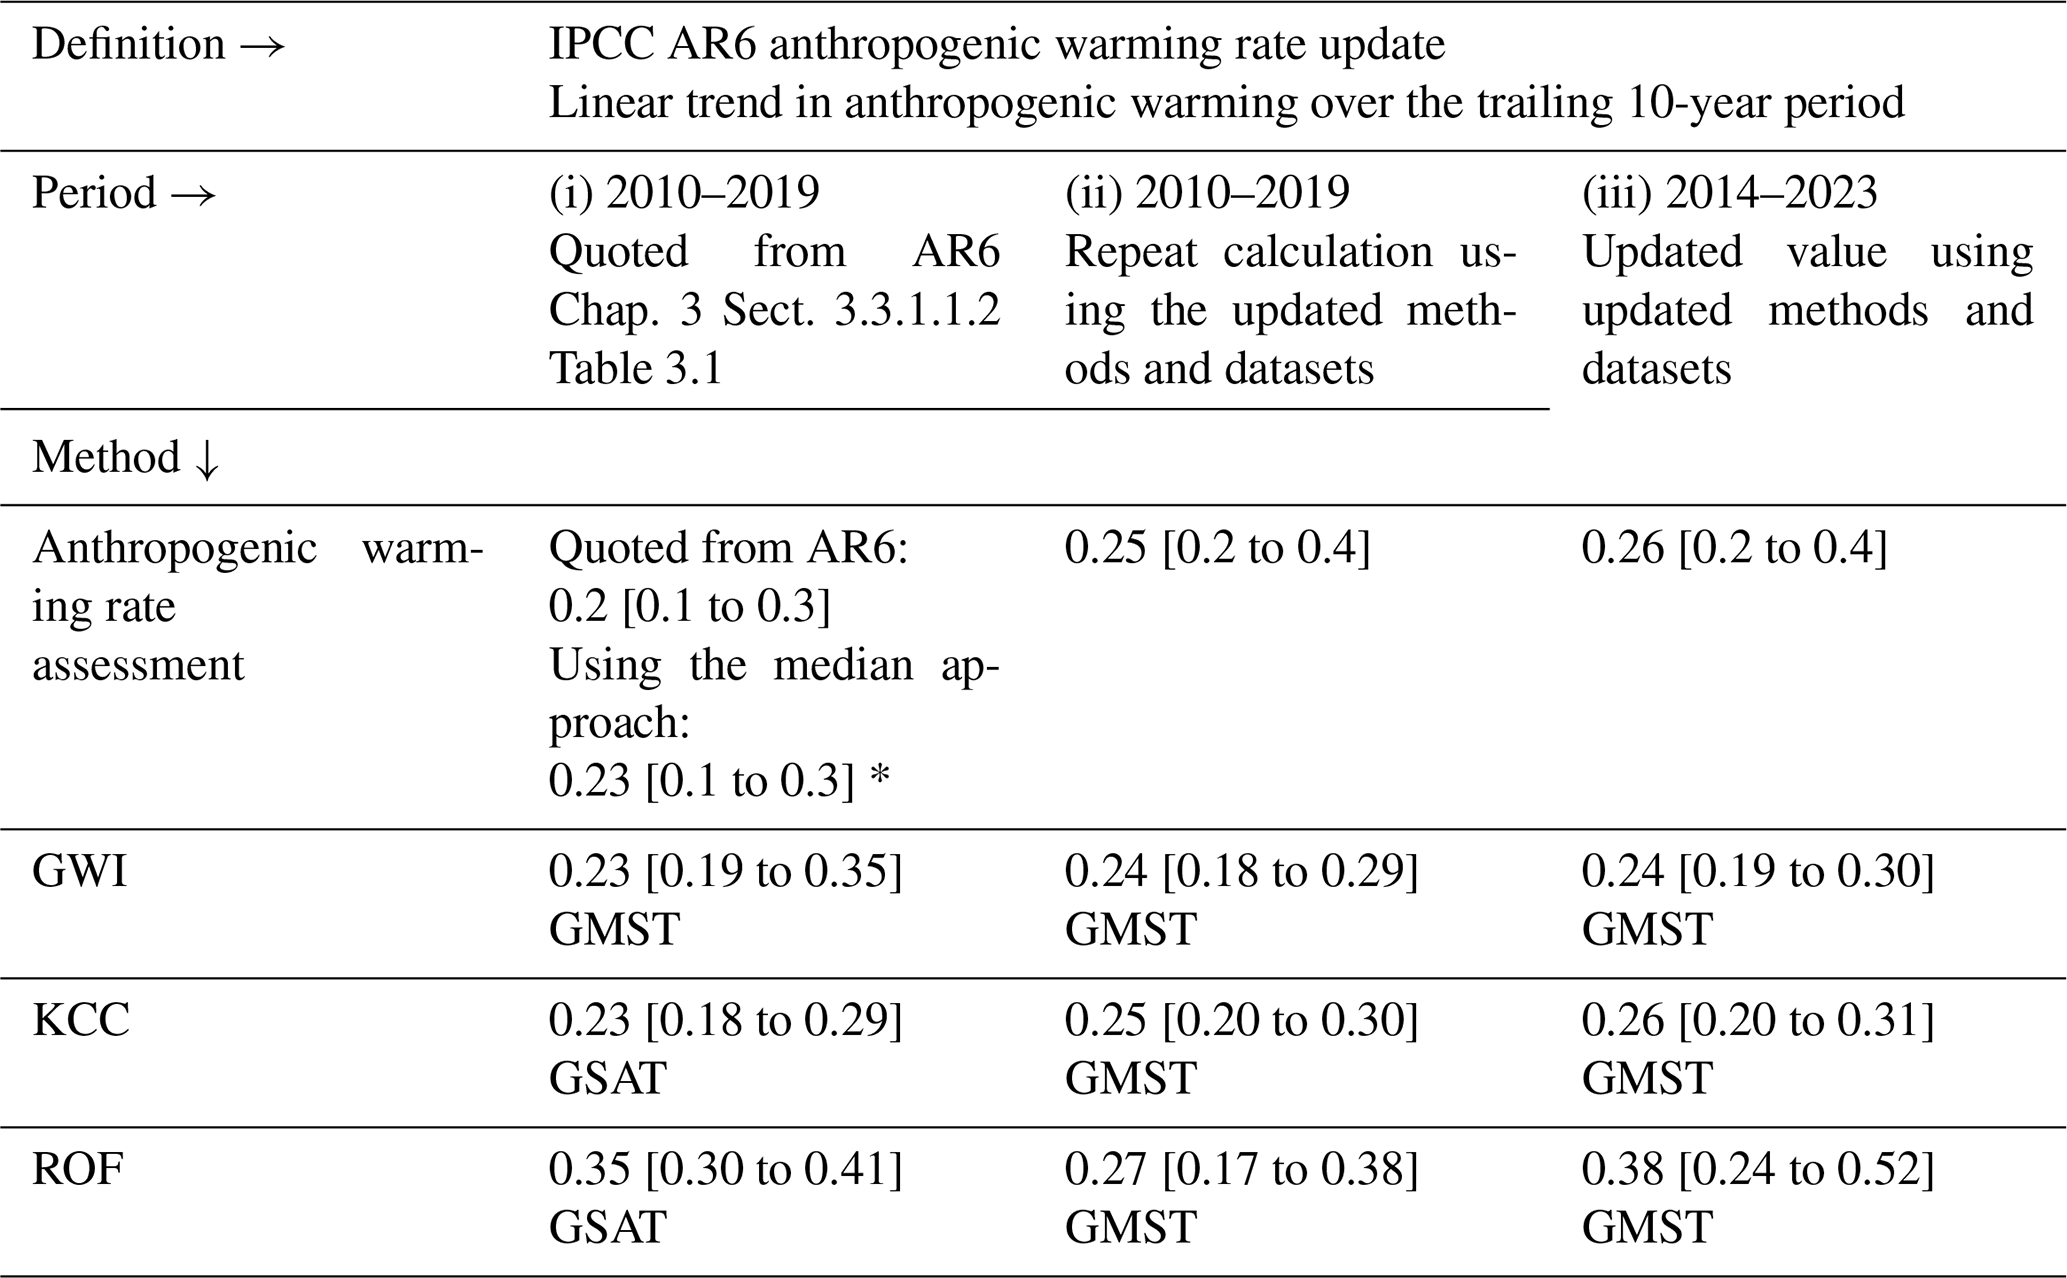
* Note that for clarity and ease of comparison with this year's updated assessment, the assessed rate in column (i) both quotes the assessment from AR6 and retrospectively applies the median approach adopted in this paper.
Figure 8 and Table 7 include a breakdown of well-mixed GHGs and other human forcings (including aerosols) and natural forcing contributions since pre-industrial times. The rate time series with ensemble uncertainty are depicted by the GWI method, which is based on observed warming and historical forcing. The rate of total attributable warming (the sum of anthropogenic and natural, not plotted) has good correspondence with the reference plotted observed warming rates. The rates for the attributed warming also correlate closely with the forcing rates. Warming rates have remained high due to strong GHG warming from high emissions and declining aerosol cooling (Forster et al., 2023; Quaas et al., 2022; Jenkins et al., 2022).
AR5 (IPCC, 2013) assessed that global surface temperature increase is close to linearly proportional to the total amount of cumulative CO2 emissions (Collins et al., 2013). The most recent AR6 report reaffirmed this assessment (Canadell et al., 2021). This near-linear relationship implies that for keeping global warming below a specified temperature level, one can estimate the total amount of CO2 that can ever be emitted. When expressed relative to a recent reference period, this is referred to as the remaining carbon budget (Rogelj et al., 2018).
AR6 assessed the remaining carbon budget (RCB) in Chap. 5 of its WGI report (Canadell et al., 2021) for 1.5, 1.7 and 2 °C thresholds (see Table 7). They were also reported in the Summary for Policymakers (Table SPM.2, IPCC, 2021b). These are updated in this section using the same method as last year (Forster et al., 2023).
The RCB is estimated by application of the WGI AR6 method described in Rogelj et al. (2019), which involves the combination of the assessment of five factors: (i) the most recent decade of human-induced warming (given in Sect. 7), (ii) the transient climate response to cumulative emissions of CO2 (TCRE), (iii) the zero emissions commitment (ZEC), (iv) the temperature contribution of non-CO2 emissions and (v) an adjustment term for Earth system feedbacks that are otherwise not captured through the other factors. AR6 WGI reassessed all five terms (Canadell et al., 2021). The incorporation of Earth system feedbacks was further considered by Lamboll and Rogelj (2022). Lamboll et al. (2023) further considered the temperature contribution of non-CO2 emissions, while Rogelj and Lamboll (2024) clarified the reductions in non-CO2 that are assumed in the RCB estimation.
The RCB for 1.5, 1.7 and 2 °C warming levels is re-assessed based on the most recent available data. Estimated RCBs are reported in Table 8. They are expressed both relative to 2020 to compare to AR6 and relative to the start of 2024 for estimates based on the 2014–2023 human-induced warming update (Sect. 7). Note that between the start of 2020 and the end of 2023, about 164 Gt CO2 was emitted (Sect. 2). Based on the variation in non-CO2 emissions across the scenarios in AR6 WGIII scenario database, the estimated RCB values can be higher or lower by around 200 Gt CO2 depending on how deeply non-CO2 emissions are reduced (Lamboll et al., 2023; Rogelj and Lamboll, 2024). The impact of non-CO2 emissions on warming includes both the warming effects of other greenhouse gases such as methane and the cooling effects of aerosols such as sulfates. Updating these pathways increased the estimate of the importance of aerosols, which are expected to decline with time in low emissions pathways (Rogelj et al., 2014; Rogelj and Lamboll, 2024), causing a warming and decreasing the RCB (Lamboll et al., 2023). Structural uncertainties give inherent limits to the precision with which remaining carbon budgets can be quantified. These particularly impact the 1.5 °C RCB. Overall, the 1.5 °C compatible budget is very small and shrinking fast due to continuing high global CO2 emissions.
Table 8Updated estimates of the remaining carbon budget for 1.5, 1.7 and 2.0 °C, for five levels of likelihood, considering only uncertainty in TCRE. Estimates start from AR6 WGI estimates (first row for each warming level), updated with the latest MAGICC emulator and scenario information from AR6 WGIII (from second row for each warming level) and an update of the anthropogenic historical warming, which is estimated for the 2014–2023 period (third row for each warming level). Estimates are expressed relative to the start of either the year 2020 or the year 2024. The probability only includes the uncertainty in how the Earth immediately responds to carbon emissions, not long-term committed warming or uncertainty in other emissions. All values are rounded to the nearest 50 Gt CO2. Bold numbers refer to the full remaining carbon budget estimate containing all terms.
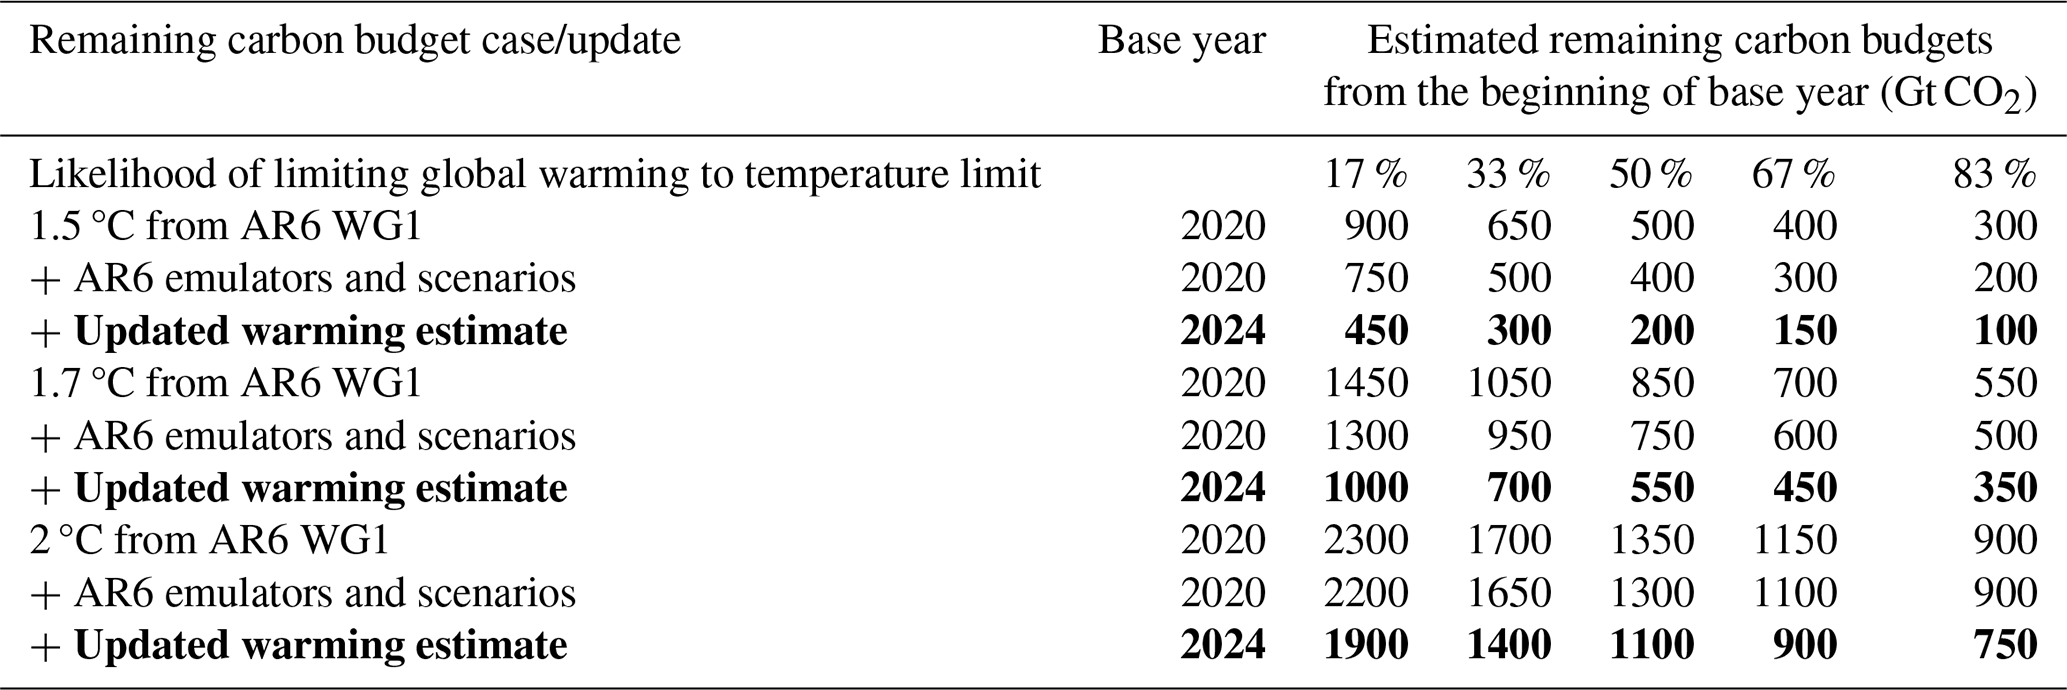
Updated RCB estimates presented in Table 8 for 1.5, 1.7 and 2.0 °C of global warming are smaller than AR6, and geophysical and other uncertainties therefore have become larger in relative terms. This is a feature that will have to be kept in mind when communicating budgets. The estimates presented here differ from those presented in the annual Global Carbon Budget (GCB) publications (Friedlingstein et al., 2023). The GCB 2023 used the average between the AR6 WGI estimate and the Forster et al. (2023) estimates. The RCB estimates presented here consider the same updates in historical CO2 emissions from the GCB as well as the latest available quantification of human-induced warming to date and a reassessment from AR6 of non-CO2 warming contributions.
The RCB for limiting warming to 1.5 °C is rapidly diminishing. It is important, however, to correctly interpret this information. RCB estimates consider projected reductions in non-CO2 emissions that are aligned with a global transition to net zero CO2 emissions (Lamboll et al., 2023; Rogelj and Lamboll, 2024). These estimates assume median reductions in non-CO2 emissions between 2020–2050 of CH4 (about 50 %), N2O (about 20 %) and SO2 (about 80 %) (Rogelj and Lamboll, 2024) (see Sect. S8 and Table S5). If these non-CO2 greenhouse gas emission reductions are not achieved, the RCB will be smaller (see Lamboll et al., 2023; Rogelj and Lamboll, 2024). This year's update of the 1.5 °C budget uses the historical warming level for the 2014–2023 period of 1.19 °C, with a 0.13 °C future contribution of non-CO2 warming. Assuming a median estimate of 0.45 °C per 1000 Gt CO2, this gives around 400 Gt CO2 from the midpoint of the period, from which we subtract around 200 Gt CO2 (205 Gt CO2 emissions from the middle of the 2014–2023 period and 8 Gt CO2 being the median estimate of the impact of Earth system feedbacks that would otherwise not be covered). This gives an RCB for 1.5 °C with 50 % probability of 200 Gt CO2. The full calculation includes the distributions of these values for the uncertainty estimates.
Note that the 50 % RCB is expected to be exhausted a few years before the 1.5 °C global warming level is reached due to the way it factors future warming from non-CO2 emissions into its estimate.
Changes in climate and weather extremes are among the most visible effects of human-induced climate change. Within AR6 WGI, a full chapter was dedicated to the assessment of past and projected changes in extremes on continents (Seneviratne et al., 2021), and the chapter on ocean, cryosphere and sea level changes also provided assessments on changes in marine heatwaves (Fox-Kemper et al., 2021). Global indicators related to climate extremes include averaged changes in climate extremes, for example, the mean increase in annual minimum and maximum temperatures on land (AR6 WGI Chap. 11, Fig. 11.2, Seneviratne et al., 2021) or the area affected by certain types of extremes (AR6 WGI Chap. 11, Box 11.1, Fig. 1, Seneviratne et al., 2021; Sippel et al., 2015). In contrast to global surface temperature, extreme indicators are less established.
The climate indicator of changes in temperature extremes consists of land average annual maximum temperatures (TXx) (excluding Antarctica). As part of this update, we provide an upgraded version of Fig. 6 from Forster et al. (2023), which in turn is based on Fig. 11.2 from Seneviratne et al. (2021) (Fig. 9). As last year, three datasets are analysed: HadEX3 (Dunn et al., 2020), Berkeley Earth Surface Temperature (building off Rohde et al., 2013) and the fifth-generation ECMWF atmospheric reanalysis of the global climate (ERA5; Hersbach et al., 2020). HadEX3 is currently static and is not being updated. Berkeley Earth has been updated, resulting in TXx differences for most years (less than 0.1 °C), and now includes data for 2022. Of the three datasets, only ERA5 covers the whole of 2023 at the present time. TXx is calculated by averaging the annual maximum temperature over all available land grid points (excluding Antarctica) and then converted to anomalies with respect to a base period of 1961–1990. To express the TXx as anomalies with respect to 1850–1900, we add an offset of 0.52 °C to all three datasets. See Sect. S9 for details on the data selection, averaging and offset computation. We note that Berkeley Earth has slightly smaller trends than ERA5 and that this might warrant further investigation.
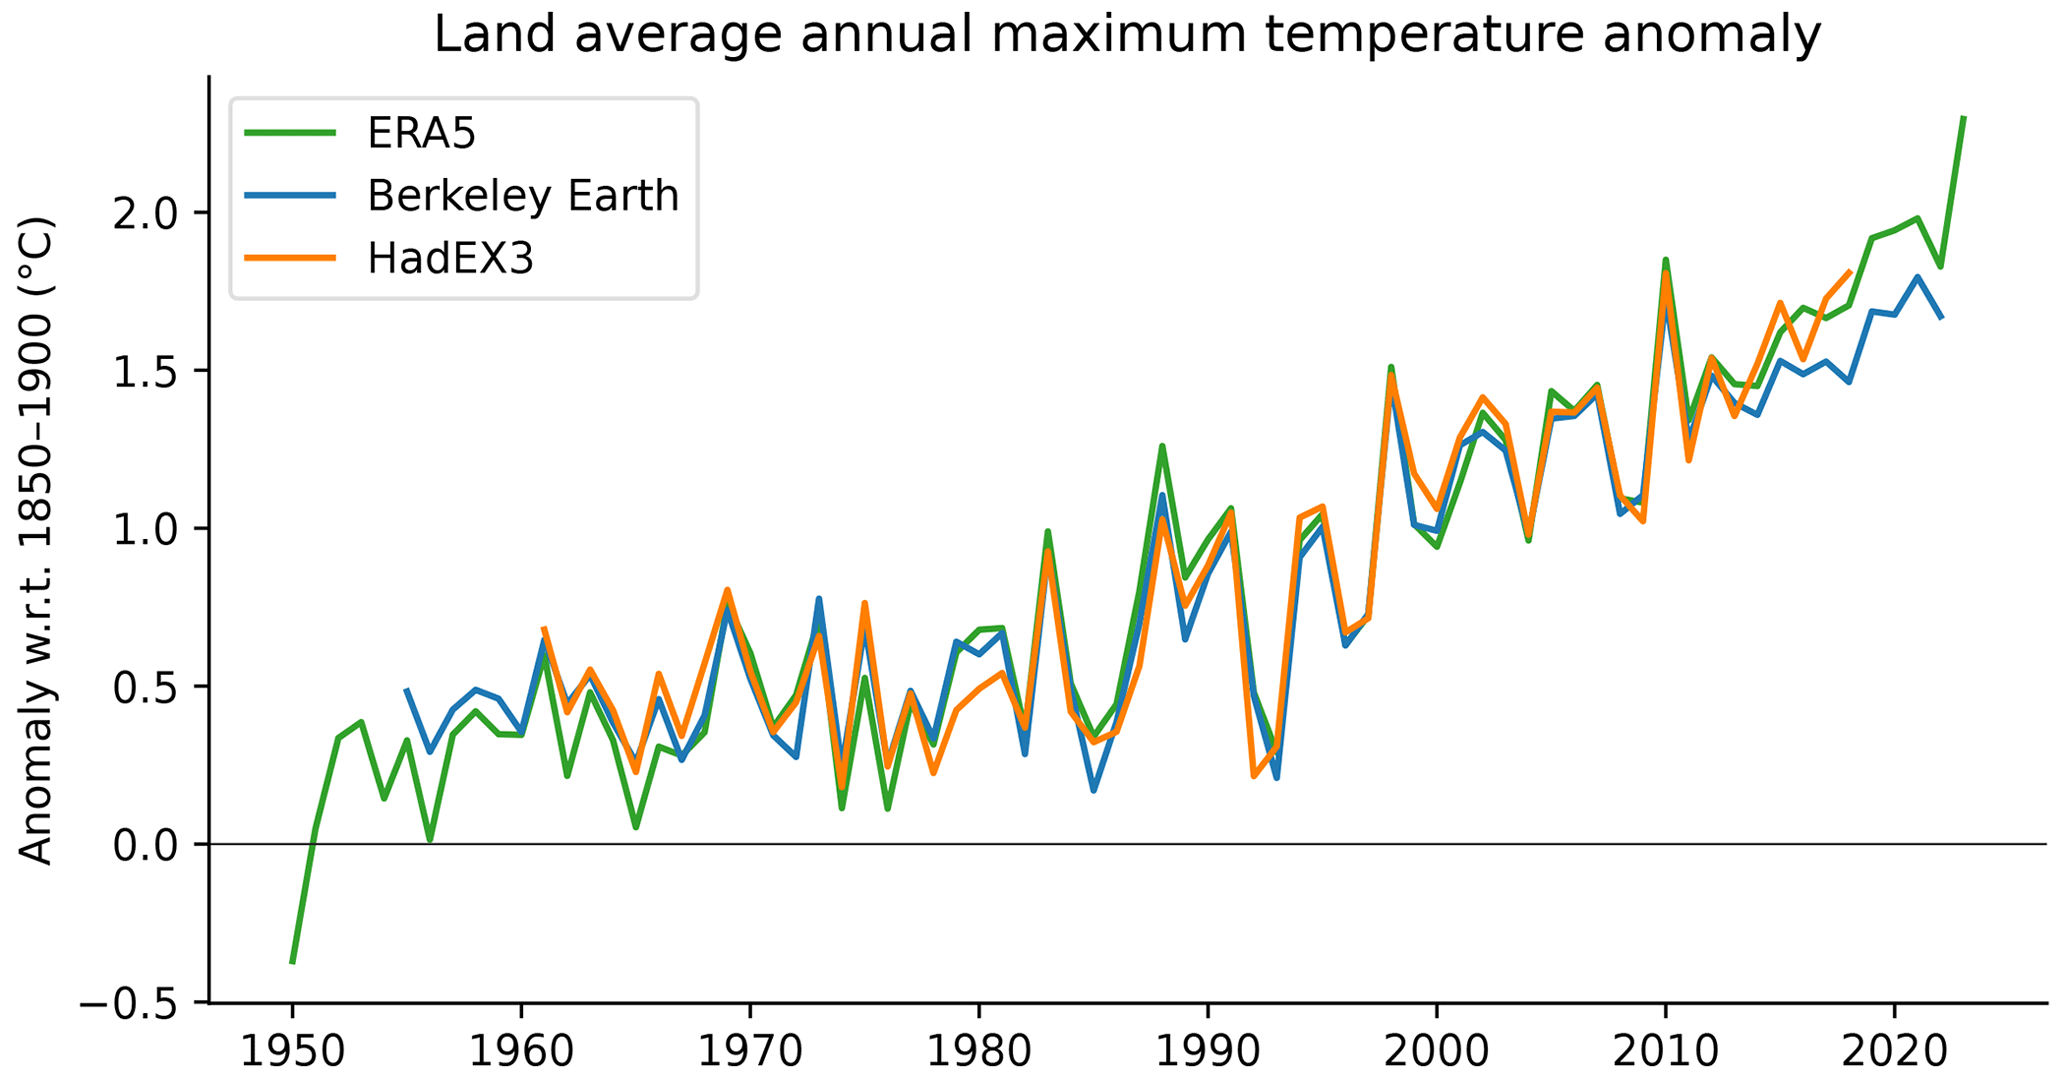
Figure 9Time series of observed temperature anomalies for land average annual maximum temperature (TXx) for ERA5 (1950–2023), Berkeley Earth (1955–2022) and HadEX3 (1961–2018), with respect to 1850–1900. Note that the datasets have different spatial coverage and are not coverage-matched. All anomalies are calculated relative to 1961–1990, and an offset of 0.52 °C is added to obtain TXx values relative to 1850–1900. Note that while the HadEX3 numbers are the same as shown in Fig. 11.2 of Seneviratne et al. (2021), these numbers were not specifically assessed.
Our climate has warmed rapidly in the last few decades (Sect. 6), which also manifests in changes in the occurrence and intensity of climate and weather extremes. From about 1980 onwards, all employed datasets point to a strong TXx increase, which coincides with the transition from global dimming, associated with aerosol increases, to brightening, associated with aerosol decreases (Wild et al., 2005, Sect. 3). The ERA5-based TXx warming estimate w.r.t. 1850–1900 for 2023 is at 2.3 °C, which is an increase of more than 0.5 °C compared to 2022 and which shatters the previous record by more than 0.3 °C. On longer timescales, land average annual maximum temperatures have warmed by more than 0.6 °C in the past 10 years (1.81 °C with respect to pre-industrial conditions) compared to the first decade of the millennium (1.21 °C; Table 9). Since the offset relative to our pre-industrial baseline period is calculated over the 1961–1990, temperature anomalies align by construction over this period but can diverge afterwards. In an extensive comparison of climate extreme indices across several reanalyses and observational products, Dunn et al. (2022) point to an overall strong correspondence between temperature extreme indices across reanalysis and observational products, with ERA5 exhibiting especially high correlations to HadEX3 among all regularly updated datasets.
Table 9Anomalies of land average annual maximum temperature (TXx) for recent decades based on HadEX3 and ERA5.
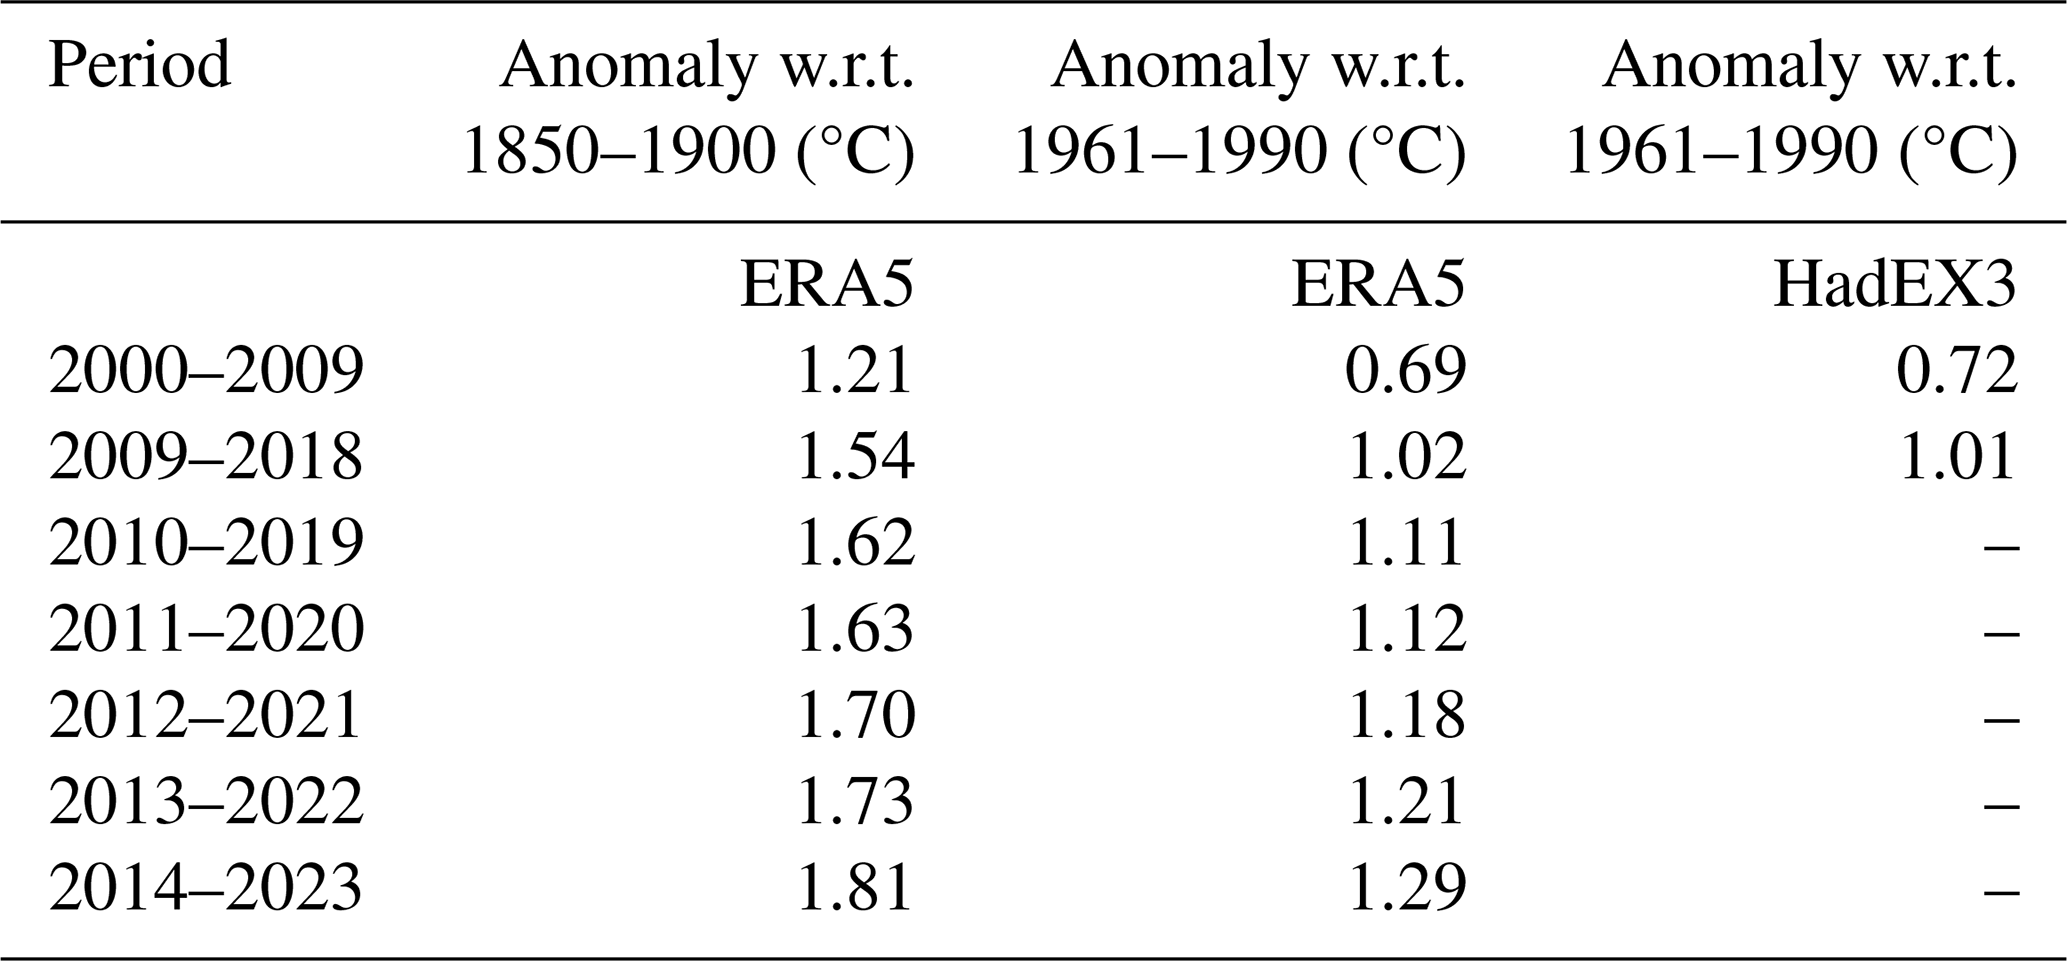
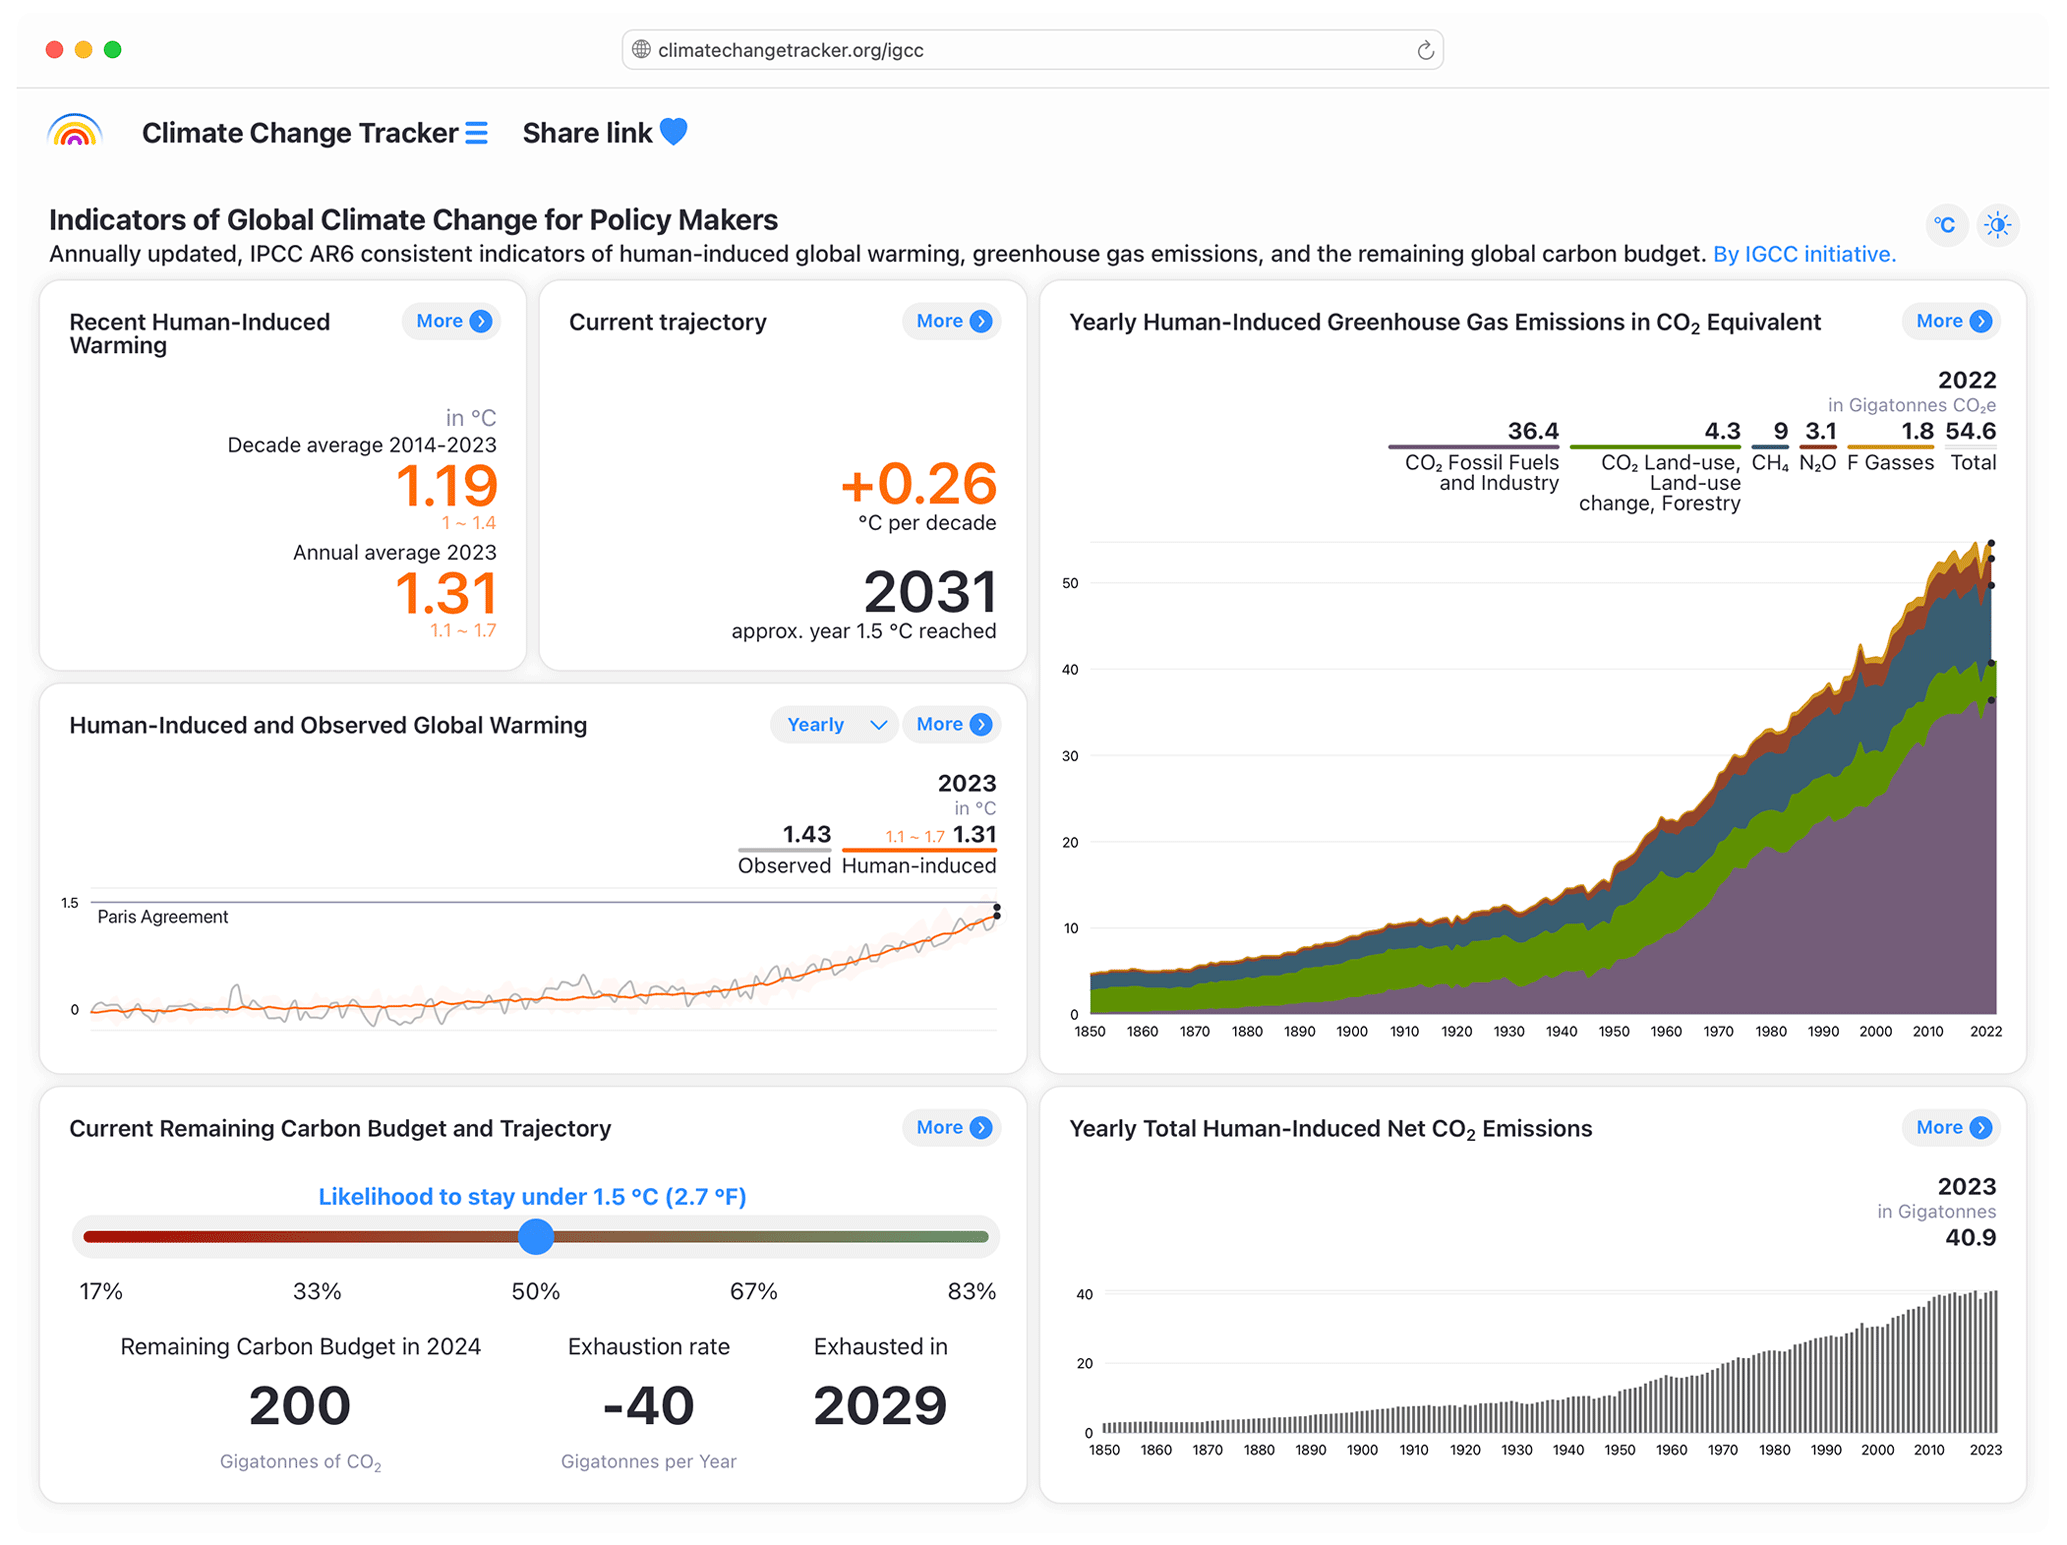
Figure 10Screenshot dashboard from https://climatechangetracker.org/igcc (last access: 2 June 2024), Climate Change Tracker (2024).
We publish a set of selected key indicators of global climate change via Climate Change Tracker (https://climatechangetracker.org/igcc, last access: 2 June 2024, Climate Change Tracker, 2024), a platform which aims to provide reliable, user-friendly, high-quality interactive dashboards including visualisations, data, and easily accessible insights of this paper (see Fig. 10).
With Climate Change Tracker, we aim to reach a wider public audience, including policymakers involved in UNFCCC negotiations and people with significant roles in climate change mitigation and adaptation. Climate Change Tracker plans to update significant indicators multiple times throughout the year, providing an up-to-date picture of the indicators of climate change. Within the dashboards, all data are traceable to the underlying sources.
The carbon budget calculation is available from https://github.com/Rlamboll/AR6CarbonBudgetCalc/tree/v1.0.1 (Lamboll and Rogelj, 2024). The code and data used to produce other indicators are available in repositories under https://github.com/ClimateIndicator/data/tree/v2024.05.29b (Smith et al., 2024b). All data are available from https://doi.org/10.5281/zenodo.11388387 (Smith et al., 2024a). Data are provided under the CC-BY 4.0 Licence.
HadEX3 [3.0.4] data were obtained from https://catalogue.ceda.ac.uk/uuid/115d5e4ebf7148ec941423ec86fa9f26 (Dunn et al., 2023) on 5 April 2023 and are © British Crown Copyright, Met Office, 2022, provided under an Open Government Licence; http://www.nationalarchives.gov.uk/doc/open-government-licence/version/2/ (last access: 2 June 2023).
The second year of the Global Climate Change (IGCC) initiative has built on last year's effort and the AR6 report cycle to provide a comprehensive update of the climate change indicators required to estimate the human-induced warming and the remaining carbon budget. Table 10 and Fig. 11 present a summary of the headline indicators from each section compared to those given in the AR6 assessment and also summarise methodological updates. The main substantive dataset change since AR6 is that land-use CO2 emissions have been revised down by around 2 Gt CO2 (Table 10). However, as CO2 ERF and human-induced warming estimates depend on concentrations, not emissions, this does not affect most of the other findings. Note it does slightly increase the remaining carbon budget, but this is only by 5 Gt CO2, less than the 50 Gt CO2 rounding precision.
Table 10Summary of headline results and methodological updates from the Indicators of Global Climate Change (IGCC) initiative.
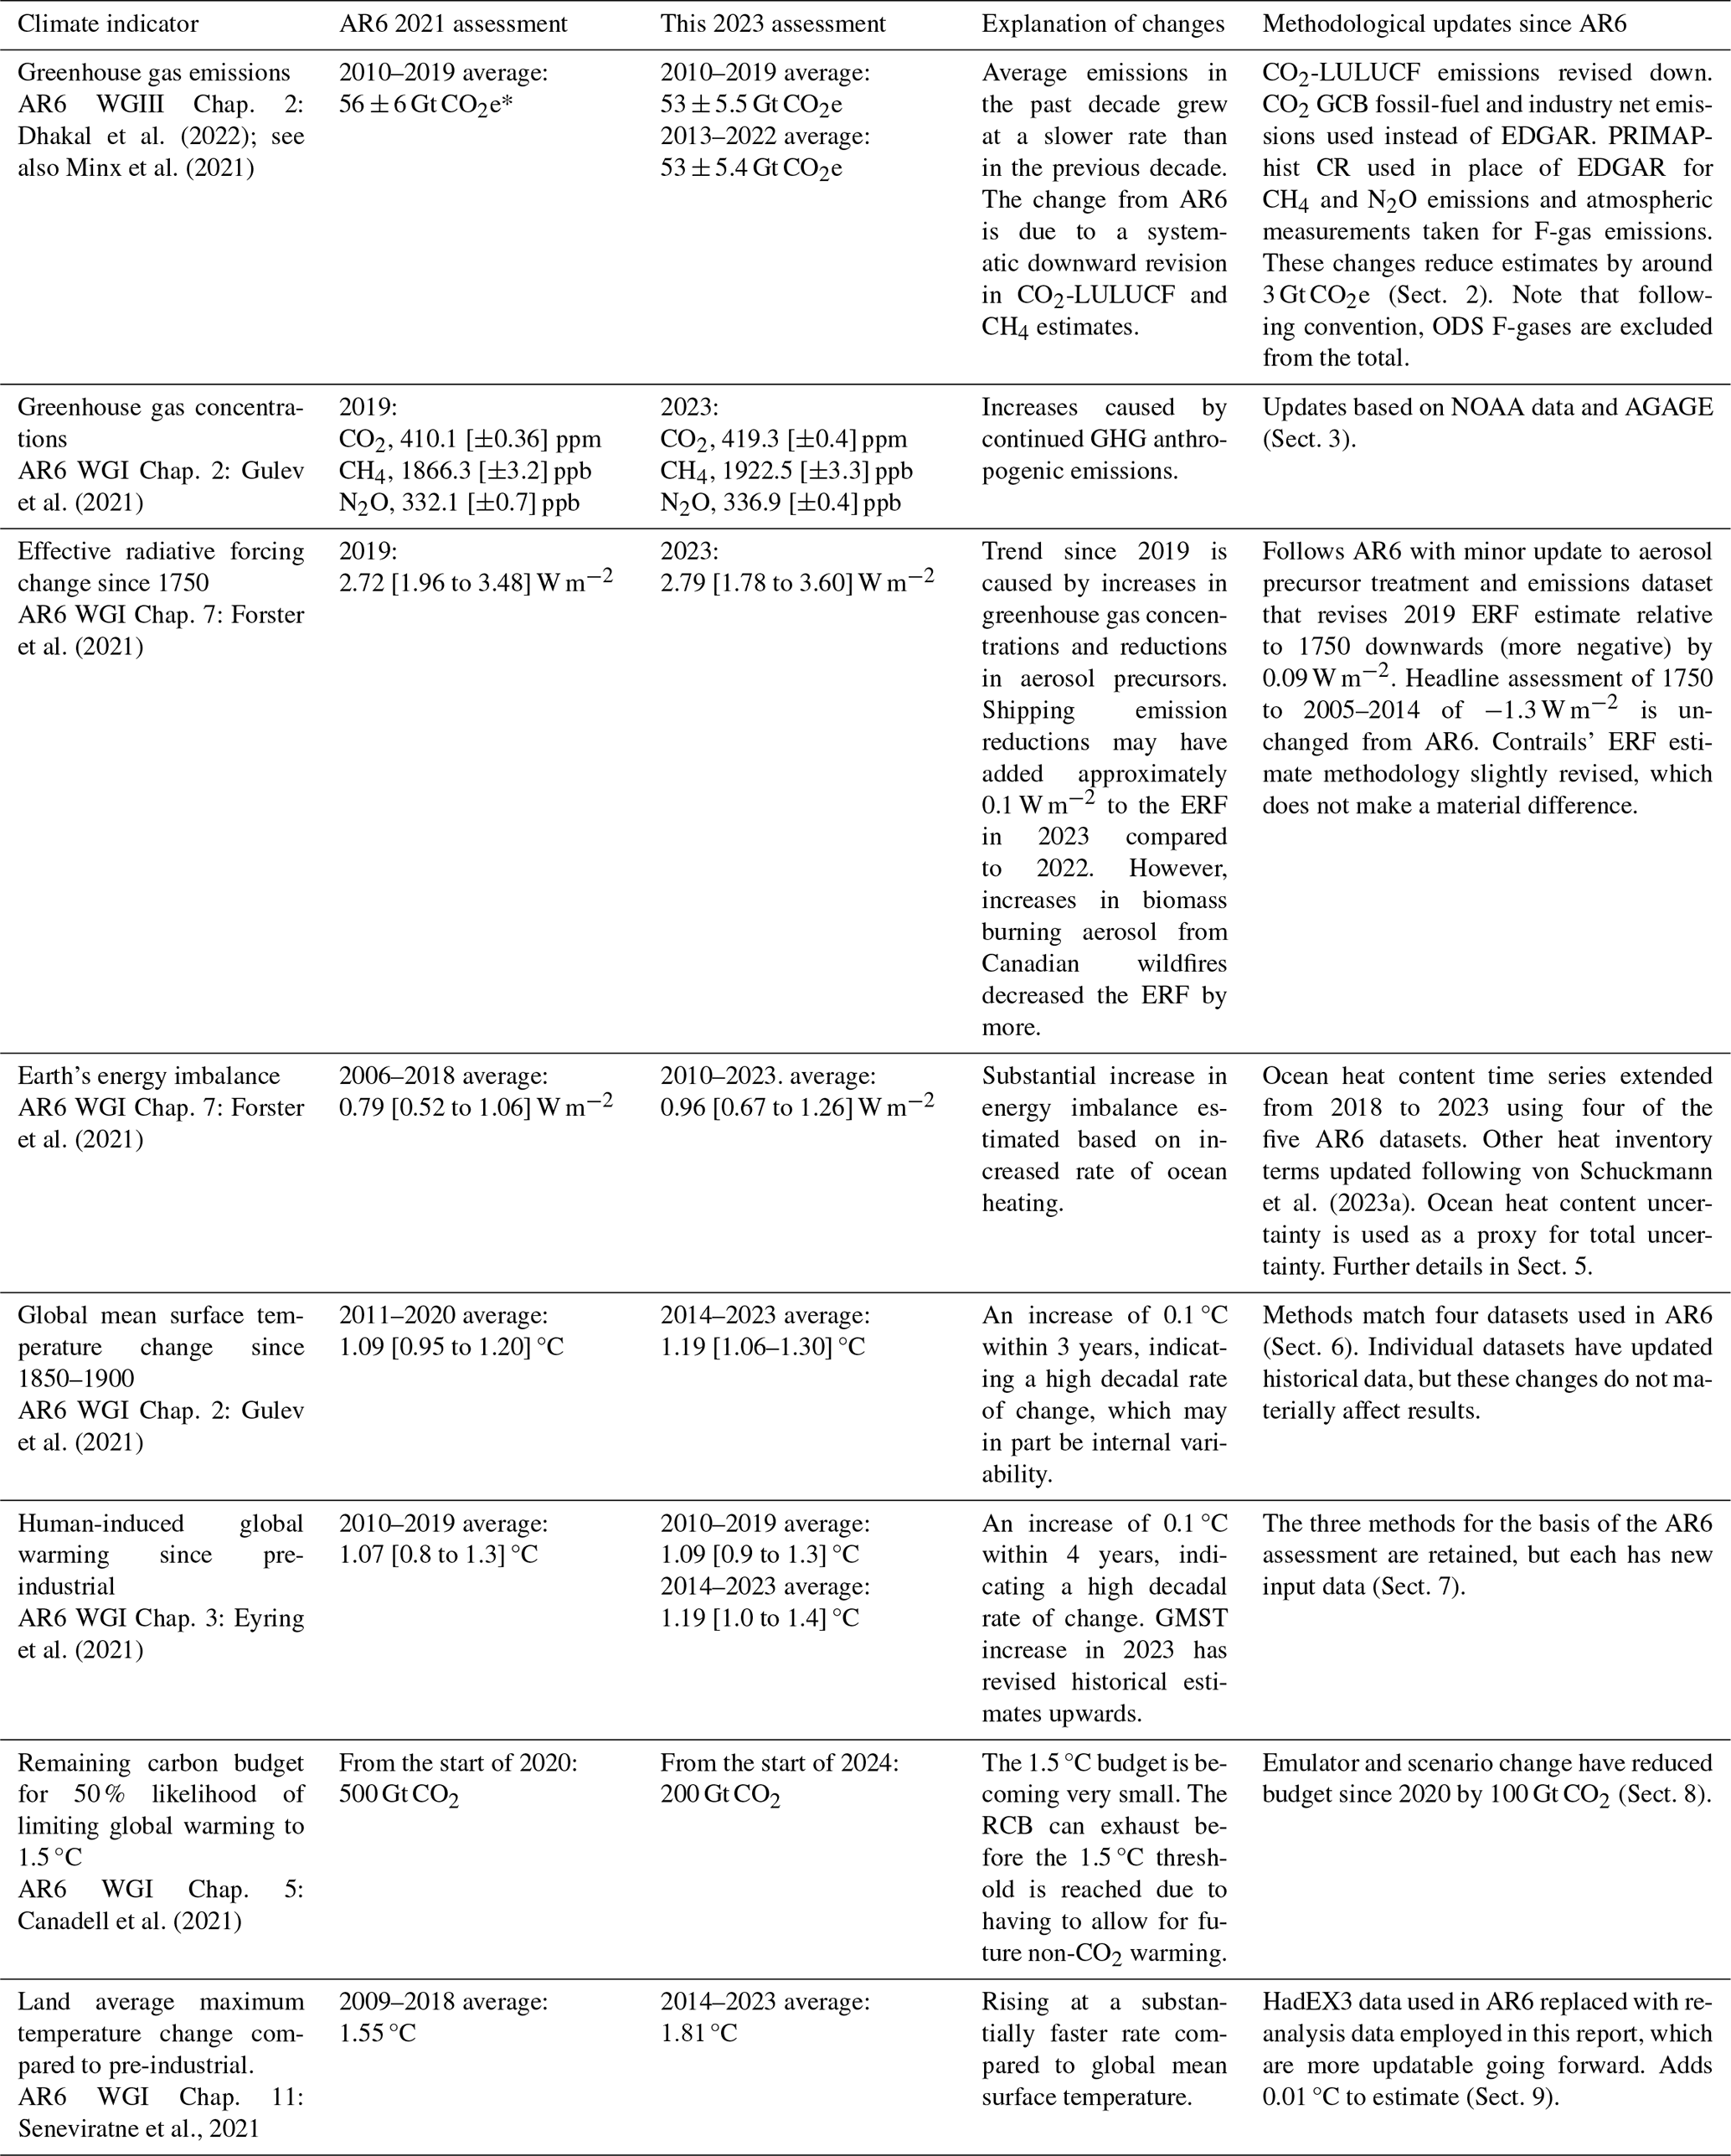
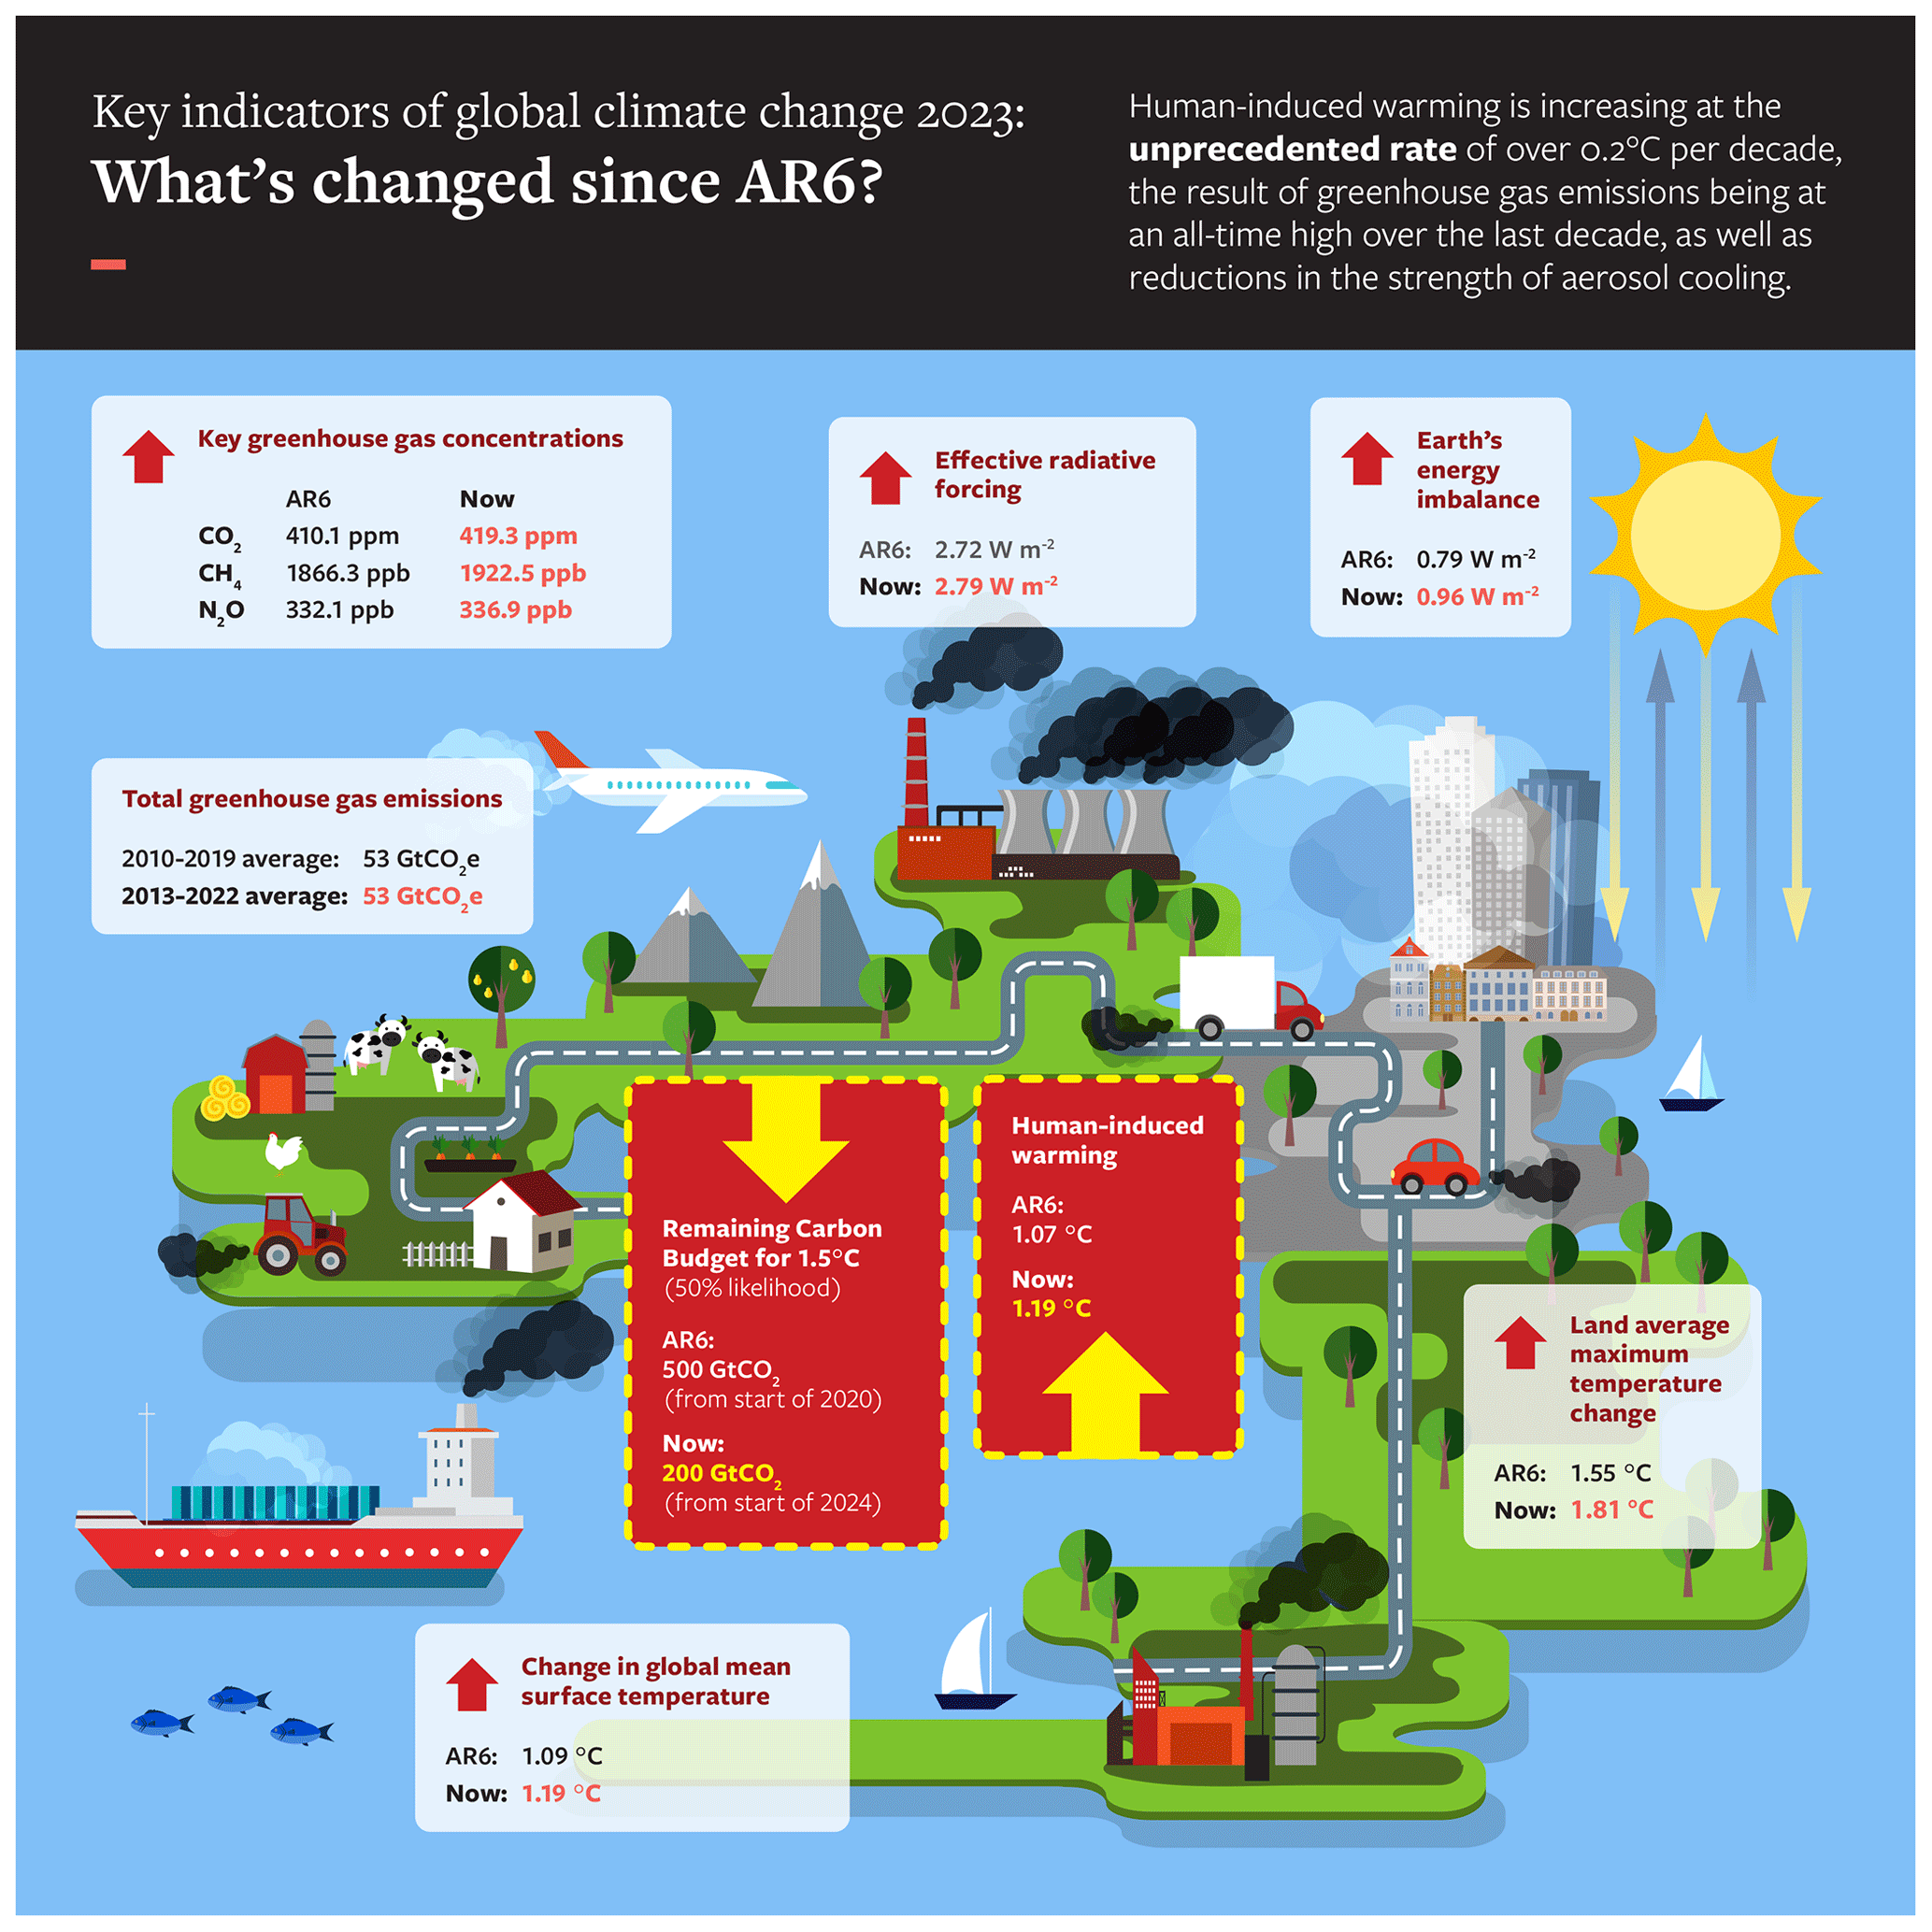
Last year witnessed a large increase in GMST (Sect. 6), approaching 1.5 °C above 1850–1900 levels, which has widely been reported in the press. The 2022–2023 increase was the third-largest annual increase in the instrumental record after 1876–1877 and 1976–1977, two other periods with a strong transition from La Niña to El Niño conditions. The reasons for the change, especially regarding the potential role of external forcings such as shipping emission reductions compared to internal variability, are currently being investigated (e.g. Schmidt, 2024; Gettelman et al. 2024). Our work looks at long-term changes and does not directly investigate the reasons for the jump in GMST levels, yet we note that our best estimate of human-induced warming in 2023 is 1.31 (1.1 to 1.7) °C (Table 6), below the observed GMST estimate of 1.43 [1.32 to 1.53] °C in 2023 (Sect. 6). This indicates a potentially large role for El Niño and other wind-driven ocean changes.
Methane and biomass emissions had a strong component of change related to climate feedbacks (Sects. 2 and 3). Such changes will become increasingly important over this century, even if the direct human influence declines. These changes need to be properly accounted for to explain atmospheric concentration and energy budget changes. The approach to methane taken in this paper (where changes to natural sources are excluded) is inconsistent with that taken for aerosol emissions (where wildfire changes are included). In future years and in the next IPCC report, a consistent approach to attribution of atmospheric emissions, concentration change and radiative forcing should be developed. Similarly, we follow the underlying literature in treating wildfire-related CO2 emissions and removals as natural only (Friedlingstein et al., 2023), even though their intensity and frequency are shifting under anthropogenic climate change.
It is hoped that this update can support the science community in its collection and provision of reliable and timely global climate data. In future years we are particularly interested in improving SLCF updating methods to get a more accurate estimate of short-term ERF changes. The work also highlights the importance of high-quality metadata to document changes in methodological approaches over time. In future years we hope to improve the robustness of the indicators presented here but also extend the breadth of indicators reported through coordinated research activities. For example, we could begin to make use of new satellite and ground-based data for better greenhouse monitoring (e.g. via the WMO Global Greenhouse Gas Watch initiative). Parallel efforts could explore how we might update indicators of regional climate extremes and their attribution, which are particularly relevant for supporting actions on adaptation and loss and damage.
Generally, scientists and scientific organisations have an important role as “watchdogs” to critically inform evidence-based decision-making. This annual update traced to IPCC methods can provide a reliable, timely source of trustworthy information. As well as helping inform decisions, we can use the update to track changes in datasets between their use in one IPCC report and the next. We can also provide information and testing to motivate updates in methods that future IPCC reports might choose to employ.
This is a critical decade: human-induced global warming rates are at their highest historical level, and 1.5 °C global warming might be expected to be reached or exceeded within the next 10 years in the absence of cooling from major volcanic eruptions (Lee et al., 2021). Yet this is also the decade that global greenhouse gas emissions could be expected to peak and begin to substantially decline. The indicators of global climate change presented here show that the Earth's energy imbalance has increased to around 0.9 W m−2, averaged over the last 12 years. This also has implications for the committed response of slow components in the climate system (glaciers, deep ocean and ice sheets) and committed long-term sea level rise, but this is not part of the update here. However, rapid and stringent GHG emission decreases such as those committed to at COP28 could halve warming rates over the next 20 years (McKenna et al., 2021). Table 1 shows that global GHG emissions are at a long-term high, yet there are signs that their rate of increase has slowed. Depending on the societal choices made in this critical decade, a continued series of these annual updates could track an improving trend for some of the indicators discussed herein.
The supplement related to this article is available online at: https://doi.org/10.5194/essd-16-2625-2024-supplement.
PMF, CS, MA, PF, JR and AP developed the concept of an annual update in discussions with the wider IPCC community over many years. CS led the work of the data repositories. VMD, PZ, SS, JCM, CFS, SIS, VN, AP, NPG, GPP, BT, MDP, KvS, JR, PF, MA, XZ, KZ, RAB, CB, CC, SB and PT provided important IPCC and UNFCCC framing. PMF coordinated the production of the manuscript with support from DR. WFL led Sect. 2 with contributions from JCM, PF, GPP, JG, JP and RA. CS and BH led Sect. 3 with inputs from XL, JM and PK. CS led Sect. 4 with contributions from BH, SS, VN, RMH, GM, AG, GW, MVMK, EM, JPK, MvM and XL. BT led Sect. 5 with contributions from PT, CM, CK, JK, RR and RV. KvS and MDP led Sect. 6 with contributions from LC, MI, TB and REK. BT led Sect. 6 with contributions from PT, CM, CK, JK, RR, RV and LC. TW led Sect. 7 with contributions and calculations from AR, NG, SJ and MA. RL led Sect. 8 with contributions from JR and KZ. Section 9 was led by MH, with contributions from SIS, XZ and DS. All authors either edited or commented on the manuscript. DR, AB and JAB coordinated the data visualisation effort.
The contact author has declared that none of the authors has any competing interests.
Publisher's note: Copernicus Publications remains neutral with regard to jurisdictional claims made in the text, published maps, institutional affiliations, or any other geographical representation in this paper. While Copernicus Publications makes every effort to include appropriate place names, the final responsibility lies with the authors.
Chris Smith, Matthew D. Palmer, Colin Morice, Rachel E. Killick and Richard A. Betts were supported by the Met Office Hadley Centre Climate Programme funded by DSIT. Peter Thorne was supported by Co-Centre award number 22/CC/11103. The Co-Centre award is managed by Science Foundation Ireland (SFI), Northern Ireland's Department of Agriculture, Environment and Rural Affairs (DAERA) and UK Research and Innovation (UKRI) and supported via the UK's International Science Partnerships Fund (ISPF) and the Irish Government's Shared Island initiative.
This research has been supported by the HORIZON EUROPE Framework Programme, HORIZON EUROPE Innovative Europe (grant nos. 820829, 101081395, and 821003), the H2020 European Research Council (grant no. 951542), the Research Councils UK (grant no. NE/T009381/1), and the UK Engineering and Physical Research Council (grant no. EP/V000772/1).
This paper was edited by Martina Stockhause and reviewed by David Huard and Matthew Jones.
Allen, M. R., Dube, O. P., Solecki, W., Aragón-Durand, F., Cramer, W., Humphreys, S., Kainuma, M., Kala, J., Mahowald, N., Mulugetta, Y., Perez, R., Wairiu, M., and Zickfeld, K.: Framing and Context. In: Global Warming of 1.5 °C. An IPCC Special Report on the impacts of global warming of 1.5 °C above pre-industrial levels and related global greenhouse gas emission pathways, in the context of strengthening the global response to the threat of climate change, sustainable development, and efforts to eradicate poverty, edited by: Masson-Delmotte, V., Zhai, P., Pörtner, H.-O., Roberts, D., Skea, J., Shukla, P. R., Pirani, A., Moufouma-Okia, W., Péan, C., Pidcock, R., Connors, S., Matthews, J. B. R., Chen, Y., Zhou, X., Gomis, M. I., Lonnoy, E., Maycock, T., Tignor, M., and Waterfield, T., Cambridge University Press, Cambridge, UK and New York, NY, USA, 49–92, https://doi.org/10.1017/9781009157940.003, 2018.
Allison, L. C., Palmer, M. D., Allan, R. P., Hermanson, L., Liu, C., and Smith, D. M.: Observations of planetary heating since the 1980s from multiple independent datasets, Environ. Res. Commun., 2, 101001, https://doi.org/10.1088/2515-7620/abbb39, 2020.
Barnes, C., Boulanger, Y., Keeping, T., Gachon, P., Gillett, N., Haas, O., Wang, X., Roberge, F., Kew, S., Heinrich, D., Singh, R., Vahlberg, M., Van Aalst, M., Otto, F., Kimutai, J., Boucher, J., Kasoar, M., Zachariah, M., and Krikken, F.: Climate change more than doubled the likelihood of extreme fire weather conditions in Eastern Canada, Imperial College London, https://doi.org/10.25561/105981, 2023.
Basu, S., Lan, X., Dlugokencky, E., Michel, S., Schwietzke, S., Miller, J. B., Bruhwiler, L., Oh, Y., Tans, P. P., Apadula, F., Gatti, L. V., Jordan, A., Necki, J., Sasakawa, M., Morimoto, S., Di Iorio, T., Lee, H., Arduini, J., and Manca, G.: Estimating emissions of methane consistent with atmospheric measurements of methane and δ13C of methane, Atmos. Chem. Phys., 22, 15351–15377, https://doi.org/10.5194/acp-22-15351-2022, 2022.
Betts, R. A., Belcher, S. E., Hermanson, L., Klein Tank, A., Lowe, J. A., Jones, C. D., Morice, C. P., Rayner, N. A., Scaife, A. A., and Stott, P. A.: Approaching 1.5 °C: how will we know we've reached this crucial warming mark?, Nature, 624, 33–35, https://doi.org/10.1038/d41586-023-03775-z, 2023.
Bond, T. C., Doherty, S. J., Fahey, D. W., Forster, P. M., Berntsen, T., DeAngelo, B. J., Flanner, M. G., Ghan, S., Kärcher, B., Koch, D., Kinne, S., Kondo, Y., Quinn, P. K., Sarofim, M. C., Schultz, M. G., Schulz, M., Venkataraman, C., Zhang, H., Zhang, S., Bellouin, N., Guttikunda, S. K., Hopke, P. K., Jacobson, M. Z., Kaiser, J. W., Klimont, Z., Lohmann, U., Schwarz, J. P., Shindell, D., Storelvmo, T., Warren, S. G., and Zender, C. S.: Bounding the role of black carbon in the climate system: A scientific assessment, J. Geophys. Res.-Atmos., 118, 5380–5552, https://doi.org/10.1002/jgrd.50171, 2013.
Bun, R., Marland, G., Oda, T., See, L., Puliafito, E., Nahorski, Z., Jonas, M., Kovalyshyn, V., Ialongo, I., Yashchun, O., and Romanchuk, Z.: Tracking unaccounted greenhouse gas emissions due to the war in Ukraine since 2022, Sci. Total Environ., 914, 169879, https://doi.org/10.1016/j.scitotenv.2024.169879, 2024.
Canadell, J. G., Monteiro, P. M. S., Costa, M. H., Cotrim da Cunha, L., Cox, P. M., Eliseev, A. V., Henson, S., Ishii, M., Jaccard, S., Koven, C., Lohila, A., Patra, P. K., Piao, S., Rogelj, J., Syampungani, S., Zaehle, S., and Zickfeld, K.: Global Carbon and other Biogeochemical Cycles and Feedbacks. In Climate Change 2021: The Physical Science Basis. Contribution of Working Group I to the Sixth Assessment Report of the Intergovernmental Panel on Climate Change, edited by: Masson-Delmotte, V., Zhai, P., Pirani, A., Connors, S. L., Péan, C., Berger, S., Caud, N., Chen, Y., Goldfarb, L., Gomis, M. I., Huang, M., Leitzell, K., Lonnoy, E., Matthews, J. B. R., Maycock, T. K., Waterfield, T., Yelekçi, O., Yu, R., and Zhou, B., Cambridge University Press, Cambridge, United Kingdom and New York, NY, USA, 673–816, https://doi.org/10.1017/9781009157896.007, 2021.
Cheng, L., Abraham, J., Hausfather, Z., and Trenberth, K. E.: How fast are the oceans warming?, Science, 363, 128–129, https://doi.org/10.1126/science.aav7619, 2019.
Cheng, L., Von Schuckmann, K., Abraham, J. P., Trenberth, K. E., Mann, M. E., Zanna, L., England, M. H., Zika, J. D., Fasullo, J. T., Yu, Y., Pan, Y., Zhu, J., Newsom, E. R., Bronselaer, B., and Lin, X.: Past and future ocean warming, Nat. Rev. Earth. Environ., 3, 776–794, https://doi.org/10.1038/s43017-022-00345-1, 2022.
Climate Change Tracker, https://climatechangetracker.org/igcc (last access: 20 May 2024), 2024.
Collins, M., Knutti, R., Arblaster, J., Dufresne, J.-L., Fichefet, T., Friedlingstein, P., Gao, X., Gutowski, W.J., Johns, T., Krinner, G., Shongwe, M., Tebaldi, C., Weaver, A. J., and Wehner, M.: Long-term Climate Change: Projections, Commitments and Irreversibility, in: Stocker, V. B. T. F., Qin, D., Plattner, G. K., Tignor, M., Allen, S. K., Boschung, J., Nauels, A., Xia, Y., and Midgley, P. M., Climate Change 2013: The Physical Science Basis. Contribution of Working Group I to the Fifth Assessment Report of the Intergovernmental Panel on Climate Change. Cambridge, United Kingdom and New York, NY, USA, Cambridge University Press, 1029–1136, 2013.
Crippa, M., Guizzardi, D., Schaaf, E., Monforti-Ferrario, F., Quadrelli, R., Risquez Martin, A., Rossi, S., Vignati, E., Muntean, M., Brandao De Melo, J., Oom, D., Pagani, F., Banja, M., Taghavi-Moharamli, P., Köykkä, J., Grassi, G., Branco, A., and San-Miguel, J.: GHG emissions of all world countries – 2023, Publications Office of the European Union, https://doi.org/10.2760/953322, 2023.
Cuesta-Valero, F. J., Beltrami, H., García-García, A., Krinner, G., Langer, M., MacDougall, A., Nitzbon, J., Peng, J., von Schuckmann, K., Seneviratne, S., Thiery, W., Vanderkelen, I., and Wu, T.: GCOS EHI 1960–2020 Continental Heat Content (Version 2), World Data Center for Climate (WDCC) at DKRZ, https://doi.org/10.26050/WDCC/GCOS_EHI_1960-2020_CoHC_v2, 2023.
Deng, Z., Ciais, P., Tzompa-Sosa, Z. A., Saunois, M., Qiu, C., Tan, C., Sun, T., Ke, P., Cui, Y., Tanaka, K., Lin, X., Thompson, R. L., Tian, H., Yao, Y., Huang, Y., Lauerwald, R., Jain, A. K., Xu, X., Bastos, A., Sitch, S., Palmer, P. I., Lauvaux, T., d'Aspremont, A., Giron, C., Benoit, A., Poulter, B., Chang, J., Petrescu, A. M. R., Davis, S. J., Liu, Z., Grassi, G., Albergel, C., Tubiello, F. N., Perugini, L., Peters, W., and Chevallier, F.: Comparing national greenhouse gas budgets reported in UNFCCC inventories against atmospheric inversions, Earth Syst. Sci. Data, 14, 1639–1675, https://doi.org/10.5194/essd-14-1639-2022, 2022.
Dhakal, S., Minx, J. C., Toth, F. L., Abdel-Aziz, A., Figueroa Meza, M. J., Hubacek, K., Jonckheere, I. G. C., Yong-Gun Kim, Nemet, G. F., Pachauri, S., Tan, X. C., and Wiedmann, T.: Emissions Trends and Drivers, in IPCC, 2022: Climate Change 2022: Mitigation of Climate Change. Contribution of Working Group III to the Sixth Assessment Report of the Intergovernmental Panel on Climate Change, edited by: Shukla, P. R., Skea, J., Slade, R., Al Khourdajie, A., van Diemen, R., McCollum, D., Pathak, M., Some, S., Vyas, P., Fradera, R., Belkacemi, M., Hasija, A., Lisboa, G., Luz, S., and Malley, J., Cambridge University Press, Cambridge, UK and New York, NY, USA, https://doi.org/10.1017/9781009157926.004, 2022.
Douville, H., Raghavan, K., Renwick, J., Allan, R. P., Arias, P. A., Barlow, M., Cerezo-Mota, R., Cherchi, A., Gan, T. Y., Gergis, J., Jiang, D., Khan, A., Pokam Mba, W., Rosenfeld, D., Tierney, J., and Zolina, O.: Water Cycle Changes. In Climate Change 2021: The Physical Science Basis. Contribution of Working Group I to the Sixth Assessment Report of the Intergovernmental Panel on Climate Change, edited by: Masson-Delmotte, V., Zhai, P., Pirani, A., Connors, S. L., Péan, C., Berger, S., Caud, N., Chen, Y., Goldfarb, L., Gomis, M. I., Huang, M., Leitzell, K., Lonnoy, E., Matthews, J. B. R., Maycock, T. K., Waterfield, T., Yelekçi, O., Yu, R., and Zhou, B., Cambridge University Press, Cambridge, United Kingdom and New York, NY, USA, 1055–1210, https://doi.org/10.1017/9781009157896.010, 2021.
Droste, E. S., Adcock, K. E., Ashfold, M. J., Chou, C., Fleming, Z., Fraser, P. J., Gooch, L. J., Hind, A. J., Langenfelds, R. L., Leedham Elvidge, E. C., Mohd Hanif, N., O'Doherty, S., Oram, D. E., Ou-Yang, C.-F., Panagi, M., Reeves, C. E., Sturges, W. T., and Laube, J. C.: Trends and emissions of six perfluorocarbons in the Northern Hemisphere and Southern Hemisphere, Atmos. Chem. Phys., 20, 4787–4807, https://doi.org/10.5194/acp-20-4787-2020, 2020.
Dunn, R. J. H., Alexander, L. V., Donat, M. G., Zhang, X., Bador, M., Herold, N., Lippmann, T., Allan, R., Aguilar, E., Barry, A. A., Brunet, M., Caesar, J., Chagnaud, G., Cheng, V., Cinco, T., Durre, I., Guzman, R., Htay, T. M., Wan Ibadullah, W. M., Bin Ibrahim, M. K. I., Khoshkam, M., Kruger, A., Kubota, H., Leng, T. W., Lim, G., Li-Sha, L., Marengo, J., Mbatha, S., McGree, S., Menne, M., Milagros Skansi, M., Ngwenya, S., Nkrumah, F., Oonariya, C., Pabon-Caicedo, J. D., Panthou, G., Pham, C., Rahimzadeh, F., Ramos, A., Salgado, E., Salinger, J., Sané, Y., Sopaheluwakan, A., Srivastava, A., Sun, Y., Timbal, B., Trachow, N., Trewin, B., Schrier, G., Vazquez-Aguirre, J., Vasquez, R., Villarroel, C., Vincent, L., Vischel, T., Vose, R., and Bin Hj Yussof, M. N.: Development of an updated global land in situ-based data set of temperature and precipitation extremes: HadEX3, J. Geophys. Res.-Atmos., 125, e2019JD032263, https://doi.org/10.1029/2019JD032263, 2020.
Dunn, R. J. H., Donat, M. G., and Alexander, L. V.: Comparing extremes indices in recent observational and reanalysis products, Front. Clim., 4, 98905, https://doi.org/10.3389/fclim.2022.989505, 2022.
Dunn, R. J. H., Alexander, L., Donat, M., Zhang, X., Bador, M., Herold, N., Lippmann, T., Allan, R. J., Aguilar, E., Aziz, A., Brunet, M., Caesar, J., Chagnaud, G., Cheng, V., Cinco, T., Durre, I., de Guzman, R., Htay, T.M., Wan Ibadullah, W. M., Bin Ibrahim, M. K. I., Khoshkam, M., Kruge, A., Kubota, H., Leng, T. W., Lim, G., Li-Sha, L., Marengo, J., Mbatha, S., McGree, S., Menne, M., de los Milagros Skansi, M., Ngwenya, S., Nkrumah, F., Oonariya, C., Pabon-Caicedo, J. D., Panthou, G., Pham, C., Rahimzadeh, F., Ramos, A., Salgado, E., Salinger, J., Sane, Y., Sopaheluwakan, A., Srivastava, A., Sun, Y., Trimbal, B., Trachow, N., Trewin, B., van der Schrier, G., Vazquez-Aguirre, J., Vasquez, R., Villarroel, C., Vincent, L., Vischel, T., Vose, R., Bin Hj Yussof, and M. N. A.: HadEX3: Global land-surface climate extremes indices v3.0.4 (1901–2018), NERC EDS Centre for Environmental Data Analysis [data set], https://doi.org/10.5285/115d5e4ebf7148ec941423ec86fa9f26, 2023.
Dutton, G. S., Hall, B. D., Montzka, S. A., Nance, J. D., Clingan, S. D., and Petersen, K. M.: Combined Atmospheric Chloroflurocarbon-12 Dry Air Mole Fractions from the NOAA GML Halocarbons Sampling Network, 1977–2024, Version: 2024-03-07, https://doi.org/10.15138/PJ63-H440, 2024.
Eyring, V., Gillett, N. P., Achuta Rao, K. M., Barimalala, R., Barreiro, M. Parrillo, Bellouin, N., Cassou, C., Durack, P. J., Kosaka, Y., McGregor, S., Min, S., Morgenstern, O., and Sun, Y.: Human Influence on the Climate System, in: Climate Change 2021: The Physical Science Basis. Contribution of Working Group I to the Sixth Assessment Report of the Intergovernmental Panel on Climate Change, edited by: Masson-Delmotte, V., Zhai, P., Pirani, A., Connors, S. L., Péan, C., Berger, S., Caud, N., Chen, Y., Goldfarb, L., Gomis, M. I., Huang, M., Leitzell, K., Lonnoy, E., Matthews, J. B. R., Maycock, T. K., Waterfield, T., Yelekçi, O., Yu, R., and Zhou, B., Cambridge University Press, Cambridge, United Kingdom and New York, NY, USA, 423–552, https://doi.org/10.1017/9781009157896.005, 2021.
Feron, S., Malhotra, A., Bansal, S., Fluet-Chouinard, E., McNicol, G., Knox, S. H., Delwiche, K. B., Cordero, R. R., Ouyang, Z., Zhang, Z., Poulter, B., and Jackson, R. B.: Recent increases in annual, seasonal, and extreme methane fluxes driven by changes in climate and vegetation in boreal and temperate wetland ecosystems, Global Change Biol., 30, e17131, https://doi.org/10.1111/gcb.17131, 2024.
Forster, P. M., Forster, H. I., Evans, M. J., Gidden, M. J., Jones, C. D., Keller, C. A., Lamboll, R. D., Le Quéré, C., Rogelj, J., Rosen, D., Schleussner, C. F., Richardson, T. B., Smith, C. J., and Turnock, S. T.: Current and future global climate impacts resulting from COVID-19, Nature Clim. Chang, 10, 913–919, https://doi.org/10.1038/s41558-020-0883-0, 2020.
Forster, P., Storelvmo, T., Armour, K., Collins, W., Dufresne, J.-L., Frame, D., Lunt, D. J., Mauritsen, T., Palmer, M. D., Watanabe, M., Wild, M., and Zhang, H.: The Earth's Energy Budget, Climate Feedbacks, and Climate Sensitivity. In Climate Change 2021: The Physical Science Basis. Contribution of Working Group I to the Sixth Assessment Report of the Intergovernmental Panel on Climate Change, edited by: Masson-Delmotte, V., Zhai, P., Pirani, A., Connors, S. L., Péan, C., Berger, S., Caud, N., Chen, Y., Goldfarb, L., Gomis, M. I., Huang, M., Leitzell, K., Lonnoy, E., Matthews, J. B. R., Maycock, T. K., Waterfield, T., Yelekçi, O., Yu, R., and Zhou, B., Cambridge University Press, Cambridge, United Kingdom and New York, NY, USA, 923–1054, https://doi.org/10.1017/9781009157896.009, 2021.
Forster, P. M., Smith, C. J., Walsh, T., Lamb, W. F., Lamboll, R., Hauser, M., Ribes, A., Rosen, D., Gillett, N., Palmer, M. D., Rogelj, J., von Schuckmann, K., Seneviratne, S. I., Trewin, B., Zhang, X., Allen, M., Andrew, R., Birt, A., Borger, A., Boyer, T., Broersma, J. A., Cheng, L., Dentener, F., Friedlingstein, P., Gutiérrez, J. M., Gütschow, J., Hall, B., Ishii, M., Jenkins, S., Lan, X., Lee, J.-Y., Morice, C., Kadow, C., Kennedy, J., Killick, R., Minx, J. C., Naik, V., Peters, G. P., Pirani, A., Pongratz, J., Schleussner, C.-F., Szopa, S., Thorne, P., Rohde, R., Rojas Corradi, M., Schumacher, D., Vose, R., Zickfeld, K., Masson-Delmotte, V., and Zhai, P.: Indicators of Global Climate Change 2022: annual update of large-scale indicators of the state of the climate system and human influence, Earth Syst. Sci. Data, 15, 2295–2327, https://doi.org/10.5194/essd-15-2295-2023, 2023.
Fox-Kemper, B., Fox-Kemper, B., Hewitt, H. T., Xiao, C., Aðalgeirsdóttir, G., Drijfhout, S. S., Edwards, T. L., Golledge, N. R., Hemer, M., Kopp, R. E., Krinner, G., Mix, A., Notz, D., Nowicki, S., Nurhati, I. S., Ruiz, L., Sallée, J.-B., Slangen, A. B. A., and Yu, Y.: Ocean, Cryosphere and Sea Level Change. In Climate Change 2021: The Physical Science Basis. Contribution of Working Group I to the Sixth Assessment Report of the Intergovernmental Panel on Climate Change, edited by: Masson-Delmotte, V., Zhai, P., Pirani, A., Connors, S. L., Péan, C., Berger, S., Caud, N., Chen, Y., Goldfarb, L., Gomis, M. I., Huang, M., Leitzell, K., Lonnoy, E., Matthews, J. B. R., Maycock, T. K., Waterfield, T., Yelekçi, O., Yu, R., and Zhou, B., Cambridge University Press, Cambridge, United Kingdom and New York, NY, USA, 1211–1362, https://doi.org/10.1017/9781009157896.011, 2021.
Francey, R. J., Steele, L. P., Langenfelds, R. L., and Pak, B. C.: High precision long-term monitoring of radiatively-active trace gases at surface sites and from ships and aircraft in the Southern Hemisphere atmosphere, J. Atmos. Science, 56, 279–285 https://doi.org/10.1175/1520-0469(1999)056<0279:HPLTMO>2.0.CO;2, 1999.
Friedlingstein, P., O'Sullivan, M., Jones, M. W., Andrew, R. M., Hauck, J., Olsen, A., Peters, G. P., Peters, W., Pongratz, J., Sitch, S., Le Quéré, C., Canadell, J. G., Ciais, P., Jackson, R. B., Alin, S., Aragão, L. E. O. C., Arneth, A., Arora, V., Bates, N. R., Becker, M., Benoit-Cattin, A., Bittig, H. C., Bopp, L., Bultan, S., Chandra, N., Chevallier, F., Chini, L. P., Evans, W., Florentie, L., Forster, P. M., Gasser, T., Gehlen, M., Gilfillan, D., Gkritzalis, T., Gregor, L., Gruber, N., Harris, I., Hartung, K., Haverd, V., Houghton, R. A., Ilyina, T., Jain, A. K., Joetzjer, E., Kadono, K., Kato, E., Kitidis, V., Korsbakken, J. I., Landschützer, P., Lefèvre, N., Lenton, A., Lienert, S., Liu, Z., Lombardozzi, D., Marland, G., Metzl, N., Munro, D. R., Nabel, J. E. M. S., Nakaoka, S.-I., Niwa, Y., O'Brien, K., Ono, T., Palmer, P. I., Pierrot, D., Poulter, B., Resplandy, L., Robertson, E., Rödenbeck, C., Schwinger, J., Séférian, R., Skjelvan, I., Smith, A. J. P., Sutton, A. J., Tanhua, T., Tans, P. P., Tian, H., Tilbrook, B., van der Werf, G., Vuichard, N., Walker, A. P., Wanninkhof, R., Watson, A. J., Willis, D., Wiltshire, A. J., Yuan, W., Yue, X., and Zaehle, S.: Global Carbon Budget 2020, Earth Syst. Sci. Data, 12, 3269–3340, https://doi.org/10.5194/essd-12-3269-2020, 2020.
Friedlingstein, P., O'Sullivan, M., Jones, M. W., Andrew, R. M., Gregor, L., Hauck, J., Le Quéré, C., Luijkx, I. T., Olsen, A., Peters, G. P., Peters, W., Pongratz, J., Schwingshackl, C., Sitch, S., Canadell, J. G., Ciais, P., Jackson, R. B., Alin, S. R., Alkama, R., Arneth, A., Arora, V. K., Bates, N. R., Becker, M., Bellouin, N., Bittig, H. C., Bopp, L., Chevallier, F., Chini, L. P., Cronin, M., Evans, W., Falk, S., Feely, R. A., Gasser, T., Gehlen, M., Gkritzalis, T., Gloege, L., Grassi, G., Gruber, N., Gürses, Ö., Harris, I., Hefner, M., Houghton, R. A., Hurtt, G. C., Iida, Y., Ilyina, T., Jain, A. K., Jersild, A., Kadono, K., Kato, E., Kennedy, D., Klein Goldewijk, K., Knauer, J., Korsbakken, J. I., Landschützer, P., Lefèvre, N., Lindsay, K., Liu, J., Liu, Z., Marland, G., Mayot, N., McGrath, M. J., Metzl, N., Monacci, N. M., Munro, D. R., Nakaoka, S.-I., Niwa, Y., O'Brien, K., Ono, T., Palmer, P. I., Pan, N., Pierrot, D., Pocock, K., Poulter, B., Resplandy, L., Robertson, E., Rödenbeck, C., Rodriguez, C., Rosan, T. M., Schwinger, J., Séférian, R., Shutler, J. D., Skjelvan, I., Steinhoff, T., Sun, Q., Sutton, A. J., Sweeney, C., Takao, S., Tanhua, T., Tans, P. P., Tian, X., Tian, H., Tilbrook, B., Tsujino, H., Tubiello, F., van der Werf, G. R., Walker, A. P., Wanninkhof, R., Whitehead, C., Willstrand Wranne, A., Wright, R., Yuan, W., Yue, C., Yue, X., Zaehle, S., Zeng, J., and Zheng, B.: Global Carbon Budget 2022, Earth Syst. Sci. Data, 14, 4811–4900, https://doi.org/10.5194/essd-14-4811-2022, 2022.
Friedlingstein, P., O'Sullivan, M., Jones, M. W., Andrew, R. M., Bakker, D. C. E., Hauck, J., Landschützer, P., Le Quéré, C., Luijkx, I. T., Peters, G. P., Peters, W., Pongratz, J., Schwingshackl, C., Sitch, S., Canadell, J. G., Ciais, P., Jackson, R. B., Alin, S. R., Anthoni, P., Barbero, L., Bates, N. R., Becker, M., Bellouin, N., Decharme, B., Bopp, L., Brasika, I. B. M., Cadule, P., Chamberlain, M. A., Chandra, N., Chau, T.-T.-T., Chevallier, F., Chini, L. P., Cronin, M., Dou, X., Enyo, K., Evans, W., Falk, S., Feely, R. A., Feng, L., Ford, D. J., Gasser, T., Ghattas, J., Gkritzalis, T., Grassi, G., Gregor, L., Gruber, N., Gürses, Ö., Harris, I., Hefner, M., Heinke, J., Houghton, R. A., Hurtt, G. C., Iida, Y., Ilyina, T., Jacobson, A. R., Jain, A., Jarníková, T., Jersild, A., Jiang, F., Jin, Z., Joos, F., Kato, E., Keeling, R. F., Kennedy, D., Klein Goldewijk, K., Knauer, J., Korsbakken, J. I., Körtzinger, A., Lan, X., Lefèvre, N., Li, H., Liu, J., Liu, Z., Ma, L., Marland, G., Mayot, N., McGuire, P. C., McKinley, G. A., Meyer, G., Morgan, E. J., Munro, D. R., Nakaoka, S.-I., Niwa, Y., O'Brien, K. M., Olsen, A., Omar, A. M., Ono, T., Paulsen, M., Pierrot, D., Pocock, K., Poulter, B., Powis, C. M., Rehder, G., Resplandy, L., Robertson, E., Rödenbeck, C., Rosan, T. M., Schwinger, J., Séférian, R., Smallman, T. L., Smith, S. M., Sospedra-Alfonso, R., Sun, Q., Sutton, A. J., Sweeney, C., Takao, S., Tans, P. P., Tian, H., Tilbrook, B., Tsujino, H., Tubiello, F., van der Werf, G. R., van Ooijen, E., Wanninkhof, R., Watanabe, M., Wimart-Rousseau, C., Yang, D., Yang, X., Yuan, W., Yue, X., Zaehle, S., Zeng, J., and Zheng, B.: Global Carbon Budget 2023, Earth Syst. Sci. Data, 15, 5301–5369, https://doi.org/10.5194/essd-15-5301-2023, 2023.
Gasser, T., Crepin, L., Quilcaille, Y., Houghton, R. A., Ciais, P., and Obersteiner, M.: Historical CO2 emissions from land use and land cover change and their uncertainty, Biogeosciences, 17, 4075–4101, https://doi.org/10.5194/bg-17-4075-2020, 2020.
Gettelman, A., Christensen, M. A., Diamond, M. S., Gryspeerdt, E., Manshausen, P., Sieir, P., Watson-Parris, D., Yang, M., Yoshioka, M., and Yuan, T.: Has Reducing Ship Emissions Brought Forward Global Warming?, Geophys. Res. Lett., submitted, 2024.
Gillett, N. P., Kirchmeier-Young, M., Ribes, A., Shiogama, H., Hegerl, G. C., Knutti, R., Gastineau, G., John, J. G., Li, L., Nazarenko, L., Rosenbloom, N., Seland, Ø., Wu, T., Yukimoto, S., and Ziehn, T.: Constraining human contributions to observed warming since the pre-industrial period, Nat. Clim. Chang., 11, 207–212, https://doi.org/10.1038/s41558-020-00965-9, 2021.
Gleckler, P. J., Durack, P. J., Stouffer, R. J., Johnson, G. C., and Forest, C. E.: Industrial-era global ocean heat uptake doubles in recent decades, Nat. Clim. Chang., 6, 394–398, https://doi.org/10.1038/nclimate2915, 2016.
Grassi, G., Schwingshackl, C., Gasser, T., Houghton, R. A., Sitch, S., Canadell, J. G., Cescatti, A., Ciais, P., Federici, S., Friedlingstein, P., Kurz, W. A., Sanz Sanchez, M. J., Abad Viñas, R., Alkama, R., Bultan, S., Ceccherini, G., Falk, S., Kato, E., Kennedy, D., Knauer, J., Korosuo, A., Melo, J., McGrath, M. J., Nabel, J. E. M. S., Poulter, B., Romanovskaya, A. A., Rossi, S., Tian, H., Walker, A. P., Yuan, W., Yue, X., and Pongratz, J.: Harmonising the land-use flux estimates of global models and national inventories for 2000–2020, Earth Syst. Sci. Data, 15, 1093–1114, https://doi.org/10.5194/essd-15-1093-2023, 2023.
Gulev, S. K., Thorne, P. W., Ahn, J., Dentener, F. J., Domingues, C. M., Gerland, S., Gong, D., Kaufman, D. S., Nnamchi, H. C., Quaas, J., Rivera, J. A., Sathyendranath, S., Smith, S. L., Trewin, B., von Schuckmann, K., and Vose, R. S.: Changing State of the Climate System, in: Climate Change 2021: The Physical Science Basis. Contribution of Working Group I to the Sixth Assessment Report of the Intergovernmental Panel on Climate Change, edited by: Masson-Delmotte, V., Zhai, P., Pirani, A., Connors, S. L., Péan, C., Berger, S., Caud, N., Chen, Y., Goldfarb, L., Gomis, M. I., Huang, M., Leitzell, K., Lonnoy, E., Matthews, J. B. R., Maycock, T. K., Waterfield, T., Yelekçi, O., Yu, R., and Zhou, B., Cambridge University Press, Cambridge, United Kingdom and New York, NY, USA, 287–422, https://doi.org/10.1017/9781009157896.004, 2021.
Gütschow, J., Jeffery, M. L., Gieseke, R., Gebel, R., Stevens, D., Krapp, M., and Rocha, M.: The PRIMAP-hist national historical emissions time series, Earth Syst. Sci. Data, 8, 571–603, https://doi.org/10.5194/essd-8-571-2016, 2016.
Gütschow, J., Pflüger, M., and Busch, D.: The PRIMAP-hist national historical emissions time series v2.5.1 (1750-2022) (2.5.1), Zenodo [data set] https://doi.org/10.5281/zenodo.10705513, 2024.
Hakuba, M. Z., Frederikse, T., and Landerer, F. W.: Earth's energy imbalance from the ocean perspective (2005–2019), Geophys. Res. Let.t, 48, e2021GL093624, https://doi.org/10.1029/2021GL093624, 2021.
Hansen, J. E., Sato, M., Simons, L., Nazarenko, L. S., Sangha, I., Kharecha, P., Zachos, J. C., von Schuckmann, K., Loeb, N. G., Osman, M. B., Jin, Q., Tselioudis, G., Jeong, E., Lacis, A., Ruedy, R., Russell, G., Cao, J., and Li, J.: Global warming in the pipeline, Oxford Open Climate Change, 3, kgad008, https://doi.org/10.1093/oxfclm/kgad008, 2023.
Hansis, E., Davis, S. J., and Pongratz, J.: Relevance of methodological choices for accounting of land use change carbon fluxes, Global Biogeochem. Cy., 29, 1230–1246, https://doi.org/10.1002/2014GB004997, 2015.
Haustein, K., Allen, M. R., Forster, P. M., Otto, F. E. L., Mitchell, D. M., Matthews, H. D., and Frame, D. J.: A real-time Global Warming Index, Sci. Rep.-UK, 7, 15417, https://doi.org/10.1038/s41598-017-14828-5, 2017.
Hersbach, H., Bell, B., Berrisford, P., Hirahara, S., Horányi, A., Muñoz-Sabater, J., Nicolas, J., Peubey, C., Radu, R., Schepers, D., Simmons, A., Soci, C., Abdalla, S., Abellan, X., Balsamo, G., Bechtold, P., Biavati, G., Bidlot, J., Bonavita, M., De Chiara, G., Dahlgren, P., Dee, D., Diamantakis, M., Dragani, R., Flemming, J., Forbes, R., Fuentes, M., Geer, A., Haimberger, L., Healy, S., Hogan, R. J., Hólm, E., Janisková, M., Keeley, S., Laloyaux, P., Lopez, P., Lupu, C., Radnoti, G., de Rosnay, P., Rozum, I., Vamborg, F., Villaume, S., and Thépaut, J.-N.: The ERA5 global reanalysis, Q. J. Roy. Meteor. Soc., 146, 1999–2049, https://doi.org/10.1002/qj.3803, 2020.
Hodnebrog, Ø., Aamaas, B., Fuglestvedt, J. S., Marston, G., Myhre, G., Nielsen, C. J., Sandstad, M., Shine, K. P., and Wallington, T. J.: Updated Global Warming Potentials and Radiative Efficiencies of Halocarbons and Other Weak Atmospheric Absorbers, Rev. Geophys., 58, e2019RG000691, https://doi.org/10.1029/2019RG000691, 2020.
Hodnebrog, Ø., Myhre, G., Jouan, C., Andrews, T., Forster, P. M., Jia, H., Loeb, N. G., Olivié, D. J. L., Paynter, D., Quaas, J., Raghuraman, S. P., and Schulz, M.: Recent reductions in aerosol emissions have increased Earth's energy imbalance, Commun. Earth Environ., 5, 166, https://doi.org/10.1038/s43247-024-01324-8, 2024.
Hoesly, R. and Smith, S.: CEDS v_2024_04_01 Release Emission Data (v_2024_04_01), Zenodo [data set], https://doi.org/10.5281/zenodo.10904361, 2024.
Hoesly, R. M., Smith, S. J., Feng, L., Klimont, Z., Janssens-Maenhout, G., Pitkanen, T., Seibert, J. J., Vu, L., Andres, R. J., Bolt, R. M., Bond, T. C., Dawidowski, L., Kholod, N., Kurokawa, J.-I., Li, M., Liu, L., Lu, Z., Moura, M. C. P., O'Rourke, P. R., and Zhang, Q.: Historical (1750–2014) anthropogenic emissions of reactive gases and aerosols from the Community Emissions Data System (CEDS), Geosci. Model Dev., 11, 369–408, https://doi.org/10.5194/gmd-11-369-2018, 2018.
Houghton, R. A. and Castanho, A.: Annual emissions of carbon from land use, land-use change, and forestry from 1850 to 2020, Earth Syst. Sci. Data, 15, 2025–2054, https://doi.org/10.5194/essd-15-2025-2023, 2023.
Houghton, R. A. and Nassikas, A. A.: Global and regional fluxes of carbon from land use and land cover change 1850–2015, Global Biogeochem. Cy., 31, 456– 472, https://doi.org/10.1002/2016GB005546, 2017.
Hu, Y., Yue, X., Tian, C., Zhou, H., Fu, W., Zhao, X., Zhao, Y., and Chen, Y.: Identifying the main drivers of the spatiotemporal variations in wetland methane emissions during 2001–2020, Front. Environ. Sci., 11, 1275742, https://doi.org/10.3389/fenvs.2023.1275742, 2023.
IATA: Air Passenger Monthly Analysis March 2024, https://www.iata.org/en/iata-repository/publications/economic-reports/air-passenger-market-analysis-march-2024/ (last access: 20 May 2024), 2024.
IEA: CO2 Emissions in 2023. https://www.iea.org/reports/co2-emissions-in-2023 (last access: 20 April 2024), 2023.
IPCC: Climate Change 2013: The Physical Science Basis. Contribution of Working Group I to the Fifth Assessment Report of the Intergovernmental Panel on Climate Change, edited by: Stocker, T. F., Qin, D., Plattner, G.-K., Tignor, M., Allen, S. K., Boschung, J., Nauels, A., Xia, Y., Bex, V., and Midgley, P. M., Cambridge University Press, Cambridge, United Kingdom and New York, NY, USA, 1535, https://doi.org/10.1017/CBO9781107415324, 2013.
IPCC: Summary for Policymakers, in: Global Warming of 1.5 °C. An IPCC Special Report on the impacts of global warming of 1.5 °C above pre-industrial levels and related global greenhouse gas emission pathways, in the context of strengthening the global response to the threat of climate change, sustainable development, and efforts to eradicate poverty, edited by: Masson-Delmotte, V., Zhai, P., Pörtner, H.-O., Roberts, D., Skea, J., Shukla, P. R., Pirani, A., Moufouma-Okia, W., Péan, C., Pidcock, R., Connors, S., Matthews, J. B. R., Chen, Y., Zhou, X., Gomis, M. I., Lonnoy, E., Maycock, T., Tignor, M., and Waterfield, T., Cambridge University Press, Cambridge, UK and New York, NY, USA, 3–24, https://doi.org/10.1017/9781009157940.001, 2018.
IPCC: Climate Change 2021: The Physical Science Basis. Contribution of Working Group I to the Sixth Assessment Report of the Intergovernmental Panel on Climate Change, Cambridge University Press, Cambridge, United Kingdom and New York, NY, USA, https://doi.org/10.1017/9781009157896, 2021a.
IPCC: Summary for Policymakers, in: Climate Change 2021: The Physical Science Basis. Contribution of Working Group I to the Sixth Assessment Report of the Intergovernmental Panel on Climate Change, edited by: Masson-Delmotte, V., Zhai, P., Pirani, A., Connors, S. L., Péan, C., Berger, S., Caud, N., Chen, Y., Goldfarb, L., Gomis, M. I., Huang, M., Leitzell, K., Lonnoy, E., Matthews, J. B. R., Maycock, T. K., Waterfield, T., Yelekçi, O., Yu, R., and Zhou, B., Cambridge University Press, Cambridge, United Kingdom and New York, NY, USA, 3–32, https://doi.org/10.1017/9781009157896.001, 2021b.
IPCC: Climate Change 2022: Impacts, Adaptation, and Vulnerability. Contribution of Working Group II to the Sixth Assessment Report of the Intergovernmental Panel on Climate Change, edited by: Pörtner, H.-O., Roberts, D. C., Tignor, M., Poloczanska, E. S., Mintenbeck, K., Alegría, A., Craig, M., Langsdorf, S., Löschke, S., Möller, V., Okem, A., and Rama, B., Cambridge University Press. Cambridge University Press, Cambridge, UK and New York, NY, USA, 3056, https://doi.org/10.1017/9781009325844, 2022.
IPCC: Climate Change 2023: Synthesis Report. Contribution of Working Groups I, II and III to the Sixth Assessment Report of the Intergovernmental Panel on Climate Change, edited by: Core Writing Team, Lee, H., and Romero, J., IPCC, Geneva, Switzerland., Intergovernmental Panel on Climate Change (IPCC), https://doi.org/10.59327/IPCC/AR6-9789291691647, 2023a.
IPCC: Climate Change 2023: Summary for Policy Makers. Contribution of Working Groups I, II and III to the Sixth Assessment Report of the Intergovernmental Panel on Climate Change, edited by: Core Writing Team, Lee, H., and Romero, J., IPCC, Geneva, Switzerland., Intergovernmental Panel on Climate Change (IPCC), https://doi.org/10.59327/IPCC/AR6-9789291691647, 2023b.
Iturbide, M., Fernández, J., Gutiérrez, J. M., Pirani, A., Huard, D., Al Khourdajie, A., Baño-Medina, J., Bedia, J., Casanueva, A., Cimadevilla, E., Cofiño, A. S., De Felice, M., Diez-Sierra, J., García-Díez, M., Goldie, J., Herrera, D. A., Herrera, S., Manzanas, R., Milovac, J., Radhakrishnan, A., San-Martín, D., Spinuso, A., Thyng, K. M., Trenham, C., and Yelekçi, Ö.: Implementation of FAIR principles in the IPCC: the WGI AR6 Atlas repository, Sci. Data, 9, 629, https://doi.org/10.1038/s41597-022-01739-y, 2022.
Janardanan, R., Maksyutov, S., Wang, F., Nayagam, L., Sahu, S. K., Mangaraj, P., Saunois, M., Lan, X., and Matsunaga, T.: Country-level methane emissions and their sectoral trends during 2009–2020 estimated by high-resolution inversion of GOSAT and surface observations, Environ. Res. Lett., 19, 034007, https://doi.org/10.1088/1748-9326/ad2436, 2024.
Jenkins, S., Povey, A., Gettelman, A., Grainger, R., Stier, P., and Allen, M.: Is Anthropogenic Global Warming Accelerating?, J. Climate, 35, 7873–7890, https://doi.org/10.1175/JCLI-D-22-0081.1, 2022.
Jenkins, S., Smith, C., Allen, M., and Grainger, R.: Tonga eruption increases chance of temporary surface temperature anomaly above 1.5 °C, Nature Clim. Chang., 13, 127–129, https://doi.org/10.1038/s41558-022-01568-2, 2023.
Kirchengast, G., Gorfer, M., Mayer, M., Steiner, A. K., and Haimberger, L.: GCOS EHI 1960–2020 Atmospheric Heat Content, https://doi.org/10.26050/WDCC/GCOS_EHI_1960-2020_AHC, 2022.
Kramer, R. J., He, H., Soden, B. J., Oreopoulos, L., Myhre, G., Forster, P. M., and Smith, C. J.: Observational evidence of increasing global radiative forcing, Geophys. Res. Lett., 48, e2020GL091585, https://doi.org/10.1029/2020GL091585, 2021.
Krotkov, N. A., Lamsal, L. N., Marchenko, S. V., Celarier, E. A., Bucsela, E. J., Swartz, W. H., Joiner, J., and the OMI core team: OMI/Aura NO2 Cloud-Screened Total and Tropospheric Column L3 Global Gridded 0.25 degree × 0.25 degree V3, NASA Goddard Space Flight Center, Goddard Earth Sciences Data and Information Services Center (GES DISC), https://doi.org/10.5067/Aura/OMI/DATA3007, 2019.
Lamboll, R. D. and Rogelj, J.: Code for estimation of remaining carbon budget in IPCC AR6 WGI, Zenodo [code], https://doi.org/10.5281/zenodo.6373365, 2022.
Lamboll, R. D., Jones, C. D., Skeie, R. B., Fiedler, S., Samset, B. H., Gillett, N. P., Rogelj, J., and Forster, P. M.: Modifying emissions scenario projections to account for the effects of COVID-19: protocol for CovidMIP, Geosci. Model Dev., 14, 3683–3695, https://doi.org/10.5194/gmd-14-3683-2021, 2021.
Lamboll, R. and Rogelj, J.: Carbon Budget Calculator, 2024, Github [code], https://github.com/Rlamboll/AR6CarbonBudgetCalc/tree/v1.0.1, last access: 25 April 2024.
Lamboll, R. D., Nicholls, Z. R. J., Smith, C. J., Kikstra, J. S., Byers, E., and Rogelj, J.: Assessing the size and uncertainty of remaining carbon budgets, Nat. Climate Change, 13, 1360–1367, https://doi.org/10.1038/s41558-023-01848-5, 2023.
Lan, X., Tans, P. and Thoning, K. W.: Trends in globally-averaged CO2 determined from NOAA Global Monitoring Laboratory measurements, Version 2023-04, https://doi.org/10.15138/9N0H-ZH07, 2023a.
Lan, X., Thoning, K. W., and Dlugokencky, E.J.: Trends in globally-averaged CH4 N2O, and SF6 determined from NOAA Global Monitoring Laboratory measurements, Version 2023-04, https://doi.org/10.15138/P8XG-AA10, 2023b.
Laube, J., Newland, M., Hogan, C., Brenninkmeijer, A. M., Fraser, P. J., Martinerie, P., Oram, D. E., Reeves, C. E., Röckmann, T., Schwander, J., Witrant, E., Sturges, W. T.: Newly detected ozone-depleting substances in the atmosphere. Nature Geosci., 7, 266–269, https://doi.org/10.1038/ngeo2109, 2014.
Lee, J.-Y., Marotzke, J., Bala, G., Cao, L., Corti, S., Dunne, J. P., Engelbrecht, F., Fischer, E., Fyfe, J. C., Jones, C., Maycock, A., Mutemi, J., Ndiaye, O., Panickal, S., and Zhou, T.: Future Global Climate: Scenario-Based Projections and Near-Term Information, in: Climate Change 2021: The Physical Science Basis. Contribution of Working Group I to the Sixth Assessment Report of the Intergovernmental Panel on Climate Change, edited by: Masson-Delmotte, V., Zhai, P., Pirani, A., Connors, S. L., Péan, C., Berger, S., Caud, N., Chen, Y., Goldfarb, L., Gomis, M. I., Huang, M., Leitzell, K., Lonnoy, E., Matthews, J. B. R., Maycock, T. K., Waterfield, T., Yelekçi, O., Yu, R., and Zhou, B., Cambridge University Press, Cambridge, United Kingdom and New York, NY, USA, 553–672,https://doi.org/10.1017/9781009157896.006, 2021.
Lee, H., Calvin, K., Dasgupta, D., Krinner, G., Mukherji, A., Thorne, P., Trisos, C., Romero, J., Aldunce, P., Barrett, K., Blanco, G., Cheung, W. W. L., Connors, S. L., Denton, F., Diongue-Niang, A., Dodman, D., Garschagen, M. O., Geden, Hayward, B., Jones, C., Jotzo, F., Krug, T., Lasco, R., Lee, J.-Y., Masson-Delmotte, V., Meinshausen, M., Mintenbeck, K., Mokssit, A., Otto, F. E. L., Pathak, M., Pirani, A., Poloczanska, E., Pörtner, H.-O., Revi, A., Roberts, D. C., Roy, J., Ruane, A. C., Skea, J., Shukla, P. R., Slade, R., Slangen, A., Sokona, Y., Sörensson, A. A., Tignor, M., van Vuuren, D., Wei, Y.-M., Winkler, H., Zhai, P., and Zommers, Z.: Synthesis Report of the IPCC Sixth Assessment Report (AR6): Summary for Policymakers, Intergovernmental Panel on Climate Change accepted, https://www.ipcc.ch/report/ar6/syr/ (last access: 2 June 2024), 2023.
Liu, Z., Deng, Z., Davis, S. J., and Ciais, P.: Global carbon emissions in 2023, Nat. Rev. Earth Environ., 5, 253–254, https://doi.org/10.1038/s43017-024-00532-2, 2024.
Loeb, N. G., Johnson, G. C., Thorsen, T. J., Lyman, J. M., Rose, F. G., Kato, S.: Satellite and ocean data reveal marked increase in Earth's heating rate. Geophys. Res. Lett., 48, e2021GL093047, https://doi.org/10.1029/2021GL093047, 2021.
McKenna, C. M., Maycock, A. C., Forster, P. M., Smith, C. J., and Tokarska, K. B.: Stringent mitigation substantially reduces risk of unprecedented near-term warming rates, Nat. Clim. Change, 11, 126–131, https://doi.org/10.1038/s41558-020-00957-9, 2021.
Minière, A., von Schuckmann, K., Sallée, J.-B., and Vogt, L.: Robust acceleration of Earth system heating observed over the past six decades, Sci. Rep.-UK, 13, 22975, https://doi.org/10.1038/s41598-023-49353-1, 2023.
Minx, J. C., Lamb, W. F., Andrew, R. M., Canadell, J. G., Crippa, M., Döbbeling, N., Forster, P. M., Guizzardi, D., Olivier, J., Peters, G. P., Pongratz, J., Reisinger, A., Rigby, M., Saunois, M., Smith, S. J., Solazzo, E., and Tian, H.: A comprehensive and synthetic dataset for global, regional, and national greenhouse gas emissions by sector 1970–2018 with an extension to 2019, Earth Syst. Sci. Data, 13, 5213–5252, https://doi.org/10.5194/essd-13-5213-2021, 2021.
Nisbet, E. G., Manning, M. R., Dlugokencky, E. J., Michel, S. E., Lan, X., Roeckmann, T., Gon, H. A. D. V. D., Palmer, P., Oh, Y., Fisher, R., Lowry, D., France, J. L., and White, J. W. C.: Atmospheric methane: Comparison between methane's record in 2006–2022 and during glacial terminations, Preprints, https://doi.org/10.22541/essoar.167689502.25042797/v1, 2023.
Nitzbon, J., Krinner, G., and Langer, M.: GCOS EHI 1960-2020 Permafrost Heat Content, World Data Center for Climate (WDCC) at DKRZ, https://doi.org/10.26050/WDCC/GCOS_EHI_1960-2020_PHC, 2022.
Palmer, M. D. and McNeall, D. J.: Internal variability of Earth's energy budget simulated by CMIP5 climate models, Environ. Res. Lett., 9, 034016, https://doi.org/10.1088/1748-9326/9/3/034016, 2014.
Peng, S., Lin, X., Thompson, R. L., Xi, Y., Liu, G., Hauglustaine, D., Lan, X., Poulter, B., Ramonet, M., Saunois, M., Yin, Y., Zhang, Z., Zheng, B., and Ciais, P.: Wetland emission and atmospheric sink changes explain methane growth in 2020, Nature, 612, 477–482, https://doi.org/10.1038/s41586-022-05447-w, 2022.
Pirani, A., Alegria, A., Khourdajie, A. A., Gunawan, W., Gutiérrez, J. M., Holsman, K., Huard, D., Juckes, M., Kawamiya, M., Klutse, N., Krey, V., Matthews, R., Milward, A., Pascoe, C., Van Der Shrier, G., Spinuso, A., Stockhause, M., and Xiaoshi Xing: The implementation of FAIR data principles in the IPCC AR6 assessment process, Zenodo [data set], https://doi.org/10.5281/ZENODO.6504469, 2022.
Pongratz, J., Schwingshackl, C., Bultan, S., Obermeier, W., Havermann, F., and Guo, S.: Land Use Effects on Climate: Current State, Recent Progress, and Emerging Topics, Curr. Clim. Change Rep., 7, 99–120, https://doi.org/10.1007/s40641-021-00178-y, 2021.
Prinn, R. G., Weiss, R. F., Arduini, J., Arnold, T., DeWitt, H. L., Fraser, P. J., Ganesan, A. L., Gasore, J., Harth, C. M., Hermansen, O., Kim, J., Krummel, P. B., Li, S., Loh, Z. M., Lunder, C. R., Maione, M., Manning, A. J., Miller, B. R., Mitrevski, B., Mühle, J., O'Doherty, S., Park, S., Reimann, S., Rigby, M., Saito, T., Salameh, P. K., Schmidt, R., Simmonds, P. G., Steele, L. P., Vollmer, M. K., Wang, R. H., Yao, B., Yokouchi, Y., Young, D., and Zhou, L.: History of chemically and radiatively important atmospheric gases from the Advanced Global Atmospheric Gases Experiment (AGAGE), Earth Syst. Sci. Data, 10, 985–1018, https://doi.org/10.5194/essd-10-985-2018, 2018.
Quaas, J., Jia, H., Smith, C., Albright, A. L., Aas, W., Bellouin, N., Boucher, O., Doutriaux-Boucher, M., Forster, P. M., Grosvenor, D., Jenkins, S., Klimont, Z., Loeb, N. G., Ma, X., Naik, V., Paulot, F., Stier, P., Wild, M., Myhre, G., and Schulz, M.: Robust evidence for reversal of the trend in aerosol effective climate forcing, Atmos. Chem. Phys., 22, 12221–12239, https://doi.org/10.5194/acp-22-12221-2022, 2022.
Raghuraman, S. P., Paynter, D., and Ramaswamy, V.: Anthropogenic forcing and response yield observed positive trend in Earth's energy imbalance, Nat. Commun., 12, 4577, https://doi.org/10.1038/s41467-021-24544-4, 2021.
Ribes, A., Qasmi, S., and Gillett, N. P.: Making climate projections conditional on historical observations, Sci. Adv., 7, eabc0671, https://doi.org/10.1126/sciadv.abc0671, 2021.
Rogelj, J. and Lamboll, R. D.: Substantial reductions in non-CO2 greenhouse gas emissions reductions implied by IPCC estimates of the remaining carbon budget, Commun. Earth Environ., 5, 35, https://doi.org/10.1038/s43247-023-01168-8, 2024.
Rogelj, J., Rao, S., McCollum, D. L., Pachauri, S., Klimont, Z., Krey, V., and Riahi, K: Air-pollution emission ranges consistent with the representative concentration pathways, Nature Clim. Chang., 4, 446–450, https://doi.org/10.1038/nclimate2178, 2014.
Rogelj, J., Shindell, D., Jiang, K., Fifita, S., Forster, P., Ginzburg, V., Handa, C., Kheshgi, H., Kobayashi, S., Kriegler, E., Mundaca, L., Séférian, R., and Vilariño, M. V.: Mitigation Pathways Compatible with 1.5 °C in the Context of Sustainable Development, in: Global Warming of 1.5 °C. An IPCC Special Report on the impacts of global warming of 1.5 °C above pre-industrial levels and related global greenhouse gas emission pathways, in the context of strengthening the global response to the threat of climate change, sustainable development, and efforts to eradicate poverty, edited by: Masson-Delmotte, V., Zhai, P., Pörtner, H.-O., Roberts, D., Skea, J., Shukla, P. R., Pirani, A., Moufouma-Okia, W., Péan, C., Pidcock, R., Connors, S., Matthews, J. B. R., Chen, Y., Zhou, X., Gomis, M. I., Lonnoy, E., Maycock, T., Tignor, M., and Waterfield, T., Cambridge University Press, Cambridge, UK and New York, NY, USA, 93–174, https://doi.org/10.1017/9781009157940.004, 2018.
Rogelj, J., Forster, P. M., Kriegler, E., Smith, C. J., and Séférian, R.: Estimating and tracking the remaining carbon budget for stringent climate targets, Nature, 571, 335–342, https://doi.org/10.1038/s41586-019-1368-z, 2019.
Rohde, R., Muller, R., Jacobsen, R., Perlmutter, S., Rosenfeld, A., Wurtele, J., Curry, J., Wickham, C., and Mosher, S.: Berkeley Earth Temperature Averaging Process, Geoinfor. Geostat.: An Overview 1:2., https://doi.org/10.4172/2327-4581.1000103, 2013.
Scarpelli, T. R., Jacob, D. J., Grossman, S., Lu, X., Qu, Z., Sulprizio, M. P., Zhang, Y., Reuland, F., Gordon, D., and Worden, J. R.: Updated Global Fuel Exploitation Inventory (GFEI) for methane emissions from the oil, gas, and coal sectors: evaluation with inversions of atmospheric methane observations, Atmos. Chem. Phys., 22, 3235–3249, https://doi.org/10.5194/acp-22-3235-2022, 2022.
Schmidt, G.: Climate models can't explain 2023's huge heat anomaly – we could be in uncharted territory, Nature, 627, 467–467, https://doi.org/10.1038/d41586-024-00816-z, 2024.
Seneviratne, S. I., Zhang, X., Adnan, M., Badi, W., Dereczynski, C., Di Luca, A., Ghosh, S., Iskandar, I., Kossin, J., Lewis, S., Otto, F., Pinto, I., Satoh, M., Vicente-Serrano, S. M., Wehner, M., and Zhou, B.: Weather and Climate Extreme Events in a Changing Climate. In Climate Change 2021: The Physical Science Basis. Contribution of Working Group I to the Sixth Assessment Report of the Intergovernmental Panel on Climate Change, edited by: Masson-Delmotte, V., Zhai, P., Pirani, A., Connors, S. L., Péan, C., Berger, S., Caud, N., Chen, Y., Goldfarb, L., Gomis, M. I., Huang, M., Leitzell, K., Lonnoy, E., Matthews, J. B. R., Maycock, T. K., Waterfield, T., Yelekçi, O., Yu, R., and Zhou, B., Cambridge University Press, Cambridge, United Kingdom and New York, NY, USA, pp. 1513–1766, https://doi.org/10.1017/9781009157896.013, 2021.
Simmonds, P. G., Rigby, M., McCulloch, A., O'Doherty, S., Young, D., Mühle, J., Krummel, P. B., Steele, P., Fraser, P. J., Manning, A. J., Weiss, R. F., Salameh, P. K., Harth, C. M., Wang, R. H. J., and Prinn, R. G.: Changing trends and emissions of hydrochlorofluorocarbons (HCFCs) and their hydrofluorocarbon (HFCs) replacements, Atmos. Chem. Phys., 17, 4641–4655, https://doi.org/10.5194/acp-17-4641-2017, 2017.
Sippel, S., Zscheischler, J., Heimann, M., Otto, F. E. L., Peters, J., and Mahecha, M. D.: Quantifying changes in climate variability and extremes: Pitfalls and their overcoming, Geophys. Res. Lett., 42, 9990–9998, https://doi.org/10.1002/2015GL066307, 2015.
Smith, C., Nicholls, Z. R. J., Armour, K., Collins, W., Forster, P., Meinshausen, M., Palmer, M. D., and Watanabe, M.: The Earth's Energy Budget, Climate Feedbacks, and Climate Sensitivity Supplementary Material, in: Climate Change 2021: The Physical Science Basis. Contribution of Working Group I to the Sixth Assessment Report of the Intergovernmental Panel on Climate Change, edited by: Masson-Delmotte, V., Zhai, P., Pirani, A., Connors, S. L., Péan, C., Berger, S., Caud, N., Chen, Y., Goldfarb, L., Gomis, M. I., Huang, M., Leitzell, K., Lonnoy, E., Matthews, J. B. R., Maycock, T. K., Waterfield, T., Yelekçi, O., Yu, R., and Zhou, B., 2021.
Smith, C., Walsh, T., Gillett, N., Hall, B., Hauser, M., Krummel, P., Lamb, W., Lamboll, R., Lan, X., Muhle, J., Palmer, M., Ribes, A., Schumacher, D., Seneviratne, S., Trewin, B., von Schuckmann, K., and Forster, P.: ClimateIndicator/data: Indicators of Global Climate Change 2023 revision (v2024.05.29b), Zenodo [data set], https://doi.org/10.5281/zenodo.11388387, 2024a.
Smith, C., Walsh, T., Gillett, N., Hall, B., Hauser, M., Krummel, P., Lamb, W., Lamboll, R., Lan, X., Muhle, J., Palmer, M., Ribes, A., Schumacher, D., Seneviratne, S., Trewin, B., von Schuckmann, K., and Forster, P.: Indicators of Global Climate Change 2023, Github [code], https://github.com/ClimateIndicator/data/tree/v2024.05.29b, last access: 25 April 2024b.
Smith, S. J., van Aardenne, J., Klimont, Z., Andres, R. J., Volke, A., and Delgado Arias, S.: Anthropogenic sulfur dioxide emissions: 1850–2005, Atmos. Chem. Phys., 11, 1101–1116, https://doi.org/10.5194/acp-11-1101-2011, 2011.
Storto, A. and Yang, C.: Acceleration of the ocean warming from 1961 to 2022 unveiled by large-ensemble reanalyses, Nat. Commun., 15, 545, https://doi.org/10.1038/s41467-024-44749-7, 2024.
Szopa, S., Naik, V., Adhikary, B., Artaxo, P., Berntsen, T., Collins, W. D., Fuzzi, S., Gallardo, L., Kiendler-Scharr, A., Klimont, Z., Liao, H., Unger, N., and Zanis, P.: Short-Lived Climate Forcers. In Climate Change 2021: The Physical Science Basis. Contribution of Working Group I to the Sixth Assessment Report of the Intergovernmental Panel on Climate Change, edited by: Masson-Delmotte, V., Zhai, P., Pirani, A., Connors, S. L., Péan, C., Berger, S., Caud, N., Chen, Y., Goldfarb, L., Gomis, M. I., Huang, M., Leitzell, K., Lonnoy, E., Matthews, J. B. R., Maycock, T. K., Waterfield, T., Yelekçi, O., Yu, R., and Zhou, B., Cambridge University Press, Cambridge, United Kingdom and New York, NY, USA, 817–922, https://doi.org/10.1017/9781009157896.008, 2021.
Tibrewal, K., Ciais, P., Saunois, M., Martinez, A., Lin, X., Thanwerdas, J., Deng, Z., Chevallier, F., Giron, C., Albergel, C., Tanaka, K., Patra, P., Tsuruta, A., Zheng, B., Belikov, D., Niwa, Y., Janardanan, R., Maksyutov, S., Segers, A., Tzompa-Sosa, Z. A., Bousquet, P., and Sciare, J.: Assessment of methane emissions from oil, gas and coal sectors across inventories and atmospheric inversions, Commun. Earth Environ., 5, 26, https://doi.org/10.1038/s43247-023-01190-w, 2024.
Vanderkelen, I. and Thiery, W.: GCOS EHI 1960–2020 Inland Water Heat Content, https://doi.org/10.26050/WDCC/GCOS_EHI_1960-2020_IWHC, 2022.
van der Werf, G. R., Randerson, J. T., Giglio, L., van Leeuwen, T. T., Chen, Y., Rogers, B. M., Mu, M., van Marle, M. J. E., Morton, D. C., Collatz, G. J., Yokelson, R. J., and Kasibhatla, P. S.: Global fire emissions estimates during 1997–2016, Earth Syst. Sci. Data, 9, 697–720, https://doi.org/10.5194/essd-9-697-2017, 2017.
van Marle, M. J. E., Kloster, S., Magi, B. I., Marlon, J. R., Daniau, A.-L., Field, R. D., Arneth, A., Forrest, M., Hantson, S., Kehrwald, N. M., Knorr, W., Lasslop, G., Li, F., Mangeon, S., Yue, C., Kaiser, J. W., and van der Werf, G. R.: Historic global biomass burning emissions for CMIP6 (BB4CMIP) based on merging satellite observations with proxies and fire models (1750–2015), Geosci. Model Dev., 10, 3329–3357, https://doi.org/10.5194/gmd-10-3329-2017, 2017.
Vimont, I. J., Hall, B. D., Dutton, G., Montzka, S. A., Mühle, J., Crotwell, M., Petersen, K., Clingan, S., and Nance, D., in: State of the Climate in 2022, B. Am. Meteorol. Soc., 104, S76–S78, https://doi.org/10.1175/BAMS-D-23-0090.1., 2022.
Vollmer, M. K., Young, D., Trudinger, C. M., Mühle, J., Henne, S., Rigby, M., Park, S., Li, S., Guillevic, M., Mitrevski, B., Harth, C. M., Miller, B. R., Reimann, S., Yao, B., Steele, L. P., Wyss, S. A., Lunder, C. R., Arduini, J., McCulloch, A., Wu, S., Rhee, T. S., Wang, R. H. J., Salameh, P. K., Hermansen, O., Hill, M., Langenfelds, R. L., Ivy, D., O'Doherty, S., Krummel, P. B., Maione, M., Etheridge, D. M., Zhou, L., Fraser, P. J., Prinn, R. G., Weiss, R. F., and Simmonds, P. G.: Atmospheric histories and emissions of chlorofluorocarbons CFC-13 (CClF3), ΣCFC-114 (C2Cl2F4), and CFC-115 (C2ClF5), Atmos. Chem. Phys., 18, 979–1002, https://doi.org/10.5194/acp-18-979-2018, 2018.
von Schuckmann, K., Cheng, L., Palmer, M. D., Hansen, J., Tassone, C., Aich, V., Adusumilli, S., Beltrami, H., Boyer, T., Cuesta-Valero, F. J., Desbruyères, D., Domingues, C., García-García, A., Gentine, P., Gilson, J., Gorfer, M., Haimberger, L., Ishii, M., Johnson, G. C., Killick, R., King, B. A., Kirchengast, G., Kolodziejczyk, N., Lyman, J., Marzeion, B., Mayer, M., Monier, M., Monselesan, D. P., Purkey, S., Roemmich, D., Schweiger, A., Seneviratne, S. I., Shepherd, A., Slater, D. A., Steiner, A. K., Straneo, F., Timmermans, M.-L., and Wijffels, S. E.: Heat stored in the Earth system: where does the energy go?, Earth Syst. Sci. Data, 12, 2013–2041, https://doi.org/10.5194/essd-12-2013-2020, 2020.
von Schuckmann, K., Minière, A., Gues, F., Cuesta-Valero, F. J., Kirchengast, G., Adusumilli, S., Straneo, F., Ablain, M., Allan, R. P., Barker, P. M., Beltrami, H., Blazquez, A., Boyer, T., Cheng, L., Church, J., Desbruyeres, D., Dolman, H., Domingues, C. M., García-García, A., Giglio, D., Gilson, J. E., Gorfer, M., Haimberger, L., Hakuba, M. Z., Hendricks, S., Hosoda, S., Johnson, G. C., Killick, R., King, B., Kolodziejczyk, N., Korosov, A., Krinner, G., Kuusela, M., Landerer, F. W., Langer, M., Lavergne, T., Lawrence, I., Li, Y., Lyman, J., Marti, F., Marzeion, B., Mayer, M., MacDougall, A. H., McDougall, T., Monselesan, D. P., Nitzbon, J., Otosaka, I., Peng, J., Purkey, S., Roemmich, D., Sato, K., Sato, K., Savita, A., Schweiger, A., Shepherd, A., Seneviratne, S. I., Simons, L., Slater, D. A., Slater, T., Steiner, A. K., Suga, T., Szekely, T., Thiery, W., Timmermans, M.-L., Vanderkelen, I., Wjiffels, S. E., Wu, T., and Zemp, M.: Heat stored in the Earth system 1960–2020: where does the energy go?, Earth Syst. Sci. Data, 15, 1675–1709, https://doi.org/10.5194/essd-15-1675-2023, 2023a.
von Schuckmann, K., Minière, A., Gues, F., Cuesta-Valero, F. J., Kirchengast, G., Adusumilli, S., Straneo, F., Ablain, M., Allan, R. P., Barker, P. M., Beltrami, H., Blazquez, A., Boyer, T., Cheng, L., Church, J., Desbruyeres, D., Dolman, H., Domingues, C. M., García-García, A., Giglio, D., Gilson, J. E., Gorfer, M., Haimberger, L., Hakuba, M. Z., Hendricks, S., Hosoda, S., Johnson, G. C., Killick, R., King, B., Kolodziejczyk, N., Korosov, A., Krinner, G., Kuusela, M., Landerer, F. W., Langer, M., Lavergne, T., Lawrence, I., Li, Y., Lyman, J., Marti, F., Marzeion, B., Mayer, M., MacDougall, A. H., McDougall, T., Monselesan, D. P., Nitzbon, J., Otosaka, I., Peng, J., Purkey, S., Roemmich, D., Sato, K., Sato, K., Savita, A., Schweiger, A., Shepherd, A., Seneviratne, S. I., Simons, L., Slater, D. A., Slater, T., Steiner, A. K., Suga, T., Szekely, T., Thiery, W., Timmermans, M.-L., Vanderkelen, I., Wjiffels, S. E., Wu, T., and Zemp, M.: GCOS EHI 1960-2020 Earth Heat Inventory Ocean Heat Content (Version 2), https://doi.org/10.26050/WDCC/GCOS_EHI_1960-2020_OHC_v2, 2023b.
Western, L. M., Vollmer, M. K., Krummel, P. B., Adcock, K. E., Fraser, P. J., Harth, C. M., Langenfelds, R. L., Montzka, S. A., Mühle, J., O'Doherty, S., Oram, D. E., Reimann, S., Rigby, M., Vimont, I., Weiss, R. F., Young, D., and Laube, J. C.: Global increase of ozone-depleting chlorofluorocarbons from 2010 to 2020, Nat. Geosci., 16, 309–313, https://doi.org/10.1038/s41561-023-01147-w, 2023.
Wild, M., Gilgen, H., Roesch, A., Ohmura, A., Long, C. N., Dutton, E. G., Forgan, B., Kallis, A., Russak, V., and Tsvetkov, A.: From Dimming to Brightening: Decadal Changes in Solar Radiation at Earth's Surface, Science, 308, 847–850, https://doi.org/10.1126/science.1103215, 2005.
Zhang, Z., Poulter, B., Feldman, A.F., Ying, Q., Ciais, P., Peng, S., and Xin, L.: Recent intensification of wetland methane feedback, Nat. Clim. Chang., 13, 430–433, https://doi.org/10.1038/s41558-023-01629-0, 2023.
- Abstract
- Introduction
- Emissions
- Well-mixed greenhouse gas concentrations
- Effective radiative forcing (ERF)
- Earth energy imbalance
- Global surface temperatures
- Human-induced global warming
- Remaining carbon budget
- Climate and weather extremes
- Code and data availability
- Discussion and conclusions
- Author contributions
- Competing interests
- Disclaimer
- Acknowledgements
- Financial support
- Review statement
- References
- Supplement
Please read the editorial note first before accessing the article.
- Article
(6203 KB) - Full-text XML
- Version 2022
- Version 2024
-
Supplement
(2150 KB) - BibTeX
- EndNote
- Abstract
- Introduction
- Emissions
- Well-mixed greenhouse gas concentrations
- Effective radiative forcing (ERF)
- Earth energy imbalance
- Global surface temperatures
- Human-induced global warming
- Remaining carbon budget
- Climate and weather extremes
- Code and data availability
- Discussion and conclusions
- Author contributions
- Competing interests
- Disclaimer
- Acknowledgements
- Financial support
- Review statement
- References
- Supplement