the Creative Commons Attribution 4.0 License.
the Creative Commons Attribution 4.0 License.
 | 22 May 2024
LGHAP v2: a global gap-free aerosol optical depth and PM2.5 concentration dataset since 2000 derived via big Earth data analytics
Ke Li
Liuqing Shao
Xinran Li
Chaoshun Liu
Zhengqiang Li
Mingliang Ma
Di Han
Yibing Sun
Zhe Zheng
Ruijie Li
Ni-Bin Chang
The Long-term Gap-free High-resolution Air Pollutants (LGHAP) concentration dataset generated in our previous study has provided spatially contiguous daily aerosol optical depth (AOD) and fine particulate matter (PM2.5) concentrations at a 1 km grid resolution in China since 2000. This advancement empowered unprecedented assessments of regional aerosol variations and their influence on the environment, health, and climate over the past 20 years. However, there is a need to enhance such a high-quality AOD and PM2.5 concentration dataset with new robust features and extended spatial coverage. In this study, we present version 2 of a global-scale LGHAP dataset (LGHAP v2), which was generated using improved big Earth data analytics via a seamless integration of versatile data science, pattern recognition, and machine learning methods. Specifically, multimodal AODs and air quality measurements acquired from relevant satellites, ground monitoring stations, and numerical models were harmonized by harnessing the capability of random-forest-based data-driven models. Subsequently, an improved tensor-flow-based AOD reconstruction algorithm was developed to weave the harmonized multisource AOD products together for filling data gaps in Multi-Angle Implementation of Atmospheric Correction (MAIAC) AOD retrievals from Terra. The results of the ablation experiments demonstrated better performance of the improved tensor-flow-based gap-filling method in terms of both convergence speed and data accuracy. Ground-based validation results indicated good data accuracy of this global gap-free AOD dataset, with a correlation coefficient (R) of 0.85 and a root mean square error (RMSE) of 0.14 compared to the worldwide AOD observations from the AErosol RObotic NETwork (AERONET), outperforming the purely reconstructed AODs (R = 0.83, RMSE = 0.15), but they were slightly worse than raw MAIAC AOD retrievals (R = 0.88, RMSE = 0.11). For PM2.5 concentration mapping, a novel deep-learning approach, termed the SCene-Aware ensemble learning Graph ATtention network (SCAGAT), was hereby applied. While accounting for the scene representativeness of data-driven models across regions, the SCAGAT algorithm performed better during spatial extrapolation, largely reducing modeling biases over regions with limited and/or even absent in situ PM2.5 concentration measurements. The validation results indicated that the gap-free PM2.5 concentration estimates exhibit higher prediction accuracies, with an R of 0.95 and an RMSE of 5.7 µg m−3, compared to PM2.5 concentration measurements obtained from former holdout sites worldwide. Overall, while leveraging state-of-the-art methods in data science and artificial intelligence, a quality-enhanced LGHAP v2 dataset was generated through big Earth data analytics by cohesively weaving together multimodal AODs and air quality measurements from diverse sources. The gap-free, high-resolution, and global coverage merits render the LGHAP v2 dataset an invaluable database for advancing aerosol- and haze-related studies as well as triggering multidisciplinary applications for environmental management, health-risk assessment, and climate change attribution. All gap-free AOD and PM2.5 concentration grids in the LGHAP v2 dataset, as well as the data user guide and relevant visualization codes, are publicly accessible at https://zenodo.org/communities/ecnu_lghap (last access: 3 April 2024, Bai and Li, 2023a).
- Article
(24159 KB) - Full-text XML
-
Supplement
(7911 KB) - BibTeX
- EndNote


Atmospheric aerosols, produced from either natural or anthropogenic emissions, have been proven to pose significant threats to human health, the ambient environment, and climate (Up in the aerosol, 2022). The risks to public health from aerosol pollution are evident, with about 4.2 million deaths per year attributable to the exposure of fine aerosol particles, as stated by the World Health Organization (WHO, 2022). With increased aerosol loading, aerosols can significantly impair atmospheric visibility because of the hygroscopic effect, thereby reducing direct solar radiation on Earth's surface (Liu et al., 2020; Wang and Yang, 2014; Wild et al., 2021; Yang et al., 2016). In addition to the evident influence on air quality (Li et al., 2017), atmospheric aerosols have an important and complex influence on regional and even global climate (Guo et al., 2016, 2019; Li et al., 2019; Yang et al., 2020; Zhao et al., 2020). Therefore, accurate monitoring of the atmospheric aerosol loading is vital for improving our understanding of the human-driven ambient environment and exposure pathways in health-risk assessment.
Aerosol optical depth (AOD), a measure of aerosols distributed within an air column from Earth's surface to the top of the atmosphere, has been widely used as a key indicator of total atmospheric aerosol loading. Ground-based aerosol observing networks, e.g., the internationally collaborated AErosol RObotic NETwork (AERONET), China Aerosol Remote Sensing Network (CARSNET), and Sun-Sky Radiometer Observation Network (SONET), have long served as the ground truth for AOD monitoring (Che et al., 2015; Giles et al., 2019; Li et al., 2018). However, the sparse distribution of aerosol monitoring stations poses a significant challenge in gaining a comprehensive understanding of the aerosol variations across the globe.
Satellite-based AOD data bridge this gap by providing spatially resolved AOD retrievals with extensive spatial coverage. Over the past 40 years, a variety of spaceborne instruments, e.g., the Sea-Viewing Wide Field-of-View Sensor (SeaWiFS), Moderate Resolution Imaging Spectroradiometer (MODIS), Visible Infrared Imaging Radiometer Suite (VIIRS), and Polarization and Directionality of the Earth's Reflectances (POLDER), were deployed on board various satellite platforms and launched into space (Wei et al., 2020). These versatile instruments provide ample AOD and aerosol property measurements, enabling us to map the global AOD distribution with finer spatial resolutions. Nonetheless, satellite-based AOD retrievals often suffer from excessive data gaps because of extensive cloud cover and retrieval failures, significantly impairing the data application potential and resulting in large uncertainties when assessing the influence of aerosol on weather and climate.
A variety of gap-filling methods were developed and applied to reconstruct the missing values in the remotely sensed satellite AOD images (Wei et al., 2020; Xiao et al., 2021). The simplest method is to fill in data gaps with valid observations from alternative data sources, e.g., filling in data gaps in MODIS AOD images from Terra with AOD observations from Aqua (Bai et al., 2019; Sogacheva et al., 2020) or fusing with AOD simulation outputs from numerical models (Xiao et al., 2021). Such a substitution method is straightforward and effective, particularly in an era with big Earth observation data. Nonetheless, cross-mission biases are always salient between satellite-based retrievals because of the significant differences in instrument properties and/or retrieval algorithms. Thus, bias correction is essential for reducing systematic biases (Bai et al., 2016b, a), and methods such as linear regression and maximum likelihood estimation are often applied for this purpose (Bai et al., 2016a, b, 2019; Ma et al., 2016; Xu et al., 2015). More complex methods, like Bayesian maximum entropy, were also applied to fuse AOD products, even with varying spatial resolutions (Tang et al., 2016; X. Wei et al., 2021).
Another type of gap-filling method works, in principle, to recover missing information via dominant pattern recognition and reconstruction over space and time, and the Data INterpolating Empirical Orthogonal Functions (DINEOF) method is a representative one (Beckers and Rixen, 2003; Liu and Wang, 2019). Two similar methods were developed to fill data gaps in the ground-measured particulate matter (PM2.5) concentration time series and geostationary satellite-sensed AOD images (Bai et al., 2020; L. Li et al., 2022). Similarly, Zhang et al. (2022) developed a spatiotemporal fitting algorithm to fill gaps in the daily MODIS AOD product by predicting AOD values based on annual trends and spatial residues inferred from neighboring pixels. Nonetheless, filling data gaps with a single data source is always challenging, particularly for those with extensive missing values (e.g., satellite-based AOD). Learning missing values from external information, e.g., numerical AOD simulations (Li et al., 2020; Xiao et al., 2017) and meteorological factors (Bi et al., 2019), was proven an effective and feasible way of improving the spatial coverage of reconstructed AOD fields.
The tensor-flow-based method, a more complex big data analytics framework, was developed to integrate six satellite-based AOD datasets, numerical aerosol diagnostics, and in situ air quality measurements, while a machine learning method, i.e., random forest, was applied for downscaling and bias-correction purposes (Bai et al., 2022a). Harnessing multimodal data fusion and missing value reconstruction capabilities, a long-term gap-free high-resolution MODIS-like AOD dataset (LGHAP v1) was successfully generated in China, with an overall data accuracy comparable to raw satellite retrievals, from which gap-free PM2.5 and PM10 concentrations were mapped on a daily basis. Despite the good performance, additional investigations have recently proven the critical importance of prior information for tensor-flow-based gap-filling, particularly over areas with substantial missing values (Bai et al., 2022a; K. Li et al., 2022; L. Li et al., 2022). Moreover, the strategies of maintaining an invariant background field and assigning equal weights to different AOD inputs may slow down the convergence speed and degrade the reconstruction accuracy.
In this study, we present a new global-scale LGHAP dataset, referred to as LGHAP v2 hereafter, which extends daily gap-free AOD and PM2.5 concentrations from China to worldwide at a 1 km grid resolution for the period of 2000–2021. To accommodate massive global Earth observations acquired from diverse sources, an improved big Earth data analytics approach was developed by harnessing several new algorithmic improvements to enhance the tensor-flow-based AOD gap-filling. Moreover, a novel deep-learning method, i.e., the SCene-Aware ensemble learning Graph ATtention network (SCAGAT), was applied to fulfill far more accurate PM2.5 concentration mapping across the globe, particularly over regions with limited air quality monitoring stations. Benefiting from the customized algorithmic improvements and the innovative SCAGAT PM2.5 concentration mapping approach, the LGHAP v2 dataset has not only an extended spatial coverage from China to worldwide, but also improved data accuracy. As a publicly accessible and global long-term gap-free MODIS-like AOD and PM2.5 concentration dataset, LGHAP v2 serves as a promising data source to improve our understanding of global aerosol pollution dynamics and its adverse impacts on public health, ecosystems, weather, and climate.
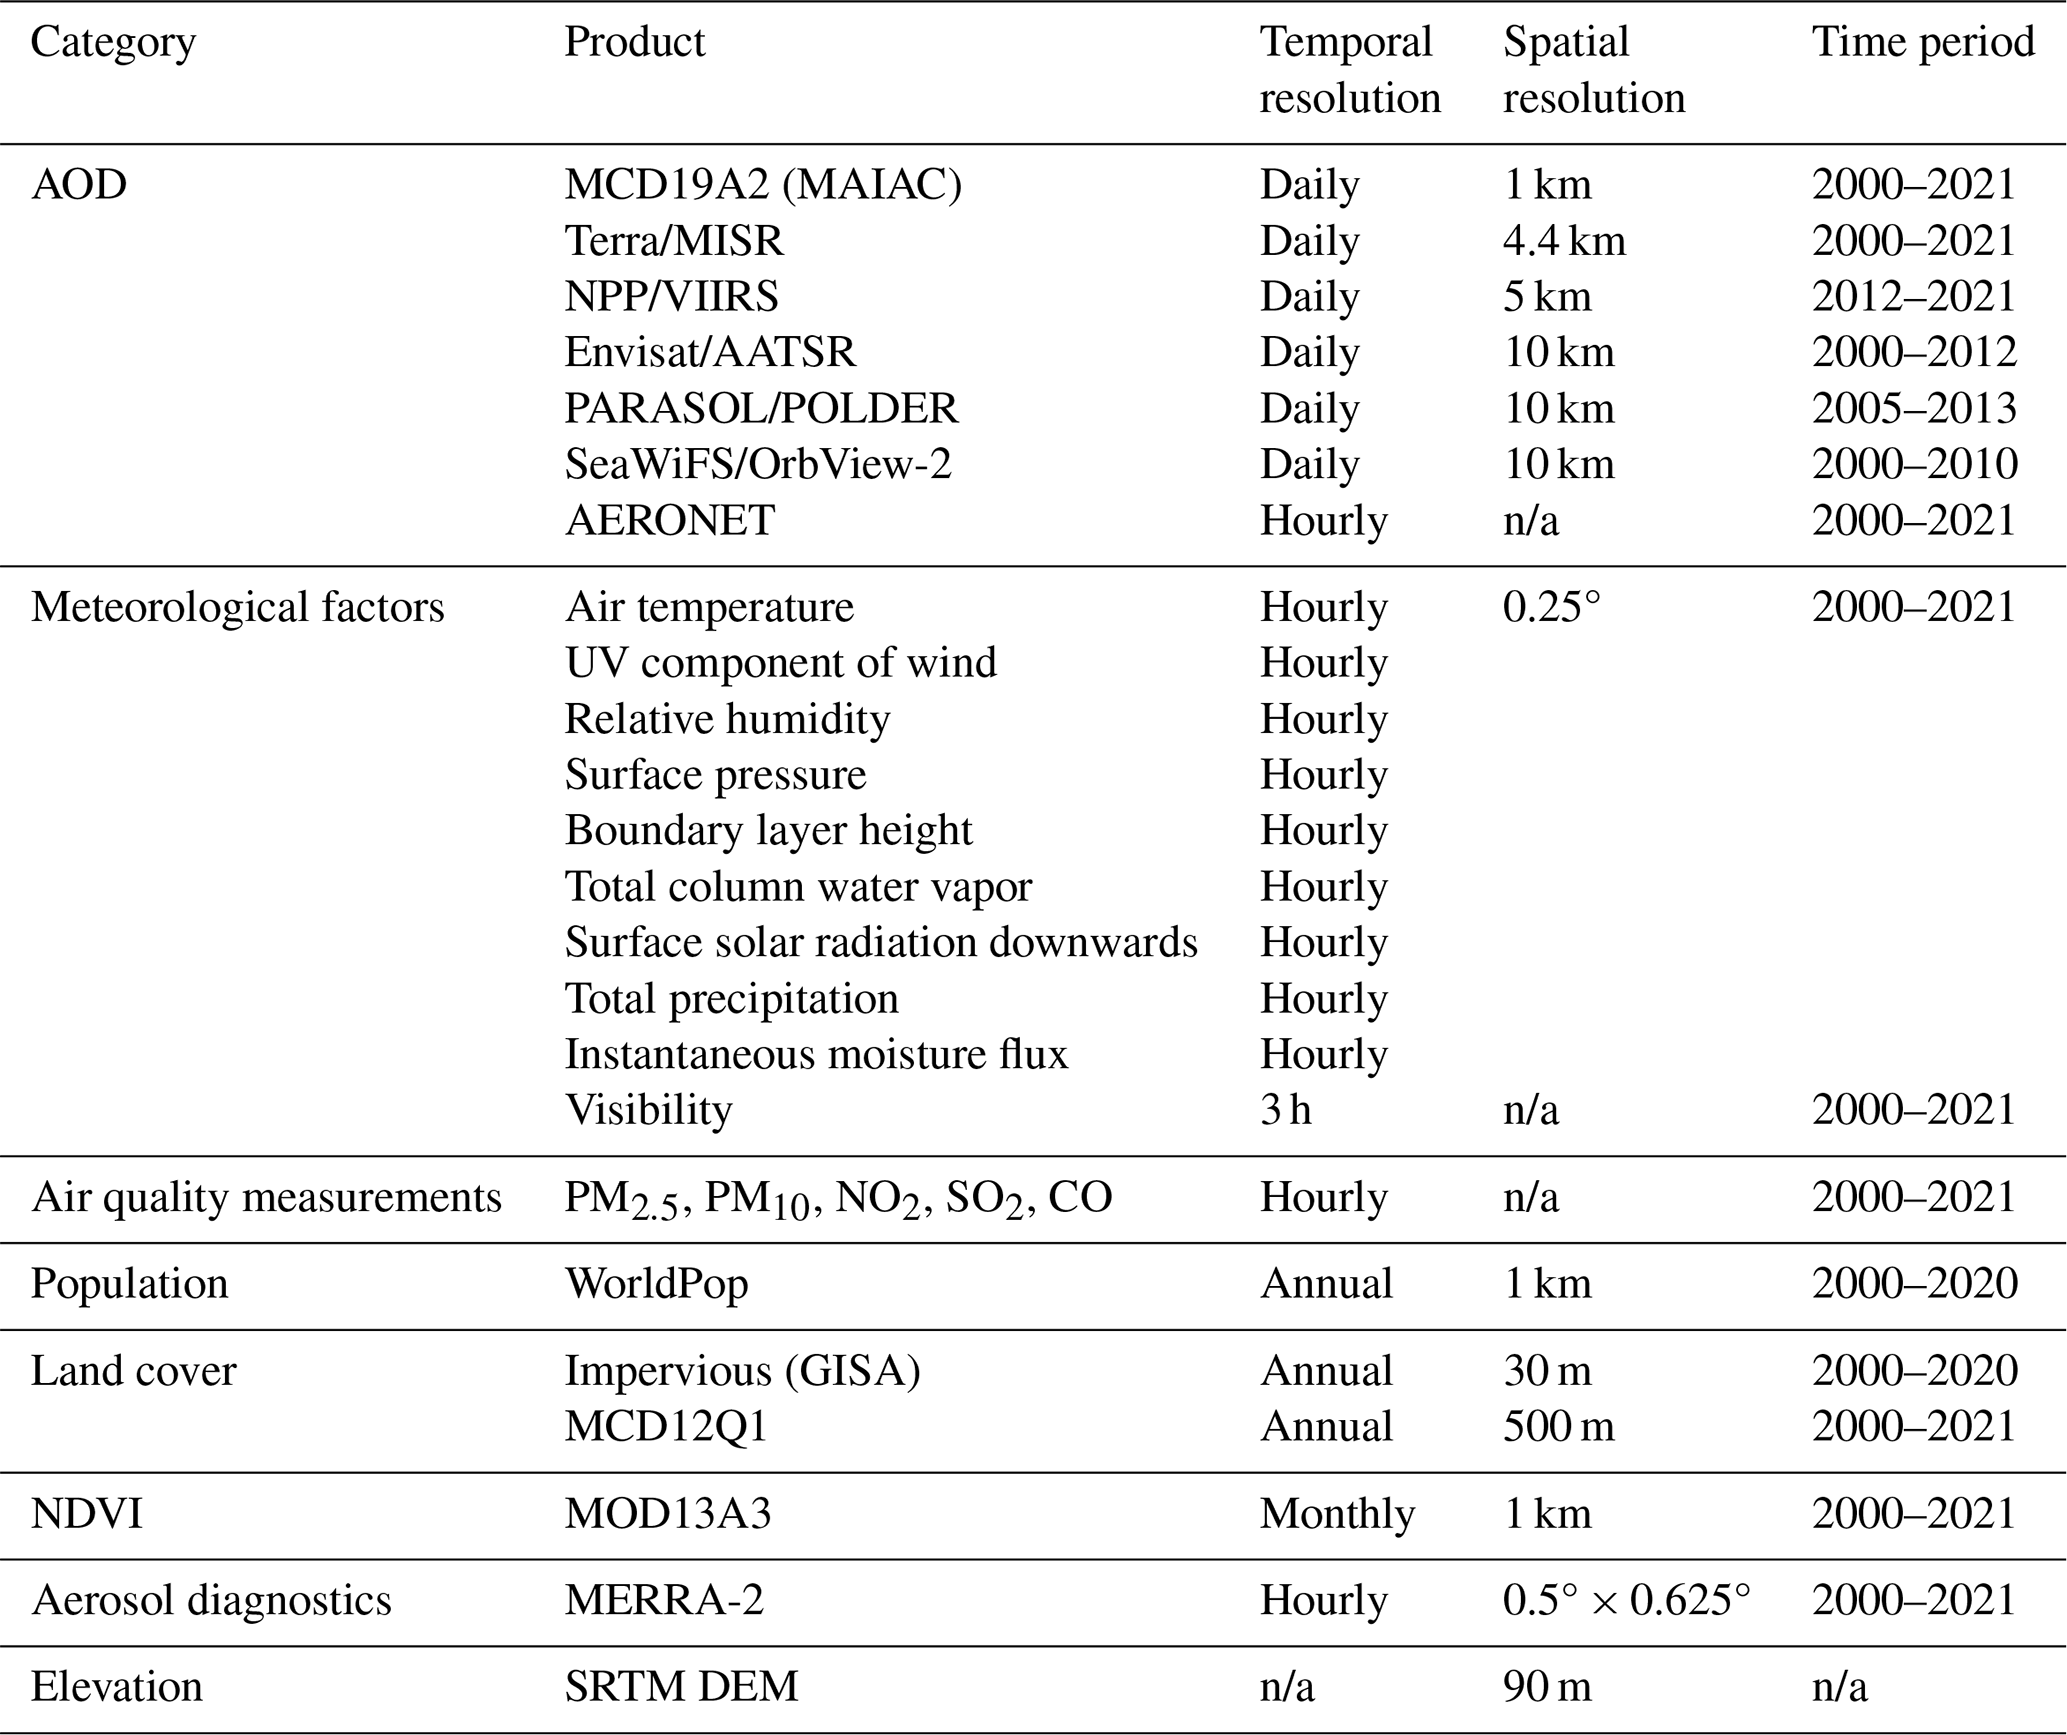
Similarly to our previous study, here we aim to synergistically integrate the big Earth data acquired from diverse sources to generate a global long-term gap-free AOD dataset with a daily 1 km resolution, from which spatially contiguous PM2.5 concentration estimates can then be derived using a more robust and accurate data-driven approach. Table 1 describes the array of big Earth data employed in this study, including gridded AOD products from six polar-orbiting satellites, numerically simulated Modern-Era Retrospective Analysis for Research and Applications version 2 (MERRA-2) aerosol diagnostics, 10 meteorological reanalysis fields, and datasets of in situ AOD and air pollutant concentration measurements. Additionally, auxiliary parameters representing land use and land cover types, elevation, population density, and vegetation covers were also employed as critical explanatory variables to harmonize discrepancies among multimodal heterogeneous aerosol datasets. Note that the spatial and temporal resolution as well as the time period for each data product are different from those of the benchmark dataset, i.e., the Multi-Angle Implementation of Atmospheric Correction (MAIAC) AOD product, and a data homogenization method is therefore essential to account for such discrepancies to reduce possible bias propagation in the subsequent data fusion procedure.
Table 1Summary of the diverse big Earth data used in this study to generate global gap-free AOD and PM2.5 concentrations at daily and 1 km resolutions (LGHAP v2) from 2000 to 2021. Note spatial resolution is not applicable (n/a) for site-based data.
2.1 Satellite-based AOD products
The AOD retrievals, derived from the MODIS sensor on board Terra using the MAIAC algorithm (denoted as AODTerra afterwards), were hereby used as the benchmark for generating the global long-term gap-free AOD dataset, given their finer spatiotemporal resolution and longer temporal coverage (Lyapustin et al., 2011, 2018; Mhawish et al., 2019). Previous studies have demonstrated the superior quality of AODTerra relative to other gridded AOD products (Chen et al., 2021; Martins et al., 2017; Qin et al., 2021) in regard to data accuracy and spatiotemporal completeness, even better than those retrieved with the well-known Dark Target and Deep Blue algorithms (Jiang et al., 2023; Liu et al., 2019). Figure S1 in the Supplement presents the spatial and temporal distribution of the coverage ratio of valid AODTerra from 2000 to 2021 at each satellite footprint across the globe.
Satellite-based AOD retrievals from a few key instruments other than MODIS were also applied to support gap-filling of AODTerra, and they include the (1) VIIRS on board Suomi-NPP, (2) Multi-angle Imaging SpectroRadiometer (MISR, on board Terra), (3) Advanced Along-Track Scanning Radiometer (AATSR, on board Envisat), (4) POLDER on board PARASOL, and (5) SeaWIFS on board SeaStar. Meanwhile, MAIAC AOD data from MODIS on board Aqua were also applied as an important complementary data source. Given their varied overpassing times and temporal spans, these multisensory AOD datasets can provide complementary observations to help reduce random errors during the AOD data reconstruction procedure because of the known prior knowledge. More details of these AOD products can be found in Bai et al. (2022a) and Wei et al. (2020).
2.2 Ground-based AOD observations and air quality measurements
2.2.1 AERONET AOD observations
Ground-based AOD observations from AERONET have long been used as the ground truth for validating AOD retrievals from other instruments, particularly diverse satellite-based AOD retrievals. In this study, AOD observations from AERONET during the study period were employed as an independent data source to validate the data accuracy of the global gap-filled AOD dataset. To guarantee an adequate number of AERONET AOD samples, the Level 1.5 AOD observations instead of Level 2.0 were applied, though the latter has stricter screening criteria for quality control. For spatial registration, each AERONET AOD observation was spatially collocated with mean AOD values over grids within a 5 × 5 km window size. Figure S2 presents the spatial distribution of the AERONET sites used in this study.
2.2.2 Air quality measurements
Concentrations of PM2.5 and other relevant air pollutants, like NO2, SO2, PM10, and CO, were acquired from a few environmental agencies and monitoring centers, e.g., the United States Environmental Protection Agency, European Air Quality Portal, China National Environmental Monitoring Centre, Canada National Air Pollution Surveillance, and Japan National Institute for Environmental Studies, to name a few. Moreover, air quality measurements acquired from the World's Air Pollution Index, an open-source data hub, were included as well. Given potential differences in measuring principles and quality control criteria, we performed rigorous data cleaning measures to harmonize these multisource air quality measurements, including not only the removal of outliers, but also a unification of timescales to the daily average. Aiming to provide critical information to facilitate the AOD gap-filling, ground-based air quality measurements were used as an important proxy for regional in situ AOD prediction, largely because of the relatively dense distribution of air quality monitoring networks and the associations between aerosol loadings and regional air pollutant concentrations.
Atmospheric visibility, a common air quality indicator highly associated with aerosol loadings, was acquired from worldwide meteorological monitoring stations and used to predict AOD over each monitoring site via data-driven modeling. Given the much denser distribution of ambient air quality and meteorological monitoring sites, as shown in Fig. S2 in the Supplement, a global virtual AOD monitoring network was in turn established, harnessing the associations between AOD and air-quality-relevant parameters. Such a virtual network provides us with an unparalleled opportunity to improve AOD gap-filling accuracy and efficiency, particularly over regions with massive data voids in satellite AOD images (Bai et al., 2022b; Li et al., 2022b).
2.3 Numerical simulations
2.3.1 MERRA-2 aerosol diagnostics
The MERRA-2 aerosol diagnostics, including total AOD and aerosol components like black carbon, organic carbon, dust, and sulfate aerosols, were employed to provide prior information to advance AOD gap-filling. As NASA's latest reanalysis for the satellite era, MERRA-2 is generated using the new Earth system model, the Goddard Earth Observing System version 5 (GEOS-5), providing global simulations of a variety of geophysical and chemical variables on Earth's surface. More details of the assimilation system and the data quality of MERRA-2 aerosol reanalysis can be found in Buchard et al. (2017) and Randles et al. (2017). By taking AODTerra as the learning target, data-driven models were established to spatially downscale and bias-correct the MERRA-2 AOD field, with meteorological, geographical, and socioeconomic factors used as covariates. This downscaled and bias-corrected MERRA-2 AOD field, given its spatially contiguous coverage, was then used as critical information to facilitate the gap-filling of AODTerra.
2.3.2 ERA5 reanalysis
As the latest atmospheric reanalysis produced by the European Centre for Medium-Range Weather Forecasts, ERA5 provides hourly estimates of a variety of atmospheric, terrestrial, oceanic, climatic, and meteorological variables. The data are provided for a 30 km grid resolution on Earth's surface, delineating the atmosphere layer using 137 levels from the surface up to a height of 80 km, covering the period from January 1940 to the present (Hersbach et al., 2020). Atmospheric parameters, including surface pressure, air temperature, relative humidity, wind speed, total column water, total precipitation, surface solar radiation downward, instantaneous moisture flux, and boundary layer height, were acquired from ERA5 and used as important modeling covariates in both data harmonization and PM2.5 mapping models. A simple bilinear interpolation was applied to the ERA5 reanalysis data to convert them to the AODTerra footprint resolution for spatial registration.
2.4 Auxiliary data
Several socioeconomic and geographic factors were also applied as covariates to support AOD gap-filling and PM2.5 concentration mapping. Specifically, gridded population data from WorldPop were used to indicate the spatial distribution of residents, serving as a critical proxy for anthropogenic air pollutant emission intensity. To characterize the land-use-dependent aerosol emissions, land cover types and the vegetation index derived from MODIS products along with the coverage ratio of an impervious surface calculated from the land use dataset generated by Huang et al. (2022) were also applied. The digital elevation data collected from the Shuttle Radar Topography Mission (SRTM) with a resolution of 1 arcsec were used to characterize the potential impact of topography on aerosol loadings.
3.1 Tensor-flow-based AOD reconstruction
3.1.1 Overview of the AOD gap-filling method
Deriving spatially contiguous PM2.5 concentrations from gap-filled AOD images has proven more promising for a better analysis of large-scale PM2.5 distribution (Bai et al., 2022b). In this study, the big Earth data analytics framework proposed in Bai et al. (2022a) was further adapted and improved for generating global gap-free AOD images to support various content-based mappings. As shown in Fig. 1, the improved big Earth data analytics framework also consists of three primary data manipulation procedures, including (1) machine-learned multimodal data homogenization, (2) knowledge-reinforced AOD tensor compiling, and (3) tensor-flow-based AOD reconstruction, with algorithmic improvements primarily conducted in the latter two procedures. This improved big Earth data analytics approach empowered us to weave together multimodal AODs and versatile big Earth observations from diverse sources via a synergy of state-of-the-art machine learning and tensor completion methods. Because the technical flow of this big Earth data analytics framework was previously detailed in Bai et al. (2022b), here we only provide an overview of this method while describing more details of the newly developed algorithmic components in the following subsections.
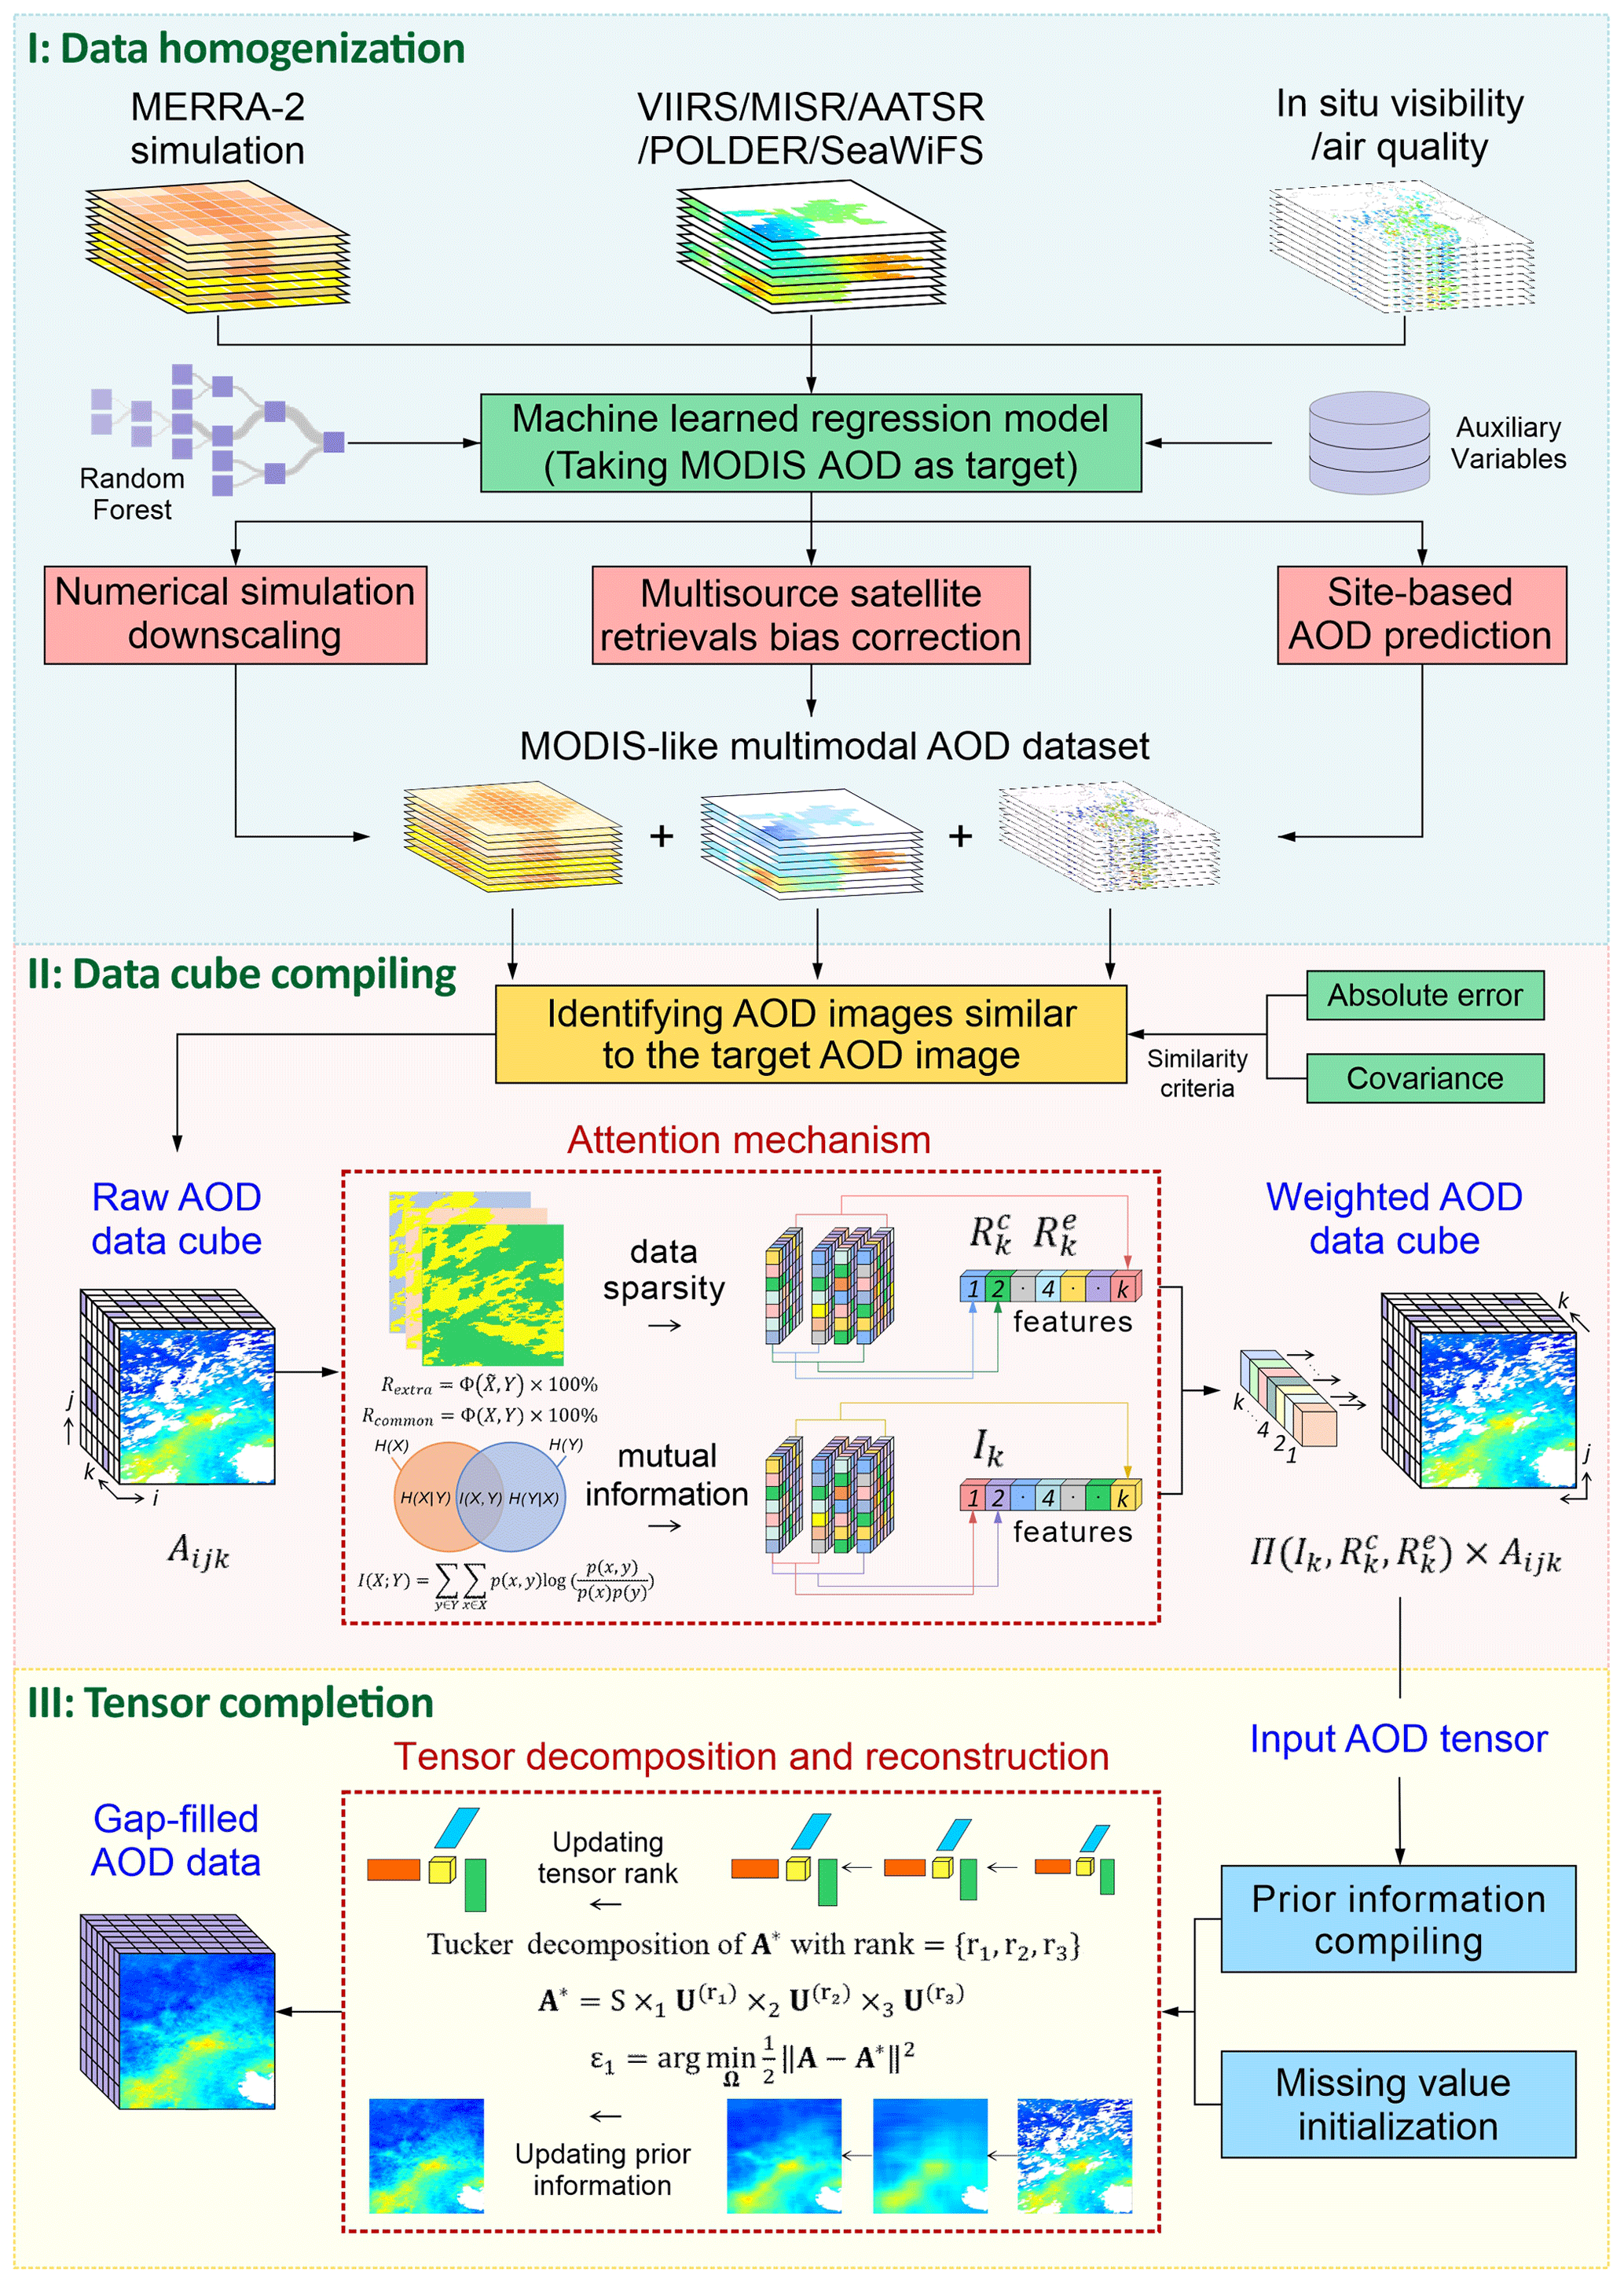
Figure 1A schematic illustration of the improved big Earth data analytics for generating the MODIS-like global gap-free AOD dataset.
The overall architecture of this big Earth data analytics framework was summarized as follows. Multimodal AODs and relevant aerosol data acquired from different satellites, ground monitoring stations, and numerical models were first harmonized to resemble the baseline dataset of AODTerra, aiming to minimize both cross-sensor biases and spatial heterogeneities. This data homogenization process is vital for the tensor-flow-based AOD gap-filling, because the bias-corrected and downscaled AOD estimates were critical inputs to form the AOD data cube. More details related to the multisource data homogenization are given in Sect. S1 in the Supplement. To fill data gaps in each individual AODTerra image, an AOD data cube was then constructed by aggregating harmonized multisensory AOD data on the same date along with historical AODTerra images resembling similar spatial patterns over the same region. Because of the excessive nonrandom missing values in the AODTerra images, both the downscaled MERRA-2 AOD grids and AOD estimates derived from air quality and visibility measurements were used conjunctively to identify similar AODTerra images from the historical image series. The selected historical AODTerra images and bias-corrected AOD images from other satellites on the same date were used individually as a slice of the tensor. Additionally, dispersed in situ AOD estimates and 5 % of the randomly selected downscaled MERRA-2 AOD data were directly overlaid onto the corresponding AODTerra grids without valid AOD retrievals. These implementations helped improve the gap-filling accuracy and greatly boosted the convergence speed given the provision of prior knowledge.
High-order singular value decomposition (HOSVD), an orthogonal Tucker decomposition method, was applied to each well-compiled AOD data cube for tensor-flow-based pattern recognition and data completion. Data gaps within the input AOD tensor were first filled with the spatial average of each individual AOD image to initialize the tensor decomposition. The AOD tensor was then decomposed along each two-dimensional slice independently, and a new tensor was subsequently reconstructed based on the principal modes via a low-rank approximation (i.e., generating an approximating matrix with reduced rank for compression). During this procedure, the AODTerra observations in the target image to be gap-filled were deemed hard data (i.e., true-state and invariant throughout the tensor completion procedure), while multisensory AOD estimates and historical AODTerra images served as soft data (Supplement and updated by iterates till convergence). By iteratively adjusting the dimension-varied ranks, the data values over grids to be gap-filled were updated and tuned to optimize both spatial homogeneity and information entropy concurrently (Bai et al., 2020, 2022a). The tensor completion process continued till it reached an agreement (with a bias decay ratio < 0.1 %) between the reconstructed values and the previously reserved AODTerra observations.
3.1.2 Algorithmic improvements
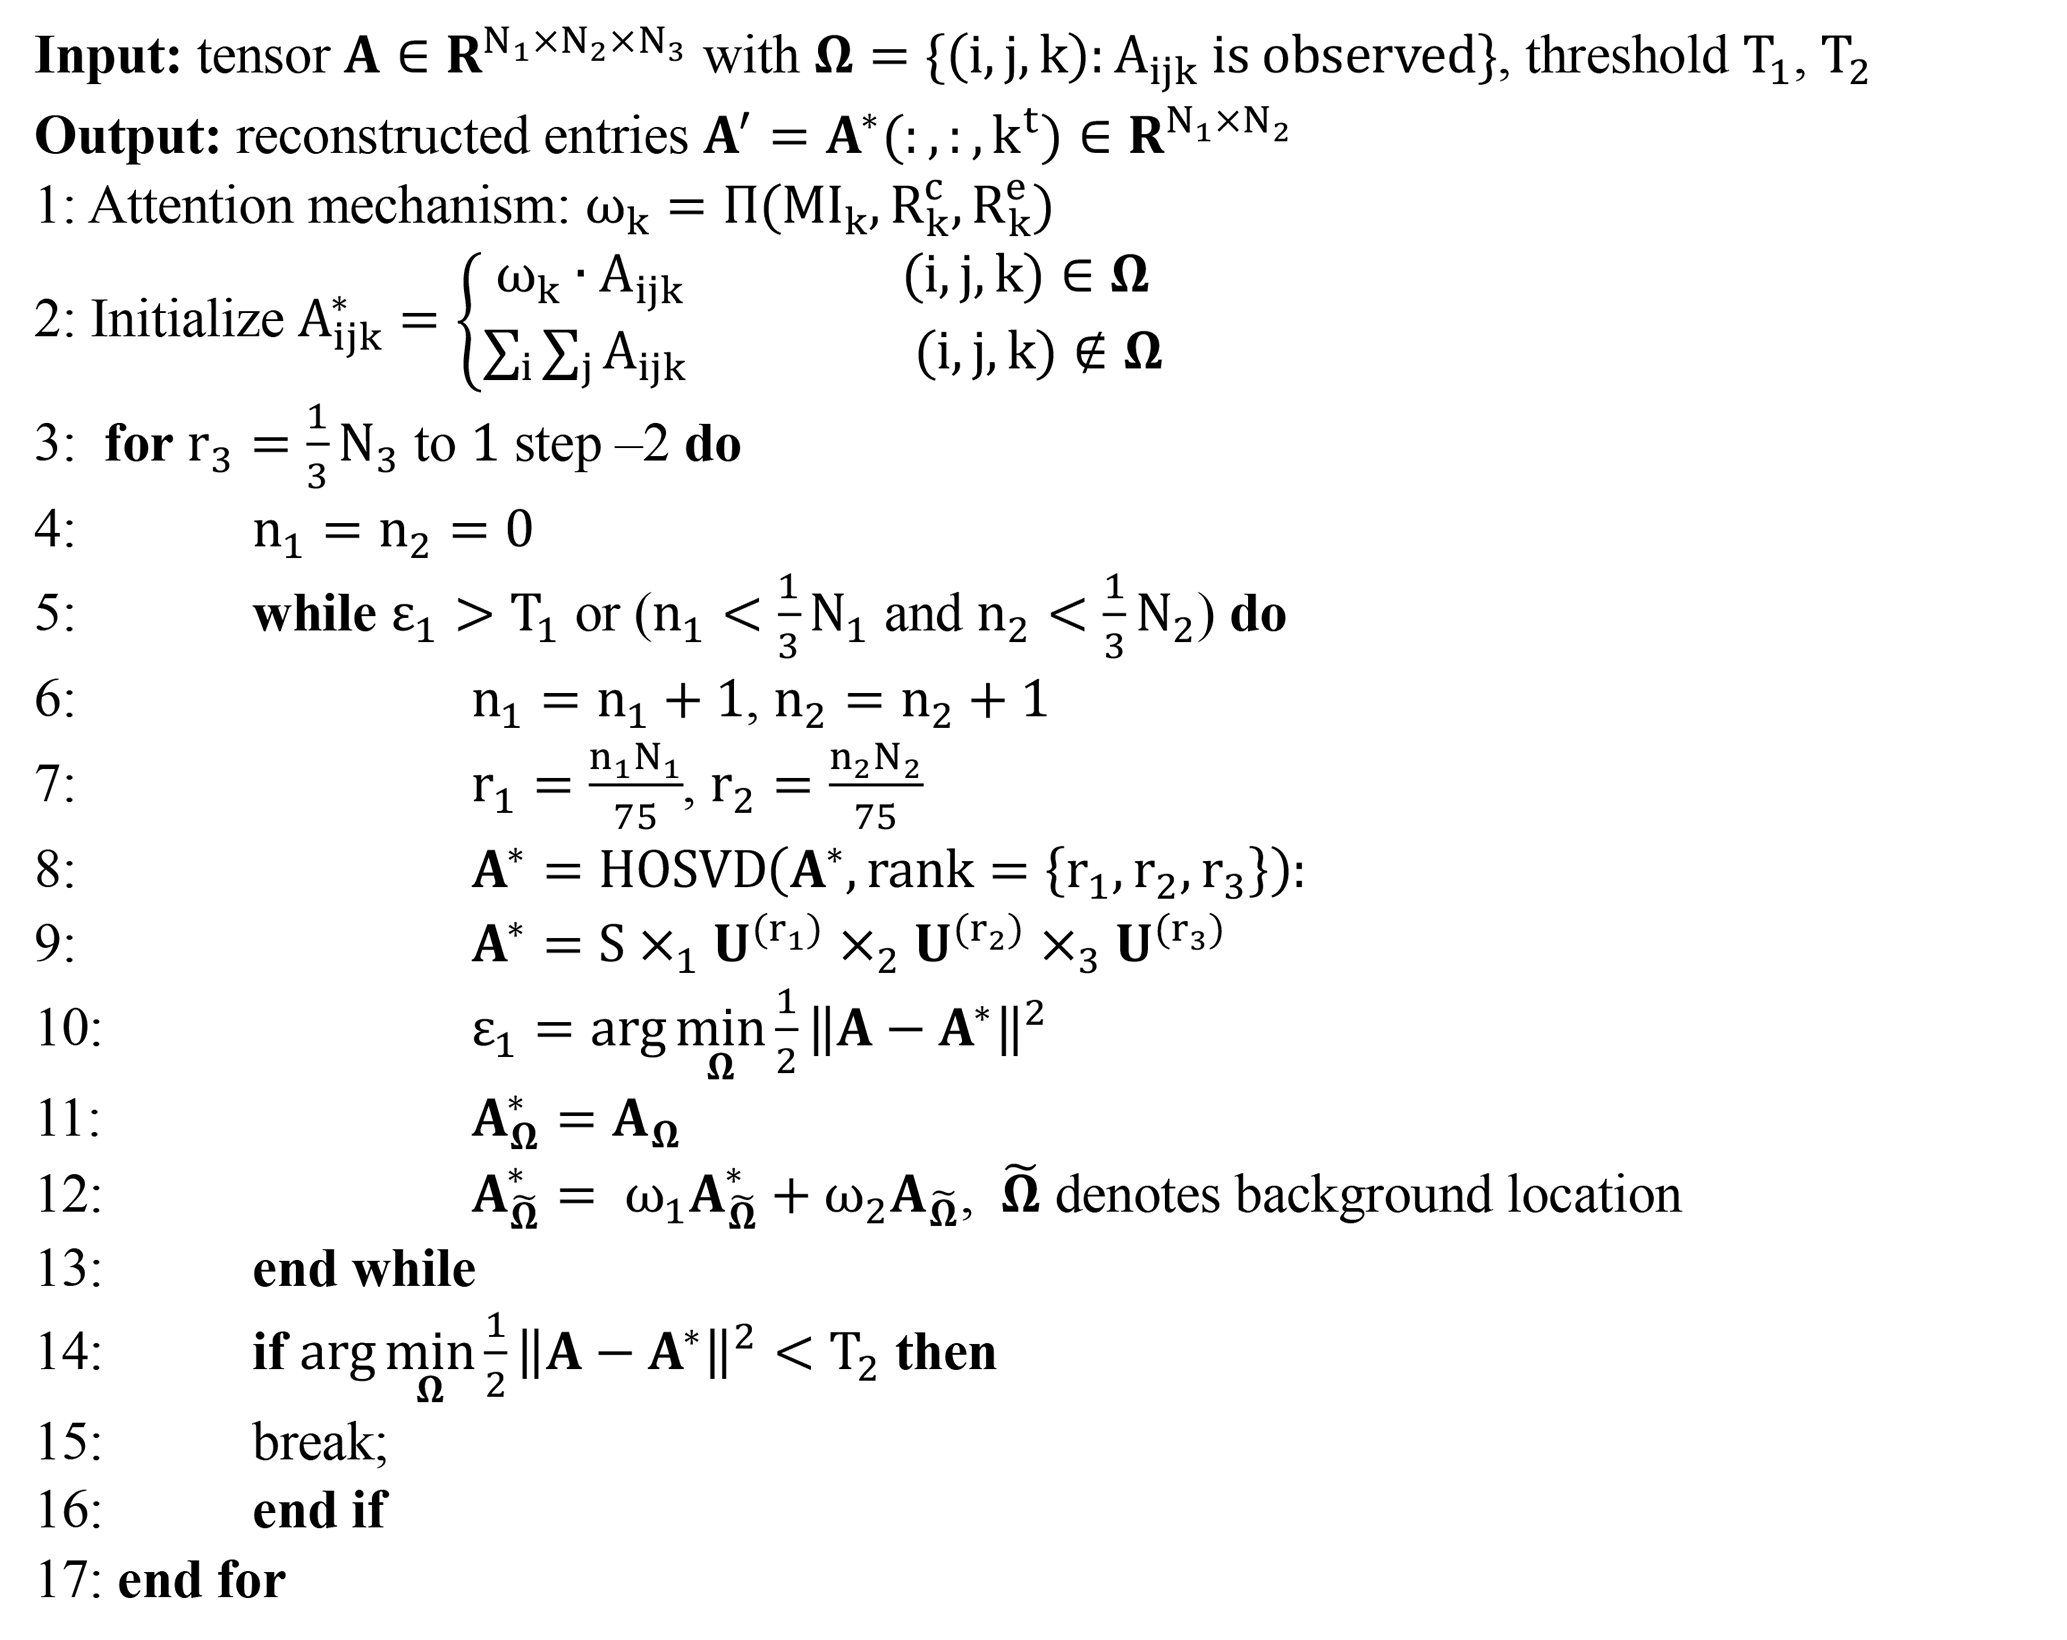
To accommodate the massive data analytics for global-scale AOD gap-filling, three major algorithmic enhancement modules were incorporated to help improve reconstruction efficiency and accuracy, with particular focus on the optimization of data manipulation procedures in tensor-flow-based AOD gap-filling. Algorithm 1 presents the pseudo code of the optimized algorithm used for tensor-flow-based AOD reconstruction.
Algorithm 1The pseudo code of the optimized algorithm used for tensor-flow-based AOD reconstruction.
Attention-reinforced AOD tensor construction
In our previous study, both the target data (i.e., the AODTerra image) and the soft data (i.e., AOD estimates from other data sources and historical AODTerra images) were treated equally in the AOD tensor throughout the tensor decomposition and reconstruction process (Bai et al., 2022a). This indifferent data treatment strategy neglected the information abundance of soft data and the spatial similarity between the soft and target data, making the reconstructed field more likely to resemble the dominant patterns learned from images with fewer data gaps rather than those with spatial patterns similar to the target image. To account for this drawback, an attention mechanism was hereby introduced to assign different weights to each data slice in the input AOD tensor, aiming to improve the AOD reconstruction performance by learning from spatiotemporal features embedded in more relevant data fields instead of all the available data.
As a widely used technique in deep learning, the attention mechanism is a mimic of cognitive attention allowing the model to focus on specific parts of the input data, achieved by assigning higher weights to more crucial elements in ensemble learning. Regarding the tensor-flow-based AOD reconstruction task, data slices with a greater similarity to the target image and fewer data gaps are supposed to play more important roles than less similar ones with extensive data gaps during tensor completion. Three statistical metrics, including mutual information (Shannon, 1948), the spatial coverage ratio of common observations (Rcommon) between soft data and hard data, and the spatial coverage ratio of extra observations beyond common observations in soft data (Rextra), were calculated to determine the overall weight that should be assigned to each slice of data in the input AOD tensor. Specifically, mutual information was applied to characterize the mutual dependence between the target image and each slice of soft data, while the common spatial coverage ratio was used to indicate the data amount for mutual information calculation, and the extra spatial coverage ratio was employed to depict additional information content that can be provided by soft data. Equations (1)–(3) provide the formulas to calculate these three statistical metrics.
Note that X and Y refer to common observations in soft and hard data, respectively. denotes extra observations in soft data. p(x,y) is the joint probability mass function of X and Y, while p(x) and p(y) are the marginal distribution mass functions of X and Y, respectively. Additionally, Φ(X,Y) is the spatial coverage ratio of the common observations, and is the spatial coverage ratio of extra observations in the soft data. By multiplying these three normalized weights by the corresponding soft data, an attention-reinforced AOD tensor was constructed in turn, which was then used as the input data cube for tensor completion.
Adaptive prior information updating
To facilitate the AOD gap-filling over regions with substantial data gaps, in our previous method, 5 % random samples from the downscaled MERRA-2 AOD image (AODM2 hereafter) on the same date were used as prior information and directly overlaid onto grids without observational AOD (i.e., AODTerra and site-based AOD estimates from air quality and visibility measurements). Although this enabled us to improve the convergence speed during tensor completion, the spatial patterns of the reconstructed field over regions with excessive data gaps were more likely to resemble the distribution of AODM2 because of this unchanged prior information. In this context, large modeling biases in AODM2 might be introduced into the final reconstruction fields.
In this study, we introduced an adaptive prior information updating scheme to mitigate the potential bias propagation problem. The main principle is to force the AOD prior information in the input AOD tensor to update iteratively throughout the tensor completion process rather than maintaining it as invariant observations. Specifically, random AODM2 samples were only used to initialize the tensor construction, while weighted averages of the prior information and the corresponding reconstructed values were then used as new prior information for the next iteration. Meanwhile, the weights assigned to the reconstructed fields were gradually increased by iteration till convergence. The goal was to improve the contribution of reconstruction fields learning from actual observations while reducing the influence of background fields. The ablation experiments demonstrated the effectiveness of this scheme in improving the reconstruction performance over regions with limited observational data.
Optimized global data tile partition and rank updating
The high spatiotemporal resolution of AODTerra images presents a great challenge in performing global-scale AOD gap-filling because of the huge computational burden. To improve computational efficiency and to make the computing workload manageable, the following algorithmic adjustments were implemented. First, the continental AODTerra data worldwide were divided into 480 data tiles, with AOD gap-filling performed over each tile independently. Through a set of gap-filling trials with varying tile sizes, a nominal tile size covering 700 × 700 pixels (refer to Fig. S3 for the spatial distribution of the optimized data tiles) was finally applied to balance the computing workload and reconstruction accuracy. Moreover, a 50-pixel overlap on the boundary of each tile was enforced, and an inverse distance weighting scheme was applied to these overlapped pixels when mosaicking the gap-filled tiles, aiming to eliminate the boundary effects between tiles toward a smooth distribution of AOD across the globe.
Since the tensor's decomposition and reconstruction processes in the tensor completion are driven by iteratively updated tensor ranks, an optimized rank updating strategy was hereby proposed to improve the learning efficiency. Specifically, the ranks were updated in ascending order along with the first and second dimensions in the inner loops to enhance the spatial details of the reconstructed AOD fields. In contrast, the ranks were updated in a descending fashion along the third dimension in the outer loop to aggregate the target AODTerra image with the soft data in a low-rank approximation manner. This new rank updating strategy not only helps better resolve spatial details of AOD, but also accelerates the convergence speed of tensor completion.
3.2 Global PM2.5 concentration modeling
The sparse and uneven distribution of ground-based air quality monitoring stations poses significant challenges to global PM2.5 concentration mapping, particularly over regions with fewer PM2.5 concentration measurements (e.g., Africa and South America in Fig. S2). Nonetheless, how to reinforce the spatial representativeness of data-driven models to improve the spatial extrapolation accuracy is still elusive. In this study, a recently developed deep-learning method, i.e., SCAGAT, was hereby applied to better estimate global PM2.5 concentrations from gap-filled AOD images. Instead of establishing a single PM2.5 estimation model using all available data samples collected from worldwide monitoring stations, site-specific PM2.5 estimation models were first developed using random forest over each air quality monitoring station with adequate PM2.5 concentration measurements.
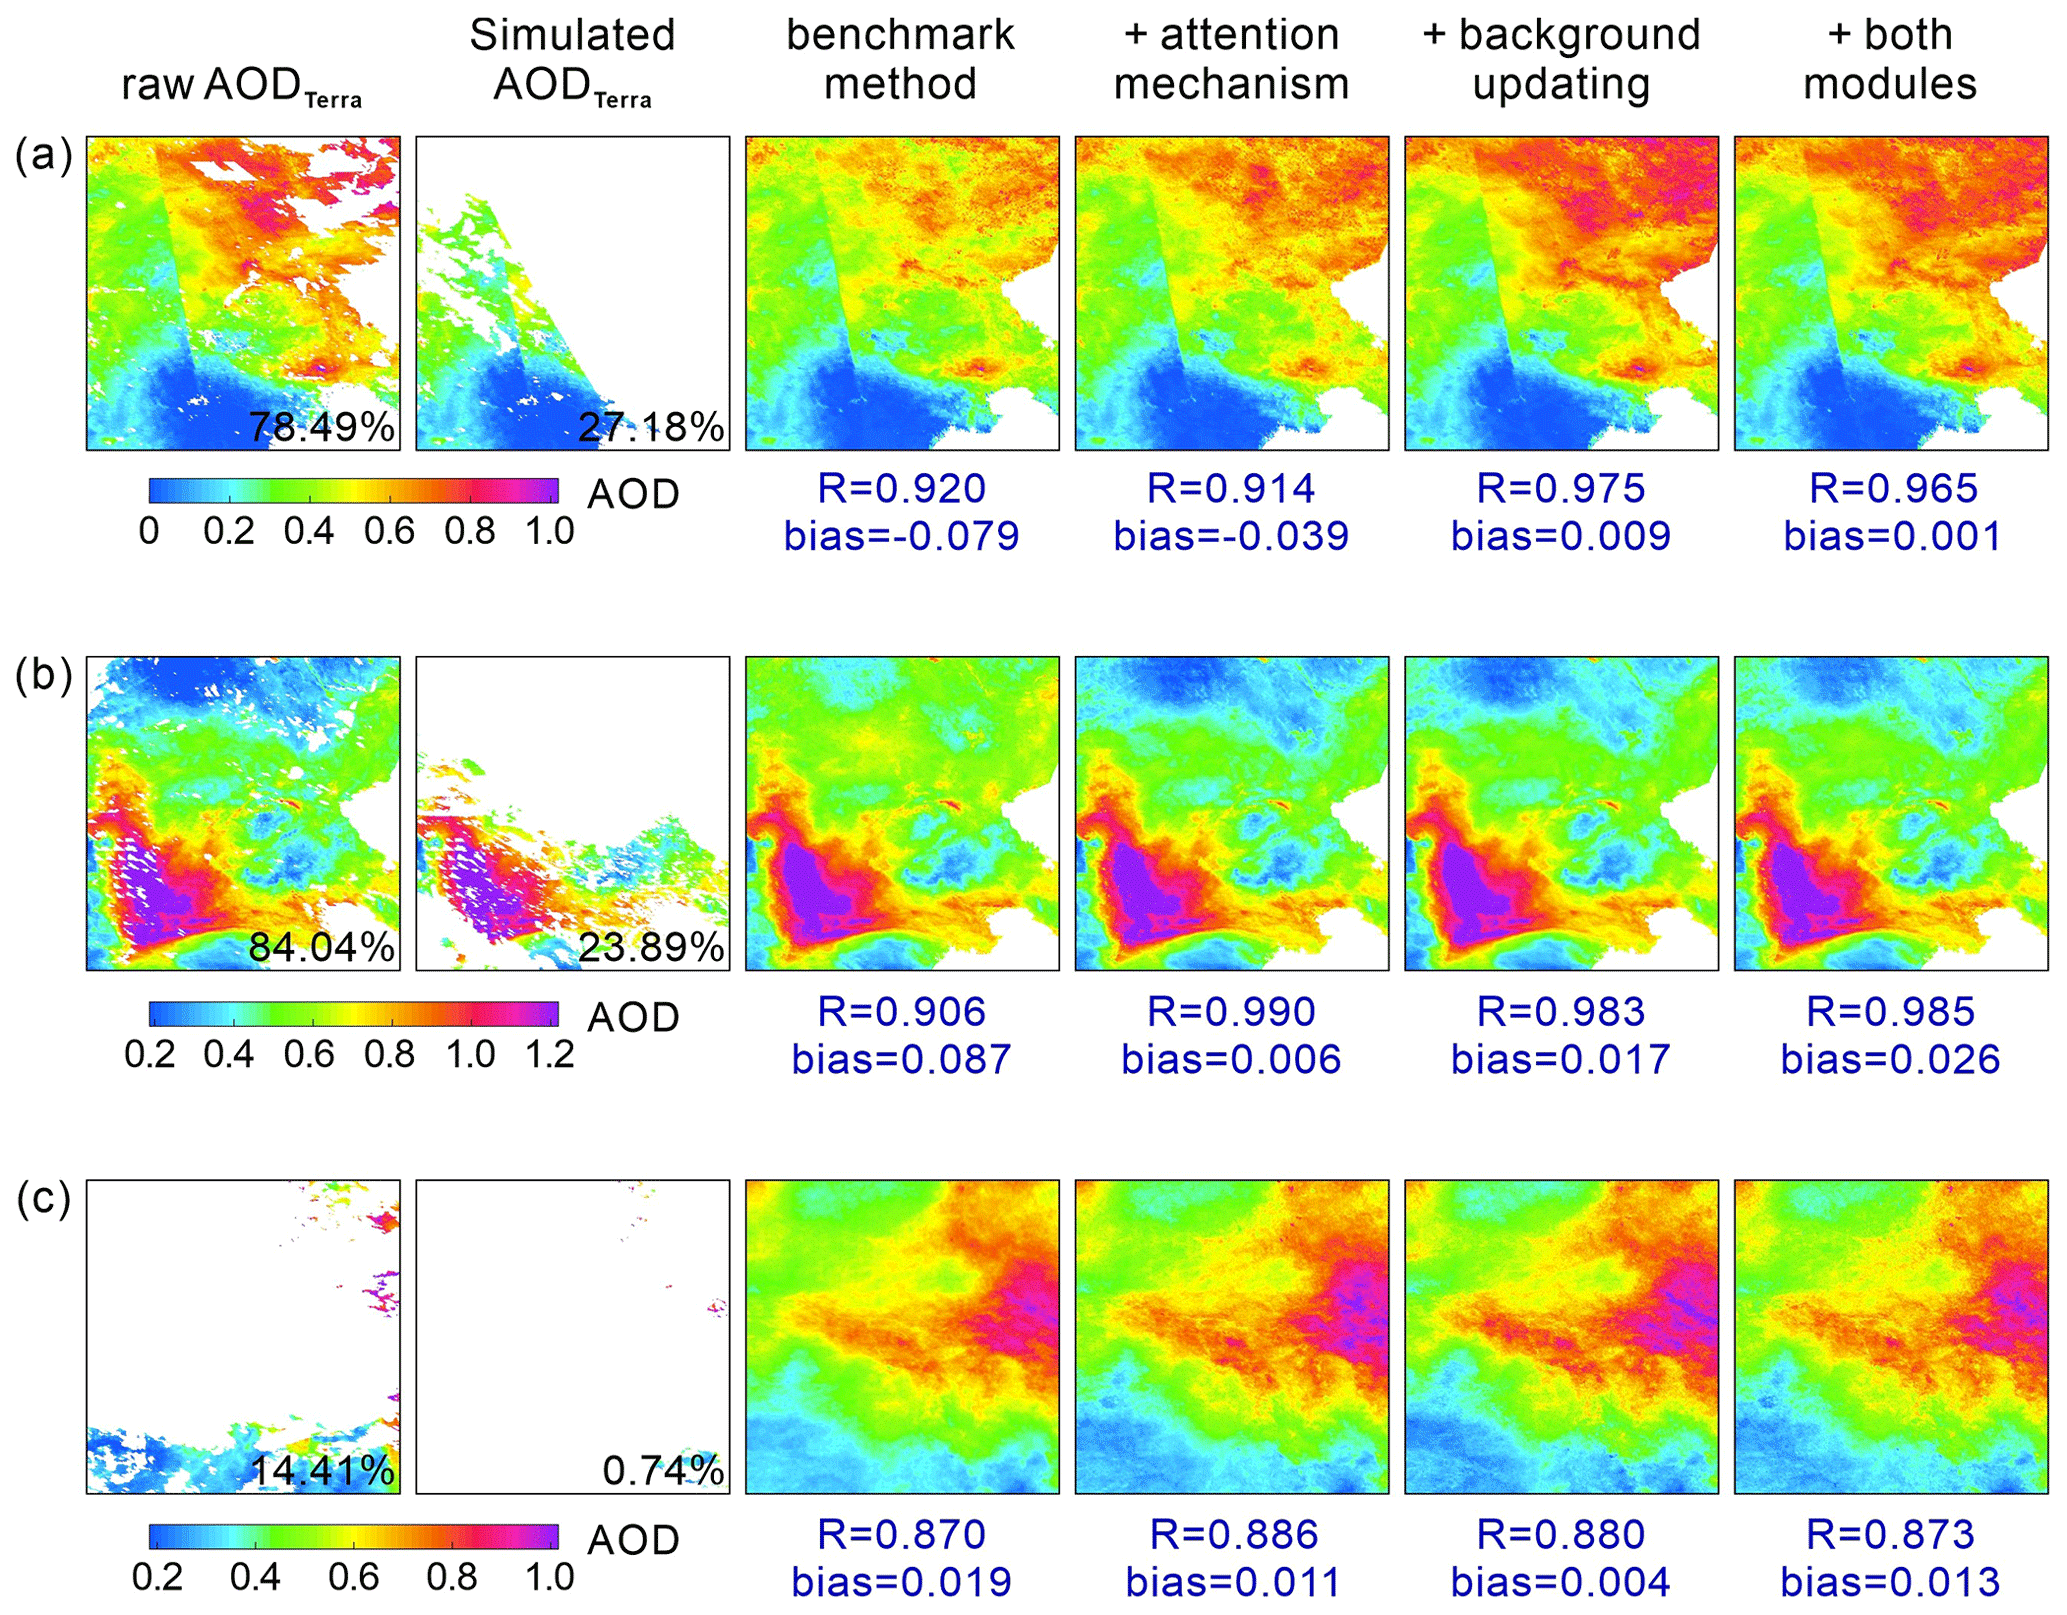
Figure 2Performance evaluation of different algorithmic enhancement modules on the reconstructed AOD distribution. Raw AODTerra denotes the actual AOD retrievals from Terra, while simulated AODTerra refers to partially masked AODTerra. The benchmark method is the AOD gap-filling approach proposed in Bai et al. (2022a). The latter three columns present the reconstructed fields using the enhanced benchmark methods. The R and bias denote the correlation coefficient and deviations between the holdout observed and reconstructed AOD data, respectively. The percent numbers shown in the two left panels indicate a spatial coverage ratio of valid AOD retrievals over the selected scenes.
For a given grid, raw PM2.5 concentration estimates were estimated from a set of independent site-specific PM2.5 estimation models, which should resemble similar geographic scene features to the given grid cell – under the assumption that the relationship between AOD and PM2.5 is similar over regions with an analogous environmental background. Nine distinct factors covering geographic locations, land cover types, climate zones, AOD levels, and population density were utilized to characterize the scene attributes of each grid cell. Subsequently, a graph attention network was used to aggregate raw PM2.5 concentration estimates derived from site-specific models to produce an ensemble estimate over the target grid cell. In the graph network, weights assigned to the adjacency matrix were determined in reference to the differences between nine different scene features, and the node bias was given as the testing accuracy of each site-specific PM2.5 prediction model. This innovative ensemble learning method enables us to better predict PM2.5 concentrations across the globe, particularly over regions with limited or even no in situ PM2.5 concentration measurements. Figure S4 depicts the workflow of the proposed SCAGAT model, and additional details are introduced in Sect. S2. For more detailed descriptions of this method, please refer to Li et al. (2024).
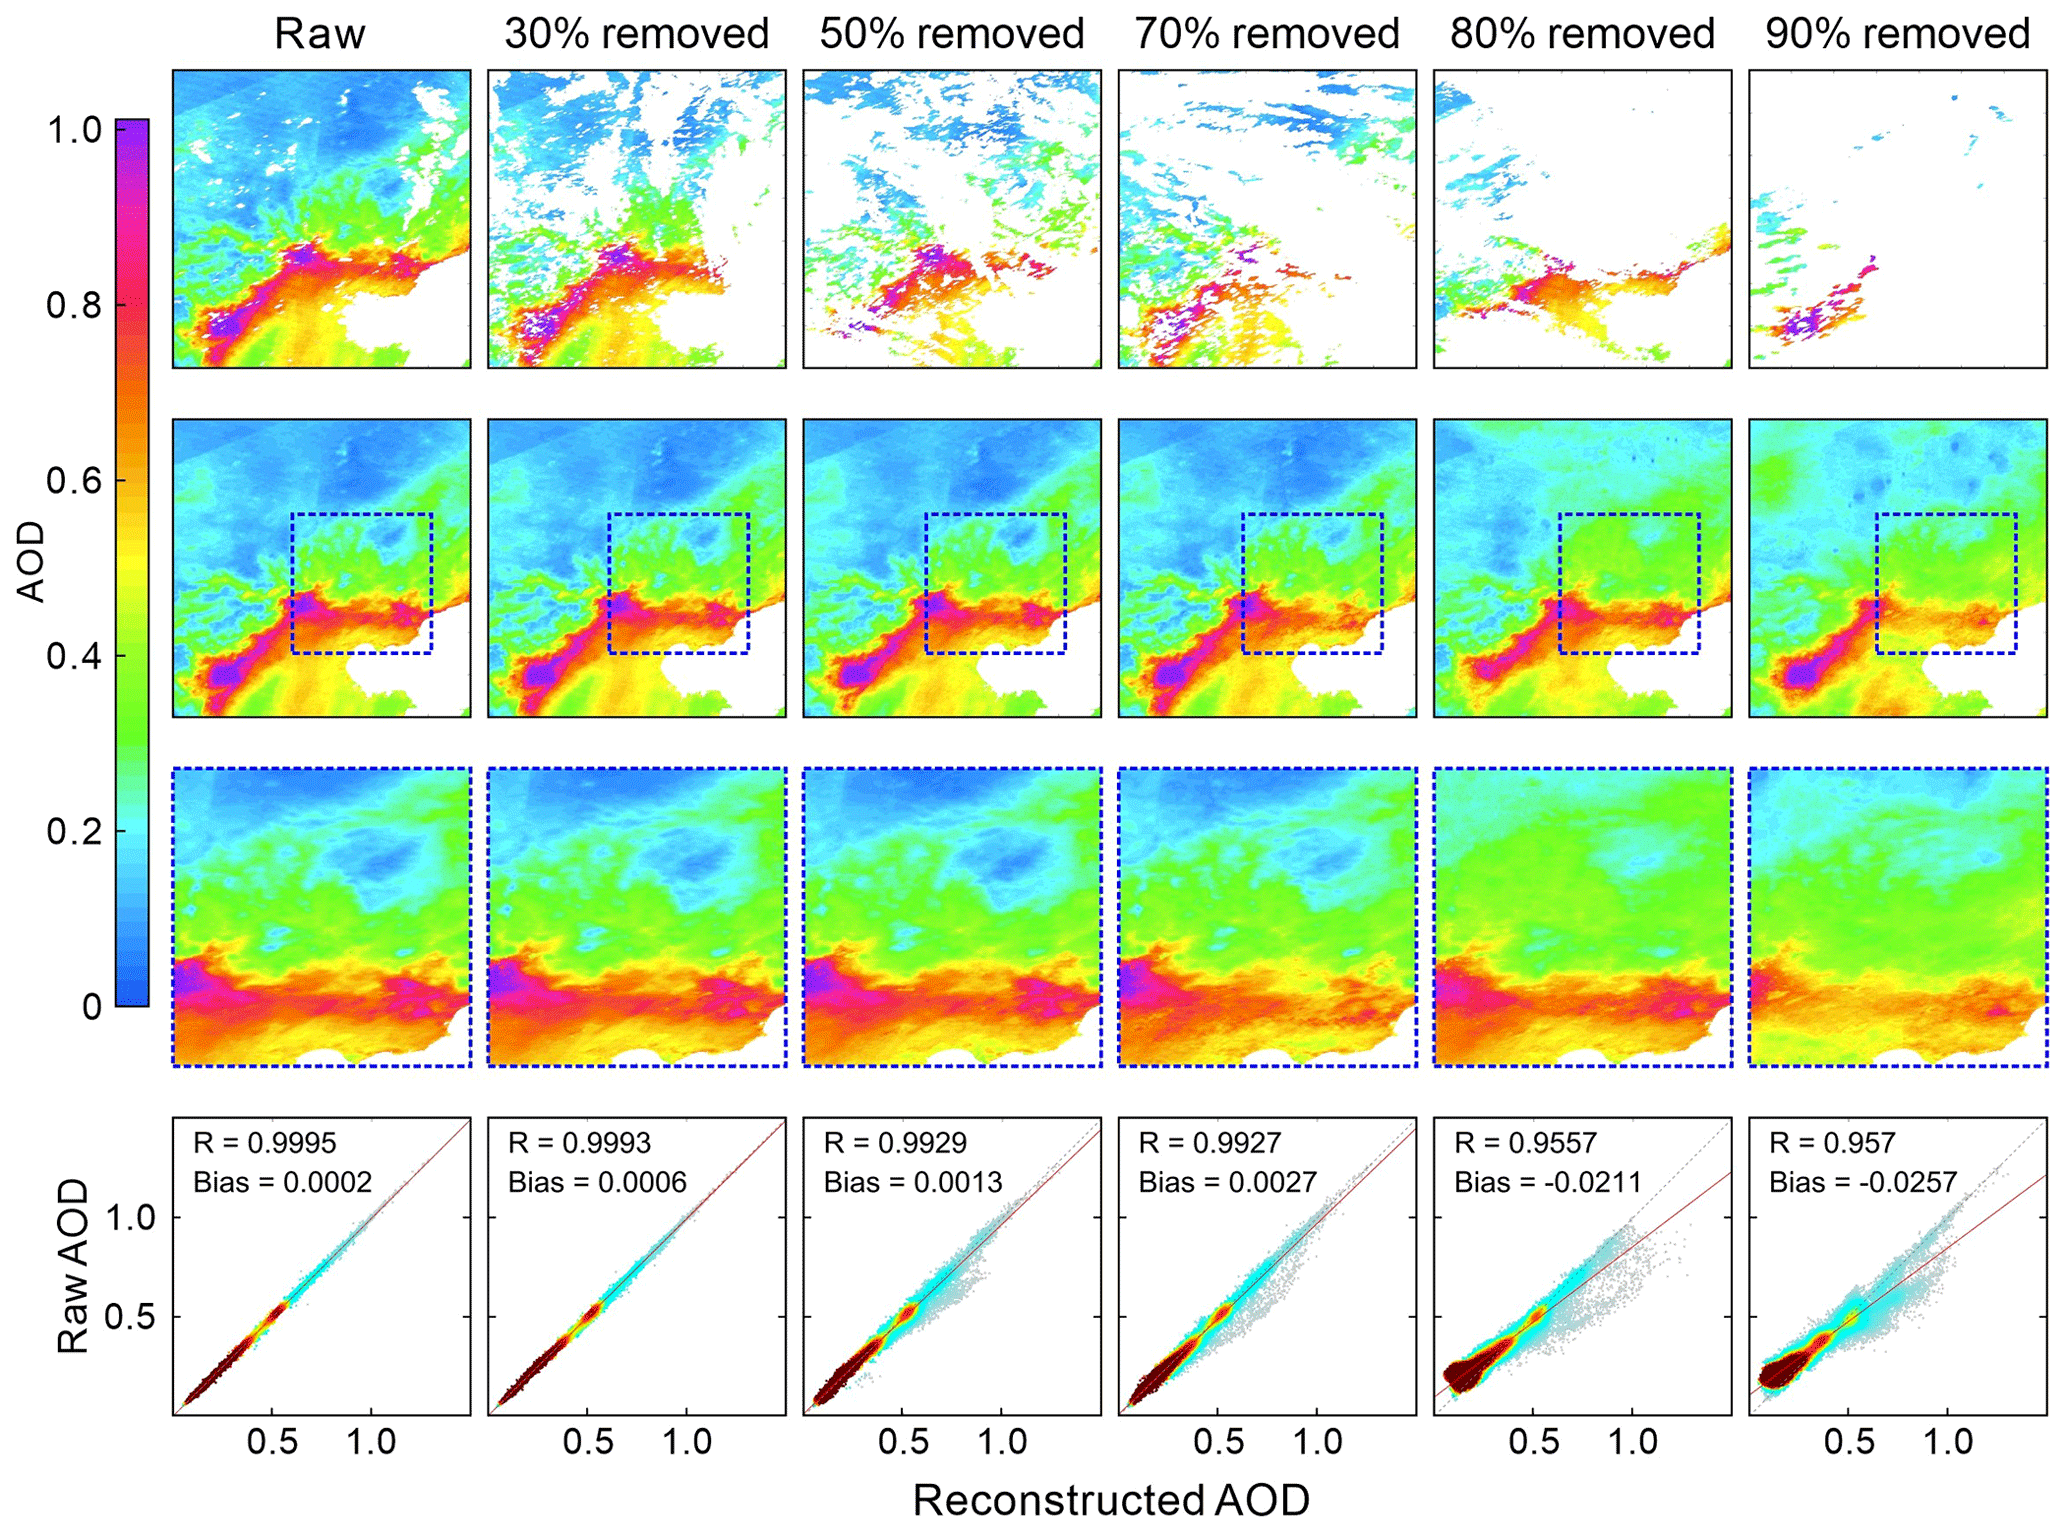
Figure 3Impact of the missing rate on the AOD gap-filling accuracy. The numbers on the top indicate the percentage of removed AOD data in the raw AODTerra image. The second row shows the distribution of the gap-filled AOD with zoomed-in maps present in the third row. The bottom panel presents scatter plots between the observed and reconstructed AOD.
4.1 Efficacy assessment of algorithmic enhancement modules
Ablation experiments were first conducted to evaluate the accuracy improvement potential of each newly developed algorithmic enhancement module. Three case studies were simulated by masking actual AODTerra retrievals with randomly selected cloud masks on different dates, and the methods reinforced with different enhancement modules were then applied to reconstruct the former holdout AOD values. For intercomparison, the AOD gap-filling framework developed in Bai et al. (2022a) was used as the benchmark method. As shown in Fig. 2, the AOD distributions reconstructed using methods embedding attention mechanism and adaptive background information updating modules have smaller bias levels compared to the benchmark method, which in turn justifies the efficacy of these two new algorithmic enhancement modules. Given an equal weight of each slice of data in the input AOD tensor, the reconstructed data fields from the benchmark method were prone to resembling a mean state determined largely by the principal mode of the input tensor. In this context, peak values in the target image might be underestimated (or overestimated for low values) because of relatively few soft data resembling similar patterns in the input tensor (e.g., Fig. 2c).
By incorporating the attention mechanism, each slice of data in the raw AOD data cube was adaptively weighted, with greater weights given to those with broader spatial coverage and closer similarities to the target AODTerra image. This strategy is vital for reducing contributions from irrelevant data, particularly when encountering imbalanced data samples within the raw AOD data cube, i.e., more irrelevant data and fewer similar images. Moreover, the importance of the target image was maximized during the tensor completion procedure by assigning a 100 % weight. Compared to the benchmark method, extreme values in raw AODTerra images were better reconstructed using the method embedding the attention mechanism. For instance, in Fig. 2b, the benchmark method apparently overestimated low AOD values in the north, whereas such a discrepancy was largely mitigated using methods involving the attention mechanism.
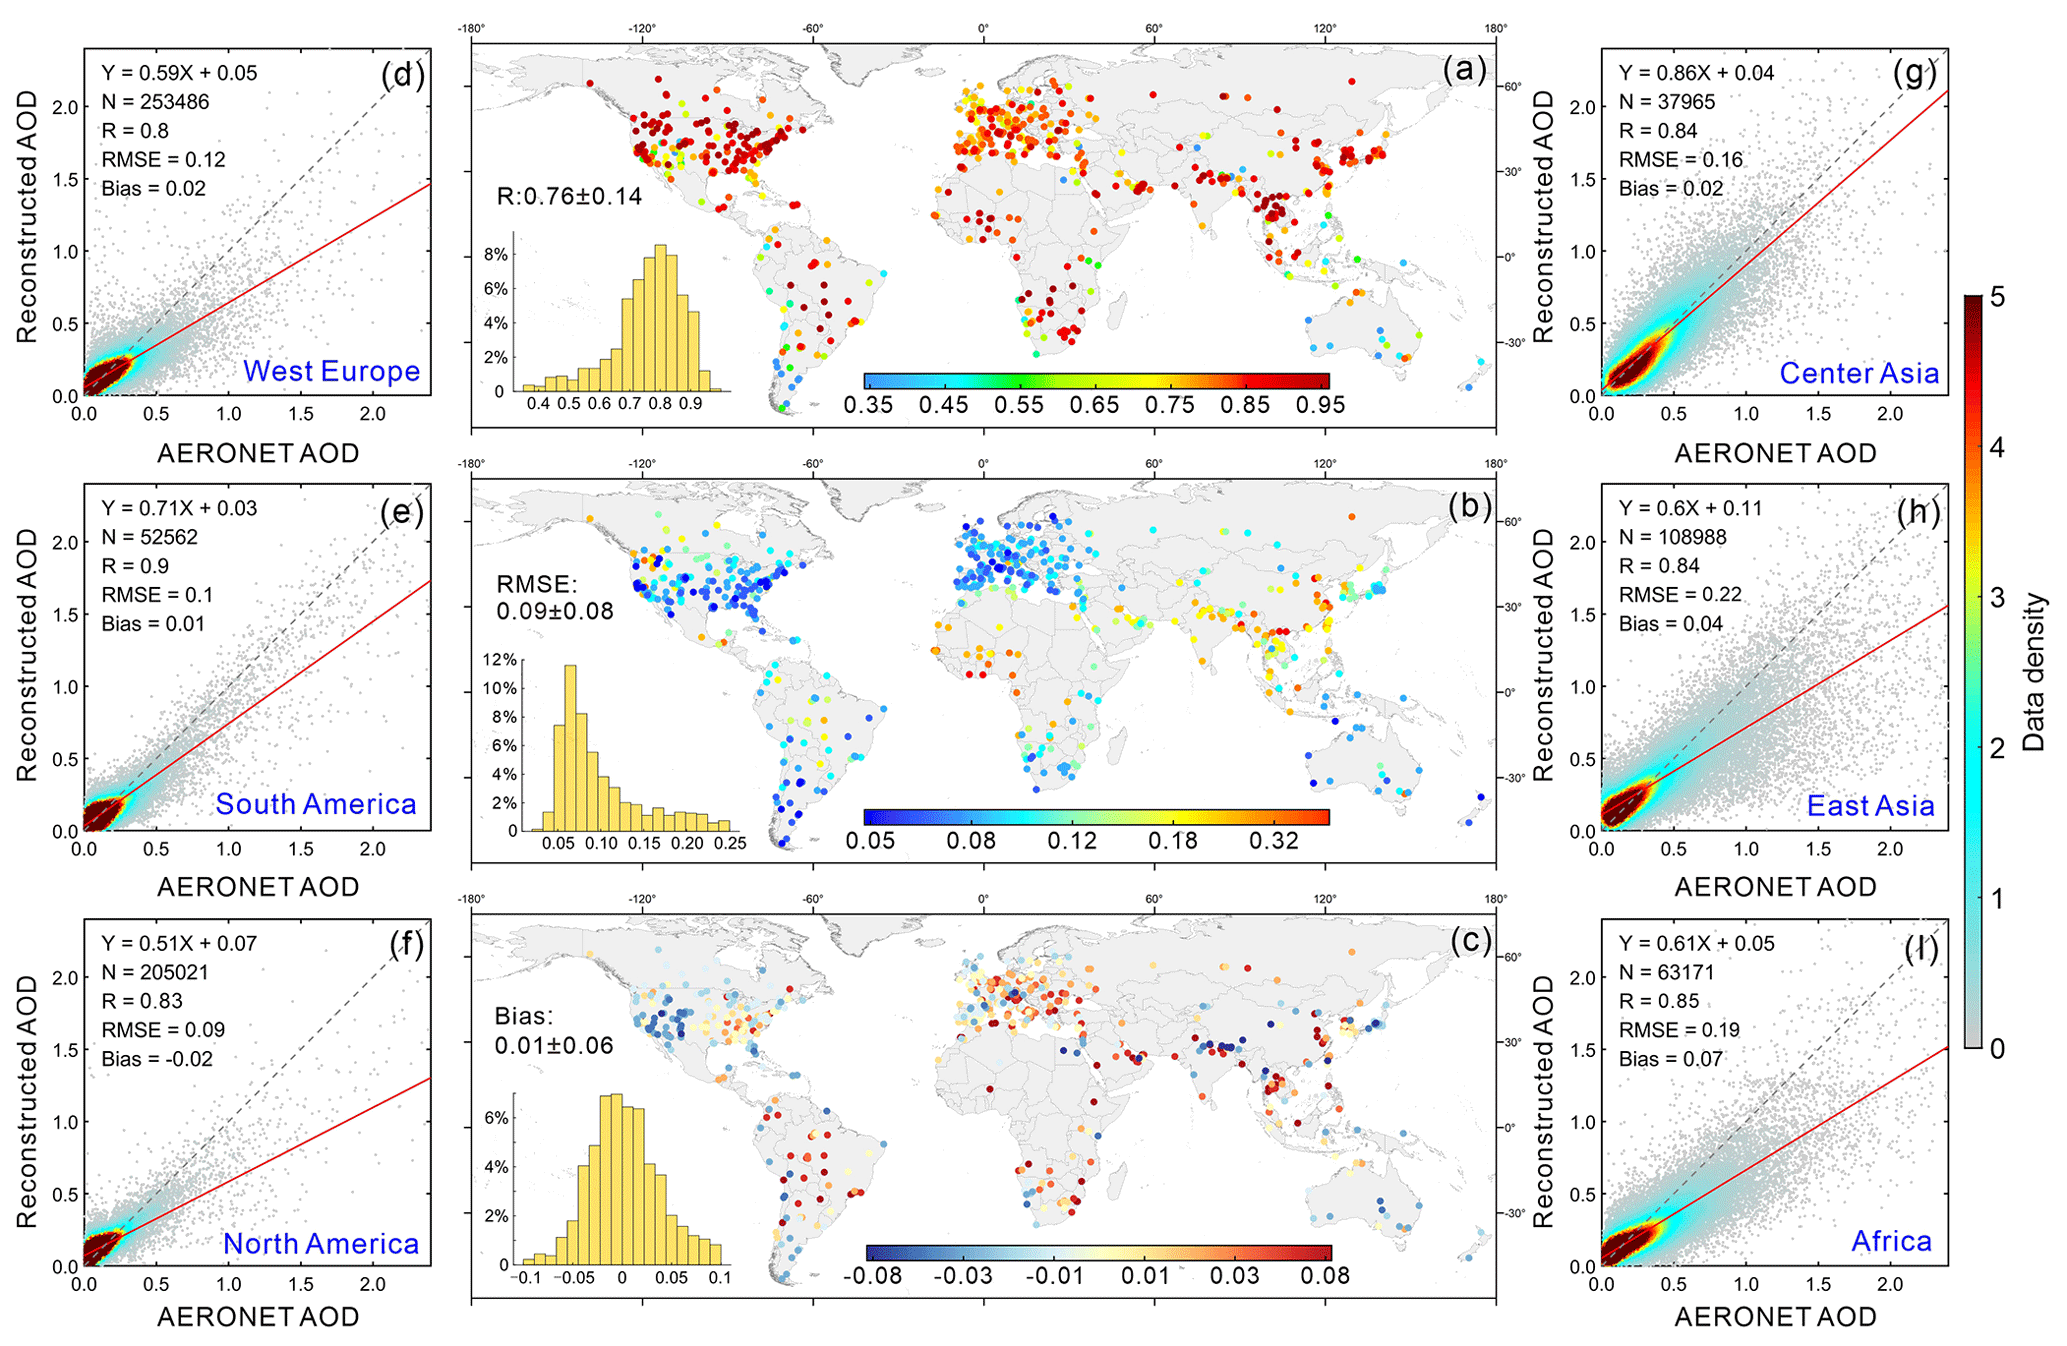
Figure 4Data accuracy of daily gap-free AOD grids in the LGHAP v2 dataset compared to AOD observations from AERONET across the globe during 2000–2021. Note that the AERONET AOD observations were independent data and had not been used in the gap-filling process.
In contrast to the benchmark method, which used an invariant background throughout the tensor completion process, an adaptive background updating scheme was incorporated here to accelerate the convergence speed and mitigate possible error propagation arising from numerical simulations to the final reconstruction fields. Compared to the benchmark method, as illustrated in Fig. S5, the adaptive background updating module enabled us to reduce the adverse impact of manually added outliers in raw background fields, thereby avoiding large error propagation from background fields into the reconstructed AOD data. Although the better quality of the reconstructed fields derived from the improved methods demonstrates the efficacy of these two newly developed algorithmic enhancement modules, the benefits could be largely cancelled out when confronted with images containing excessive data gaps (e.g., Fig. 2c). The inherent reason could be attributed to few observational data in the target image for reference to leverage the attention mechanism to pinpoint similar AOD images from the historical data series.
In Fig. 3, we evaluated the impact of the missing rate of the target image on the AOD gap-filling accuracy. By masking one truly observed AODTerra image with arbitrarily selected cloud masks, a series of target images at different missing rates, as shown in the top row of Fig. 3, were simulated for gap-filling trails. As shown, the reconstructed fields agreed fairly well with the observed AOD fields, resembling the actual AOD distribution over the outlined region well, even in extreme situations with excessive data gaps, demonstrating an excellent performance of the proposed gap-filling method. As expected, the accuracy of the reconstruction fields decreased along with an increase in the missing rate. For instance, when the missing rate was greater than 80 %, the low values in the upper left of the raw AODTerra image were not properly reconstructed, largely because of the limited prior knowledge in the target image for use when constructing the raw AOD tensor. This effect also highlights the crucial importance of prior information for the gap-filling accuracy. Therefore, increasing prior information is the most promising way to improve the gap-filling accuracy, in particular for regions with substantial data gaps.
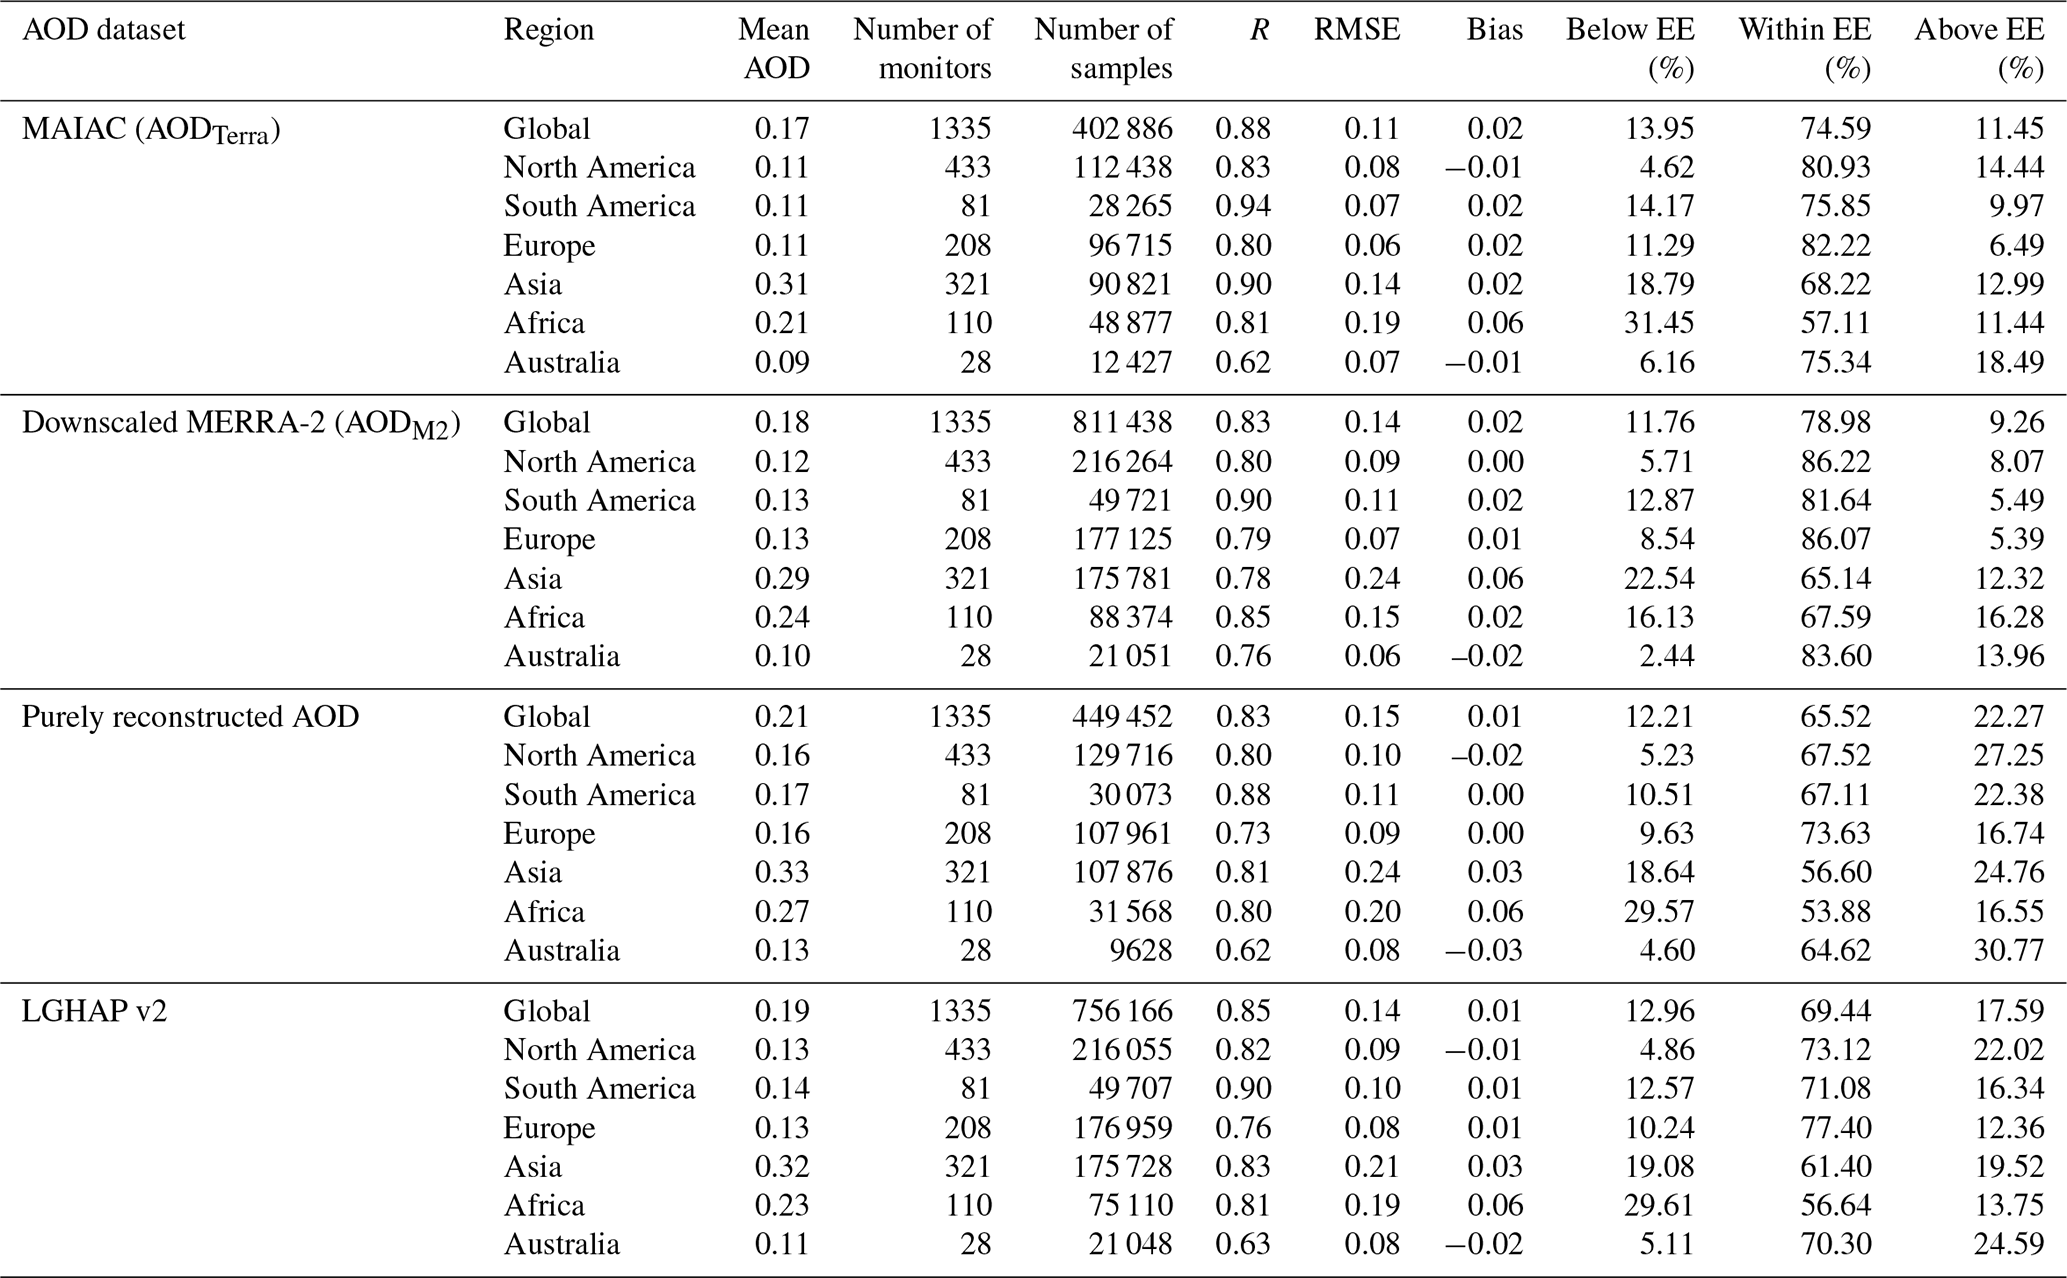
Table 2An intercomparison of AOD data accuracy between satellite-based retrievals (raw MAIAC AOD), numerical aerosol diagnostics (downscaled MERRA-2 AOD), purely reconstructed data, and the final gap-free product (LGHAP v2 AOD) by comparing AOD observations from AERONET across the globe during 2000–2021. Note that the term “purely reconstructed AOD” refers to the imputed AOD estimates, while “LGHAP v2” refers to the gap-filled AOD dataset combining both satellite-based retrievals and purely reconstructed data. The expected error (EE) envelope for AOD over land was defined as ±(1.5 × AODAERONET+0.05).
4.2 Data accuracy of global gap-free AOD in LGHAP v2
The gap-free AOD grids in LGHAP v2 were generated by filling in data gaps in AODTerra images with reconstructed AOD estimates at each collocated footprint over land. In comparison to the independent AOD observations from AERONET, the data accuracy of the gap-free AOD in LGHAP v2 was comprehensively evaluated across the globe. Figure 4a–c present the spatial distribution of the site-specific correlation coefficient (R), root mean square error (RMSE), and bias between AOD in the LGHAP v2 and AERONET observations, respectively. Regardless of the uneven distribution of ground-based aerosol observing stations and variations in data samples between sites, the ground validation results indicate good agreement between the AOD in the LGHAP v2 and AERONET observations, with a site-specific R of 0.76 ± 0.14 and an RMSE of 0.09 ± 0.08 on a global scale. Note that site-specific data accuracy metrics vary across regions, with larger biases mainly observed in central and East Asia as well as in Africa – regions always suffering from high aerosol loadings.
Figure 4d–i present scatter plots between the LGHAP v2 AOD and AERONET observations in six major continental regions. As shown, the reconstructed AOD estimates were prone to an underestimation of large AOD values (> 0.80) versus an overestimation of low values (< 0.2) across these six regions. This effect is particularly common in machine learning, largely because of the imbalanced distribution of data values in the training samples (Johnson and Khoshgoftaar, 2019; Shi et al., 2022). A similar reason could also be applied for the tensor completion as the missed AOD extremes may not be accurately reconstructed to their nominal levels; instead, they tend to resemble a mean state that was determined by principal modes via a low-rank approximation.
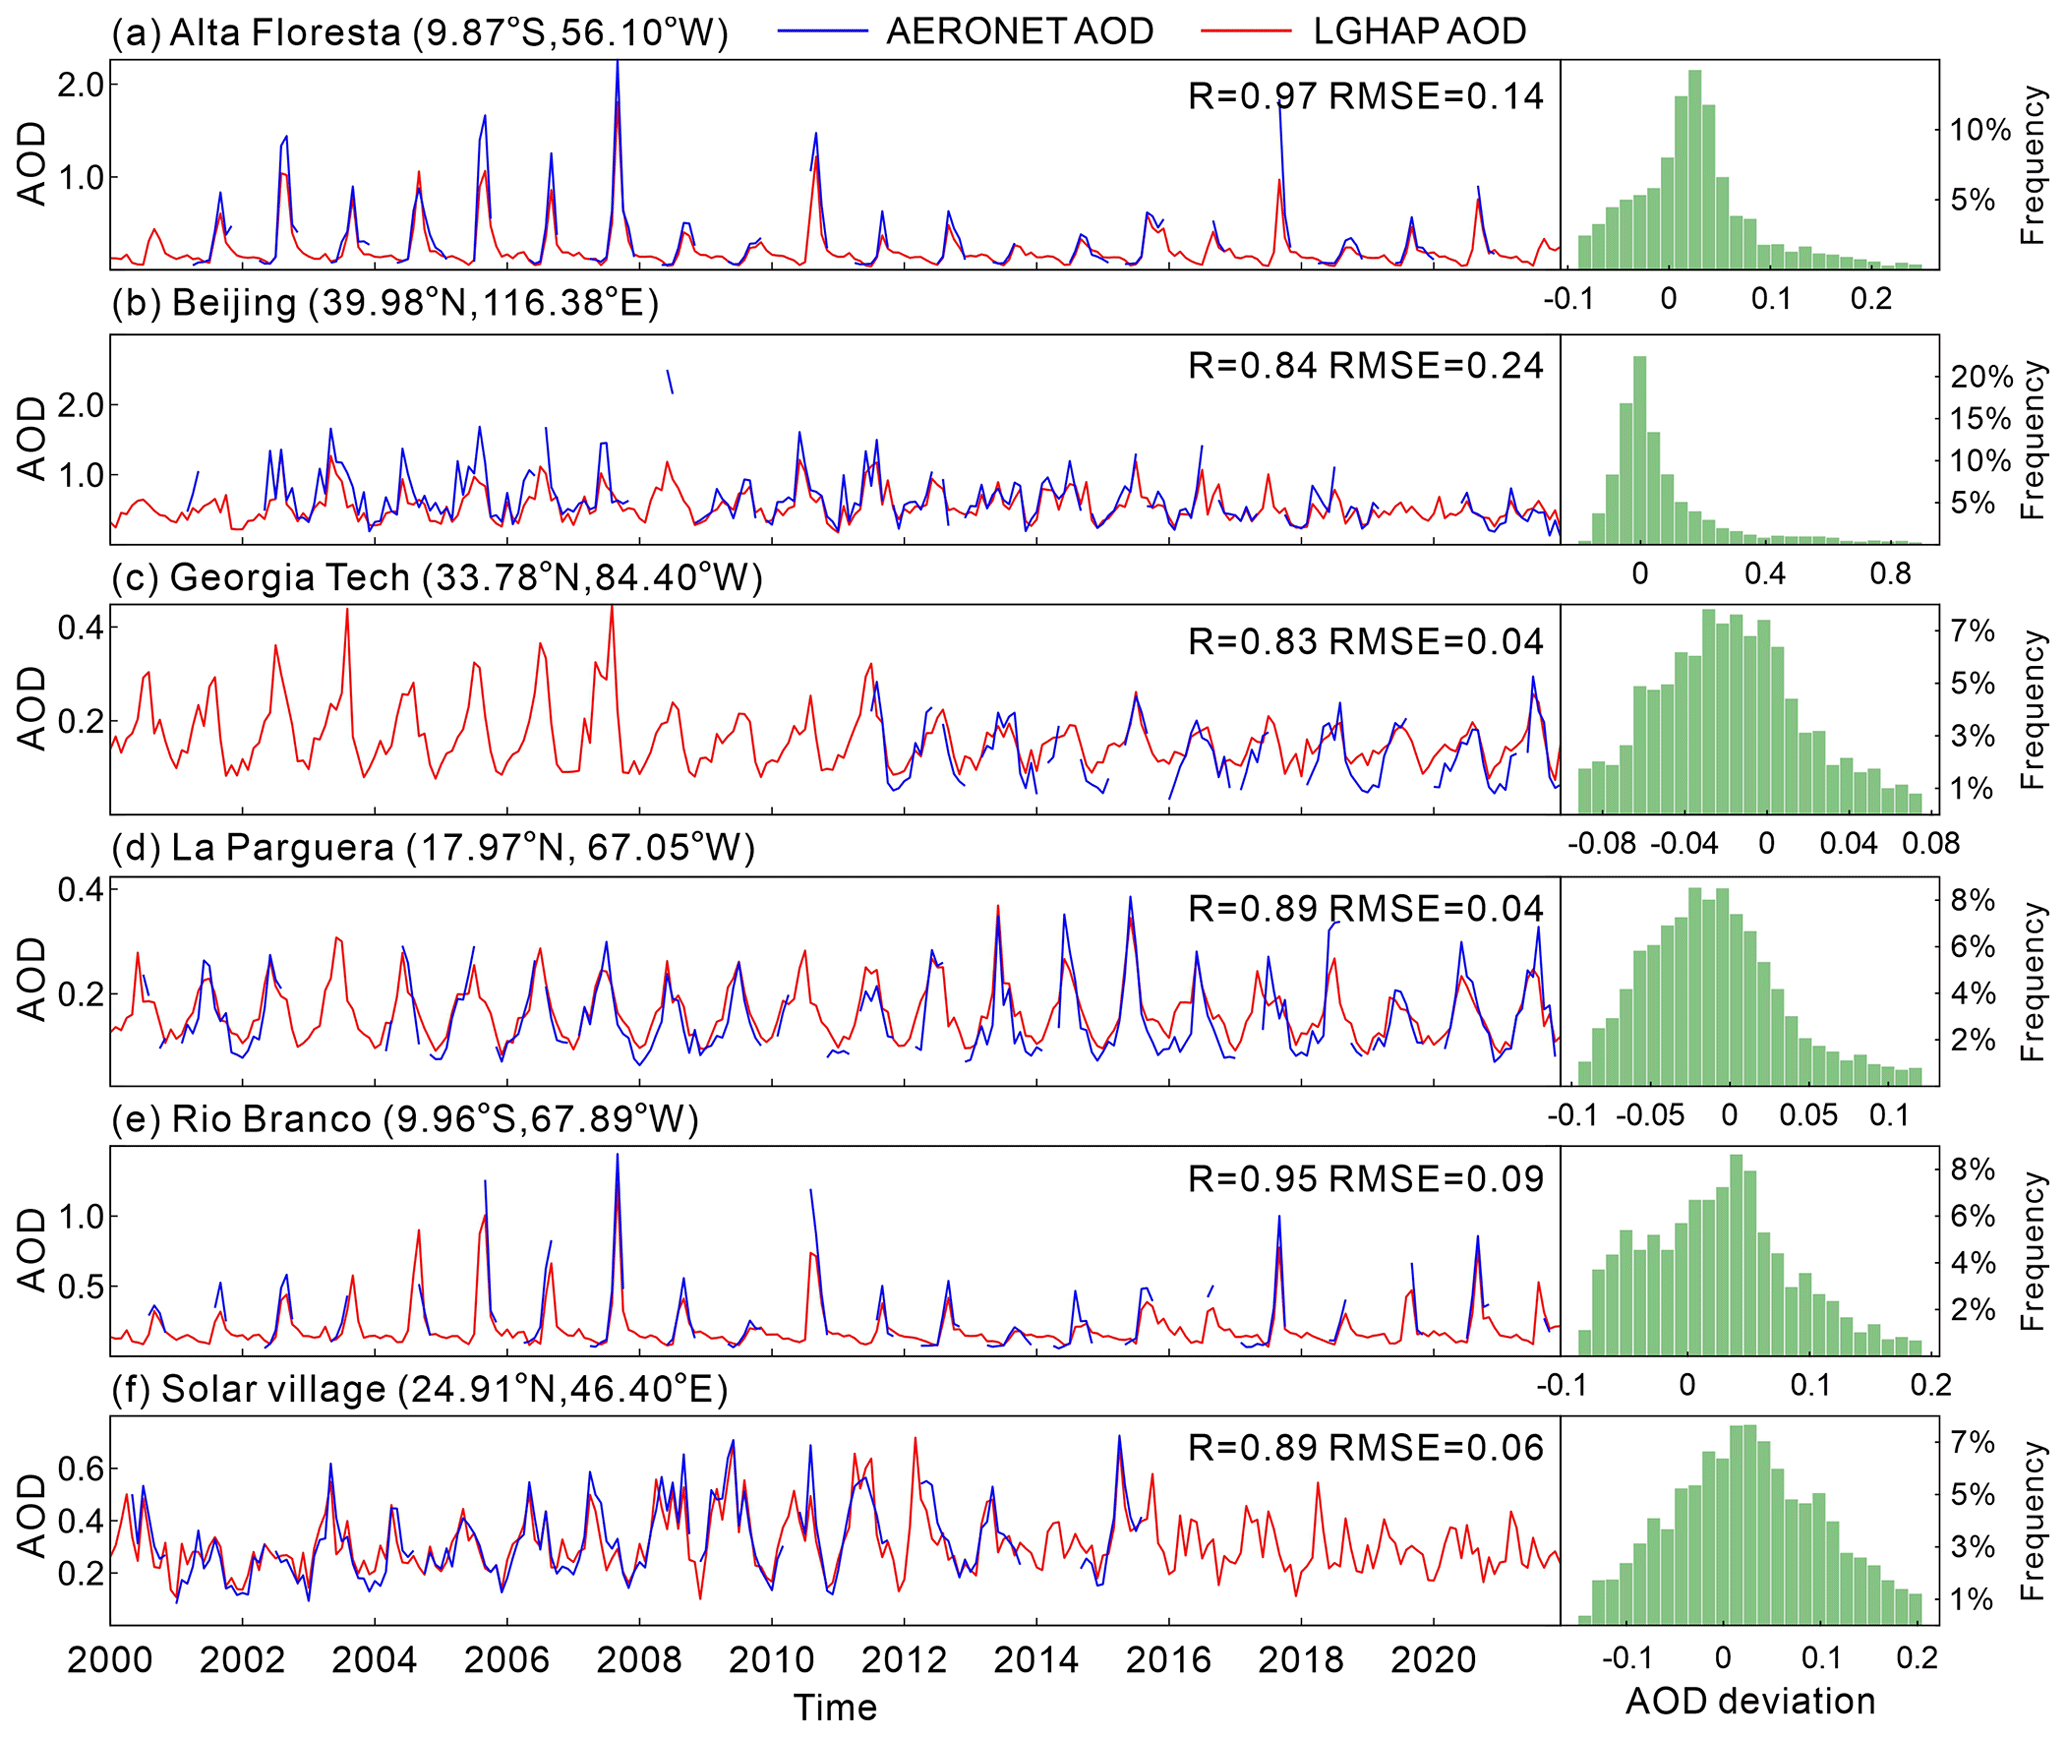
Figure 5Temporal variations in the monthly AOD over six AERONET sites with long-term AOD observations from 2000 to 2021. The panels on the right present histograms of AOD deviations between the LGHAP v2 and AERONET observations at each individual site.
To further verify the data accuracy of the imputed AOD estimates, we compared the gap-filled AODs in the LGHAP v2 dataset with two major gridded products of AODTerra and AODM2. As shown in Table 2, the purely reconstructed AOD estimates have an R of 0.83 and an RMSE of 0.15 compared to the AERONET AOD observations at the global scale – comparable to the data accuracy of AODM2 (R = 0.83, RMSE = 0.14) but lower than that of AODTerra (R = 0.88, RMSE = 0.11). Nevertheless, the imputed AOD estimates achieved comparable data accuracies to AODTerra in Africa (R = 0.80, RMSE = 0.20) and Australia (R = 0.62, RMSE = 0.08), largely because of the availability of abundant satellite-based AOD prior information (refer to the AOD coverage ratio shown in Fig. S1 in the Supplement) to facilitate AOD tensor completion. In contrast, the LGHAP v2 AOD estimates in Europe and Asia have poorer data accuracies relative to AODTerra, particularly in East Asia. The possible reasons could be extensive missing values, severe aerosol pollution levels, and significant spatial variations in aerosol loadings over these regions. Compared to AODTerra, the gap-filled AOD data tended to overestimate the AERONET AODs (17.59 % versus 11.45 % above the envelope of expected error), resulting in an even larger global mean AOD (0.19 versus 0.17) and implying that a greater number of large AOD values were reconstructed in the imputed AOD estimates. Moreover, the accuracy of LGHAP v2 AOD data outperforms that of the gap-filled AOD dataset (R2=0.6031 and RMSE = 0.1350) generated by Guo et al. (2023), in which missing AODs in AODTerra were predicted using various proxy variables (e.g., meteorological factors and population density) via a random forest model.
In Fig. 5, we compared temporal variations in AOD between the LGHAP v2 dataset and ground-based observations at six AERONET sites with long-term records. Compared to discrete AOD observations from AERONET, the gap-free AOD time series accurately reconstructed long-term variations of aerosol loading from 2000 to 2021 at these monitoring sites, with R ranging from 0.83 to 0.97 and RMSEs varying between 0.04 and 0.24. Note that the large RMSEs observed at the Alta Floresta and Beijing sites are more likely ascribed to the reconstruction failures of abnormal AOD peaks, largely because of very limited peak values for reference in the AOD tensor. Referring to histograms of AOD deviations between the LGHAP v2 and AERONET observations, more than 80 % of the AOD biases fell within the range of −0.1 to 0.1, demonstrating a high accuracy of gap-filled AOD in the LGHAP v2 dataset.
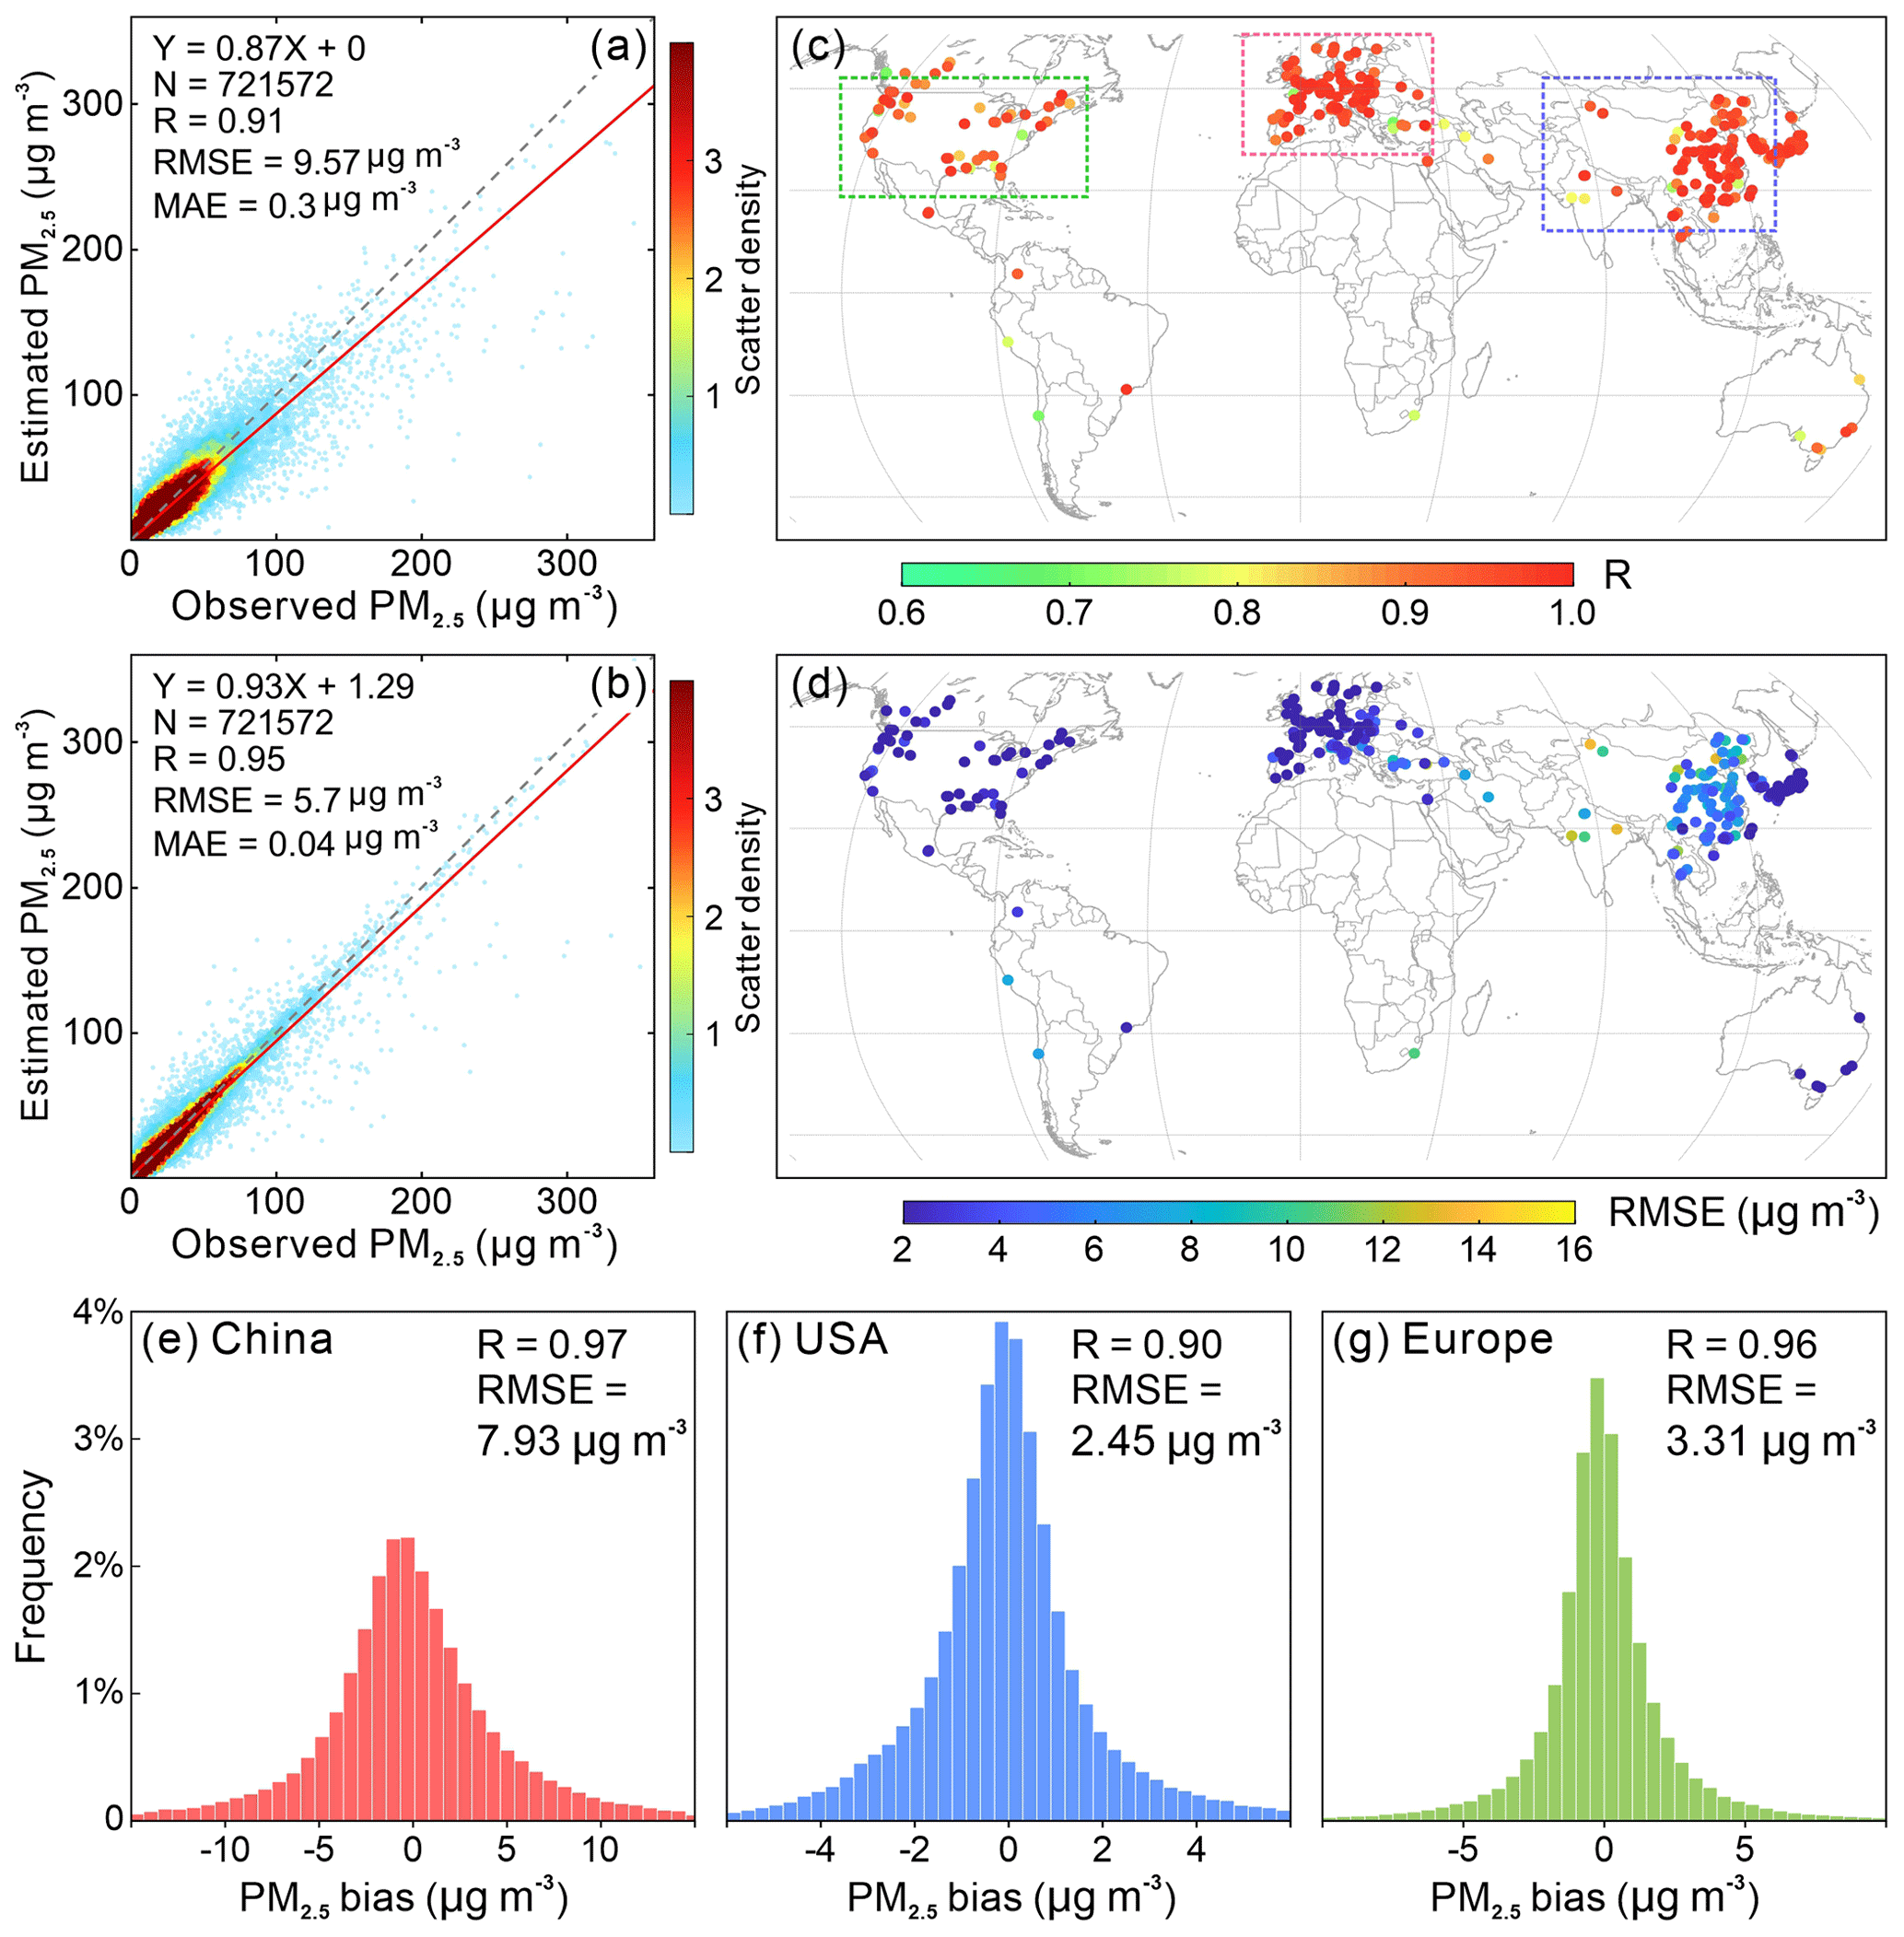
Figure 6Site-based validation accuracy of PM2.5 concentration estimates derived from gap-free AOD images using the proposed SCAGAT method. (a) Scatter plots between PM2.5 estimates derived from the SCAGAT model and the withheld PM2.5 concentration measurements. (b) Same as panel (a) but for gap-free PM2.5 estimates fusing ground-measured PM2.5 concentration measurements. (c–d) Site-based correlation coefficient and RMSE, respectively, for LGHAP v2 PM2.5 concentrations. (e–g) Histograms of the LGHAP v2 PM2.5 concentration bias over China, the United States, and Europe, respectively. Note that the ground-based PM2.5 concentration data used here for validation were not used in the model training or in the data fusion procedures.
4.3 Data accuracy of global gap-free PM2.5 concentrations in LGHAP v2
Global gap-free PM2.5 concentration estimates were derived from gap-filled AOD images by taking advantage of the novel SCAGAT method that was specifically developed for global PM2.5 concentration mapping. Additional details of the SCAGAT method were provided in another study (Li et al., 2024), and here we focused on the data accuracy of the global gap-free PM2.5 concentration estimates. Figure 6 presents the validation accuracy of the daily gap-free PM2.5 concentration estimates by comparing them to the ground-based PM2.5 concentration records measured at 350 former holdout sites. As indicated, by accounting for the spatial representativeness of the prediction models during the spatial extrapolation, PM2.5 concentration estimates derived from the SCAGAT model are in better agreement with ground-based PM2.5 concentration measurements, with an R of 0.91 and an RMSE of 9.587 µg m−3, surpassing the performance of our traditional machine-learned models (Bai et al., 2019, 2022a, 2023). Meanwhile, the data accuracy was further improved by correcting modeling biases using sparsely distributed in situ PM2.5 concentration measurements via optimal interpolation, resulting in an improvement in R to 0.95 and a decrease in RMSE to 5.7 µg m−3 (Fig. 6b). As shown in Fig. 6e, the PM2.5 concentration estimates over China in LGHAP v2 have a higher data accuracy (R = 0.97, RMSE = 7.93 µg m−3) than those in LGHAP v1 (R = 0.95, RMSE = 12.03 µg m−3). Figure 6c–d present a site-based distribution of R and RMSE for the LGHAP v2 PM2.5 concentrations over each individual validation site. Compared to the United States of America and Europe, as depicted in Fig. 6e–g, larger PM2.5 concentration biases were observed in China because of higher PM2.5 loadings therein.
Table 3 presents the data accuracy of the gap-free PM2.5 concentrations in the LGHAP v2 dataset during the period of 2000–2021 over nations with sufficient records of ground-based PM2.5 concentration measurements. It indicates that the data accuracy of PM2.5 concentration estimates varied across regions, with R changing from 0.71 to 0.98 and RMSEs ranging between 1.15 and 32.69 µg m−3. Regardless of the substantial differences in the total number of data pairs, larger RMSEs are mainly observed in regions like Mongolia (32.69 µg m−3) and India (25.34 µg m−3), which often suffered from severe PM2.5 pollution episodes. The spatially varying accuracy metrics highlight the great complexity in large-scale PM2.5 modeling, which also underscores the critical importance of accounting for spatial representativeness when applying models over other regions for data extrapolation.
In Fig. 7, we examined long-term variations in PM2.5 concentrations in four different cities from 2000 to 2021. Good agreement with the previously withheld PM2.5 concentration measurements demonstrated a high accuracy of the LGHAP v2 PM2.5 concentration estimates. Compared to temporally discrete PM2.5 concentration records measured by ground monitors, the gap-free LGHAP v2 PM2.5 concentration time series enabled us to better understand the long-term variability of haze pollution across the globe. As shown, declining trends were observed in PM2.5 concentrations as early as 2006 in New York (United States), whereas apparent reductions were mainly observed after 2012 in Jilin (China) and 2015 in Toyama (Japan). Overall, the gap-free and high-accuracy merits render PM2.5 concentrations in the LGHAP v2 dataset reliable data sources for assessing long-term trends of haze pollution across the globe.
Table 3The data accuracy of gap-free PM2.5 concentrations in the LGHAP v2 dataset compared to ground-based measurements in countries with sufficient PM2.5 records. N denotes the total number of PM2.5 concentration data pairs for calculating R, RMSE, and bias.
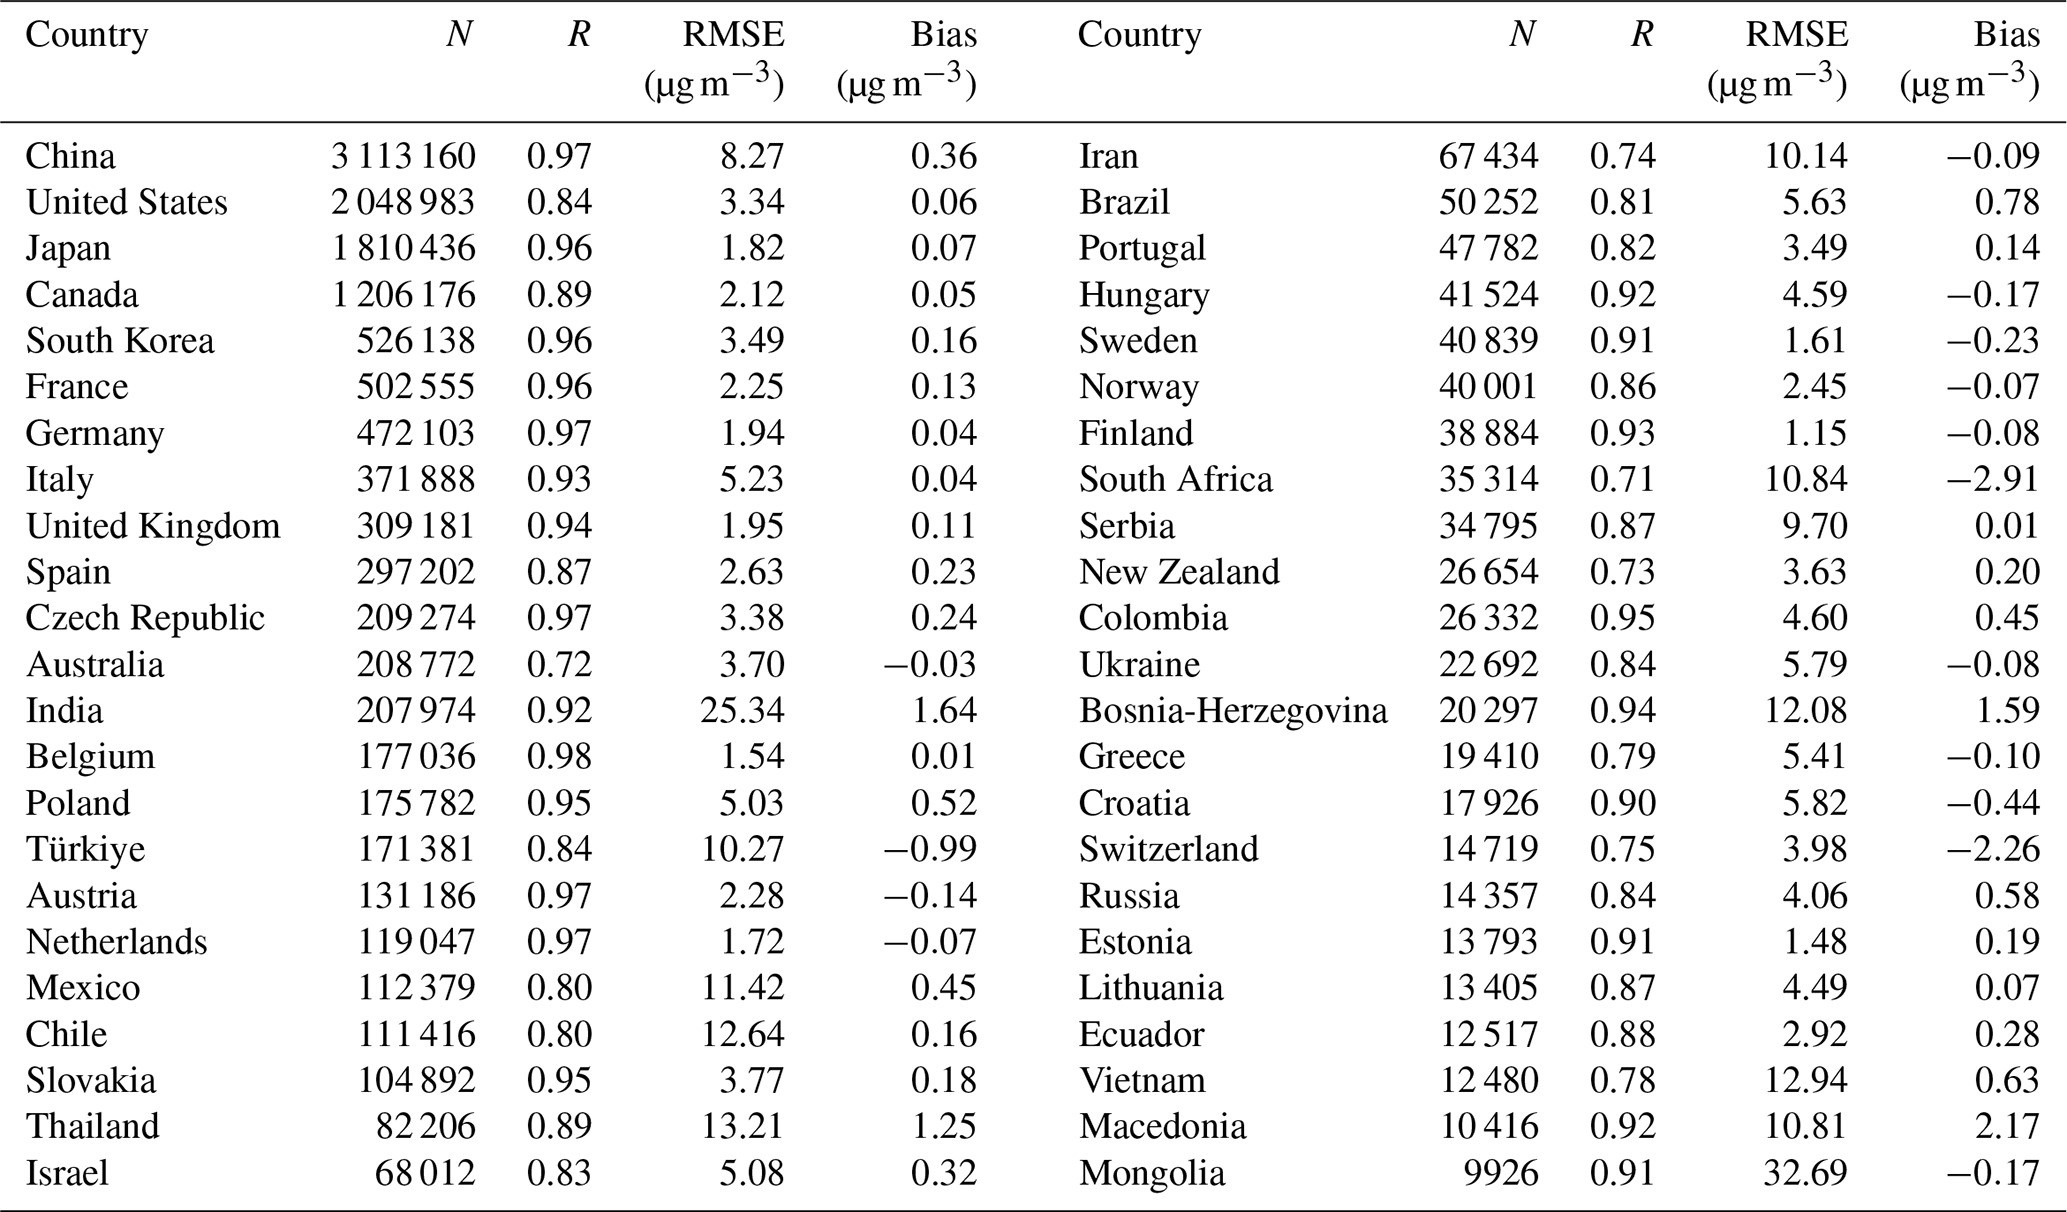
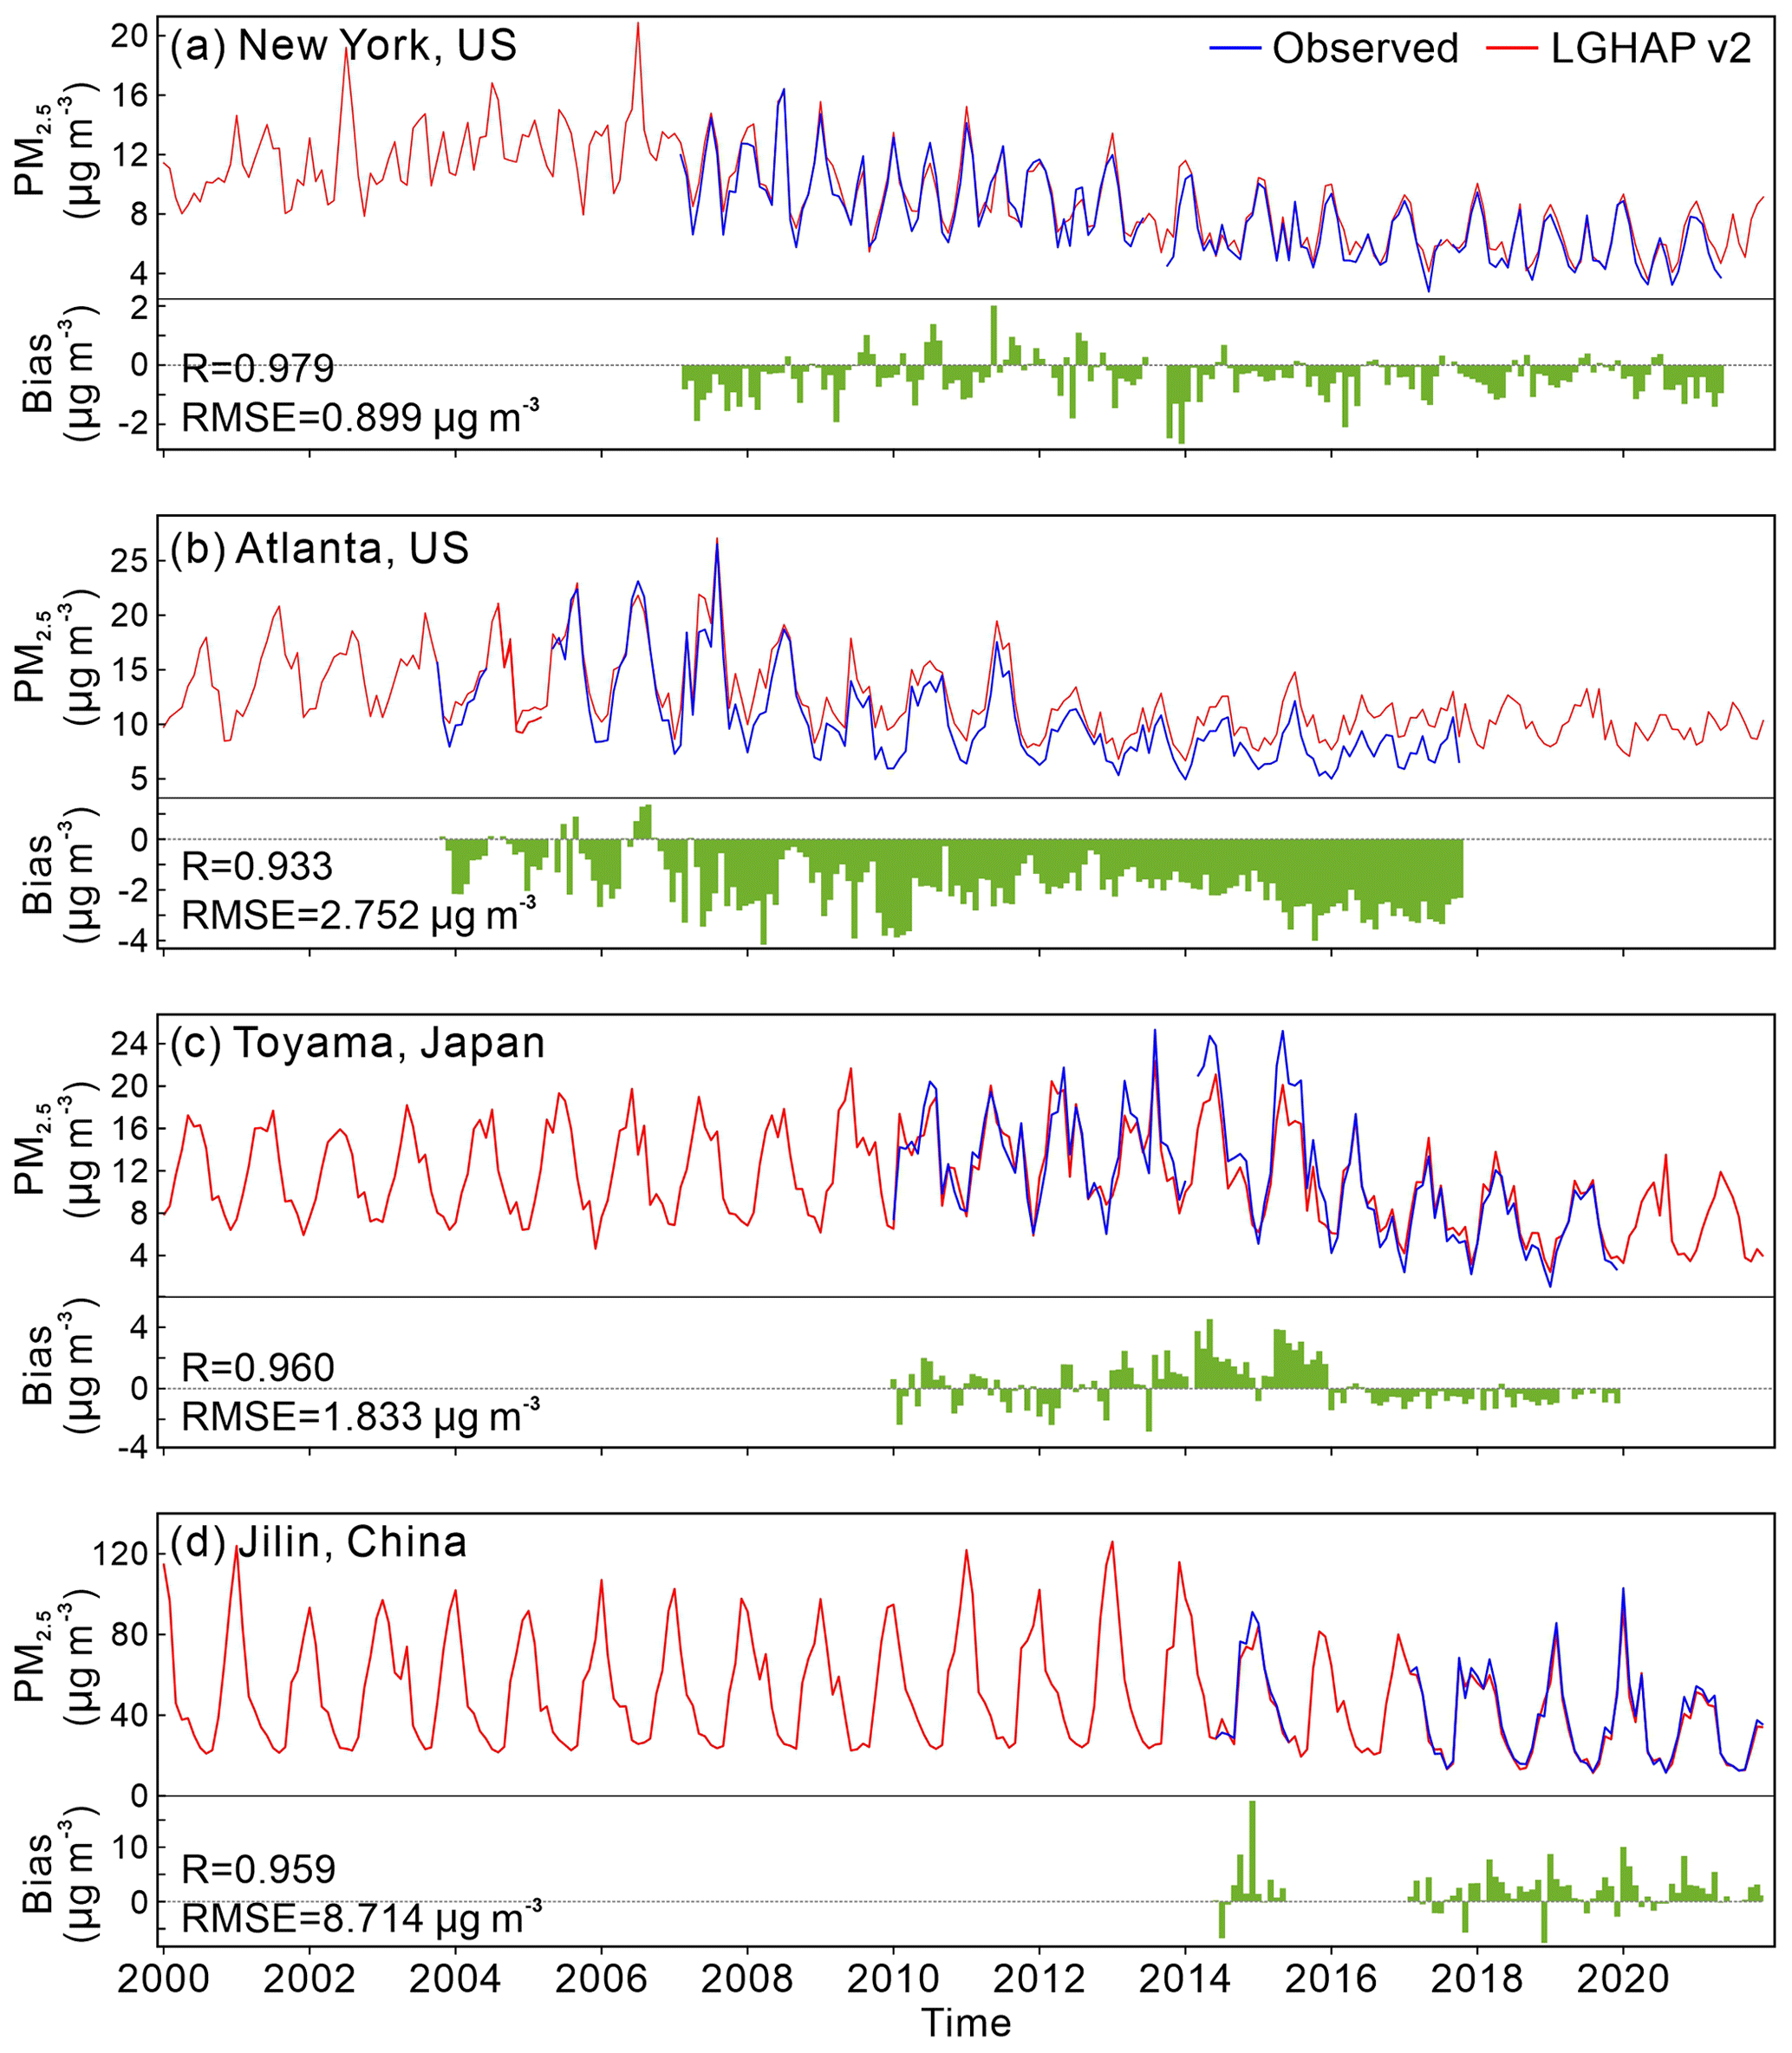
Figure 7An intercomparison of temporal variations in monthly mean PM2.5 concentrations in four different cities between the LGHAP v2 and collocated ground-based PM2.5 concentration measurements from 2000 to 2021.
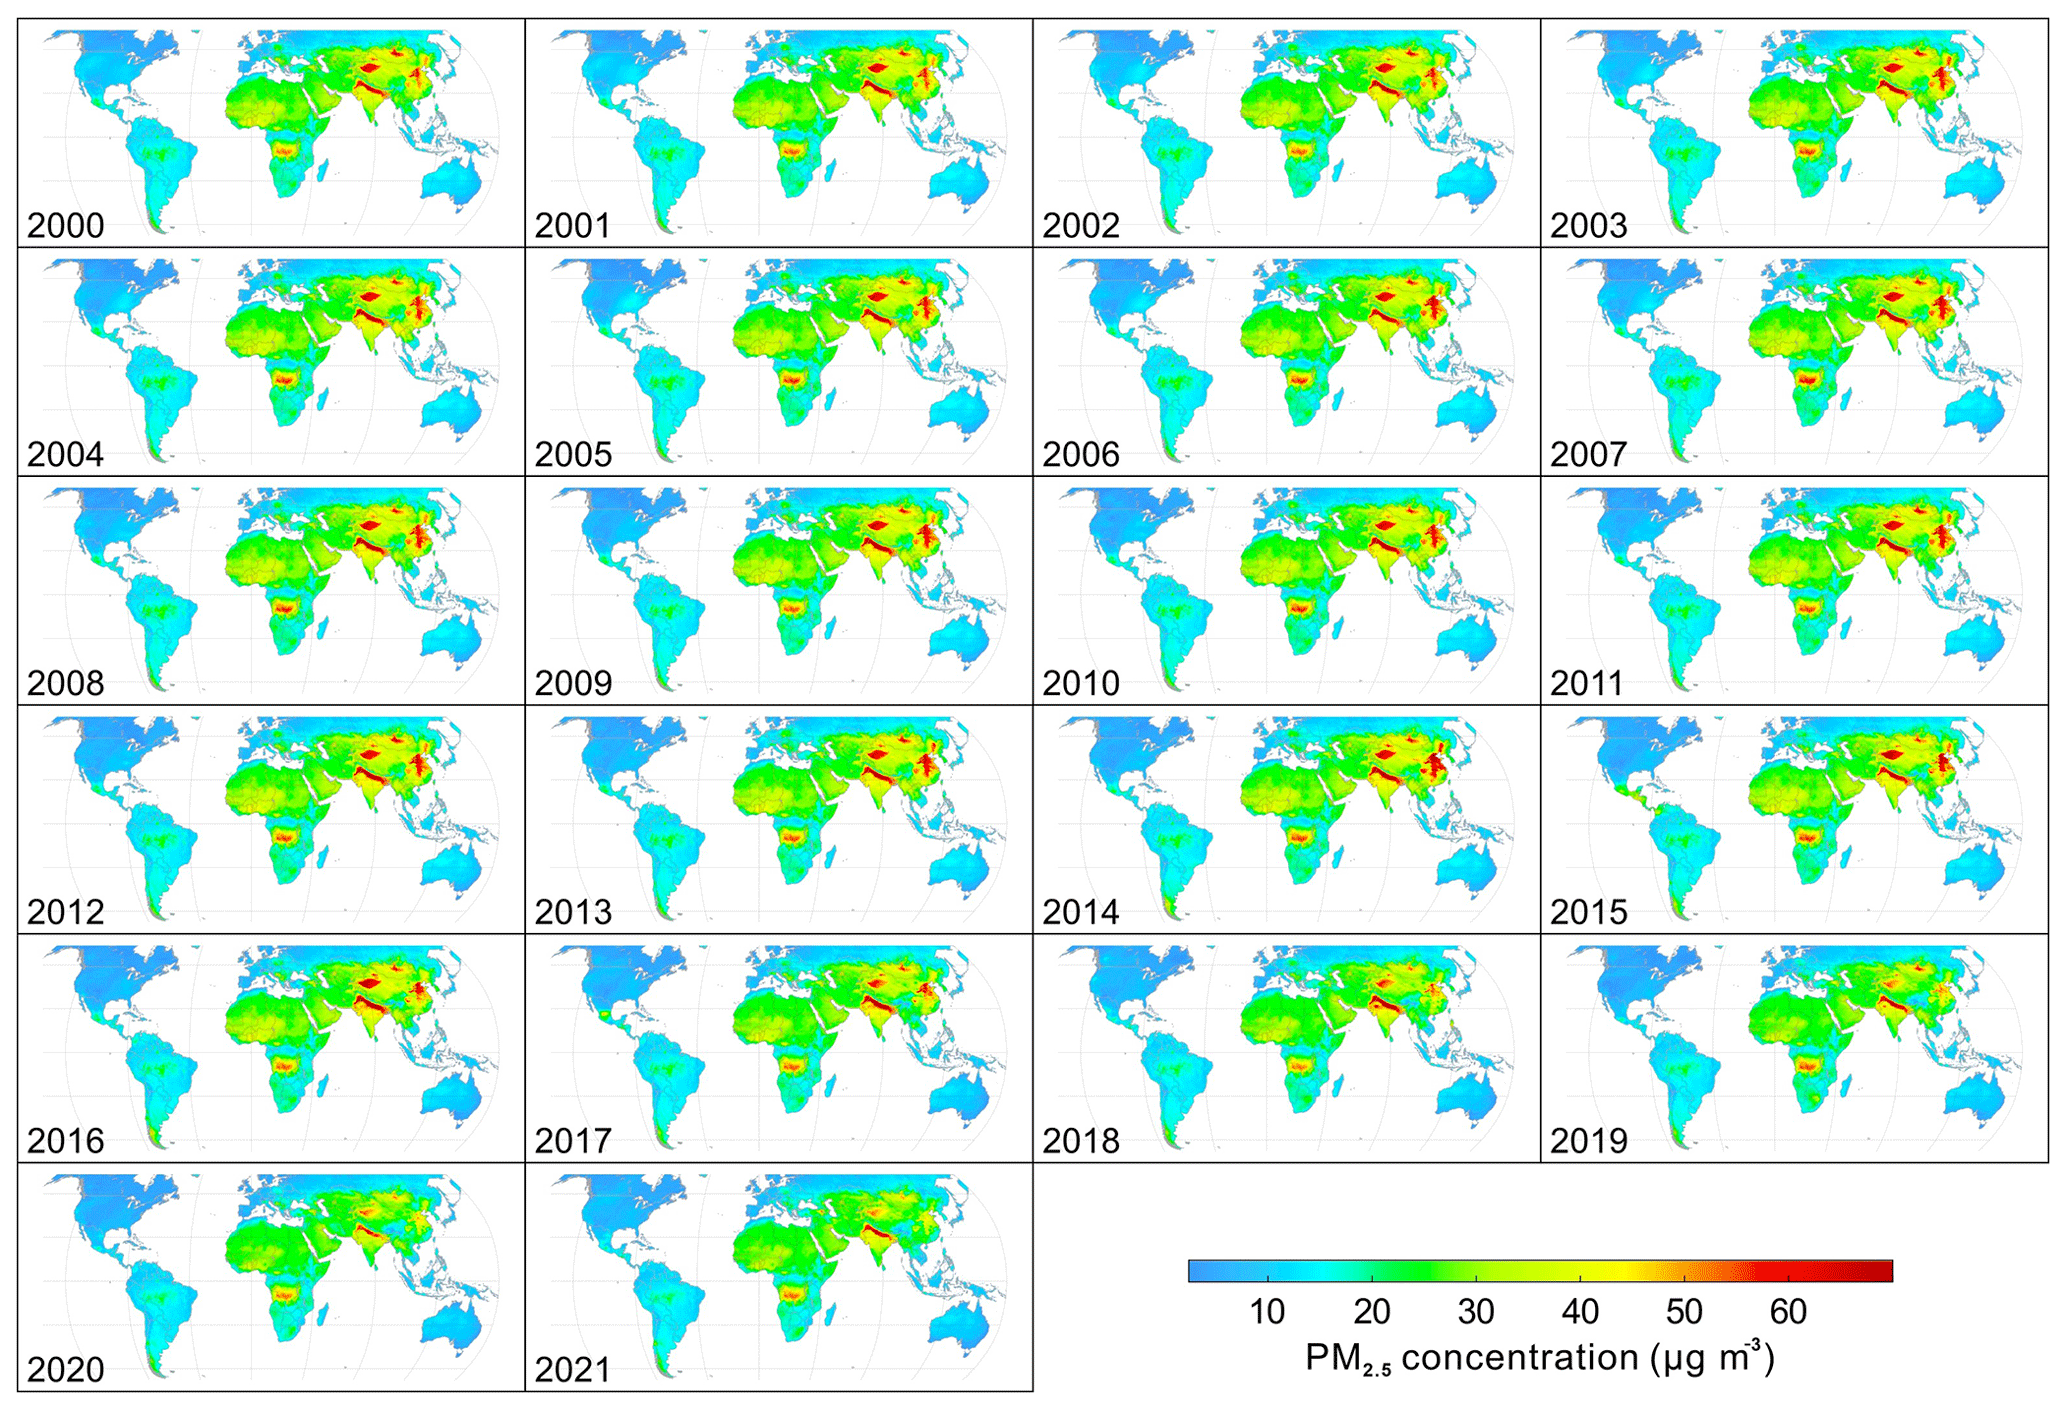
Figure 8Spatial distribution of the global annual mean PM2.5 concentrations derived from the LGHAP v2 dataset between 2000 and 2021.
Figure 8 presents the temporal variations in the global annual mean PM2.5 concentration distribution from 2000 to 2021. As shown, the daily gap-free LGHAP v2 dataset seamlessly supports the derivation of comparable annual mean PM2.5 concentration maps between years, and data-gap-related biases in raw AODTerra images were eliminated. Meanwhile, the quality-assured annual mean PM2.5 concentration maps enable us to easily pinpoint the hotspot regions suffering from severe haze pollution and to analyze the long-term variability of global PM2.5 concentrations. Specifically, Mongolia, northern India, eastern China, and central Africa were identified as four major regions with relatively high PM2.5 loadings, in particular northern India, becoming a hotspot region suffering from more severe PM2.5 pollution on the planet. Substantial PM2.5 reductions were observed in eastern China from 2014 onwards, with PM2.5 concentrations reduced to levels even comparable to countries in central Asia.
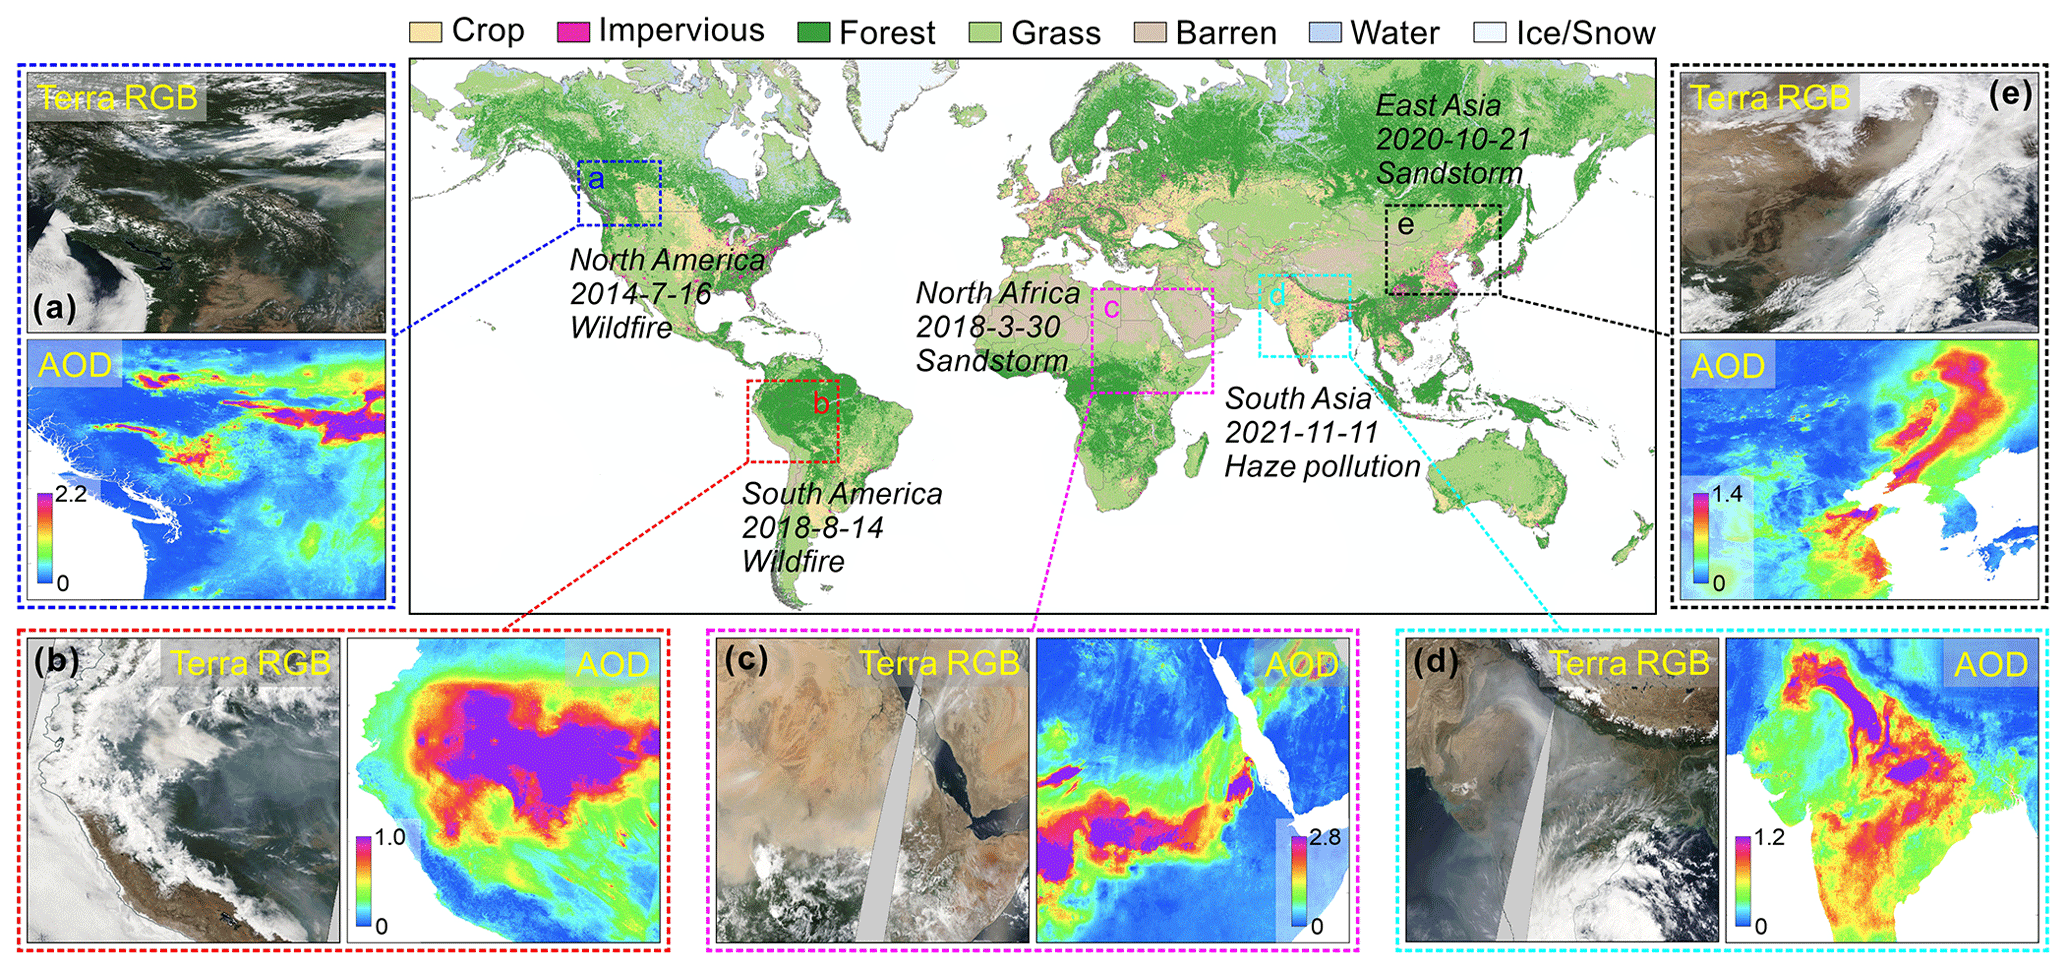
Figure 9An illustration of AOD responses to wildfires, sandstorms, and haze pollution episodes across the globe, as characterized by gap-free AOD in the LGHAP v2 dataset. The global map in the middle panel shows the spatial distribution of major land cover types in 2020.
Spatially contiguous AOD and PM2.5 concentration grids are pivotal in regional air quality management, haze pollution exposure risk assessment, and aerosol radiative forcing diagnosis. By seamlessly gearing up state-of-the-art machine learning and tensor completion methods, a novel big Earth data analytics framework was developed to fulfill the generation of long-term high-resolution AOD and PM2.5 concentration grids (LGHAP v1) in our previous study (Bai et al., 2022a). Specifically, multimodal AODs and relevant air quality data acquired from diverse satellites, numerical models, and ground monitoring stations were first harmonized using random forest models. Next, multisource AOD data flows were weaved neatly as the tensor inputs, with data gaps in daily MODIS AOD images properly reconstructed via low-rank tensor completion. Finally, gap-free PM2.5 concentration grids were mapped from gap-filled AOD images using a random forest model. This big data analytics framework provided an effective solution to integrate multimodal Earth observations from diverse sources to generate high-quality AOD and PM concentrations in China.
In this study, aiming to generate global gap-free AOD and PM2.5 concentration grids, i.e., the LGHAP v2 dataset, the previous big Earth data analytics framework was adopted but enhanced with several new features, with particular focuses on accommodating the rocketing data size and global-scale modeling demand other than reducing modeling biases. Specifically, an attention mechanism, inspired by deep-learning techniques, was hereby introduced to weight each data slice in the input tensor to account for the drawback induced by the equal weight strategy, with larger weights assigned to data slices with fewer data gaps and more similar to the target image. In other words, both the spatial coverage ratio of valid observations in all soft data and the mutual information between the target and soft data were considered simultaneously to weight each data slice in the AOD tensor. A weighted AOD tensor was then calculated for tensor completion instead of using all the available information in the AOD tensor indifferently. Although the ablation experiments shown in Fig. 2 have demonstrated the efficacy of this attention-reinforced tensor construction strategy, the underlying philosophy, in particular the relative importance of mutual information and extra spatial coverage, has not yet been fully justified and assessed.
An adaptive background field updating scheme was also introduced to iteratively update prior information in the target AOD images. Compared to the invariant prior information, adaptively updated prior information allowed for mitigation of the influence of uncertainties in the prior information on the reconstruction accuracy, particularly large modeling biases from numerical simulations. Despite these algorithmic improvements, a slightly reduced data accuracy of gap-filled AODs in China from the LGAHP v2 dataset was observed compared to those in the LGHAP v1 dataset. Further investigations revealed that this was mainly due to the relatively poor data accuracy of the downscaled AODM2 data because a global-scale versus regional downscaling model was applied. Nonetheless, benefiting from the adaptive background updating scheme, the modeling biases in AODM2 were effectively suppressed in the final reconstructed AOD fields, evidenced by larger biases of AODM2 (R = 0.77, RMSE = 0.36) versus smaller biases of the purely reconstructed AOD (R = 0.82, RMSE = 0.26).
The global gap-free and high-resolution benefits render the LGHAP v2 dataset a promising data source to monitor global aerosol distribution and variations in space and time. As illustrated in Fig. 9, aerosol-related environmental disturbance episodes, e.g., sandstorms, wildfires, or haze pollution events, can be indicated well by local rising AODs. More importantly, the gap-filled AOD dataset provides us with an unprecedented opportunity to monitor aerosol loadings and variations even under cloud cover, e.g., the haze pollution episodes over southern India and eastern China shown in Fig. 9d and e. This largely benefited from the intelligent spatiotemporal pattern recognition as well as the assimilation of air quality measurements from ground monitoring stations and numerical aerosol diagnostics. While this global air quality mapping approach greatly facilitates the surveillance and management of air pollution around the world, the LGHAP v2 dataset would also significantly reduce uncertainties in the health-related aerosol exposure risk assessment results because of the gap-free and high-resolution advantages.
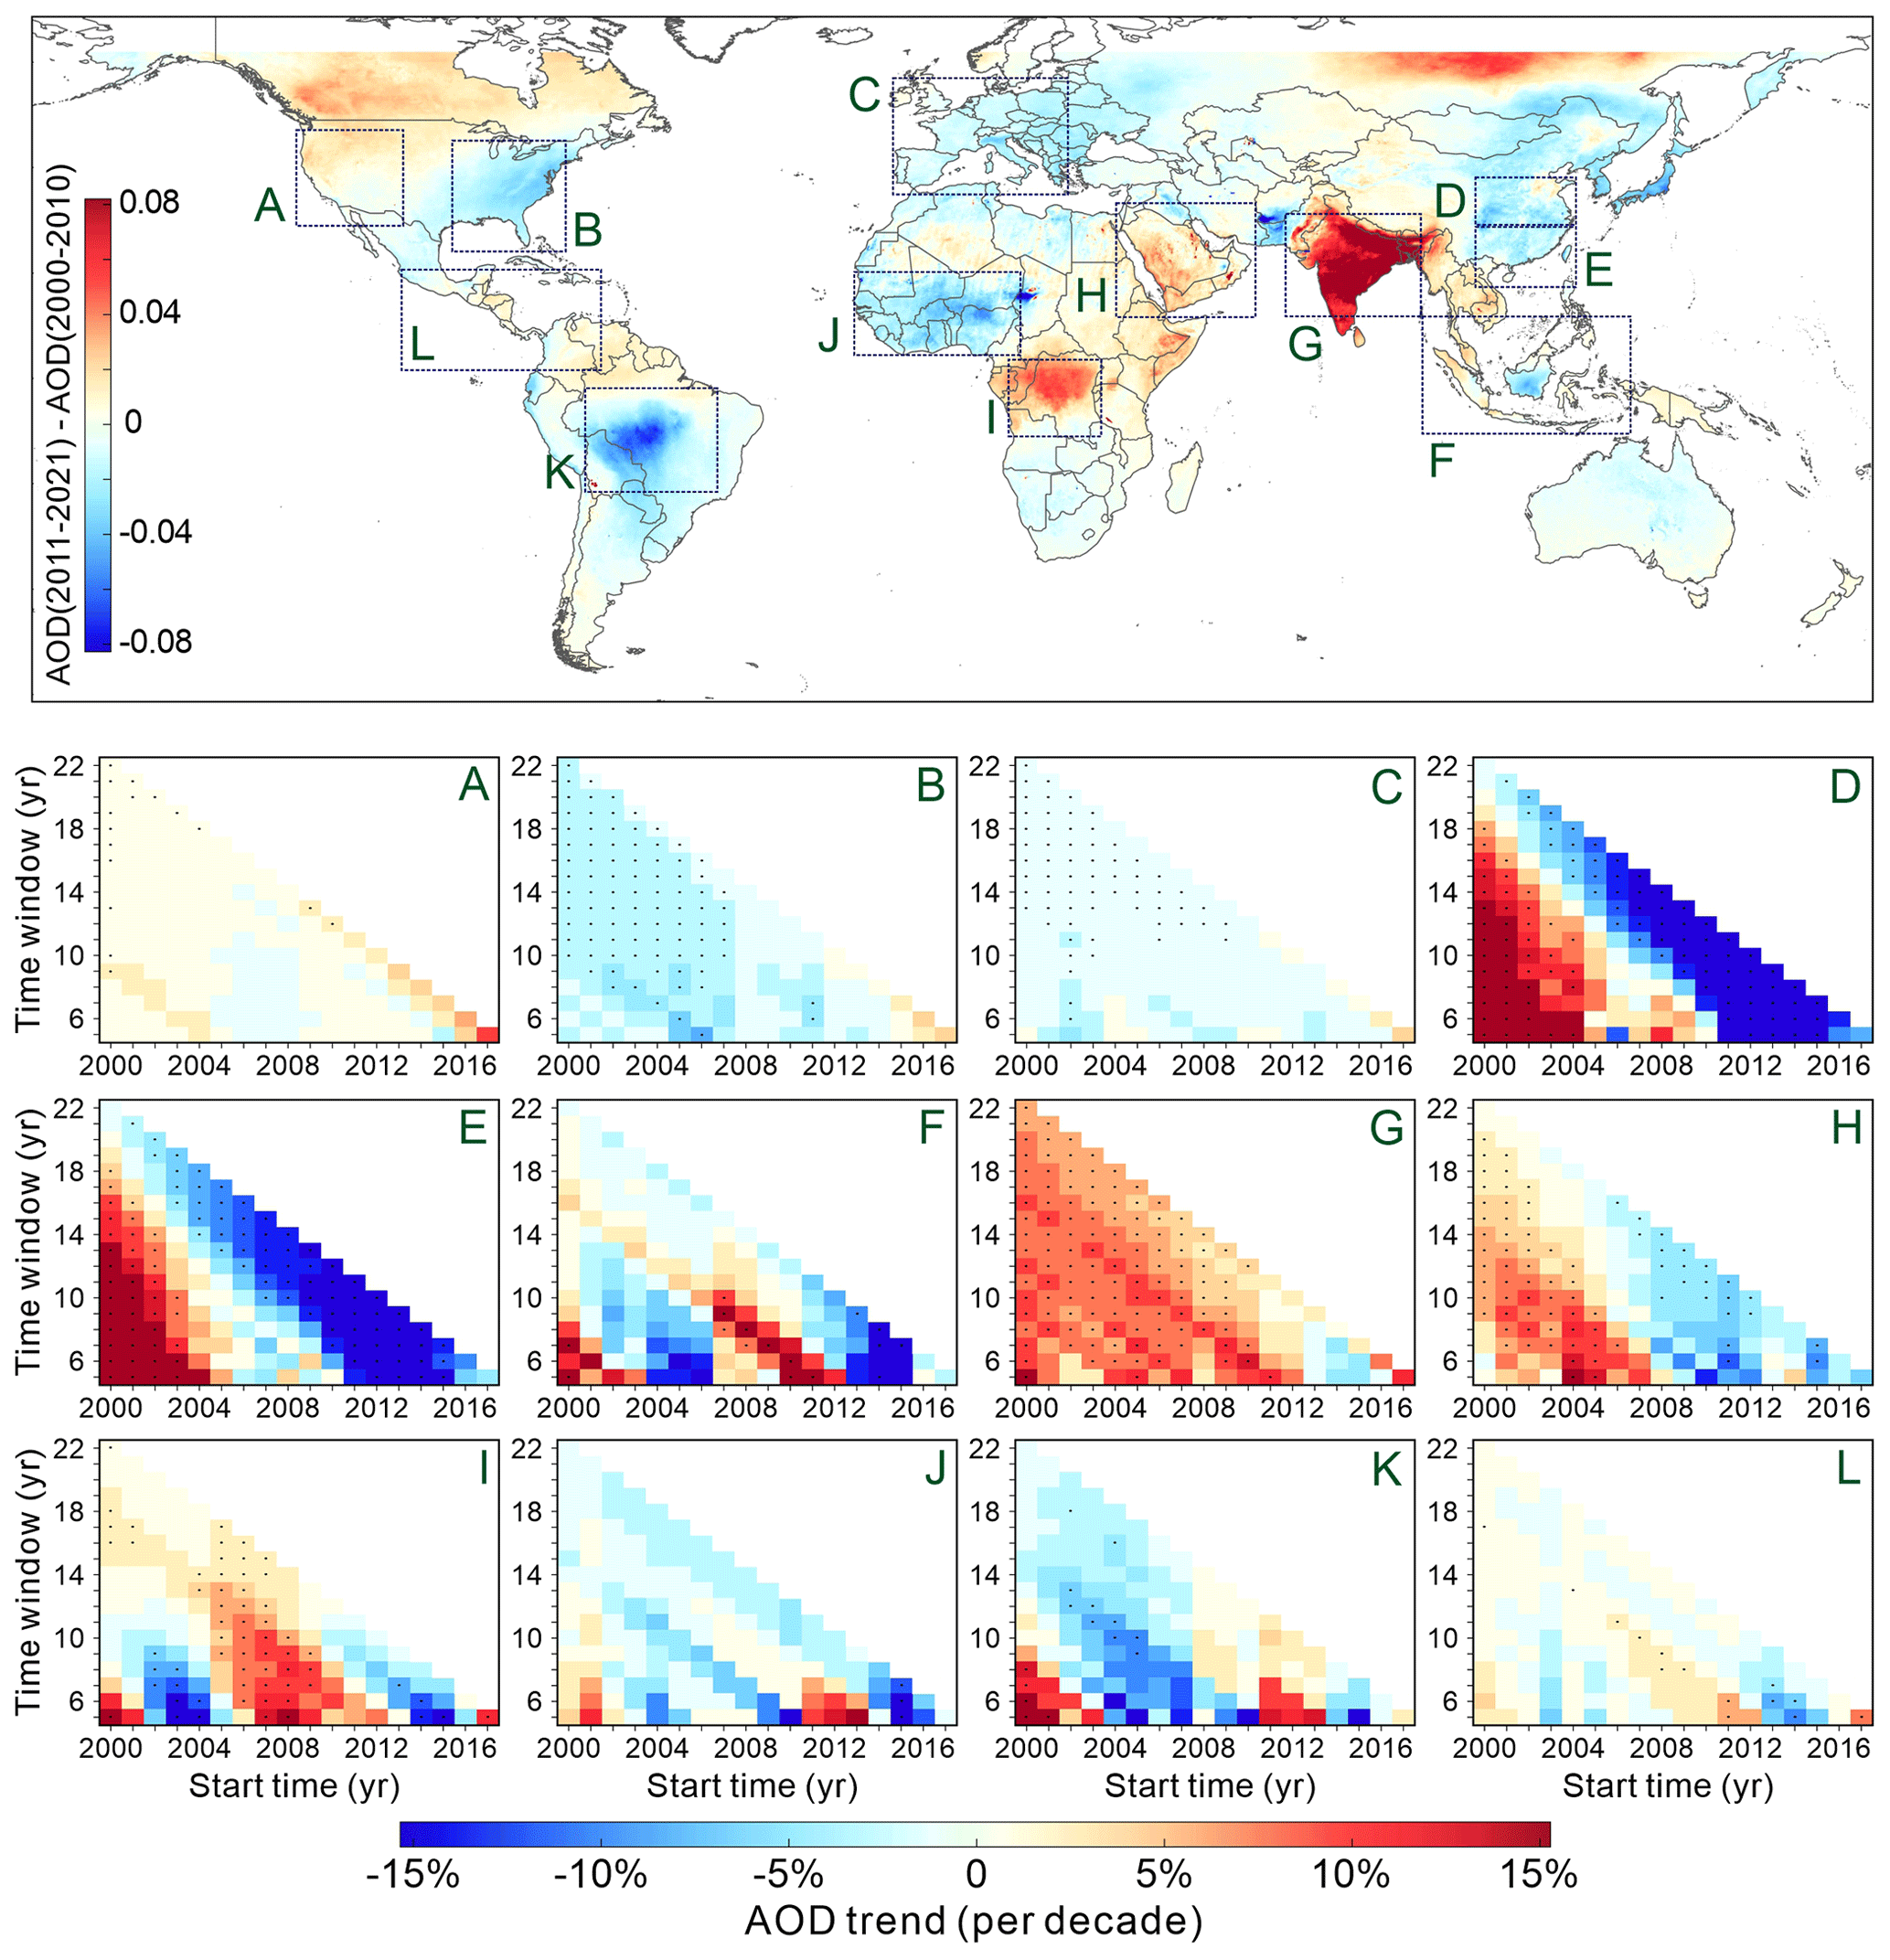
Figure 10AOD trends over 12 regions of interest worldwide from 2000 to 2021 estimated from gap-free AODs in the LGHAP v2 dataset. The top row shows the spatial distribution of global AOD deviations between the first and second decades in the 21st century. The 12 diagrams in the bottom panel show the linear trend of mean AOD over the outlined region of interest at different starting times with varying time window sizes.
Global AOD variation trends were carefully examined by taking advantage of the LGHAP v2 AOD dataset. Figure 10a presents the AOD deviations between the AOD averages during the first and second decades of the 21st century across the globe. As shown, substantial AOD increases in the 21st century are primarily present over India and central Africa, with remarkable AOD decreases observed in the middle of South America. In North America, AOD increases were mainly observed in Canada and the western United States, whereas AOD decreases were found in the eastern United States. Additionally, in reference to temporally varying AOD trends in regions A and B, evident AOD increasing trends were observed in the United States from 2012 onwards, while significant decreasing trends in the eastern United States were entirely reversed after 2015. This effect could be partially attributed to more frequent and intensive wildfire emissions in North America during the second decade of the 2000s (Burke et al., 2023; X. Wei et al., 2021). A similar effect was also observed in Europe, with an apparent slowdown in the AOD decreasing trend after 2010.
Inverse effects were also observed in China but with totally different temporal transition patterns. As shown, statistically significant AOD increasing trends were observed in eastern and southern China in the first decade, with a slowdown starting around 2007, followed by a sudden reversion to decreasing trends after 2010. This was also the most significant AOD decreasing trend during the 2010s around the world. This observational evidence confirms the success of clean air action in improving air quality in China during recent decades (Bai et al., 2022a; Liang et al., 2020; Zhang et al., 2019). A similar temporal variation pattern was also observed in the Middle East but with relatively weak trends. In contrast, India was a hotspot area showing an increasing trend in AOD throughout the 2000s, despite a short period of increasing hiatus from 2013 to 2015.
Global gap-free PM2.5 concentrations were derived based on gap-filled AOD grids by taking advantage of a novel SCAGAT model. Unlike many other data-driven models, the spatial representativeness was accounted for in the SCAGAT model, providing a unique solution to modeling PM2.5 concentrations over regions even without PM2.5 monitoring sites. Daily gap-free PM2.5 concentration grids favor the assessment of the pandemic's influence on regional air quality. Figure 11a and b present the spatial distribution of PM2.5 concentrations before and during the COVID-19 pandemic, respectively. Neglecting long-term variation trends in PM2.5 concentrations, the substantial PM2.5 decreases in central and eastern China as well as in central Europe clearly indicate the positive effect of pandemic-related mobility restrictions on air quality improvement (by comparing PM2.5 concentrations in 2019 and 2020 during the synchronous period). In contrast, PM2.5 reductions were relatively small in the United States due to the lack of mobility restriction measures, with apparent PM2.5 reductions observed mainly in regions like Chicago. Overall, the LGHAP v2 dataset enables us to better investigate global aerosol variations and assess PM2.5-related health exposure risks.
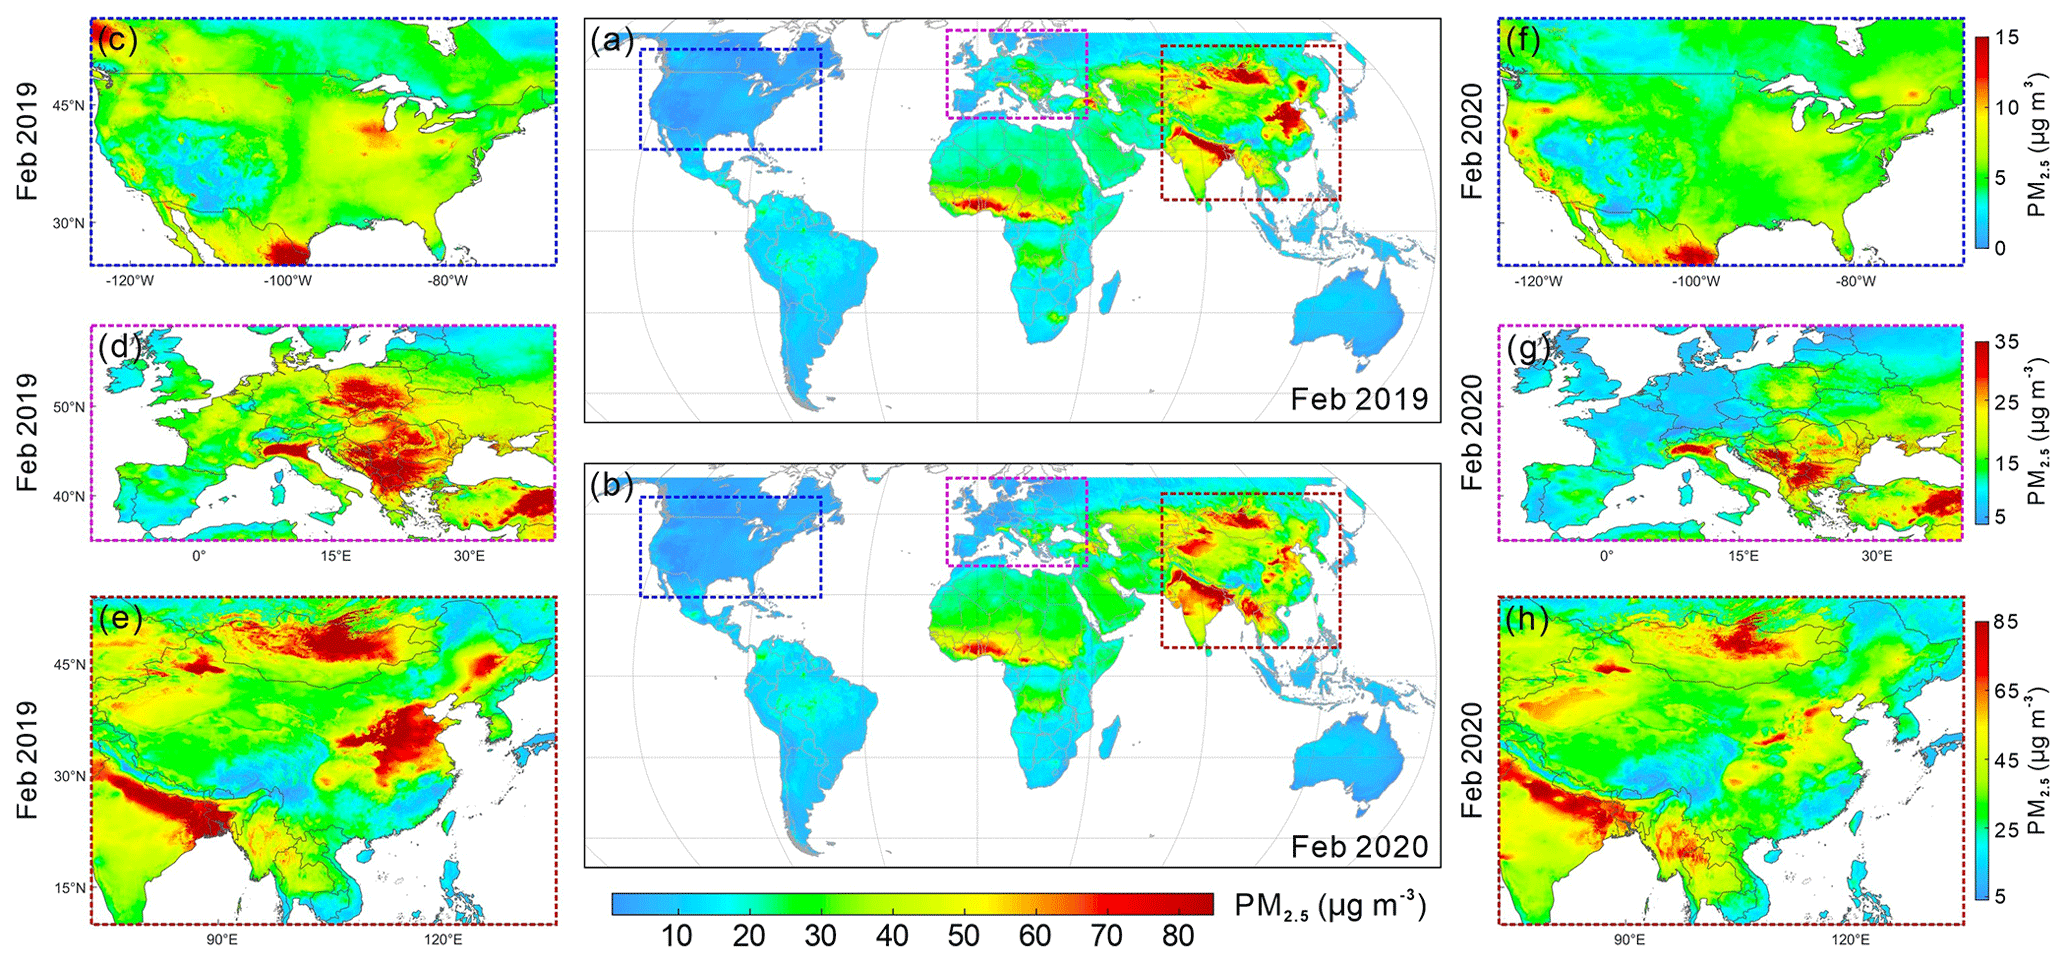
Figure 11Influence of the COVID-19 pandemic on PM2.5 concentrations in the United States, Europe, and China. PM2.5 concentrations from LGHAP v2 were averaged over synchronous periods in 2019 and 2020 for intercomparison.
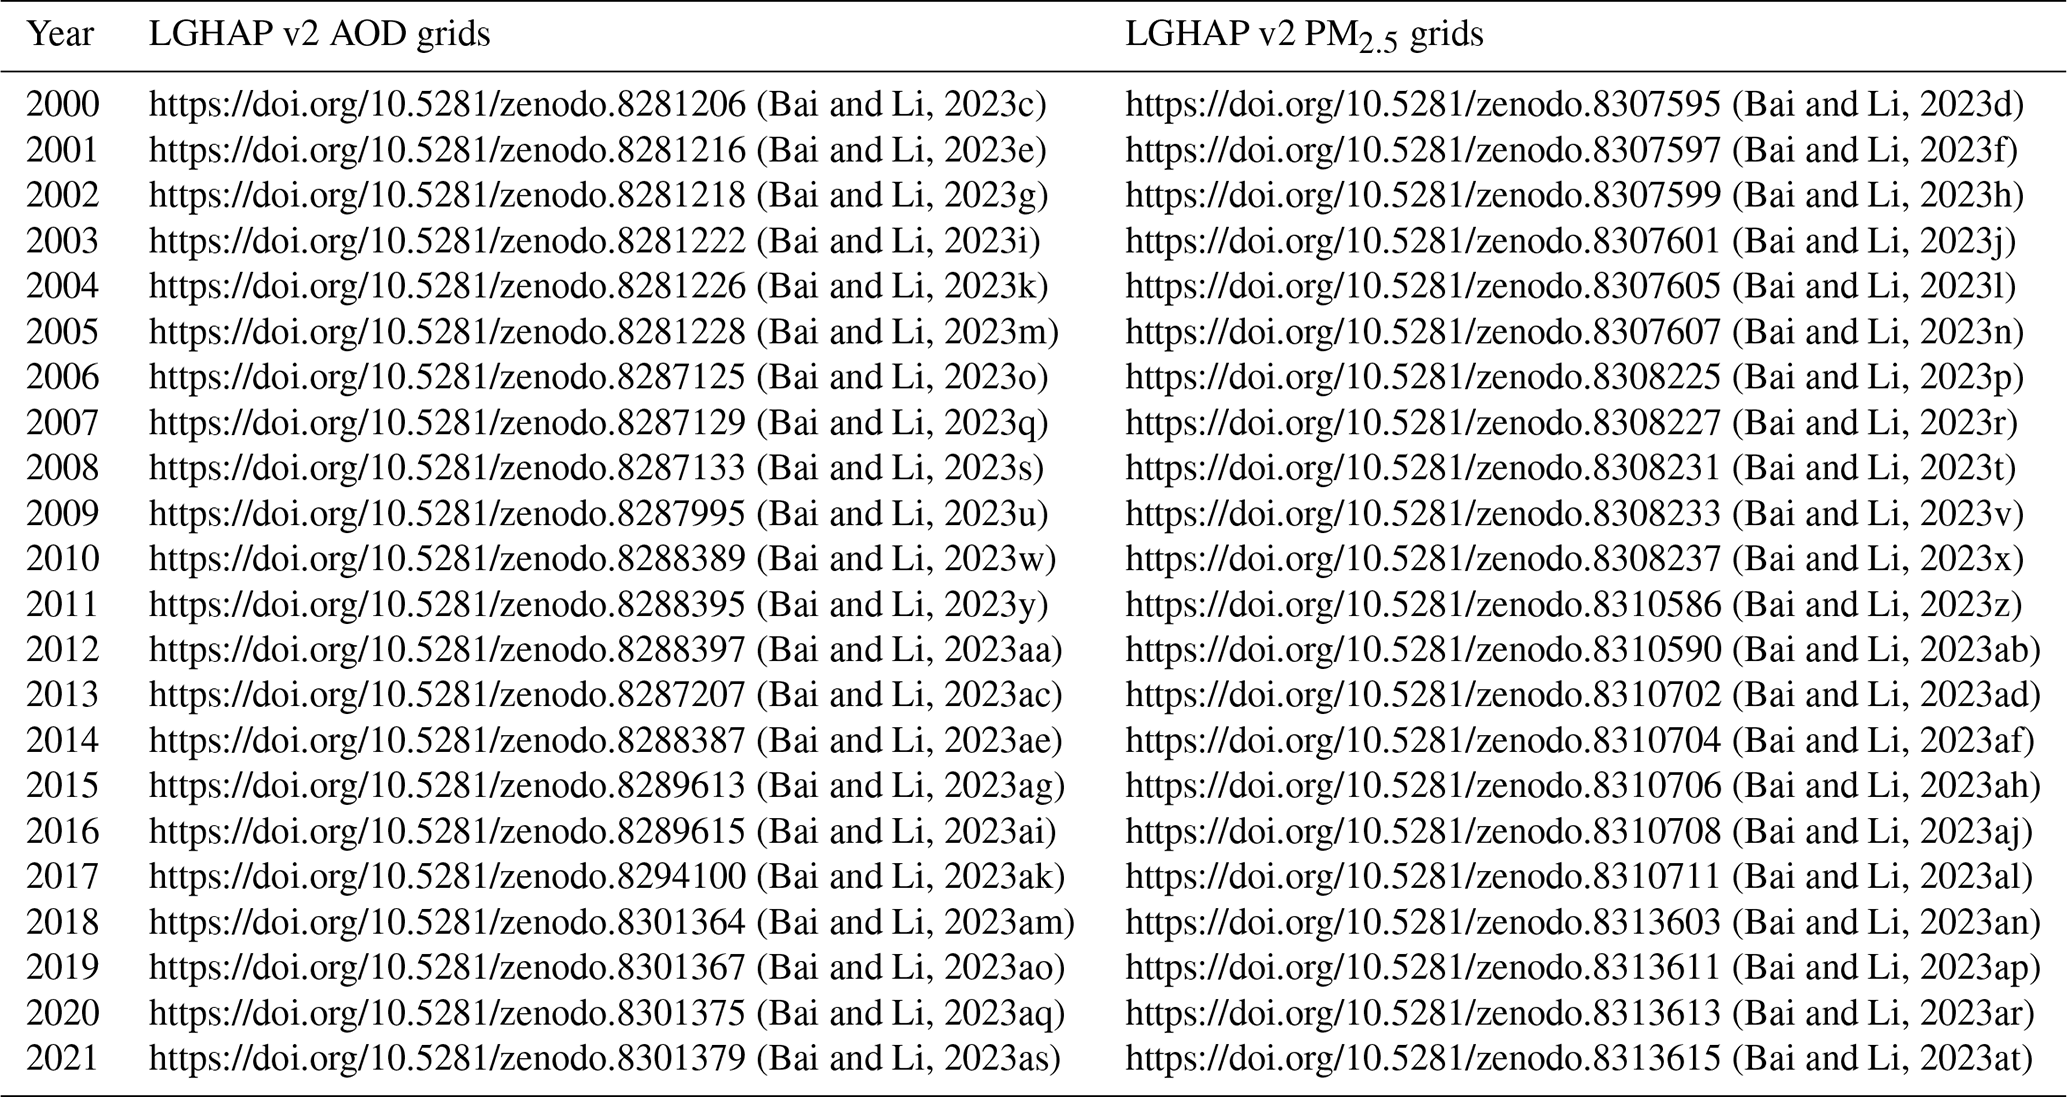
The LGHAP v2 dataset provides global gap-free AOD and PM2.5 concentration grids from 2000 to 2021 with a daily 1 km resolution. To facilitate the data sharing, each daily map was saved as a single NetCDF file, and the data in each individual month were then archived as one zip file. Table 4 summarizes the permanent digital object identifiers for data in each calendar year from 2000 to 2021. All these datasets are publicly available at the LGHAP community link via https://zenodo.org/communities/ecnu_lghap (Bai and Li, 2023a). The data user guide and visualization codes (Python, MATLAB, R, and IDL) were also provided to guide the users in retrieving data from the NetCDF files, which can be accessed at https://doi.org/10.5281/zenodo.10216396 (Bai and Li, 2023b).
Table 4List of data links for AOD and PM2.5 concentration grids in the LGHAP v2 dataset for each individual year.
In this study, the LGHAP v2 dataset, a successor of LGHAP v1, was generated to provide global gap-free AOD and PM2.5 concentration grids with a daily 1 km resolution from 2000 to 2021, by leveraging an improved big Earth data analytics approach. The ground validation results confirm high accuracies of these two gap-free products, with AOD having an R of 0.85 and an RMSE of 0.14 compared to the AERONET AOD observations, which are slightly worse than the original MCD19A2 product (R = 0.88 and RMSE = 0.11). Similarly, PM2.5 concentration estimates derived from gap-free AOD via the SCAGAT method show agreement with the withheld ground-based PM2.5 measurements, achieving an R of 0.91 and an RMSE of 9.57 µg m−3, while the data accuracy was improved to an R of 0.95 and an RMSE of 5.7 µg m−3 with the fusion of ground-measured PM2.5 concentrations.
Several new algorithmic enhancement modules were incorporated into the big data analytics framework to improve both the computing speed and the reconstruction accuracy. The ablation experiments demonstrated the effectiveness and advantages of the newly implemented attention mechanism in weighing each slice of soft data in the AOD tensor. Updating prior information in the target image after each tensor reconstruction iteration helped mitigate the risk of error propagation from numerical aerosol diagnostics to the final reconstructed field and improve the convergence speed of tensor completion. Overall, this study provides a compelling illustration of big Earth data analytics to generate high-quality remote sensing datasets by synergistically integrating and assimilating multimodal data from diverse sources via machine learning techniques. Additionally, this big data analytics approach could also be used for near-term gap-free AOD mapping by simply replacing numerical AOD reanalysis with forecasting fields (e.g., CAMS forecasts).
This study also provides new insights into how to deal with the scale problem when developing large-scale environmental variable (e.g., PM2.5 concentration) mapping models. Instead of constructing a global model with all paired data samples, site-specific PM2.5 prediction models were first established using a random forest model, and a graph attention network was then developed to establish an ensemble learning model to integrate multiple PM2.5 estimates derived from site-specific random forest models trained over sites with similar scene features to the target grid. By accounting for the scene similarity between geographic regions, the proposed deep-learning model attempted to address the scale problem in large-scale PM2.5 modeling practices.
The LGHAP v2 dataset is publicly accessible using the aforementioned links. The gap-free and high-resolution dataset can be used as a reliable data source for assessing aerosol–climate interactions as well as PM2.5 exposure risks and related health outcomes around the world. Researchers are also encouraged to use this dataset to evaluate the status and trends of urban aerosol pollution across the globe to support the assessment of Sustainable Development Goals.
The supplement related to this article is available online at: https://doi.org/10.5194/essd-16-2425-2024-supplement.
The study was completed with cooperation between all the authors. KB, KL, JG, ZL, and NBC conceived of the idea. KB, KL, LS, CL, and YS developed the method. KL, KB, XL, MM, DH, ZZ, and RL conducted the data analyses. KB and KL wrote the paper. All the authors discussed the results and proofread the paper.
The contact author has declared that none of the authors has any competing interests.
Publisher’s note: Copernicus Publications remains neutral with regard to jurisdictional claims made in the text, published maps, institutional affiliations, or any other geographical representation in this paper. While Copernicus Publications makes every effort to include appropriate place names, the final responsibility lies with the authors.
The authors would like to express gratitude to the relevant organizations and data archive services for generating and sharing the essential datasets used in this study.
This research has been supported by the National Natural Science Foundation of China (grant no. 42171309), the International Research Center of Big Data for Sustainable Development Goals (grant no. CBAS2022GSP07), the Foreign Technical Cooperation and Scientific Research Program (grant no. E3KZ0301), and the Fundamental Research Funds for the Central Universities.
This paper was edited by Qingxiang Li and reviewed by two anonymous referees.
Bai, K. and Li, K.: LGHAP: Long-term Gap-free High-resolution Air Pollutants concentration dataset, Zenodo [data set], https://zenodo.org/communities/ecnu_lghap (last access: 3 April 2024), 2023a.
Bai, K. and Li, K.: LGHAP air pollution data user guide version 2, Zenodo [code], https://doi.org/10.5281/zenodo.10216396, 2023b.
Bai, K. and Li, K.: LGHAP v2: Global daily 1-km gap-free PM2.5 grids (2000), Zenodo [data set], https://doi.org/10.5281/zenodo.8307595, 2023c.
Bai, K. and Li, K.: LGHAP v2: Global daily 1-km gap-free AOD grids (2000), Zenodo [data set], https://doi.org/10.5281/zenodo.8281206, 2023d.
Bai, K. and Li, K.: LGHAP v2: Global daily 1-km gap-free AOD grids (2001), Zenodo [data set], https://doi.org/10.5281/zenodo.8281216, 2023e.
Bai, K. and Li, K.: LGHAP v2: Global daily 1-km gap-free PM2.5 grids (2001), Zenodo [data set], https://doi.org/10.5281/zenodo.8307597, 2023f.
Bai, K. and Li, K.: LGHAP v2: Global daily 1-km gap-free AOD grids (2002), Zenodo [data set], https://doi.org/10.5281/zenodo.8281218, 2023g.
Bai, K. and Li, K.: LGHAP v2: Global daily 1-km gap-free PM2.5 grids (2002), Zenodo [data set], https://doi.org/10.5281/zenodo.8307599, 2023h.
Bai, K. and Li, K.: LGHAP v2: Global daily 1-km gap-free AOD grids (2003), Zenodo [data set], https://doi.org/10.5281/zenodo.8281222, 2023i.
Bai, K. and Li, K.: LGHAP v2: Global daily 1-km gap-free PM2.5 grids (2003), Zenodo [data set], https://doi.org/10.5281/zenodo.8307601, 2023j.
Bai, K. and Li, K.: LGHAP v2: Global daily 1-km gap-free AOD grids (2004), Zenodo [data set], https://doi.org/10.5281/zenodo.8281226, 2023k.
Bai, K. and Li, K.: LGHAP v2: Global daily 1-km gap-free PM2.5 grids (2004), Zenodo [data set], https://doi.org/10.5281/zenodo.8307605, 2023l.
Bai, K. and Li, K.: LGHAP v2: Global daily 1-km gap-free AOD grids (2005), Zenodo [data set], https://doi.org/10.5281/zenodo.8281228, 2023m.
Bai, K. and Li, K.: LGHAP v2: Global daily 1-km gap-free PM2.5 grids (2005), Zenodo [data set], https://doi.org/10.5281/zenodo.8307607, 2023n.
Bai, K. and Li, K.: LGHAP v2: Global daily 1-km gap-free AOD grids (2006), Zenodo [data set], https://doi.org/10.5281/zenodo.8287125, 2023o.
Bai, K. and Li, K.: LGHAP v2: Global daily 1-km gap-free PM2.5 grids (2006), Zenodo [data set], https://doi.org/10.5281/zenodo.8308225, 2023p.
Bai, K. and Li, K.: LGHAP v2: Global daily 1-km gap-free AOD grids (2007), Zenodo [data set], https://doi.org/10.5281/zenodo.8287129, 2023q.
Bai, K. and Li, K.: LGHAP v2: Global daily 1-km gap-free PM2.5 grids (2007), Zenodo [data set], https://doi.org/10.5281/zenodo.8308227, 2023r.
Bai, K. and Li, K.: LGHAP v2: Global daily 1-km gap-free AOD grids (2008), Zenodo [data set], https://doi.org/10.5281/zenodo.8287133, 2023s.
Bai, K. and Li, K.: LGHAP v2: Global daily 1-km gap-free PM2.5 grids (2008), Zenodo [data set], https://doi.org/10.5281/zenodo.8308231, 2023t.
Bai, K. and Li, K.: LGHAP v2: Global daily 1-km gap-free AOD grids (2009), Zenodo [data set], https://doi.org/10.5281/zenodo.8287995, 2023u.
Bai, K. and Li, K.: LGHAP v2: Global daily 1-km gap-free PM2.5 grids (2009), Zenodo [data set], https://doi.org/10.5281/zenodo.8308233, 2023v.
Bai, K. and Li, K.: LGHAP v2: Global daily 1-km gap-free AOD grids (2010), Zenodo [data set], https://doi.org/10.5281/zenodo.8288389, 2023w.
Bai, K. and Li, K.: LGHAP v2: Global daily 1-km gap-free PM2.5 grids (2010), Zenodo [data set], https://doi.org/10.5281/zenodo.8308237, 2023x.
Bai, K. and Li, K.: LGHAP v2: Global daily 1-km gap-free AOD grids (2011), Zenodo [data set], https://doi.org/10.5281/zenodo.8288395, 2023y.
Bai, K. and Li, K.: LGHAP v2: Global daily 1-km gap-free PM2.5 grids (2011), Zenodo [data set], https://doi.org/10.5281/zenodo.8310586, 2023z.
Bai, K. and Li, K.: LGHAP v2: Global daily 1-km gap-free AOD grids (2012), Zenodo [data set], https://doi.org/10.5281/zenodo.8288397, 2023aa.
Bai, K. and Li, K.: LGHAP v2: Global daily 1-km gap-free PM2.5 grids (2012), Zenodo [data set], https://doi.org/10.5281/zenodo.8310590, 2023ab.
Bai, K. and Li, K.: LGHAP v2: Global daily 1-km gap-free AOD grids (2013), Zenodo [data set], https://doi.org/10.5281/zenodo.8287207, 2023ac.
Bai, K. and Li, K.: LGHAP v2: Global daily 1-km gap-free PM2.5 grids (2013), Zenodo [data set], https://doi.org/10.5281/zenodo.8310702, 2023ad.
Bai, K. and Li, K.: LGHAP v2: Global daily 1-km gap-free AOD grids (2014), Zenodo [data set], https://doi.org/10.5281/zenodo.8288387, 2023ae.
Bai, K. and Li, K.: LGHAP v2: Global daily 1-km gap-free PM2.5 grids (2014), Zenodo [data set], https://doi.org/10.5281/zenodo.8310704, 2023ef.
Bai, K. and Li, K.: LGHAP v2: Global daily 1-km gap-free AOD grids (2015), Zenodo [data set], https://doi.org/10.5281/zenodo.8289613, 2023ag.
Bai, K. and Li, K.: LGHAP v2: Global daily 1-km gap-free PM2.5 grids (2015), Zenodo [data set], https://doi.org/10.5281/zenodo.8310706, 2023ah.
Bai, K. and Li, K.: LGHAP v2: Global daily 1-km gap-free AOD grids (2016), Zenodo [data set], https://doi.org/10.5281/zenodo.8289615, 2023ai.
Bai, K. and Li, K.: LGHAP v2: Global daily 1-km gap-free PM2.5 grids (2016), Zenodo [data set], https://doi.org/10.5281/zenodo.8310708, 2023aj.
Bai, K. and Li, K.: LGHAP v2: Global daily 1-km gap-free AOD grids (2017), Zenodo [data set], https://doi.org/10.5281/zenodo.8294100, 2023ak.
Bai, K. and Li, K.: LGHAP v2: Global daily 1-km gap-free PM2.5 grids (2017), Zenodo [data set], https://doi.org/10.5281/zenodo.8310711, 2023al.
Bai, K. and Li, K.: LGHAP v2: Global daily 1-km gap-free AOD grids (2018), Zenodo [data set], https://doi.org/10.5281/zenodo.8301364, 2023am.
Bai, K. and Li, K.: LGHAP v2: Global daily 1-km gap-free PM2.5 grids (2018), Zenodo [data set], https://doi.org/10.5281/zenodo.8313603, 2023an.
Bai, K. and Li, K.: LGHAP v2: Global daily 1-km gap-free AOD grids (2019), Zenodo [data set], https://doi.org/10.5281/zenodo.8301367, 2023ao.
Bai, K. and Li, K.: LGHAP v2: Global daily 1-km gap-free PM2.5 grids (2019), Zenodo [data set], https://doi.org/10.5281/zenodo.8313611, 2023ap.
Bai, K. and Li, K.: LGHAP v2: Global daily 1-km gap-free AOD grids (2020), Zenodo [data set], https://doi.org/10.5281/zenodo.8301375, 2023aq.
Bai, K. and Li, K.: LGHAP v2: Global daily 1-km gap-free PM2.5 grids (2020), Zenodo [data set], https://doi.org/10.5281/zenodo.8313613, 2023ar.
Bai, K. and Li, K.: LGHAP v2: Global daily 1-km gap-free AOD grids (2021), Zenodo [data set], https://doi.org/10.5281/zenodo.8301379, 2023as.
Bai, K. and Li, K.: LGHAP v2: Global daily 1-km gap-free PM2.5 grids (2021), Zenodo [data set], https://doi.org/10.5281/zenodo.8313615, 2023at.
Bai, K., Chang, N.-B., and Chen, C.-F.: Spectral Information Adaptation and Synthesis Scheme for Merging Cross-Mission Ocean Color Reflectance Observations from MODIS and VIIRS, IEEE T. Geosci. Remote, 54, 311–329, https://doi.org/10.1109/TGRS.2015.2456906, 2016a.
Bai, K., Chang, N.-B., Yu, H., and Gao, W.: Statistical bias correction for creating coherent total ozone record from OMI and OMPS observations, Remote Sens. Environ., 182, 150–168, https://doi.org/10.1016/j.rse.2016.05.007, 2016b.
Bai, K., Li, K., Chang, N.-B., and Gao, W.: Advancing the prediction accuracy of satellite-based PM2.5 concentration mapping: A perspective of data mining through in situ PM2.5 measurements, Environ. Pollut., 254, 113047, https://doi.org/10.1016/j.envpol.2019.113047, 2019.
Bai, K., Li, K., Guo, J., Yang, Y., and Chang, N.-B.: Filling the gaps of in situ hourly PM2.5 concentration data with the aid of empirical orthogonal function analysis constrained by diurnal cycles, Atmos. Meas. Tech., 13, 1213–1226, https://doi.org/10.5194/amt-13-1213-2020, 2020.
Bai, K., Li, K., Ma, M., Li, K., Li, Z., Guo, J., Chang, N.-B., Tan, Z., and Han, D.: LGHAP: the Long-term Gap-free High-resolution Air Pollutant concentration dataset, derived via tensor-flow-based multimodal data fusion, Earth Syst. Sci. Data, 14, 907–927, https://doi.org/10.5194/essd-14-907-2022, 2022a.
Bai, K., Li, K., Guo, J., and Chang, N.-B.: Multiscale and multisource data fusion for full-coverage PM2.5 concentration mapping: Can spatial pattern recognition come with modeling accuracy?, ISPRS J. Photogramm., 184, 31–44, https://doi.org/10.1016/j.isprsjprs.2021.12.002, 2022b.
Bai, K., Li, K., Sun, Y., Wu, L., Zhang, Y., Chang, N.-B., and Li, Z.: Global synthesis of two decades of research on improving PM2.5 estimation models from remote sensing and data science perspectives, Earth-Sci. Rev., 241, 104461, https://doi.org/10.1016/j.earscirev.2023.104461, 2023.
Beckers, J. M. and Rixen, M.: EOF calculations and data filling from incomplete oceanographic datasets, J. Atmos. Ocean. Technol., 20, 1839–1856, https://doi.org/10.1175/1520-0426(2003)020<1839:ECADFF>2.0.CO;2, 2003.
Bi, J., Belle, J. H., Wang, Y., Lyapustin, A. I., Wildani, A., and Liu, Y.: Impacts of snow and cloud covers on satellite-derived PM2.5 levels, Remote Sens. Environ., 221, 665–674, https://doi.org/10.1016/j.rse.2018.12.002, 2019.
Buchard, V., Randles, C. A., da Silva, A. M., Darmenov, A., Colarco, P. R., Govindaraju, R., Ferrare, R., Hair, J., Beyersdorf, A. J., Ziemba, L. D., and Yu, H.: The MERRA-2 Aerosol Reanalysis, 1980 Onward. Part II: Evaluation and Case Studies, J. Climate, 30, 6851–6872, https://doi.org/10.1175/JCLI-D-16-0613.1, 2017.
Burke, M., Childs, M. L., de la Cuesta, B., Qiu, M., Li, J., Gould, C. F., Heft-Neal, S., and Wara, M.: The contribution of wildfire to PM2.5 trends in the USA, Nature, 622, 761–766, https://doi.org/10.1038/s41586-023-06522-6, 2023.
Che, H., Zhang, X.-Y., Xia, X., Goloub, P., Holben, B., Zhao, H., Wang, Y., Zhang, X.-C., Wang, H., Blarel, L., Damiri, B., Zhang, R., Deng, X., Ma, Y., Wang, T., Geng, F., Qi, B., Zhu, J., Yu, J., Chen, Q., and Shi, G.: Ground-based aerosol climatology of China: aerosol optical depths from the China Aerosol Remote Sensing Network (CARSNET) 2002–2013, Atmos. Chem. Phys., 15, 7619–7652, https://doi.org/10.5194/acp-15-7619-2015, 2015.
Chen, X., Ding, J., Liu, J., Wang, J., Ge, X., Wang, R., and Zuo, H.: Validation and comparison of high-resolution MAIAC aerosol products over Central Asia, Atmos. Environ., 251, 118273, https://doi.org/10.1016/j.atmosenv.2021.118273, 2021.
Giles, D. M., Sinyuk, A., Sorokin, M. G., Schafer, J. S., Smirnov, A., Slutsker, I., Eck, T. F., Holben, B. N., Lewis, J. R., Campbell, J. R., Welton, E. J., Korkin, S. V., and Lyapustin, A. I.: Advancements in the Aerosol Robotic Network (AERONET) Version 3 database – automated near-real-time quality control algorithm with improved cloud screening for Sun photometer aerosol optical depth (AOD) measurements, Atmos. Meas. Tech., 12, 169–209, https://doi.org/10.5194/amt-12-169-2019, 2019.
Guo, B., Wang, Z., Pei, L., Zhu, X., Chen, Q., Wu, H., Zhang, W., and Zhang, D.: Reconstructing MODIS aerosol optical depth and exploring dynamic and influential factors of AOD via random forest at the global scale, Atmos. Environ., 315, 120159, https://doi.org/10.1016/j.atmosenv.2023.120159, 2023.
Guo, J., Deng, M., Lee, S. S., Wang, F., Li, Z., Zhai, P., Liu, H., Lv, W., Yao, W., and Li, X.: Delaying precipitation and lightning by air pollution over the Pearl River Delta. Part I: Observational analyses, J. Geophys. Res.-Atmos., 121, 6472–6488, https://doi.org/10.1002/2015JD023257, 2016.
Guo, J., Su, T., Chen, D., Wang, J., Li, Z., Lv, Y., Guo, X., Liu, H., Cribb, M., and Zhai, P.: Declining summertime local-scale precipitation frequency over China and the United States, 1981–2012: The disparate roles of aerosols, Geophys. Res. Lett., 46, 13281–13289. https://doi.org/10.1029/2019GL085442, 2019.
Hersbach, H., Bell, B., Berrisford, P., Hirahara, S., Horányi, A., Muñoz-Sabater, J., Nicolas, J., Peubey, C., Radu, R., Schepers, D., Simmons, A., Soci, C., Abdalla, S., Abellan, X., Balsamo, G., Bechtold, P., Biavati, G., Bidlot, J., Bonavita, M., Chiara, G., Dahlgren, P., Dee, D., Diamantakis, M., Dragani, R., Flemming, J., Forbes, R., Fuentes, M., Geer, A., Haimberger, L., Healy, S., Hogan, R. J., Hólm, E., Janisková, M., Keeley, S., Laloyaux, P., Lopez, P., Lupu, C., Radnoti, G., Rosnay, P., Rozum, I., Vamborg, F., Villaume, S., and Thépaut, J.: The ERA5 global reanalysis, Q. J. Roy. Meteor. Soc., 146, 1999–2049, https://doi.org/10.1002/qj.3803, 2020.
Huang, X., Song, Y., Yang, J., Wang, W., Ren, H., Dong, M., Feng, Y., Yin, H., and Li, J.: Toward accurate mapping of 30-m time-series global impervious surface area (GISA), Int. J. Appl. Earth Obs., 109, 102787, https://doi.org/10.1016/j.jag.2022.102787, 2022.
Jiang, J., Liu, J., Jiao, D., Zha, Y., and Cao, S.: Evaluation of MODIS DT, DB, and MAIAC Aerosol Products over Different Land Cover Types in the Yangtze River Delta of China, Remote Sens.-Basel, 15, 275, https://doi.org/10.3390/rs15010275, 2023.
Johnson, J. M. and Khoshgoftaar, T. M.: Survey on deep learning with class imbalance, J. Big Data, 6, 27, https://doi.org/10.1186/s40537-019-0192-5, 2019.
Li, K., Bai, K., Li, Z., Guo, J., and Chang, N.-B.: Synergistic data fusion of multimodal AOD and air quality data for near real-time full coverage air pollution assessment, J. Environ. Manage., 302, 114121, https://doi.org/10.1016/j.jenvman.2021.114121, 2022a.
Li, K., Bai, K., Ma, M., Guo, J., Li, Z., Wang, G., and Chang, N.-B.: Spatially gap free analysis of aerosol type grids in China: First retrieval via satellite remote sensing and big data analytics, ISPRS J. Photogramm., 193, 45–59, https://doi.org/10.1016/j.isprsjprs.2022.09.001, 2022b.
Li, K., Bai, K., Jiao, P., Sun, Y., Shao, L., Li, X., Liu, C., Ma, M., Qiu, S., Zheng, Z., Han, D., Li, R., Li, Z., Guo, J., Chang, N.: SCAGAT: A scene-aware ensemble learning graph attention network for global PM2.5 pollution mapping, in preparation, 2024.
Li, L., Franklin, M., Girguis, M., Lurmann, F., Wu, J., Pavlovic, N., Breton, C., Gilliland, F., and Habre, R.: Spatiotemporal imputation of MAIAC AOD using deep learning with downscaling, Remote Sens. Environ., 237, 111584, https://doi.org/10.1016/j.rse.2019.111584, 2020.
Li, Z., Guo, J., Ding, A., Liao, H., Liu, J., Sun, Y., Wang, T., Xue, H., Zhang, H., and Zhu, B.: Aerosol and boundary-layer interactions and impact on air quality, Natl. Sci. Rev., 4, 810–833, https://doi.org/10.1093/nsr/nwx117, 2017.
Li, Z., Wang, Y., Guo, J., Zhao, C., Cribb, M. C., Dong, X., Fan, J., Gong, D., Huang, J., Jiang, M., Jiang, Y., Lee, S. S., Li, H., Li, J., Liu, J., Qian, Y., Rosenfeld, D., Shan, S., Sun, Y., Wang, H., Xin, J., Yan, X., Yang, X., Yang, X., Zhang, F., and Zheng, Y.: East Asian Study of Tropospheric Aerosols and their Impact on Regional Clouds, Precipitation, and Climate (EAST-AIRCPC), J. Geophys. Res.-Atmos., 124, 13026–13054, https://doi.org/10.1029/2019JD030758, 2019.
Li, Z. Q., Xu, H., Li, K. T., Li, D. H., Xie, Y. S., Li, L., Zhang, Y., Gu, X. F., Zhao, W., Tian, Q. J., Deng, R. R., Su, X. L., Huang, B., Qiao, Y. L., Cui, W. Y., Hu, Y., Gong, C. L., Wang, Y. Q., Wang, X. F., Wang, J. P., Du, W. B., Pan, Z. Q., Li, Z. Z., and Bu, D.: Comprehensive study of optical, physical, chemical, and radiative properties of total columnar atmospheric aerosols over China: An overview of sun–Sky radiometer observation network (SONET) measurements, B. Am. Meteorol. Soc., 99, 739–755, https://doi.org/10.1175/BAMS-D-17-0133.1, 2018.
Liang, F., Xiao, Q., Huang, K., Yang, X., Liu, F., Li, J., Lu, X., Liu, Y., and Gu, D.: The 17-y spatiotemporal trend of PM2.5 and its mortality burden in China, P. Natl. Acad. Sci. USA, 117, 25601–25608, https://doi.org/10.1073/pnas.1919641117, 2020.
Liu, J., Ren, C., Huang, X., Nie, W., Wang, J., Sun, P., Chi, X., and Ding, A.: Increased Aerosol Extinction Efficiency Hinders Visibility Improvement in Eastern China, Geophys. Res. Lett., 47, e2020GL090167, https://doi.org/10.1029/2020GL090167, 2020.
Liu, N., Zou, B., Feng, H., Wang, W., Tang, Y., and Liang, Y.: Evaluation and comparison of multiangle implementation of the atmospheric correction algorithm, Dark Target, and Deep Blue aerosol products over China, Atmos. Chem. Phys., 19, 8243–8268, https://doi.org/10.5194/acp-19-8243-2019, 2019.
Liu, X. and Wang, M.: Filling the gaps of missing data in the merged VIIRS SNPP/NOAA-20 ocean color product using the DINEOF method, Remote Sens., 11, 178, https://doi.org/10.3390/rs11020178, 2019.
Lyapustin, A., Wang, Y., Laszlo, I., Kahn, R., Korkin, S., Remer, L., Levy, R., and Reid, J. S.: Multiangle implementation of atmospheric correction (MAIAC): 2. Aerosol algorithm, J. Geophys. Res.-Atmos., 116, 1–15, https://doi.org/10.1029/2010JD014986, 2011.
Lyapustin, A., Wang, Y., Korkin, S., and Huang, D.: MODIS Collection 6 MAIAC algorithm, Atmos. Meas. Tech., 11, 5741–5765, https://doi.org/10.5194/amt-11-5741-2018, 2018.
Ma, Z., Liu, Y., Zhao, Q., Liu, M., Zhou, Y., and Bi, J.: Satellite-derived high resolution PM2.5 concentrations in Yangtze River Delta Region of China using improved linear mixed effects model, Atmos. Environ., 133, 156–164, https://doi.org/10.1016/j.atmosenv.2016.03.040, 2016.
Martins, V. S., Lyapustin, A., Carvalho, L. A. S., Barbosa, C. C. F., and Novo, E. M. L. M.: Validation of high-resolution MAIAC aerosol product over South America, J. Geophys. Res.-Atmos., 122, 7537–7559, https://doi.org/10.1002/2016JD026301, 2017.
Mhawish, A., Banerjee, T., Sorek-Hamer, M., Lyapustin, A., Broday, D. M., and Chatfield, R.: Comparison and evaluation of MODIS Multi-angle Implementation of Atmospheric Correction (MAIAC) aerosol product over South Asia, Remote Sens. Environ., 224, 12–28, https://doi.org/10.1016/j.rse.2019.01.033, 2019.
Qin, W., Fang, H., Wang, L., Wei, J., Zhang, M., Su, X., Bilal, M., and Liang, X.: MODIS high-resolution MAIAC aerosol product: Global validation and analysis, Atmos. Environ., 264, 118684, https://doi.org/10.1016/j.atmosenv.2021.118684, 2021.
Randles, C. A., da Silva, A. M., Buchard, V., Colarco, P. R., Darmenov, A., Govindaraju, R., Smirnov, A., Holben, B., Ferrare, R., Hair, J., Shinozuka, Y., and Flynn, C. J.: The MERRA-2 Aerosol Reanalysis, 1980 Onward. Part I: System Description and Data Assimilation Evaluation, J. Climate, 30, 6823–6850, https://doi.org/10.1175/JCLI-D-16-0609.1, 2017.
Shannon, C. E.: A Mathematical Theory of Communication, Bell Syst. Tech. J., 27, 379–423, 1948.
Shi, H., Zhang, Y., Chen, Y., Ji, S., Dong, Y.: Resampling algorithms based on sample concatenation for imbalance learning, Knowl.-Based Syst., 245, 108592, https://doi.org/10.1016/j.knosys.2022.108592, 2022.
Sogacheva, L., Popp, T., Sayer, A. M., Dubovik, O., Garay, M. J., Heckel, A., Hsu, N. C., Jethva, H., Kahn, R. A., Kolmonen, P., Kosmale, M., de Leeuw, G., Levy, R. C., Litvinov, P., Lyapustin, A., North, P., Torres, O., and Arola, A.: Merging regional and global aerosol optical depth records from major available satellite products, Atmos. Chem. Phys., 20, 2031–2056, https://doi.org/10.5194/acp-20-2031-2020, 2020.
Tang, Q., Bo, Y., and Zhu, Y.: Spatiotemporal fusion of multiple-satellite aerosol optical depth (AOD) products using Bayesian maximum entropy method, J. Geophys. Res.-Atmos., 121, 4034–4048, https://doi.org/10.1002/2015JD024571, 2016.
Up in the aerosol, Nat. Geosci., 15, 157, https://doi.org/10.1038/s41561-022-00915-4, 2022.
Wang, Y. W. and Yang, Y. H.: China's dimming and brightening: evidence, causes and hydrological implications, Ann. Geophys., 32, 41–55, https://doi.org/10.5194/angeo-32-41-2014, 2014.
Wei, J., Li, Z., Lyapustin, A., Sun, L., Peng, Y., Xue, W., Su, T., and Cribb, M.: Reconstructing 1-km-resolution high-quality PM2.5 data records from 2000 to 2018 in China: spatiotemporal variations and policy implications, Remote Sens. Environ., 252, 112136, https://doi.org/10.1016/j.rse.2020.112136, 2021.
Wei, X., Chang, N.-B., Bai, K., and Gao, W.: Satellite remote sensing of aerosol optical depth: advances, challenges, and perspectives, Crit. Rev. Env. Sci. Tec., 50, 1640–1725, https://doi.org/10.1080/10643389.2019.1665944, 2020.
Wei, X., Bai, K., Chang, N.-B., and Gao, W.: Multisource hierarchical data fusion for high-resolution AOD mapping in a forest fire event, International J. Appl. Earth Obs. Geoinf., 102, 102366, https://doi.org/10.1016/j.jag.2021.102366, 2021.
WHO: Ambient air pollution, https://www.who.int/news-room/fact-sheets/detail/ambient-(outdoor)-air-quality-and-health (last access: 3 April 2024), 2022.
Wild, M., Wacker, S., Yang, S., and Sanchez-Lorenzo, A.: Evidence for Clear-Sky Dimming and Brightening in Central Europe, Geophys. Res. Lett., 48, e2020GL092216, https://doi.org/10.1029/2020GL092216, 2021.
Xiao, Q., Wang, Y., Chang, H. H., Meng, X., Geng, G., Lyapustin, A., and Liu, Y.: Full-coverage high-resolution daily PM2.5 estimation using MAIAC AOD in the Yangtze River Delta of China, Remote Sens. Environ., 199, 437–446, https://doi.org/10.1016/j.rse.2017.07.023, 2017.
Xiao, Q., Geng, G., Cheng, J., Liang, F., Li, R., Meng, X., Xue, T., Huang, X., Kan, H., Zhang, Q., and He, K.: Evaluation of gap-filling approaches in satellite-based daily PM2.5 prediction models, Atmos. Environ., 244, 117921, https://doi.org/10.1016/j.atmosenv.2020.117921, 2021.
Xu, H., Guang, J., Xue, Y., de Leeuw, G., Che, Y. H., Guo, J., He, X. W., and Wang, T. K.: A consistent aerosol optical depth (AOD) dataset over mainland China by integration of several AOD products, Atmos. Environ., 114, 48–56, https://doi.org/10.1016/j.atmosenv.2015.05.023, 2015.
Yang, X., Zhao, C., Zhou, L., Wang, Y., and Liu, X.: Distinct impact of different types of aerosols on surface solar radiation in China, J. Geophys. Res.-Atmos., 121, 6459–6471, https://doi.org/10.1002/2016JD024938, 2016.
Yang, Y., Ren, L., Li, H., Wang, H., Wang, P., Chen, L., Yue, X., and Liao, H.: Fast Climate Responses to Aerosol Emission Reductions During the COVID-19 Pandemic, Geophys. Res. Lett., 47, e2020GL089788, https://doi.org/10.1029/2020GL089788, 2020.
Zhang, Q., Zheng, Y., Tong, D., Shao, M., Wang, S., Zhang, Y., Xu, X., Wang, J., He, H., Liu, W., Ding, Y., Lei, Y., Li, J., Wang, Z., Zhang, X., Wang, Y., Cheng, J., Liu, Y., Shi, Q., Yan, L., Geng, G., Hong, C., Li, M., Liu, F., Zheng, B., Cao, J., Ding, A., Gao, J., Fu, Q., Huo, J., Liu, B., Liu, Z., Yang, F., He, K., and Hao, J.: Drivers of improved PM2.5 air quality in China from 2013 to 2017, P. Natl. Acad. Sci. USA, 116, 24463–24469, https://doi.org/10.1073/pnas.1907956116, 2019.
Zhang, T., Zhou, Y., Zhao, K., Zhu, Z., Asrar, G. R., and Zhao, X.: Gap-filling MODIS daily aerosol optical depth products by developing a spatiotemporal fitting algorithm, Geosci. Remote Sens., 59, 762–781, https://doi.org/10.1080/15481603.2022.2060596, 2022.
Zhao, C., Yang, Y., Fan, H., Huang, J., Fu, Y., Zhang, X., Kang, S., Cong, Z., Letu, H., and Menenti, M.: Aerosol characteristics and impacts on weather and climate over the Tibetan Plateau, Natl. Sci. Rev., 7, 492–495, https://doi.org/10.1093/nsr/nwz184, 2020.