the Creative Commons Attribution 4.0 License.
the Creative Commons Attribution 4.0 License.
 | 04 Apr 2024
The physical and biogeochemical parameters along the coastal waters of Saudi Arabia during field surveys in summer, 2021
Yasser O. Abualnaja
James H. Churchill
Ioannis Hatzianestis
Dimitris Velaoras
Harilaos Kontoyiannis
Vassilis P. Papadopoulos
Aristomenis P. Karageorgis
Georgia Assimakopoulou
Helen Kaberi
Theodoros Kannelopoulos
Constantine Parinos
Christina Zeri
Dionysios Ballas
Elli Pitta
Vassiliki Paraskevopoulou
Afroditi Androni
Styliani Chourdaki
Vassileia Fioraki
Stylianos Iliakis
Georgia Kabouri
Angeliki Konstantinopoulou
Georgios Krokos
Dimitra Papageorgiou
Alkiviadis Papageorgiou
Georgios Pappas
Elvira Plakidi
Eleni Rousselaki
Ioanna Stavrakaki
Eleni Tzempelikou
Panagiota Zachioti
Anthi Yfanti
Theodore Zoulias
Abdulah Al Amoudi
Yasser Alshehri
Ahmad Alharbi
Hammad Al Sulami
Taha Boksmati
Rayan Mutwalli
Ibrahim Hoteit
During the last decades, the coastal areas of the Kingdom of Saudi Arabia, on the Red Sea and the Arabian Gulf, have been subjected to intense economic and industrial growth. As a result, it may be expected that the overall environmental status of Saudi Arabian coastal marine waters has been affected by human activities. As a consequence, adequate management of the Saudi Arabian coastal zone requires an assessment of how the various pressures within this zone impact the quality of seawater and sediments. To this end, environmental surveys were conducted over 15 hotspot areas (areas subject to environmental pressures) in the Saudi Arabian coastal zone of the Red Sea and over three hotspot areas in the Saudi Arabian waters of the Arabian Gulf. The survey in the Red Sea, conducted in June/July 2021, acquired measurements from hotspot areas spanning most of the Saudi coastline, extending from near the Saudi–Jordanian border in the north to Al Shuqaiq and Jizan Economic City (close to the Saudi–Yemen border) in the south. The survey in the Arabian Gulf, carried out in September 2021, included the areas of Al Khobar, Dammam and Ras Al Khair. The main objective of both cruises was to record the physical and biogeochemical parameters along the coastal waters of the kingdom, tracing the dispersion of contaminants related to specific pressures. Taken together, these cruises constitute the first multidisciplinary and geographically comprehensive study of contaminants within the Saudi Arabian coastal waters and sediments. The measurements acquired revealed the influence of various anthropogenic pressures on the coastal marine environment of Saudi Arabia and also highlighted a strong influence of hydrographic conditions on the distribution of biochemical properties in the Red Sea and the Arabian Gulf. The data can be accessed at SEANOE https://doi.org/10.17882/96463 (Abualnaja et al., 2023), whereas the details of the sampling stations are available at https://mcep.kaust.edu.sa/cruise-postings (last access: 25 March 2024). The dataset includes the parameters shown in Tables 1a, b and 2a.
- Article
(11305 KB) - Full-text XML
-
Supplement
(322 KB) - BibTeX
- EndNote


The Red Sea and the Arabian (Persian) Gulf are water bodies of importance to the Middle East and North Africa (MENA) region, particularly to the Kingdom of Saudi Arabia, which has coastlines on both water bodies.
An elongated, marginal oceanic basin, the Red Sea is bordered by northeastern Africa and the Arabian Peninsula. Spanning almost 20° in latitude, the Red Sea is more than 2200 km long and is roughly 200 km wide on average. The bathymetry of the Red Sea is characterized by a deep axial trench, exceeding 3000 m in depth, bordered by shallow (100–200 m) and broad coastal shelf platforms that cover more than 40 % of the basin (Rasul et al., 2015). The shallow coastal areas are particularly wide in the southern Red Sea, where they take the form of extended shallow banks riddled with coral reef complexes. The coastal areas in the north are narrower than those to the south and reach depths of more than 200 m. The shallow Gulf of Suez and the deeper and narrower Gulf of Aqaba are the natural extensions of the Red Sea to the north. The Red Sea communicates with the Mediterranean Sea through the Suez Canal in the Gulf of Suez; however, this water exchange is practically negligible, and the Red Sea relies on the Indian Ocean for its water renewal through the Bab-el-Mandeb Strait at its southernmost edge. In climatic terms, the Red Sea is divided into two distinct parts: the southern part, which is affected by the Arabian Sea monsoon, and the northern part, where a seasonal cycle of warm and cold periods prevails (Abualnaja et al., 2015; Viswanadhapalli et al., 2017). The elongated shape of the basin, the water exchange with the Gulf of Aden (Indian Ocean) and local atmospheric forcing regulate the water properties and general circulation of the Red Sea. Relatively fresh seawater enters the basin at its southern end, counterbalancing the water deficit produced by excessive evaporation coupled with negligible precipitation and terrestrial runoff. This fresher water from the south, with typical salinity values of 36–37.5, travels northwards through a complicated near-surface circulation (Sofianos and Johns, 2003, 2015; Yao et al., 2014; Zhan et al., 2014). The general northward surface circulation, which becomes stronger in winter, includes northward currents that flow near the east coast of the Red Sea and have been described previously as the Eastern Boundary Current (Sofianos and Jones, 2003). This boundary current affects all coastal regions, creating small eddies and bifurcating currents along natural barriers in the shallow areas near the coasts. During winter, the already hypersaline water in the Gulf of Aqaba and Gulf of Suez, along with the northern part of the Red Sea, cools and sinks to the intermediate and deep layers of the water column, depending on its density (e.g., Sofianos and Johns, 2003, 2015; Papadopoulos et al., 2013, 2015; Zhai et al., 2015; Yao and Hoteit, 2018; Asfahani et al., 2020). It must be mentioned that throughout most of the extent of the Red Sea the tidal component of the flow has a minor contribution on the total large-scale flow in the offshore areas, as well as the near-coast ones (Churchill et al., 2014a; Pugh et al., 2019). The barotropic tidal flows are larger (up to ∼30–50 cm s−1) near the area of the southern end of the Red Sea at the Bab-el-Mandeb Strait and also in the shallow Gulf of Suez (Guo et al., 2018).
Figure 1Station maps. (a) Sampling areas within the coastal zone of the Red Sea. A number of sampling stations were located in each area, as shown in Table 1. (b) Sampling areas in the Arabian Gulf. Detailed station grids for each area are shown in Fig. 1b-1, b-2 and b-3. Data for the bathymetry were used from GEBCO Compilation Group (2020).
Within the Saudi Arabian coastal zone of the Red Sea, the main drivers of pollution include maritime transport; fisheries; aquaculture; oil, gas, and energy infrastructures; coastal industry; coastal and maritime tourism; municipal and industrial discharge; and urban development (Schröder et al., 2021).
In contrast to the Red Sea, the Arabian Gulf is a shallow plateau with relatively smooth bottom topography, especially in its northern and western parts. It is a semi-enclosed oceanic basin that extends between the eastern part of the Arabian Peninsula and the mountainous coastline of Iran. The gulf exchanges water with the Gulf of Oman (Indian Ocean) through the Strait of Hormuz at its south-eastern edge. The mean depth of the Arabian Gulf is 35 m, with its maximum depth of 120 m found close to the Strait of Hormuz. The physical properties of Arabian Gulf water are regulated by the water exchange with the Indian Ocean and the high evaporation rate. It can be considered an idiosyncratic seawater basin, strongly influenced by its surrounding arid-to-hyper-arid areas. It is highly affected by dust storms, which transport large amounts of material and nutrients that influence the local ecosystems (Gherboudj and Ghedira, 2014). The gulf receives a small annual amount of precipitation, around 15 cm yr−1 (Reynolds, 1993), and a river discharge estimated at 18 cm yr−1 (Sheppard et al., 1992). However, damming of the major rivers in the region has resulted in substantial reductions in freshwater discharge (Sheppard et al., 2010). Evaporation is very high throughout the gulf, especially over the western part, and reaches approximately 200 cm yr−1, resulting in unusually high salinities compared to the open ocean (Johns et al., 2003). The Arabian Gulf features some of the highest temperatures and salinities observed in any marine water body worldwide (Sheppard et al., 2010). It is noteworthy that the maximum salinities within the gulf exceed 45 and are found along the Saudi Arabian, Bahraini and Qatari coastal areas. Regarding the tidal regime of the areas studied in the Arabian Gulf in the frame of this work, the tidal amplitude ranges between 0.5 and 1 m (Neelamani et al., 2021).
The current environmental status of the Arabian Gulf is changing and is increasingly impacted by numerous adverse anthropogenic factors (Al Azhar et al., 2016). Notable among these factors is activity associated with the petroleum industry (Jones et al., 2008). More than 50 % of the world's oil and natural gas reserves are located within the gulf. Other factors include desalination, reduced discharge from the two major rivers of the Tigris and the Euphrates (due to damming for the increased water demands), urbanization, and rapid industrial and residential development. The combination of these factors has substantially altered the environmental status of the Arabian Gulf, especially along the Saudi coast (Vaughan et al., 2019), and these have resulted in the Arabian Gulf being classified among the highest anthropogenically impacted regions in the world (Naser, 2013, 2014, 2015; Schröder et al., 2021).
Despite the economic and environmental importance of the Red Sea and Arabian Gulf to the MENA region, as well as the potential impact of anthropogenic activities on these water bodies, the quality of the marine environment of the Red Sea and the Arabian Gulf has not been extensively studied. Those studies that have been directed at the quality of the Saudi Arabian marine environment have largely been locally focused, e.g., on the marine area near Jeddah and the Jeddah lagoons. A number of studies have focused on trace metals (Al Farawati et al., 2011; Youssef, 2015; Brima and AlBishri, 2017; Al Mur et al., 2017; Ali et al., 2017; Fallatah et al., 2018; Al Mur 2020; Mannaa et al., 2021; Halawani et al., 2022; El Zokm et al., 2022) and/or organic pollutants (PAHs, polycyclic aromatic hydrocarbons) (El Maradny et al., 2023). Very few studies, also related mainly to metals and organic contaminants, are limited to local marine environments such as Al Lith (Abu-Zied and Hariri, 2016; Bantan et al., 2020), Yanbu (El Sorogy et al., 2023), and Jizan (Kahal et al., 2020). The sporadic and geographically confined nature of contaminant measurements acquired in the Red Sea highlight the importance of the dataset obtained in this work, since it extends along the whole Saudi Arabian coastline of the Red Sea.
Similarly, a few studies of contaminants have been conducted in the Saudi Arabian waters of the Arabian Gulf. These deal mainly with metals and petroleum (Freije, 2015; Alharbi et al., 2017; Al Kahtany et al., 2018; El Sorogy et al., 2018; Alharbi and El Sorogy, 2019, 2017; Paparella et al., 2022; Amin and Almahasheer, 2022; Alharbi et al., 2022; Alzahrani et al. 2023; Al-Kahtany et al., 2023; Sohaib et al., 2023).
Table 1List of sampling sites of the AEGAEO cruise in the Red Sea as seen in the National Center for Environmental Compliance (NCEC) database (https://mcep.kaust.edu.sa/cruise-postings, last access: 25 March 2024); list of sampling stations with location, depth and date (conductivity–temperature–depth (CTD) data have been measured at all stations).
Table 2A list of the acoustic Doppler current profiler (ADCP) measurements.
Table 3List of biogeochemical parameters in the water column of the Red Sea cruise in June 2021 with R/V AEGAEO as seen in the NCEC database. DO: dissolved oxygen; BOD: biochemical oxygen demand; TOC: total organic carbon; SPM: suspended particulate matter; TPH: total petroleum hydrocarbon.
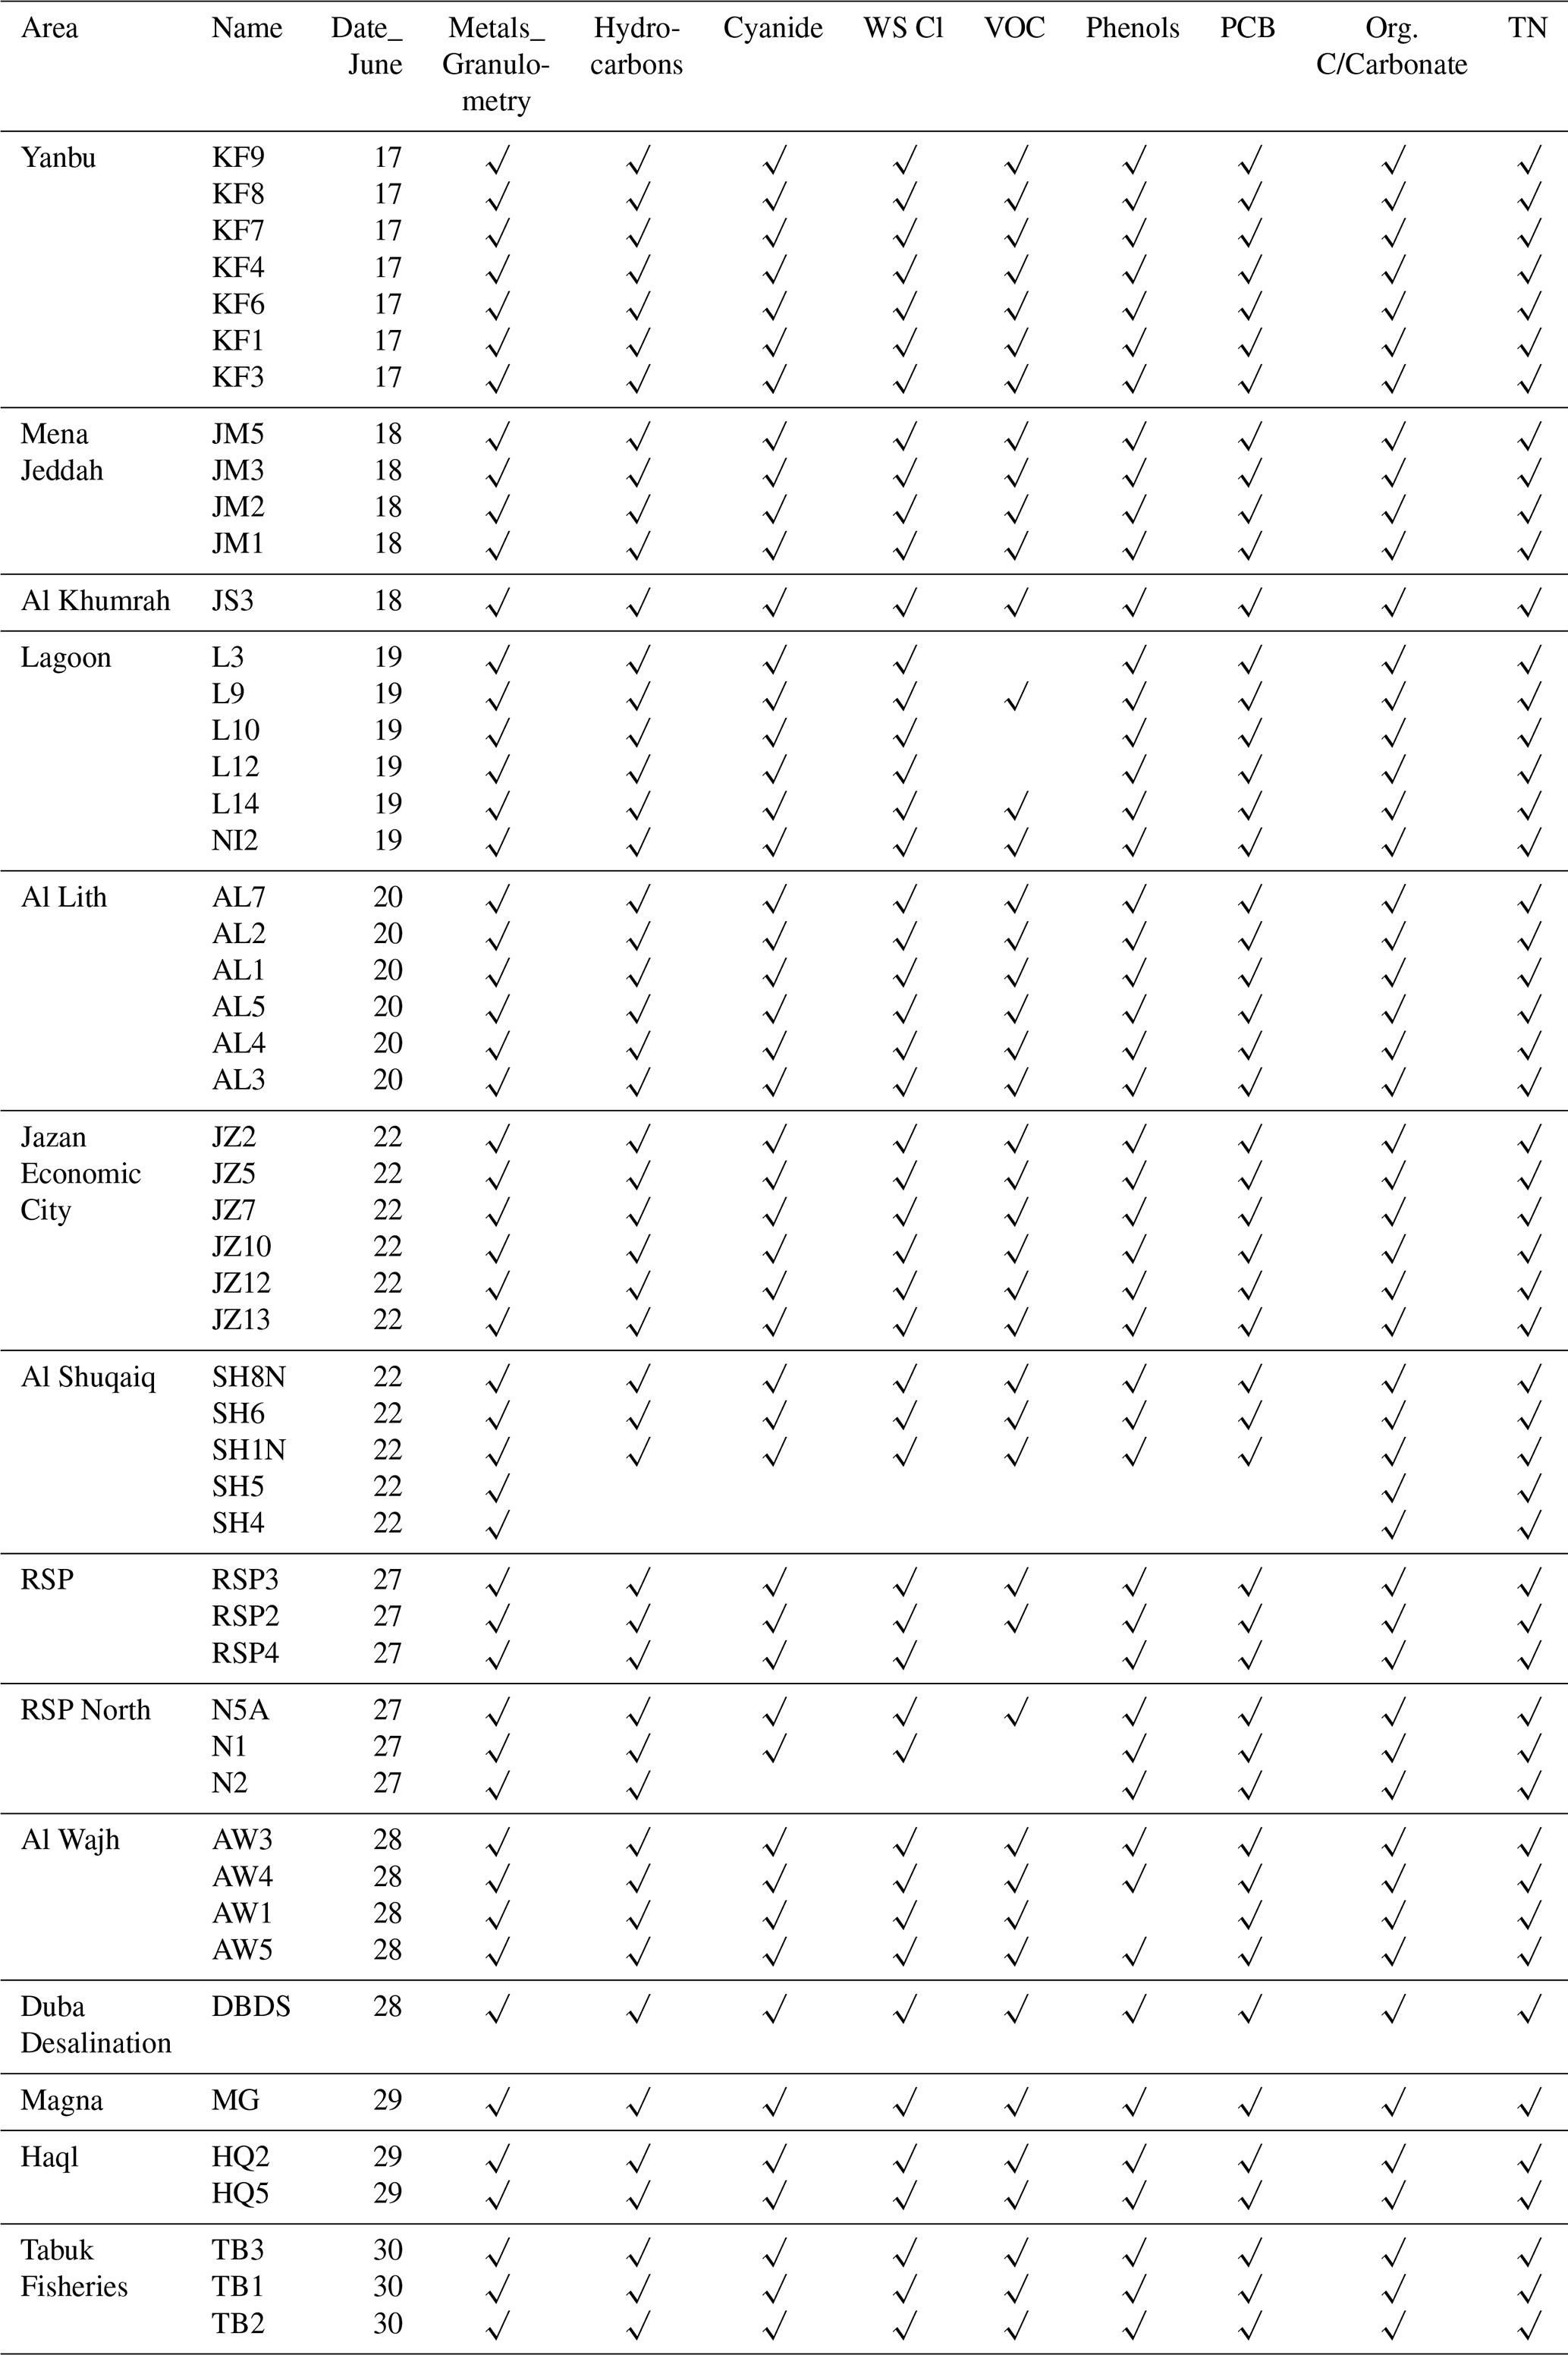
Table 4List of sediment parameters from the cruise in the Red Sea in June 2021 with R/V AEGAEO as seen in the NCEC database. WS Cl: water-soluble chloride; VOC: volatile organic compound; PCB: polychlorinated biphenyl; TN: total nitrogen.
As part of the Vision 2030 roadmap for economic growth and development in the Kingdom of Saudi Arabia, the Marine and Coastal Environment Protection (MCEP) Initiative for Saudi Arabia was established (https://mcep.kaust.edu.sa/, last access: 25 March 2024). The objective of this project, a collaboration between the National Center for Environmental Compliance (NCEC) and King Abdullah University of Science and Technology (KAUST), was to provide a national status quo assessment to set priorities for protection of the kingdom's coastal environment. The project was divided into seven tiered tasks (https://mcep.kaust.edu.sa/, last access: 25 March 2024). Guided by the findings of Task 4, Hotspot Analysis, KAUST's partner – the Hellenic Centre for Marine Research (HCMR) – undertook field surveillance at a number of sites in the Red Sea and Arabian Gulf. The sites were selected in consultation with the NCEC on the basis of the findings from Task 4 (https://mcep.kaust.edu.sa/, last access: 25 March 2024) (Schröder et al., 2021). The field surveillance, Task 6, was designed to trace the discrete sources of pollution in critical hotspot areas. These sources include wastewater treatment plants, desalination plants, ports, industry, petroleum platforms, aquaculture facilities (floating cages and onshore operations) and urban development. A variety of hydrographic and chemical properties in the water column and sediment were measured in each area.
Here, we present physical and biochemical measurements obtained during the two surveillance cruises, conducted in June and September 2021. Together, these cruises constitute the first multidisciplinary and geographically comprehensive survey of contaminants in the Saudi Arabian coastal zone. Here, these data are used to describe hydrographic conditions and the spatial variability of biochemical variables in the Red Sea and the Arabian Gulf. In addition, the baseline values for various pollutants (chlorophyll-a (Chl-a), nutrients, and rarely measured essential oceanographic variables, such as dissolved organic carbon) are presented along with their spatial distributions.
The survey in the Red Sea was carried out from the R/V AEGAEO of the HCMR from 9 June to 6 July 2021, whereas the survey in the Arabian Gulf was carried out using small fishing boats from 17 to 22 September 2021. The cruise in the Red Sea was conducted over a north–south coastal transect from the area located in the northern part of the Gulf of Aqaba close to the Saudi Arabia–Jordan border (Hagl) to the Jizan Economic City area located in the southern region of the Red Sea (Fig. 1a). The hotspot areas surveyed, from north to south, were an area near the Saudi–Jordanian border (Phosphate Terminal in the Port of Aqaba in Jordan, cross-border pollution) and Haql (desalination, power and sewage-treatment plants, port activities), Magna (maritime traffic), Tabuk Fisheries (aquaculture activities), Duba (desalination plant), Al Wajh (port facilities, desalination plant), Red Sea Project Lagoon (north and west channels), Yanbu Cement Company (industrial discharge), King Fahad Industrial Port Yanbu (industrial and shipping center –, the largest in Saudi Arabia on the basis of oil and overall cargo volume; Schröder et al., 2021), Jeddah Lagoon system (wastewater inputs), Jeddah Mena (port operations), Al Khurmah (wastewater treatment plant), Al Lith (shrimp and fish farms), Al-Shuqaiq (desalination plant), and Jazan Economic City (expanding industrial facility). During the cruise, measurements of hydrographic and biochemical variables were acquired with traditional techniques (i.e., use of a CTD with companion sensors, acoustic Doppler current profiler (ADCP) and collection of water samples). The sampling strategy was aimed at resolving the dispersion of contaminants related to environmental pressures impacting each area. For example, when sampling near desalination and wastewater treatment facilities, we first conducted a CTD survey, acquiring data on temperature, salinity, dissolved oxygen (DO) and turbidity to identify the signal of the discharge from these facilities. Subsequently, water and sediment samples were obtained within the discharge signal suggested by the CTD data and at a point distant from the signal (reference site). Samples of water and sediment, as well as CTD data, were acquired from both R/V AEGAEO and AEGAEO's support vessel (tender). At deeper (>10 m) stations, water samples and vertical CTD profiles were acquired using AEGAEO's rosette sampling system, which consists of a CTD profiler with twelve 12 L Niskin bottles. Sediment samples at the deeper stations were acquired with the ship's box corer. At shallower stations, the sampling was carried out using the tender. At these shallower stations, sediment samples were acquired with a small grab sampler, and water samples were taken using a single Niskin bottle lowered from the tender. Water samples were taken at discrete depths, such as surface, 10 m, 20 m and near the bottom (roughly 0.5 m from the seabed), as well as from depths of particular interest (e.g., where effluent plumes were identified) if they did not match with the discrete depths.
The shipboard CTD system included a sensor suite for acquiring in situ data of salinity, temperature, DO, pH, specific conductivity, total dissolved solids, turbidity, Chl-a and total suspended matter. Onboard analysis was performed on the water samples for ammonium, DO, biological oxygen demand (BOD), sulfides, fluoride and total chlorine. The water samples were also subjected to onboard particle filtration and extraction of organic compounds.
The surveillance cruise in the Arabian Gulf covered the critical hotspot areas predefined by Schröder et al. (2021). Three main areas were sampled: Al Khobar, Dammam and Ras Al Khair. Unfortunately, rough sea conditions prevented surveying more areas, particularly in the northern part of the Saudi Arabian waters. These will hopefully be surveyed in future field surveillance work. The sampling entailed measurements of seawater properties using a portable CTD unit and the collection of seawater and sediment samples from which various types of contaminants and other properties were measured. Altogether, CTD data, as well as seawater and sediment samples, were obtained from 14 coastal stations (Fig. 1b). Similar to the Red Sea surveillance, the sampling strategy was aimed at resolving the dispersion of contaminants related to environmental pressures impacting each survey area. Sediment samples were acquired with a small grab sampler, and water samples were taken by individual Niskin bottles lowered from the boat. Water samples were taken at discrete depths: surface, 10 m and near the bottom (roughly 0.5 m from the seabed). The portable CTD data included in situ measurements of temperature, conductivity and turbidity. On-board chemical analyses were not performed, these were not possible on the small boat employed. Nevertheless, all samples were treated and were subjected to extraction of organic compounds onboard immediately after collection. The water samples were subjected to particle and Chl-a filtration at the ALS Arabia laboratories
Data coverage and parameters measured
Coverage: 17–29° N and 34–42° E
Location name: Red Sea
Date start: 9 June 2021
Date end: 6 July 2021
A link to the summary page of the Red Sea cruise can be found in the NCEC database under https://mcep.kaust.edu.sa/cruise-postings (last access: 25 March 2024).
Coverage: 26–27° N and 49–50° E
Location name: Arabian Gulf
Date start: 17 September 2021
Date end: 22 September 2021
Table 5List of sampling sites from the cruise in the Arabian Gulf in September 2021 with location, depth, date and sampling information (CTD data have been measured at all stations).
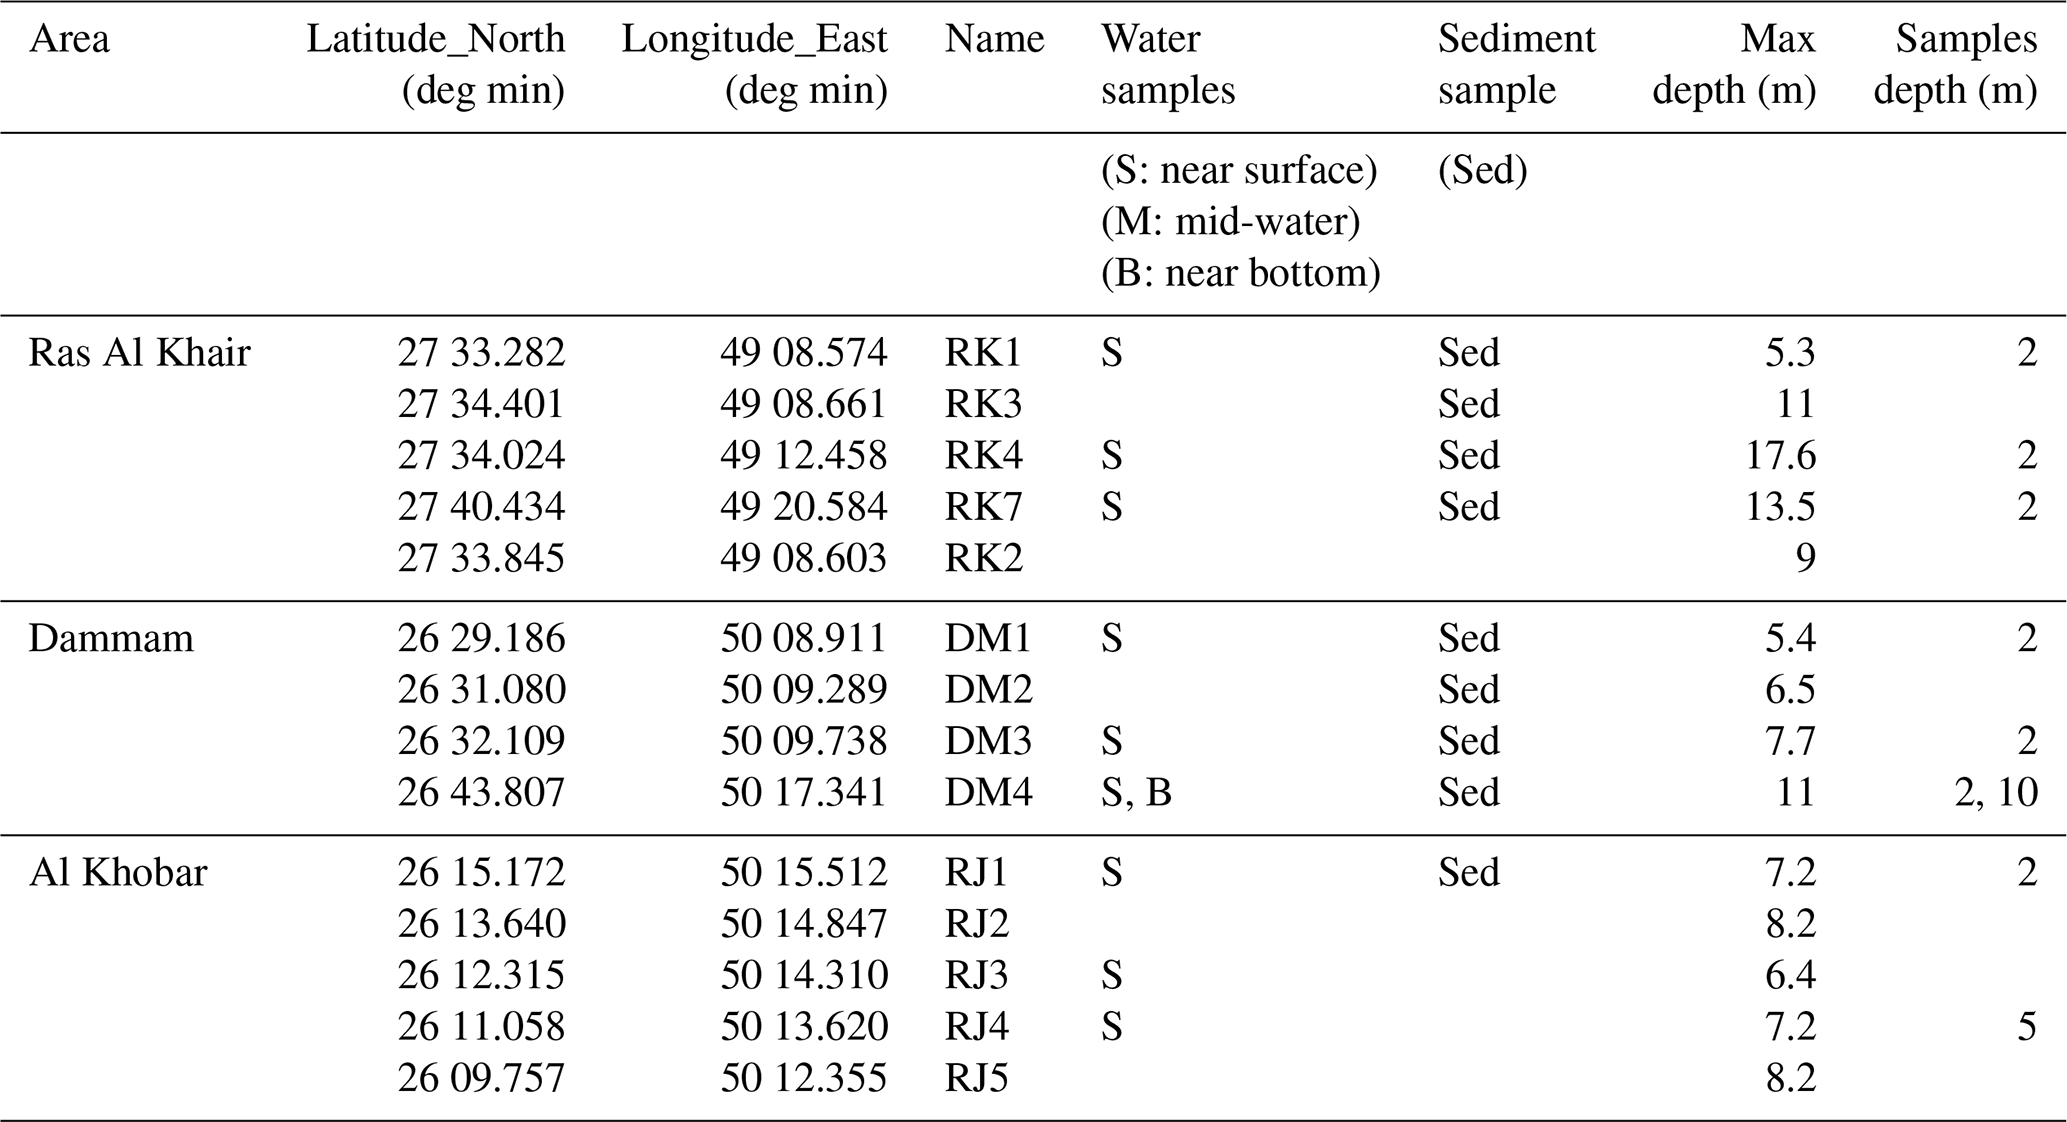
Table 6List of biogeochemical parameters in the water column (sampling depth) from the cruise in the Arabian Gulf in September 2021.
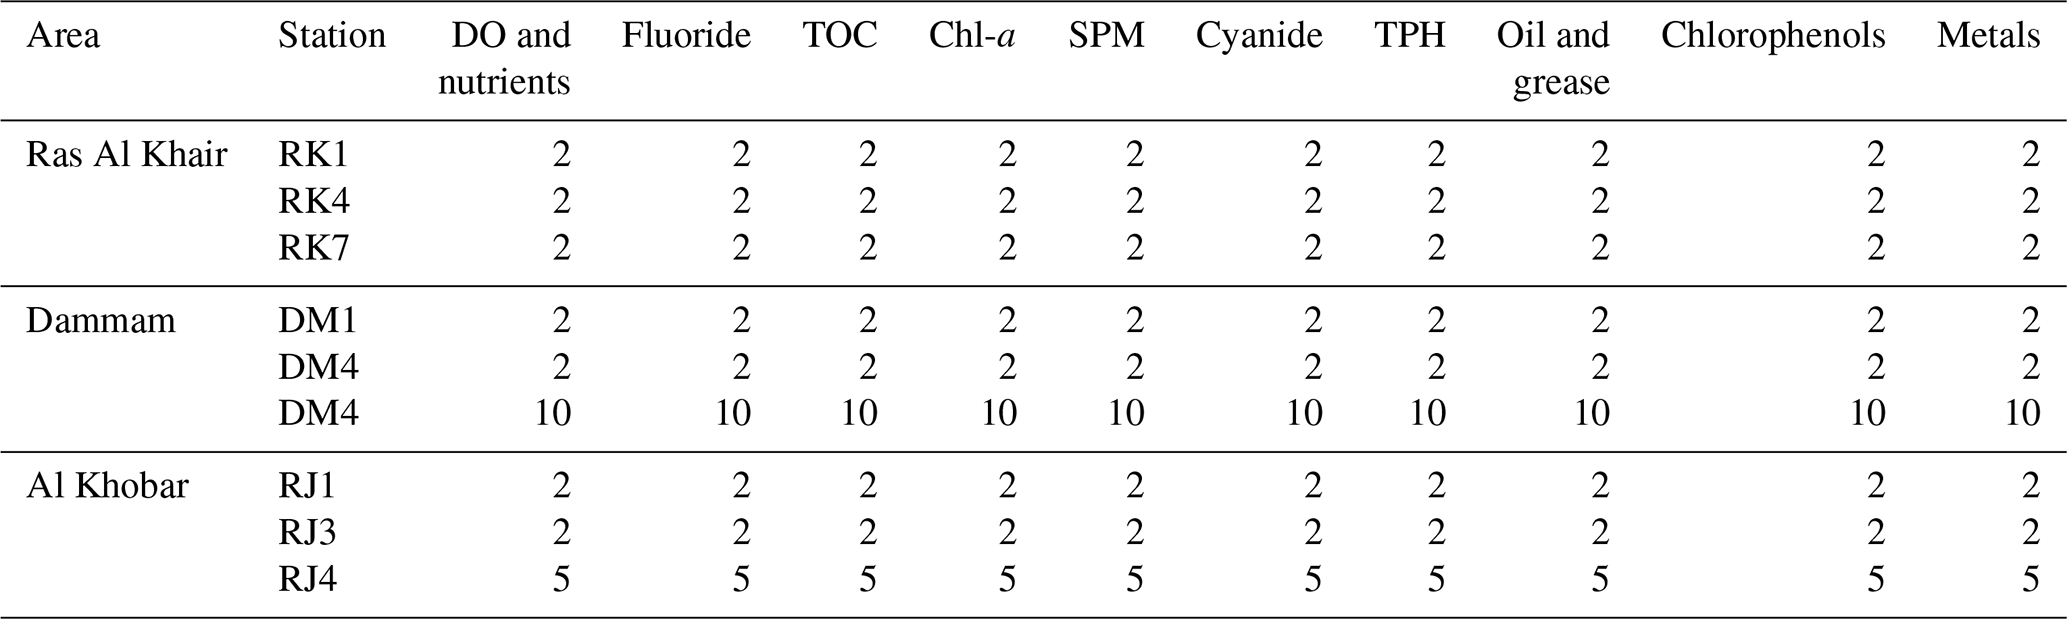
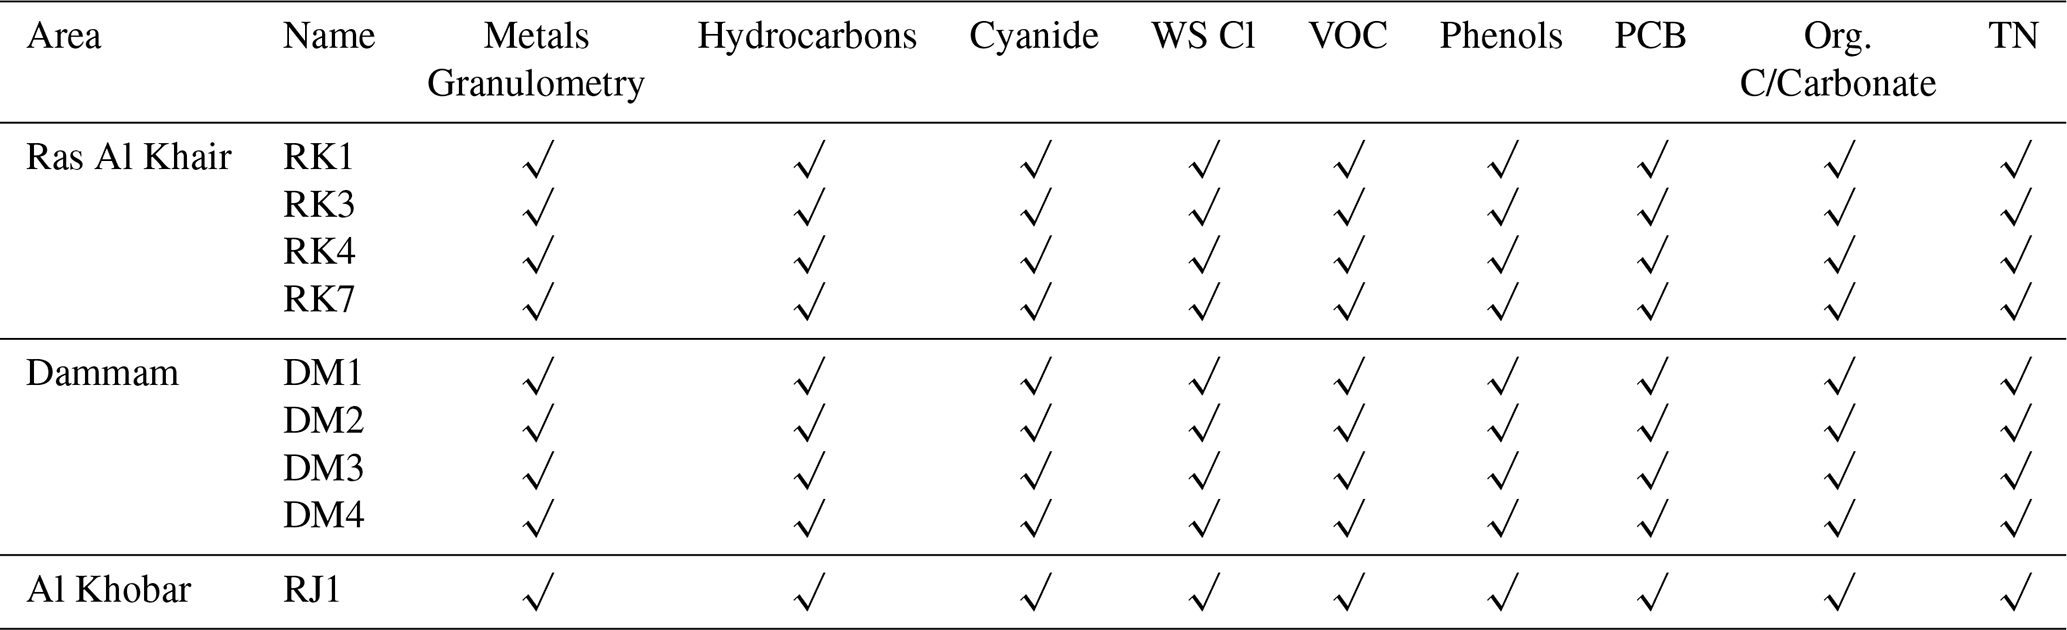
Table 7List of sediment parameters from the cruise in the Arabian Gulf in September 2021.
3.1 CTD – rosette
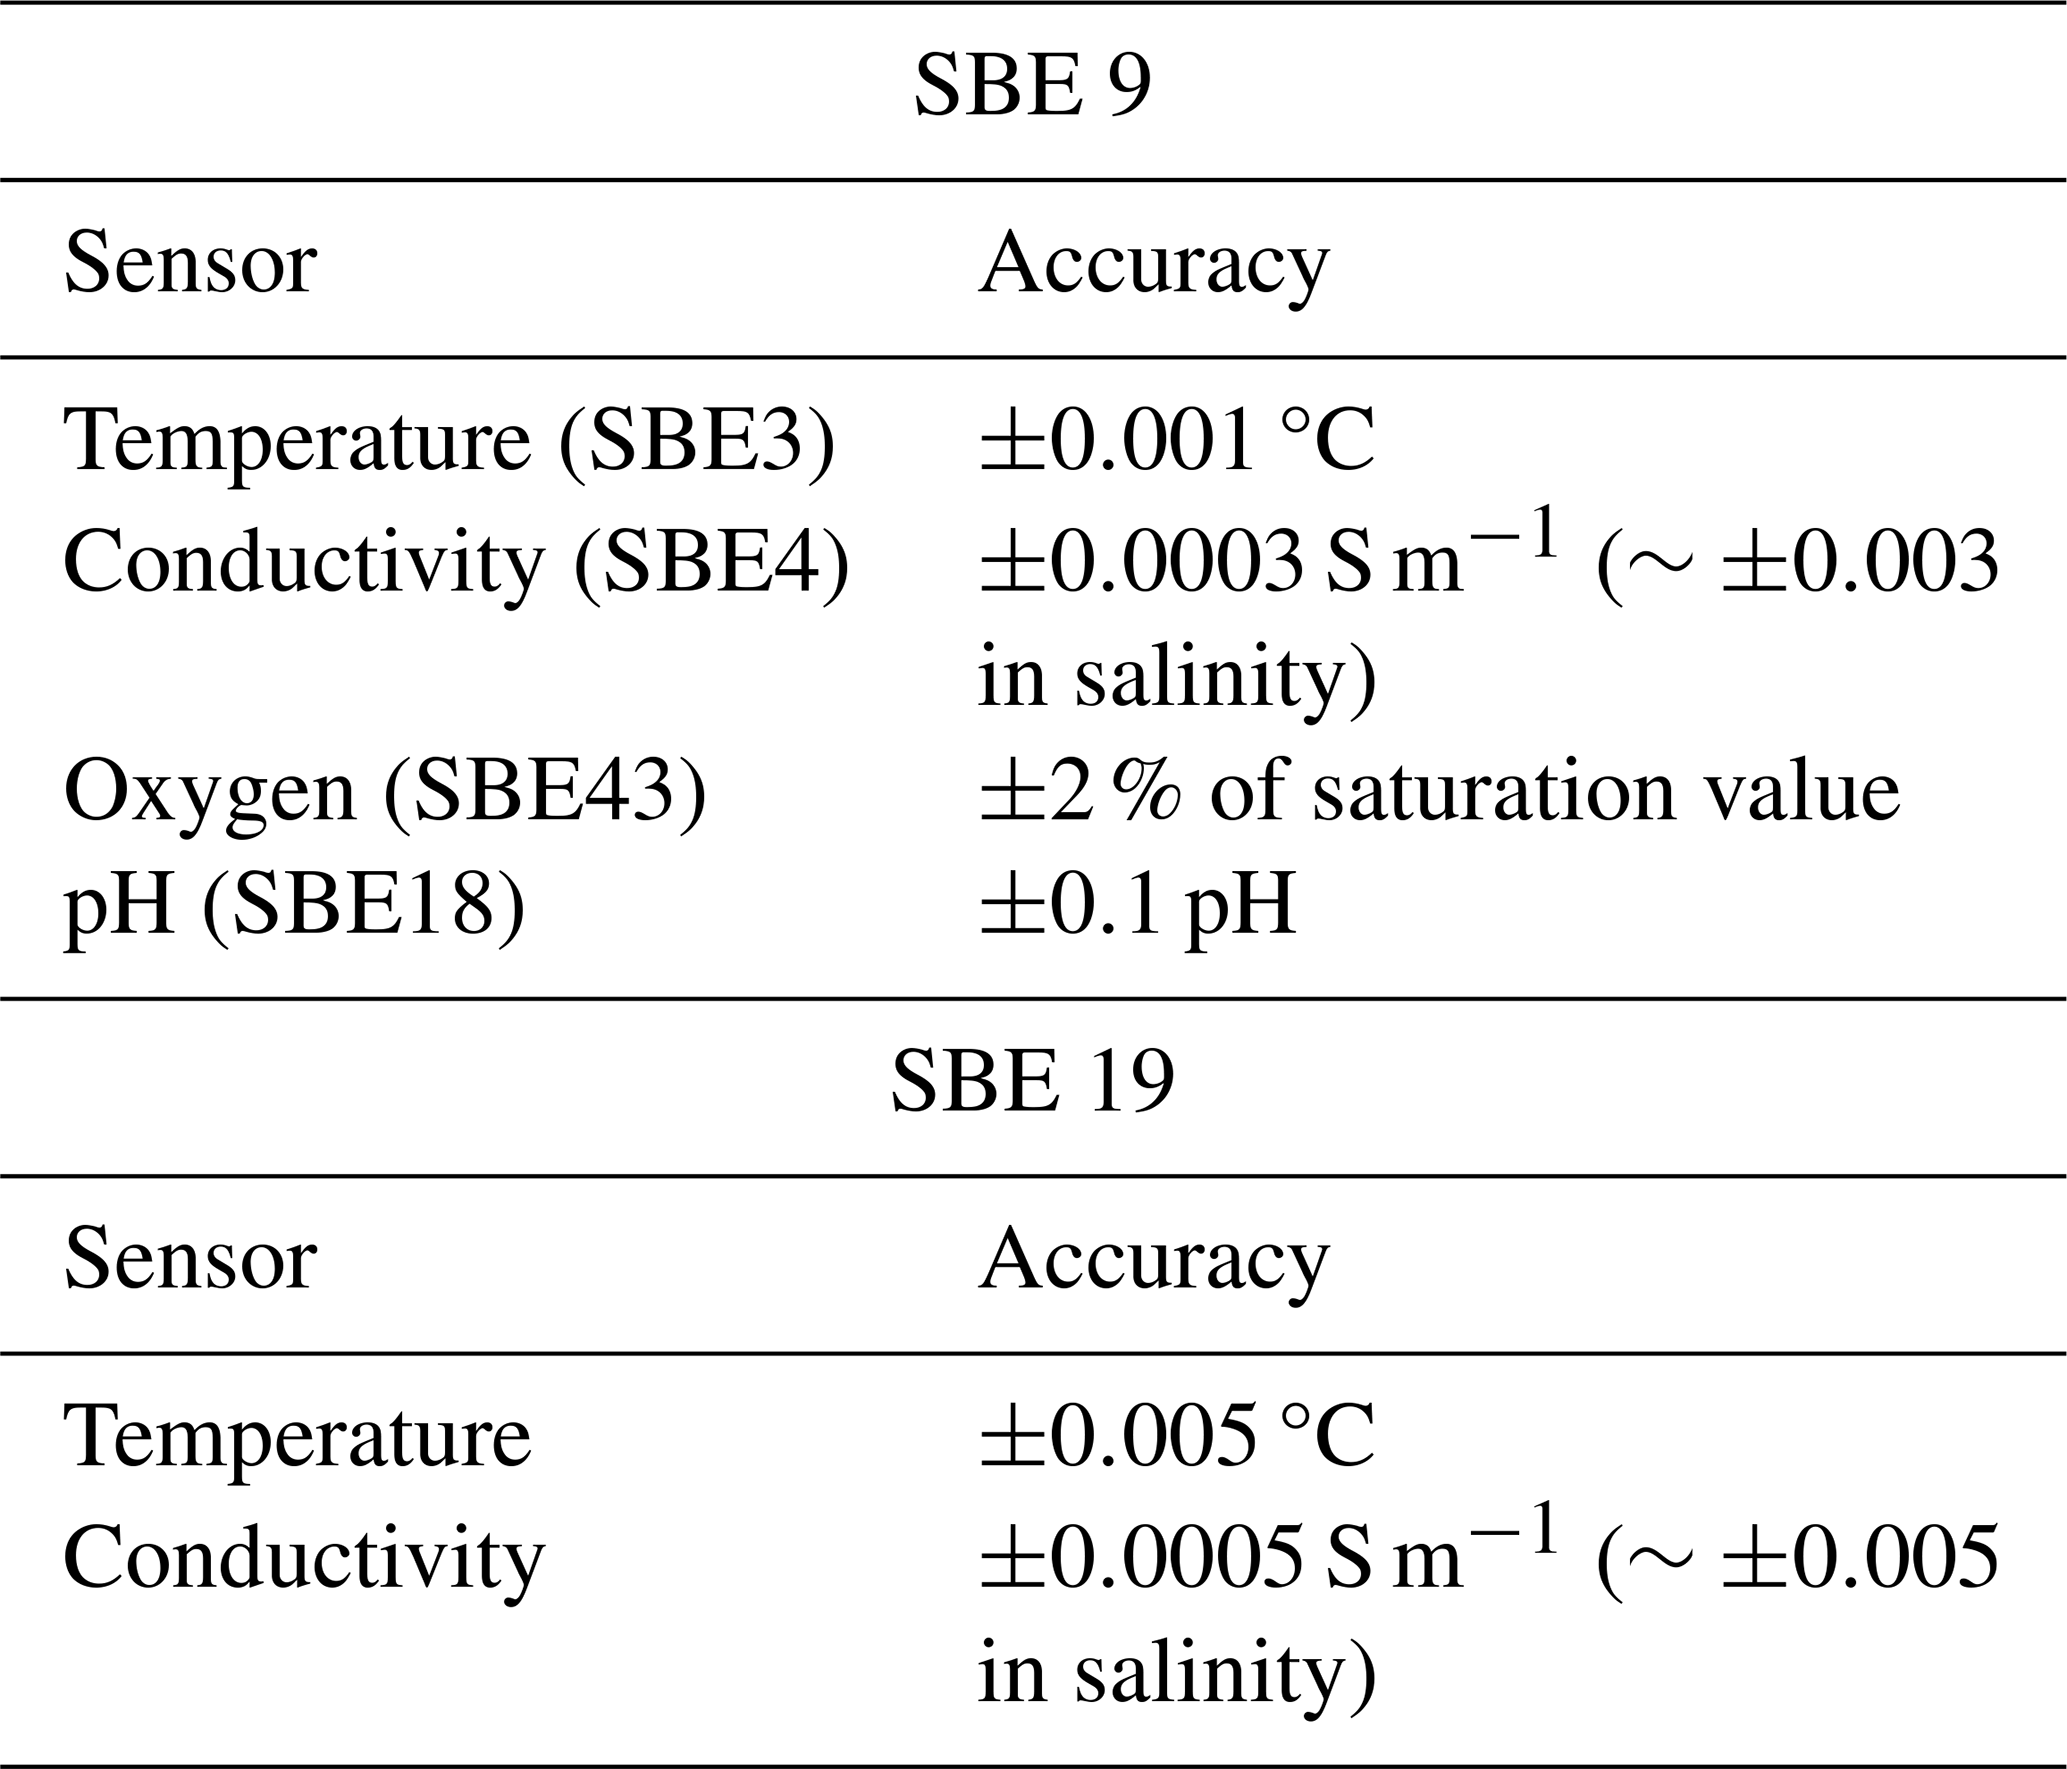
In the Red Sea, 96 CTD casts were performed. A total of 71 casts included rosette/Niskin water sampling (full details are given in Tables 1 and 2) while the other 25 acquired only sensor data. A Sea-Bird SBE 9plus CTD underwater unit (Sea-Bird Electronics, Inc.) connected to an SBE 11 deck unit was used. The SBE 9plus CTD system was equipped with a pressure sensor (Digiquartz), temperature sensor (SBE 3), conductivity sensor (SBE 4), DO (SBE 43), transmissometer sensor (Chelsea AlphaTracka Mk II), fluorometer sensor (Chelsea AquaTracka III), pH sensor (SBE 18) and underwater and shipborne photosynthetically active radiation (PAR) sensor (Satlantic). Temperature and conductivity sensors were calibrated before the cruise, in February/March 2021, at the manufacturer's facilities. Oxygen values were corrected post-cruise using the Winkler oxygen values. The underwater unit was attached to a metallic frame that supported 12 Niskin bottles of 12 L volume each. The bottles were connected to a carousel water sampler (SBE 32) linked to the CTD probe via a conductive cable.
In addition, a portable SBE 19 CTD underwater unit equipped with a pressure sensor (strain gauge), unit-embedded temperature sensor, unit-embedded conductivity sensor, transmissometer sensor (Chelsea/Seatech) and fluorometer sensor (WET Labs ECO-AFL/FL) was used in the shallow areas. Both CTD sensors recorded measurements in the whole water column from near surface to ∼0.5 m above the sea bottom. Water samples for the rosette system were taken for the quality control/quality assurance (QC/QA) of the results derived from the CTD probes. Moreover, an inter-calibration test cast was conducted before sampling, in which both the SBE 9 and SBE 19 probes were attached to a frame and lowered in the water column. Minor adjustments were applied to correct the SBE19 sensors. In total, 36 casts were conducted with the tender's CTD unit. Raw CTD data were processed following the manufacturer's recommendations and procedures using the SBE Data Processing software. Accuracies of CTD sensors are shown in Table 8.
The physical properties derived from the CTD and companion sensor data provided indicators of pressure signals. For example, salinity, fluorescence and beam transmission were taken as tracers for brine water (e.g., from desalination plants), wastewater effluent (e.g., from effluent outfalls).
In the Arabian Gulf, data were acquired with a portable Idronaut Ocean Seven CTD unit equipped with pressure, temperature, conductivity, DO, pH and turbidity sensors. All sensors attached to the unit were calibrated before the cruise, in September 2021, at the Coastal and Marine Resources (CMR) Core Lab of KAUST according to the manufacturer's instructions. Arabian Gulf water samples were taken using Niskin bottles.
3.2 ADCP
The R/V AEGAEO was equipped with a portable ADCP operating at 300 kHz. The ADCP (Teledyne Workhorse) measured water current magnitude and direction down to a depth of approximately 50 m in optimal conditions. The instrument was deployed on the side of the AEGAEO at shallow stations with the bottom tracking mode enabled. This ADCP was typically set up to measure velocities in 2 m depth bins, collecting 4–5 (ensemble) profiles at 6–8 min intervals. The average velocity profile at each station was computed as a mean of these ensembles with questionable-quality (biased and noisy) measurements removed. At 15 deeper stations where depths ranged from ∼70 to ∼600 m, ADCP measurements were collected for 10–15 min via the shipboard ADCP (SADCP Teledyne Ocean Surveyor), a unit installed at the ship's hull and operating at 75 kHz. Averaged velocity profiles were obtained at a total of 59 stations. Unfortunately, ADCP measurements were not taken in the Arabian Gulf.
3.3 DO, nitrogen and phosphorus, Chl-a, total organic carbon (TOC) and total suspended solids (TSSs)
Seawater samples were collected from the rosette/Niskin sampling system with the typical precaution to prevent any biological activity and gas exchange with the atmosphere (Strickland and Parsons, 1968). Winkler glass bottles with beveled glass stoppers and a measured capacity specification of ±0.01 mL were used. Chemical reagents were added immediately after sampling. DO was determined by titration using the Winkler method, according to Carpenter (1965a, b). Reagent 1 (manganese) and reagent 2 (alkaline iodide) were added with semi-automated Eppendorf (Germany) dispensers, and the bottles were kept in the dark. Before titration, the precipitated hydroxides were dissolved with sulfuric acid, and the solution was carefully transferred to a titration beaker. The titration was carried out with a standardized thiosulfate solution using a Metrohm 876 Dosimat (Switzerland). QC/QA was performed daily by standardization of the thiosulfate solution with a reference standard solution of potassium iodide. The precision of the method outlined above is estimated to be 2.2 µmol L−1.
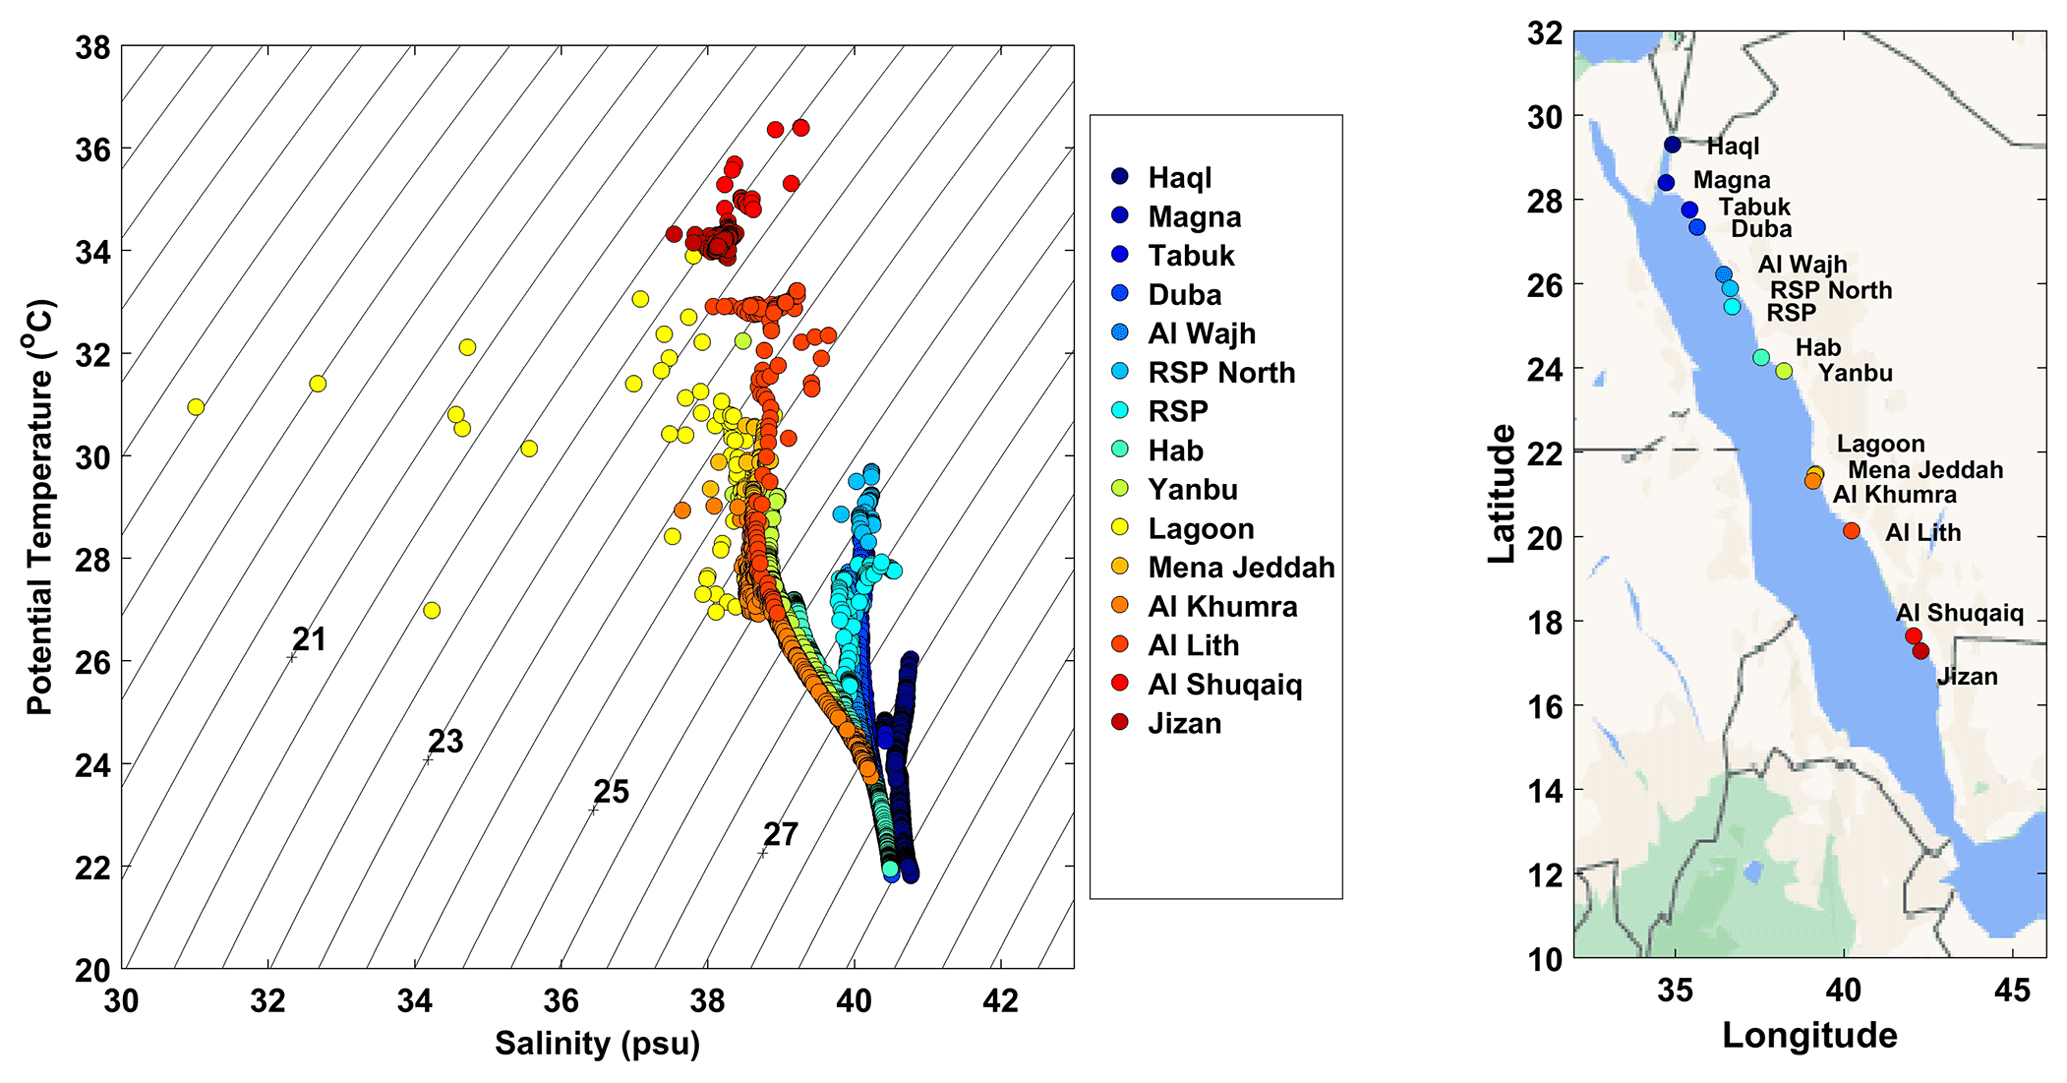
Figure 2T–S diagram encompassing all data taken (averaged every 1 m) in the Red Sea. Dots of the same color indicate measurements taken at the same site as shown on the map on the right (© Google Maps 2021).
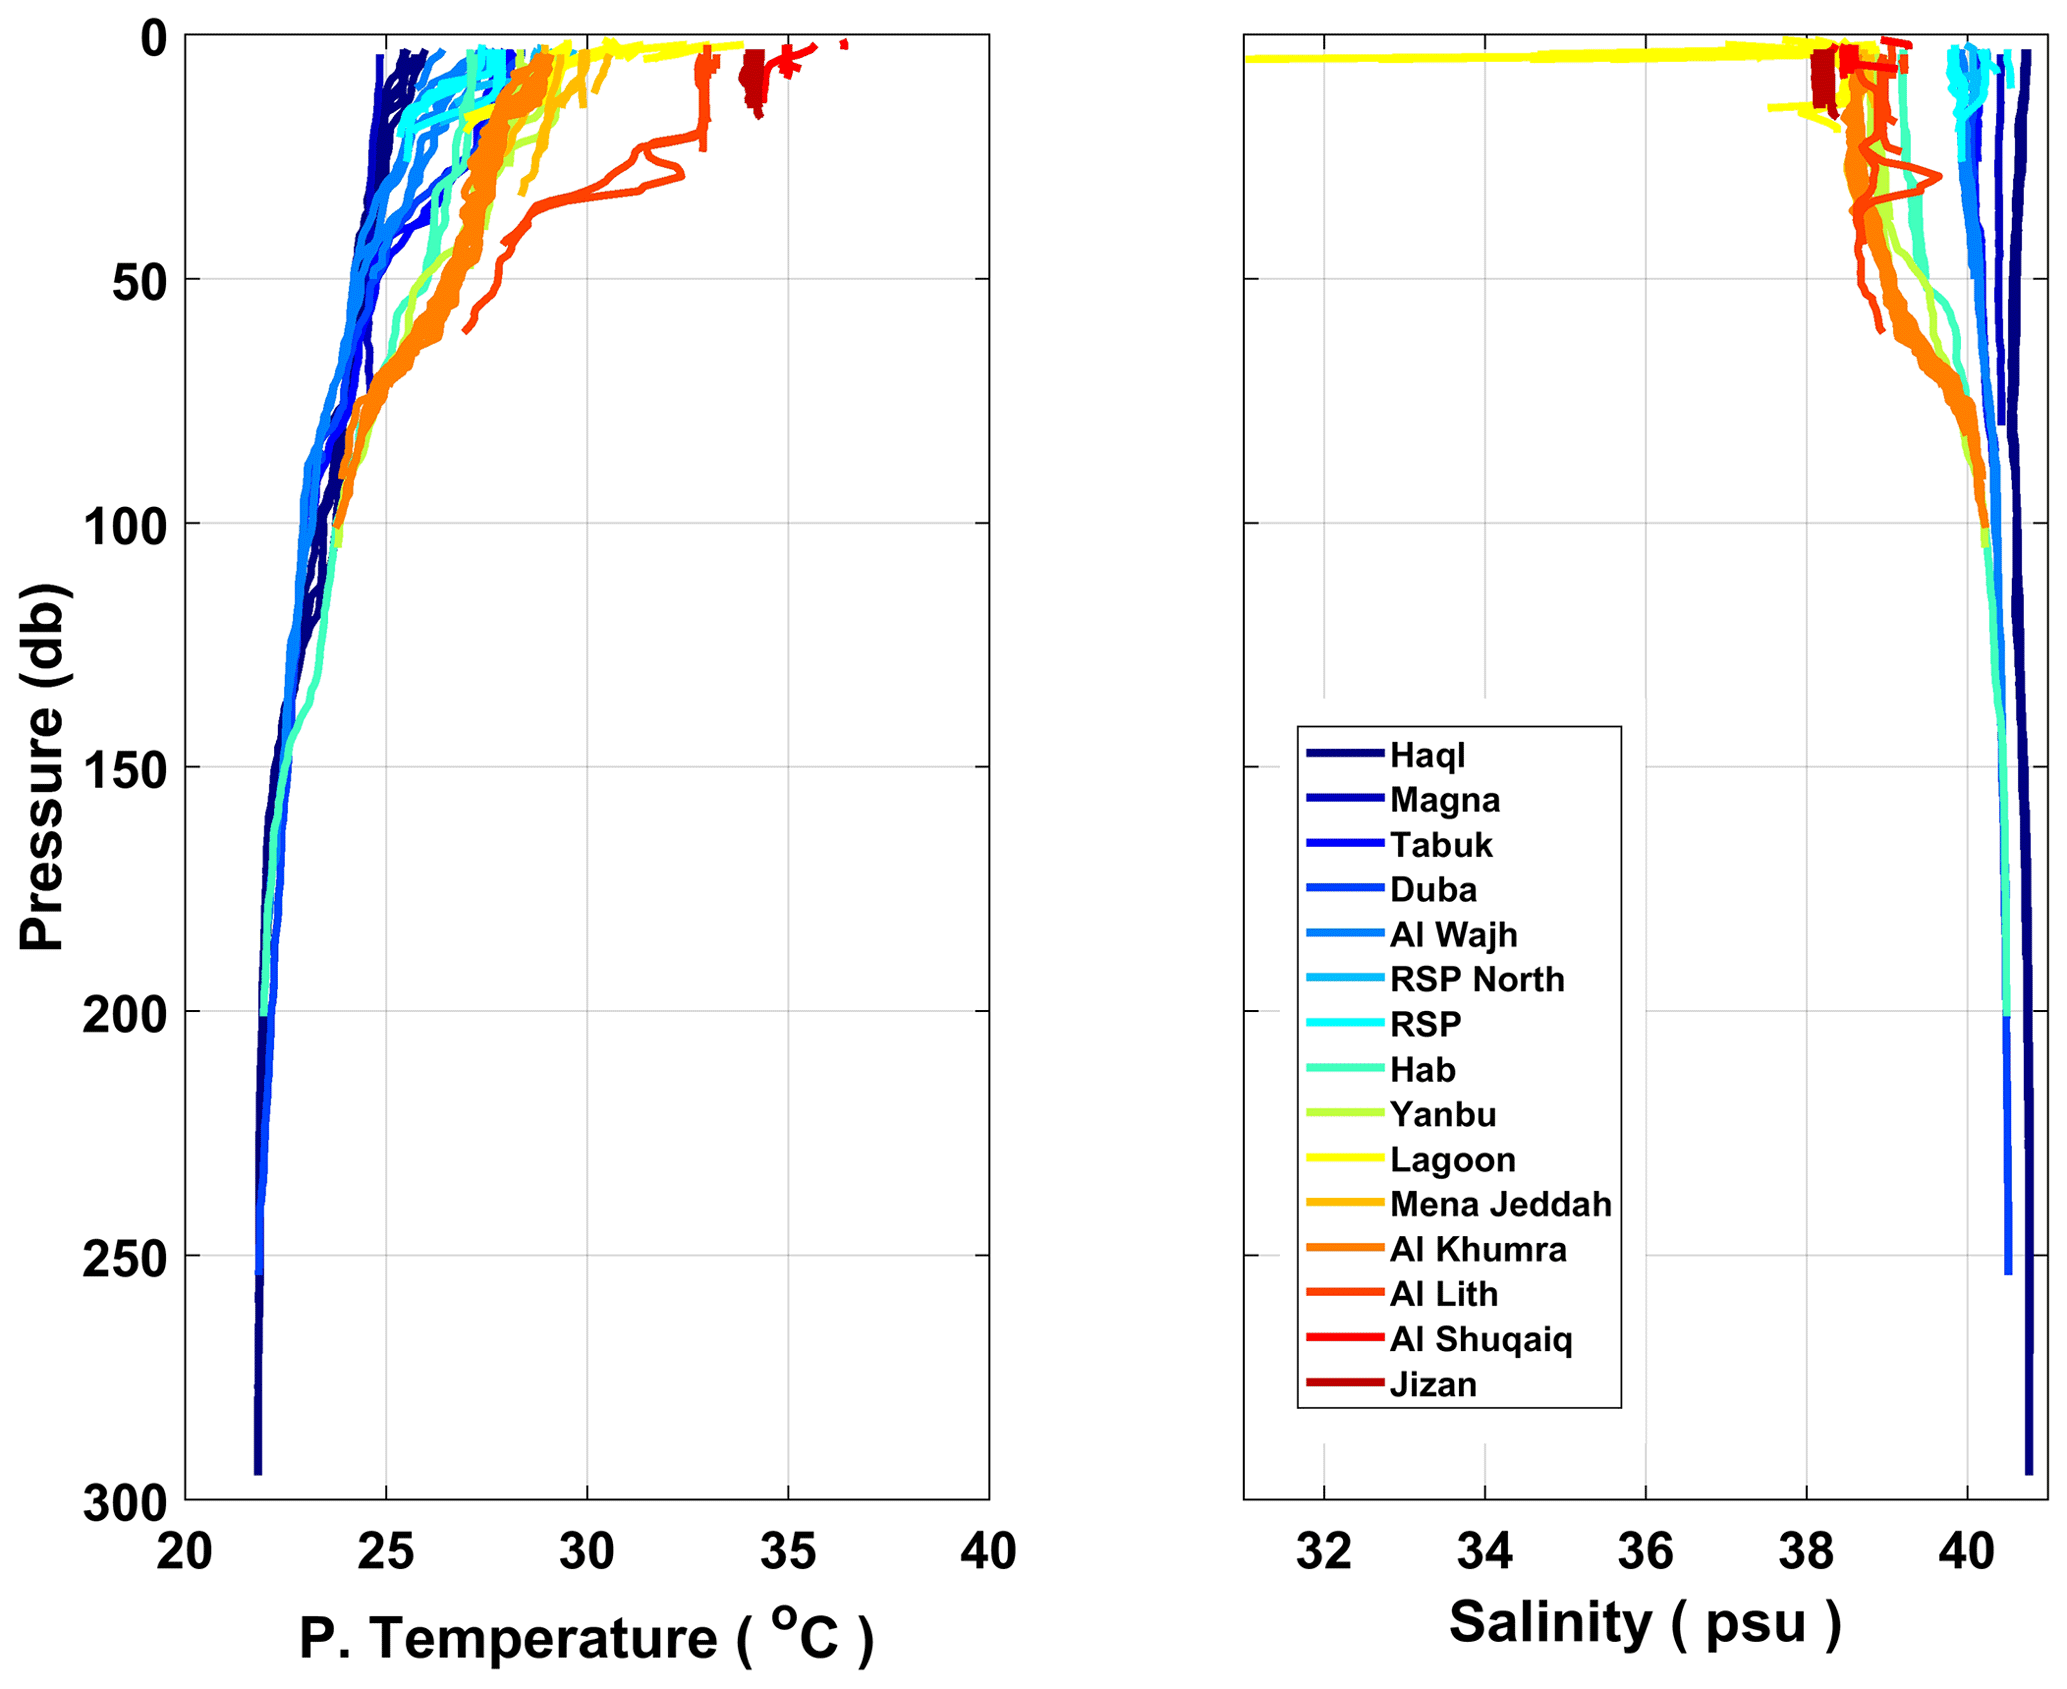
Figure 3Vertical profiles of Potential Temperature and Salinity in the study areas of the Red Sea.
The onboard determination of DO concentration from the seawater samples provided data for QC/QA of the CTD DO sensor measurements and enabled calibration of the CTD's DO sensor (SBE 43) during the cruise.
For nutrient analysis, seawater samples were collected in tubes amenable to the QuAAtro nutrient autoanalyzer (SEAL Analytical) and were also collected in 125 mL bottles. All sample containers were pre-treated with 10 % HCl and distilled water. The samples were collected in triplicate and kept deep-frozen (−20 °C) until their subsequent analysis in the HCMR biogeochemical laboratory, which is certified according to EN ISO/IEC 17025:2017 (2018). In the laboratory, the samples were analyzed using the QuAAtro nutrient autoanalyzer (SEAL Analytical) according to standard methods (Strickland and Parsons, 1968; Murphy and Riley, 1962). Ammonium was determined based on the spectrophotometric measurement of the blue-colored indophenol complex formed by the reaction of phenol and hypochlorite in the presence of the NH and NH3 species (Koroleff, 1970). Absorbance was measured using a UV-2600 Shimadzu UV/Visible spectrometer (USA) with an 8 mL volume, 10 cm path length cell. QC samples were analyzed together with the field samples. Results were calculated according to a calibration curve based on the EN ISO/IEC 17025:2017 standard, followed by the HCMR Laboratory QUASIMEME inter-calibration exercise used for testing the accuracy of the method. The limit of detection (LOD) values of the certified methods were 0.04 µmol L−1 for nitrate+nitrite, 0.01 µmol L−1 for nitrite, 0.03 µmol L−1 for nitrate, 0.01 µmol L−1 for phosphate and 0.02 µmol L−1 for ammonium.
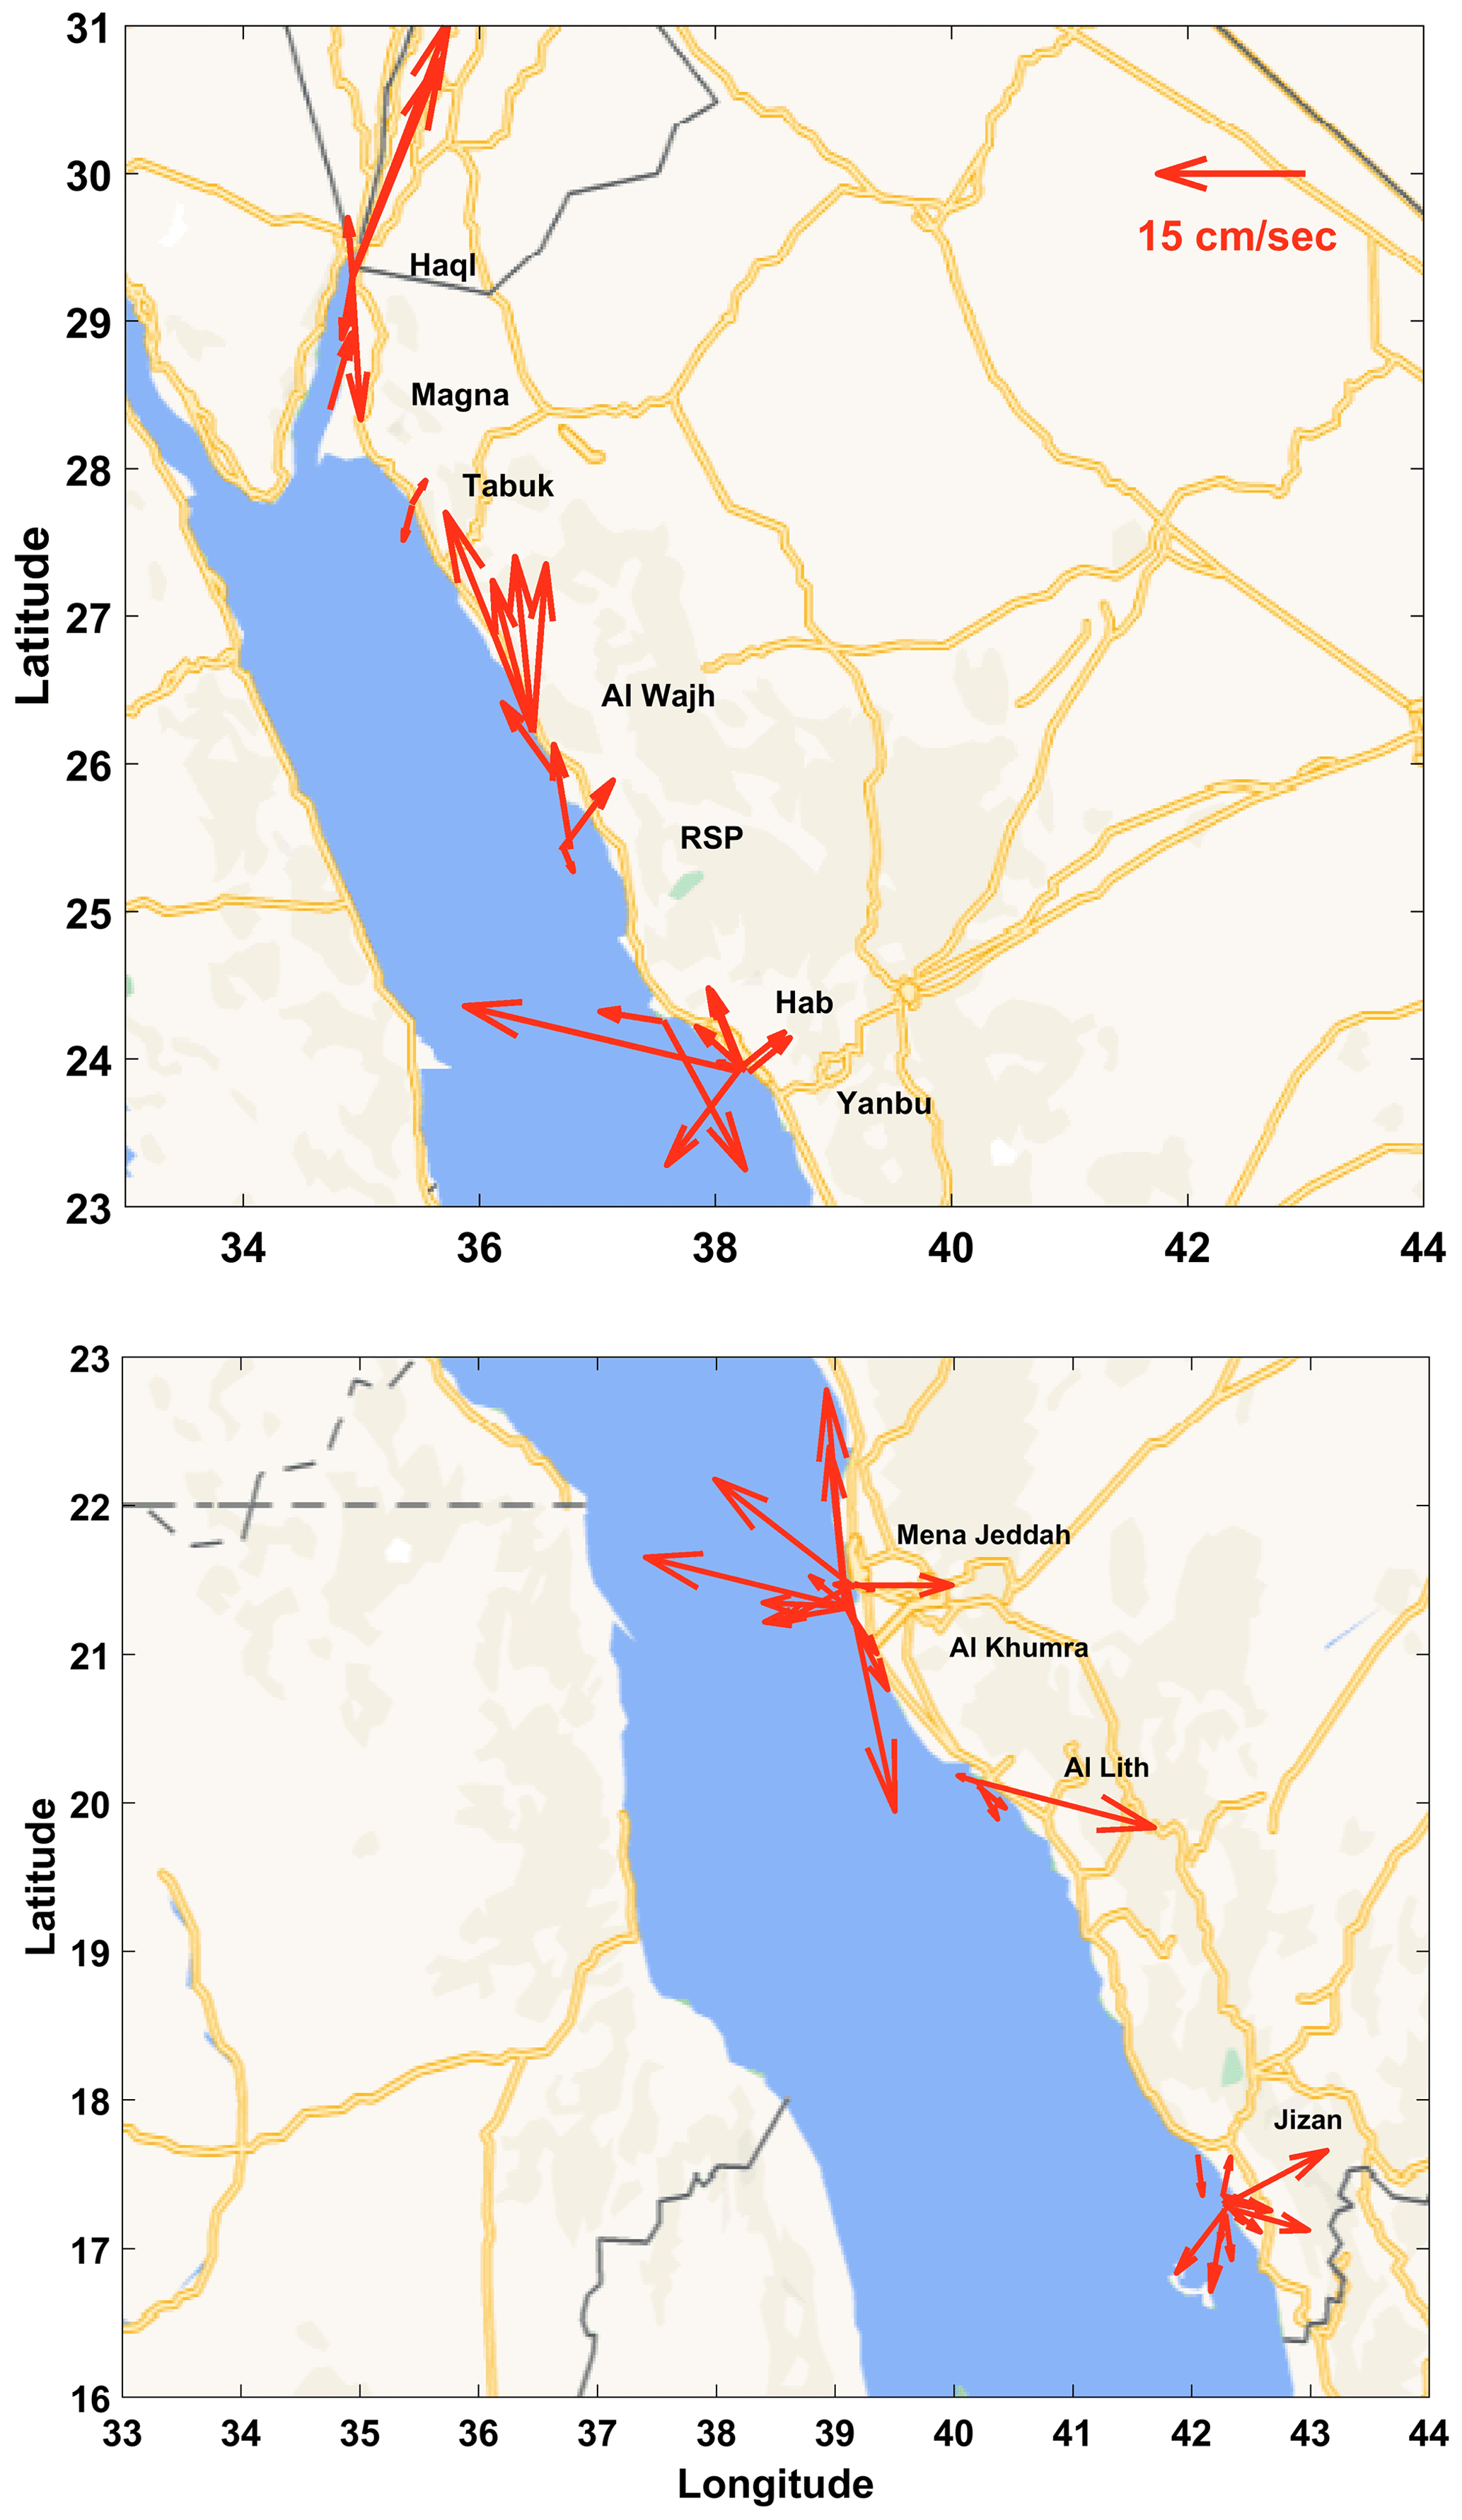
Figure 4Current vectors at 12 m at specific areas along the Saudi Arabian coast of Aqaba and Red Sea. Scale vector of a westward current with a speed of 15 cm s−1 appears in the upper right of the top panel (© Google Maps 2021).
For organic phosphorus and nitrogen analysis, seawater was collected in 20 mL Teflon bottles (for phosphorus) and 50 mL glass bottles fitted with screw caps. These digestion bottles were previously washed with 10 % HCl. Preliminary digestion was performed to remove traces of organic matter. The bottles were then kept continuously in a deep freeze (−20 °C) in the dark until their contents were analyzed in the HCMR laboratory. In the laboratory, digestion was performed by a persulfate wet-oxidation in low-alkaline conditions at 120 °C (1 bar) for 30 min. After cooling at room temperature, the assay mixture was analyzed for nitrate and phosphate on a QuAAtro nutrient autoanalyzer (Seal Analytical) according to the methods for nutrient analysis.
Samples for TOC analysis were collected in 20 mL acid-cleaned (10 % HCl, 12 h) glass bottles fitted with Teflon cups. Directly after sampling, 50 µL of 2N HCl was added to each bottle. The samples were then refrigerated until analysis. TOC concentrations were determined using a Shimadzu TOC-L organic carbon analyzer following the high-temperature catalytic oxidation (HTCO) method described by Cauwet (1994) and Sugimura and Suzuki (1988). TOC concentration was calculated as the average value of three replicates that yielded a standard deviation <2 %. Analytical precision and accuracy were tested daily against Deep Atlantic Seawater Reference Material provided by the DOC-CRM program (University of Miami – D.A. Hansell). The certified value of the reference material is 0.533–0.574 mg L−1, and the measured values (n=10) during the analysis of the samples were between 0.532 and 0.570 mg L−1.
Water samples for the determination of Chl-a concentrations (µg L−1) were collected by Niskin bottles principally near the surface of the water column and at the depth of the deep chlorophyll maximum (DCM) concentrations. For the estimation of the phytoplankton biomass, seawater samples were filtered on board through Whatman GF/F microfiber filters. A volume of 1 or 2 L of seawater were filtered depending on the expected concentrations of Chl-a. The filters were kept in a deep freezer in the dark at −15 °C, and were than analyzed at the laboratory on a TURNER 00-AU-10 fluorometer.
TSSs were determined by a standard method in which 4 L of seawater was collected in polyethylene bottles and filtered on board through pre-weighed glass fiber filters.
3.4 BOD, sulfide, fluorine, cyanide and total chlorine in seawater
The determination of BOD was performed on board immediately after seawater sampling according to Standard Methods for the Examination of Water and Wastewater no. 5210b (EPA 5210B, 2023). Seawater samples were taken from the Niskin bottles with the recommended precaution to prevent any biological activity and gas exchange with the atmosphere (Strickland and Parsons, 1968). A WTW 208262 respirometric BOD measuring system was used for the analysis. The bottles were incubated at 20 °C for 5 d. The accuracy of the BOD method is ±1 (±3.55 hPa). The determination of sulfide concentration was performed on board immediately after seawater sampling. Seawater samples were taken from the Niskin sampling bottles, and sulfides were determined by using the photometric method of Cline (1969). Sulfides react with diethyl-p-phenylenediamine (DPD) sulfate and ferric chloride to produce a blue color measured with a UV/Visible spectrophotometer at 670 nm. The limit of detection (LOD) was 1 µg L−1.
For fluoride measurement, seawater samples were collected from the Niskin bottles in the special tubes equipped for the ECION700/40S Eutech Ion 700 meter with integral electrode holder and 100/240 VAC Adapter CE equipped with Eutech 9609BNWP Fluoride Ionplus Sure-Flow combination electrode with a BNC connector.
For cyanide analysis, sea water samples were collected from the Niskin bottles in 125 mL polyethylene bottles. The samples were preserved by adding NaOH until pH >12 and stored at 4 °C until their analysis at HCMR labs. The analytical methodology was based on the colorimetric method no. 4500-CN-E in Standard Methods for the Examination of Water and Wastewater (1992). The detection limit is 0.2 µg L−1.
Chlorine concentration was measured on board immediately (in exactly 2 min) after seawater sampling. Seawater samples were taken from the Niskin bottles, and chlorine was determined by photometry according to the Standard Methods for the Examination of Water and Wastewater no. 4500-Cl G (1992). Chlorine reacts with DPD to produce a red color measured with a UV/Visible spectrometer at 515 nm. The LOD of the method was 10 µg L−1.
3.5 Total petroleum hydrocarbons (TPHs), oil/grease and chlorophenols in seawater
Total petroleum hydrocarbons (TPH), oil, grease and chlorophenols were analyzed in the HCMR organic chemistry laboratory certified according to EN ISO/IEC 17025:2017. For TPH, oil and grease determination, 2.5 L of seawater was collected in glass bottles and, after the addition of deuterated n-C24 as an internal standard, was immediately extracted on board with n-hexane. For chlorophenols, 1 L of seawater was collected in high-density polyethylene bottles, 2-chlorophenol-3,4,5,6-D4 was added as an internal standard, and then the samples were acidified to pH <4 and extracted on board with dichloromethane. All extracts were stored in a refrigerator and transferred to the HCMR laboratory.
In the laboratory, TPH was determined by gas chromatography and mass spectrometry with a flame ionization detector (FID) (Agilent 7890A/5975C GC–MS) based on the ISO 9377-2:2000 method (2002), and oil/grease was determined gravimetrically as the hexane extractable material using EPA method 1664 (2010). The hexane was distilled to dryness, and after further drying in an oven at 60 °C, the remaining residue was weighed in a 4-digit analytical balance. The LOD was 0.1 mg L−1.
The analysis of chlorophenols was based on EPA method 528 (2000). In the laboratory, the extracts were dried with sodium sulfate, and their volume was reduced to about 1 mL using a rotary evaporator and finally to 100 µL using a stream of ultraclean nitrogen. Chlorophenols were determined by gas chromatography–mass spectrometry (Agilent 7890A GC – 5975C MS). The following substances were quantified using the internal standard method: 2-chlorophenol, 3-chlorophenol, 4-chlorophenol, 2,3-dichlorophenol, 2,4-dichlorophenol, 2,5-dichlorophenol, 2,6-dichlorophenol, 3,4-dichlorophenol, 3,5-dichlorophenol, 2,3,4-trichlorophenol, 2,3,5-trichlorophenol, 2,3,6-trichlorophenol, 2,4,5-trichlorophenol, 2,4,6-trichlorophenol, 3,4,5-trichlorophenol, 2,3,4,5-tetrachlorophenol, 2,3,4,6-tetrachlorophenol, 2,3,5,6-tetrachlorophenol and pentachlorophenol. The LOD for each compound was 0.01 µg L−1.
3.6 Metals in seawater
For the analysis of dissolved Cd, Co, Cr, Cu, Ni, Pb and Zn, 250 mL of seawater was collected in pre-cleaned polyethylene bottles and stored at −20 °C until analysis in the laboratory. After thawing, the samples were filtered through 0.45 µm filters (Whatman sterile mixed cellulose ester membranes) and acidified with Suprapur HCl to pH <2. Samples for Cd, Co, Cu, Ni, Pb and Zn determination were pre-concentrated by the Toyopearl AF-Chelate-650M resin to separate these elements from interfering matrix components (Milne et al., 2010; Willie et al., 1998). The trace metals eluted on the resin were collected with 1 M Suprapur HNO3 and determined using inductively coupled plasma mass spectrometry (ICPMS, Thermo-Elemental X-series II) in a regular laboratory environment. Accuracy and precision were assessed using the class-5 certified reference material for coastal water and acidified seawater samples of the QUASIMEME inter-laboratory exercise (AQ-3, Lab code 122, https://www.wepalquasimeme.nl/en/wepal.htm, last access: 25 March 2024). The results obtained for class 5 were in good agreement with the certified values (Tables S1 and S2 in the Supplement), and the samples of the QUASIMEME tests had acceptable Z scores ().
A co-precipitation method was used for total dissolved Cr (Harper and Riley, 1985). The samples were precipitated with Fe(II) ammonium sulfate. Total dissolved Cr determination was performed by graphite furnace atomic absorption spectrometry (AAS, Shimadzu GFA-7000A) in a regular laboratory environment. The LOD of the method was 0.083 µg L−1.
For the total Hg, 250 mL of seawater was collected in pre-cleaned glass bottles. After adding 1.2 mL of 37 % HCl, the samples were stored in a refrigeration unit until the analysis in the laboratory. Total Hg was determined by EPA method No 1631 (2002), which consisted of oxidation of all species to Hg(II), purging and trapping onto a gold trap, desorption and cold-vapor atomic fluorescence spectrometry (CVAFS) by a Tekran 2500 mercury analyzer. The LOD was 0.2 ng L−1, and the limit of quantification (LOQ) was 0.5 ng L−1. On each day of analysis, the reference material was analyzed at least once daily for recovery estimation (accuracy) (Tables S1 and S2). The reference material was a diluted sample from digested sediment with a certified Hg content of 412 µg kg−1, an aliquot of which was spiked in purged seawater to reach a concentration of 2.0 ng L−1. Thus, both accuracy and matrix spike checks were performed.
The samples' pre-treatment, the trace metal pre-concentration steps, the trace metal analyses and Hg determination were carried out in US FED-STD Class M5.5 (10 000) clean room environments using ultraclean handling techniques (EPA method 1669).
3.7 Sediments
Surface sediment samples were collected for the determination, using EPA methods, of aliphatic hydrocarbons and polycyclic aromatic hydrocarbons (AHCs and PAHs); volatile organic compounds (VOCs) benzene, toluene, ethylbenzene, and xylene (BTEX); polychlorinated biphenyls (PCBs); phenols; organic carbon; and metals. Organic compounds and metals were analyzed in the HCMR organic chemistry laboratories certified according to EN ISO/IEC 17025:2017. An internal quality check was performed by means of analyses of QUASIMEME samples. In order to identify the geochemical background of each area, additional sampling and analysis of sediment cores is needed.
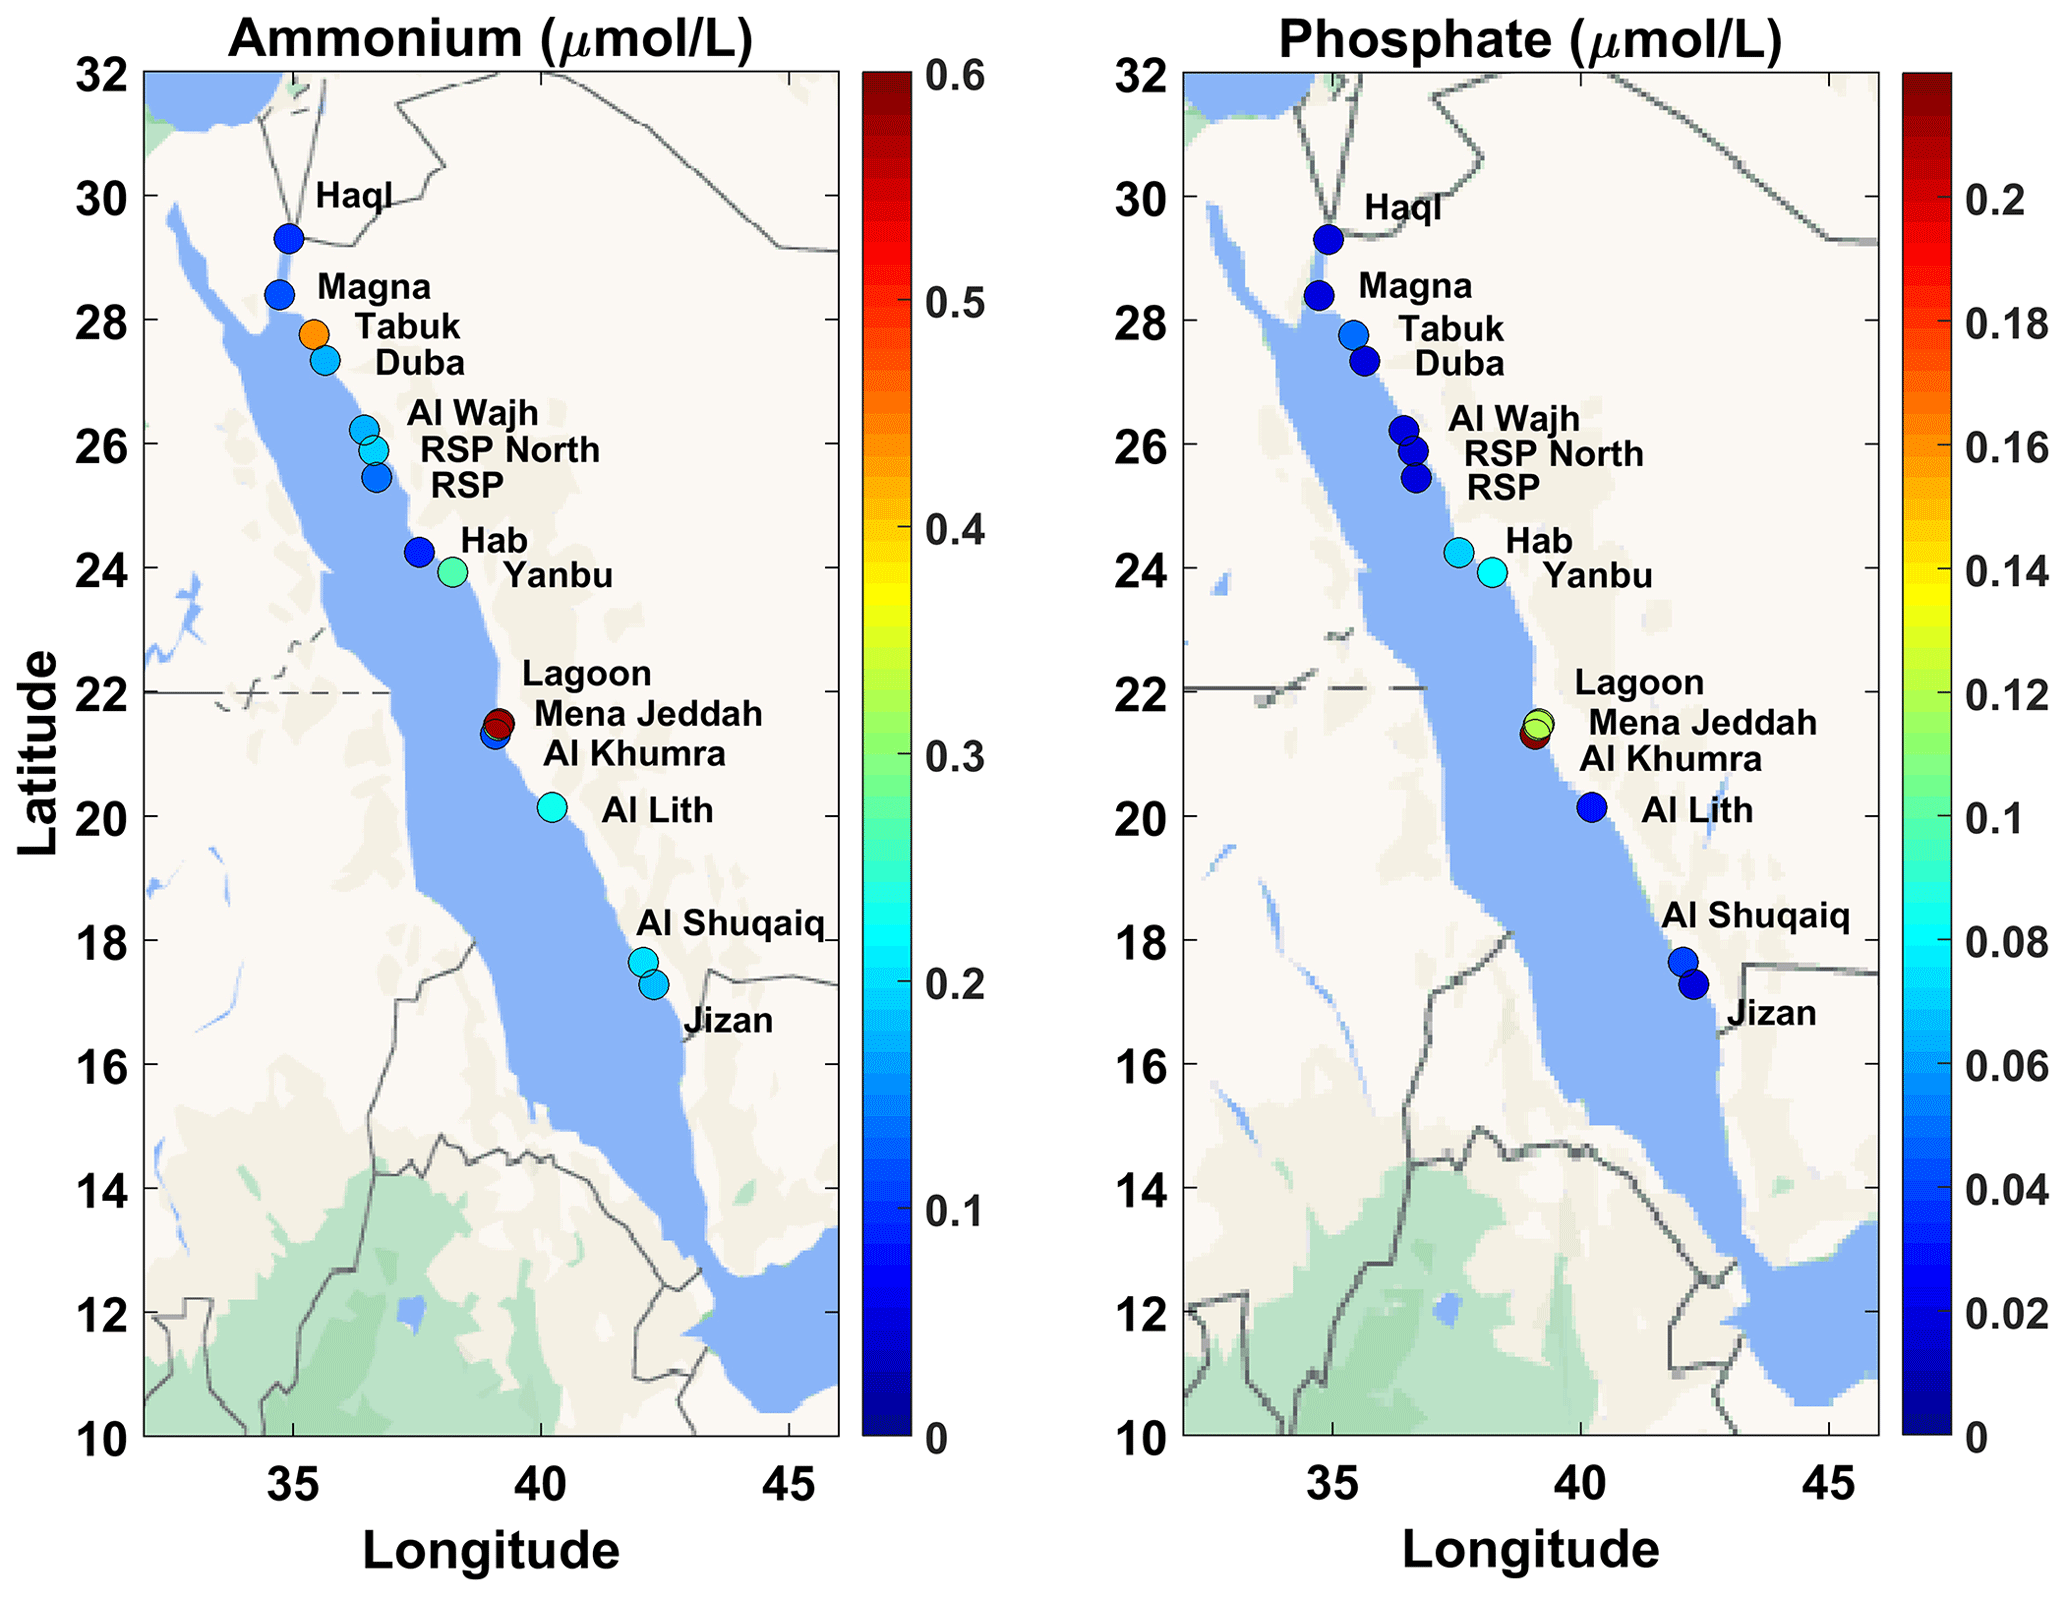
Figure 5Average ammonium (left panel) and phosphate (right panel) concentrations in the sampled marine areas along the coastline of the Red Sea (© Google Maps 2021). The mapping presents the average concentrations for each area (average from all stations sampled in the area, average of mean integrated concentrations of the stations included in each area). Ammonium values at Jeddah Lagoon are out of scale.
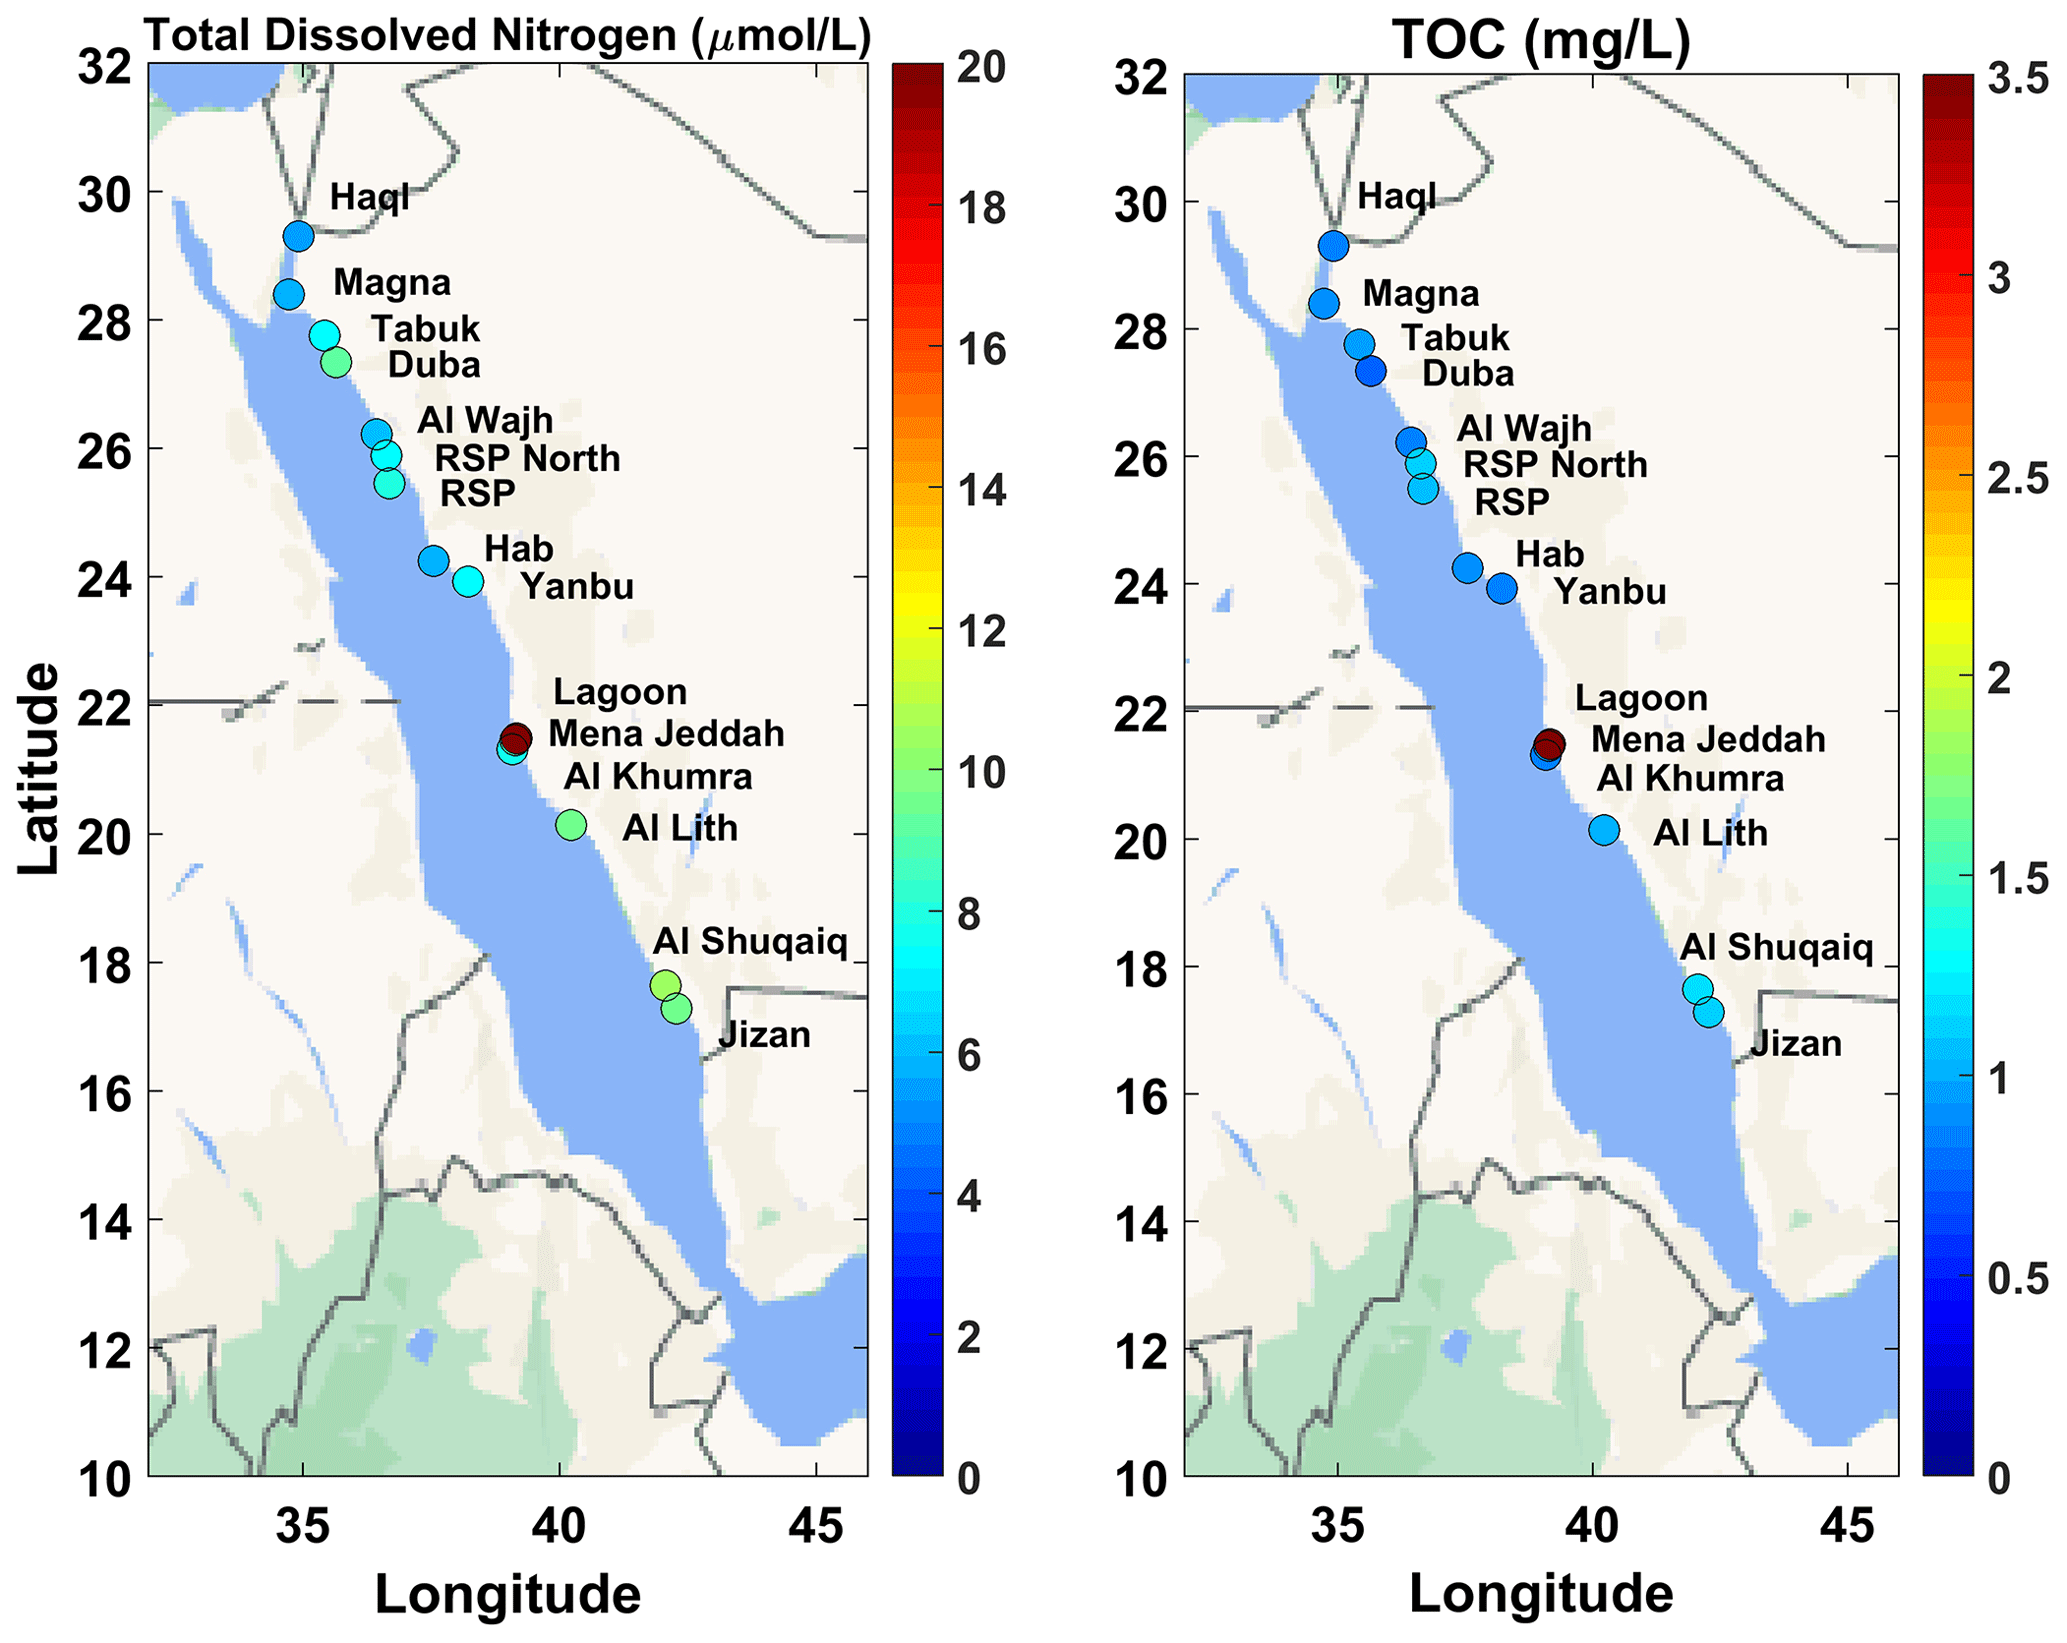
Figure 6Average total dissolved nitrogen (left panel) and total organic carbon (right panel) concentrations in the sampled marine areas along the coastline of the Red Sea (© Google Maps 2021). The mapping presents the average concentrations for each area (average from all stations sampled in the area, average of mean integrated concentrations of the stations included in each area). Jeddah Lagoon values are out of scale, since they ranged from 11.8 to 167 µmol L−1 for total dissolved nitrogen and from 1 to 5.7 mg L−1 for total organic carbon.
The analysis of AHC and PAH in sediments was based on the recommendations of OSPAR (2013) and UNEP/IOC/IAEA (1992). The sediments were frozen at −20 °C (UNEP, 1992) until they arrived at the laboratory. In the laboratory, the sediment samples were dried at 40 °C, sieved through a 250 mm sieve and homogenized. After the addition of a mixture of deuterated compounds, used as internal standards, 0.5–3 g of dried sediment was extracted with a mixture of methanol and dichloromethane (1:2, ) using an accelerated solvent extractor (Dionex ASE 350). The extract was saponified with methanolic KOH, and the unsaponified components were extracted with n-hexane and cleaned up and fractionated by passing through a silica column. The final determination of total AHC and PAH was carried out by gas chromatography and mass spectrometry (Agilent 7890A/5975C GC–MS). The quantitation was based on the deuterated internal standards. Blanks were systematically checked to verify the absence of contamination during analyses. Accuracy ranged from 79.8 % to 96.5 % for individual PAH compounds and was systematically controlled using a reference material (NIST SRM 1941b), and the laboratory also participates in QUASIMEME inter-laboratory exercises. Analytical uncertainties for each PAH ranged from 12.1 % to 37 % (k=2). The LOD for total AHC and PAH was 0.5 µg g−1 and 0.1 ng g−1, respectively. Individual PAHs determined were naphthalene; acenaphthylene; acenaphthene; fluorene; dibenzothiophene; phenanthrene; anthracene; fluoranthene; pyrene; benzo(a)anthracene; chrysene; benzo(b)fluoranthene; benzo(k)fluoranthene; benzo(e)pyrene; benzo(a)pyrene; perylene; indeno(1,2,3-cd)pyrene; benzo(ghi)perylene; dibenzo(ah)anthracene; and the methylated derivatives of naphthalene, dibenzothiophene, phenanthrene, pyrene, and chrysene.
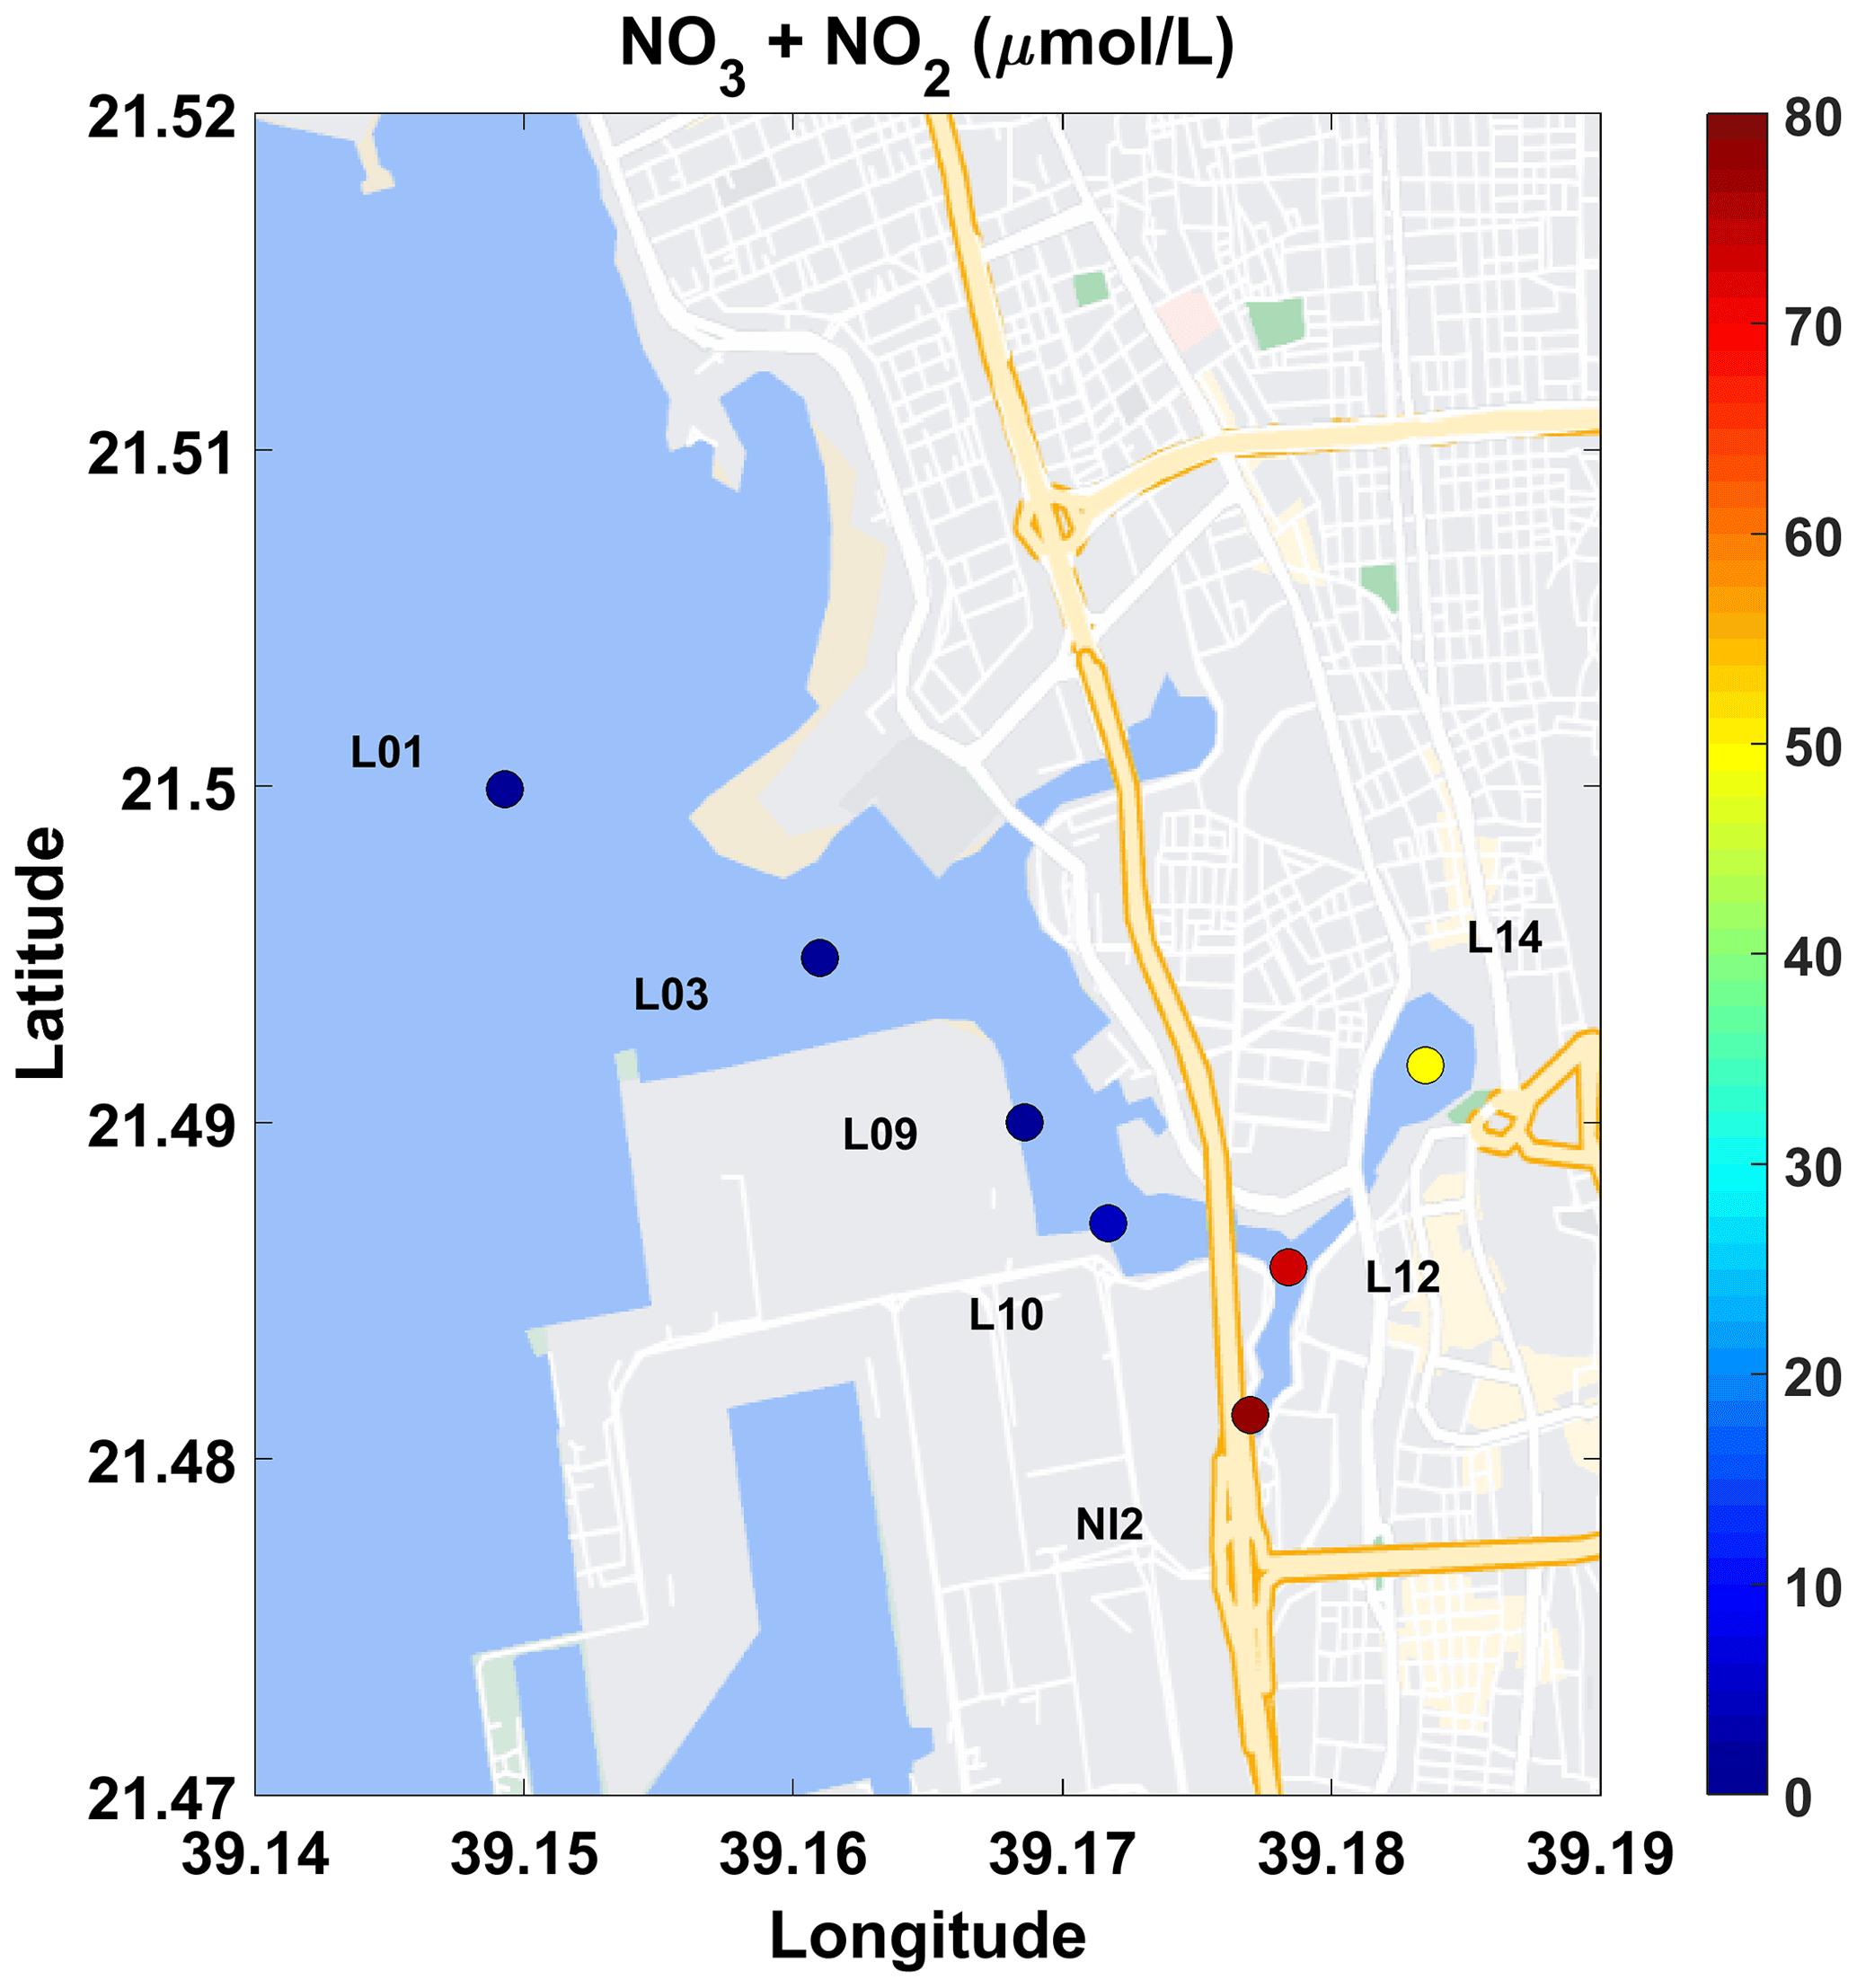
Figure 7Nitrate+nitrite concentrations in Jeddah Lagoon (© Google Maps 2021).
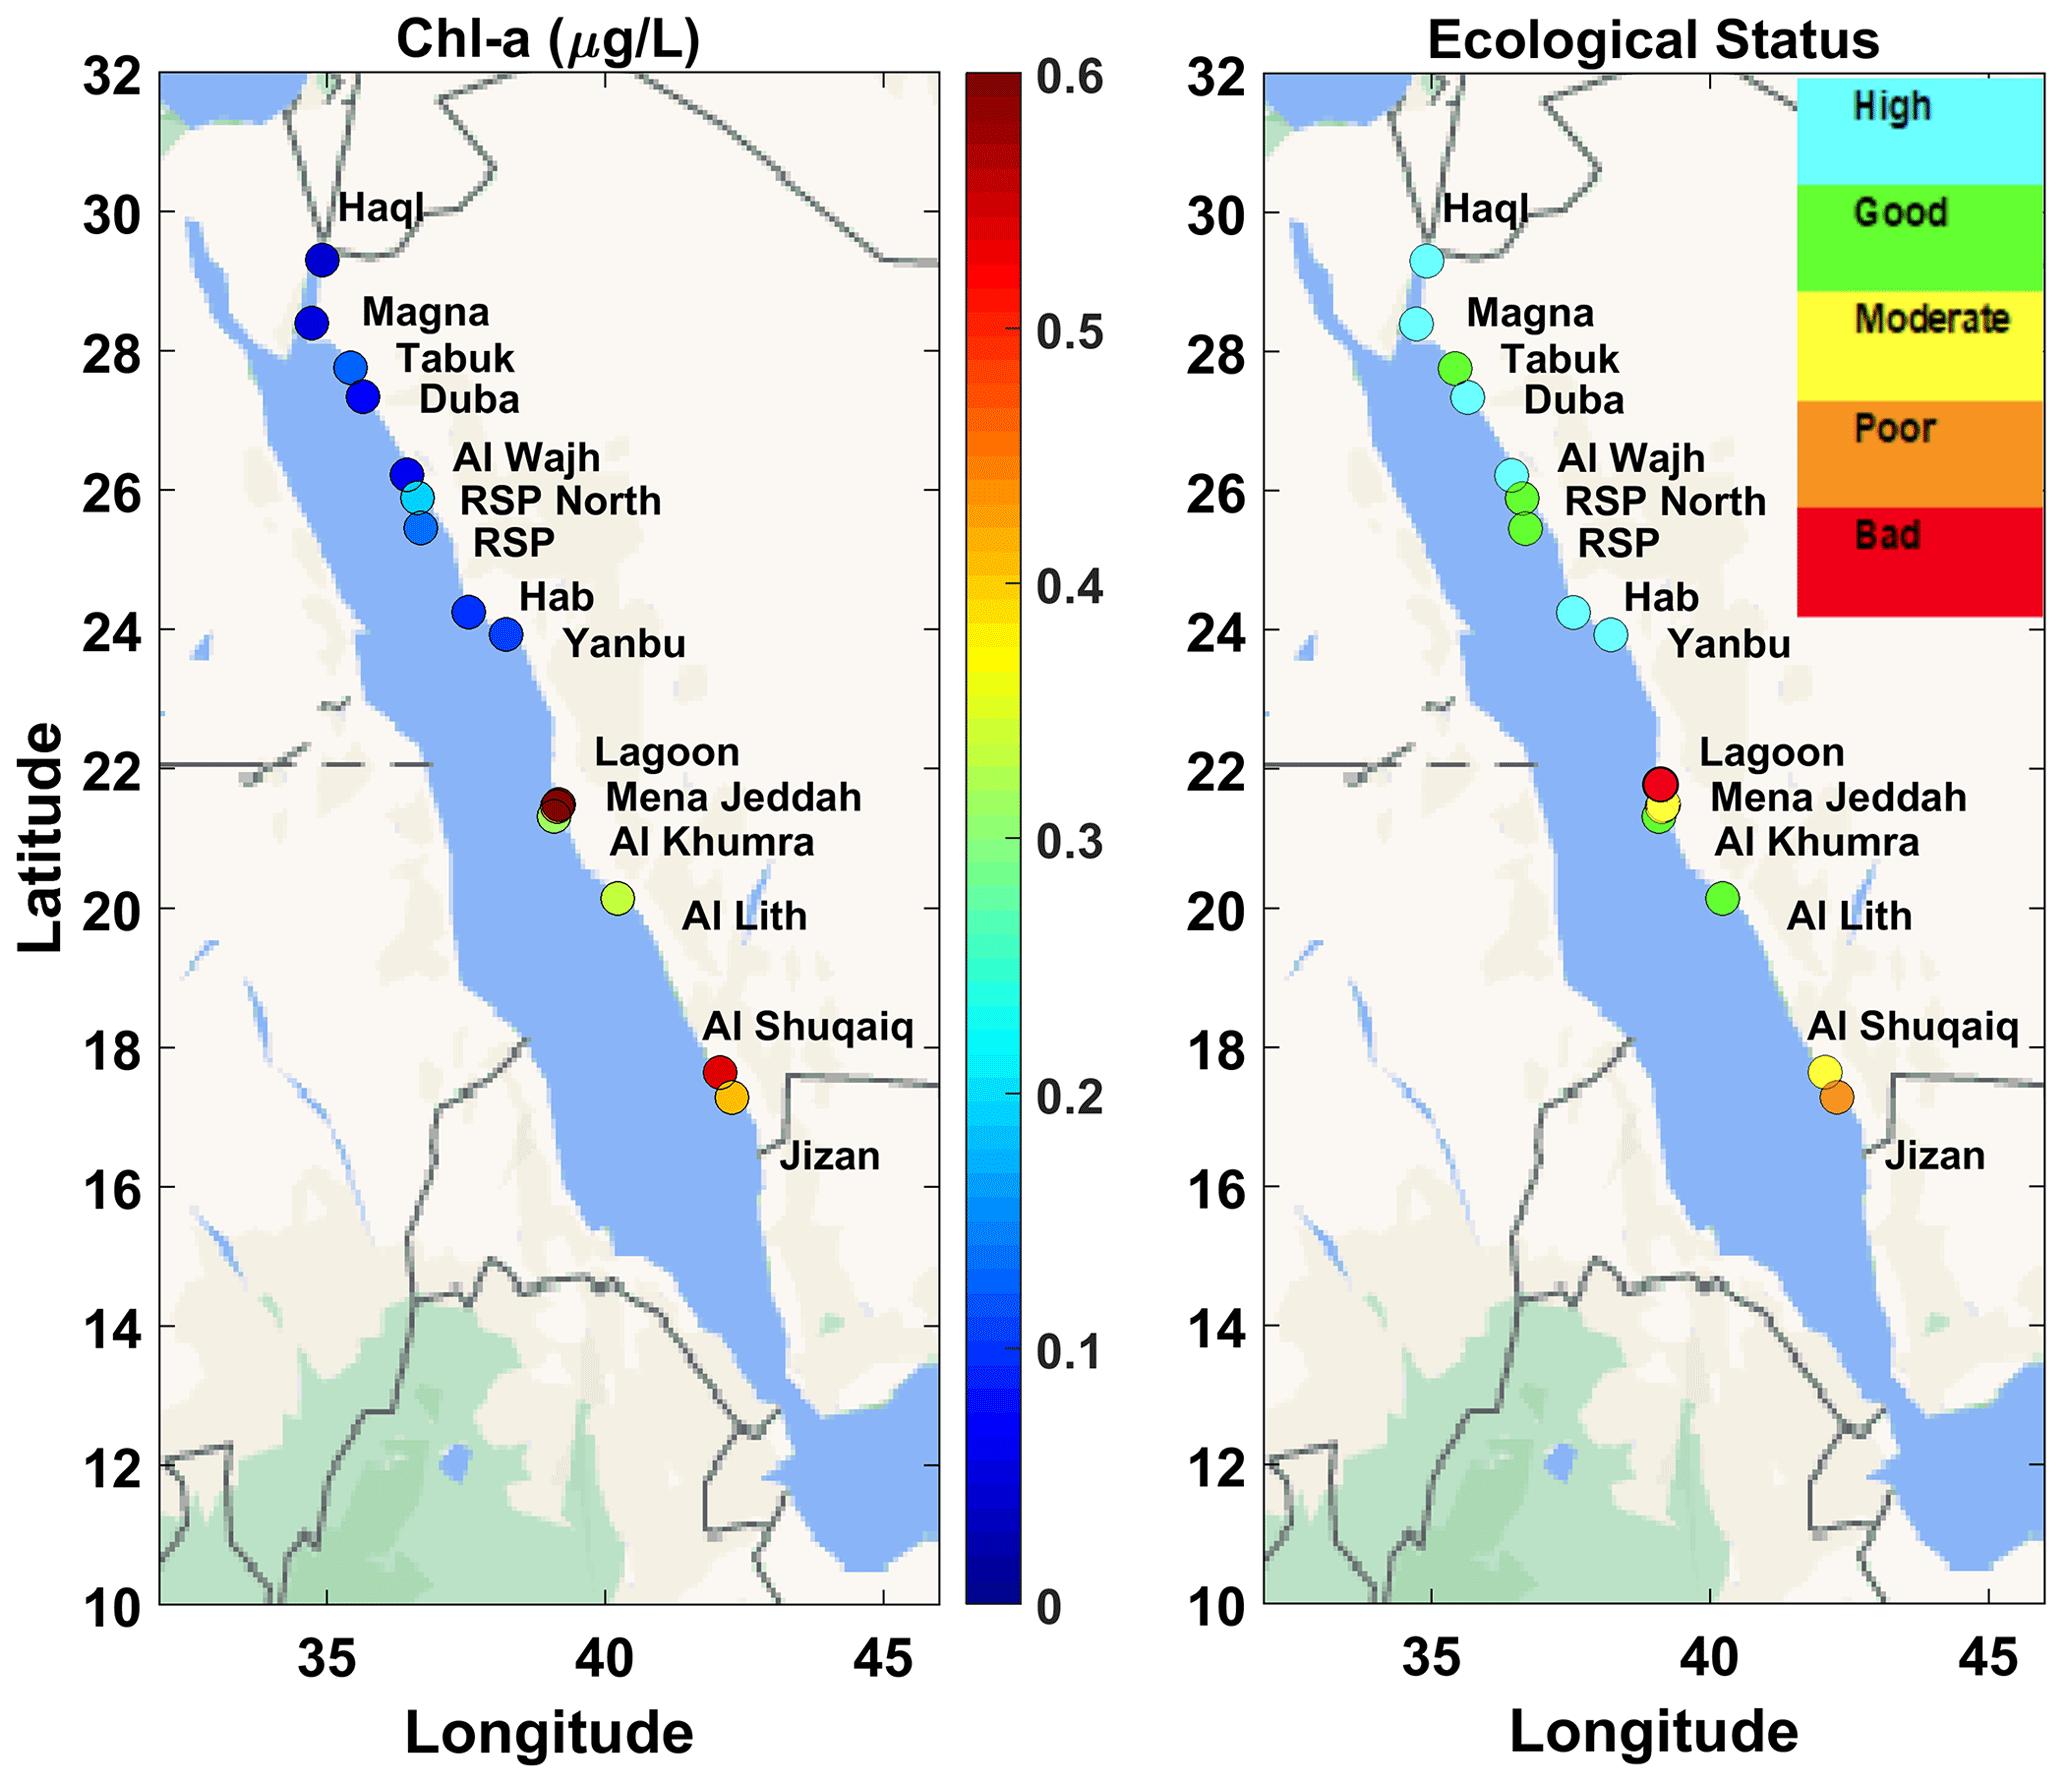
Figure 8Average Chl-a concentrations in the sampled marine areas along the coastline of the Red Sea (left panel) and the indicative assessment of ecological status based on Chl-a concentrations according to the five-scale classification scheme for the Eastern Mediterranean (right panel). The mapping presents the average concentrations for each area (average from all stations sampled in the area, average of mean integrated concentrations of the stations included in each area) Chl-a values at Jeddah Lagoon (left panel) ranged from 0.61 to 44 µg L−1 (© Google Maps 2021).
For the analysis of PCB in sediments, 3 g of dried sediment was extracted, following the addition of a mixture of CB112, CB155 and CB209 (used as internal standards), with a mixture of hexane and dichloromethane (1:1, ) using an accelerated solvent extractor (Dionex ASE 350). The extract was cleaned on an alumina glass column. The final determination of PCB was carried out by capillary gas chromatography using a non-polar column and an electron capture detector (Agilent 7890A GC). The quantitation was based on the abovementioned internal standards. Accuracy ranged from 69.3 % to 83.5 % for each congener and was controlled using a reference material (NIST SRM 1941b). Analytical uncertainties for each congener ranged from 27.1 % to 39 % (k=2). The following individual congeners were determined: CB28, CB52, CB101, CB118, CB105, CB138, CB153, CB128, CB156, CB170, CB180, CB183 and CB194. The LOD for each congener was 0.01 ng g−1.
The analysis of BTEX was performed using the equilibrium-based static headspace technique and gas chromatography–mass spectrometry according to EPA methods 5021A (2014) and 8260 (2018). Briefly, ∼3 g of wet sediment was collected in 20 mL headspace vials and kept at −20 °C until arrival at the HCMR laboratory. In the laboratory, VOC was determined using a headspace autosampler (HTA, HT2800T) and a gas chromatography–mass spectrometry system (Shimadzu GCMS-QP2020 NX). The following substances were quantified using an external standard mixture: benzene; toluene; ethylbenzene; and o-, m-, and p-xylenes. The LOD was 0.05 µg kg−1.
The analysis of phenols in sediments was based on the EPA (spectrophotometric) method 420.1 (1978). The sediments were frozen at −20 °C until their arrival in HCMR labs. In the lab, 15 g of sediment was put in 500 mL of distilled water, and the pH was adjusted to <4 using phosphoric acid. The sample was distilled, and total phenols were determined in the distillate by the 4-aminoantipyrine colorimetric method. The dye was extracted with chloroform, and absorbance was measured at 460 nm using a UV-2600 Shimadzu UV/Visible spectrometer and 100 mm cell. The detection limit was 0.1 µg g−1.
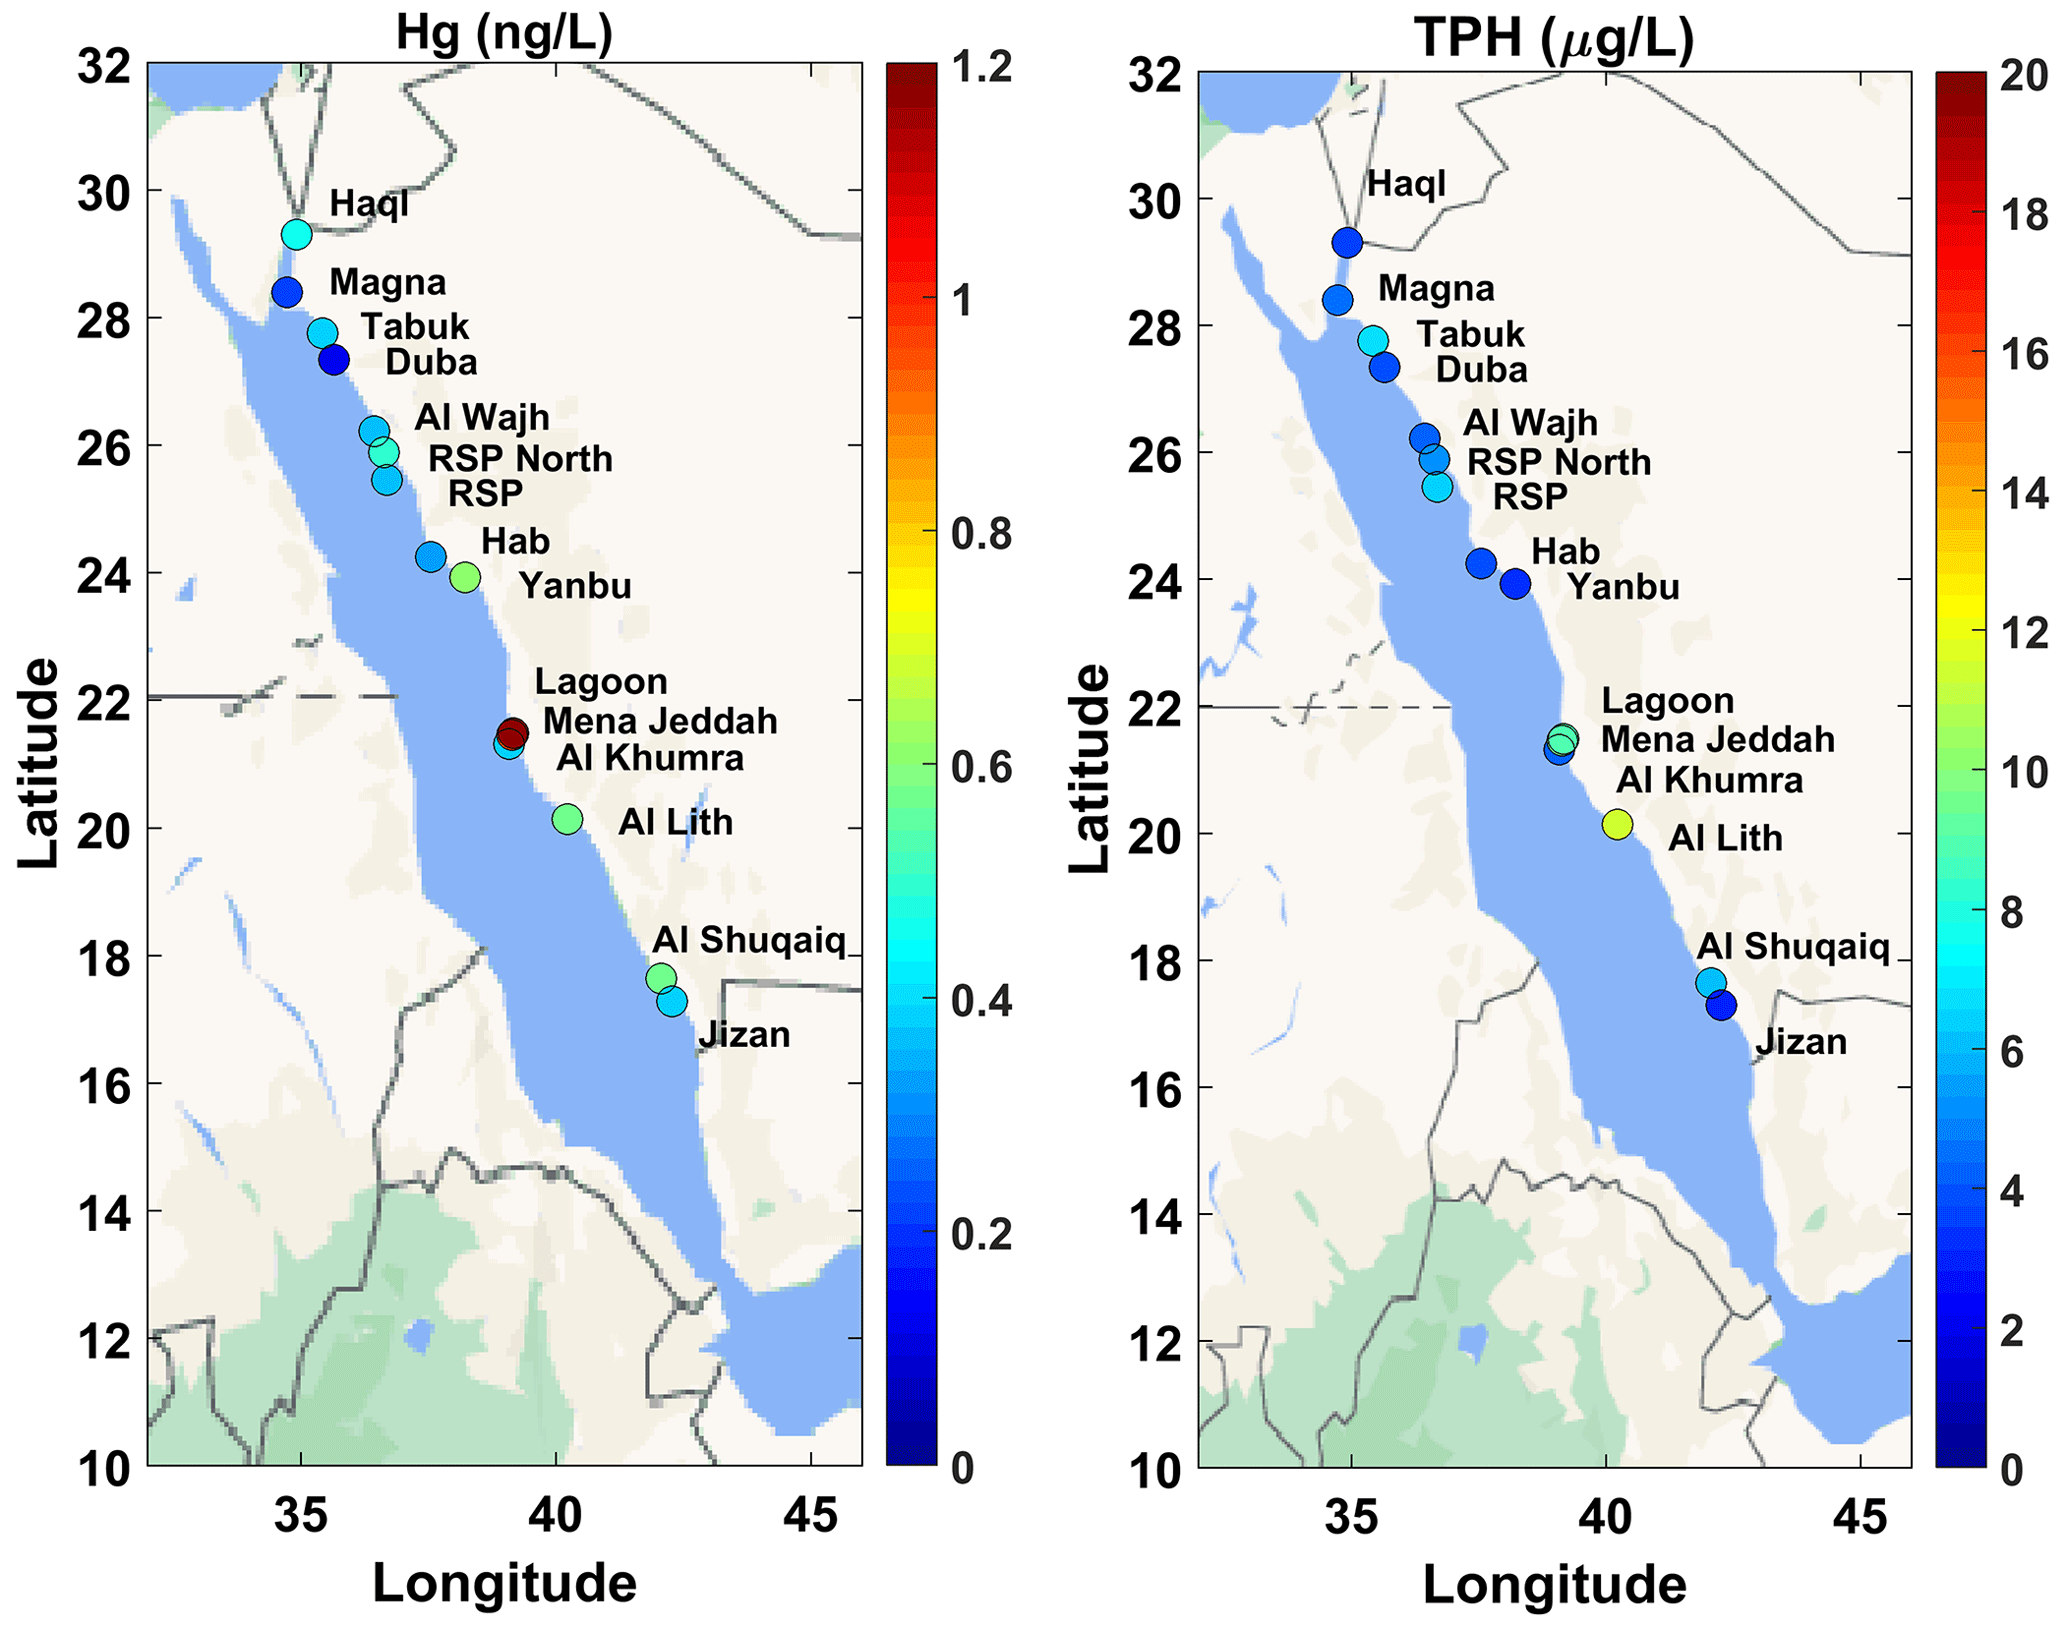
Figure 9Average total mercury (Hg; ng L−1) (left panel) and petroleum hydrocarbon (TPH) concentrations (µg L−1) (right panel) at the stations sampled in the Red Sea (© Google Maps 2021). The mapping presents the average concentrations for each area (average from all stations sampled in the area, average of mean integrated concentrations of the stations included in each area).
Major elements and trace metals in marine sediments were measured by an accredited method (EN ISO/IEC 17025:2017) using a wavelength-dispersive X-ray fluorescence (WDXRF) system. The LOD for this XRF method was calculated from a series of measurements of 5 samples for major elements and 10 samples for trace elements using the certified reference sample PACS-2. The LOD measurements were carried out in the same experimental conditions in which the sediment samples were analyzed (Table S3).
The calibration of the XRF method was carried out by scanning reference samples that contained a wide spectrum of element concentrations. For this calibration analysis, several rock and sediment samples were gathered, mainly from the U.S. Geological Survey and the National Research Council of Canada Reference Materials. Fused beads and powder pellets were prepared carefully, and all samples were scanned for major and trace elements. All measurement parameters were configured through the software, building two distinct “applications” and selecting the optimum settings for each element separately. Subsequently, element concentrations were plotted against the measured intensities, and a linear fit was generated by regression. Theoretical alpha corrections and possible line overlaps were carefully resolved until the lowest mean error of the fit was obtained. Accredited trace elements are As, Co, Cr, Cu, Mn, Mo, Ni, Pb, Sb, Sn, Sr, V, Zn, Ag, Ba, Bi, Br, Cd, Ce, Cs, Ga, Ge, Hf, Hr, I, La, Nb, Nd, Rb, Sb, Sc, Se, Sm, Sn, Sr, Ta, Te, Th, Tl, U, W, Y, Yb and Zr. Accredited major elements are Fe2O3, CaO, TiO2, Al2O3, K2O, MgO, Na2O, P2O5, SO3 and Si2O.
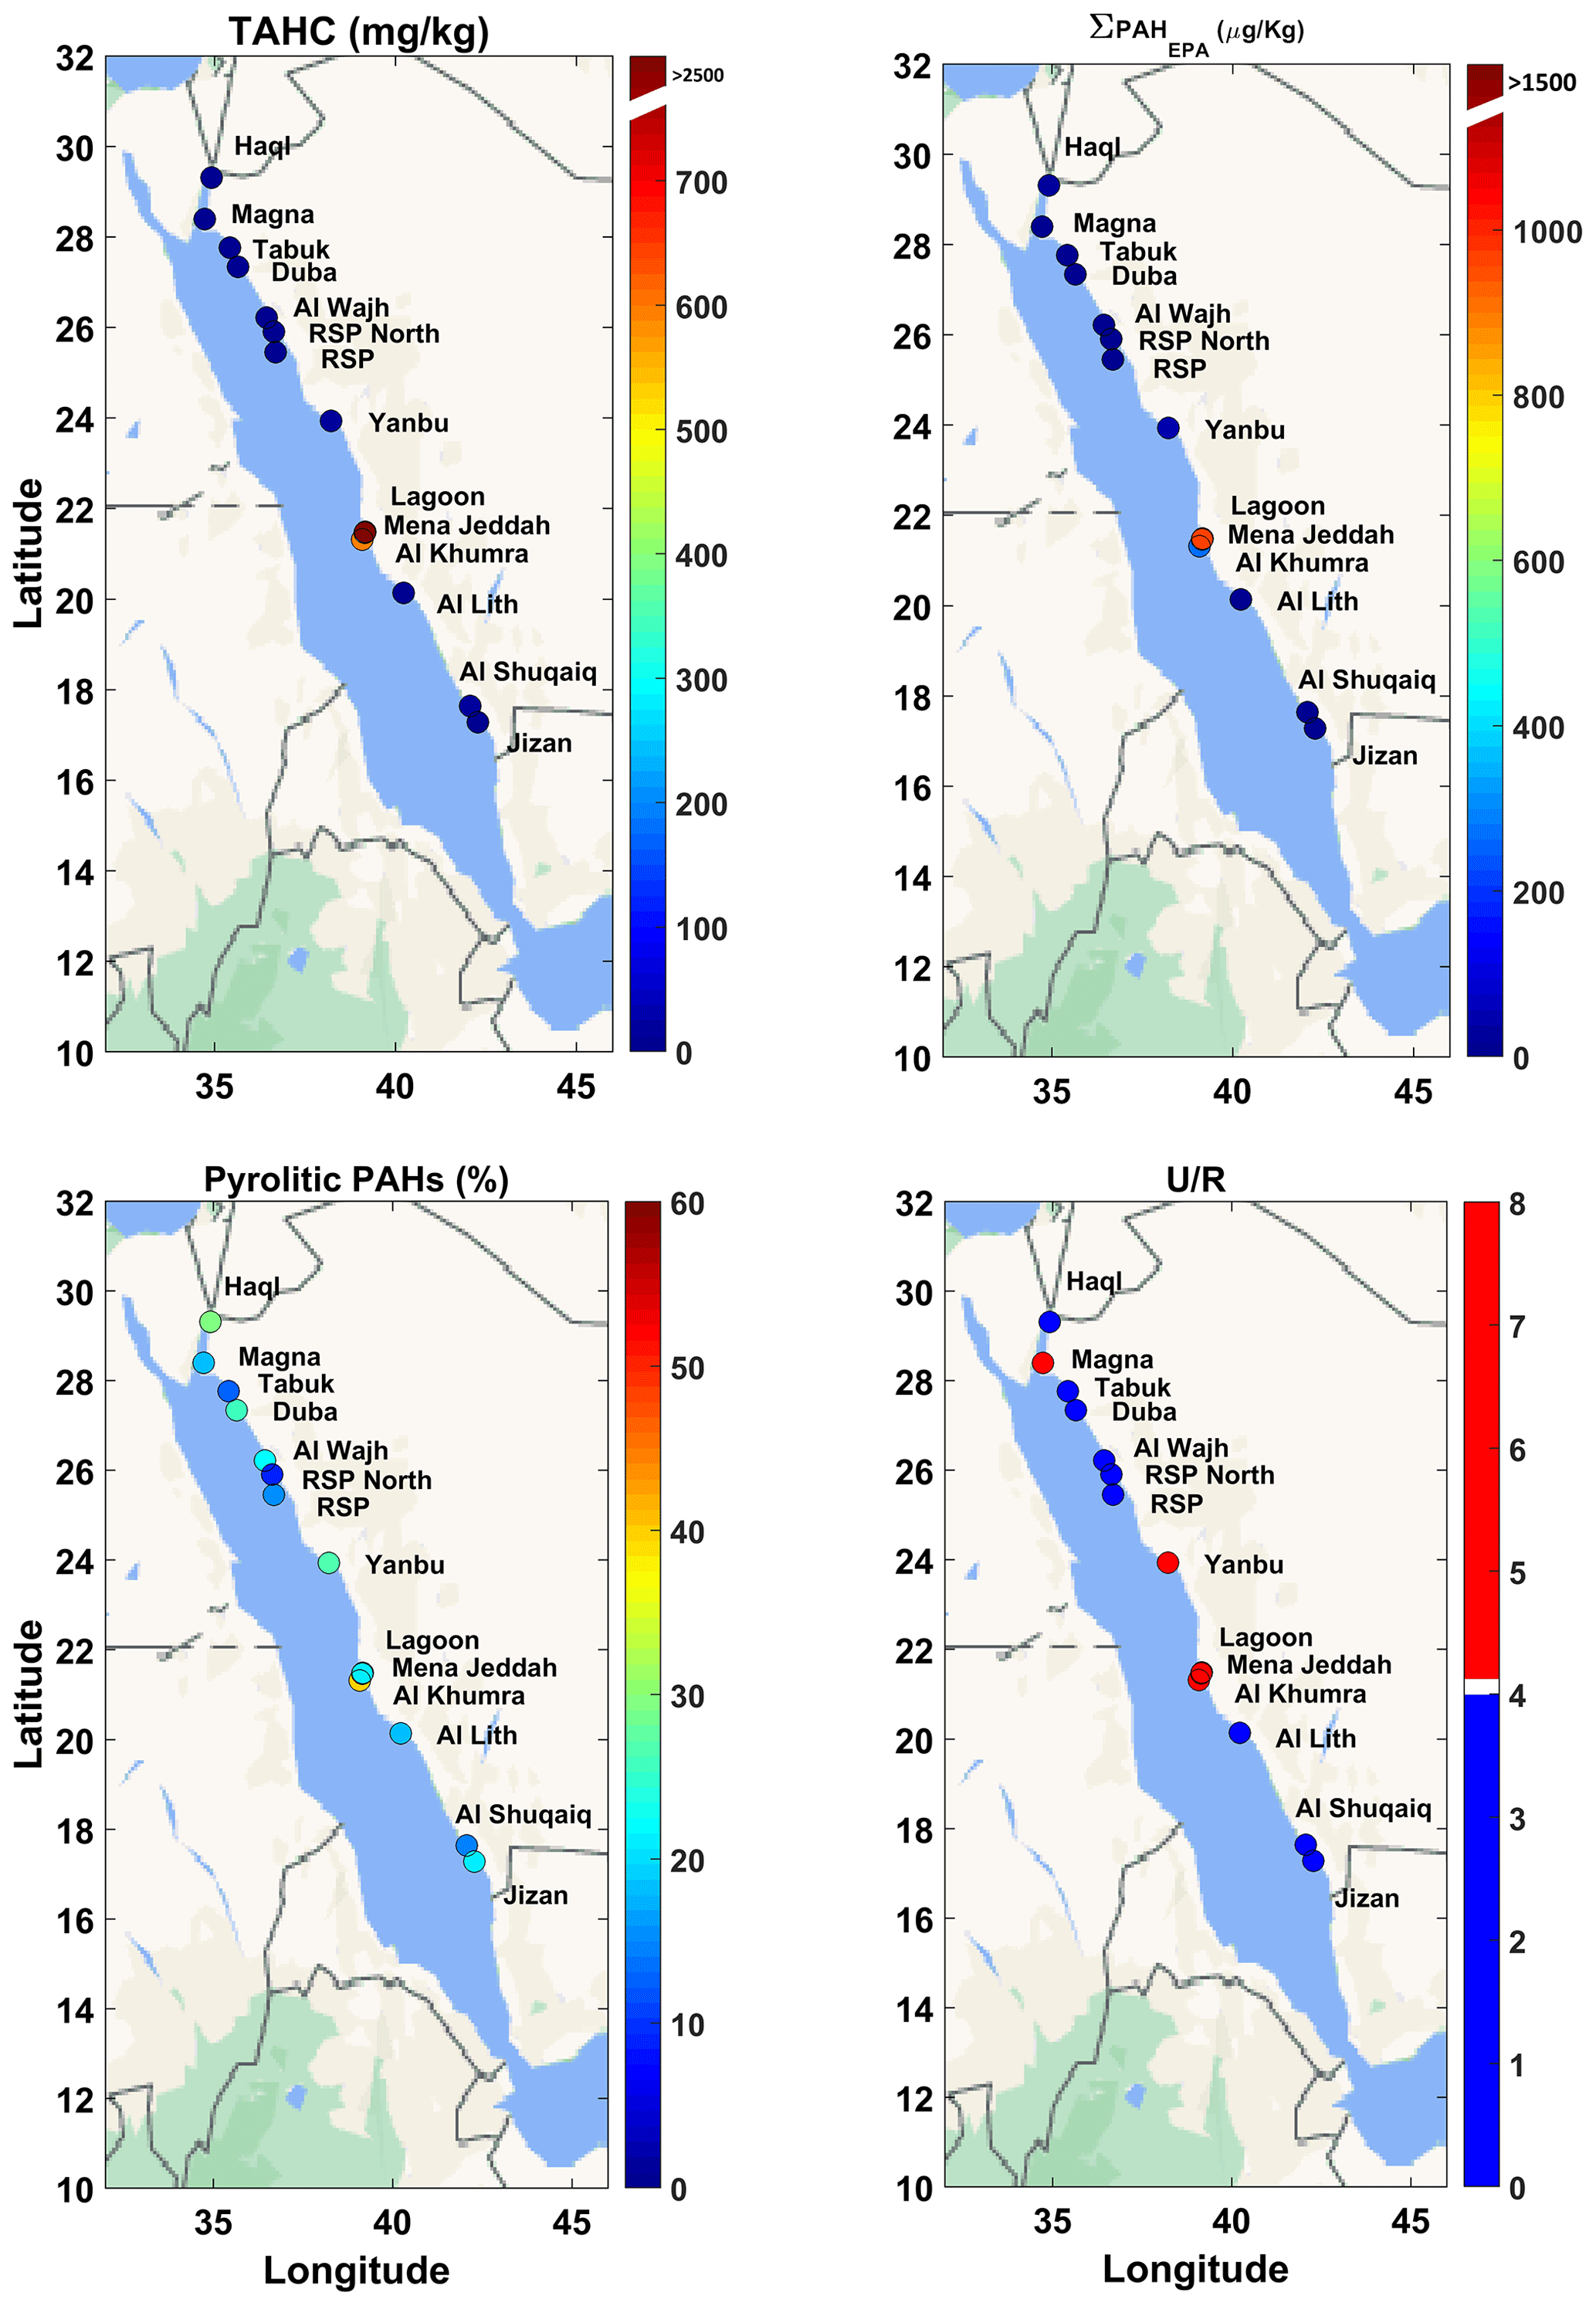
Figure 10Total aliphatic hydrocarbon concentrations (TAHCs; mg kg−1), total EPA PAH concentrations (∑PAHEPA), unresolved/resolved (U/R) diagnostic ratio and percentage contribution of pyrolytic PAH in sediments for each site in the Red Sea (© Google Maps 2021). The mapping presents the average concentrations for each area (average from all stations sampled in the area, average of mean integrated concentrations of the stations included in each area). For the U / R diagnostic ratio, the color scale indicates average values >4 (red color) or <4 (blue color) for all study sites.
Here, we present the essential physical and biochemical parameters related to the hydrography and the quality of seawater and sediments of the Arabian Gulf and Red Sea study areas (SEANOE, https://doi.org/10.17882/96463, Abualnaja et al., 2023). A principal goal is to trace contaminants from pollution sources along the coastal zone of Saudi Arabia. In addition, the data establish the baseline for the future design of monitoring strategies of the Saudi Arabian coastal marine environment.
4.1 Red Sea
4.1.1 Physical parameters
The water properties measured during the Red Sea cruise would be expected to conform with the general picture of the regional physical oceanography prevailing during the sampling period.
The temperature–salinity (T–S) diagram presenting all the CTD casts of the Red Sea surveys displays the general physical characteristics of the water masses (Fig. 2). Expectedly, general gradients in both temperature and salinity are evident, with temperature increasing and salinity decreasing from north to south, a trend consistent with the previous studies of Neumann and McGill (1962), Maillard and Soliman (1986), Sofianos and Johns (2007), and Ali et al. (2018). In particular, the densest water, with the highest salinity and lowest temperatures, is found within the Gulf of Aqaba (Fig. 3). In general, the potential temperature (hereafter, temperature) values ranged between 21 and 36 °C, which are typical for the mid-summer period (Sofianos and Johns, 2007). The north–south gradient of surface salinity, typical for the Red Sea due to the general northward propagation of relatively fresher water from the Gulf of Aden (Sofianos and Johns, 2007; Churchill et al., 2014a), is evident, with high surface values (40.7) within the Gulf of Aqaba, decreasing to 38 towards the southern region near the Jizan area. The CTD profiles acquired at shallow stations (<100 m) show almost constant temperature and salinity with depth, whereas, at the deeper areas, the temperature tends to decrease while salinity increases with depth. Additionally, due to the shallow bathymetry of the coastal areas, they are more susceptible to local atmospheric forcing, with increased temperature compared to offshore during the cruise period.
The T−S properties at the hotspot sites reveal potential signs of pressures on the coastal ecosystem. Low salinity, detected within the Jeddah Lagoon system, indicates the input of fresher water, possibly consisting of sewage effluent as observed by Peña-García et al. (2014). A slight increase in temperature and salinity within the Jeddah Islamic Port, compared to the stations located outside the port, could be attributed to water stagnation in the port. Differences in temperature and salinity values at Al Shuqaiq and Al Lith can be attributed to water discharges linked to desalination plant and aquaculture activities, respectively. In general, the brine discharge at discharging plume in the Red Sea is getting diluted within 10–20 m (Raventós et al., 2006; Fallatah et al., 2018). However, the accurate detection of the plume dispersion area would require a dedicated, denser grid of stations, which was beyond the implementation of this survey. In addition, an approximate estimation of the plume dispersion would require precise knowledge of the brine water supply from the desalination plants.
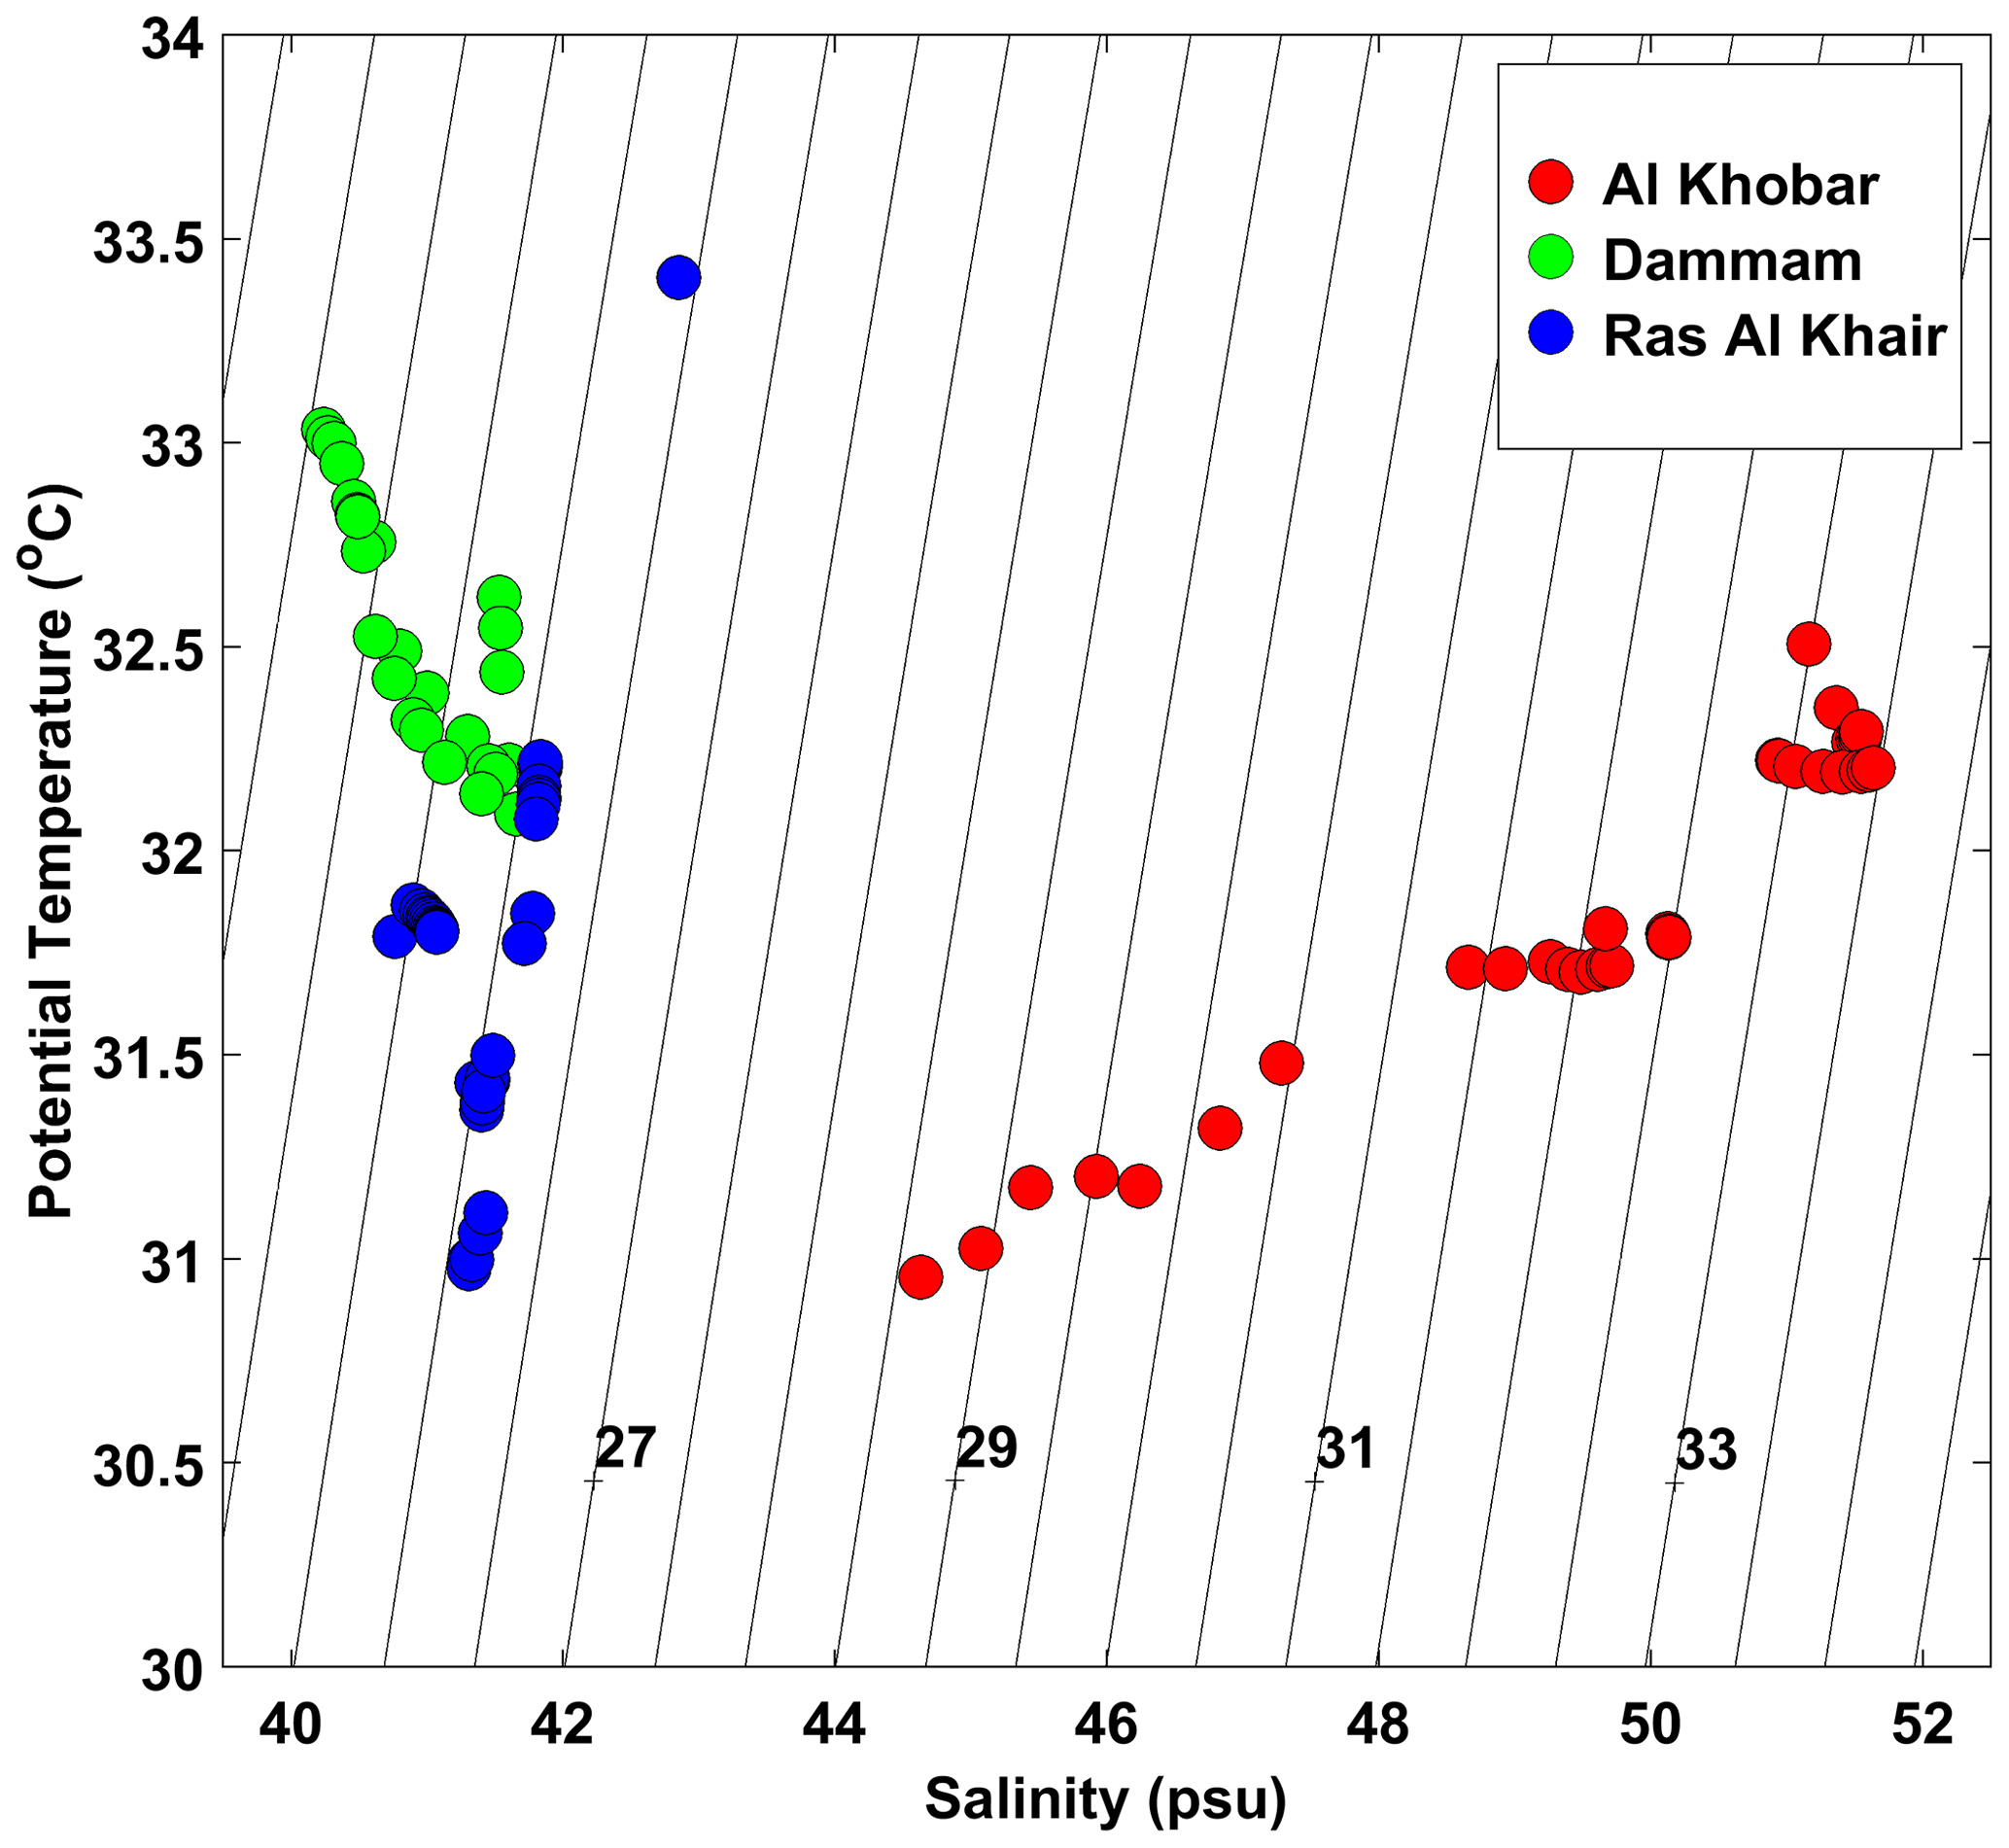
Figure 11T–S diagram for all measured stations in the Arabian Gulf. The three colors of dots represent the three hotspot sites. Measurements are averaged every 1 m in the water column up to 0.5 m from the sea bottom.
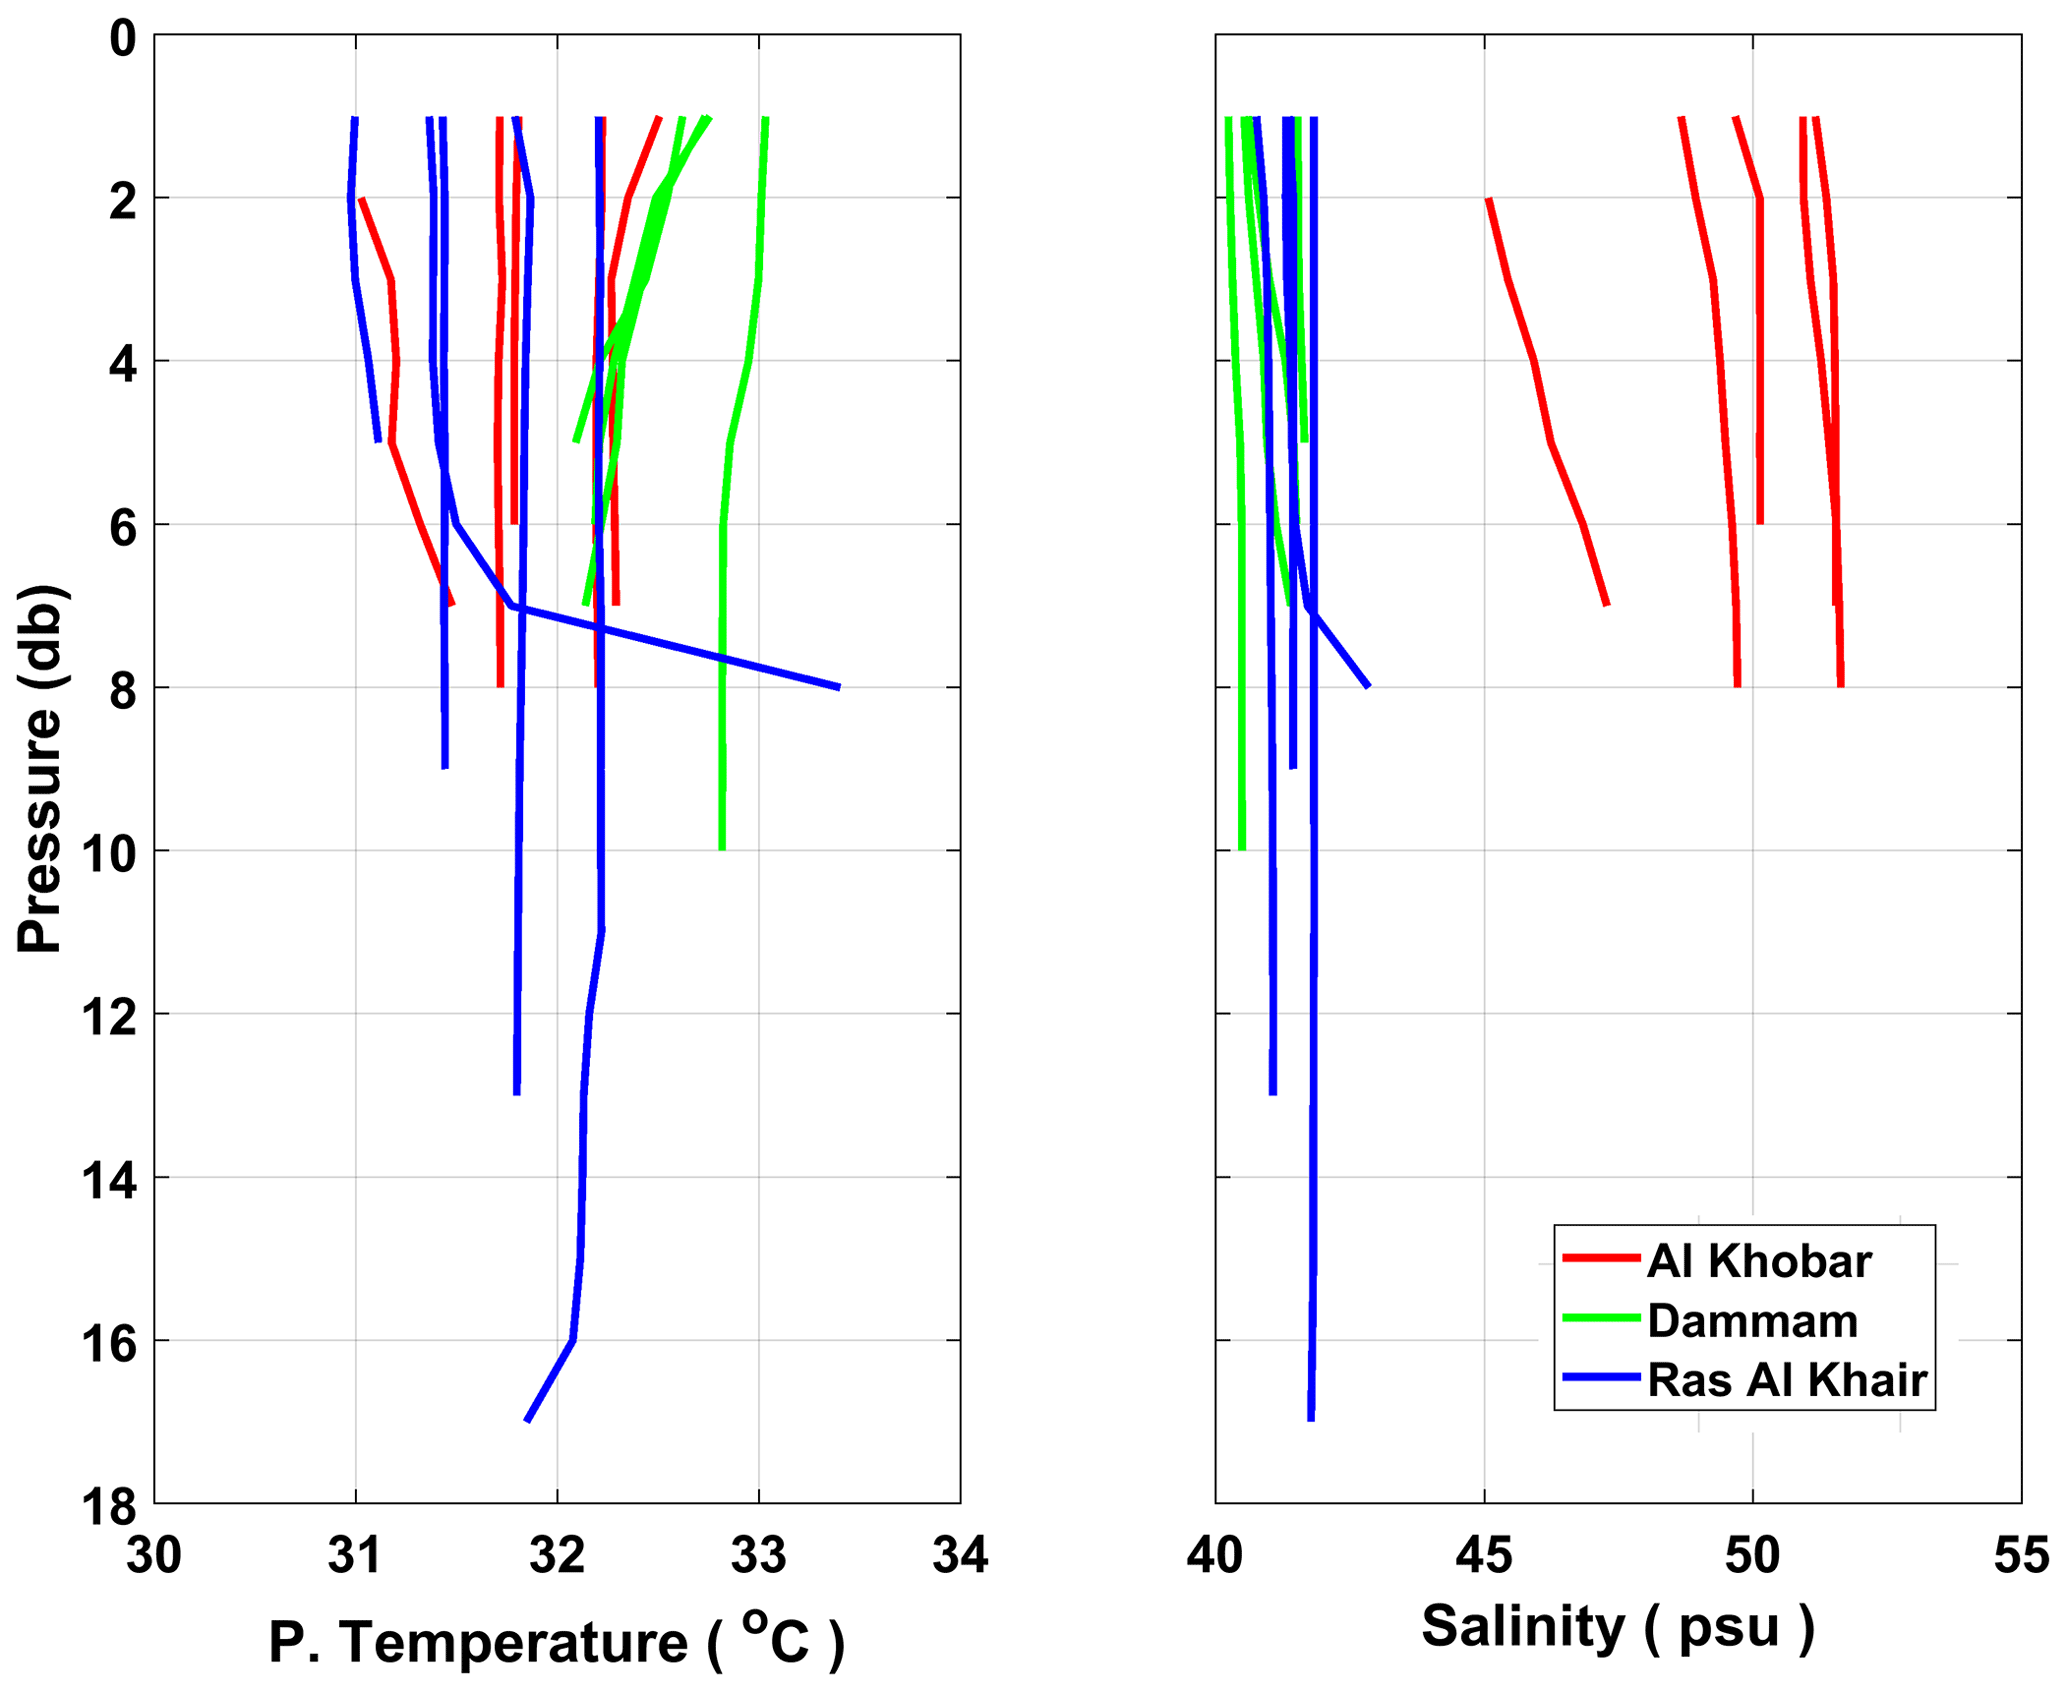
Figure 12Vertical profiles of Potential Temperature and Salinity in the study areas of the Arabian Gulf.
Regarding the current measurements, the surface currents range from weak, on the order of ∼2–3 cm s−1, to substantial, reaching values of 17–25 cm s−1. Dominant northward flow only appears at stations located in the north Red Sea, whereas multi-directional flow seems to be the rule at most stations (Fig. 4). Pavlidou et al. (2021) have found that sub-surface currents in the depth range of 18–60 m are mostly in the same direction as the near-surface ones and parallel to the nearby coast. Moreover, it should be mentioned that, in practical terms, our velocity data were collected in June 2021 during lunar days, which were away from the spring tides near the new moon and the full moon days, which were on 10 and 24 June, respectively, and the tidal influence is expected to be very low.
4.1.2 Biogeochemical parameters
The results obtained during the cruise in June 2021 in the Red Sea coastal area showed that the Gulf of Aqaba appears to be better oxygenated through the whole water column, from the surface to the bottom layer, while a decrease in oxygen near the bottom (115 µmol L−1), which is possibly connected to the organic material accumulated near the bottom, is recorded at the majority of the sampling stations. As recently reported by Povinec et al. (2023), in the Gulf of Aqaba, the first 300 m of the water column indicates stable DO values of about 210 µmol L−1, whereas DO of about 3.5 µmol kg−1 was measured below the depth of 500 m. Conversely, in the open Red Sea, DO minimum values from 0.6 to 1.25 µmol kg−1 were observed at depths from 300 to 450 m, showing a decreasing trend below 150–200 m.
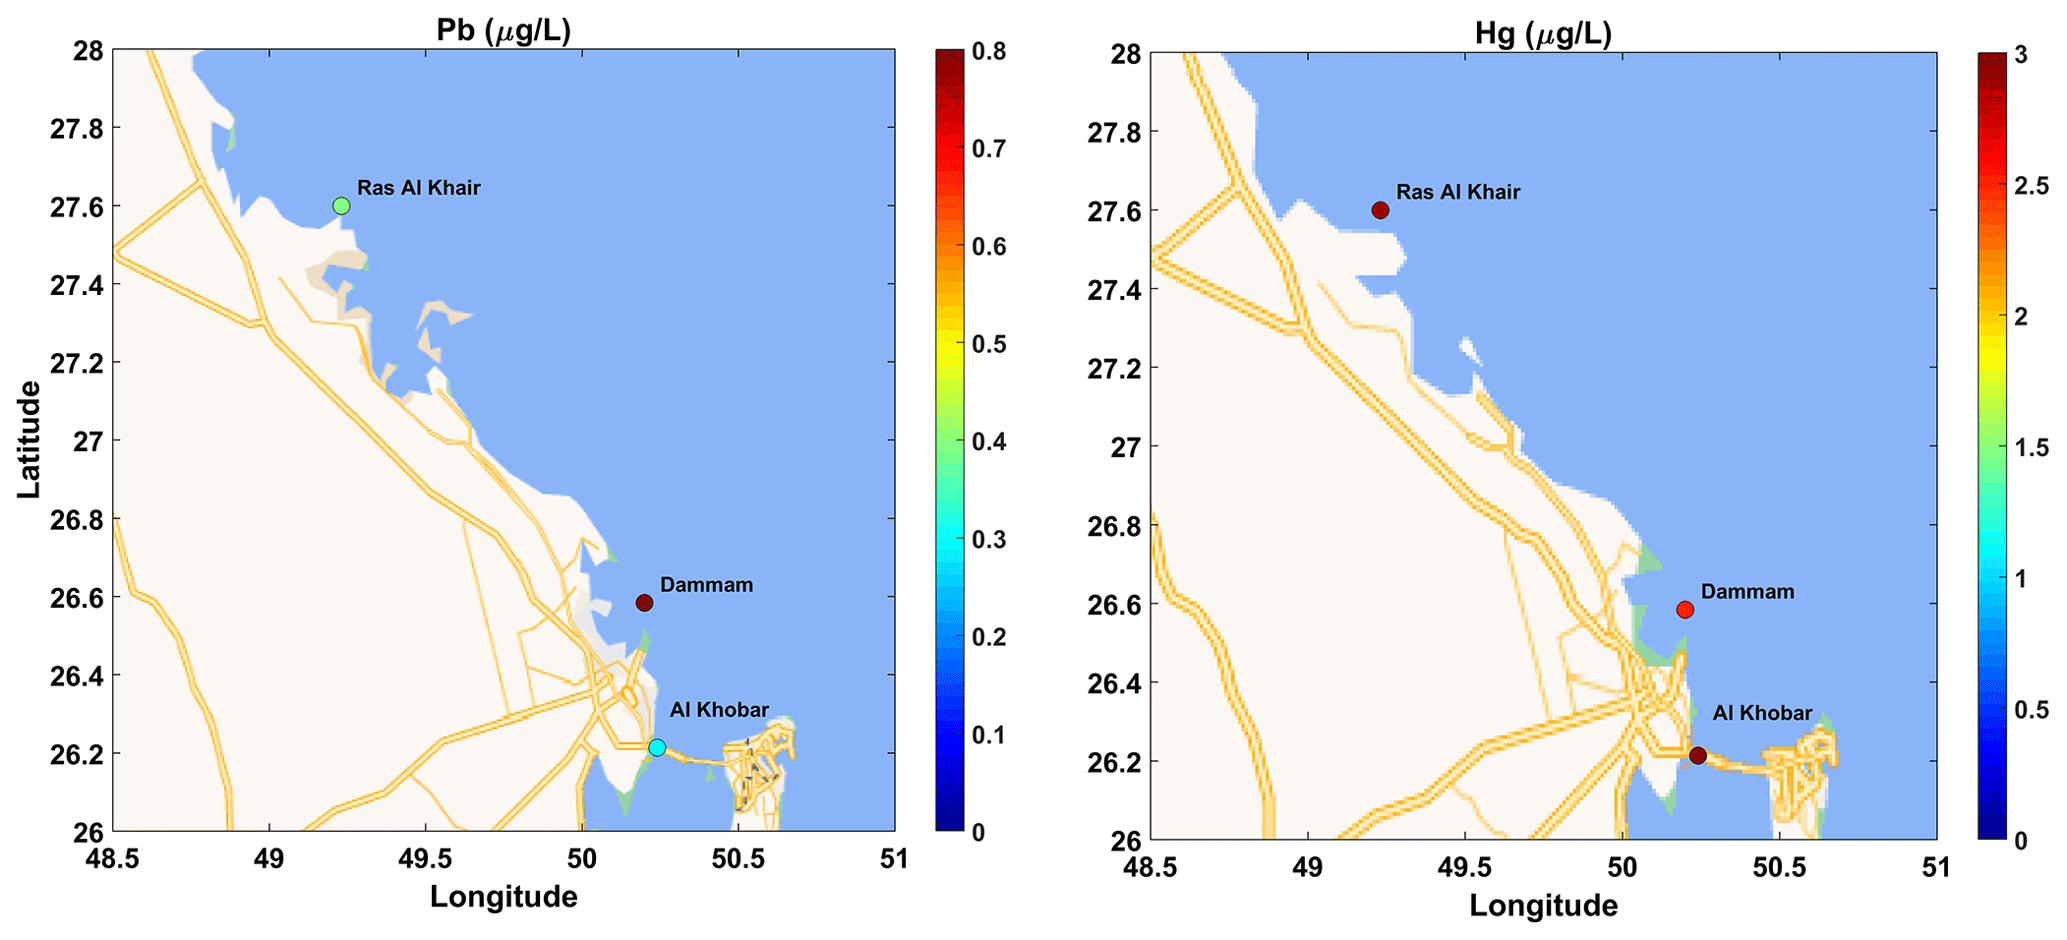
Figure 13Average lead (Pb; mg L−1) (left panel) and total mercury (Hg; ng L−1) (right panel) in the Arabian Gulf (© Google Maps 2021). The mapping presents the average concentrations for each area (average from all stations sampled in the area, average of mean integrated concentrations of the stations included in each area).
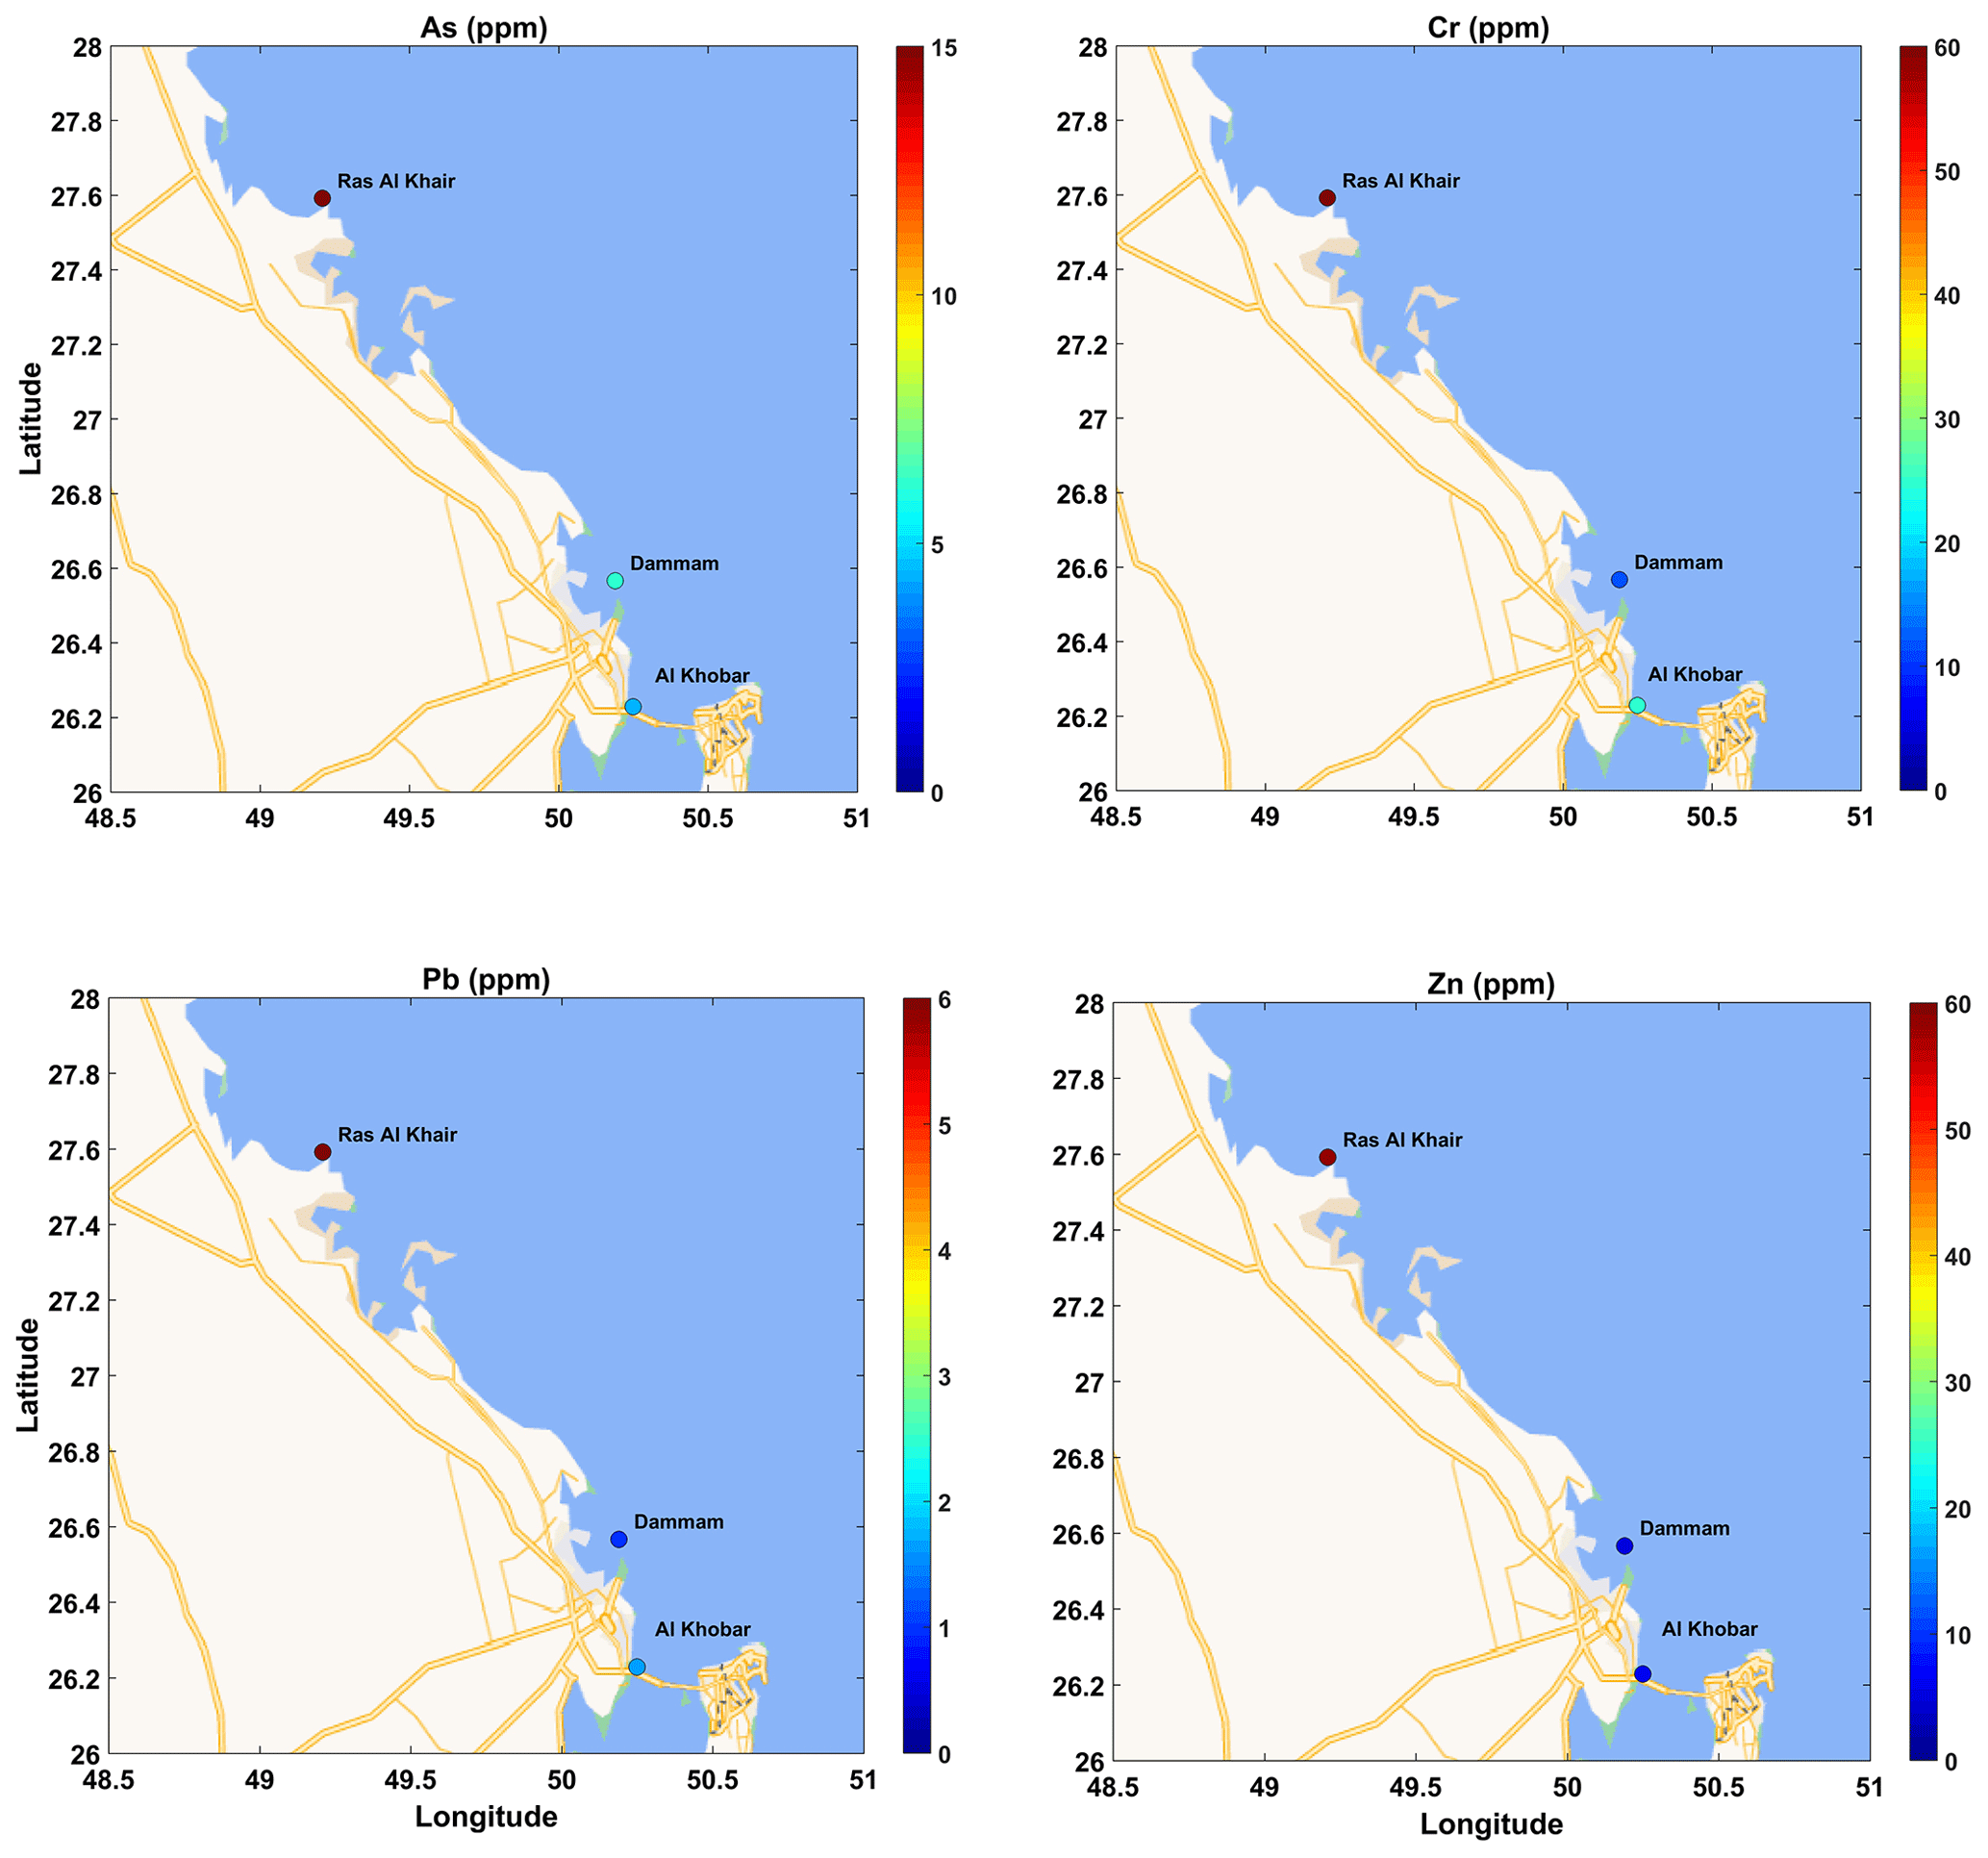
Figure 14Average metals in sediments in the Arabian Gulf (© Google Maps 2021). The mapping presents the average concentrations for each area (average from all stations sampled in the area).
The assessment presented herein aims to identify the areas facing eutrophication and/or pollution problems. In general, in the Red Sea, north−south increasing gradients were evident for some of the parameters studied, revealing a link between the hydrographic conditions and biogeochemical properties. Nutrients and organic carbon revealed high values at Jeddah Lagoon (Figs. 5–7), which is a unique system with low water renewal and pollution mainly from domestic sewage (Peña-García et al., 2014). The nitrite values at Jeddah Lagoon were high (3.06–3.90 µmol L−1), and the highest ammonium values (2.90 µmol L−1) were found at the station (L03), whereas total dissolved nitrogen was extremely high at the same station, reaching 167 µmol L−1. At all other sites of the Red Sea, nitrate+nitrite was low in the euphotic zone and increased with depth. Nitrate+nitrite values in the euphotic layer (approximately 0–100 m) ranged between below the LOQ and 2.30 µmol L−1, with the exception of two relatively high values detected at Al Khumrah, close to the sewage outfall (3.43 µmol L−1), and station AL1 of the Al Lith grid (5.78 µmol L−1). These values exceed the commonly observed values in coastal areas and could indicate organic load from anthropogenic activity. Figures 8 and 9 illustrate the distribution of Chl-a and selected pollutants (metals and organic) along the north–south section. Higher Chl-a values recorded in the southern Red Sea correlate with relatively higher nutrient concentrations, which are influenced by the Gulf of Aden Intermediate Water (GAIW), the inflow of nutrient-rich water entering the Red Sea from the Gulf of Aden through the Bab-el-Mandeb Strait (Churchill et al., 2014b). In this survey, the Chl-a concentrations did not exceed 1 µg L−1 at any site except from Jeddah Lagoon, where extremely high Chl-a values reaching 40 µg L−1 were sometimes measured within the Jeddah Lagoon system. The Kingdom of Saudi Arabia has set maximum allowable values only for ammonium (5.5 µmol L−1), whereas it has not set maximum allowable values for Chl-a. The Abu Dhabi Quality and Conformity Council (2017) set 1 mg L−1 as the maximum allowable concentration of Chl-a for ambient marine waters, whereas in the Eastern Mediterranean the target values for the “Good” environmental status is 0.53 µg L−1 (EC Decision 2018/229/EU). Regarding Chl-a distribution, it seems that the ecological status of the water at the southernmost site of the Red Sea, Jizan Economic City, is classified as poor, which corroborates the algal blooms observed in this area during summer and early Autumn 2021 (personal communications with the emirate of Jazan Province). This area may be affected by water intrusion from the south and atmospheric deposition. The deposition of material transferred by dust storm events may also influence the ecological quality of the water in the area, since during the summer period, the Tokar Gap frequently channels strong winds onto the sea surface, causing African dust storms spreading over the southern part of the Red Sea (Jiang et al., 2009; Garrison al., 2010).
Sediments at all of the Red Sea study sites are found to be enriched in some metals (e.g., As). This finding should be further investigated via sampling and analysis of sediment cores in order to define the geochemical background of the region. Moreover, AHC, PAH and PCB, which constitute important classes of organic contaminants that may cause degradation and pose a risk of serious damage in the marine environment, are determined in surface sediments collected from the coastal zone of the Red Sea (Fig. 10). The examination of various indices reveals a chronic petroleum-associated anthropogenic pressure in Jeddah Lagoon system, Jeddah Islamic Port (Mena Jeddah) and Al Khumrah, whereas some petroleum residues were also found at King Fahad Industrial Port Yanbu, Mena Jeddah, shrimp and fish farms near Al Lith, and to a lesser extent at Magna.
Organic pollution in the Jeddah Lagoon system and at King Fahad Industrial Port Yanbu is also confirmed by BOD values (4.5 mg L−1 inside the port to 7.7 mg L−1 in the lagoon), and fluoride values at the northern part of the Gulf of Aqaba confirmed the effect of the phosphate terminal in the Port of Aqaba in Jordan due to cross-border pollution. However, it seems that industrial activities probably enrich the coastal zone of the Red Sea with organic pollutants.
4.2 Arabian Gulf
4.2.1 Physical parameters
Salinity is the main indicator for local differentiations in the Arabian Gulf. A broad range of salinity values is observed, with higher salinity close to the coastline at Ras Al Khair and, especially, at Al Khobar, reflecting the effects of the local desalination plants and their brine discharges. The CTD casts conducted during the survey are plotted in a T–S diagram (Fig. 11) with the different sampling sites distinguished by different colors. In general, temperature values ranged from 31.0 to 33.5 °C. The salinity measurements span a wide range of hypersaline values, from 40 to 52. The lowest salinity was measured at DM4, a station that can be considered a reference for the Dammam and Al Khobar sea areas and as the most representative one for the regional open sea salinity values, which according to earlier studies are around 40 over the western part of the Gulf (John et al., 1990; Chao et al., 1992). Along with the hydrological characteristics of the gulf and the regional morphology, the presence of this desalination plant seems to be the major factor that leads to extremely high salinity values at the study site of Al Khobar (Fig. 12). In the Arabian Gulf, salinity increases >2 are rarely seen beyond a 400 m radius of the desalination plants's outfalls (Roberts et al., 2010), although in some cases they can extend to several kilometers, as in the case of Az Zour power and desalination plant in southern Kuwait (Uddin et al., 2011).
4.2.2 Biogeochemical parameters
In terms of the eutrophication and pollution status of the three areas in the Arabian Gulf, the Dammam is supposed to be affected by wastewater discharges (Mahboob et al., 2022). The concentrations of inorganic nutrients and organic phosphorus are low at all three sites, indicating that eutrophication is not affecting these specific sites during the sampling period. However, dissolved organic nitrogen and carbon values are relatively high, reaching a maximum value of 18.8 µmol L−1 for nitrogen and 477 µmol L−1 for organic carbon. Relatively higher Hg and Pb concentrations (0.55–5.90 µg L−1 for Hg and 0.18–1.25 µg L−1 for Pb) were found in the water column (Fig. 13), which is probably linked to the industrial activities in these areas and/or atmospheric deposition (for Pb). However, it should be noted that this analysis only provides a snapshot of the status in the water column at one point in time and that eutrophication-related parameters exhibit strong seasonal variation.
The measurements showed that similar concentration ranges of metals were detected in the Arabian Gulf and Red Sea coastal waters in June 2021. It is noteworthy that TPH was low in the Arabian Gulf. However, sediments at Ras Al Khair were found to be polluted with metals and, in some cases, exceeded the allowable values set in the Abu Dhabi specifications: 7.0 mg L−1 for As, 52 mg L−1 for Cr, 30 mg L−1 for Pb and 125 mg L−1 for Zn (Abu Dhabi Quality and Conformity Council, 2017) (Fig. 14). By contrast, TPH was surprisingly low in the Arabian Gulf. However, sediments at Ras Al Khair, and especially at Al Khobar, were found to be polluted with metals. Regarding the degree of contamination, it seems that sediments in the Arabian Gulf are severe-to-heavily (Al Khobar) metal polluted. Thus, an additional, more detailed study of the Arabian Gulf, with finer coverage of the coastal zone from Khafji to Al Khobar, is highly recommended.
Data described in this manuscript can be assessed at SEANOE: https://doi.org/10.17882/96463 (Abualnaja et al., 2023).
This is the first broad coverage study in a one-off sampling campaign in the Saudi Arabian coastal zone. To the best of our knowledge, these cruises constitute the first multidisciplinary and geographically comprehensive survey of contaminants within the Saudi Arabian coastal waters and sediments, extending from near the Saudi–Jordanian border in the north of the Red Sea to Al Shuqaiq and Jizan Economic City (close to the Saudi–Yemen border) in the south, as well as in the Arabian Gulf, including the areas of Al Khobar, Dammam, and Ras Al Khair. The assessment presented in this work, aimed to identify the areas facing eutrophication and/or pollution problems. In general, in the Red Sea, north–south increasing gradients were evident for some of the parameters studied, revealing a link between the hydrographic conditions and biogeochemical properties. Sediments at all of the Red Sea study sites were found to be enriched in arsenic. In the Arabian Gulf, salinity was defined as the main indicator of local differentiation. A broad range of salinity values were observed, reflecting the effects of the local desalination plants and their brine discharges.
The supplement related to this article is available online at: https://doi.org/10.5194/essd-16-1703-2024-supplement.
YOA, AP and JHC designed the research. AP, IoH, DV, HK, VPP, GA, HK, TK, CP, CZ, DB, EP, VP, AA, SC, VF, SI, GK, AK, GK, DP, AP, GP, EP, ER, IS, ET, PZ, AY, TZ performed the analysis and prepare the data. YOA, AP, JHC, DV, HK, CP, DB, AA, AK, GK, GP, EP, ER, PZ, TZ, AAA, YOA, AA, HAS, TB abd RM performed the field work. AP wrote the paper with comments from YOA, JHC, IoH, DV, VPP, IbH, AK. AP and DP produced metadata and thematic maps.
The contact author has declared that none of the authors has any competing interests.
Publisher’s note: Copernicus Publications remains neutral with regard to jurisdictional claims made in the text, published maps, institutional affiliations, or any other geographical representation in this paper. While Copernicus Publications makes every effort to include appropriate place names, the final responsibility lies with the authors.
This publication is based on work supported by the funded project “Marine and Coastal Assessment Protection Study for the Kingdom of Saudi Arabia Coastline” (under contract number 062/475000300/284) made between the Saudi National Center for Environmental Compliance (NCEC) and King Abdullah University of Science and Technology (KAUST). Captain Theodoros Kanakaris, the crew and the scientific staff of R/V AEGAEO are acknowledged for their assistance and valuable support during the cruise. We especially appreciate the collaboration with and advice offered by the other Marine and Coastal Assessment Protection Study Initiative members, who hail from different departments at the NCEC and KAUST.
This research has been supported by the Saudi National Center for Environmental Compliance (grant no. 062/475000300/284).
This paper was edited by Dagmar Hainbucher and reviewed by two anonymous referees.
Abu Dhabi Quality and Conformity Council (ADQCC): Ambient Marine Water and Sediments Specifications, Abu Dhabi Specification (ADS 18/2017), 2017.
Abualnaja, Y., Papadopoulos, V. P., Josey, S. A., Hoteit, I., Kontoyiannis, H., and Raitsos, D. E.: Impacts of climate modes on air–sea heat exchange in the Red Sea, J. Climate, 28, 2665–2681, https://doi.org/10.1175/JCLI-D-14-00379.1, 2015.
Abualnaja, Y., Pavlidou, A., Churchill, J., Hatzianestis, I., Velaoras, D., Kontoyiannis, H., Papadopoulos, V. P., Karageorgis, A., Assimakopoulou, G., Kaberi, E., Kannelopoulos, Th., Parinos, C., Zeri, Ch., Ballas, D., Pitta, E., Paraskevopoulou, V., Adroni, A., Chourdaki, S., Fioraki, V., Iliakis, S., Kabouri, G., Konstantinopoulou, A., Krokos, G., Papageorgiou, D., Papageorgiou, A., Pappas, G., Plakidi, E., Rousselaki, E., Stavrakaki, I., Tzempelikou, E., Zachioti, P., Yfanti, A., Zoulias, Th., Al Amoudi, A., Alshehri, Y., Alharbi, A., Alsulmi, H., Boksmati, T., Mutwalli, R., and Hoteit, I.: Water and Sediment data in the coastal zone of the Red Sea and the Arabian (Persian) Gulf (Saudi Arabia), SEANOE [data set], https://doi.org/10.17882/96463, 2023.
Abu-Zied, R. H. and Hariri, M. S. B.: Geochemistry and benthic foraminifera of the nearshore sediments from Yanbu to Al-Lith, eastern Red Sea coast, Saudi Arabia, Arab. J. Geosci., 9, 245, https://doi.org/10.1007/s12517-015-2274-9, 2016.
Al Azhar, M., Temimi, M., Zhao, J., and Ghedira, H.: Modeling of circulation in the Arabian Gulf and the Sea of Oman: Skill assessment and seasonal thermohaline structure, J. Geophys. Res.-Oceans, 121, 1700–1720, https://doi.org/10.1002/2015JC011038, 2016.
Al-Farawati, R. K., Gazzaz, M. O., El Sayed, M. A., and El-Maradny, A.: Temporal and spatial distribution of dissolved Cu, Ni and Zn in the coastal waters of Jeddah, eastern Red Sea, Arab. J. Geosci., 4, 1229–1238, https://doi.org/10.1007/s12517-010-0137-y, 2011.
Alharbi, T. and El-Sorogy, A.: Assessment of metal contamination in coastal sediments of Al-Khobar area, Arabian Gulf, Saudi Arabia, J. Afr. Earth Sci., 129, 458–468, https://doi.org/10.1016/j.jafrearsci.2017.02.007, 2017.
Alharbi, T. and El-Sorogy, A.: Assessment of seawater pollution of the Al-Khafji coastal area, Arabian Gulf, Saudi Arabia, Environ. Monit. Assess., 191, 383, https://doi.org/10.1007/s10661-019-7505-1, 2019.
Alharbi, T., Alfaifi, H., Almadani, S. A., and El-Sorogy, A.: Spatial distribution and metal contamination in the coastal sediments of Al-Khafji area, Arabian Gulf, Saudi Arabia, Environ. Monit. Ass., 189, 634, https://doi.org/10.1007/s10661-017-6352-1, 2017.
Alharbi, T., Al-Kahtany, K., Nour, H. E., Giacobbe, S., and El-Sorogy, A. S.: Contamination and health risk assessment of arsenic and chromium in coastal sediments of Al-Khobar area, Arabian Gulf, Saudi Arabia, Mar. Pollut. Bull., 185, part A, https://doi.org/10.1016/j.marpolbul.2022.114255, 2022.
Ali, A. M., Rønning, H. T., Al Arif, W. M., Kallenborn, R., and Kallenborn, R.: Occurrence of pharmaceuticals and personal care products in effluent-dominated Saudi Arabian coastal waters of the Red Sea, Chemosphere, 175, 505–513, https://doi.org/10.1016/j.chemosphere.2017.02.095, 2017.
Ali, E. B., Churchill, J. H., Barthel, K., Skjelvan, I., Omar, A. M., de Lange, T. E., and Eltaib, E. B. A.: Seasonal variations of hydrographic parameters in the Sudanese coast of the Red Sea, 2009–2015, Reg. Stud. Mar. Sci., 18, 1–10, https://doi.org/10.1016/j.rsma.2017.12.004, 2018.
Al-Kahtany, K., El-Sorogy, A., Al-Kahtany, F., and Youssef, M.: Heavy metals in mangrove sediments of the central Arabian Gulf shoreline, Saudi Arabia, Arab. J. Geosci., 11, 155, https://doi.org/10.1007/s12517-018-3463-0, 2018.
Al-Mur, B. A.: Assessing nutrient salts and trace metals distributions in the coastal water of Jeddah, Red Sea, Saudi J. Biol. Sci., 27, 3087–3098, https://doi.org/10.1016/j.sjbs.2020.07.012, 2020.
Al-Mur, B. A., Quicksall, A. N., and Al-Ansari, A. M. A.: Spatial and temporal distribution of heavy metals in coastal core sediments from the Red Sea, Saudi Arabia, Oceanologia, 59, 262–270, https://doi.org/10.1016/j.oceano.2017.03.003, 2017.
Alzahrani, H., El-Sorogy, A. S., Qaysi, S., and Alshehri, F.: Contamination and Risk Assessment of Potentially Toxic Elements in Coastal Sediments of the Area between Al-Jubail and Al-Khafji, Arabian Gulf, Saudi Arabia, Water, 15, 573, https://doi.org/10.3390/w15030573, 2023.
Amin, S. A. and Almahasheer, H.: Pollution indices of heavy metals in the Western Arabian Gulf coastal area, Egypt. J. Aquat. Res., 48, 21–27, https://doi.org/10.1016/j.ejar.2021.10.002, 2022.
Asfahani, K., Krokos, G., Papadopoulos, V. P., Jones, B. H., Sofianos, S. S., Kheireddine, M., and Hoteit, I.: Capturing a mode of intermediate water formation in the Red Sea, J. Geophys. Res.-Oceans, 125, e2019JC015803, https://doi.org/10.1029/2019JC015803, 2020.
Bantan, R. A., Khawfany, A. A., Basaham, A. S., and Gheith, A. M.: Geochemical Characterization of Al-Lith Coastal Sediments, Red Sea, Saudi Arabia, Arab. J. Sci. Eng., 45, 291–306, https://doi.org/10.1007/s13369-019-04161-6, 2020.
Brima, E. I. and AlBishri, H. M.: Major and trace elements in water from different sources in Jeddah City, KSA, Arab. J. Geosci., 10, 436, https://doi.org/10.1007/s12517-017-3221-8, 2017.
Carpenter, J. H.: The accuracy of the Winkler method for dissolved oxygen analysis, Limnol. Oceanogr., 10, 135–140, https://doi.org/10.4319/lo.1965.10.1.0135, 1965a.
Carpenter, J. H.: The Chesapeake Bay Institute technique for dissolved oxygen method, Limnol. Oceanogr., 10, 141–143, https://doi.org/10.4319/lo.1965.10.1.0141, 1965b.
Cauwet, G.: HTCO method for dissolved organic carbon analysis in seawater: influence of catalyst on blank estimation, Mar. Chem., 47, 55–64, https://doi.org/10.1016/0304-4203(94)90013-2, 1994.
Chao, S. Y., Kao, T. W., and Al-Hajri, K. R.: A numerical investigation of circulation in the Arabian Gulf, J. Geophys. Res., 97, 11.219–11.236, https://doi.org/10.1029/92JC00841, 1992.
Churchill, J. H., Bower, A. S., McCorkle, D. C., and Abualnaja, Y.: The transport of nutrient-rich Indian Ocean water through the Red Sea and into coastal reef systems, J. Mar. Res., 72, 165–181, https://doi.org/10.1357/002224014814901994, 2014a.
Churchill, J. H., Lentz, S. J., Farrar, J. T., and Abualnaja, Y.: Properties of Red Sea coastal currents, Cont. Shelf Res., 78, 51–61, https://doi.org/10.1016/j.csr.2014.01.025, 2014b.
Cline, J. D.: Spectrophotometric determination of hydrogen sulfide in natural waters, Limnol. Oceanogr., 14, 454–458, https://doi.org/10.4319/lo.1969.14.3.0454, 1969.
El-Maradny, A., Orif, M., AlKobati, A., Ghandourah, M., and Al-Farawati, R.: Polycyclic aromatic hydrocarbons in the water column of three hot spot areas, Jeddah coast, eastern of Red Sea, Reg. Stud. Mar. Sci., 64, 103047, https://doi.org/10.1016/j.rsma.2023.103047, 2023.
El-Sorogy, A., Al-Kahtany, K., Youssef, M., Al-Kahtany, F., and Al-Malky, M.: Distribution and metal contamination in the coastal sediments of Dammam Al-Jubail area, Arabian Gulf, Saudi Arabia, Mar. Pollut. Bull., 128, 8–16, https://doi.org/10.1016/j.marpolbul.2017.12.066, 2018.
El-Sorogy, A. S., Youssef, M., and Al-Hashim, M. H.: Water Quality Assessment and Environmental Impact of Heavy Metals in the Red Sea Coastal Seawater of Yanbu, Saudi Arabia, Water, 15, 201, https://doi.org/10.3390/w15010201, 2023.
El Zokm, G. M., Al-Mur, B. A., and Okbah, M. A.: Ecological risk indices for heavy metal pollution assessment in marine sediments of Jeddah Coast in the Red Sea, Int. J. Environ. Anal., 102, 4496–4517, https://doi.org/10.1080/03067319.2020.1784888, 2022.
EPA method 1631, Revision E: Mercury in Water by Oxidation, Purge and Trap, and Cold Vapor Atomic Fluorescence Spectrometry, EPA-821-R-02-019, August 2002.
EPA method 1664, Revision B: n-Hexane Extractable Material (HEM; Oil and Grease) and Silica Gel Treated n-Hexane Extractable Material (SGT-HEM; Non-polar Material) by Extraction and Gravimetry, EPA-821-R-10-001, February 2010.
EPA method 420.1: Phenolics (Spectrophotometric, Manual 4-AAP With Distillation), no. 32730, 1978.
EPA method 5021A: Volatile Organic Compounds in Various Sample Matrices using Equilibrium Headspace Analysis, July 2014 (Revision 2).
EPA method 5210B: 5-days BOD test, Methods for the Examination of Water and Wastewater, 24th ed., Washington DC, APHA Press, https://doi.org/10.2105/SMWW.2882.102, 2023.
EPA method 528: Determination of phenols in drinking water by solid phase extraction and capillary column gas chromatography/mass spectrometry (GC/MS), https://www.epa.gov/dwanalyticalmethods/method-528-determination-phenols-drinking-water (last access: 25 March 2024), 2000.
EPA method 8260D: Volatile Organic Compounds by Gas Chromatography-Mass Spectrometry (GC/MS), June 2018 (Revision 4).
Fallatah, M. M., Kavil, Y. N., Ibrahim, A. S. A., Orif, M. I., Shaban, Y. A., and Al Farawati, R.: Hydrographic parameters and distribution of dissolved Cu, Ni, Zn and nutrients near Jeddah desalination plant, Open Chem., 16, 245–257, https://doi.org/10.1515/chem-2018-0029, 2018.
Freije, A. M.: Heavy metal, trace element and petroleum hydrocarbon pollution in the Arabian Gulf: Review, Arab J. Basic Appl. Sci., 17, 90–100, https://doi.org/10.1016/j.jaubas.2014.02.001, 2015.
Garrison, V., Lamothe, P., Morman, S., and Plumlee, G. S.: Trace-metal concentrations in African dust: effects of long-distance transport and implications for human health, in: 19th World Congress of Soil Science, Book of Abstracts, Brisbane, Australia, 1–6 August 2010, 33–36, 130090454, 2010.
GEBCO Compilation Group: The GEBCO_2020 Grid – a continuous terrain model of the global oceans and land, British Oceanographic Data Centre, National Oceanography Centre, NERC, UK, https://doi.org/10.5285/a29c5465-b138-234d-e053-6c86abc040b9 2020.
Gherboudj, I. and Ghedira, H.: Spatiotemporal assessment of dust loading over the United Arab Emirates, Int. J. Climatol., 34, 3321–3335, https://doi.org/10.1002/joc.3909, 2014.
Guo, D., Kartadikaria, A., Zhan, P., Xie, J., Li, M., and Hoteit, I.: Baroclinic Tides Simulation in the Red Sea: Comparison to Observations and Basic Characteristics, J. Geophys. Res.-Oceans, 123, 9389–9404, https://doi.org/10.1029/2018JC013970, 2018.
Halawani, R. F., Wilson, M. E., Hamilton, K. M., Aloufi, F. A., Taleb, M. A., Al-Zubieri, A. G., and Quicksall, A. N.: Spatial Distribution of Heavy Metals in Near-Shore Marine Sediments of the Jeddah, Saudi Arabia Region: Enrichment and Associated Risk Indices, J. Mar. Sci. Eng., 10, 614, https://doi.org/10.3390/jmse10050614, 2022.
Harper, D. and Riley, J. P.: Determination of Low concentrations of Dissolved and Particulate Chromium in Natural Waters, Technical report TR 215, University of Liverpool, Department of Oceanography, OL13839981M, 1985.
ISO 9377-2:2000: Water quality–Determination of hydrocarbon oil index–Part 2: Method using solvent extraction and gas chromatography, 13.060.50, 2000.
ISO/IEC 17025:2017: General Requirements for the competence of testing and calibration laboratories, https://www.iso.org/obp/ui/#iso:std:iso-iec:17025:ed-3:v1:en (last access: 25 March 2024), 2018.
Jiang, H., Farrar, J., Beardsley, R., Chen, R., and Chen, C.: Zonal surface wind jets across the Red Sea due to mountain gap forcing along both sides of the Red Sea, Geophys. Res. Lett, 36, L19605, https://doi.org/10.1029/2009GL040008, 2009.
John, V., Coles, S., and Abozed, A.: Seasonal cycles of temperature, salinity, and water masses of the Western Arabian Gulf, Oceanol. Acta, 13, 273–282, 1990.
Johns, W. E., Yao, F., Olson, D. B., Josey, S. A., Grist, J. P., and Smeed, D. A.: Observations of seasonal exchange through the Straits of Hormuz and the inferred heat and freshwater budgets of the Persian Gulf, J. Geophys. Res., 108, 3391, https://doi.org/10.1029/2003JC001881, 2003.
Jones, D. A., Hayes, M., Krupp, F., Sabatini, G., Watt, I., and Weishar, L.: The impact of the Gulf War (1990–91) oil release upon the intertidal Gulf coast line of Saudi Arabia and subsequent recovery, in: Protecting the Gulf's Marine Ecosystems from Pollution, edited by: Abuzinada, A. H., Barth, H. J., Krupp, F., Böer, B., and Al Abdessalaam, T. Z., Springer, Switzerland, 237–254, https://doi.org/10.1007/978-3-7643-7947-6_3, 2008.
Kahal, A., El-Sorogy, A. S., Qaysi, S., Almadani, S., Kassem, O. M., and Al-Dossari, A.: Contamination and ecological risk assessment of the Red Sea coastal sediments, southwest Saudi Arabia, Mar. Pollut. Bull., 154, 111125, https://doi.org/10.1016/j.marpolbul.2020.111125, 2020.
Koroleff, F.: Revised version of “Direct determination of ammonia in natural waters as indophenol blue, Int. Con. Explor. Sea, C. M. 1969/C:9”, ICES Information on Techniques and Methods for Sea Water Analysis Interlab, Rep. No 3, 19–22, 1970.
Mahboob, S., Ahmed, Z., Muhammad Farooq Khan, M., Virik, P., Al-Mulhm, N., and Baabbad, A. A. A.: Assessment of heavy metals pollution in seawater and sediments in the Arabian Gulf, near Dammam, Saudi Arabia, J. King Saud. Univ. Sci., 34, 101677, https://doi.org/10.1016/j.jksus.2021.101677, 2022.
Maillard, C. and Soliman, G.: Hydrography of the Red Sea and exchanges with the Indian Ocean in summer, Oceanol. Acta, 9, 249–269, 1986.
Mannaa, A. A., Khan, A. A., Haredy, R., and Al-Zubieri, A. G.: Contamination evaluation of heavy metals in a sediment core from the al-salam lagoon, jeddah coast, Saudi Arabia, J. Mar. Sci. Eng., 9, 899, https://doi.org/10.3390/jmse9080899, 2021.
Milne, A., Landing, W., Bizimis, M., and Morton, P.: Determination of Mn, Fe, Co, Ni, Cu, Zn, Cd and Pb in seawater using high resolution magnetic sector inductively coupled mass spectrometry (HR-ICP-MS), Anal. Chim. Acta, 665, 200–207, https://doi.org/10.1016/j.aca.2010.03.027, 2010.
Murphy, J. and Riley, J. P.: A modified single solution method for the determination of phosphate in natural waters, Anal. Chim. Acta, 27, 31–36, https://doi.org/10.1016/S0003-2670(00)88444-5, 1962.
Naser, H. A.: Assessment and management of heavy metal pollution in the marine environment of the Arabian Gulf: A review, Mar. Pollut. Bull., 72, 6–13, https://doi.org/10.1016/j.marpolbul.2013.04.030, 2013.
Naser, H. A.: Biodiversity – The Dynamic Balance of the Planet, in: Marine ecosystem diversity in the Arabian Gulf: Threats and conservation, edited by: Grillo, O., InTech, Croatia, 297–328, https://doi.org/10.5772/57425, 2014.
Naser, H. A.: The role of environmental impact assessment in protecting coastal and marine environments in rapidly developing islands: The case of Bahrain, Arabian Gulf, Ocean Coast. Manag., 104, 159–169, https://doi.org/10.1016/j.ocecoaman.2014.12.009, 2015.
Neelamani, S., Al-Osairi, Y., Al-Salem K., and Rakha, K.: Some Physical Oceanographic Aspects of Kuwait and Arabian Gulf Marine Environment, in: The Arabian Seas: Biodiversity, Environmental Challenges and Conservation Measures, edited by: Jawad L. A., Springer, Switzerland AG, 99–119, https://doi.org/10.1007/978-3-030-51506-5_5, 2021.
Neumann, A. C. and McGill, D. A.: Circulation of the Red Sea in early summer, Deep-Sea Res., 8, 223–285, 1962.
Ospar: JAMP Guidelines for Monitoring of Contaminants in Seawater, Agreement 2013-03, https://mcc.jrc.ec.europa.eu/documents/OSPAR/Guidelines_forMonitoring_of_ContaminantsSeawater.pdf (last access: 25 March 2024), 2013.
Papadopoulos, V. P., Abualnaja, Y., Josey, S. A., Bower, A., Raitsos, D. E., Kontoyiannis, H., and Hoteit, I.: Atmospheric forcing of the winter air–sea heat fluxes over the northern Red Sea, J. Climate, 26, 1685–1701, https://doi.org/10.1175/JCLI-D-12-00267.1, 2013.
Papadopoulos, V. P., Zhan, P., Sofianos, S. S., Raitsos, D. E., Qurban, M., Abualnaja, Y., Bower, A. S., Kontoyiannis, H., Pavlidou, A., Ashraf, T. T. M., Zarokanellos, N., and Hoteit, I.: Factors governing the deep ventilation of the Red Sea, J. Geophys. Res.-Oceans, 120, 7493–7505, https://doi.org/10.1002/2015JC010996, 2015.
Paparella, F., D'Agostino, D., and Burt, J.A.: Long-term, basin-scale salinity impacts from desalination in the Arabian/Persian Gulf, Sci. Rep.-UK, 12, 20549, https://doi.org/10.1038/s41598-022-25167-5, 2022.
Pavlidou, A., Hatzianestis, I., Papadopoulos, V. P., Parinos, K., Kaberi, E., Zeri, C., Tzempelikou, E., Pitta, E., Assimakopoulou, G., Papageorgiou, D., Velaoras, D., and Kannelopoulos, T.: Marine and Coastal Environment Protection Initiative (MCEP) Task 6: Field Surveillance Report, 145 pp., 2021.
Peña-García, D., Ladwig, N., Turki, A. J., and Mudarris, M. S.: Input and dispersion of nutrients from the Jeddah Metropolitan Area, Red Sea, Mar. Pollut. Bull., 80, 41–51, https://doi.org/10.1016/j.marpolbul.2014.01.052, 2014.
Povinec, P. P., Papadopoulos, V. P., Krokos, G., Abualnaja, Y., Pavlidou, A., Kontul, I., Kaizer, J., Cherkinsky, A., Molnár, A., Palcsu, L., Al Ghamdi, A. S., Anber, H. A., Al Othman, A. S., and Hoteit, I.: Tritium and radiocarbon in the water column of the Red Sea, J. Environ. Radioactiv., 256, 107051, https://doi.org/10.1016/j.jenvrad.2022.107051, 2023.
Pugh, D. T., Abualnaja, Y., and Jarosz, E.: The Tides of the Red Sea, in: Oceanographic and Biological Aspects of the Red Sea, edited by: Rasul, N. M. A. and Stewart, I. C. F., Springer Cham Springer Oceanography, 11–40, https://doi.org/10.1007/978-3-319-99417-8, 2019.
Rasul, N. M. A., Stewart, I. C. F., and Nawab, Z. A.: Introduction to the Red Sea: Its origin, structure, and environment, in: The Red Sea: the Formation, Morphology, Oceanography and Environment of a Young Ocean Basin, edited by: Rasul, N. M. A. and Stewart I. C. F., Springer, 1–28, https://doi.org/10.1007/978-3-662-45201-1_20, 2015.
Raventós, N., Macpherson, E., and García-Rubies, A.: Effect of brine discharge from a desalination plant on macrobenthic communities in the NW Mediterranean, Mar. Environ. Res., 62, 1–14, https://doi.org/10.1016/j.marenvres.2006.02.002, 2006.
Reynolds, R. M.: Physical oceanography of the Gulf, Strait of Hormuz, and the Gulf of Oman?, Results from the Mt Mitchell expedition, Mar. Pollut. Bull., 27, 35–59, https://doi.org/10.1016/0025-326X(93)90007-7, 1993.
Roberts, D. A., Johnston, E. L., and Knott, N. A.: Impacts of desalination plant discharges on the marine environment: a critical review of published studies, Water Res. 44, 5117–5128, https://doi.org/10.1016/j.watres.2010.04.036, 2010.
Schröder, C., Sánchez, A., Rodriguez, D., and Abdul Malak, D.: Marine and Coastal Assessment Protection Study for the Kingdom of Saudi Arabia: Hotspot analysis. A report prepared by ETC-UMA for the King Abdullah University of Science and Technology, 118 pp., 2021.
Sheppard, C., Price, A., and Roberts, C.: Marine Ecology of the Arabian Region: Patterns and Processes in Extreme Tropical Environments, Toronto, Academic Press, ISBN 0126394903, 1992.
Sheppard, C., Al-Husiani, M., Al-Jamali, F., Al-Yamani, F., Baldwin, R., Bishop, J., Benzoni, F., Dutrieux, E., Dulvy, N. K., Durvasula, S. R., Jones, D. A., Loughland, R., Medio, D., Nithyanandan, M., Pilling, G. M., Polikarpov, I., Price, A. R., Purkis, S., Riegl, B., Saburova, M., Namin, K. S., Taylor, O., Wilson, S., and Zainal, K.: The Gulf: A young sea in decline, Mar. Pollut. Bull., 60, 13–38, https://doi.org/10.1016/j.marpolbul.2009.10.017, 2010.
Sofianos, S. S. and Johns, W. E.: An Oceanic General Circulation Model (OGCM) investigation of the Red Sea circulation: 2. Three-dimensional circulation in the Red Sea, J. Geophys. Res.-Oceans, 108, 3066, https://doi.org/10.1029/2001JC001185, 2003.
Sofianos, S. S. and Johns, W. E.: Observations of the summer Red Sea circulation, J. Geophys. Res., 112, C06025, https://doi.org/10.1029/2006JC003886, 2007.
Sofianos, S. S. and Johns, W. E.: Water mass formation, overturning circulation, and the exchange of the Red Sea with the adjacent basins, in: The Red Sea: the Formation, Morphology, Oceanography and Environment of a Young Ocean Basin, edited by: Rasul, N. M. A. and Stewart, I. C. F., Springer Earth System Sciences, Springer, Berlin, Heidelberg, 343–353, https://doi.org/10.1007/978-3-662-45201-1_20, 2015.
Sohaib, M., Al-Barakah, F. N. I., Migdadi, H. M., Alyousif, M., and Ahmed, I.: Ecological assessment of physico-chemical properties in mangrove environments along the Arabian Gulf and the Red Sea coasts of Saudi Arabia, Egypt, J. Aquat. Res., 49, 9–16, https://doi.org/10.1016/j.ejar.2022.11.002, 2023.
Standard Methods for the Examination of Water and Wastewater: Cyanide 4500-CN–E. Colorimetric Method, Washington, DC, American Public Health Association, https://www.standardmethods.org/doi/abs/10.2105/SMWW.2882.077# (last access: 25 March 2024), 1992.
Standard Methods for the Examination of Water and Wastewater: Total Residual Chlorine 4500-Cl G. DPD Colorimetric Method, Washington, DC, American Public Health Association, https://www.standardmethods.org/doi/abs/10.2105/SMWW.2882.078 (last access: 25 March 2024), 1992.
Strickland, J. D. H. and Parsons, T. R.: A Practical Handbook of Seawater Analysis, Bulletin 167, Fisheries Research Board of Canada, Ottawa, Canada, https://doi.org/10.25607/OBP-1791, 1968.
Sugimura, Y. and Suzuki, Y.: A high-temperature catalytic oxidation method for the determination of non-volatile dissolved organic carbon in seawater by direct injection of a liquid sample, Mar. Chem., 24, 105–131, https://doi.org/10.1016/0304-4203(88)90043-6, 1988.
Uddin, S., Al Ghadban, A. N., and Khabbaz, A.: Localized hyper saline waters in Arabian Gulf from desalination activity–an example from South Kuwait, Environ. Monit. Assess., 181, 587–594, https://doi.org/10.1007/s10661-010-1853-1, 2011.
UNEP/IOC/IAEA: Determination of Petroleum Hydrocarbons in Sediments, Reference Methods for Marine Pollution Studies, No. 20, 75, https://www.unep.org/resources/report/determination-petroleum-hydrocarbons-sediments (last access: 25 March 2024)1992.
Vaughan, G. O., Al-Mansoori, N., and Burt, J. A.: The Arabian Gulf, in: World Seas, An Environmental Evaluation, the Indian Ocean to the Pacific, 2nd ed., edited by: Sheppard, C., Elsevier, UK, 1–23, https://doi.org/10.1016/B978-0-08-100853-9.00001-4, 2019.
Viswanadhapalli, Y., Dasari, H. P., Langodan, S., Challa, V. S., and Hoteit, I.: Climatic features of the Red Sea from a regional assimilative model, Int. J. Climatol., 37, 2563–2581, https://doi.org/10.1002/joc.4865, 2017.
Willie, S. N., Iida, Y., and McLaren, J. W.: Determination of Cu, Ni, Zn, Mn, Co, Pb, Cd and V in seawater using flow-injection ICP-MS, At. Spectrosc., 19, 67–72, 1998.
Yao, F. and Hoteit, I.: Rapid Red Sea deep water renewals caused by volcanic eruptions and the North Atlantic oscillation, Sci. Adv., 4, 6, https://doi.org/10.1126/sciadv.aar5637, 2018.
Yao, F., Hoteit, I., Pratt, L. J., Bower, A. S., Zhai, P., Köhl, A., and Gopalakrishnan, G.: Seasonal overturning circulation in the Red Sea: 1. Model validation and summer circulation, J. Geophys. Res.-Oceans, 119, 2238–2262, https://doi.org/10.1002/2013JC009004, 2014.
Youssef, M.: Heavy metals contamination and distribution of benthic foraminifera from the Red Sea coastal area, Jeddah, Saudi Arabia, Oceanologia, 57, 236–250, https://doi.org/10.1016/j.oceano.2015.04.002, 2015.
Zhai, P., Bower, A. S., Smethie Jr., W. M., and Pratt, L. J.: Formation and spreading of Red Sea Outflow Water in the Red Sea, J. Geophys. Res.-Oceans, 120, 6542–6563, https://doi.org/10.1002/2015JC010751, 2015.
Zhan, P., Subramanian, A. C., Yao, F., and Hoteit, I.: Eddies in the Red Sea: A statistical and dynamical study, J. Geophys. Res.-Oceans, 119, 3909–3925, https://doi.org/10.1002/2013JC009563, 2014.