the Creative Commons Attribution 4.0 License.
the Creative Commons Attribution 4.0 License.
 | 16 Nov 2023
High-resolution emission inventory of full-volatility organic compounds from cooking in China during 2015–2021
Shuxiao Wang
Shengyue Li
Xiaochun Wang
Guanghan Huang
Xing Chang
Lyuyin Huang
Chengrui Liang
Yun Zhu
Haotian Zheng
Qian Song
Qingru Wu
Fenfen Zhang
Quantifying the full-volatility organic emissions from cooking sources is important for understanding the causes of organic aerosol pollution. However, existing national cooking emission inventories in China fail to cover full-volatility organics and have large biases in estimating emissions and their spatial distribution. Here, we develop the first emission inventory of full-volatility organics from cooking in China, which covers emissions from individual commercial restaurants as well as residential kitchens and canteens. In our emission estimates, we use cuisine-specific full-volatility emission factors and provincial policy-driven purification facility installation proportions, which allows us to consider the significant impact of diverse dietary preferences and policy changes on China's cooking emissions. The 2021 emissions of volatile organic compounds (VOCs), intermediate-volatility organic compounds (IVOCs), semi-volatile organic compounds (SVOCs), and organic compounds with even lower volatility (xLVOCs) from cooking in China are 561 (317–891, 95 % confidence interval) kt yr−1, 241 (135–374) kt yr−1, 176 (95.8–290) kt yr−1, and 13.1 (7.36–21.0) kt yr−1, respectively. The IVOC and SVOC emissions from cooking account for 9 %–21 % and 31 %–62 % of the total emissions from all sources in the five most densely populated cities in China. Among all cooking types, commercial cooking dominates the emissions, contributing 54.5 %, 66.2 %, 68.5 %, and 46.7 % to the VOC, IVOC, SVOC, and xLVOC emissions, respectively. Sichuan–Hunan cuisine contributes the most to total cooking emissions among all commercial cuisines. Residential cooking emissions are also important, accounting for 22.2 %–47.1 % of the cooking organic emissions across the four volatility ranges, whereas canteens make minor contributions to each volatility range (<10 %). In terms of spatial distribution, emission hotspots mainly occur in densely populated areas and regions with oily and spicy dietary preferences. From 2015 to 2021, national organic emissions from cooking increased by 25.2 % because of the rapid growth of the catering industry, despite being partly offset by the increased installation of purification facilities. Future control measures need to further promote the purification facilities in commercial restaurants and improve their removal efficiency as well as reduce emissions from residential cooking. Our dataset and generalizable methodology serve as valuable resources for evaluating the air quality, climate, and health impacts of cooking sources, and help to formulate effective emission control policies. Our national, multi-year, high-spatial-resolution dataset can be accessed from https://doi.org/10.6084/m9.figshare.23537673 (Li et al., 2023).
- Article
(6299 KB) - Full-text XML
-
Supplement
(4170 KB) - BibTeX
- EndNote


Organic compounds are ubiquitous in the atmosphere, exhibiting a continuous volatility distribution spanning both particle and gaseous phases (Robinson et al., 2007). They can be categorized based on the saturation vapor concentration (log10C*/(µg m−3)) into volatile organic compounds (VOCs, >6.5), intermediate-volatility organic compounds (IVOCs, 2.5–6.5), semi-volatile organic compounds (SVOCs, 0.5–0.25), and organic compounds with even lower volatility (expressed as xLVOCs, ) (Donahue et al., 2012). All of these organics affect climate, air quality, and human health to varying degrees (An et al., 2023; Zheng et al., 2023a).
Cooking activities are a significant source of organic emissions, as cooking fumes contain many complex organic compounds derived from oil, ingredients, and seasonings (Jin et al., 2021). Source apportionment results based on aerosol mass spectrometry–positive matrix factorization (the AMS-PMF method) indicate that cooking organic aerosol (COA) contributes 5 %–37 % of the total atmospheric organic aerosol (OA) mass concentrations at various urban sites worldwide (Lee et al., 2015; Mohr et al., 2012; Huang et al., 2021; Abdullahi et al., 2013). Additionally, gaseous VOCs, IVOCs, and SVOCs emitted from cooking have been identified as crucial precursors of secondary OA (SOA) and O3 (Yuan et al., 2023; Yu et al., 2022; Zhang et al., 2021). Furthermore, I/SVOCs have been reported to produce SOA more efficiently than VOCs and to contribute significantly to the OA burden (Zheng et al., 2023b; Jathar et al., 2014). Therefore, quantifying the full-volatility organic emissions from cooking sources is important for understanding the causes of OA pollution and formulating effective policies.
In China, the large and dense population results in a substantial demand for cooking. Furthermore, Chinese cooking stands distinct from those of other countries due to its cuisine diversity and unique cooking styles (Zhao and Zhao, 2018). With the vast regional variation, various popular Chinese cuisines such as Sichuan cuisine and Cantonese cuisine have flourished, each having distinct cooking methods and ingredients (Lin et al., 2022; Liang et al., 2022). This diversity results in significant variations in emission characteristics. Additionally, compared to Western cooking methods, the common practice of using oil at high temperatures in Chinese cooking, especially the widespread technique of high-temperature stir-frying (Chen et al., 2018; Liang et al., 2022), might result in more complex organic compound emissions (Zhao et al., 2018). Therefore, the unique characteristics and significance of Chinese cooking warrant special attention. However, the complexity of cooking emissions in China, including a myriad of distinct emission sources (restaurants serving diverse cuisines, home kitchens, and canteens) and thousands of chemical species, poses significant challenges to emission estimation (Lin et al., 2022; Zhao and Zhao, 2018; Liang et al., 2022).
In recent years, many efforts have been made to quantify cooking emissions in China. Testing of PM2.5 and VOC emission factors (EFs) for different cooking cuisines (Lin et al., 2019; Wang et al., 2018a, 2015; Cheng et al., 2016) and surveys of restaurant activity data and purification equipment installations (Jin et al., 2021; Wang et al., 2018a; Li, 2020) have provided the necessary data for emission calculations. The use of online oil fume monitoring systems (Yuan et al., 2023) and the use of catering-related point of interest (POI) data (Lin et al., 2022) in the digital map have improved the spatial resolution of cooking emissions. Small-scale inventories of PM2.5 and VOC cooking emissions have been established for cities or districts such as Beijing, Shanghai, and Shunde (Lin et al., 2022; Wang et al., 2018a; Yuan et al., 2023; Qi et al., 2020). At the national scale, a few studies have established cooking emission inventories using relatively simplified methods compared to small-scale inventories (Wang et al., 2018a; Jin et al., 2021; Liang et al., 2022; Cheng et al., 2022), as gathering detailed data over large spatial and temporal scales is difficult. Some national-scale studies have indirectly calculated China's particle-phase organic carbon (OC) and VOC emissions from cooking by proportionally extrapolating city-scale emissions based on easily obtained statistical data, such as population and catering consumption expenditure (Wang et al., 2018a; Jin et al., 2021). Other studies have adopted population or meat consumption as the activity data and used nationwide per capita EFs and EFs per unit of meat consumption to directly estimate the OC and VOC emissions from cooking nationwide (Cheng et al., 2022; Liang et al., 2022). Both of the above methods essentially assumed a linear relationship between cooking emissions and national total activity levels such as population, cooking oil consumption, and meat consumption. Moreover, regarding the pollution control conditions, most studies simply assume that all restaurants are equipped with purification facilities and therefore apply controlled EFs to all restaurants. Restaurants without pollution control are only considered in the study by Jin et al. (2021), which applied purification facility installation proportion (PFIP) survey results from two cities to the whole country.
The above inventories provide a preliminary understanding of national cooking emissions, but they still have major shortcomings and considerable uncertainties. Firstly, the existing national cooking inventories fail to cover full-volatility organics. They primarily consider gaseous (VOCs) and particle-phase primary OA (or related OCs or PM2.5), ignoring the important gaseous I/SVOC emissions, which may lead to significant underestimation of SOA formation. Also, Chang et al. (2022) have developed a full-volatility emission inventory for China for most emission sources, but the cooking source was missing from the inventory, possibly due to the lack of EFs, which hinders an accurate understanding of OA sources. Benefiting from advanced measurement techniques, full-volatility organic EFs have recently been measured for different cooking sources (Yu et al., 2022; Song et al., 2022; Huang, 2023). This makes it possible to establish an unprecedented full-volatility organic cooking emission inventory, but such efforts have not yet been made.
Moreover, previous national inventories suffer from significant biases in their estimates of emissions and spatial distributions. The statistical data currently used for emission calculations hardly reflect the complex cooking activities that occur in millions of commercial restaurants, countless home kitchens, and canteens. Meanwhile, the relationship between emissions and national statistics is not simply linear, because different regions have vastly different dietary habits, cooking styles, and cooking pollution control policies, leading to large differences in EFs and PFIPs (Jin et al., 2021; Lin et al., 2022). These issues introduce large uncertainties in emission estimation. Most importantly, the aforementioned methods cannot accurately describe the spatial distribution of cooking emissions, which is crucial due to the strong linkage between the location of cooking emissions (which potentially pose significant health risks) and human living environments (Lin et al., 2022; Wang et al., 2018a).
In this study, we develop the first inventory of full-volatility organic emissions from cooking sources in China, encompassing high-resolution emissions from each individual commercial restaurant as well as family kitchens and canteens during 2015–2021. We estimate the emissions using cuisine-specific EFs and dynamically changing PFIPs driven by provincial-level control policies. Further, we analyze the sources, regional variations, and temporal trends in full-volatility cooking emissions in China. We also quantify the contribution of key drivers to emission changes and provide recommendations for future control strategies.
We use the emission-factor method to estimate organic emissions from three types of cooking activities, namely commercial cooking, residential cooking, and canteen cooking, essentially covering all dietary sources for people (Liang et al., 2022). Notably, we focus solely on cooking fume emissions, excluding emissions from cooking fuels, which were included in the domestic combustion sources in our previous full-volatility inventory (Chang et al., 2022). We use different calculation methods for the three sources according to their characteristics and data availability, as shown in Fig. 1. The most important, commercial cooking, is treated as a point source, with detailed cuisine types and geographic coordinates used to estimate the emissions of each individual restaurant and pinpoint its location. Residential and canteen cooking are estimated by province (Sect. 2.1). The data used to calculate emissions are derived from multiple sources or from our estimates (Sect. 2.2). The emissions are allocated to spatial grids using the exact locations of commercial cooking and using spatial proxies for residential cooking and canteen cooking (Sect. 2.3). Finally, we analyze the uncertainty of the inventory (Sect. 2.4) and quantify the contributions of different drivers to emission changes through sensitivity analysis (Sect. 2.5).
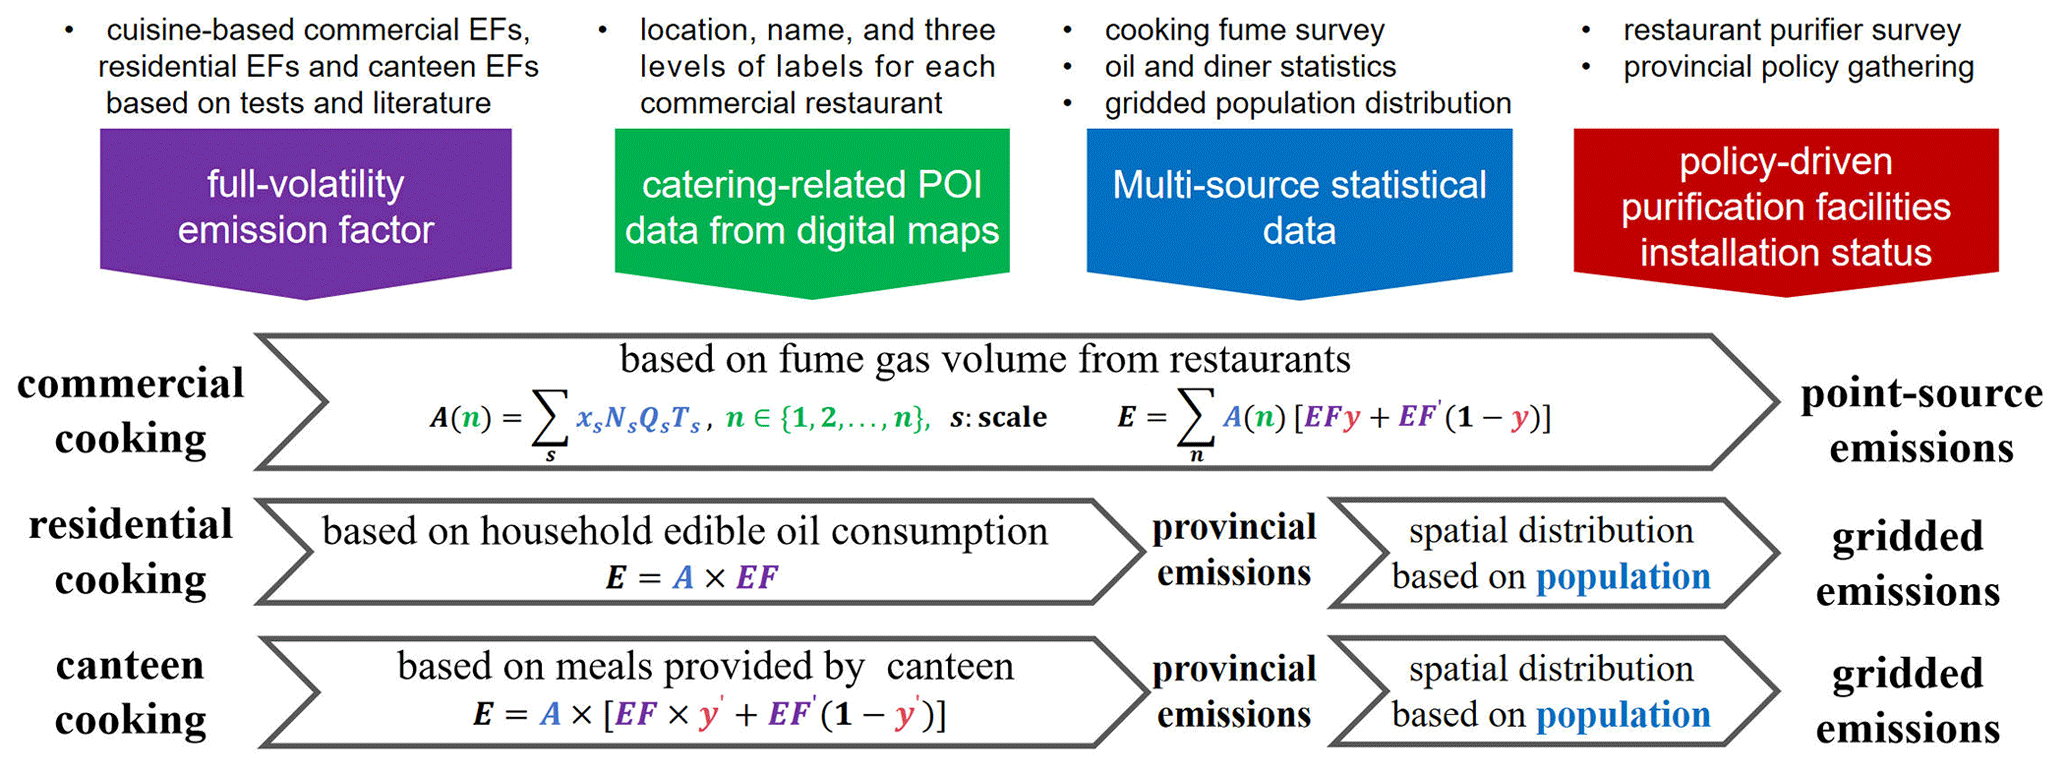
Figure 1Schematic of the method and data used for developing a high-resolution cooking emission inventory. Three cooking emission sectors are considered. The texts within the large horizontal arrows detail the emission quantification and spatial distribution methods and data used for each sector. The color of each variable corresponds to the data sources of the same color indicated above. The right ends of the arrows describe the calculated emission outputs with varying levels of precision.
2.1 Emission calculation method
2.1.1 Emissions from commercial cooking
The commercial catering industry in China is varied and complex, with its emissions influenced by the diversity of cuisines and regional pollution control regulations (Lin et al., 2021, 2022; Song et al., 2022; Amouei et al., 2017). Our emission calculations, based on the point sources of cuisine-specific restaurants and the installation status of purification facilities driven by policy changes, fully consider these influencing factors. We capture the geographic locations of nearly all commercial restaurants (up to 7.70 million) nationwide and identify their cuisine types. For each restaurant, we calculate its activity data, i.e., the volume of cooking fumes, and adopt the corresponding full-volatility EFs depending on its cuisine type. Previous studies often simplistically applied the controlled EFs to all restaurants when calculating cooking emissions (Liang et al., 2022; Wang et al., 2018a; Lin et al., 2022), overlooking the over 30 % of restaurants that do not have fume purification facilities (Jin et al., 2021). Here, we estimate the PFIP in each province to consider the excess emissions from these restaurants without purification facilities. Since it is challenging to know the installation situation of the purification facilities for each restaurant, we use the provincial-level PFIP to weigh the controlled EFs and uncontrolled EFs, forming a comprehensive EF for restaurants of each cuisine within each province that is applicable to all restaurants in that category. In this way, we can obtain an overall emission for each type of restaurant that is closer to reality as compared to the previous method of applying controlled EFs to all restaurants. The emissions from commercial cooking are estimated as shown in Eq. (1):
where the subscript c represents the cuisine type and the subscript p represents the province. The subscript v represents the volatility bin, where each bin corresponds to a range of saturation vapor concentrations (C*) of organic compounds at 300 K as defined by Chang et al. (2022). The lowest-volatility bin represents the range where log, and the highest-volatility bin represents the range where log10C*. Nc,p is the number of restaurants of each cuisine in each province; Ac(n) is the annual fume gas volume of the nth restaurant in m3 yr−1. EFc,v and are the controlled and uncontrolled organic EFs for each cuisine in each volatility bin, respectively, in µg m−3. yp is the PFIP for each province. Details on data acquisition are provided in Sect. 2.2.
2.1.2 Emissions from residential cooking
Residential cooking refers to meal preparation at home for individuals or families, where most dishes are cooked with common oil, ingredients, and seasonings using simple cooking methods (Liang et al., 2022). Moreover, the fumes emitted during cooking in home kitchens are generally expelled outdoors through range hoods, exhaust fans, or natural ventilation (Qi et al., 2020). The main functions of range hoods and exhaust fans are to reduce the concentration of pollutants indoors, but they have almost no removal effect on the organics in the fumes. Therefore, we use a uniform uncontrolled EF for residential cooking. Meanwhile, we use official statistics (National Bureau of Statistics of China, 2022c) of household edible oil consumption as activity data due to its minimal uncertainty and strong correlation with cooking emissions (Jin et al., 2021). The emission from residential cooking is calculated by Eq. (2):
where Ap is the annual total household edible oil consumption in each province in t yr−1; EFv is the organic emission per unit mass of edible oil consumed in g kg−1.
2.1.3 Emissions from canteen cooking
Canteen cooking, often featuring simple, low-oil meals with fixed ingredients, caters to students and employees in enterprises and institutions (Liang et al., 2022). Given the consistent diners and dining regularity, we calculate canteen cooking emissions based on the number of meals served and also a uniform EF:
where Ap is the annual total number of meals served in canteens in each province in meals yr−1; EFv and EFv′ are the organic emissions per meal in each volatility bin after and before pollution control in g meal−1, respectively; yp′ is the PFIP for canteens in each province.
2.2 Data acquisition and processing
2.2.1 Activity data
For commercial cooking, we capture nearly all restaurants nationwide and estimate their annual cooking fume volumes (Ac) by gathering catering-related POI data on digital maps and collecting multi-source statistical data. We extract POI data from Amap, a digital map platform, via a web application programming interface (API), following the method of Wu et al. (2021). The information provided by POI data includes the names, labels, and longitudes and latitudes of millions of catering service venues across China. It offers broad and timely coverage with high spatial resolution, outperforming the population statistics, cooking oil consumption, and meat consumption used in most previous inventory calculations (Li et al., 2019).
Identifying the cuisine type of each restaurant is crucial for mapping it to the corresponding EFs and accurately estimating its emissions. The three-level labels in the POI data assist in categorizing restaurants, but they may not be precise enough, as over 60 % of restaurants are simply labeled as Chinese food restaurants. Therefore, we classify the restaurant cuisine by searching their names and labels for specific terms related to certain cuisines (see Table S1 in the Supplement). The specific terms are obtained through word frequency analysis using the “jiebaR” package in the R statistical framework version 4.0.3 (R-4.0.3). The remaining restaurants without any specific terms in their names are categorized as home-style cuisine. However, in some provinces, such as Hunan and Guangdong, the home-style restaurants are expected to have distinct regional characteristics and are thus classified as local specialty cuisines. To explore the uncertainty introduced by this categorization method of these restaurants, we also calculated the emissions under the scenario where these restaurants remain classified as home-style cuisine instead of local specialty cuisines. Under this scenario, because home-style cuisine has the lowest EF, the total cooking organic emissions of the nine provinces involved (see Sect. S1 in the Supplement) would decrease by 8.61 % to 30.4 %, and the national total cooking organic emissions would decrease by 12.2 %. However, in reality, the EFs of these restaurants are probably closer to those of local specialty cuisines rather than home-style cuisine, so the actual deviation would be much less than these values. Additionally, we excluded restaurants with “canteen” in their names. The specific classification method is described in Sect. S1, and the code for cuisine categorization can be accessed at https://github.com/lizeqi18/count_cooking_emission (last access: 25 October 2023).
We finally assign all restaurants to the nine cuisine types (see Table S1 for their characteristics) supported by full-volatility organic EFs: home-style cuisine, Chinese fast food and snacks, hotpot, barbecue, Sichuan–Hunan cuisine, Guangdong–Fujian cuisine, Jiangsu–Zhejiang cuisine, other Chinese cuisines, and non-Chinese cuisines. Specifically, home-style cuisine refers to simple everyday meals. Chinese fast food and snacks offer quick and convenient meals like noodles, dumplings, and buns. Sichuan cuisine and Hunan cuisine, both known for their spiciness and heavy flavors, were combined into one category; in fact, many restaurants serve both cuisines. Cantonese cuisine and Fujian cuisine, characterized by their light and fresh taste and their common use of seafood, are also merged into one category. Jiangsu cuisine and Zhejiang cuisine are both renowned for their rich and slightly sweet flavors and are thus merged into one category. Other Chinese cuisines include other local specialties in China such as Shandong cuisine and Anhui cuisine, and non-Chinese cuisines include cuisines from countries outside China. Although these two broad categories comprise many diverse sub-cuisines, the proportion of restaurants serving these cuisines in China is relatively low, so we utilize these two broad categories for classification. Notably, we've excluded catering services without fume emissions, such as tea houses and coffee houses.
Next, we estimate the Ac of restaurants. According to national standards, restaurants can be divided into three sizes: large, medium, and small (MEE, 2001), with different activity levels for each size. However, due to the lack of detailed statistics on the size of each restaurant, we can only estimate a scale-weighted average Ac for each cuisine type based on existing data using the equation below. This average is then used as the activity level of each restaurant belonging to that cuisine type.
Here, the subscript c represents the cuisine type; s represents the restaurant scale. xs,c is the proportion of restaurants of a particular scale; Nc,s is the average number of stoves in a restaurant; Qs is the cooking fumes discharge rate of each stove in m3 h−1; Ts is the annual total operating time of restaurants in h yr−1. The values of the above parameters are derived from multiple surveys and the literature (Lin et al., 2022; Wang et al., 2018a, b; Yuan et al., 2023), as detailed in Table S2. It should be noted that the values of xs,c and Nc,s depend on cuisine type.
The activity data for residential cooking, the annual household edible oil consumption, is calculated by multiplying the per capita oil consumption with the resident population derived from the official statistical yearbooks (National Bureau of Statistics of China, 2022b, c). Also, the activity data for canteens is the annual total number of meals provided by canteens, which is calculated by Eq. (5):
where the subscript l represents six different populations, including preschool and kindergarten students, primary school students, junior high school students, high school students, undergraduate and graduate students, and employees of state-owned and collective enterprises and institutions. np,l is the number of students or employees for a particular population in a particular province. Dl is the average annual number of days in school or at work for a particular population; ml is the average number of meals per day in the canteen for a particular population; zl is the proportion of people dining in canteens for each type of diner. The values of the above parameters are determined by official statistics (National Bureau of Statistics of China, 2022c, a) and empirical estimation, which are described in detail in Table S3.
2.2.2 Controlled and uncontrolled full-volatility emission factors
Our main advances over traditional cooking inventories are that we cover full-volatility organic emissions and we consider differences in regional cuisines and variations in the installation of purification facilities. To accomplish this, we provide a set of controlled and uncontrolled full-volatility organic EFs for nine different commercial cuisines as well as residential and canteen cooking.
The full-volatility EFs for various commercial cuisines are mainly derived from full-volatility measurements of gaseous and particle-phase organics (Huang, 2023; Song et al., 2022; Yu et al., 2022; Song et al., 2023) and are supplemented by other cooking emission test results recorded in the literature (Xu et al., 2023; Wang et al., 2018a; Cheng et al., 2016; Huang et al., 2020; Sun et al., 2022; Jiang et al., 2021; He et al., 2020; Tong, 2019; Xu et al., 2017; Lin et al., 2014, 2019; Li et al., 2020, 2021; Zhang et al., 2016; Shu et al., 2014; Wang, 2013; Zhao et al., 2007; He et al., 2004; Wang et al., 2018b; Pei et al., 2016). As most commercial restaurants have installed purification facilities, the existing full-volatility EFs of commercial cooking are all measured after pollution control. Therefore, we first obtain a set of controlled full-volatility EFs for all cuisines. Existing full-volatility tests have covered commercial restaurants featuring home-style cuisine, hotpot cuisine, barbecue cuisine, Sichuan–Hunan cuisine, other Chinese cuisines, and non-Chinese cuisines (Huang, 2023; Song et al., 2023), so we can obtain the controlled full-volatility EFs for these cuisines. However, not all of the nine cuisines mentioned in Sect. 2.2.1 have full-volatility tests for both gaseous and particle-phase organics. Therefore, for the commercial cuisines lacking full-volatility testing of gaseous or particle-phase organics, we estimate and supplement the missing full-volatility EFs based on the literature. Specifically, for cuisines lacking the gaseous full-volatility EF, we adopt the average VOC EFs from corresponding cuisines in previous studies (Xu et al., 2017, 2023; Wang et al., 2018a; Cheng et al., 2016; Huang et al., 2020; Sun et al., 2022; Jiang et al., 2021; He et al., 2020; Tong, 2019) to determine organic emissions within the VOC range (log10C*/(µg m), and then we proportionally estimate EFs of gaseous organics in other volatility bins based on the volatility distribution of gaseous organics emitted from similar cuisines. For cuisines lacking the particle-phase full-volatility EF, we use the average primary OA (POA) EFs from previous studies (Lin et al., 2014, 2019; Zhang et al., 2016; Li et al., 2020, 2021; Shu et al., 2014; Wang, 2013; Zhao et al., 2007; He et al., 2004; Wang et al., 2018b, 2015; Pei et al., 2016) as the total particle-phase organic EFs and distribute the total particle-phase EFs into each volatility bin according to the volatility distribution of particle-phase organics emitted from similar cuisines. The data sources and methods that are used to estimate all full-volatility EFs are described in detail in Tables S4 and S5. POA EFs were rarely given directly in previous studies, but they can be calculated from PM2.5 EFs. Given that the majority of particles emitted from cooking activities are PM2.5 (∼94.0 % (Buonanno et al., 2009)) and the particles consist primarily of organics (69.1 %–84 % (Pei et al., 2016; Zhao et al., 2007), median at 76.6 %), we assume that the POA EFs equate to 81.5 % (76.6 %/94.0 %) of the corresponding PM2.5 EFs. After determining both gaseous and particle-phase full-volatility EFs, the total full-volatility EFs for each type of cuisine are computed as the sum of these two components.
Next, we estimate the uncontrolled EFs for each commercial cuisine based on the controlled EF and the removal efficiency of the corresponding cuisine. In the absence of removal efficiencies for I/SVOCs, we assume that the removal efficiencies for gaseous and particle-phase organics are equal to those for VOCs and PM2.5, respectively, similar to our previous study's approach (Chang et al., 2022). Since most (>90 %) purification devices in commercial restaurants are electrostatic fume purifiers (Liang et al., 2022), we adopt a uniform removal efficiency for the purification devices in all restaurants of the same cuisine type. The removal efficiencies of PM2.5 and VOCs for each cuisine type are determined by comparing uncontrolled and controlled EFs in numerous previous studies, as shown in Table S6 and Fig. S1.
The full-volatility EFs for residential cooking also come from full-volatility measurements of gaseous and particle-phase organics (Song et al., 2023, 2022; Huang, 2023), as specifically described in Table S4. Since the emissions from residential cooking are generally exhausted through range hoods or exhaust fans without any purification (Liang et al., 2022; Qi et al., 2020), and the existing full-volatility measurements are also conducted under uncontrolled conditions (Song et al., 2023, 2022; Huang, 2023), we only need to obtain uncontrolled EFs for residential cooking. The original test data are provided in the form of emission rates (µg min−1). To match the activity data used for emission calculations, we convert the EFs for residential cooking into the emissions per unit consumption of cooking oil (g kg oil−1) according to the method detailed in Sect. S2.
The controlled and uncontrolled full-volatility EFs for canteen cooking are determined using the same method as for commercial cooking, based on a series of emission tests listed in Table S4 (Huang, 2023; Liang et al., 2022; Wang et al., 2018a; Zhao et al., 2020). To match the activity data used for emission calculations, we convert the EFs for canteen cooking into the emissions per meal (g meal−1) according to the method detailed in Sect. S2.
2.2.3 Fume purification facility installation proportion
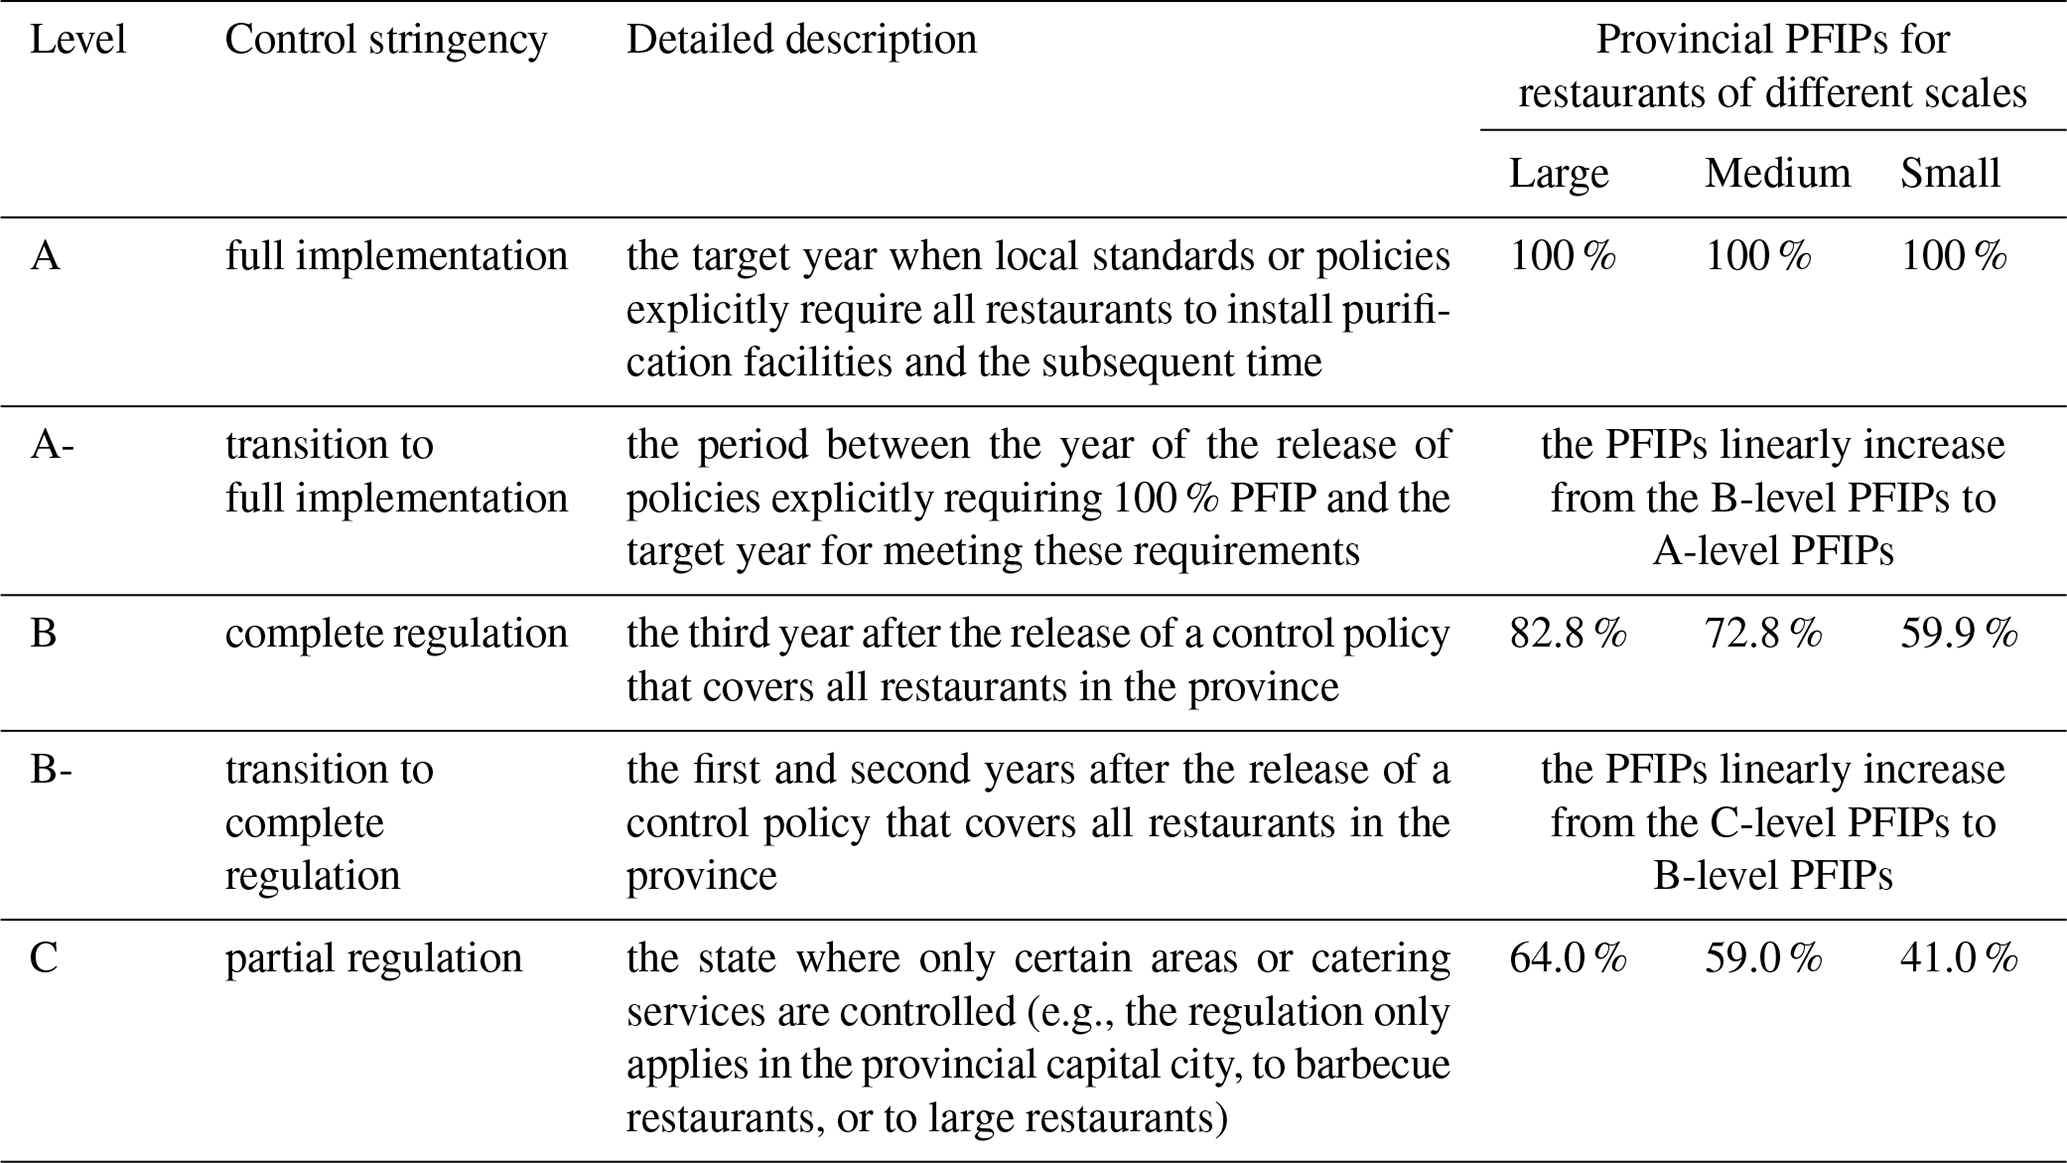
The treatment of the PFIP has always been a weakness in previous cooking emission inventories. Most studies simplistically assume that all commercial restaurants have fume purification facilities (Liang et al., 2022; Wang et al., 2018a; Cheng et al., 2022). While a few studies obtained citywide PFIPs through door-to-door restaurant surveys (Jin et al., 2021; Li, 2020), the time- and labor-intensive nature of these surveys constrains their spatial and temporal coverage. So far, PFIP survey results are only available for three cities. To overcome this limitation, we gather multi-year policies related to catering emission control in each province, and extrapolate the PFIPs from specific years in three cities to multiple years (2015–2021) in China's 31 provinces based on the assumption that the installation proportions correlate closely with the stringency of local regulations. Specifically, we first construct the relationship between the stringency of pollution control policies and PFIP based on the situation for the three cities (Heze, Linfen, Nanjing) with detailed PFIP survey data (Jin et al., 2021; Li, 2020), as shown in Table 1. Notably, the pollution control scenarios of these three cities include cases of both strong and weak regulatory forces. When combined with the optimal scenario (a PFIP reaching 100 %), they essentially cover the various pollution control statuses across different regions nationwide.
We divided the stringency of the control policies into different levels. Among the three cities, Heze is classified as level C (partial regulation). In the year of the PFIP survey in Heze, Heze's catering control policy only included spot checks on restaurants in busy food streets. Linfen and Nanjing are classified as level B (complete regulation). At the time of the survey, their policy state was such that citywide catering industry emission control policies had been implemented for 3 years. The PFIP survey results for the three cities are used for PFIPs of level B and level C. However, although the introduction of citywide emission control policies can increase the PFIPs, it does not guarantee that all restaurants will adopt the requisite purification facilities, as evidenced by the PFIPs for level B. Further, the optimal level A (full implementation) represents the target year in which local standards or policies explicitly require all restaurants to install the purification facility. It is easy to see that the corresponding PFIP for level A is 100 %. Since the policy may not be implemented immediately after it is issued, we also consider a transition period, i.e., the status corresponding to A- and B- in Table 1. The transition period from the introduction of a citywide control policy to the achievement of level B is considered to be 3 years, based on the situation for the two surveyed cities (Jin et al., 2021; Li, 2020). The transition period from the announcement of the full implementation policy to the achievement of level A depends on the target time specified in the policy. During the transition period, the PFIP is considered to increase linearly. Also, if no new policy is issued, the PFIPs will remain unchanged.
Table 1Grading standards for provincial catering emission control stringency and the PFIPs corresponding to each control stringency level.
Next, we collate key policy milestones and implementation transition periods for catering pollution control policies in each province to determine the level of control stringency (see Sect. S3 for details) and thus obtain the corresponding PFIP based on Table 1. Note that the PFIPs of restaurants of different scales may vary. Therefore, for commercial restaurants, the PFIPs are taken as weighted averages calculated according to the proportion of restaurants at each scale (see Table S2). As for canteens, since they typically cater to large numbers of students and employees, we approximate the canteens' PFIPs as being consistent with those of large-scale restaurants in the same regions.
2.3 Grid allocation
To examine regional emission variations, pinpoint hotspots, and assess emission impacts on air quality, a grid inventory for cooking emissions is necessary. Here we allocate cooking emissions in China into grids with a 27 km ×27 km spatial resolution, utilizing catering-related POI data and the nationwide population density data with a spatial resolution of 1 km ×1 km. Gridded datasets with higher resolutions of up to 1 km ×1 km can be prepared with the same method. For commercial catering, we have developed an emission inventory with point-source accuracy. We simply aggregate the emissions of restaurants located within each grid to obtain the gridded inventory, with calculations performed in R-4.0.3 to handle the massive computational load. Also, emissions for canteens and residences are allocated to the county level based on the tertiary industry gross domestic product (GDP) (National Bureau of Statistics, 2022c) and then distributed to grids per population density.
2.4 Uncertainty analysis
We employ Monte Carlo simulations to estimate the uncertainties in emissions by considering the probabilistic distributions of key parameters. Our approach to quantifying the uncertainties of the parameters is generally consistent with Chang et al. (2022). The activity data is assumed to follow a normal distribution with coefficients of variation (CVs) between 5 %–50 %, based on the standard proposed by Li (2017). The EFs are assumed to fit a log-normal distribution, with the CV values based on Chang et al. (2022). Since we make some estimations based on the raw data for measured EFs, including using VOC or POA EFs to infer the gaseous and particle-phase full-volatility EFs and using PM2.5 EFs to infer POA emission factors, we also consider the additional uncertainty introduced by these estimates. For the former estimation, we add an additional 30 % to the original range of uncertainty of the EFs; for instance, increasing it from 50 % to 80 %. For the latter estimation, we added an extra 20 % to the original range. Furthermore, the unit conversion would add an additional 20 % to the uncertainty. Additionally, the CVs for purification efficiencies and installation proportions of fume purification facilities are assumed to be 20 % and 30 %, respectively (Li, 2017). Then, we conduct 10 000 iterations of the simulation, which yields results in the form of statistical distributions. This enables us to ascertain the uncertainty ranges for emissions from various sources at the 95 % confidence level.
2.5 Sensitivity simulations
We conduct a series of sensitivity analyses to explore the factors driving changes in cooking emissions during 2015–2021. Direct influencing factors of cooking emission changes include variations in the catering industry (specifically, the changes in the total number of restaurants and the cuisine distribution), pollution control enhancement, changes in edible oil use, and changes in canteen diners. These factors are also indirectly affected by changes in the external environment, such as economic growth, population migration, and the COVID-19 pandemic. We use a brute-force method to quantify the annual impact of the four factors from 2015 to 2021, in which we sequentially adjust the values of an individual factor to their value the following year. The difference between the emissions pre- and post-adjustment is seen as that factor's contribution to the emission change for that year.
The database provided in this study includes emission calculation parameters and emission inventories. We provide a set of full-volatility EFs applicable nationwide, high-resolution activity data, and dynamically changing PFIPs (Sect. 3.1), which are beneficial for calculating emission inventories for different periods and regions. Concurrently, an analysis of emission characteristics, including the volatility distribution (Sect. 3.2), spatial distributions (Sect. 3.3), and temporal evolution trends (Sect. 3.4), provides comprehensive insights into cooking emissions.
3.1 Full-volatility emission factors, cooking activity data, and purification facility installation proportions
In this study, we present a set of controlled and uncontrolled full-volatility organic EFs for cuisine-specific commercial cooking as well as residential and canteen cooking (Table 2 and Fig. 2). Commercial restaurants and canteen may or may not have purification facilities for pollutant removal, while fumes from home kitchens are usually expelled through range hoods or exhaust fans without purification (Liang et al., 2022; Qi et al., 2020). Therefore, we provide both controlled and uncontrolled EFs for commercial cooking and canteen cooking and uncontrolled EFs for residential cooking. According to Fig. 2, the significant variance in EFs across the nine commercial cuisines demonstrates the necessity of distinguishing among cuisines when quantifying commercial cooking emissions. Sichuan–Hunan cuisine exhibits the highest controlled EF (11 498 µg m−3) among the nine commercial cuisines, which is attributed to its high oil consumption and the extensive use of spicy seasonings such as chili and pepper. Barbecue ranks second in controlled EF value (9430 µg m−3), largely due to the high heat levels used (which facilitate complex chemical reactions) and the extensive use of seasonings. Comparatively, home-style cuisine and non-Chinese cuisines show the lowest emissions (1555 and 1673 µg m−3), probably because of their less frequent usage of high-emission cooking methods such as frying and grilling compared to other local specialty cuisines. Also, the residential cooking uncontrolled EF is 20.3 g kg oil−1, and the canteen cooking controlled EF is 0.648 g meals−1. The volatility distribution of EFs is similar for all cooking sources. VOCs dominate the cooking organic emissions (∼55 %), followed by SVOCs (17 %–33 %) and IVOCs (11 %–36 %), while xLVOCs are negligible (<2 %).
The removal efficiencies of gaseous and particle-phase organics for different cuisines are listed in Table S6. Average removal efficiencies are 57.2 % and 55.4 % for gaseous and particle-phase organics, respectively. Currently, the national standard and most local standards lack regulations on the removal efficiency for VOCs and particulate matter (PM), let alone for full-volatility organics. Only the local standard of Beijing (Beijing Environmental Protection Bureau, 2018) mentions the removal efficiency requirements of related pollutants, namely non-methane hydrocarbons (NMHCs) and PM, as shown in Table S7. In contrast, the current average removal efficiencies of gaseous and particle-phase organics fall short of the efficiencies of NMHCs (68.7 %) and PM (82.3 %) in the Beijing standard (Beijing Environmental Protection Bureau, 2018), possibly due to sub-optimal maintenance and cleaning of fume purification facilities.
Table 2Controlled and uncontrolled full-volatility EFs for different cooking sources.
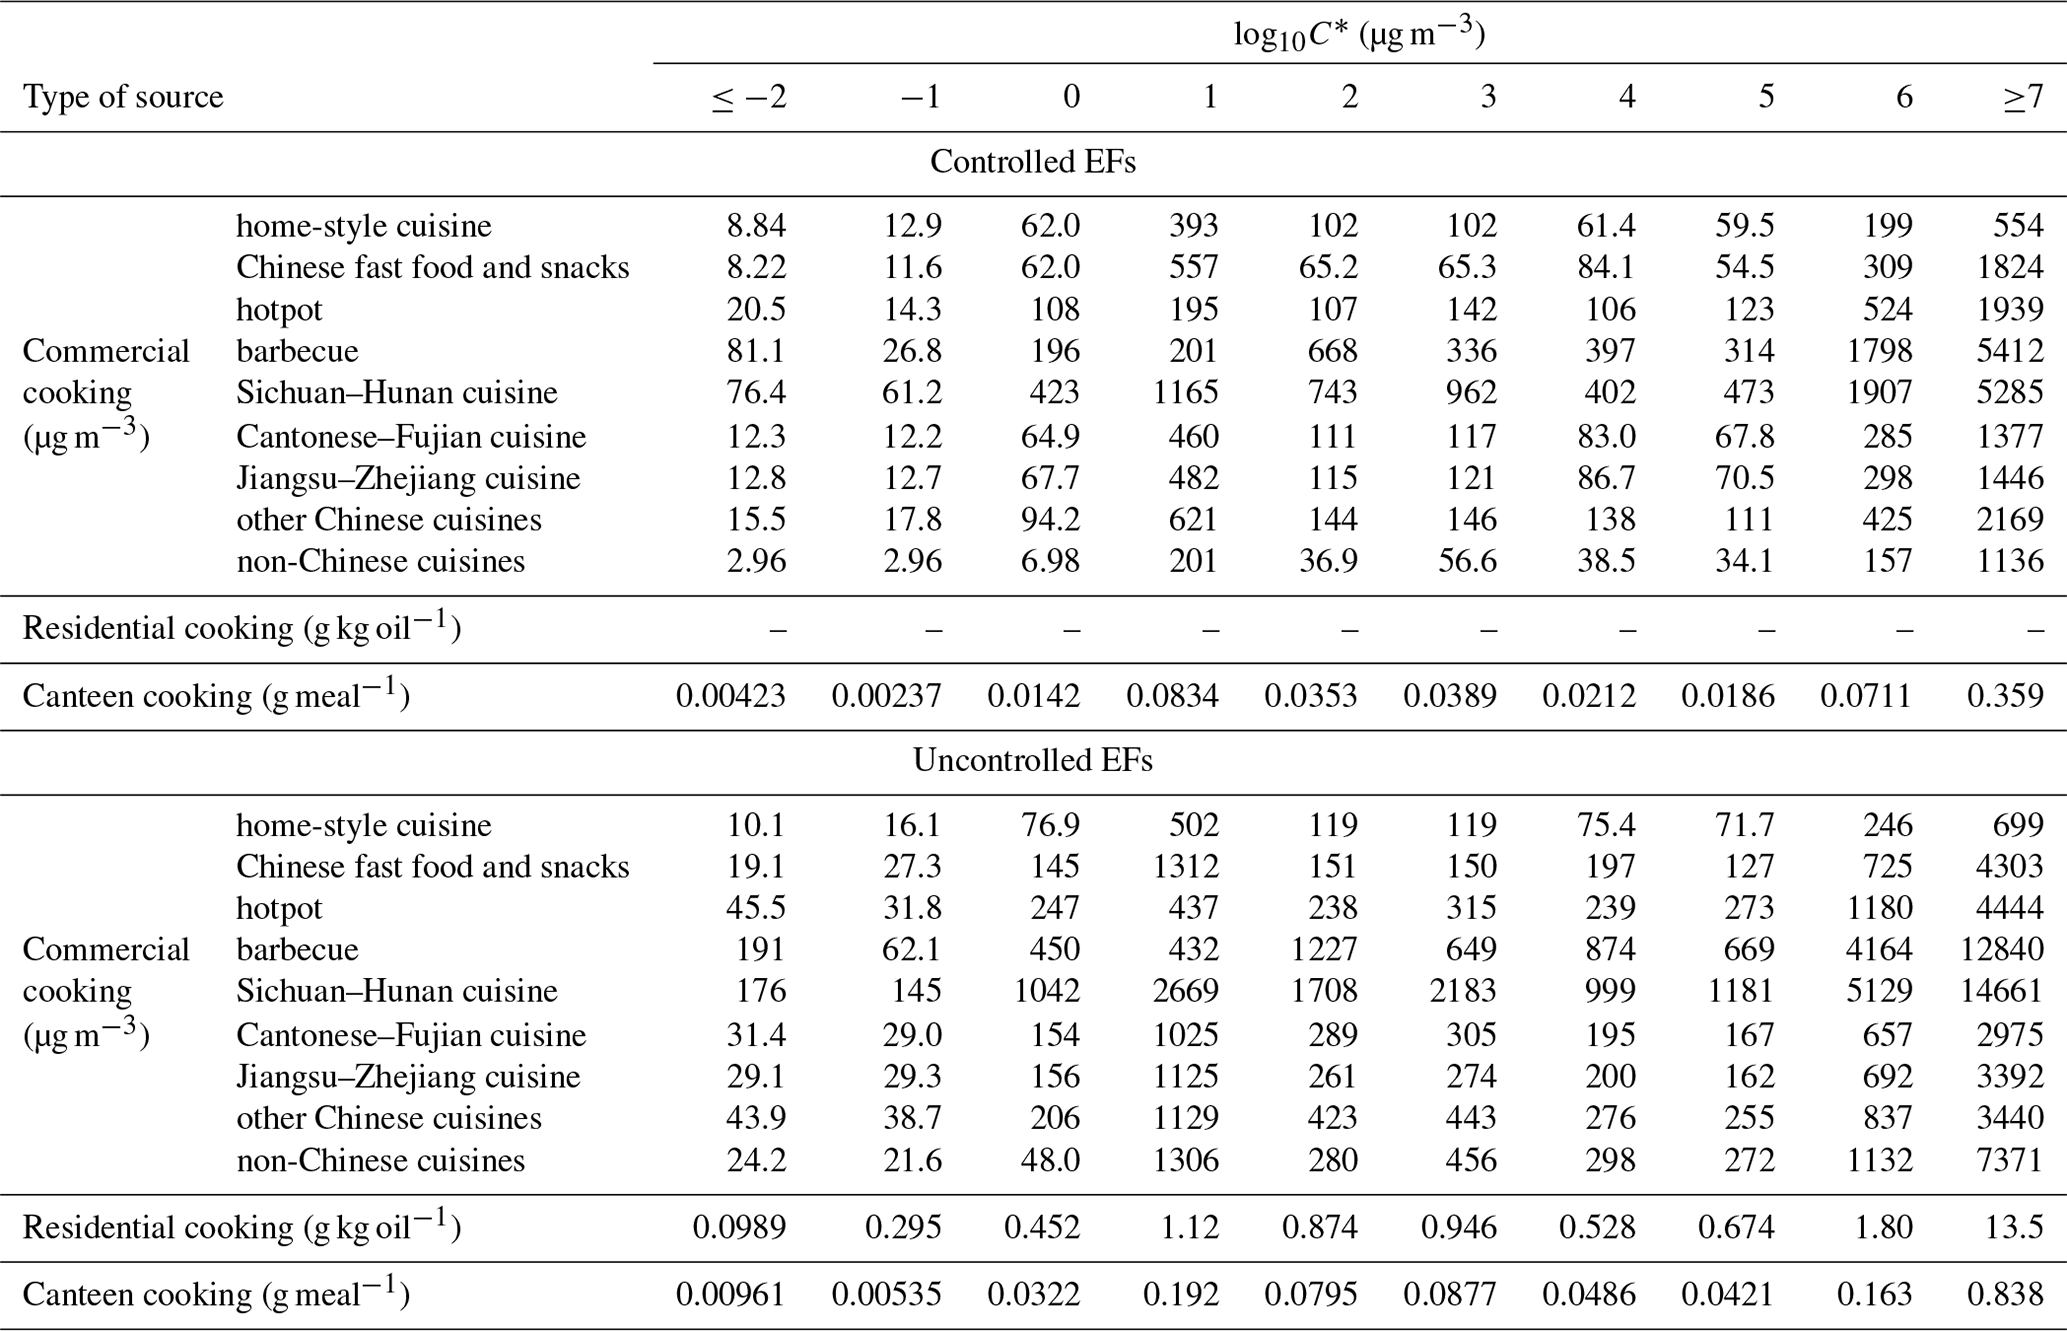
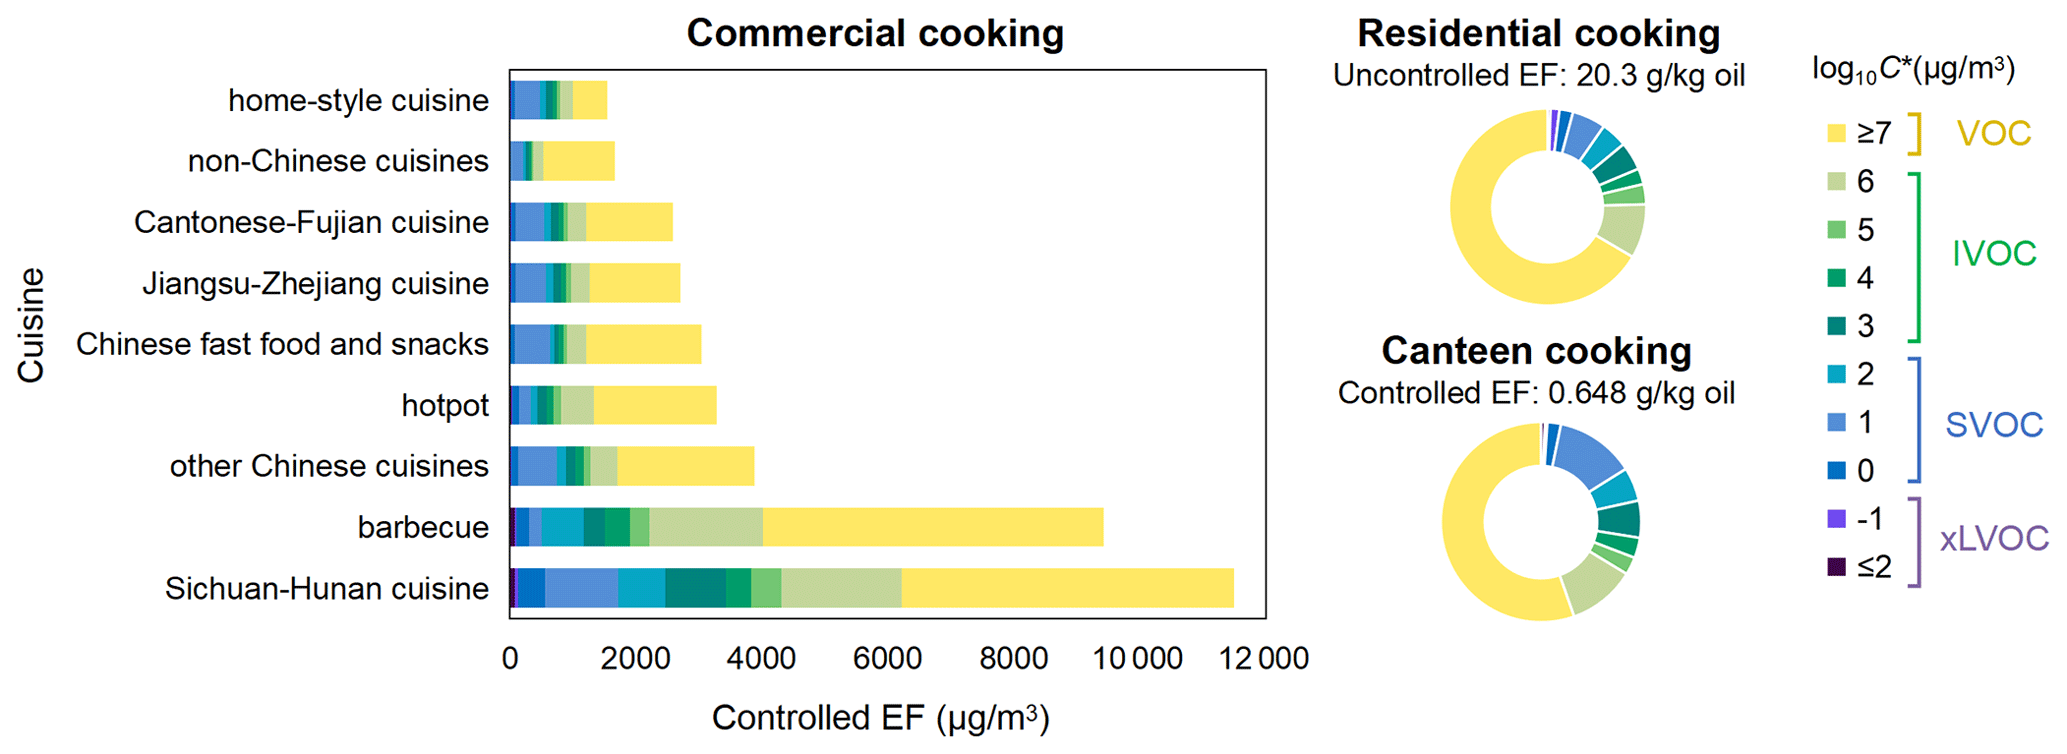
Figure 2Full-volatility EFs for different cooking sources. The colors represent volatility ranges: purple for xLVOCs, blue for SVOCs, green for IVOCs, and yellow for VOCs. Darker colors in the same color group signify lower volatility. The controlled EFs for commercial and canteen cooking are displayed here, as most full-volatility EFs are tested after pollution control facilities and most uncontrolled EFs are inferred from the controlled EFs. The uncontrolled EFs for residential cooking are displayed here, considering the absence of pollution control facilities in home kitchens.
Figure 3 presents the trend in activity data for each emission source from 2015 to 2021, along with the contributions of their respective subsectors averaged over these years. The volume of fume gas produced by commercial restaurants is largely associated with the number of restaurants. The total number of restaurants increased from 5.61 million in 2015 to 7.70 million in 2021, reflecting the rapid expansion of China's catering industry. However, there was a dip in the number of restaurants in 2020, potentially attributed to the impact of the COVID-19 pandemic on catering. Figure S2 illustrates the proportion of each cuisine in each province and across China during 2015–2021. It reveals that Chinese fast food and snacks (28.3 %), home-style cuisine (20.7 %), and Sichuan–Hunan cuisine (11.1 %) are the most popular cuisines in China, while non-Chinese cuisine (3.21 %) and barbecue (4.67 %) are the least common. However, given that most Chinese fast food and snack restaurants are of a small scale, their contribution to the total fume gas volume is much less, accounting for only 11.6 %. The activity data for residential cooking, the household edible oil consumption, is essentially stable, with fluctuations in certain years. The fluctuations are potentially attributed to less frequent home cooking due to the rise of food delivery services and more frequent home cooking during COVID-19 lockdowns. Additionally, the meals provided by canteens have gradually increased, likely due to China's growing population and urbanization.
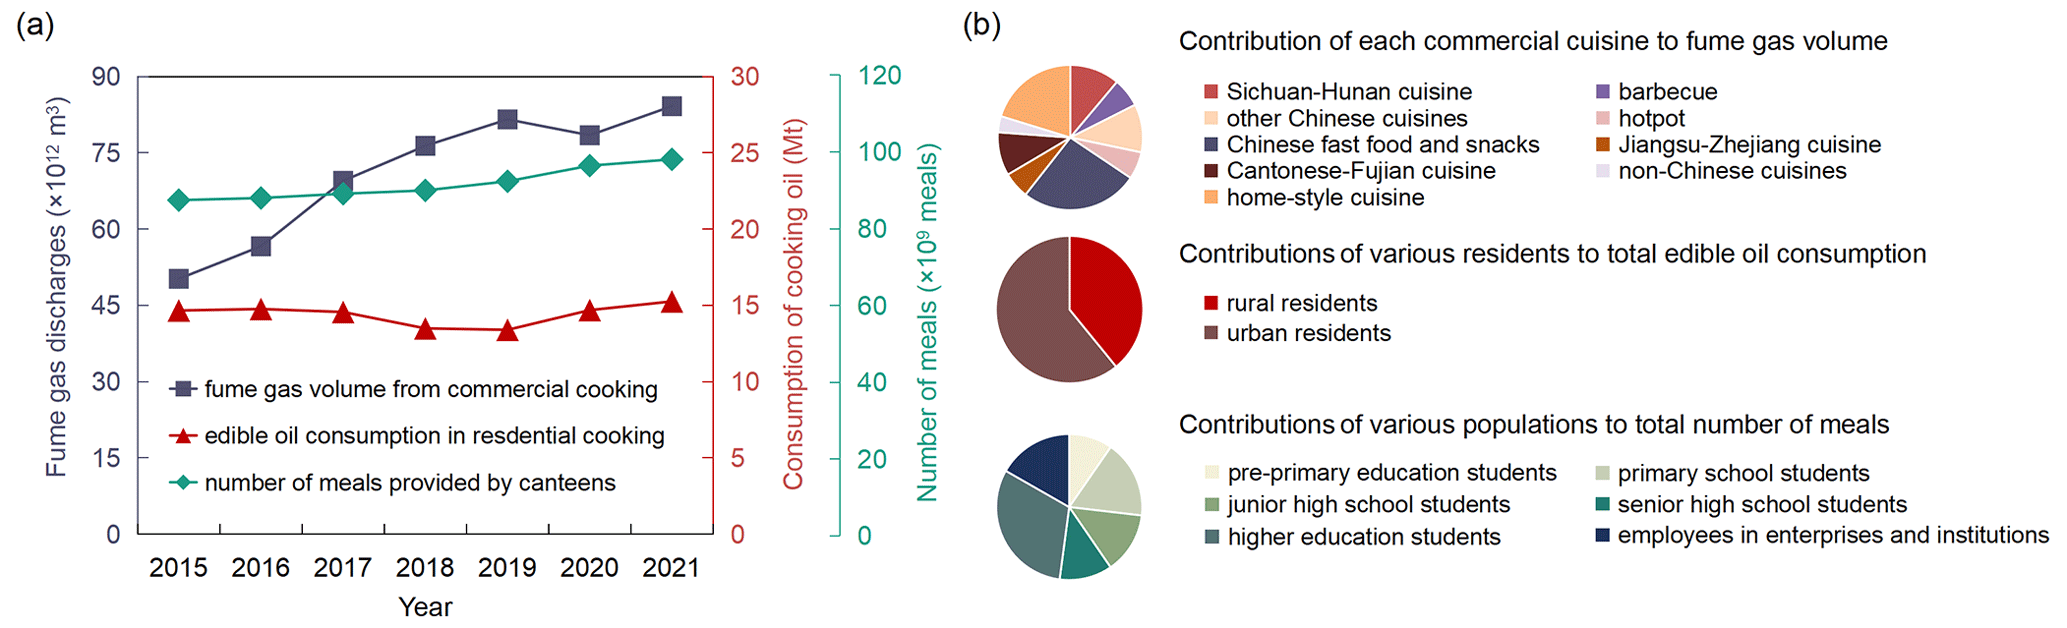
Figure 3(a) National activity data for commercial, residential, and canteen cooking from 2015–2021 and (b) their subsectors' contributions.
Notably, we obtain point-source precision activity data for commercial cooking, including the geographic location and cuisine type of each restaurant. This helps with the accurate determination of the spatial distribution of commercial cooking emissions and the identification of regional differences. Figure 4 shows the geographic distribution of all restaurants of various cuisine types across China. The spatial distributions of different cuisines vary greatly. The restaurants serving local specialty cuisines, including Sichuan–Hunan, Fujian–Cantonese, Jiangsu–Zhejiang, and other Chinese cuisines (mainly composed of the famous Beijing cuisine, Shandong cuisine, Anhui cuisine, and Xinjiang cuisine), are clearly concentrated in certain provinces. Restaurants that serve home-style dishes typically offer common, simple, traditional Chinese meals, similar to those prepared in home kitchens, as opposed to the refined and complex dishes found in larger upscale restaurants. They are not distributed in some provinces, such as Sichuan, Hunan, and Guangdong, because home-style restaurants in these provinces have been classified as local specialty cuisine restaurants due to their distinctive local characteristics (specific categorization principles are available in Sect. S1). Other cuisines are mainly distributed in populous areas throughout the country. Based on Fig. S1, we find that the cuisine distributions are similar in most provinces across China. However, in some provinces, such as Hunan, Guangdong, Zhejiang, and Beijing, the local specialty cuisines are dominant.
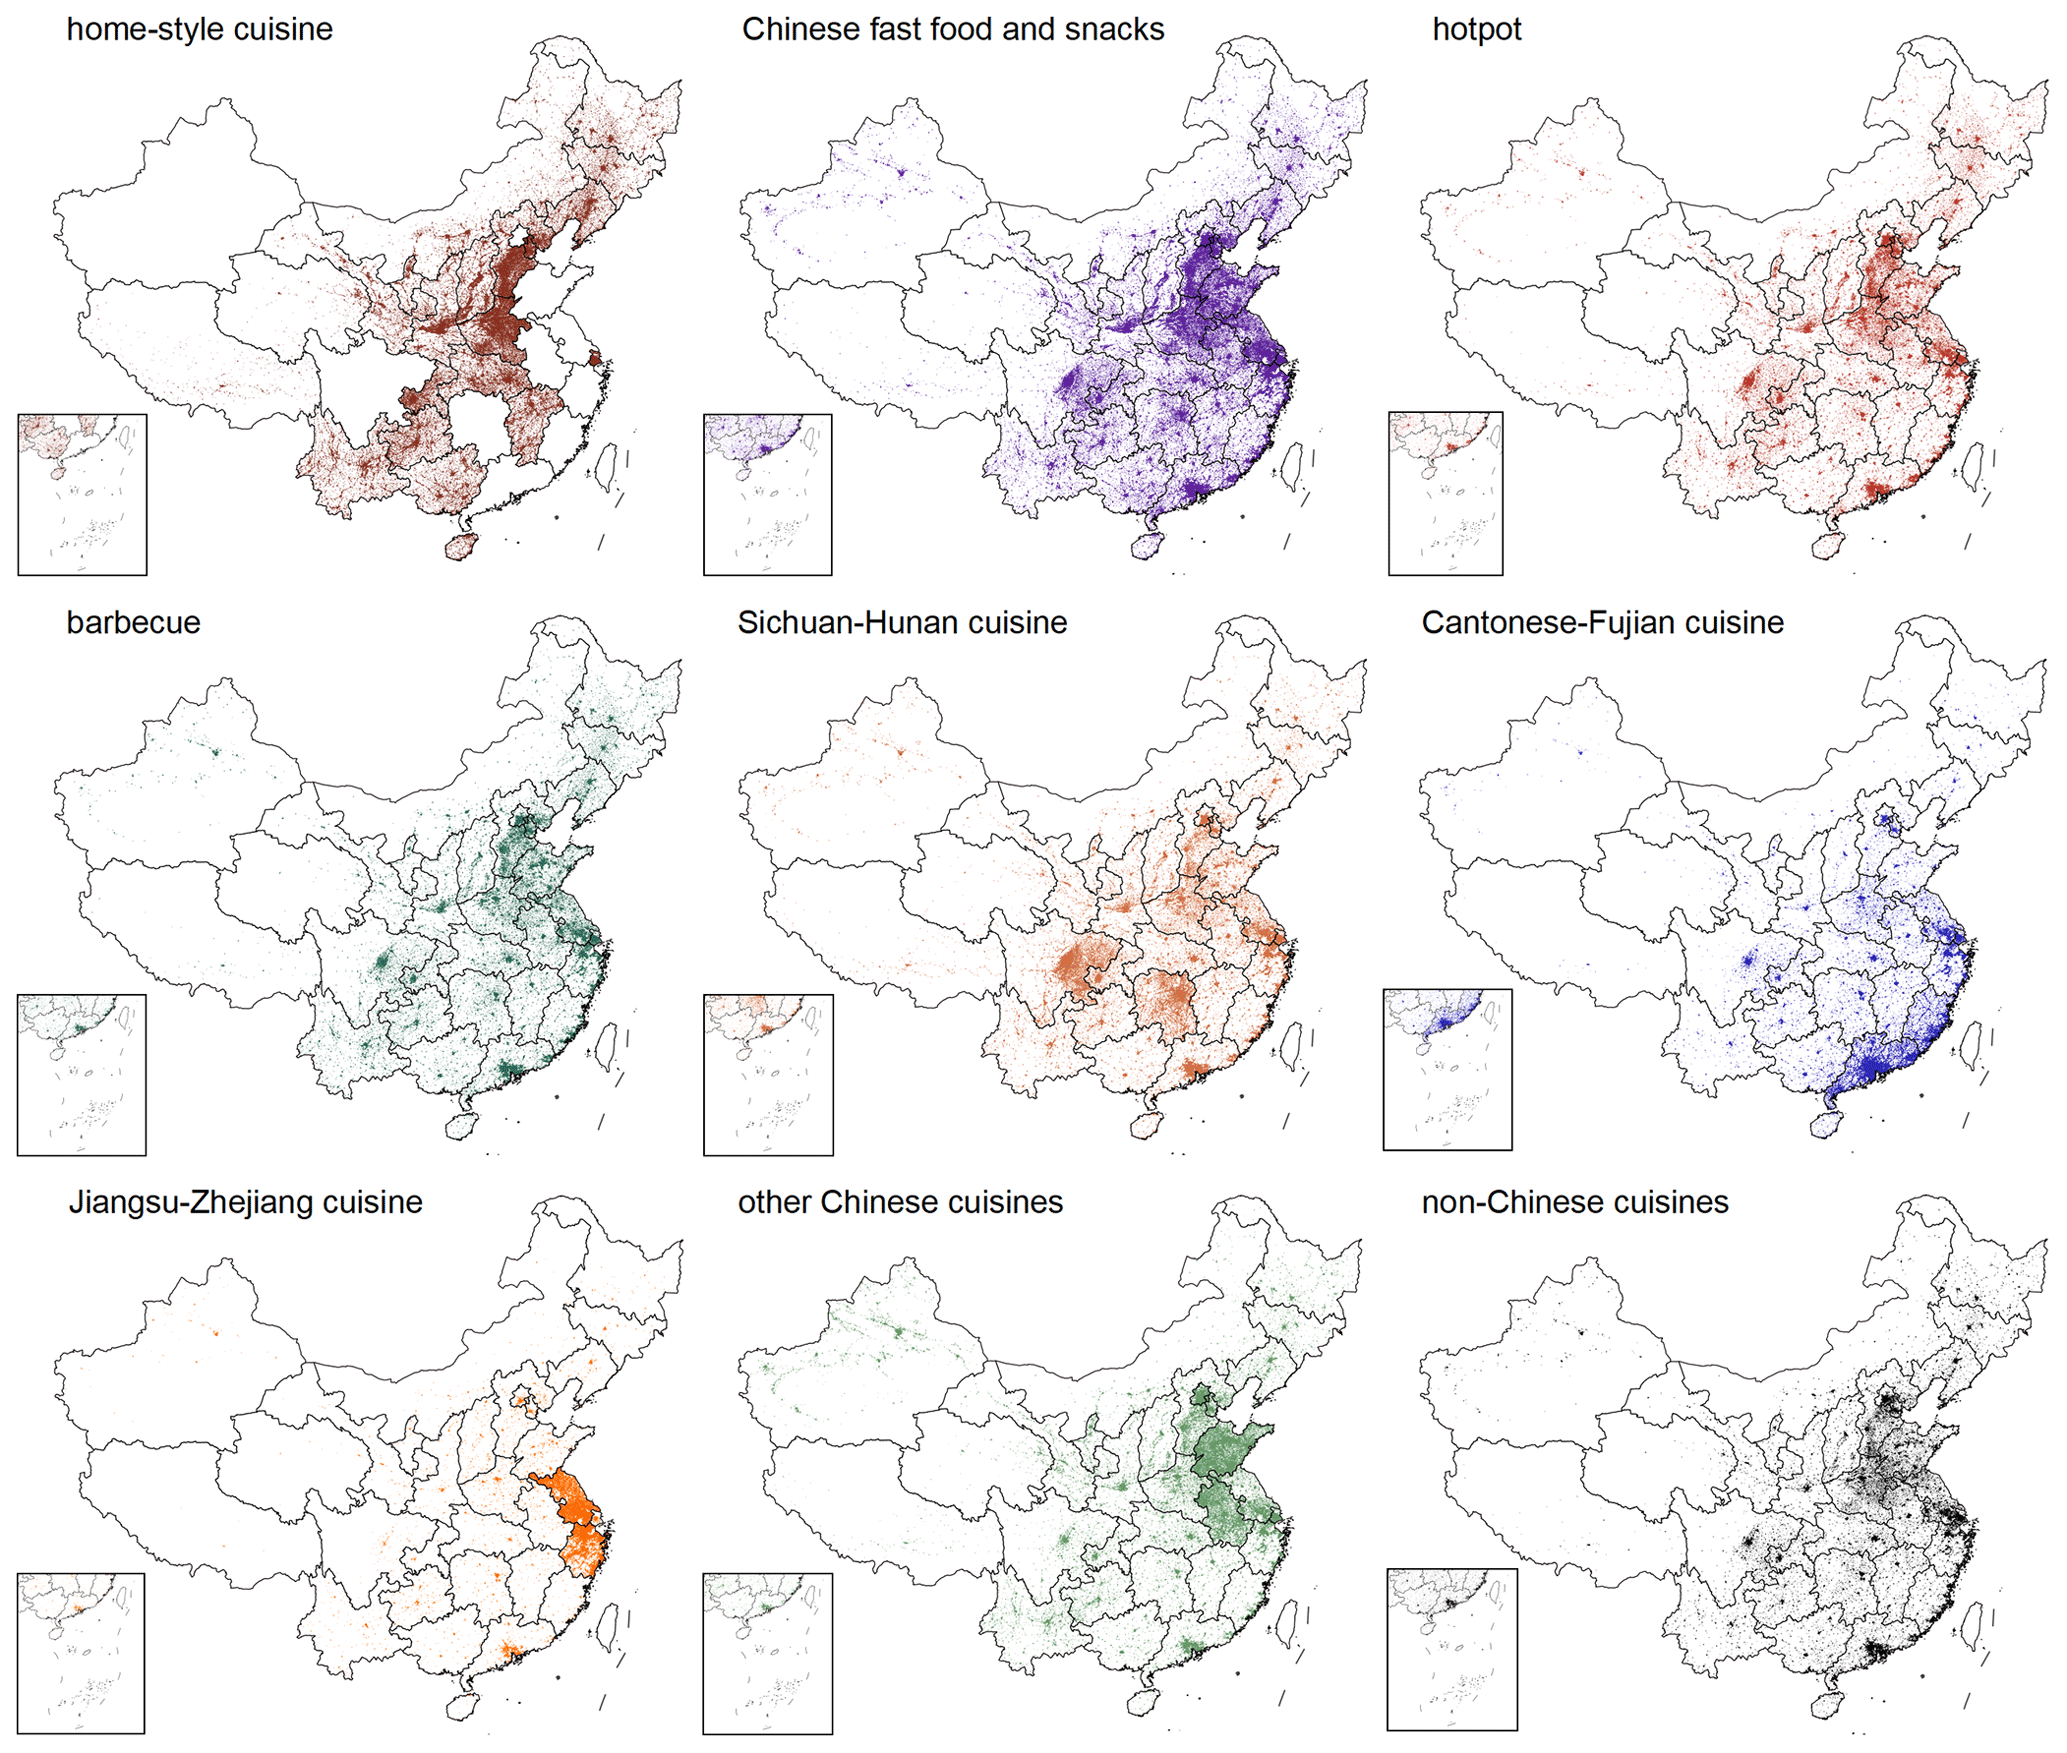
Figure 4The geographical locations of all restaurants in China, categorized by cuisine.
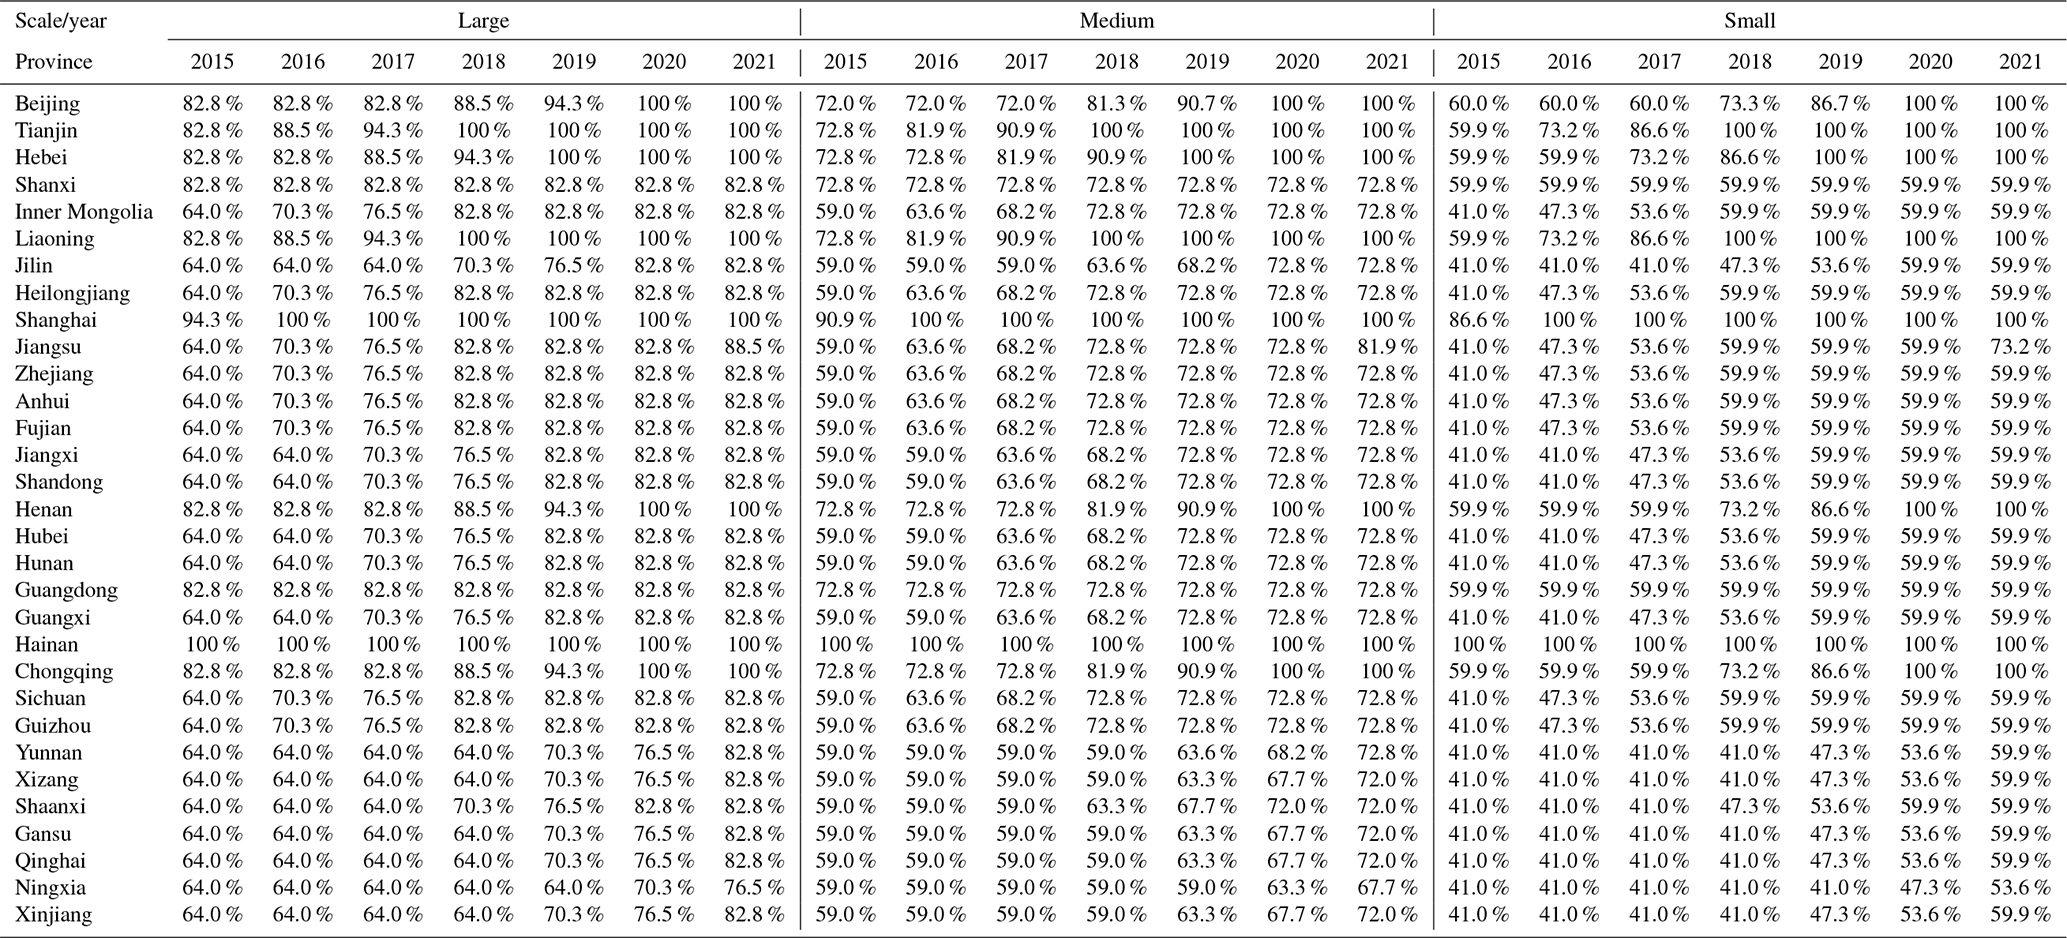
Table 3 illustrates the PFIPs of 31 provinces in China from 2015 to 2021. An overall improvement in pollution control has been observed nationwide in recent years as the importance of cooking emissions has been increasingly recognized. The national overall PFIP increased from 54.4 % in 2015 to 73.9 % in 2021. Besides, the PFIP tends to increase with restaurant scale, probably because larger restaurants face greater regulatory pressure or have more funding for fume purification. The PFIP exhibits considerable variation across different provinces due to different levels of focus on pollution control in the catering industry. Provinces such as Beijing, Liaoning, Shanghai, and Hainan were the first to achieve PFIPs of 100 %, as they have long emphasized the control of pollution emissions from cooking sources and have issued explicit regulations requiring all restaurants to install purification facilities. In contrast, the PFIPs in most other provinces remain relatively low, as major efforts to strengthen cooking source pollution control in these regions were initiated mainly between 2015 and 2018.
Table 3Purification facility installation proportions for restaurants of different scales in each province.
3.2 Full-volatility organic emissions from cooking in China
Figure 5 shows the national emission inventory of full-volatility organic emissions from cooking in 2021 and the uncertainty ranges of emissions. The xLVOC, SVOC, IVOC, and VOC emissions in China in 2021 were 13.1 (7.36–21.0, 95 % confidence level) kt yr−1, 176 (95.8–290) kt yr−1, 241 (135–374) kt yr−1, and 561 (317–891) kt yr−1, respectively. The majority of those emissions were VOCs (56.4 %), followed by IVOCs (24.6 %) and SVOCs (17.7 %), with xLVOCs comprising only 1.32 %.
Among all cooking sources, commercial cooking had the most prominent emissions, contributing 46.7 %, 68.5 %, 66.2 %, and 54.5 %, respectively, to the xLVOC, SVOC, IVOC, and VOC emissions on average from 2015 to 2021. Sichuan–Hunan cuisine contributed the most to emissions among all commercial cuisines, accounting for 19.3 %–30.6 % of cooking emissions from all cooking sources in the four volatility ranges, despite Sichuan–Hunan cuisine not being the most common cuisine (it was cooked by only 11.1 % of all restaurants). In contrast, the most common Chinese fast food and snacks and home-style cuisine contributed less to the emissions (≤9.25 %) in the four volatility ranges. This further emphasizes the significant influence of variations in EFs across different cuisines. Additionally, residential cooking was also a notable source, contributing 47.1 %, 22.2 %, 25.9 %, and 37.5 % to xLVOC, SVOC, IVOC, and VOC emissions, respectively, whereas canteens made a minor contribution to the full-volatility organics (<10 %).
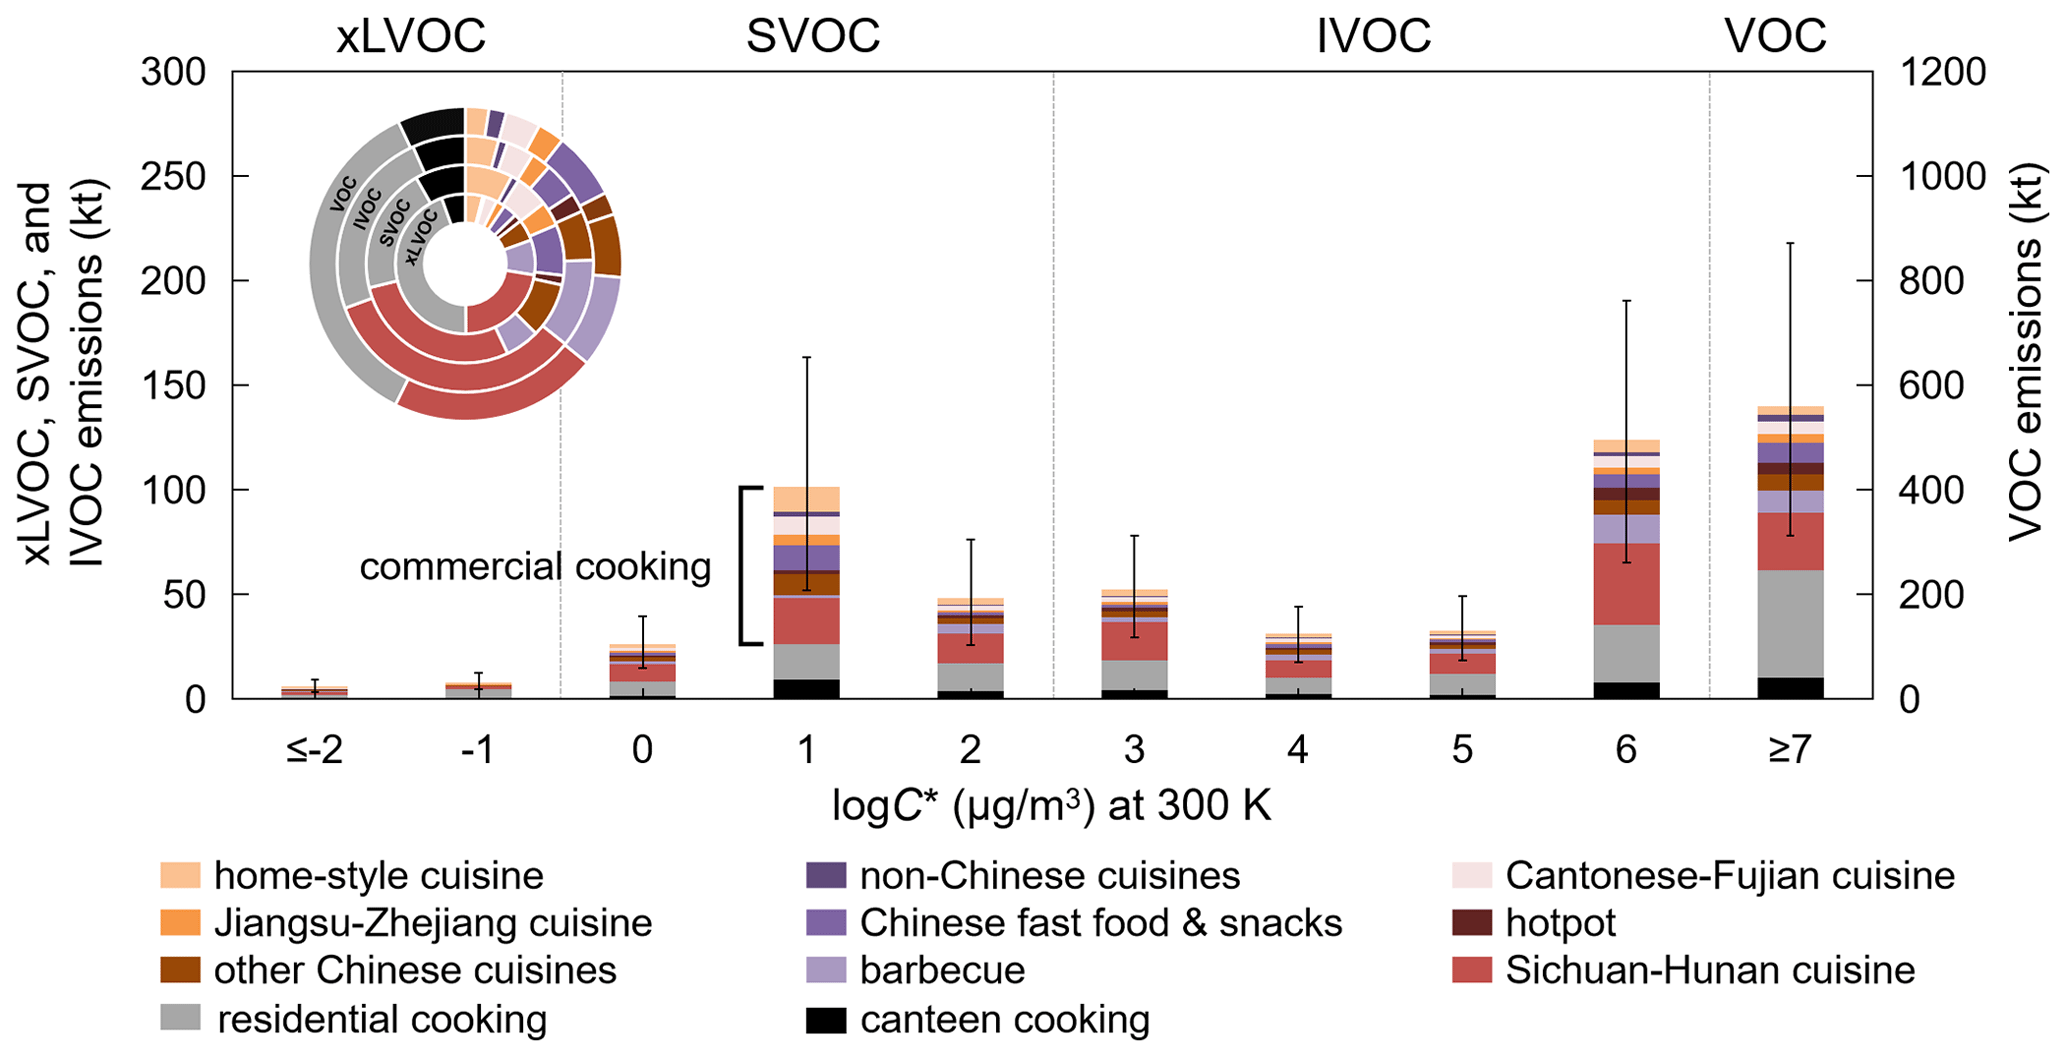
Figure 5Full-volatility organic emissions from different cooking sources in China in 2021. The gray and black bars represent the residential and canteen cooking emissions in each volatility bin, respectively. Other colors represent the emissions from different commercial cuisines. Each error bar indicates the uncertainty range of emissions for the 95 % confidence level. The upper left corner displays the contributions of various types of cooking sources to emissions across the four volatility ranges.
The uncertainty ranges (95 % confidence interval) of the national cooking emissions are estimated as [−47.5 %, 60.2 %] for commercial cooking, [−63.0 %, −124 %] for residential cooking, [−91.0 %, −213 %] for canteen cooking, and [−45.2 %, +53.5 %] for total cooking emissions. The uncertainty in the total emissions is less due to offset effects across sectors. The relatively large uncertainty in canteen emissions arises from activity level estimates and EF unit conversions. As canteen emissions are small, the uncertainty in them has little impact on the uncertainty in the total emissions. The residential emission uncertainty also largely originates from EF unit conversions, while the smaller uncertainty in commercial cooking emissions is due to a greater number of EF tests and better statistics.
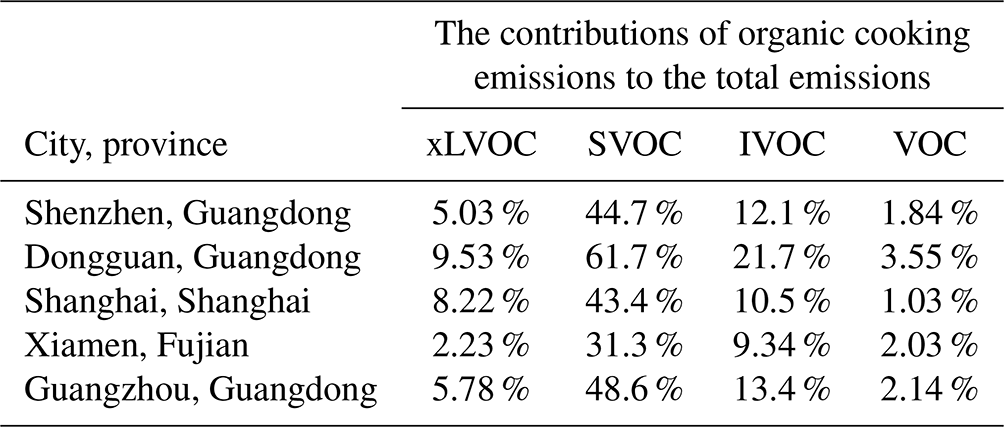
Furthermore, we evaluate the importance of cooking organic emissions by combining our emission inventory in 2017 with the full-volatility emissions inventory in 2017 developed by Chang et al. (2022), which lacks cooking sources. The results indicate that the cooking source contributes 1.03 %, 12.7 %, 5.53 %, and 1.83 % to the total xLVOC, SVOC, IVOC, and VOC emissions, respectively. This reveals the significance of I/SVOC emissions from the cooking source, suggesting that accounting for the previously missing cooking source may be crucial for accurately identifying the source of SOA. In fact, cooking activities are often concentrated in densely populated urban areas. Table 4 lists the contributions of cooking emissions to the total emissions in the four volatility ranges in the five most densely populated cities in China. In these regions, the importance of organic emissions from cooking, particularly I/SVOC emissions, is much higher than the national average. The contributions to SVOC emissions from cooking sources are all above 30 %, reaching up to 61.7 % at maximum. The contribution of cooking sources to IVOCs is also significant (9.34 %–21.7 %). Furthermore, the close affinity of cooking activities with the human living environment renders its organic emissions a high health risk. Therefore, obtaining accurate cooking emissions, including their spatial distribution, is necessary for studies on the causes and health impacts of air pollution in the human living environment.
Table 4The contributions of cooking emissions to the total emissions in the four volatility ranges in the five most densely populated cities in China.
3.3 Spatial distributions of emissions
The comprehensive and cuisine-specific activity data in our emission estimates, coupled with the provincial policy-driven PFIPs, allow us to discern regional emission disparities accurately. Figure 6 displays the provincial total and per capita emissions from cooking sources in China in 2021. The provincial total emissions are closely associated with the population. The provinces with the highest populations – Guangdong, Shandong, Henan, and Jiangsu – are at the forefront of emissions, whereas those with the smallest populations – Tibet, Qinghai, Ningxia, and Hainan – are at the bottom. Surprisingly, per capita emissions show a threefold difference among provinces, which is likely attributable to different dietary preferences. For example, people in Sichuan and Hunan prefer spicy and oil-rich food, increasing the average commercial cooking EFs and household edible oil consumption in these regions. Therefore, the per capita emissions in Hunan and Sichuan (1.35 and 1.19 kg/person, respectively) are significantly higher than the national average (0.701 kg/person). Moreover, the importance of emission sources varies by province, but the overall picture across all provinces is that commercial cooking emissions are generally the most prominent, followed by domestic cooking, with minimal emissions from canteen cooking.
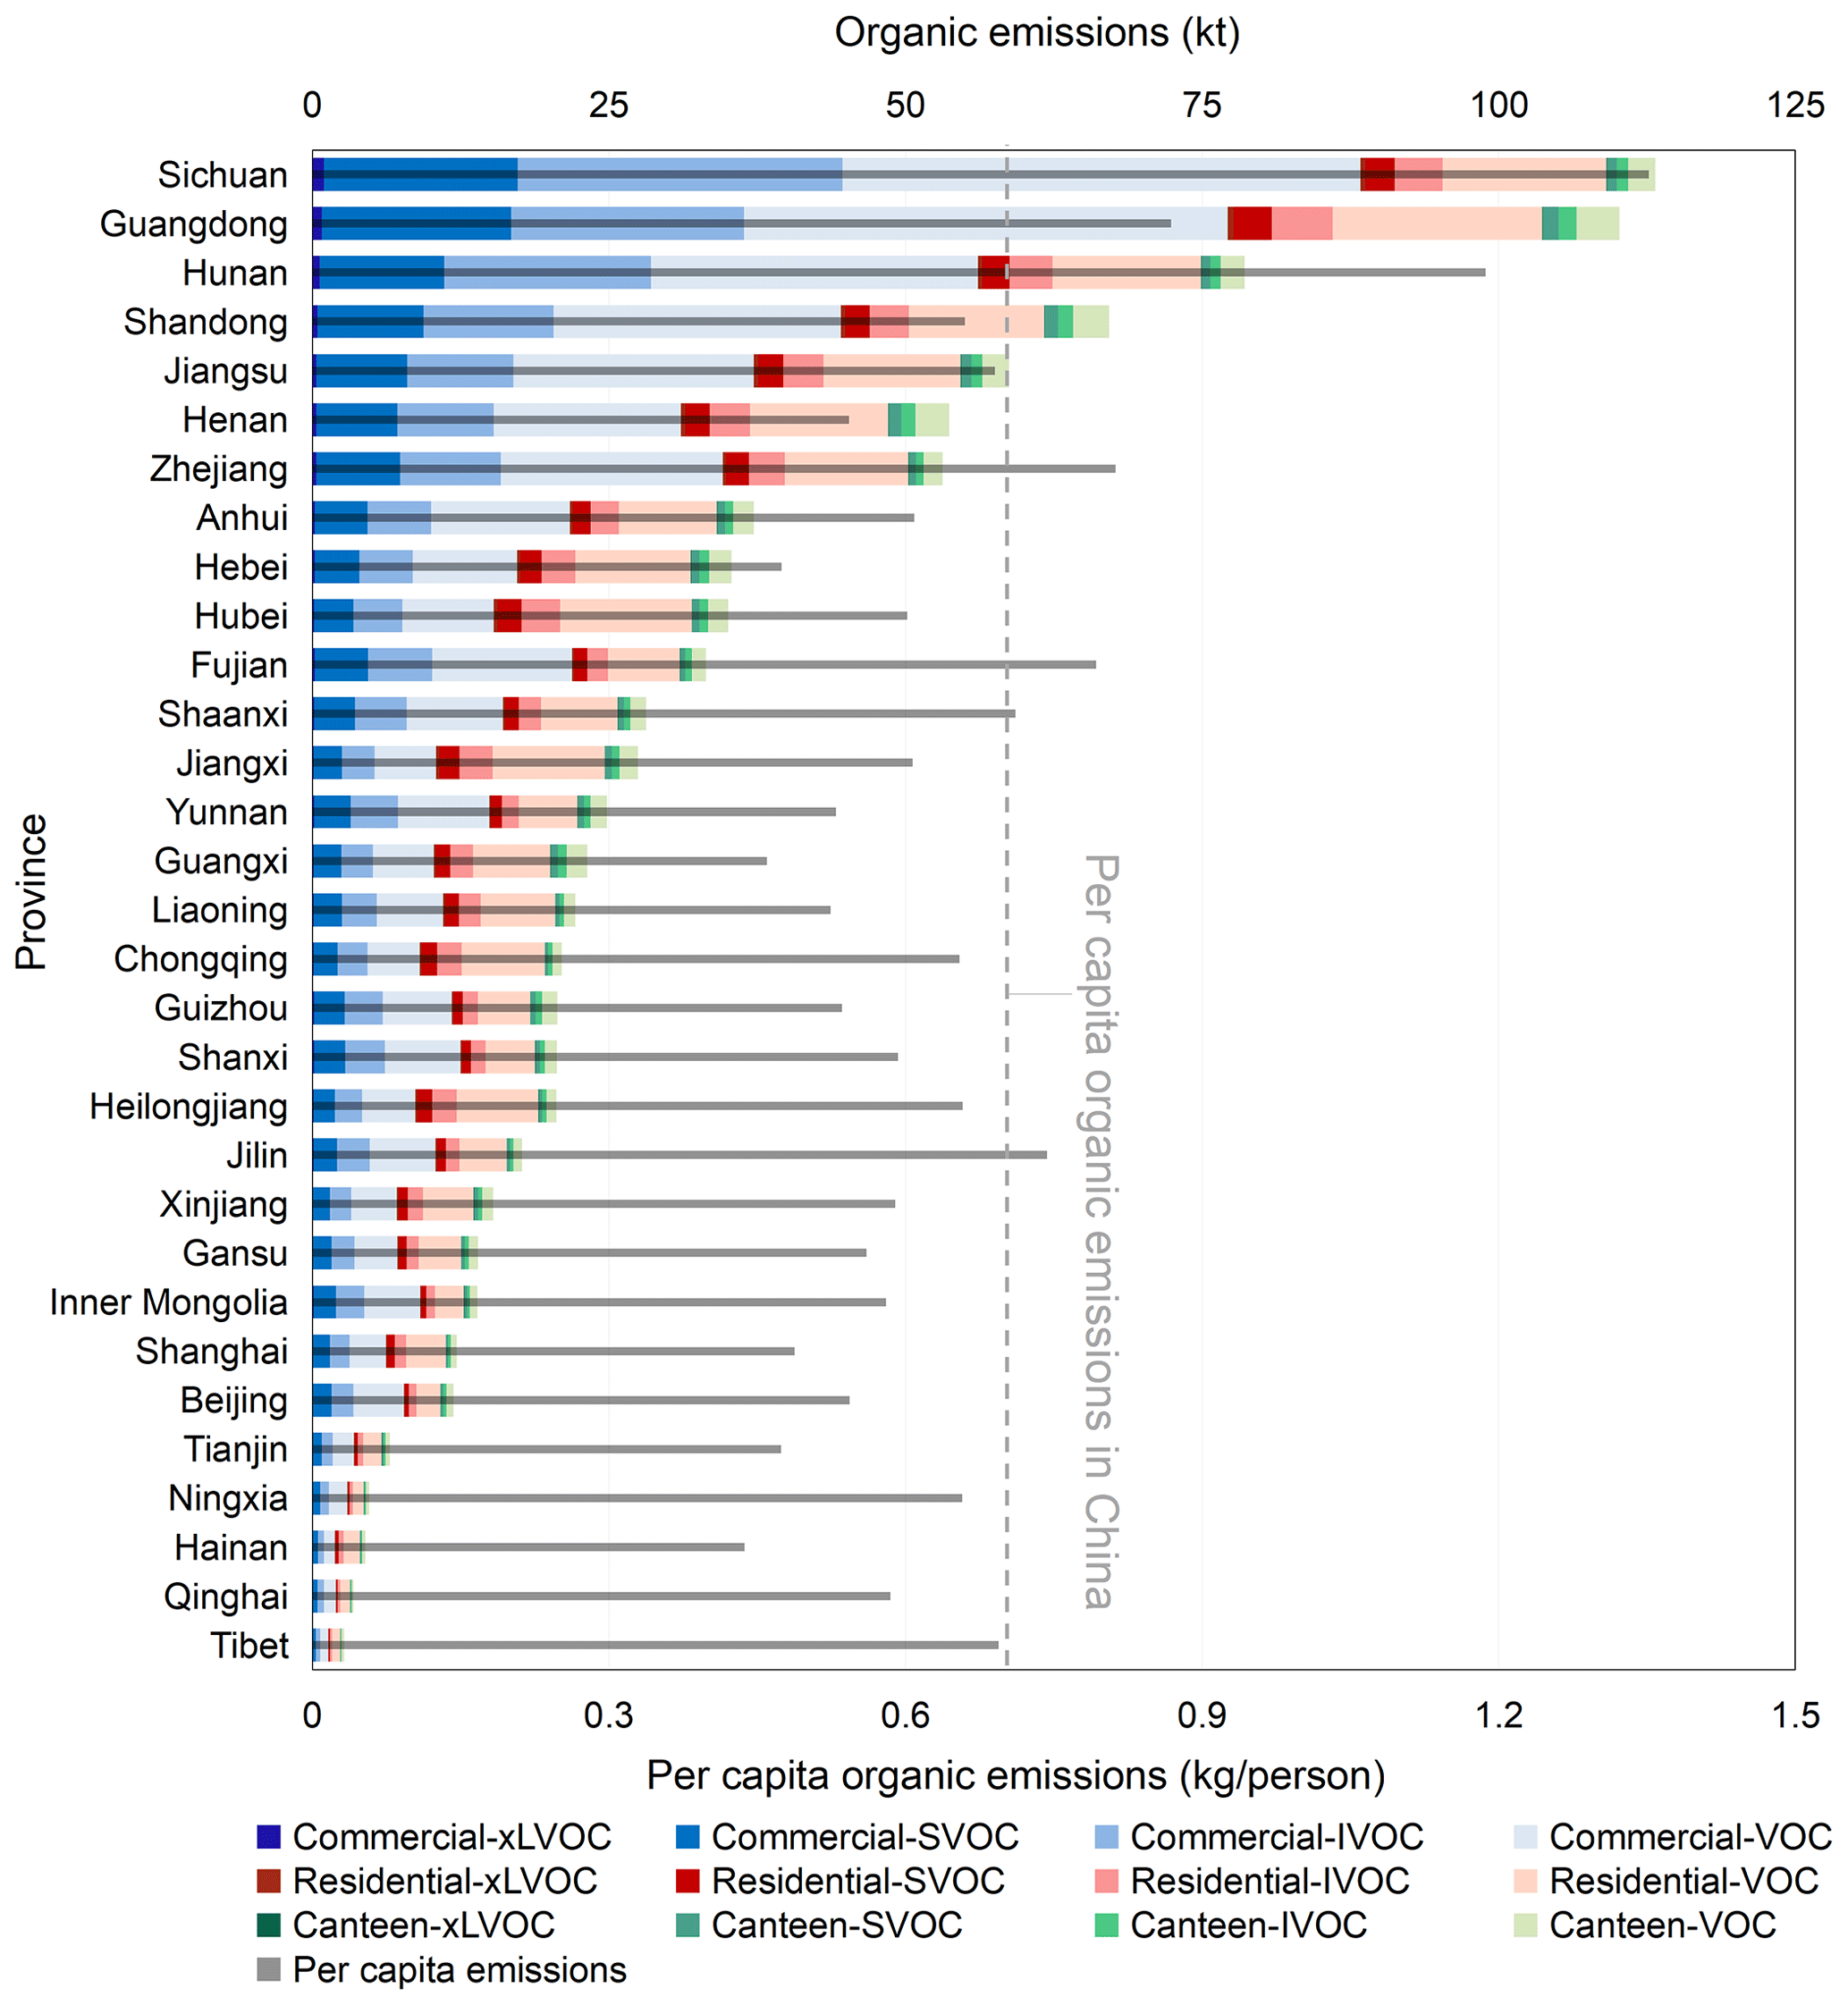
Figure 6Provincial total emissions and per capita emissions across China in 2021. The thick bars represent the total emissions for each province. The blue, red, and green bars represent organic emissions from commercial cooking, home cooking, and canteen cooking sources, respectively. Within the same color group, four different shades represent different volatility ranges of organic matter, namely xLVOC, SVOC, IVOC, and VOC, with darker colors indicating lower volatility. The thin gray bars represent per capita organic emissions in each province. The dashed gray line represents the national per capita organic emissions.
To identify high-emission areas and hotspots, we have further allocated cooking emissions, including commercial cooking emissions with point-source precision and residential and canteen cooking emissions, into grids with 27 km ×27 km resolution (Fig. 7). As previously analyzed, a high population density and specific dietary preferences are two important features of high-emission areas. Representative areas of high population density include the North China Plain (NCP), Yangtze River Delta (YRD), and Pearl River Delta (PRD), indicated by red circles. Capital cities in central and eastern Chinese provinces also emerge as emission hotspots due to high population densities. The large population in each of these areas fosters a flourishing commercial catering industry and substantial residential cooking, thereby producing significant emissions. High emissions are also present in Sichuan (SC) and Hunan (HN), highlighted by green circles. These regions not only have significant populations and prosperous catering industries that hold appeal for people nationwide, but, more importantly, the spice-rich and oily characteristic of the local food amplifies the emissions.
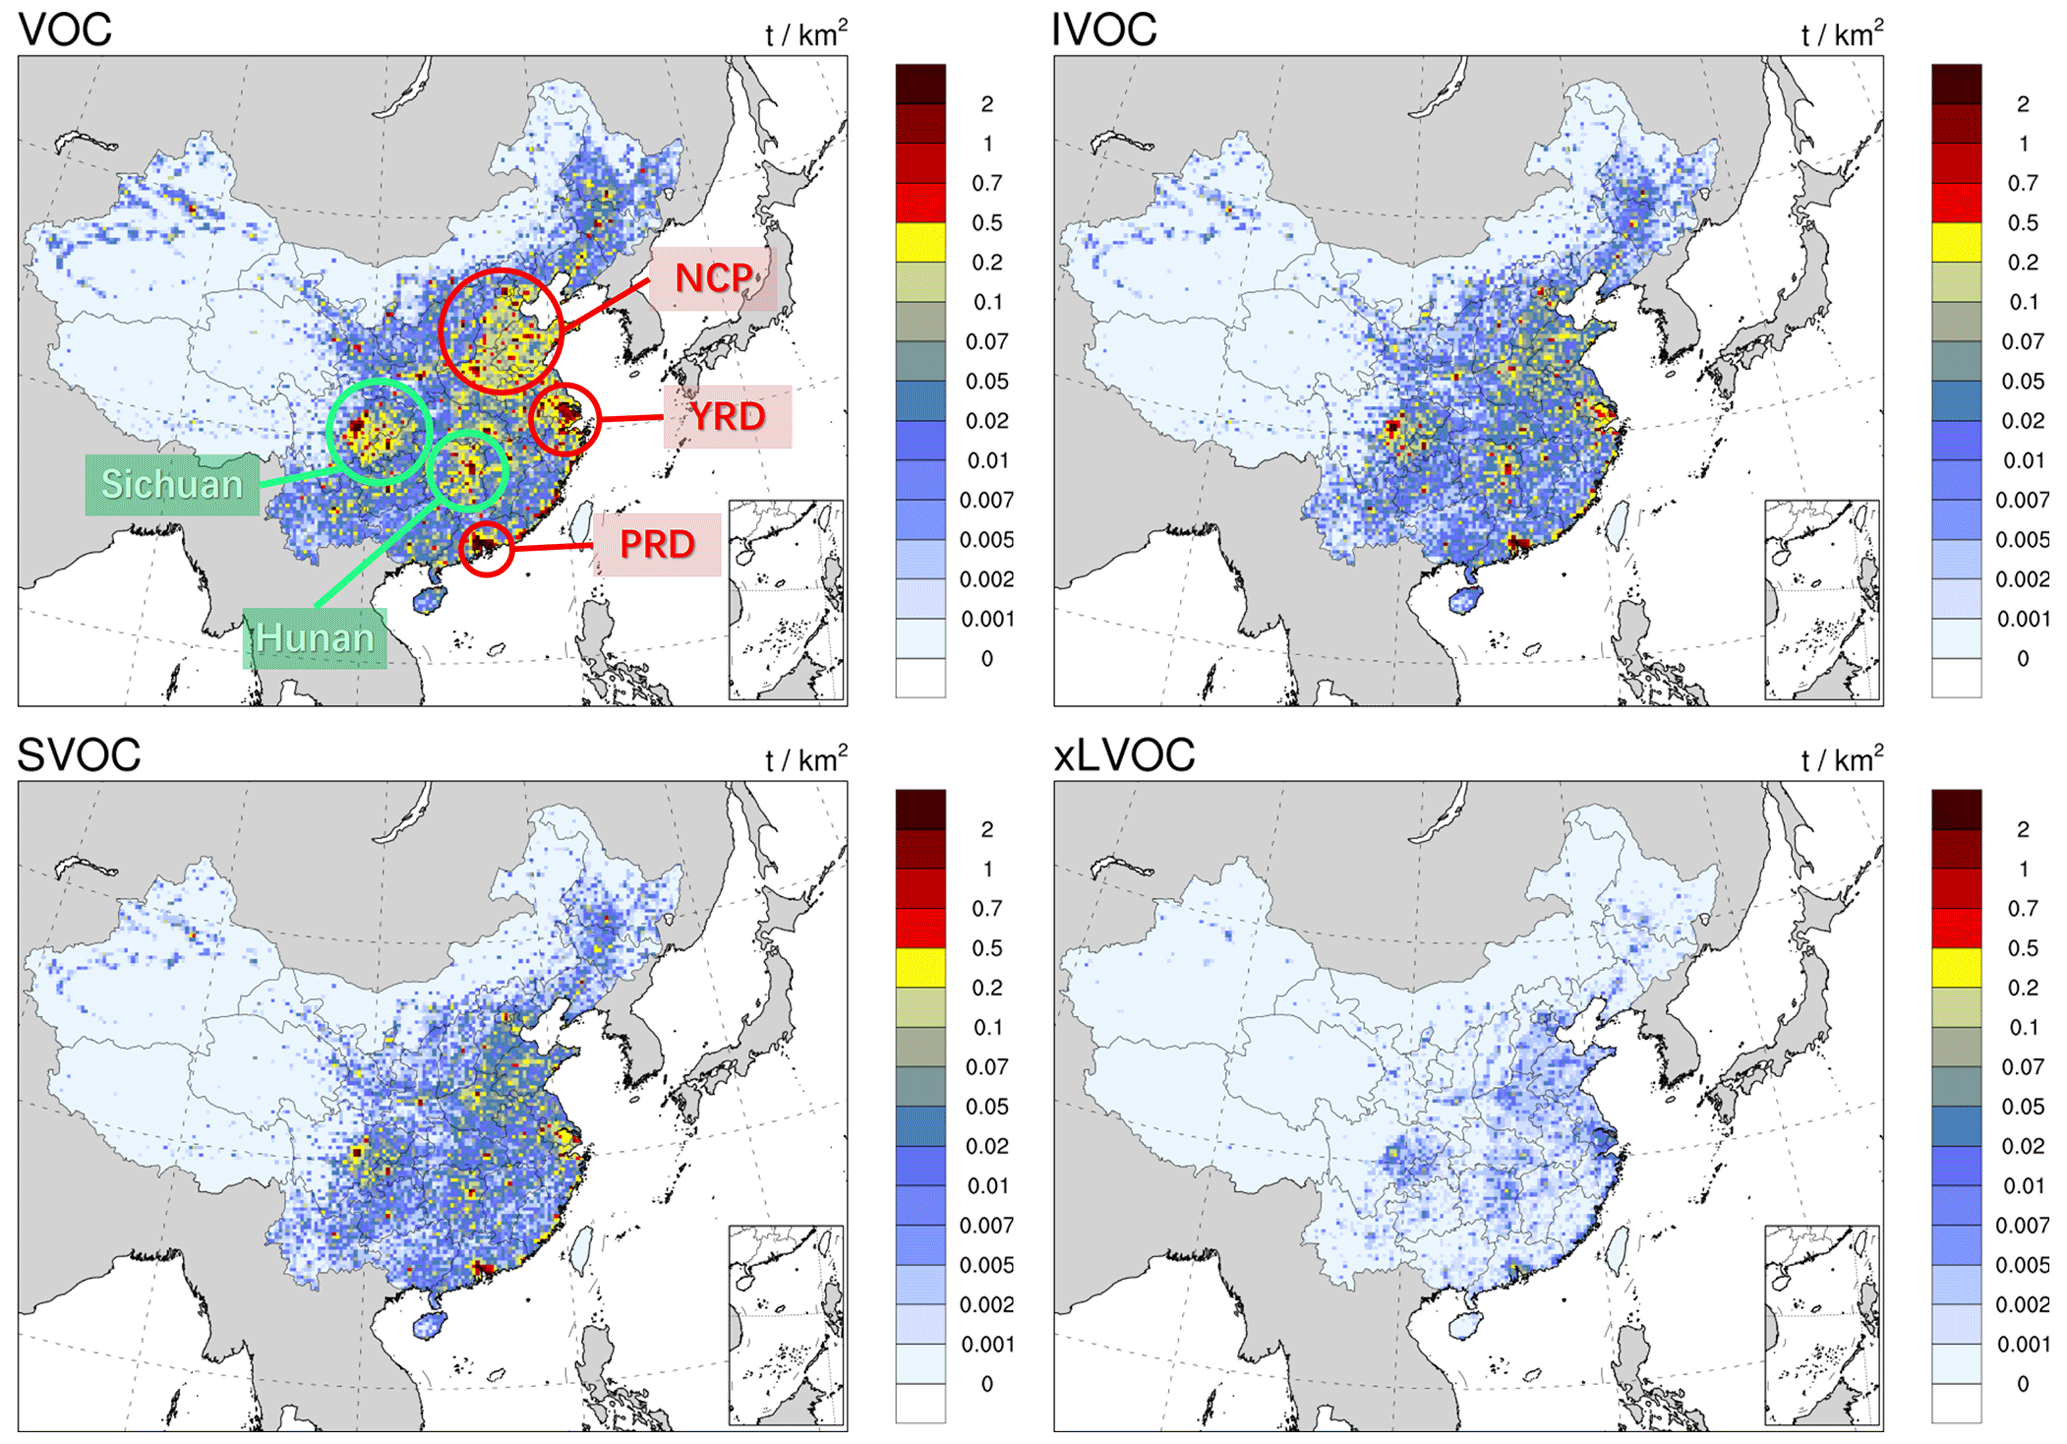
Figure 7Nationwide gridded cooking emissions in the four volatility ranges in 2021, with high-emission areas circled.
Figure S3 displays the spatial distribution of emissions from three cooking subsectors in the four volatility ranges. Commercial cooking emissions are more concentrated in economically developed regions, such as provincial capitals, while less developed regions have lower emission intensities. In contrast, residential cooking emissions are correlated with population density and are distributed across areas where people live. The greater the population density, the larger the emissions. The difference between the spatial distribution of emissions from these two main cooking subsectors aligns with our understanding that in economically more developed areas, where people's disposable income is higher, people tend to dine out more frequently in commercial restaurants. Also, canteen cooking emissions are much lower and are also highly correlated with the population distribution.
3.4 Historical trends and drivers of emissions
Figure 8a displays cooking emissions from various sources during 2015–2021. Overall, the total cooking organic emissions slowly increased from 791 kt in 2015 to 990 kt in 2021. This upward trend is mainly due to the overall growth in commercial cooking emissions, which increased from 414 kt in 2015 to 609 kt in 2021, while emissions from residential and canteen cooking only fluctuated slightly. The percentages of xLVOC, SVOC, IVOC, and VOC during these years were generally stable, with an average of 1.32 %, 17.51 %, 24.2 %, and 56.9 %.
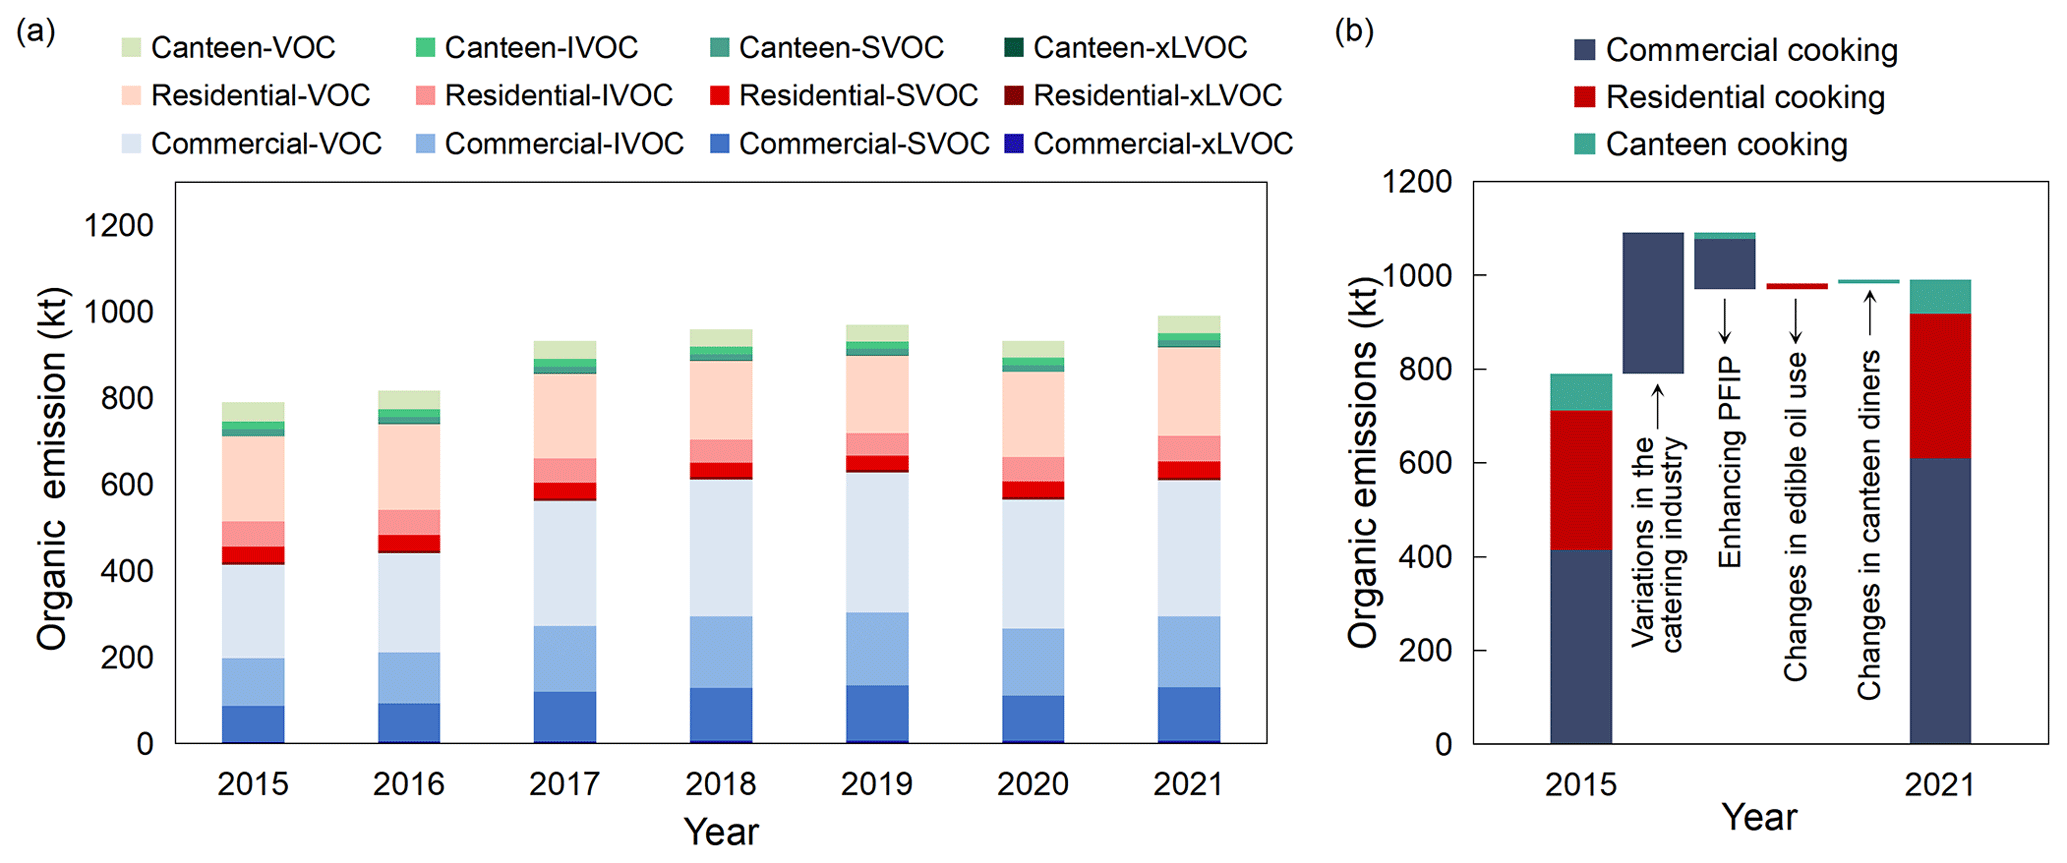
Figure 8(a) Organic emissions in the four volatility ranges from various cooking sources in 2015–2021, and (b) the contributions of different drivers to the changes in organic emissions from 2015 to 2021.
Figure 8b illustrates the contributions of four influencing factors mentioned in Sect. 2.5 to the changes in organic emissions from 2015 to 2021 (see Fig. S4 for the annual contributions of different factors). The development of the catering industry drove the overall increase in cooking emissions, leading to an average annual emission growth rate of 6.36 % from 2015 to 2021. However, the case in 2020 was an exception, as the catering industry regressed and the cooking emissions were reduced by 4.95 % due to the COVID-19 lockdown measure. The yearly increase in the installation proportion of purification facilities also mitigated emissions; it resulted in an average annual emission reduction rate of 2.25 % from 2015 to 2021. However, its effect was limited in comparison to the rapid development of the catering industry due to inadequate regulations for cooking emissions nationwide. Furthermore, the overall impact of household edible oil consumption was minor in 2015–2021, but in years with significant changes in dietary habits, it could cause notable shifts in emissions. For instance, in 2020, the change in household edible oil consumption caused a 2.63 % increase in total emissions due to an increase in household cooking under the COVID-19 lockdown measures. Additionally, the meals provided by canteens have gradually increased in recent years, but the impact of this on overall emission changes has been minimal due to the small scale of canteen emissions.
3.5 Comparison with other related emission inventories
Table 5 compares cooking emissions at different spatial scales in our study with previous studies (Lin et al., 2022; Liang et al., 2022; Qi et al., 2020; Jin et al., 2021; Wang et al., 2018a; Yuan et al., 2023; Cheng et al., 2022). Previous inventories mainly considered pollutants such as VOCs, PM2.5, and OC, all of which we convert to VOCs or POA for comparison. In contrast, our inventory manages to cover full-volatility organics, comprehensive cooking sources, a wide time range, and various regional scales, which were difficult to achieve in previous inventories.
Table 5Comparison of cooking emissions in this study with those in previous studies. Bolded values are from this study.
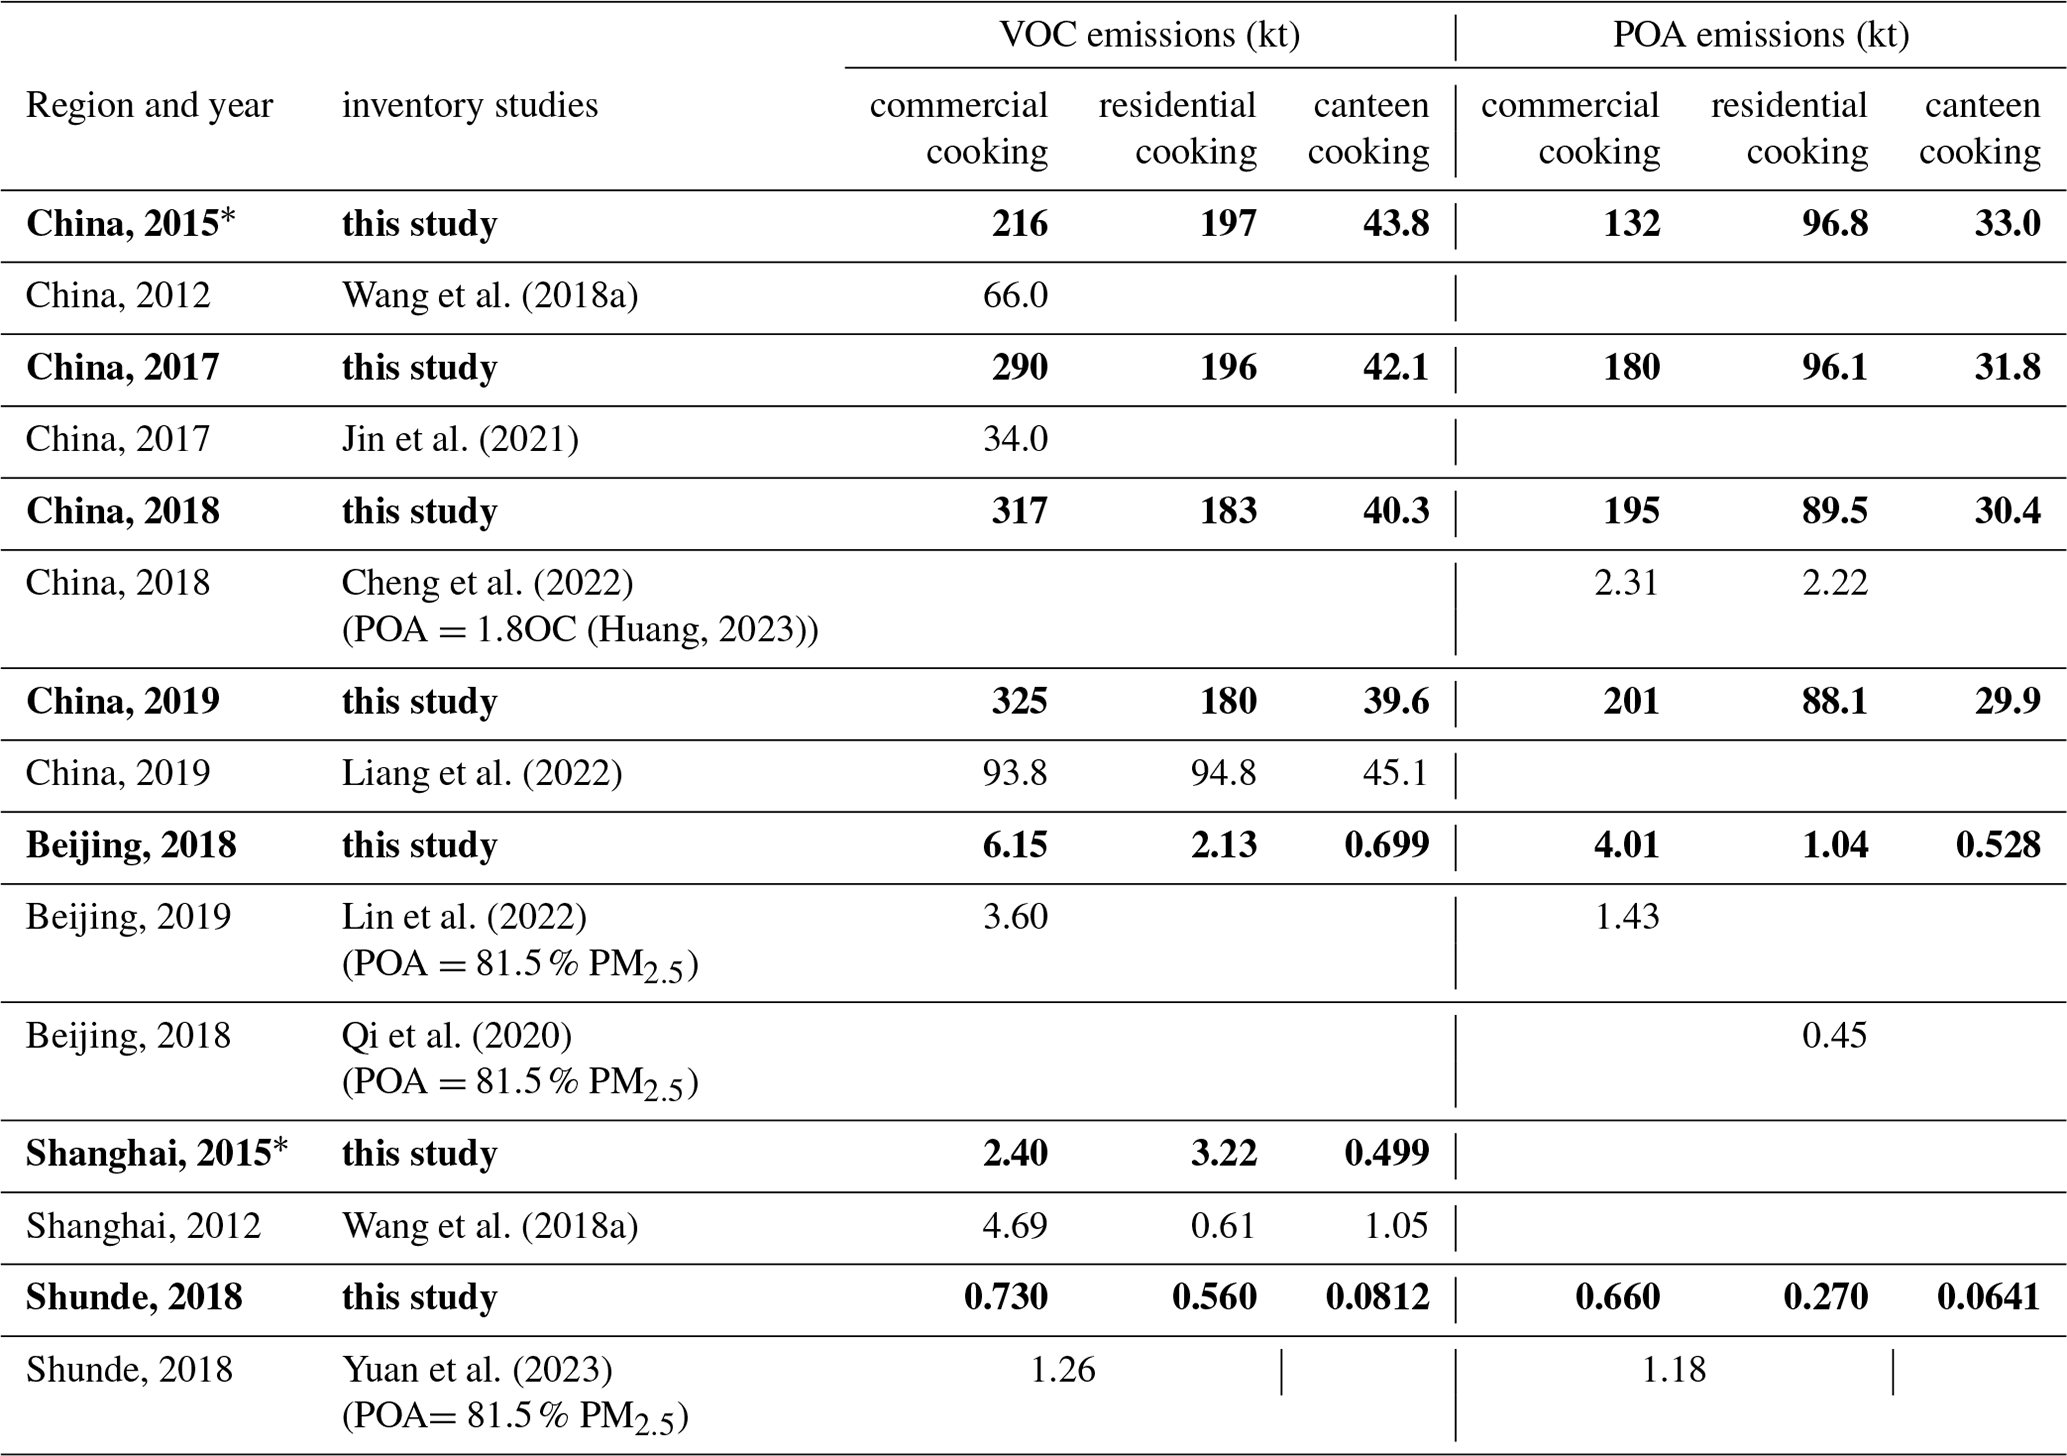
* Due to data limitations, our inventory only covers emissions up to 2015, so the earliest available results from 2015 are used to compare with the 2012 results reported by Wang et al. (2018a).
At the national scale, our estimate of cooking emissions is significantly higher than previous calculations (Lin et al., 2022; Wang et al., 2018a; Yuan et al., 2023; Cheng et al., 2022). This significant discrepancy is probably due to potential omissions from activity data and the biases introduced by inaccurate EFs and PFIPs in previous studies. Specifically, Cheng et al.'s (2022) estimations based on meat consumption were 98.4 % lower than our estimate. This is because cooking emissions are not only determined by meat consumption but also involve the use of vegetables, cooking oils, and condiments, so the underrepresented activity data could introduce large errors. Commercial cooking emissions estimated by Jin et al. (2021) are also 88.3 % lower than our estimates, possibly because they used EFs that were not based on measurements and applied uniform EFs across China without distinguishing between cuisines, introducing significant uncertainty. In comparison, the estimations from Wang et al. (2018a) and Liang et al. (2022) differ less significantly from our estimates, with their results being 69.4 % and 57.1 % lower, respectively, possibly because they used cuisine-specific EFs derived from measurements, thereby improving the accuracy of the EFs. However, applying controlled EFs in all restaurants, including those without pollution control facilities, probably led to an underestimation of their emissions.
At the city and district scales, the previous inventories (Lin et al., 2022; Qi et al., 2020; Wang et al., 2018a; Yuan et al., 2023) were calculated in a more refined way. Therefore, our results are closer to previous estimates. However, differences persist due to uncertainties in our calculations and those of previous studies. Notably, our estimated emissions agree remarkably well with the emission inventory based on the online monitoring system in Shunde, as both inventories use refined point-source data as activity data. Overall, our study achieves broader coverage across multiple dimensions and significantly rectifies the previous underestimations in national inventories.
The full-volatility organic emissions dataset is available at https://doi.org/10.6084/m9.figshare.23537673 (Li et al., 2023). It includes multi-year provincial full-volatility emissions from residential cooking, canteen cooking, and cuisine-specific commercial cooking. For commercial cooking emissions, we also provide full-volatility emissions with point-source accuracy. Also, the dataset provides gridded emissions in China for xLVOCs, SVOCs, IVOCs, and VOCs from the three cooking sources at a resolution of 27 km ×27 km. Emission factors, PFIPs, and other calculated parameters used for emission estimates are listed in the main text and Supplement. The catering-related POI data were obtained from the Amap map service (https://lbs.amap.com/, Amap, 2023). In addition, the required statistical data, including provincial populations, the number of students at different stages of education, the number of employees in state-owned and collective enterprises and institutions, urban and rural populations, and the per capita consumption of household cooking oil by urban and rural residents, city population, and city area, were obtained from the China Statistical Yearbook and China Labour Statistical Yearbook at https://data.stats.gov.cn/ (National Bureau of Statistics, 2022a, b).
Previous cooking inventories rarely covered full-volatility organics and failed to achieve accurate emission estimates with a high resolution at a national scale, preventing an accurate understanding of the characteristics and health impacts of cooking emissions. Our study fills this gap by developing a high-resolution national inventory of full-volatility organic emissions from cooking in China. This state-of-the-art inventory updates our understanding of the characteristics, sources, and regional variations of cooking emissions across China. The emissions of xLVOCs, SVOCs, IVOCs, and VOCs from cooking in China in 2021 were 13.1 (7.36–21.0), 176 (95.8–290), 241 (135–374), and 561 (317–891) kt yr−1, respectively. This reveals that the IVOCs and SVOCs emitted from cooking sources are of great importance, especially in densely populated cities, where they account for 9 %–21 % and 31 %–62 % of the total IVOC and SVOC emissions from all sources, thereby potentially greatly impacting SOA formation and human health. Our inventory also comprehensively includes emissions from home kitchens, canteens, and restaurants with various cuisines, and it corrects significant underestimations in previous emission calculations for these sources due to the potential omission of activity data as well as oversimplified EFs and PFIPs, which aids in the accurate identification and effective control of emission sources. We find that commercial and residential cooking are two important sources, contributing over 90 % of the total organic emissions from cooking. Moreover, we find that local dietary habits significantly influence cooking emissions. For example, in areas where spicy and oily foods are preferred, the per capita organic emissions from cooking (1.19–1.35 kg/person) are much higher than the average (0.701 kg/person). Such regional features would be obscured when using a national uniform EF. Overall, our dataset provides meaningful information for the precise regulation of organic cooking emissions (including gaseous and particle-phase organics) in China, and it provides the prerequisite for the accurate modeling of SOA formation and evolution.
Based on the multi-year national cooking emission inventory and sensitivity analyses, we discover that, despite annual increases in PFIPs, they cannot offset the emission increases caused by the rapid growth of the catering industry. Given the significant health risks potentially posed by cooking emissions, future efforts to reduce cooking emissions need to be strengthened through multiple pathways. Considering that the overall PFIP for restaurants nationwide in 2021 is only about 73.9 %, the continued promotion of purification facilities remains a critical emission reduction strategy. Moreover, it may be more important to ensure that the installed purification facilities meet the removal efficiency requirements. According to our estimates, total cooking emissions could be reduced by about 30 % if the current removal efficiencies for gaseous and particle-phase organics met the standards for NMHCs and PM, respectively (Beijing Environmental Protection Bureau, 2018). Furthermore, residential cooking is also an important emission source, but it currently lacks dedicated purification facilities, so it may have great emission reduction potential. Consideration could be given to equipping residential chimneys with uniform flue gas purifiers or developing miniature fume purifiers that could be installed at the back ends of home kitchen range hoods. Our methodology and integrated parameters allow the emission inventories to be extended to different locations and times, and they can be used to predict the effect of emission reductions in future control scenarios to evaluate the effectiveness of control strategies.
We also acknowledge some limitations of our study. Due to the potential inadequacy of earlier digital map construction, we can only guarantee reliable information on commercial restaurants from 2015 onwards. While it is challenging to retrospectively track high-resolution emissions using our methodology, pre-2015 emissions could be estimated using the data from 2015 to 2021 and previous statistical data. Additionally, due to limited full-volatility tests and basic data for the cooking activities, we have made some estimates and used some supplements, which may introduce some uncertainties. Nonetheless, as the first national inventory of full-volatility organic cooking emissions, our dataset provides many novel and meaningful insights within an acceptable uncertainty range. In the future, further measurements of full-volatility EFs and surveys of cooking habits and fume purification facility installations may help reduce these uncertainties.
The supplement related to this article is available online at: https://doi.org/10.5194/essd-15-5017-2023-supplement.
ZL, SW, SL, and BZ designed the study. ZL developed the emission inventory; SW, SL, XW, GH, XC, LH, and BZ helped to improve the emission inventory. ZL and XW determined the spatial distribution of the emission inventory. ZL wrote the original draft; all the coauthors revised the manuscript.
The contact author has declared that none of the authors has any competing interests.
Publisher’s note: Copernicus Publications remains neutral with regard to jurisdictional claims made in the text, published maps, institutional affiliations, or any other geographical representation in this paper. While Copernicus Publications makes every effort to include appropriate place names, the final responsibility lies with the authors. Regarding the maps used in this paper, please note that Figs. 4 and 7 and the key figure contain disputed territories.
This research has been supported by the National Natural Science Foundation of China (grant nos. 92044302 and 22188102) and the Samsung Advanced Institute of Technology.
This paper was edited by Yuqiang Zhang and reviewed by two anonymous referees.
Abdullahi, K. L., Delgado-Saborit, J. M., and Harrison, R. M.: Emissions and indoor concentrations of particulate matter and its specific chemical components from cooking: A review, Atmos. Environ., 71, 260–294, https://doi.org/10.1016/j.atmosenv.2013.01.061, 2013.
Amouei Torkmahalleh, M., Gorjinezhad, S., Unluevcek, H. S., and Hopke, P. K.: Review of factors impacting emission/concentration of cooking generated particulate matter, Sci. Total Environ., 586, 1046–1056, https://doi.org/10.1016/j.scitotenv.2017.02.088, 2017.
An, J., Huang, C., Huang, D., Qin, M., Liu, H., Yan, R., Qiao, L., Zhou, M., Li, Y., Zhu, S., Wang, Q., and Wang, H.: Sources of organic aerosols in eastern China: a modeling study with high-resolution intermediate-volatility and semivolatile organic compound emissions, Atmos. Chem. Phys., 23, 323–344, https://doi.org/10.5194/acp-23-323-2023, 2023.
Beijing Environmental Protection Bureau: Emission standards of air pollutants for catering industry, Beijing Environmental Protection Bureau, China Environmental Science Press, DB 11/1488-2018, 2018.
Buonanno, G., Morawska, L., and Stabile, L.: Particle emission factors during cooking activities, Atmos. Environ., 43, 3235–3242, https://doi.org/10.1016/j.atmosenv.2009.03.044, 2009.
Chang, X., Zhao, B., Zheng, H., Wang, S., Cai, S., Guo, F., Gui, P., Huang, G., Wu, D., Han, L., Xing, J., Man, H., Hu, R., Liang, C., Xu, Q., Qiu, X., Ding, D., Liu, K., Han, R., Robinson, A. L., and Donahue, N. M.: Full-volatility emission framework corrects missing and underestimated secondary organic aerosol sources, One Earth, 5, 403–412, https://doi.org/10.1016/j.oneear.2022.03.015, 2022.
Chen, C., Zhao, Y., and Zhao, B.: Emission Rates of Multiple Air Pollutants Generated from Chinese Residential Cooking, Environ. Sci. Technol., 52, 1081–1087, https://doi.org/10.1021/acs.est.7b05600, 2018.
Cheng, S., Wang, G., Lang, J., Wen, W., Wang, X., and Yao, S.: Characterization of volatile organic compounds from different cooking emissions, Atmos. Environ., 145, 299–307, https://doi.org/10.1016/j.atmosenv.2016.09.037, 2016.
Cheng, Y., Kong, S., Yao, L., Zheng, H., Wu, J., Yan, Q., Zheng, S., Hu, Y., Niu, Z., Yan, Y., Shen, Z., Shen, G., Liu, D., Wang, S., and Qi, S.: Multiyear emissions of carbonaceous aerosols from cooking, fireworks, sacrificial incense, joss paper burning, and barbecue as well as their key driving forces in China, Earth Syst. Sci. Data, 14, 4757–4775, https://doi.org/10.5194/essd-14-4757-2022, 2022.
Donahue, N. M., Kroll, J. H., Pandis, S. N., and Robinson, A. L.: A two-dimensional volatility basis set – Part 2: Diagnostics of organic-aerosol evolution, Atmos. Chem. Phys., 12, 615–634, https://doi.org/10.5194/acp-12-615-2012, 2012.
He, L., Hu, M., Huang, X., Yu, B., Zhang, Y., and Liu, D.: Measurement of emissions of fine particulate organic matter from Chinese cooking, Atmos. Environ., 38, 6557–6564, https://doi.org/10.1016/j.atmosenv.2004.08.034, 2004.
He, W., Wang, T., Shao, X., Nie, L., and Shi, A.: Pollution Characteristics of Cooking Fumes, Particulates, and Non-methane Hydrocarbons in the Exhaust of Typical Beijing Restaurants, Environ. Sci., 41, 2050–2056, https://doi.org/10.13227/j.hjkx.201908063, 2020.
Huang, D. D., Zhu, S., An, J., Wang, Q., Qiao, L., Zhou, M., He, X., Ma, Y., Sun, Y., Huang, C., Yu, J. Z., and Zhang, Q.: Comparative Assessment of Cooking Emission Contributions to Urban Organic Aerosol Using Online Molecular Tracers and Aerosol Mass Spectrometry Measurements, Environ. Sci. Technol., 55, 14526–14535, https://doi.org/10.1021/acs.est.1c03280, 2021.
Huang, G.: Characterizations of Intermediate Volatile and Semi-volatile Organic Compounds Emissions from Typical Stationary Sources, Tsinghua University, 2023.
Huang, X., Han, D., Cheng, J., Chen, X., Zhou, Y., Liao, H., Dong, W., and Yuan, C.: Characteristics and health risk assessment of volatile organic compounds (VOCs) in restaurants in Shanghai, Environ. Sci. Pollut. Res., 27, 490–499, https://doi.org/10.1007/s11356-019-06881-6, 2020.
Jathar, S. H., Gordon, T. D., Hennigan, C. J., Pye, H. O. T., Pouliot, G., Adams, P. J., Donahue, N. M., and Robinson, A. L.: Unspeciated organic emissions from combustion sources and their influence on the secondary organic aerosol budget in the United States, P. Natl. Acad. Sci. USA, 111, 10473–10478, https://doi.org/10.1073/pnas.1323740111, 2014.
Jiang, B., Sun, C., Bai, H., Chen, X., He, W., Nie, L., Shi, A., and Li, G.: Influence of fume purifier on VOCs emission characteristics and photochemical reaction of catering, China Environmental Science, 41, 2040–2047, https://doi.org/10.19674/j.cnki.issn1000-6923.2021.0214, 2021.
Jin, W., Zhi, G., Zhang, Y., Wang, L., Guo, S., Zhang, Y., Xue, Z., Zhang, X., Du, J., Zhang, H., Ren, Y., Xu, P., Ma, J., Zhao, W., Wang, L., and Fu, R.: Toward a national emission inventory for the catering industry in China, Sci. Total Environ., 754, 142184, https://doi.org/10.1016/j.scitotenv.2020.142184, 2021.
Lee, B. P., Li, Y. J., Yu, J. Z., Louie, P. K. K., and Chan, C. K.: Characteristics of submicron particulate matter at the urban roadside in downtown Hong Kong–Overview of 4 months of continuous high-resolution aerosol mass spectrometer measurements, J. Geophys. Res.-Atmos., 120, 7040–7058, https://doi.org/10.1002/2015JD023311, 2015.
Li, B., Wang, J., Wu, S., Jia, Z., Li, Y., Wang, T., and Zhou, S.: New Method for Improving Spatial Allocation Accuracy of Industrial Energy Consumption and Implications for Polycyclic Aromatic Hydrocarbon Emissions in China, Environ. Sci. Technol., 53, 4326–4334, https://doi.org/10.1021/acs.est.8b06915, 2019.
Li, J.: Study on the Construction of Air Pollutant Emission Inventory of Restaurant Enterprises in Nanjing, Technology Trend, https://doi.org/10.19392/j.cnki.1671-7341.202019109, 2020.
Li, L., Cheng, Y., Du, X., Dai, Q., Wu, J., Bi, X., and Feng, Y.: Chemical Compositions of PM2.5 Emitted from Six Types of Chinese Cooking, Res. Environ. Sci., 34, 71–78, https://doi.org/10.13198/j.issn.1001-6929.2020.11.11, 2021.
Li, N: Quantitative Uncertainty Analysis and Verification of Emission Inventory in Guangdong Province, 2012, Master, South China University of Technology, China, 2017.
Li, Y., Wu, A., Tong, M., Luan, S., Li, Z., and Hu, M.: Emission Characteristics of Particulate Organic Matter from Cooking, Environ. Sci., 41, 3467–3474, https://doi.org/10.13227/j.hjkx.202001027, 2020.
Li, Z., Wang, S., Li, S., Wang, X., Huang, G., Chang, X., Huang, L., Liang, C., Zhu, Y., Zheng, H., Song, Q., Wu, Q., Zhang, F., and Zhao, B.: High-resolution emission inventory of full-volatility organic from cooking souce in China during 2015–2021, figshare [data set], https://doi.org/10.6084/m9.figshare.23537673, 2023.
Liang, X., Chen, L., Liu, M., Lu, Q., Lu, H., Gao, B., Zhao, W., Sun, X., Xu, J., and Ye, D.: Carbonyls from commercial, canteen and residential cooking activities as crucial components of VOC emissions in China, Sci. Total Environ., 846, 157317, https://doi.org/10.1016/j.scitotenv.2022.157317, 2022.
Lin, L., He, X., Wu, J., Yu, P., and Guo, T.: Research of Shanghai Cooking Fume Pollution, Environ. Sci. Technol., 37, 546–549, 2014.
Lin, P., He, W., Nie, L., Schauer, J. J., Wang, Y., Yang, S., and Zhang, Y.: Comparison of PM2.5 emission rates and source profiles for traditional Chinese cooking styles, Environ. Sci. Pollut. Res., 26, 21239–21252, https://doi.org/10.1007/s11356-019-05193-z, 2019.
Lin, P., Gao, J., He, W., Nie, L., Schauer, J. J., Yang, S., Xu, Y., and Zhang, Y.: Estimation of commercial cooking emissions in real-world operation: Particulate and gaseous emission factors, activity influencing and modelling, Environ. Pollut., 289, 117847, https://doi.org/10.1016/j.envpol.2021.117847, 2021.
Lin, P., Gao, J., Xu, Y., Schauer, J. J., Wang, J., He, W., and Nie, L.: Enhanced commercial cooking inventories from the city scale through normalized emission factor dataset and big data, Environ. Pollut., 315, 120320, https://doi.org/10.1016/j.envpol.2022.120320, 2022.
Mohr, C., DeCarlo, P. F., Heringa, M. F., Chirico, R., Slowik, J. G., Richter, R., Reche, C., Alastuey, A., Querol, X., Seco, R., Peñuelas, J., Jiménez, J. L., Crippa, M., Zimmermann, R., Baltensperger, U., and Prévôt, A. S. H.: Identification and quantification of organic aerosol from cooking and other sources in Barcelona using aerosol mass spectrometer data, Atmos. Chem. Phys., 12, 1649–1665, https://doi.org/10.5194/acp-12-1649-2012, 2012.
National Bureau of Statistics of China: China Labor Statistical Yearbook, China Statistics Press, Beijing, ISBN 978-7-5230-0077-9, 2022a.
National Bureau of Statistics of China: China Population and Employment Statistics Yearbook, China Statistics Press, Beijing, ISBN 978-7-5037-9915-0, 2022b.
National Bureau of Statistics of China: China Statistical Yearbook, China Statistics Press, Beijing, ISBN 978-7-5037-9950-1, 2022c.
Pei, B., Cui, H., Liu, H., and Yan, N.: Chemical characteristics of fine particulate matter emitted from commercial cooking, Front. Environ. Sci. Eng., 10, 559–568, https://doi.org/10.1007/s11783-016-0829-y, 2016.
Qi, X., Qu, J., Liu, J., Wang, X., Guo, P., Zhang, Y., Jia, K., Zhang, Y., and Liu, Y.: Preliminary estimation of chemical compositions and emissions of particulate matters from domestic cooking in Beijing, IOP Conf. Ser.: Earth Environ. Sci., 508, 012140, https://doi.org/10.1088/1755-1315/508/1/012140, 2020.
Robinson, A. L., Donahue, N. M., Shrivastava, M. K., Weitkamp, E. A., Sage, A. M., Grieshop, A. P., Lane, T. E., Pierce, J. R., and Pandis, S. N.: Rethinking Organic Aerosols: Semivolatile Emissions and Photochemical Aging, Science, 315, 1259–1262, https://doi.org/10.1126/science.1133061, 2007.
Shu, M., Li, Y., and Cao, J.: Emission characteristics of PM2.5 from different restaurant sources, in: Proceedings of the Annual Meeting of the Chinese Academy of Environmental Sciences (2014), 2014 China Environmental Science Society Annual Academic Conference, Chengdu, Sichuan, China, 22 August 2014, 5147, 2014.
Song, K., Guo, S., Gong, Y., Lv, D., Zhang, Y., Wan, Z., Li, T., Zhu, W., Wang, H., Yu, Y., Tan, R., Shen, R., Lu, S., Li, S., Chen, Y., and Hu, M.: Impact of cooking style and oil on semi-volatile and intermediate volatility organic compound emissions from Chinese domestic cooking, Atmos. Chem. Phys., 22, 9827–9841, https://doi.org/10.5194/acp-22-9827-2022, 2022.
Song, K., Guo, S., Gong, Y., Lv, D., Wan, Z., Zhang, Y., Fu, Z., Hu, K., and Lu, S.: Non-target scanning of organics from cooking emissions using comprehensive two-dimensional gas chromatography-mass spectrometer (GCxGC-MS), Appl. Geochem., 151, 105601, https://doi.org/10.1016/j.apgeochem.2023.105601, 2023.
MEE (Ministry of Ecological Environment): Emission standards of catering oil fume, Ministry of Ecological Environment, China Environmental Science Press, GB 18483-2001, 2001.
Sun, C., Zhao, L., Chen, X., Nie, L., Shi, A., Bai, H., and Li, G.: A comprehensive study of volatile organic compounds from the actual emission of Chinese cooking, Environ. Sci. Pollut. Res., 29, 53821–53830, https://doi.org/10.1007/s11356-022-19342-4, 2022.
Tong, M.: Research on Emission Characteristics of Volatile Organic Compounds from Cooking Oil Fumes, Master, Dalian Polytechnic University, https://doi.org/10.26992/d.cnki.gdlqc.2019.000301, 2019.
Wang, G.: The Organic Pollution Characteristics in the Beijing Cooking Source Emissions of Atmospheric Particulate Matter, Master, China University of Geosciences (Beijing), 2013.
Wang, G., Cheng, S., Wei, W., Wen, W., Wang, X., and Yao, S.: Chemical Characteristics of Fine Particles Emitted from Different Chinese Cooking Styles, Aerosol Air Qual. Res., 15, 2357–2366, https://doi.org/10.4209/aaqr.2015.02.0079, 2015.
Wang, H., Xiang, Z., Wang, L., Jing, S., Lou, S., Tao, S., Liu, J., Yu, M., Li, L., Lin, L., Chen, Y., Wiedensohler, A., and Chen, C.: Emissions of volatile organic compounds (VOCs) from cooking and their speciation: A case study for Shanghai with implications for China, Sci. Total Environ., 621, 1300–1309, https://doi.org/10.1016/j.scitotenv.2017.10.098, 2018a.
Wang, H., Jing, S., Lou, S., Tao, S., Qiao, L., Li, L., Huang, C., Lin, L., and Cheng, C.: Estimation of Fine Particle (PM2.5) Emission Inventory from Cooking: Case Study for Shanghai, Environ. Sci., 39, 1971–1977, https://doi.org/10.13227/j.hjkx.201708228, 2018b.
Wu, J., Kong, S., Zeng, X., Cheng, Y., Yan, Q., Zheng, H., Yan, Y., Zheng, S., Liu, D., Zhang, X., Fu, P., Wang, S., and Qi, S.: First High-Resolution Emission Inventory of Levoglucosan for Biomass Burning and Non-Biomass Burning Sources in China, Environ. Sci. Technol., 55, 1497–1507, https://doi.org/10.1021/acs.est.0c06675, 2021.
Xu, M., He, W., Nie, L., Han, L., Pan, T., and Shi, A.: Atmospheric Pollutant Emission Characteristics from the Cooking Process of Traditional Beijing Roast Duck, Environ. Sci., 38, 3139–3145, https://doi.org/10.13227/j.hjkx.201701165, 2017.
Xu, T., Zhang, C., Liu, C., and Hu, Q.: Variability of PM2.5 and O3 concentrations and their driving forces over Chinese megacities during 2018–2020, J. Environ. Sci., 124, 1–10, https://doi.org/10.1016/j.jes.2021.10.014, 2023.
Yu, Y., Guo, S., Wang, H., Shen, R., Zhu, W., Tan, R., Song, K., Zhang, Z., Li, S., Chen, Y., and Hu, M.: Importance of Semivolatile/Intermediate-Volatility Organic Compounds to Secondary Organic Aerosol Formation from Chinese Domestic Cooking Emissions, Environ. Sci. Technol. Lett., 9, 507–512, https://doi.org/10.1021/acs.estlett.2c00207, 2022.
Yuan, Y., Zhu, Y., Lin, C.-J., Wang, S., Xie, Y., Li, H., Xing, J., Zhao, B., Zhang, M., and You, Z.: Impact of commercial cooking on urban PM2.5 and O3 with online data-assisted emission inventory, Sci. Total Environ., 873, 162256, https://doi.org/10.1016/j.scitotenv.2023.162256, 2023.
Zhang, T., Peng, L., Li, Y., Liu, H., Wang, Y., and Wang, Y.: Chemical Characteristics of PM2.5 Emitted from Cooking Fumes, Res. Environ. Sci., 28, 190–197, https://doi.org/10.13198/j.issn.1001-6929.2016.02.04, 2016.
Zhang, Z., Zhu, W., Hu, M., Wang, H., Chen, Z., Shen, R., Yu, Y., Tan, R., and Guo, S.: Secondary Organic Aerosol from Typical Chinese Domestic Cooking Emissions, Environ. Sci. Technol. Lett., 8, 24–31, https://doi.org/10.1021/acs.estlett.0c00754, 2021.
Zhao, Y. and Zhao, B.: Emissions of air pollutants from Chinese cooking: A literature review, Build. Simul.-China, 11, 977–995, https://doi.org/10.1007/s12273-018-0456-6, 2018.
Zhao, Y., Hu, M., Slanina, S., and Zhang, Y.: Chemical Compositions of Fine Particulate Organic Matter Emitted from Chinese Cooking, Environ. Sci. Technol., 41, 99–105, https://doi.org/10.1021/es0614518, 2007.
Zhao, Y., Chen, C., and Zhao, B.: Is oil temperature a key factor influencing air pollutant emissions from Chinese cooking?, Atmos. Environ., 193, 190–197, https://doi.org/10.1016/j.atmosenv.2018.09.012, 2018.
Zhao, Z., Tong, M., Li, Y., Li, Q., Li, Z., Wu, A., and Xu, T.: Characteristics of particulate matters emitted from cooking in Shenzhen, Environ. Chem., 39, 1763–1773, https://doi.org/10.7524/j.issn.0254-6108.2019050804, 2020.
Zheng, H., Chang, X., Wang, S., Li, S., Zhao, B., Dong, Z., Ding, D., Jiang, Y., Huang, G., Huang, C., An, J., Zhou, M., Qiao, L., and Xing, J.: Sources of Organic Aerosol in China from 2005 to 2019: A Modeling Analysis, Environ. Sci. Technol., 57, 5957–5966, https://doi.org/10.1021/acs.est.2c08315, 2023a.
Zheng, H., Chang, X., Wang, S., Li, S., Yin, D., Zhao, B., Huang, G., Huang, L., Jiang, Y., Dong, Z., He, Y., Huang, C., and Xing, J.: Trends of Full-Volatility Organic Emissions in China from 2005 to 2019 and Their Organic Aerosol Formation Potentials, Environ. Sci. Technol. Lett., 10, 137–144, https://doi.org/10.1021/acs.estlett.2c00944, 2023b.